
CATTLE HAMMERED, CALLS VS DP & 2026 SALES?
AUDIO COMMENTARY
Cattle hammered again
Cattle broke major support (chart below)*
Strategies we are using in cattle
Perhaps a little hedge pressure in corn
Simple re-test in corn? (chart below)*
Crop insurance pricing period is going to be over so you will not have a floor anymore. There is a risk in that
Why is basis firming at harvest?
Canada & US trade war escalation
Questions many of you have had
Should you be making any 2026 sales?
Delayed price vs call options
Why options might make more sense than DP
Options are abnormally cheap
Even if prices go lower options could be the better decision than DP because it locks in a floor
How can you capture the carry without locking in the price?
Listen to today’s audio below
Want to talk? (605)295-3100
Your free trial has ended
Don’t miss our updates & future signals
Here is extended access to our harvest sale
CORN & CATTLE CHART
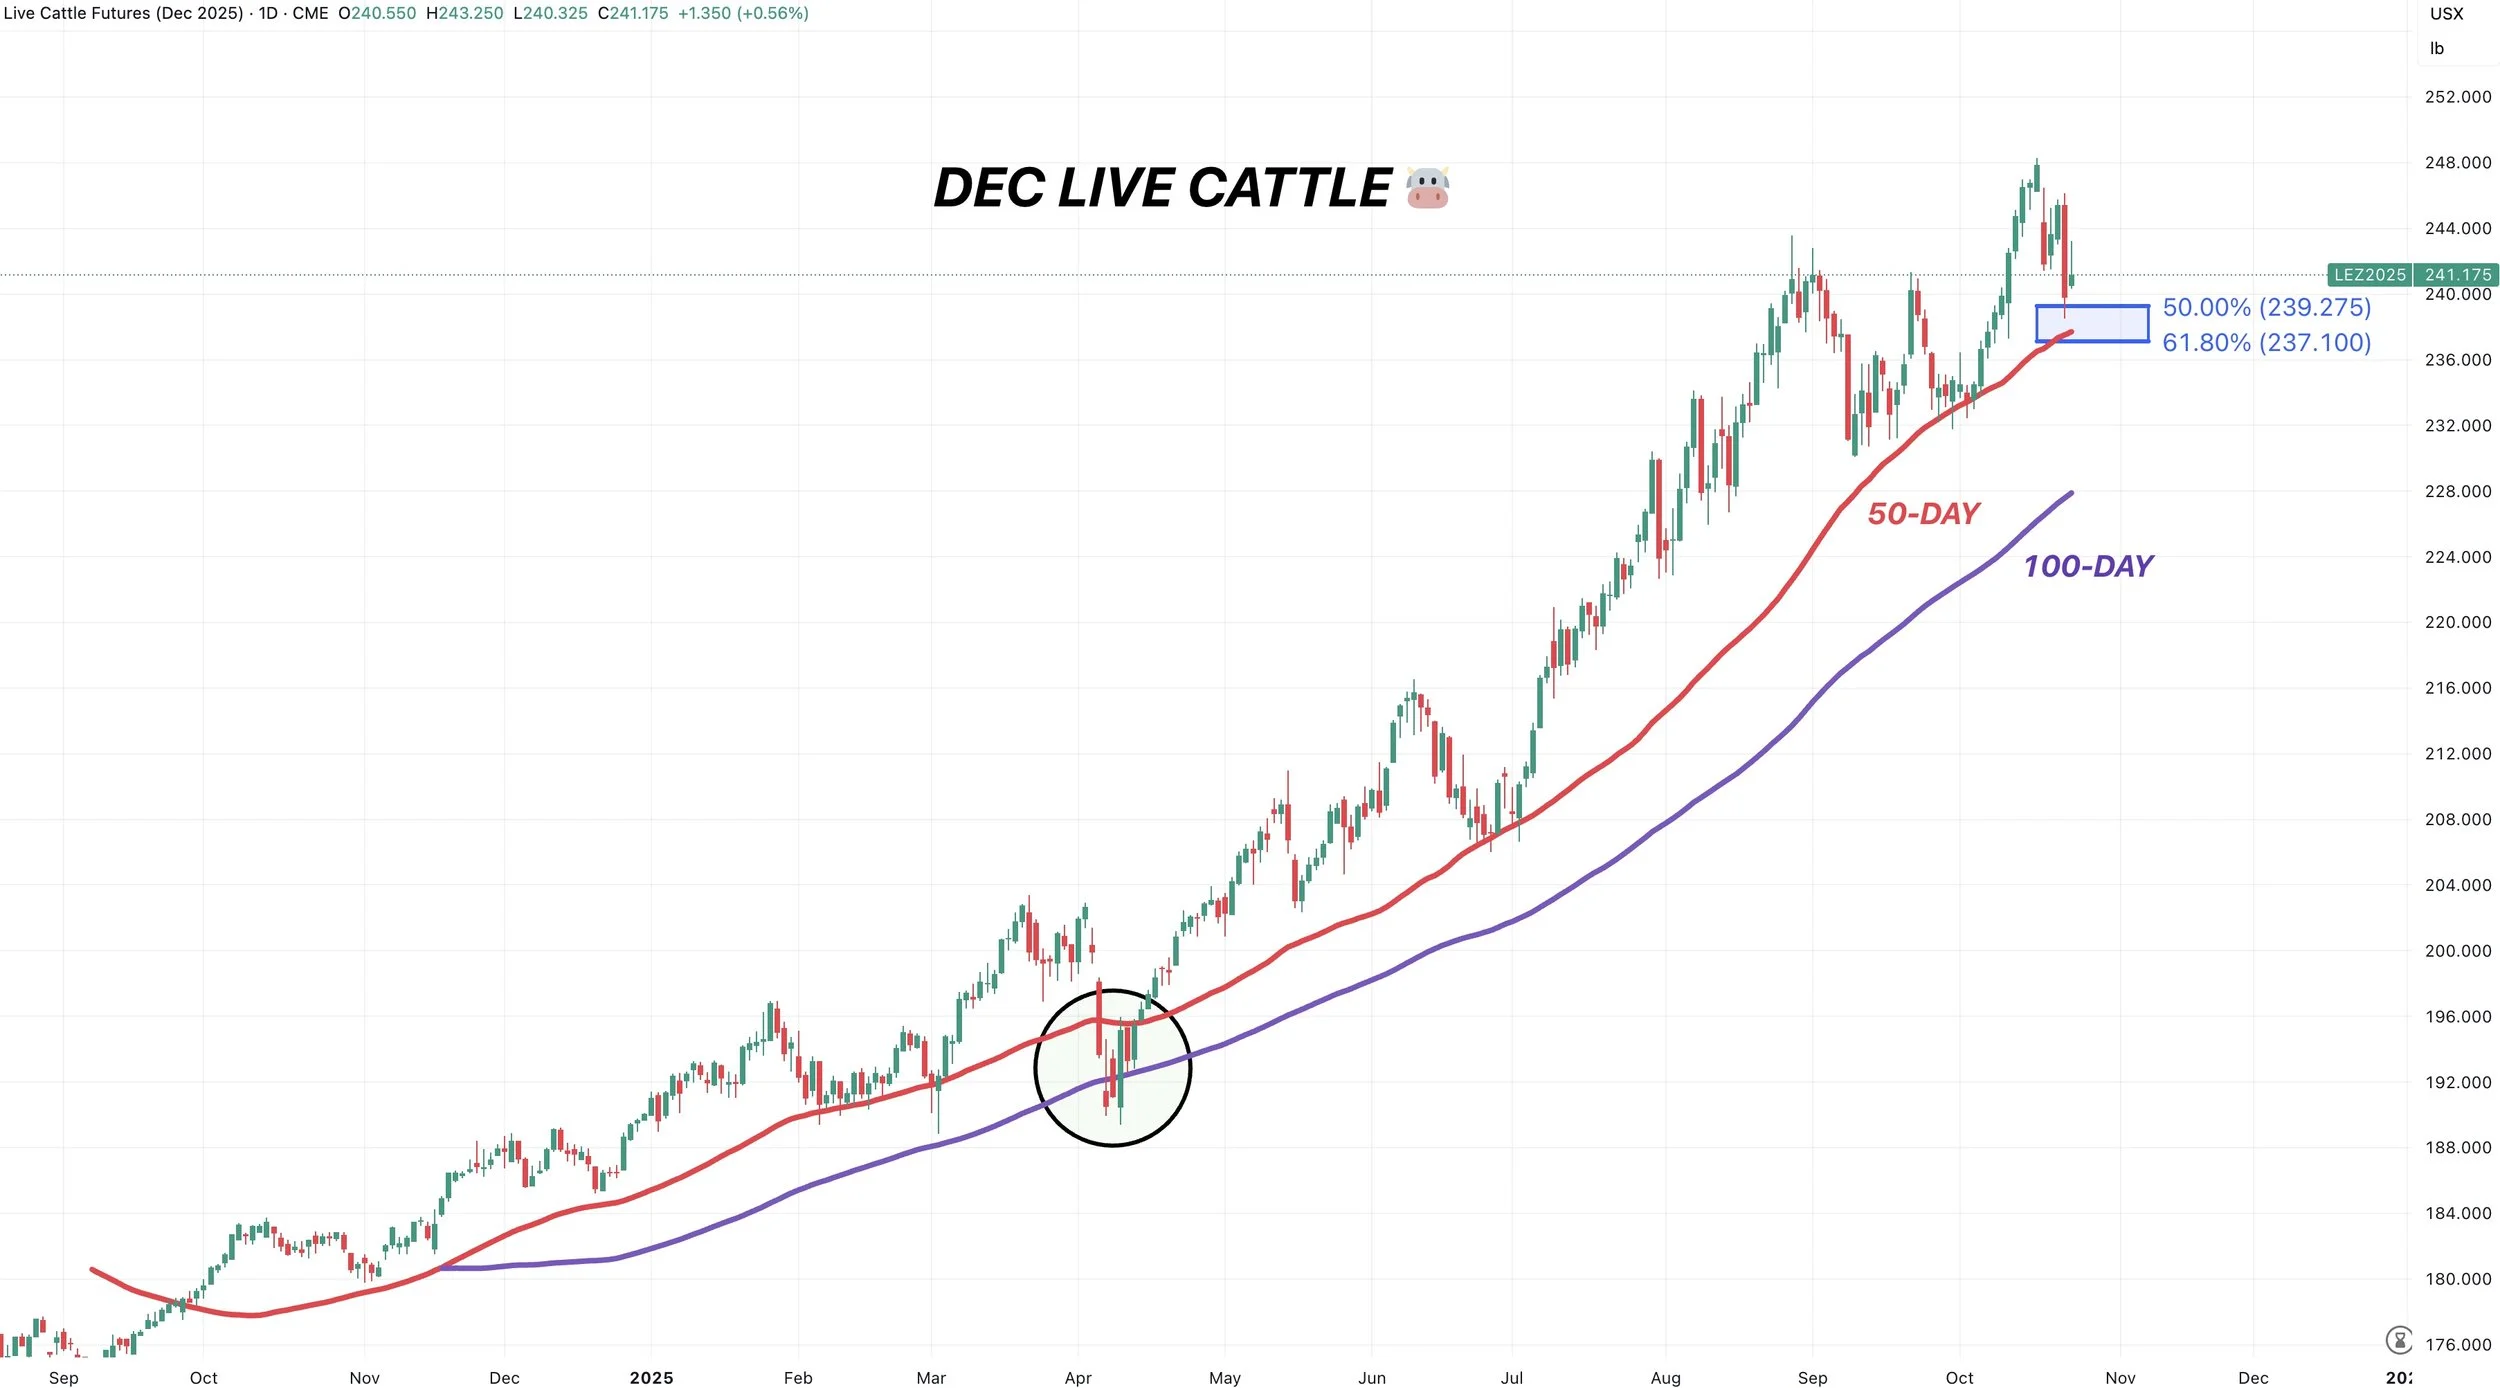
Dec Live Cattle 🐮
We rejected off that golden fib.
We are now breaking below some pretty critical support.
We broke below the 50-day MA for the first time since April.
This has acted as a complete floor the entire year. The entire run.
It has marked several bottoms.
The only time we broke below was April. We then ultimately came down and tested the 100-day.
This market is still clearly in an uptrend and only at prices seen two weeks ago.
However, breaking below this support is not a good sign as could very well spark additional downside.
I have been talking about the 50-day being our warning sign for months.

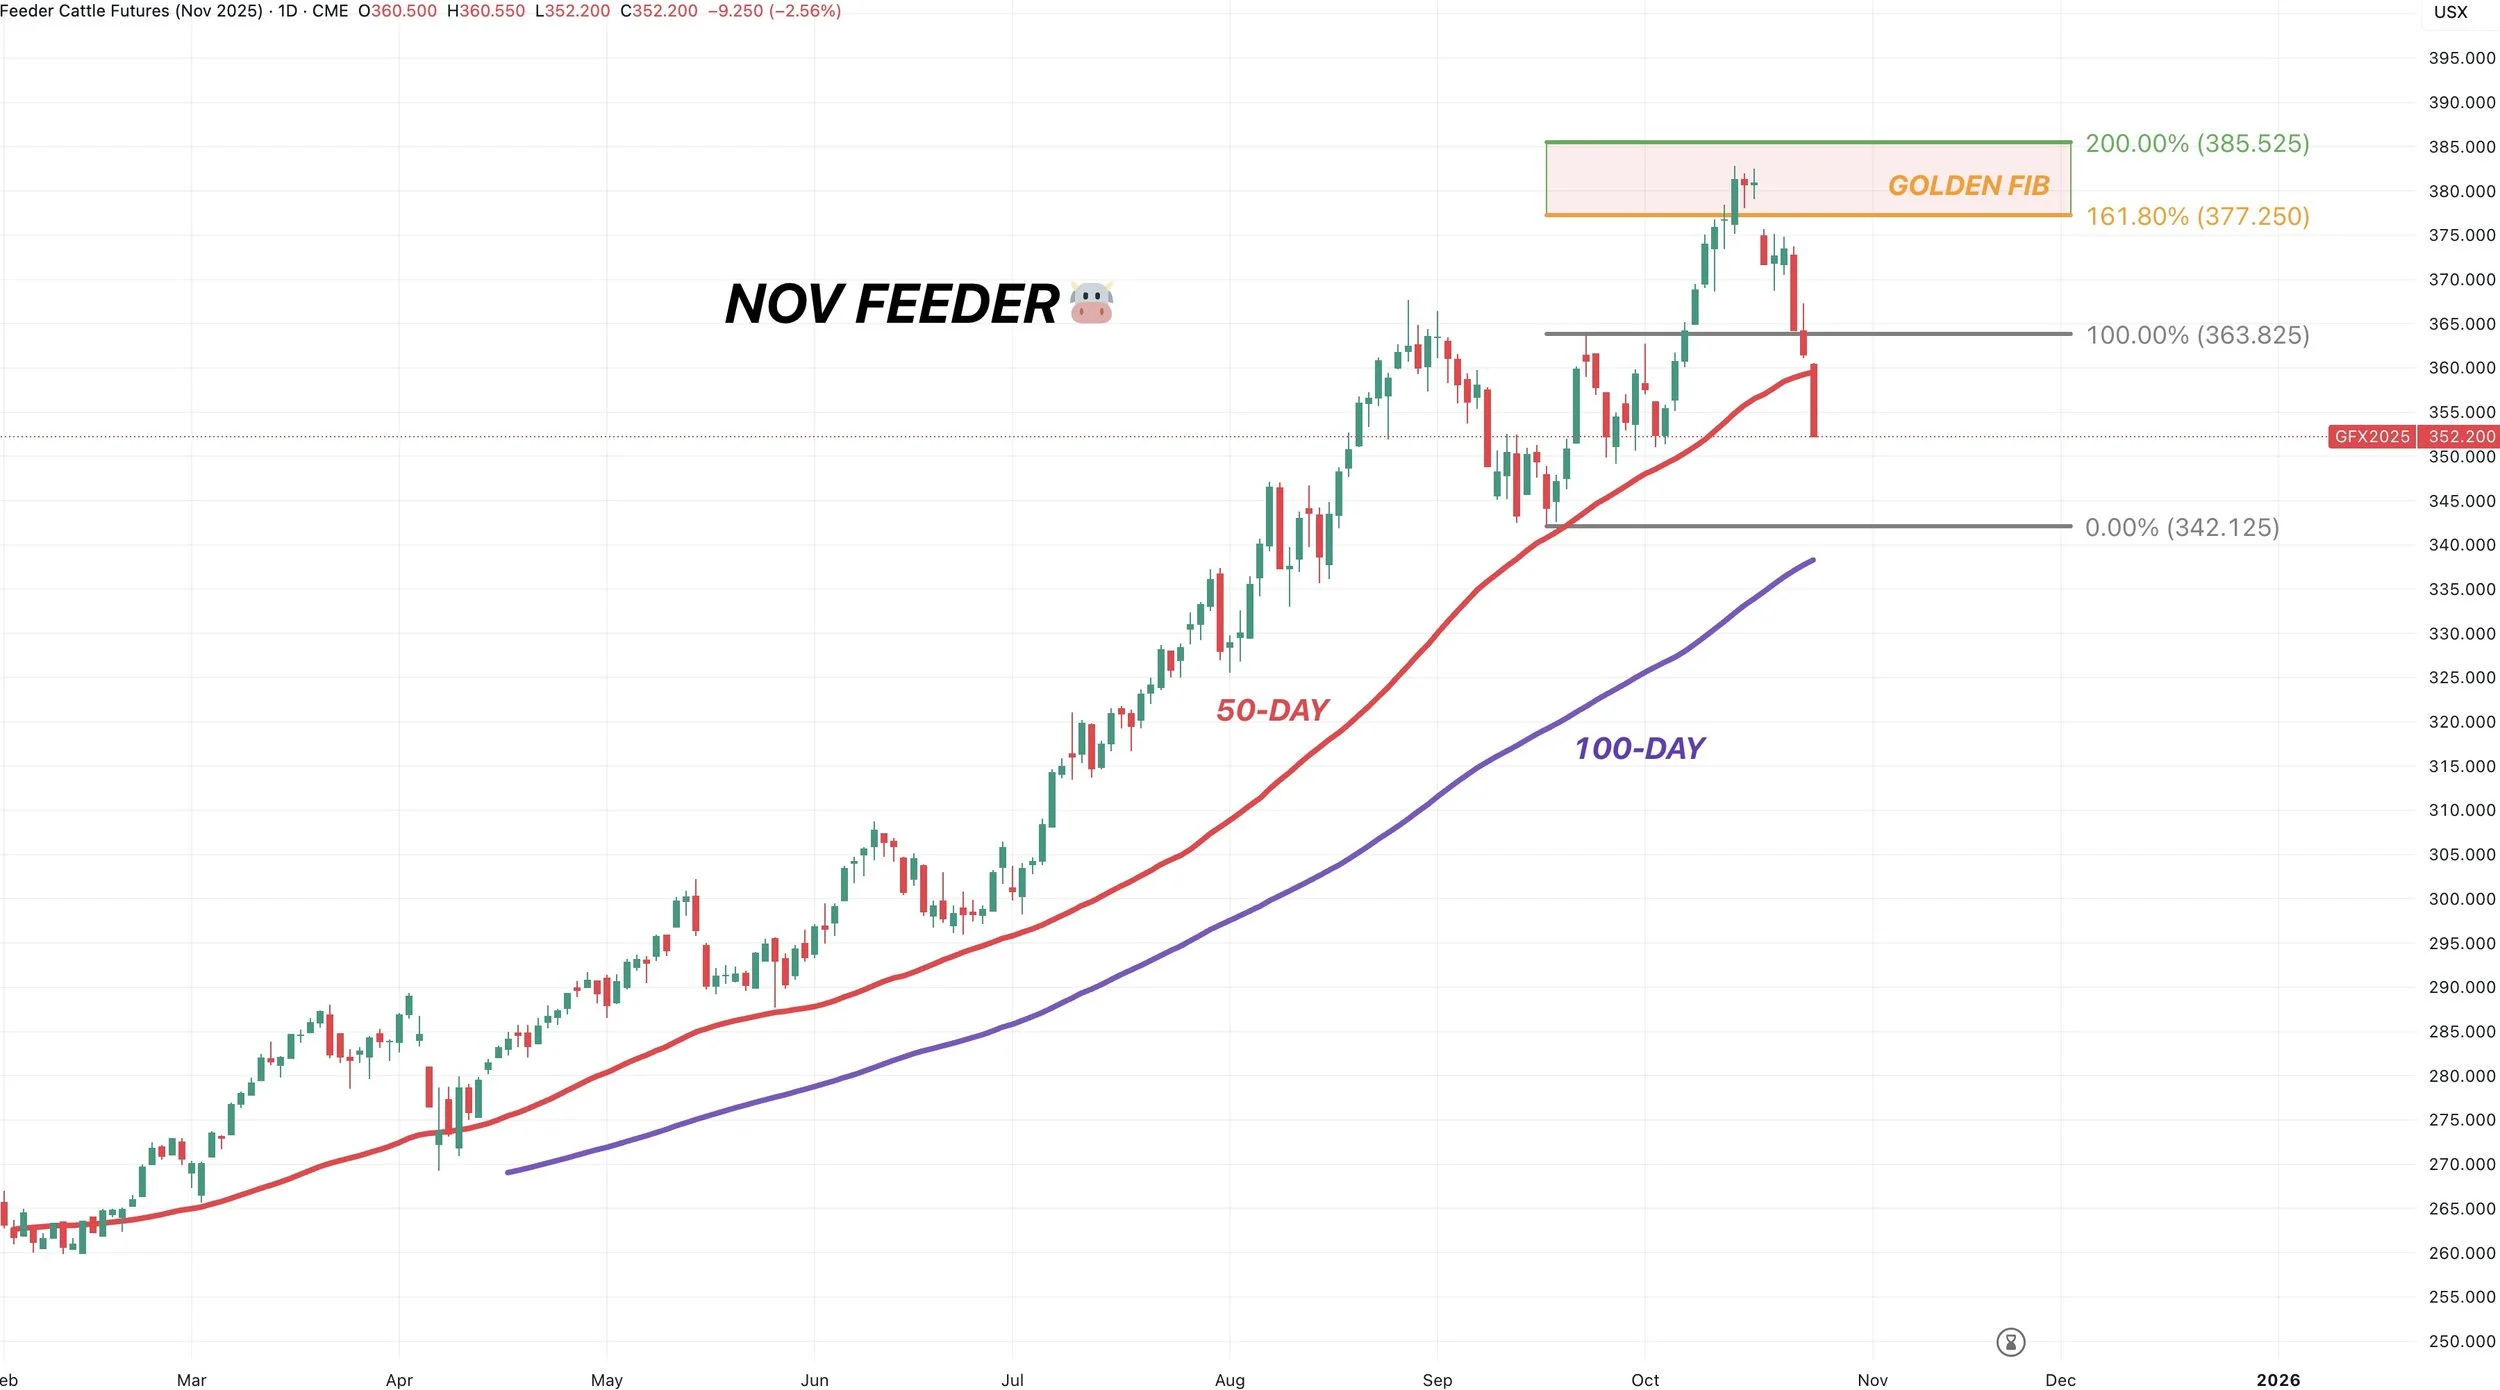
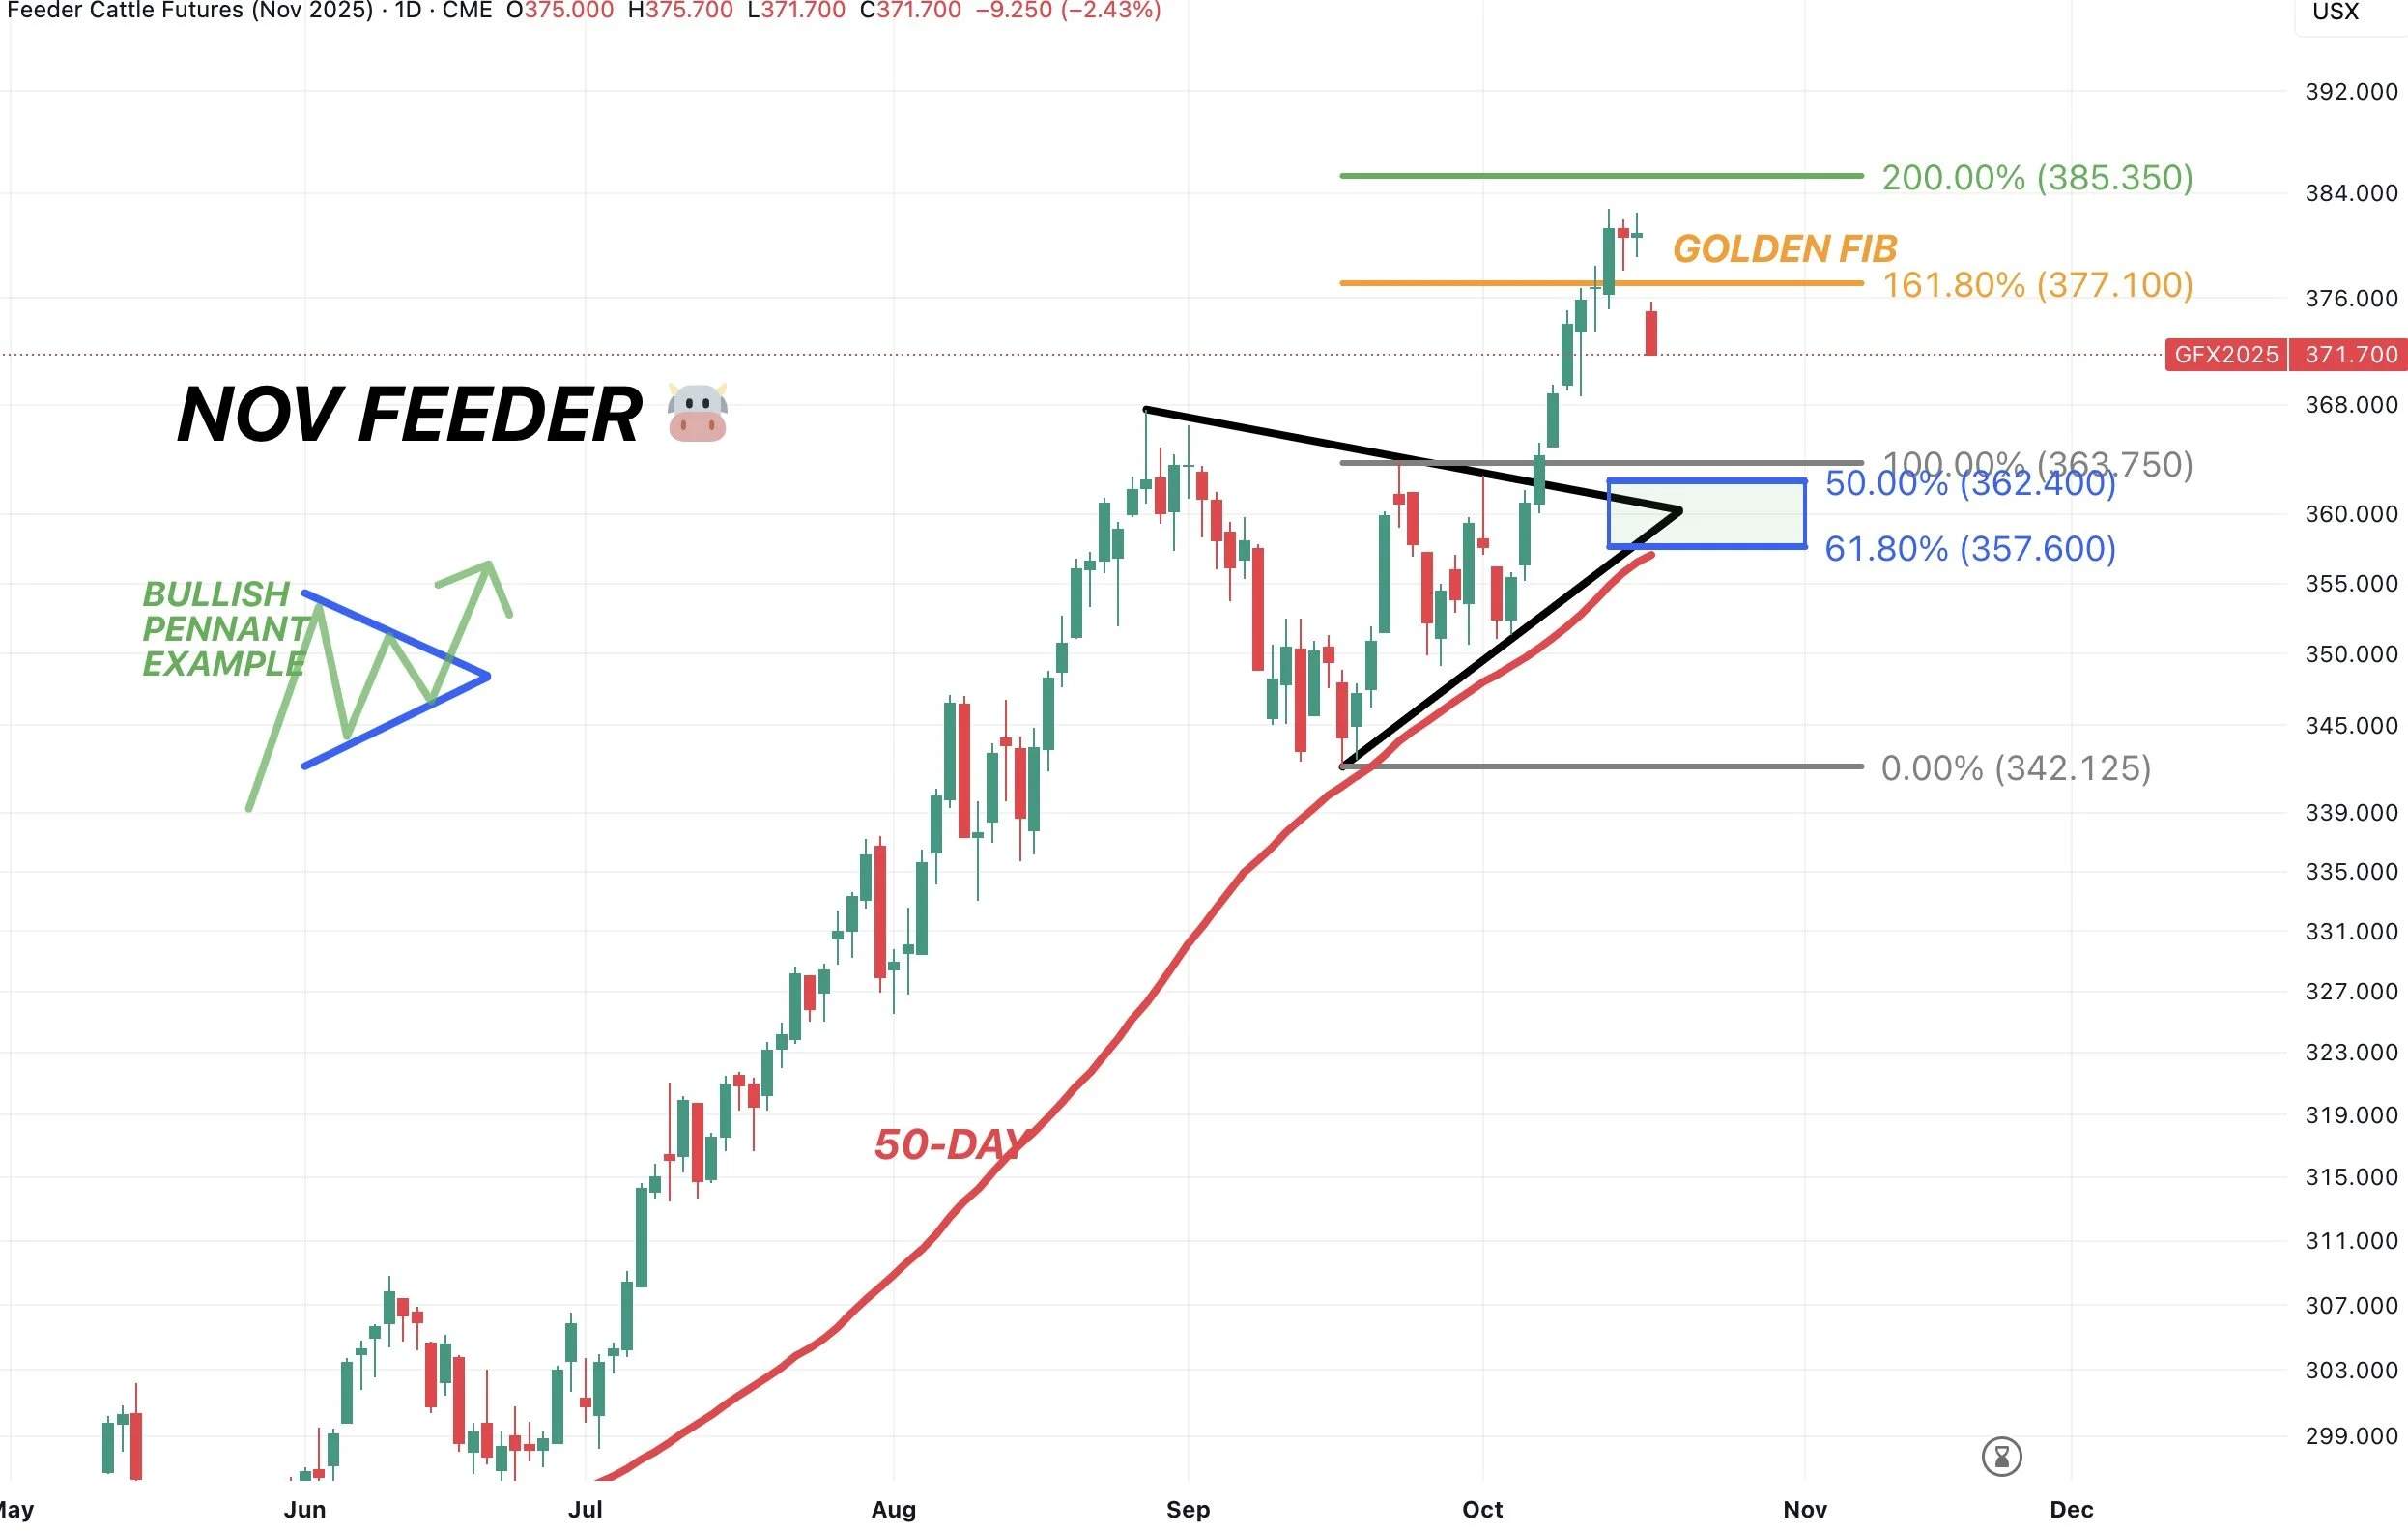
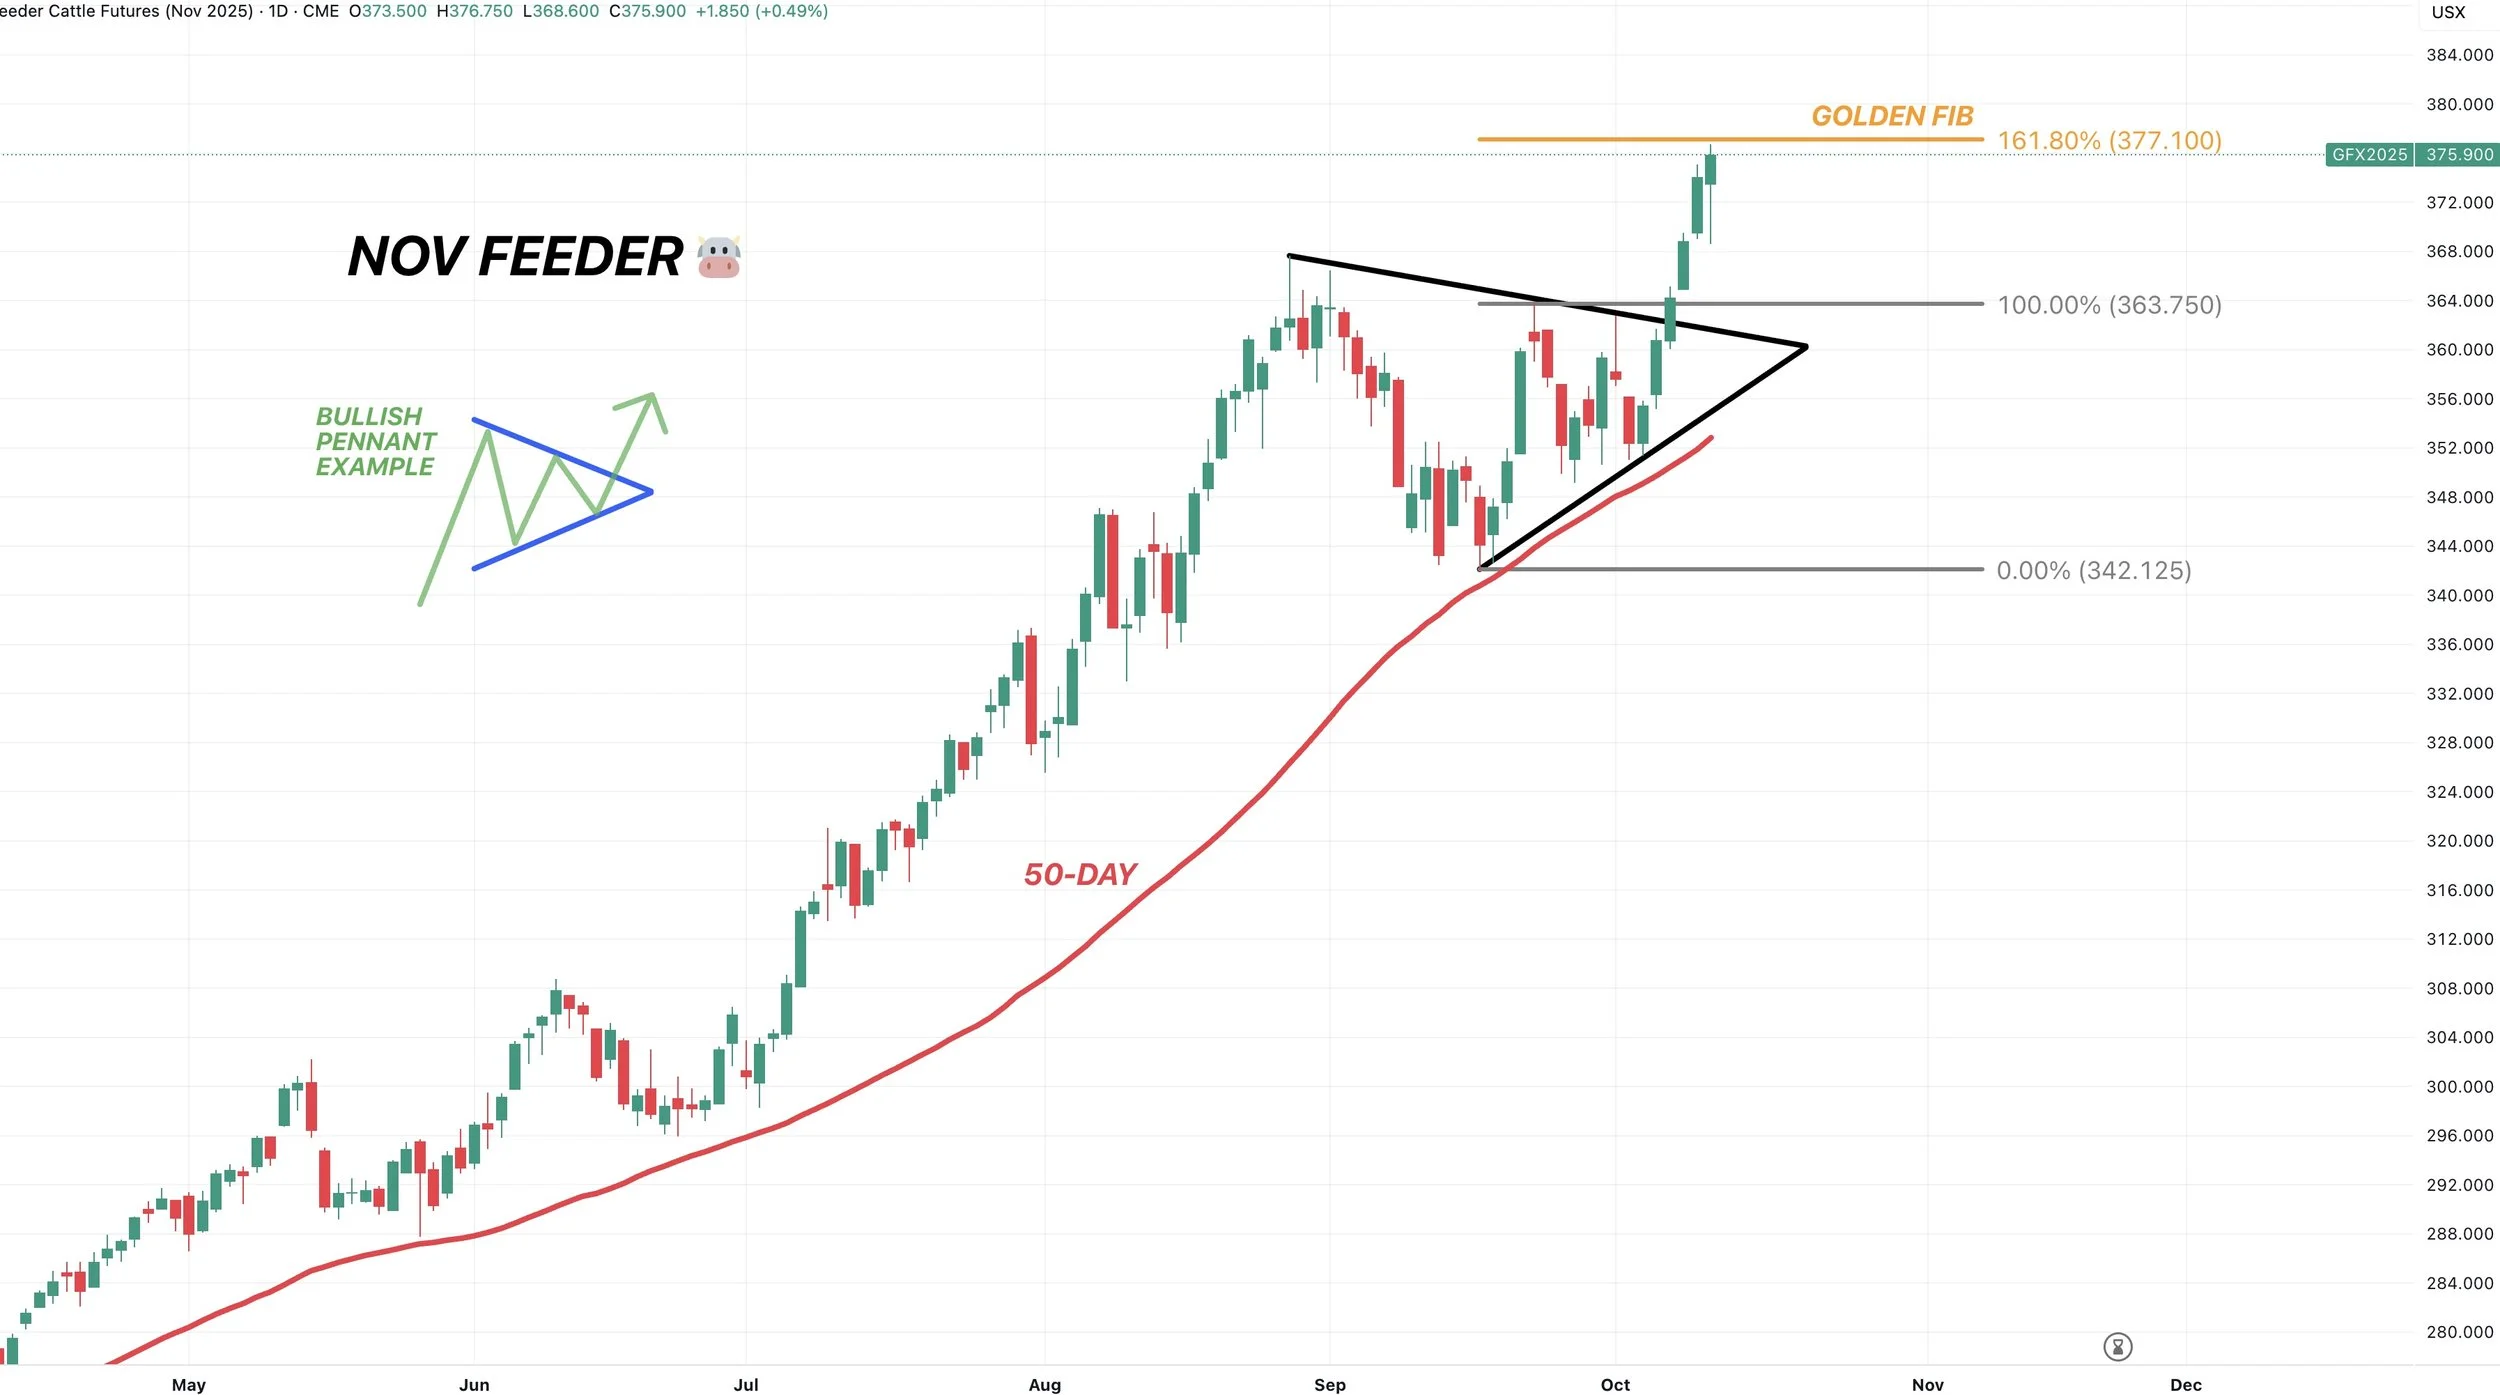
Nov Feeder 🐮
We also broke below that critical 50-day MA.
This is pretty much the very first time we’ve broken below in the entire life of this contract.
It could very well spark some more downside.
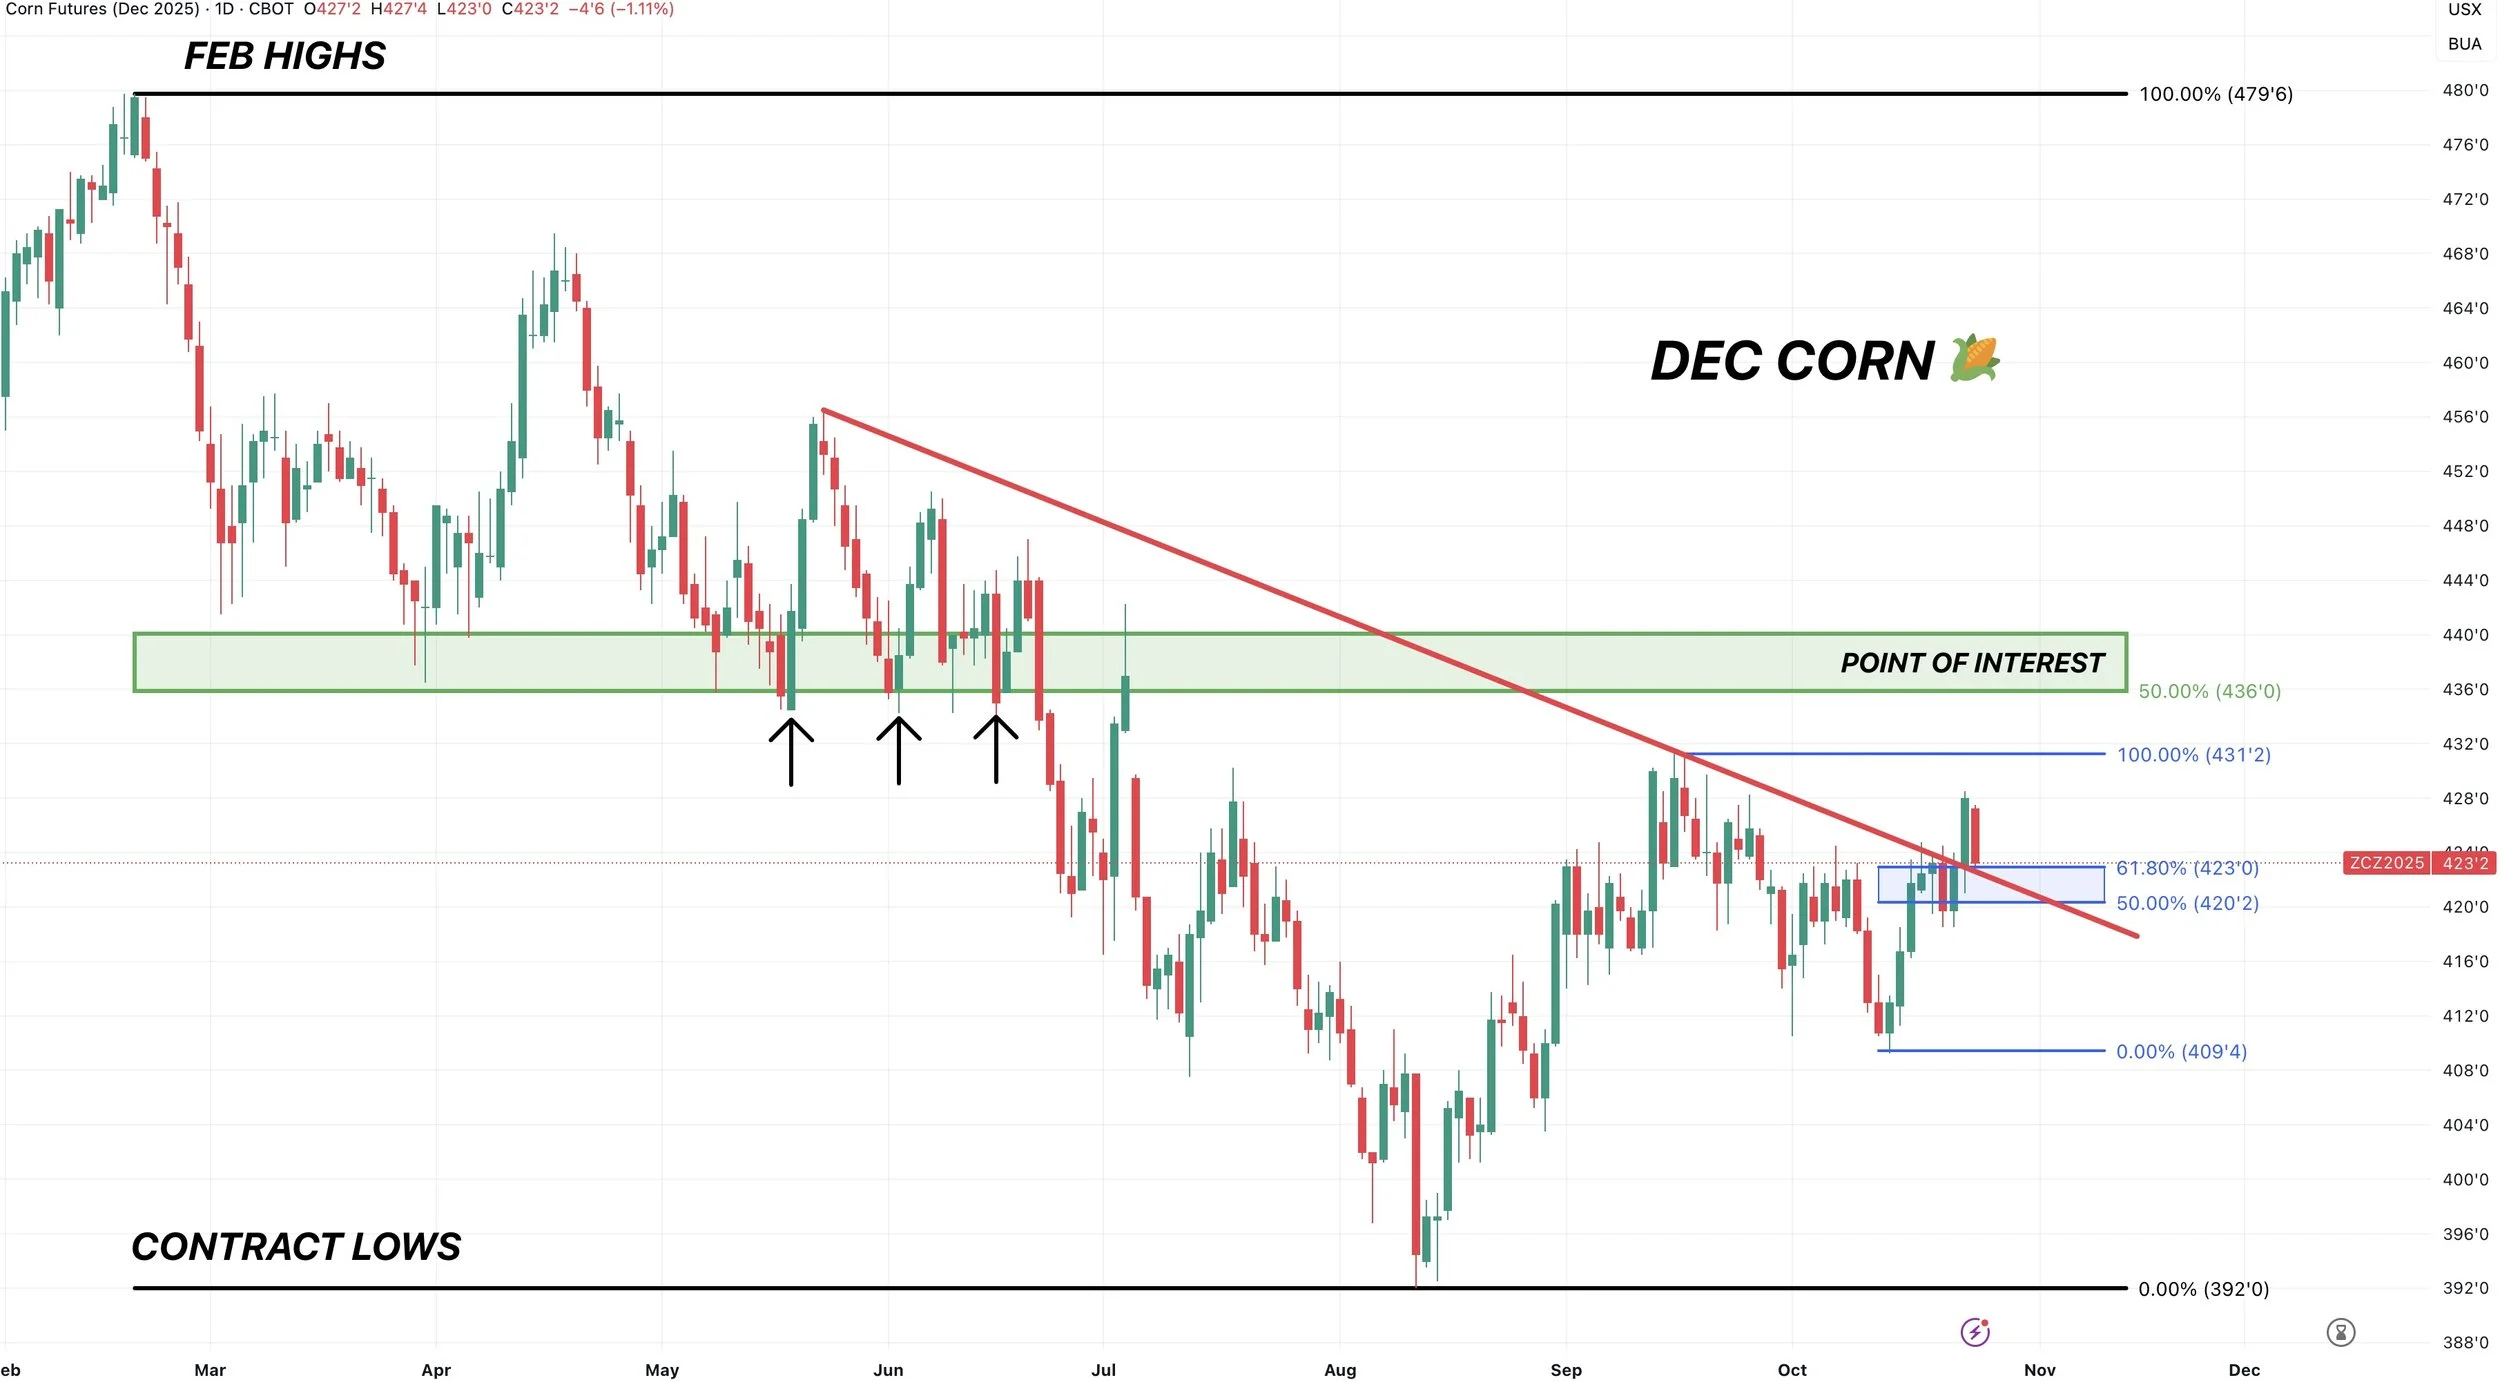
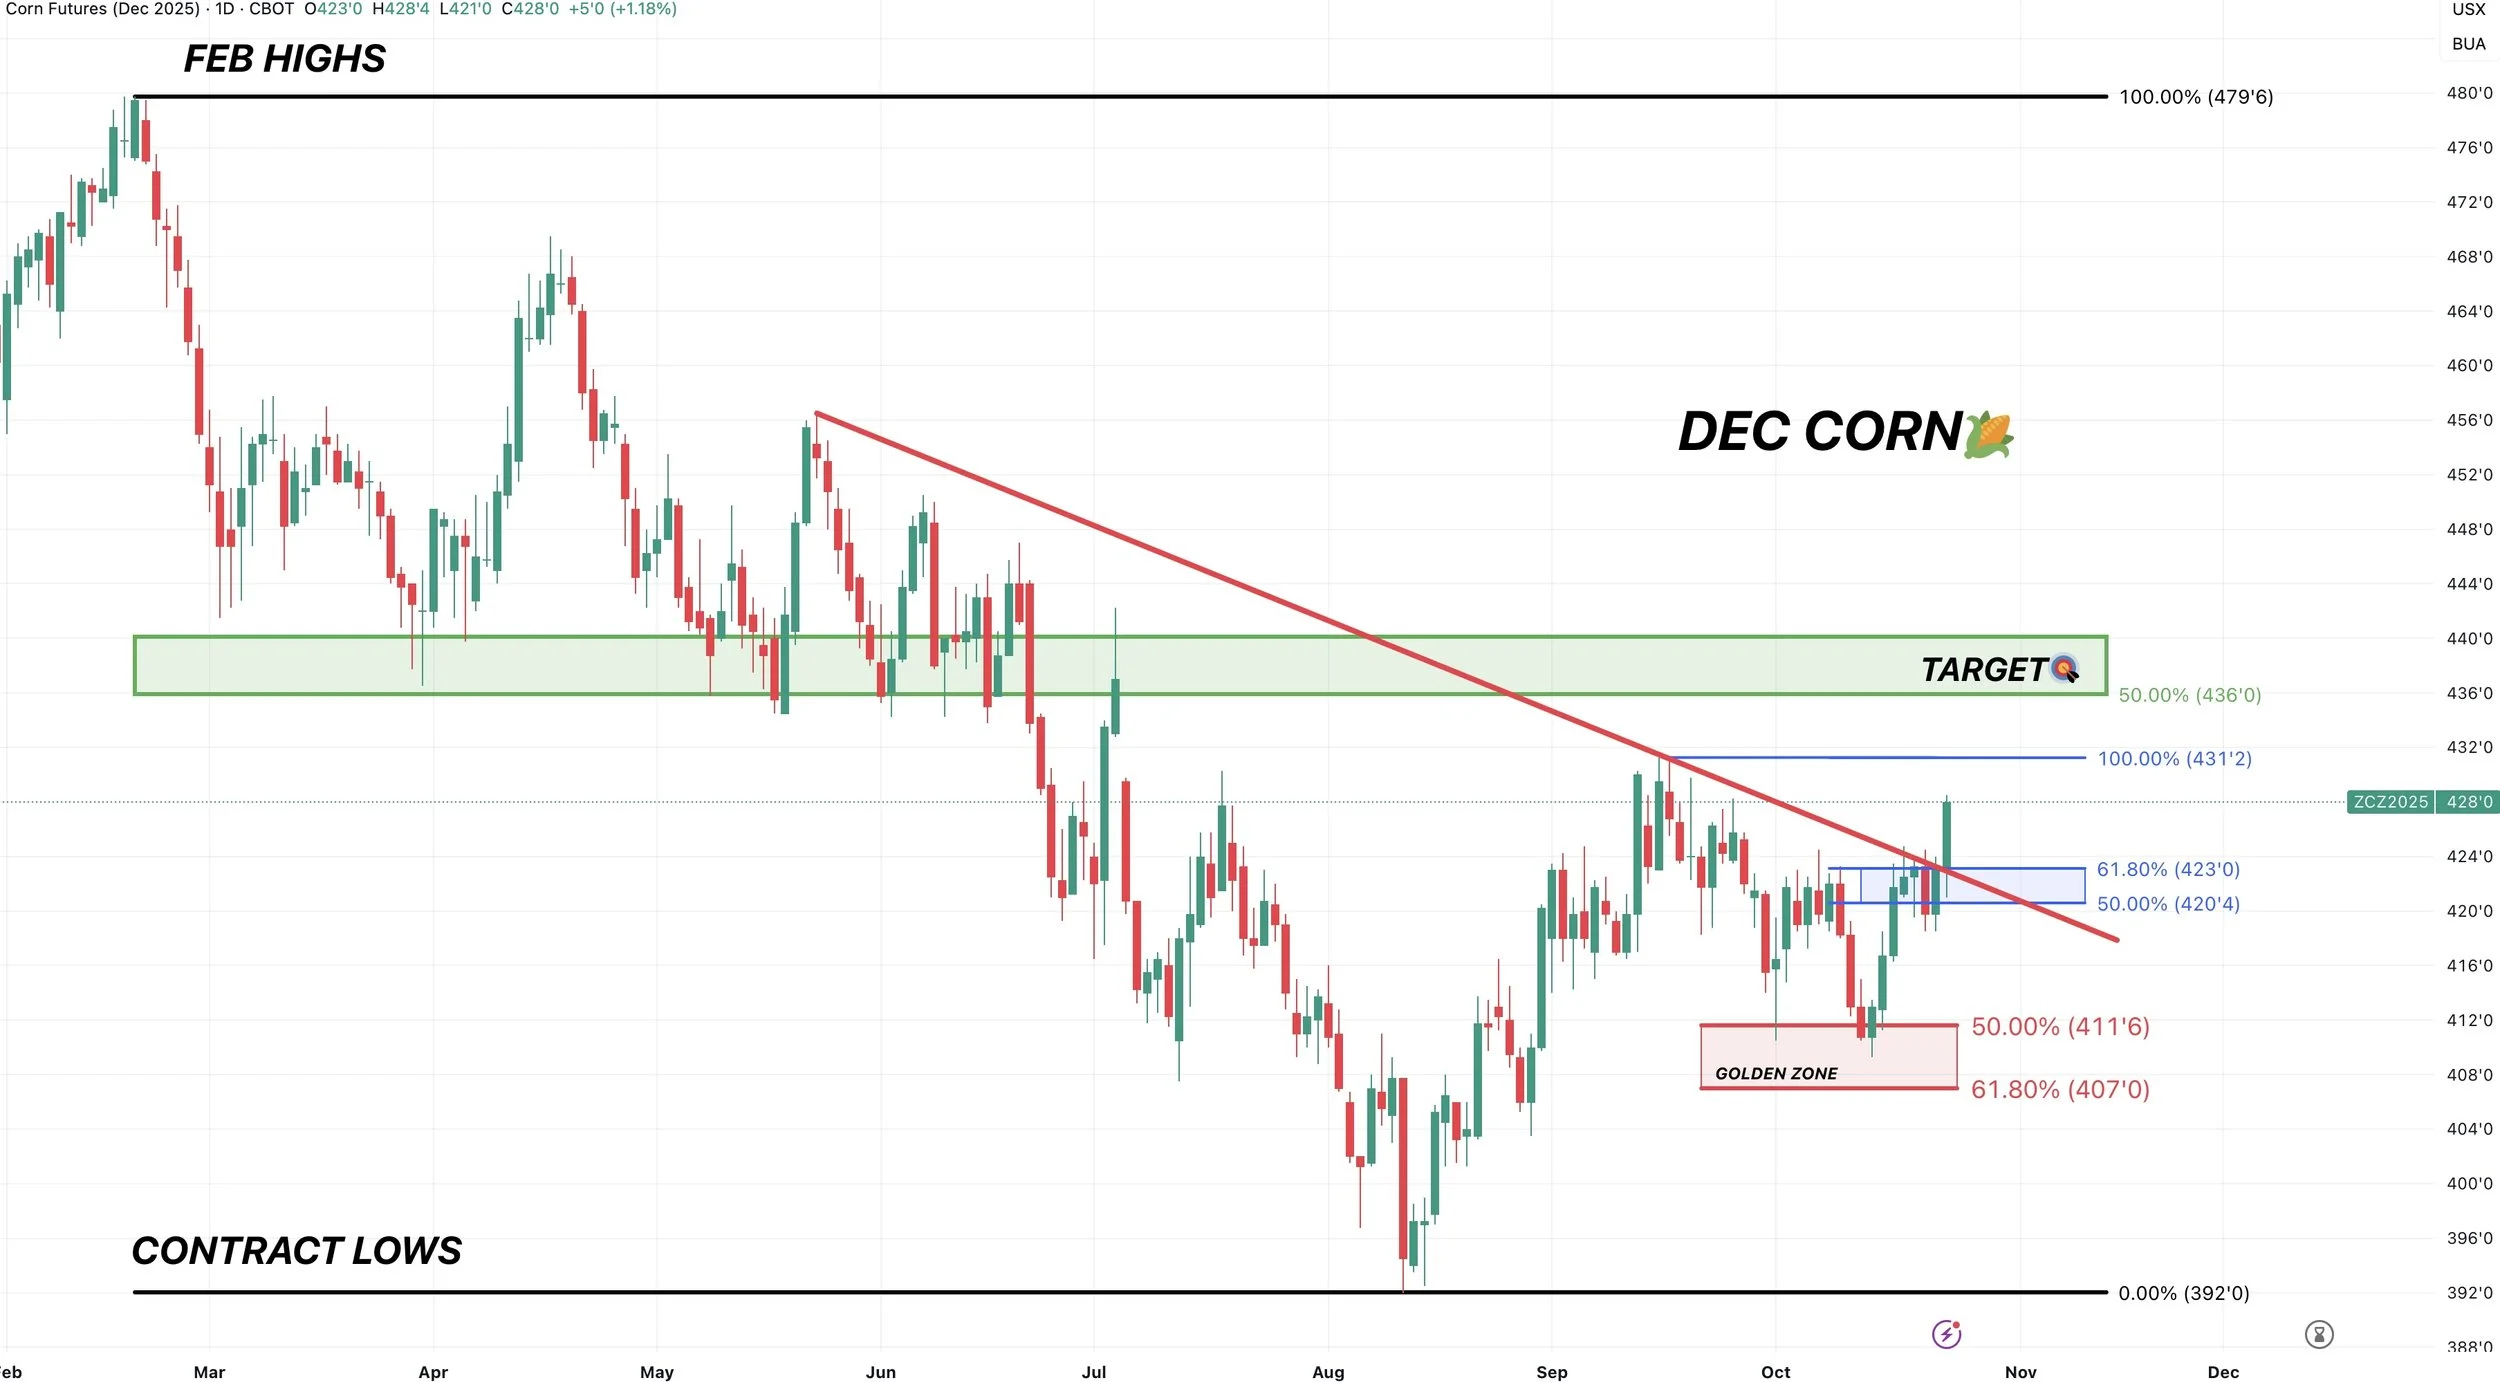
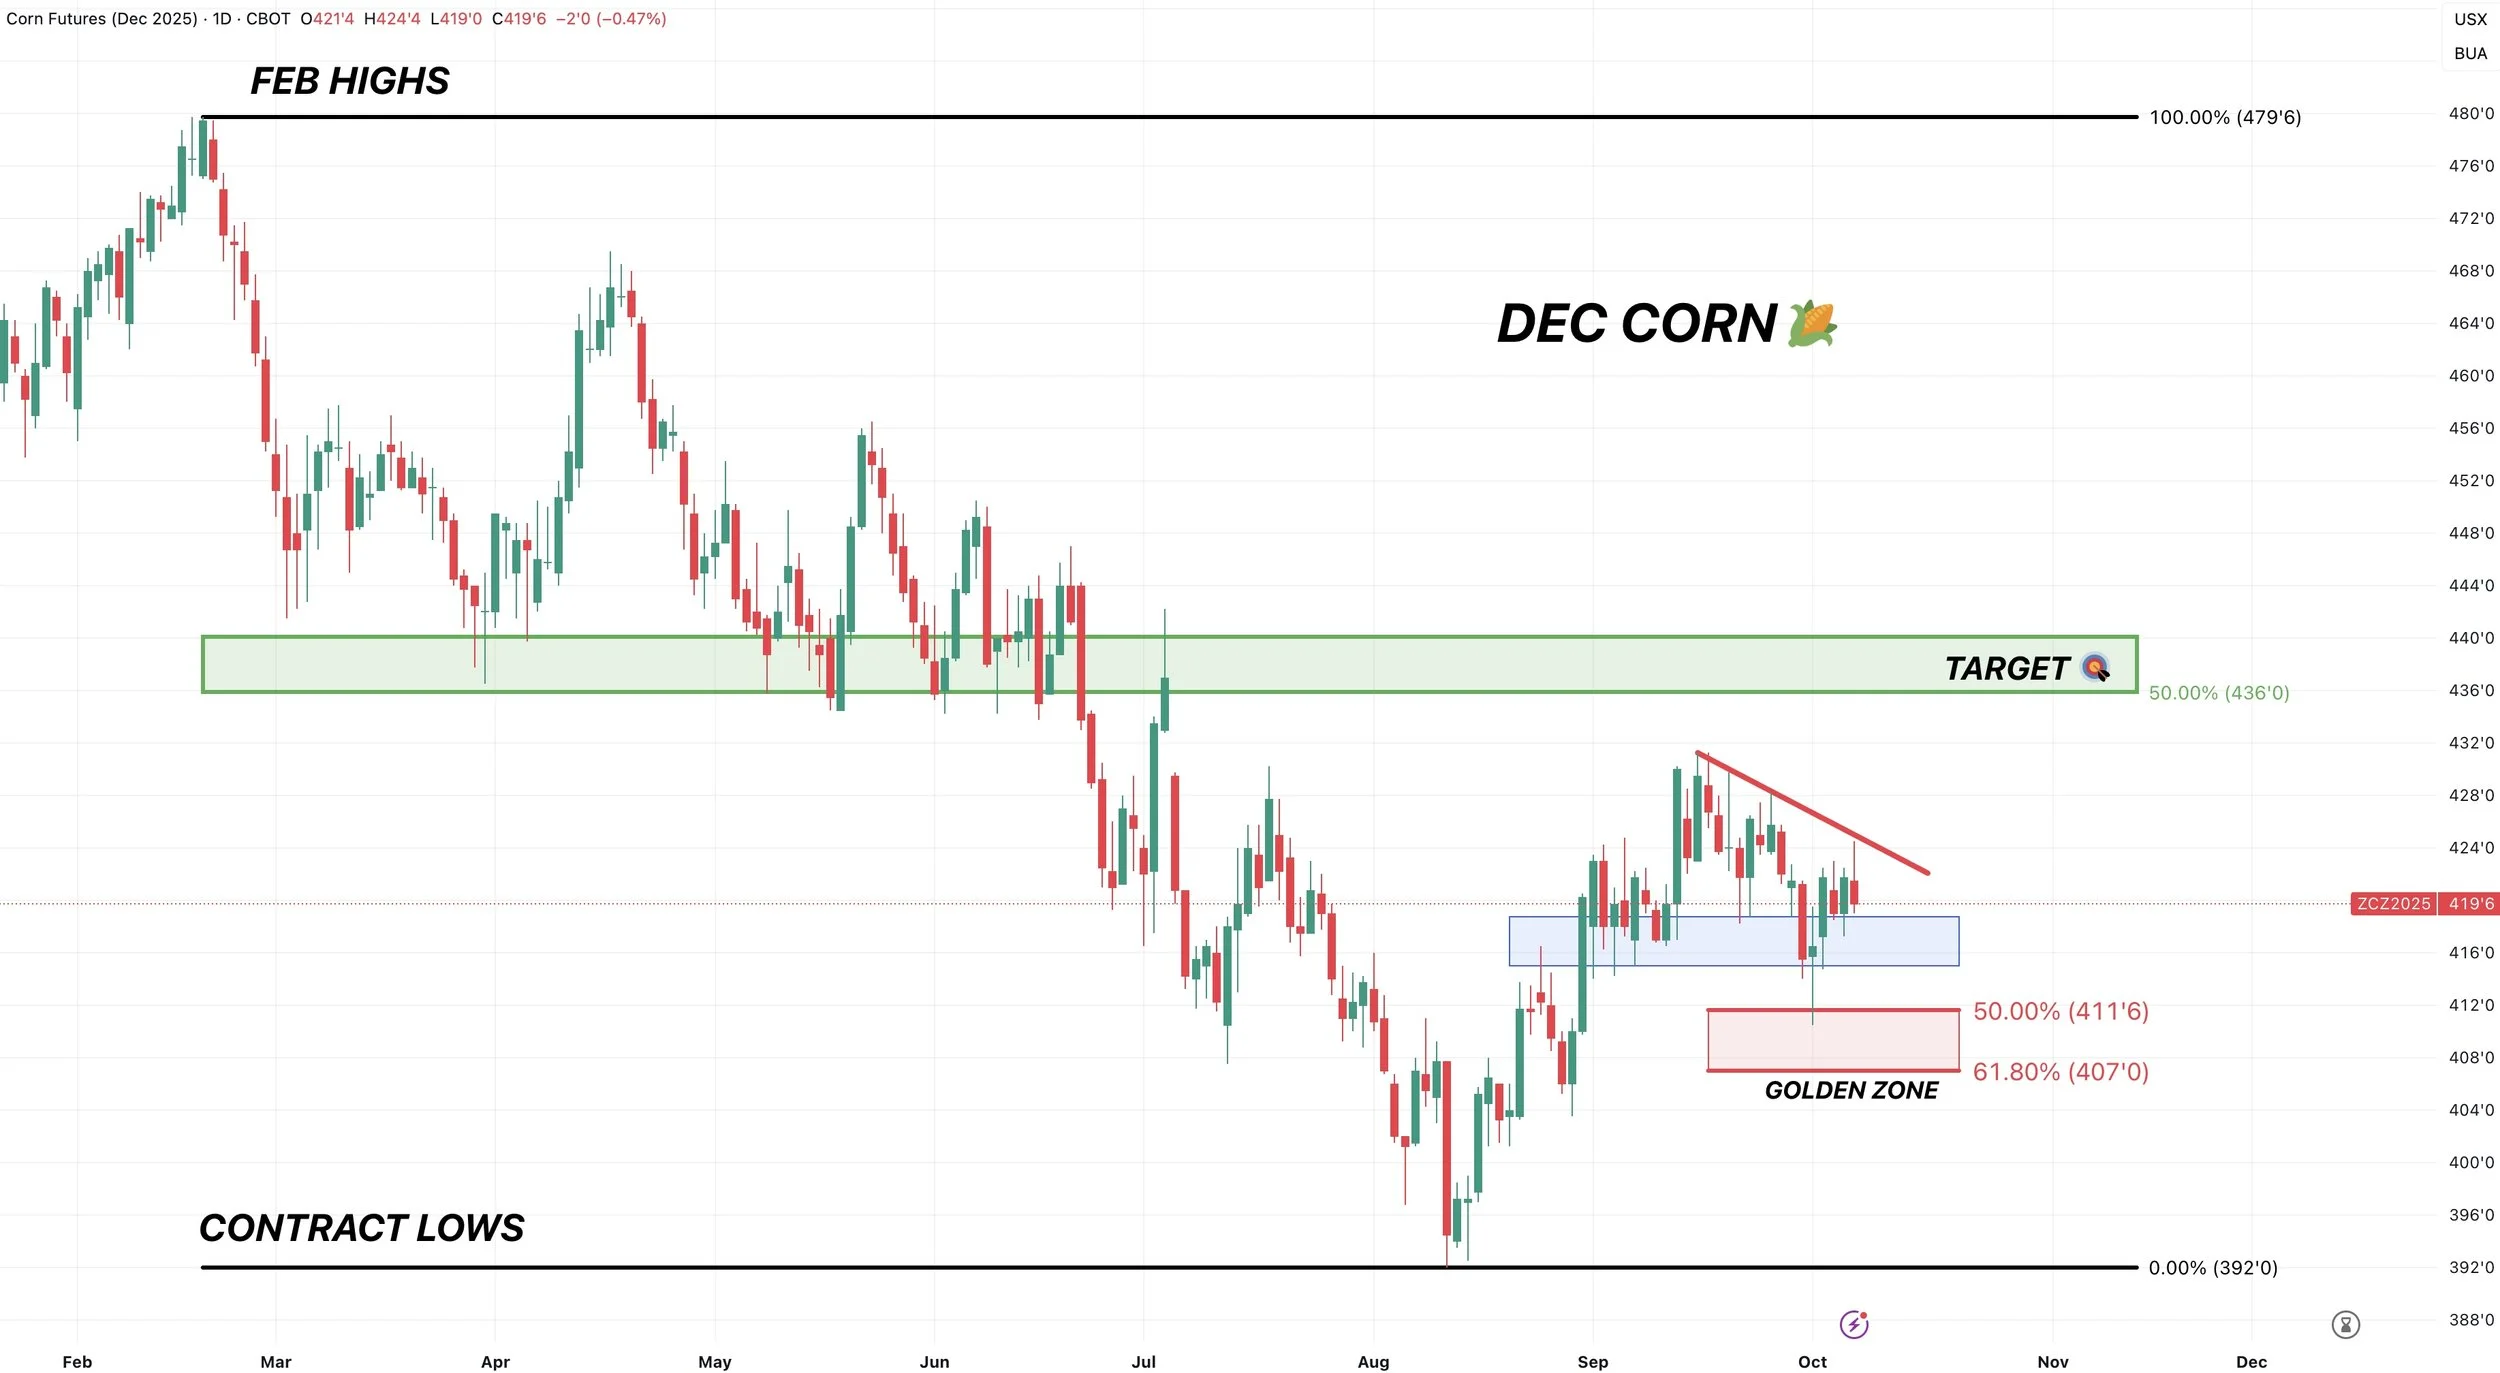
Dec Corn 🌽
I’m not concerned with the price action in corn today.
It was an inside day meaning we did not trade above yesterday’s highs or below yesterday’s lows.
Yesterday we had a clear breakout above the 61.8% retracement up to the Sep highs as well as a break from the downtrend resistance.
Most of the time (not every time) break above the 61.8% and it tells us we are going to see more upside.
I think today’s pressure could simply be a back test of our previous resistance. As old resistance is now viewed as support.
Past Sell or Protection Signals
Oct 13th: 🐮
Cattle sell signal & hedge alert.
Aug 22nd: 🌱
Soybean sell signal & hedge alert.
July 31st: 🐮
Cattle sell signal & hedge alert.
July 10th: 🐮
Cattle sell signal & hedge alert.
CLICK HERE TO VIEW
June 5th: 🐮
Cattle sell signal & hedge alert.
June 2nd: 🌾
MPLS wheat sell signal.
April 10th: 🌽
Old crop corn sell signal.
March 19th: 🐮
Cattle hedge & sell signal.
Feb 18th: 🌽 🌾
Old crop KC wheat & old crop corn signal.
Jan 23rd: 🌽 🌱
Corn & beans old crop sell signal.
CLICK HERE TO VIEW
Jan 15th: 🌽 🌱
Corn & beans hedge alert/sell signal.
Jan 2nd: 🐮
Cattle hedge alert at new all-time highs & target.
Dec 11th: 🌽
Corn sell signal at $4.51 200-day MA
CLICK HERE TO VIEW
Oct 2nd: 🌾
Wheat sell signal at $6.12 target
Sep 30th: 🌽
Corn protection signal at $4.23-26
Sep 27th: 🌱
Soybean sell & protection signal at $10.65
Sep 13th: 🌾
Wheat sell signal at $5.98
May 22nd: 🌾
Wheat sell signal when wheat traded +$7.00
Want to Talk?
Our phones are open 24/7 for you guys if you ever need anything or want to discuss your operation.
Hedge Account
Interested in a hedge account? Use the link below to set up an account or shoot Jeremey a call at (605)295-3100.
GRAINS BREAK OUT
MARKET UPDATE
You can scroll to read the usual update as well. As the written version is the exact same as the video.
Timestamps for video:
Overview: 0:00min
Corn: 3:00min
Options vs DP: 5:00min
Beans: 9:10min
Wheat: 14:10min
Cattle: 15:00min
Want to talk about your situation?
(605)295-3100
Your free trial has ended
You will not get our next signal or future updates
Here is extended access to our harvest sale
Don’t miss the next opportunity
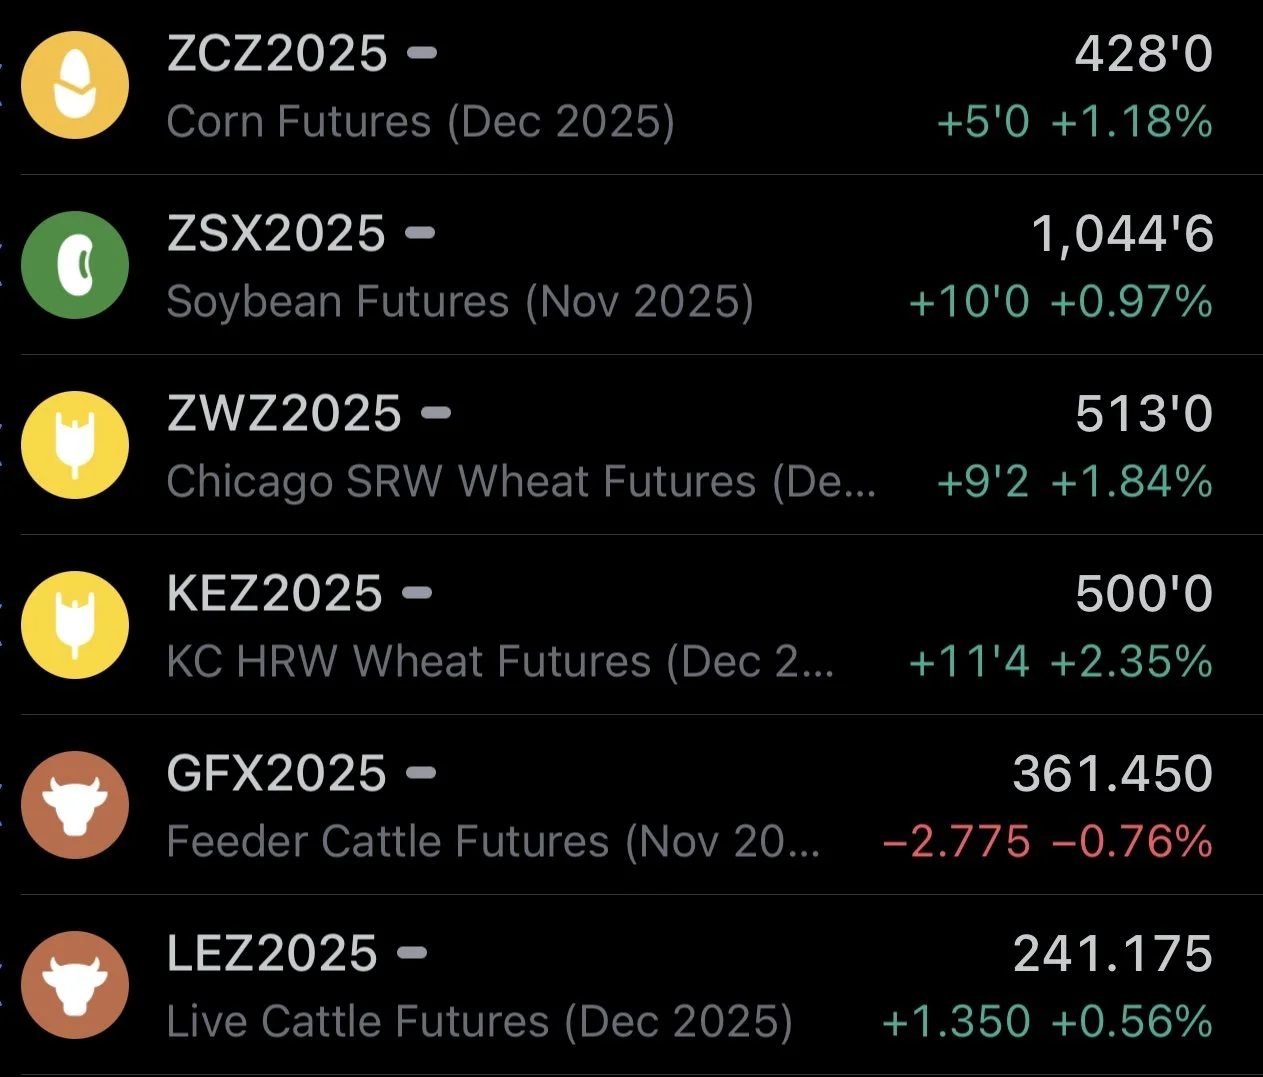
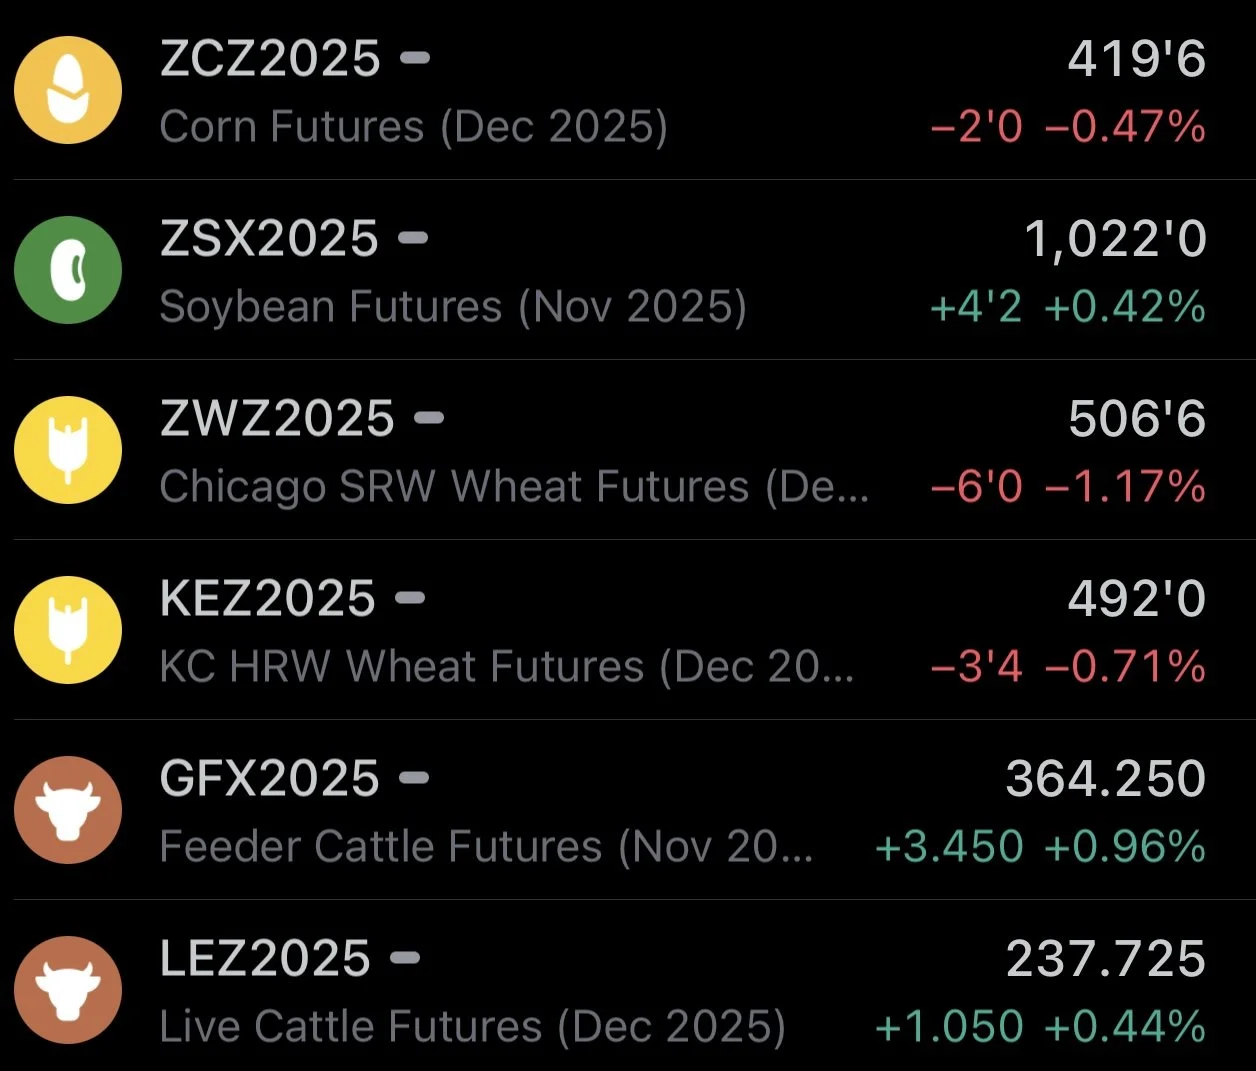
Futures Prices Close
Overview
Great day across the grain markets with the wheat market leading the way higher as soybeans continue to catch a bid from trade deal optimism.
The cattle market was mixed. Feeder cattle led this move higher while live cattle lagged behind. We are now seeing that feeder to fat spread get back in line as live cattle has held up better on this sell off.
Today is a longer update. We go over a ton of charts, targets, the math behind delayed price vs options and what the right move might be in the corn market.
Let's dive right into the news before we jump into the good stuff.
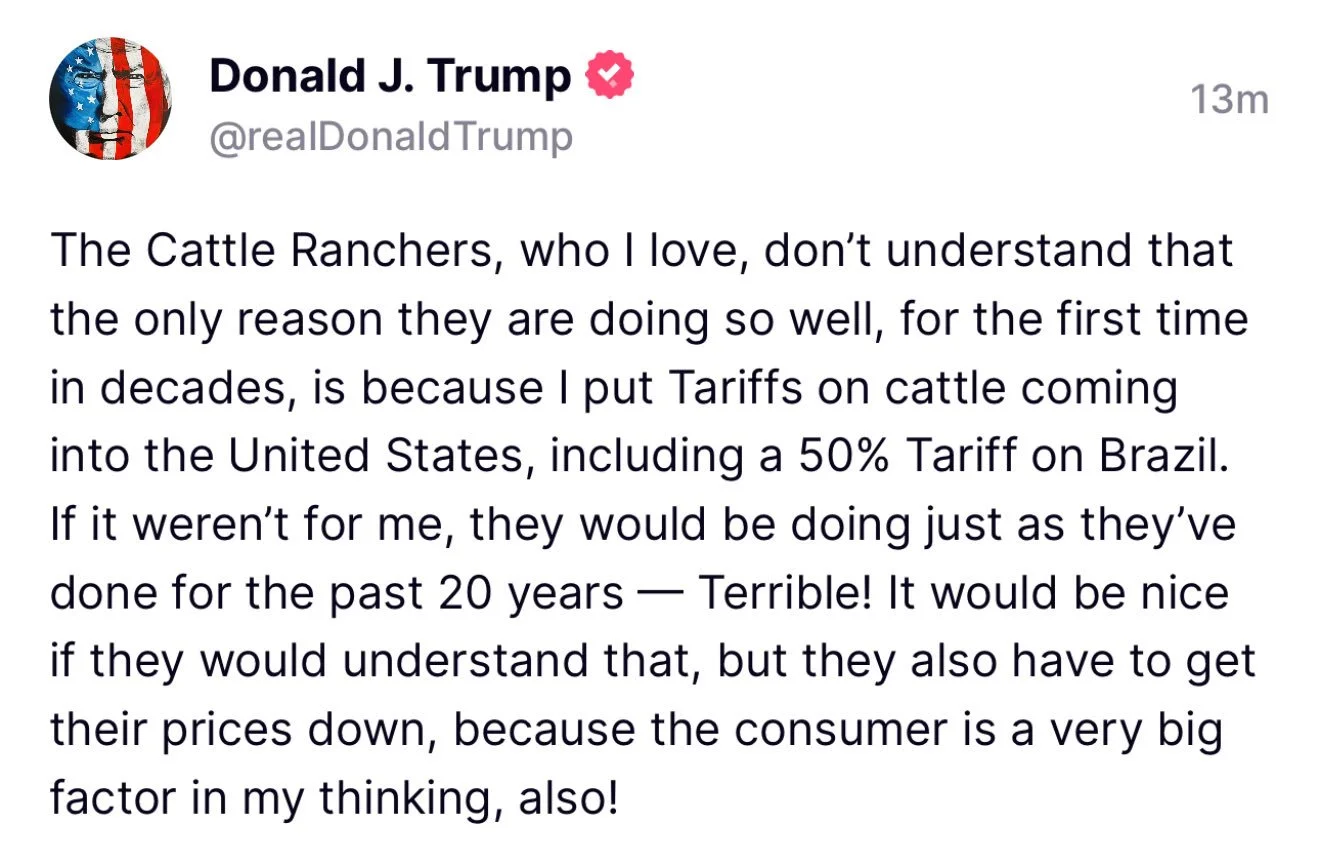
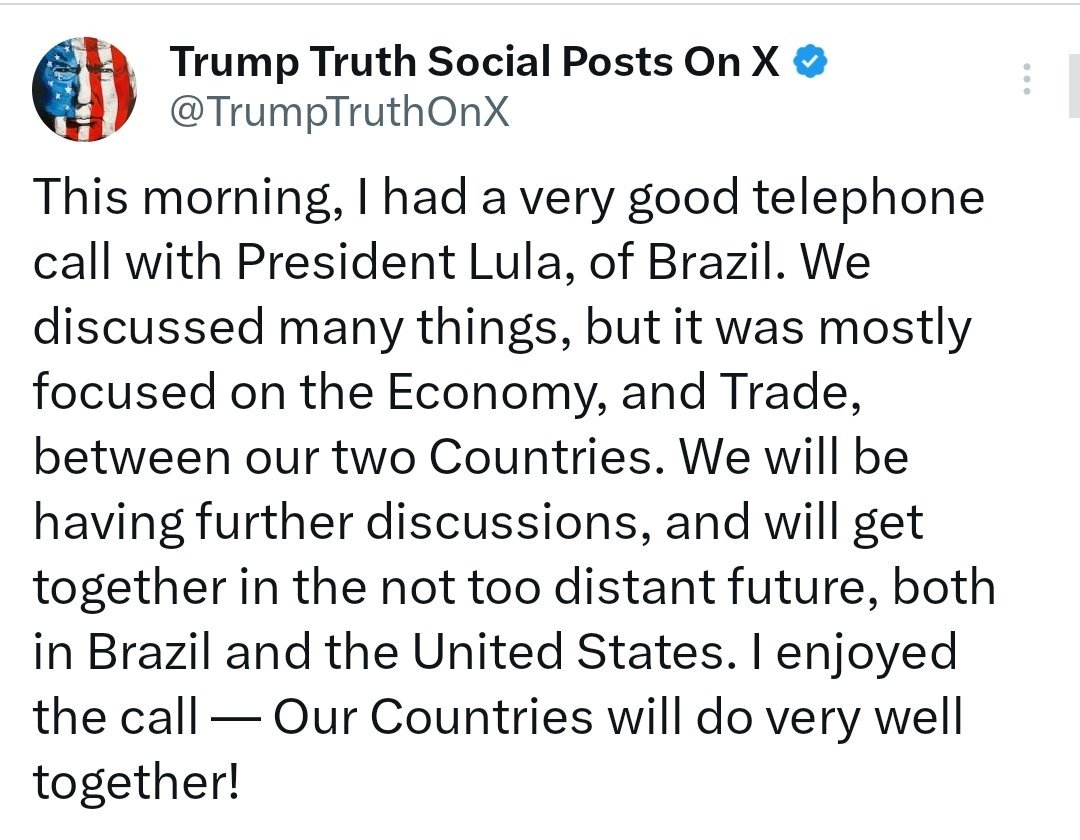
Trump Cattle News
Trump made quiet a few comments yesterday.
The one that stirred the most controversy and upset many was these tweets about the cattle market.
He claimed that he is "the only reason cattle ranchers are doing so well" and that they "have to get their prices down" as the consumer is a big factor.
A few days ago, he said they are going to start importing Argentine beef, but that really doesn’t change anything.
Brazil is the one you have to be worried about. If he removes that tariff on Brazil beef that could add some pressure to this market and be a bearish factor. I believe he is scheduled to meet with Brazil next week, so that is going to be something to watch closely.
Regardless of the tariffs, cattle herds are at their lowest levels of all-time. That is the biggest reason why this market is higher. Supply is the tightest it has ever been.
Yes, the government shut down the Mexican border, amongst other things that helped fuel this rally. But tariffs alone aren’t the reason for the high prices.
There are certainly risks in this market which we'll touch on later.
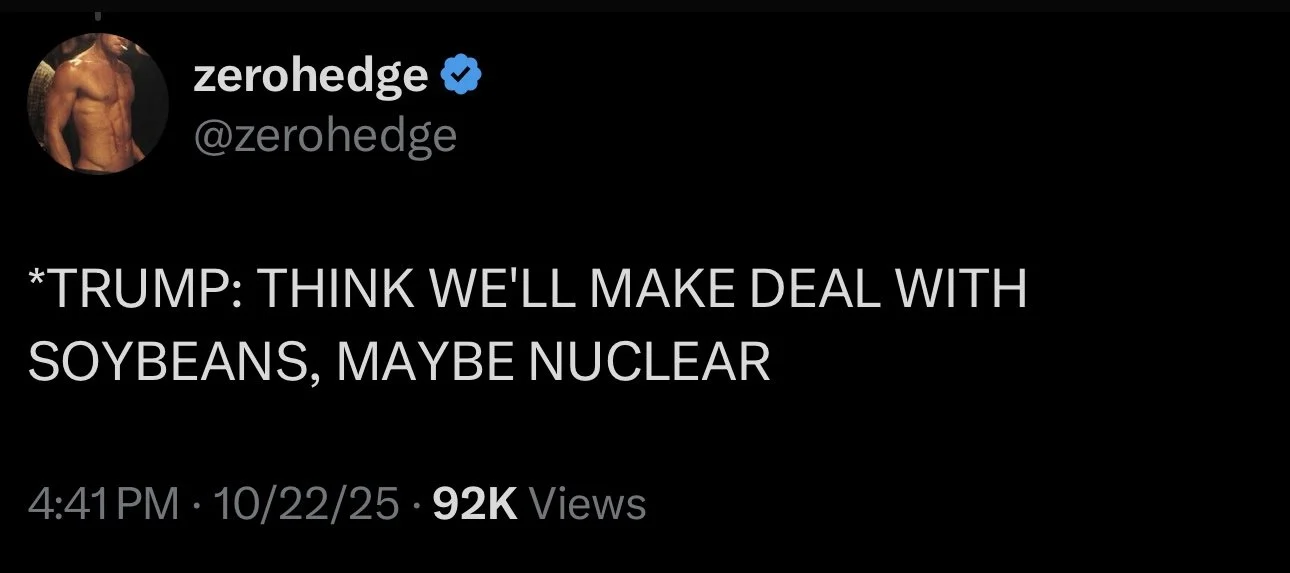
Trump Soybean News
On a more positive note, yesterday Trump said the following:
"We will make a deal on everything."
"I think we are going to make a deal in soybeans."
Optimism of a deal has been the biggest reason for the recent rally in soybeans.

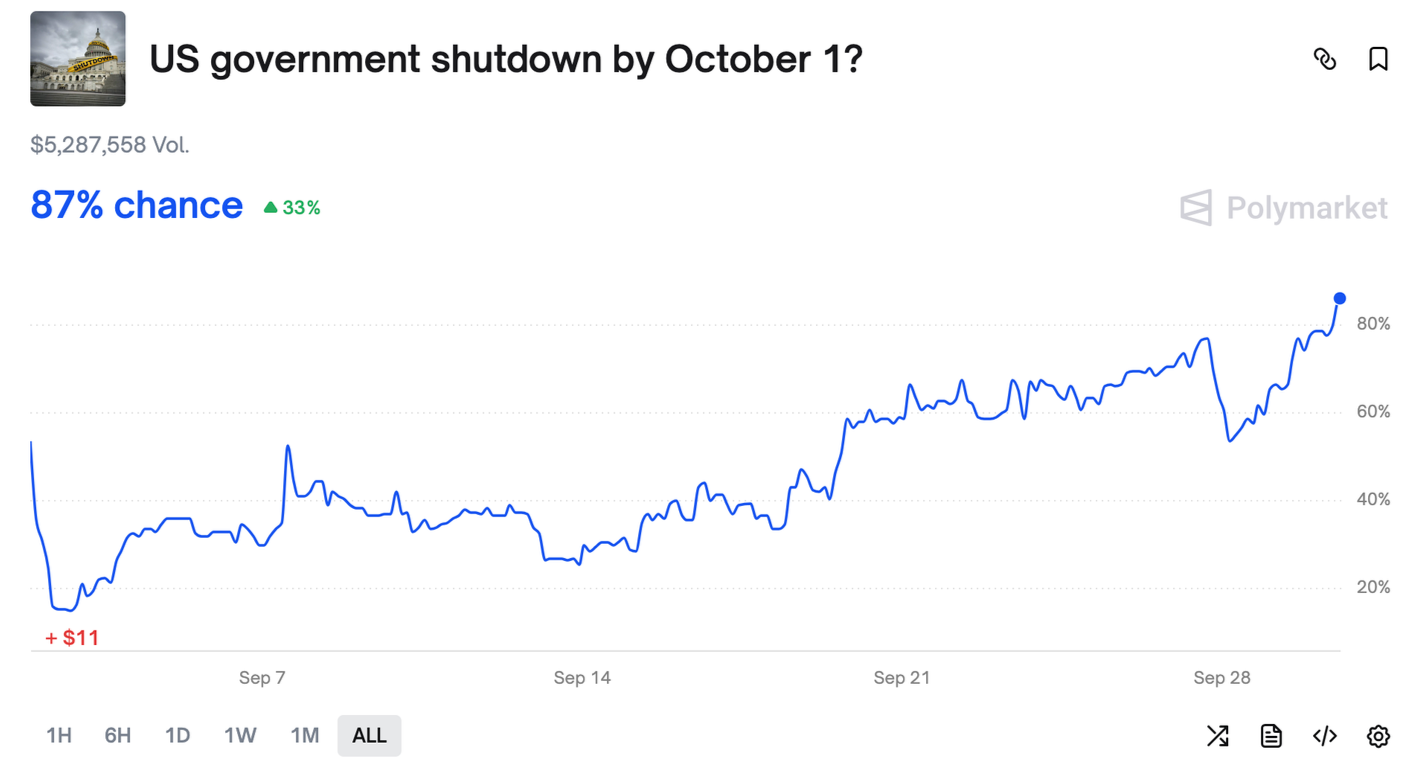
Gov Shut Down Odds
I've been including this in most of my recent updates, but the betting markets date for the government shut down continues to grow longer.
It is now estimated to last 44 days.
Which puts us well into the middle of November (Nov 14th).
As a reminder, the Nov USDA is suppose to be Nov 10th.

Rate Cuts
I've been talking about this for months and how this could be a potentially friendly factor for the grains.
There is currently an 80% chance we see 3 rate cuts this year.
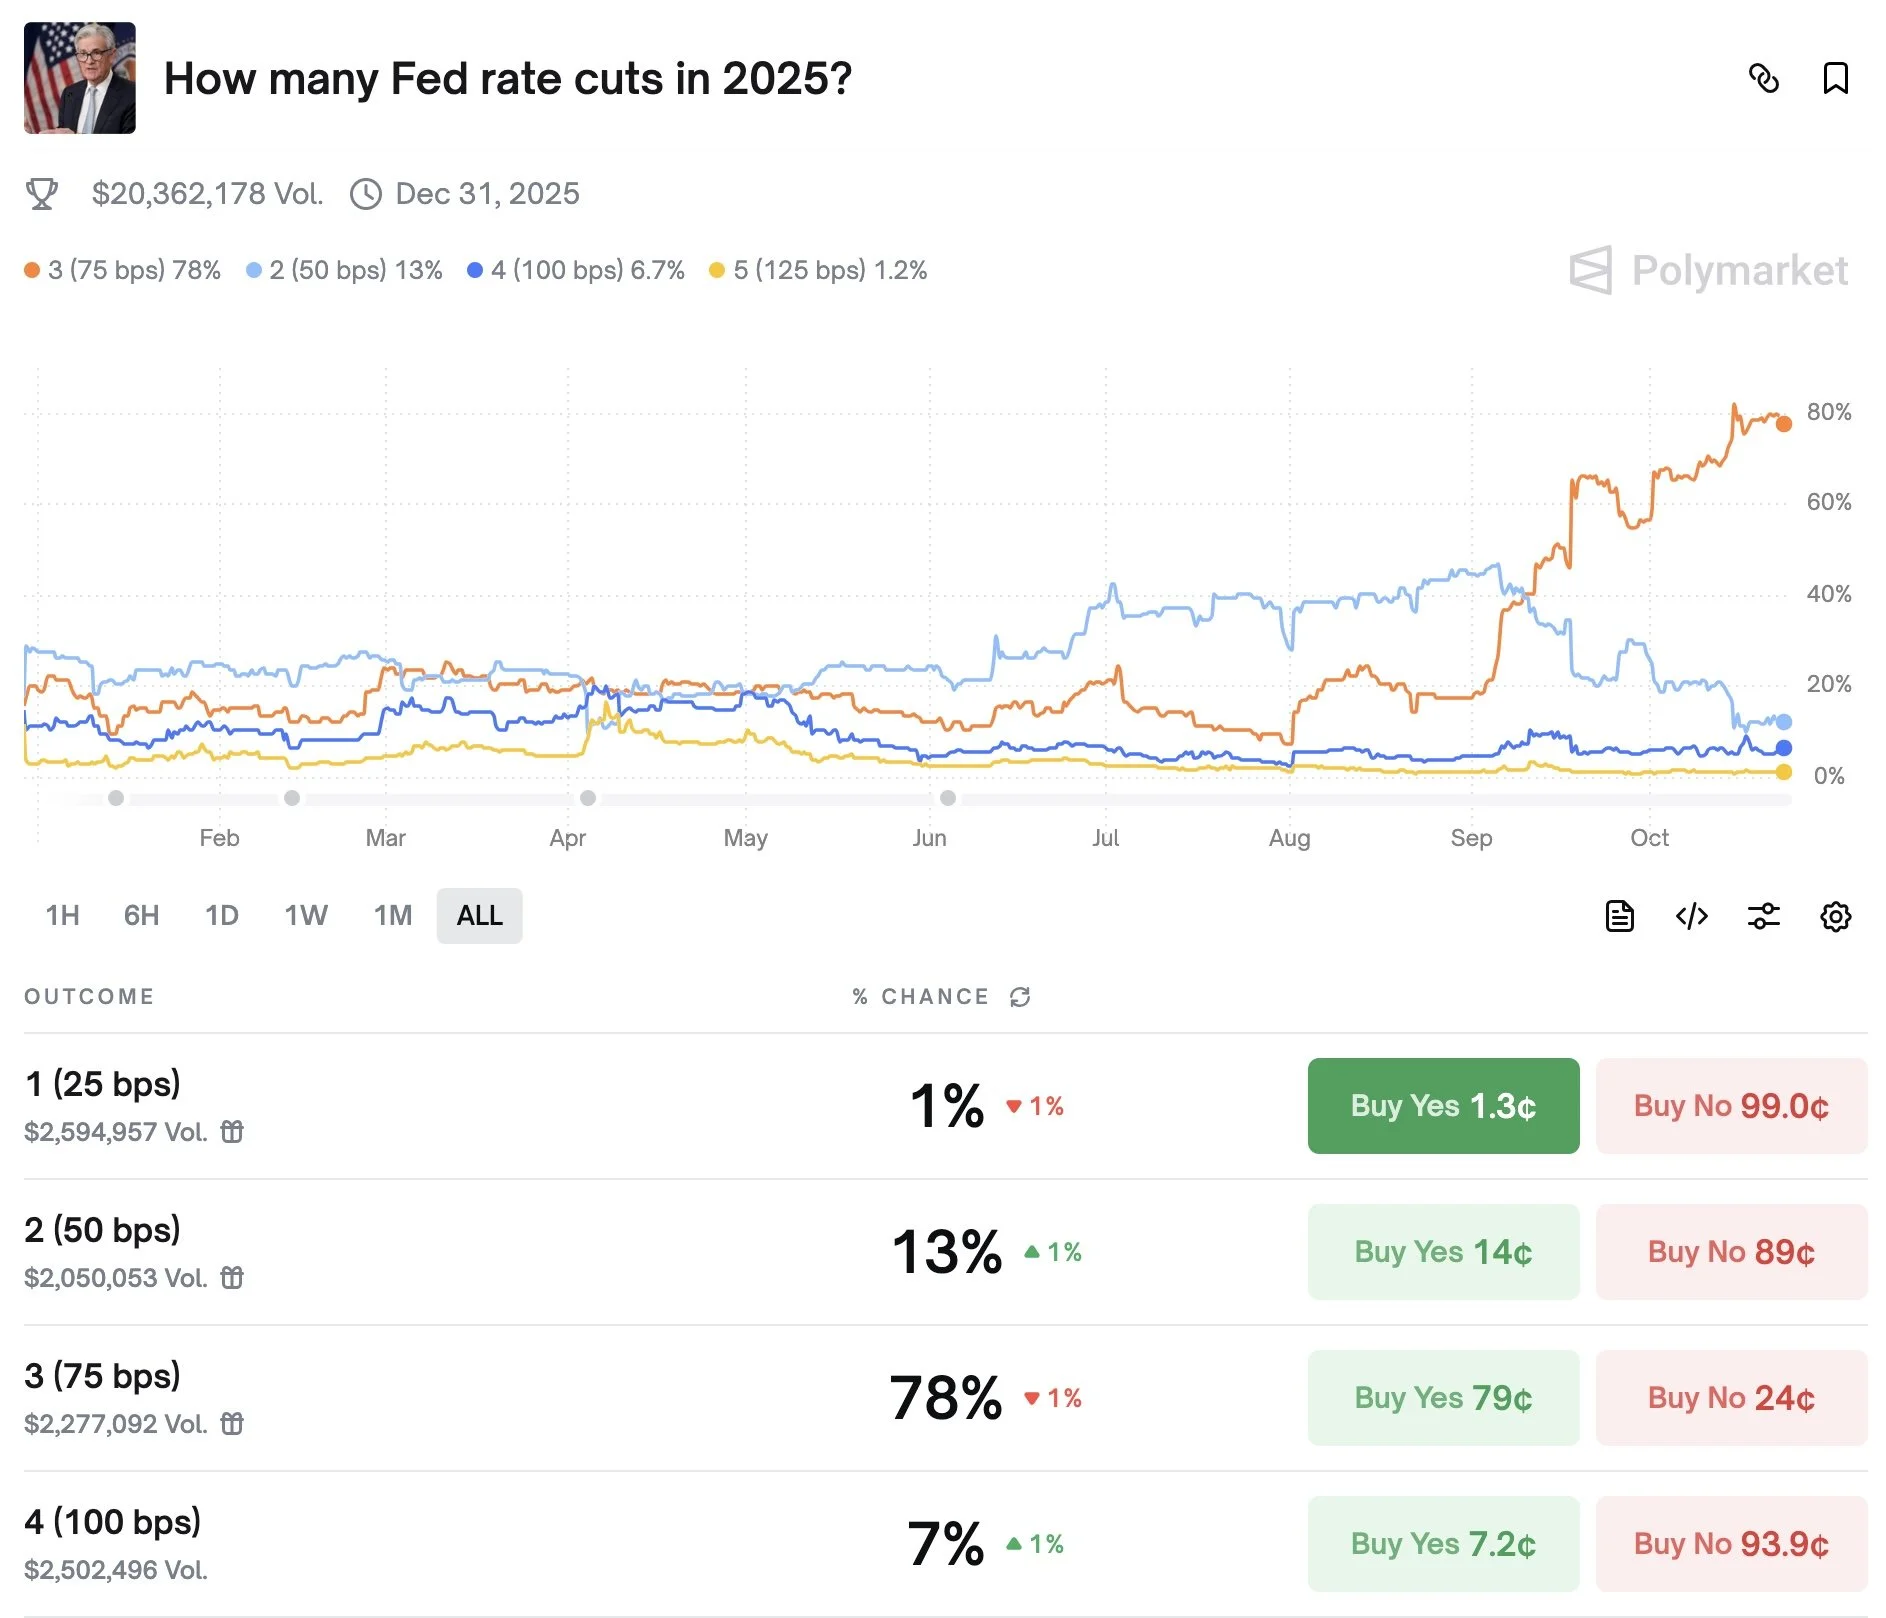
Rate cuts lead to higher inflation and often higher-priced commodities.
Rate hikes lead to lower inflation and often cheaper commodities.
I've shown this before, but here is a chart that shows corn and soybean prices along with the feds rate cuts & hikes as well as inflation.
Interestingly enough, corn & soybean prices tend to follow inflation higher or lower.
Our last rate hikes marked the top of the bull market in 2022.
Last fall, our first rate cuts since 2020 coincidentally happened right before corn's most sustained rally of the entire bear market.
It does not mean grains "have" to go higher. Maybe it’s simply a coincidence. But you can’t deny the resemblance.

Today's Main Takeaways
Corn
Fundamentals:
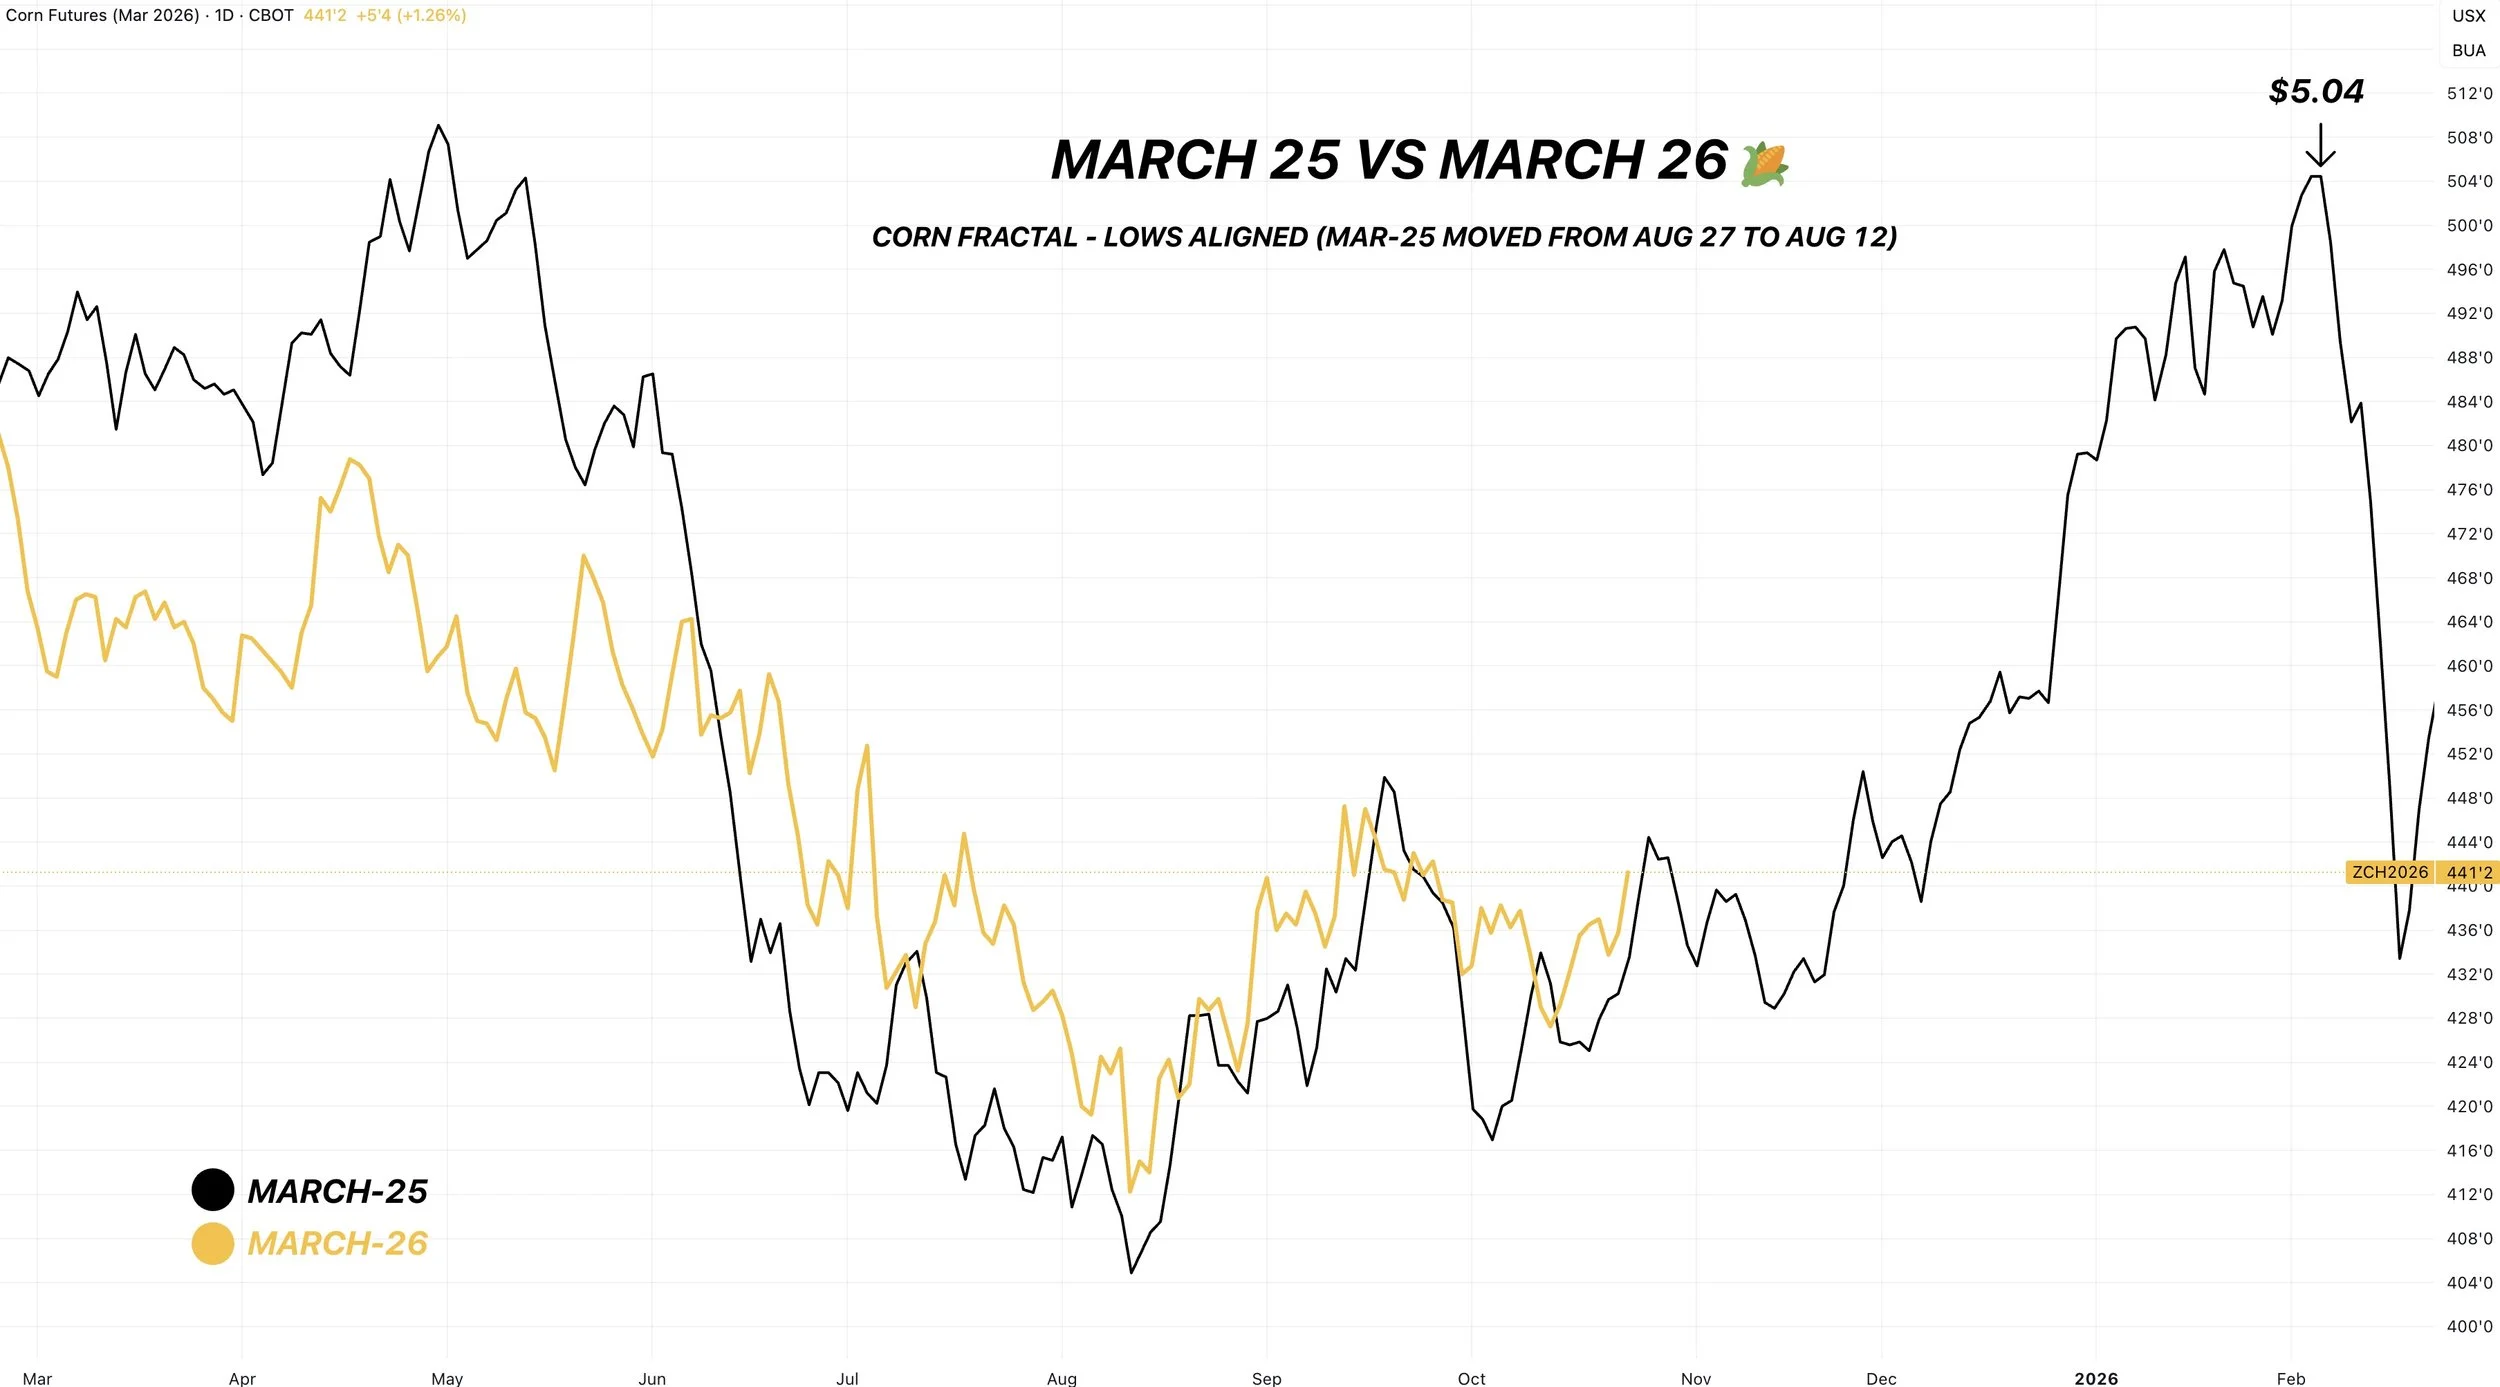
I showed this chart on Tuesday but wanted to include it again.
This is March-25 vs March-26 corn if you align our harvest lows.
So far, the two years have seen very similar price action.
Summer sell off.
August harvest low.
Rally off the harvest lows going into September.
Even the size of the rally off the harvest low was almost the exact same size.
Now seeing a correction and stabilization.
The years are not going to follow each other exactly.
But I could see us following a similar path.
Where we don’t get that real opportunity until late 2025 or early 2026.
China News:
There was a headline that said China is receiving too much moisture and that they may be facing a corn shortage due to this.
China is the world's 2nd largest corn producer.
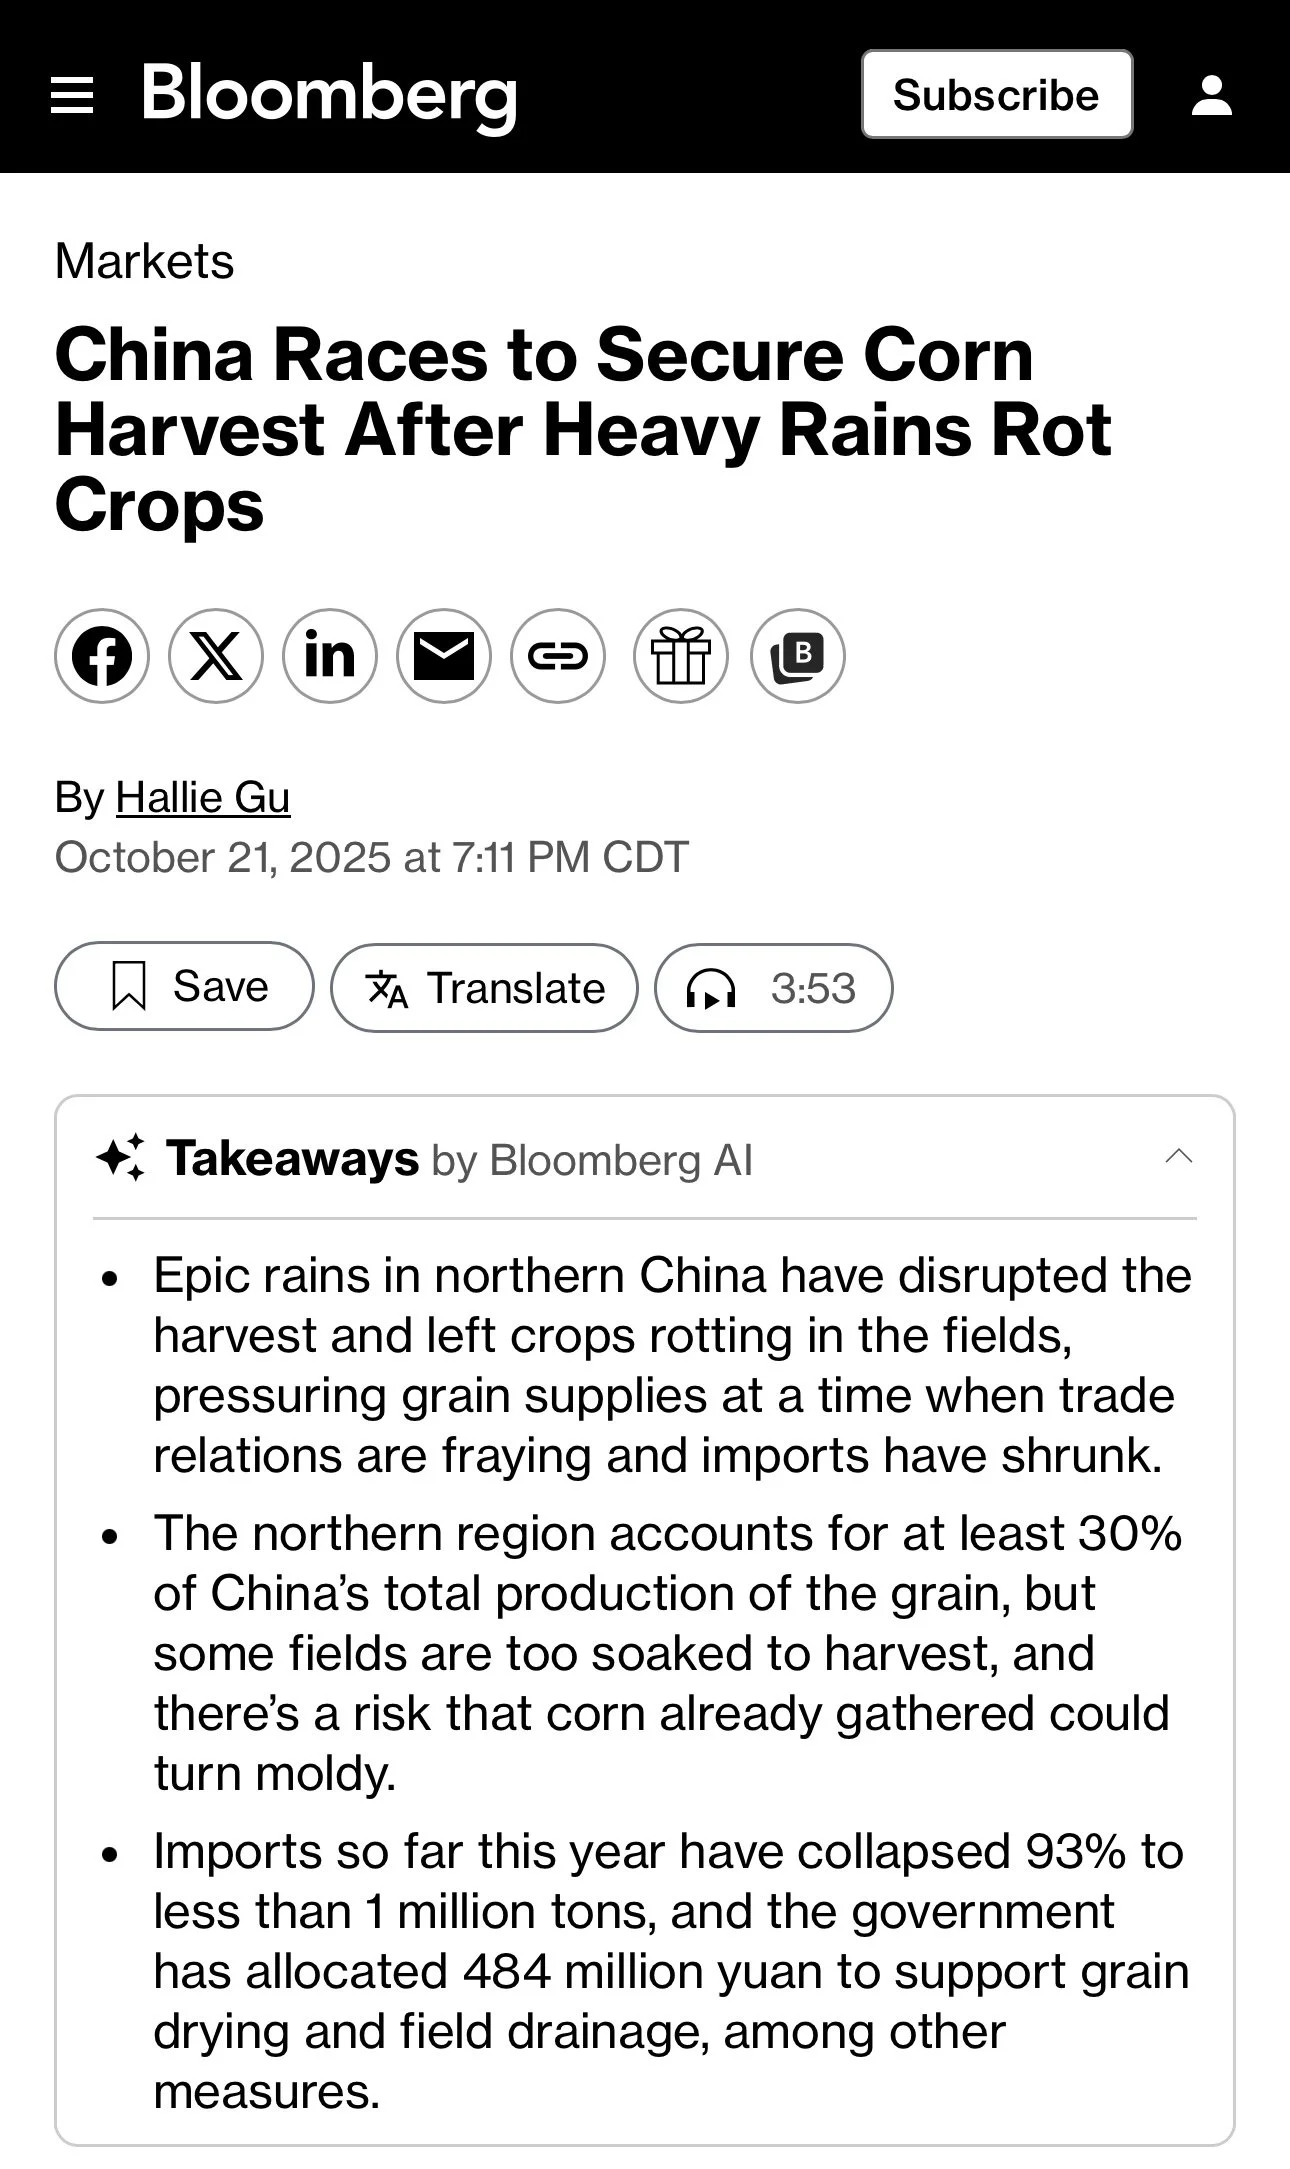
China has not bought any US corn in a very long time.
Their US corn imports have continued to shrink since the phase 1 trade agreement.

The last bull run in corn was largely due to the demand we saw from China buying US corn.
Even with zero business to China, corn demand is at a record.
Surpassing the demand we saw during the last bull run.
Who knows if China will actually buy US corn. They do have large corn stocks they can tap into, but nobody knows how accurate the data actually is.
However, you can only imagine how friendly it would be for this market if China did come in and buy US corn.
I'm obviously not getting my hopes up and betting the house on this happening.
But what if China has to buy US corn? Or what if we sign a trade deal where they agree to buy some corn? We already have record demand without them.
Chart from Karen Braun
Options vs DP
Many of you have asked about DP charges and what you should do.
Here is a good article that Jeremey and Lauren at Texas Hedge Risk put together:
Many farmers face a critical decision. Should they pay DP charges for stored corn, or explore a different strategy?
The answer is clear for most.
You're likely better off with selling corn and re-owning it will call options.
This approach can save you significant money while keeping your upisde potential.
Here is the math behind it:
Assume you are paying 5 cents per month in DP charges. Plus 8% interest on a line of credit.
At $4.50 corn, interest costs run you 3 cents a month.
For a total of 8 cents every month when you combine the DP and interest.
By February 20th, holding corn on DP would cost you 32 cents in total.
Here is an alternative:
March futures are trading at $4.37
The March $4.35 call options cost only 15 cents.
This presents a compelling opportunity.
You could sell your physical corn, buy one call option to protect your upside, and still come out ahead.
Even better.. you could buy two call options for 30 cents.
This 30 cents for the options would still be less than your total carrying costs.
While leaving you with exposure to the upside if we were to rally.
Here is a visual of the strategies and their minimum prices etc.
Now let's compare the outcomes based on various price scenarios.
In this scenario we used $4.00 to $5.65 corn, assuming you must sell by February 20th when the options expire.
This visual comparion reveals a striking difference in outcomes depending on where the market goes.
Here is a table of the outcomes.
The DP strategy simply delivers the futures price minus 32 cents in total carrying costs.
The one call option strategy provides a floor of $4.22 by ($4.37 futures price minus 15 cents for call option). While keeping your upside open.
The double call strategy provides a floor of $4.07 ($4.37 futures price minus 30 cents for both call options). While keeping your upside open by twice as much.
For example, if corn were to rally to $5.05 like we did last year. You would receive $5.47. Which is a full 74 cents above the DP outcome.
So should you pay DP charges?
Probably not in this current environment.
However, this analysis does NOT account for basis appreciation or extreme market moves in either direction.
Remember, you can always make marketing decisions and defer payment until January 1st. The right pricing decision and the right cash flow decision don’t have to align.
The bottom line: If your elevator will improve basis even on DP corn, you might justify paying DP. But right now, options are simply too cheap and DP charges are too expensive to ignore this strategy.
Give us a call or a text if you want to talk through this or have any questions at all.
(605) 295-3100
Technicals:
I really like what I am seeing out of corn.
We finally broke that $4.23 level we had been talking about.
$4.23 clawed back 61.8% of the Sep highs.
That is where most relief bounces fail.
Since we are above that level, it tells us this is no longer seen as just a small bounce. It could very well be the start of something bigger.
More often than not.. it is a sign we are in for some more upside.
Our first target is still $4.35.
That gives back 50% of the Feb highs. It is also old key support from spring, now viewed as resistance.
That is a good spot to start to de-risk.
Soybeans
Fundamentals:
Today it was confirmed that Trump and China are scheduled to meet in exactly a week.
48 hours before those 100% tariffs on China are set to go into effect.
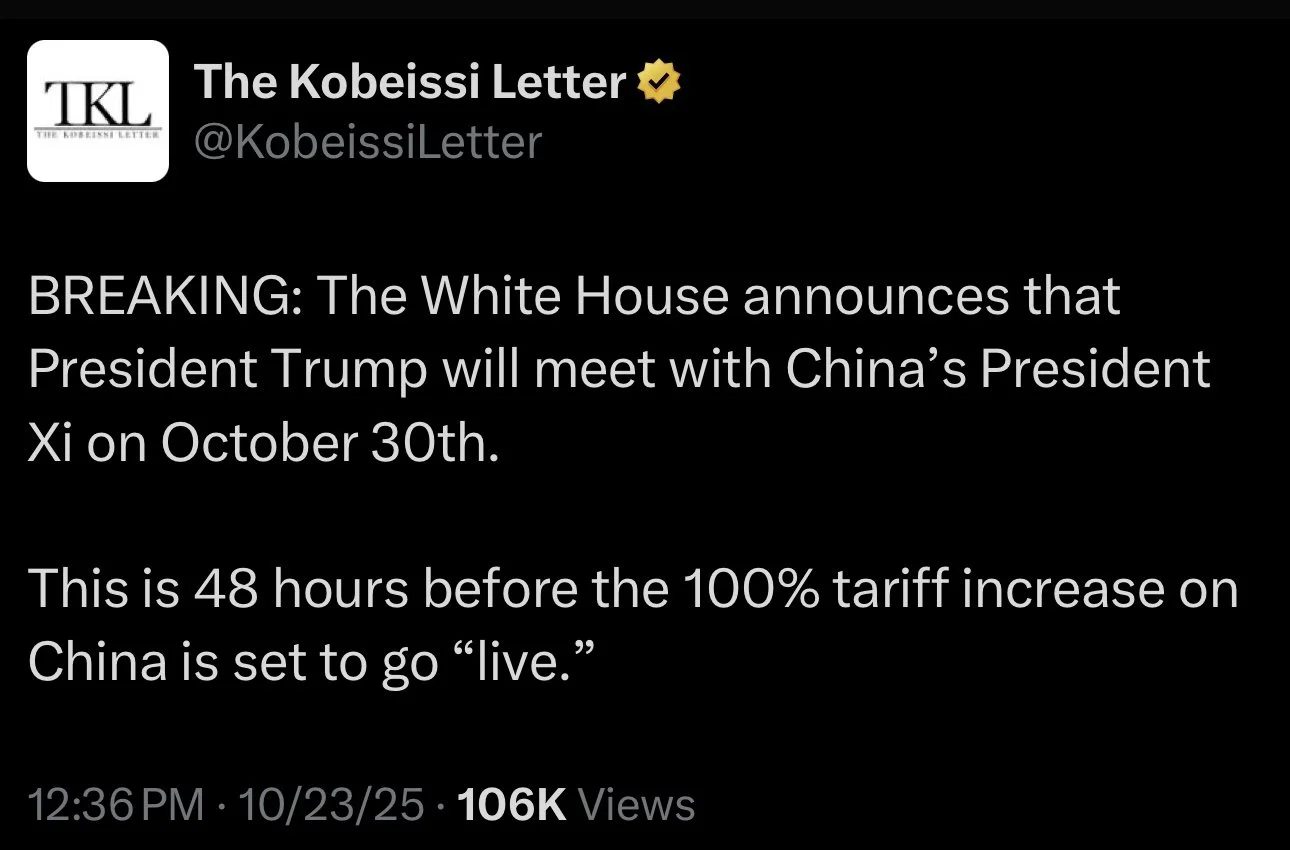
Where this market decides to go will likely stem from what happens between them.
This market continues to trade headlines.
If we strike a deal, there is incredible upside.
If the meeting is a flop, we probably sell off.
One negative headline could very easily kill this rally.
On the other hand, if we do end up making a deal with China and they come in and buy our soybeans.. this market has some insane upside potential.
I have no idea where soybean exports will end at. Rumors are that China is still going to need around 300 million bu of soybeans to meet their needs until Brazil's crop comes online.
Last year China bought 800 million bu from us. So if we secured that 300 million bu worth of demand, we would still be -500 million bu short of last year. But other countries have been stepping up to offset those losses.
If demand is fine, or if China actually buys soybeans. The supply side of the balance sheet is still razor thin.
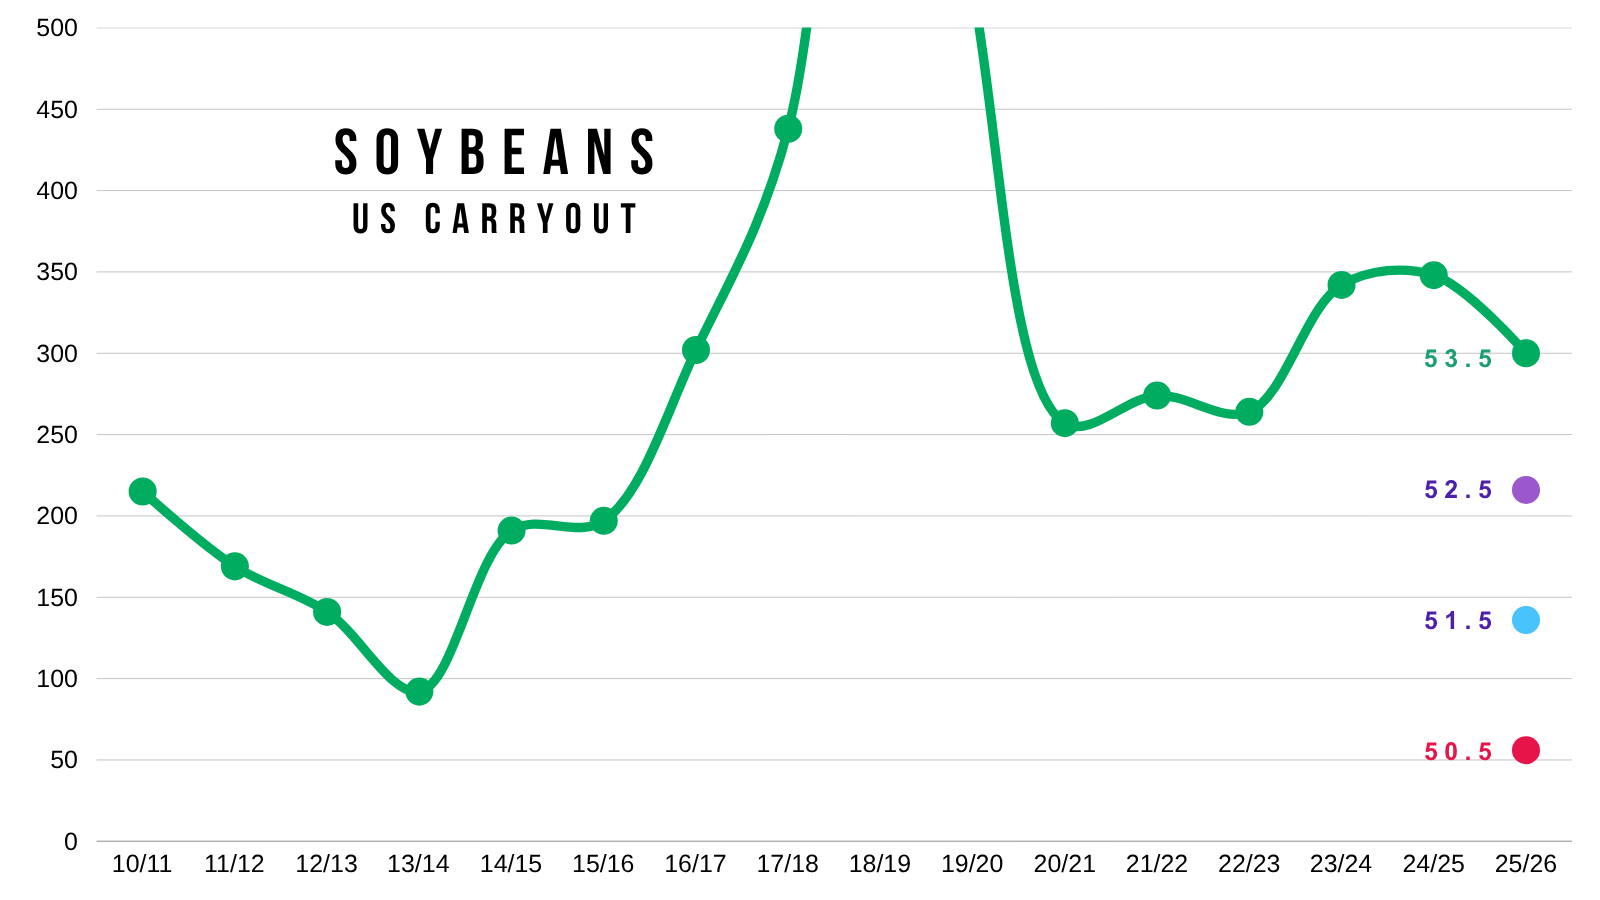
The chart below is where would carryout would come in at based on different yield numbers while using the current demand numbers the USDA has.
As always, if supply drops, the USDA will lower demand and offset some of the supply loss. So the chart isn’t fully accurate. But you get the idea. No room for error on yield.
That is why this market has potential. What if yield isn’t there? What if China buys soybeans?
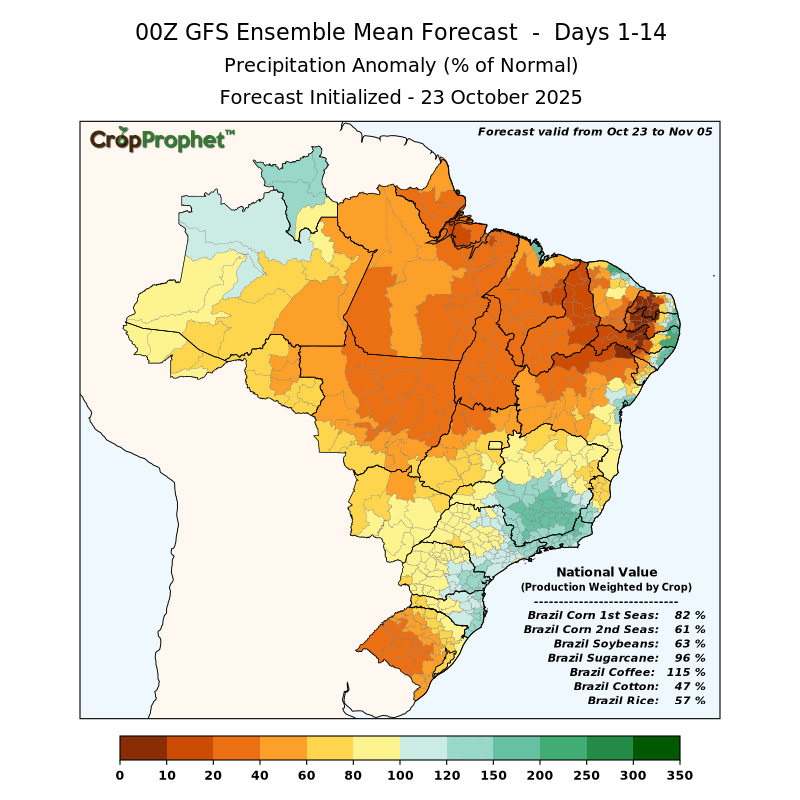
Currently, China is placing a pretty big bet on Brazil weather.
If Brazil has any production issues at all, China will almost be forced to come to the US.
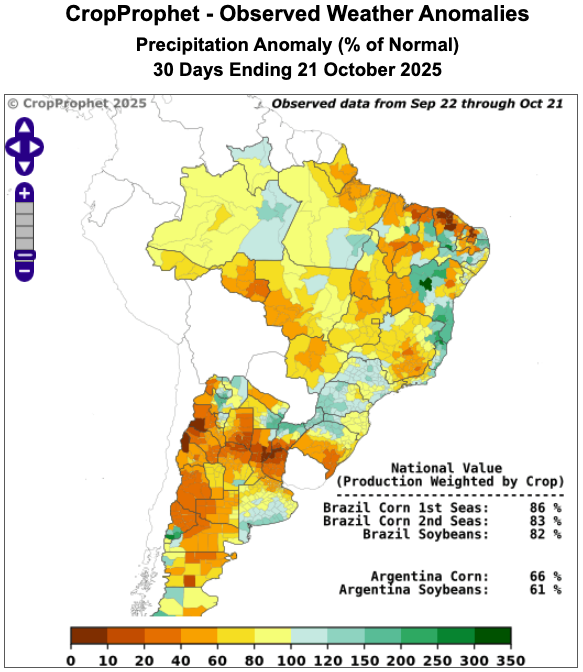
It is still too early to be calling for some drastic drought or production problem in Brazil, but the last 30 days have been pretty dry.
Here are maps from Crop Prophet that show Brazil's rainfall based on the percentage of normal.
Last 30 Days: 82% of normal
Last 14 Days: 63% of normal
Technicals:
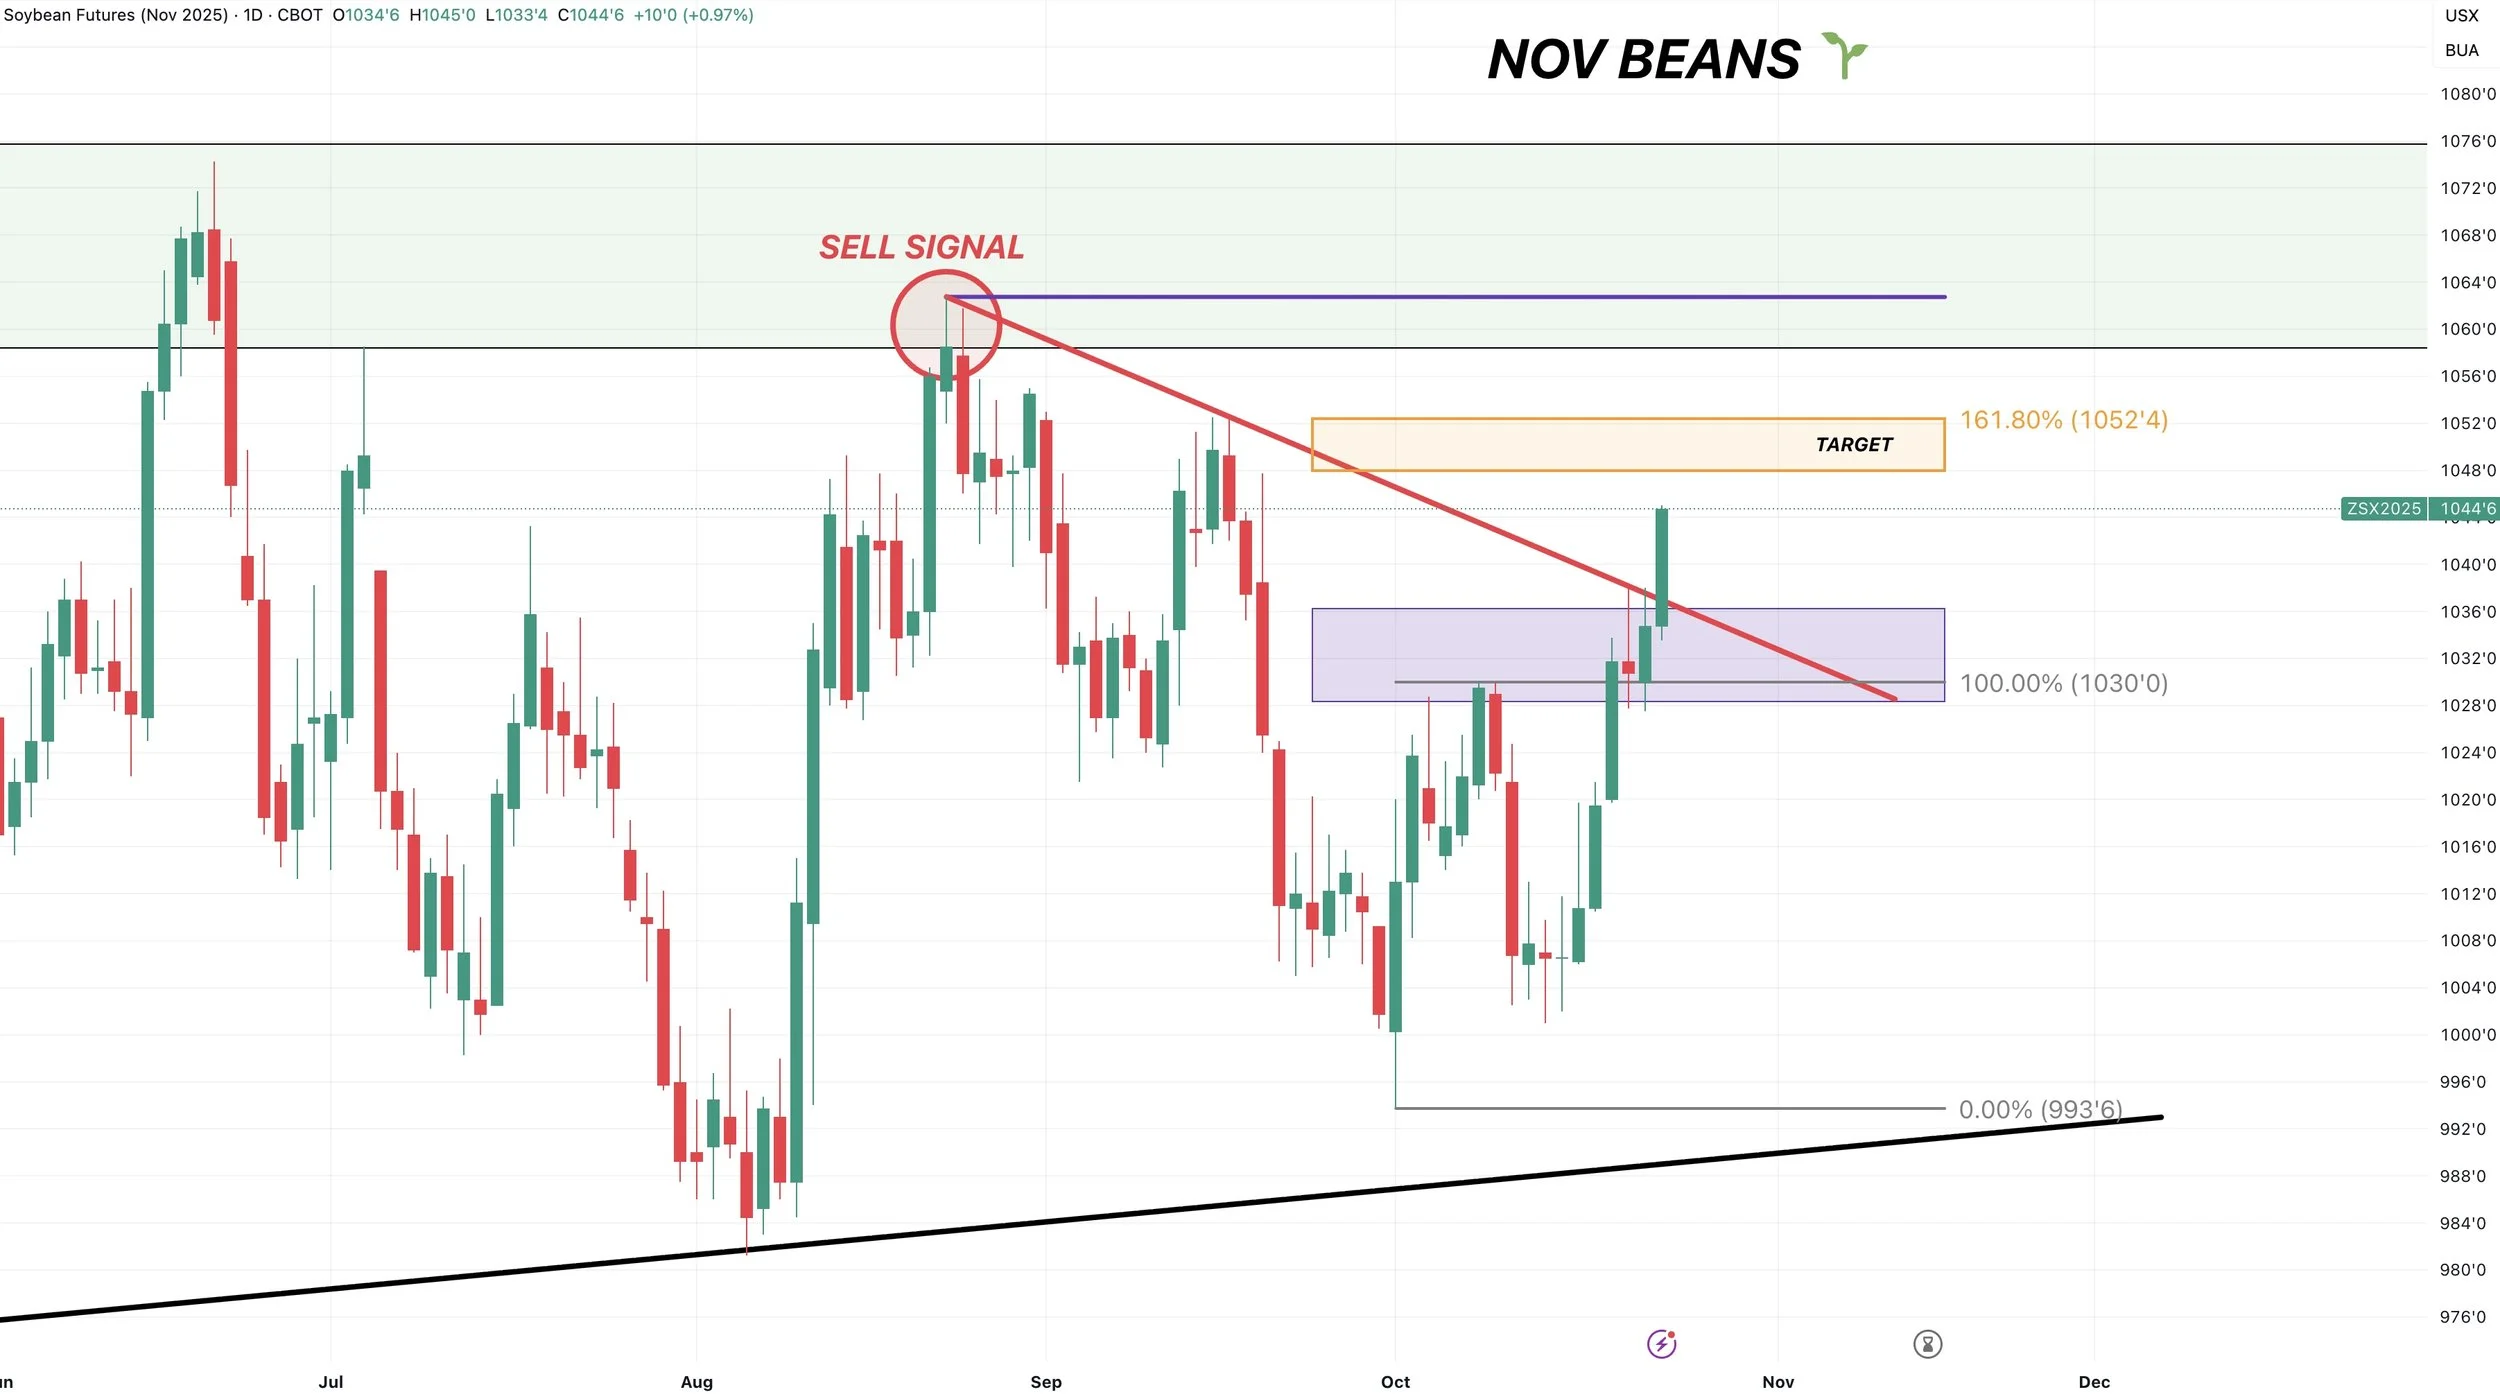
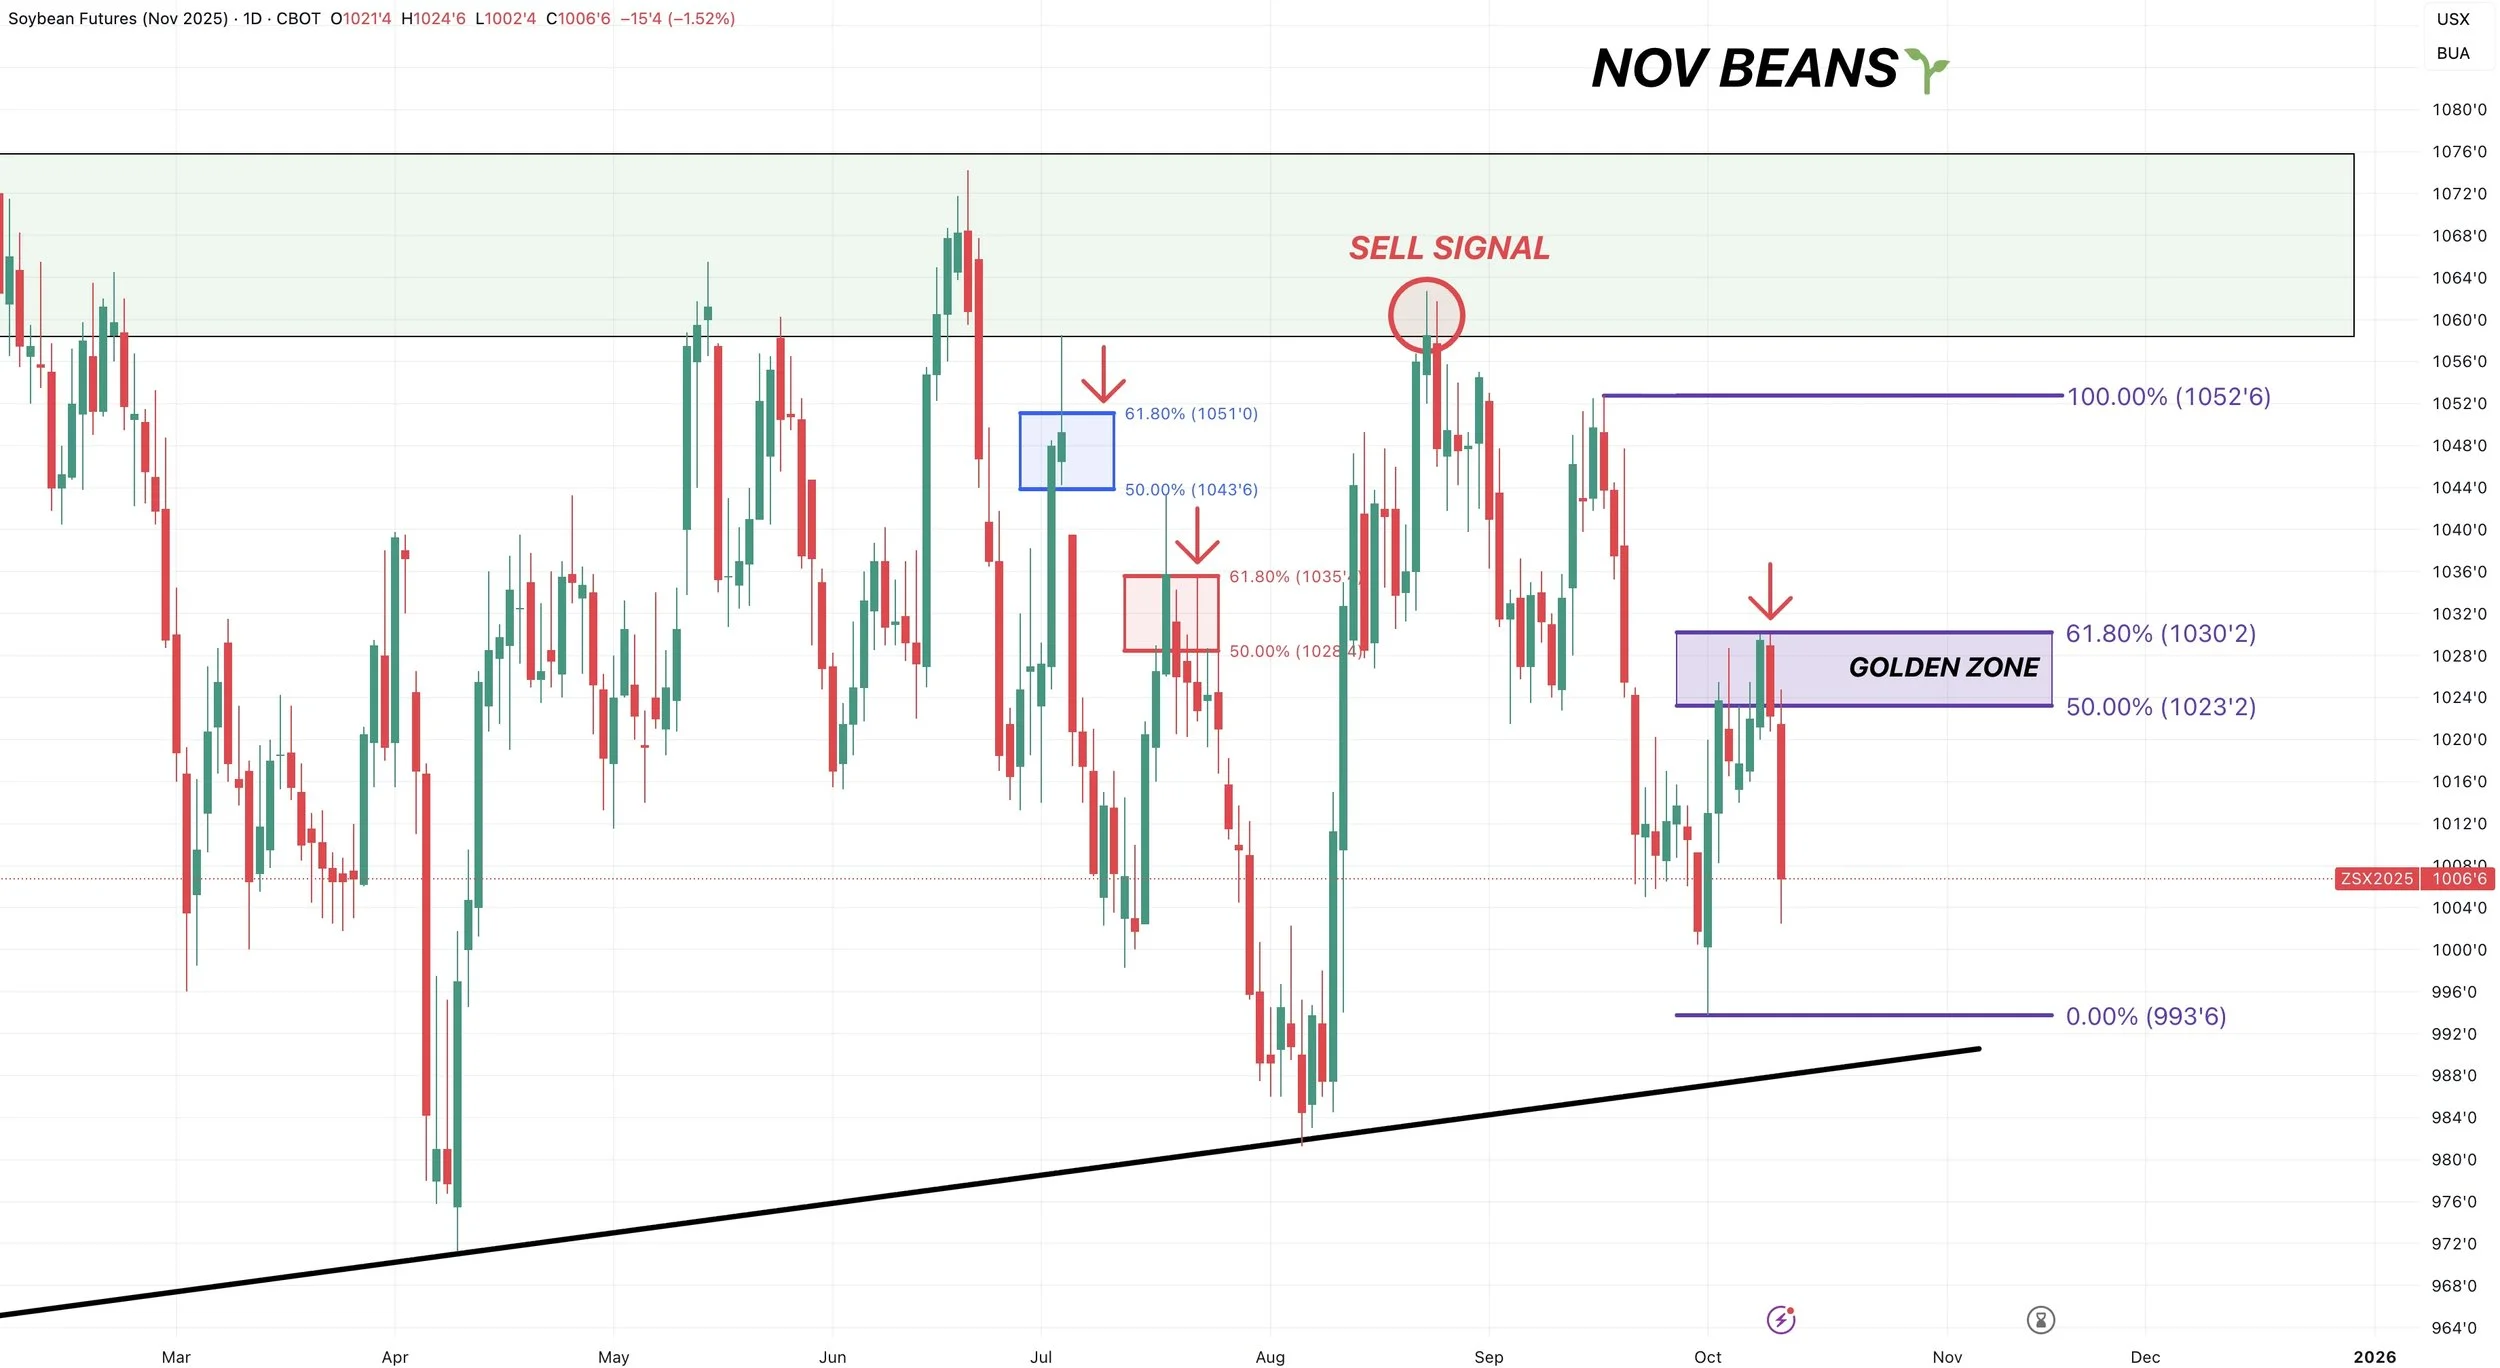
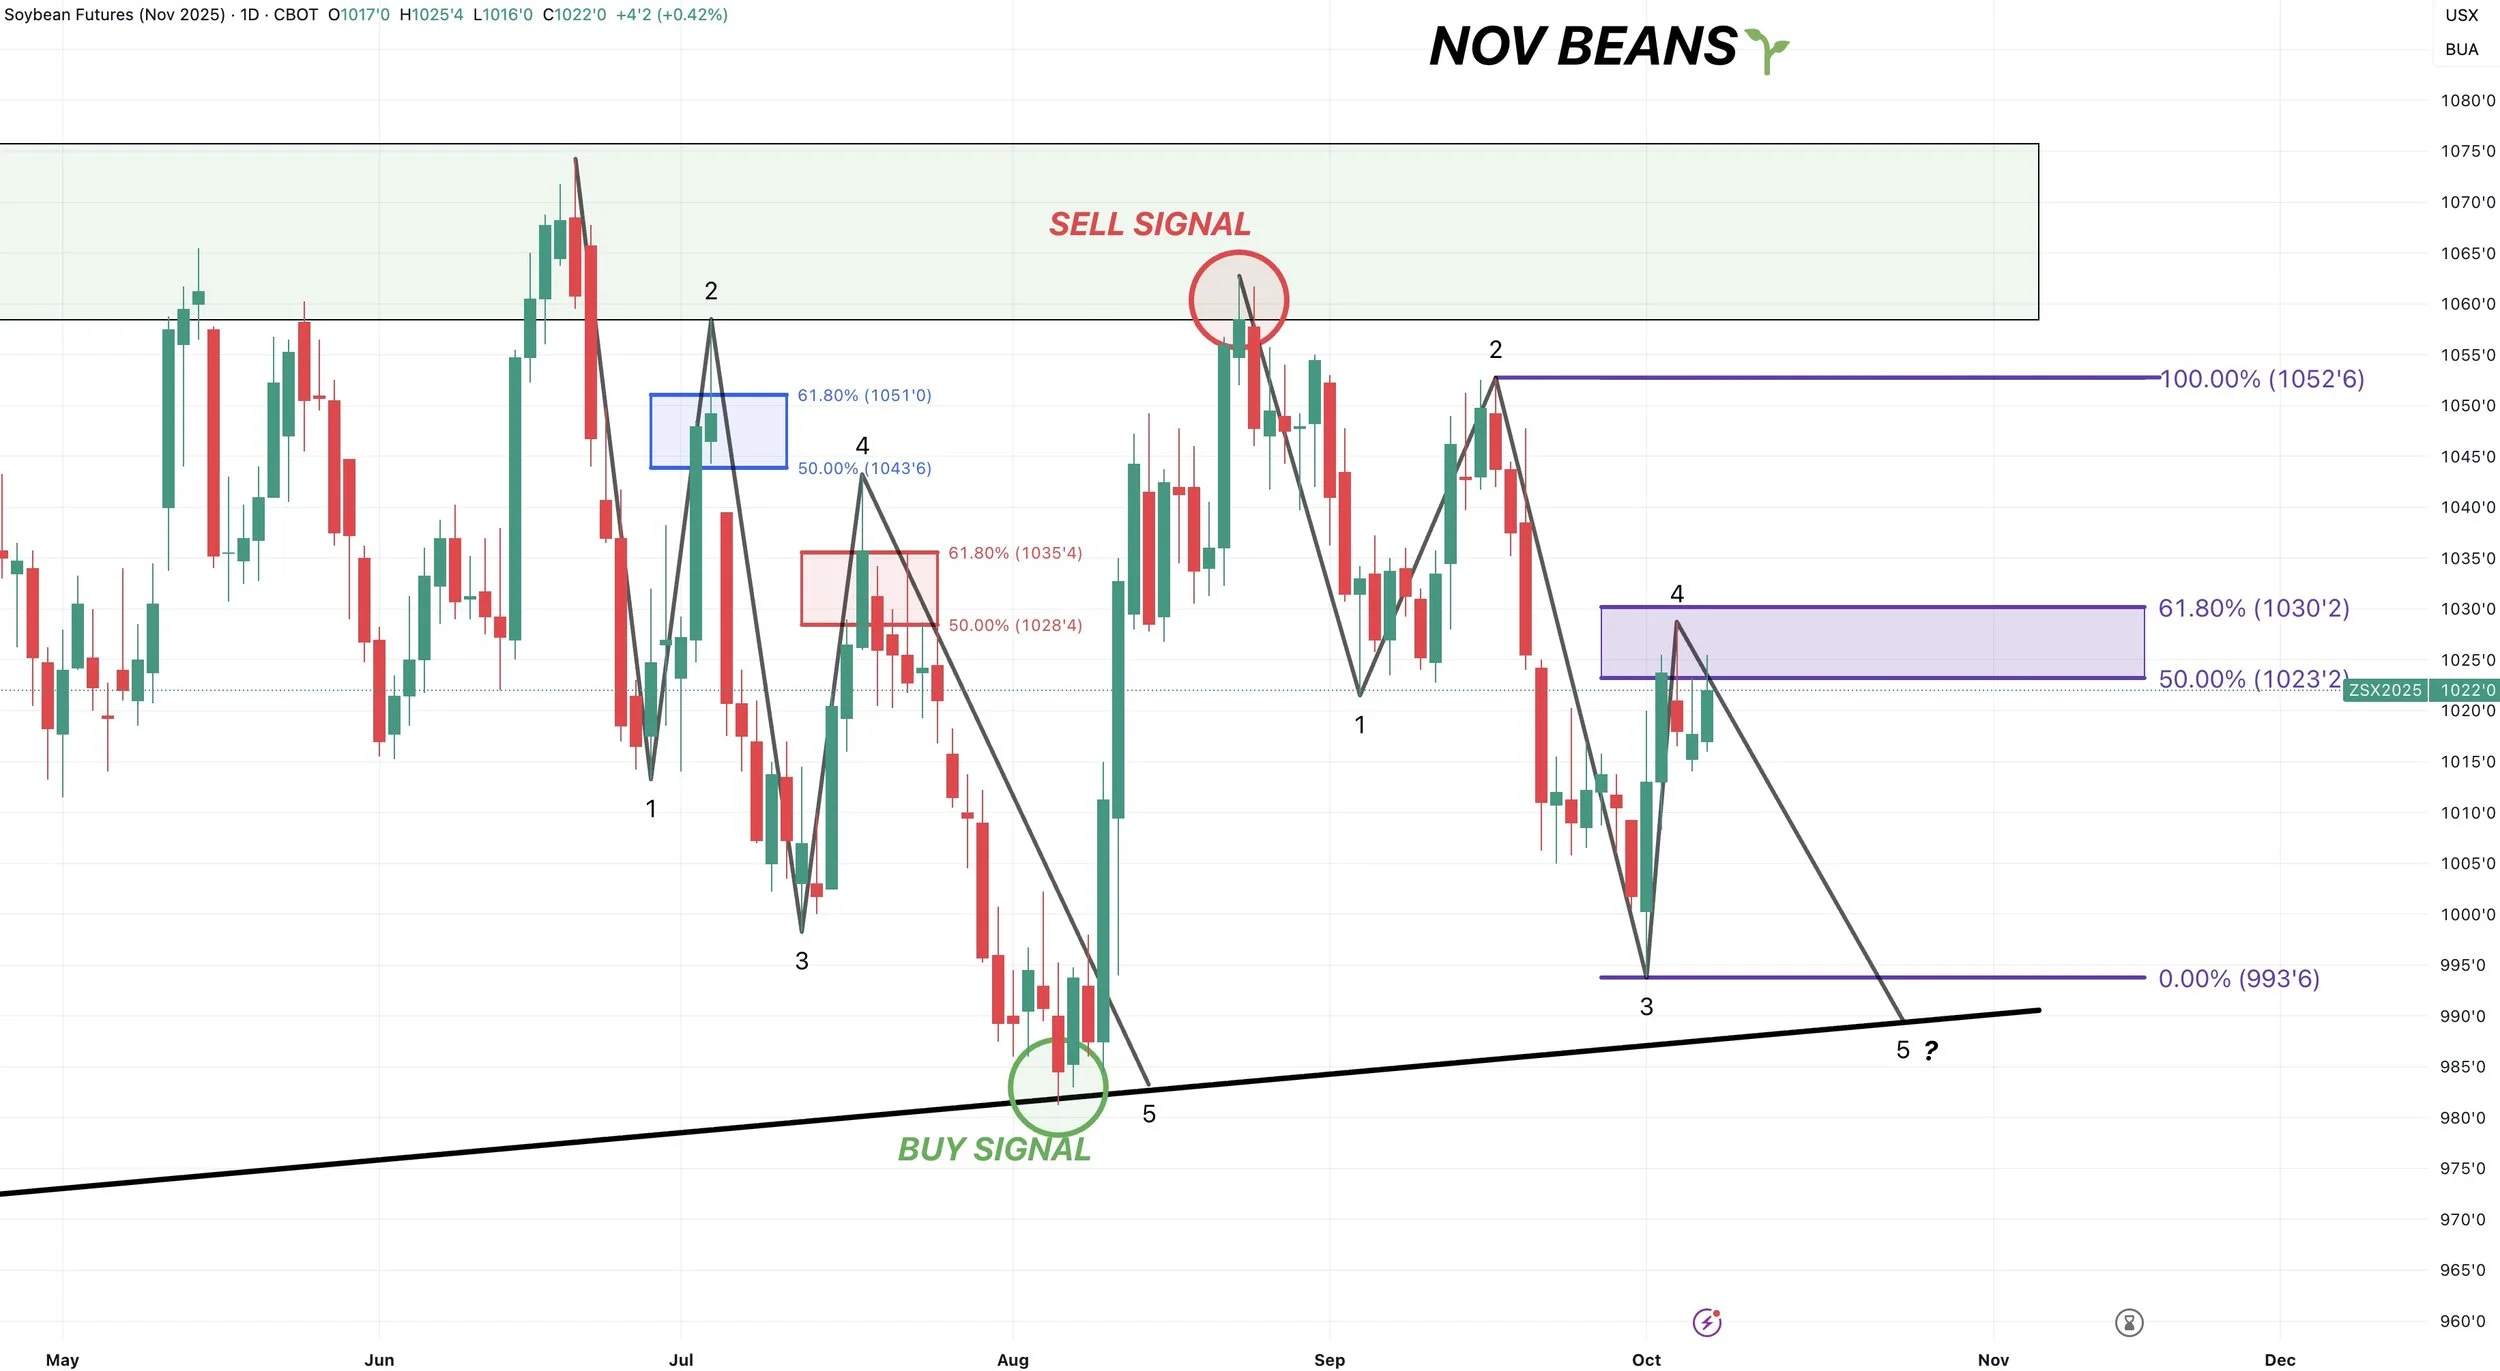
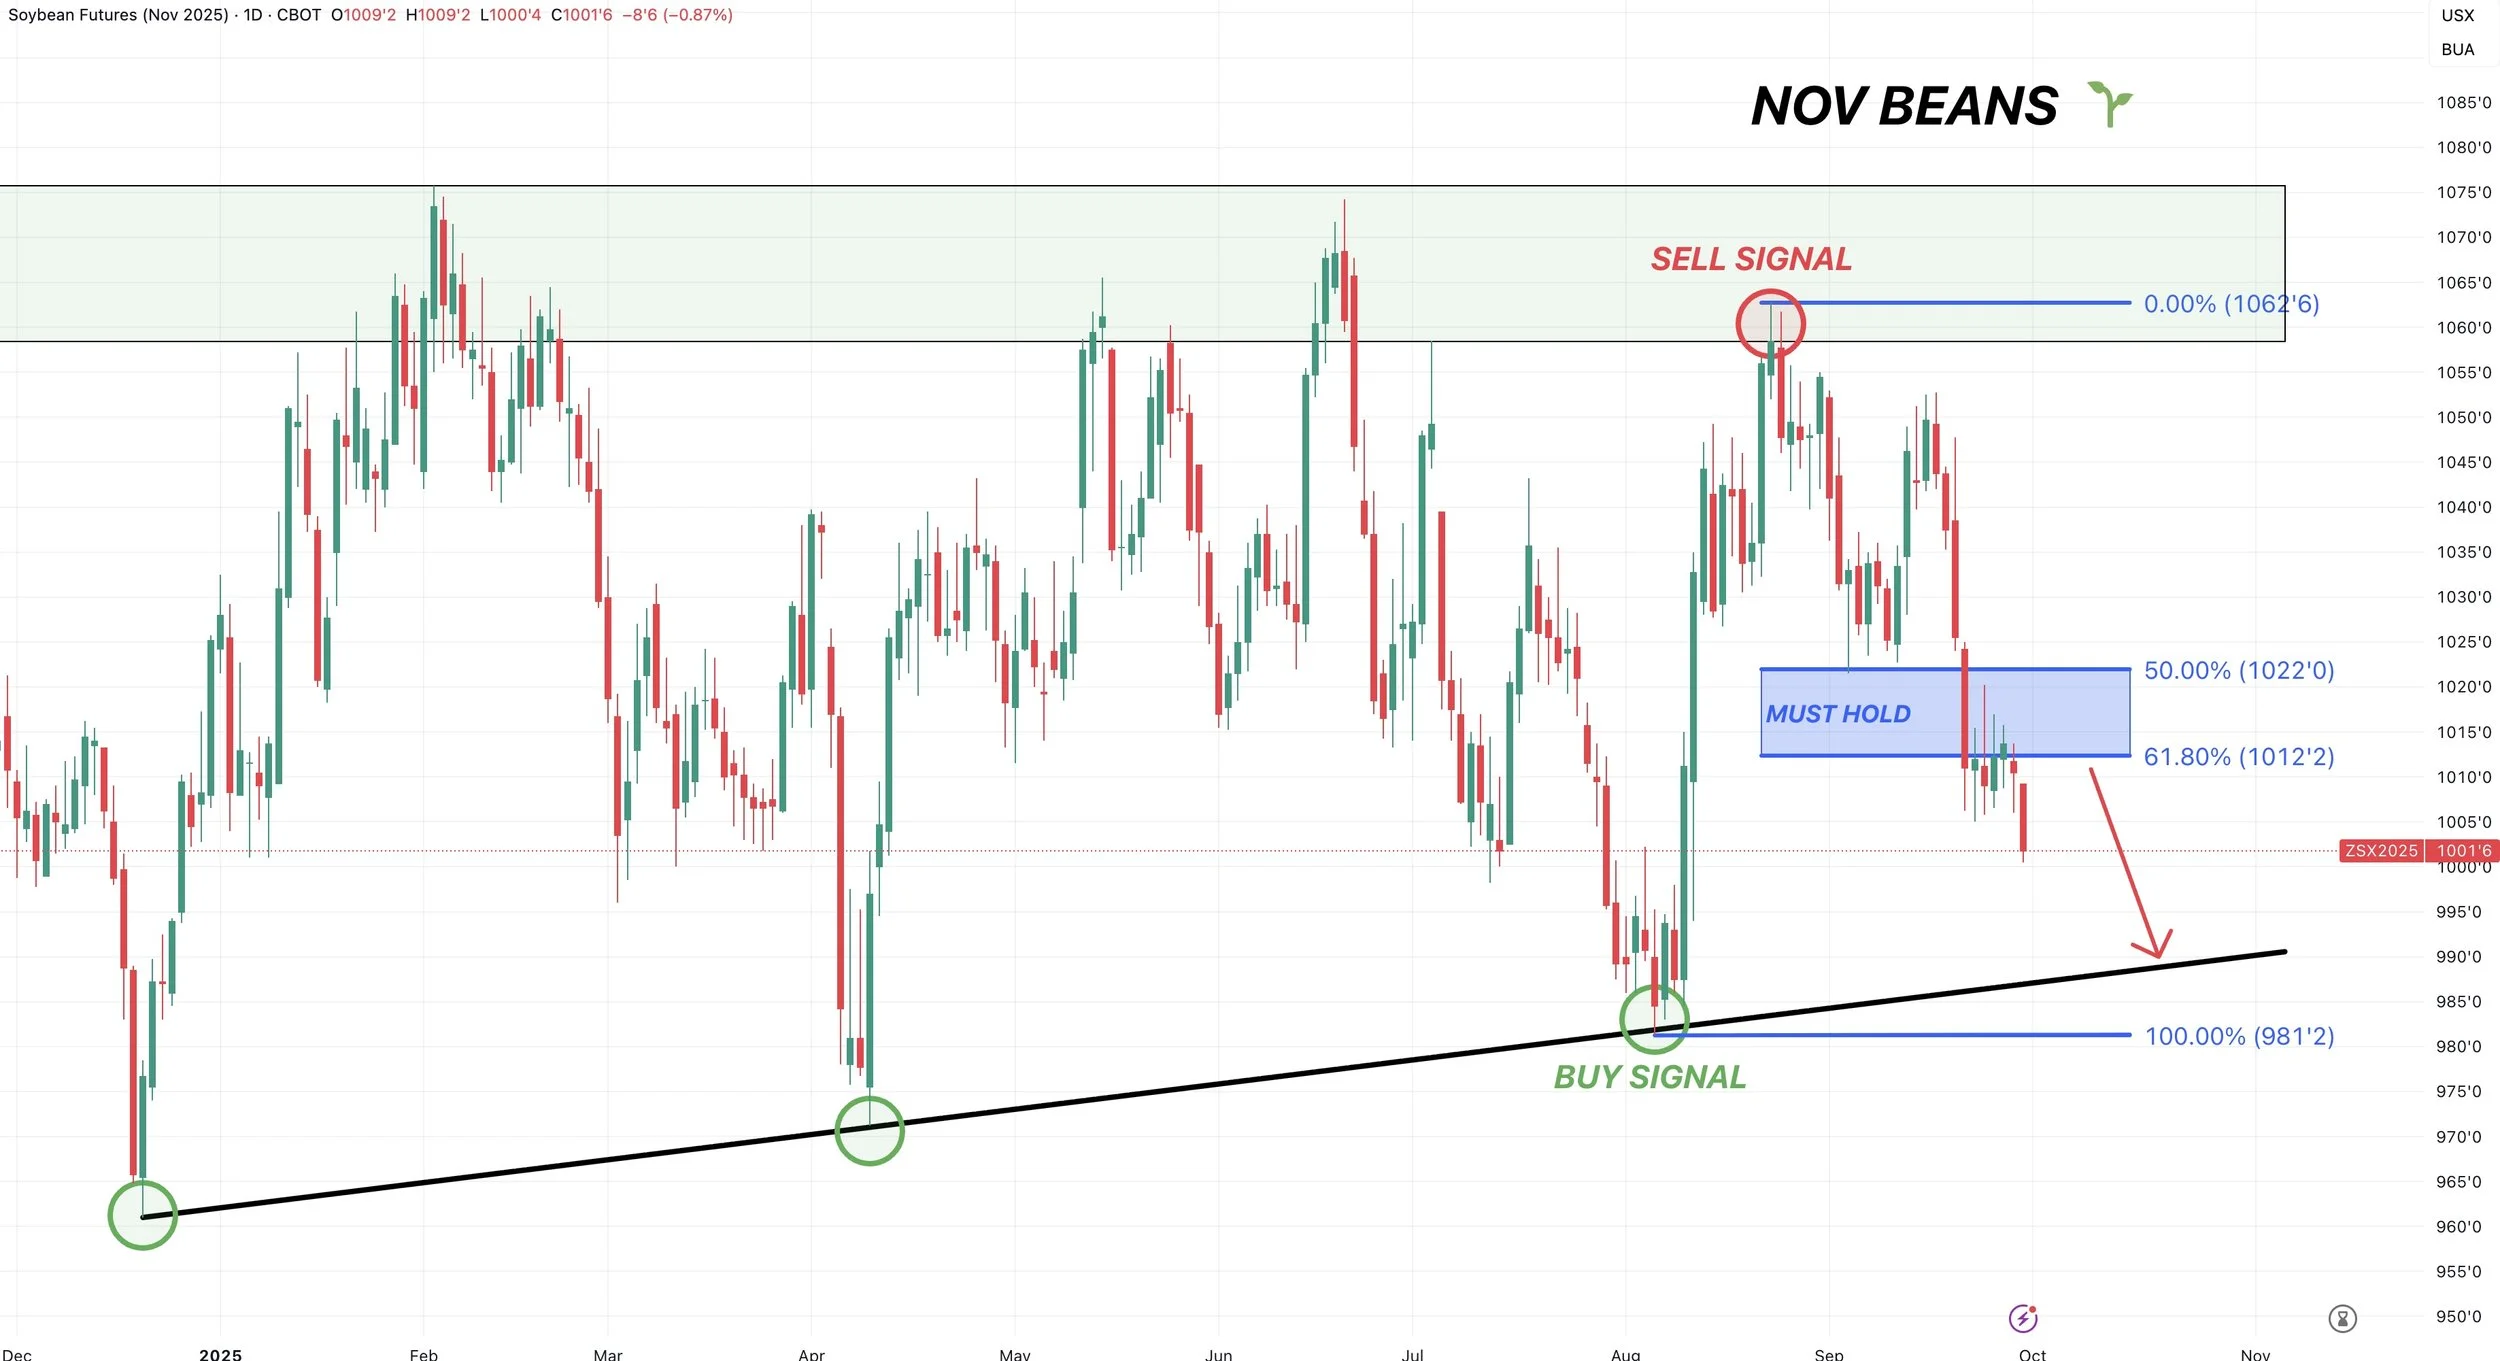
Nov Beans
Great price action in soybeans.
We broke above $10.37 which was the 61.8% retracement up to those August highs.
Like in corn, when you break above this level, it oftens tells us that this is no longer a relief bounce and indicates there is more upside from here.
Not everytime.. but most of the time.
We also busted above downtrend resistance that marked the August and September highs.
We are now approaching my first target since our sell signal on August 22nd at $10.60
Next Target: $10.48 to $10.52
Why here?
$10.48 is the 78.6% retracement up to the August highs. It is the next fib level after the 61.8% one.
$10.52 is the golden fib (161.8%) of the first rally we saw off the lows. A common spot for a rally to pause.
In my next chart a give a better visual as to how the golden fib is calculated.

Here is how the golden fib target is calculated.
You simply take that first rally we saw, and $10.52 equals 161.8% of that the size of that first rally.
Which is marked with the gray lines.
Jan Beans
Jan beans have almost an idential set up to Nov beans.
We shattered that 61.8% level and downtrend resistance.
That first target is $10.66 to $10.67.
Which is the 78.6% level and the golden fib from the first rally.

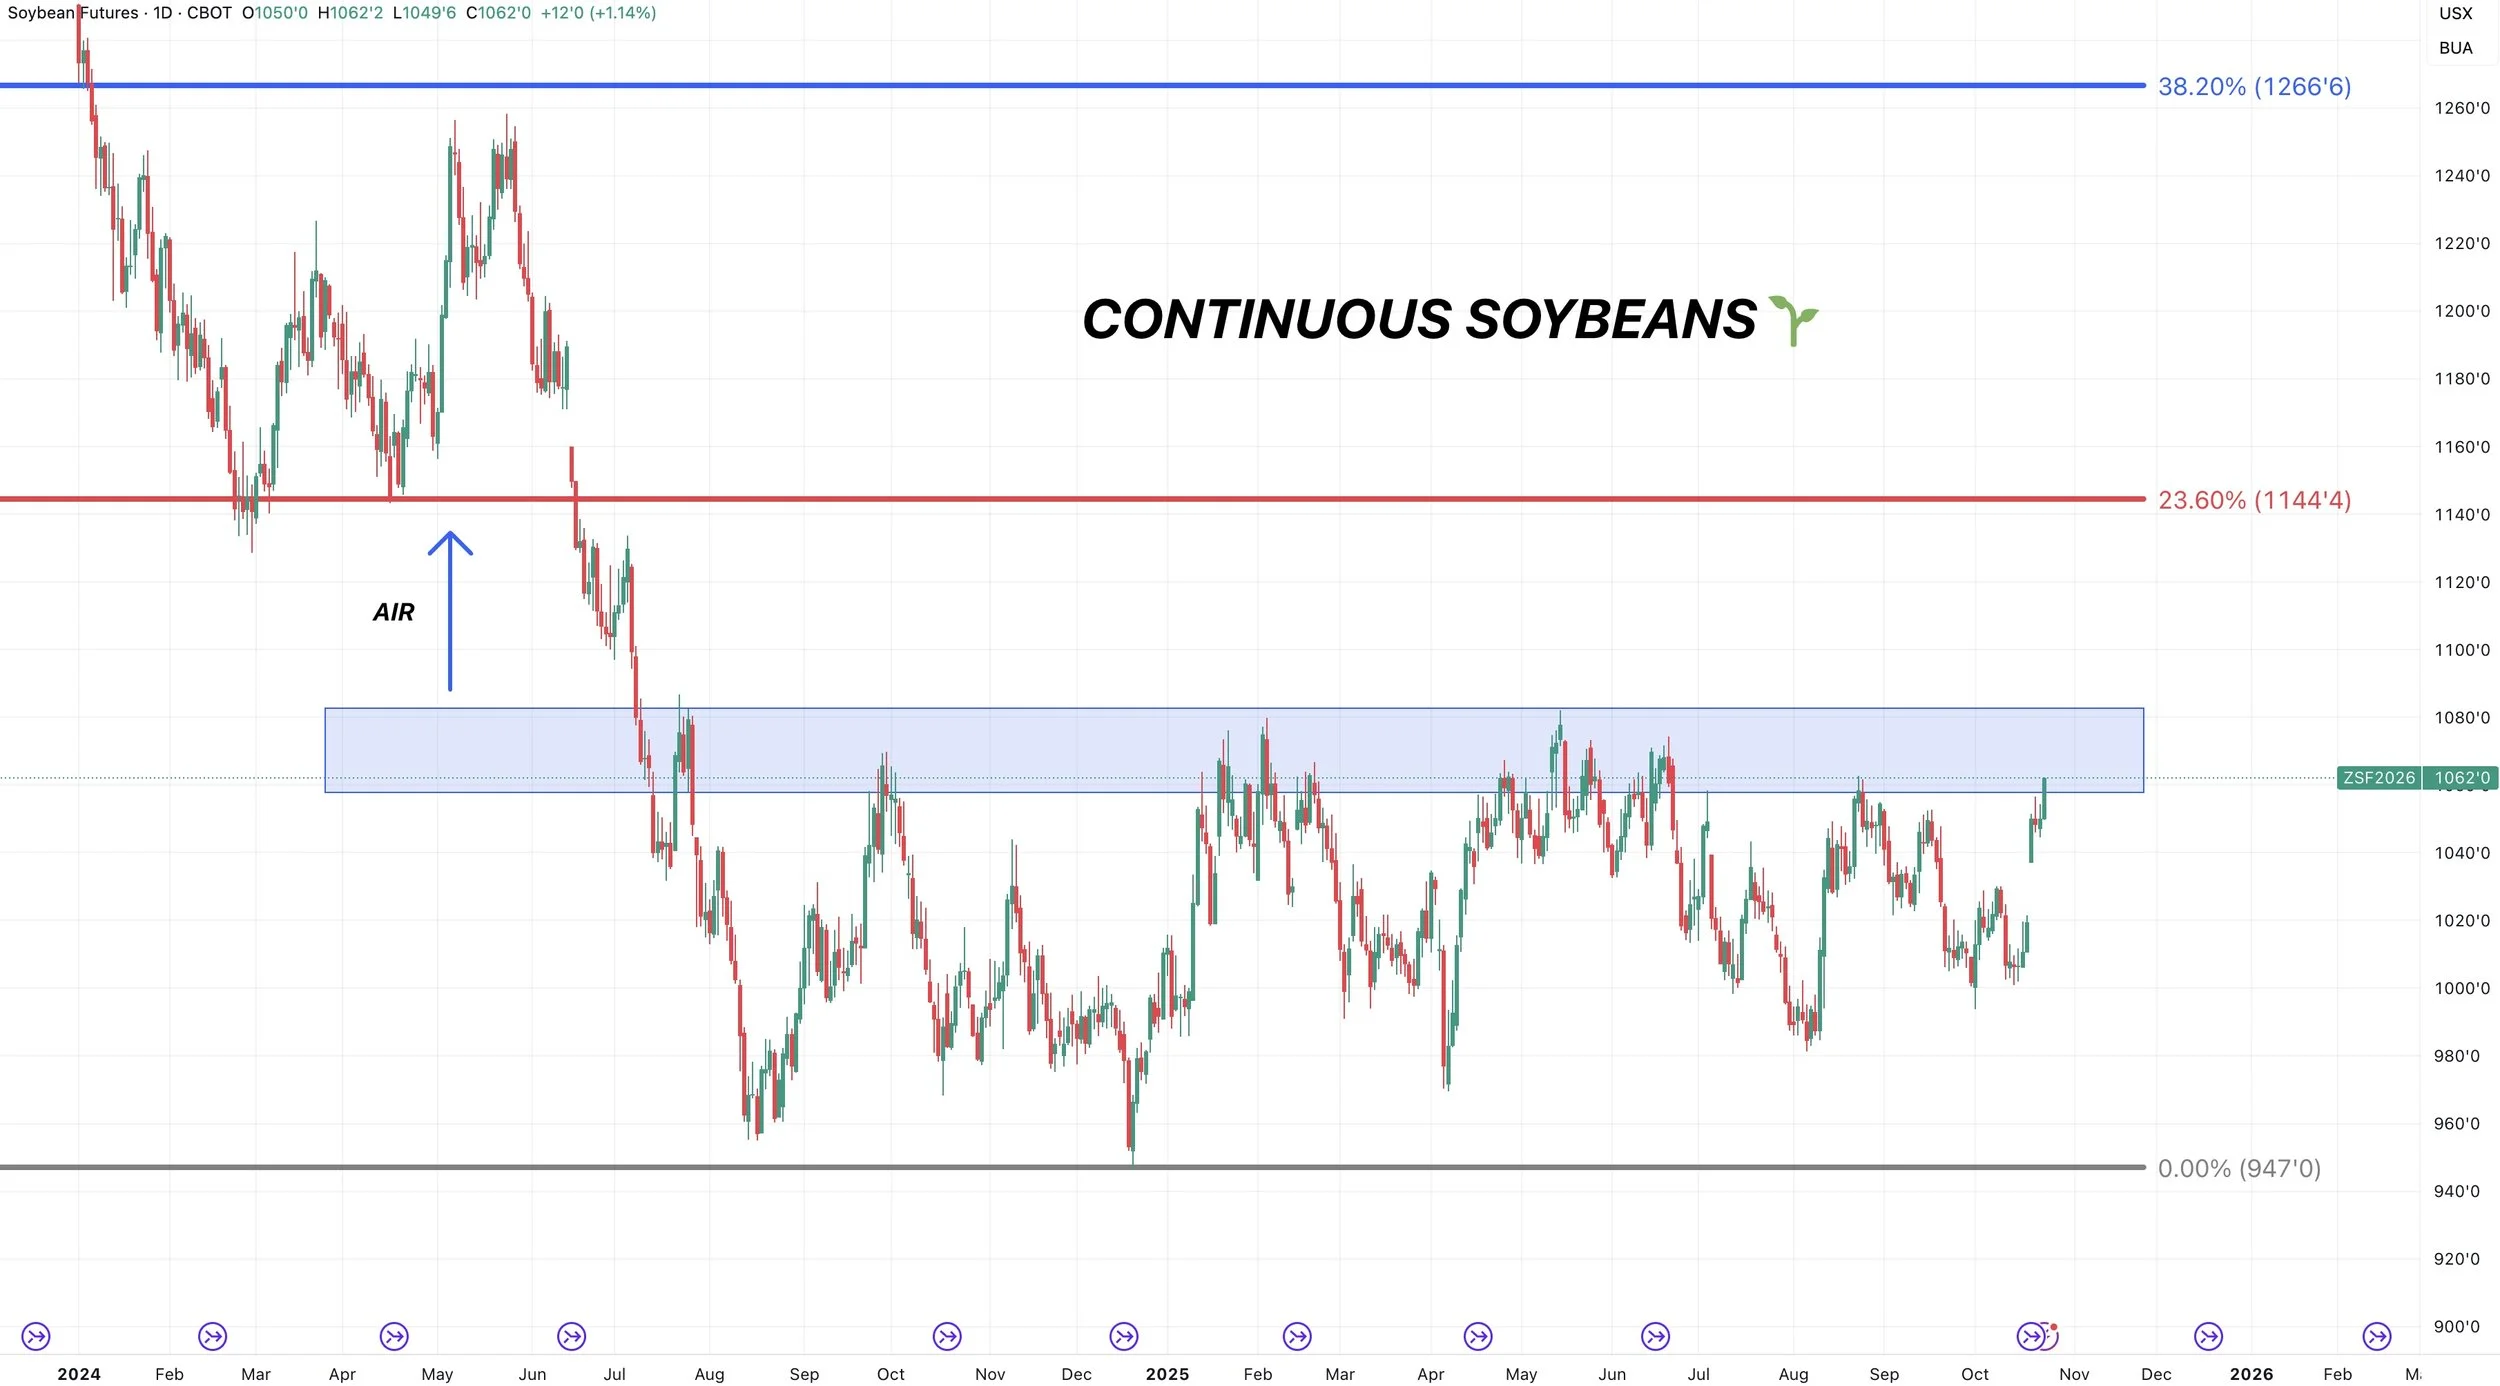
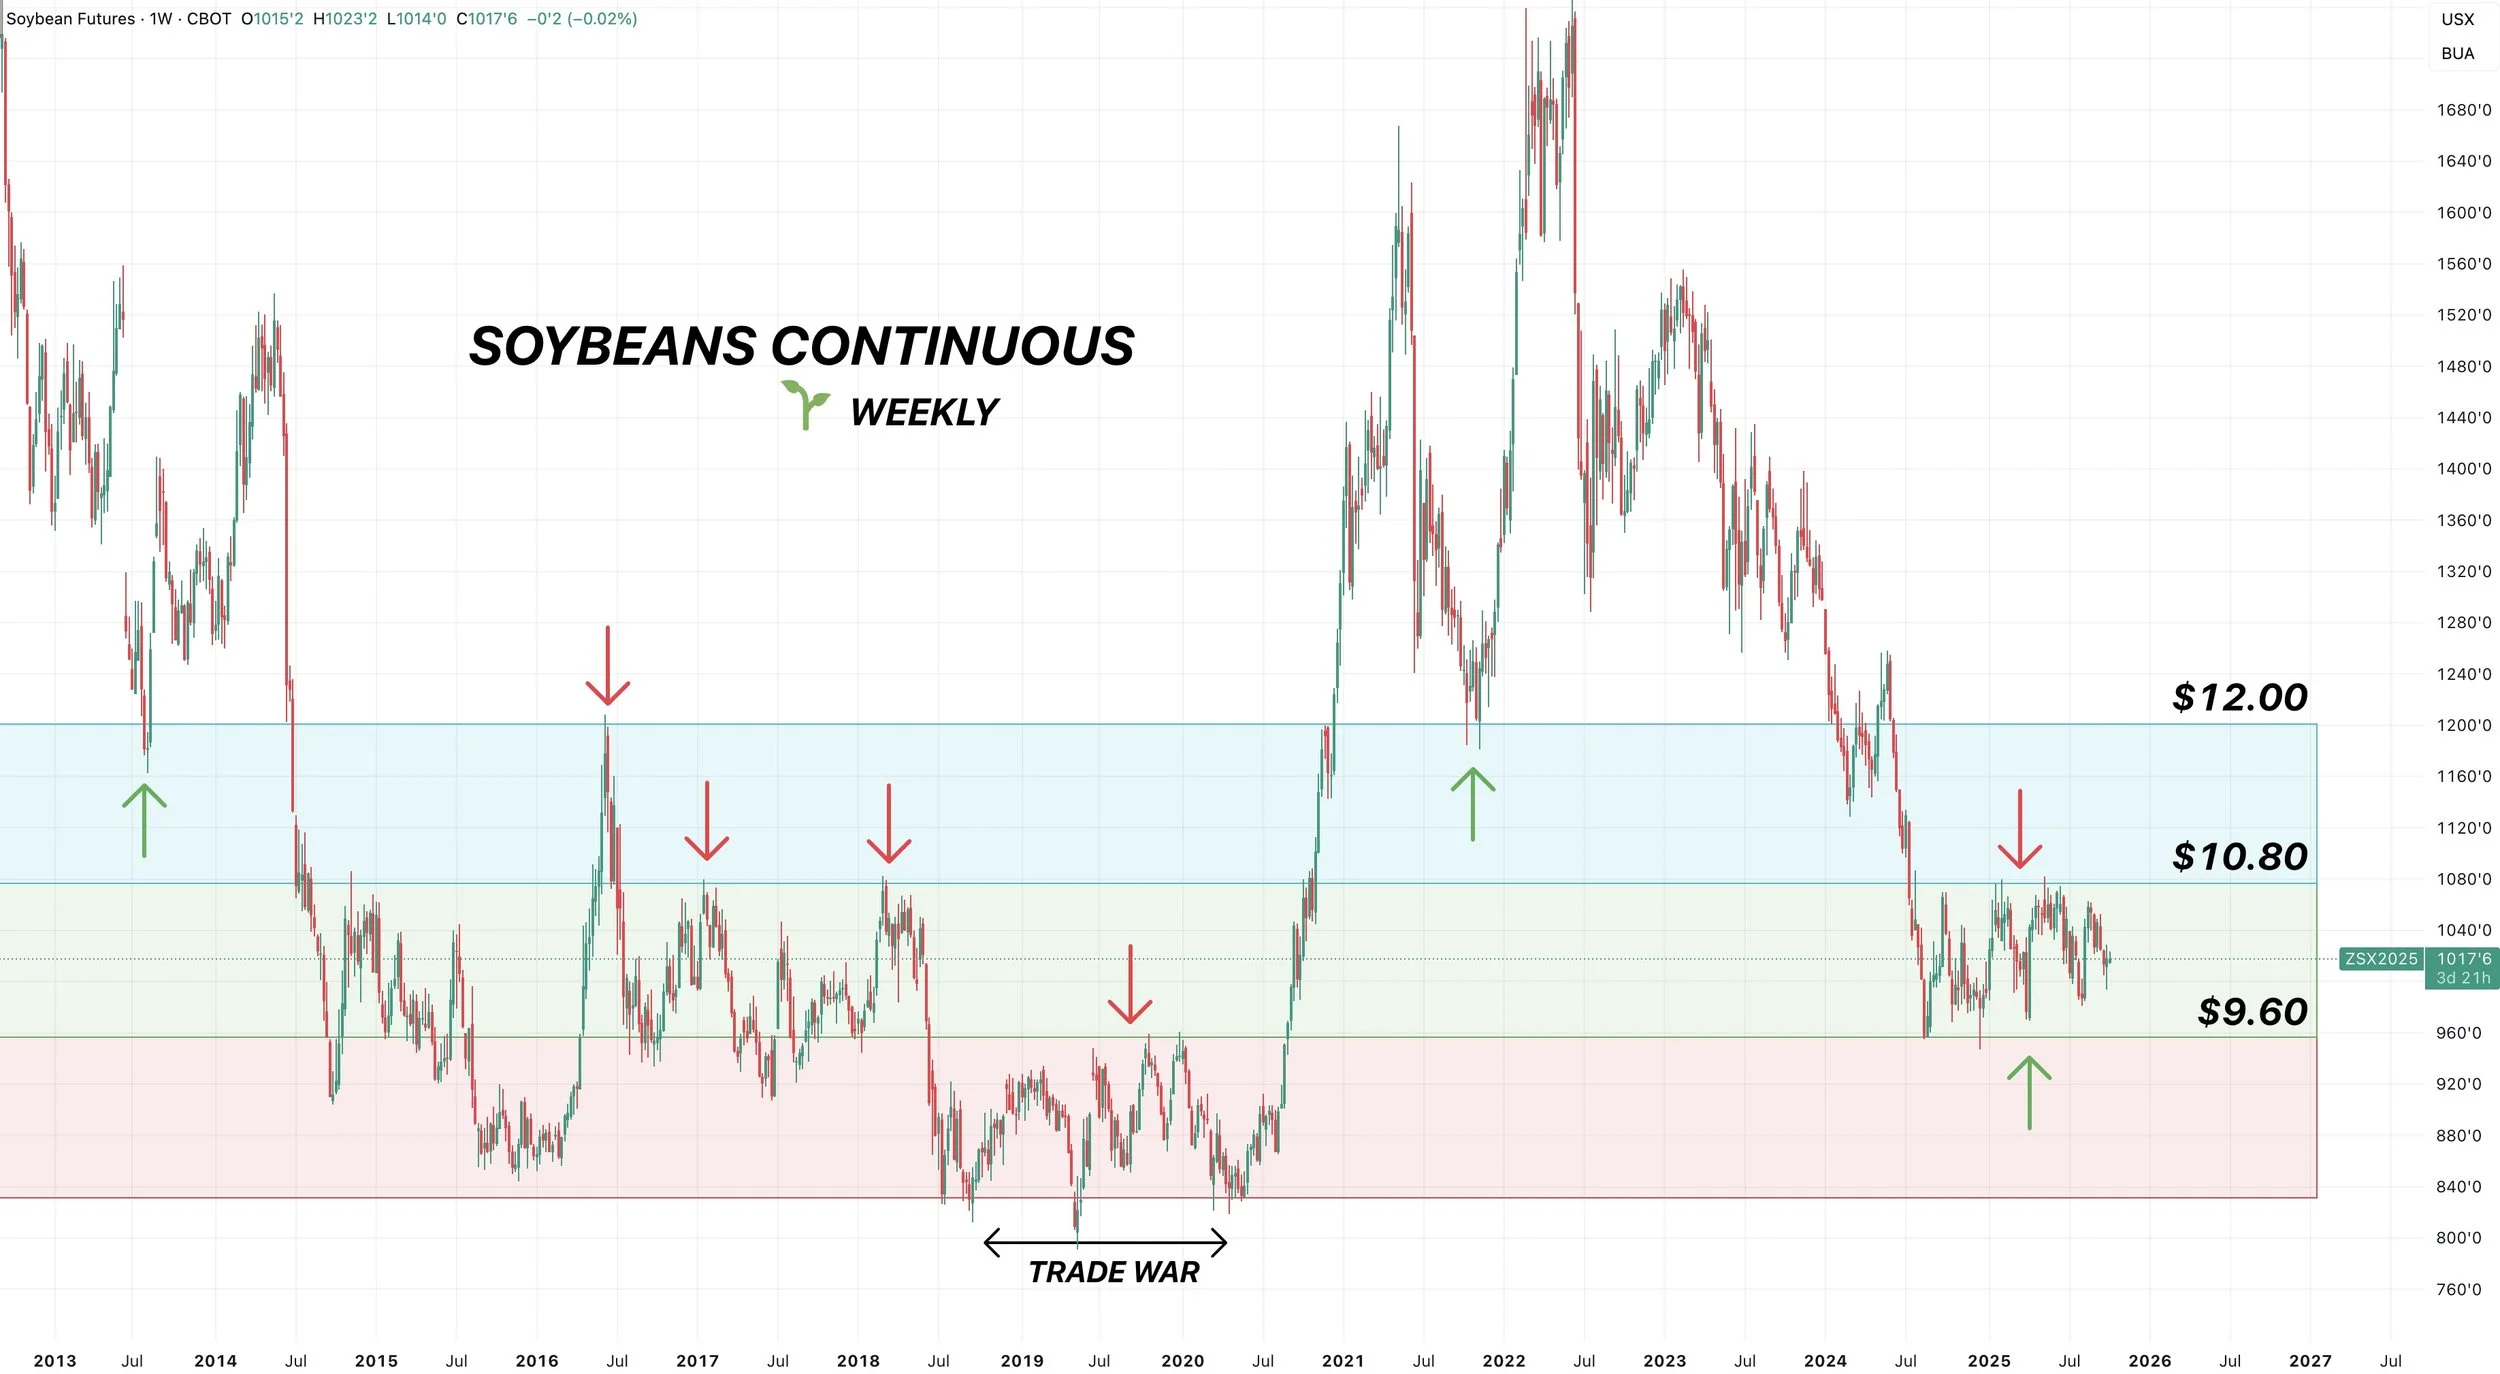
Continuous Beans
Here is a big picture look on soybeans.
Right now we running up into the same area where we've found resistance for a now year.
However.. if soybeans ever clear that $10.80 there is a ton of upside.
For starters, the very first retracement level from the 2024 lows up to the 2022 highs is the 23.6% level. Which comes in at $11.44
Not only that.. but we have a gap of air to upside. Where this market has previously found support. That also perfectly lines up with that $11.44 level.
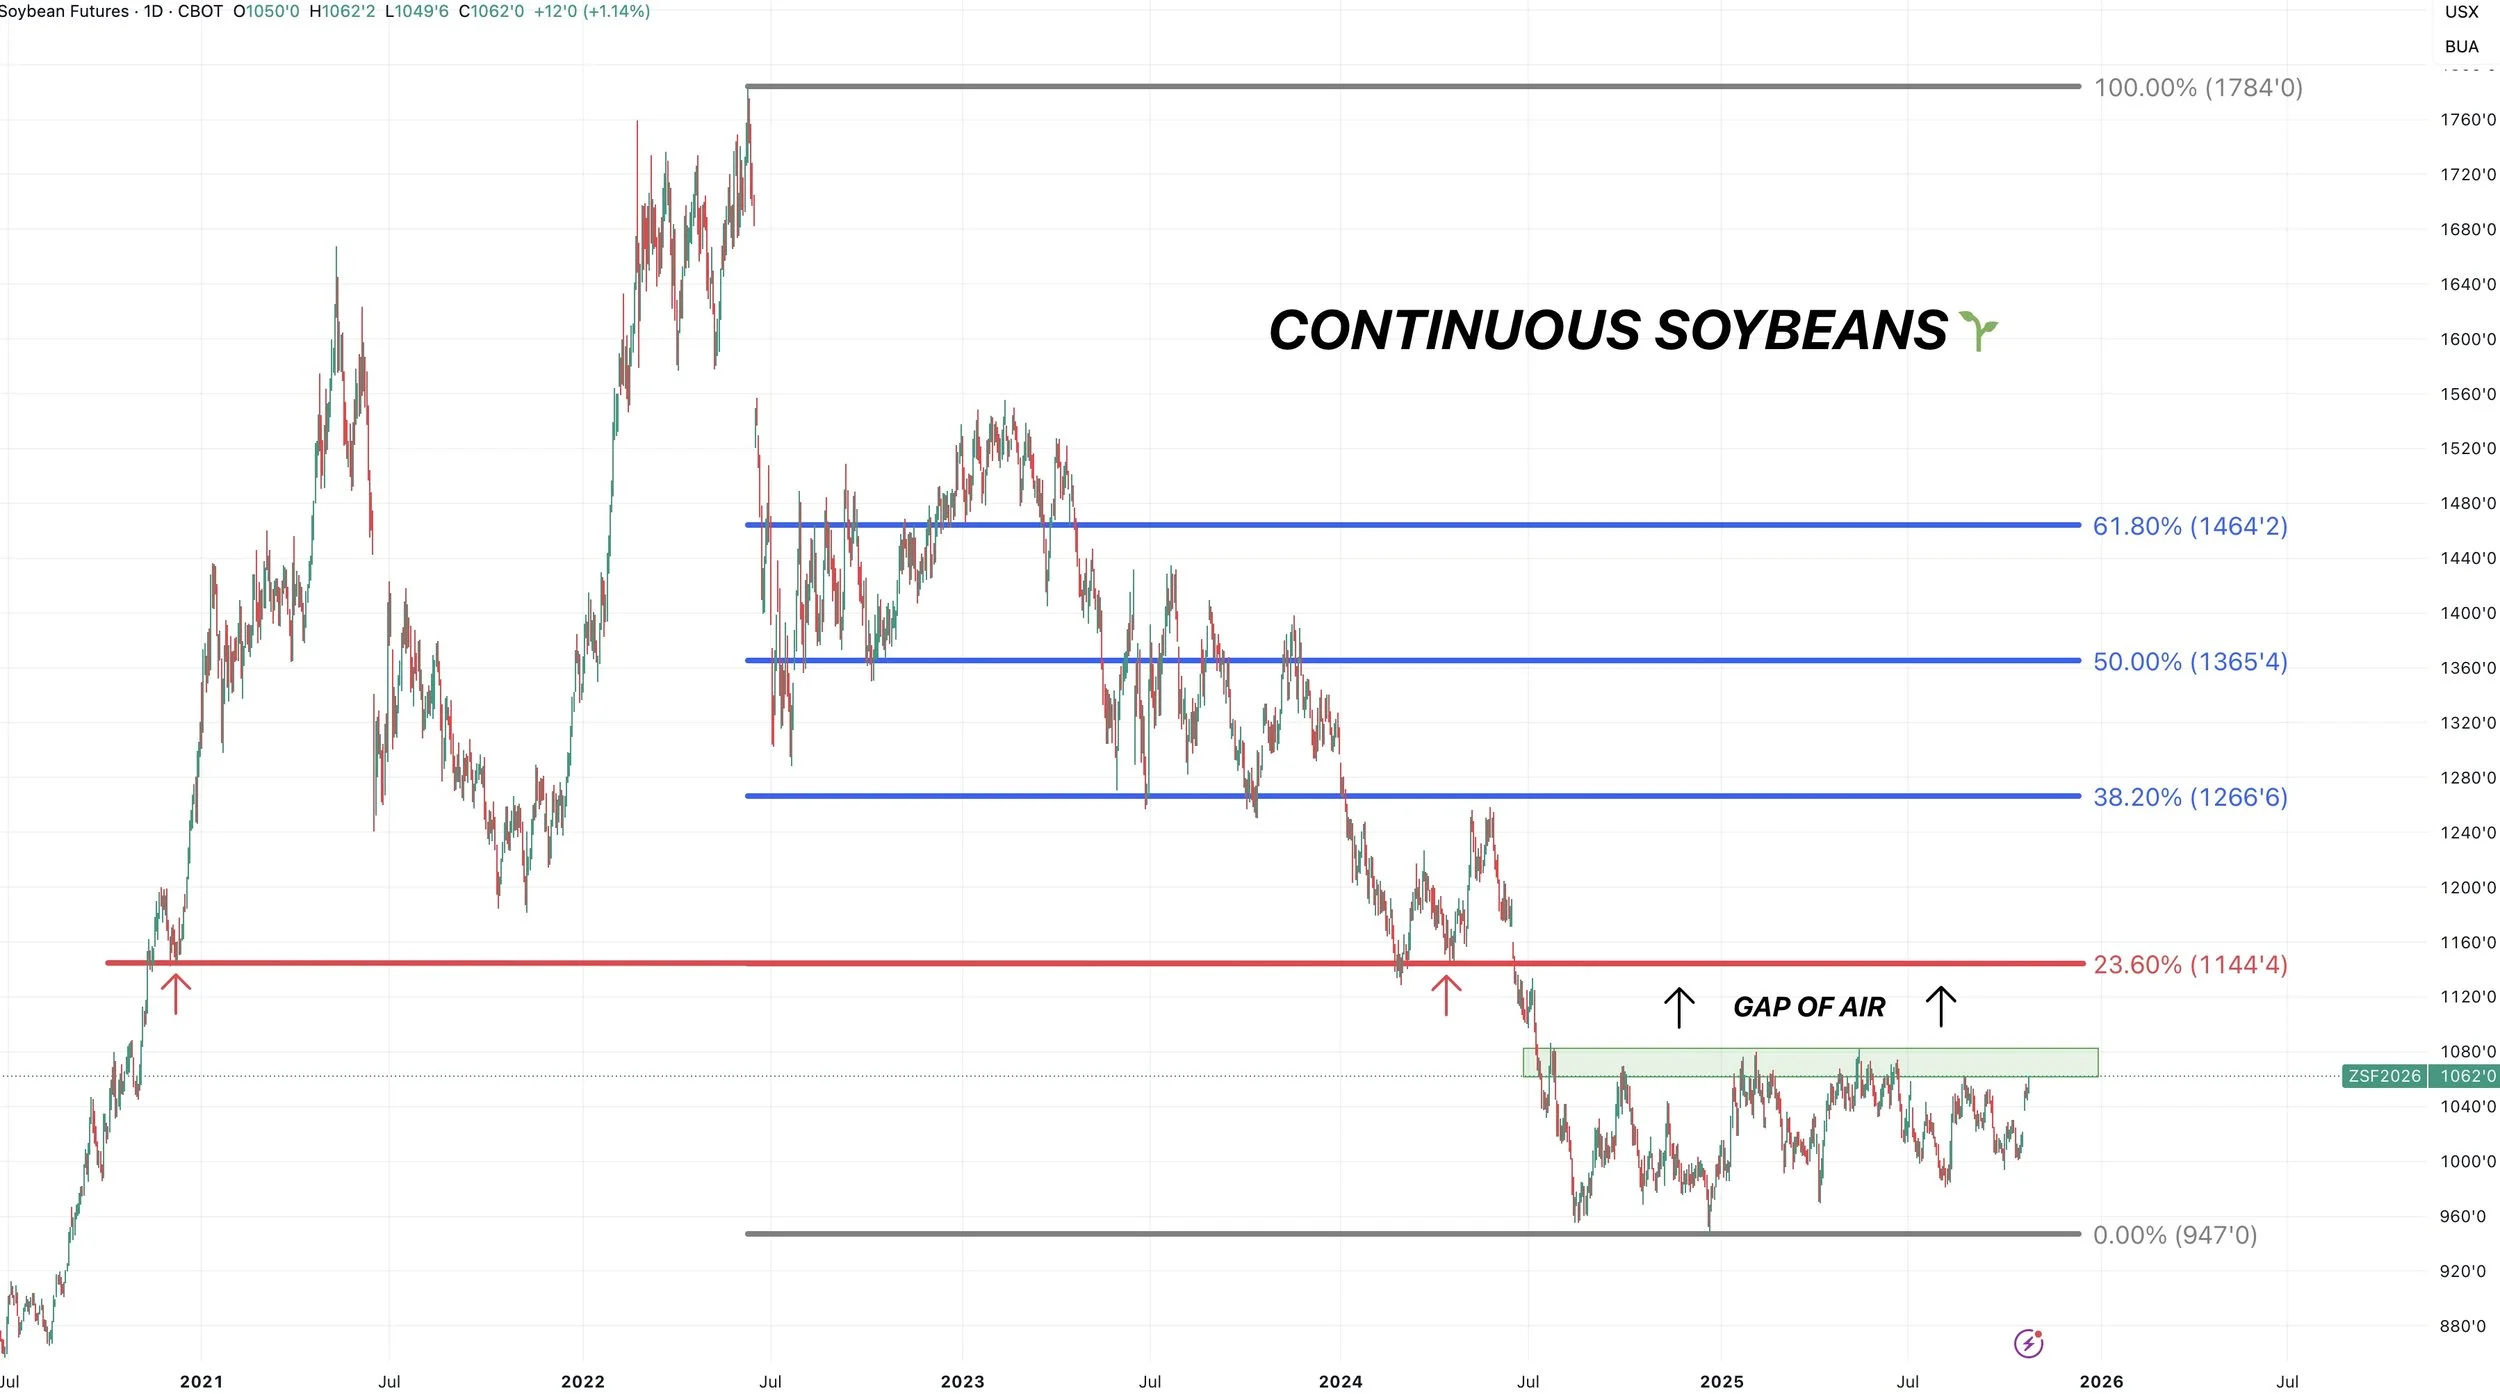
Here is an even bigger picture view.
You can see just how critical of level that $10.80 area is.
We've been trapped there a year. It was also key resistance back in 2017-2018.
This market has pretty much never traded between $10.80 and $11.40
Meaning there is a massive gap of air.
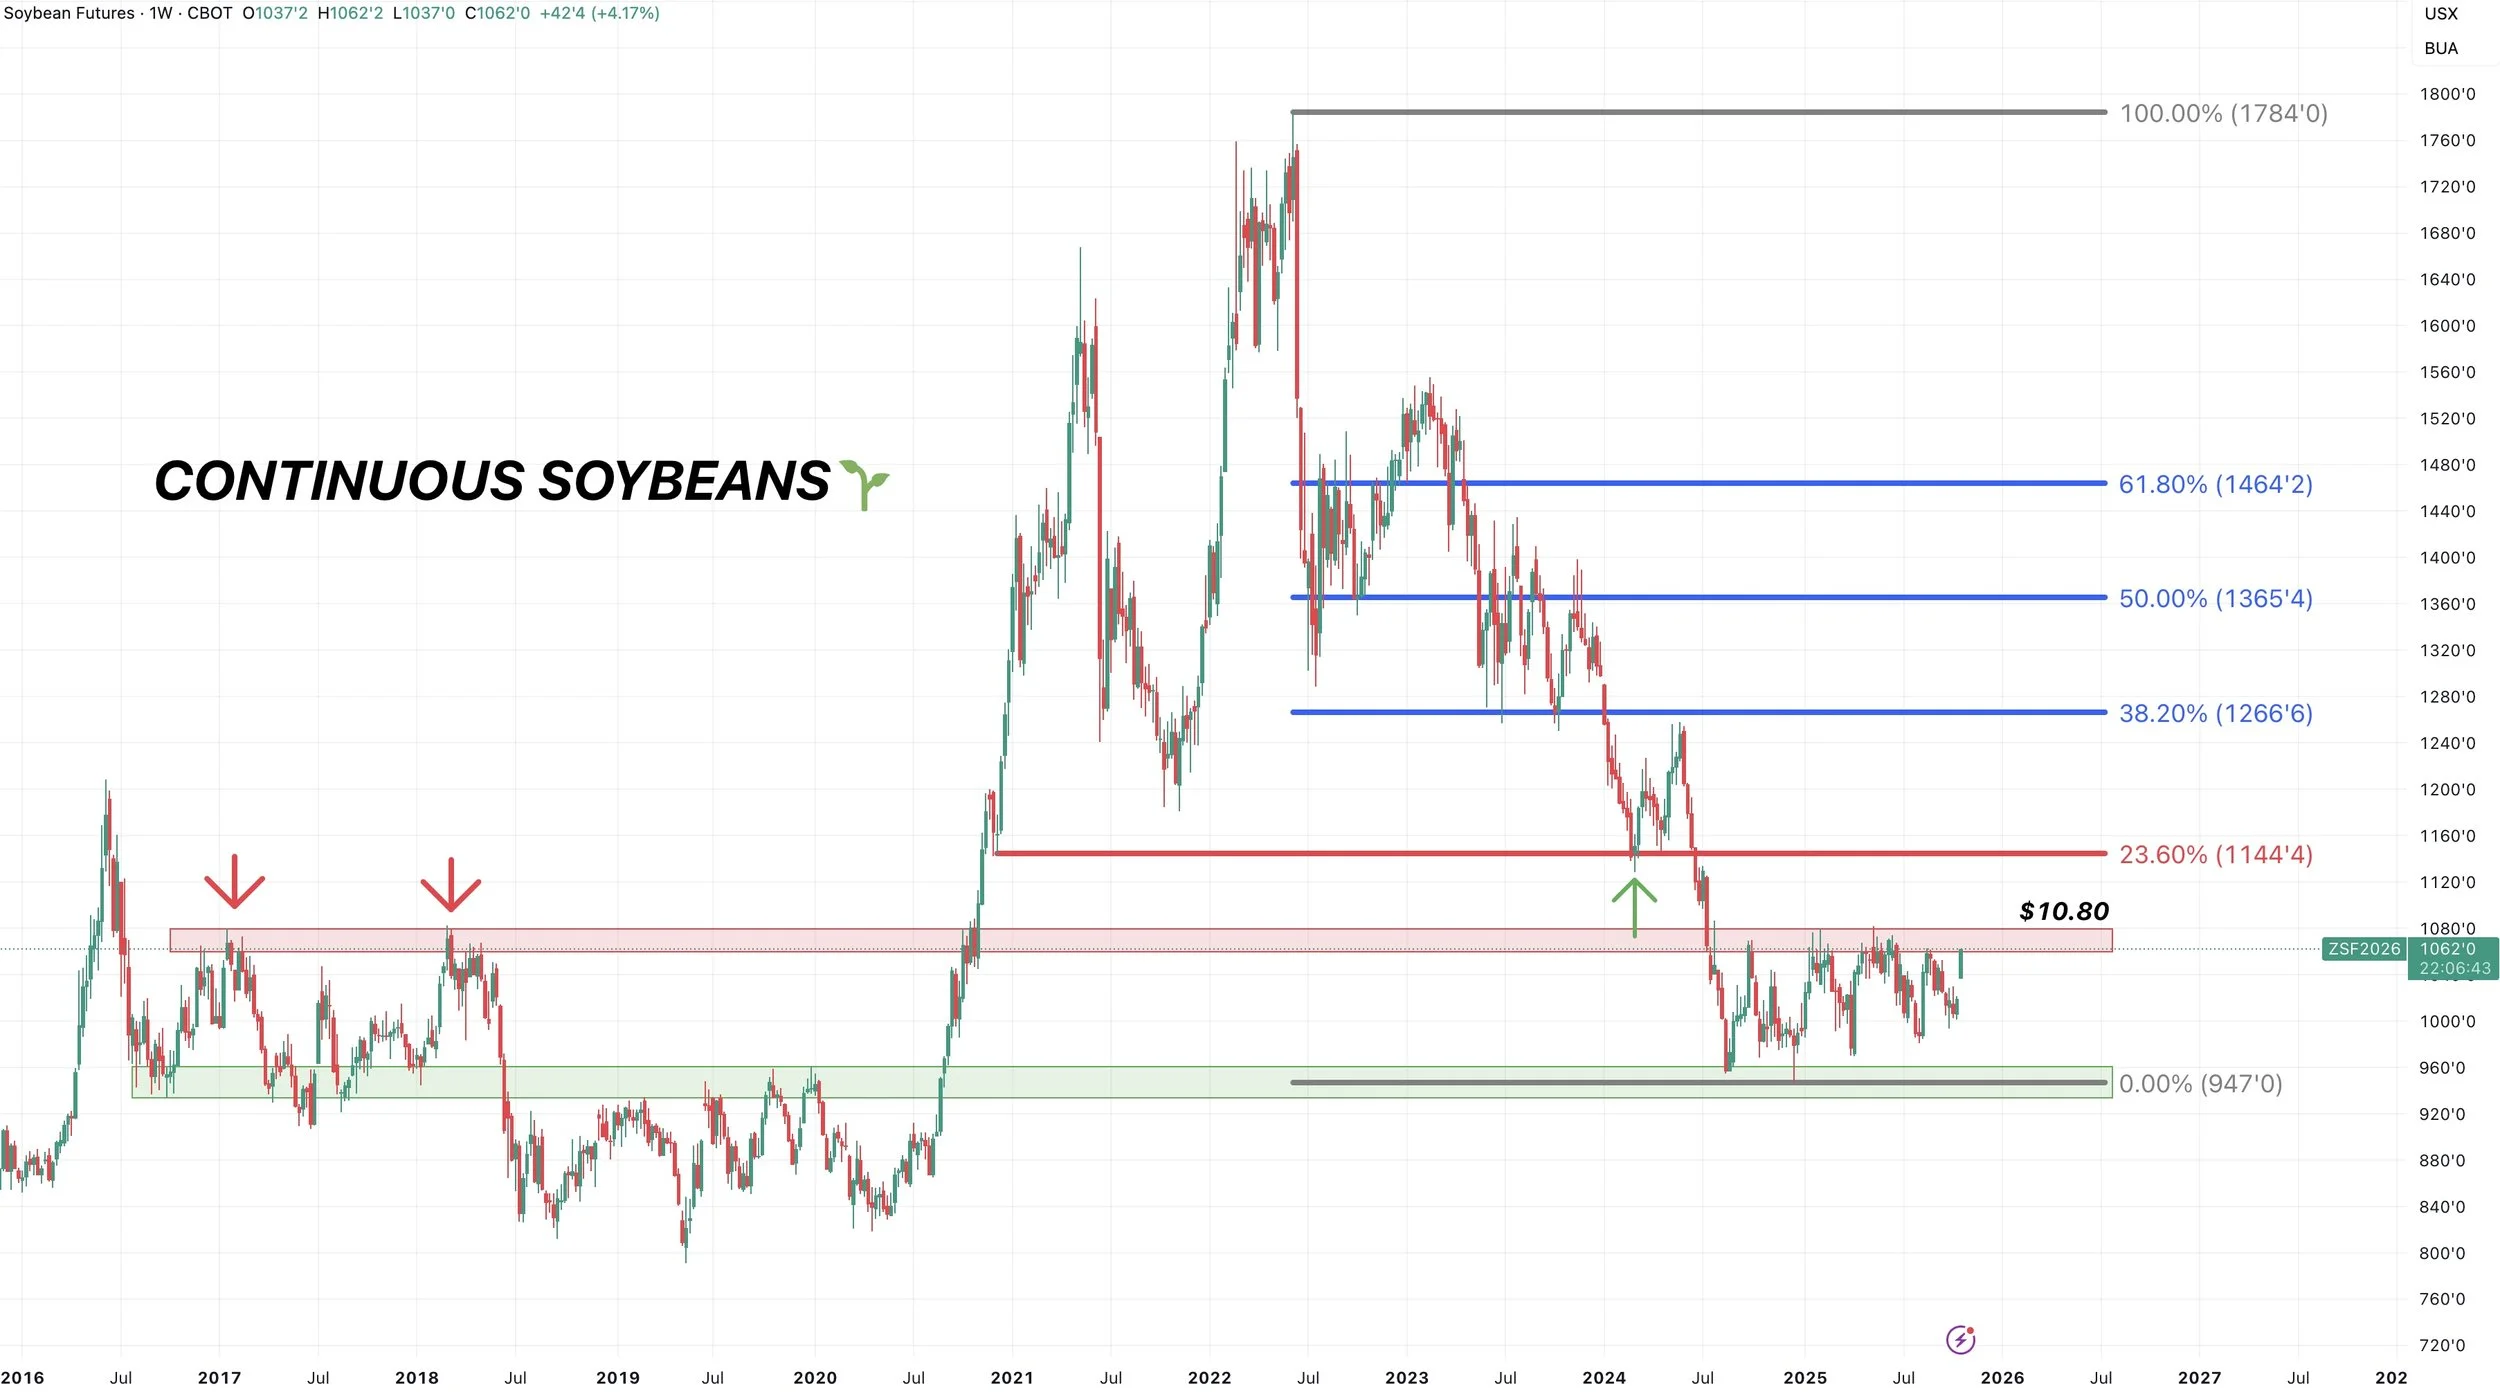
Lastly, here is a close up view.
This market has topped in this area 4 separate times over the past year.
It has been an absolute lid.
Which is why we will be looking to take risk off the table here soon.
But again.. if we ever clear $10.80 it opens the door so much higher to that $11.40 range.
Wheat
Fundamentals:
Like corn, wheat also found some strength due to that China headline about too much moisture.
China also grows a good amount of winter wheat, and their planting is wrapping up here soon. Too much rain are not great for that crop.
Outside of that, the wheat market still lacks a fundamental catalyst.
The charts on the other hand are providing some optimism here.
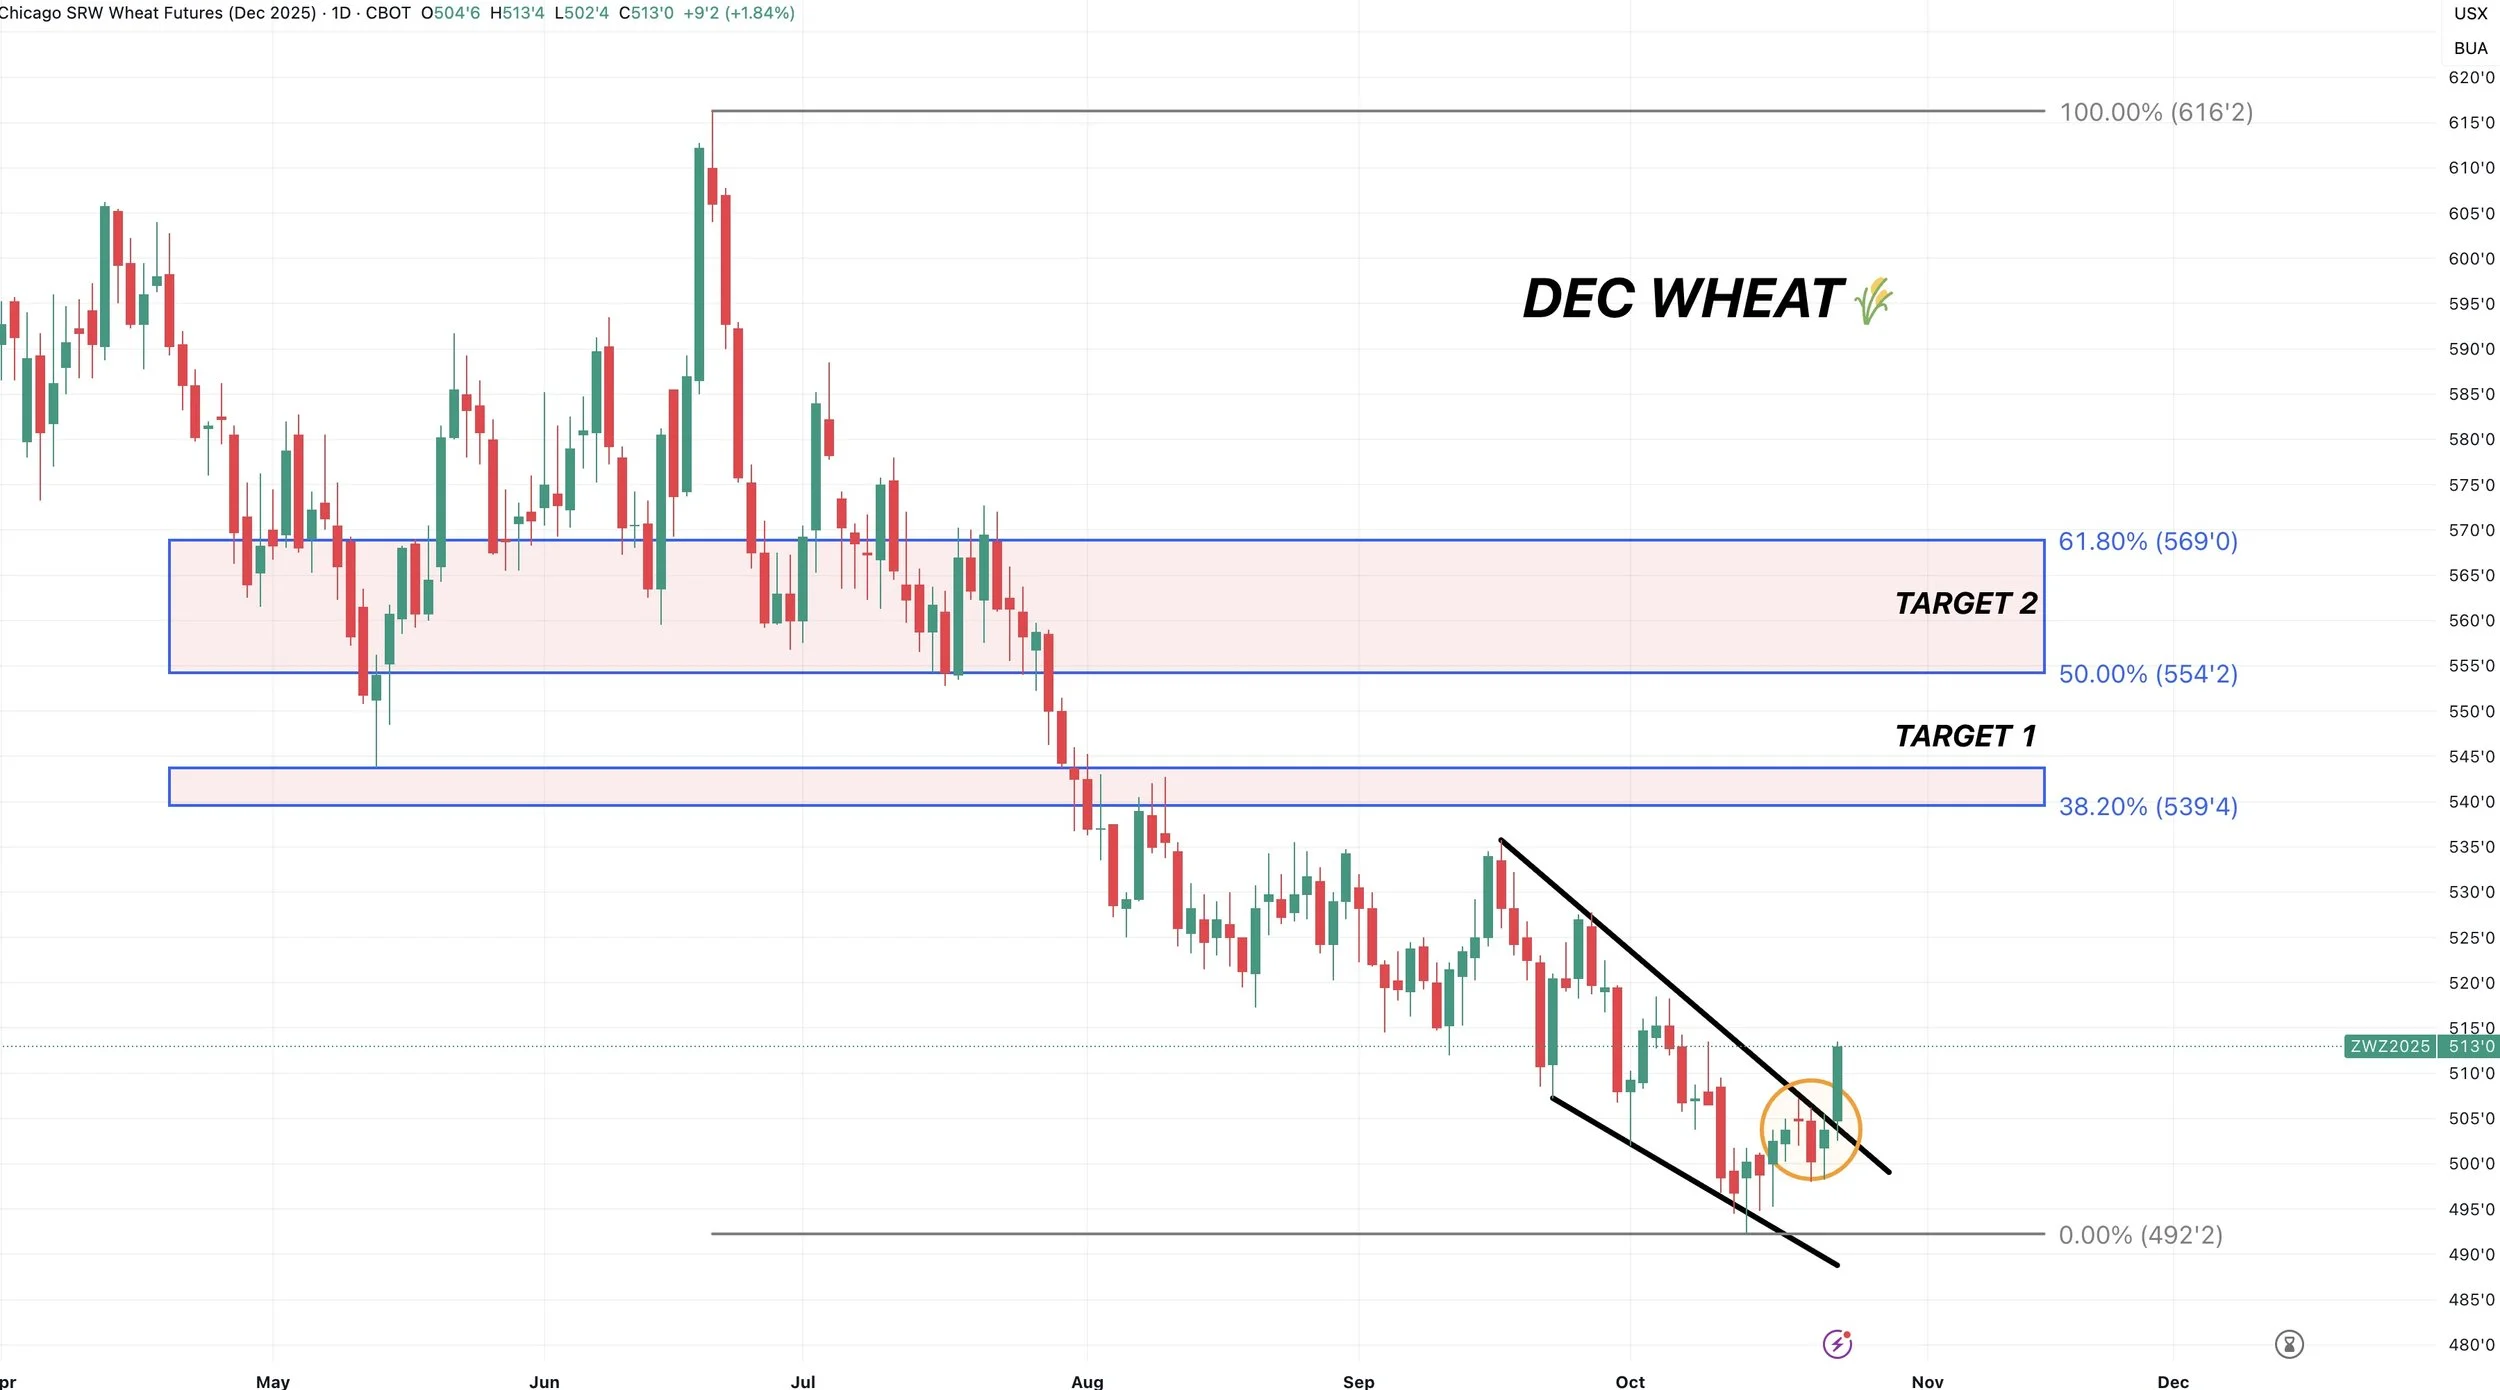
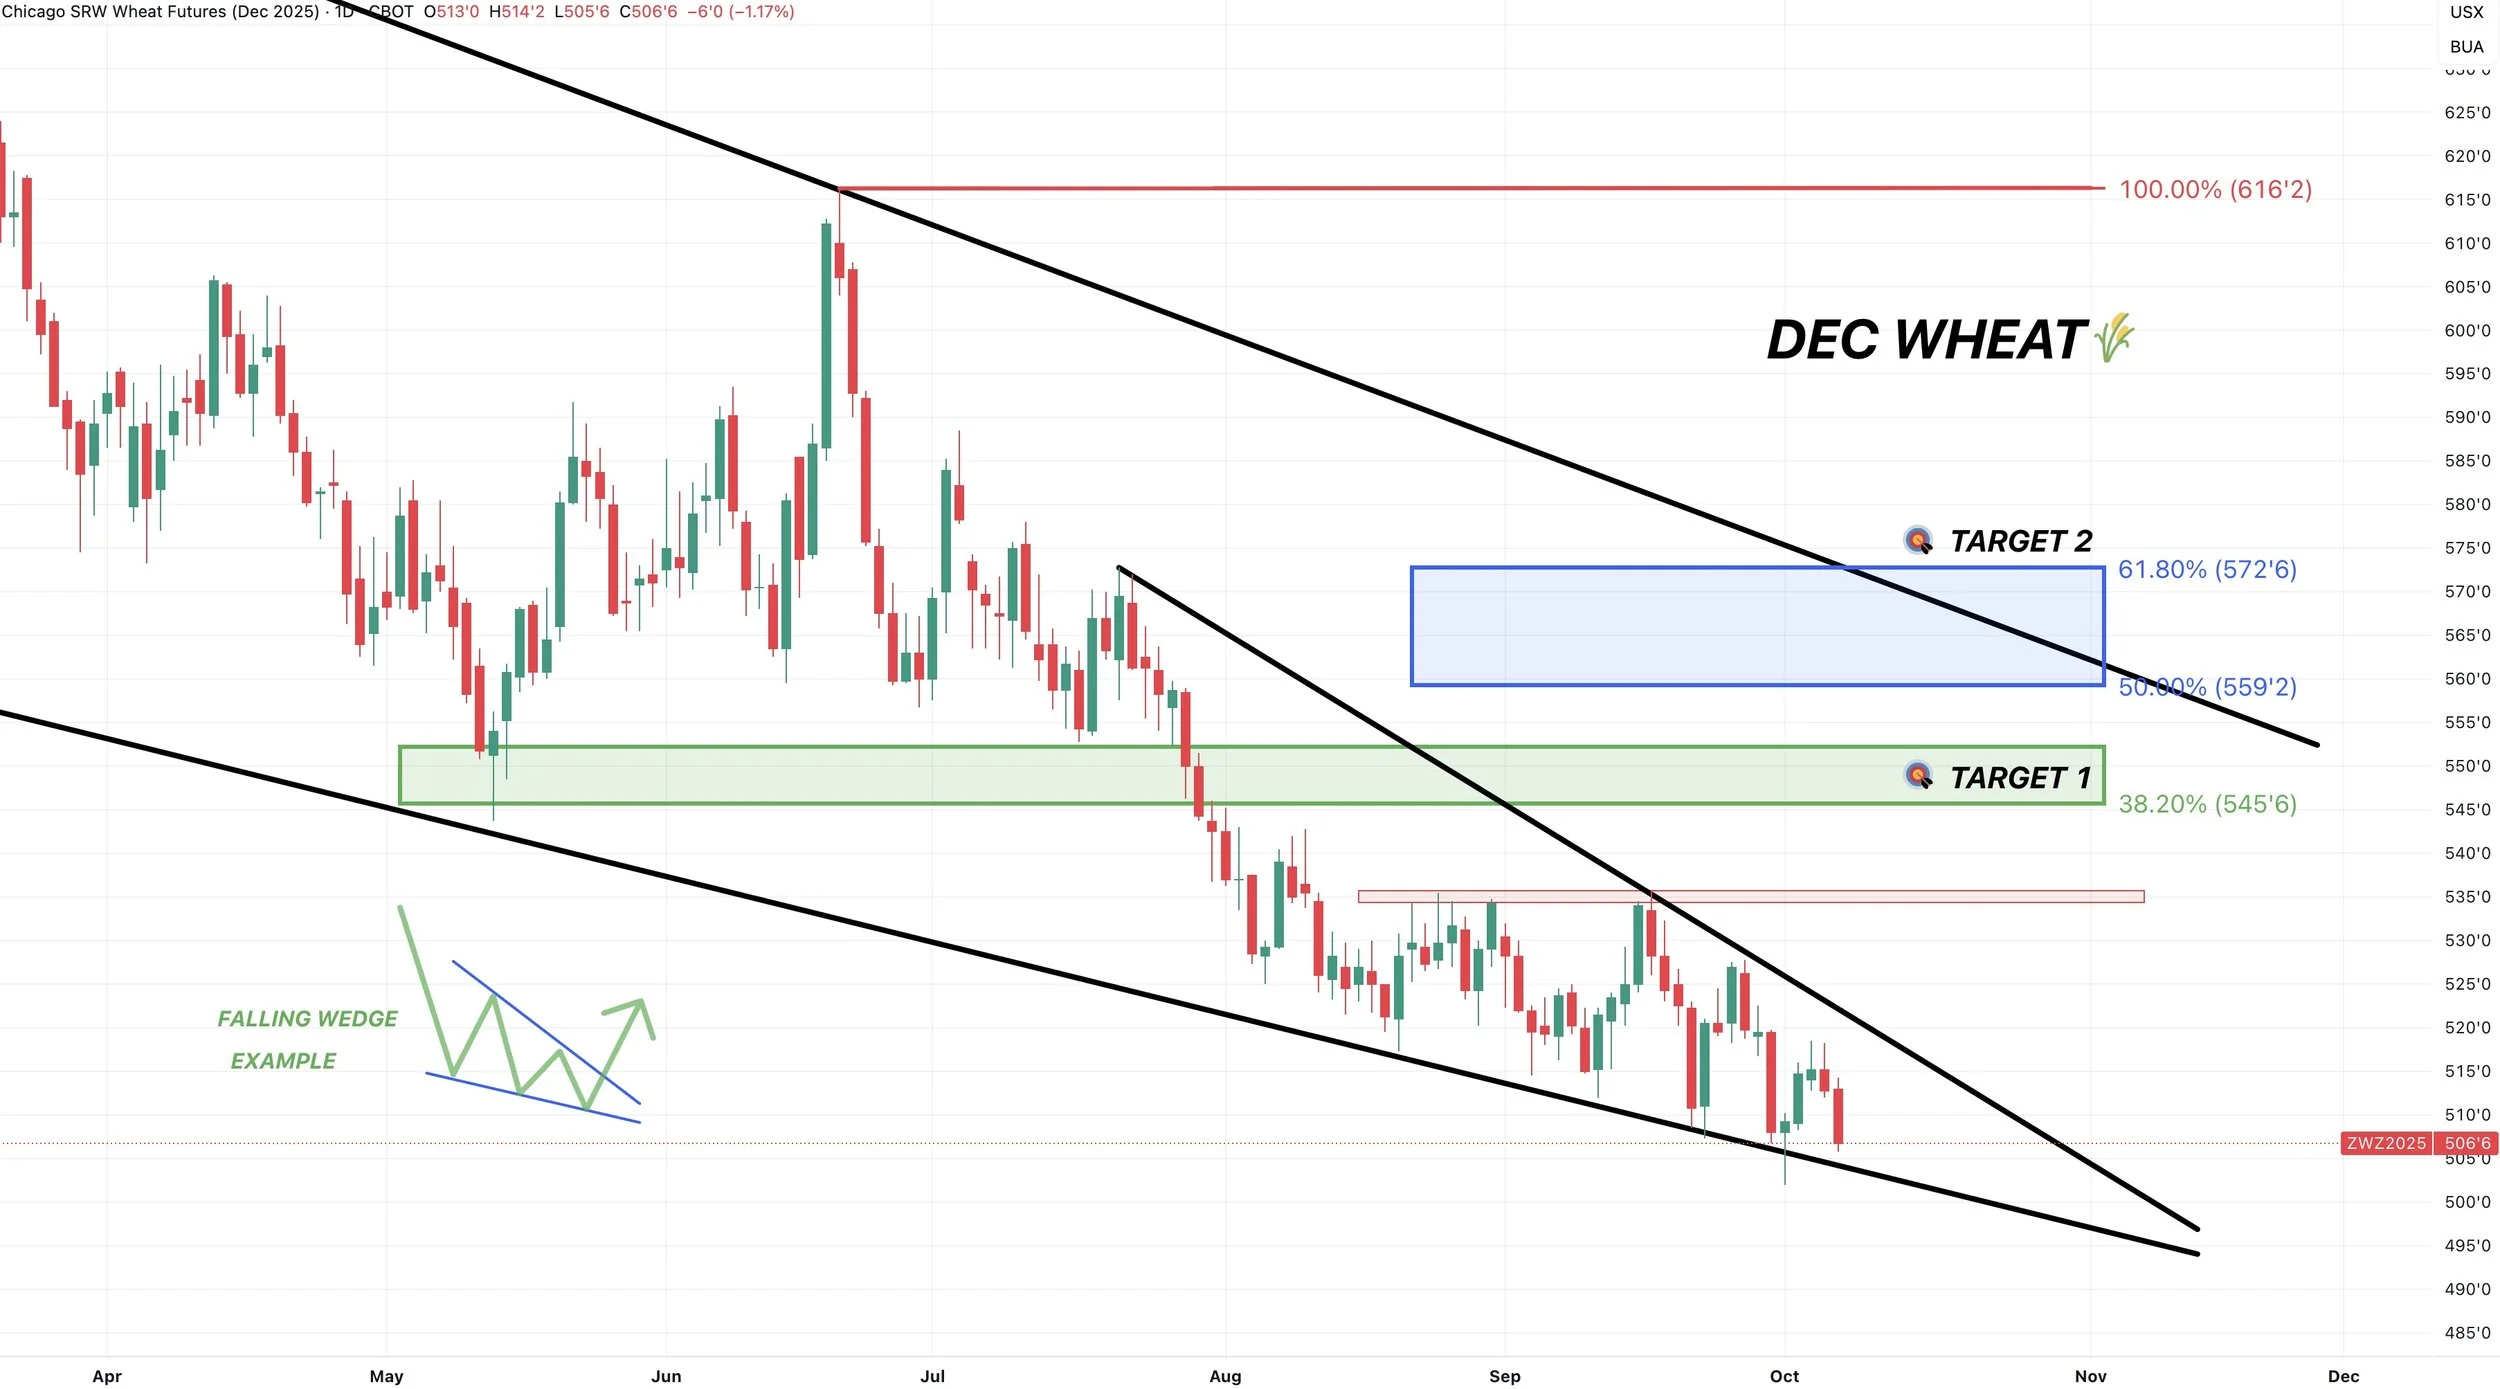
Dec Wheat Technicals:
Today was the best day for the wheat market in a month.
We now appear to breaking out of this brutal downtrend.
So the chart looks optimistically good here.
If this is truly the start of the turn around, I think we have at least another 25 to 40 cents of upside here.
Dec KC Wheat Technicals:
KC also looks like it is finally seeing a break out.
I see at least 30 cents of upside from here if this is actually the start of the move bulls have been waiting for.

Cattle
We already touched on the Trump news.
We've been very vocal about keeping protection up here at these levels and still like doing so.
Fundamentally nothing has changed in cattle.
But there are several things the government can do to add pressure to this market.
They could remove the Brazil tariffs.
They could re-open the Mexican border.
If your government is flat out telling you that they are trying to lower prices, you need to protect yourself at all-time highs after a historic run.
You do not want to caught with zero protection if this market starts to fade away. If this market tanks and you don’t already have protection, there isn’t much you can do. But you can do something right now.
I am not saying this bull run is over. It just makes sense to protect yourself when your President is telling you lower prices are coming.
Take eggs for example. They wanted lower prices. They got them.
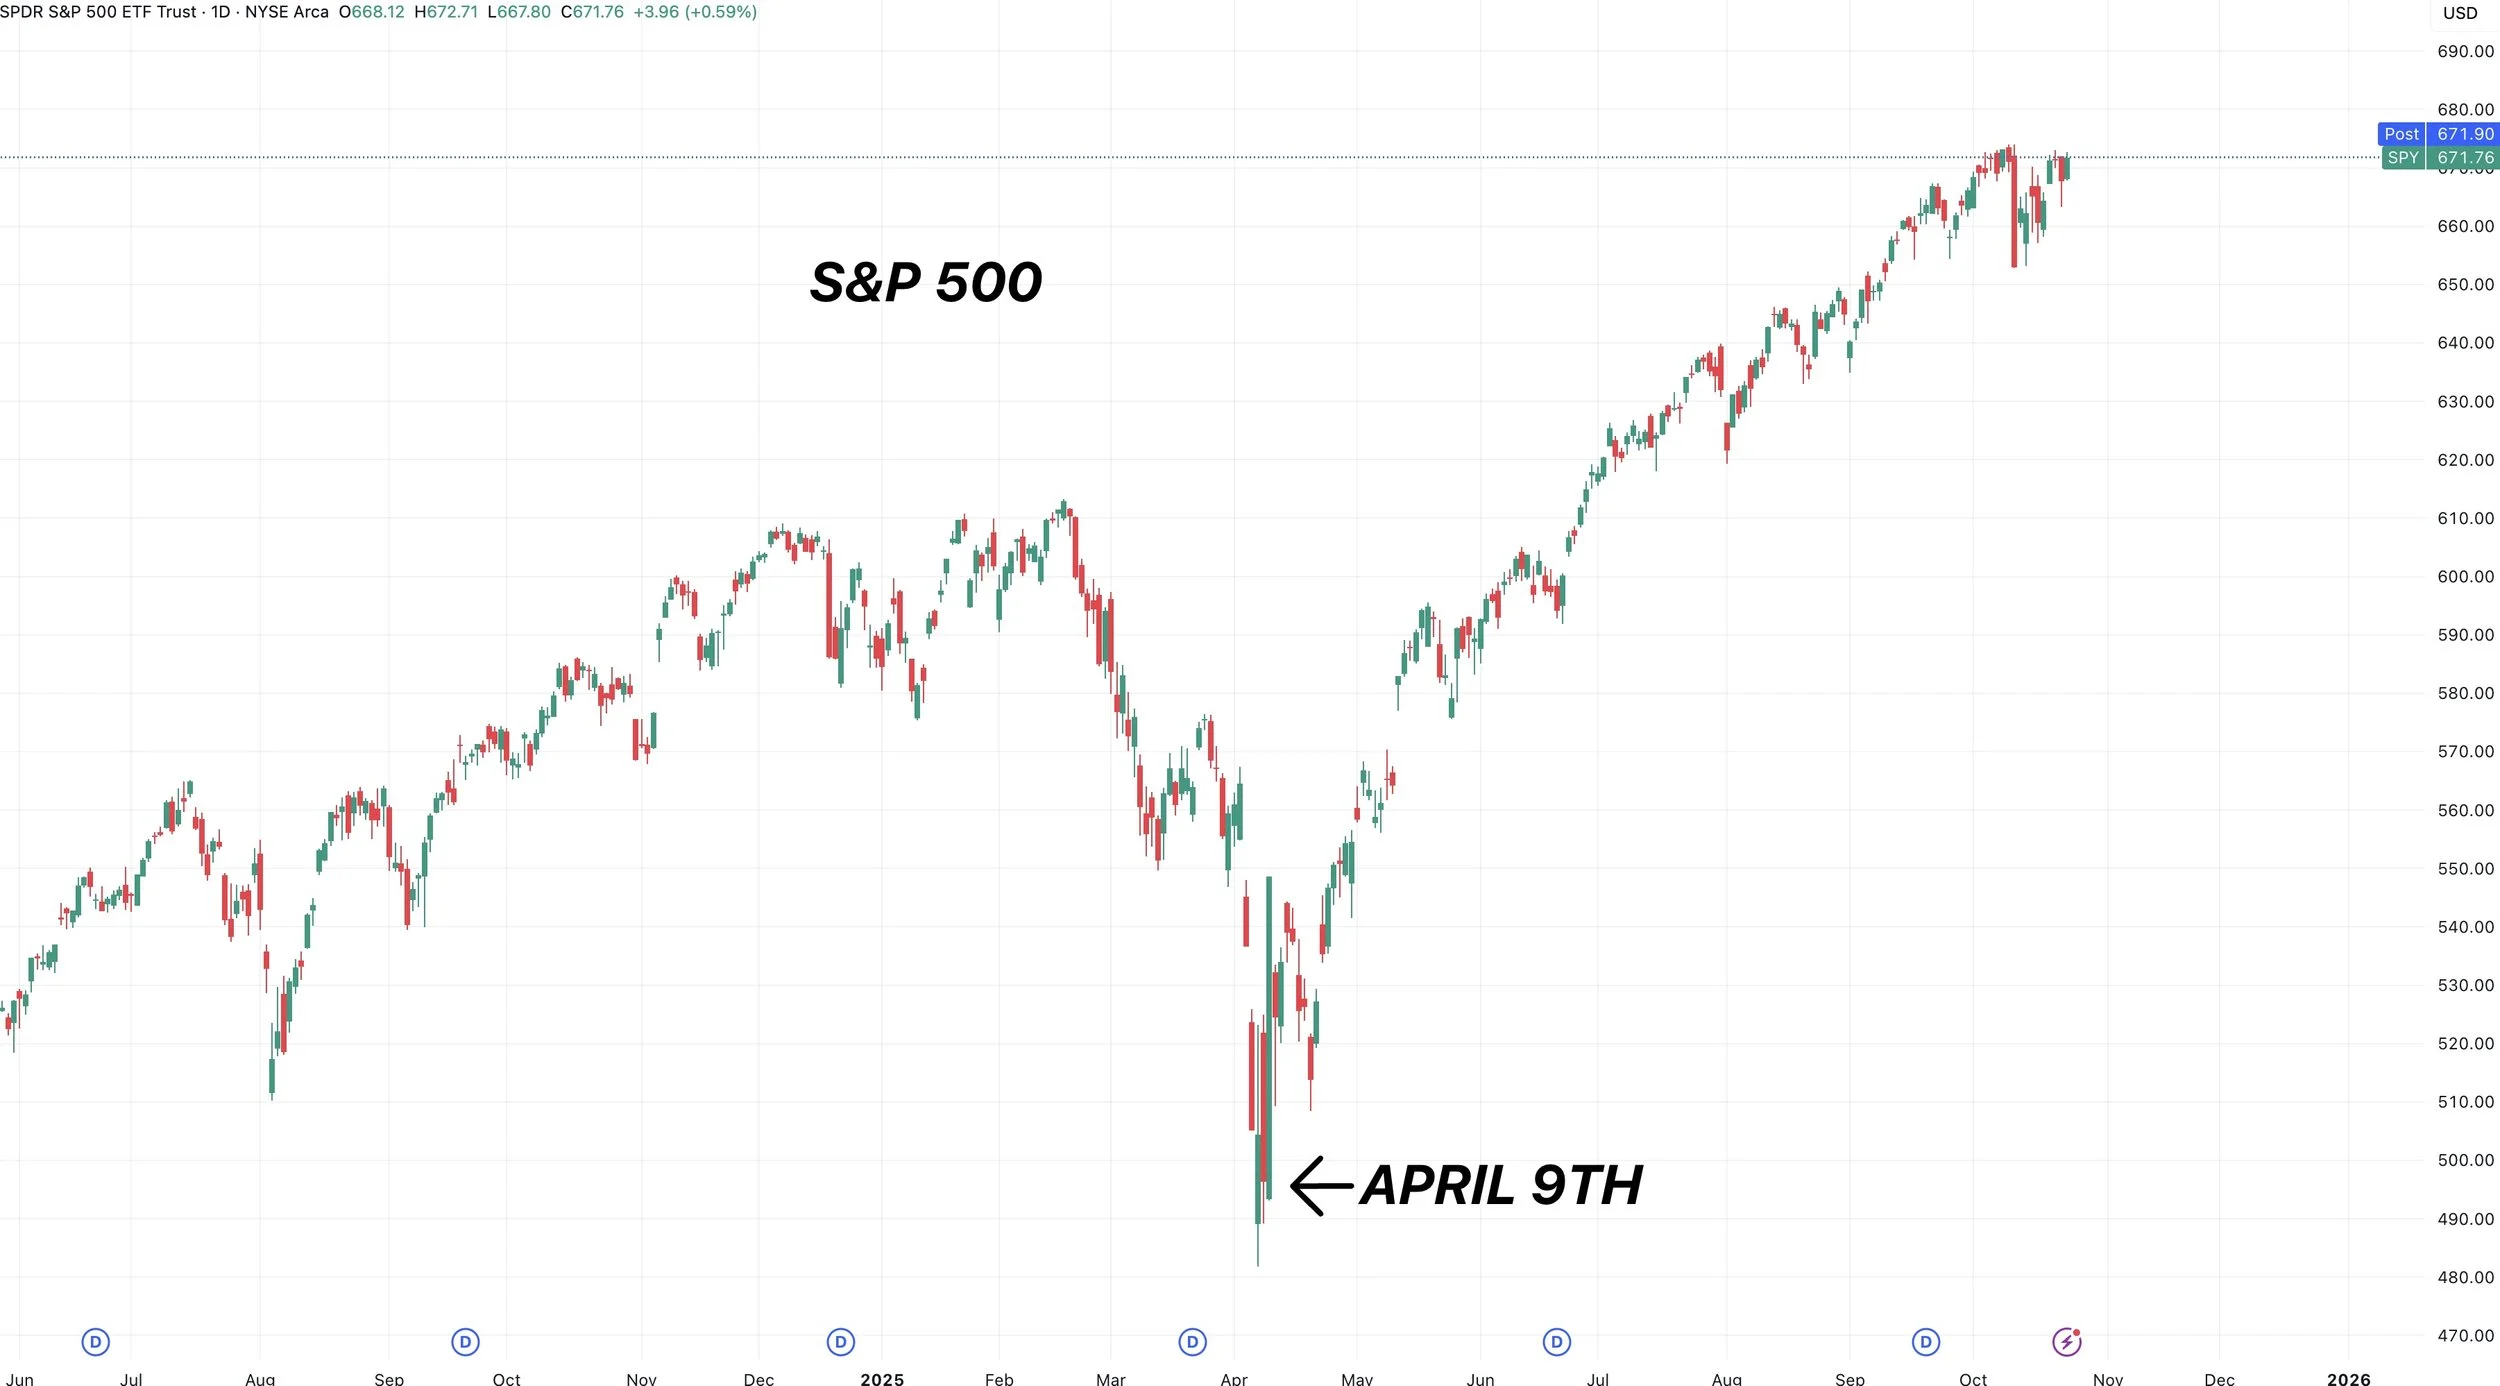
Trump told everyone to buy the stock market on April 9th.
He then paused tariffs, and stocks have exploded higher since he said that.
Whether it is right or wrong, the government can control markets. We can’t control if they are trying to lower beef prices.
The only thing you can control is your risk in this market.
Nov Feeder Chart:
Nov feeders are now in this golden zone box.
Which is 50-61.8% of the recent rally.
This is a pretty big must hold spot.
The 50-day MA also sits right in this box.
Which we are quickly approaching.
If that level gives it, you have to imagine it sparks a leg lower.
The 50-day has acted as a complete floor. If it breaks, I'm sure the algos are going to sell it further.
This is a big spot for bulls to hold.
If we are going to bounce, it needs to be here.

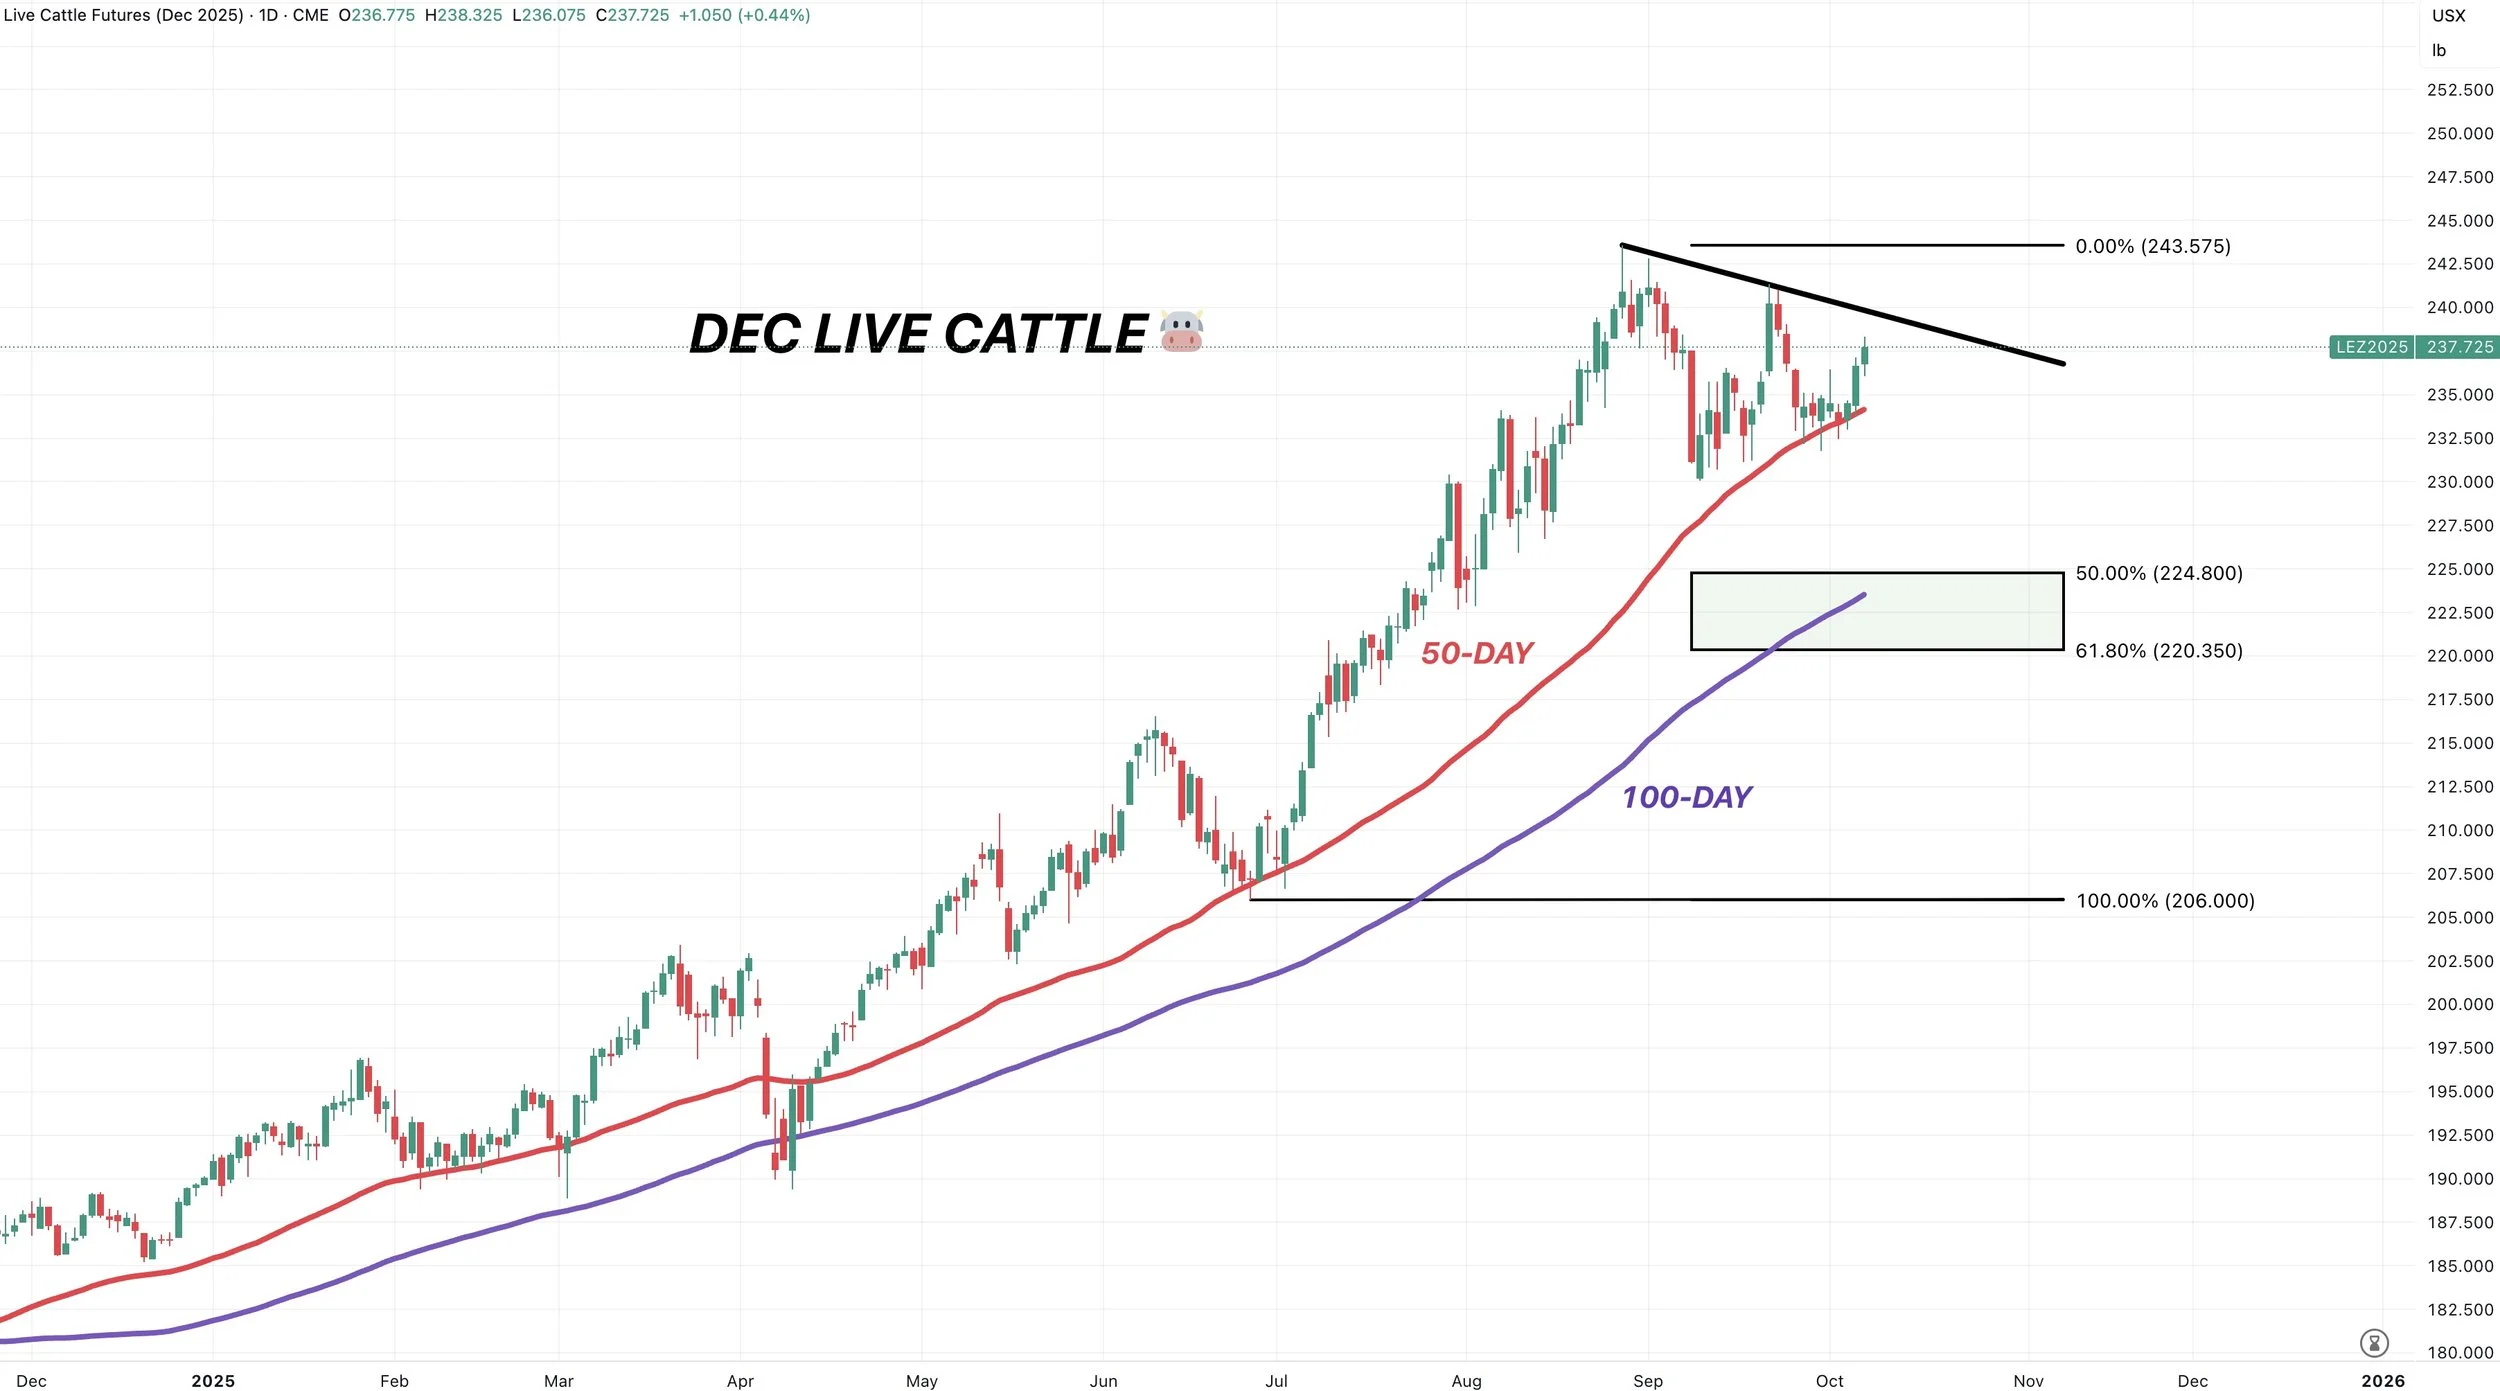
Dec Live Cattle:
Live cattle is holding up better on the sell off.
That is probably because feeders led the rally higher. So they have a larger move to correct.
Like feeders, live cattle is also approaching a must hold spot.
The golden zone and that 50-day MA.
Absolute must hold.

Here is how utterly massive of support the 50-day has been.
It's marked pretty much every bottom.
The one time we broke below was April. It then sparked a sell off down to the 100-day MA.
So if the 50-day fails to hold, one could argue we fall down to the 100-day.
I am not saying cattle is going to fall apart. I am simply stating how crucial of a level we are approaching.
If this market is going to bounce, it has to be soon, or we could very well be in for some larger downside.
Past Sell or Protection Signals
Oct 13th: 🐮
Cattle sell signal & hedge alert.
Aug 22nd: 🌱
Soybean sell signal & hedge alert.
July 31st: 🐮
Cattle sell signal & hedge alert.
July 10th: 🐮
Cattle sell signal & hedge alert.
CLICK HERE TO VIEW
June 5th: 🐮
Cattle sell signal & hedge alert.
June 2nd: 🌾
MPLS wheat sell signal.
April 10th: 🌽
Old crop corn sell signal.
March 19th: 🐮
Cattle hedge & sell signal.
Feb 18th: 🌽 🌾
Old crop KC wheat & old crop corn signal.
Jan 23rd: 🌽 🌱
Corn & beans old crop sell signal.
CLICK HERE TO VIEW
Jan 15th: 🌽 🌱
Corn & beans hedge alert/sell signal.
Jan 2nd: 🐮
Cattle hedge alert at new all-time highs & target.
Dec 11th: 🌽
Corn sell signal at $4.51 200-day MA
CLICK HERE TO VIEW
Oct 2nd: 🌾
Wheat sell signal at $6.12 target
Sep 30th: 🌽
Corn protection signal at $4.23-26
Sep 27th: 🌱
Soybean sell & protection signal at $10.65
Sep 13th: 🌾
Wheat sell signal at $5.98
May 22nd: 🌾
Wheat sell signal when wheat traded +$7.00
Want to Talk?
Our phones are open 24/7 for you guys if you ever need anything or want to discuss your operation.
Hedge Account
Interested in a hedge account? Use the link below to set up an account or shoot Jeremey a call at (605)295-3100.
TRUMP WANTS LOWER BEEF & CHINA DEAL
AUDIO COMMENTARY
Trump wants to lower beef prices
Why not have puts at all-time highs?
Don’t be completely exposed in cattle
Trump says China tariffs won’t last
Trump will meet with China
Corn needs above $4.23 (chart below)*
Wheat possibly turning around (chart below)*
I still think wheat is a steal down here
Gap lower and limit down in cattle
Sounds like won’t have Nov USDA report
What happens if we don’t have an idea of where yield is at until January?
Demand feels really strong
Options cheap for protection or re-owning
If you have corn on DP
Being careful with certain elevator tools
If you’re upset with locked in basis
If a buyer is trying to get you on a basis contract
Have a plan for basis contracts
Cattle, corn, & wheat charts below*
Listen to today’s audio below
Want to talk? (605)295-3100
Your free trial has ended
Miss our harvest sale?
Here is extended access. Subscribe so you don’t miss out on future updates or our next sell signal.
CHARTS
Dec Corn 🌽
Still not out of the woods just yet.
We have not closed above the 61.8% retracement of this sell off yet, rejecting there back to back days now.
If we close above, most of the time it would suggest we are headed higher.
Big spot to break above.

Nov Feeder 🐮
We hit that target zone.
We now have a gap from today’s gap lower.
A standard correction would take us to that blue box. 50-61.8% of the recent rally.
The 50-day MA and wedge resistance (now possible support) also sit right in that box as well.
We don’t have to go that low, but that will be a point of interest if we get there.
Dec Live 🐮
Tapped the golden fib yesterday.
Unlike feeder, we filled that gap. So we do not have one.
Point of interest is the blue box.
It is the golden zone, the 50-day and previous point of break out (trendline) also sit right there.

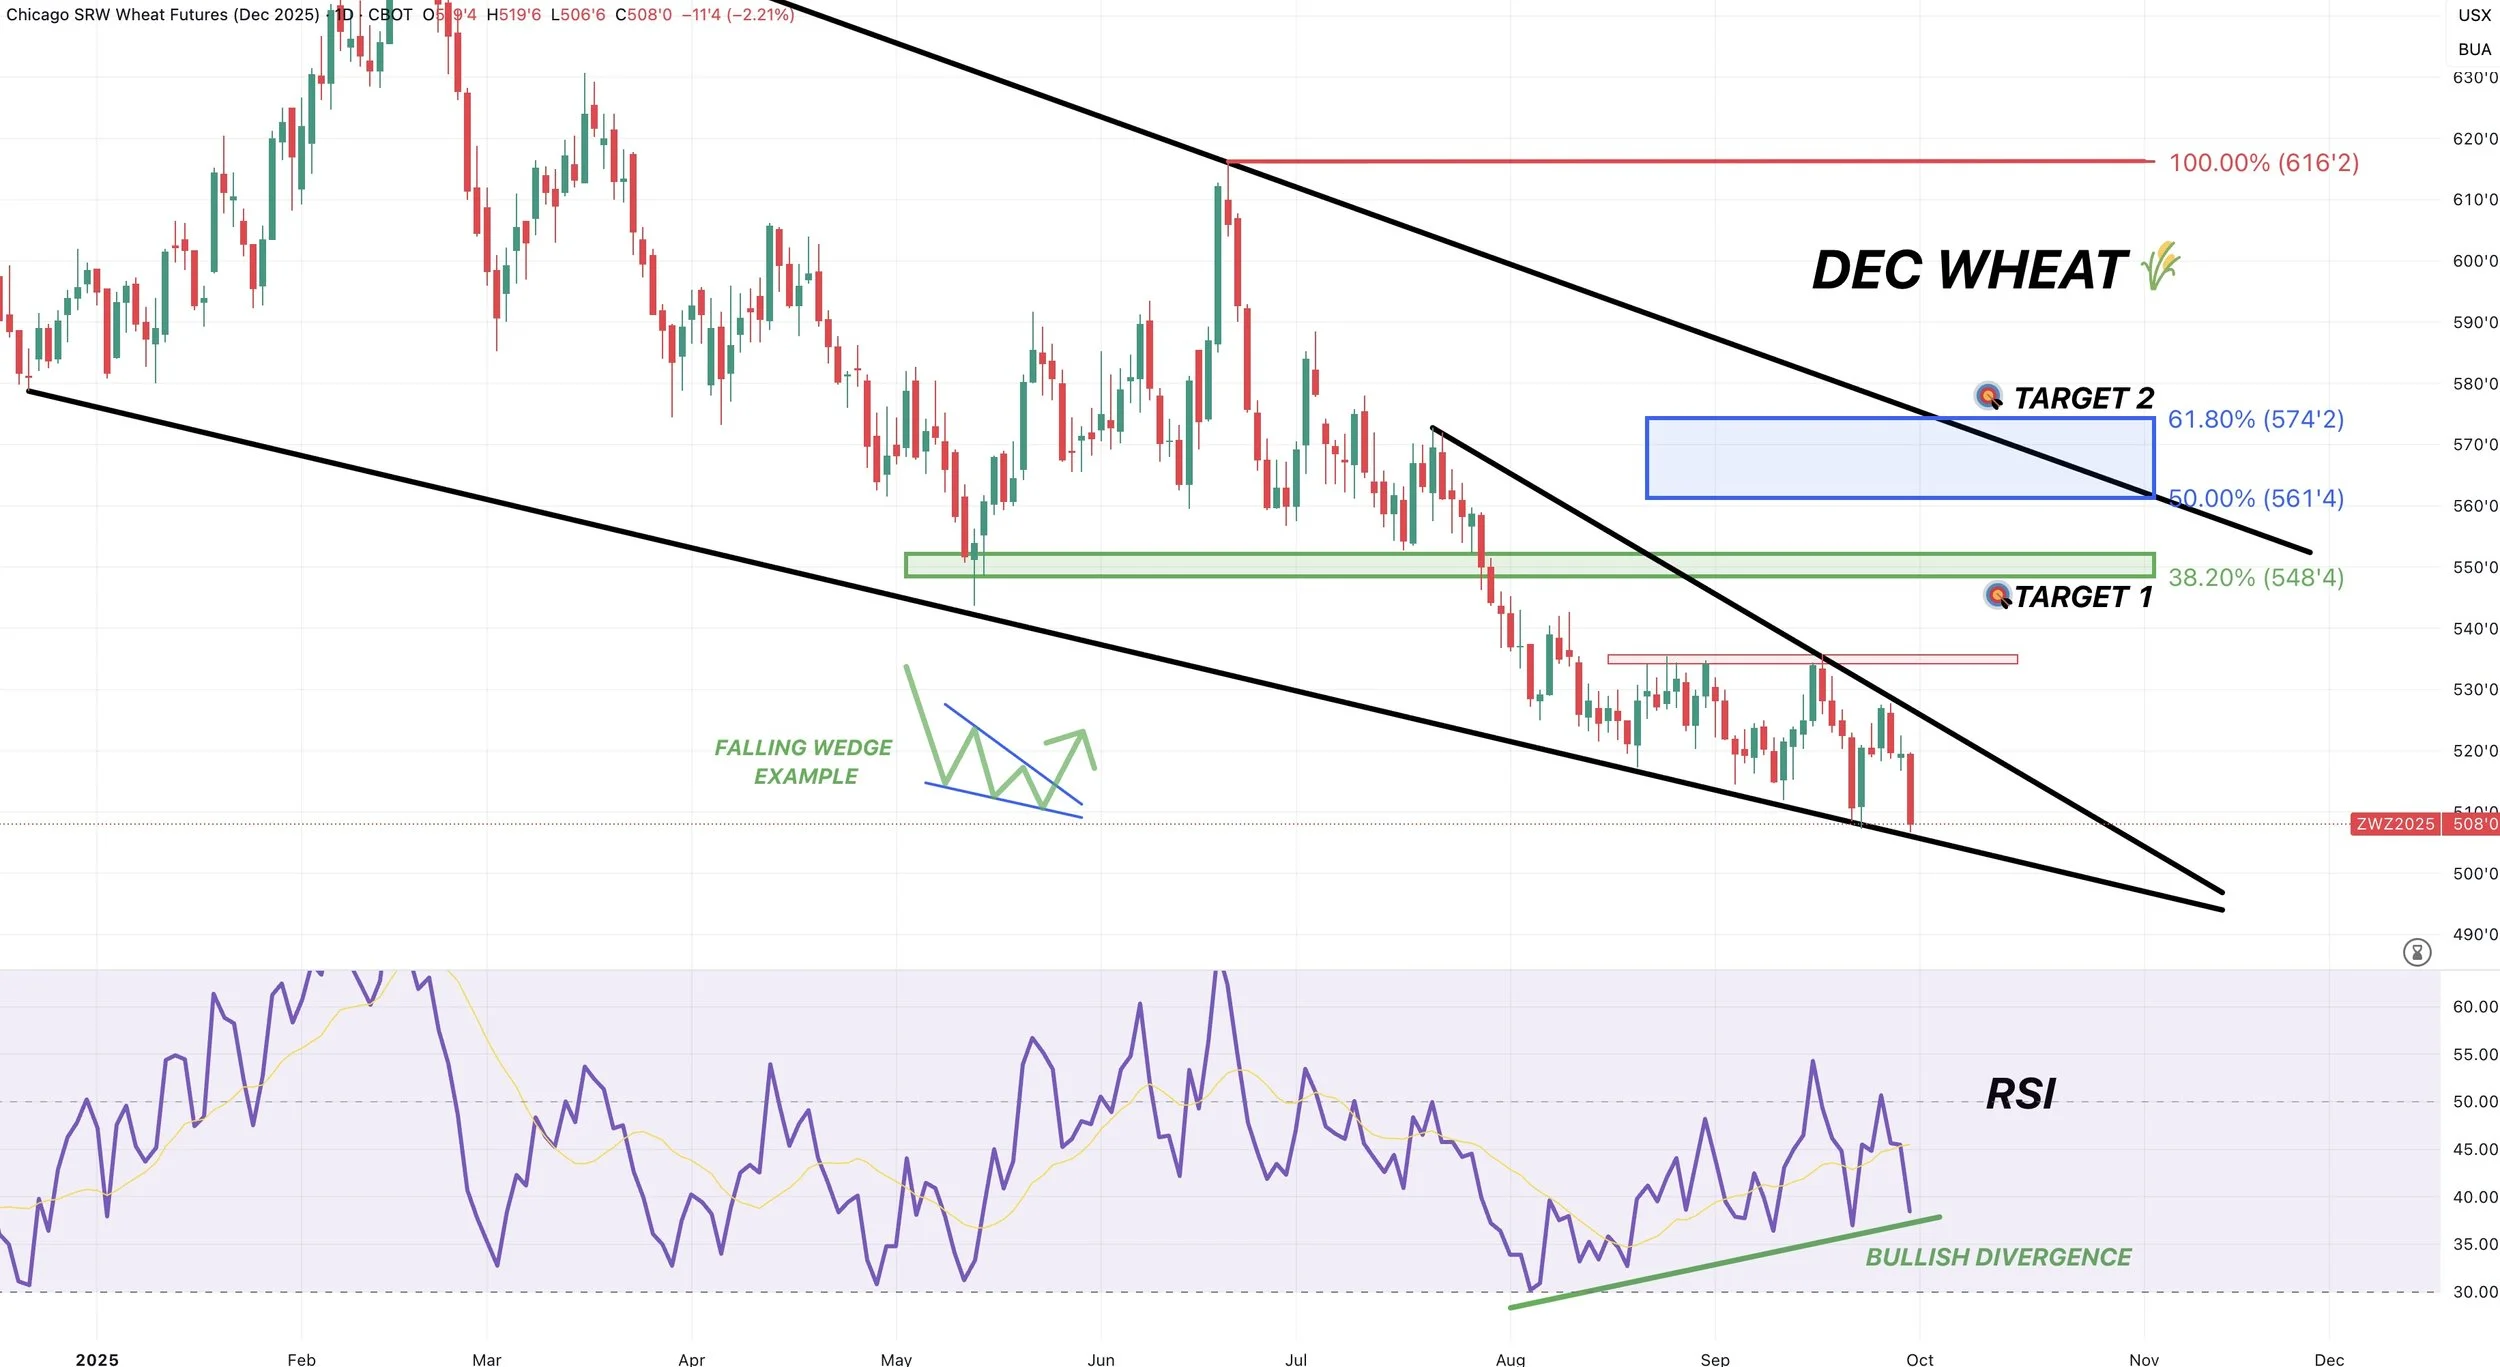
Dec Wheat 🌾
Wheat looks pretty good here.
On the verge of a potential breakout, but no confirmation yet. Fingers crossed.
If we break out, I think we have at least roughly 40 cents higher.

Past Sell or Protection Signals
Oct 13th: 🐮
Cattle sell signal & hedge alert.
Aug 22nd: 🌱
Soybean sell signal & hedge alert.
July 31st: 🐮
Cattle sell signal & hedge alert.
July 10th: 🐮
Cattle sell signal & hedge alert.
CLICK HERE TO VIEW
June 5th: 🐮
Cattle sell signal & hedge alert.
June 2nd: 🌾
MPLS wheat sell signal.
April 10th: 🌽
Old crop corn sell signal.
March 19th: 🐮
Cattle hedge & sell signal.
Feb 18th: 🌽 🌾
Old crop KC wheat & old crop corn signal.
Jan 23rd: 🌽 🌱
Corn & beans old crop sell signal.
CLICK HERE TO VIEW
Jan 15th: 🌽 🌱
Corn & beans hedge alert/sell signal.
Jan 2nd: 🐮
Cattle hedge alert at new all-time highs & target.
Dec 11th: 🌽
Corn sell signal at $4.51 200-day MA
CLICK HERE TO VIEW
Oct 2nd: 🌾
Wheat sell signal at $6.12 target
Sep 30th: 🌽
Corn protection signal at $4.23-26
Sep 27th: 🌱
Soybean sell & protection signal at $10.65
Sep 13th: 🌾
Wheat sell signal at $5.98
May 22nd: 🌾
Wheat sell signal when wheat traded +$7.00
Want to Talk?
Our phones are open 24/7 for you guys if you ever need anything or want to discuss your operation.
Hedge Account
Interested in a hedge account? Use the link below to set up an account or shoot Jeremey a call at (605)295-3100.
TRUMP & CHINA BLOOD BATH
AUDIO COMMENTARY
Blood bath in grains & stocks
Cattle showing strength amidst weakness
Trump says he will cancel China meeting
Grains still flying blind with shutdown
Wheat struggles to find catalyst
Feeder cattle reached target (chart below)*
Like having hedges on cattle up here & rolling up puts
How to capture the cattle rally with puts
How to manage margin risk in cattle
You have to be proactive in soybeans
You have to have a plan if we don’t get trade deal
Spreads & basis been firming
Wheat will take off eventually, it just might not be when you want it to
Soybeans reject exactly off 61.8% (chart below)*
What to do if you know you have to deliver
If you want to capture the carry
Why you want a hedge account vs an elevator when aiming to capture the carry
Biggest weather bet ever on Brazil this year
Listen to today’s audio below
Want to talk? (605)295-3100
Harvest sale ends tomorrow
Your free trial has ended
Take advantage of this offer if you’d like to keep receiving our updates & our next sell signal
CATTLE & SOYBEAN CHART
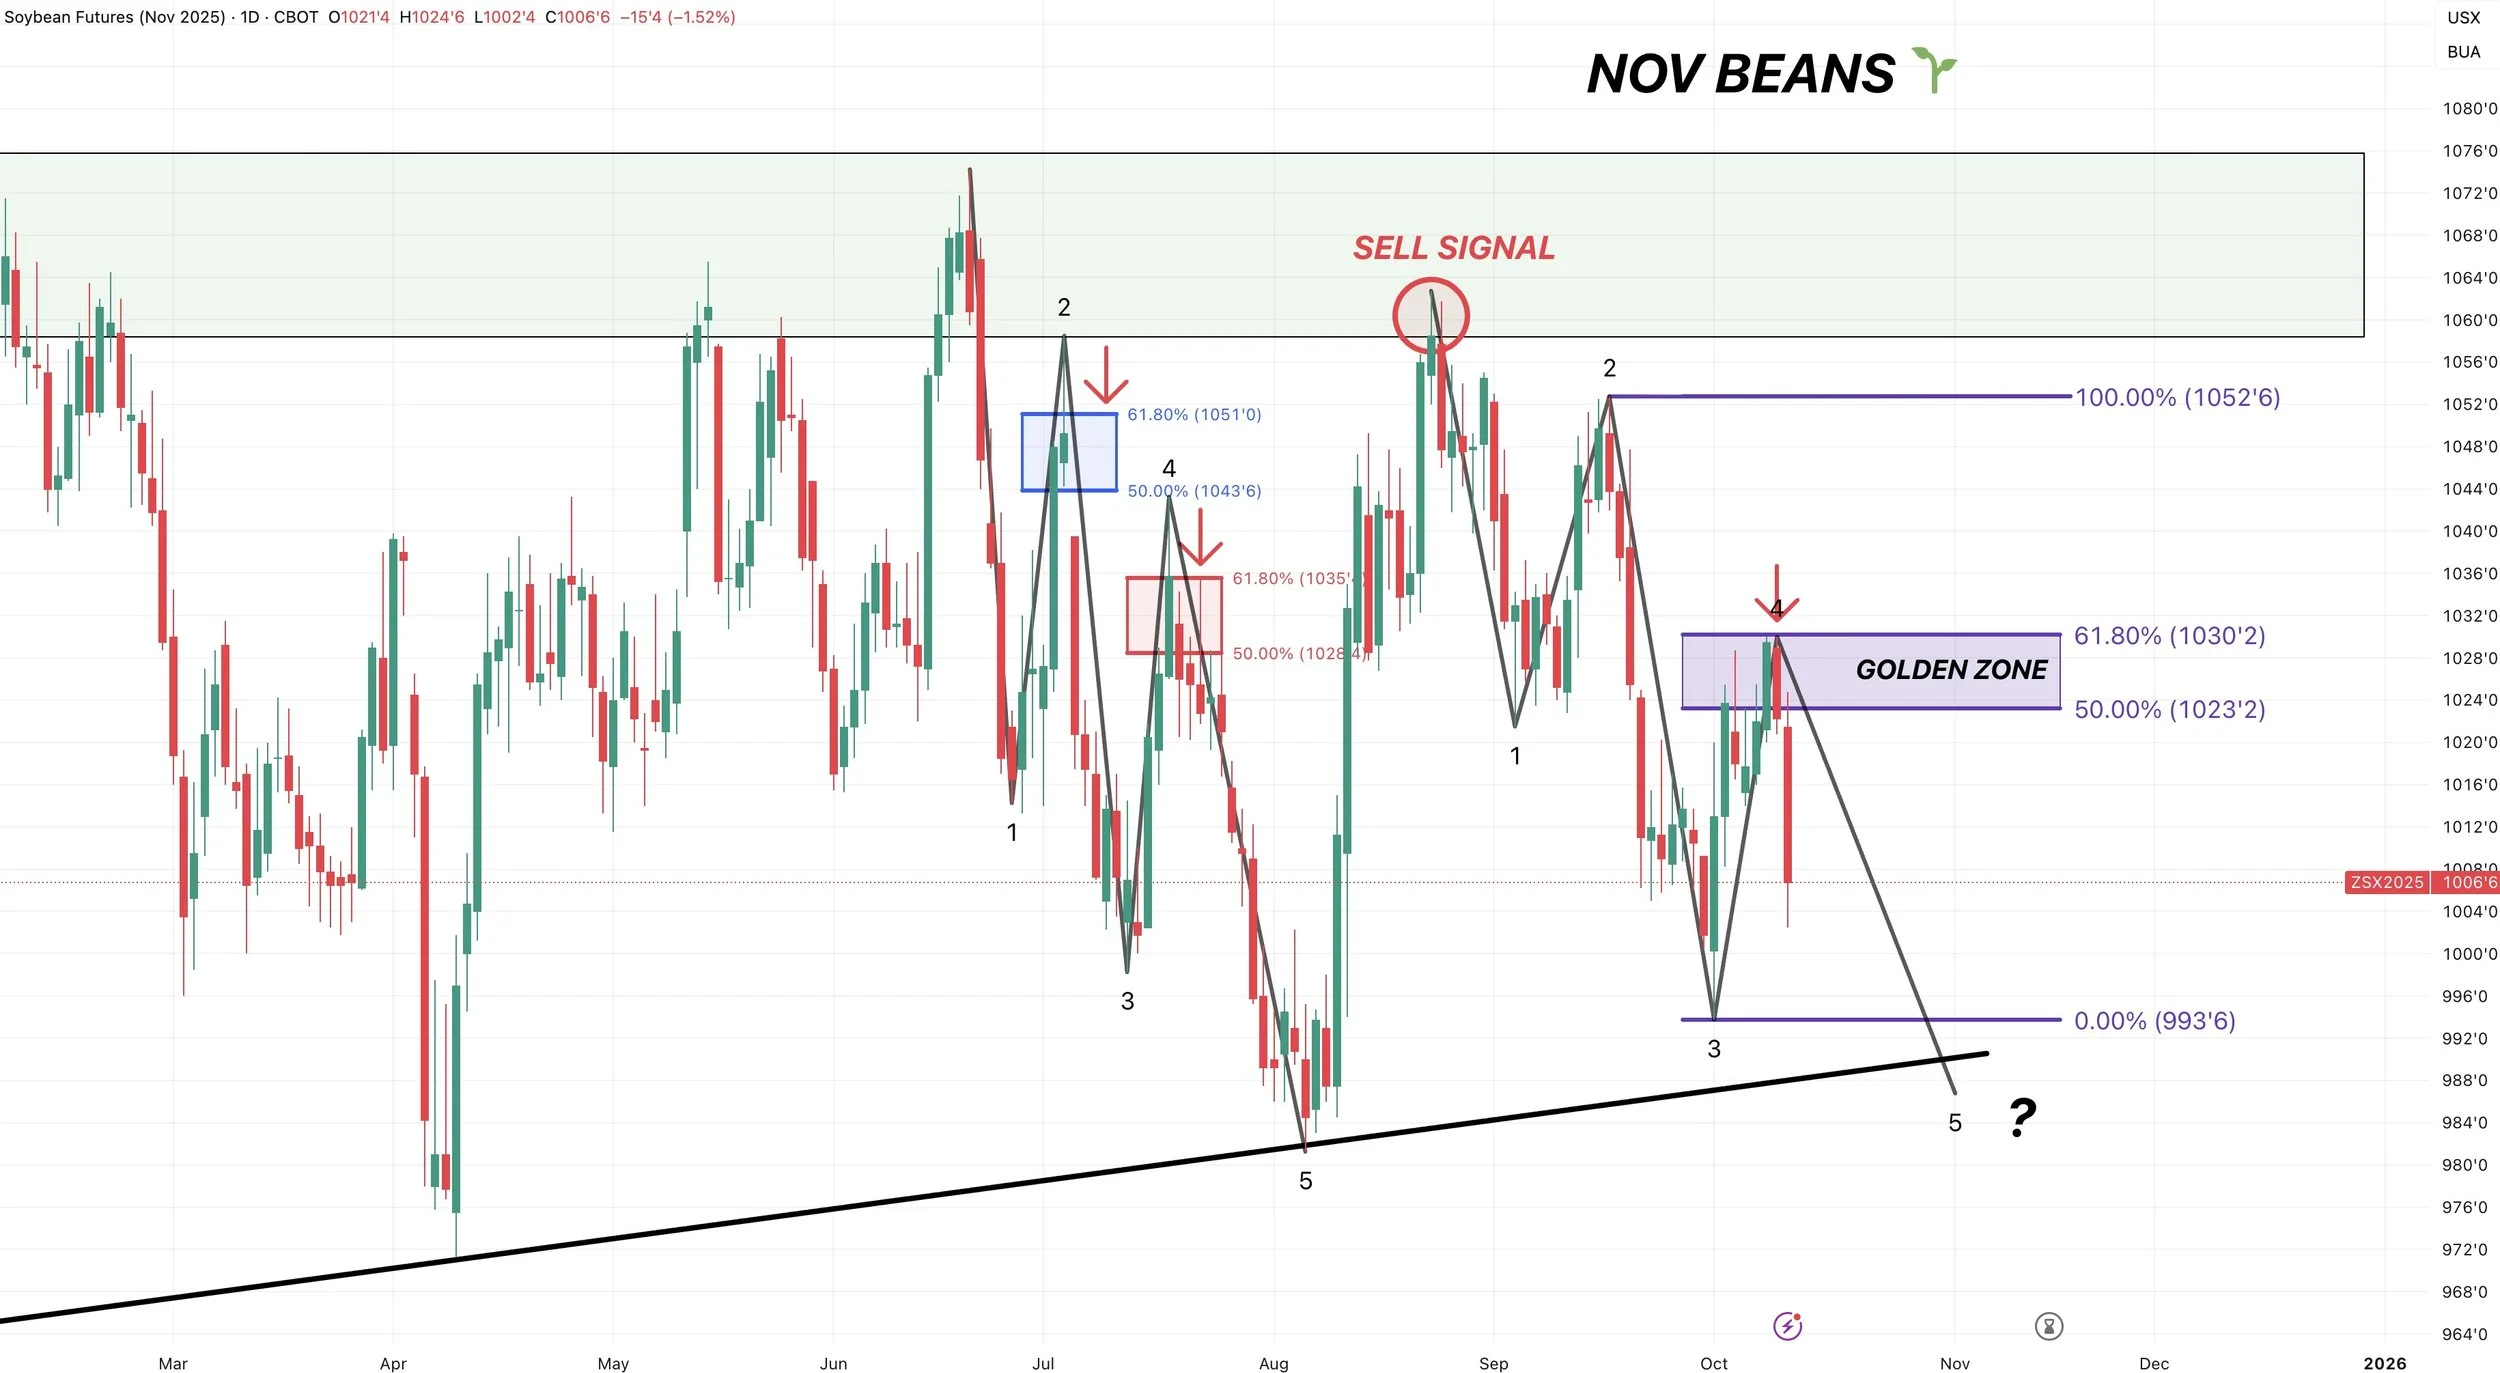
Nov Beans 🌱
We failed exactly at that critical spot we’ve been talking about for a few weeks.
We reclaimed 61.8% of the sell off before rejecting hard.
This is the most common spot for a relief bounce to end.
Both the summer bounced failed at this same level before heading lower.
Risk is lower until we break above the purple box.
Honestly, I wouldn’t be surprised if we went and posted one final leg lower, but doesn’t have to happen.
This is why one last leg lower would not surprise me. I’ve been showing this chart for a while as well.
The summer sell off featured a 5 wave move.
Up until two days ago, we only had 4 waves.
So we could definitely see that 5 wave make a new low.
Again, this doesn’t “have” to happen. But it’s definitely possible.
Nov Feeder 🐮
We almost touched that target at 377. Right up against it.
This is the golden fib from the bottom of the pennatn up to those late Sep highs.
It is a common spot for a 2nd rally to pause.
Will share target #2 if we break above this one.
Dec Live 🐮
Live finally followed feeders and got a breakout.
The chart looks pretty solid here. We did not post new ATHs but posted a new high close.
Since we got the breakout, we could potentially go and post new highs.
If we do, one target I have is the golden fib at 248.
Past Sell or Protection Signals
Aug 22nd: 🌱
Soybean sell signal & hedge alert.
July 31st: 🐮
Cattle sell signal & hedge alert.
July 10th: 🐮
Cattle sell signal & hedge alert.
CLICK HERE TO VIEW
June 5th: 🐮
Cattle sell signal & hedge alert.
June 2nd: 🌾
MPLS wheat sell signal.
April 10th: 🌽
Old crop corn sell signal.
March 19th: 🐮
Cattle hedge & sell signal.
Feb 18th: 🌽 🌾
Old crop KC wheat & old crop corn signal.
Jan 23rd: 🌽 🌱
Corn & beans old crop sell signal.
CLICK HERE TO VIEW
Jan 15th: 🌽 🌱
Corn & beans hedge alert/sell signal.
Jan 2nd: 🐮
Cattle hedge alert at new all-time highs & target.
Dec 11th: 🌽
Corn sell signal at $4.51 200-day MA
CLICK HERE TO VIEW
Oct 2nd: 🌾
Wheat sell signal at $6.12 target
Sep 30th: 🌽
Corn protection signal at $4.23-26
Sep 27th: 🌱
Soybean sell & protection signal at $10.65
Sep 13th: 🌾
Wheat sell signal at $5.98
May 22nd: 🌾
Wheat sell signal when wheat traded +$7.00
Want to Talk?
Our phones are open 24/7 for you guys if you ever need anything or want to discuss your operation.
Hedge Account
Interested in a hedge account? Use the link below to set up an account or shoot Jeremey a call at (605)295-3100.
SPECIFIC SITUATIONS YOU MIGHT BE IN
AUDIO COMMENTARY
Cattle new all-time high (target below audio)*
Live cattle haven’t broke out yet (chart below)*
What to do with cattle
Divergence between feeder & live cattle
Money wants to keep flowing in stocks & cattle
Don’t short cattle, hedge cattle
Flying blind on data in grain markets
Beans at major decision point (chart below)*
Wheat still coiling in wedge (chart below)*
I am waiting for a rally in wheat. Usually, every 3-4 months wheat provides an opportunity
Specific situations you might be in
If you have soybeans that you have to haul because yields are better than expected, just don’t strike out. Spread out that risk. Don’t chase home runs
What to do if you don’t have any storage
What to do if you have excess bushels
Should you be re-owning corn? If so, how?
What to do if you are forced to sell your corn
Why you should spread your risk out
Cattle, beans & wheat charts below audio*
Listen to today’s audio below
Want to talk? (605)295-3100
Harvest sale ends this weekend
Your free trial has ended
Starting next week you will not get future updates or our next signal.
CHART BREAKDOWNS
Nov Beans 🌱
We are RIGHT at the decision point.
This is where we find out if this bounce is simply a relief bounce, or the start of a larger rally.
If we are going to reject, it should be here.
If we close above the purple box, more often than not it would be an indication we are headed higher.
The top of the purple box reclaims 61.8% of the sell off. The most common spot for a relief bounce to reject.
So we should know soon what decision the market makes.
Nov Feeder 🐮
We broke out of this bullish pennant pattern we have been talking about.
Posting fresh all-time highs.
We continue to find life at the 50-day MA. It’s been an absolute floor the entire bull run.
The 50-day MA is going to be your warning sign this market is ready to roll over. Until then, you can’t help but lean higher.
The golden fib is at 377. I think that’s a reasonable target.
The golden fib equals 161.8% of the rally we saw from the bottom of the pennant to that late Sep top. I outlined this with the gray lines.
If we hit there, I think that will be a great opportunity to de-risk.

Dec Live 🐮
Live cattle is different than feeder.
We have not broken out of this recent downtrend yet.
If we break out, it should result in all-time highs like we saw in feeder.
Just like feeder, the warning sign is going to be the 50-day MA. If that ever breaks it could cause the flood gates to open much lower.

Dec Wheat 🌾
We are still coiling in this falling wedge.
Personally my bias still leans towards a break out.
If the break out comes, I think we should have room to run to $5.45
It hasn’t mattered yet, but we’ve been printing bullish divergence since August.
Prices are making new lows.
The RSI is not.
A sign downside momentum is getting weaker.

Past Sell or Protection Signals
Aug 22nd: 🌱
Soybean sell signal & hedge alert.
July 31st: 🐮
Cattle sell signal & hedge alert.
July 10th: 🐮
Cattle sell signal & hedge alert.
CLICK HERE TO VIEW
June 5th: 🐮
Cattle sell signal & hedge alert.
June 2nd: 🌾
MPLS wheat sell signal.
April 10th: 🌽
Old crop corn sell signal.
March 19th: 🐮
Cattle hedge & sell signal.
Feb 18th: 🌽 🌾
Old crop KC wheat & old crop corn signal.
Jan 23rd: 🌽 🌱
Corn & beans old crop sell signal.
CLICK HERE TO VIEW
Jan 15th: 🌽 🌱
Corn & beans hedge alert/sell signal.
Jan 2nd: 🐮
Cattle hedge alert at new all-time highs & target.
Dec 11th: 🌽
Corn sell signal at $4.51 200-day MA
CLICK HERE TO VIEW
Oct 2nd: 🌾
Wheat sell signal at $6.12 target
Sep 30th: 🌽
Corn protection signal at $4.23-26
Sep 27th: 🌱
Soybean sell & protection signal at $10.65
Sep 13th: 🌾
Wheat sell signal at $5.98
May 22nd: 🌾
Wheat sell signal when wheat traded +$7.00
Want to Talk?
Our phones are open 24/7 for you guys if you ever need anything or want to discuss your operation.
Hedge Account
Interested in a hedge account? Use the link below to set up an account or shoot Jeremey a call at (605)295-3100.
CORN SITUATION & CATTLE BREAK OUT?
MARKET UPDATE
You can scroll to read the usual update as well. As the written version is the exact same as the video.
Timestamps for video:
Overview: 0:00min
Corn: 1:25min
Bean: 5:35min
Wheat: 9:25min
Cattle: 10:40min
Want to talk about your situation?
(605)295-3100
Our harvest offer ends soon
Your free trial has ended.
This is the last week you'll receive our updates.
You will not get our next signal.
Lock in our harvest sale so you’re prepared for the next opportunity.
Futures Prices Close
Overview
Grains mixed with soybeans leading the way higher on optimism of trade aid, while the wheat market leads the way lower.
Meanwhile, the cattle market bounces right at some crucial support off the back of screwworm news and no trade deal between Brazil and the US.
Thursday was supposed to be the October USDA report. That is not happening.
This is now day 7 of the government shutdown.
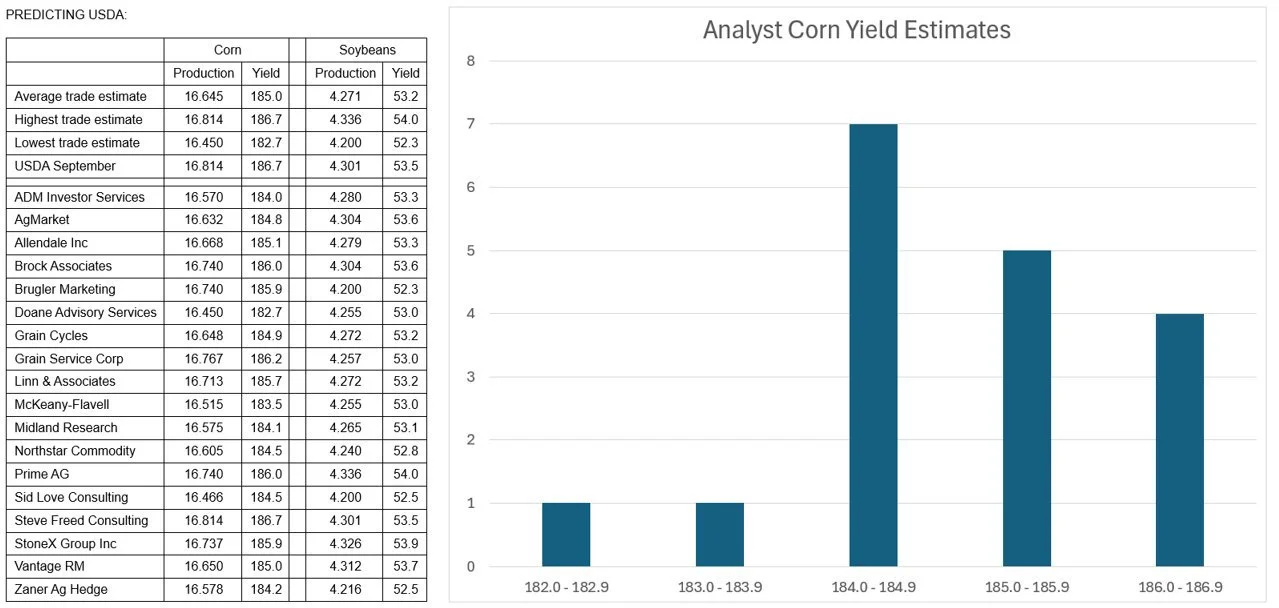
However, despite there not being a report. The analysts still provided their estimates for the report.
Corn Yield: 185 (186.7 in Sep)
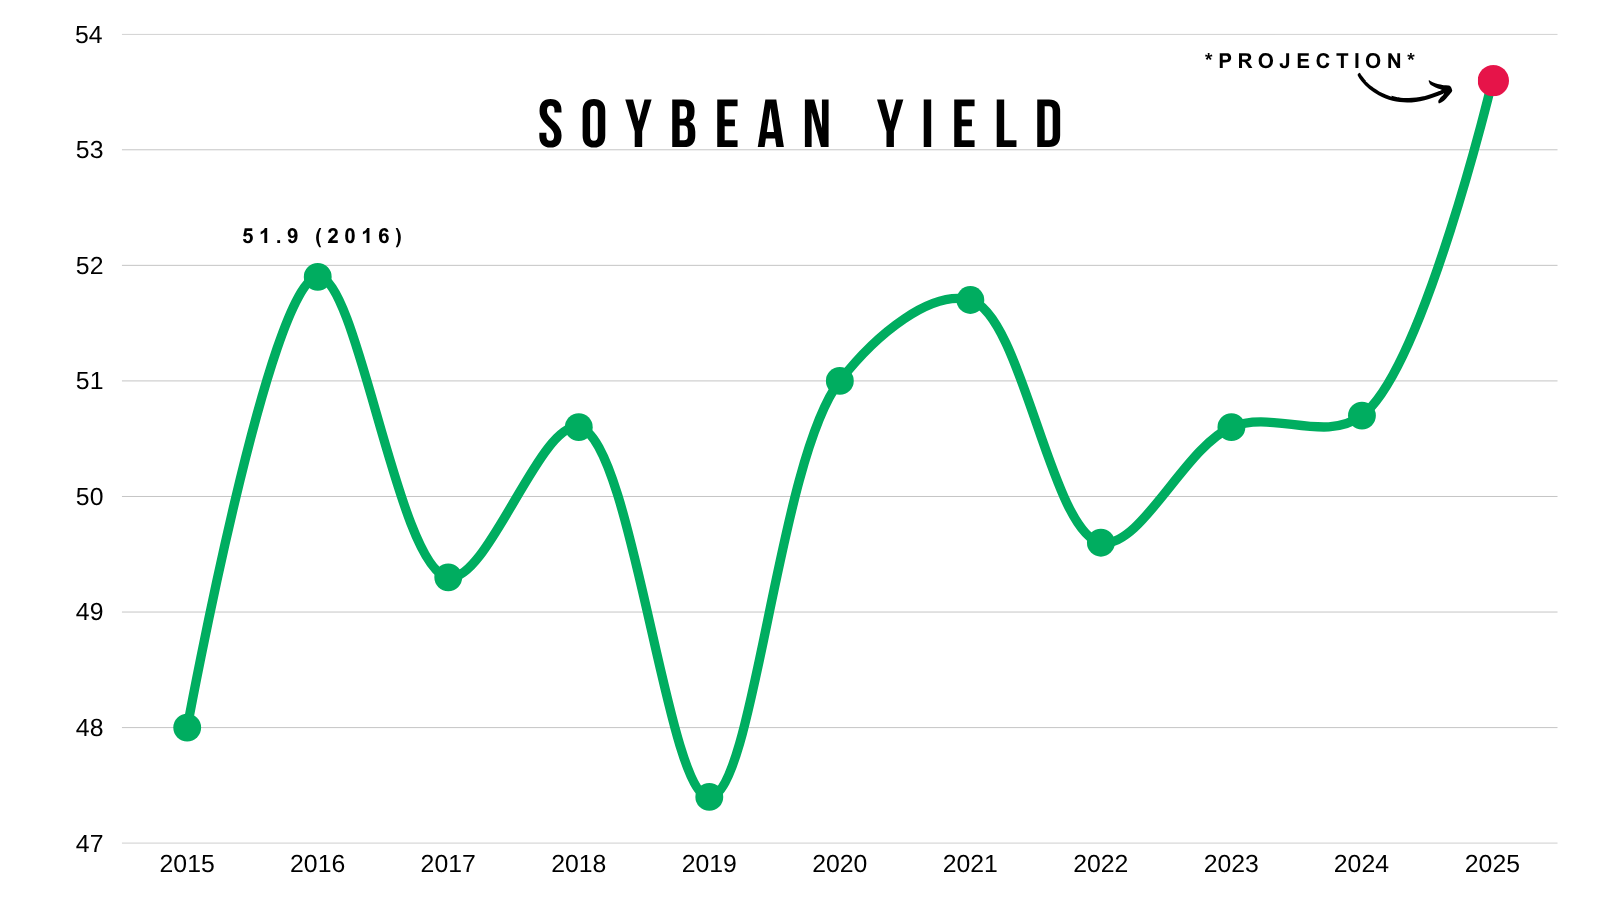
Bean Yield: 53.2 (53.5 in Sep)
Chart from Allendale
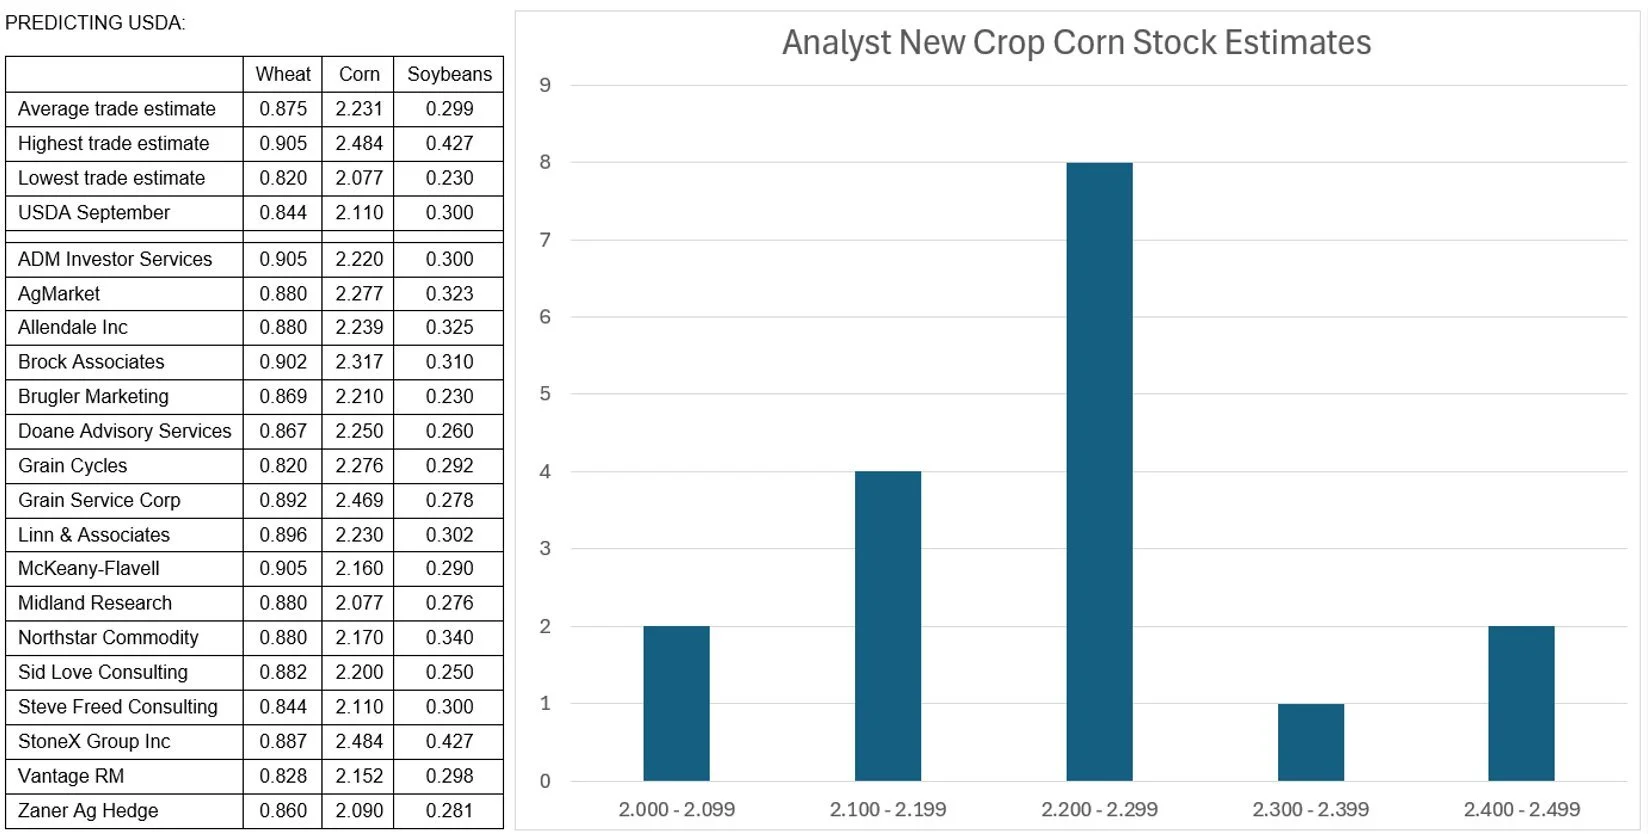
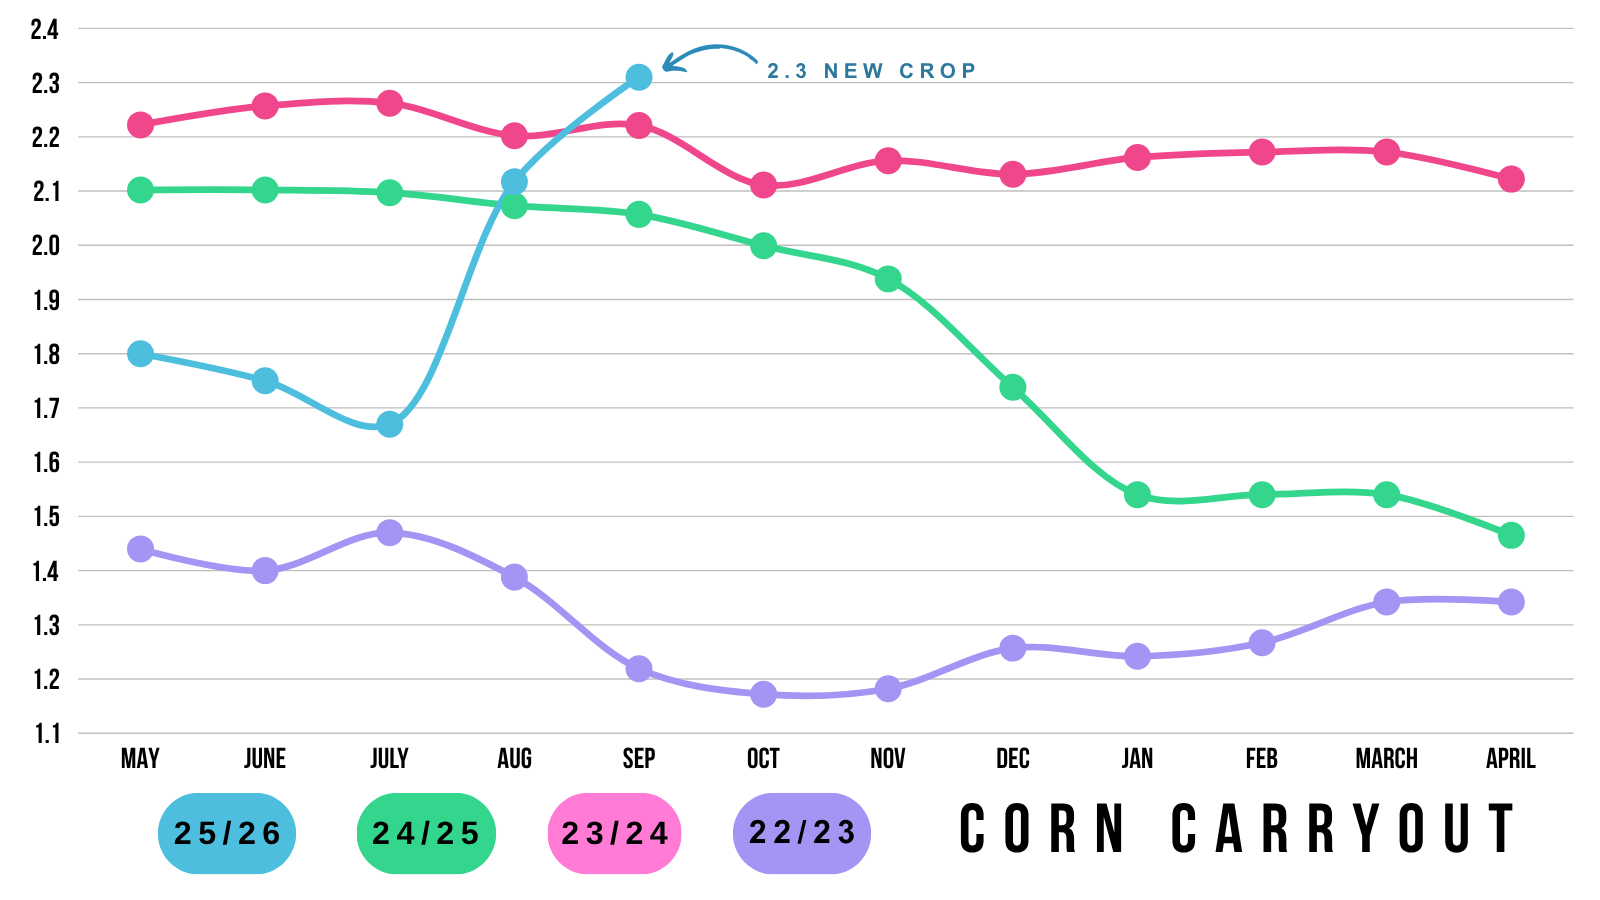
Corn Carryout: 2.231 (2.110 in Sep)
Bean Carryout: 0.299 (0.300 in Sep)
Wheat Carryout: 0.875 (0.844 in Sep)
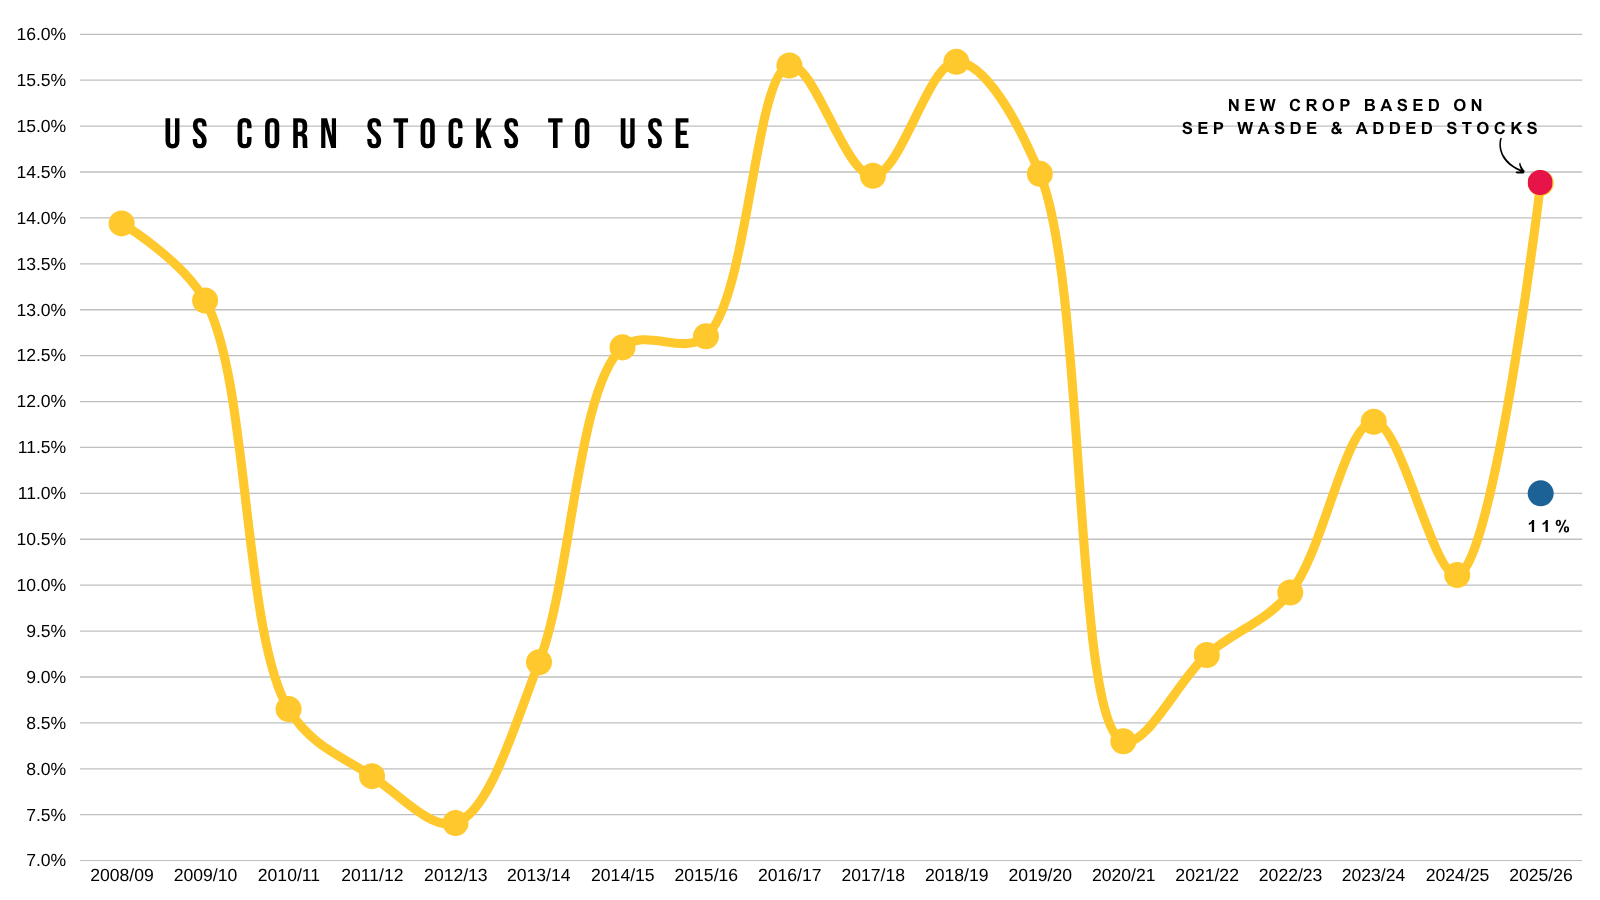
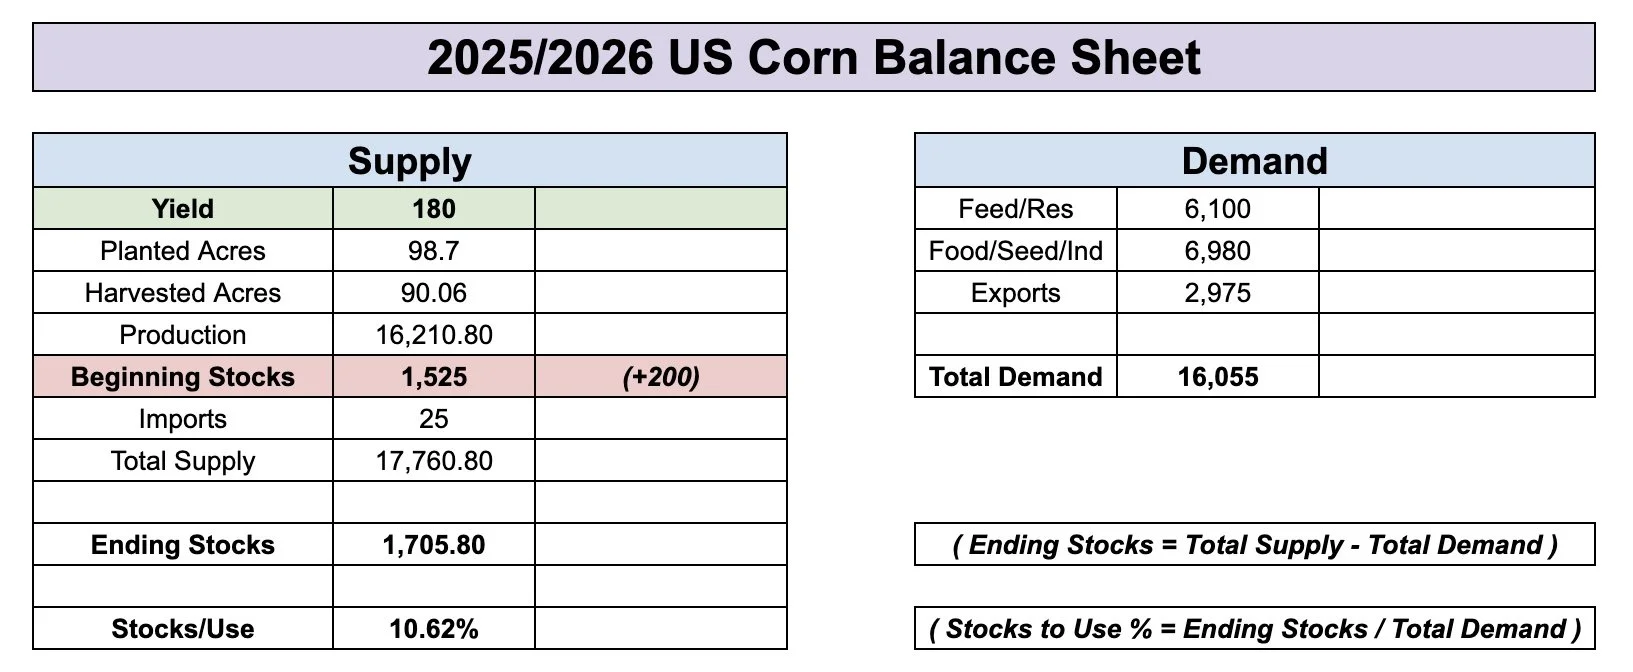
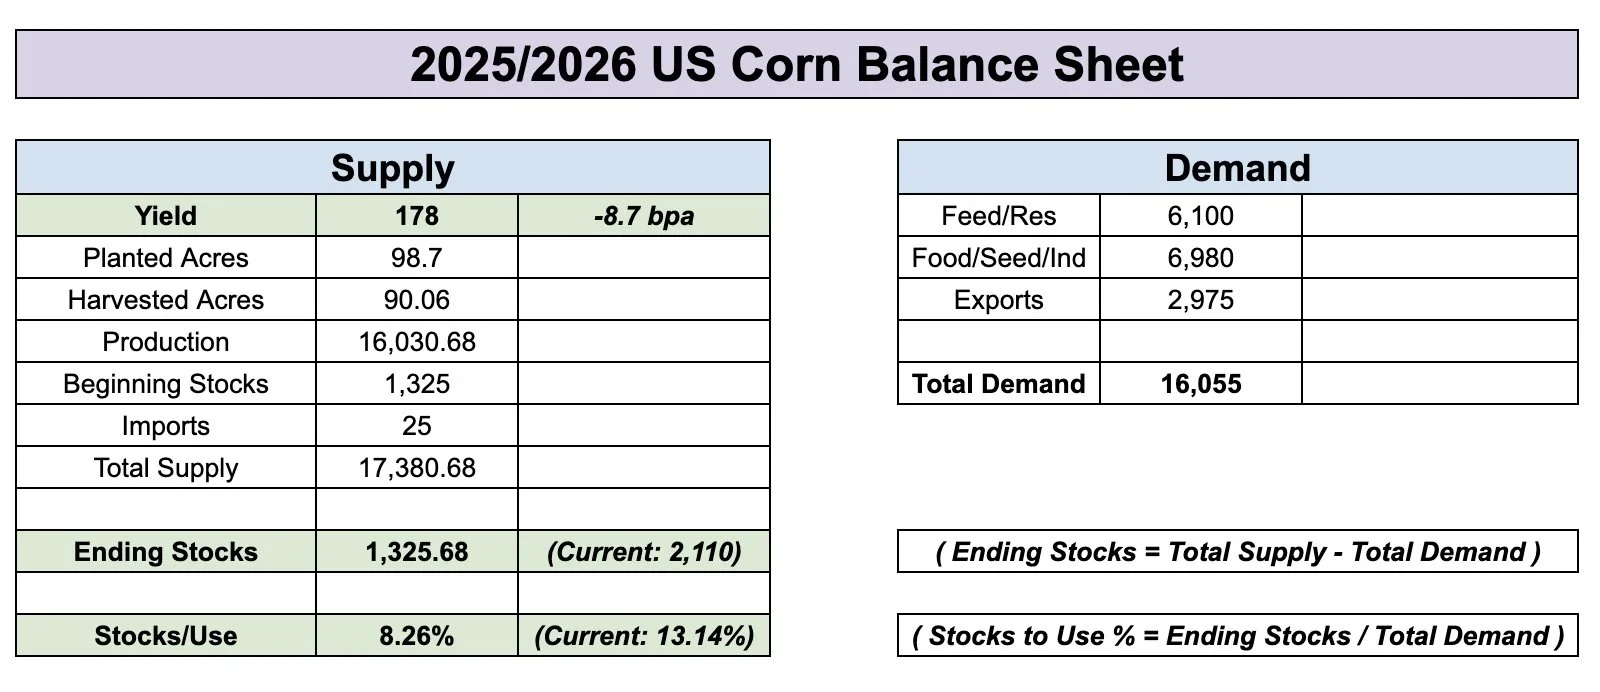
Corn stocks are projected to be higher due to that quarterly stocks report. Where the USDA was +200 million too high on their old crop feed demand numbers, which automaically got added to the new crop balance sheet in the form of beginning stocks.
Chart from Allendale
Today's Main Takeaways
Corn
Despite harvest ramping up fast, sitting around 30% complete based on the estimates. The corn market isn’t seeing any major harvest pressure.
The market is definitely aware that yield is smaller, some think it could be drastically smaller. Hence why we are hanging in there.
From a pure fundamental standpoint, you could argue corn should be heading lower.
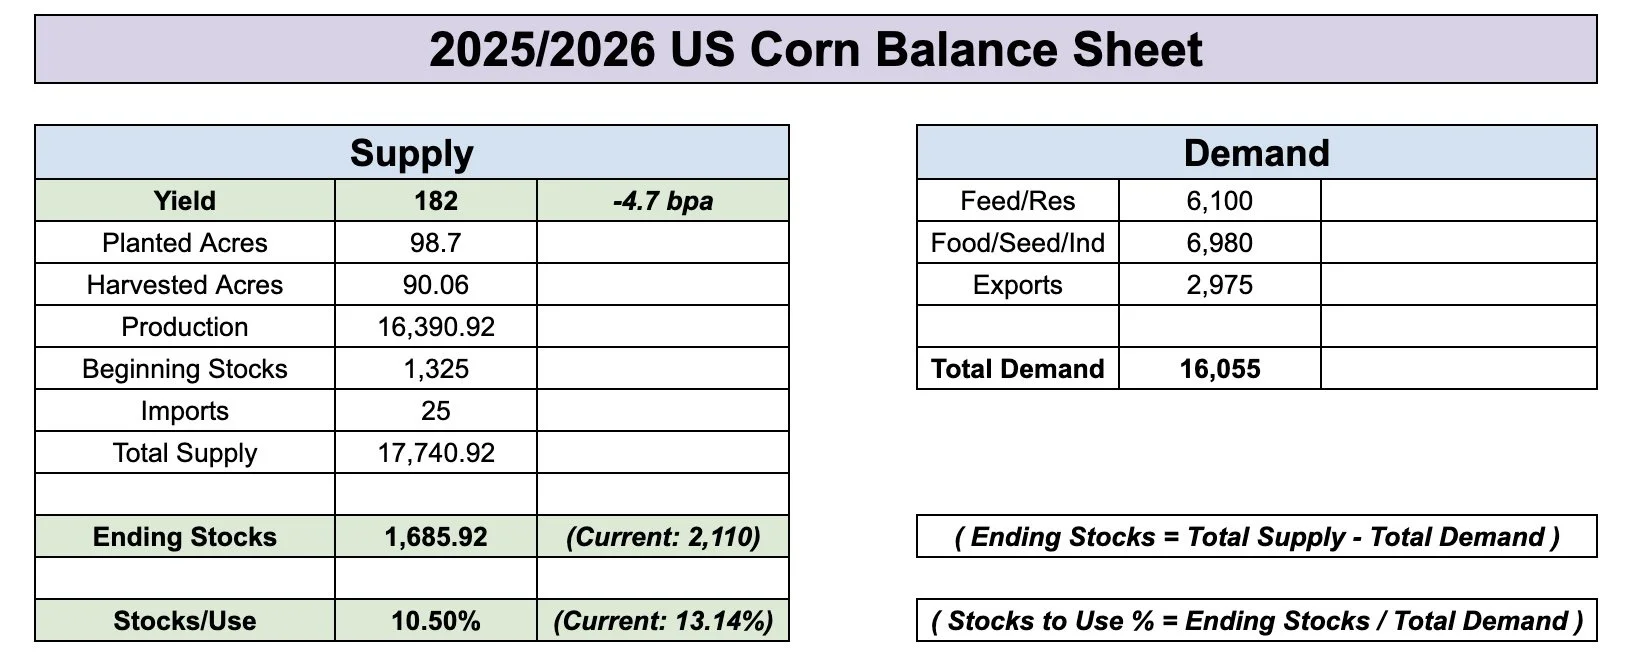
I mean we are looking at a 2.2 to 2.3 billion bu carryout.
Which would peg out stocks to use ratio at some pretty high levels.
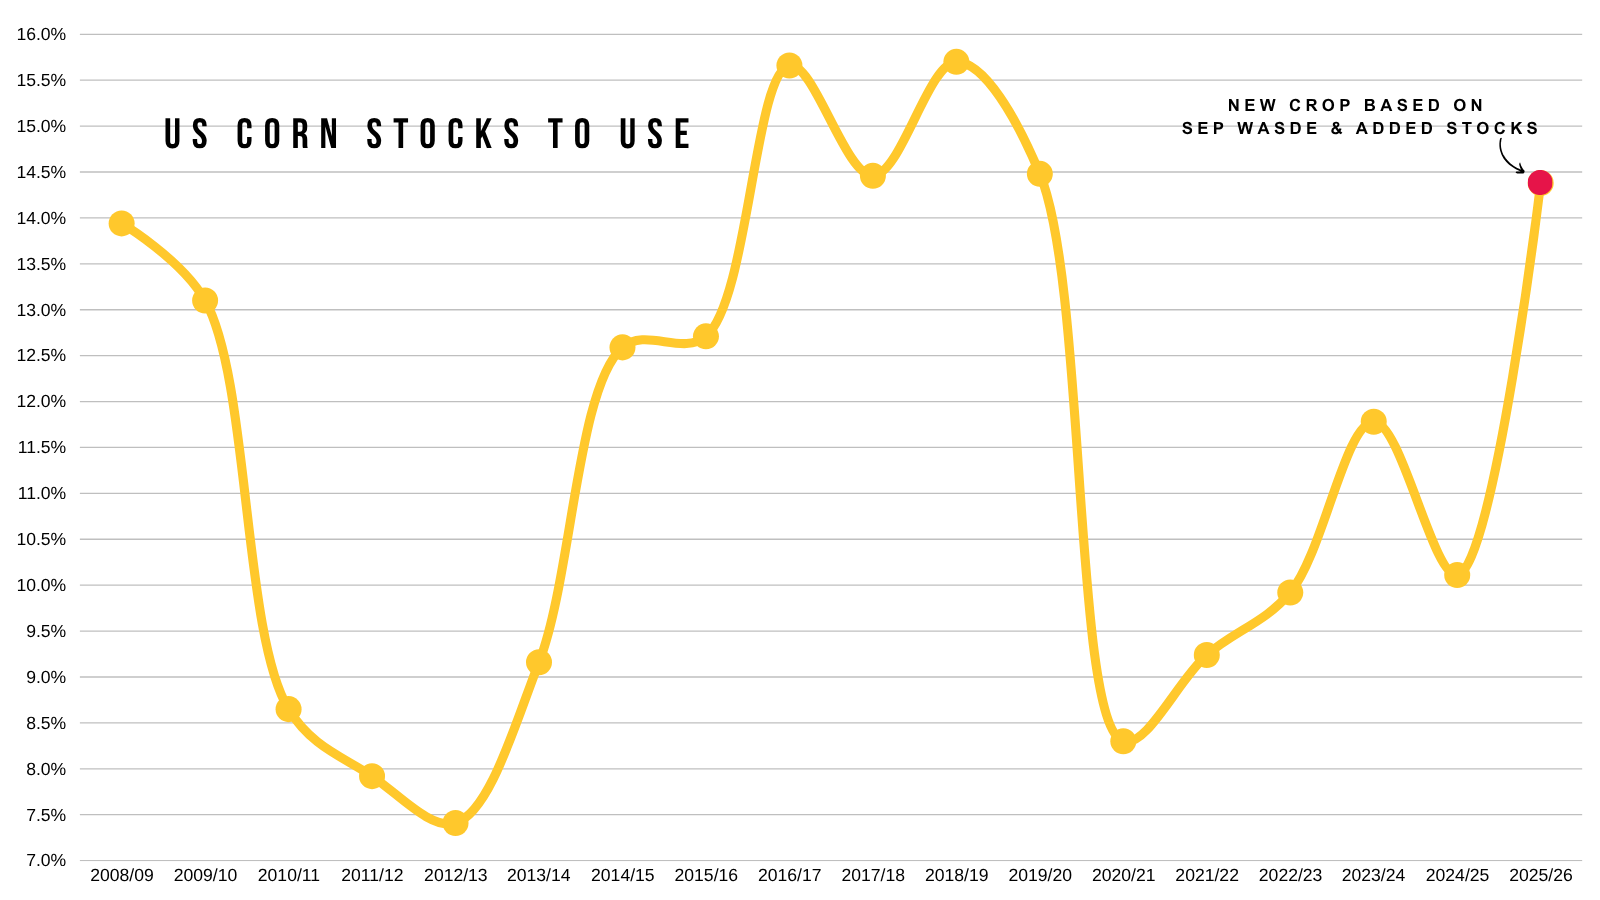
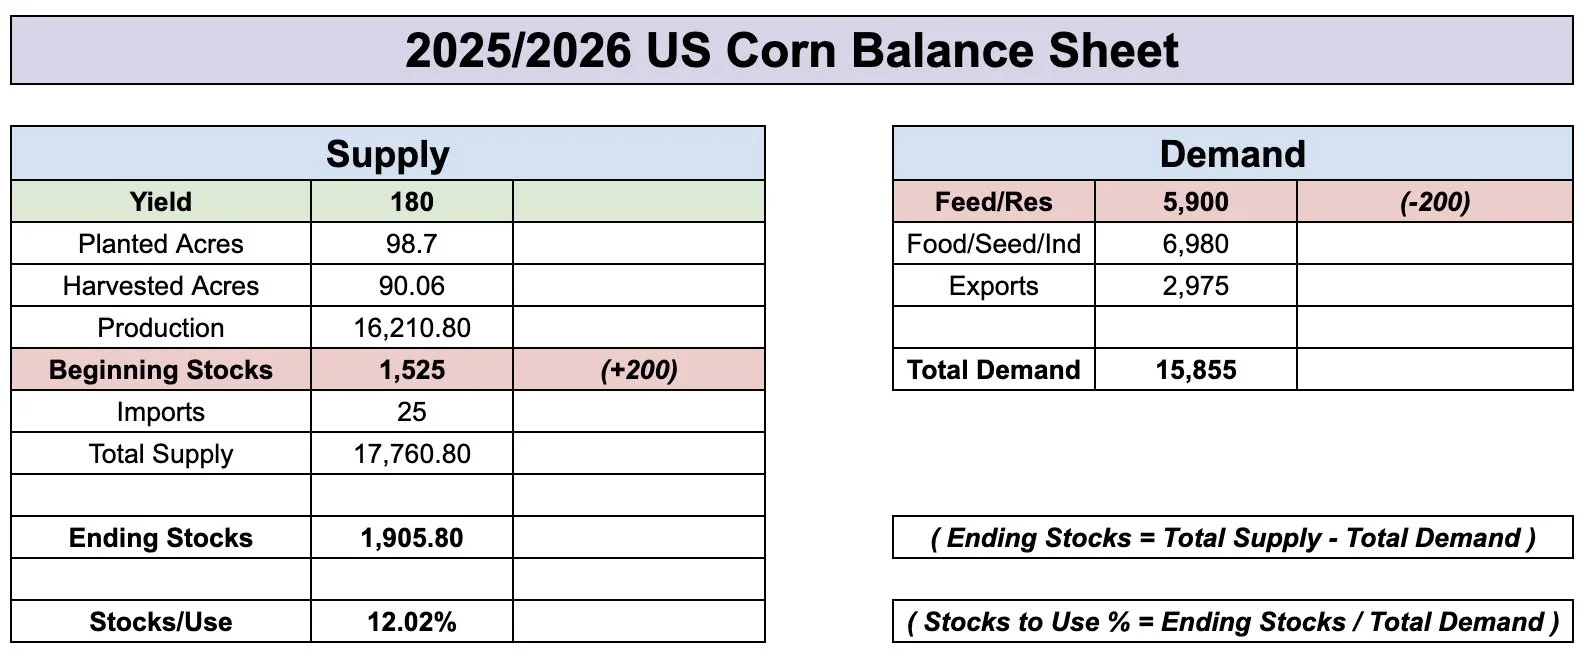
Given the extra acres, even if yield dropped to 180 and you left demand unchanged, it would still only print around an 11% stocks to use which isn’t super bearish, but it's not crazy bullish by any means either.
Here is the rough current balance sheet vs with a 180 yield and no demand changes.


Here is what that 11% would look like compared to other years.
Way less burdensome than the current projections, still not out of this world bullish.
We have to keep in mind, that even if yield falls. The USDA will also be taking feed & residual demand back which could offset some of this.
However, on the other hand. The only marketing year that saw over a +2 billion carryout over in recent memory was 2023/2024.
The 2023/2024 marketing year ran from Sep 2023 to August 2024.
If you look at prices during this time frame, we only spent a handful of weeks below $4.00.
Which was last August before we went on that run.
So the point is, does corn really have to venture below $4.00 by a wide margin if at all?
Given the record acres.. we are going to have record corn production no matter where yield comes in at.
Even if yield is 175 we are still going to have a record production number.
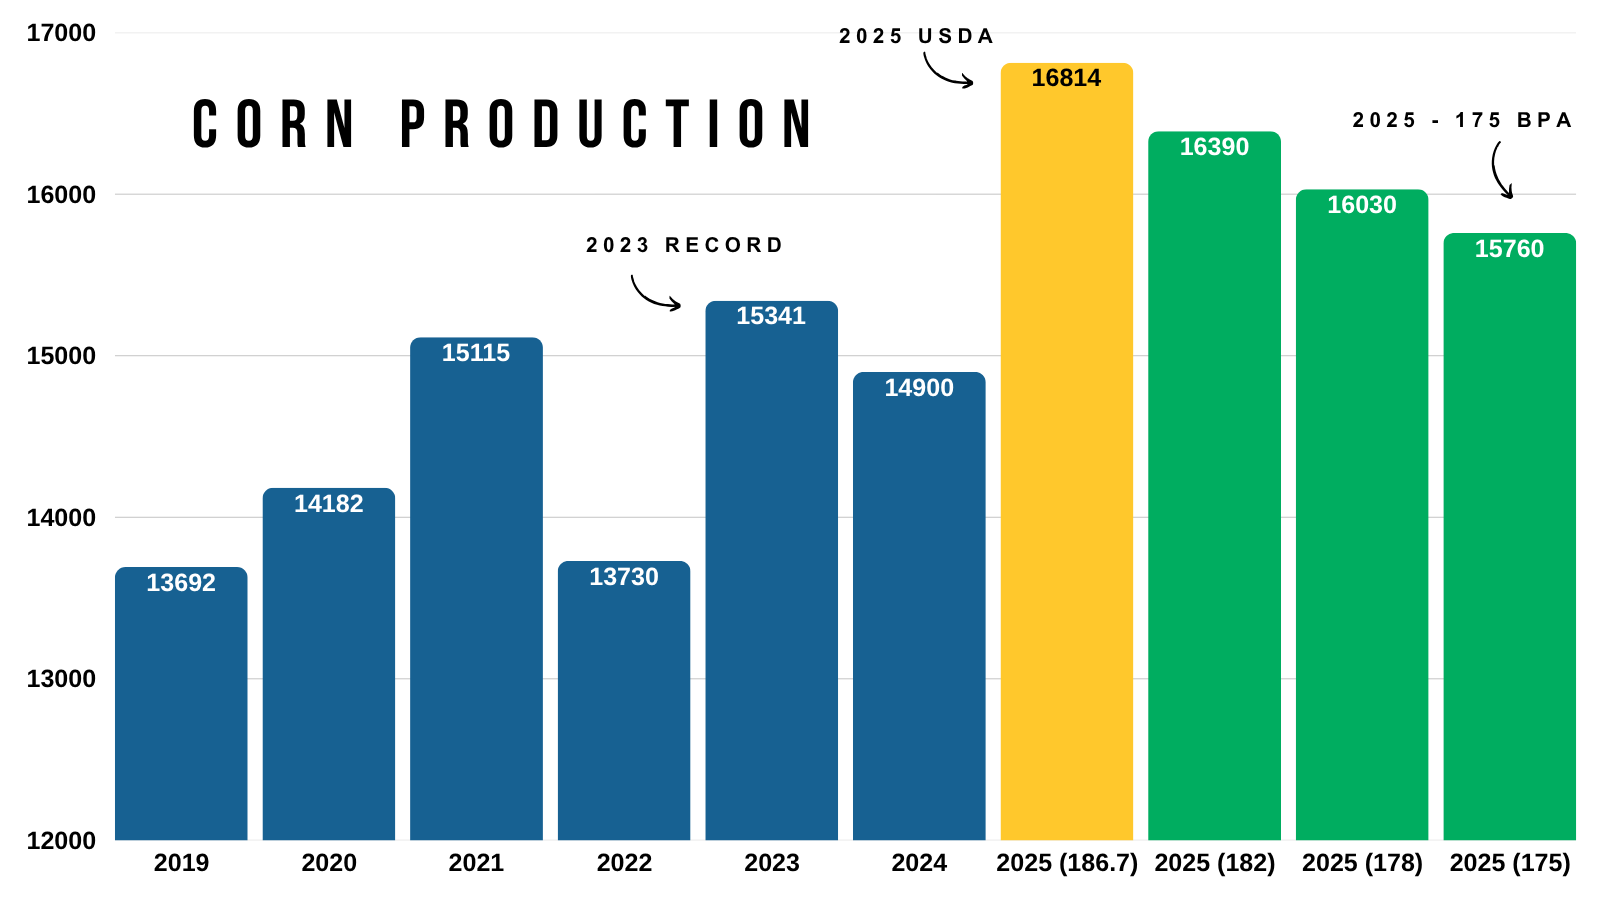
However.. we have been creating a demand monster for the last year.
2023 was our record production year.
In 2023, exports were 2,150 million bushels.
The current estimate for this year is 2,975 million.
A near 50% increase.
So we have record supply, but we also have record demand offseting that supply.
Here is a good chart from Karen Braun I showed last week.
Look at our exports compared to 2023. Up to this point, we are nearly double what we were then.
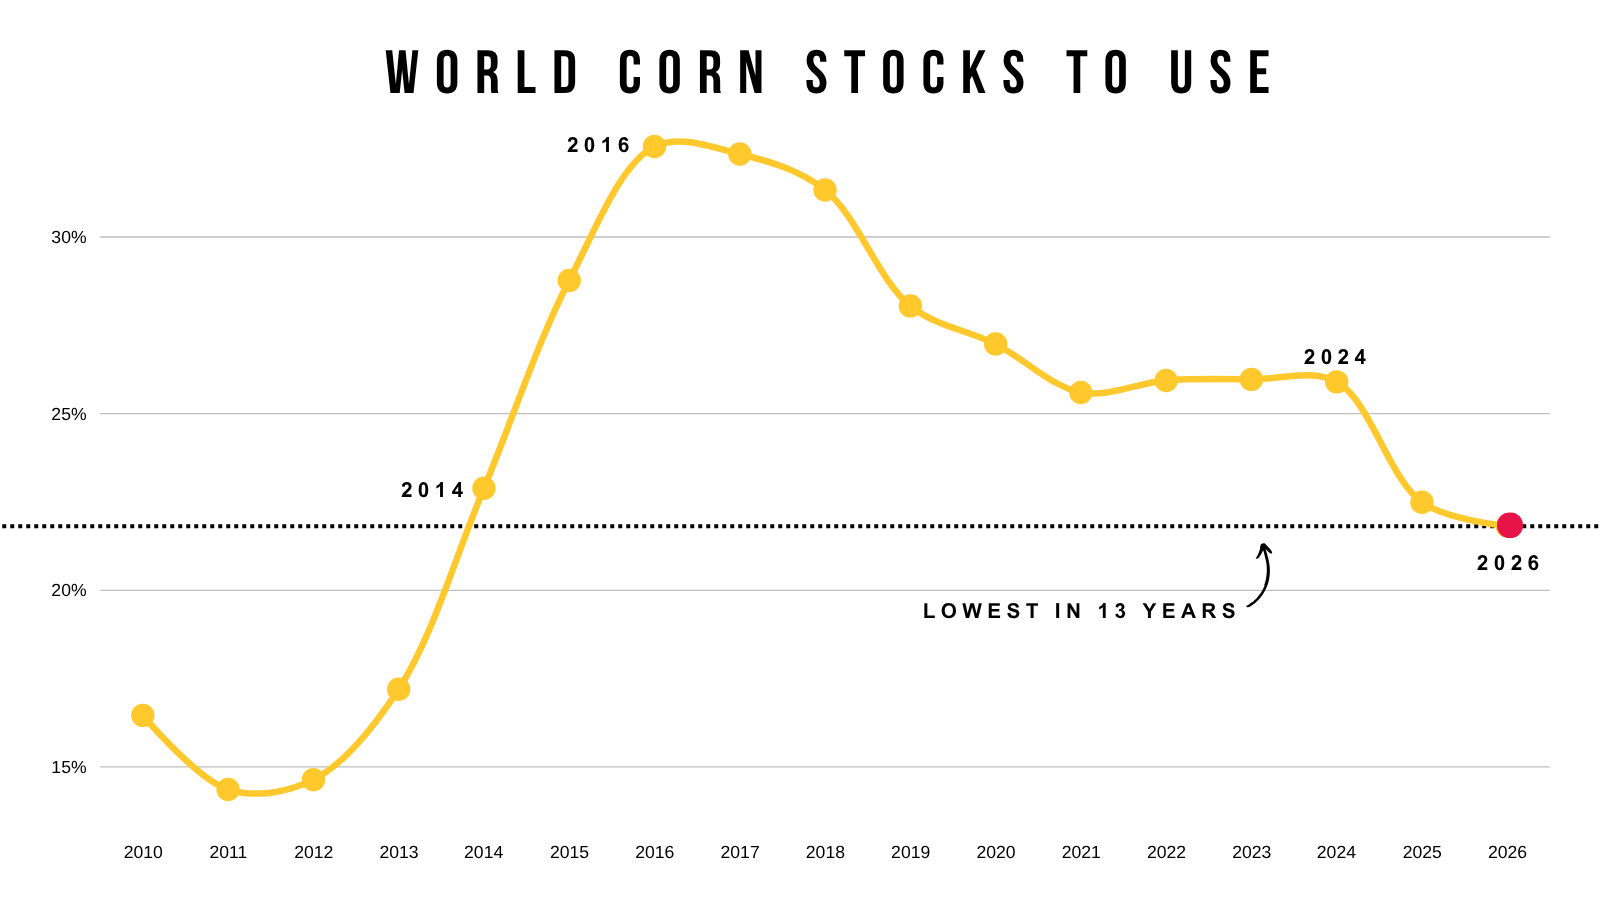
Despite the huge crops out of both the US and Brazil, the world situation is still one of the tightest in years.
The tightest in 13 years.
The world still needs corn.
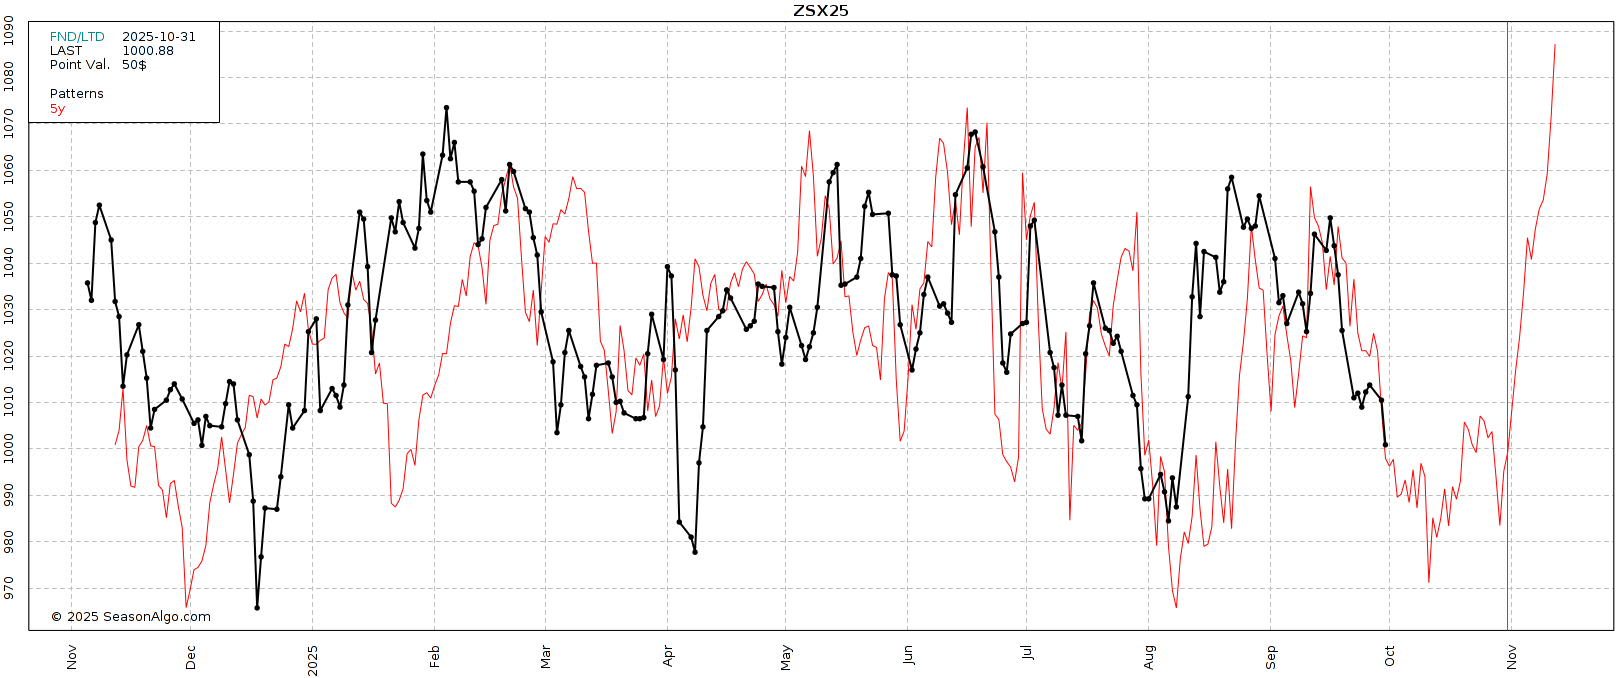
Now the biggest risk in this corn market has to be a post-October insurance sell-off. That would be the worst-case scenario to end the year.
If we look at the seasonal patterns, the 5-year suggests a possible grind the higher the rest of the year. That is what has happened on average over the last 5 years.
However, both the 10 and 15 year patterns suggest a top in October, followed by an end of year sell off.
The most recent example of this was 2023.
That is the one year during that 5-year seasonal window where we did not grind higher the rest of the year.
We sold off in late October and never looked back.
The red line is 2023.
Technicals:
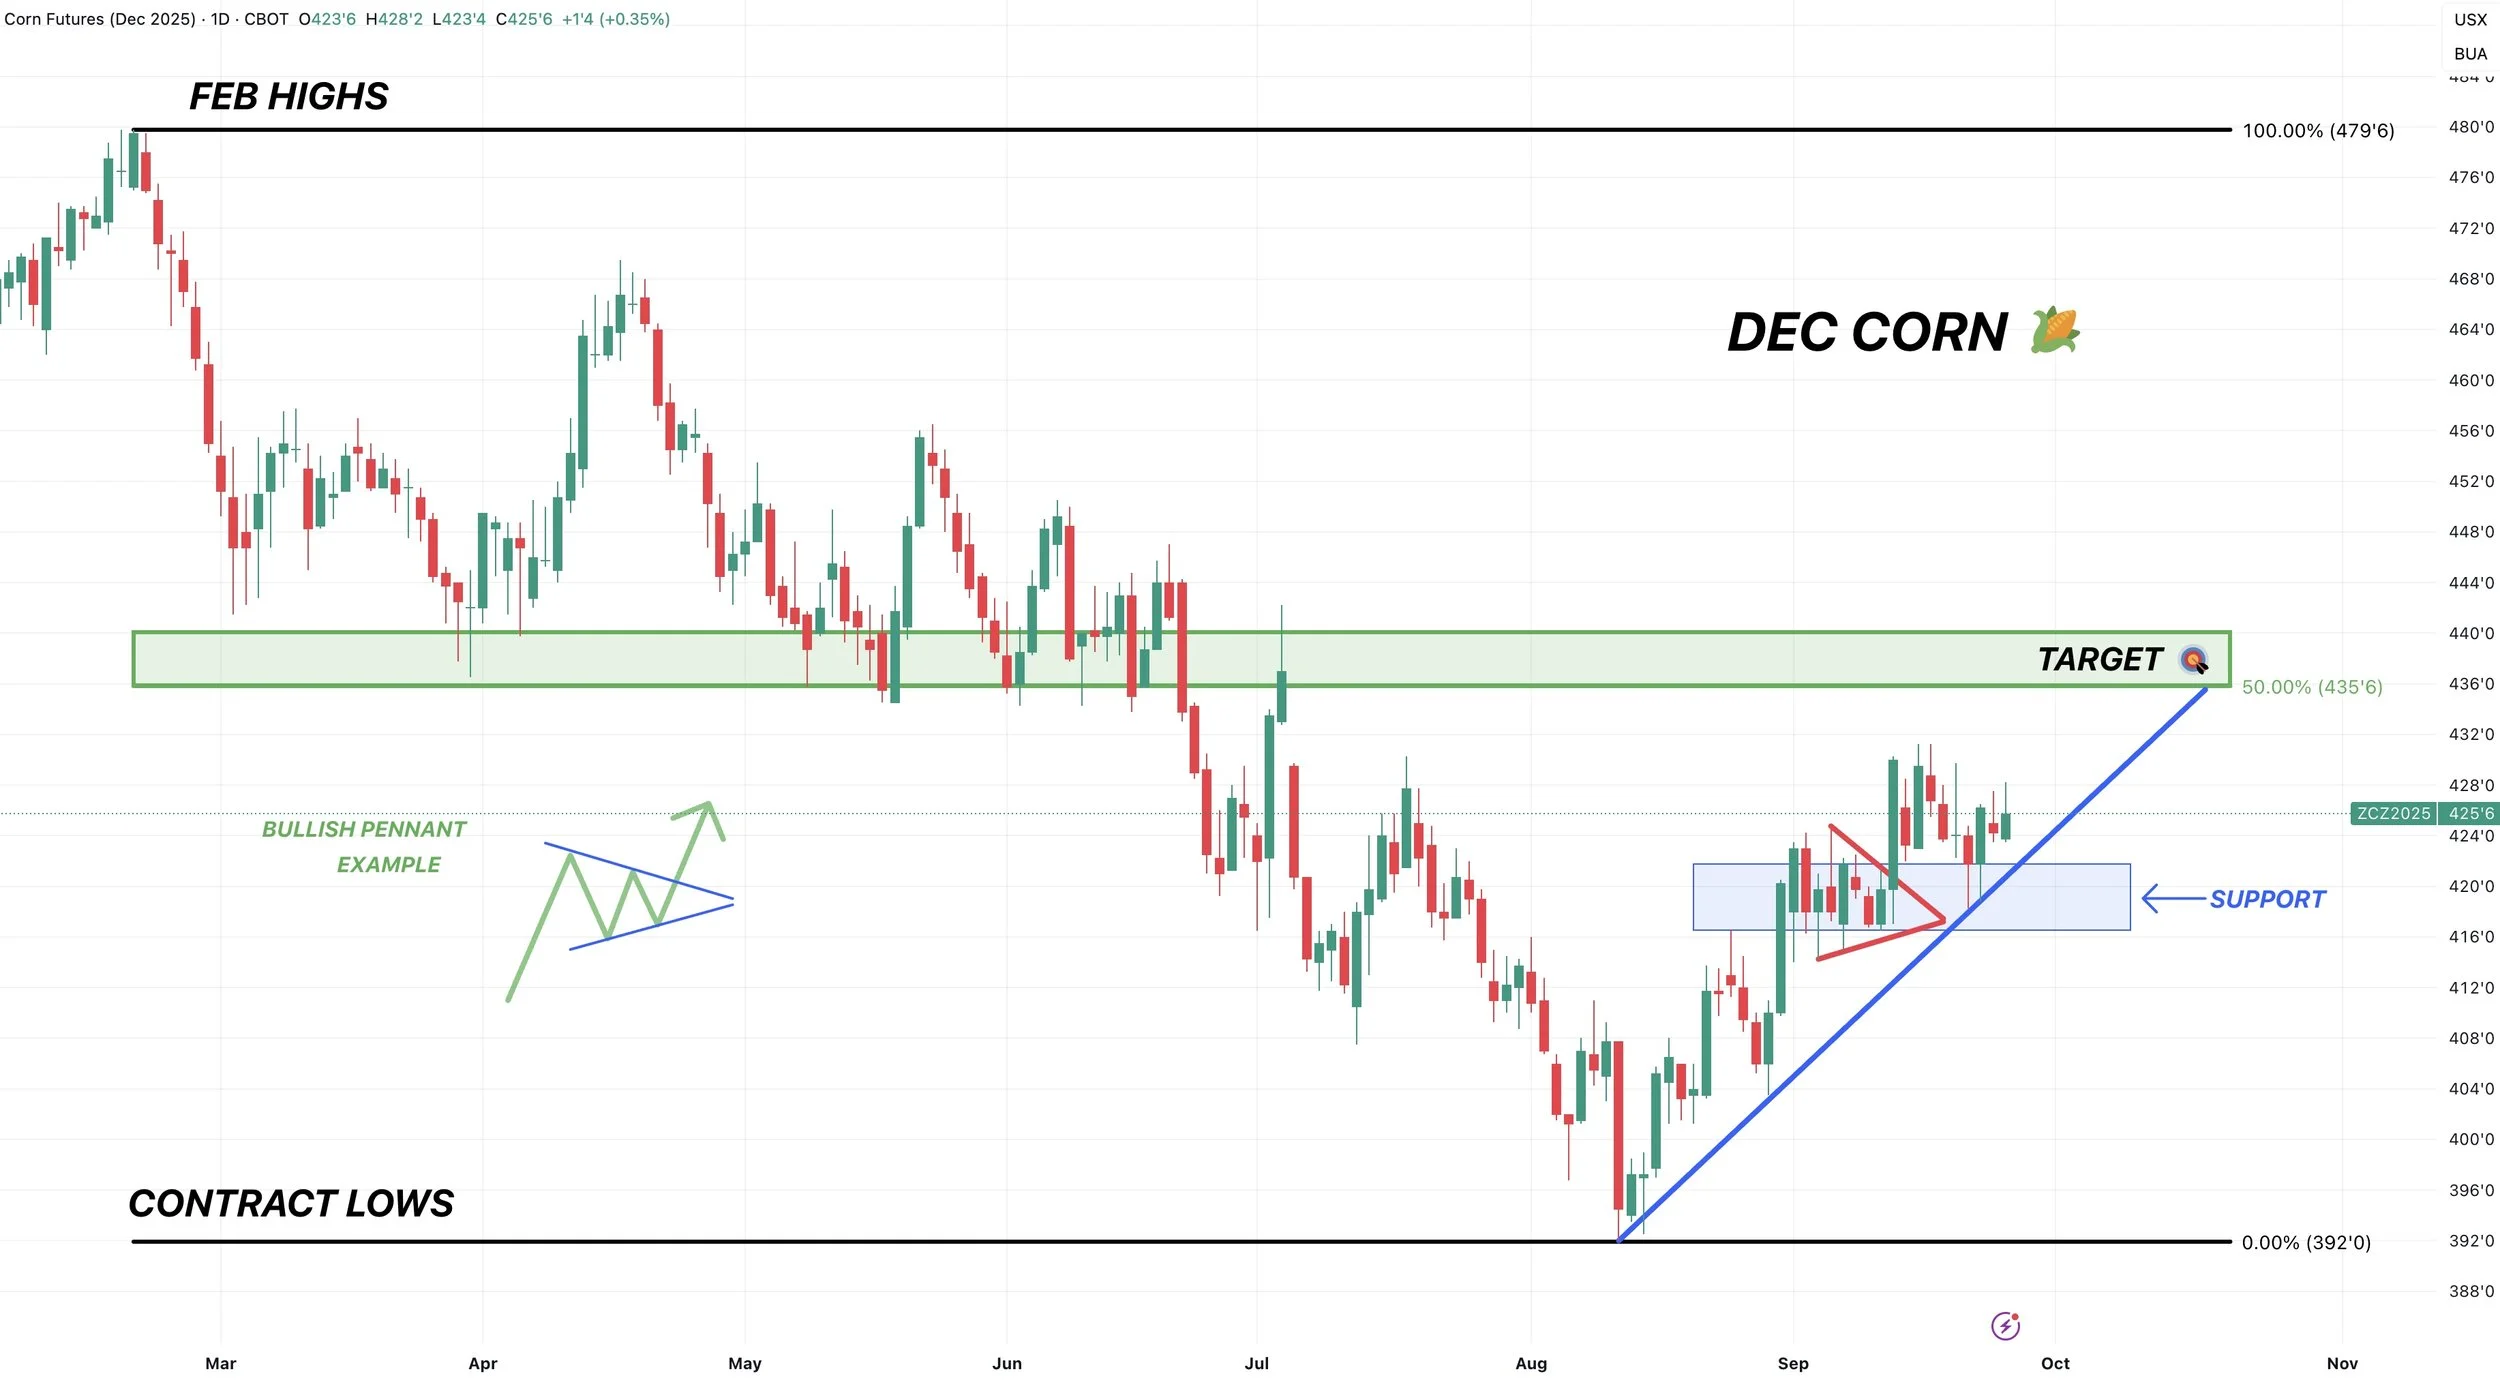
Pretty simple chart in Dec corn.
We had a failed breakout today. Rejecting right off this newly formed downward trend.
If we get the breakout above, it should spark a leg higher.
Target is still $4.35 to de-risk.
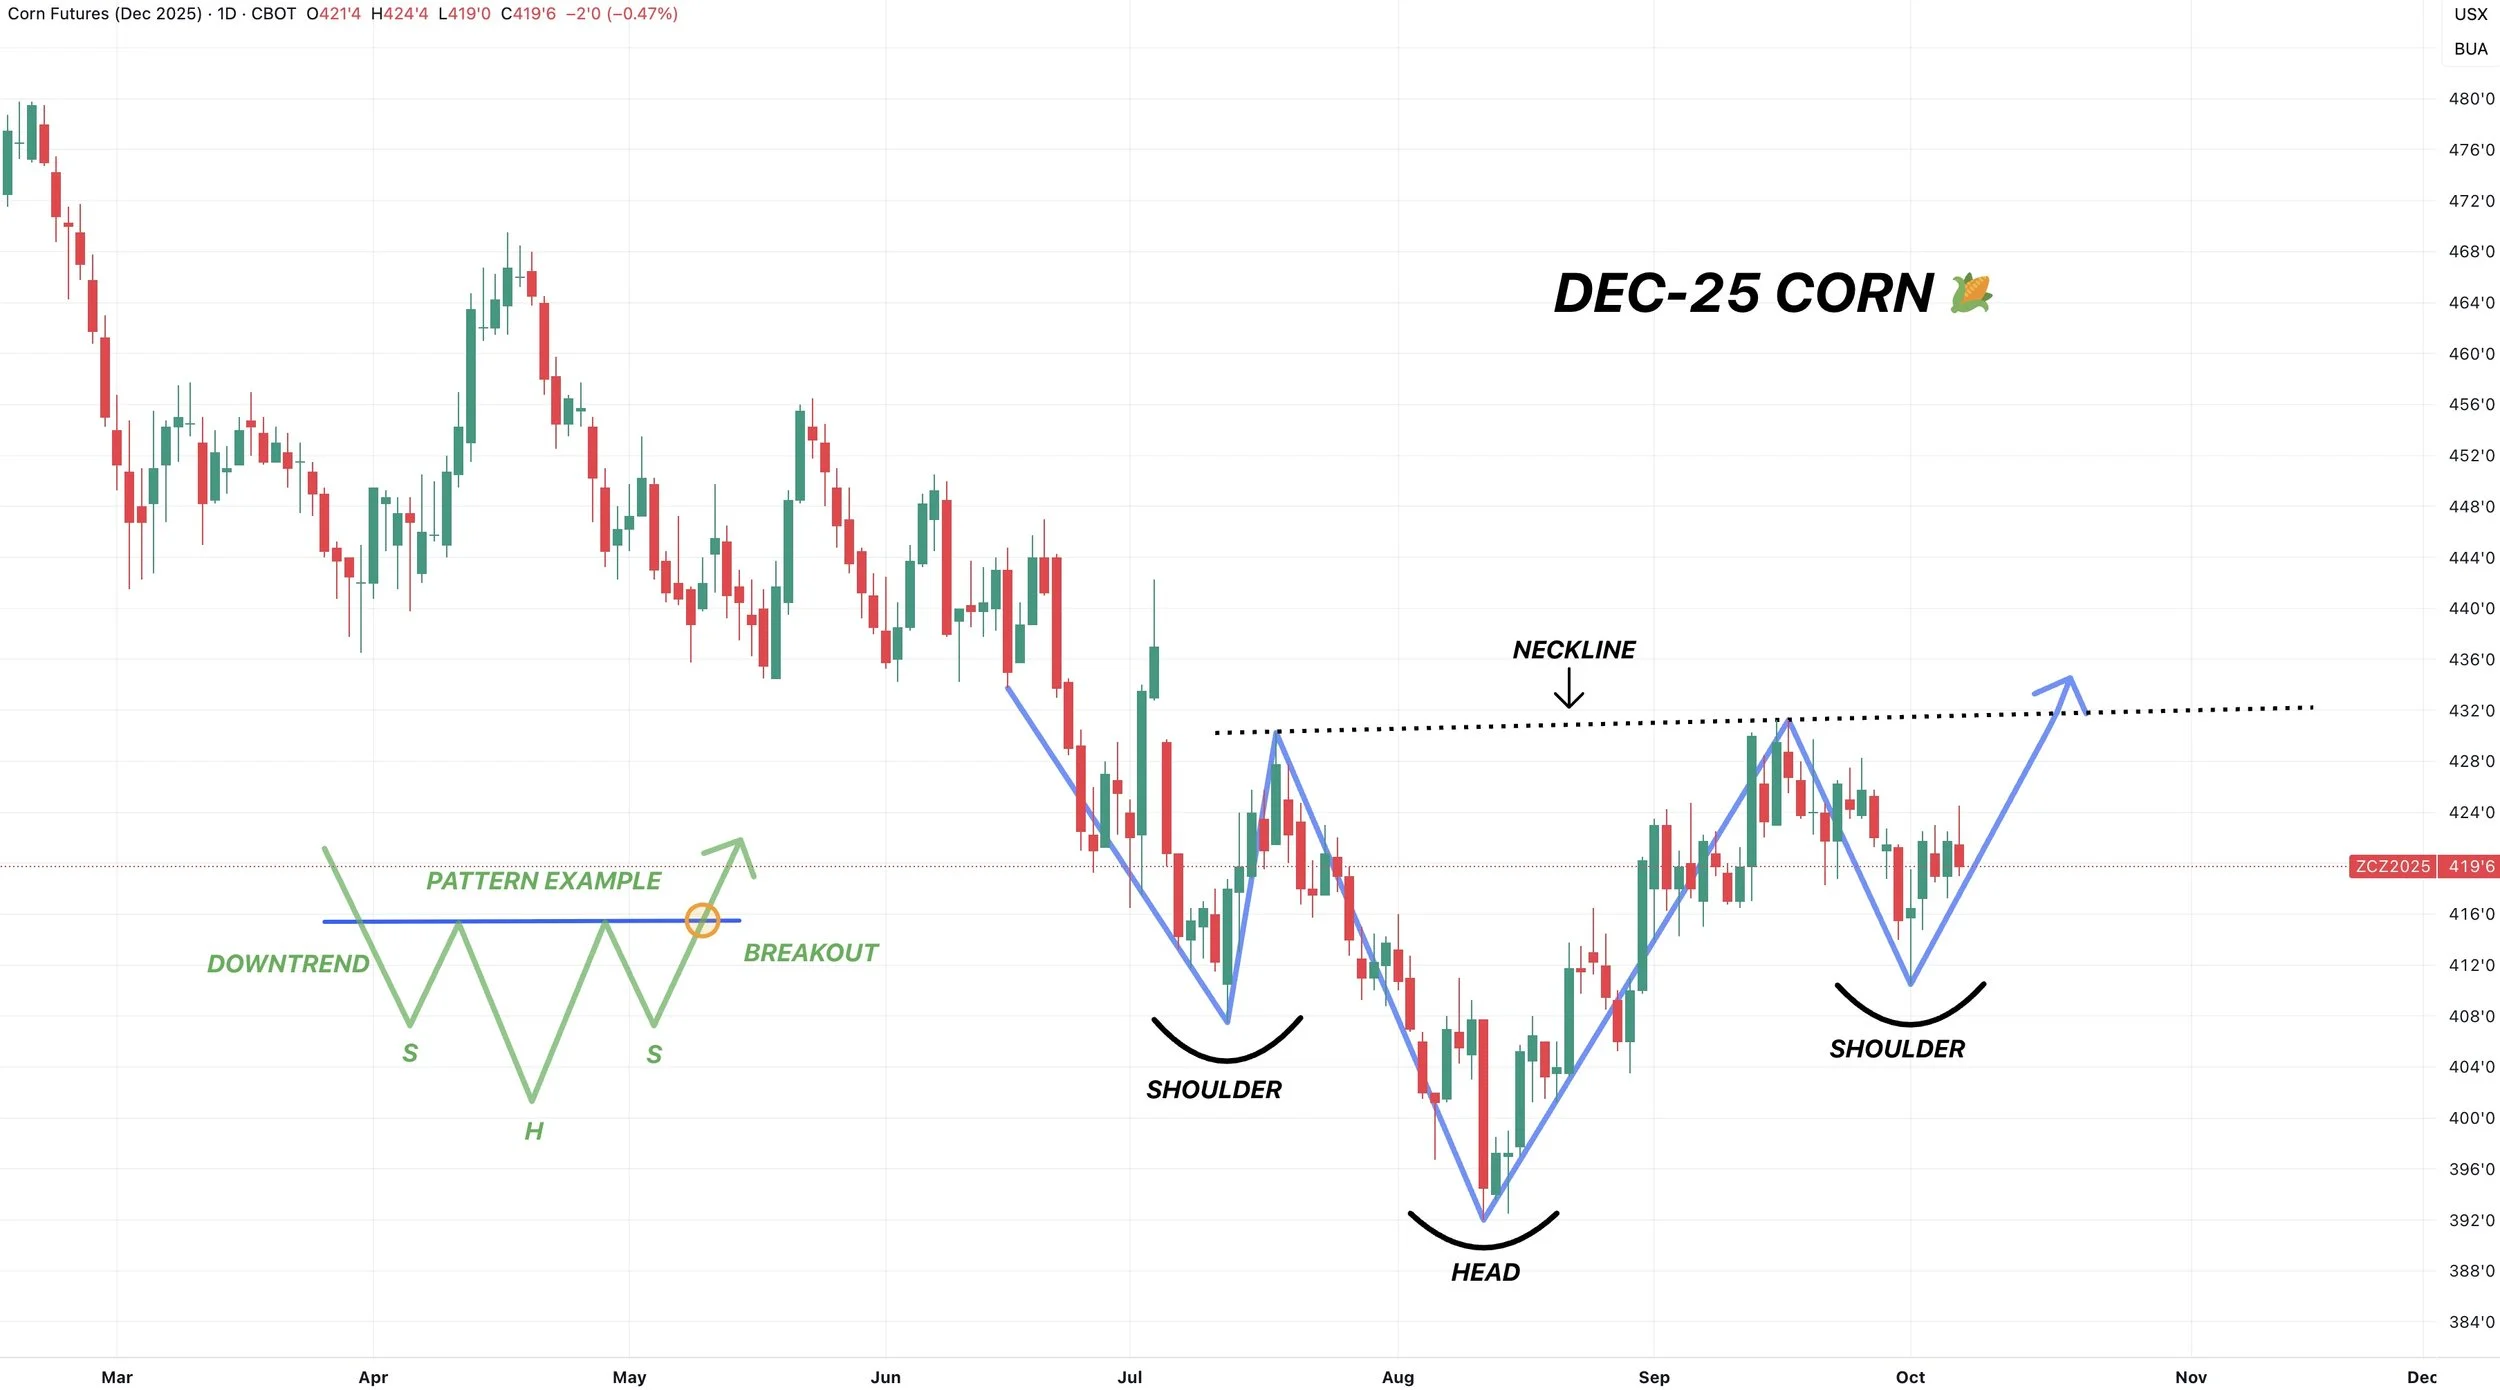
We still have an interesting potential inverse head & shoulders pattern.
Which in nature, is considered bullish.
Soybeans
Fundamentals:
Soybeans saw a boost today because the market is anticipating a trade aid package.
There isn’t a ton of news for the market to trade, so any positive news here helps support the market.

Why is this a supportive factor?
Mainly because it could keep some bushels off the market.
Prices aren’t great to begin with. Basis is awful in plenty of areas because we aren’t seeing any business to China. So this aid might help farmers hold on and not dump as much supply into the market.
However, trade aid does make it seem like the government isn’t extremely confident about a trade deal coming to boost prices relatively soon.
It might be quiet here for the next few weeks.
We don’t have the USDA report. China and Trump aren’t scheduled to talk until the end of the month. So the market does not have much to digest and trade on.
Little fundamental changes can lead to quiet markets.
It's mostly a waiting game here in soybeans. We always get a nice boost on these trade deal talks, then sell off after the meeting because it didn’t lead to anything. So you really can’t get overly excited unless this meeting actually materially changes something.
Long term you do have to be somewhat optimistic on how a trade deal could impact things. Short term is the concern given that we've already missed a good chunk of our prime shipping window.
I still find it hard to imagine that yield is going to be +2 bpa higher than anything we've seen before.
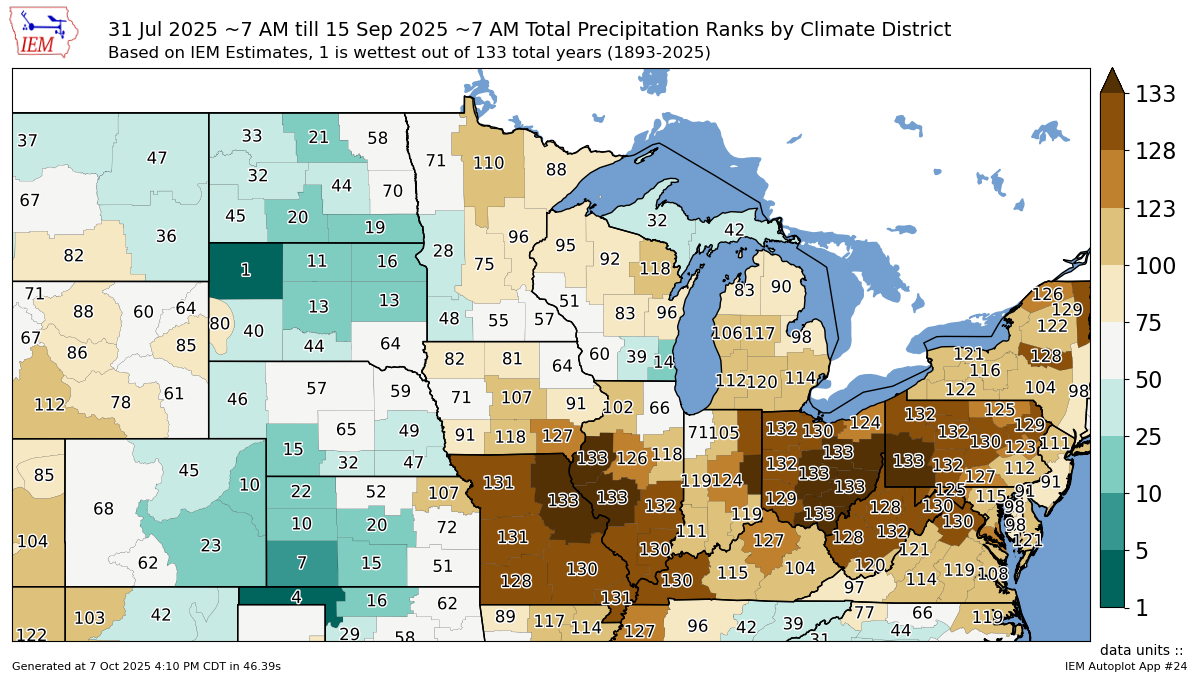
As a reminder, we did just one one of the driest finishes on record.
Here is the precip rankings from Aug 1st to Sep 15th.
Technicals:
We rejected right at this golden zone retracement box.
As we reclaimed 61.8% of the recent sell off.
This is a normal size for a correctional bounce. So unless you break above that box, this bounce is seen as nothing more than a usual relief bounce. Meaning the risk is still lower.
If we break above the box, most of the time it would suggest we've put in our lows. As it would no longer be a standard-sized relief bounce in a broader correction.

I'm also cautious here because we could see a similar pattern play out like we did earlier this summer unless we break that box I mentioned above.
Often times, markets move in 5 waves.
The summer sell off saw 5 waves.
So far we only have 4.
Both the 2nd and 4th wave on the summer sell off rejected the 61.8% level. The level we are are currently battling.
This doesn’t have to happen at all. I just can’t be confident in this market until we clear the purple box. It's a big spot.
I've shown this chart recently as well.
Soybeans have traded in one of the smallest & longest ranges we've ever seen.
Trapped between $9.60 and $10.80 for 427 days now. Essentially sideways for over a year.
Finding support at our trade war resistance. While finding resistance where we did in 2016-2018.
Soybeans absolutely hate trading in the $11.00's. Which is marked with the blue box.
We either rally to $12 or break into the $10.00's.
My bias leans towards the belief that $9.60 is our new long term floor. But if you ever broke below that level things could get ugly.
On the other hand, if we ever take out $10.80 the chart is completely open to the upside.
There are so many unknowns in this market. But if we strike a deal with China, this chart has so much room to run long term.
Wheat
Fundamentals:
Very little fresh news in wheat.
Seasonally, this is the time of the year where wheat tries to buy some acres but has struggled to find a catalyst to move higher.
We certainly aren’t buying extra acres here.
We just have an ample amount of supply around the world and no real concerns anywhere.
On the bright side, our exports are fantastic. Some of the best demand we've seen in years. Which doesn’t have to lead to higher prices right now, but is one way you can chew into the carryout and paint a friendly situation here in the US.
It's just a waiting game in wheat. Being patient for opportunities. They just might not come as soon as any of us would like.
Dec Wheat Technicals:
We continue to trickle lower. But I personally still think we are coiling for a move higher.
Still trapped in this falling wedge. Waiting for the breakout.
If the breakout comes, I think we could reasonably run to $5.45.
Which gives back 38.2% of the June highs and is old support.
Dec KC Wheat Technicals:
Pretty similar to Chicago.
Coiling in this wedge pattern.
If the breakout comes, a reasonable target would be $5.35 which is old support and 38.2% of the June highs.

Cattle
We had a few pieces of news that's been supporting cattle.
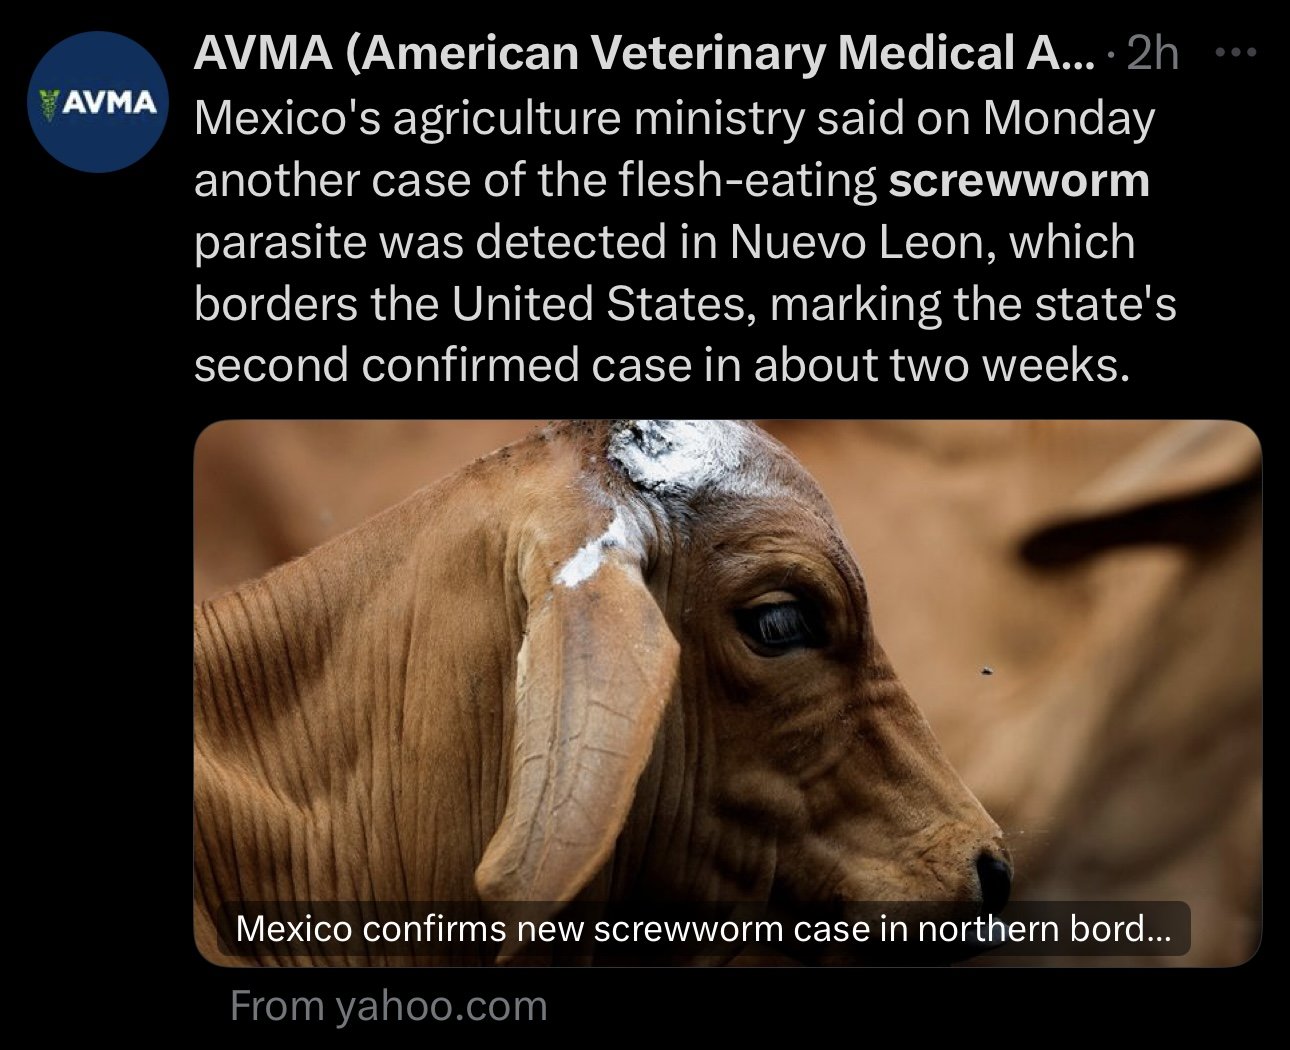
First was that there was another screwworm case in northern Mexico.
It looks like someone knew this info was coming because the market rallied before this came out. But it looks like the border isn’t re-opening soon.
We also had the news that Trump and Brazil did not come to a trade agreement. So the tariffs remain on Brazil beef.
As Trump and Brazil spoke for the first time since he added 50% tariffs on Brazil's beef.
Brazil is the #1 beef exporter in the world. This 50% tariff means that their beef gets priced out of the market.
These pieces of news came at a pretty perfect spot on the charts. Right at critical support.
Oct Feeder Chart:
We were sitting in a wedge pattern and got the breakout today.
That is a pretty friendly sign and suggests we could go print new highs.
If we post new highs, we have a potential target of 377.
That is the golden fib from the bottom of the wedge up the previous end of Sep high (outlined on the chart).
(If you are new, the golden fib means it equals 161.8% of the prior move).
This is a common spot for a 2nd rally to pause.
To the downside, the biggest thing to watch is the 50-day MA. That is a must hold spot and will be our warning sign that this market is truly experiencing a larger correction.
The 50-day has acted as an absolute floor in this market.
If it breaks, it could open the door much lower.
The downside target would be to give back 50-61.8% of the entire rally since June. Which is also where the 100-day MA sits.
They always say the trend is your friend. Until the 50-day gives out, you have to lean higher.

Dec Live Cattle:
Live has not had the breakout that feeders have had.
However, we bounced EXACTLY where we needed to.
Right off that 50-day MA.
This market has bounced there countless times. The only time we broke below it was back in April. We then proceeded to fall to the 100-day.
So the 50-day is still the must hold spot and warning sign. If it gives out, it could open the floor gates lower.
But so far we've continued to hold.
Past Sell or Protection Signals
Aug 22nd: 🌱
Soybean sell signal & hedge alert.
July 31st: 🐮
Cattle sell signal & hedge alert.
July 10th: 🐮
Cattle sell signal & hedge alert.
CLICK HERE TO VIEW
June 5th: 🐮
Cattle sell signal & hedge alert.
June 2nd: 🌾
MPLS wheat sell signal.
April 10th: 🌽
Old crop corn sell signal.
March 19th: 🐮
Cattle hedge & sell signal.
Feb 18th: 🌽 🌾
Old crop KC wheat & old crop corn signal.
Jan 23rd: 🌽 🌱
Corn & beans old crop sell signal.
CLICK HERE TO VIEW
Jan 15th: 🌽 🌱
Corn & beans hedge alert/sell signal.
Jan 2nd: 🐮
Cattle hedge alert at new all-time highs & target.
Dec 11th: 🌽
Corn sell signal at $4.51 200-day MA
CLICK HERE TO VIEW
Oct 2nd: 🌾
Wheat sell signal at $6.12 target
Sep 30th: 🌽
Corn protection signal at $4.23-26
Sep 27th: 🌱
Soybean sell & protection signal at $10.65
Sep 13th: 🌾
Wheat sell signal at $5.98
May 22nd: 🌾
Wheat sell signal when wheat traded +$7.00
Want to Talk?
Our phones are open 24/7 for you guys if you ever need anything or want to discuss your operation.
Hedge Account
Interested in a hedge account? Use the link below to set up an account or shoot Jeremey a call at (605)295-3100.
USDA & CORN TRUTH FINALLY EXPLAINED
MARKET UPDATE
You can scroll to read the usual update as well. As the written version is the exact same as the video.
Timestamps for video:
USDA: 0:00min
Corn: 4:15min
Beans: 7:10min
Wheat: 9:00min
Cattle: 10:45min
Want to talk about your situation?
(605)295-3100
USDA Sale Ends Tonight
Your free trial has expired
Subscribe if you would like to keep getting our daily updates. Don’t miss our next sell signal
Futures Prices Close

Overview
Grains lower across the board with today's USDA report.
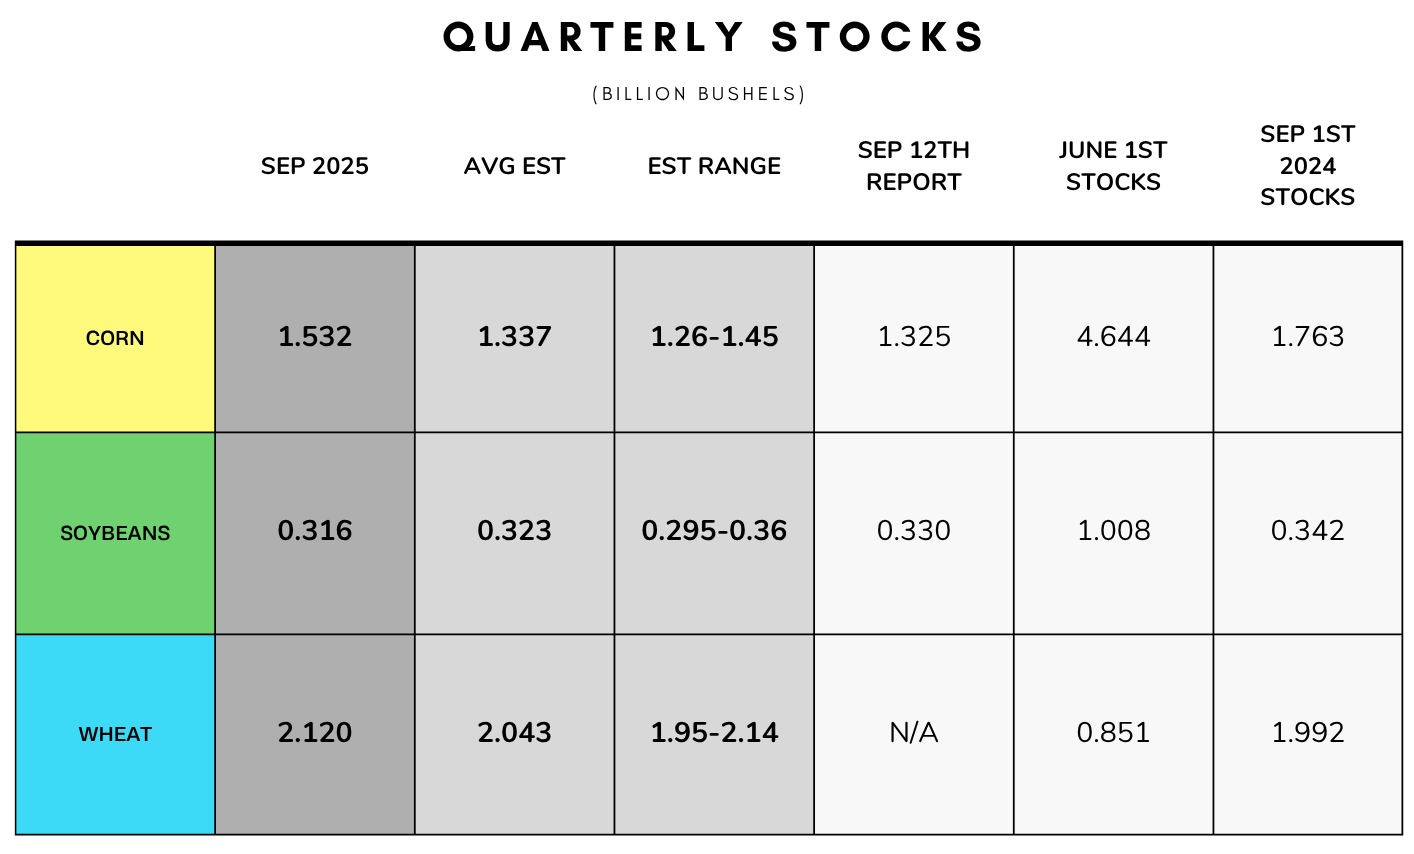
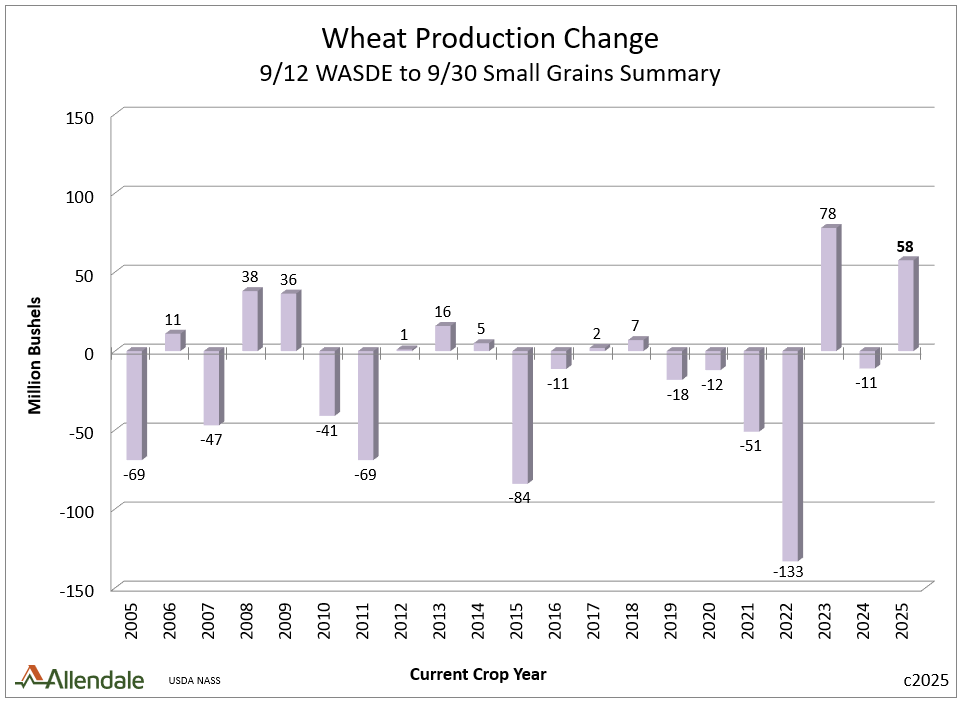
Today we had the quarterly stocks, which is our final old crop balance sheets, along with wheat production.
The report provided a bearish surprise in both corn & wheat.
Old crop corn stocks came in above expectations due to a cut to feed & residul demand.
Old crop wheat stocks also came in above expectations due to finding extra winter wheat acres.
Meanwhile, the report was essentially neutral for soybeans with no major changes made.
Let's dive right into the report and what it means..
Corn Truth Finally Explained
As expected, this was bearish for corn.
Here is the numbers in case you missed them.
Corn came in +200 million higher than estimates.
Wheat was +80 million higher than estimates.
Beans were just under the estimates.
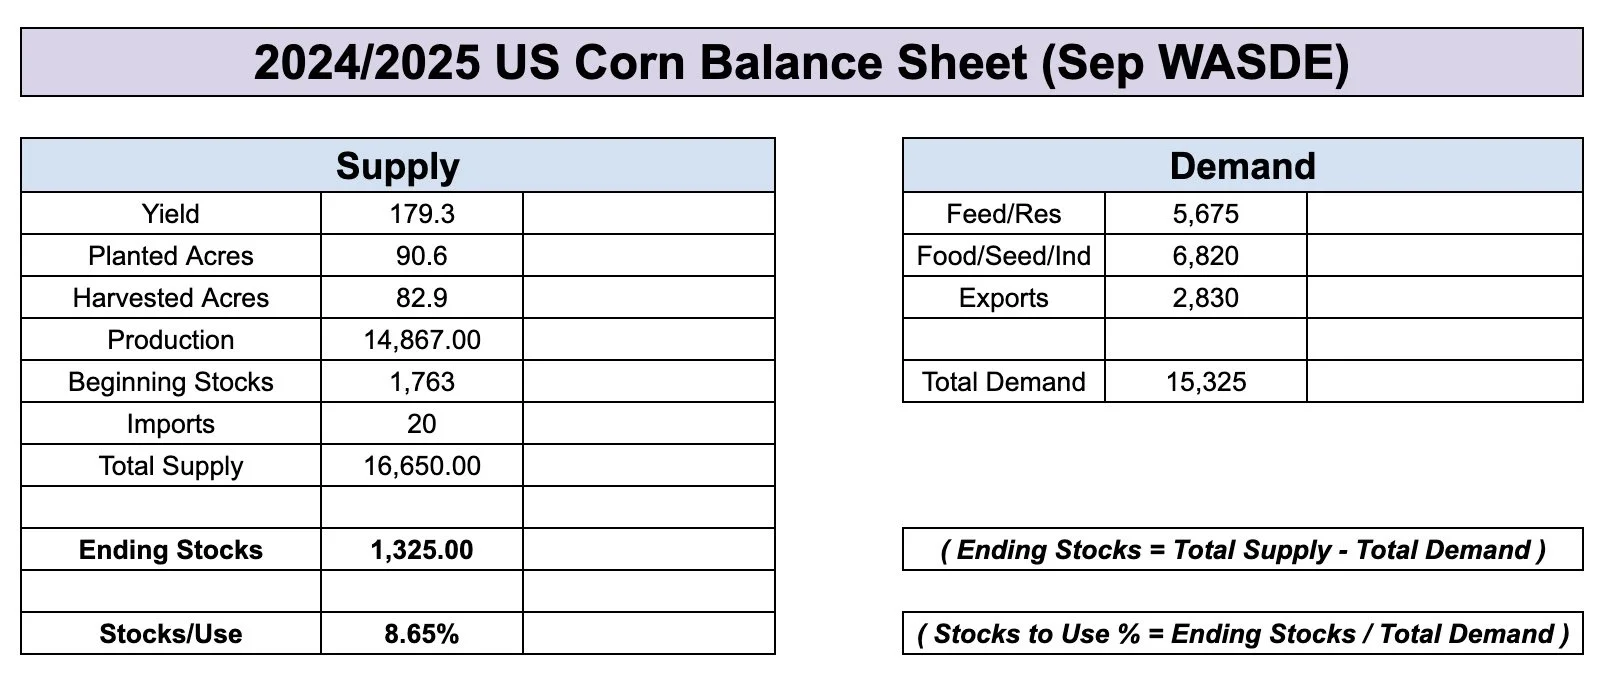
The USDA found an extra +200 million bushels of old crop corn.
This change in old crop did NOT come from last year's crop being bigger. They left production virutally unchanged.
The USDA dropped old crop feed & residual demand by almost -200 million. Which is where the entirety of this change came from.
We had said all week that this was the biggest risk for this report. Because this market simply never traded like we had a sub 9% stocks to use ratio or a 1.3 billion bushel carryout.
So almost everyone expected that this report would provide an explanation as to why corn performed so poorly the last year despite the supposedly friendly balance sheet. That is exactly what we got.
The market has been hinting at us for months that this crop was never at a 1.3 billion carryout.
Instead, it was actually at 1.5 billion.
Instead of an 8.7% stocks to use ratio. It was actually over 10%.
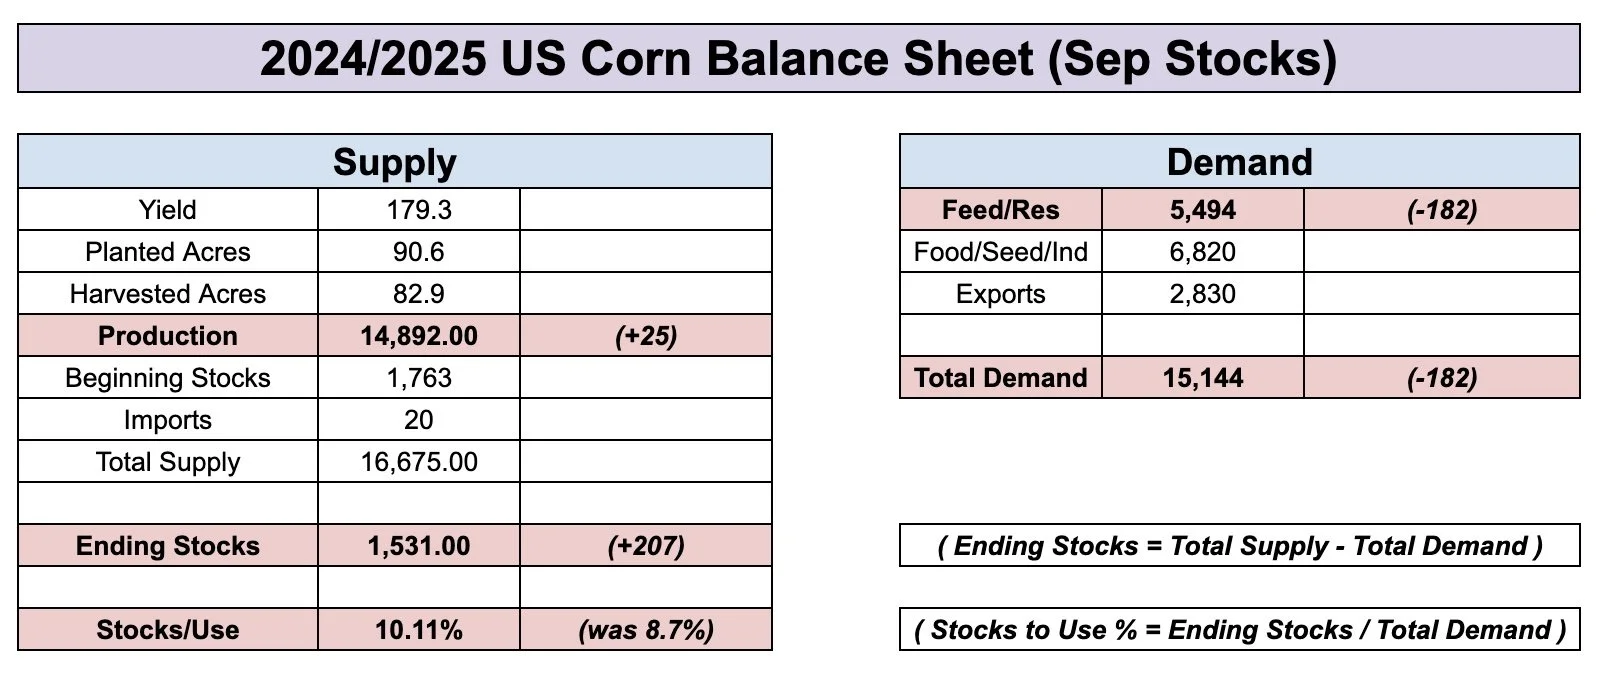
Here is the final old crop balance sheet with the new updated numbers vs what it looked like before this report.
Old Crop Before Report
Final Old Crop Balance Sheet
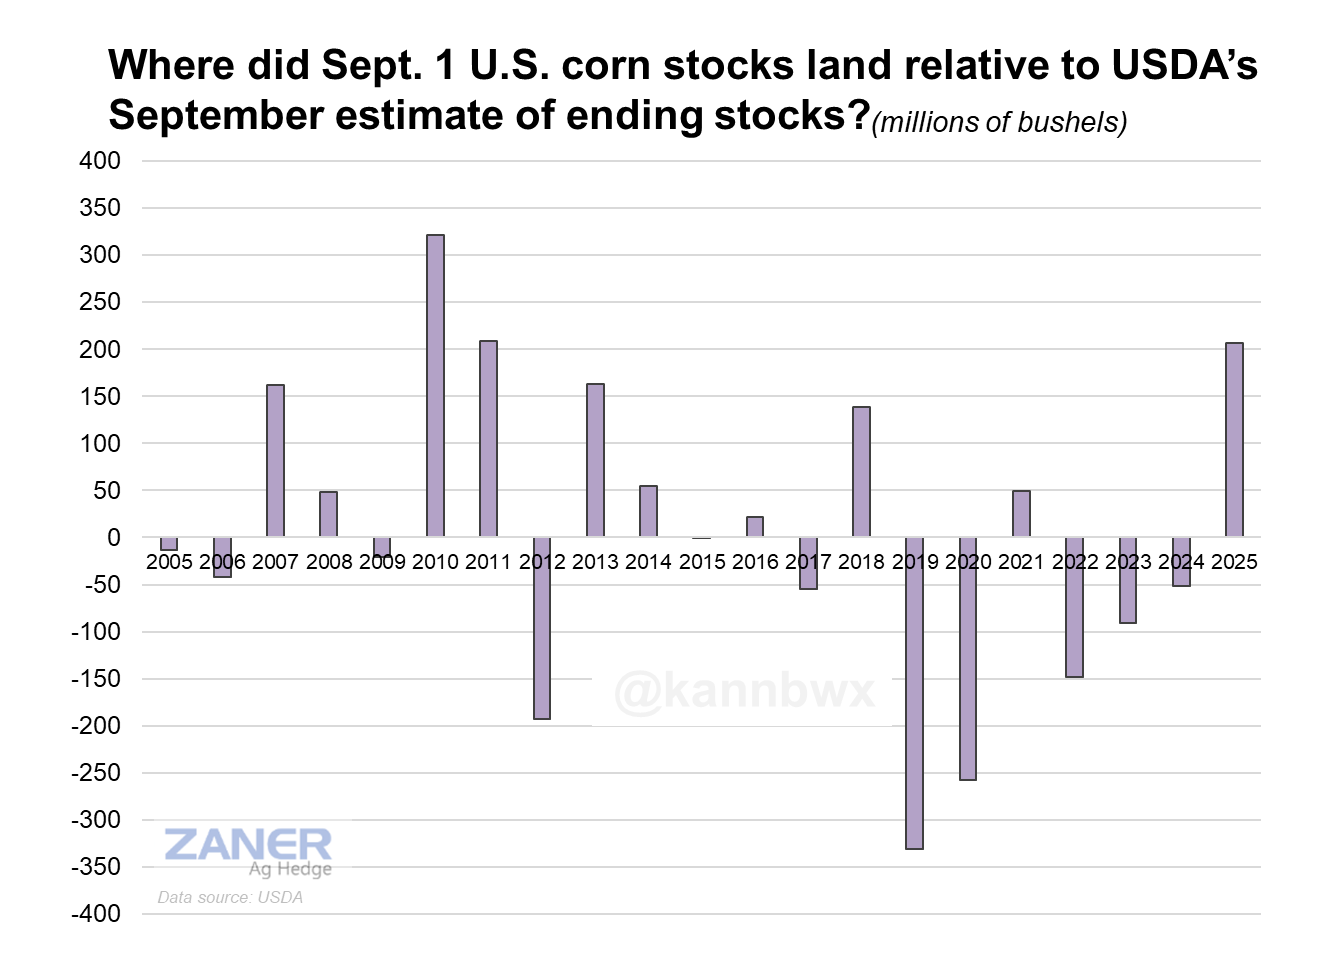
Here is a good visual from Karen Braun that shows how corn stocks changed from the Sep WASDE to the Sep Stocks Report.
This was the 2nd biggest upside change in decades. Only behind 2010.
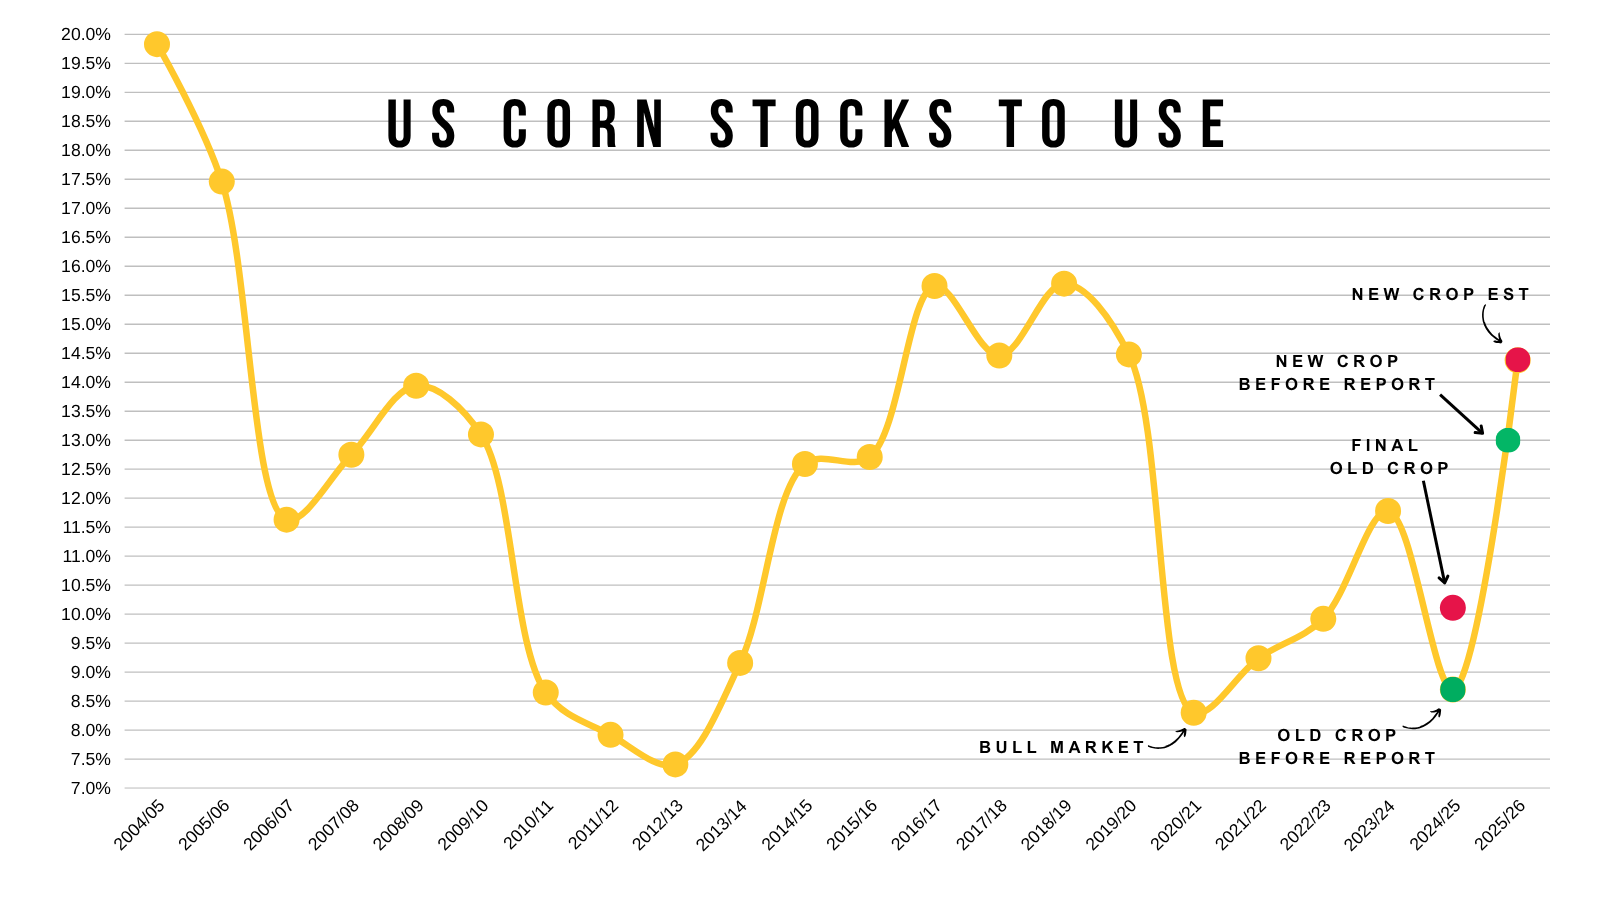
Here is a visual of the stocks to use ratio over the years.
Which includes new crop with the fresh 2.3 billion carryout, along with old crop before & after this report.
There is a big difference between being below 9% and being over 10%.
But at least we partially know why this corn market never traded like it should have.
A sub 9% stocks to use ratio indicates a full blown bull market, but it was never actually true.
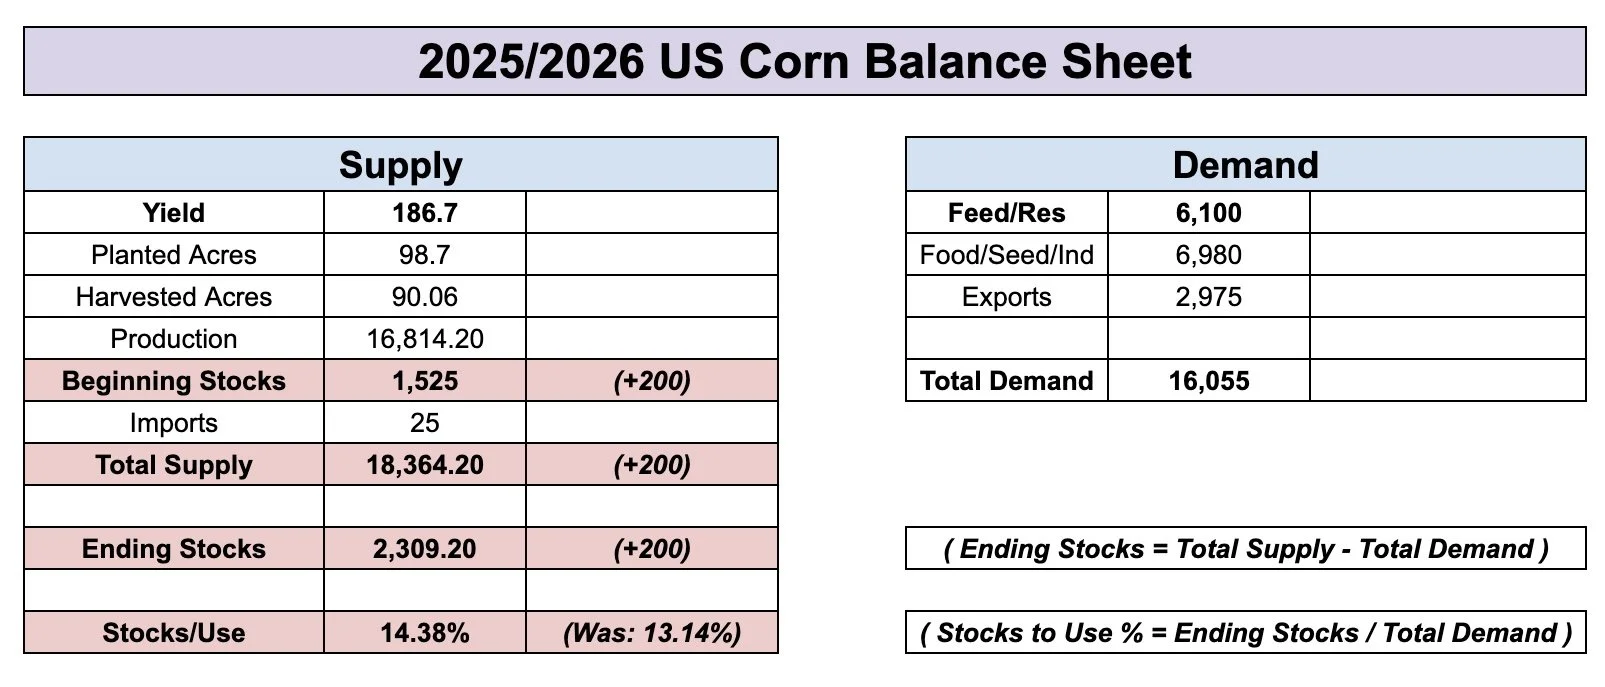
What does this mean for new crop corn?
Not only did we find +200 million bushels of old crop corn, but it automatically carries over to new crop and adds another +200 million bushels of supply to the new crop balance sheet.
As this gets added to "beginning stocks".
So instead of a 2.1 billion bushel carryout, this now gives us a whopping 2.3 billion bushel carryout without making any other changes.
(2.1 billion + 200 million = 2.3 billion)
Here is a visual of carryout the last few years.
2.3 is a pretty bearish number.
This 2.3 is not set in stone, as the USDA can make some other changes by the next report.
But purely using their numbers from the Sep WASDE report, while adding this extra supply leaves you with 2.3 billion.

Government Shut Down?
I just wanted to mention this quickly.
There is an 87% chance that the government will shut down today according to the betting markets.
If this happens, we may or may not get the October USDA report. As the USDA is a government agency.
The USDA report is scheduled for October 9th. However, I believe they compile the data during the first week of October.
Today's Main Takeaways
Corn
The corn market continues to have bearish surprise after bearish surprise thrown at it.
We had more acres TWICE.
A record yield.
Now more stocks.
This report was not friendly for corn at all. It makes it that much harder to paint a friendly situation.
But.. the market was expecting this to a certain extent. This corn market has battled through some incredibly bearish headlines.
Here is what I mean when I say this makes it even that much harder to paint a bullish scenario in corn.
Here is the current balance sheet from the Sep WASDE, with the added beginning stocks once again for reference.
Without changing anything else, we now have a 2.3 billion bushel carryout.

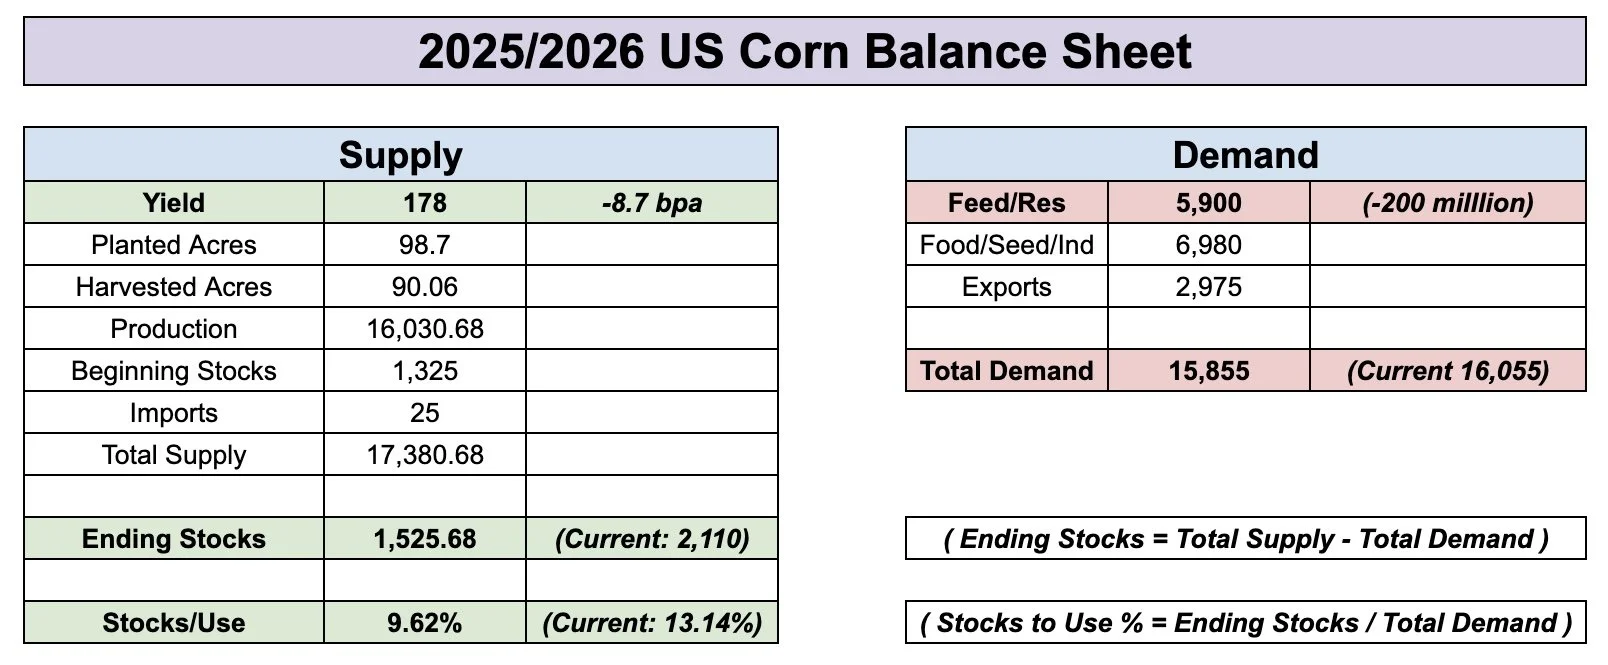
Now here is what the balance sheet would’ve looked like if you hadn’t added that extra +200 million bushels of supply and if yield fell all the way down to 180 bpa.
Cuts to demand would’ve offset some of this, but without changing demand it would’ve resulted in a carryout of 1.5 and a stocks to use ratio below 10%.
180 Yield Before This Report (New Crop)

Now instead.. since we have an extra +200 million.. if yield dropped to 180 it would only result in a carryout of 1.7 with a near 11% stocks to use ratio. Which isn’t super bullish.
This is without changing demand.
If yield gets cut, the USDA is almost certainly going to be cutting some of those lofty demand numbers as well.
180 Yield After This Report (New Crop)
Most believe feed demand is at least +200 million too high.
After all.. they did just cut our old crop feed & residual demand by -200 million as well.
If that is the case, there is a possible scenario where we wind up with a 180 yield and still have a near 2 billion bushel carryout.
In this scenario we dropped yield to 180 and cut feed demand by -200 million. It results in a carryout of 1.9 billion.
This is why this extra supply it makes it even harder to eat into that carryout.
180 Yield With -200 Million Feed & Residual
Am I super bearish corn here? No of course not.
I still think our harvest lows are in and that this market has priced in a lot of bearishness.
We have had 3 very bearish corn reports in a row, and the corn market has held in there.
However, it is incredibly hard to paint some mega bullish scenario in corn unless yield somehow winds up in the realm of 175.
Short term we do also still have to deal with that harvest pressure.
Dec Corn Chart:
Despite the bearish numbers, we didn’t have that awful of price action. Only down -6 cents on the day.
Currently we are right at this cluster of support and bounce nicely off the lows today.
Break below and we could test that red box.
We need to hold that red box to keep an upward bias. That is the golden zone retracement of the entire rally off of contract lows.

Soybeans
This USDA report virtually made zero changes to the soybean situation.
We still have zero business to China.
The biggest question is.. will our losses in demand offset the possible losses in supply?
If China truly stays away, it would take an immense cut to yield to offset that type of demand loss.
China is the wild card.
Seasonally this is soybeans weakest time of the year as well.
Nov Beans Chart:
We posted new lows for the move today and are now very cleary below that must hold spot. Which was the 61.8% retracement down to the lows.
This tell us that this sell off is probably something bigger.
Where could we post our lows?
I could easily see us falling down to the $9.90 range.
That is about where that trendline comes in that marked the last 3 major bottoms in this market.
That is where I would potentially look at some re-ownership strategies.
What Should You Do With Beans?
There are a few different strategies you can use in soybeans.
We have a massive carry in this market. The market is telling you to simply store soybeans and caputure that carry.
Another possible strategy would to simply sell soybeans off the combine and re-own with a call option, as this is cheaper than storage & interest costs.
Implied volatility for soybeans are at some historically low levels. This means options are cheap because the market isn’t expecting big moves.
However, with the 2nd option you could give up a lot of basis potential.
Give us a call or text if you have questions or want specific advice tailored to you: (605)295-3100
Wheat
The report was bearish for wheat just like corn.
Winter wheat surprised high. Winter wheat production is now up almost +4% vs last year.
We saw spring wheat also surprise high, but spring wheat production is still down over -8% compared to last year.
The interesting thing about this report is that the production increase came almost entirely from more acres. As the USDA left yield unchanged.
They added +450k of harvested acres to Texas with overall winter wheat acres jumping by +773k. Which was an unpredictable surprise.
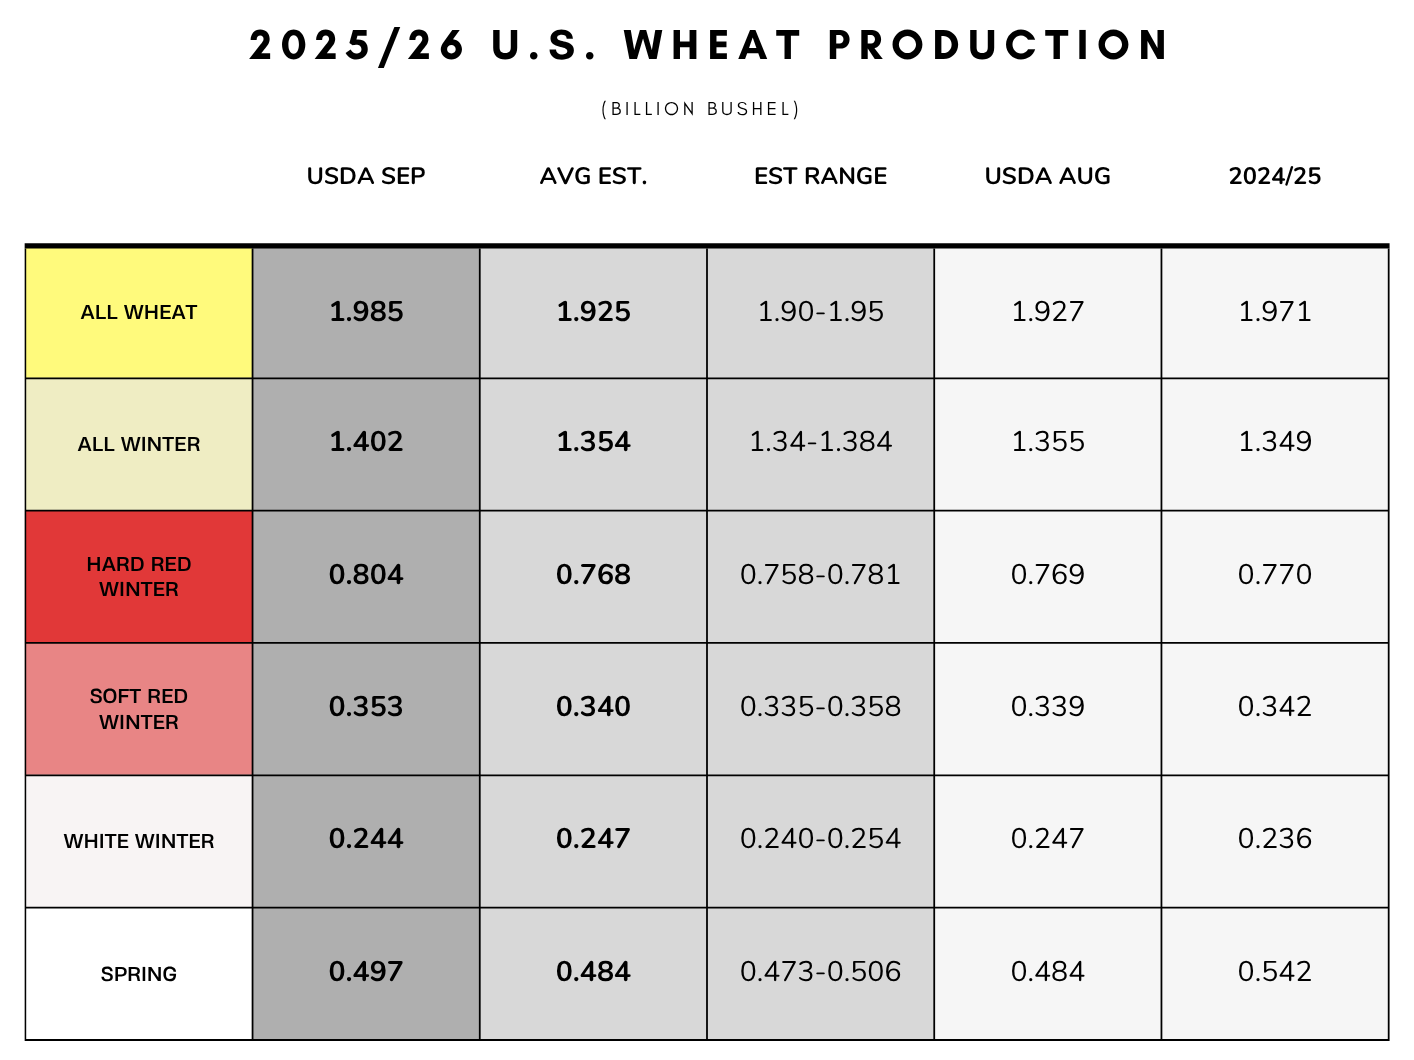
This report was bearish no doubt.
This was the 2nd largest increase to production we have seen in this report in over 20 years.
However, I still have a hard time getting overly bearish at $5.00 wheat.
Despite selling off today, the charts didn’t create any damange and are still in tact.
Seasonally this is still the time of year where we usually find some life.
I am still being patient waiting for an opportunity.
Dec Chicago Chart:
We are right back down to the bottom of this channel once again.
This is where we have continued to bounce for months, so I would like to think we continue to defend it.
This falling wedge pattern is starting to get pretty tight.
Bulls want to see us bust of out this wedge higher to get some momentum.

Despite posting contract lows once again.. the RSI once again did not post a new low.
We continue to show bullish divergence on the RSI and have been showing this for weeks now.
Dec KC Wheat Chart:
KC wheat also sitting in this falling wedge pattern.
Waiting for a direction and decision to be made.
Bulls watching for a breakout.

Cattle
Continous Feeder Chart:
When front month feeders rolled from Sep to Oct, we left a roll gap at 364.
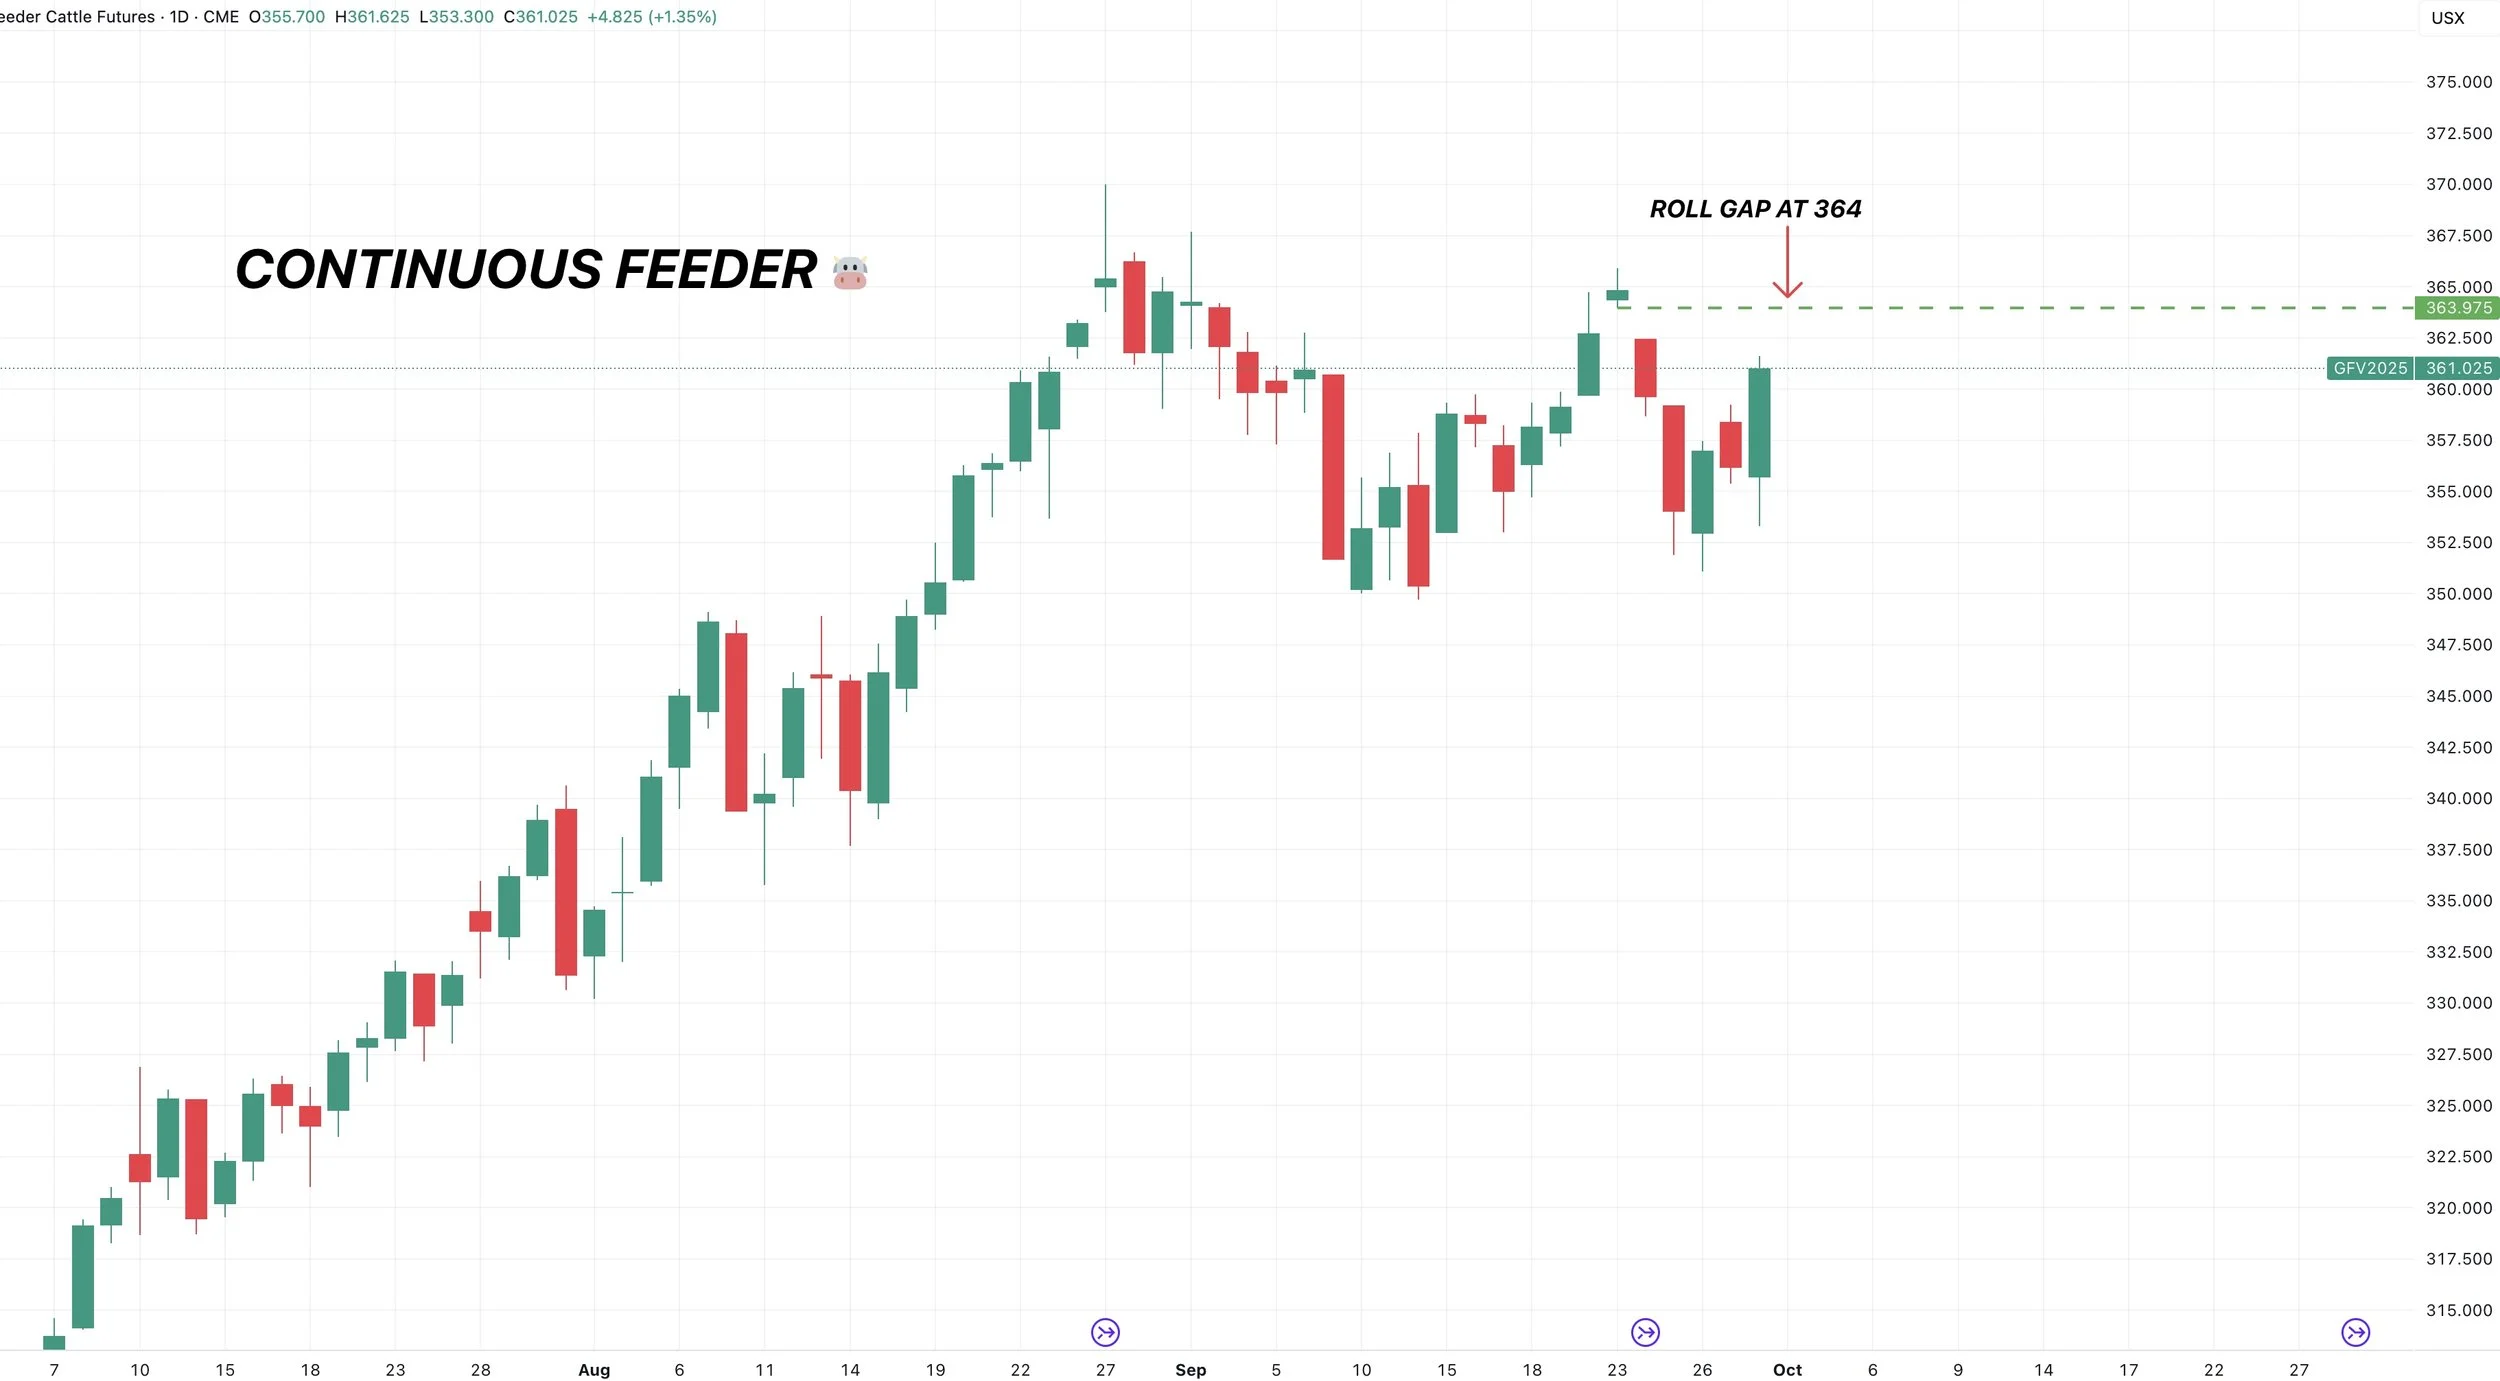
Oct Feeder Chart:
If we look at Oct feeder, that 364 level would also challenge those recent highs.
If we break above that level it is probably a sign we're going to go post new contract highs.
To the downside, need to hold the red box or we could very easily drop down to the blue one.

Feeder Monthly Chart:
This was our first month where we traded lower for the month since all the way back in October of last year.
Nearly an entire year without a single red month.
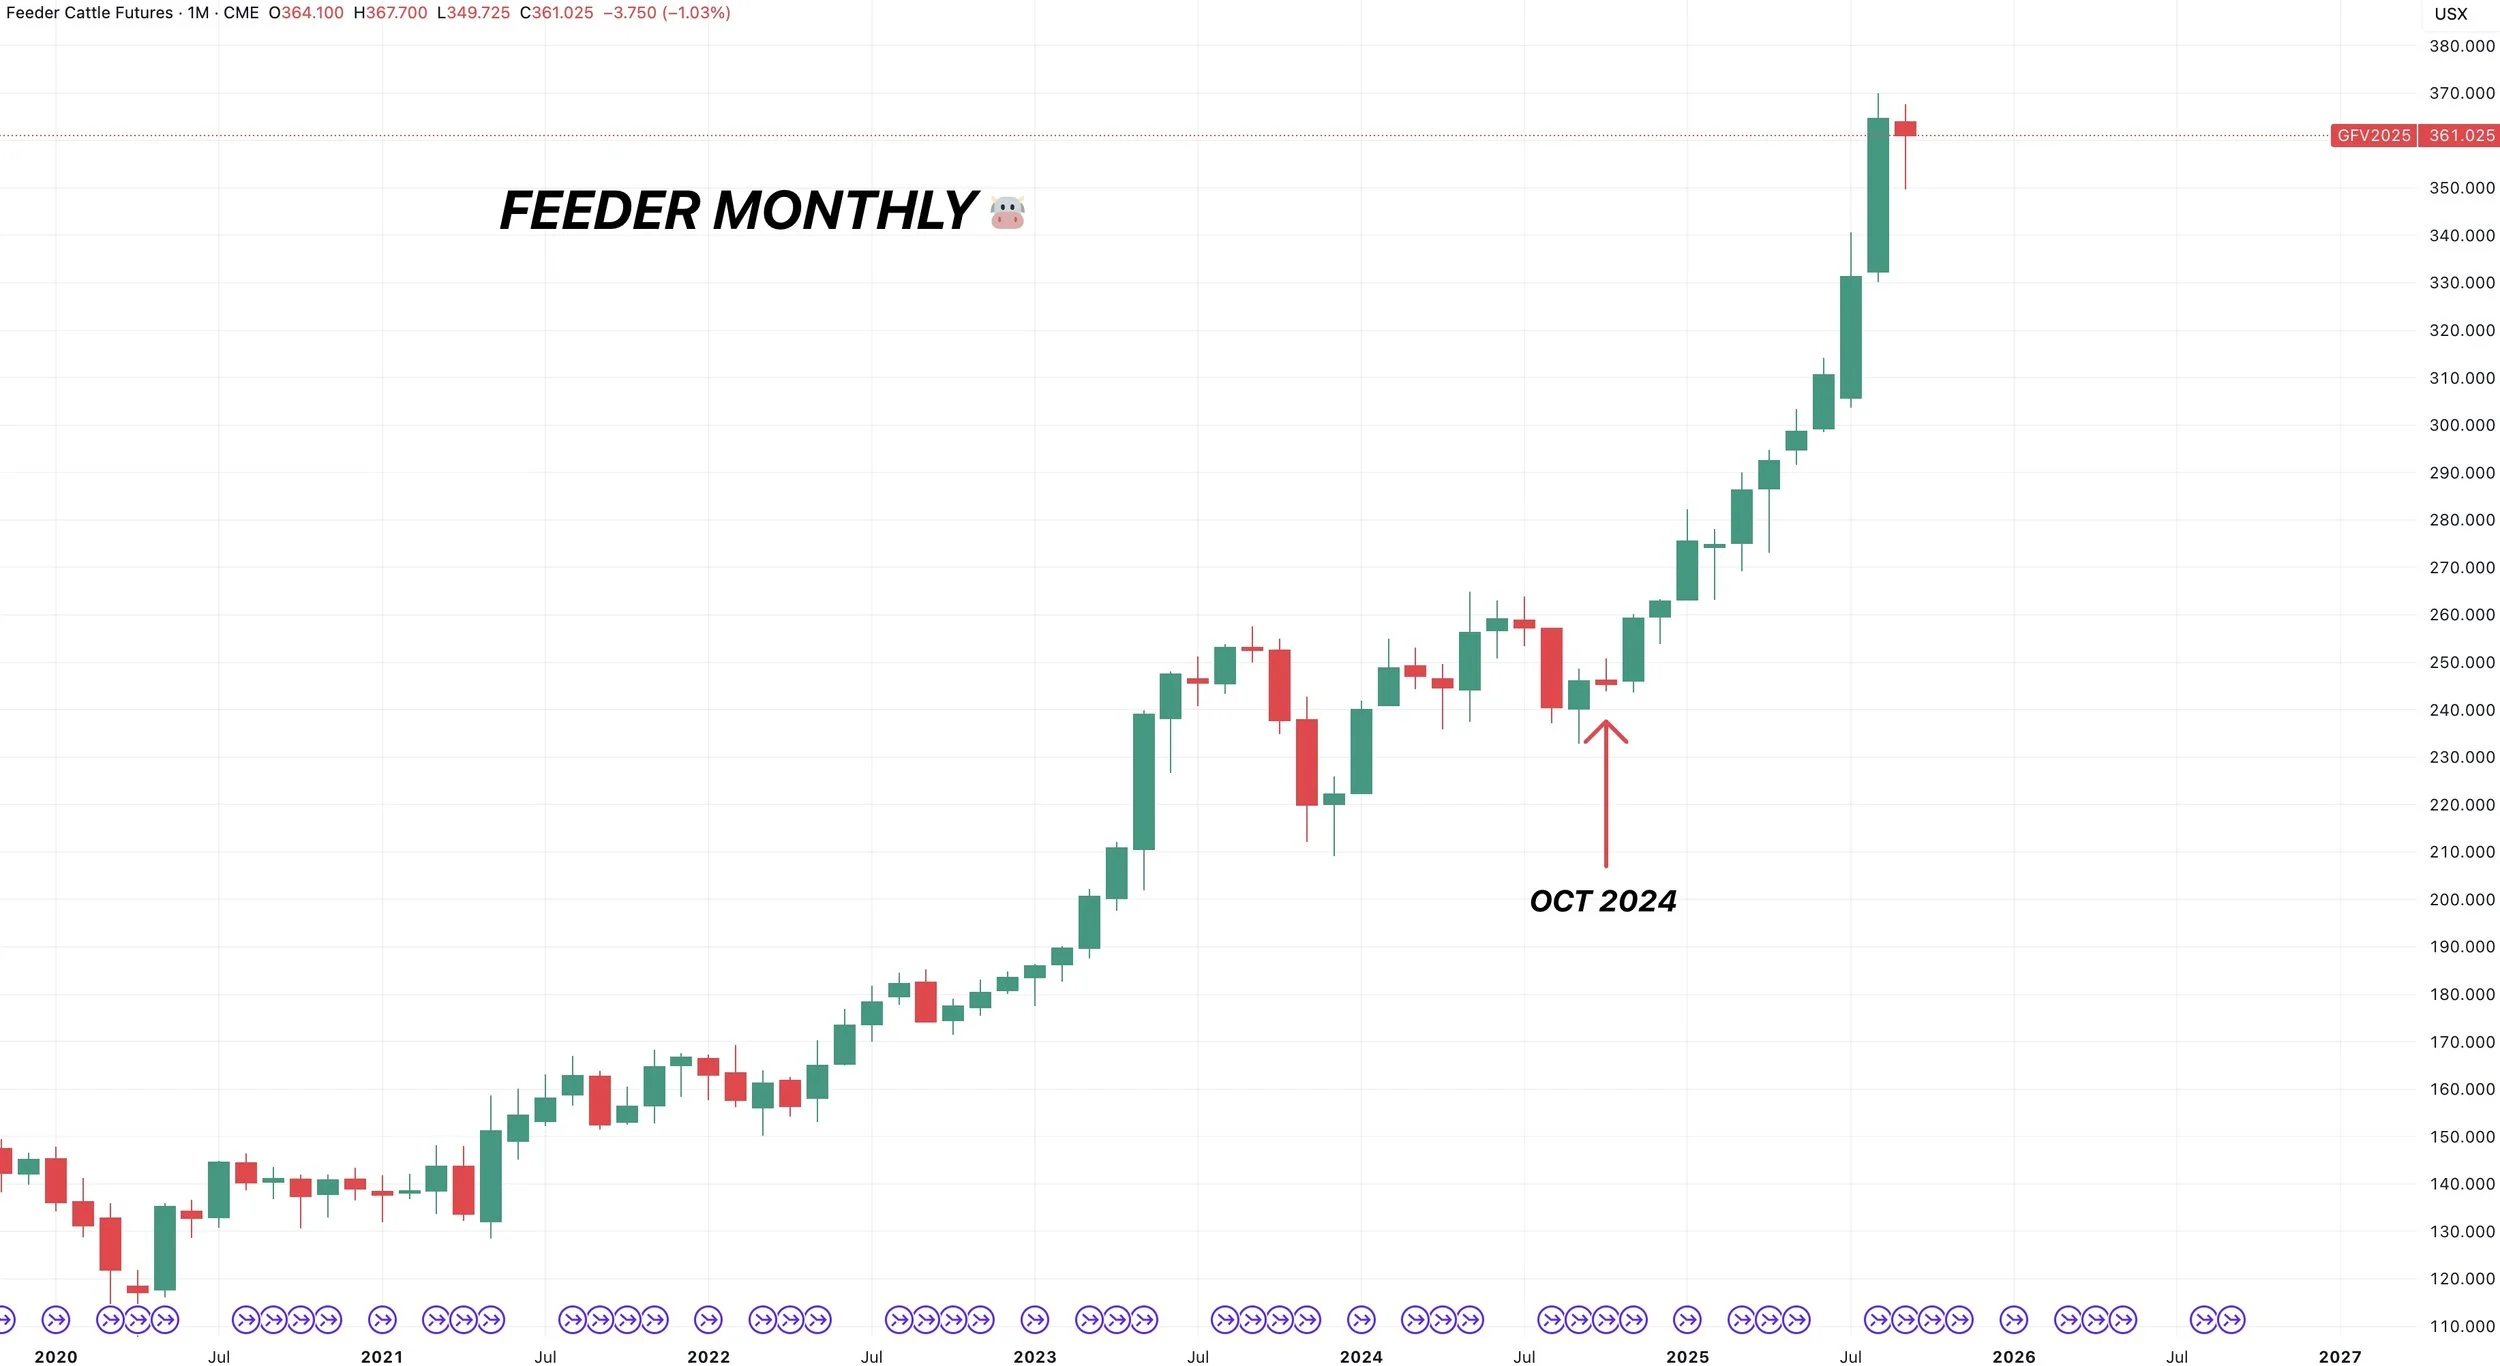
We could easily go and post new highs in this market.
But that doesn’t mean I am not going to be managing my risk up here.
I am still very cautious up here.
If we look at open interest, it has been droppping by a large amount.
Open interest is the total number of long or short positions in the market. Basically, market participants have been leaving.
If you pair this with cattle posting it's first month lower in a year, it definitely makes me all that more cautious up here.

The funds have also been jumping out of those record-long positions.
They are now holding their smallest long position since last year.

Past Sell or Protection Signals
Aug 22nd: 🌱
Soybean sell signal & hedge alert.
July 31st: 🐮
Cattle sell signal & hedge alert.
July 10th: 🐮
Cattle sell signal & hedge alert.
CLICK HERE TO VIEW
June 5th: 🐮
Cattle sell signal & hedge alert.
June 2nd: 🌾
MPLS wheat sell signal.
April 10th: 🌽
Old crop corn sell signal.
March 19th: 🐮
Cattle hedge & sell signal.
Feb 18th: 🌽 🌾
Old crop KC wheat & old crop corn signal.
Jan 23rd: 🌽 🌱
Corn & beans old crop sell signal.
CLICK HERE TO VIEW
Jan 15th: 🌽 🌱
Corn & beans hedge alert/sell signal.
Jan 2nd: 🐮
Cattle hedge alert at new all-time highs & target.
Dec 11th: 🌽
Corn sell signal at $4.51 200-day MA
CLICK HERE TO VIEW
Oct 2nd: 🌾
Wheat sell signal at $6.12 target
Sep 30th: 🌽
Corn protection signal at $4.23-26
Sep 27th: 🌱
Soybean sell & protection signal at $10.65
Sep 13th: 🌾
Wheat sell signal at $5.98
May 22nd: 🌾
Wheat sell signal when wheat traded +$7.00
Want to Talk?
Our phones are open 24/7 for you guys if you ever need anything or want to discuss your operation.
Hedge Account
Interested in a hedge account? Use the link below to set up an account or shoot Jeremey a call at (605)295-3100.
WILL NEXT WEEKS USDA EXPLAIN POOR CORN PRICES?
AUDIO COMMENTARY
Quarterly stocks report on Tuesday
Wheat production on Tuesday
Some years this report is a yawn, sometimes it brings big surprises
Could this USDA report explain the poor prices we saw this year?
Report could tell us if last years crop was bigger
I don’t think it’s realistic that they put the crop smaller, because basis and everything does not indicate that
This report offers more downside risk than upside
We had a 1.3 carryout, no invert, and no basis firm. This market did not trade like a 1.3 billion bu carryout
Some should be buying puts that cover you the next month
How to establish a “free” floor with calls & puts
Longer term I see upside, but short term why do we have to go higher heading into harvest?
Soybeans don’t tend to move as much as corn does on this report
Whenever we get something done with China, we will have a friendly soybean situation
What happens if there is a hiccup in SA’s crop?
Wheat higher from today 15 years in a row
If buyers realize you don’t have a plan, they can use that to their advantage
Listen to today’s audio below
Want to talk ? (605)295-3100
Your free trial has ended
You will not receive our next sell signal or future daily updates
Make sure you take advantage of our harvest sale so you don’t miss the next opportunity
Past Sell or Protection Signals
Aug 22nd: 🌱
Soybean sell signal & hedge alert.
July 31st: 🐮
Cattle sell signal & hedge alert.
July 10th: 🐮
Cattle sell signal & hedge alert.
CLICK HERE TO VIEW
June 5th: 🐮
Cattle sell signal & hedge alert.
June 2nd: 🌾
MPLS wheat sell signal.
April 10th: 🌽
Old crop corn sell signal.
March 19th: 🐮
Cattle hedge & sell signal.
Feb 18th: 🌽 🌾
Old crop KC wheat & old crop corn signal.
Jan 23rd: 🌽 🌱
Corn & beans old crop sell signal.
CLICK HERE TO VIEW
Jan 15th: 🌽 🌱
Corn & beans hedge alert/sell signal.
Jan 2nd: 🐮
Cattle hedge alert at new all-time highs & target.
Dec 11th: 🌽
Corn sell signal at $4.51 200-day MA
CLICK HERE TO VIEW
Oct 2nd: 🌾
Wheat sell signal at $6.12 target
Sep 30th: 🌽
Corn protection signal at $4.23-26
Sep 27th: 🌱
Soybean sell & protection signal at $10.65
Sep 13th: 🌾
Wheat sell signal at $5.98
May 22nd: 🌾
Wheat sell signal when wheat traded +$7.00
Want to Talk?
Our phones are open 24/7 for you guys if you ever need anything or want to discuss your operation.
Hedge Account
Interested in a hedge account? Use the link below to set up an account or shoot Jeremey a call at (605)295-3100.
ARGY TAXES REAPPLIED. HOW MUCH SUPPLY TO OFFSET DEMAND?
MARKET UPDATE
You can scroll to read the usual update as well. As the written version is the exact same as the video.
Timestamps for video:
Argy, China, Trump News: 0:00min
Exports: 2:45min
Seasonals: 4:00min
Corn: 4:45min
Beans: 8:15min
Wheat: 11:40min
Cattle: 13:05min
Want to talk about your situation?
(605)295-3100
Your free trial has ended
You will not receive our next signal or future updates
Lock in our harvest sale before its over
Futures Prices Close
Overview
Decent day for the grains as the wheat market catches a bid while the cattle market takes a hit.
Earlier this morning all the grains were decently higher, but both corn & soybeans faded off the early highs.
This first story is probably the biggest reason for the strength.
Argy News
This was the biggest news today and had the grains higher this morning.
Argentina's cut to their export tax is already over after just 3 days. As export tax is back on for the grains but still on for beef.
The terms of this cut to export tax on grains were that the cuts remained until October 31st or if grain/oilseed export sales reached the $7 billion cap.
They already met that $7 billion cap so taxes have been re-applied.
Sources say that China bought around 90 million bushels of soybeans from Argentina while taxes were cut.
So we undoubtedly lost some business there.
However, we probably won’t be seeing much more business out of Argentina now.
The reason that Argentina did the tax cuts was to generate some cash and help boost their economy.
As the Argentina Peso has lost -99% of it's value compared to the US Dollar in the past decade, and lost -30% of it's value this year alone. Despite getting a +10% bounce this week due to all of this news.

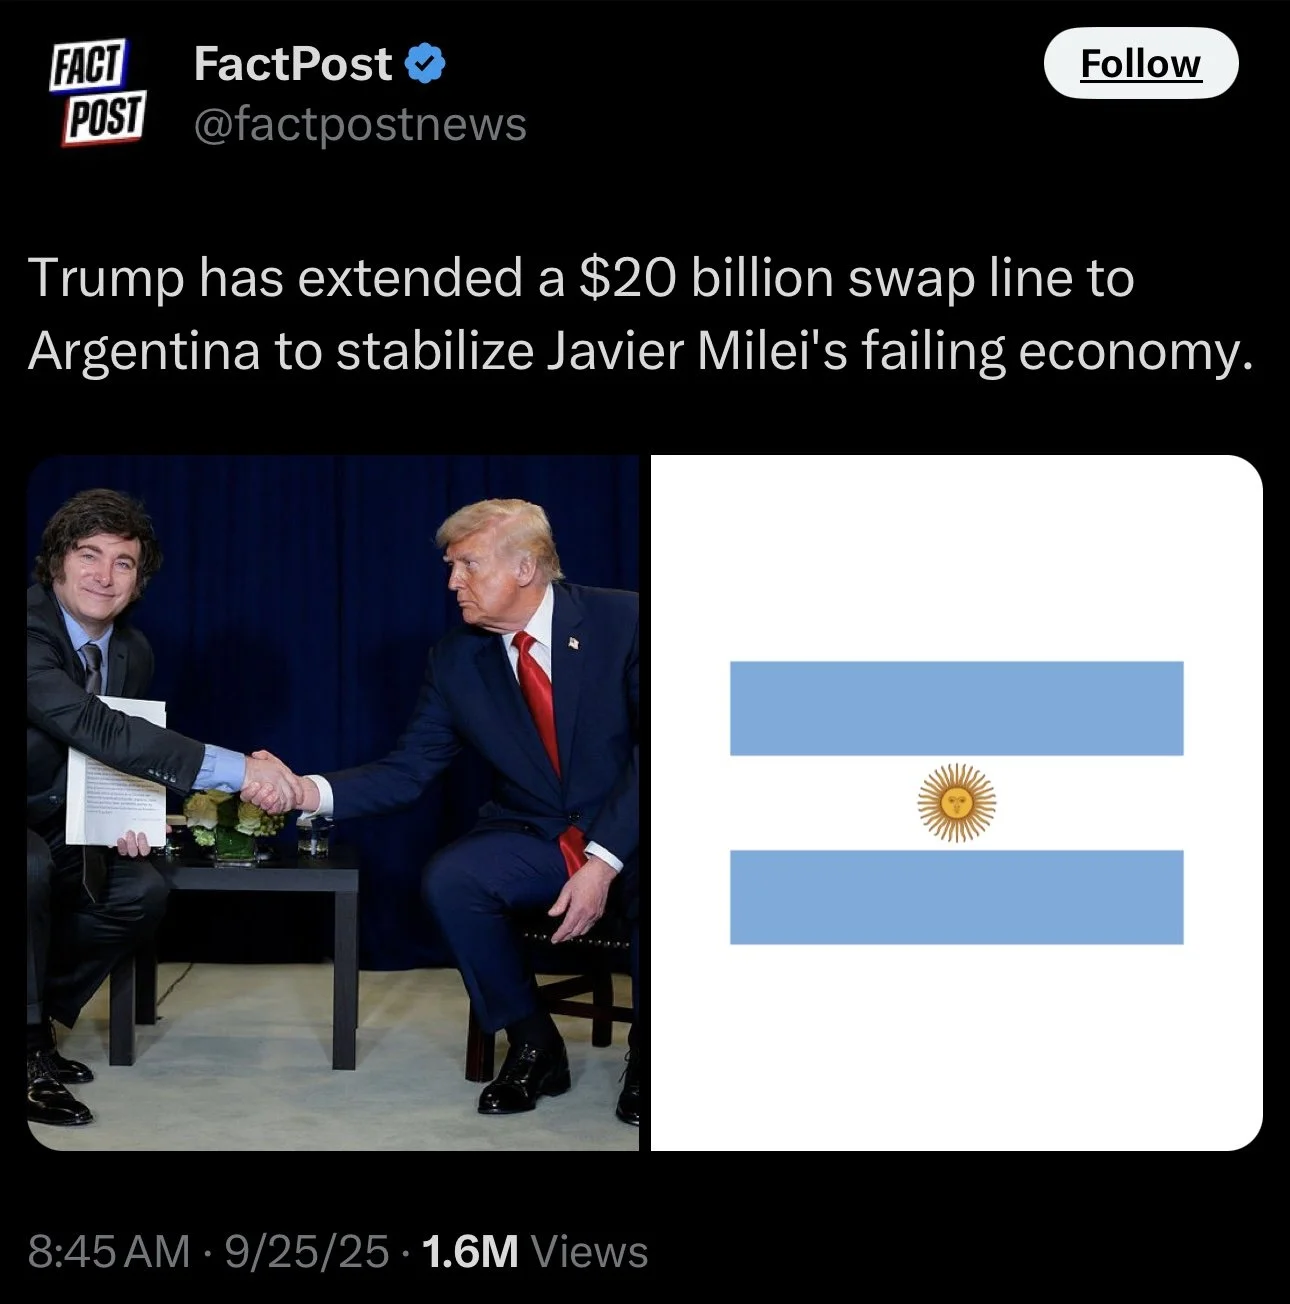
The US has now announced they are going to extend a $20 billion currency swap line to Argentina, and also buy Argentina's bonds.
Essentially, they are lending $20 billion USD to Argentina. Argentina can then use that money to help stabilize it's economy. Later on, Argentina is then suppose to swap the money back to the US.
By the US doing this, yes we are helping support one of our biggest competitors. But by giving them money, does that now help keep their exports closed for longer now? Potentially helping China come to the table if Argy is closed for business. Who knows, but something to think about.
China News
On Monday, China expressed that they were possibly interested in buying US soybeans.
They signaled that they could buy US soybeans ahead of bigger trade talks "IF" the tariffs were dropped.
On the export market, US soybeans are cheaper than Brazil. But the tariffs are making Brazil beans cheaper than US ones. So China continues to stay away.
Basically, China says they will only buy our beans if we lift the tariffs.

Trump News
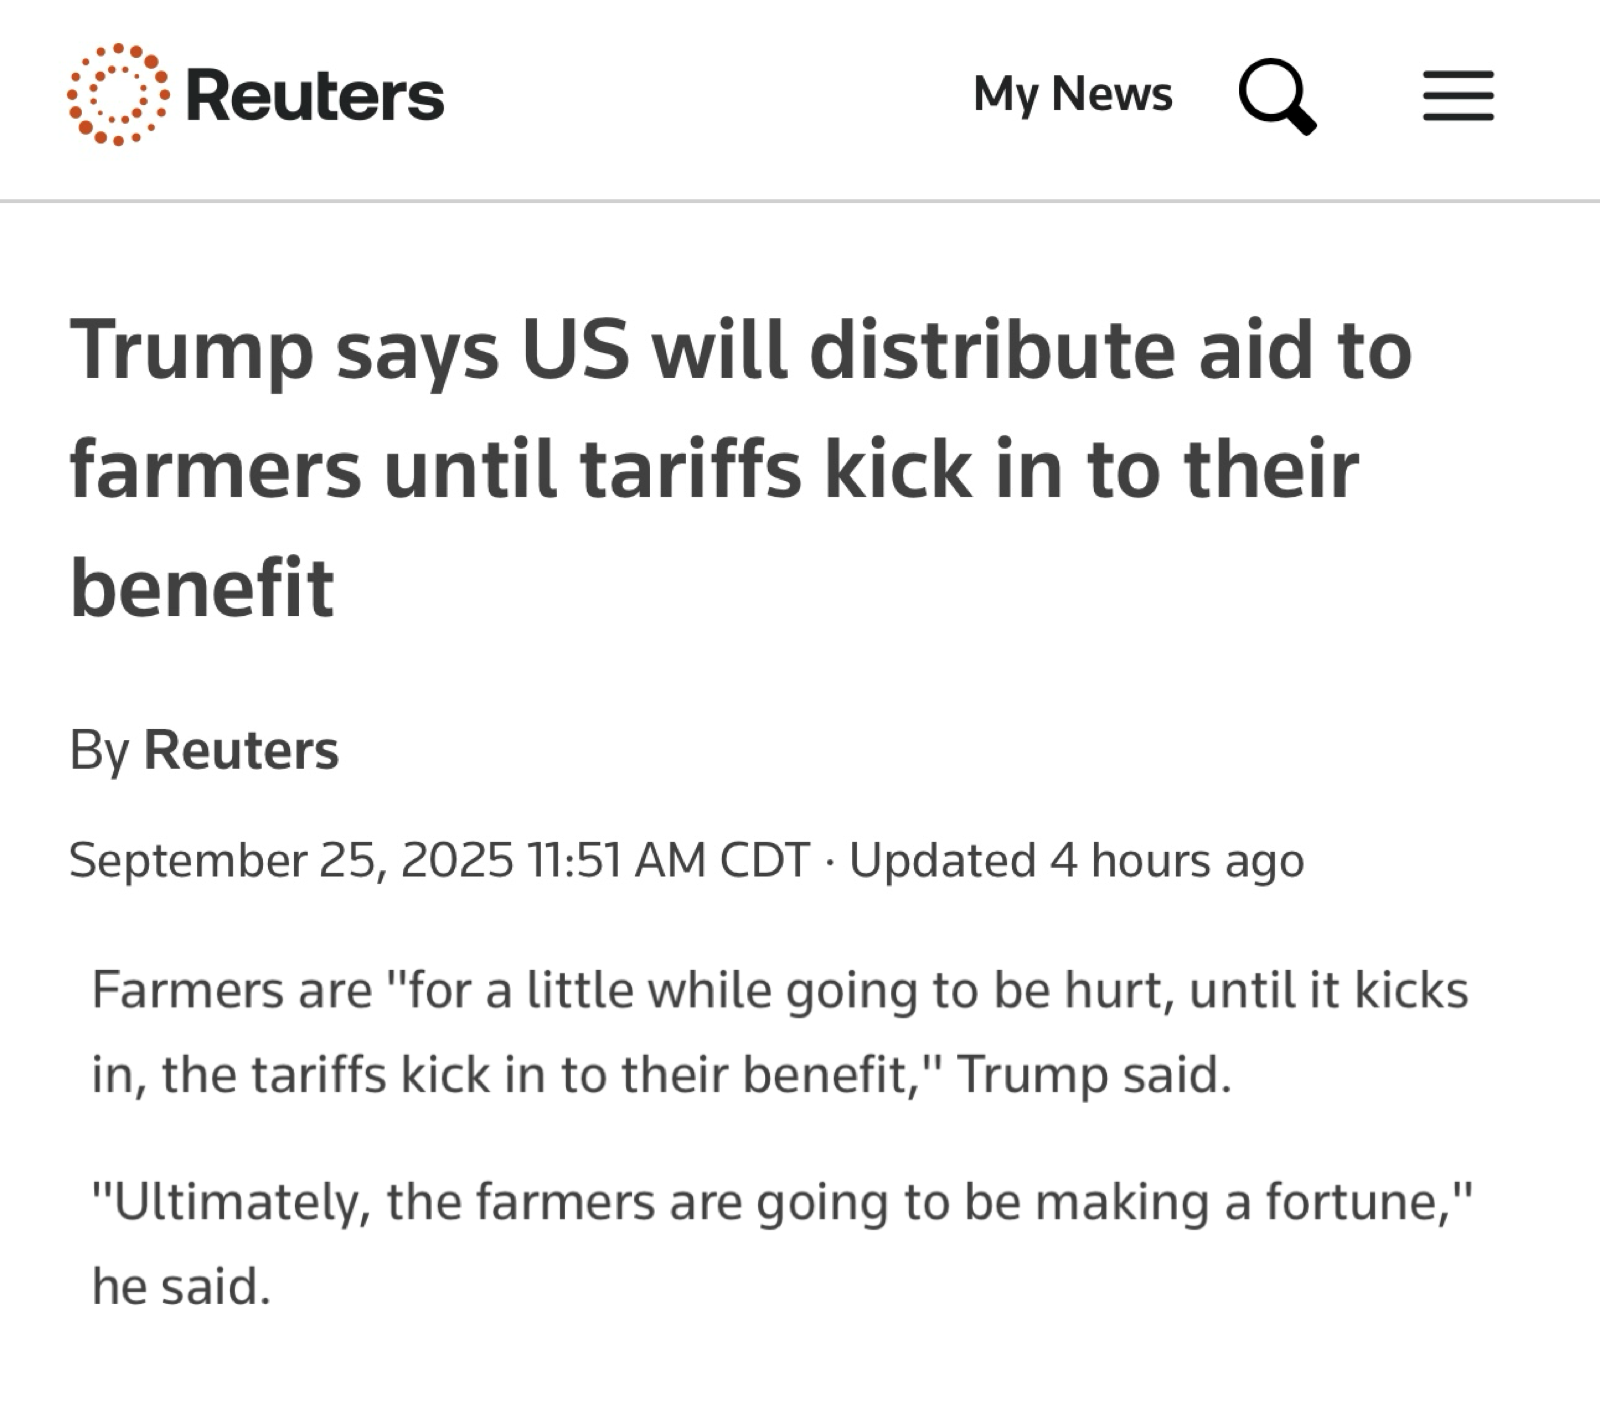
Trump announced that US farms will receive some of the proceeds from tariff revenues.
He said:
"Farmers are going to hurt for a little while, until the tariffs kick in to their benefit."
"Ultimately, the farmers are going to be making a fortune."
This does kind of sound like he is not expecting a deal to be struck with China soon, as he makes it sound like the tariffs are here to stay and China essentially said they won’t buy soybeans until the tariffs go away.
Exports
Corn 🌽
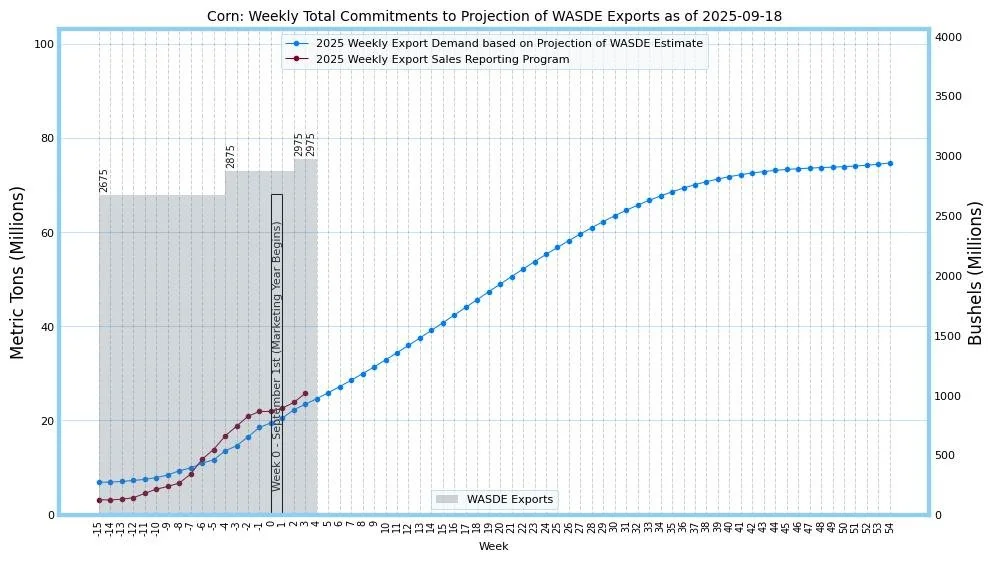
We now have RECORD corn exports.
We have offically passed 2021.
The craziest part is that in 2021, China accounted for nearly 50% of all of these exports.
We haven’t sold a penny to China this year.
Chart from Karen Braun
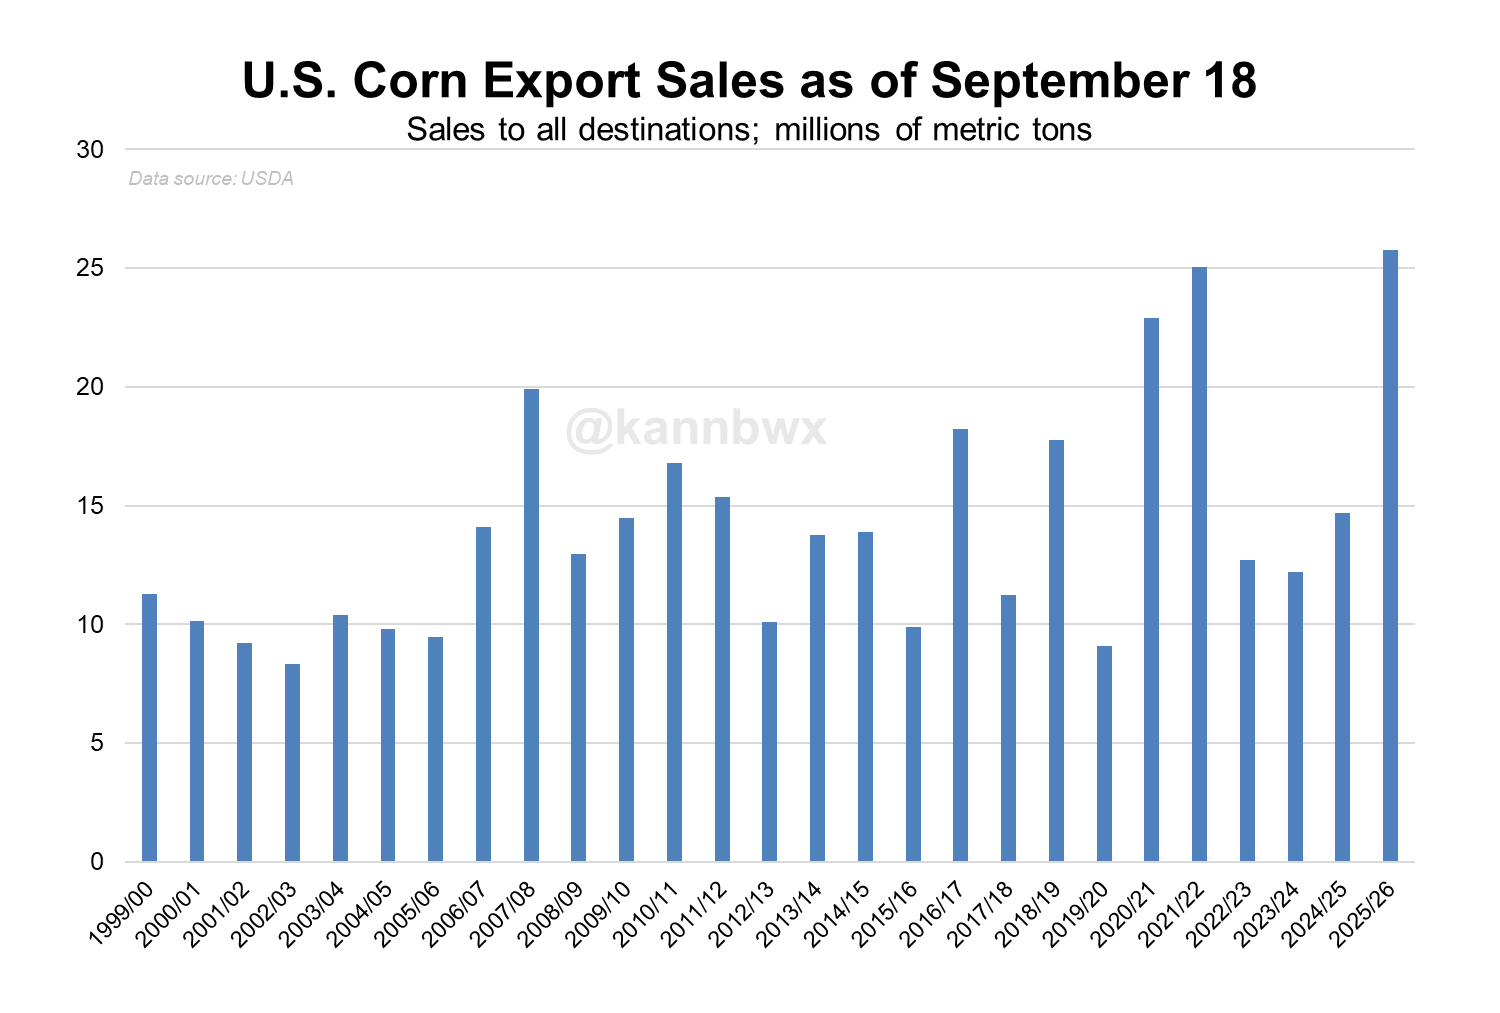
Corn is +5% ahead of the USDA's estimates.
Those estimates already seemed pretty large to begin with, but we are now surpassing them.
Needless to say, corn demand remains phenomenonal.
Many have tried to argue that corn export estimates are too high, but based on this, you can’t really make that argument yet.
The USDA has some lofty expectations, but we are continuing to impress.
I think the bigger question mark for corn demand is going to be the feed and residual. Not exports.
Chart from Robert McClure on X
Soybeans 🌱
Soybeans exports on the other hand remain well below expectations.
Demand everywhere outside of China has been great, but it's hard to make up for the lack of China.
As soybean exports are -19% behind the USDA's expectations.
We are almost certainly going to see the USDA lower their export projections for soybeans.
Chart from Robert McClure on X

Wheat 🌾
Wheat demand remains great along with corn demand.
Well ahead of the USDA's current projections.
Chart from Robert McClure on X
Seasonals Update
Corn 🌽
5 Year:
We've followed this one very close this year. It marked the exact bottom and rally thus far. It has us grinding higher the rest of the year.
10 Year:
This one says we make our highs in October before grinding sideways.
Beans 🌱
5 Year:
Typically we carve out lows in early to mid-October before rallying into November. Which typically coincides with some South America production uncertainty.
Wheat 🌾
The 5, 10, and 15 year seasonal all say we head higher from here.
All of them have us posting our local top in mid-October.

Today's Main Takeaways
Corn
Demand is amazing.
Yield is getting smaller, some say perhaps drastically smaller.
However, the only reason you can’t get super bullish on this corn market (not yet anyways) is because we are going to have record production even if that yield falls short.
Here is a chart that shows corn production over the years, along with where production would be based on different yield scenarios.
Even if yield fell all the way down to 175, we would still print a record production number given the massive acres.
The current estimates have us being rougly +1.5 billion bushels higher than our previous record in 2023.
That is how big our production is.

However, on the bright side, demand is also the strongest it has ever been. So this helps offset that.
Production is indeed getting smaller.
We've already priced in a massive crop.
So you can’t really get bearish corn here either.
Normally, we are suppose to struggle to rally throughout harvest.
However, once harvest is out of the way and once we get into that January report where I am sure yield is going to be smaller, you do have to wonder where the ceiling is in this corn market.
Here are a few balance sheet scenarios, without changing demand numbers.
Arlan Suderman says this crop is between 178 to 182, and would be surprised if it was bigger but not smaller.
So here is what those potential balance sheets could look like. As always, demand will be cut to offset some of these losses. But it gives you an idea.
Here is the current balance sheet for reference:

182:
It would put our stocks to use ratio around 10.5% to 11% depending on how much they drop demand.
With a 1.7 billion bushel carryout.
That still isn’t exactly bullish, but it's not sub $4 corn bearish.
180:
Here is where things get a little more interesting.
It drops our carryout to 1.5 billion.
Again, this is barring demand changes. If the USDA drops demand by a -100 million then you simply add +100 million to our carry out and get 1.6 billion instead.
It drops our stocks to use ratio below 10%, which is considered bullish.

178:
Now this could potentially paint a bullish situation in the corn market.
This drops carryout down to 1.3 billion.
Dropping our stocks to use ratio to nearly 8%.
In this scenario, even if the USDA dropped feed demand by -200 million our stocks to use would still be below 10% (check 2nd chart for this).
So a 178 could give you a bullish scenario even if demand estimates are too high.
Daily Dec Chart:
Still planning on de-risking at $4.35
That gives back 50% of the Feb highs and is key support from spring.
No damange has been done to this chart. We are simply consolidating above previous resistance. Old resistance is new support.
The price action is pretty similar to what we saw before that last bullish pennant breakout. As before that breakout we consolidated right at old resistance as well.
Short term I'd like to see us hold this newly formed trend and that blue support box. If the box breaks we probably make a leg lower.
Soybeans
The soybean market is struggling to make a decision.
Does the potential loss in supply make up for the possible loss in demand?
China is the wild card.
Most are saying that exports for soybeans could drop by -300 to -400 million if China refuses to come to the table.
Currently, our exports are behind by -19%. If we continued this pace, exports would end up short by -320 million.
So let's dive into how this impacts the balance sheet and how much supply loss it would take to truly offset these demand losses if we see them.
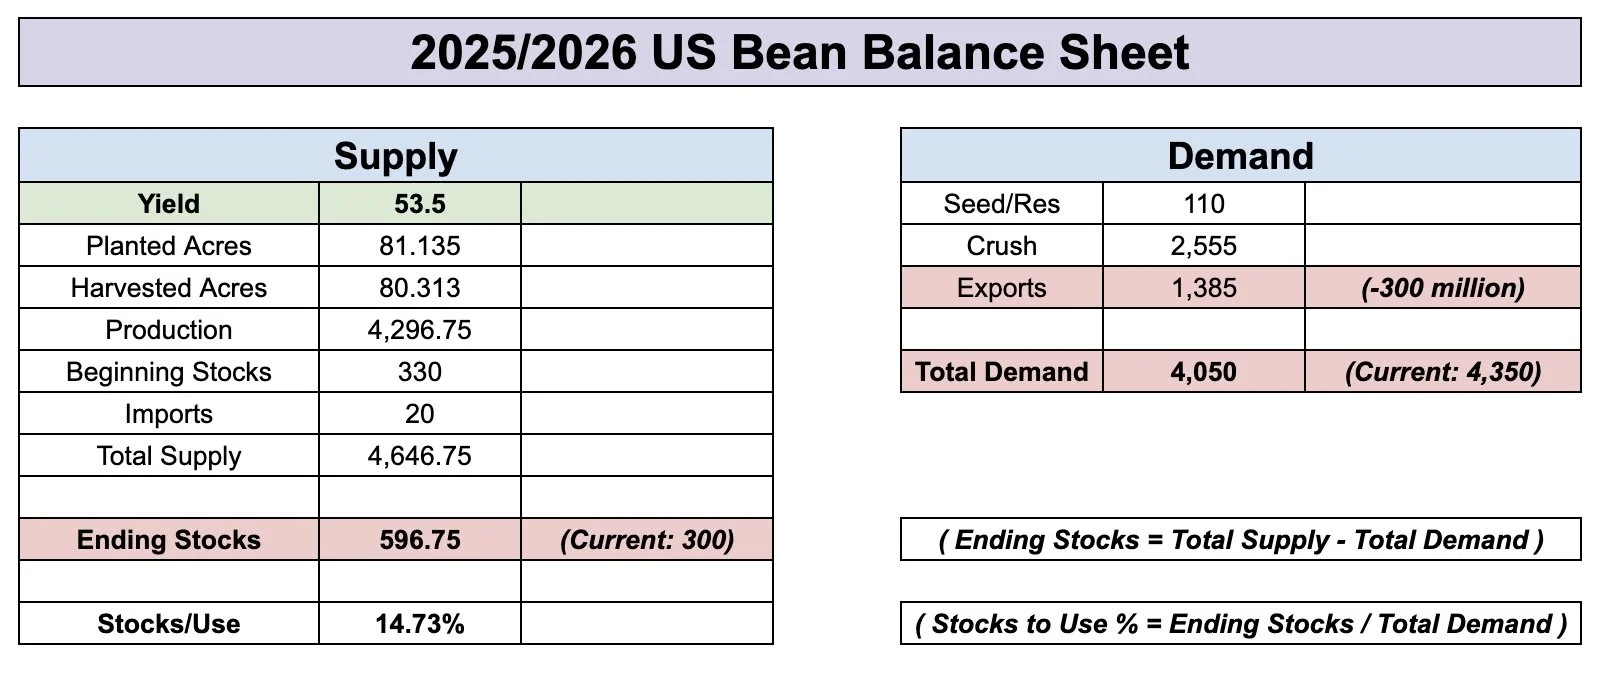
For this experiment, we are cutting exports by -300 million and only changing yield.
Here is the current balance sheet for reference:

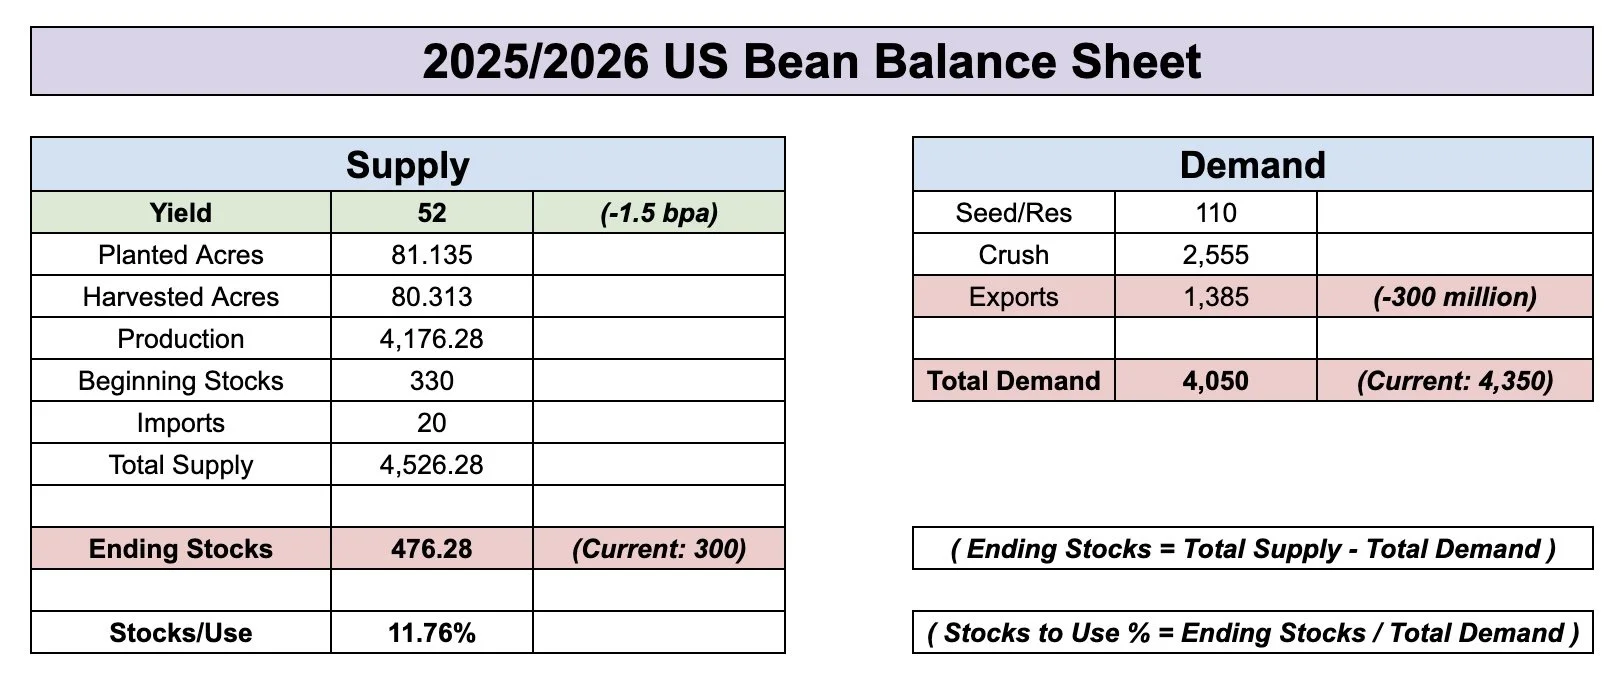
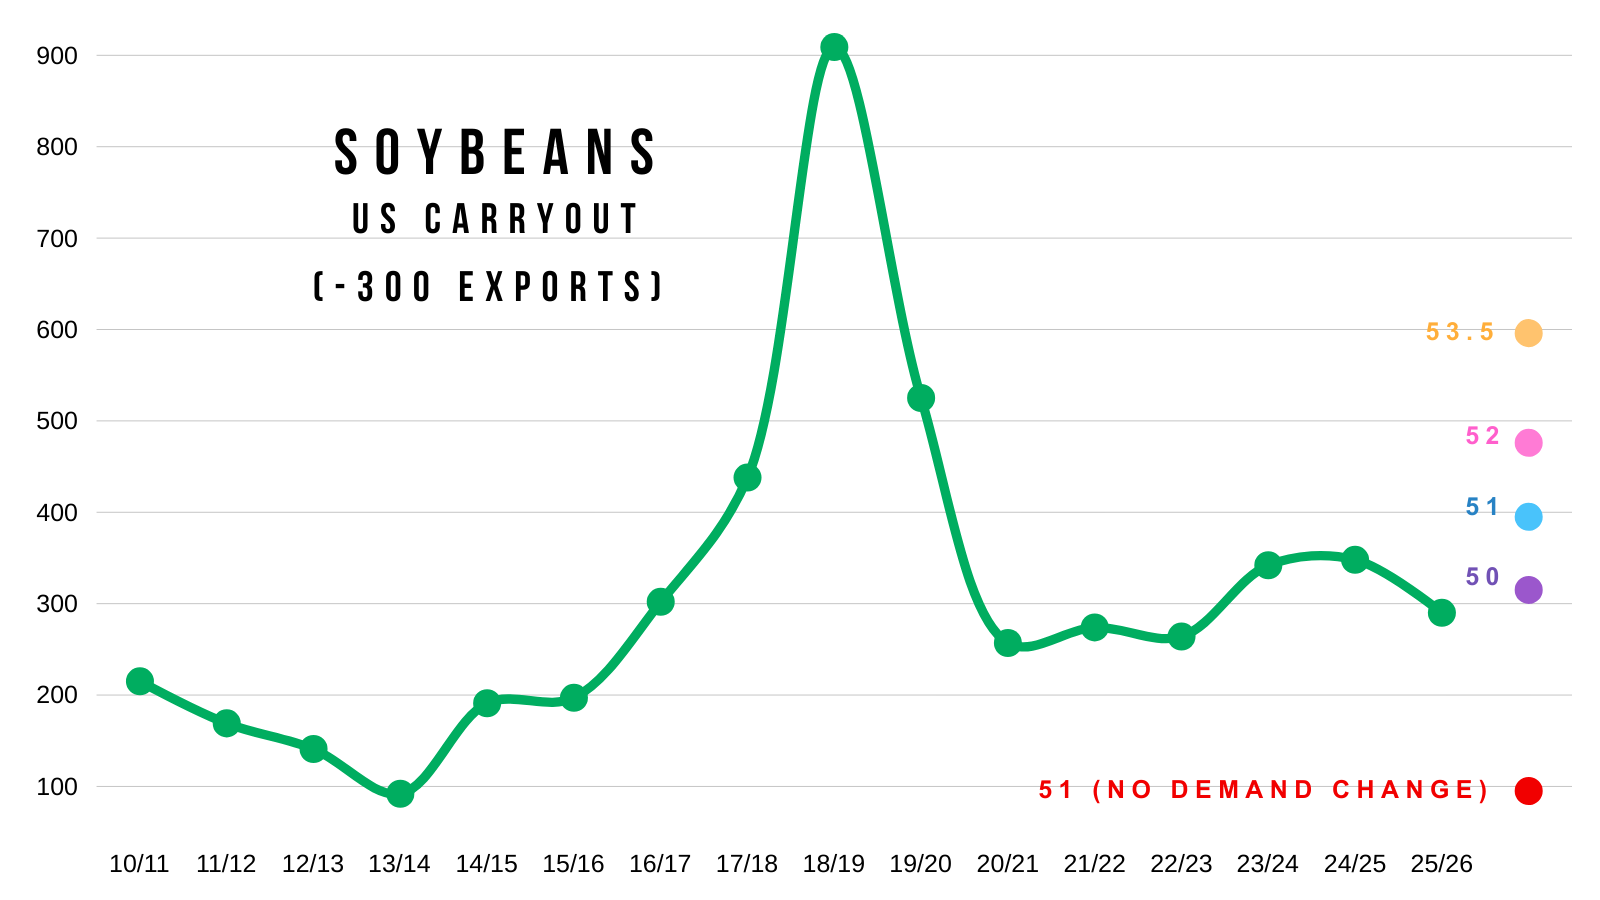
53.5 Yield:
With the loss in exports, this would sky rocket our carryout to 600 million vs the current 300 million.
Our carryout would double.
We had a 300 million carryout. We lost -300 million demand. Which results in a 600 million carryout.
Now that is very bearish.
It would be the highest since the trade war.
52 Yield:
Carryout would still be almost 500 million.
Still very bearish.
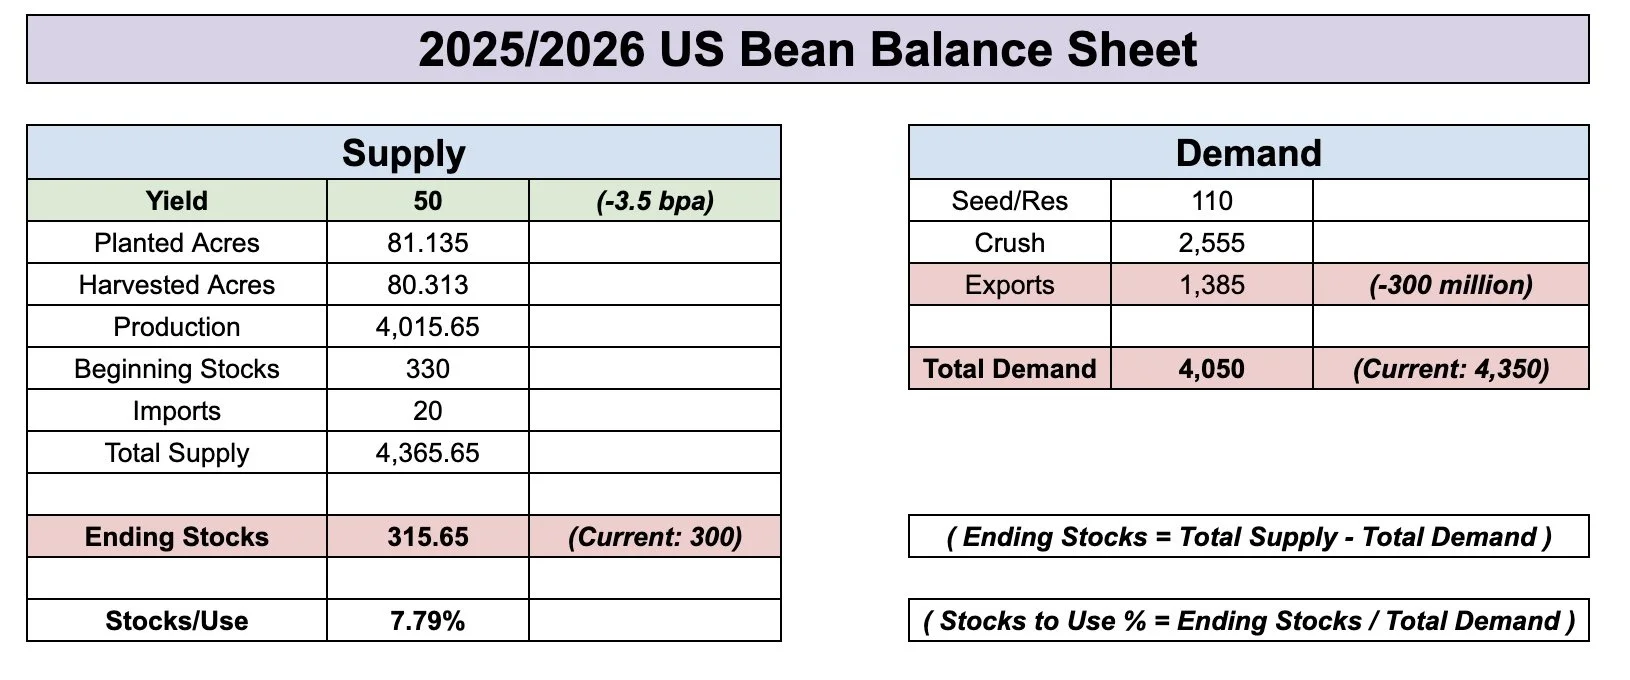
51 Yield:
Carryout is 400 million.
That isn’t crazy trade war bearish, but is still far from being super friendly.
For reference, our final carryout the last two years was around 350 million.

50 Yield:
Carryout would remain roughly the same as it is today with a 53.5 yield.
So if exports are cut by -300 million, it would take a 50 bpa yield to offset those losses in demand.
Leaving our balance sheet about where it is at today.
Which is the tightest in 3 years, but still not considered out of this world bullish.
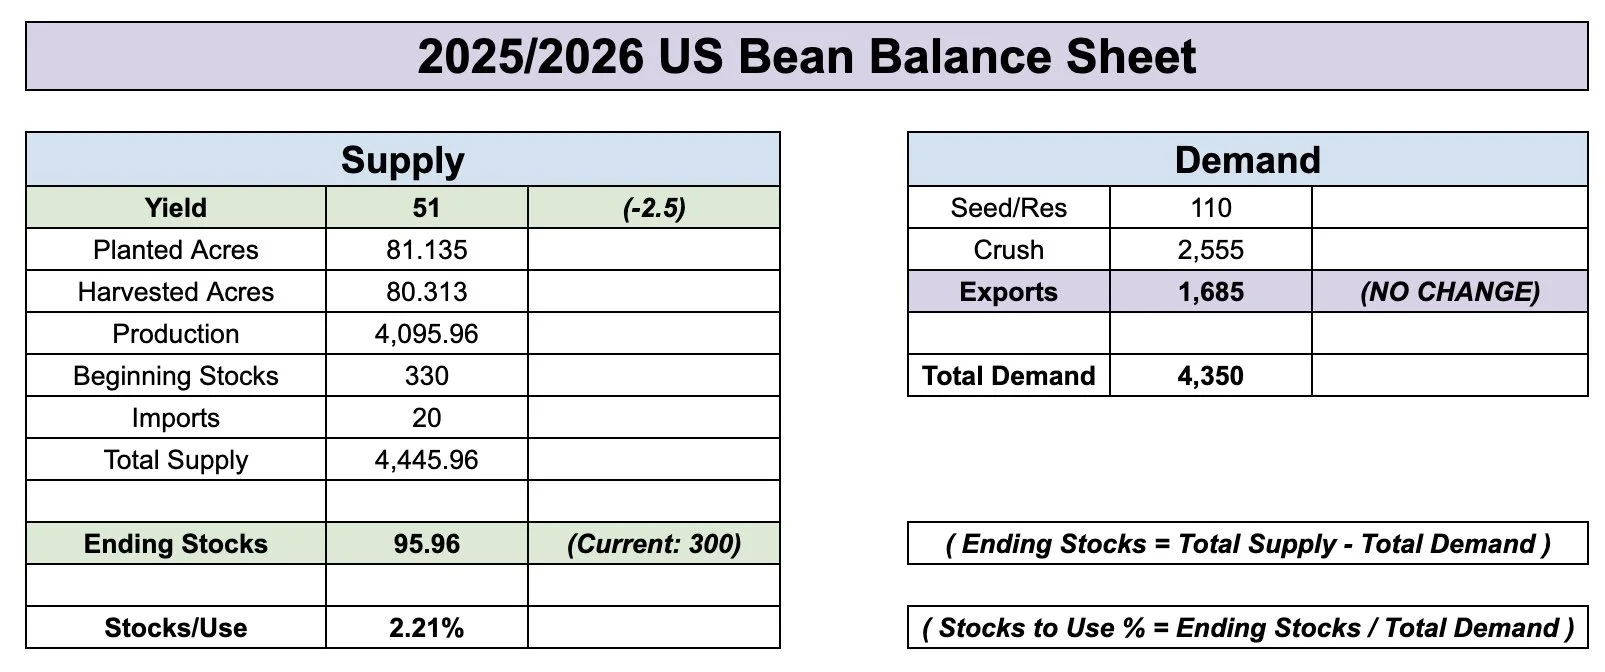
51 Yield & No Demand Change:
Now here is the balance sheet if demand wasn’t dropped at all and yield came in at 51.
It becomes virtually non-existent. Which would be very bullish.
However, there is no chance the USDA doesn’t lower exports to some extent.
The bigger question is by how much?
Here is what all of those examples look like compared to other years.
This is why there is so much uncertainty in this market, and why you could argue for $9 or $12 soybeans and no one would call you crazy for either argument.
If China actually doesn’t buy any soybeans at all, we could be in trouble.
But if demand isn’t actually in trouble and our yield isn’t as big as advertised, there is a realistic path for this thing to get incredibly tight.
Daily Nov Chart:
Soybeans still hovering right at this 61.8% level at $10.12
This is where the market makes a decision. We either bounce and this is it for the sell off, or we make another leg lower.
If we take out Tuesday's low, I could easily see us testing the $9.90 level. Which is where that trendline that marked the last 3 major bottoms is at.
That is where I would look at some potential re-ownership strategies if we get there.
For now, I am waiting to see what decision the market makes here at this critical spot.

Wheat
Nothing to update fundamentally on the wheat market.
However, I am really liking what I am seeing on the charts.
Daily Chicago:
We are once again bouncing at the bottom of this massive channel like we have done a dozen times.
Now sitting in somewhat of a falling wedge pattern.
Today we did post an outside up day, where we took out yesterday’s lows but closed above yesterday’s highs.
That is seen as a positive sign.

If we zoom in here, I am still watching the $5.35 level.
I think if we break above there, it sparks a leg higher. If we break above, I'd be confident we finally posted our lows.
The chart looks promising but we need to break that level for confirmation.
First point of interest after that is $5.49

On Monday I talked about how we were showing some massive bullish divergence the past few weeks.
We posted new contract lows on Monday, but once again the RSI posted another higher high.
This tells us the downside momentum is getting weaker, not stronger.

Daily KC Wheat:
KC looks pretty good here as well.
Also sitting in a bigger picture wedge pattern.
Need to see us take out those highs from last week to say we found our true bottom.
After that our first point of interest is $5.40
Like Chicago, on Monday we printed some clear bullish divergence.

Cattle
Our partner Lauren of Texas Hedge specializes in the cattle market, and has more fundamental knowledge in this market than I do. Here is what she had to say:
Thoughts from Lauren Urbanczyk of Texas Hedge:
Feeder were limit up on Monday based on the secretary of ag saying that relief was coming to American ranchers to rebuild the beef herd, since cattle supply is historically low.
The market took this and ran with it as rumors of a stimulus package was coming for heffer retention. However, it was then confirmed today by the secretary of ag that there is no stimulus coming for cattle ranchers in the form of heffer rettenion.
So the market gave back all of it's early gains from earlier this week. Beef has struggled as we seasonally get a September pullback. So a lot of this is following the seasonals.
This situation was kind of a buy the rumor sell the fact situation. As the market digested the rumors to realize they were just rumors.
We have cash trading -$3 lower in Texas, and in some instances -$5 lower in Kansas. So a weaker tone to the markets to the cash side and to beef. We are starting to see the futures give away.
Both live and feeder cattle are about flat on the week. So tomorrow’s price action will important to see if we get higher weekly closes or not.

Oct Feeder:
Earlier this week we bounced right in the golden zone where we needed to.
On the recent bounce, we rejected right off the 78.6% retracement up to the contract highs (the 61.8% level is more common, but this bounce was overextended)
The most common correction pattern is an "ABC".
So the must hold spot here is the red box. If the red box fails to hold, we could easily get a broader correction down to the blue one. Which is the golden zone of the entire rally since June.
If we drop into the blue box, that is where I would potentially consider some re-ownership strategies.
We still like having protection up here.

Oct Live:
Very similar chart to feeder. Except on the recent rally we rejected right off the 61.8% level we talked about on Monday. Which is where we needed to close above to be more confident we'd go test the highs.
Area to hold is the red box.
If it fails, we could easily get that bigger correction towards the blue box.

Past Sell or Protection Signals
Aug 22nd: 🌱
Soybean sell signal & hedge alert.
July 31st: 🐮
Cattle sell signal & hedge alert.
July 10th: 🐮
Cattle sell signal & hedge alert.
CLICK HERE TO VIEW
June 5th: 🐮
Cattle sell signal & hedge alert.
June 2nd: 🌾
MPLS wheat sell signal.
April 10th: 🌽
Old crop corn sell signal.
March 19th: 🐮
Cattle hedge & sell signal.
Feb 18th: 🌽 🌾
Old crop KC wheat & old crop corn signal.
Jan 23rd: 🌽 🌱
Corn & beans old crop sell signal.
CLICK HERE TO VIEW
Jan 15th: 🌽 🌱
Corn & beans hedge alert/sell signal.
Jan 2nd: 🐮
Cattle hedge alert at new all-time highs & target.
Dec 11th: 🌽
Corn sell signal at $4.51 200-day MA
CLICK HERE TO VIEW
Oct 2nd: 🌾
Wheat sell signal at $6.12 target
Sep 30th: 🌽
Corn protection signal at $4.23-26
Sep 27th: 🌱
Soybean sell & protection signal at $10.65
Sep 13th: 🌾
Wheat sell signal at $5.98
May 22nd: 🌾
Wheat sell signal when wheat traded +$7.00
Want to Talk?
Our phones are open 24/7 for you guys if you ever need anything or want to discuss your operation.
Hedge Account
Interested in a hedge account? Use the link below to set up an account or shoot Jeremey a call at (605)295-3100.
WHEN WILL CORN DEMAND TRAIN SLOW DOWN?
AUDIO COMMENTARY
Still have caution in cattle
Don’t be exposed to margin in cattle
Waiting for next weeks big USDA report
Most I hear have yield less than last year
Demand is a big wild card
US soybeans could supply others who originally were getting supply from SA
Corn demand still remains salty
China is putting big bets on SA crops
Interest rates going lower
Things get interesting if yield drops
Like getting feed needs covered
The market says sell the carry
Don’t love taking grain to town at harvest
Where is bean bottom? (chart below)*
Listen to today’s audio below
Want to talk? (605)295-3100
Your free trial has ended
Don’t miss out on our next sell signal or future daily updates
Lock in our harvest sale before it ends
SOYBEAN CHART
Nov Beans 🌱
I’ve had this blue box as the must hold spot on the chart since we alerted that sell signal at the top.
This bottom of the box gives back 61.8% of the entire rally off $9.80. Breaking below tells us that this sell off is more than a simple correction.
This could still be a potential bear trap as we haven’t fully busted below this level, but if we close below yesterday’s lows it likely opens the door lower.
That $9.90 area would be an area of interest. That trendline that marked all 3 major bottoms in this market this year. That is where I would start to look at some re-owning strategies etc.
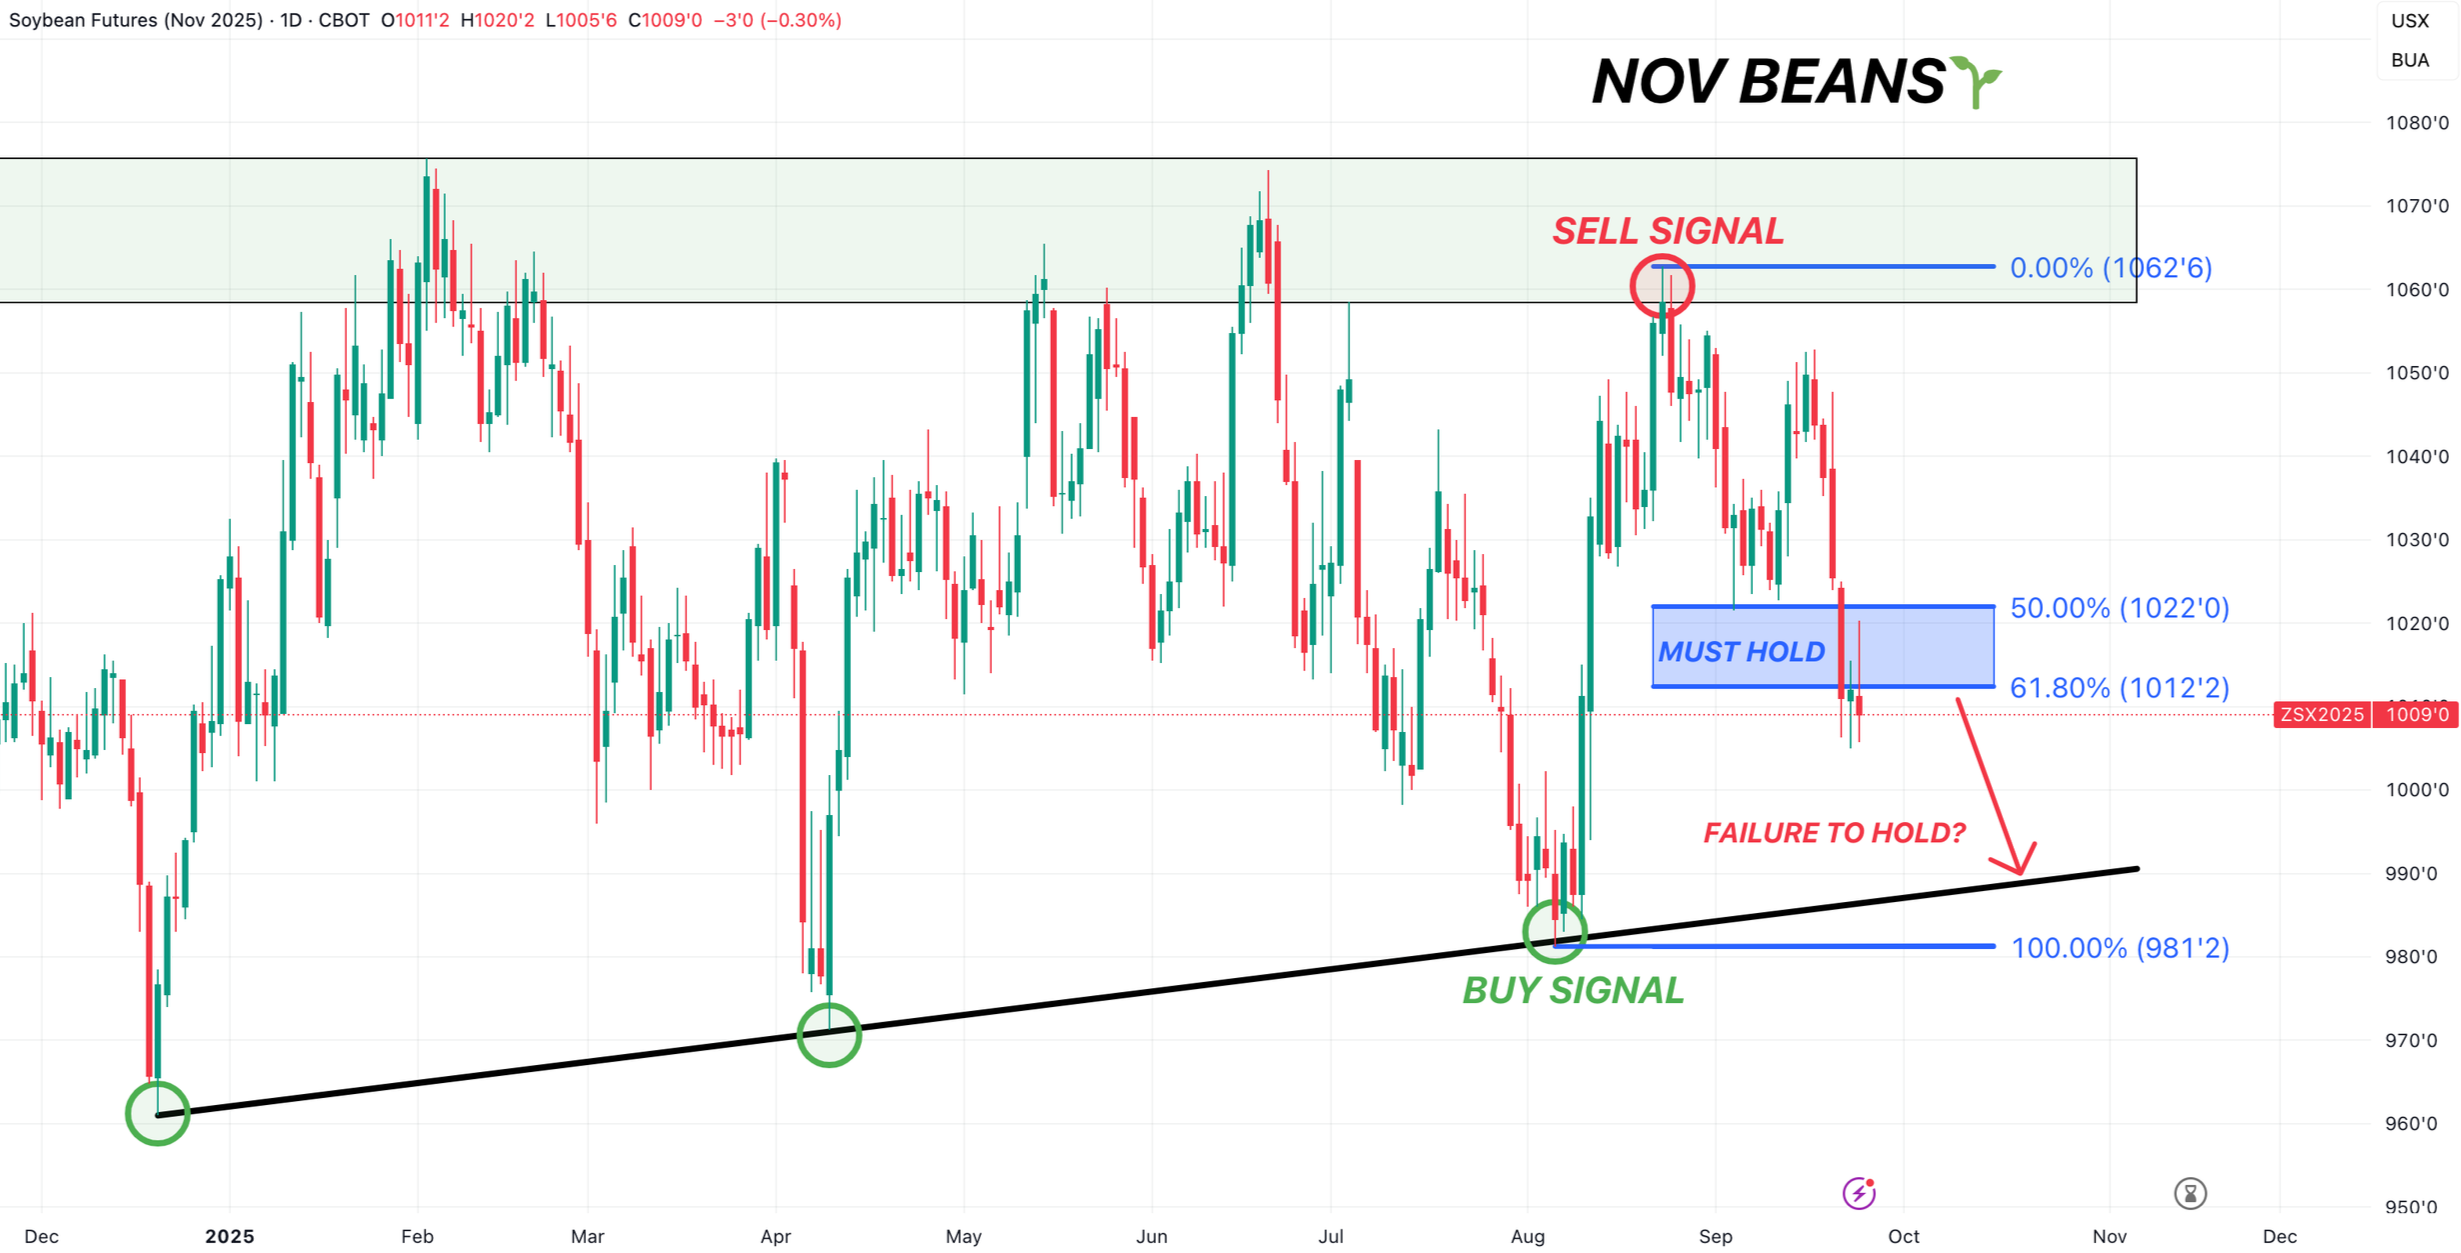
Past Sell or Protection Signals
Aug 22nd: 🌱
Soybean sell signal & hedge alert.
July 31st: 🐮
Cattle sell signal & hedge alert.
July 10th: 🐮
Cattle sell signal & hedge alert.
CLICK HERE TO VIEW
June 5th: 🐮
Cattle sell signal & hedge alert.
June 2nd: 🌾
MPLS wheat sell signal.
April 10th: 🌽
Old crop corn sell signal.
March 19th: 🐮
Cattle hedge & sell signal.
Feb 18th: 🌽 🌾
Old crop KC wheat & old crop corn signal.
Jan 23rd: 🌽 🌱
Corn & beans old crop sell signal.
CLICK HERE TO VIEW
Jan 15th: 🌽 🌱
Corn & beans hedge alert/sell signal.
Jan 2nd: 🐮
Cattle hedge alert at new all-time highs & target.
Dec 11th: 🌽
Corn sell signal at $4.51 200-day MA
CLICK HERE TO VIEW
Oct 2nd: 🌾
Wheat sell signal at $6.12 target
Sep 30th: 🌽
Corn protection signal at $4.23-26
Sep 27th: 🌱
Soybean sell & protection signal at $10.65
Sep 13th: 🌾
Wheat sell signal at $5.98
May 22nd: 🌾
Wheat sell signal when wheat traded +$7.00
Want to Talk?
Our phones are open 24/7 for you guys if you ever need anything or want to discuss your operation.
Hedge Account
Interested in a hedge account? Use the link below to set up an account or shoot Jeremey a call at (605)295-3100.
EFFECTS OF DEMAND & BEANS AT CRUCIAL SPOT
AUDIO COMMENTARY
Very crucial spot in soybeans (chart below)*
Soybeans have major upside potential and downside risk
There is a lot riding on South America weather soon
The effects of the Argy tax cuts
Long term demand picture
Crops are definitely smaller
How high we go depends on demand
2011 comparisons floating around
Still close to corn signal (chart below)*
Still believe wheat has upside (chart below)*
Do funds want to jump behind China story or lack of supply story in soybeans?
Have a game plan for basis contracts
Seasonals say soybeans go lower short term
Be proactive if you’re in a corner
Listen to today’s audio below
Want to talk? (605)295-3100
GRAIN CHARTS
Dec Corn 🌽
Bouncing at some support here in this blue box. Getting a re-test after the bullish pennant breakout. Would like to see us hold the blue box.
Target is still $4.35 as has been for weeks now.

Nov Beans 🌱
Soybeans fighting for their life. Trying to hang on to this must hold spot.
$10.12 gives back 61.8% of the rally off $9.80
Today we bounced +7 cents off the the lows and closed right at that 61.8% level.
Either we bounce right now, or if we close back below $10.12 we have a gap of air to the downside towards the $9.90 range.
Very very important spot here.

Dec Wheat 🌾
Bouncing right at the bottom of this channel once again.
We are still showing some very clear massive bullish divergence.
The level to watch is still $5.35.
If we clear that level we can be confident we are ready to turn higher.

Past Sell or Protection Signals
Aug 22nd: 🌱
Soybean sell signal & hedge alert.
July 31st: 🐮
Cattle sell signal & hedge alert.
July 10th: 🐮
Cattle sell signal & hedge alert.
CLICK HERE TO VIEW
June 5th: 🐮
Cattle sell signal & hedge alert.
June 2nd: 🌾
MPLS wheat sell signal.
April 10th: 🌽
Old crop corn sell signal.
March 19th: 🐮
Cattle hedge & sell signal.
Feb 18th: 🌽 🌾
Old crop KC wheat & old crop corn signal.
Jan 23rd: 🌽 🌱
Corn & beans old crop sell signal.
CLICK HERE TO VIEW
Jan 15th: 🌽 🌱
Corn & beans hedge alert/sell signal.
Jan 2nd: 🐮
Cattle hedge alert at new all-time highs & target.
Dec 11th: 🌽
Corn sell signal at $4.51 200-day MA
CLICK HERE TO VIEW
Oct 2nd: 🌾
Wheat sell signal at $6.12 target
Sep 30th: 🌽
Corn protection signal at $4.23-26
Sep 27th: 🌱
Soybean sell & protection signal at $10.65
Sep 13th: 🌾
Wheat sell signal at $5.98
May 22nd: 🌾
Wheat sell signal when wheat traded +$7.00
Want to Talk?
Our phones are open 24/7 for you guys if you ever need anything or want to discuss your operation.
Hedge Account
Interested in a hedge account? Use the link below to set up an account or shoot Jeremey a call at (605)295-3100.
ARGY NEWS BLOOD BATH
MARKET UPDATE
You can scroll to read the usual update as well. As the written version is the exact same as the video.
Timestamps for video:
Argy News: 0:00min
Trump & China: 2:30min
Dollar & Demand: 3:25min
Corn: 4:25min
Beans: 7:00min
Wheat: 11:05min
Cattle: 13:10min
Want to talk about your situation?
(605)295-3100
Your free trial has ended..
Don’t miss our next sell signal or future updates. Lock in our harvest sale so you’re ready for the next opportunity
Futures Prices Close
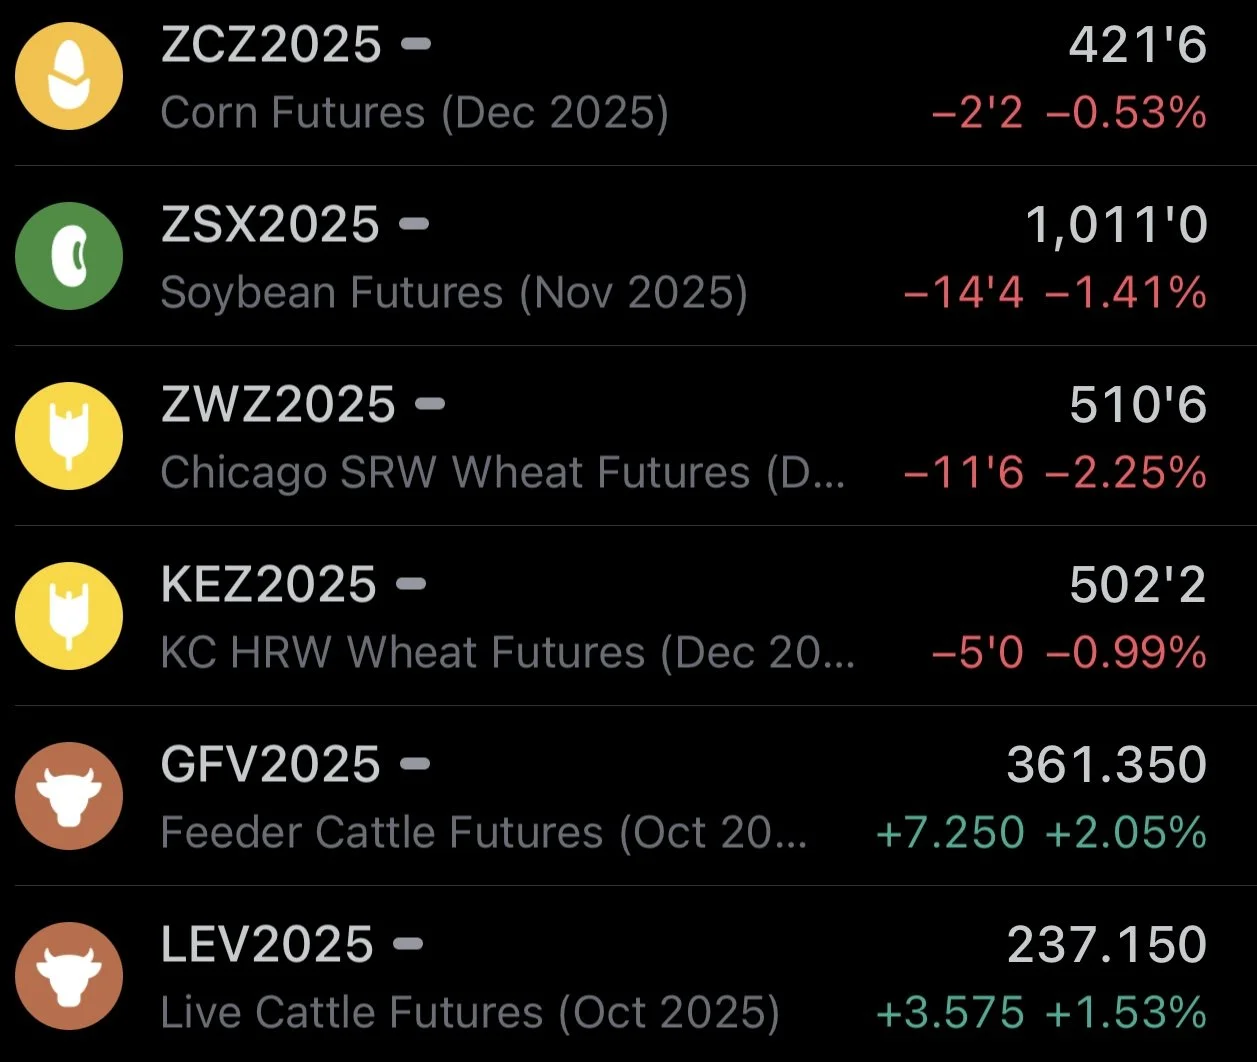
Overview
Blood bath in the grains to start the week. Soybeans and wheat we were hit hard while corn actually showed some nice resilience.
Meanwhile the cattle market continues to bounce in the golden zone off the back of screw worm news and a neutral to friendly cattle on feed report (we'll talk more about this in the cattle section).
Why the sell off in grains?
Some news caught the market off guard this morning. The news was that Argentina is removing export taxes on all grains until October 31st.
Before today, export tax for them was 9.5% on corn and wheat, and 26% on soybeans. It is now zero.
Why is this a big deal?
It essentially floods the market with cheaper product. Because this lowers the cost of exporting for Argentina, and incentivizes them to ramp up their exports. Pushing more supply to the market and adding competitive pressure to US exports.
More competition for our exports is bad for our prices. Because less exports results in more supply here at home.
Why did Argentina do this?
Normally, when they export, they are taxed every time they sent product out of the country. Which cuts into profits. Removing this tax now lets them keep more money for their product.
Removing this encourages farmers to sell their grain and bring more cash into their economy.
They want to help their economy because the value of the Argentina Peso is down -99% vs the US Dollar in the last 10 years.
Essentially, Argentina is hoping that this will accelerate exports and help stabilize their economy.

Argentina farmers are holding on to a lot of grain because they think selling now won’t give them enough money. This tax cut might help a little bit, but it is probably only a temporary fix to a bigger issue.
In 2023, Argentina inflation hit 300% and their inflation rate was above 25% per month.
Since then it has fallen down to 2% a month or 34% a year. Which is an improvement, but compared to the US we have a 2% yearly inflation target.
I'm not sure how negative of effect this is actually going to have on our exports. The tax cut is only for a month, and a lot of times the intial reaction to news can often be worse than the actual effects.
However, for soybeans specifically, having Argentina that much more competitive during prime shipping season isn’t friendly. Especially given China is already avoiding the US.
China & Trump
We talked about this in yesterday’s audio, but this was the biggest reason for the weakness on Friday in soybeans.
On Friday, soybeans were up +10 cents at one point during the call.
Immediately after the call we sold off and then closed down -12 cents because the call Trump and China had was a disappointment to say the least.
I mentioned last week that I thought it would be a nothing burger for ag and be mostly about TikTok. Which it was.
Their call mentioned absolutely nothing about soybeans.
Trump also mentioned that he wouldn’t be visiting China until early next year.
However, Trump did say he will meet with China's President in South Korea on October 31st.
The current trade truce deadline between the China and US is on Nov 10th.
So perhaps we get some good news then.
The issue is that if no progress is made until early next year, we would miss prime time shipping season.

US Dollar & Demand
I don’t believe there is a true correlation to the US dollar and grain prices.
Often times people will say "the wheat market is down because the dollar is higher today".
Well that just isn’t the case. If it was, wheat should’ve been posting an enormous rally. Cleary it hasn’t.
Here is the US dollar performance vs the wheat market performance the past few years.
Really no correlation. Especially this year.
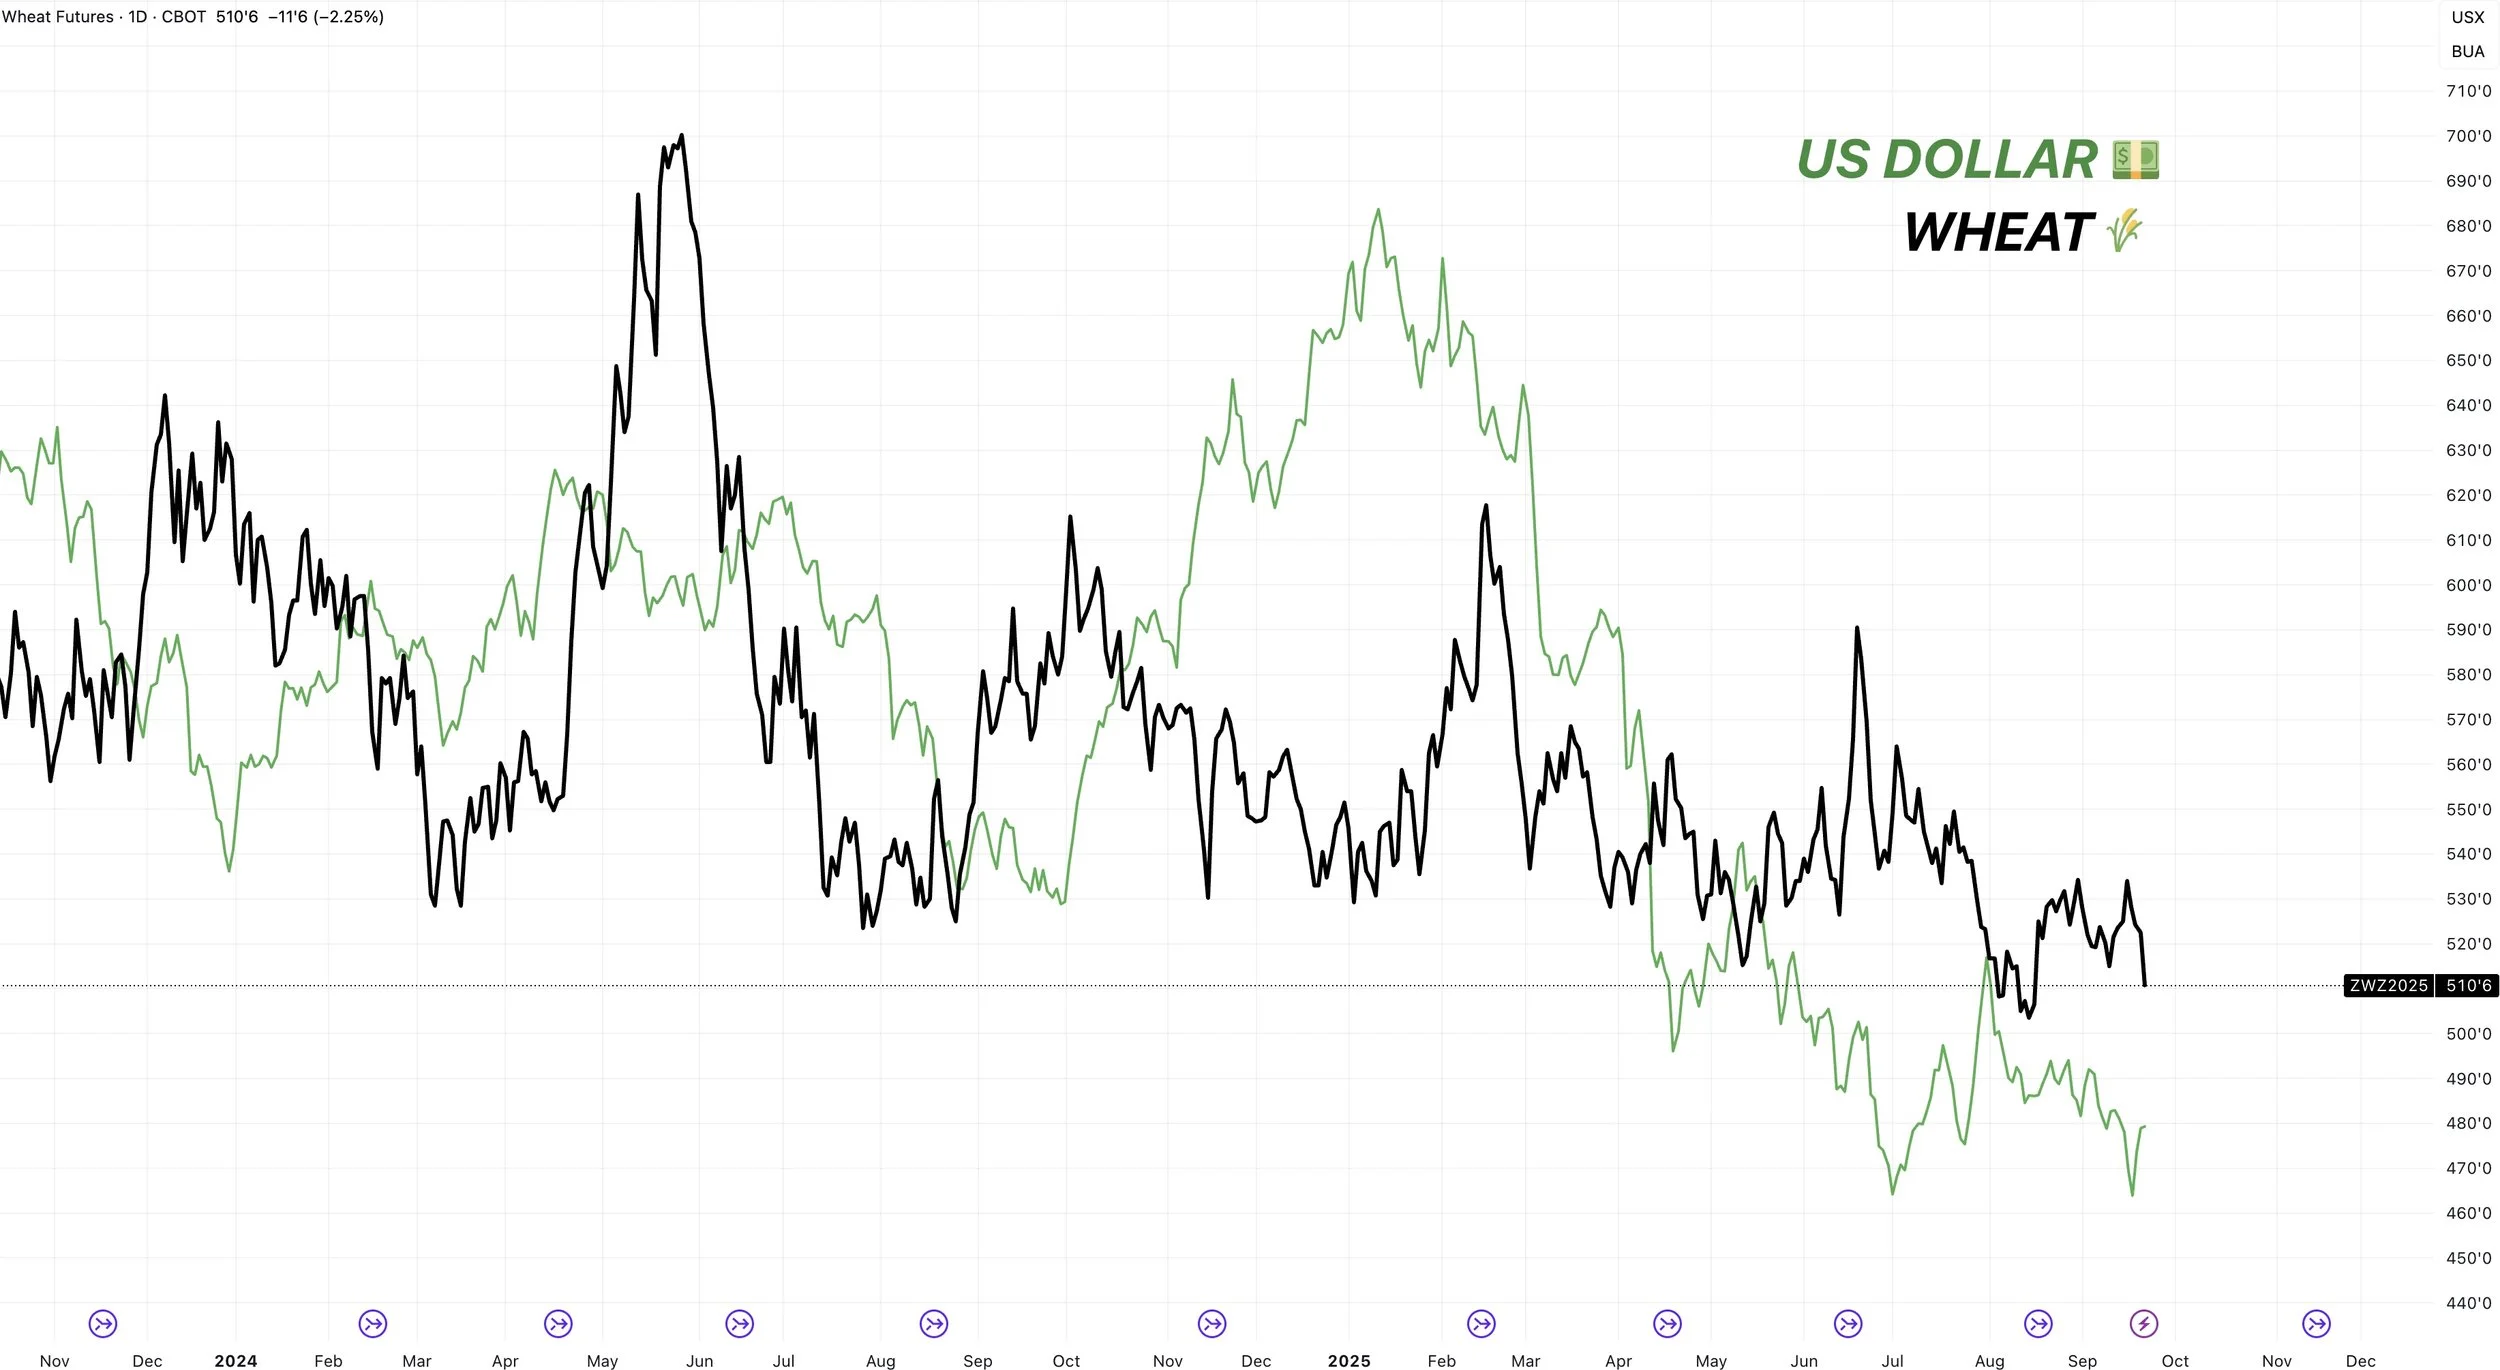
Despite this, a weaker US dollar is in fact friendly for the grains. It just isn’t a day to day correlation.
A weaker dollar makes us that much more competitive on exports and helps boost demand.
The US dollar is on track for one of it's weakest years in decades.
(2025 is in black)*
Corn and wheat demand are also posting some of their strongest export numbers in years.
For example wheat exports are up +21% vs last year.
They are the strongest compared to expectations in 12 years.
Chart from Karen Braun
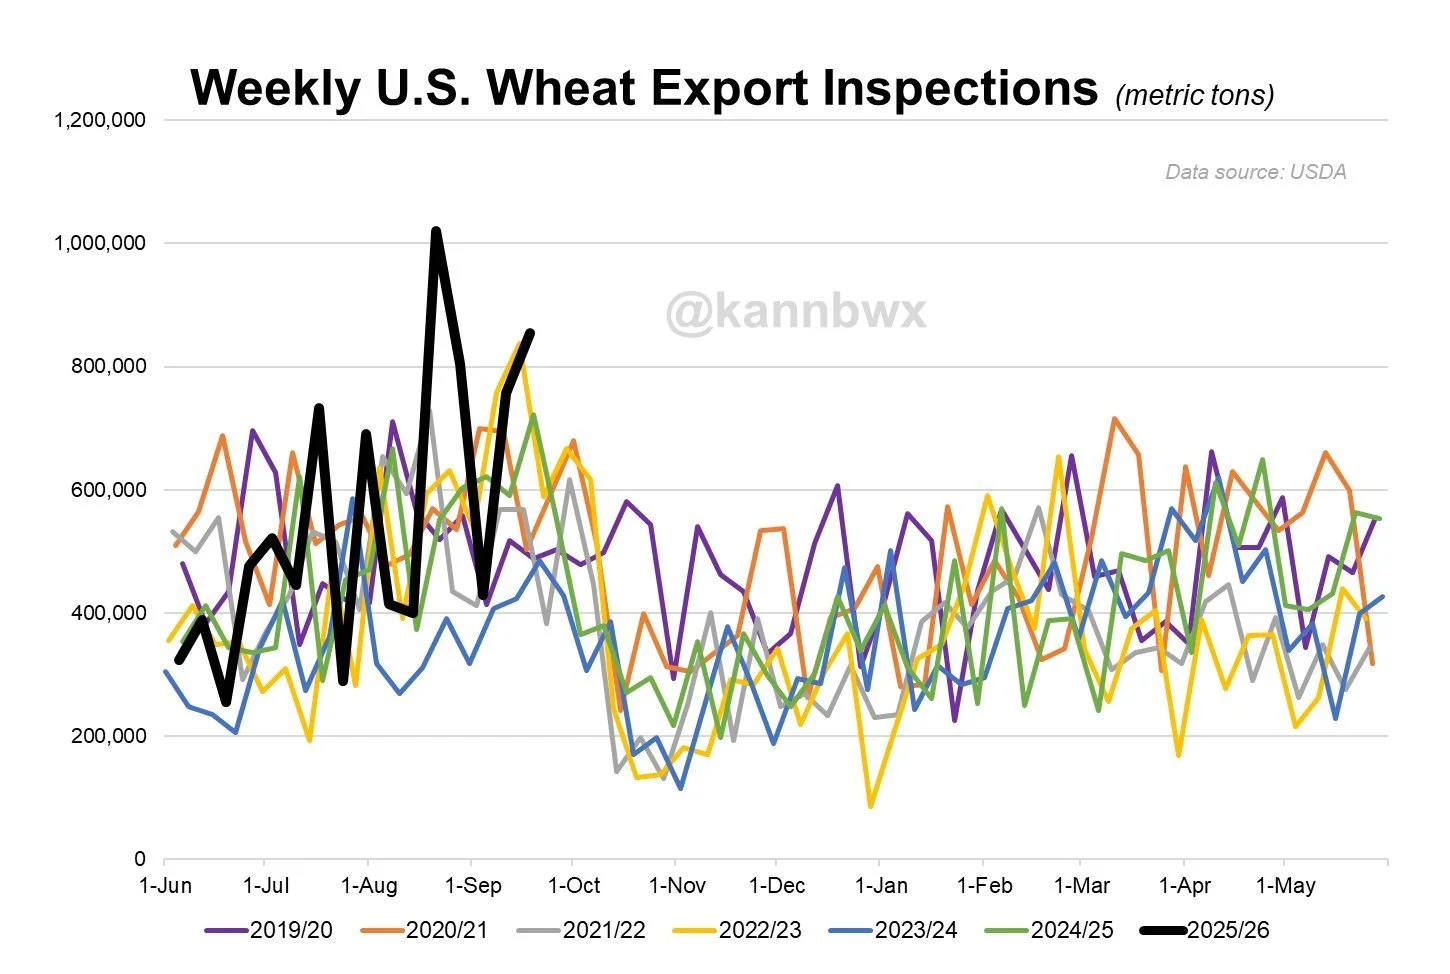
Today's Main Takeaways
Corn
The first thing I wanted to talk about in corn today was StoneX's Arlan Suderman.
In Market to Market last week, he was asked where he truly thinks this crop is at.
His Answer: 178 to 182
He said:
"I wouldn’t be surprised if it was lower than that, but I would be surprised if it was higher than that."

Arlan is the same person many were upset with just a few months ago because his yield survey model had a 188 corn yield back in August.
It's pretty clear this crop is getting smaller.
August StoneX Survey
Even if yield is 180 or so, we are still going to have a record crop and record acres.
Which makes it hard for corn to simply run away here, especially heading into harvest. We just saw a +40 cent rally ahead of harvest and normally it’s hard to rally through out harvest.
Now despite the fact we will have record production no matter how you cut the pie, this isn’t anything new.
The market is aware of this and has been pricing this in for months.
This market already priced in a near 190 yield.
The day the USDA gave us a 188.8 yield and added +1 billion bushels of supply to the balance sheet marked the exact lows in this market.
Because it was priced in.
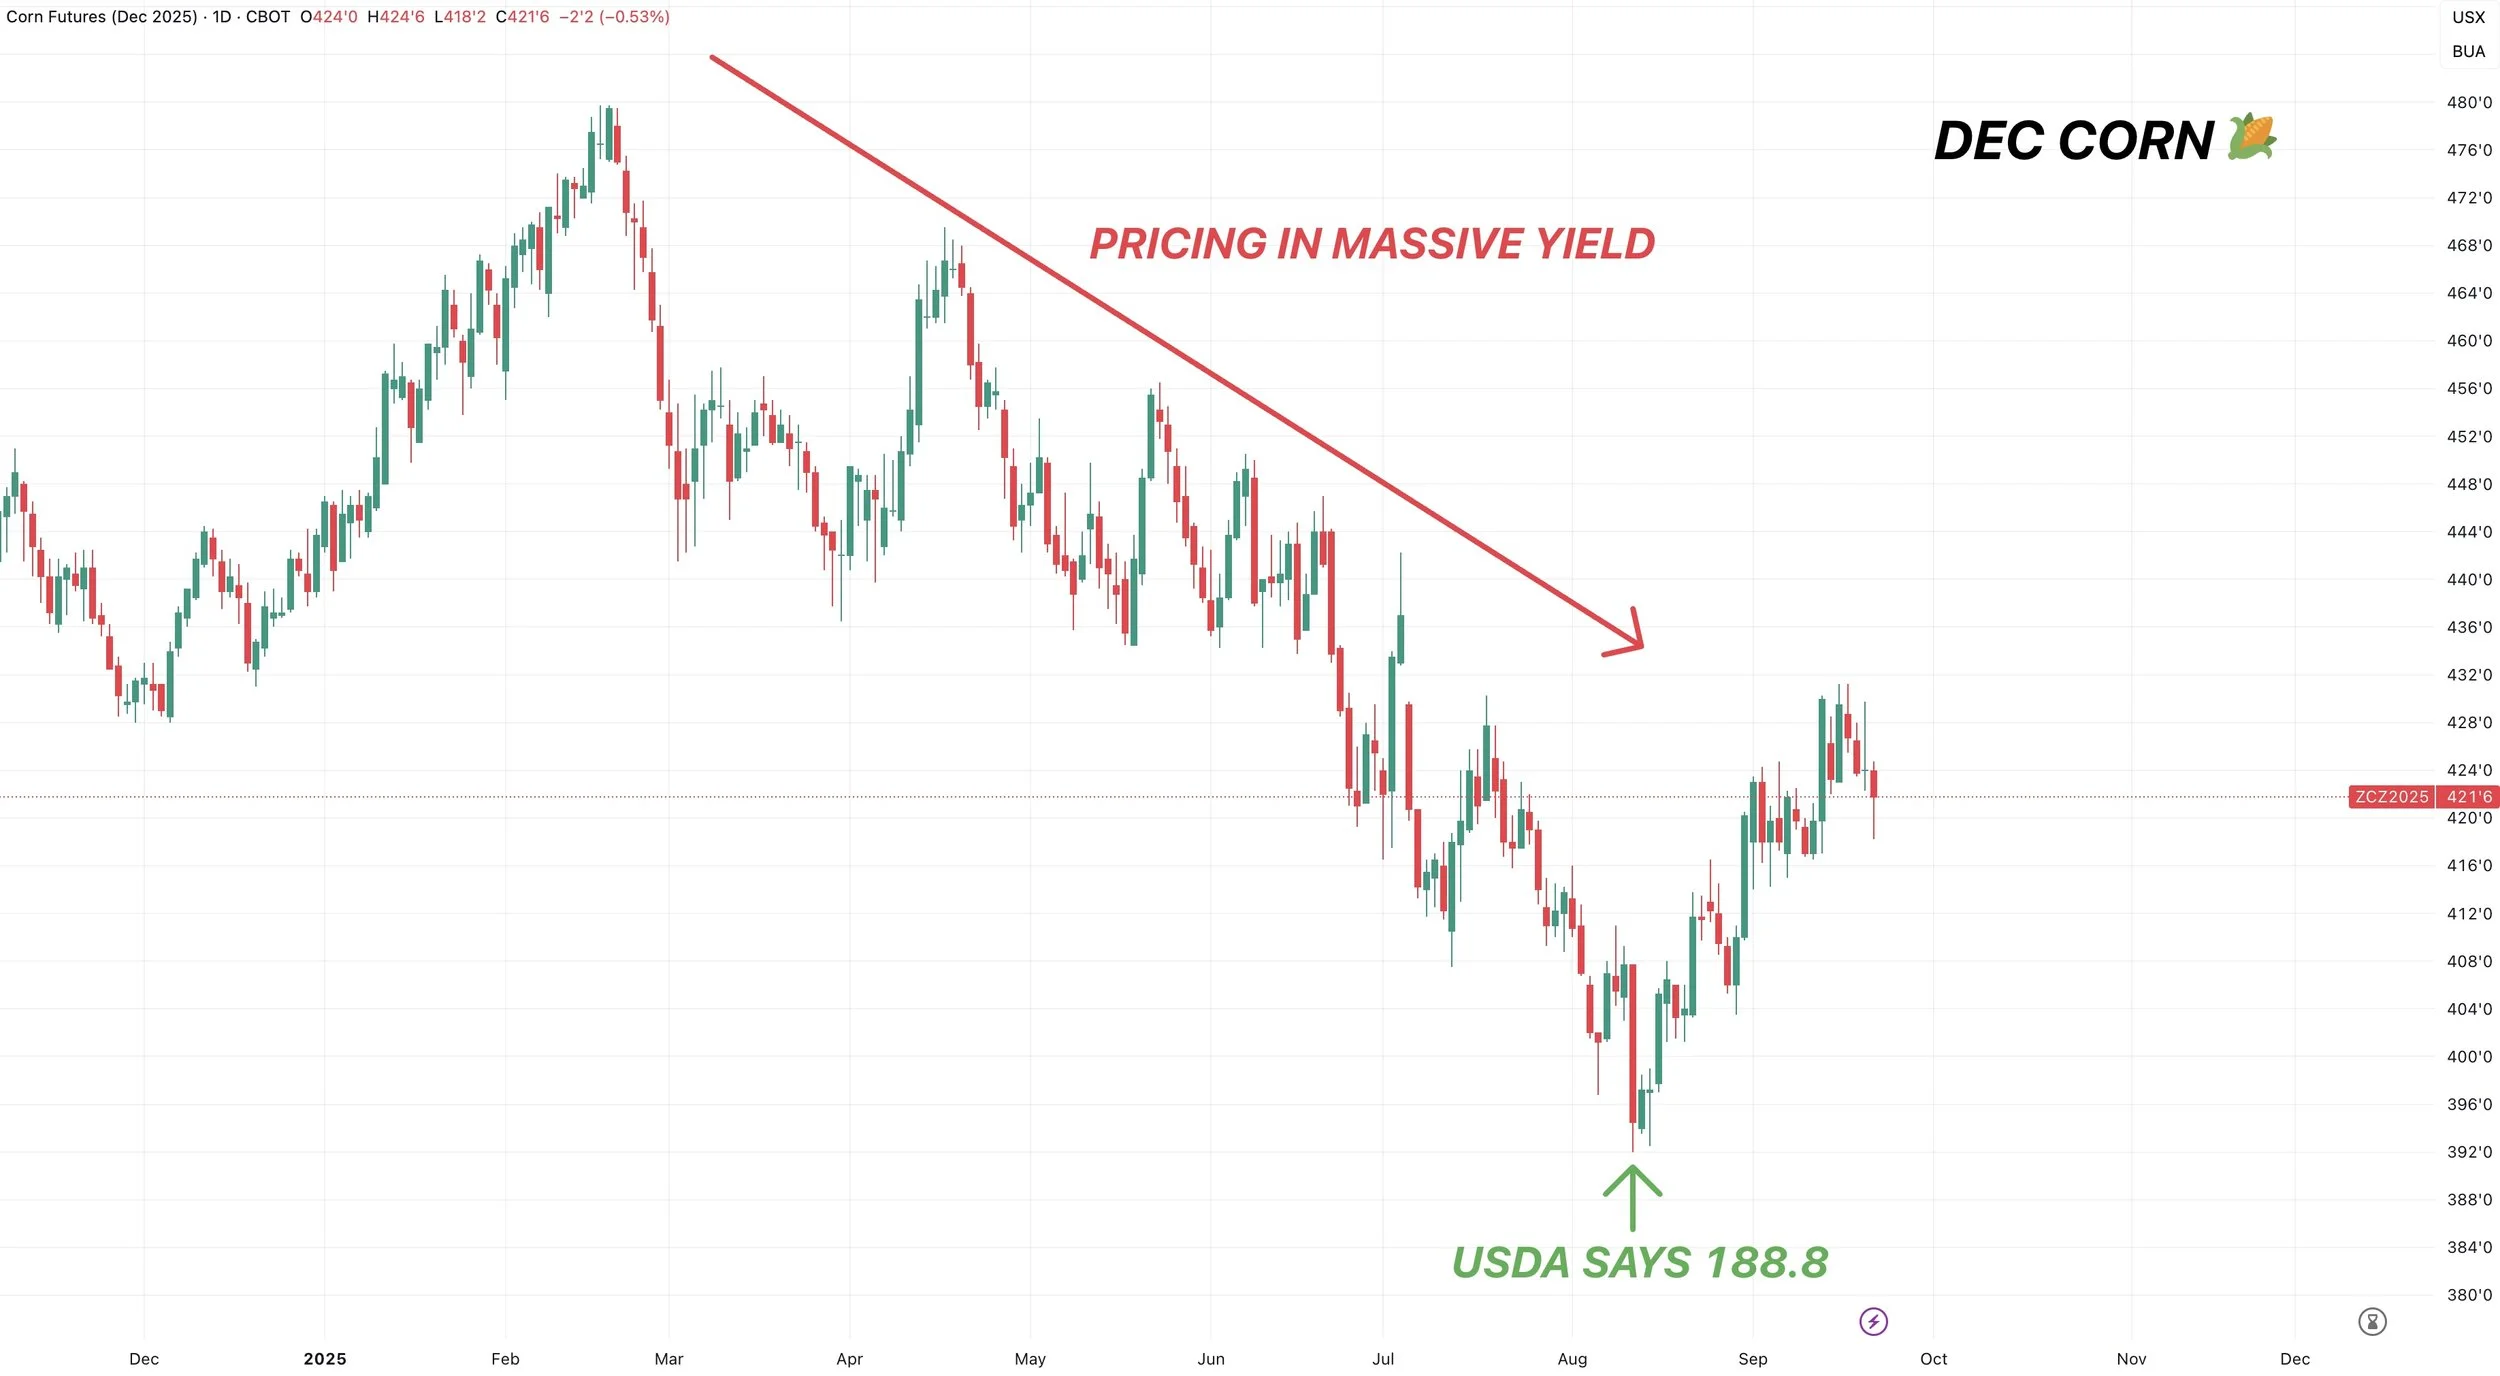
Now although the record acres and production might make it hard to see dramatically higher corn here in the short term, that doesn’t mean we have to be bearish corn.
There really isn’t a reason to be overly bearish when the market already priced in about as bearish of a scenario you could paint.
The farther out you look at corn, the more friendly the possible situation becomes.
I mean do you really think we will keep 98 million acres of corn next year?
This comes after creating some massive demand down here.
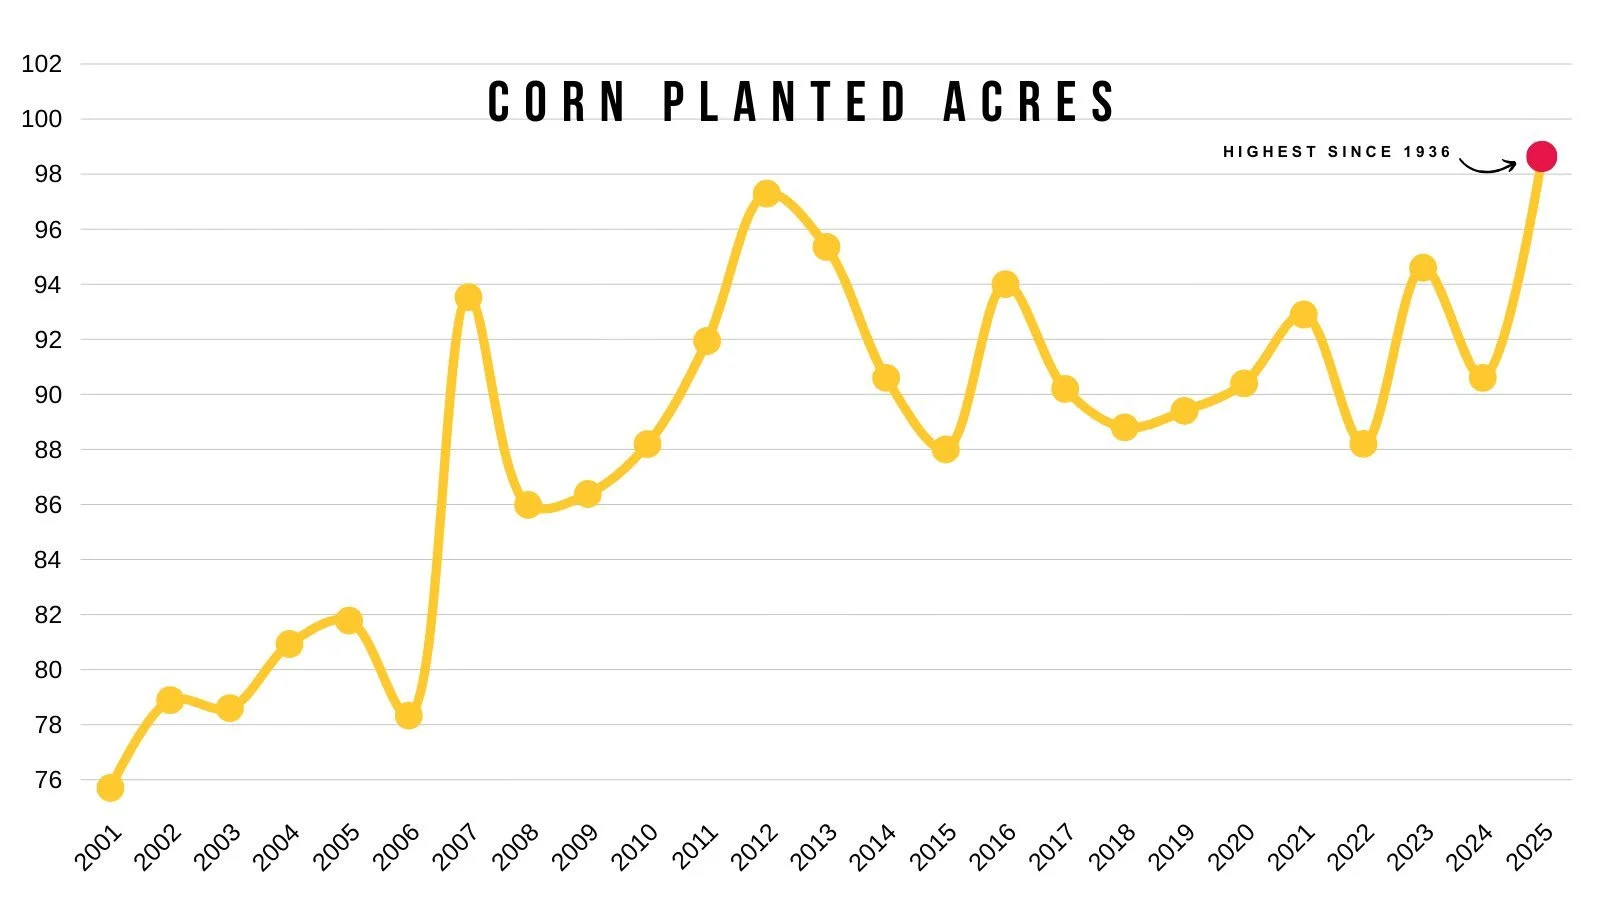
Final Thoughts:
I have a hard time thinking corn is going to be a runaway train short term here.
We have too much supply to get overly bullish, but we have strong enough demand to not be bearish. With a crop that is getting smaller, not larger, after pricing in a massive yield just a month ago.
I still think the harvest lows are in and I remain optimistic looking towards next year.
Ready to take advantage of opportunities when they come.
Daily Dec Chart:
Corn was the bright spot in grains today.
We closed slightly lower but well off the early lows.
We are essentially just back testing this small range from the beginning of the month (blue box).
My current game plan is still to de-risk at $4.35
That is 50% of the Feb highs and key support from spring.
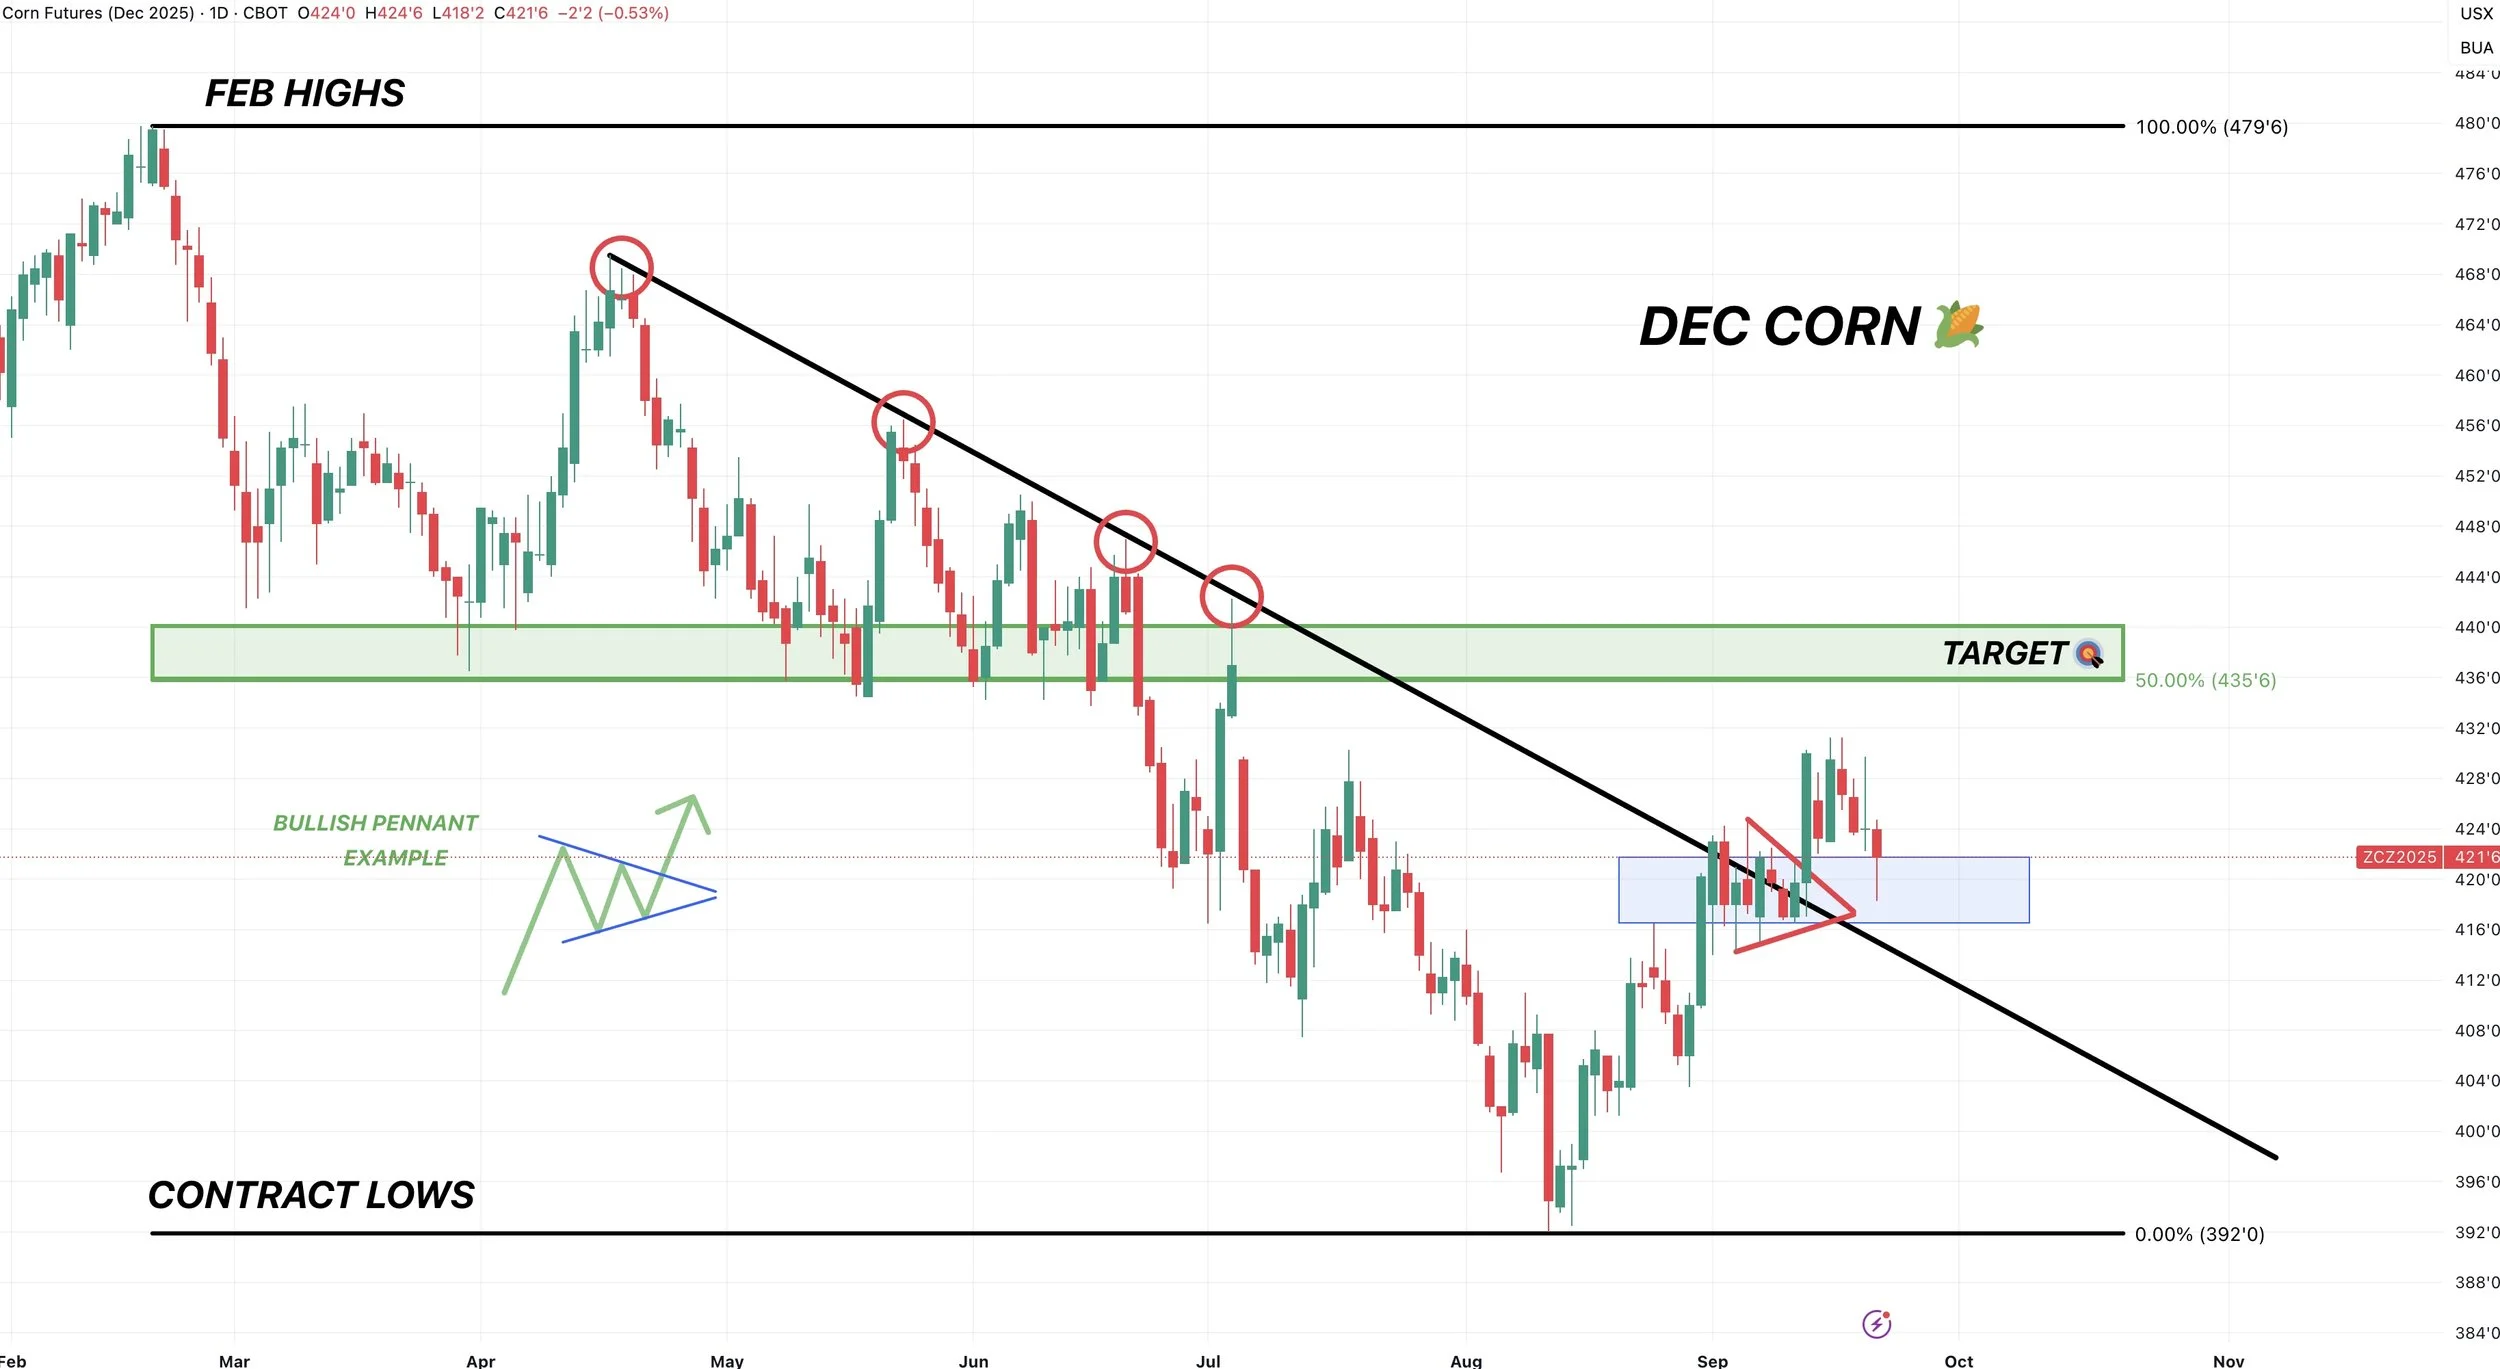
Soybeans
Soybeans got hit with back to back bearish headlines.
First the lack of a China deal Friday and then the Argentina tax cut this morning.
Soybeans are now down over -50 cents from the recent highs and have given back the entire rally that the USDA report gave us after dropping acres.

The soybean market is a tricky one to navigate here.
On one hand, we still have zero beans sold to China. You can’t get overly bullish until we know whether our export program is in jeopardy or not.
On the other hand, it's hard to get too bearish knowing that our supply is getting smaller with not a ton of room for error.
Basically, the exact opposite story in corn. Corn has too much supply but amazing demand. Beans have a potential supply problem, but not enough demand.
You could realistically make an argument that soybeans could be $9 or $12 by this same time next year, and both arguments could be valid.
On a big picture scale, soybeans have traded completely sideways for a year now.
Trapped in an +/- 80 cent range since last year.
This is the longest and smallest range we've seen in a very long time.
There are so many unknowns and possibilities in this market, and the direction has yet to be decided.
The funds positioning in this market paints a good picture as to how much uncertainty there is in this market.
The funds haven’t been too long or too short this market the entire year, they keep flip flopping right around an even position.

Here is a chart from Ag Yield that shows the funds position and the funds open interest.
Their position has gone sideways (Blue).
At the same time, open interest has declined sizeably (Orange).
Basically, the funds don’t even know what to do with this market.
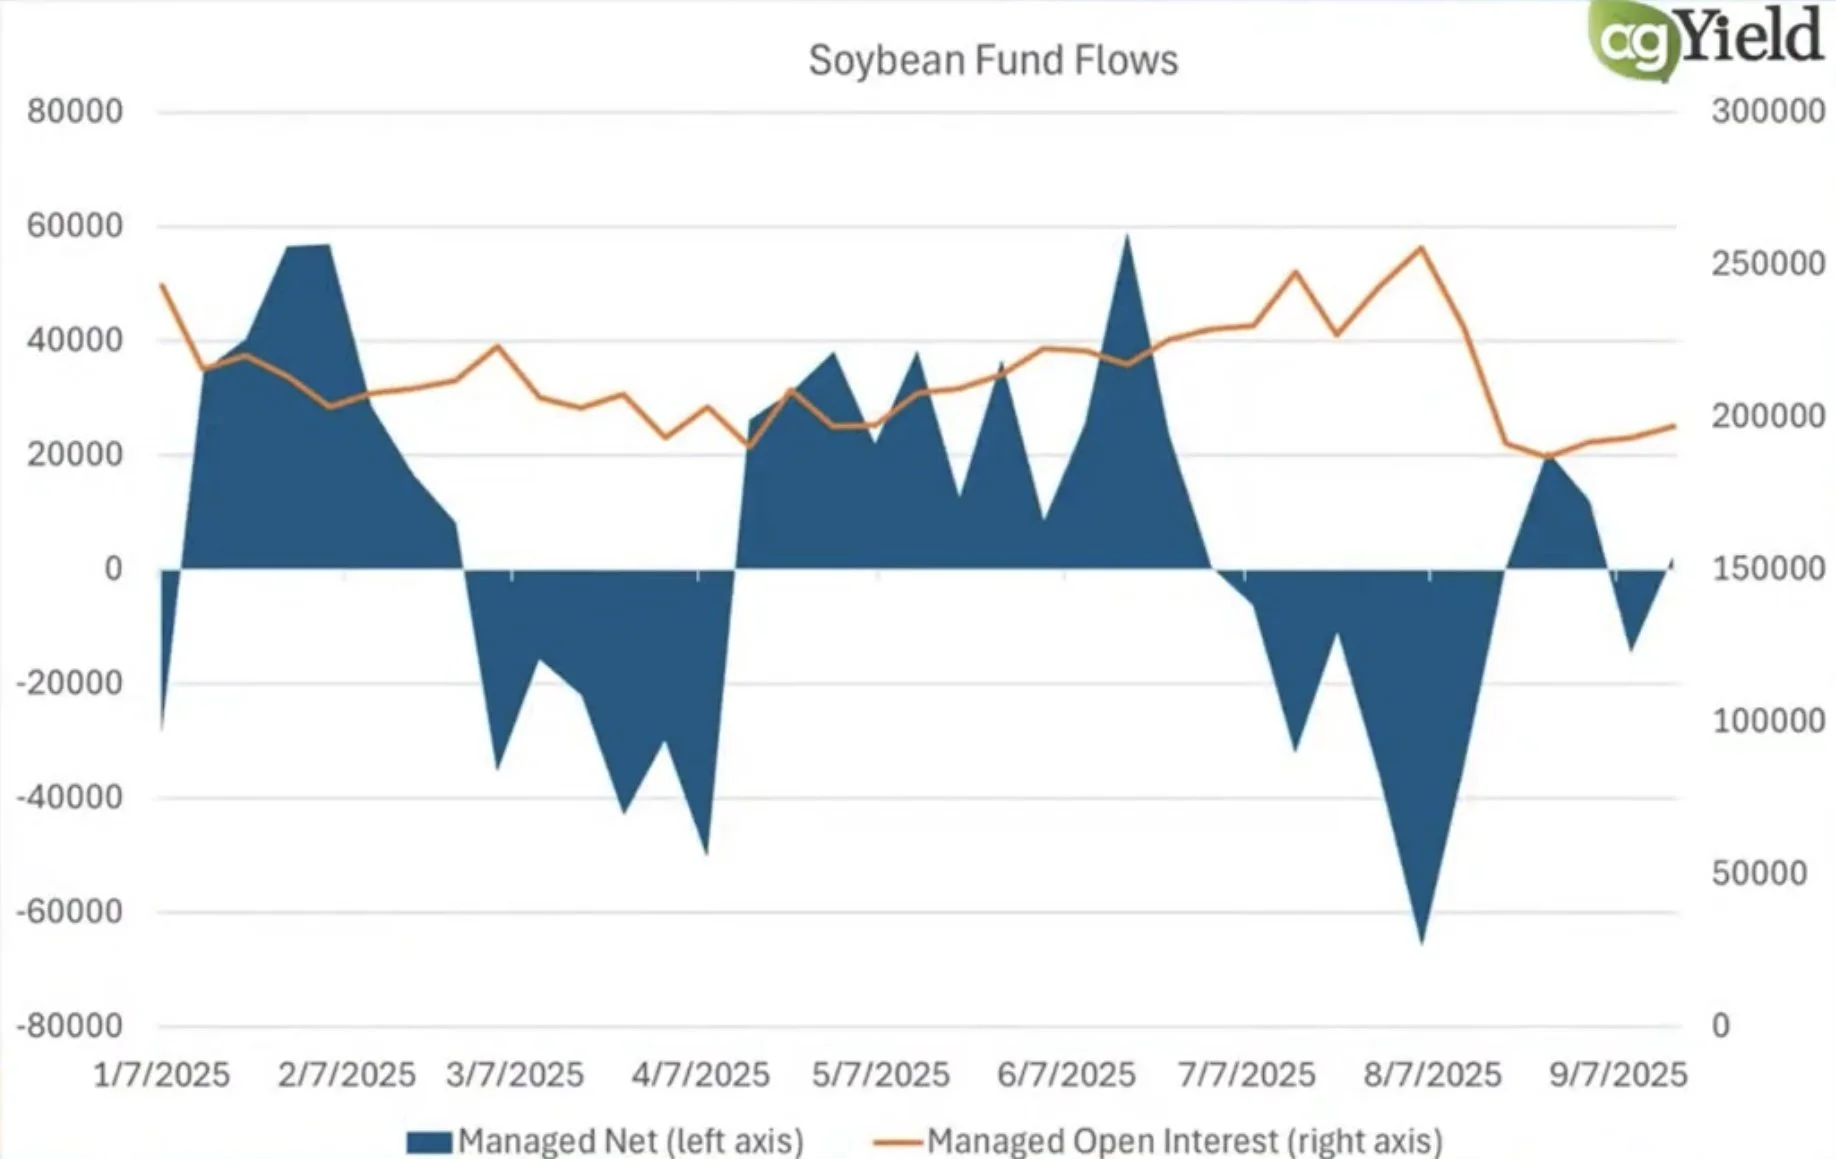
No one really knows whether China is going to come to the table or not. That is the risk in this market.
If China continues to refuse, then we could see more downside.
If China buys, the soybean balance sheet could get awfully tight as yield is getting smaller on a balance sheet that can’t afford to lose supply given the smaller acres.
One potential wild card coming up soon is going to be Brazil.
Will they get a production scare? And if they do, will that be enough to spook China buyers to come the US if they don’t think Brazil's crop will be as big as they expected?
There are so many unknowns in this market.
I've been showing the 5-year seasonal for a few weeks now and how this is seasonally a weak time frame.
Here is all of the seasonals combined.
Seasonally, we are selling off right on schedule. As this is often our weakest time frame of the year.
Usually that bottom then comes around the first week of October.

Daily Nov Chart:
Soybeans are now below $10.12 which is the 61.8% retracement of the entire rally off of $9.80
We closed today at $10.11, just one penny below the must hold level.
Either this is a bull trap and we bounce right now, or we are headed lower.
We should know tomorrow.
This level is a must hold spot. If we close below $10.12 again, then this sell off is no longer viewed as correctional. It is seen as something bigger.
We have a gap of air lower down to that trend that marked multiple bottoms in this market. So if we break below here, that is the next point of interest.

One other thing I am seeing here.
Today we closed right at the 1 to 1 move lower from the first sell off after the August highs. (Marked with purple arrows)
Meaning that this 4 day sell now equals exactly the size of that first sell off we saw.
If you remember back at the $9.80 lows, we found our bottom at the 1 to 1 move lower from the previous sell off as well.
As that mid-July to August sell off equaled the same size as the sell off we saw after the 4th of July. (Marked with blue arrows)
This is a must hold spot.

Wheat
Nothing fresh fundamentally in the wheat market, as wheat continues to do what wheat always does.
I do think that we would’ve found our lows if it hadn’t been for the Argentina news spooking the market.
The most friendly factor in wheat has been demand. It continues to surpass expectations.
This is a bullish long term factor, but the wheat market just lacks that one catalyst to really push this market higher.
Although we lack a defining catalyst, I can’t get bearish wheat down at these levels.
Seasonally wheat still carves out lows here.

Seasonal lows played out pretty perfectly in both the corn & soybean market this year.
I'd like to think wheat eventually catches a bid here as well at a time where it should, but time will telll.
Corn 5 Year Seasonal

Beans 5 Year Seasonal

Daily Chicago:
We had that falling wedge breakout, but then rejected right at key resistance.
That $5.35 level if going to be a major level to break above.
As I have been saying for a few weeks, if we break above that level that is going to be our sign saying that this market is finally ready to head higher.
We are now sitting right back down at the bottom of this channel.
This is where this market has bounced a dozen times before. Hopefully we do it once again.

Chicago wheat is still showing massive bullish divergence like it has been for a few weeks now.
We posted yet another round of contract lows, yet the RSI continues to post higher highs.
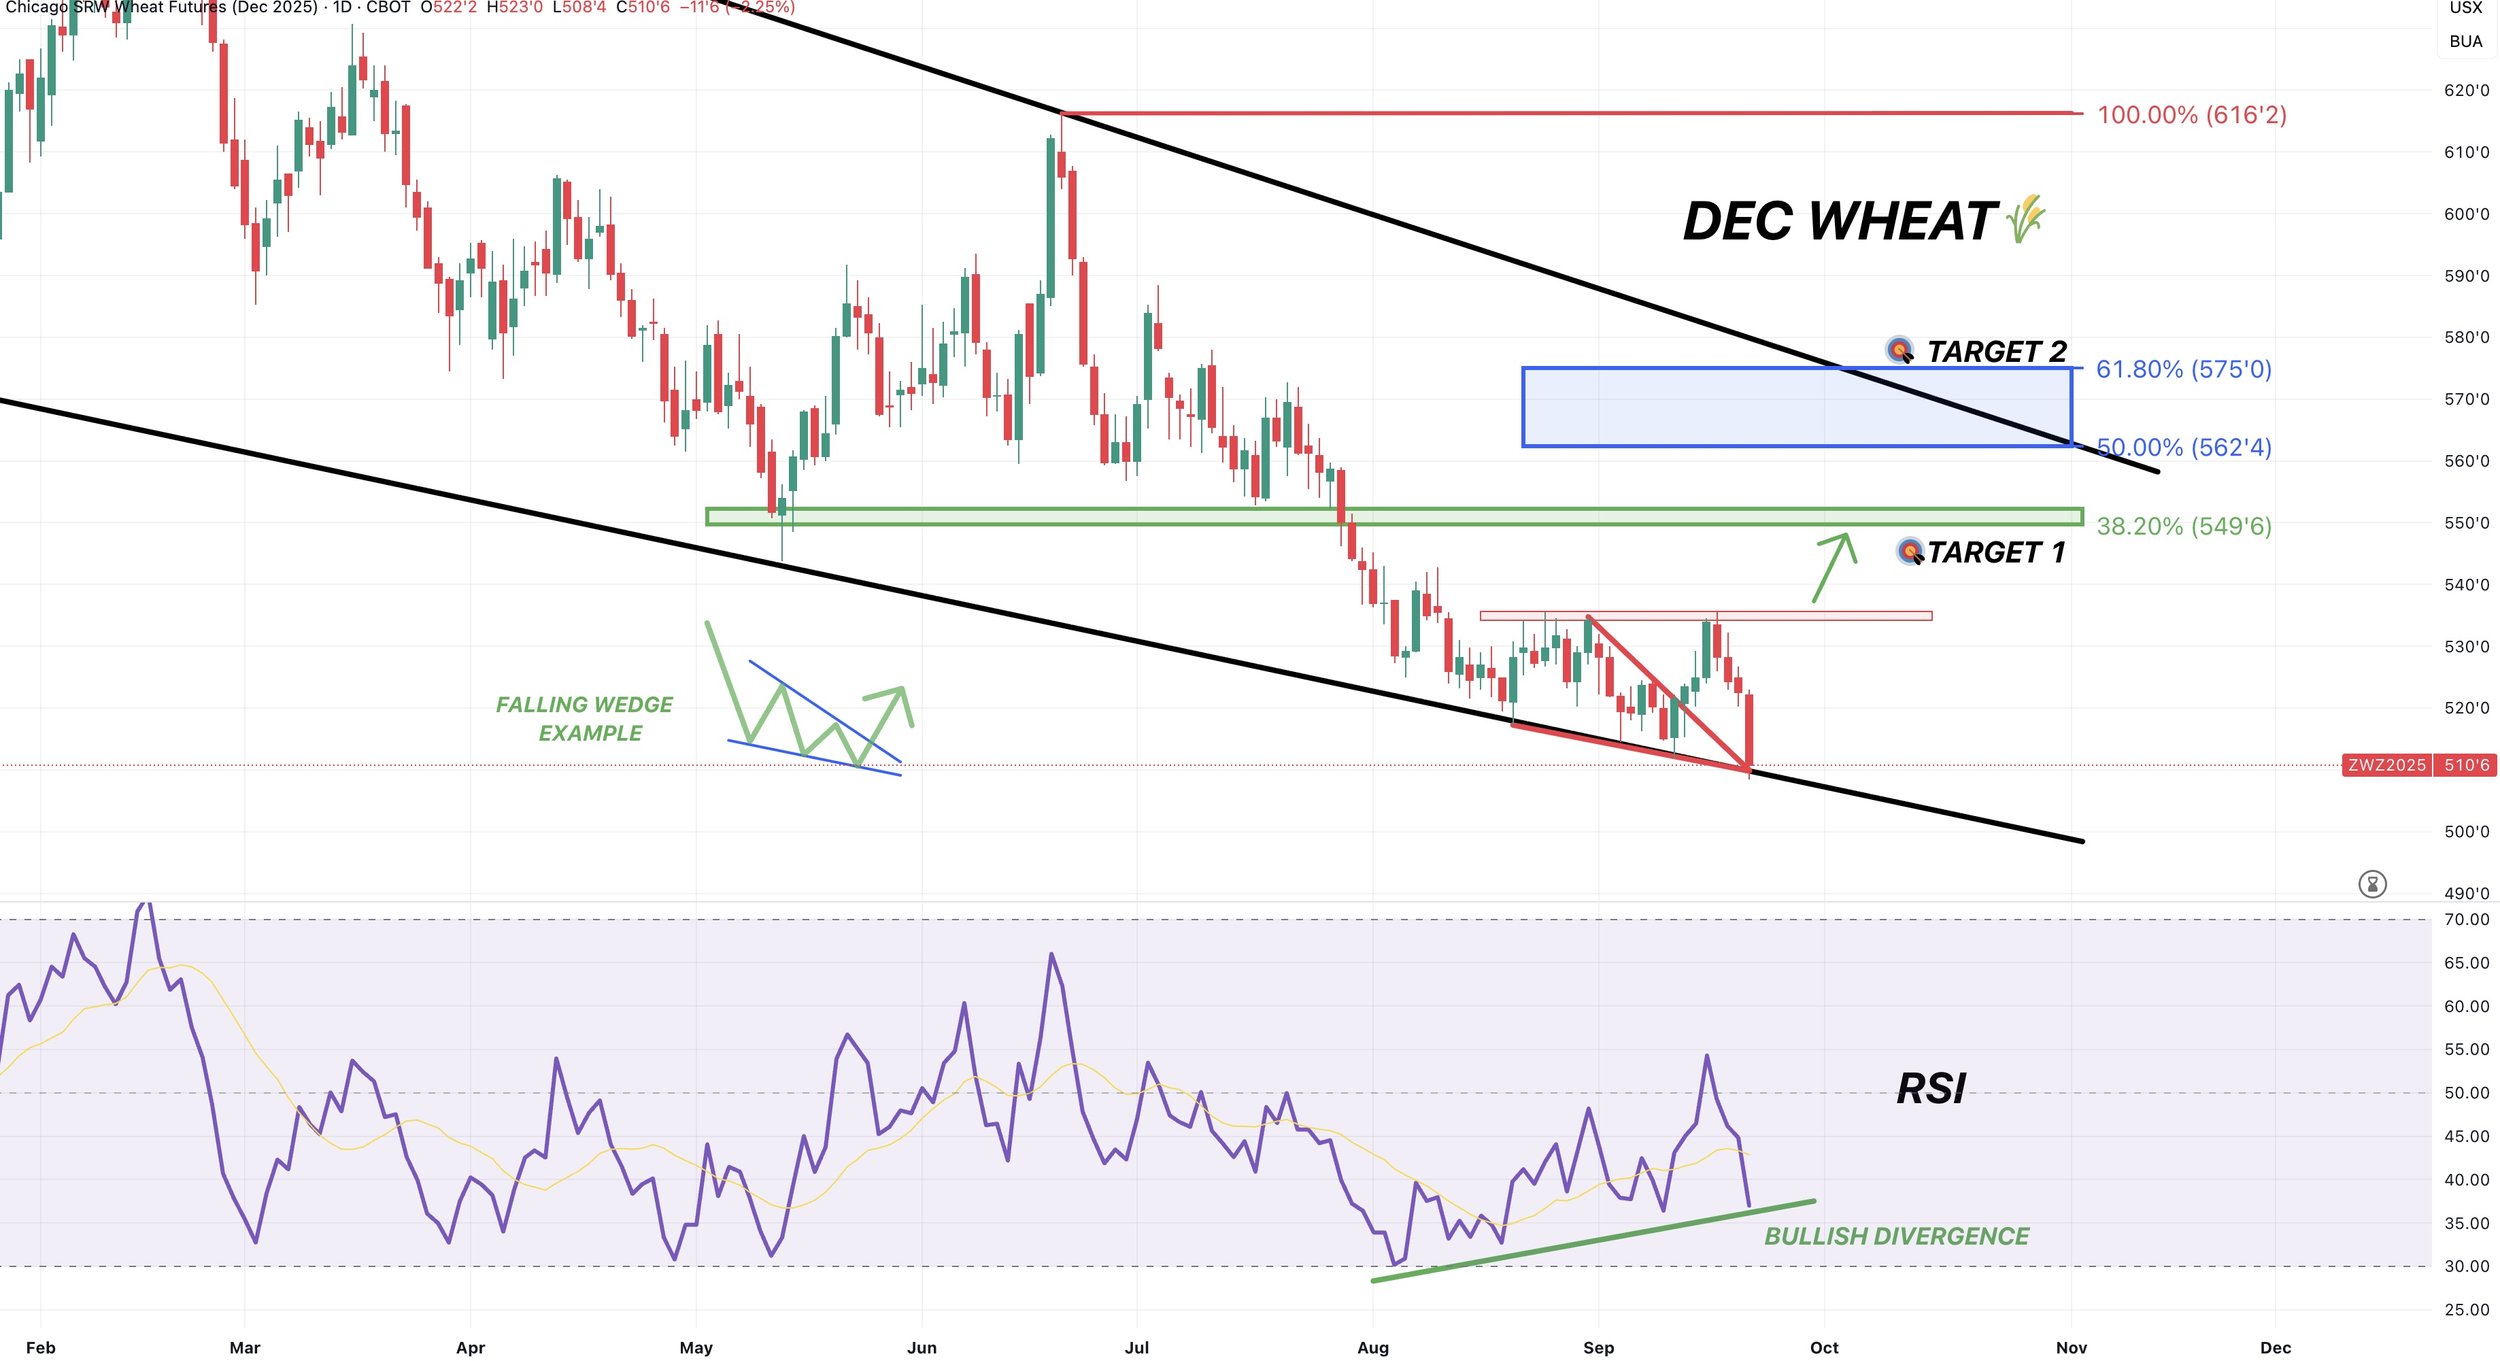
Daily KC Wheat:
We failed the breakout of the downward channel (pink lines).
Still sitting in a large wedge pattern.
Bounced right at some support today.
If we take out last week's highs I think that'll be our indication the low is in.
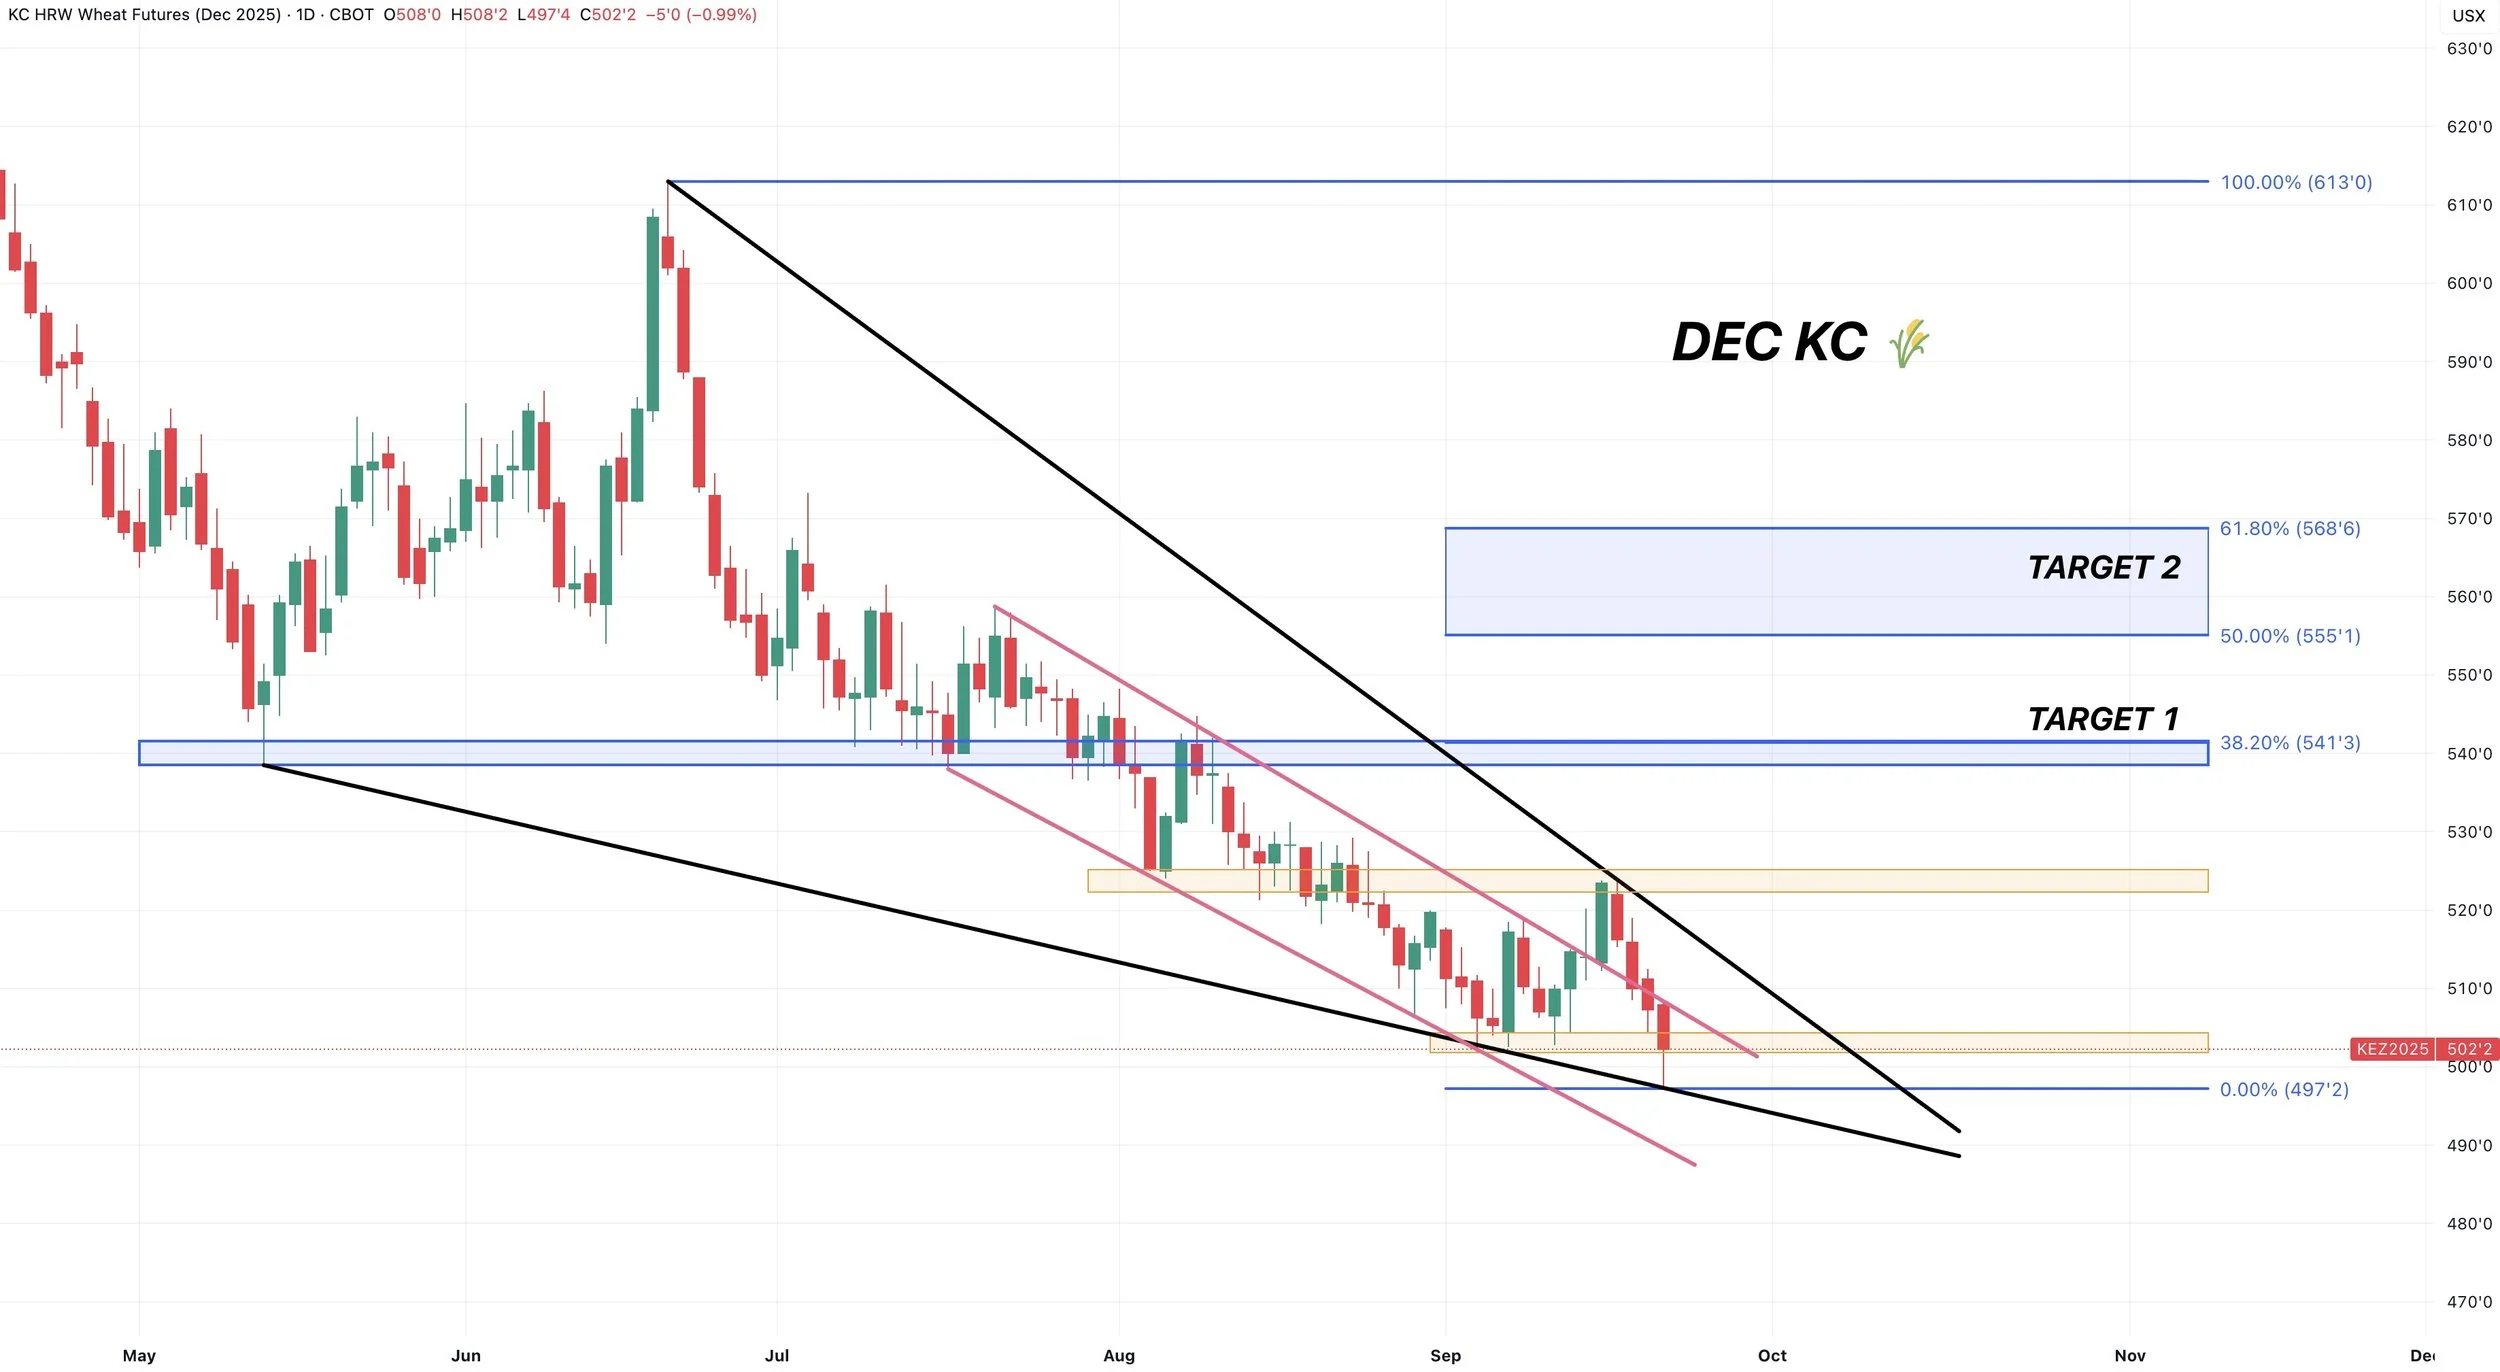
KC wheat is also now showing bullish divergence on the RSI as well.
We posted new lows, meanwhile the RSI did not.

Cattle
Impressive day for cattle off the back of few different pieces of news.
The biggest reason for the strength was screw worm news.
The story that is going around is that an 8 month old calf started in the southern Mexico area (which is an area known to be effected withs crew worm) was brought up to a feed yard roughly 70 miles away from the Texas border. The calf then tested positive for screw worm.
This is now the most northern detection of the screwworm during this outbreak.
Some think that the last few weeks of weakness was partly due to speculation that they would talk about reopening the border.
This news further delays the border re-opening, and it doesn’t appear like it will happen soon.

The other piece of news was the cattle on feed report.
The report wasn’t super bullish or bearish. As it came in around expectations.
But the report still told us there is a tight situation.
Placements are down -10% vs 2024, and are the lowest in 10 years.
Marketing numbers are down -14% vs 2024, and are the lowest on record since the series began in 1996.
Here is the numbers vs the estimates:

Here is a state by state breakdown of placements vs 2024.
Only two states are higher compared to last year.
There is a supply problem in this market. But that problem is also known.
The biggest question in this market is, when is this problem finally priced in?
Eventually, this market will turn lower once it is priced in. It's just hard to say exactly when that will be.
Oct Feeder:
Feeders look pretty good here.
We bounced perfectly in the golden zone from those August 1st lows. Right where we needed to.
We now reclaimed over 61.8% of this sell off. So odds favor us now going to test those highs again.
If not, the must hold spot is the red box.
I still like keeping downside protection up here via puts for most of you.

Let's say we go and post new highs.
We would more than likely be showing some serious bearish divergence.
With prices making new highs but the RSI not.
Unless the RSI goes and posts a new high as well.
Something to keep an eye on moving forward if we post new highs.

Oct Live:
Live cattle also bounced right in the golden zone perfectly.
We closed right at the 61.8% retracement of the recent sell off. So we need one more push to say we are going to test the highs.
The must hold spot is going to be the red box for now.
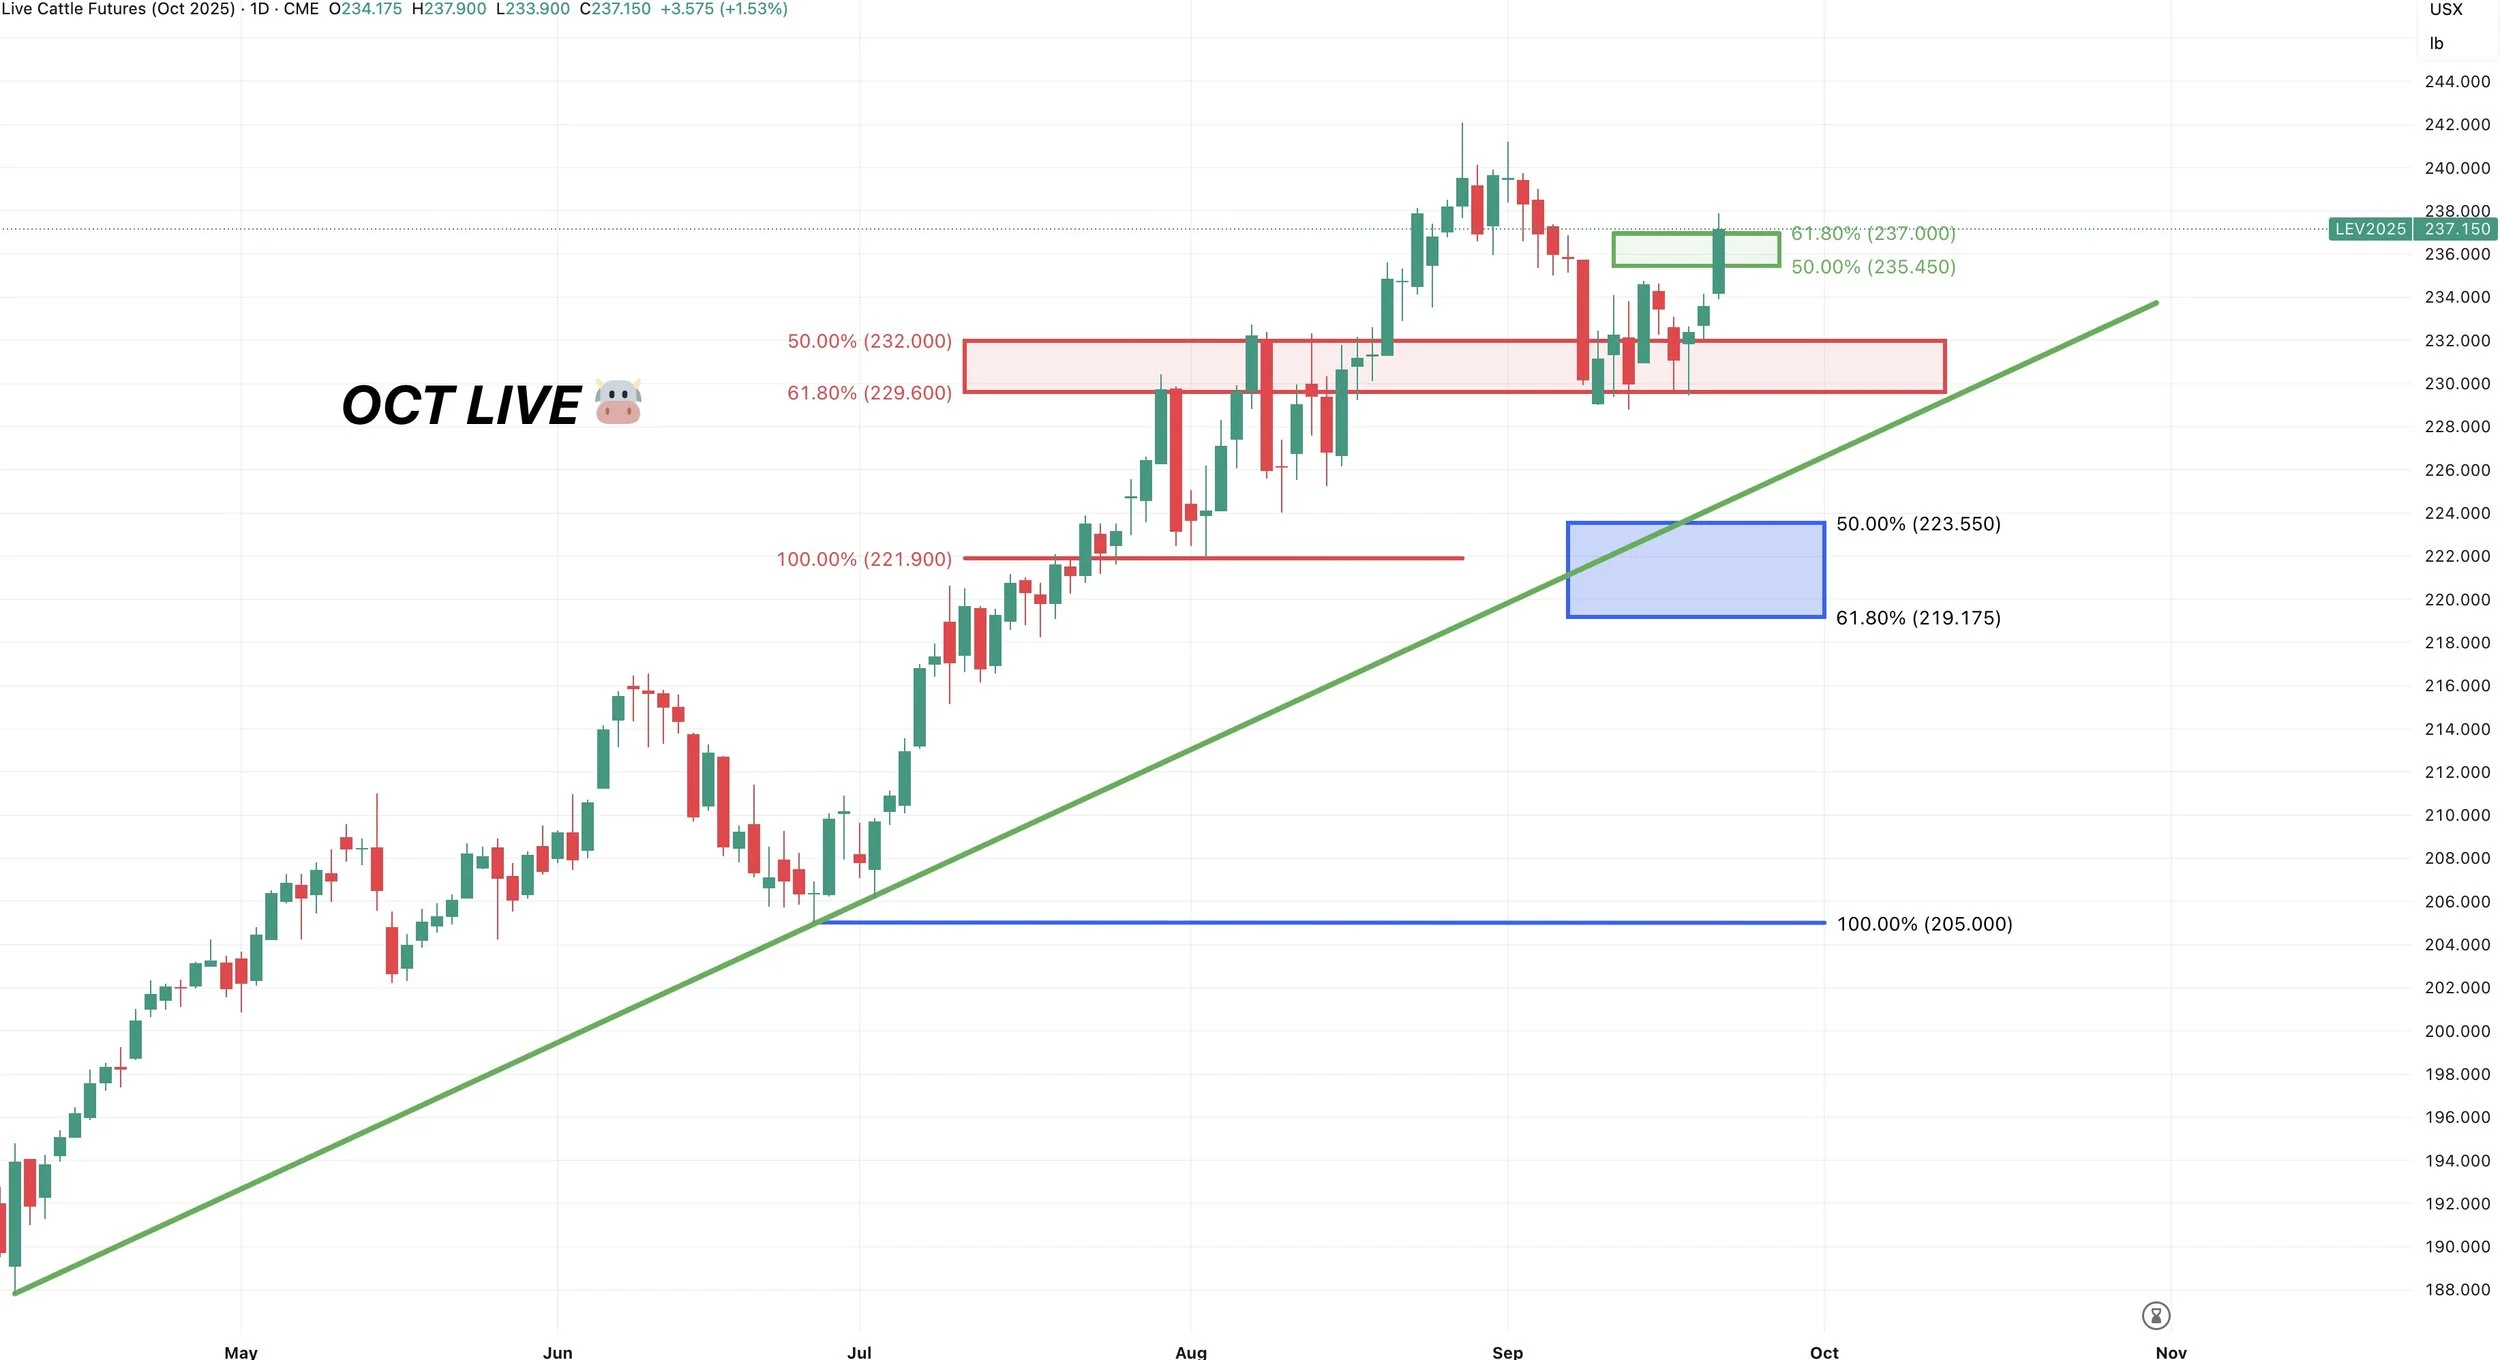
Past Sell or Protection Signals
Aug 22nd: 🌱
Soybean sell signal & hedge alert.
July 31st: 🐮
Cattle sell signal & hedge alert.
July 10th: 🐮
Cattle sell signal & hedge alert.
CLICK HERE TO VIEW
June 5th: 🐮
Cattle sell signal & hedge alert.
June 2nd: 🌾
MPLS wheat sell signal.
April 10th: 🌽
Old crop corn sell signal.
March 19th: 🐮
Cattle hedge & sell signal.
Feb 18th: 🌽 🌾
Old crop KC wheat & old crop corn signal.
Jan 23rd: 🌽 🌱
Corn & beans old crop sell signal.
CLICK HERE TO VIEW
Jan 15th: 🌽 🌱
Corn & beans hedge alert/sell signal.
Jan 2nd: 🐮
Cattle hedge alert at new all-time highs & target.
Dec 11th: 🌽
Corn sell signal at $4.51 200-day MA
CLICK HERE TO VIEW
Oct 2nd: 🌾
Wheat sell signal at $6.12 target
Sep 30th: 🌽
Corn protection signal at $4.23-26
Sep 27th: 🌱
Soybean sell & protection signal at $10.65
Sep 13th: 🌾
Wheat sell signal at $5.98
May 22nd: 🌾
Wheat sell signal when wheat traded +$7.00
Want to Talk?
Our phones are open 24/7 for you guys if you ever need anything or want to discuss your operation.
Hedge Account
Interested in a hedge account? Use the link below to set up an account or shoot Jeremey a call at (605)295-3100.
WHAT TO EXPECT HEADING INTO HARVEST
AUDIO COMMENTARY
Beans down hard on lack of China deal
Will supply loss offset demand loss in beans?
What will the US dollar do?
Watching harvest results
No major damage on charts
Bias leans higher in wheat still
Wheat isn’t suppose to be sold this time of year
Do your basis diligence
Have we given the funds a story yet?
More rate drops in the future. Could this help give the funds a reason to stop selling?
Could see a similar story as last year
Could see sideways action for a month or two before we get opportunities
Corn is the only one close to a sell signal
Beans at must hold level (chart below)*
Listen to today’s audio below
You free trial has ended
You will not receive future updates or our next signal
Lock in our harvest sale so you’re ready for the next opportunity
SOYBEAN CHART
Nov Beans 🌱
Soybeans are now right above a major must hold level.
$10.12 to $10.22
This blue box retraces 50-61.8% of the entire +80 cent rally off the lows.
We can fall all the way down to the bottom of the box and this entire sell off could still be viewed as a simple correction.
Bulls need to hold that box, or this sell off is no longer viewed as a simple correction. It is likely something bigger if it breaks.
Below this box we do also have a gap of air lower towards that trendline that has marked some pretty significant lows in this market several times.
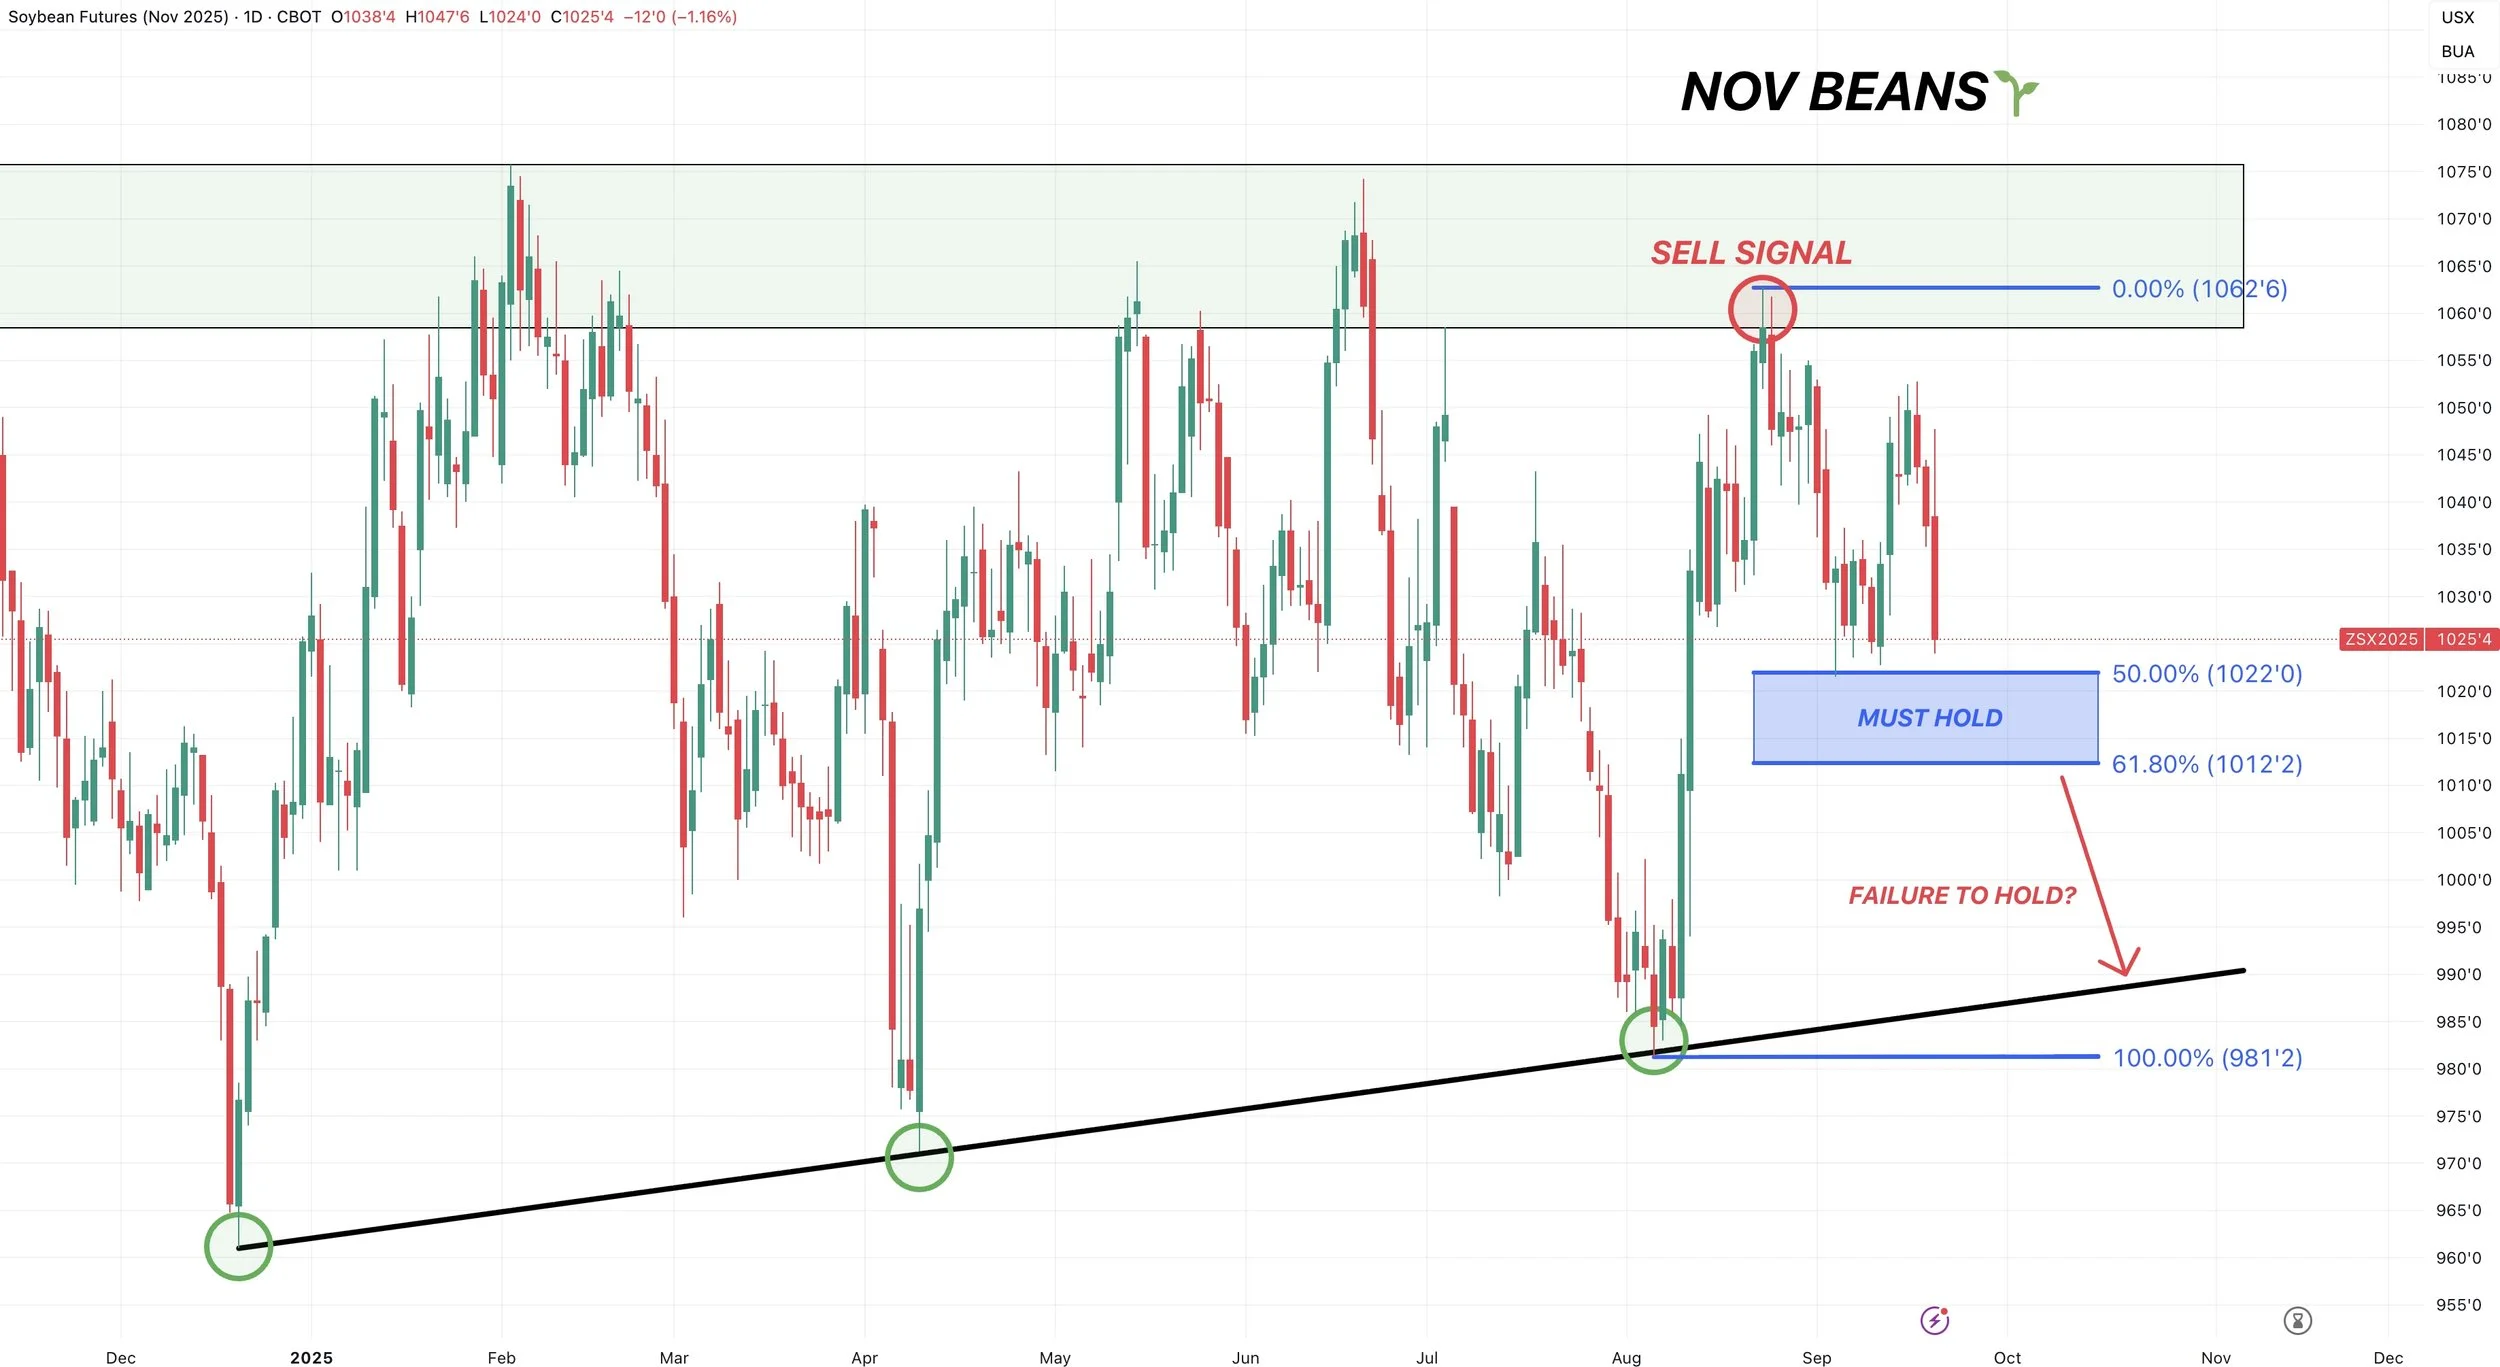
Past Sell or Protection Signals
Aug 22nd: 🌱
Soybean sell signal & hedge alert.
July 31st: 🐮
Cattle sell signal & hedge alert.
July 10th: 🐮
Cattle sell signal & hedge alert.
CLICK HERE TO VIEW
June 5th: 🐮
Cattle sell signal & hedge alert.
June 2nd: 🌾
MPLS wheat sell signal.
April 10th: 🌽
Old crop corn sell signal.
March 19th: 🐮
Cattle hedge & sell signal.
Feb 18th: 🌽 🌾
Old crop KC wheat & old crop corn signal.
Jan 23rd: 🌽 🌱
Corn & beans old crop sell signal.
CLICK HERE TO VIEW
Jan 15th: 🌽 🌱
Corn & beans hedge alert/sell signal.
Jan 2nd: 🐮
Cattle hedge alert at new all-time highs & target.
Dec 11th: 🌽
Corn sell signal at $4.51 200-day MA
CLICK HERE TO VIEW
Oct 2nd: 🌾
Wheat sell signal at $6.12 target
Sep 30th: 🌽
Corn protection signal at $4.23-26
Sep 27th: 🌱
Soybean sell & protection signal at $10.65
Sep 13th: 🌾
Wheat sell signal at $5.98
May 22nd: 🌾
Wheat sell signal when wheat traded +$7.00
Want to Talk?
Our phones are open 24/7 for you guys if you ever need anything or want to discuss your operation.
Hedge Account
Interested in a hedge account? Use the link below to set up an account or shoot Jeremey a call at (605)295-3100.
HOW BIG OF AN IMPACT DID USDA MAKE?
MARKET UPDATE
You can scroll to read the usual update as well. As the written version is the exact same as the video.
Timestamps for video:
USDA Impact: 0:25min
Corn: 7:25min
Beans: 9:45min
Wheat: 12:05min
Cattle: 13:45min
Want to talk about your situation?
(605)295-3100
Your free trial has ended
Subscribe if you would like to keep getting our daily update and our next sell signal.
Here is extended access to our most recent sale.
Futures Prices Close
Overview
Grains mostly lower following the impressive price action after Friday's USDA report.
Meanwhile the cattle finds some life after posting it's worst week of the year last week.
Friday's report was anything but bullish, yet prices had a bullish reaction.
How Did USDA Change Things?
Let's take a little deeper dive into what the USDA did on Friday and how this changes things moving forward.
Corn
We got the cut to yield everyone was expecting, but the surprise came in acres.
As the USDA found yet another +1.4 million acres.
This bump in acres more than offset the cut we saw to yield. Leading to a net increase of around +90 million bushels on the supply side of the balance sheet despite seeing yield drop -2.1 bpa.
At the same time, the USDA once again raised our exports. This time by +100 million. Which offset the increase in supply, leading to a very small net decrease to our carryout, virtually unchanged.
Here is the balance sheet and the changes the USDA made.
Green = Bullish
Red = Bearish
Current Balance Sheet
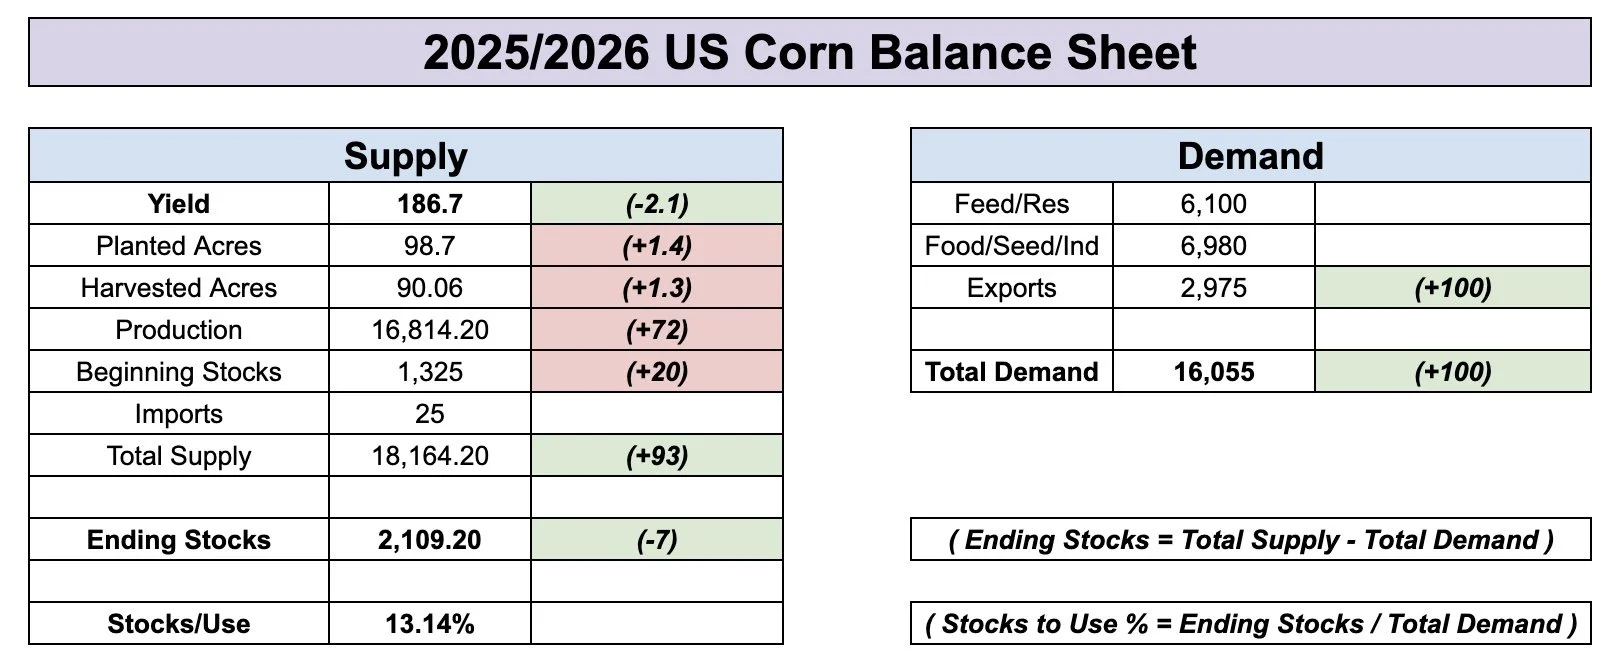
Want to know the craziest thing about the last two reports?
Here is a chart from Karen Braun show casing the USDA's corn acre change from the June survey to the Sep report.
These acre changes were unprecedented. We have never, ever seen anything like this before.
In the past 50 years, we have never seen acres jump by +1%. Only a handful of years even came close to +1%.
This year acres jumped nearly +4%.
That is how much of an anomaly these acre increase have been.
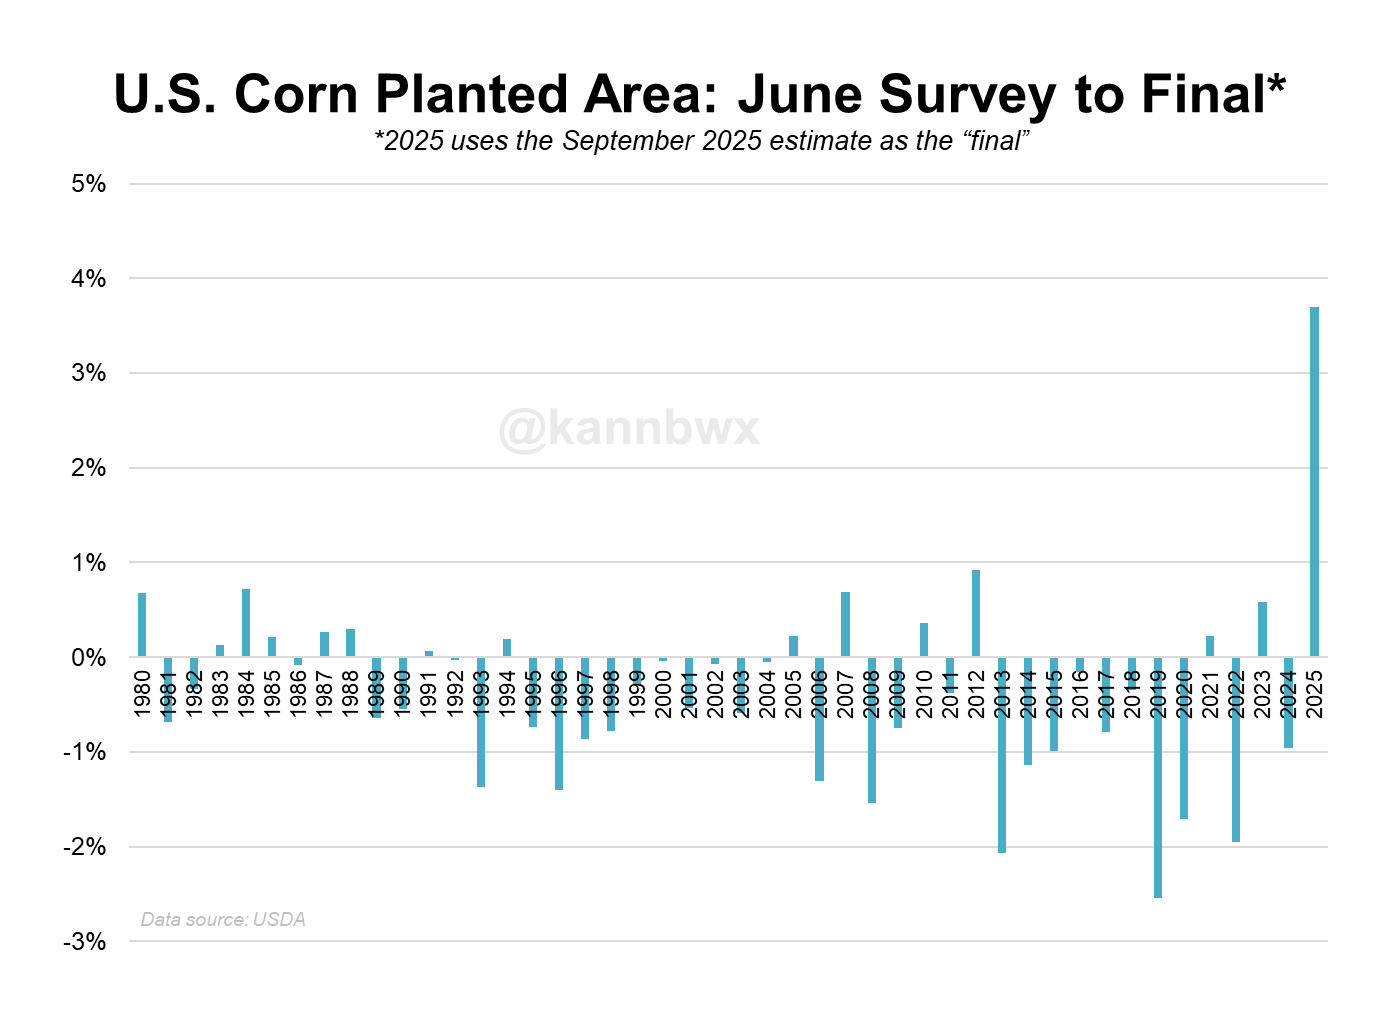
With this recent acre increase, acres are now essentially at an all-time high.
This is the most acres we've seen in 89 years, since 1936.
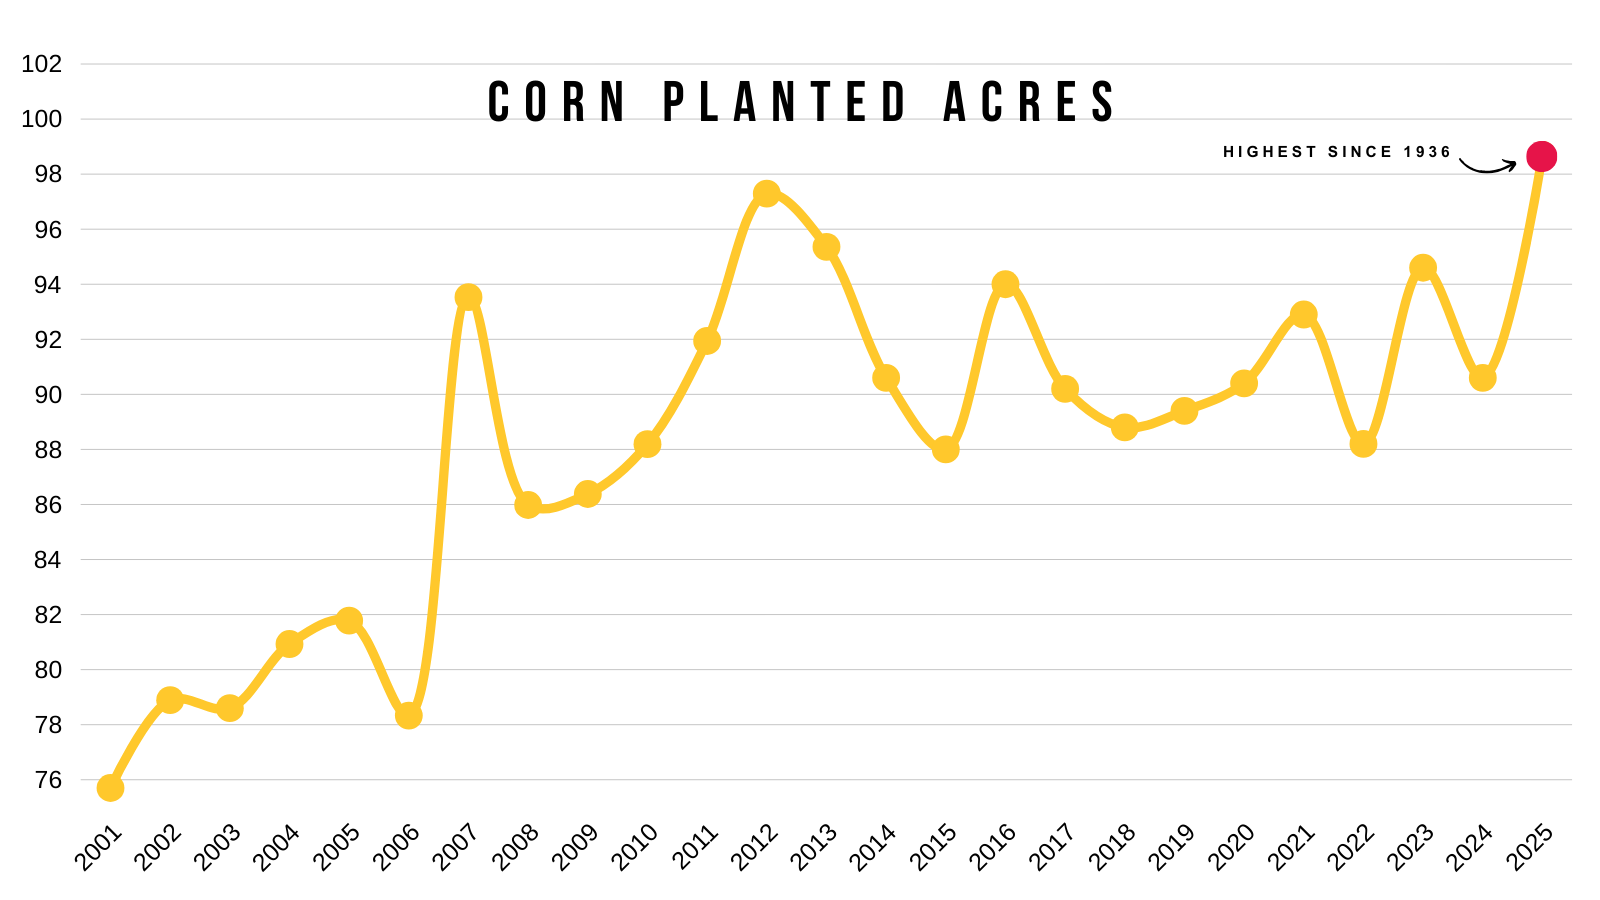
How big of an impact did this report have on corn?
It made it that much harder to achieve a tighter carryout if yield continues to fall. Because the acres add that much supply.
Here are a few examples.
None of these include demand changes. If the USDA drops supply, they will drop demand to offset some of the supply loss.
Scenarios:
But let's say yield were to come in at 183.
If the USDA would have left acres unchanged at 88.7, a 183 yield would have created a somewhat bullish scenario.
As it would have dropped carryout down to 1.5 billion and dropped our stocks to use ratio below 10%.
183 Yield & 88.7 Harvest Acres
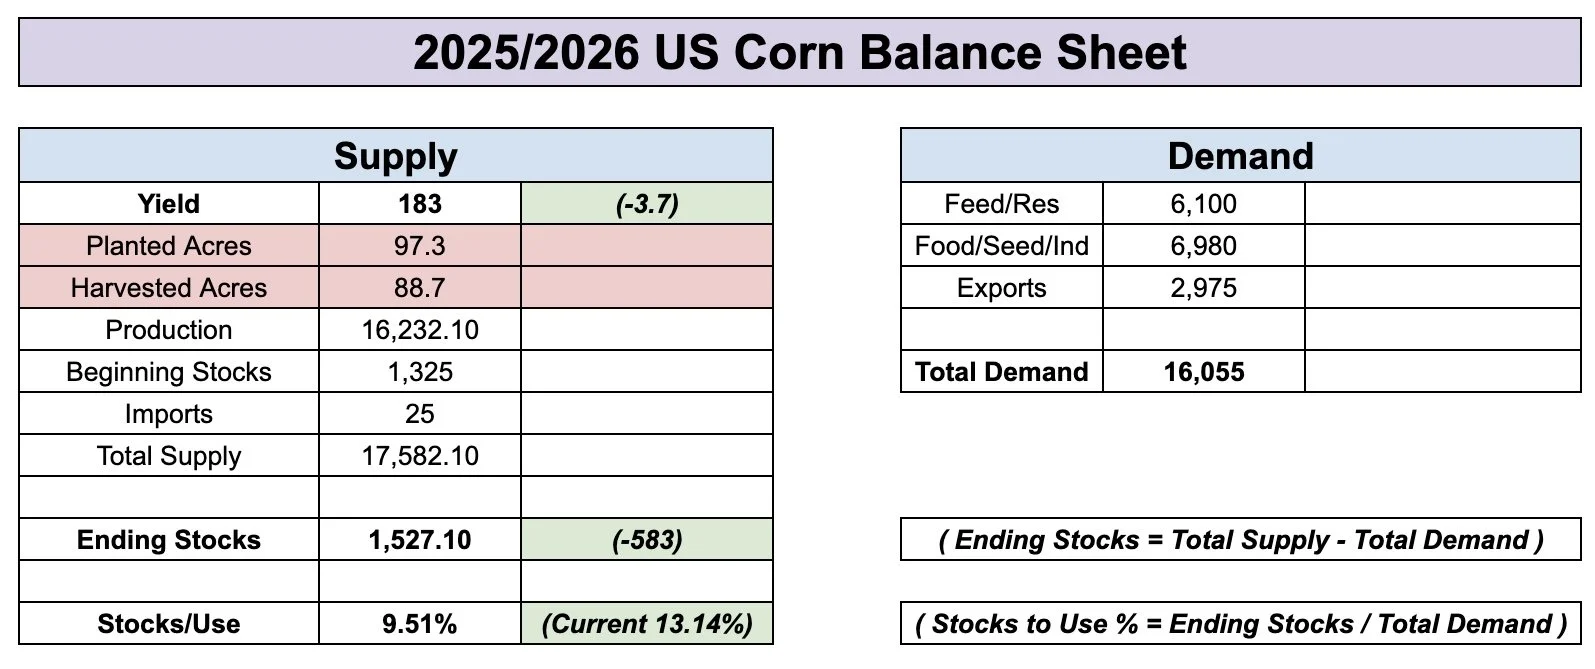
But instead, if we were to now drop yield down to 183 with the 90 million acres, it doesn’t make nearly as bullish of an impact.
Without changing demand, it would result in a near 1.8 billion bushel carryout and a stocks to use ratio of 11%.
Neither of those are extremely bullish scenarios.
183 Yield & 90 Harvest Acres
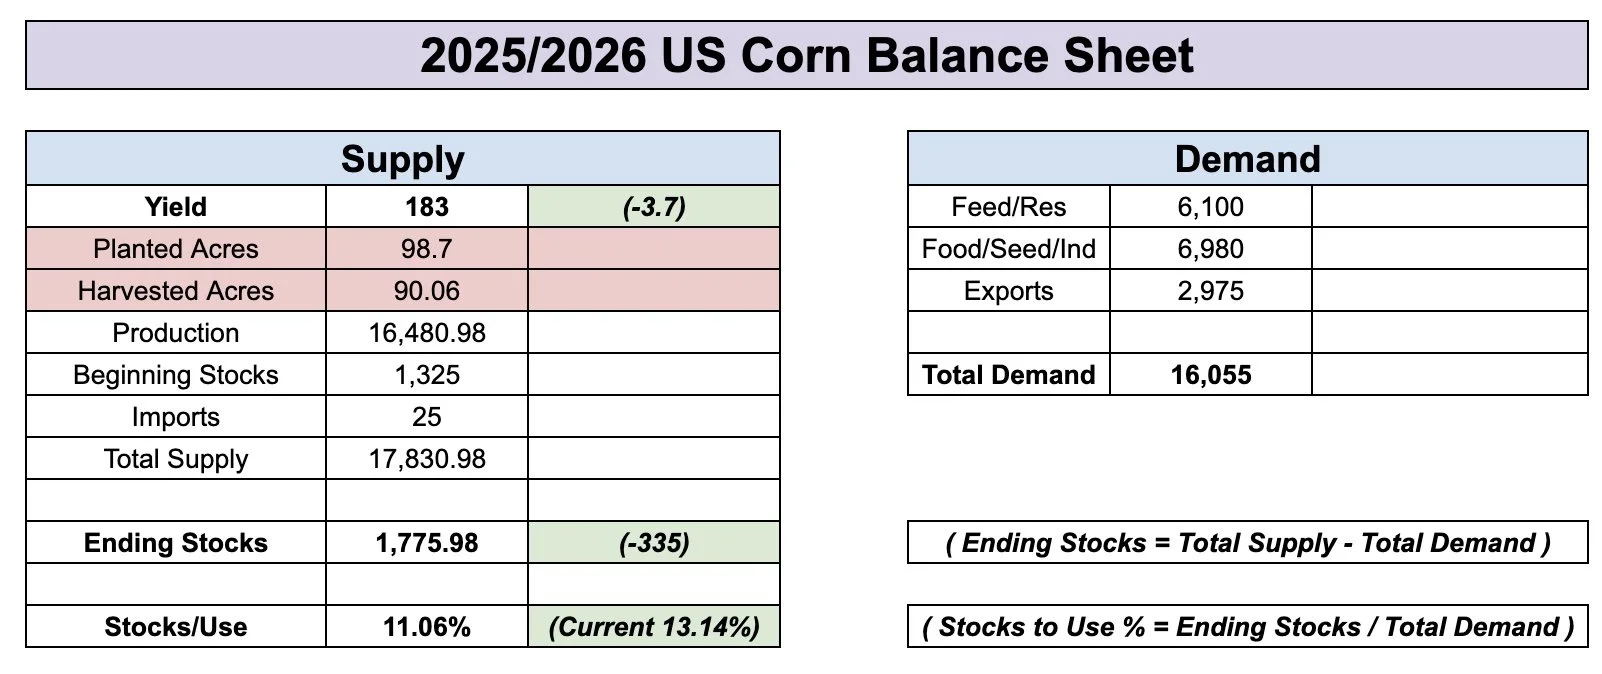
Typically, the rule of thumb is that a stocks to use ratio under 10% is considered decently bullish.
Before this bump in acres on Friday, it would’ve only took a 184 yield to see a stocks to use ratio below 10%.
184 Yield & 88.7 Harvest Acres

With the added acres, it would now take a 181 yield to get a stocks to use ratio below 10%.
So a friendly outcome is still possible, but it now takes that much more of a drop in yield to achieve the same results.
181 Yield & 90 Harvest Acres
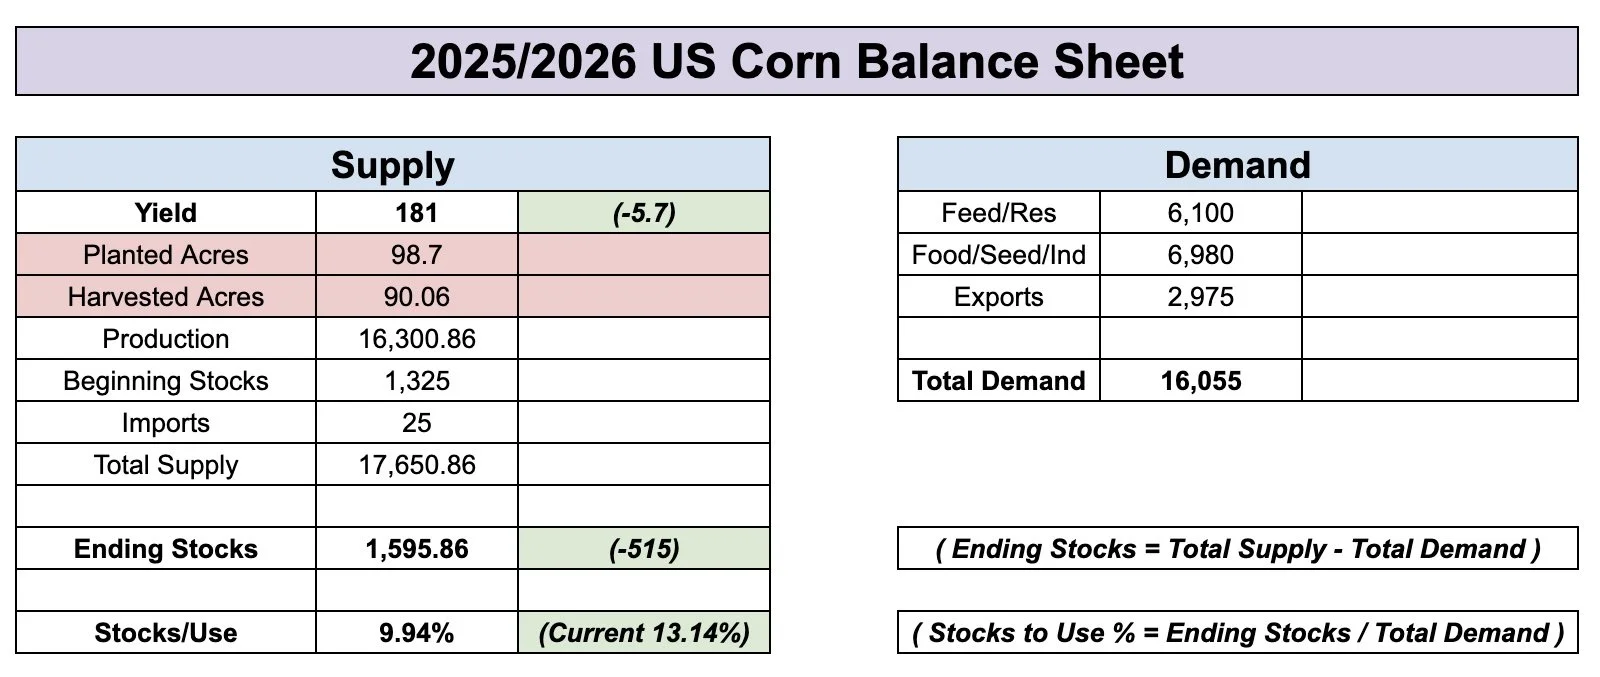
There are several who would argue that our feed & residual demand is too high and needs to be cut by at least 200 million.
What kind of impact would that have?
If we dropped feed by -200 million, it would take a -2 bpa decrease in yield to offset that loss in demand.
In this scenario:
Feed: Cut by -200 million
Yield: Cut by -2 bpa
Result: Carryout essentially unchanged
So the most acres on record really does make it hard to paint a mega bullish situation.
184.7 Yield & -200 Million Feed
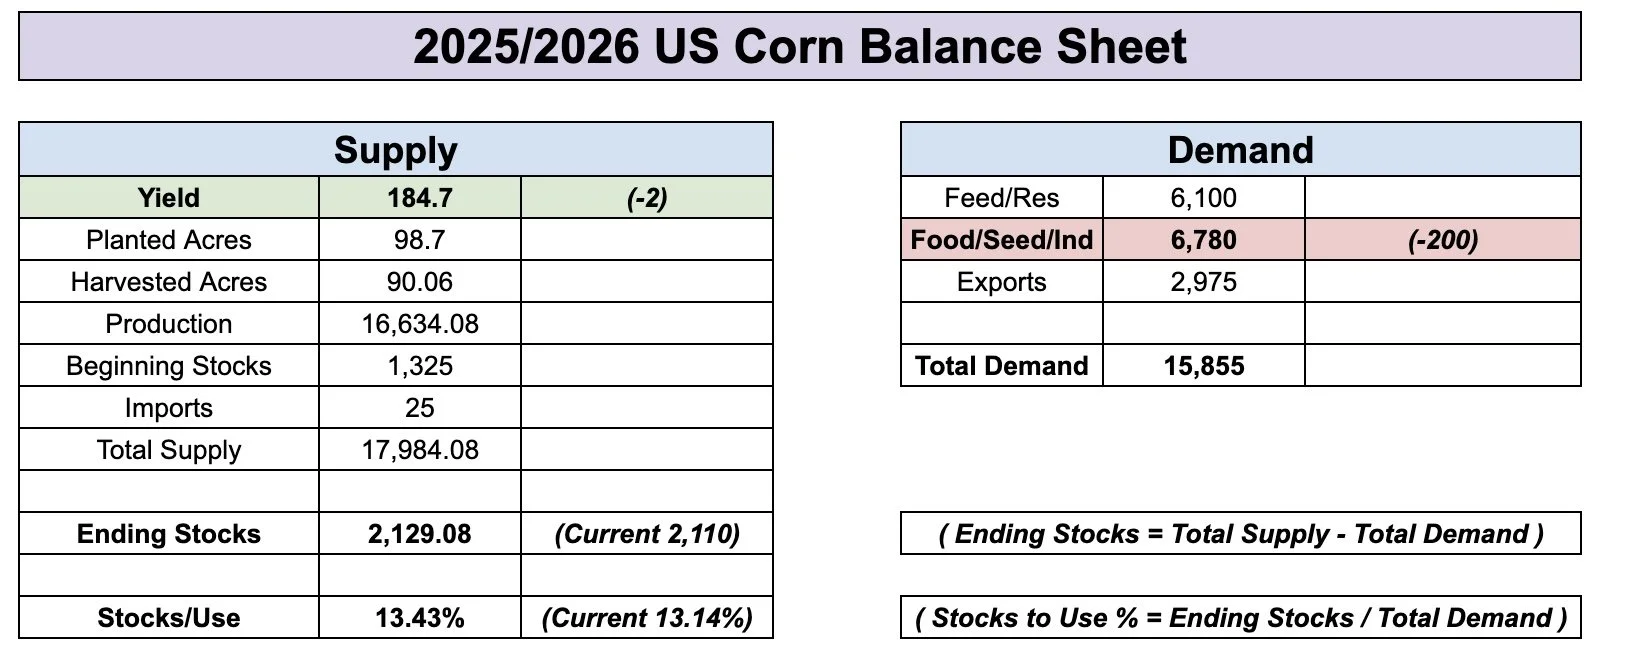
Now of course, there is always that scenario where yield just simply isn’t there at all.
Let's say yield is all the way down at 179.
Without changing demand, it would result in a stocks to use ratio below 9%. Which is very bullish.
179 Yield & No Demand Change

Now let's say yield is 179.
But feed demand is also 200 million too high.
That low of yield would still create a decently bullish scenario.
So in reality, it is going to take a decently large cut to yield to see a super bullish situation in corn.
179 Yield & -200 Million Feed

Soybeans
The USDA really did not make any major changes on the soybean balance sheet.
They found an extra 200k acres.
But the yield cut of -0.10 offset most of this change. Resulting in a slight increase to total supply.
At the same time, the USDA did drop soybean exports by -20 million. However they raised crush and seed & residual demand which led to a wash on the demand balance sheet.
The net result was a slight increase to carryout but nothing dramatic.
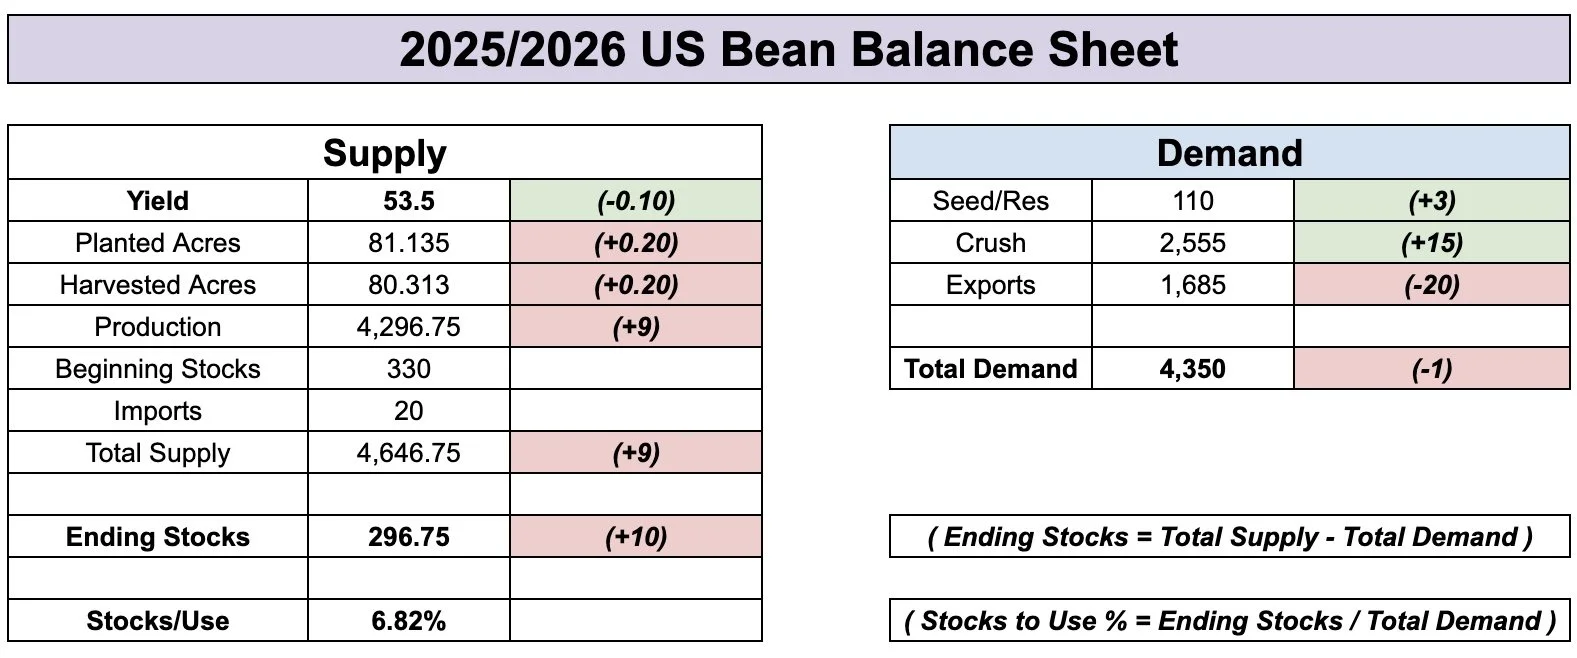
I don’t think there is any way yield doesn’t get revised lower from here given we just saw one of the driest Augusts on record.
The USDA's export estimates are also probably too high.
The real question is which one is going to outweigh the other?
The loss in supply or the loss in demand?
Exports are going to be the wild card.
Does China come to the table or not?
How does the USDA account for this?
It's really anyone's guess.
But if we completely ignore demand and only look at the supply side of the balance sheet, it is still razor thin when it comes to room for error.
This does not include demand changes, but if yield came just -1 bpa lower at 52.5 it would potentially put our carryout at it's lowest levels in nearly a decade.
If yield came in at our current 51.9 record from 2016, it would be one of the tightest situations in a long time.
So that is why soybeans have a story. We could see a record yield yet see our tightest carryout in a decade.
Although I am sure we will see exports cut, which will offset some of this. The biggest question is by how much.
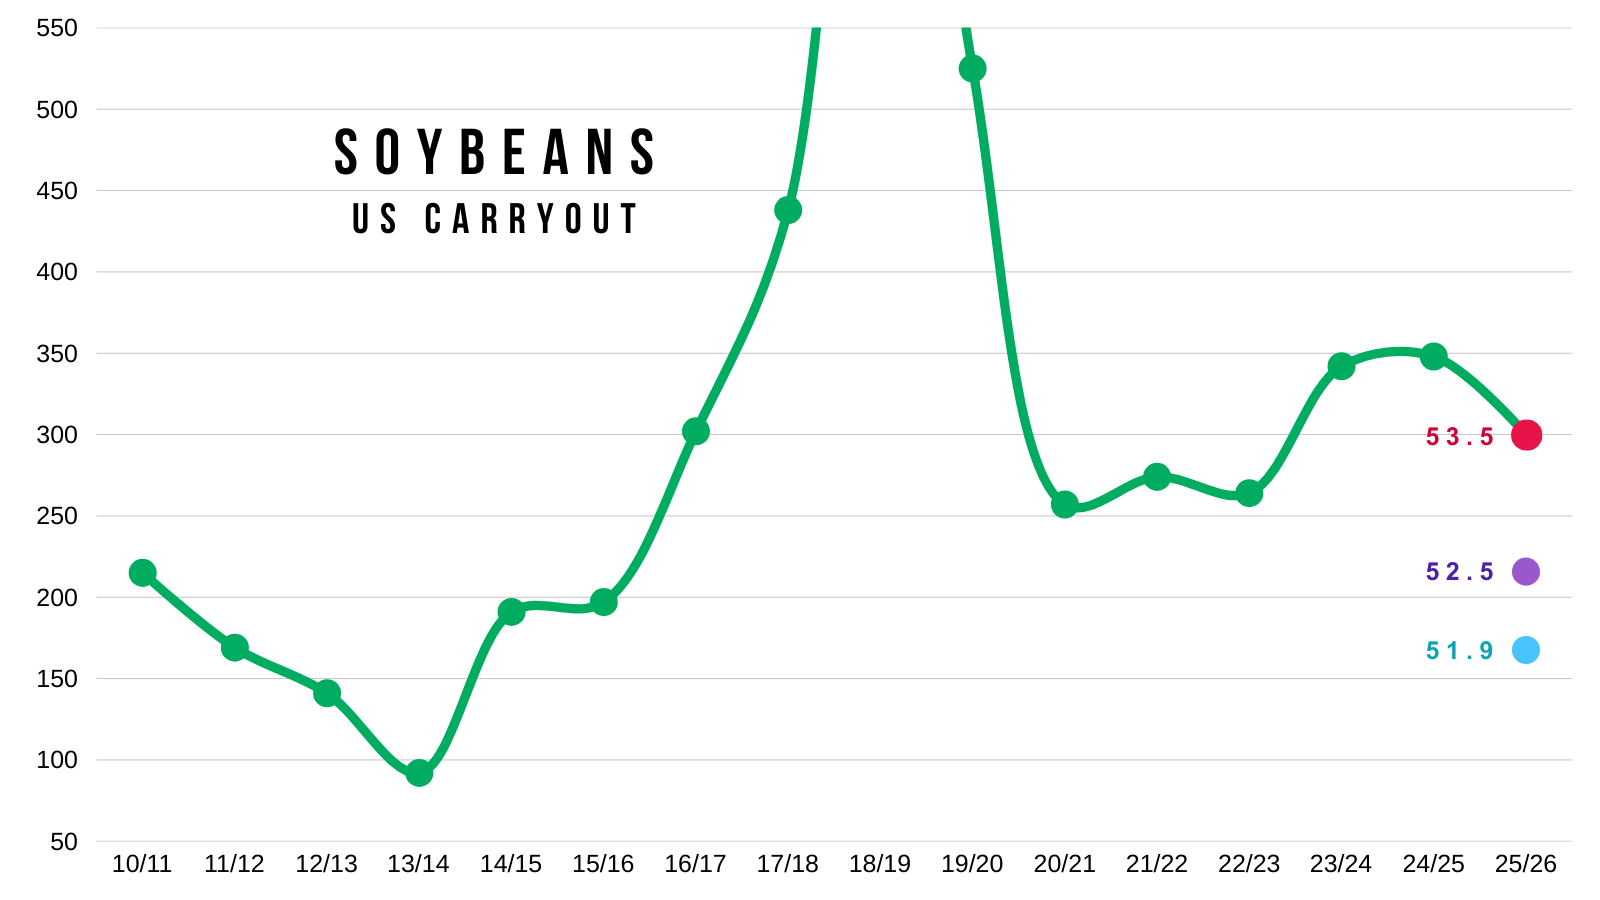
This is pretty much only possible due to having less acres this year.
Acres are still the 2nd lowest in at least a decade.
Only trailing behind 2019.
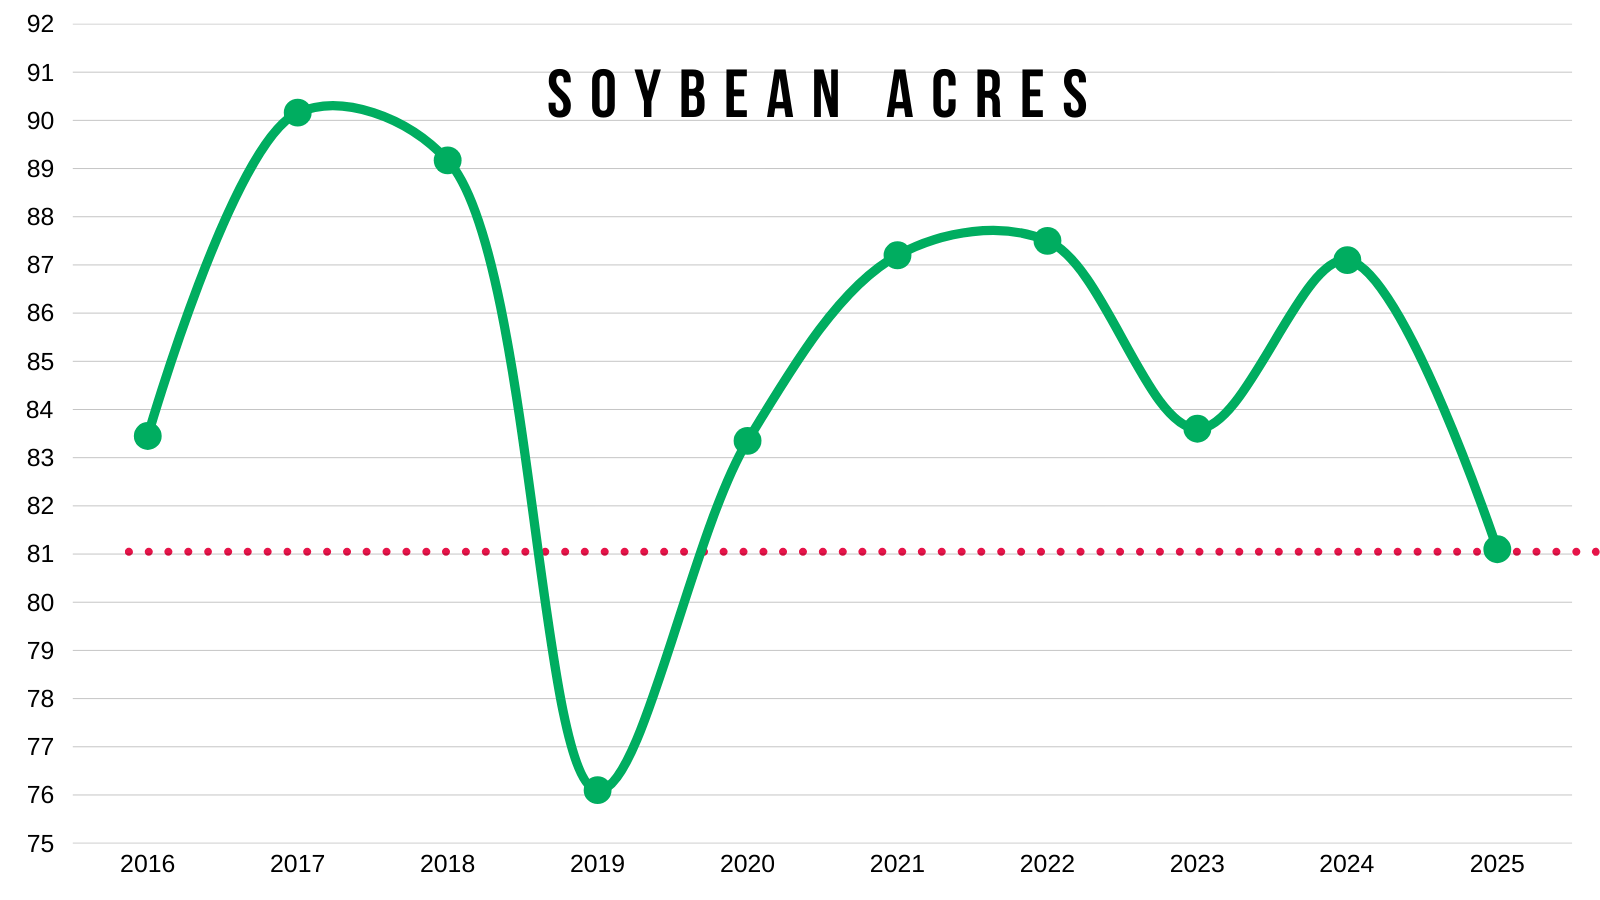
Sep vs Final Yield
Corn
It's actually about 50/50 the past decade whether we see an increase or a decrease in yield from Sep to final.
However, the last 3 of 4 changes lower were by more than -4 bpa.
Soybeans
Soybeans have a more clear trend of dropping from Sep to final.
As yield has dropped 6 of the last 8 years.
Last year was the biggest of the decade at nearly -2.5 bpa.
Today's Main Takeaways
Corn
Altough corn has a harder path to a substantially tight balance sheet given the increase in acres.
You have to imagine yield is getting smaller, perhaps even drastically smaller.
Here is the precip rankings from August 1st until today.
This doesn’t scream yield is 7 bushels an acre higher than anything we've seen before.
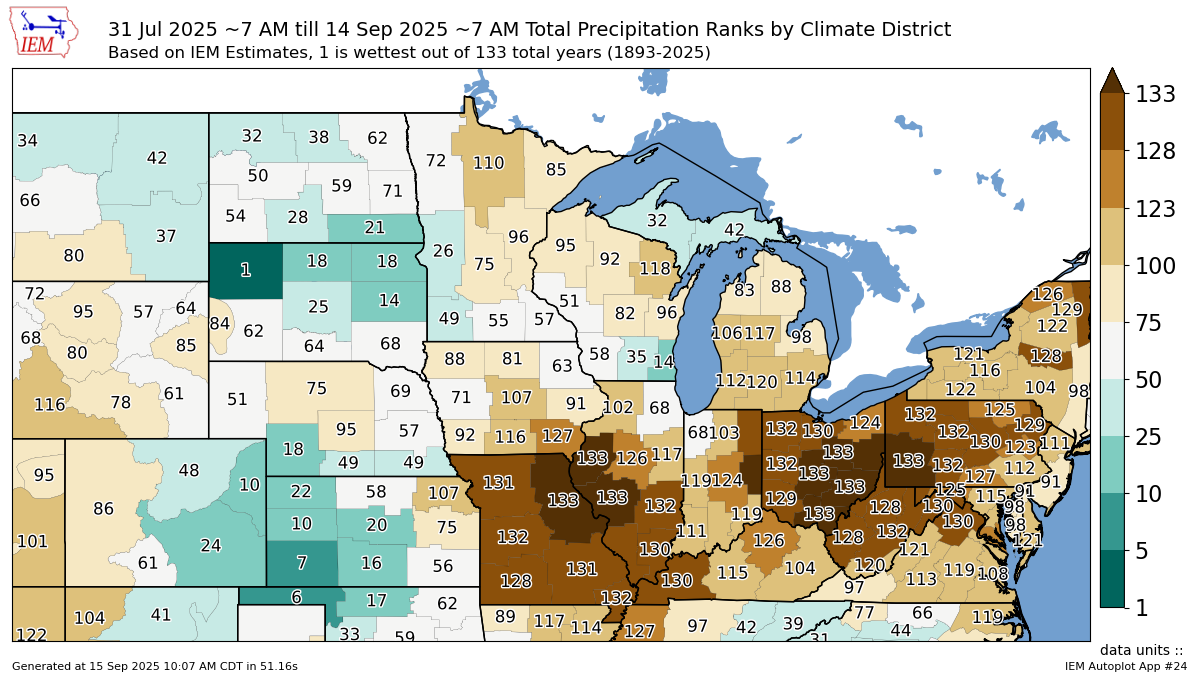
Here is data from the NOAA that actually weighs primary corn & soybean growing areas precipitation for August.
It was the driest since 2013.

I am not $5.00 corn bullish here yet by any stretch of the imagination.
However, I still think we've seen our lows for the year.
We've already priced in the biggest yield we are going to see.
The trade and the funds are very aware that yield is getting smaller, not larger.
Seasonally we carve out lows exactly where we just did.
Our lows this year were marked on the exact day the USDA printed a 189 yield.
Here is a March corn seasonal that aligns nicely with my thoughts on how this market could play out.
Red = 5 Year Seasonal
Green = 10 Year Seasonal
Both say we top around October 1st. Right in time for insurance pricing.
Both then suggest we go sideways to slightly lower into the end of the year, but do not revist those harvest lows.
Before heading higher into the new year when the USDA probably comes clean about where yield is at.

Technicals:
We saw a big sell off today but no damage was done on the charts.
Since we rallied big on Friday, today's candle was a complete inside day.
We didn’t take out Friday's highs or lows.
Which ever we take out first will decide our short term momentum.
Regardless, the chart looks pretty solid here.
First off, we broke out of a bullish pennant pattern.
Secondly, we finally broke this simple downward trend that had marked several highs since all the way back in April.
Momentum looks like it has shifted higher.
Now what?
I am eyeing $4.35 to de-risk.
That gives back 50% of our February highs.
It is also old key support from back in spring.
I will be alerting a sell signal & hedge alert if this hits.

Soybeans
Soybeans have a battle.
Will the loss in supply offset the loss in demand?
You have to wonder if the demand problem in soybeans could get corrected by a supply problem.
That is how tight the balance sheet is on the supply side.
August is the make or break month for beans.
I can’t imagine the driest August on record doesn’t result in lower yields.
If yield slips and export demand is fine, soybeans have an incredible amount of upside.
But export demand and China is going to be the wild card.
We are quickly approaching that time frame where we are going to need China to start buying our soybeans.

Here is a 5 year seasonal for March beans.
Typically we do start to struggle here pretty soon before finding a bottom in October.
We then typically head higher into the end of the year off the back of South America production uncertainty.
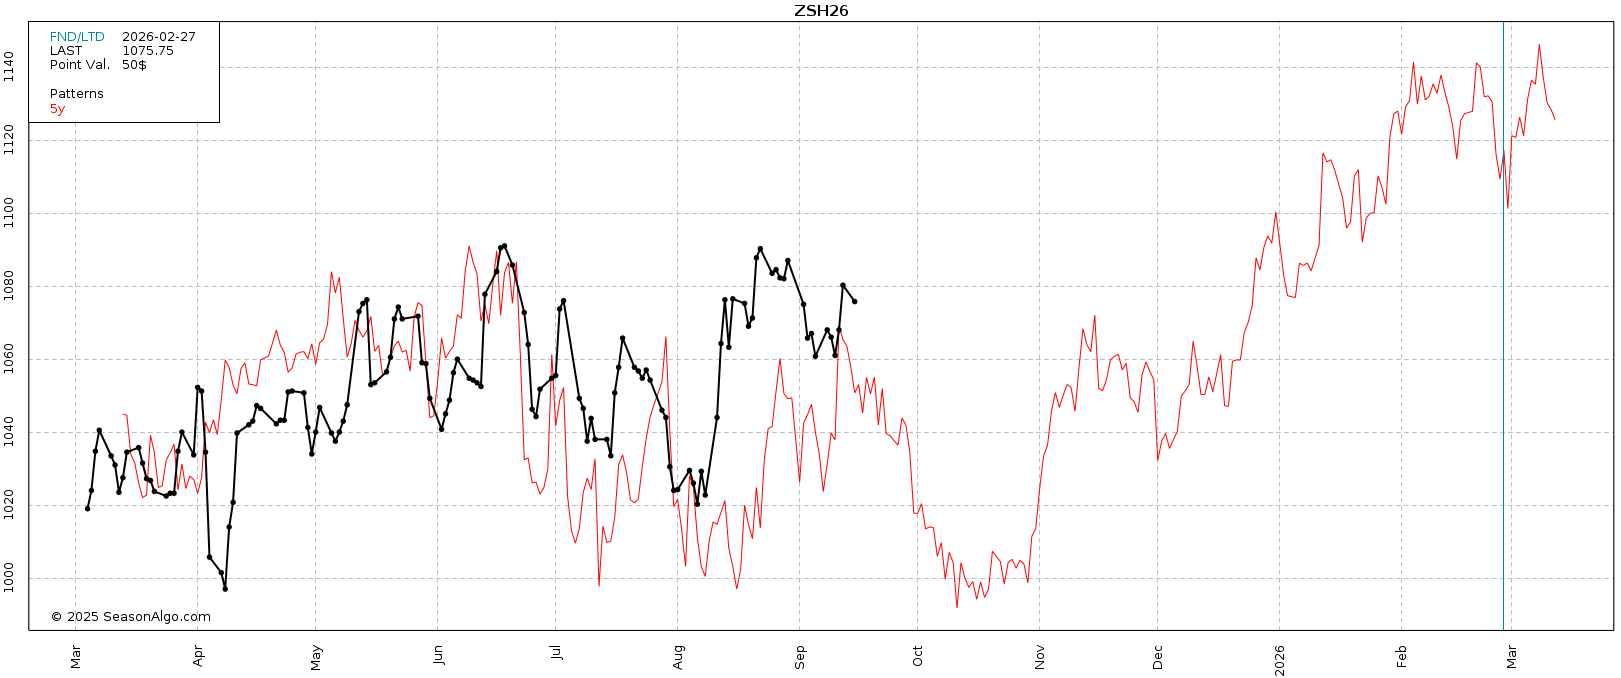
Daily Nov Chart:
Nov soybeans are rejecting right off the 61.8% retracement up to those recent highs.
This is a major spot and decision point in the market.
If we break above, it tells us this bounce has room to run and is no longer viewed as a correctional bounce. It would suggest our lows are in and we are headed higher.
If we fail here, it is still possible that we could go and post new lows.
The line in the sand to remain bullish is that blue box. Which we bounced off of perfectly near the recent lows.

Here is a chart that shows how powerful the 61.8% level tends to be.
I outlined the last two correctional bounces following those June highs.
Both of them rejected at the 61.8% level before heading lower.
That is why this level is so key.
Since we alerted a sell signal at those recent highs, our next target to de-risk is still going to be $10.82
As $10.82 gives back 50% of the May 2024 highs.
If you did not follow our sell signal at Target #1, then by all means de-risk if that first target hits again.

Wheat
Wheat continues to struggle near contract lows.
There isn’t one definitive catalyst saying "wheat has to go higher".
But I do still think wheat will eventually find some life down at these levels.
For starters, seasonally this is a bullish time period.
Wheat has traded higher from Sep 1st to Oct 1st the past 8 of 10 years.
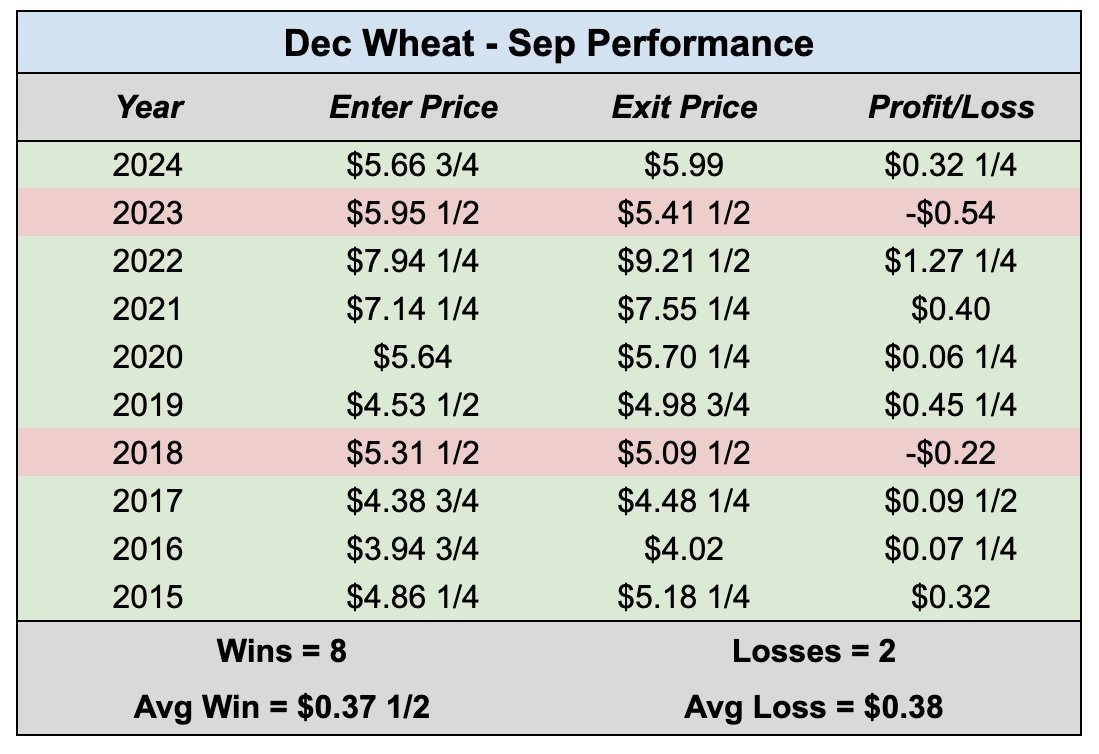
Here is a 10 year seasonal for Dec wheat.
Typically we find a bottom right about now.
Daily Chicago:
The charts are the biggest reason my bias leans higher here for the wheat market.
We have a falling wedge pattern that we are breaking out of.
If we clear $5.35 that would be our green light telling us this market is ready to move higher.
I think that should ignite a move to $5.52 before finding major resistance.
That is 38.2% of the June highs and old support.
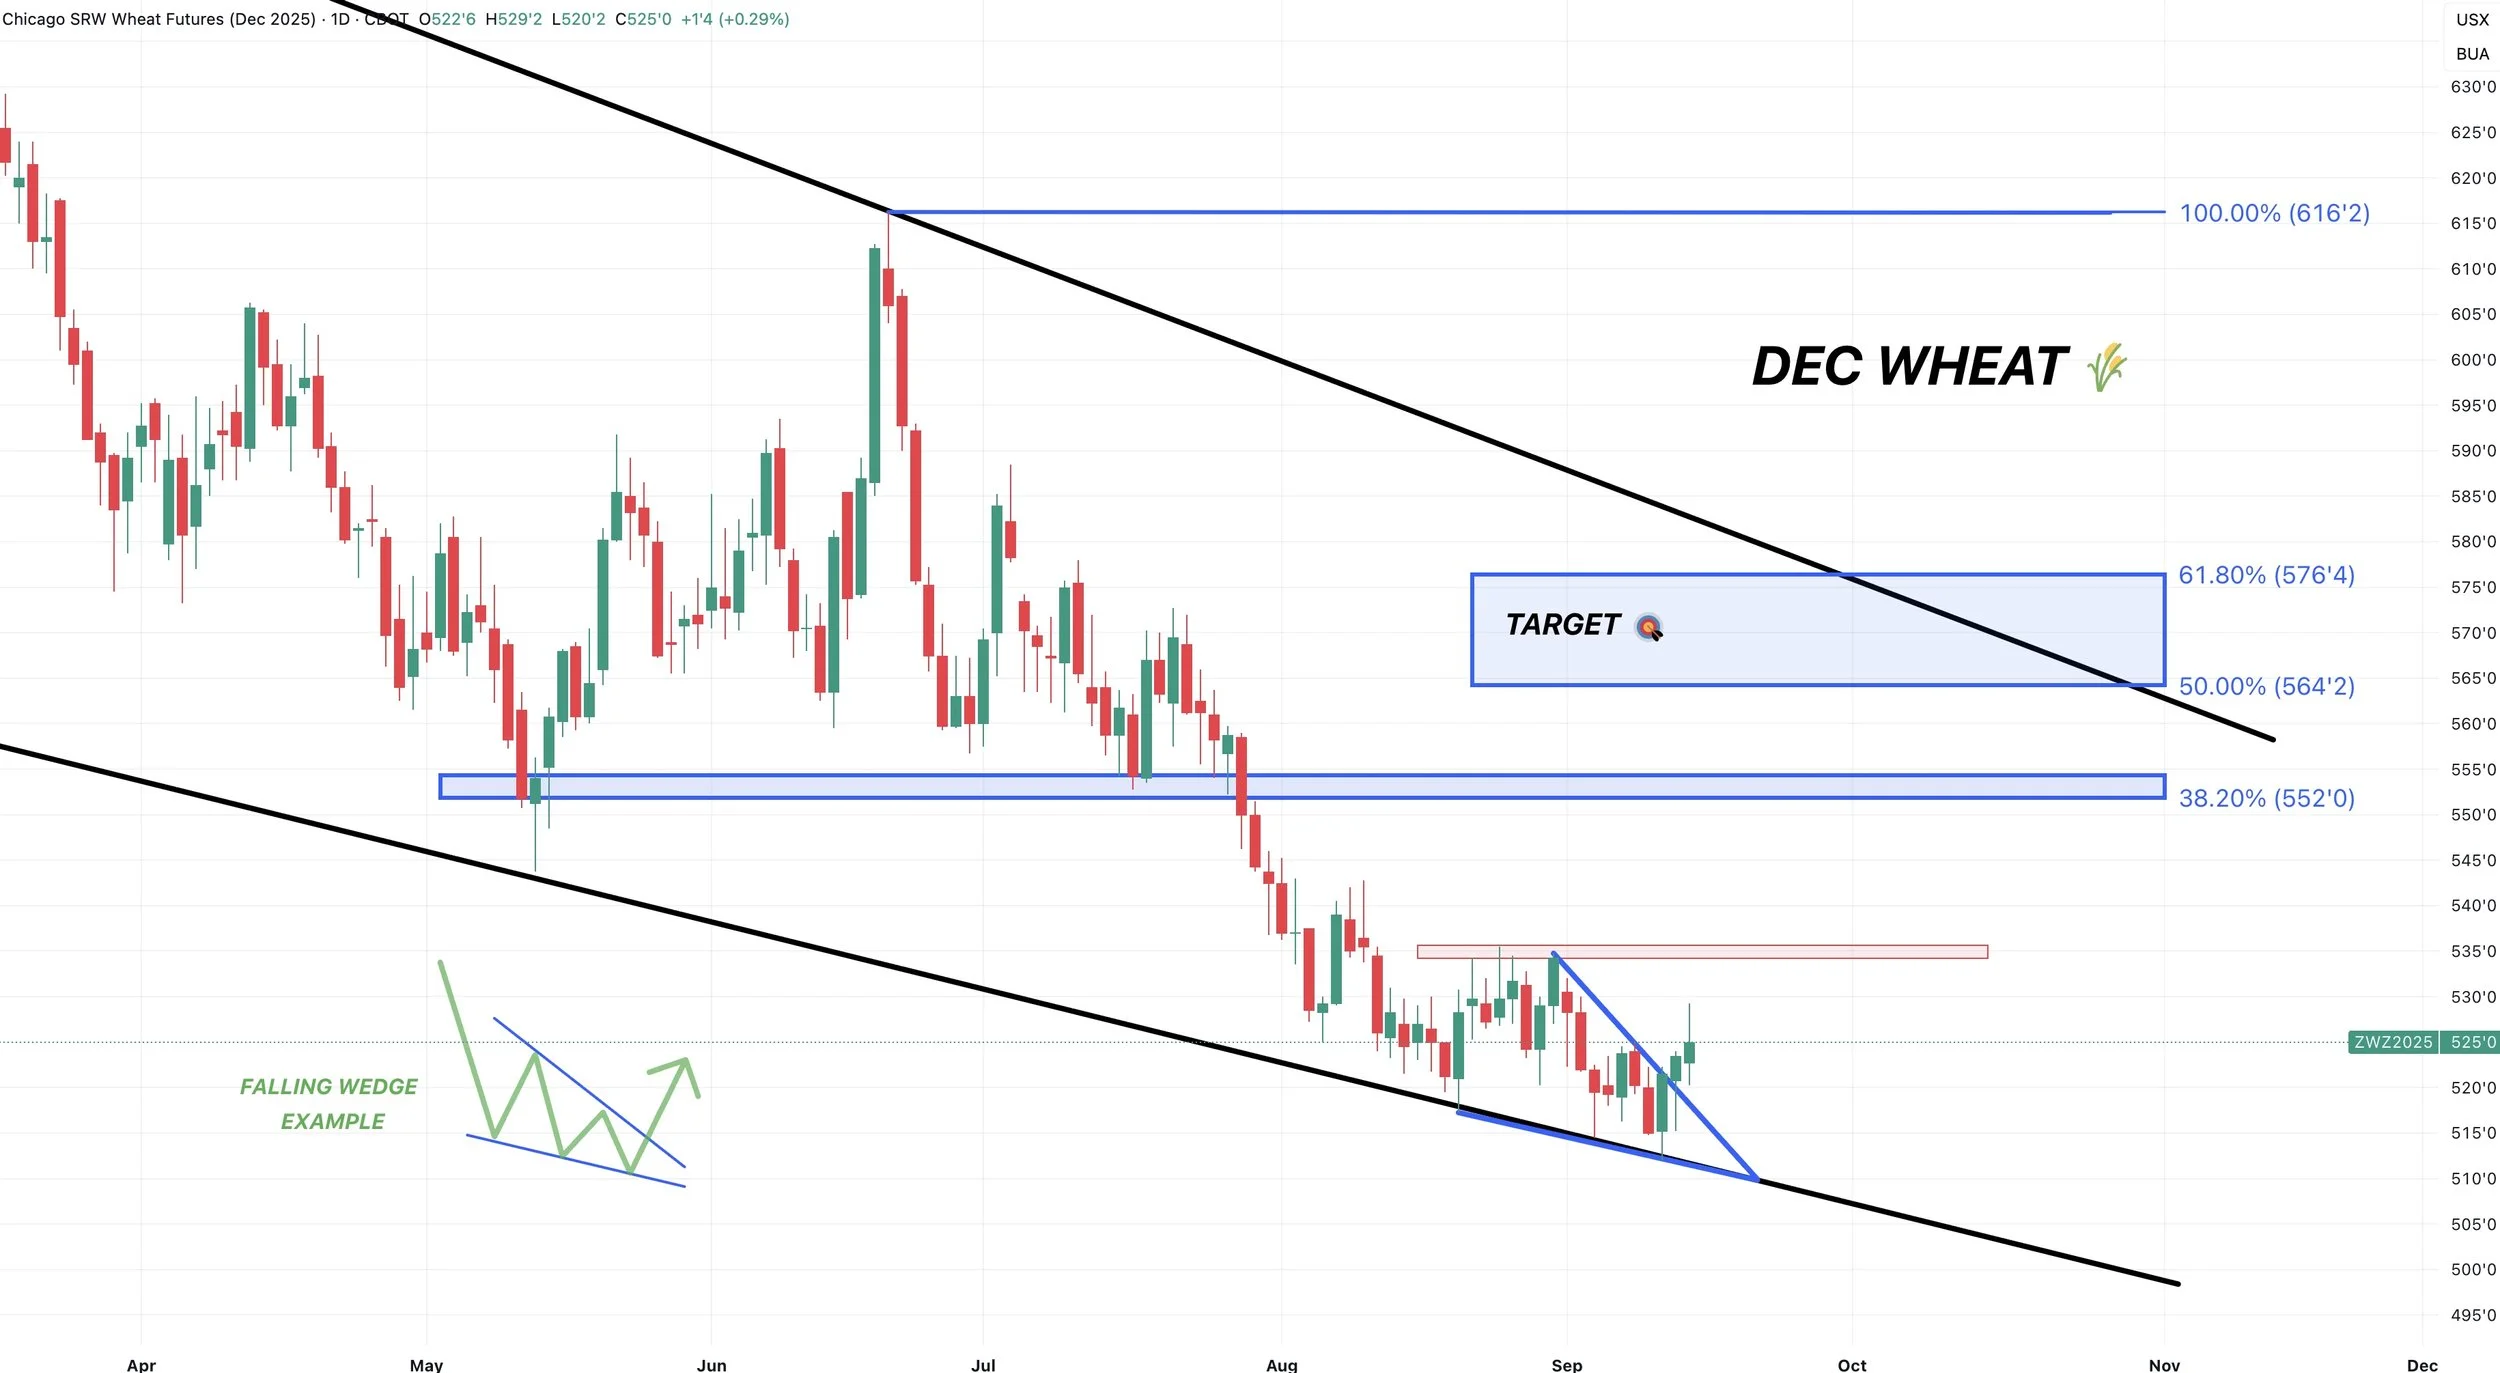
We are also showing some massive bullish divergence.
Prices continue to trickle lower, yet the RSI is not.
This tells us that downside momentum is getting weak.
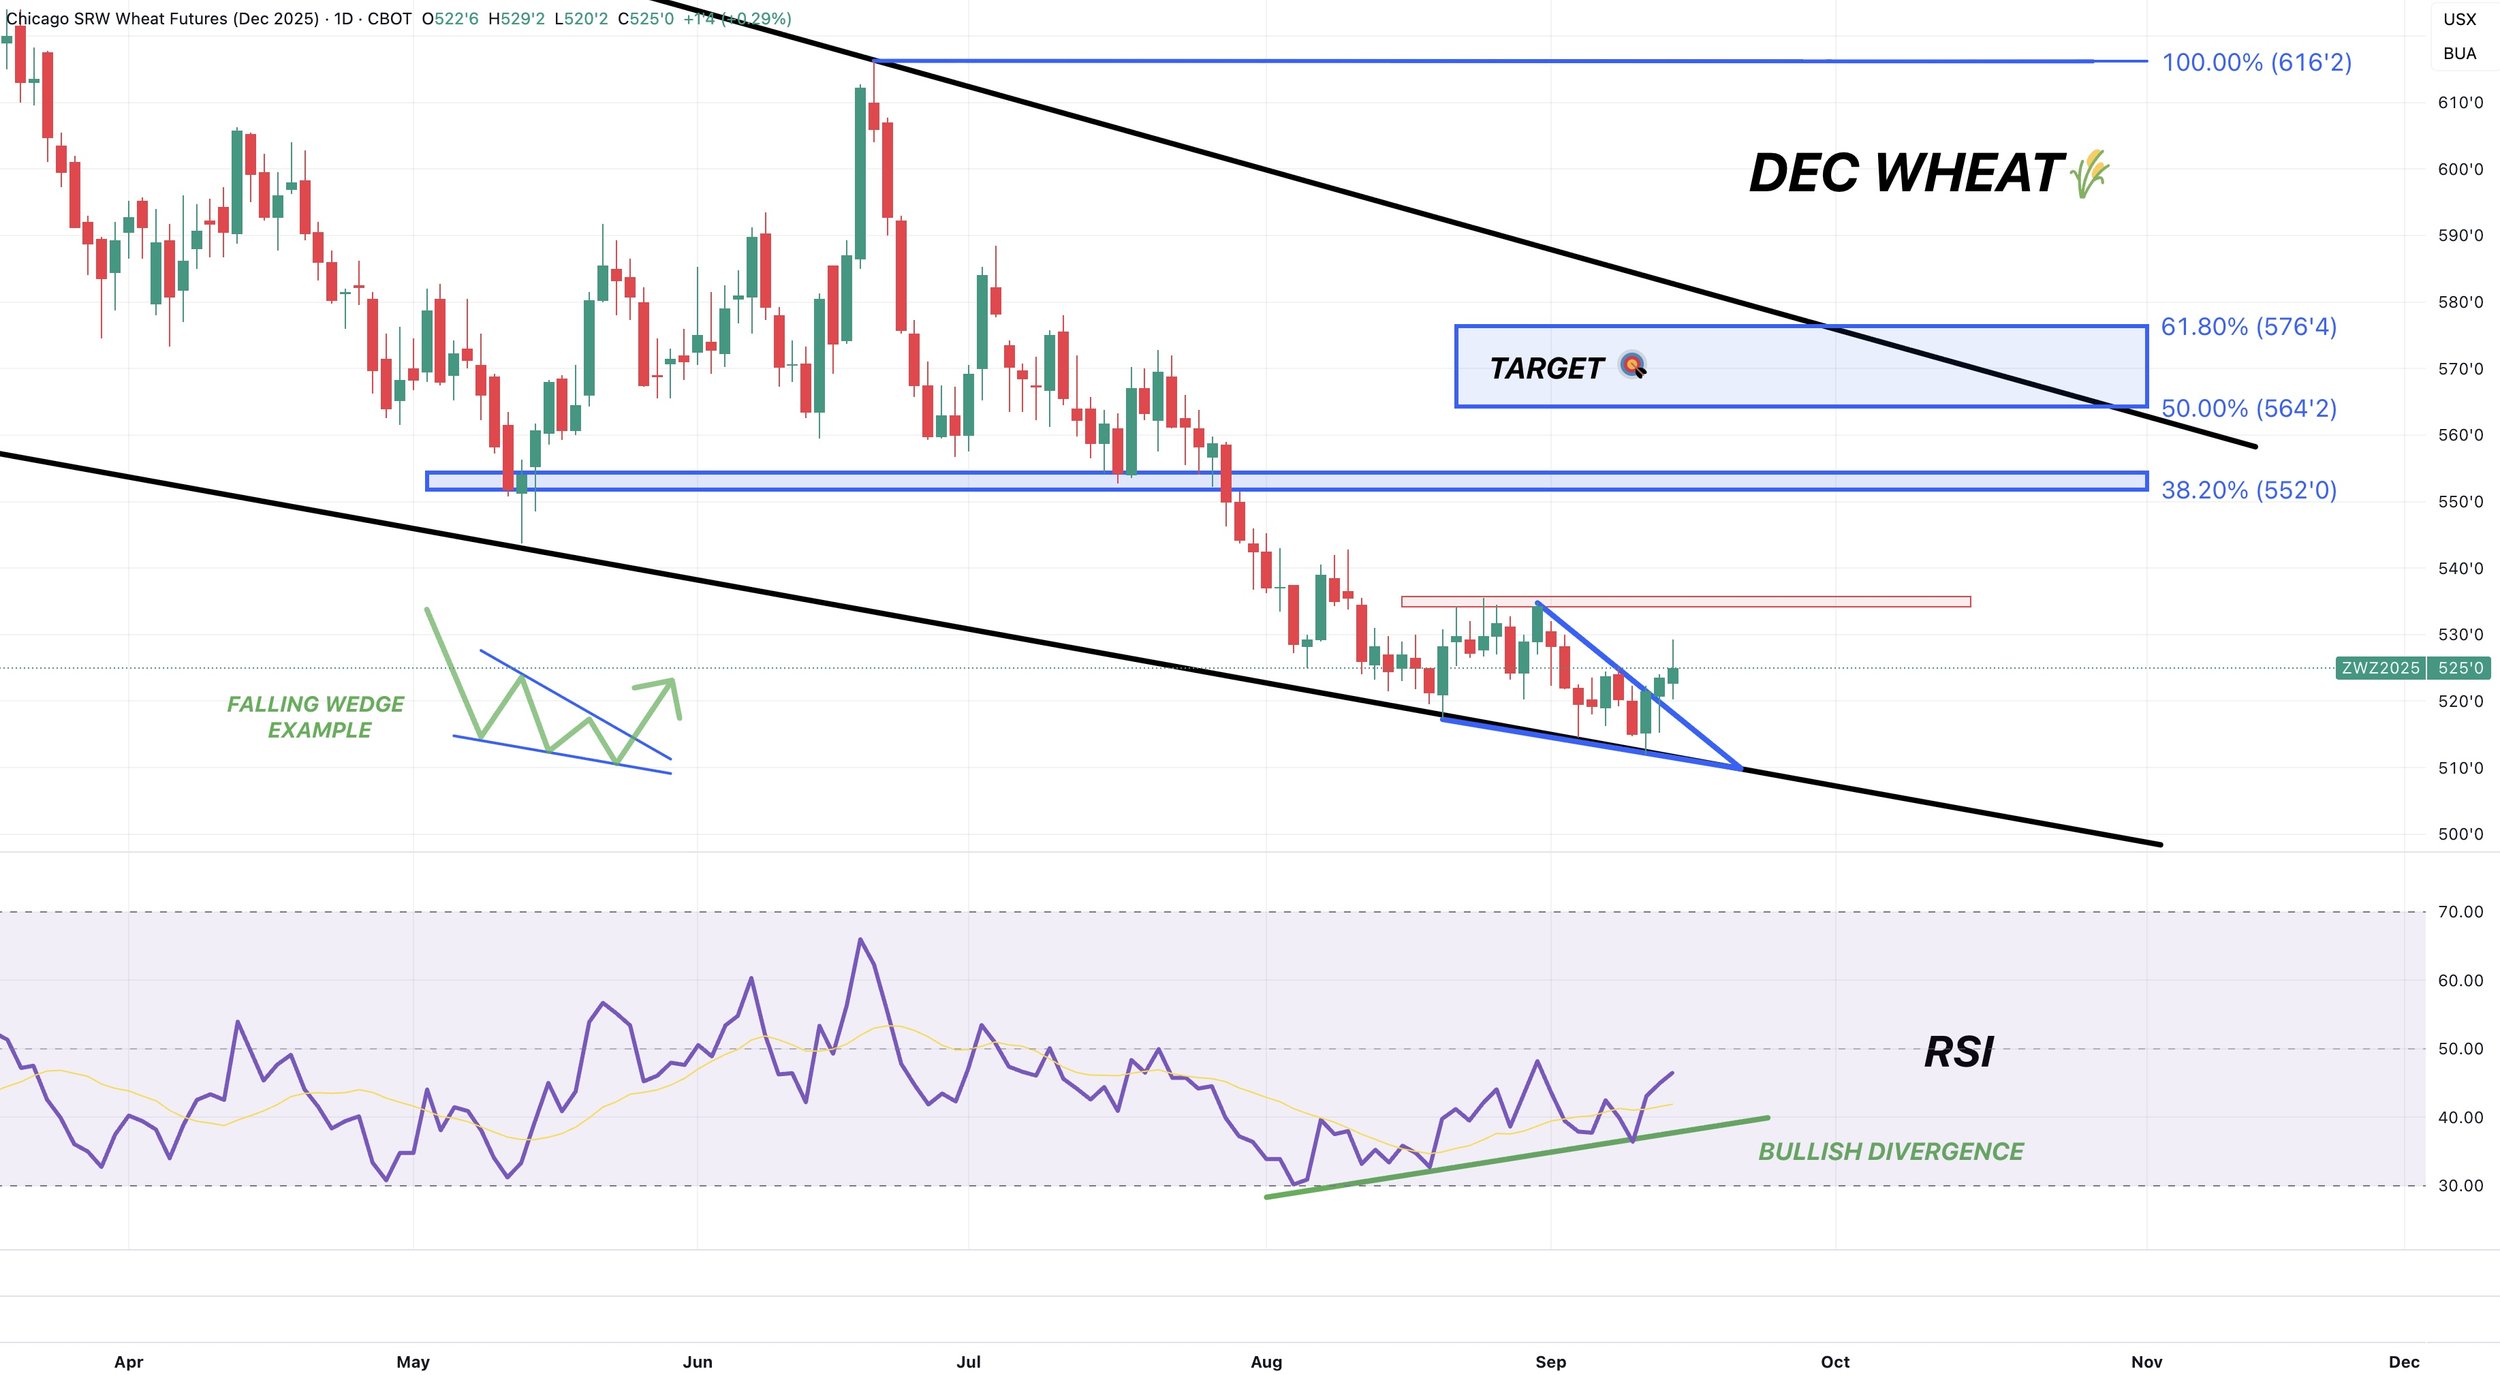
Daily KC Wheat:
KC potentially trying to break out of this downward channel.
First real resistance comes in at the $5.40 range if we get the breakout.
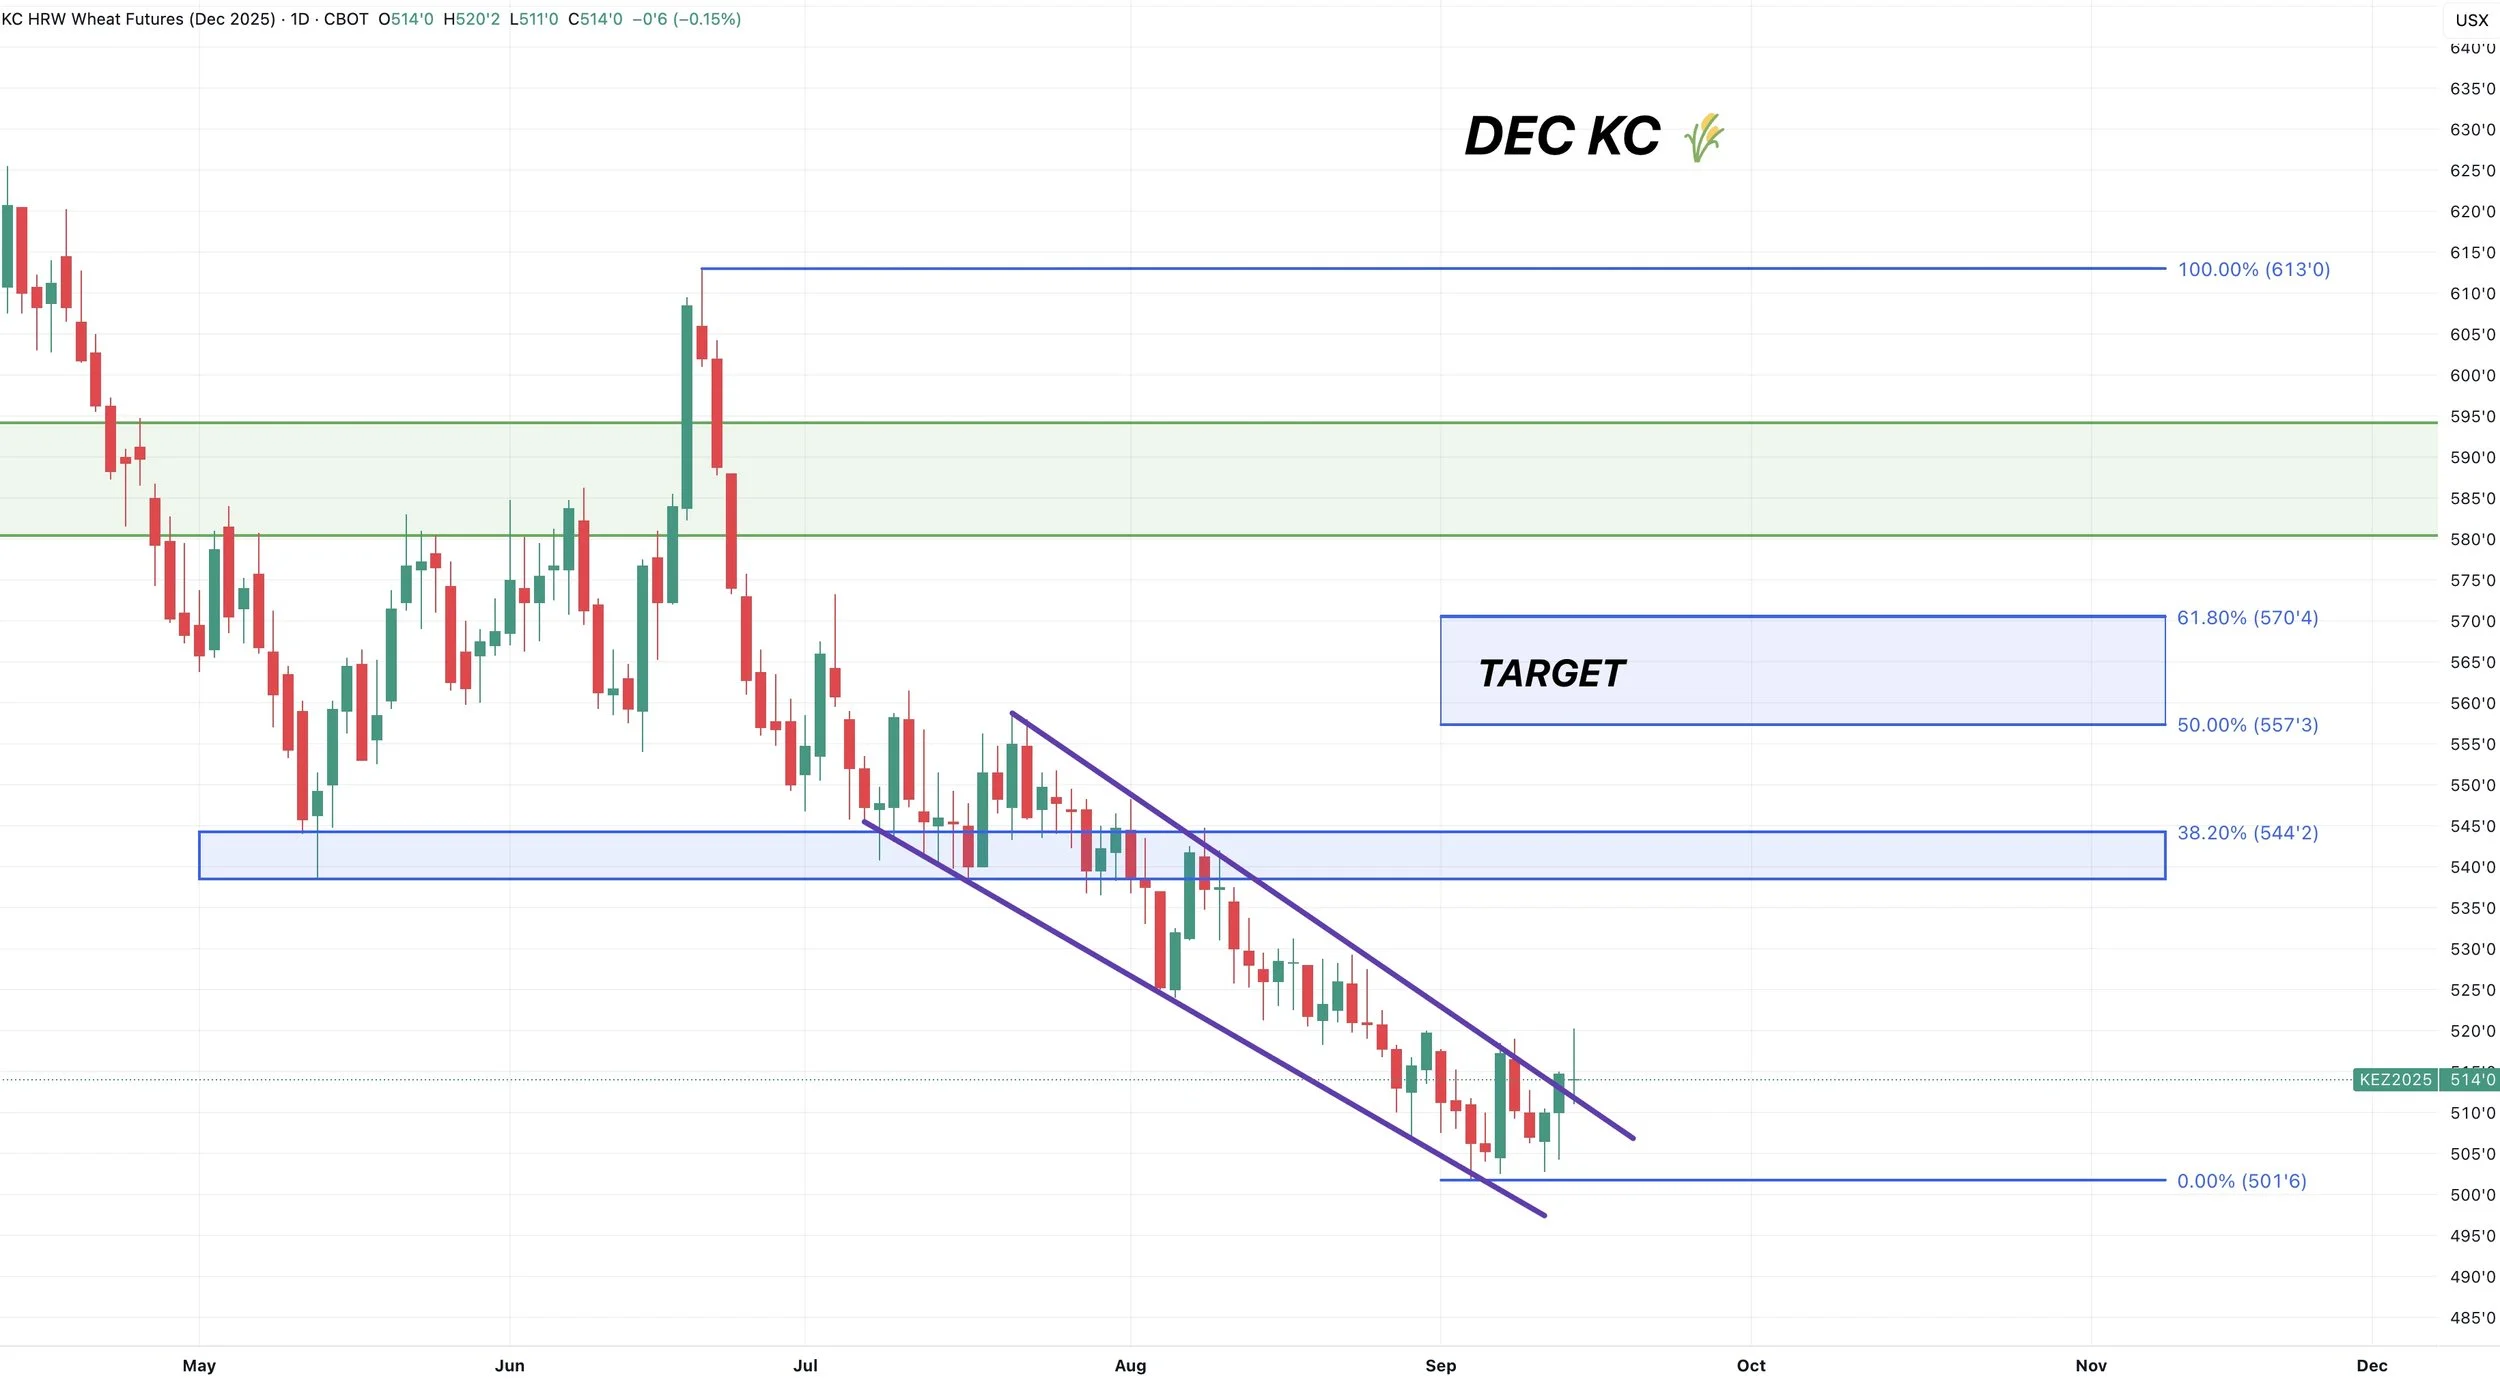
Here is a continuous chart for KC wheat.
This makes me hopeful that these levels will be long term lows.
We are finding support right where we found resistance back in 2019 and 2020.
A classic case of old resistance turning into new support.
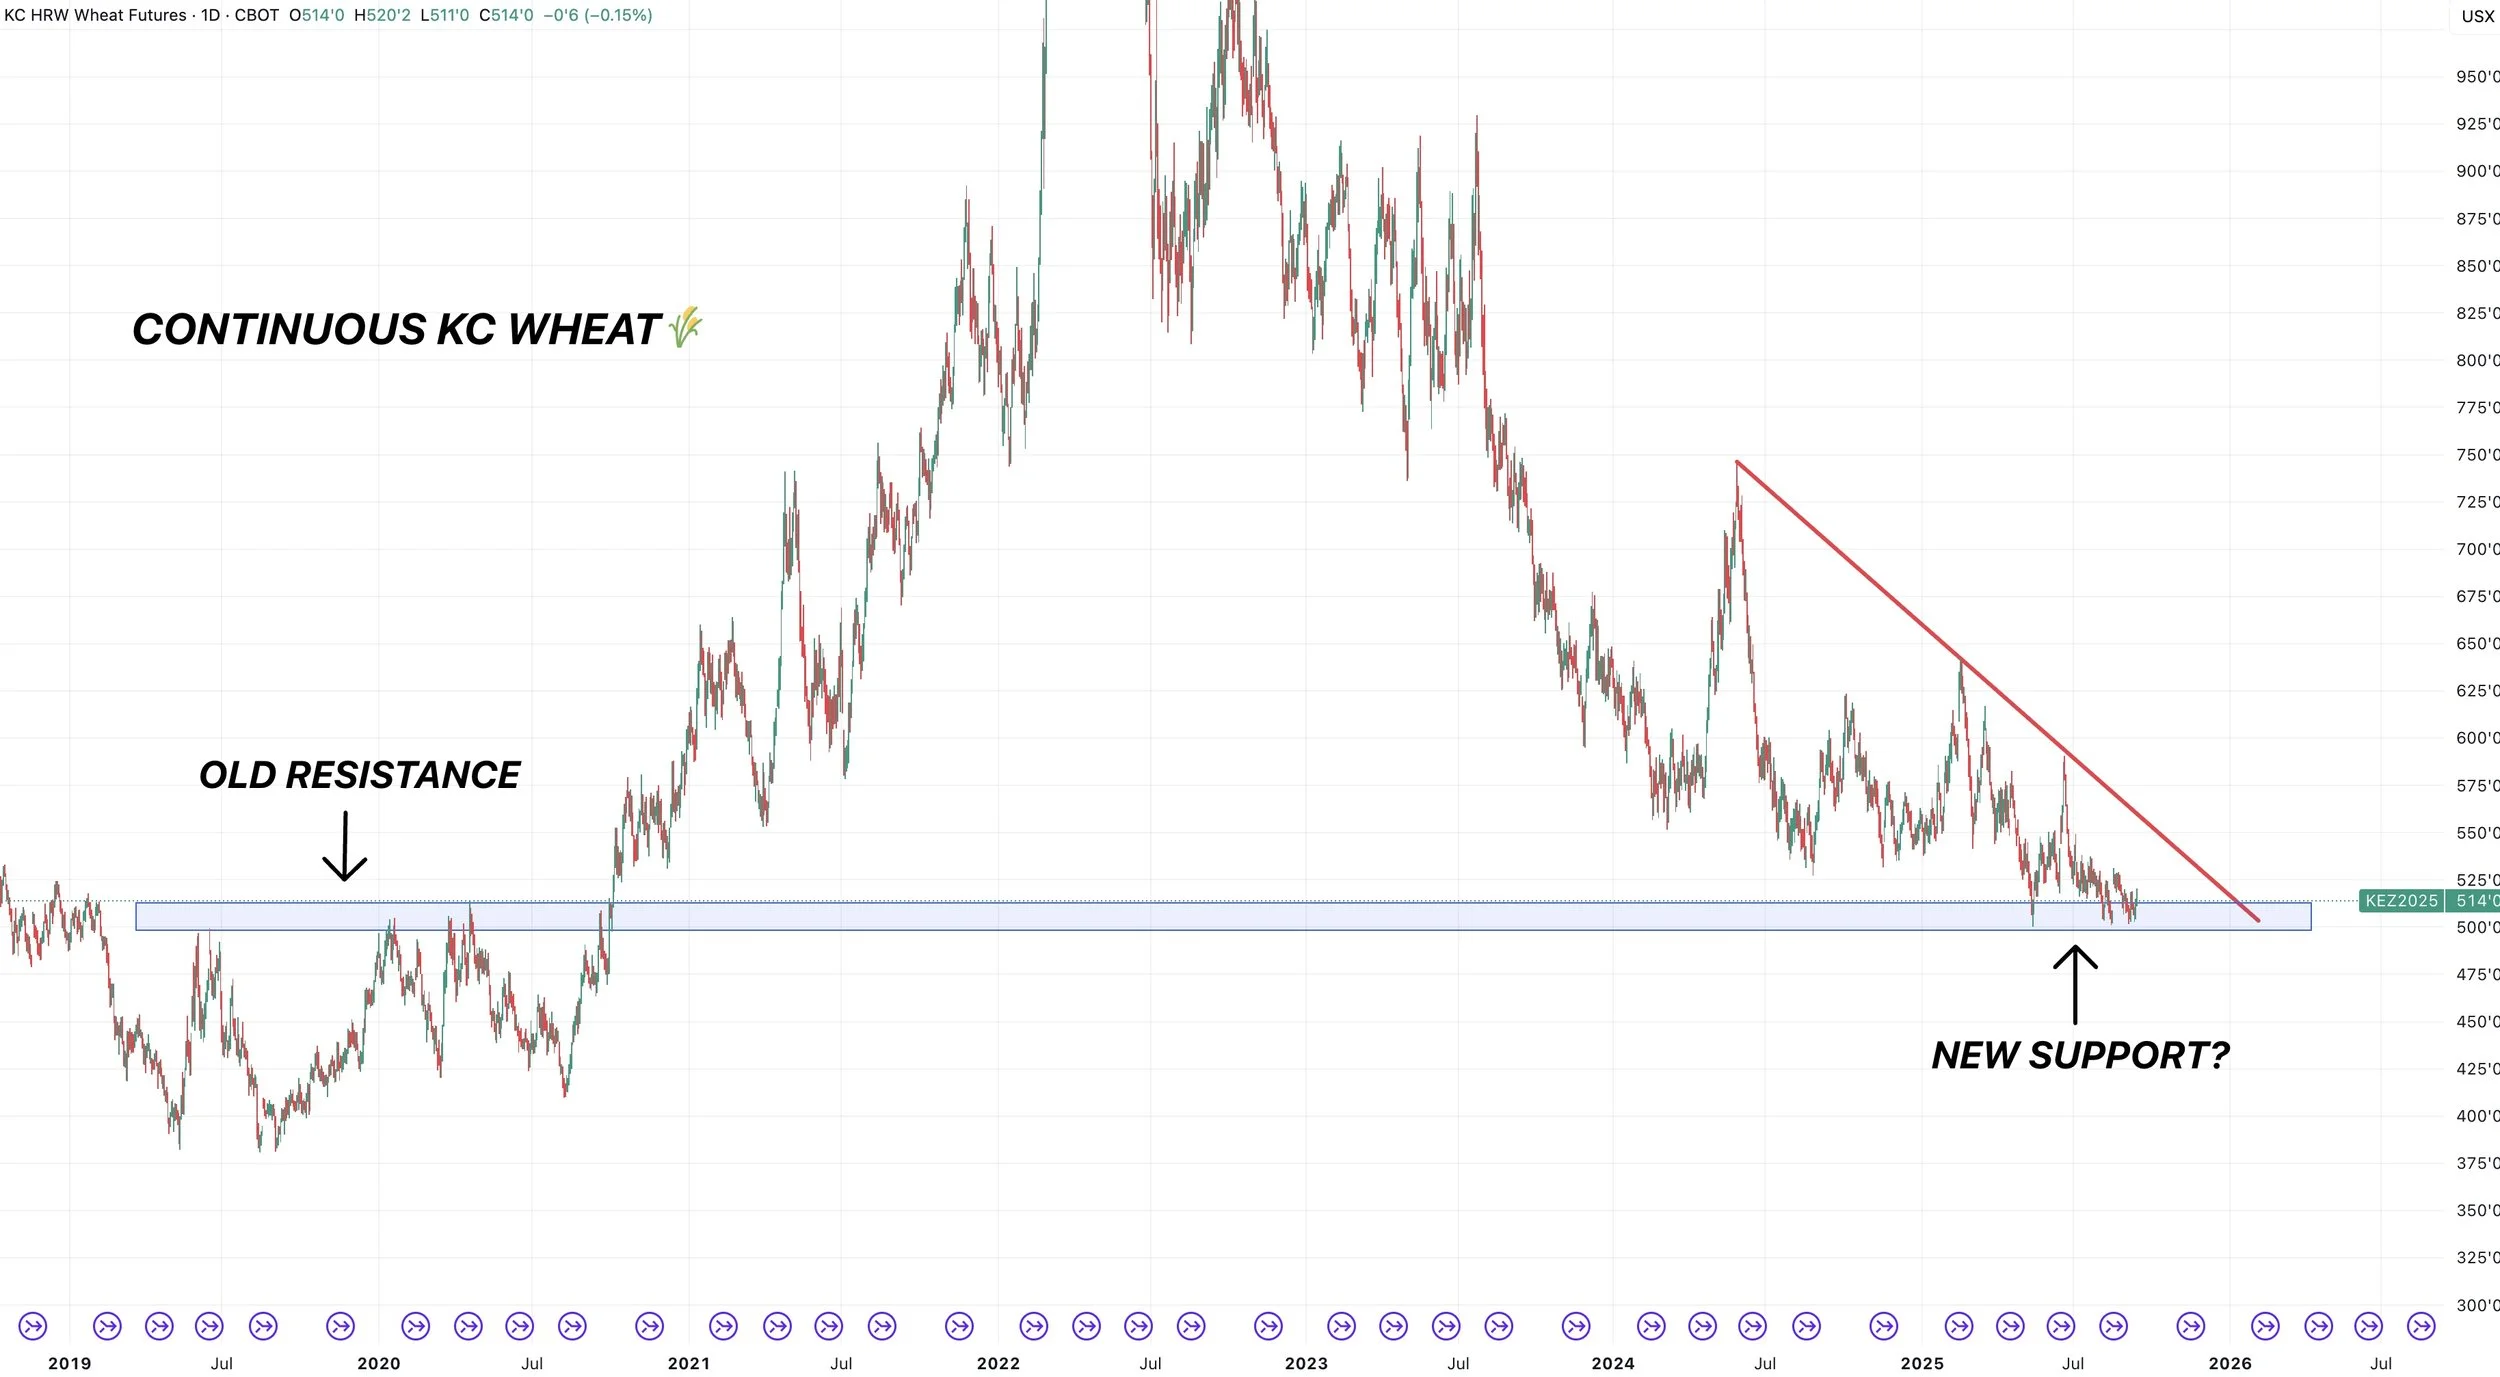
Cattle
One thing I wanted to point out was the funds.
They have been selling a lot of cattle after holding a massive record long position.
This is now their smallest long position they've held all year long.
So that has to be a sign of caution in this market, as it appears the funds are taking some profit.
Seasonally we tend to struggle here until around late October to early November.
But this a bull market, and anything can happen in a bull market.
Just another reason to have some caution up here.
Oct Feeder:
We are finding life right in the golden zone from those August 1st lows.
This is deep enough for a standard correction.
However, that 343.875 is going to be a big level to hold.
If we cannot hold that level, it opens the door lower.
Perhaps as low as 325 to 334. Which is the golden zone from the entire rally since June.
If we drop down to that level, I think that would be a great spot to look at some re-ownership strategies.
To say that we have found a bottom here, I need a close above 360. As that reclaims 61.8% of this sell off.

Oct Live:
Live cattle also bouncing in the golden zone.
229.600 is a huge spot to hold.
If we break below, it opens the door lower to the next golden zone.
If we close above 237 then we could be more confident the lows are in.
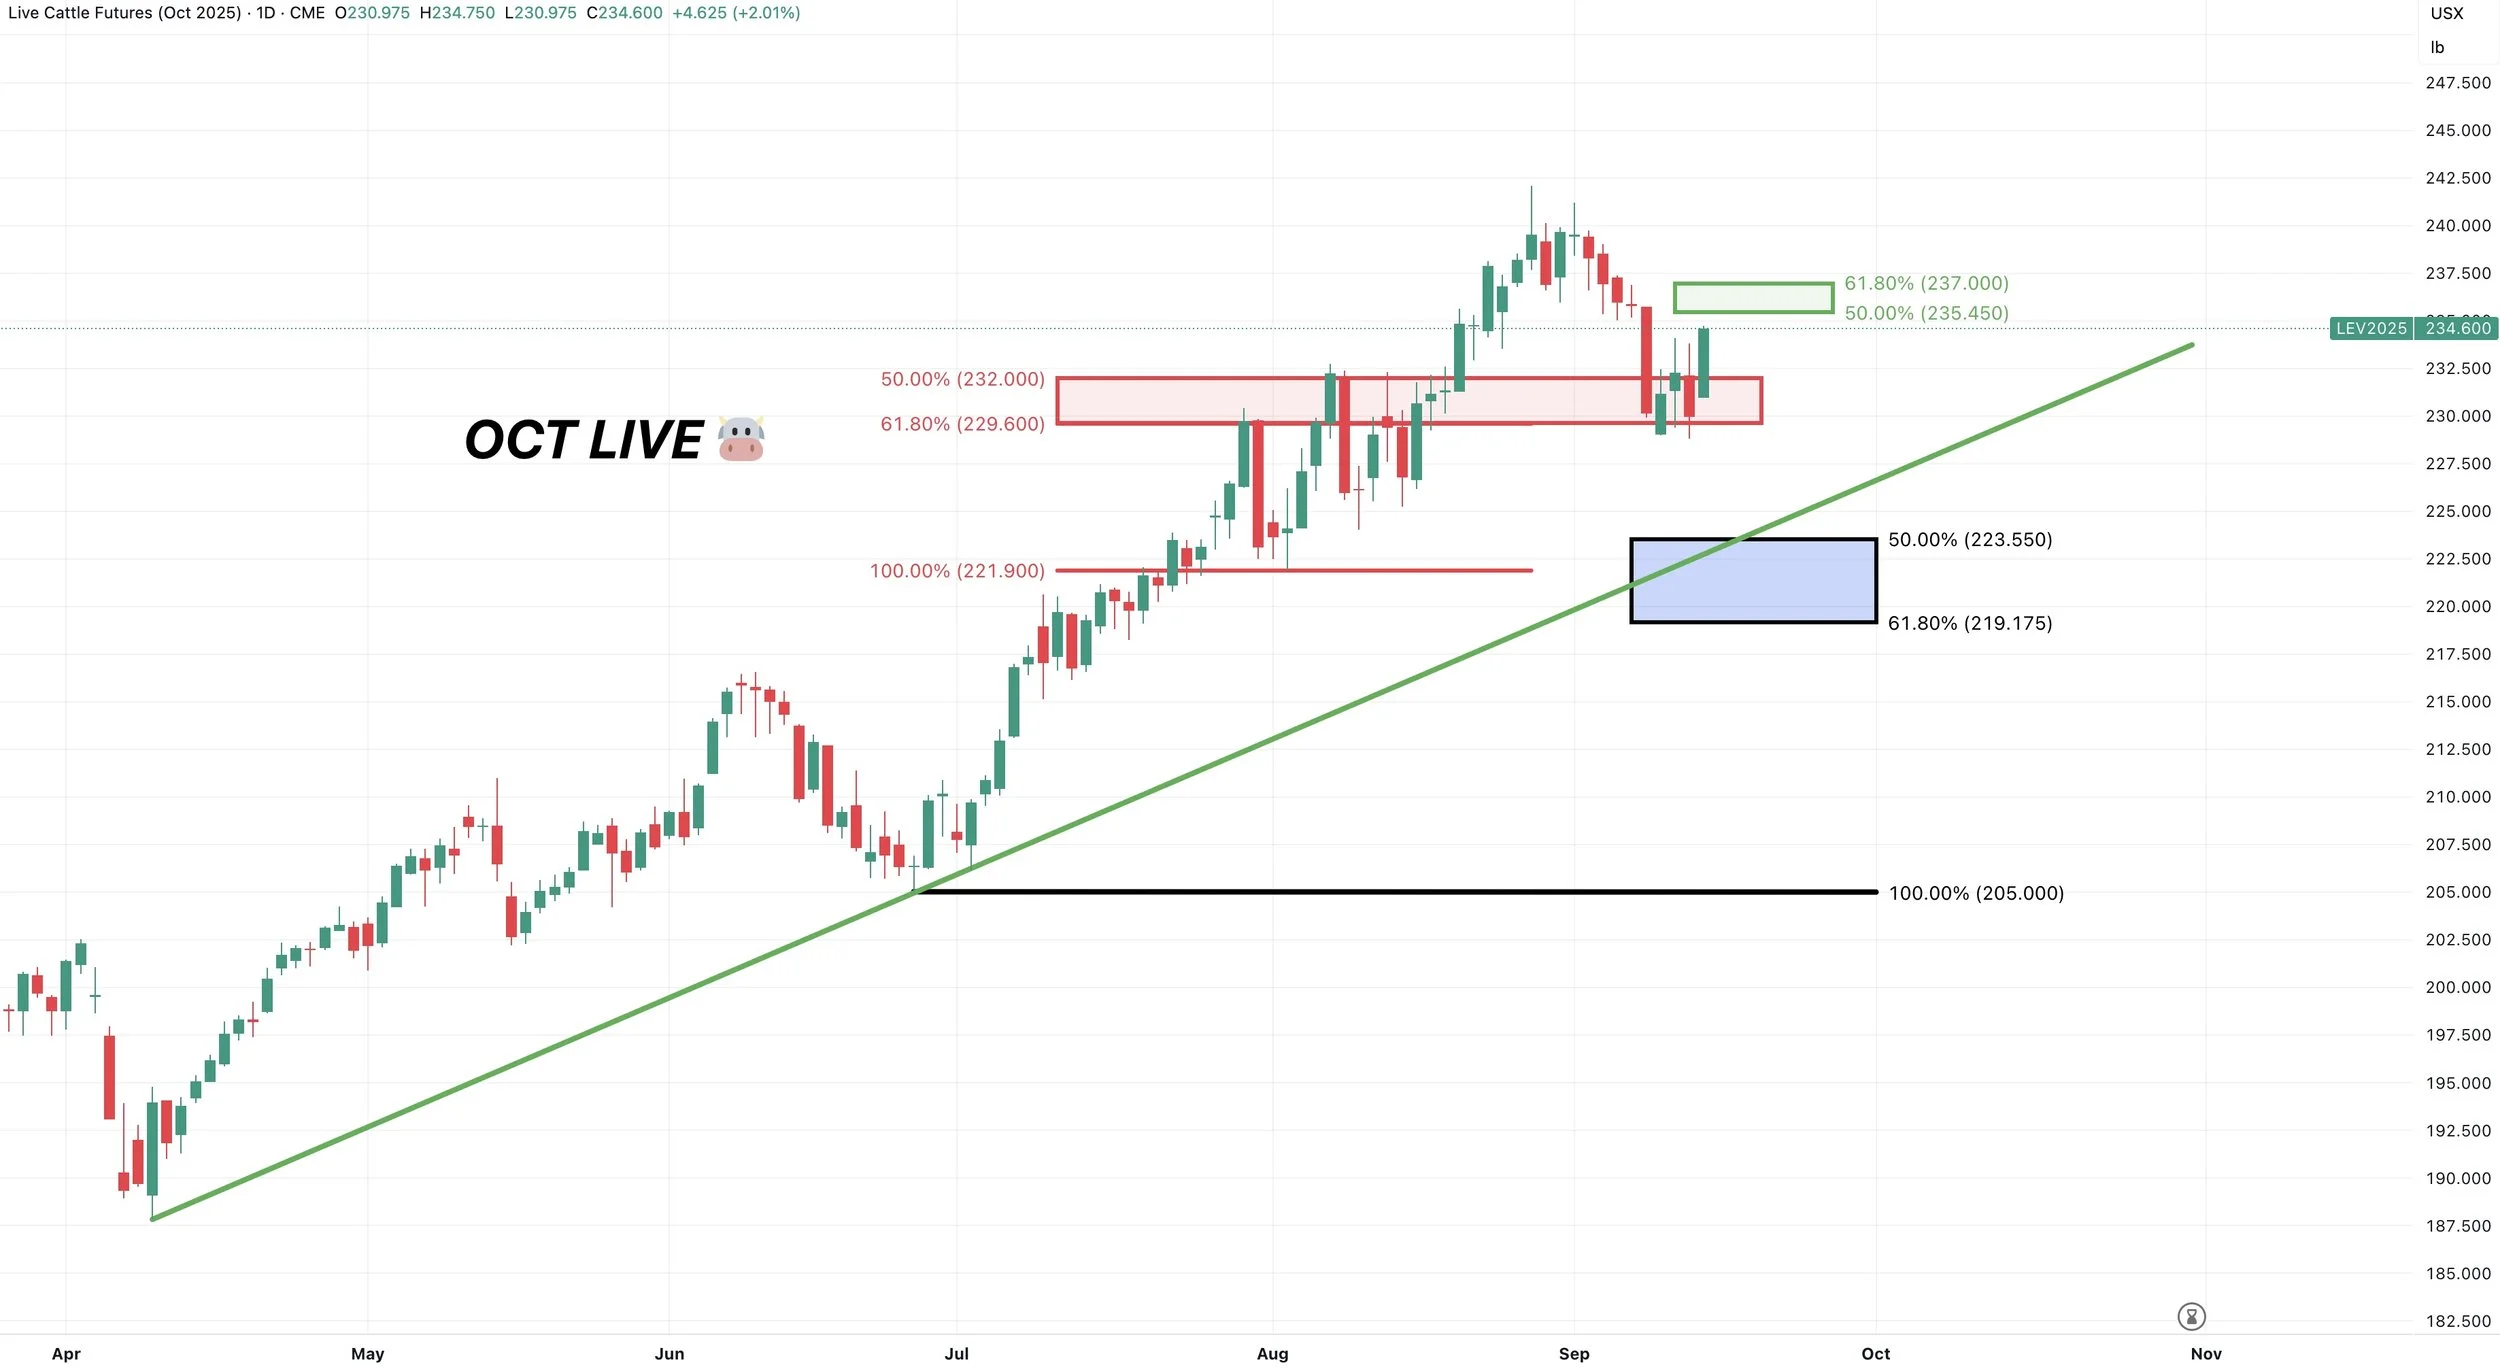
Past Sell or Protection Signals
Aug 22nd: 🌱
Soybean sell signal & hedge alert.
July 31st: 🐮
Cattle sell signal & hedge alert.
July 10th: 🐮
Cattle sell signal & hedge alert.
CLICK HERE TO VIEW
June 5th: 🐮
Cattle sell signal & hedge alert.
June 2nd: 🌾
MPLS wheat sell signal.
April 10th: 🌽
Old crop corn sell signal.
March 19th: 🐮
Cattle hedge & sell signal.
Feb 18th: 🌽 🌾
Old crop KC wheat & old crop corn signal.
Jan 23rd: 🌽 🌱
Corn & beans old crop sell signal.
CLICK HERE TO VIEW
Jan 15th: 🌽 🌱
Corn & beans hedge alert/sell signal.
Jan 2nd: 🐮
Cattle hedge alert at new all-time highs & target.
Dec 11th: 🌽
Corn sell signal at $4.51 200-day MA
CLICK HERE TO VIEW
Oct 2nd: 🌾
Wheat sell signal at $6.12 target
Sep 30th: 🌽
Corn protection signal at $4.23-26
Sep 27th: 🌱
Soybean sell & protection signal at $10.65
Sep 13th: 🌾
Wheat sell signal at $5.98
May 22nd: 🌾
Wheat sell signal when wheat traded +$7.00
Want to Talk?
Our phones are open 24/7 for you guys if you ever need anything or want to discuss your operation.
Hedge Account
Interested in a hedge account? Use the link below to set up an account or shoot Jeremey a call at (605)295-3100.
YIELD DECLINING INTO USDA REPORT?
AUDIO COMMENTARY
Signs of correction or top in cattle
We could see massive correction yet still remain in a bull market in cattle
Why we like short term puts in cattle
Corn made new high for move failed at $4.25
USDA numbers out next week
Bears think feed demand overstated
Demand monster in corn, no China demand in beans
Still see wheat at area of value
Wheat should try to get acres here
A lot of disease being reported
Will demand offset supply loss?
Deal with China is biggest bullish card
If you’re aggressive in sales, have inputs locked in
Have a plan for stuff you have to move within the next 1-3 months
Implied volatility and options are cheap
Listen to todays audio below
Want to talk? (605)295-3100
Your free trial has ended
Here is extended access to our Labor Day sale
Don’t miss out on our future updates & our next sell signal in the grain markets
CORN & BEAN CHARTS
Dec Corn 🌽
If we break above $4.25 I think $4.35 is our next stop.
$4.25 is 38.2% retracement up to the Feb highs.
The next level is $4.35 at the 50% retracement.
That is going to be our target to de-risk.
It is also support from spring.
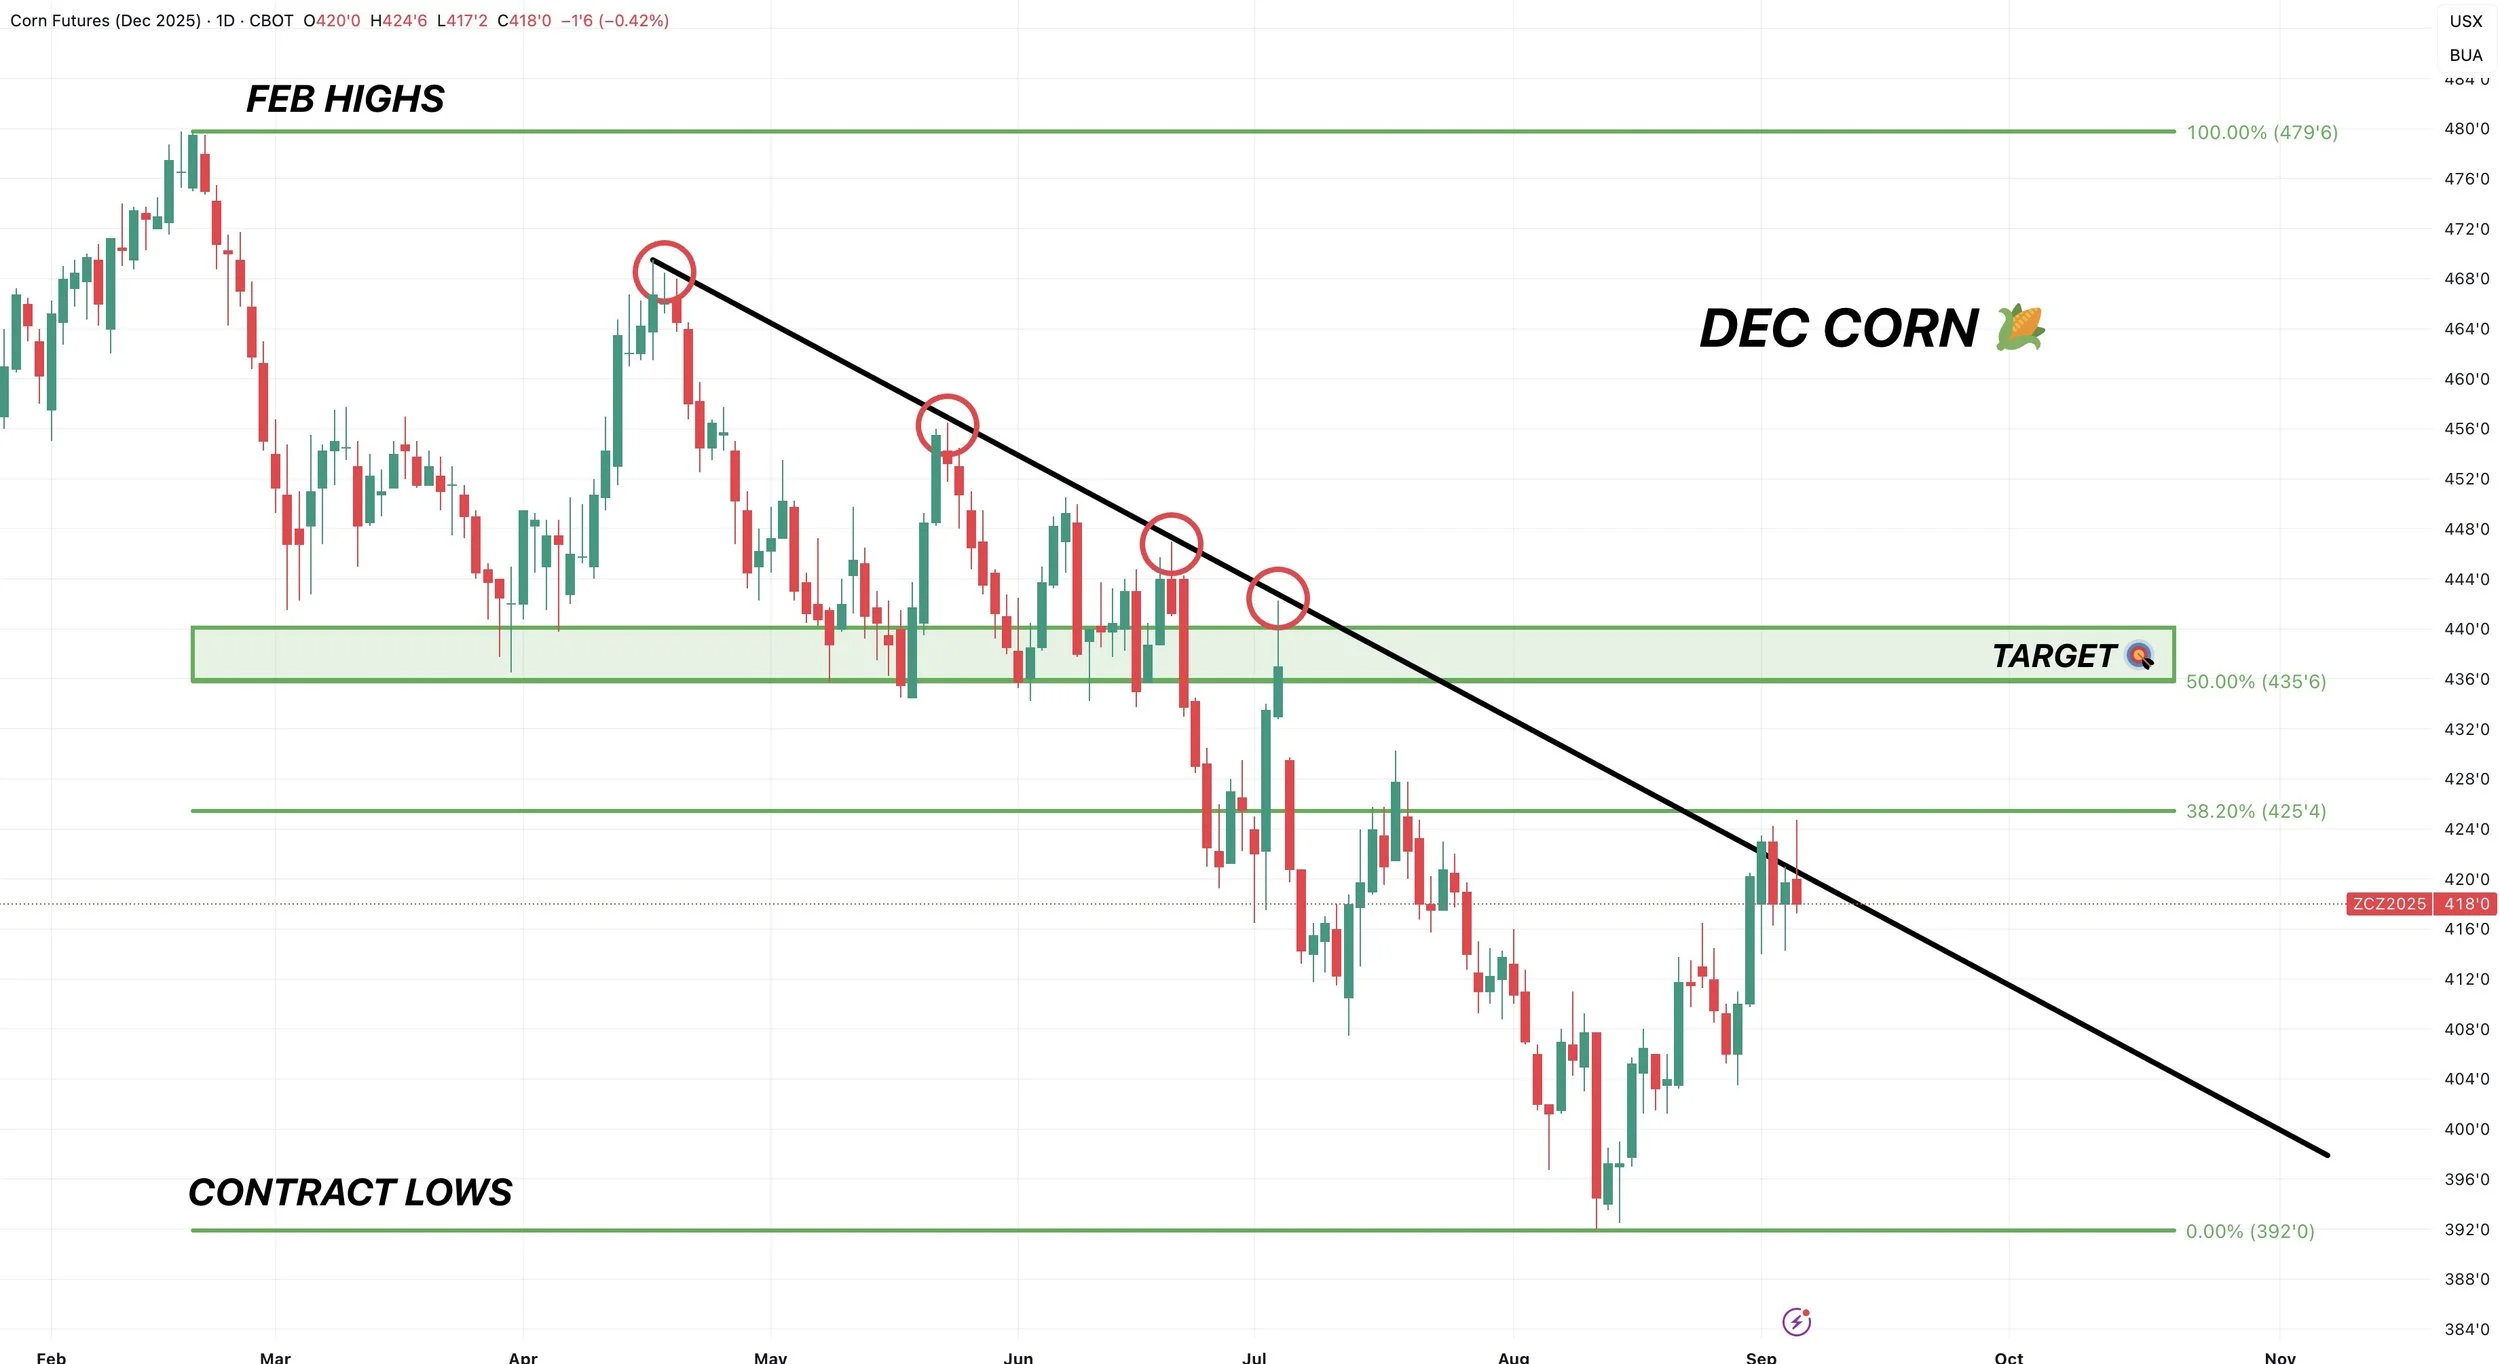
Nov Beans 🌱
I am looking for a bounce anywhere in this blue box. Which is 50-61.8% of the entire rally from $9.80
We tapped the box yesterday at the 50% retracement of the entire rally.
However, the 61.8% level is more common. So not ruling out testing the bottom of the box.
Regardless, the blue box is a must hold level to keep our bias remaining higher.

Past Sell or Protection Signals
Aug 22nd: 🌱
Soybean sell signal & hedge alert.
July 31st: 🐮
Cattle sell signal & hedge alert.
July 10th: 🐮
Cattle sell signal & hedge alert.
CLICK HERE TO VIEW
June 5th: 🐮
Cattle sell signal & hedge alert.
June 2nd: 🌾
MPLS wheat sell signal.
April 10th: 🌽
Old crop corn sell signal.
March 19th: 🐮
Cattle hedge & sell signal.
Feb 18th: 🌽 🌾
Old crop KC wheat & old crop corn signal.
Jan 23rd: 🌽 🌱
Corn & beans old crop sell signal.
CLICK HERE TO VIEW
Jan 15th: 🌽 🌱
Corn & beans hedge alert/sell signal.
Jan 2nd: 🐮
Cattle hedge alert at new all-time highs & target.
Dec 11th: 🌽
Corn sell signal at $4.51 200-day MA
CLICK HERE TO VIEW
Oct 2nd: 🌾
Wheat sell signal at $6.12 target
Sep 30th: 🌽
Corn protection signal at $4.23-26
Sep 27th: 🌱
Soybean sell & protection signal at $10.65
Sep 13th: 🌾
Wheat sell signal at $5.98
May 22nd: 🌾
Wheat sell signal when wheat traded +$7.00
Want to Talk?
Our phones are open 24/7 for you guys if you ever need anything or want to discuss your operation.
Hedge Account
Interested in a hedge account? Use the link below to set up an account or shoot Jeremey a call at (605)295-3100.
SEASONAL SEP BOTTOM?
MARKET UPDATE
You can scroll to read the usual update as well. As the written version is the exact same as the video.
Timestamps for video:
Overview: 0:00min
Sep Bottom?: 1:20min
Corn: 3:10min
Beans: 8:05min
Wheat: 10:50min
Cattle: 12:30min
Want to talk about your situation?
(605)295-3100
Your free trial has ended
Don’t miss future updates or our next sell signal.
Here is extended access to our Labor Day sale since you were on a trial.
Futures Prices Close
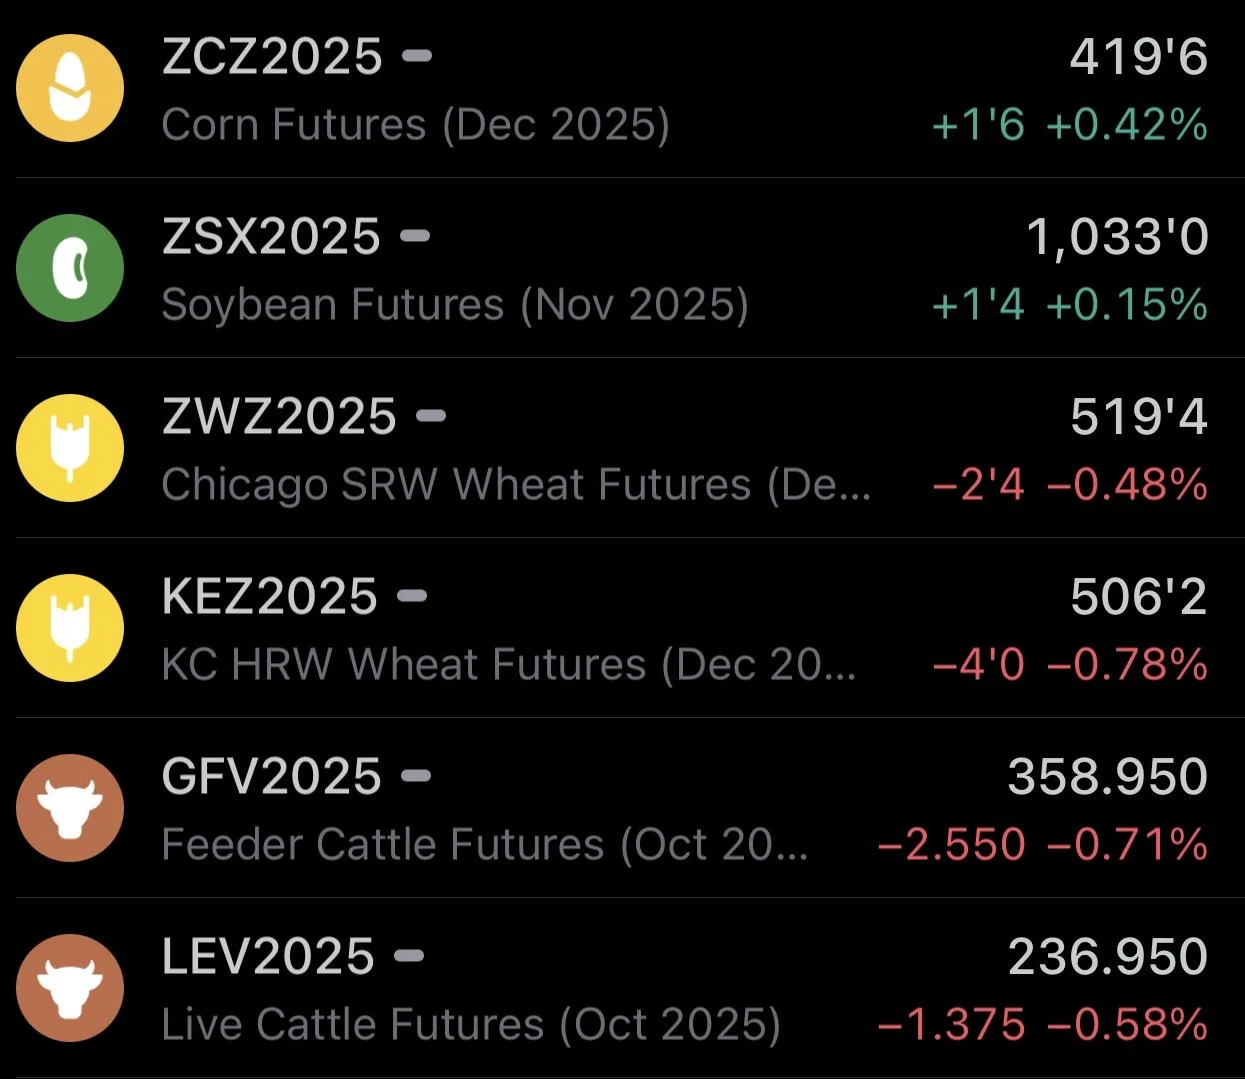
Overview
Decent action in the grains today.
We started off the session well in the red but bounced. After corn being down -4 and beans being down -10 cents they both closed in the green.
Meanwhile the cattle market closes lower for the 3rd day in the row. The first time we've seen that happen since June.
We are seeing two completely different stories play out between corn & soybeans.
Corn is facing an oversupply issue due to the massive acerage. Yet, demand has been phenomenal. Export sales are double what they were last year at this time, and the best since the China driven buying in 2021/22.
Soybeans on the other hand are dealing with the opposite problem. We might not have enough supply, with acres being the 2nd lowest in the last decade. We just had a record dry August that has led to crop conditions slipping. However, demand is the thing everyone is worried about. China continues to avoid the US and opt for Brazil instead. With zero US beans sold to China.
Trump stated that China's President is teaming up with Putin and Kim Jong Un to conspire against the US

Wheat continues to struggle to find a story, as the US and the rest of the world isn’t short on wheat. This is despite the US being very competitive on exports. As recently we've seen the strongest demand numbers for wheat in over a decade.
Dry Finish Continues
We already know we just had a record dry August.
But the next 10 days are suppose to stay bone dry for most of those same regions that have been struggling.
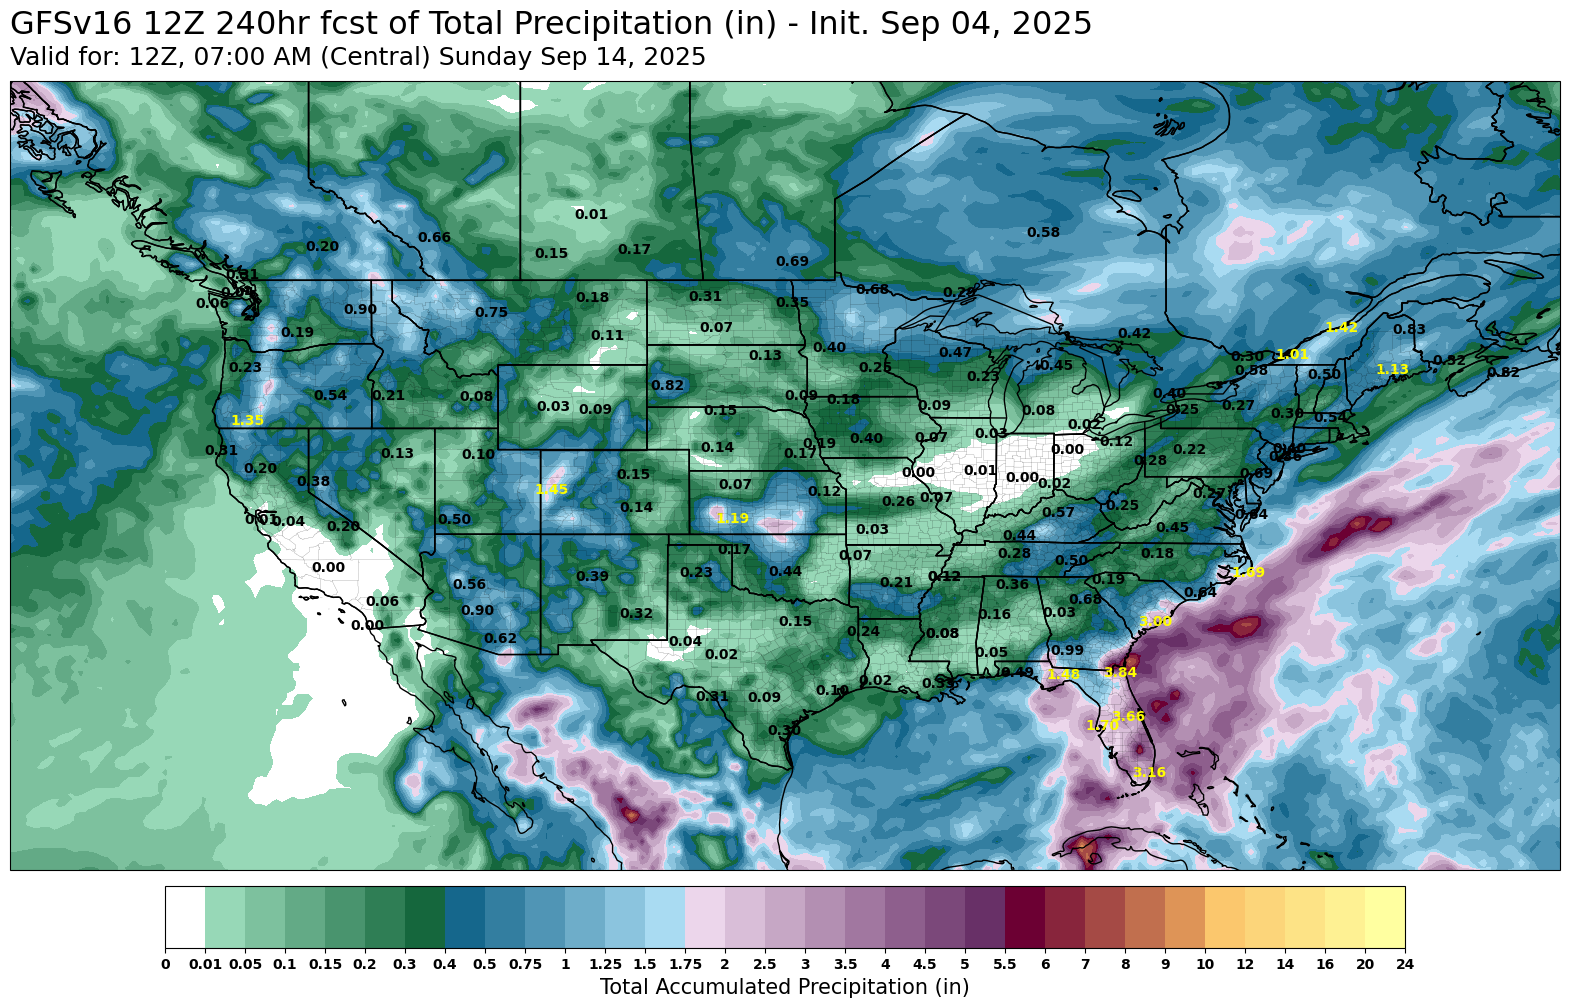
Sep Seasonal Bottom?
On Tuesday I went over how during the past decade, the month of September is typically a friendly month for the corn market.
Here is the data in case you missed it.
From Sep 1st to Oct 1st.
Corn has traded higher 4 of the last 5 years.
Higher 8 of the last 10 years.
The only years we did not trade higher was 2023 and 2018.

On the 10 year seasonal, we normally trend higher until pretty much October 1st before trending sideways.
Right in time for the start of fall insurance pricing.
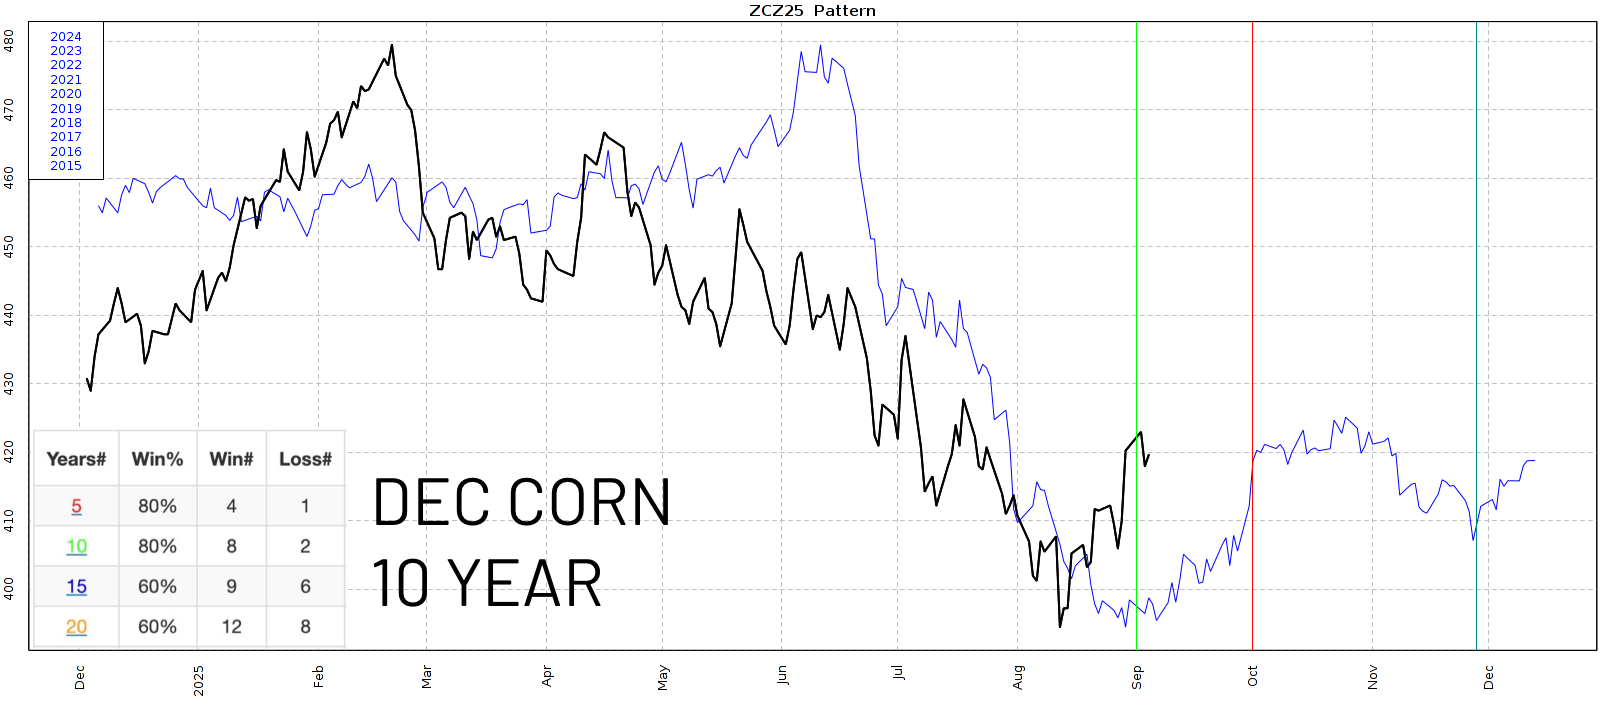
If we compare this year to last year, we continued higher until October 3rd.
Topping out at $4.30
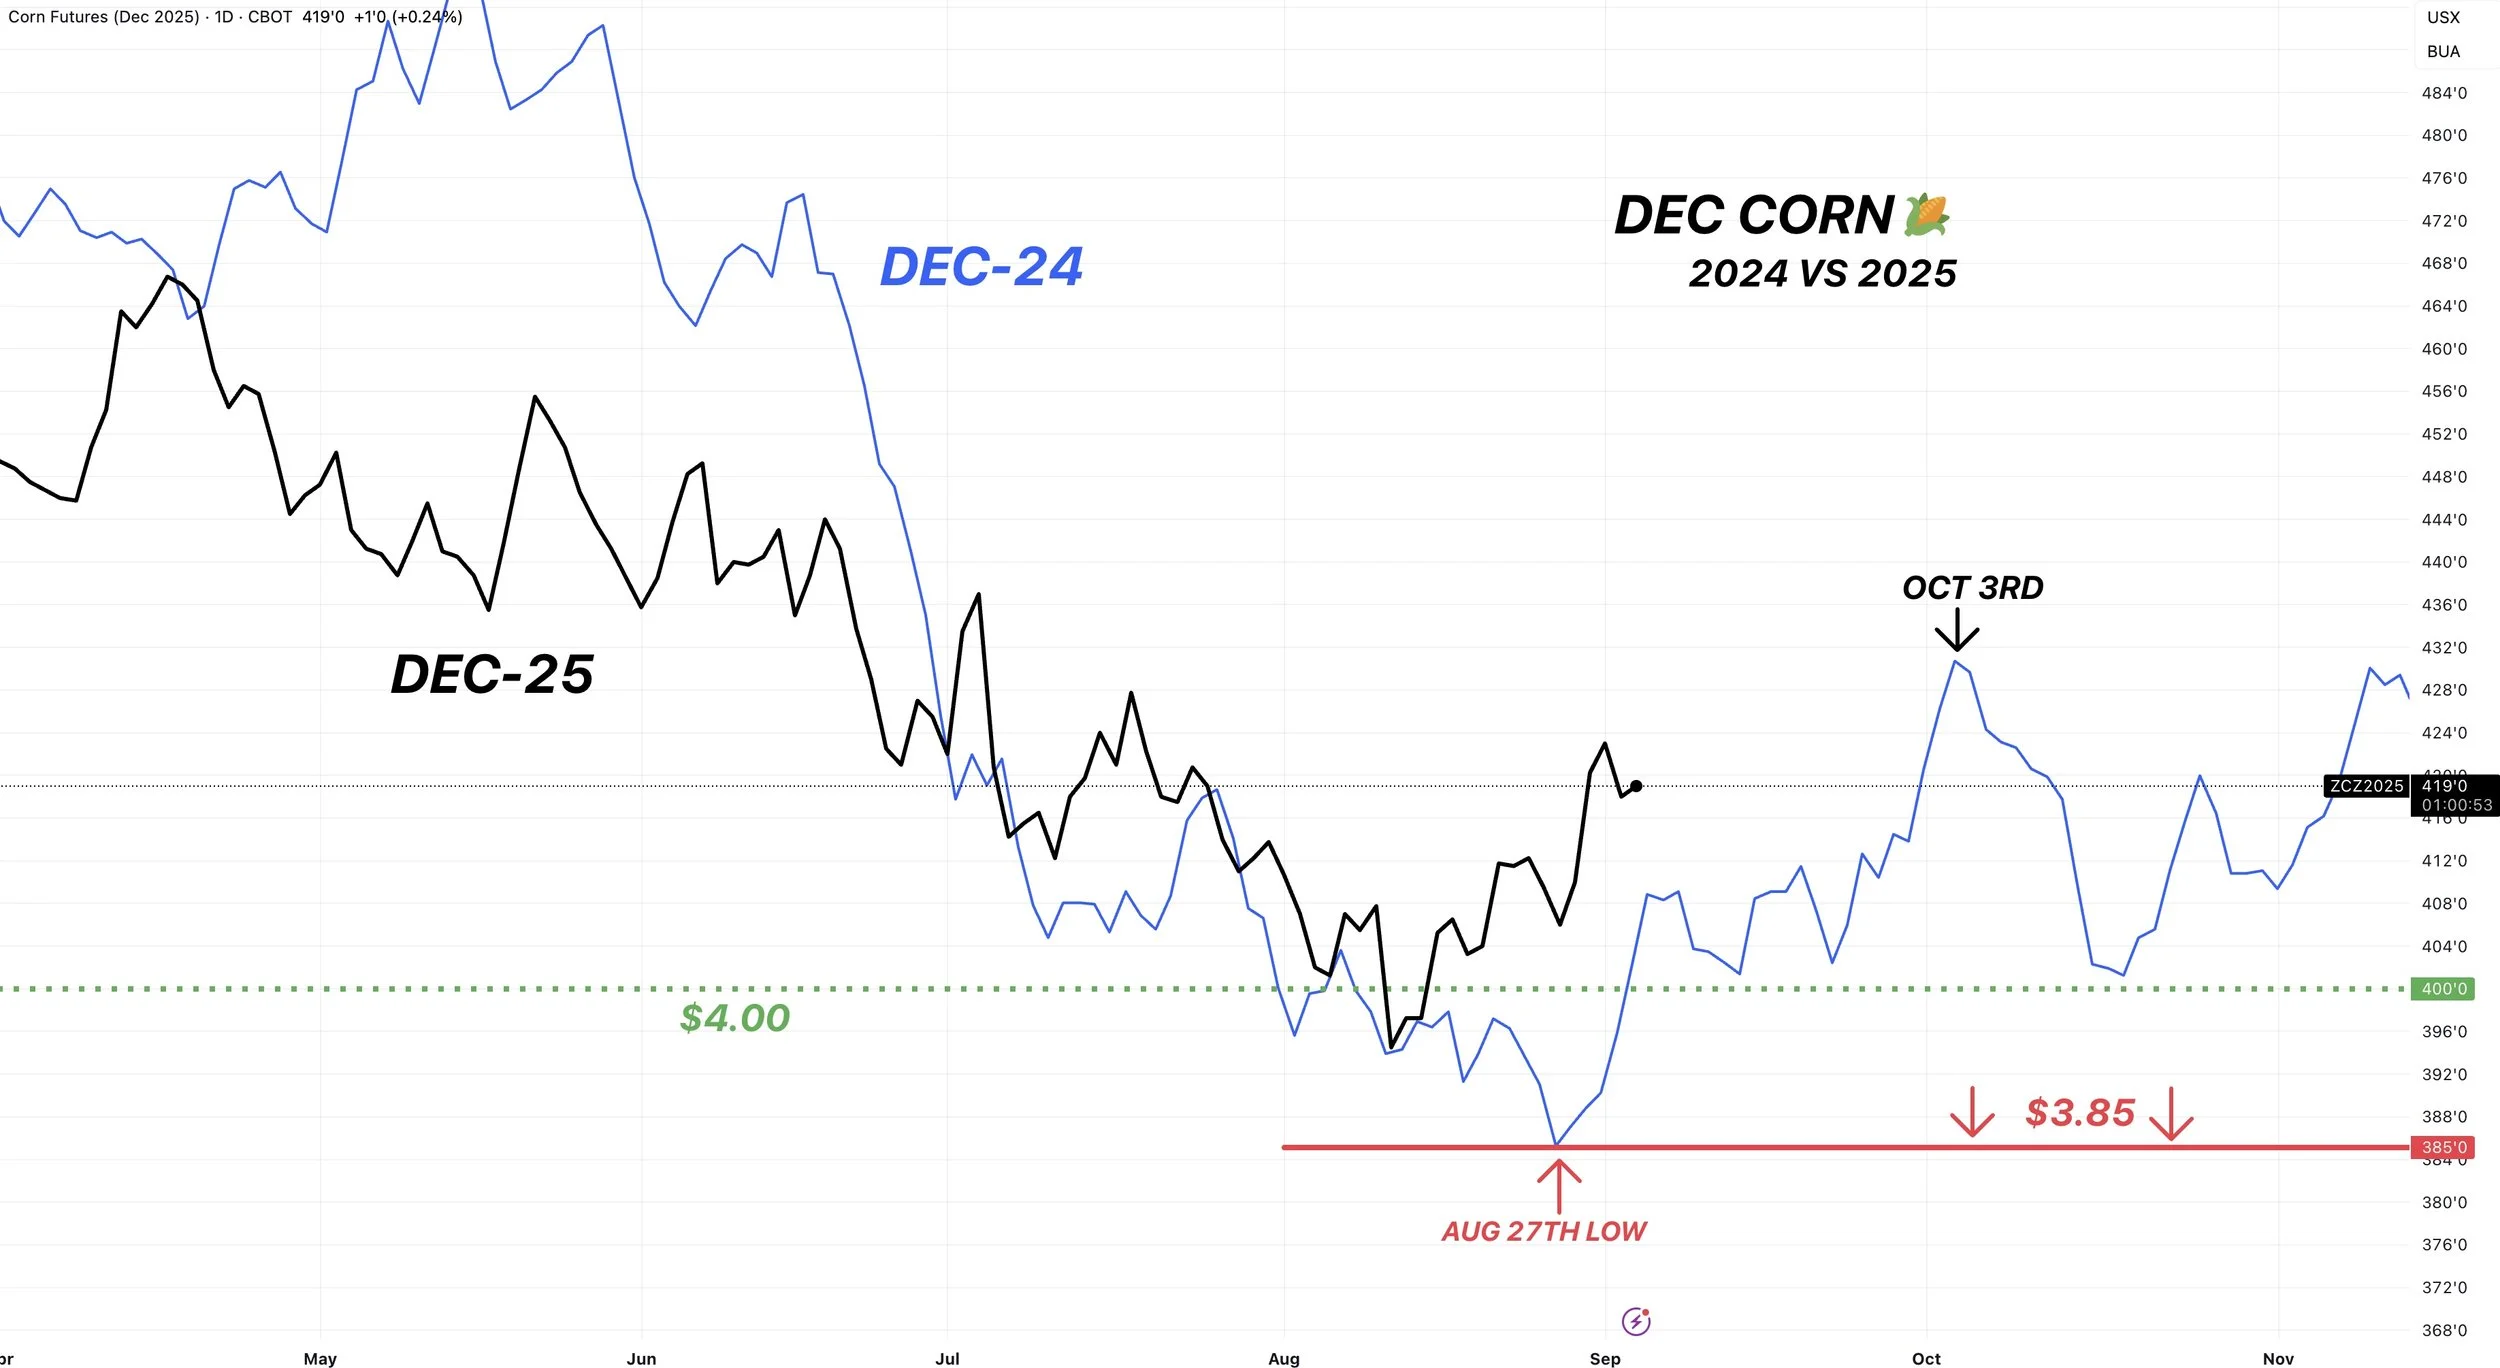
To make this comparison to last year even more intriguing..
Here is the funds positions for last year vs this year.
This year, they started covering at the exact same time that they did last year.

What about the wheat market?
I found a similar pattern in the wheat market.
Here is the data for the month of September.
It is exactly the same as corn.
Higher the last 4 of 5 years.
Higher the last 8 of 10 years.
The only two years we traded lower were once again 2023 and 2018.
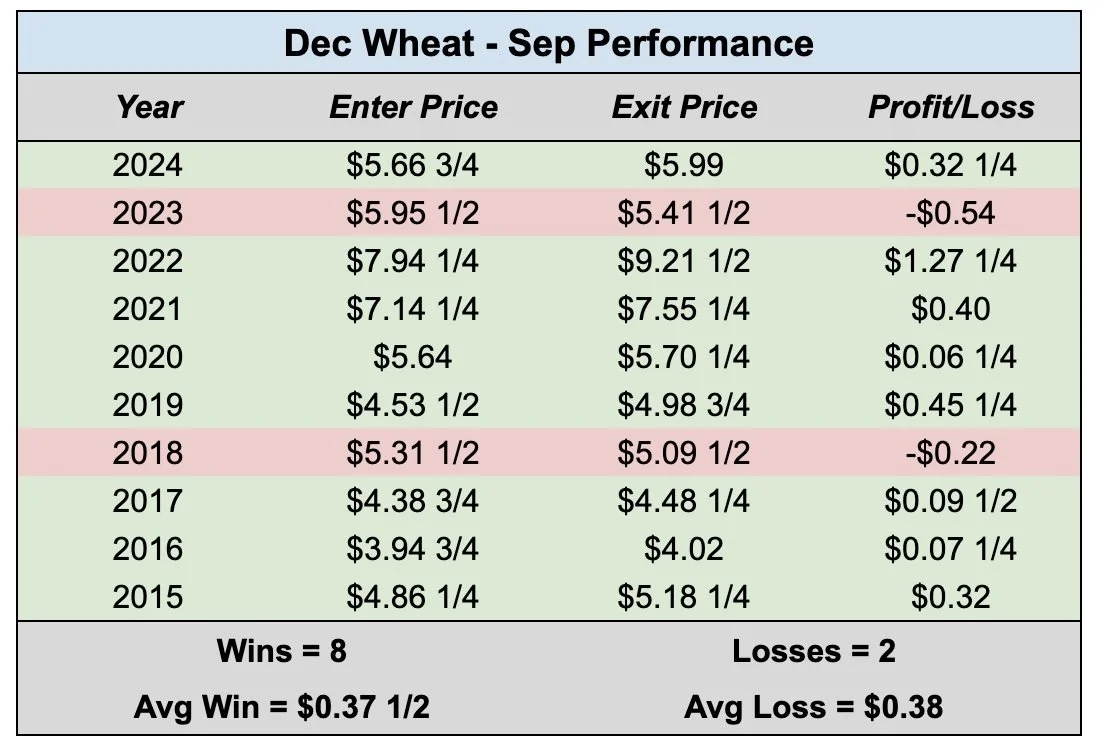
Now if we look at the actual seasonal chart, it has the wheat market posting it's bottom basically right now.
Before trending higher into the middle of October.
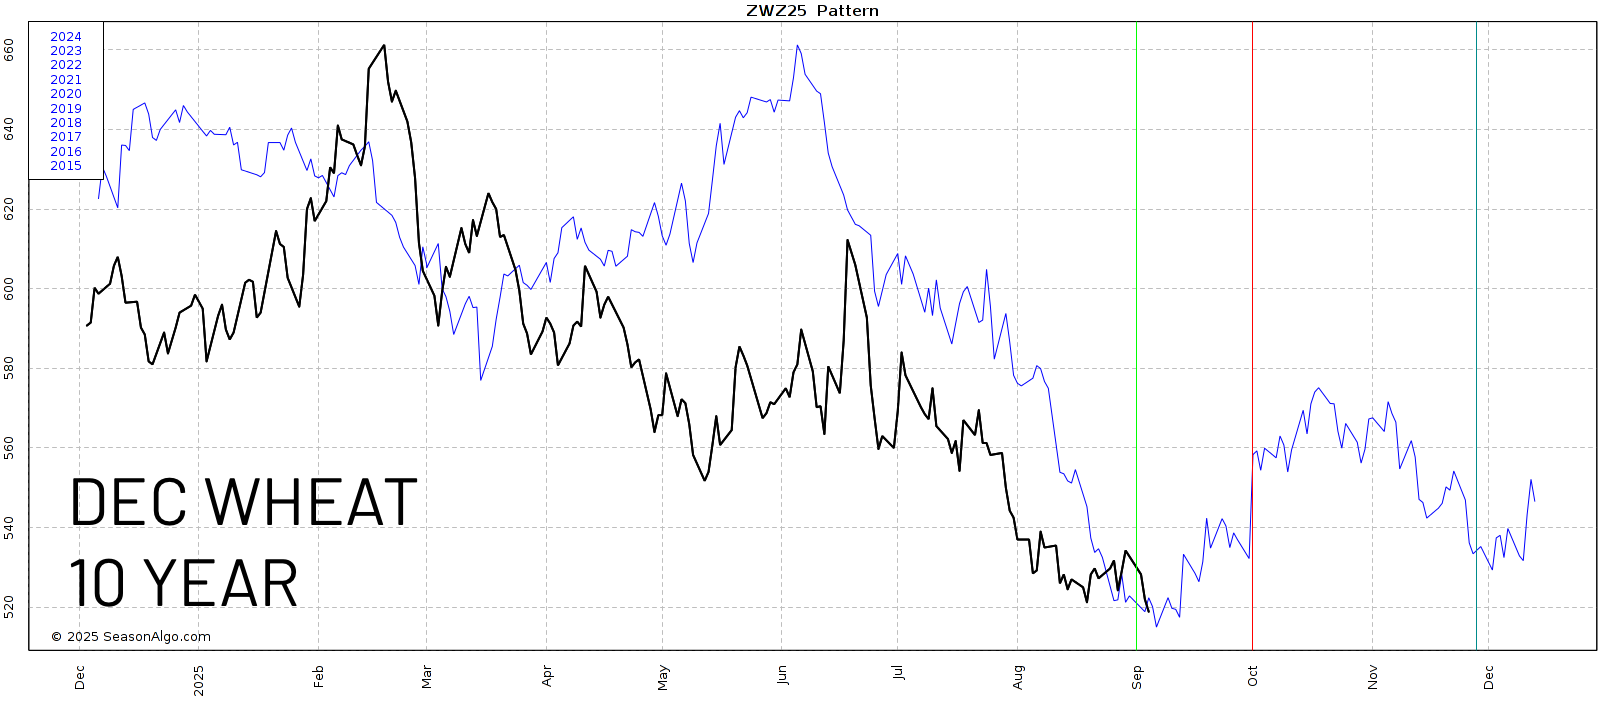
Comparing this year to last year, we found a bottom right about now. At about the same price levels we are currently sitting at around $5.20.
Before topping out on October 3rd after a +90 cent rally.

Does this mean corn or wheat "has" to rally in September.
No of course not.
This is simply what the historical data suggests.
Today's Main Takeaways
Corn
We have a supply that is getting smaller (although still record).
We have some of the best demand on record.
A 188.8 yield isn’t going to happen.
However, that is already now likely partially being priced in on the recent rally.
But I do think corn is supported until the USDA report because I'm sure plenty of traders want to know where yield is going to come in at.
The market's job is to put prices at fair values.
I have no clue if the yield is 180 or 185. But we do know supply is getting smaller.
How much does this matter?
Let's look at the balance sheet to find out.
Here is the current balance sheet. I left the last changes the USDA made on it.
Red is bearish, green is bullish.
If you remember, the USDA added +1 billion bushels of supply, but offset half of that with an extra +500 million bushels of demand.
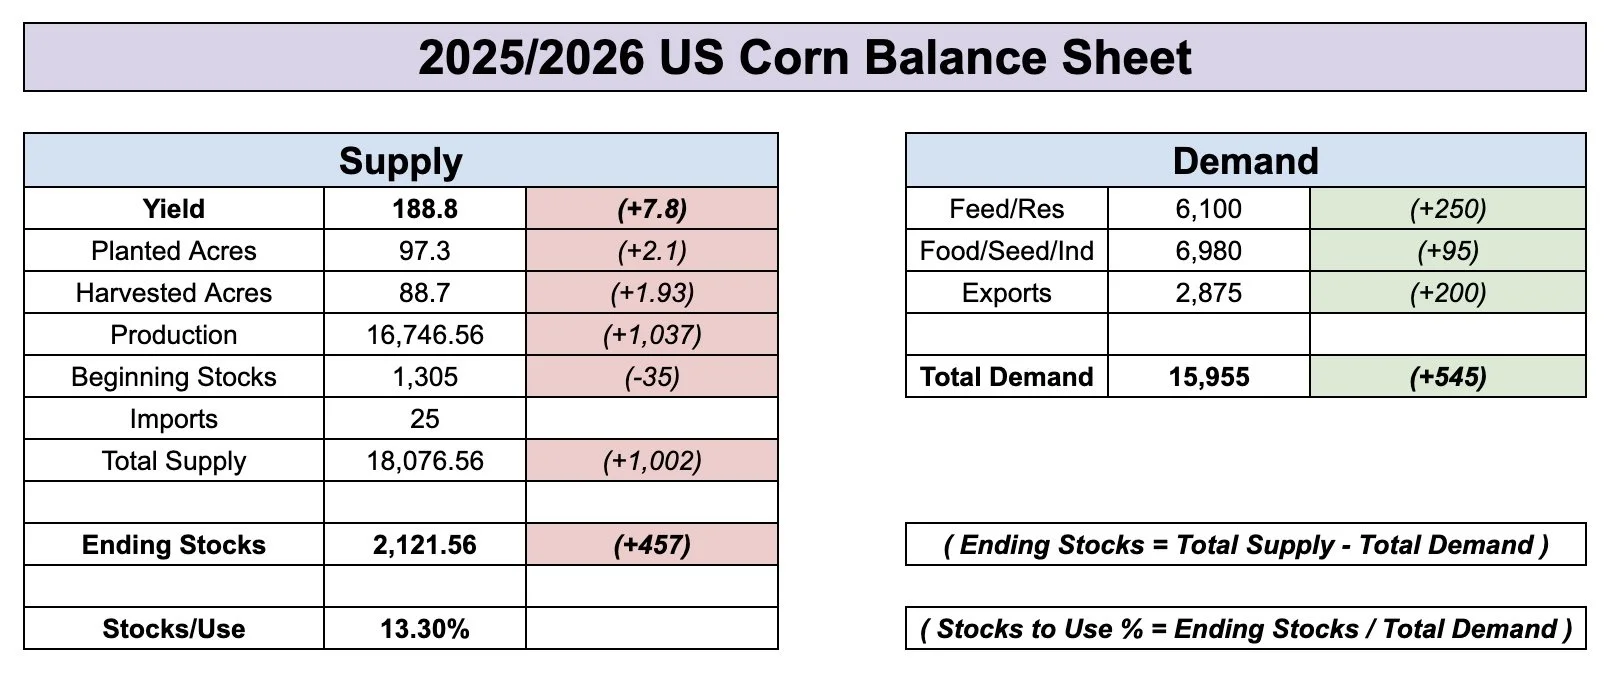
Let's just say yield dropped to 185.
Without changing demand, it would still print a 1.80 billion bushel carryout.
Which isn’t as burdensome as the current 2.10 billion but is still far from being bullish.
When supply gets cut, the USDA will probably offset part of it with a decrease to demand as well.
Given they added that fresh +500 million bushels of demand, it gives them wiggle room to play with.

If yield dropped to 183, things do become more interesting.
The drop will not be this dramatic given they will also lower demand, but it spits out a 1.60 billion bushel carryout and a 10% stocks to use ratio.
Typically anything below 10% is considered bullish.
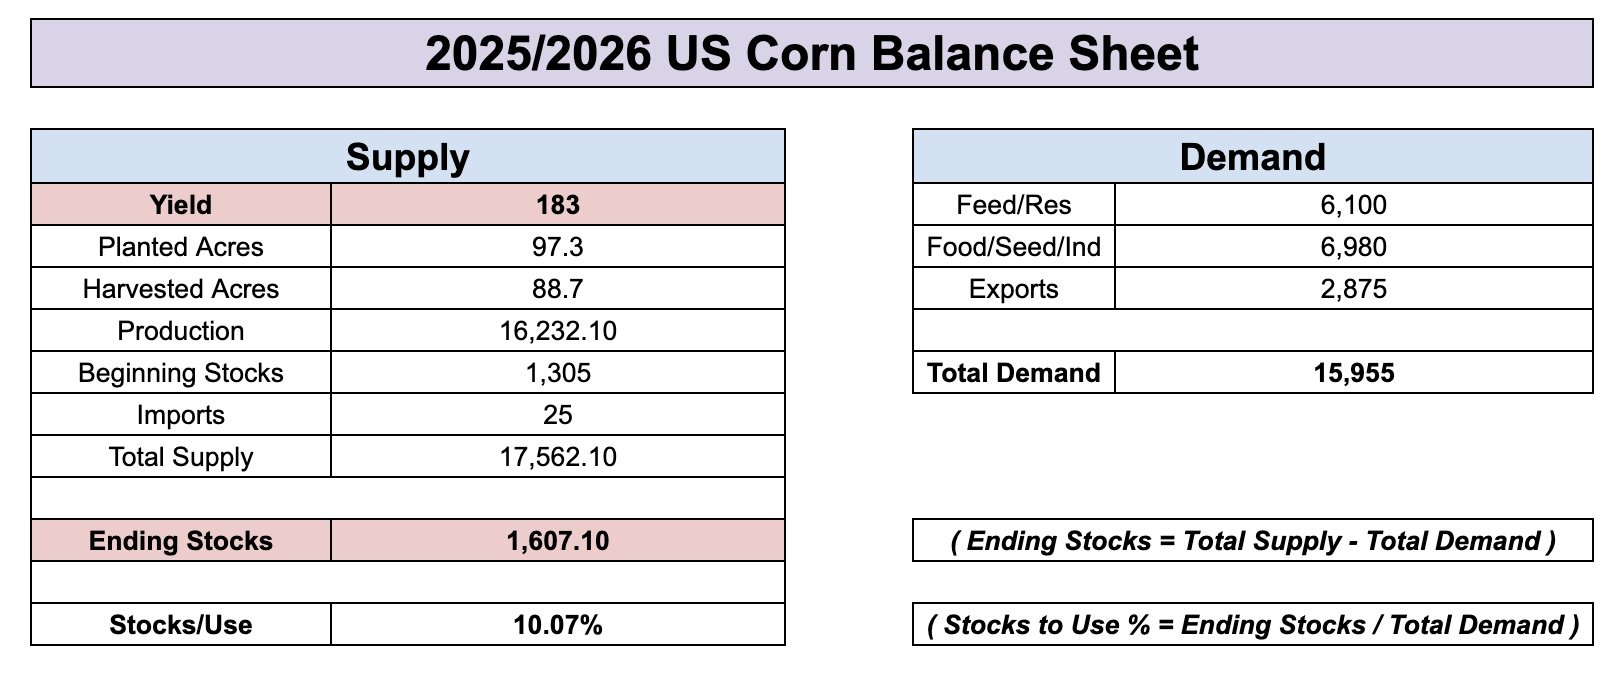
Now let's just say somehow yield actually came in at their original 181 estimate.
Well, that would paint the balance sheet pretty bullish.
Before changing demand, it drops the stocks to use ratio to 9%.
Which is bullish.
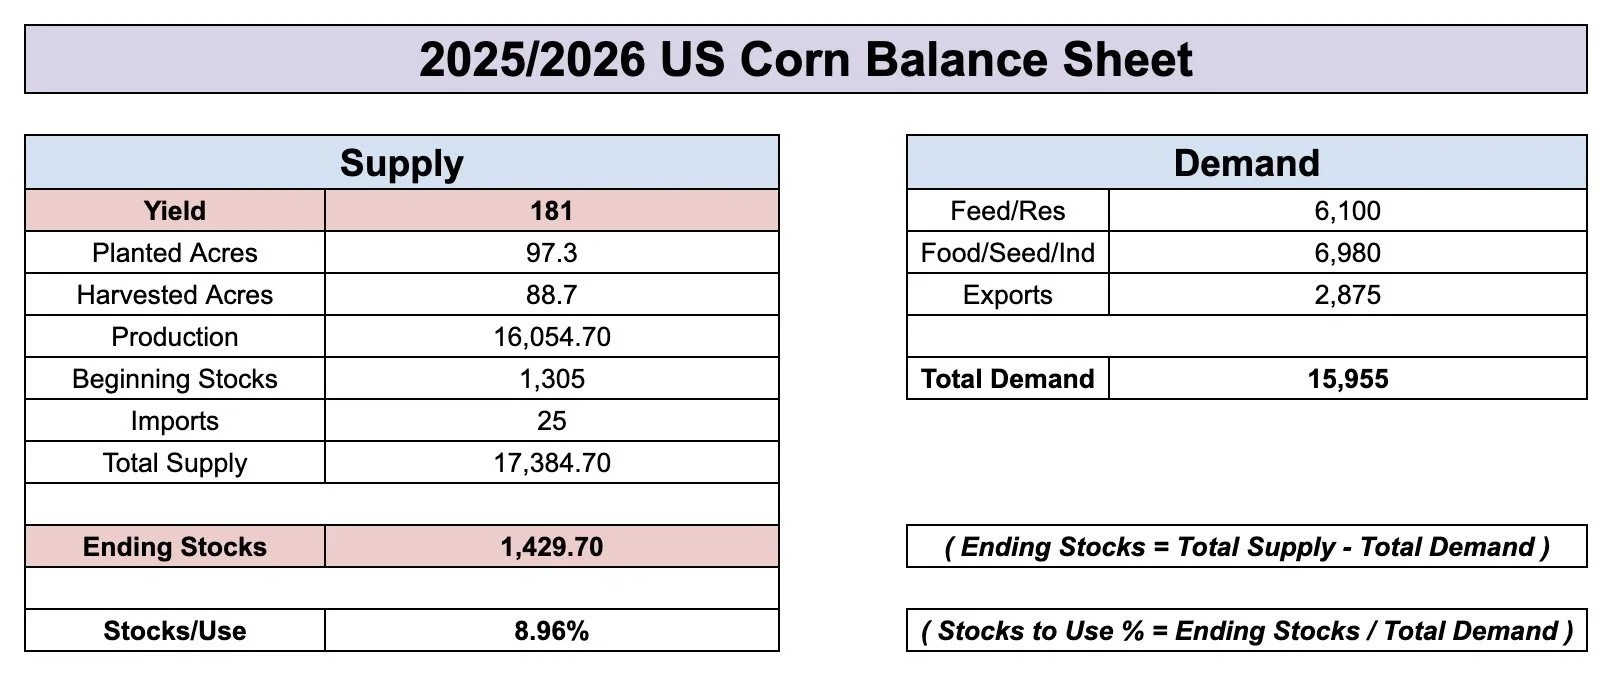
Here is a visual of corn carryout the past few years.
I plotted those scenarios on the chart.
If yield is 185 or less, we are still looking at our tightest carryout for this time of year since 2022.

We are going to have record production no matter how you slice it.
We have near record acres.
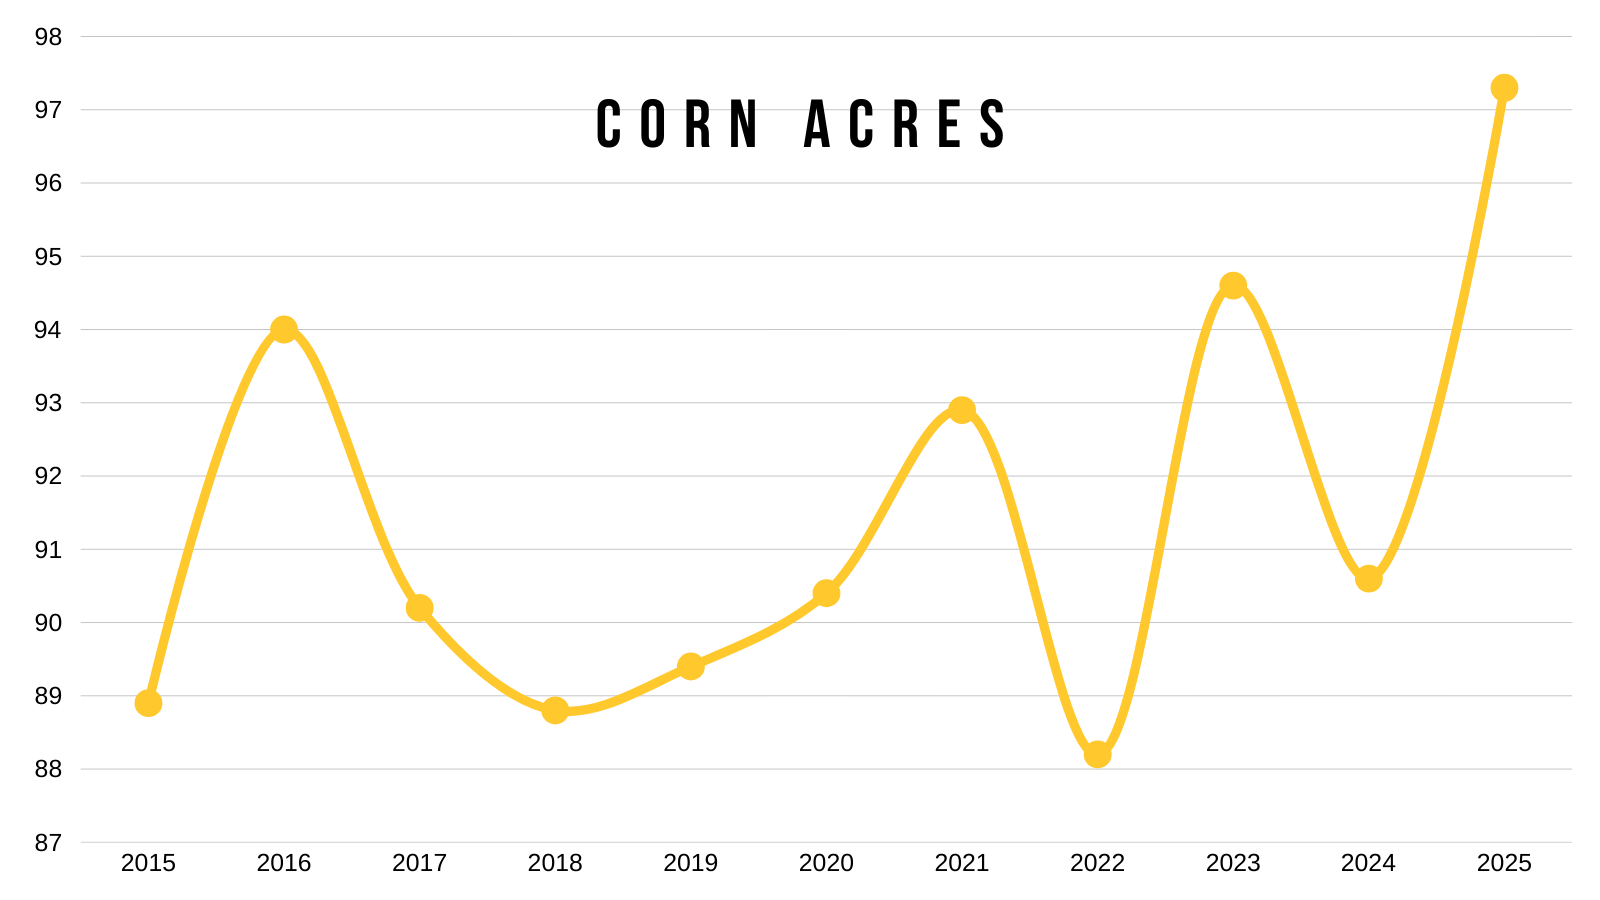
Along with a record yield.
Far greater than anything we've ever seen before.
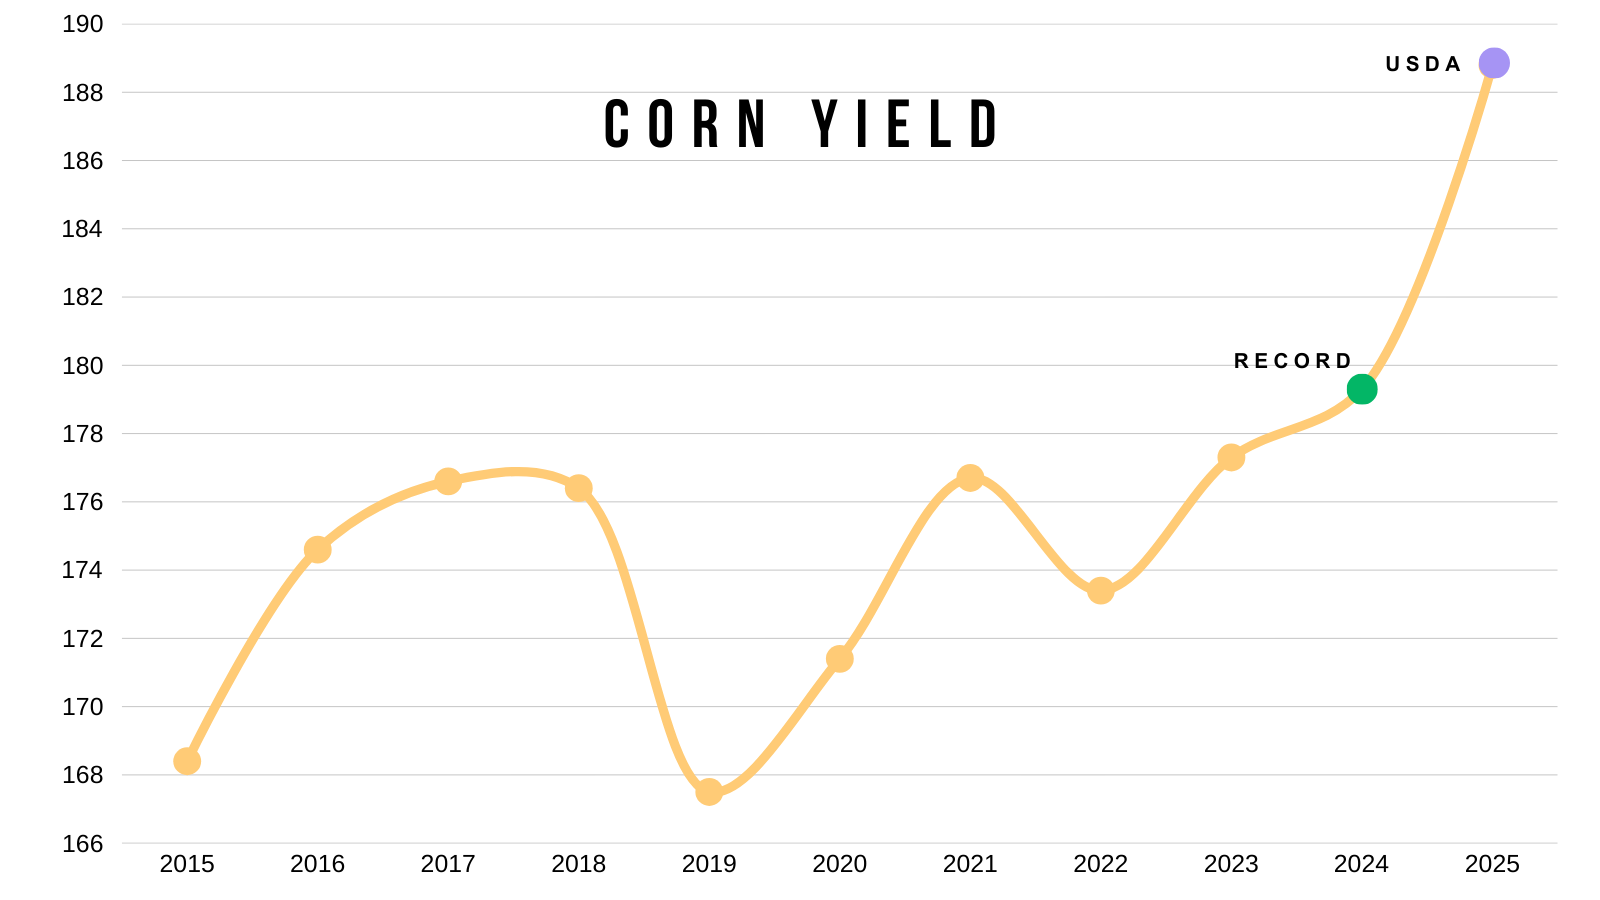
But we are also exporting more corn than ever which is helping offset that major production.
Like I mentioned, export sales were great last year.
We are literally double what were sitting at the past 3 years during this same time.
Chart from DTN
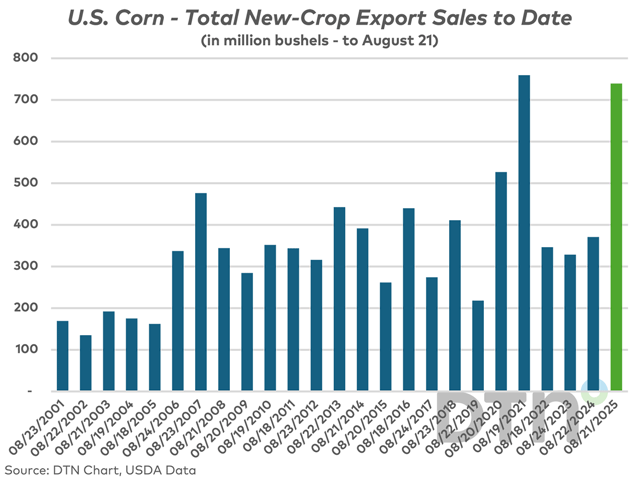
Why I think the harvest low is in:
There are a few reasons why I think we posted our harvest lows.
Could I be wrong? Absolutely. But here is my thought process.
Continuous Chart:
This chart shows front month corn.
On August 29th last year, this chart rolled from the September contract to the December contract.
Since Dec was trading higher than Sep, it left a roll gap higher.
That gap remained unfilled for an entire year.
On the day of the USDA sell off in August, we almost perfectly filled that gap before heading higher.
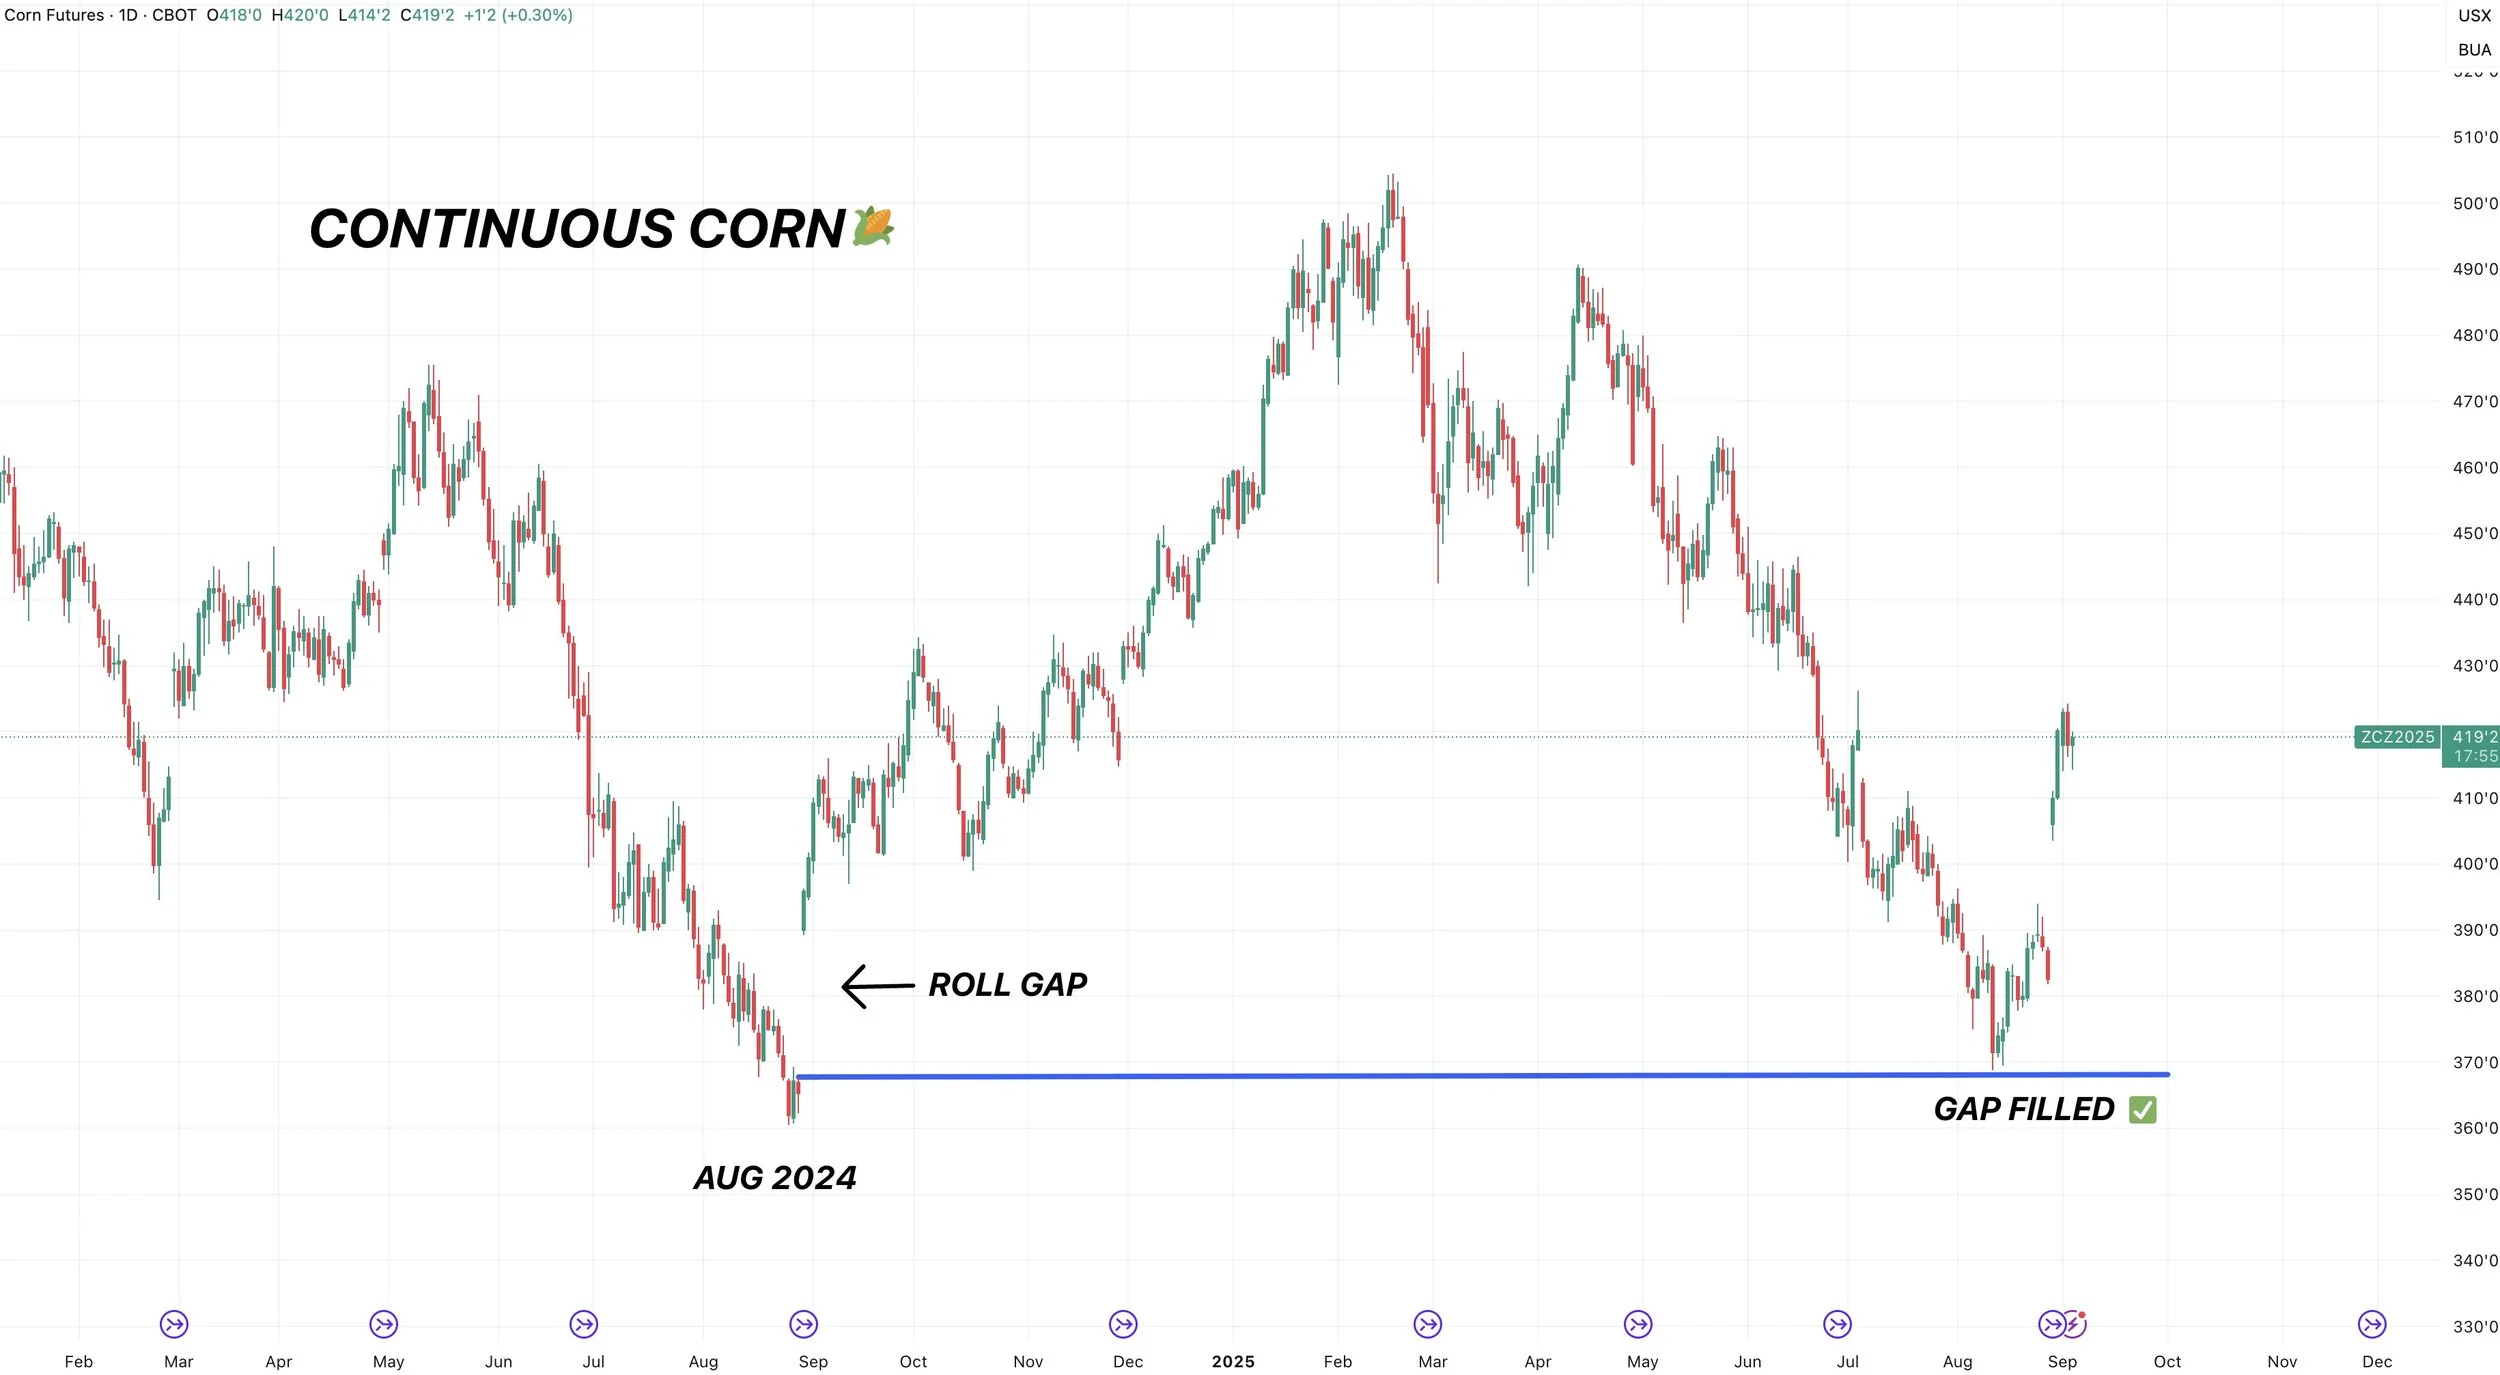
Daily Dec Chart:
I mentioned this Tuesday.
We closed above the 61.8% retracement up to those mid-July highs (red box).
This tells us that this rally off contract lows is seen as more than just another correctional bounce before heading lower.
As a standard correctional bounce or correctional sell off is usually 61.8%.

Yesterday we rejected right off this downward trend from April.
It has marked a top in this market countless times.
If we bust above, it should spark a leg higher.
My Target: $4.35
$4.35 gives back 50% of the Feb highs.
It is also our old support level from spring.
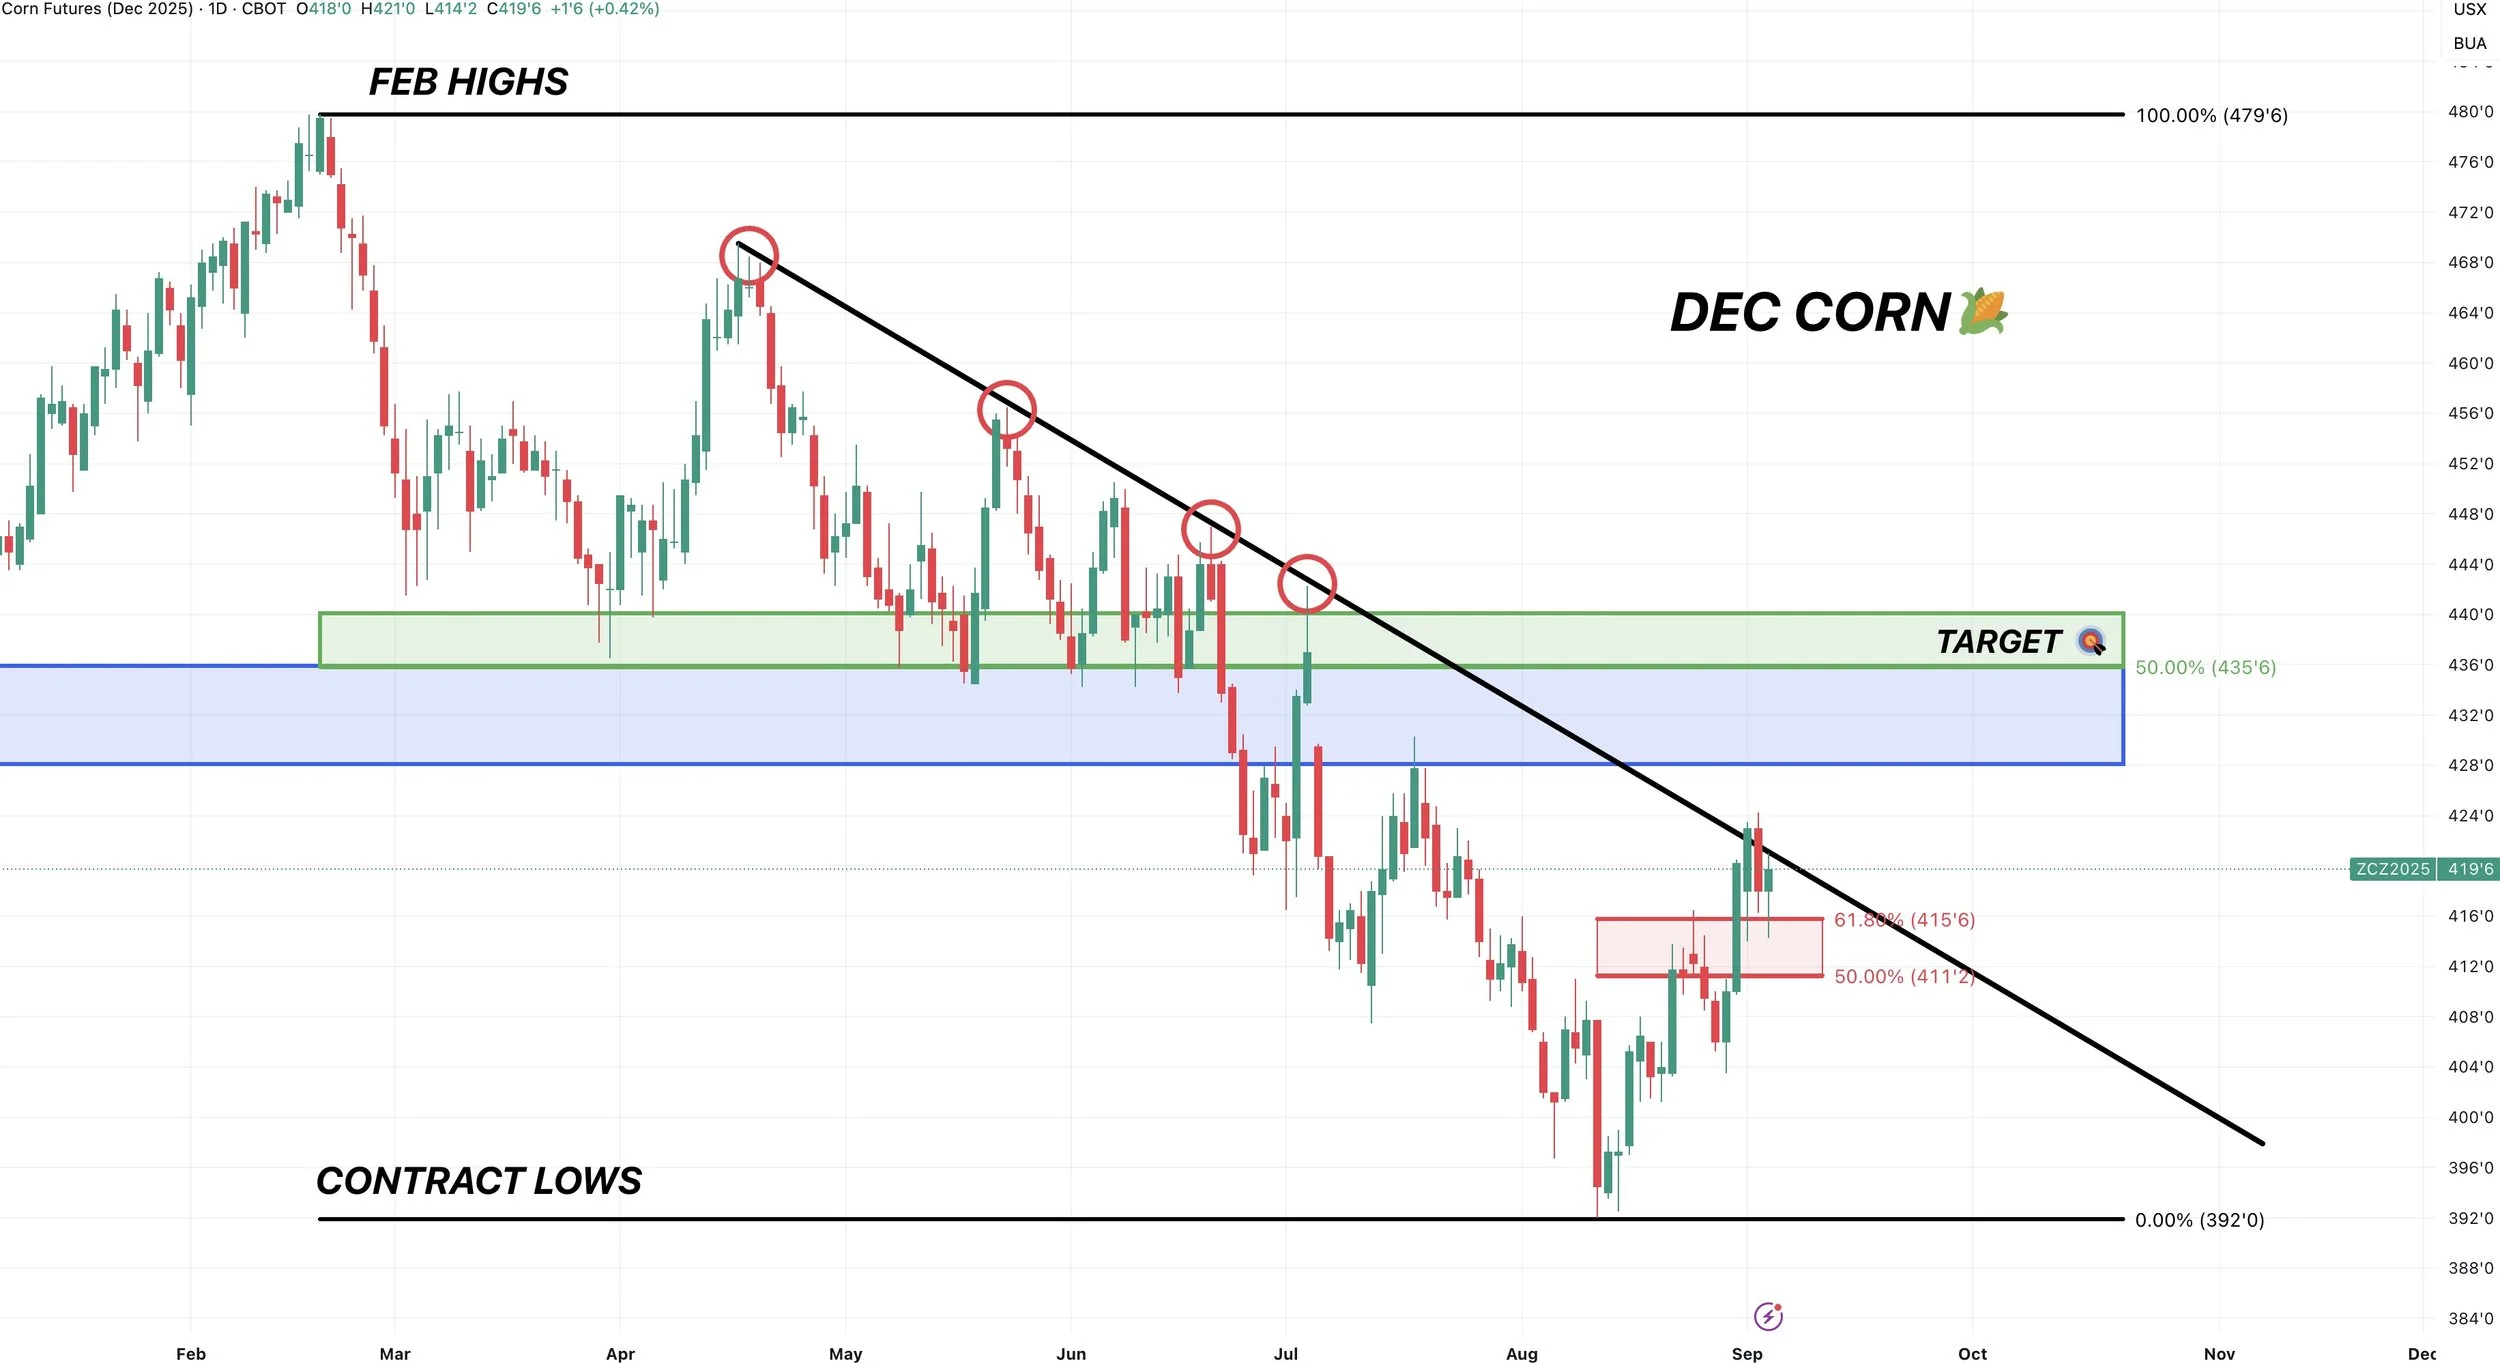
Here is a more short term analysis.
On yesterday and this morning's sell off, we retracement almost 50% of the recent 3-day rally.
That is seen as deep enough for a standard correction.
On the last mini sell off, we also bounced right at the 50% retracement level.
So that "could" have been it for the correction.
We need to take out yesterday’s highs for confirmation.
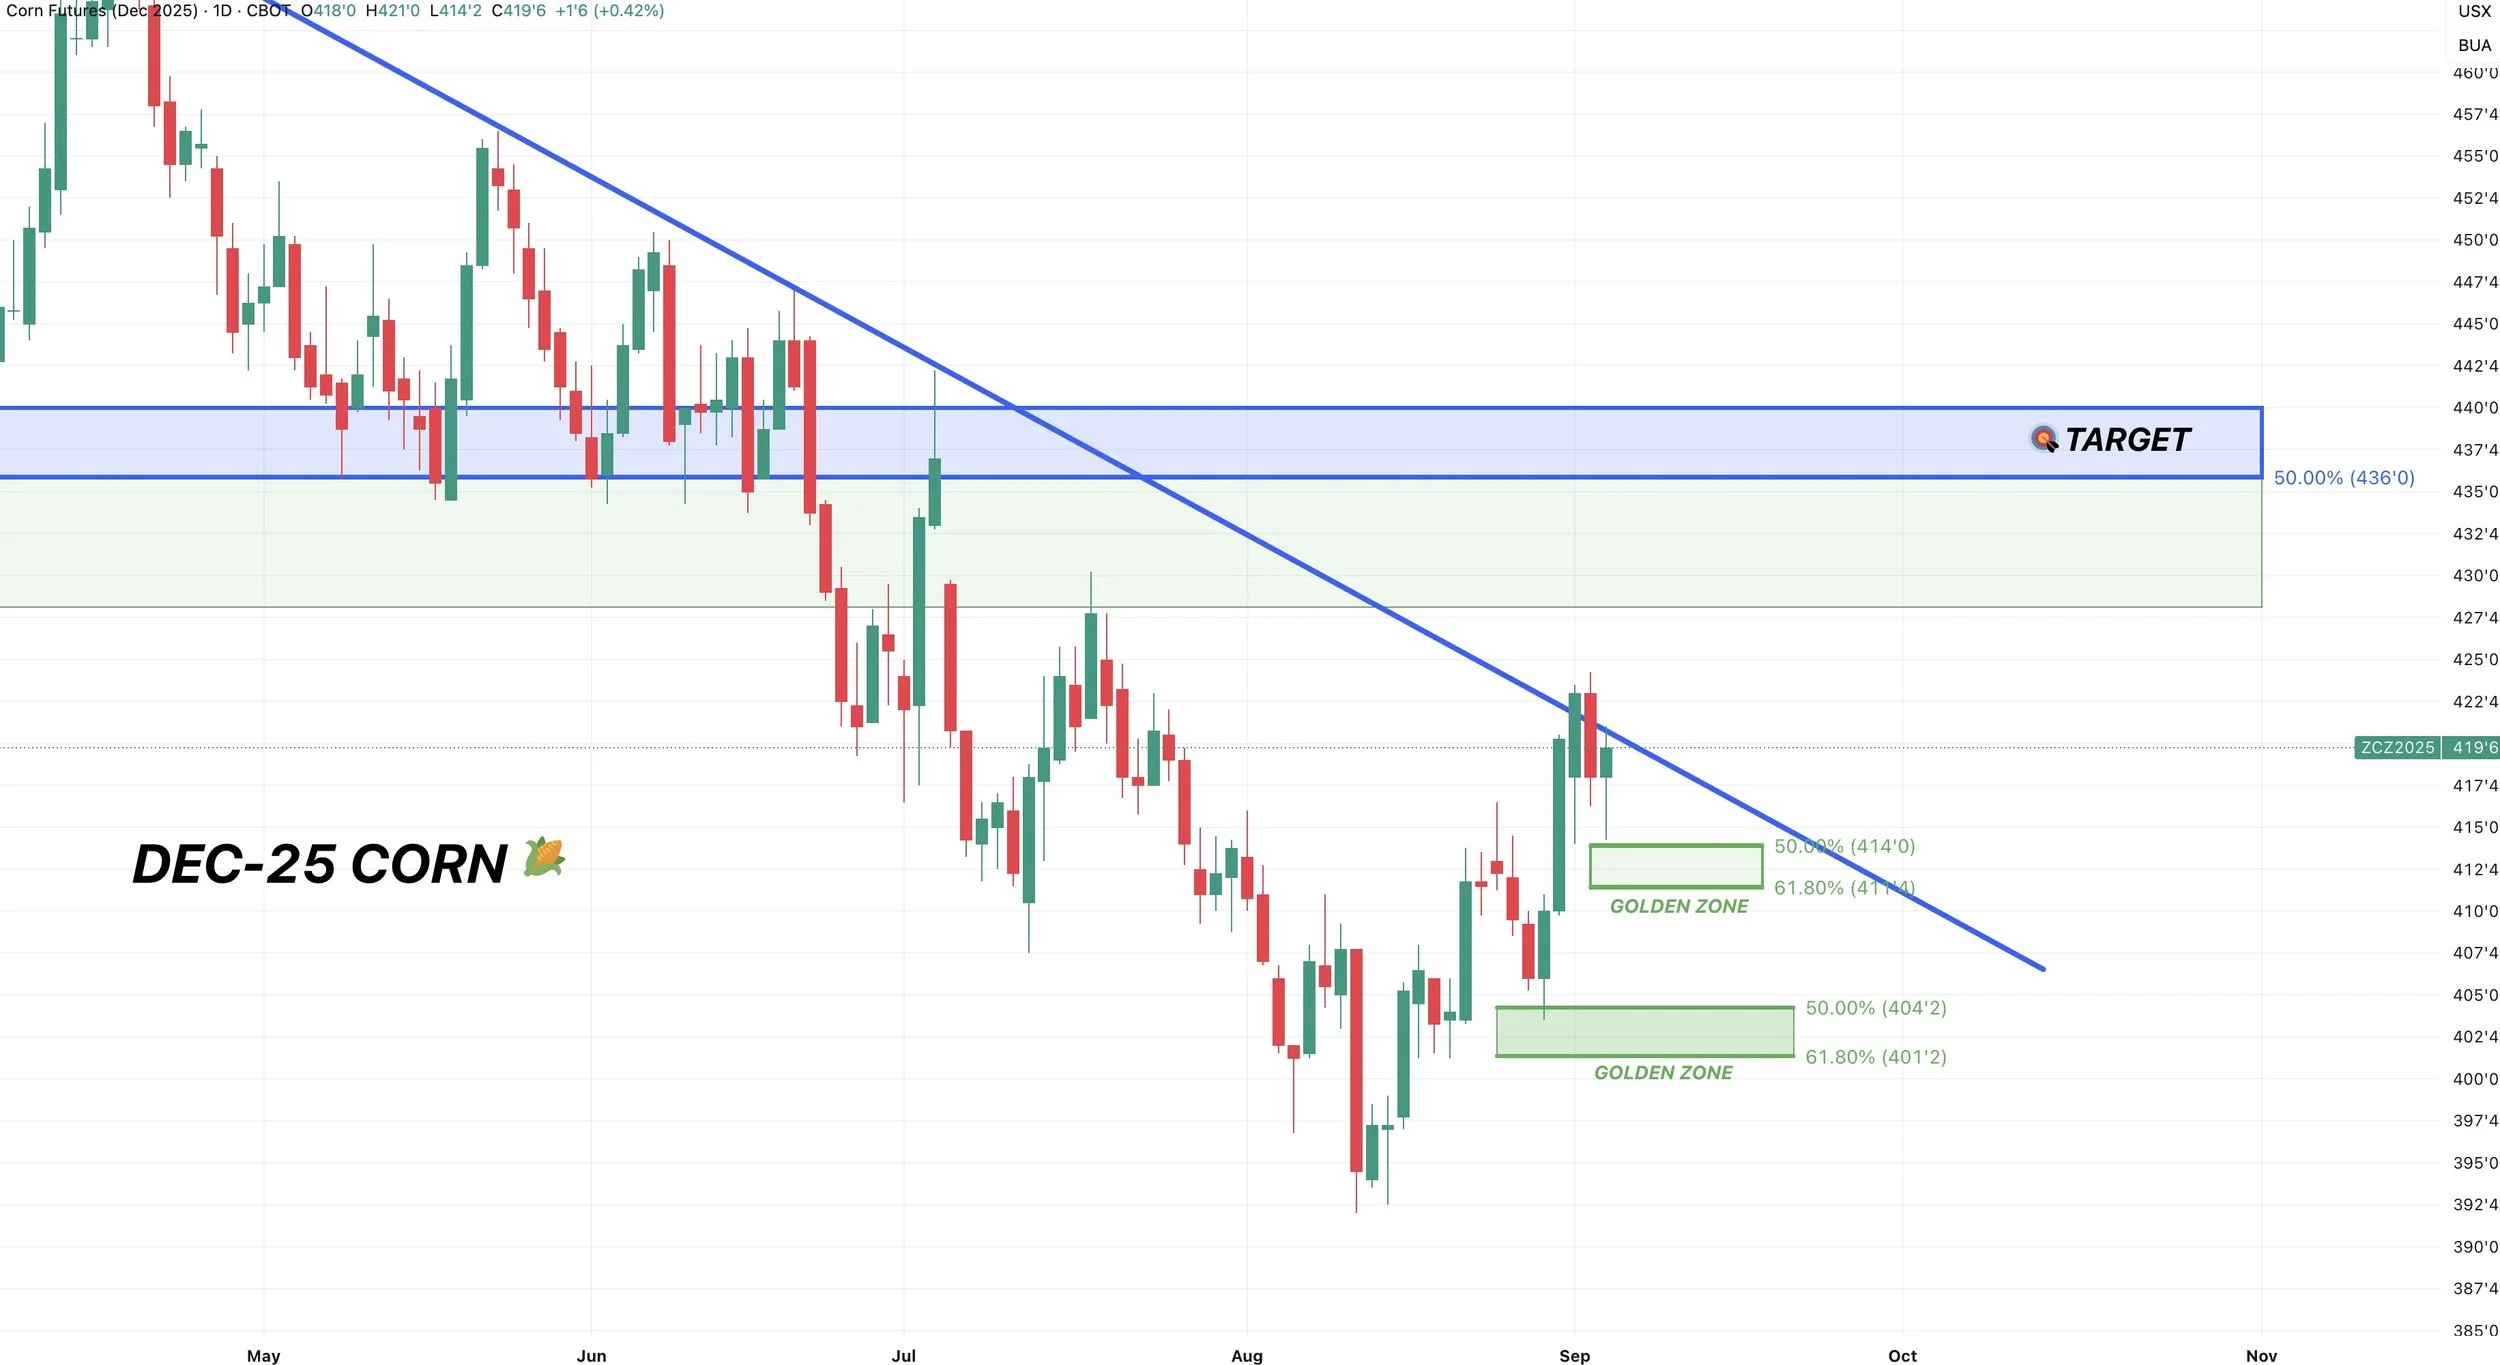
Well what if this was our local top?
What level do we need to hold?
We need to hold $4.04
$4.04 is the 61.8% retracement of the entire rally off contract lows.
If we break below $4.04 we would probably test contract lows, although I don’t think this happens.
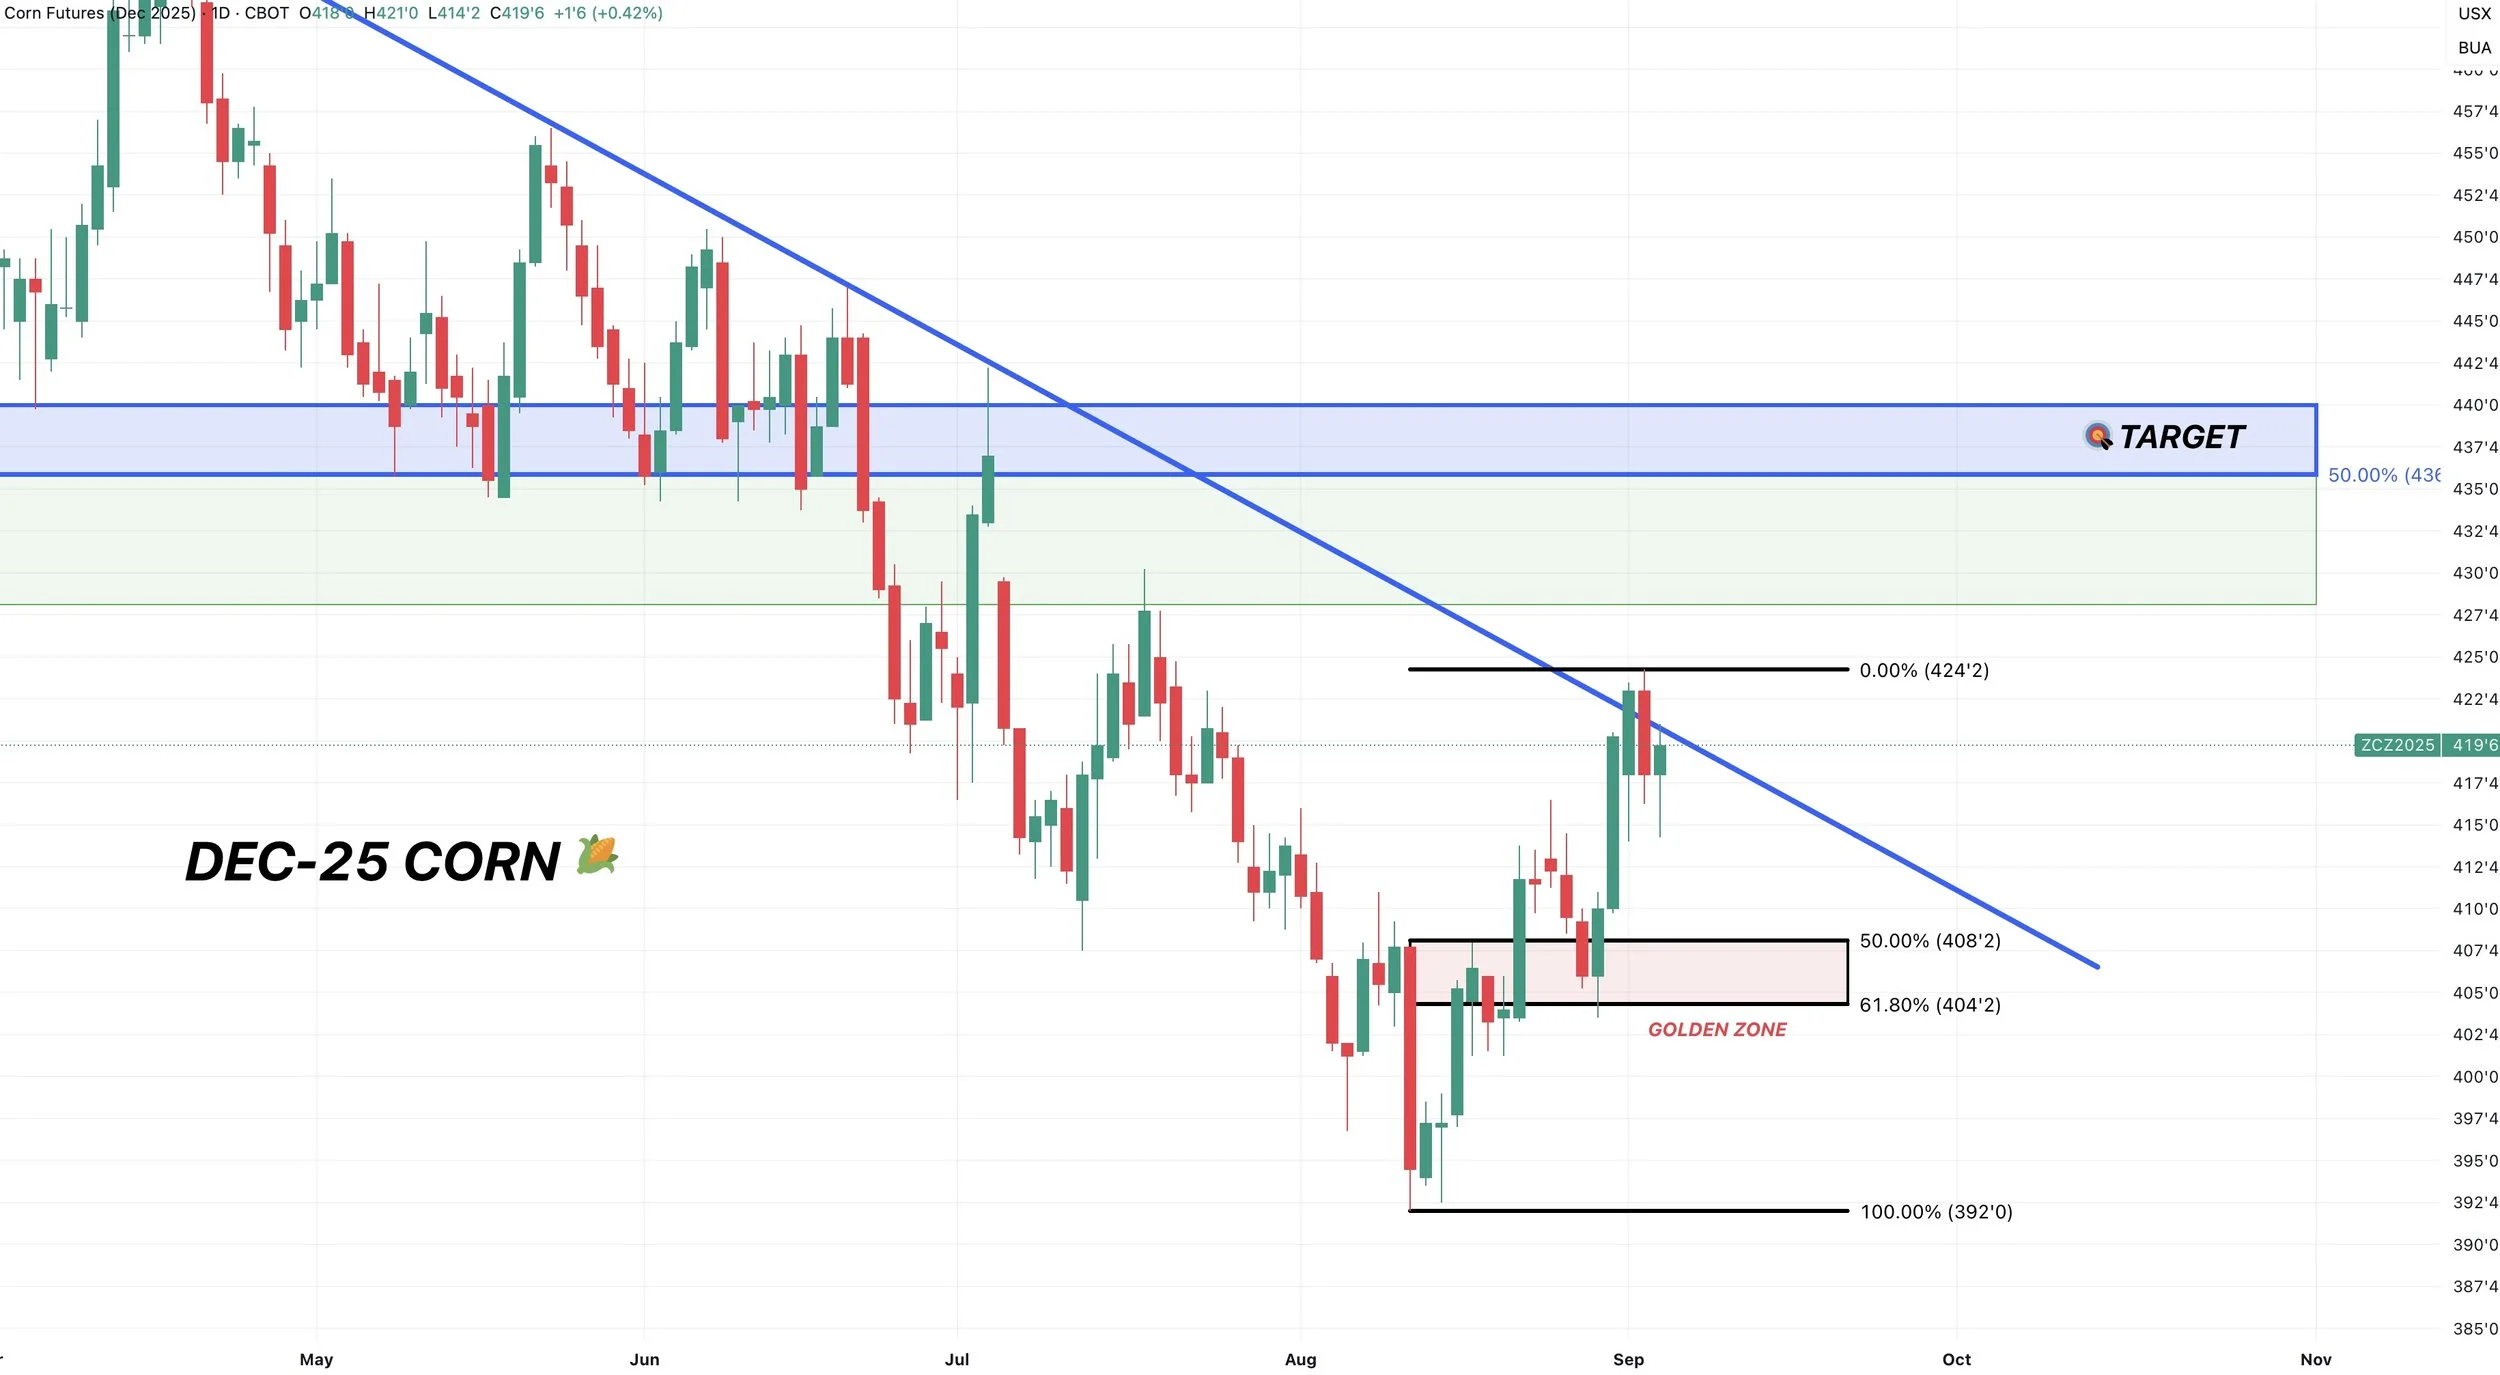
Soybeans
Basically a broken record story in beans.
A battle of not enough US supply but not enough demand from China.
Tuesday, we went over how the US balance sheet is razor-thin.
Even with a record yield, our carryout is sitting at 3-year lows.
And that number drastically falls if yield falls.

But the obvious concern is demand.
What if China refuses to buy US soybeans?
How big of an impact could this have?
Last year China bought 810 million bushels of soybeans from the US.
During the last trade war they only bought 330 million bushels.
Here is the current balance sheet.
Our carryout is 290 million.
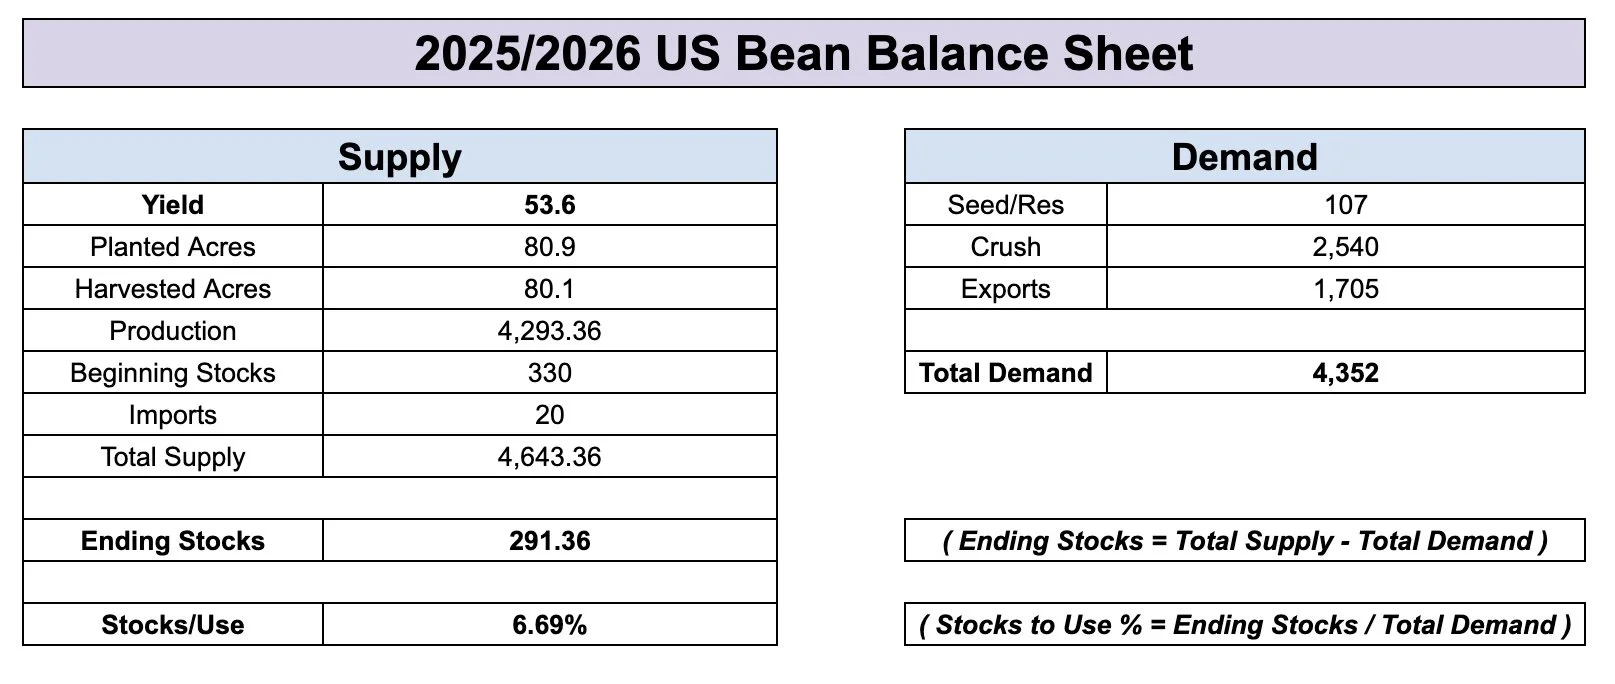
Now or the sake of this arguement, let's say export demand is overstated by 500 million bushels.
This number is based on last years sales (810 million), and the previous trade war's sales (330 million).
If this happened, it would sky rocket our carryout to nearly 800 million bushels vs the current 290 milllion.

Here is what that looks like on the carryout chart.
Our carryout would be the 2nd highest of all-time.
Only behind last trade war.
So yes. We need China.
I have a hard time believing China completely cuts off the US, but I guess it's possible.
Even if China does not come to the table. Some of that business that normally goes to Brazil might wind up coming to the US. So this is an extreme example.
On the other hand, the upside in this market is higher than anyone thinks if China does come to the table.

USDA Yield
The USDA report is next Friday.
In August, they have cut yield 4 times in the past 5 years.
The average cut is 1 bpa.
Which would put yield at 52.6 bpa if it happened again.
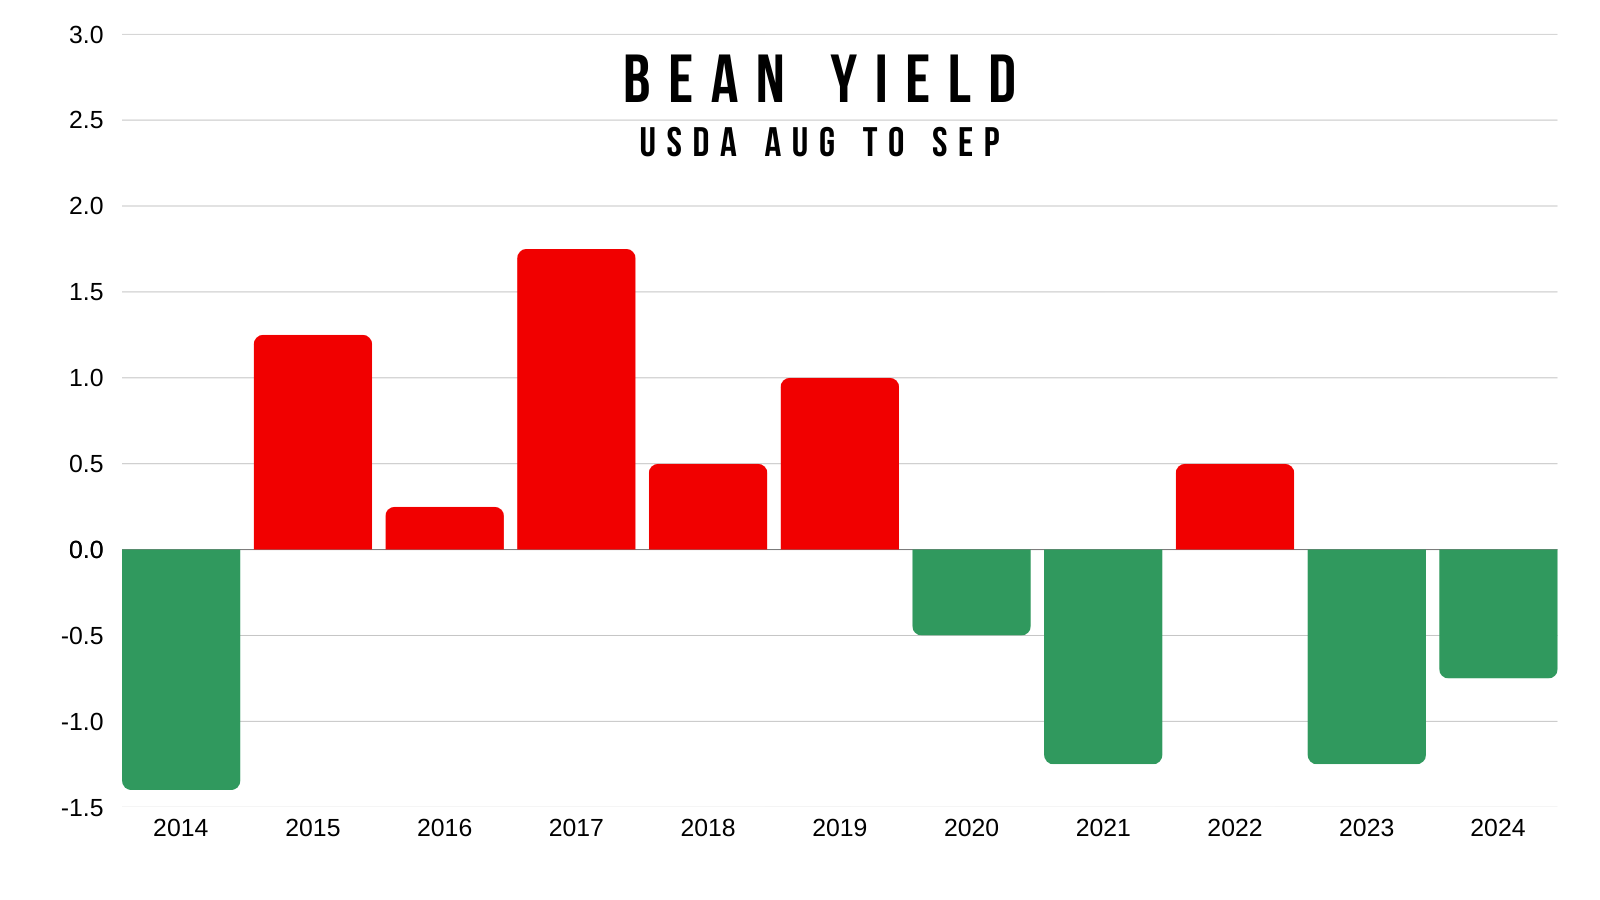
Daily Nov Chart:
We have been mentioned that if we broke below this green box, our next stop could very well be the blue box.
The green box was the golden zone of this mini rally (50-61.8% retracement).
The blue box is the golden zone of the entire rally off of $9.80.
Today we bounced perfectly off of the 50% retracement at $10.22
Which means this move was technically deep enough for a standard correction and it might be over.
However, I am not ruling out testing the 61.8% level at $10.12
That is the line in the sand to keep the chart bullish.
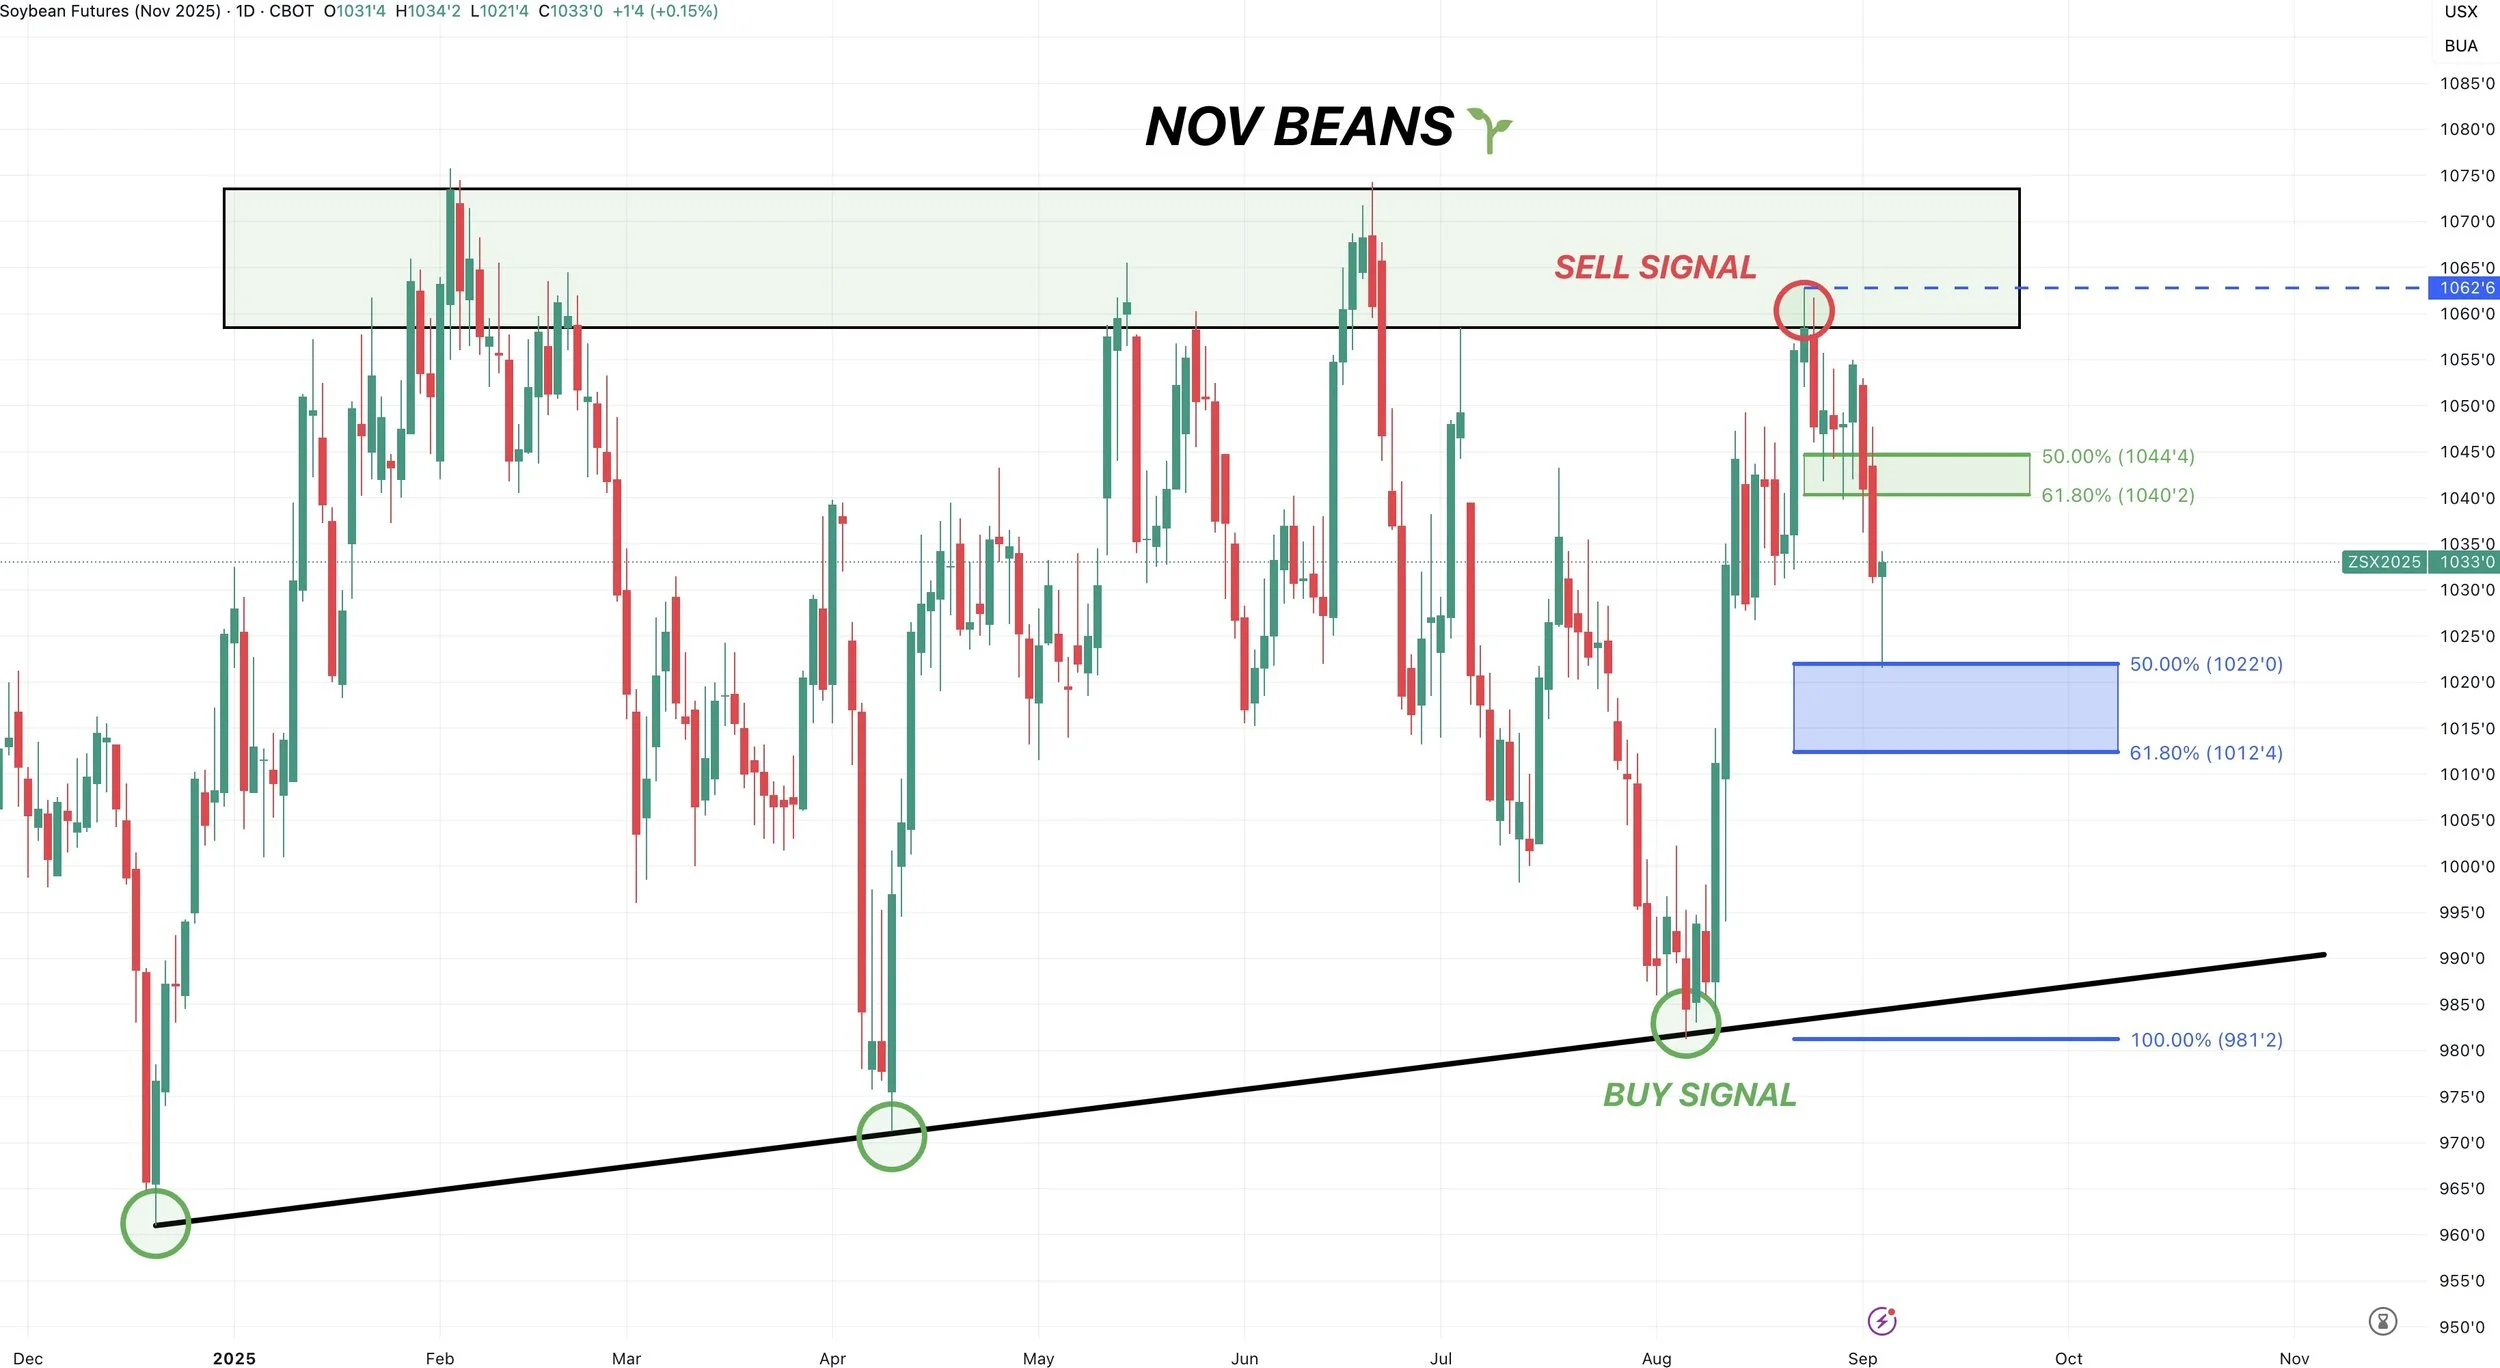
For confirmation that this correction is over, I need to see a close above $10.47
That reclaims 61.8% of this sell off.
When we close above that level, it tells us that a move is no longer correctional.
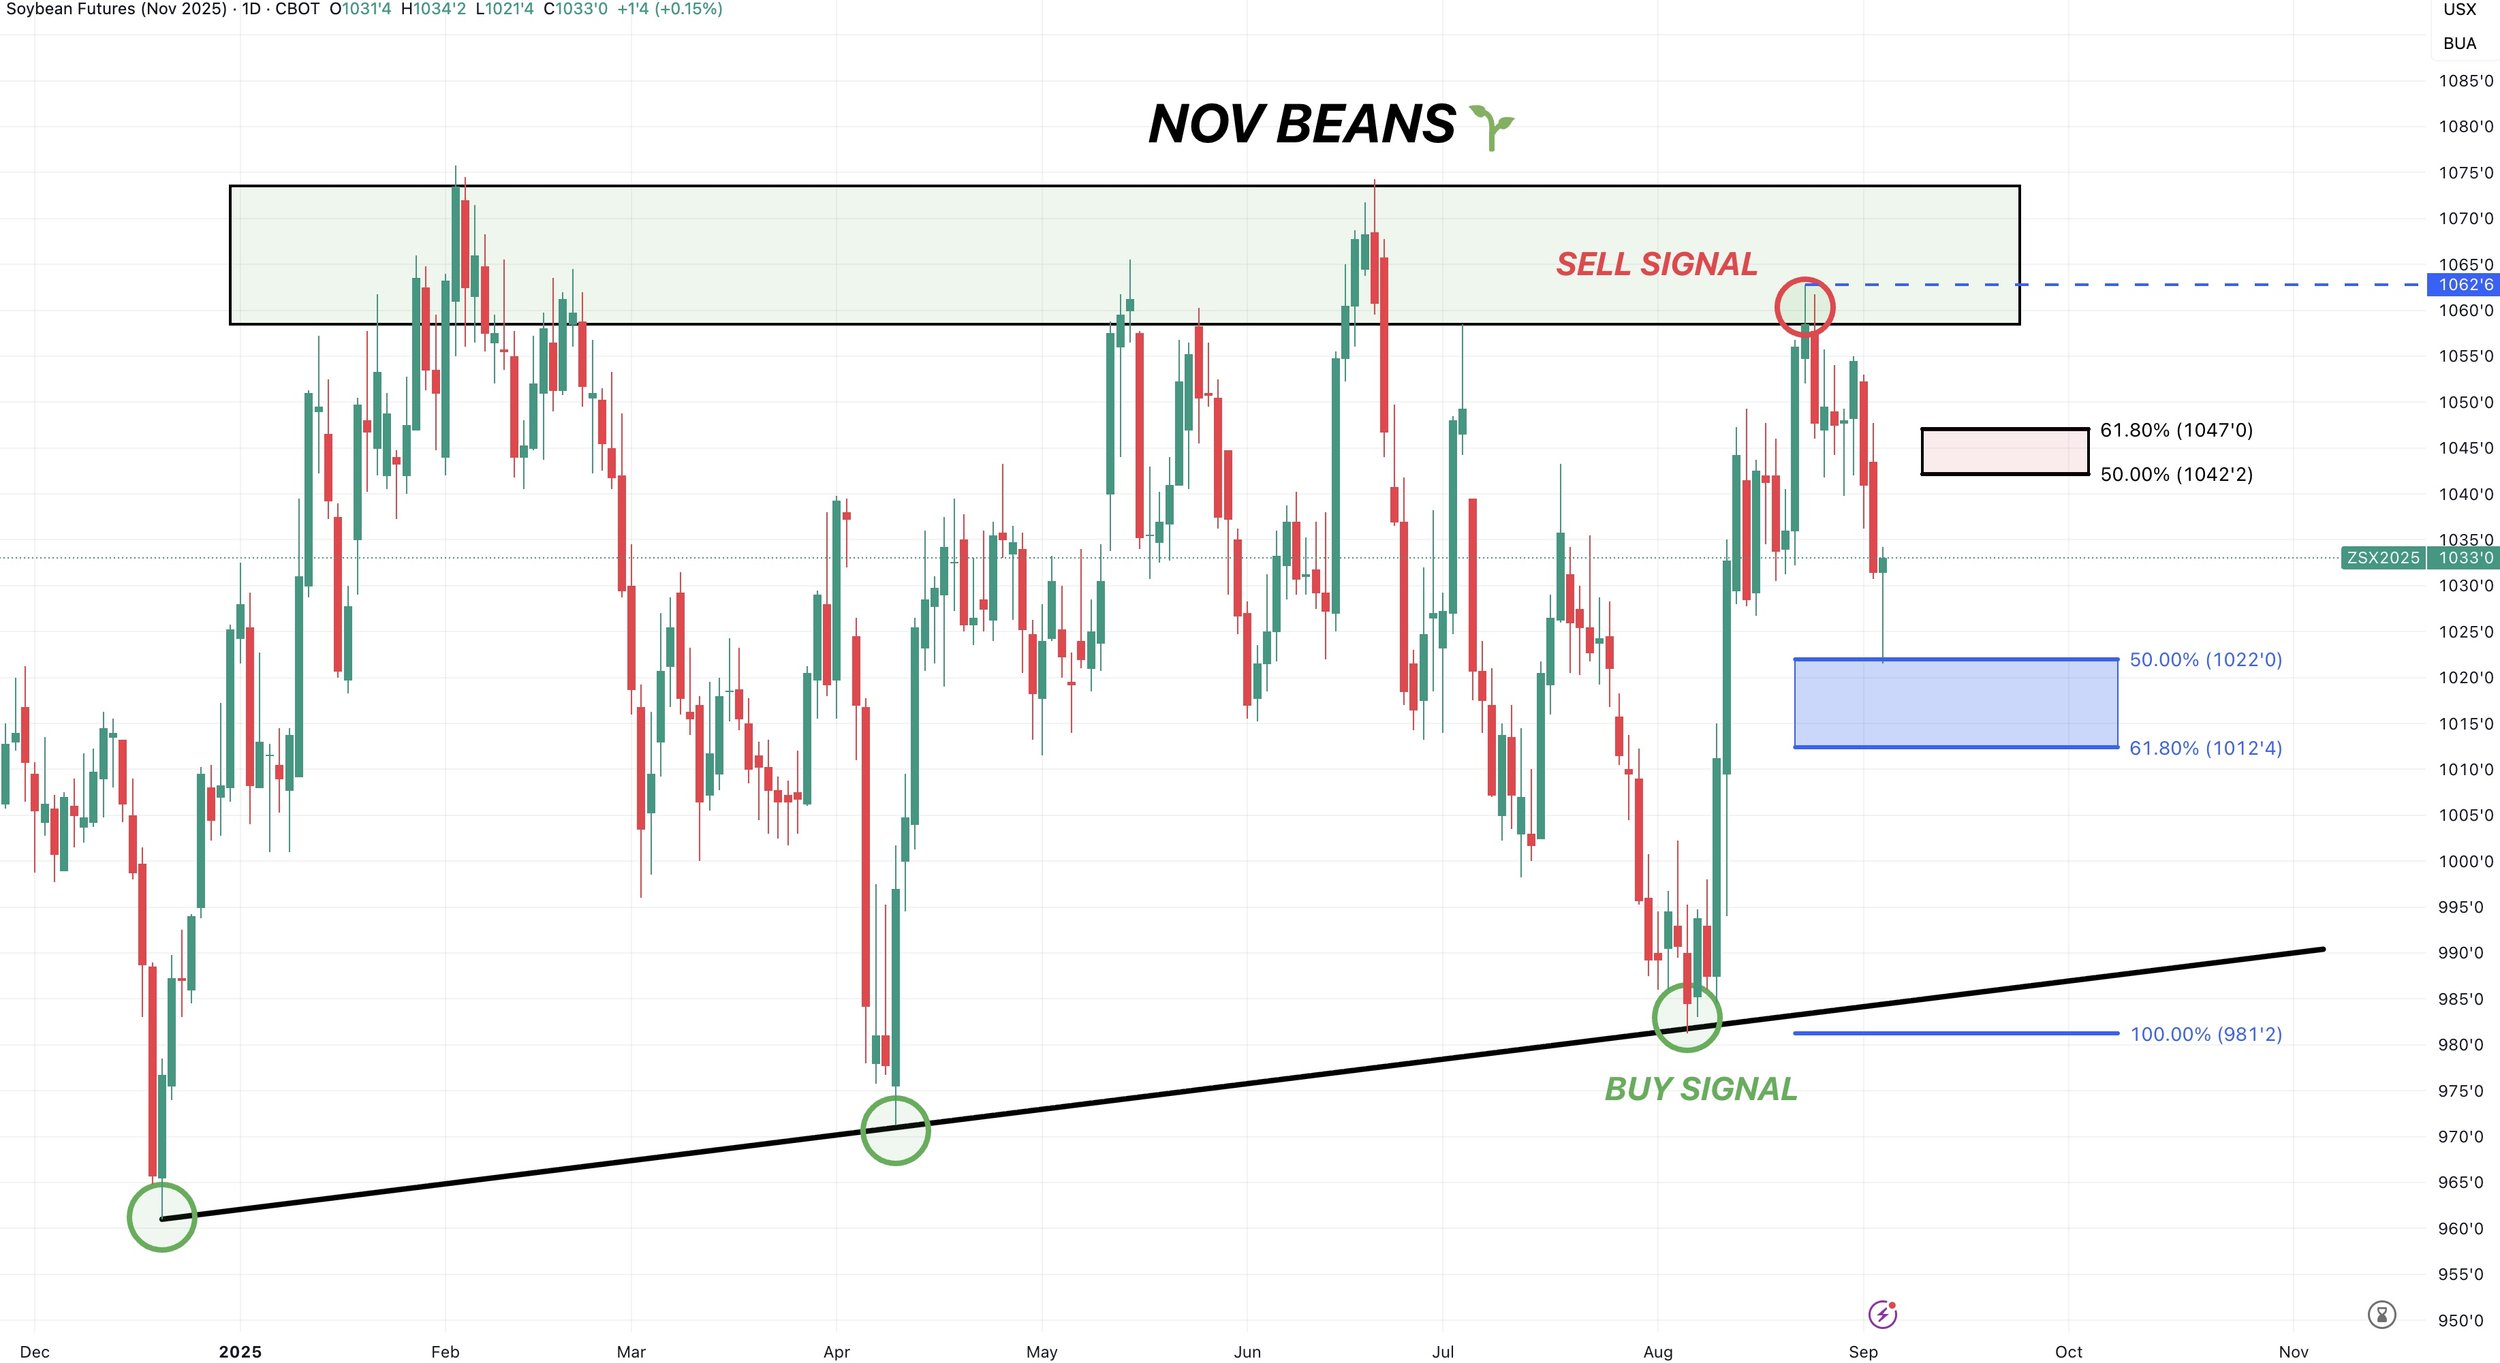
August 22nd we had a sell signal & hedge alert at the highs.
The next target to de-risk further is still going to be $10.82 as of now.
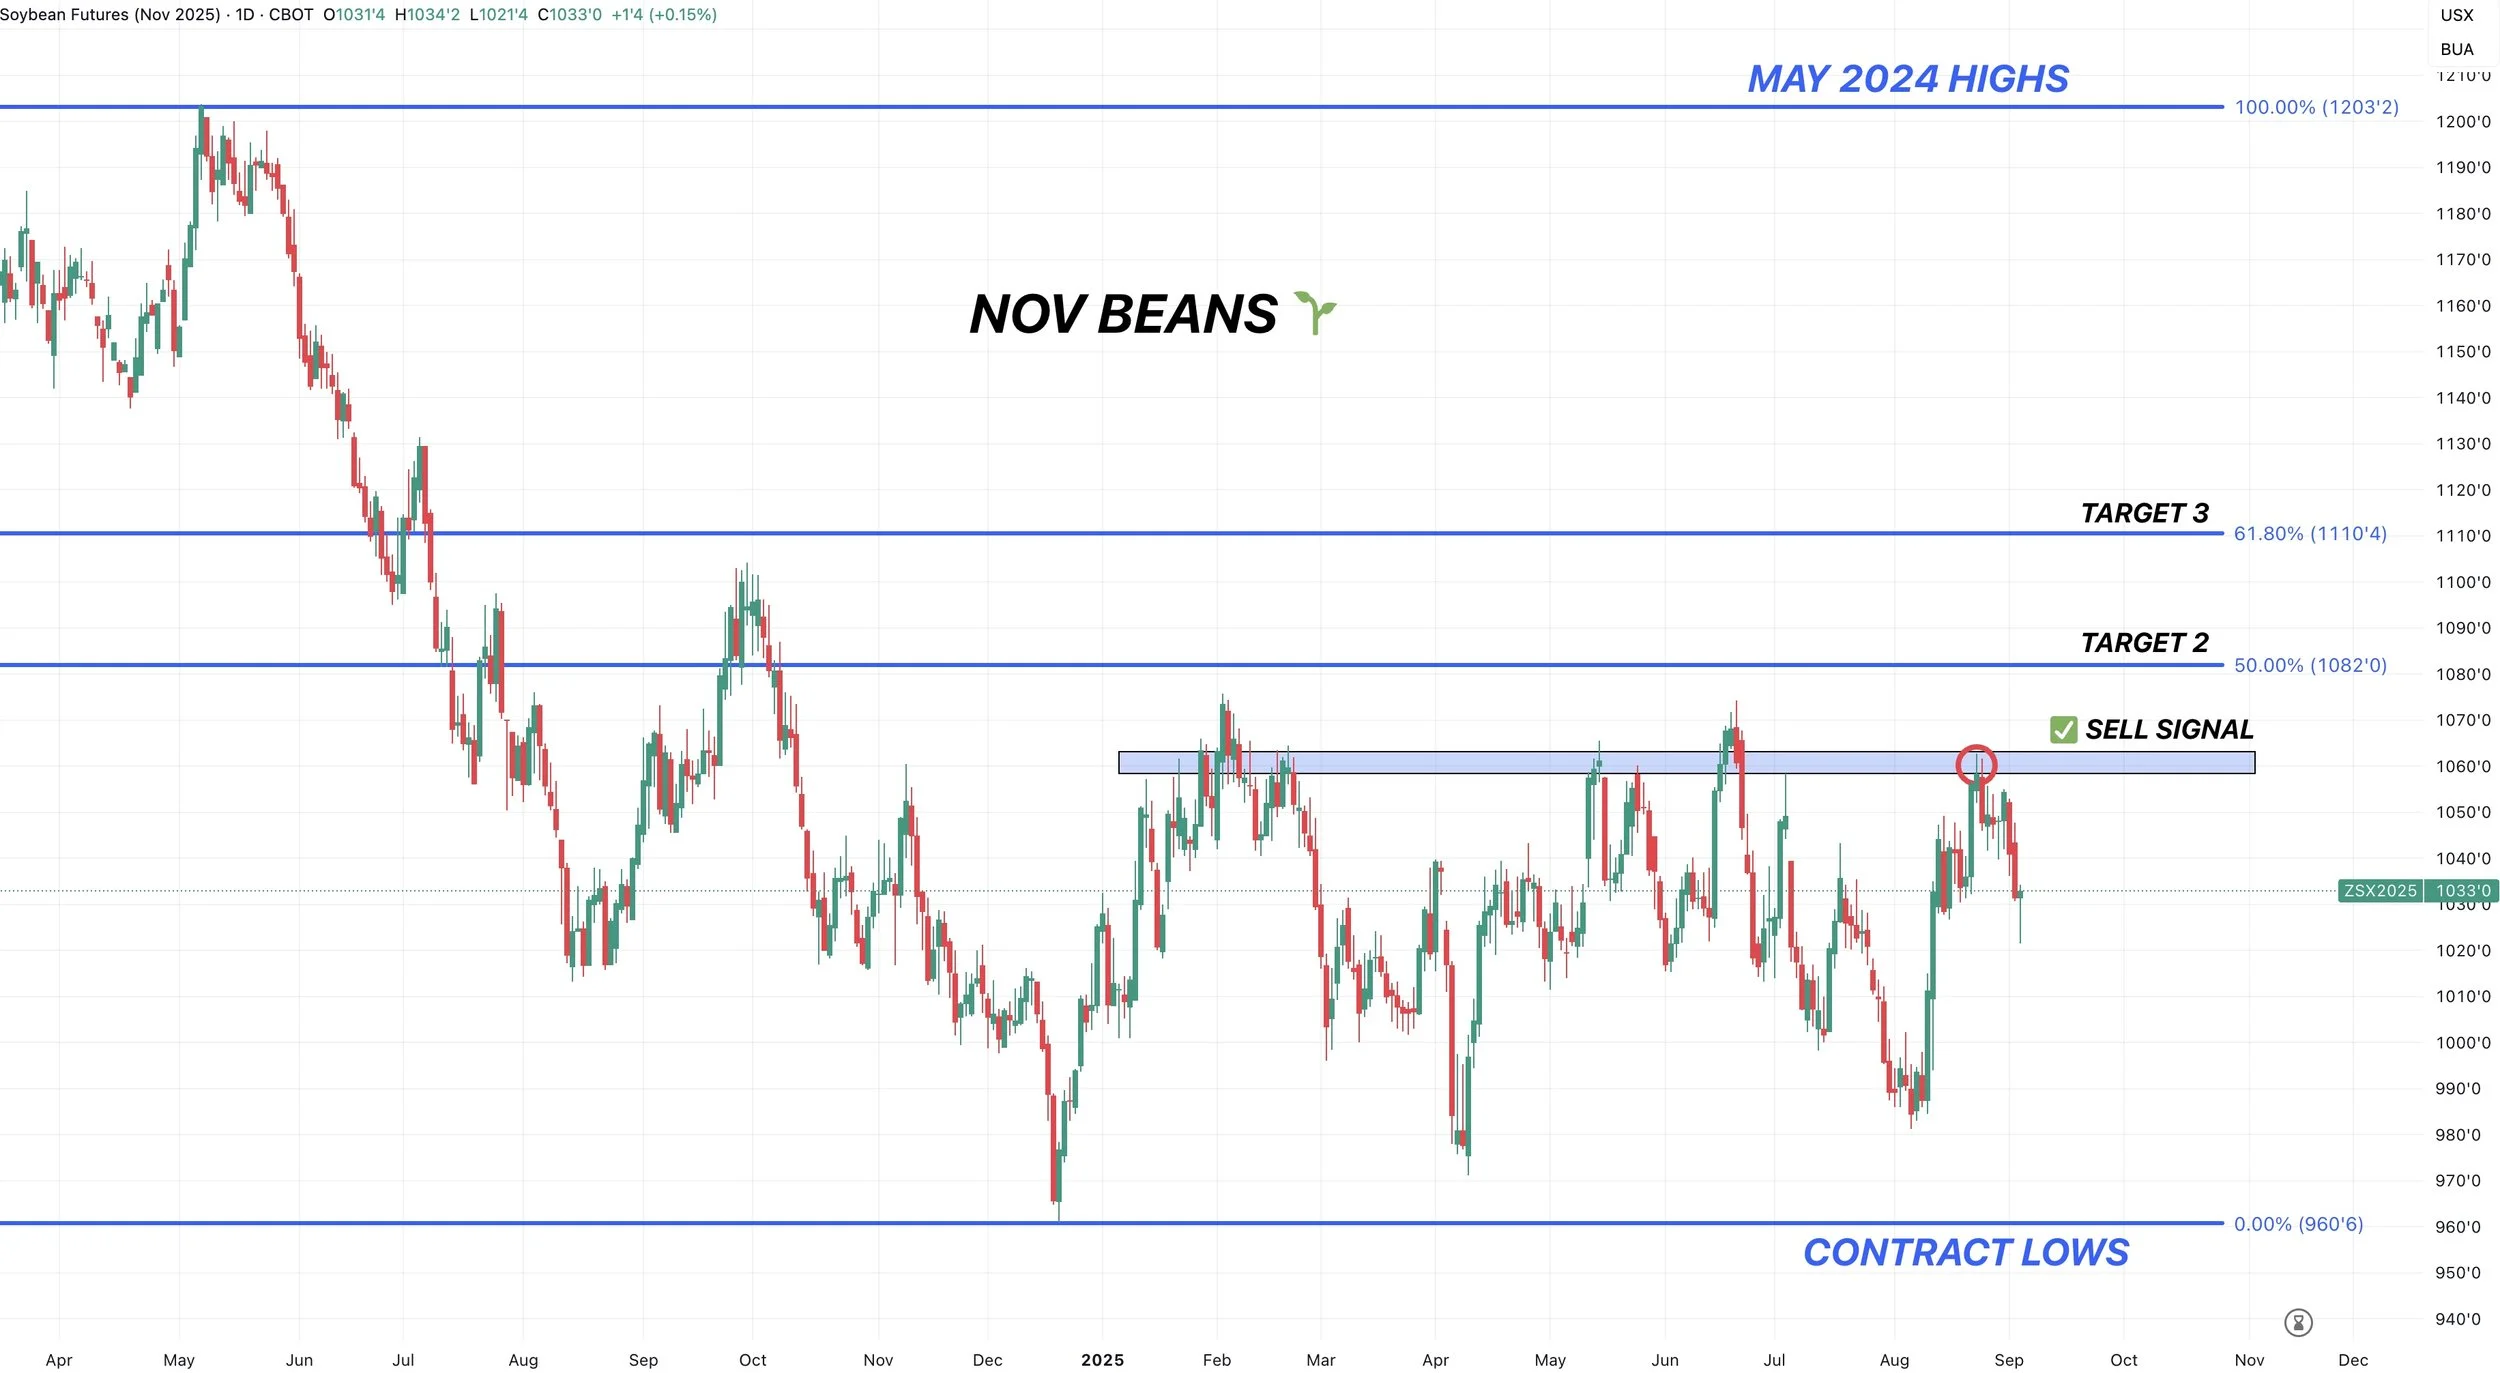
Wheat
Wheat continues to be the dog of the grains.
Nothing new fundamentally.
Demand has been amazing lately. We're extremely competitive on the export markets. Yet we continue to struggle.
Here is the US stocks to use ratio.
It's at it's highest levels since 2020.
There is just simply an ample amount of wheat to go around.
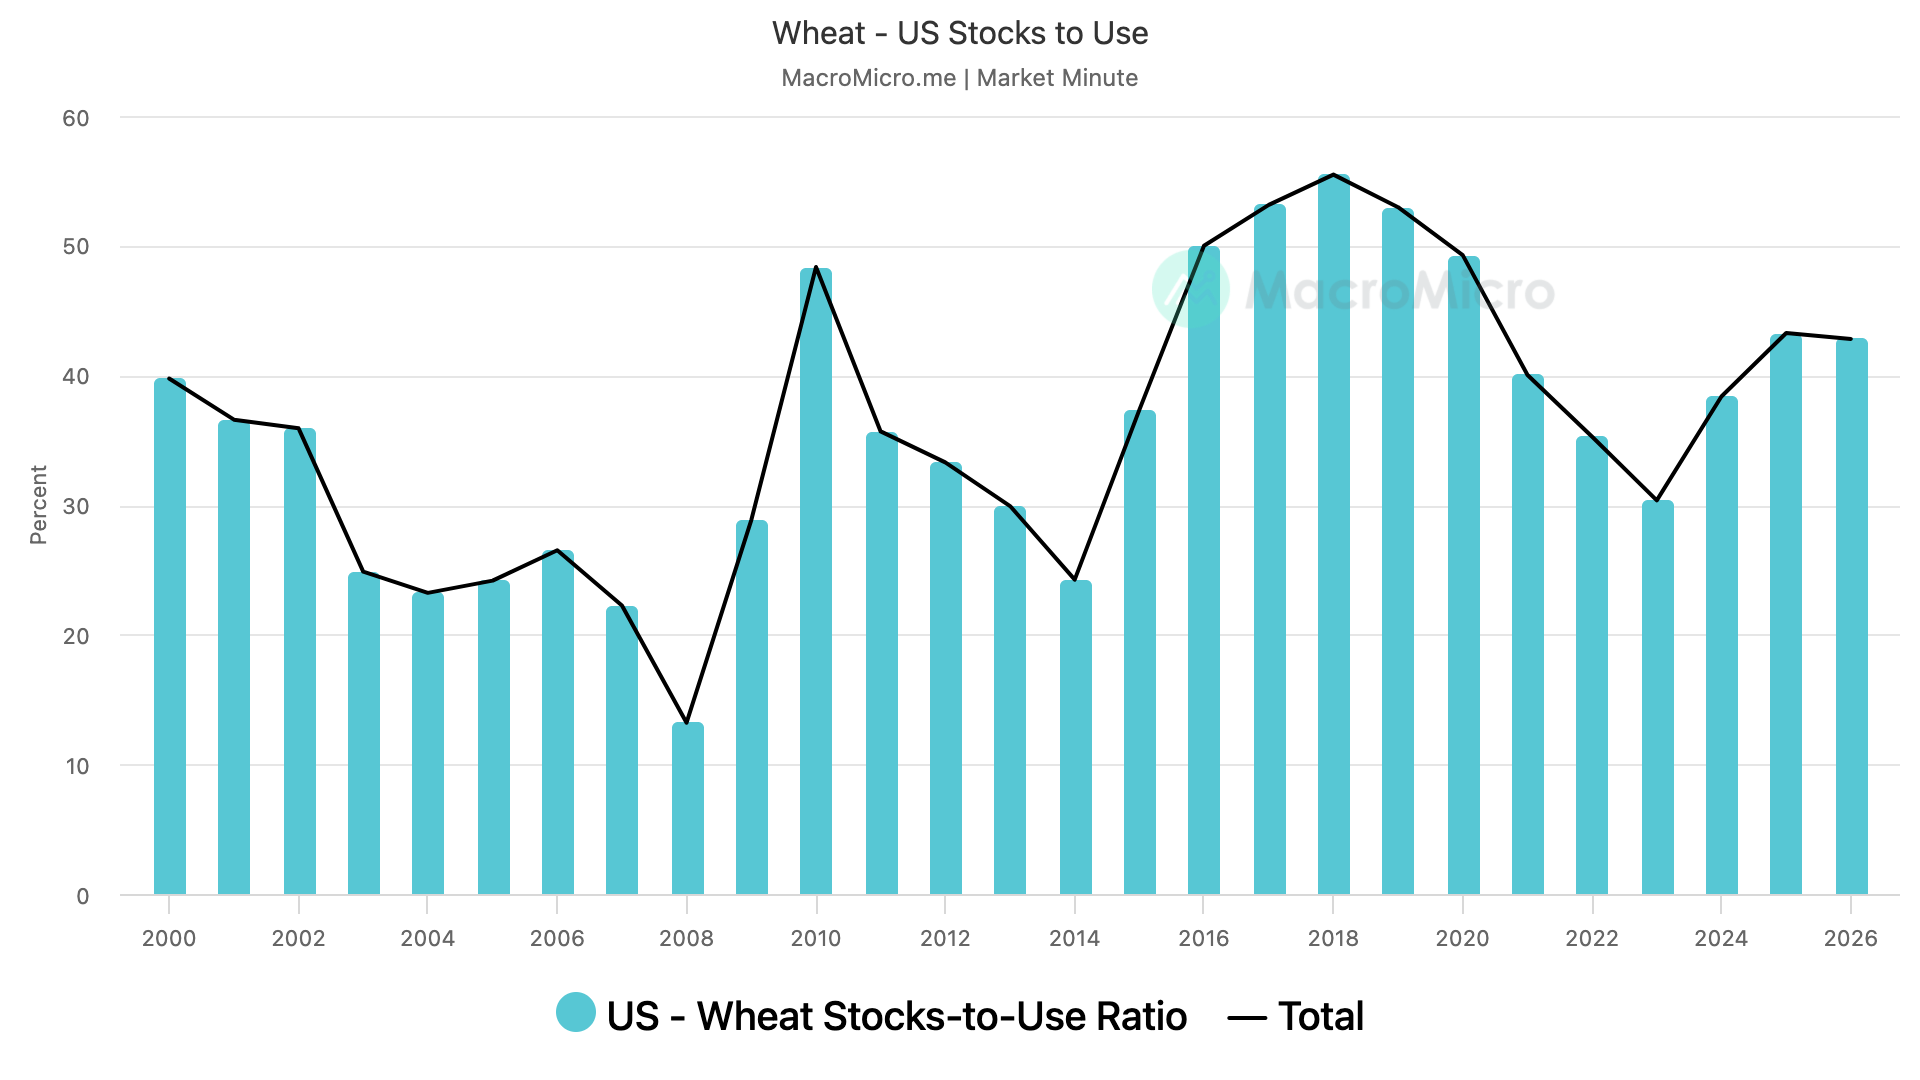
Despite not having a true bullish catalyst.
I do still think the wheat market catches a bid down here eventually.
Seasonally, we put in our lows here.
The funds recently bought for the first time since June.
Although there isn’t a reason to be mega bullish, I find it very hard to get bearish at these price levels.
Daily Chicago:
We bounced at the bottom of this massive channel once again.
We posted new contract lows today before bouncing nicely off the lows.
A sign of a "potential" bear trap.
If we can clear $5.35 it will be a good indication we are headed higher.
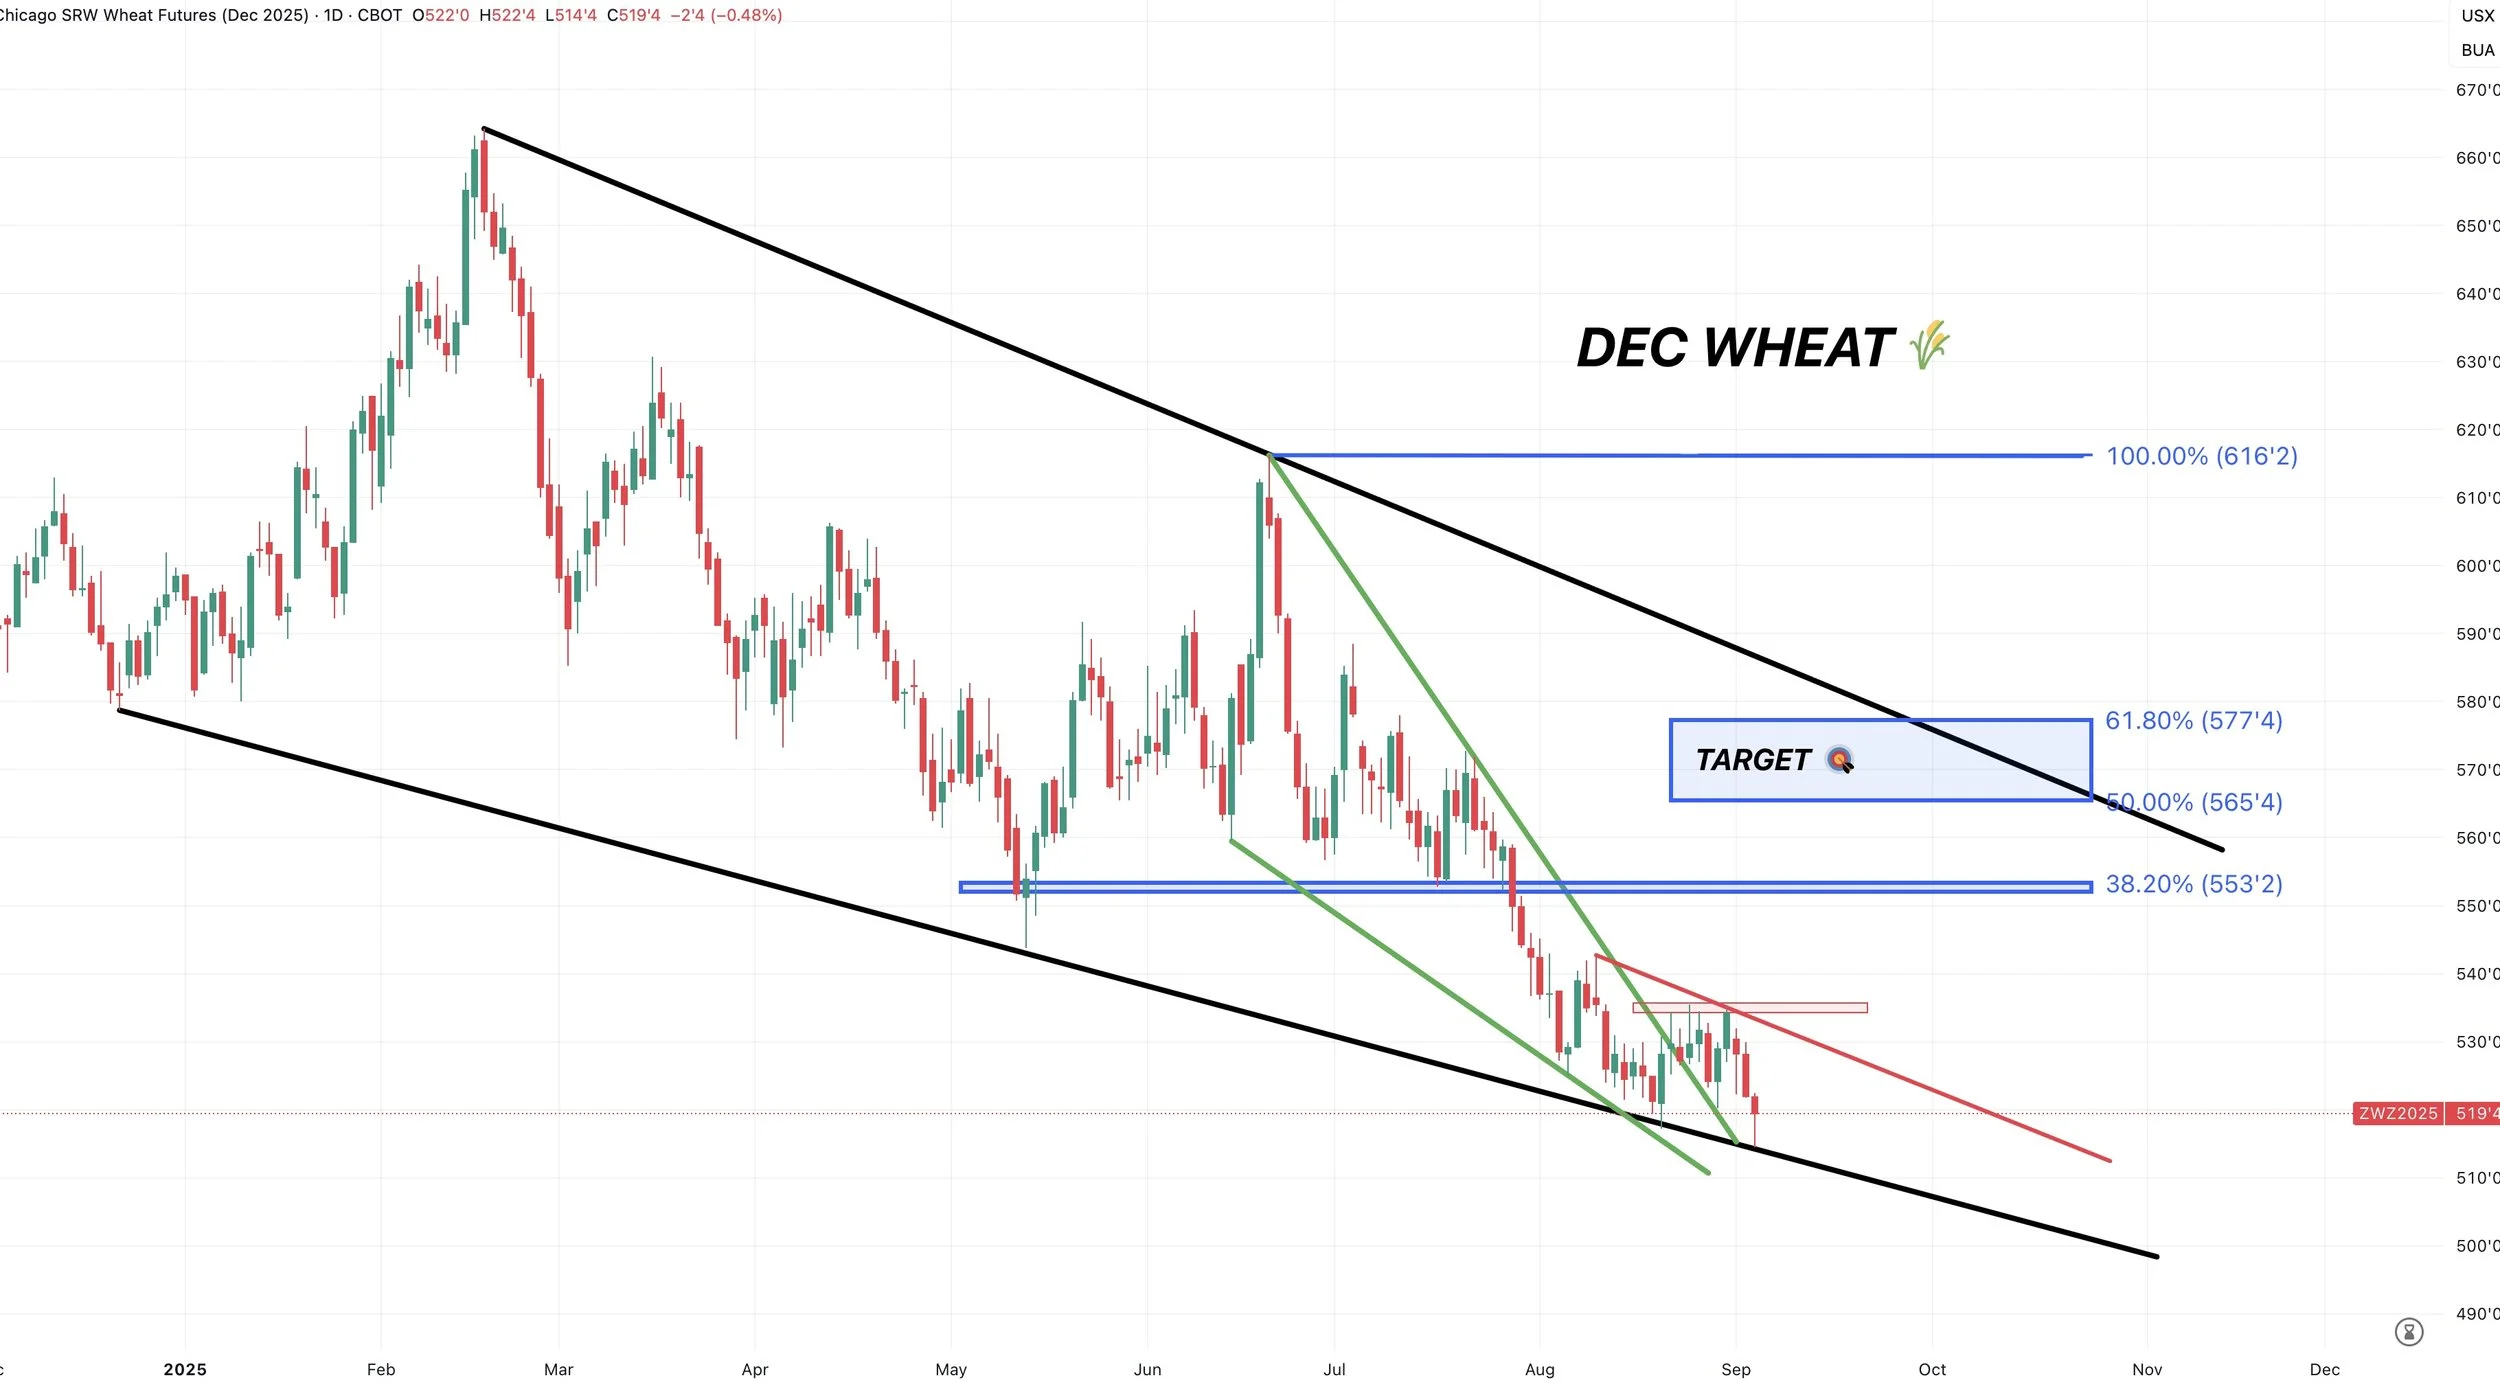
We are showing some very clear signs of bullish divergence here.
Prices made new lows.
The RSI did not.
This suggests downside momentum is getting weaker.
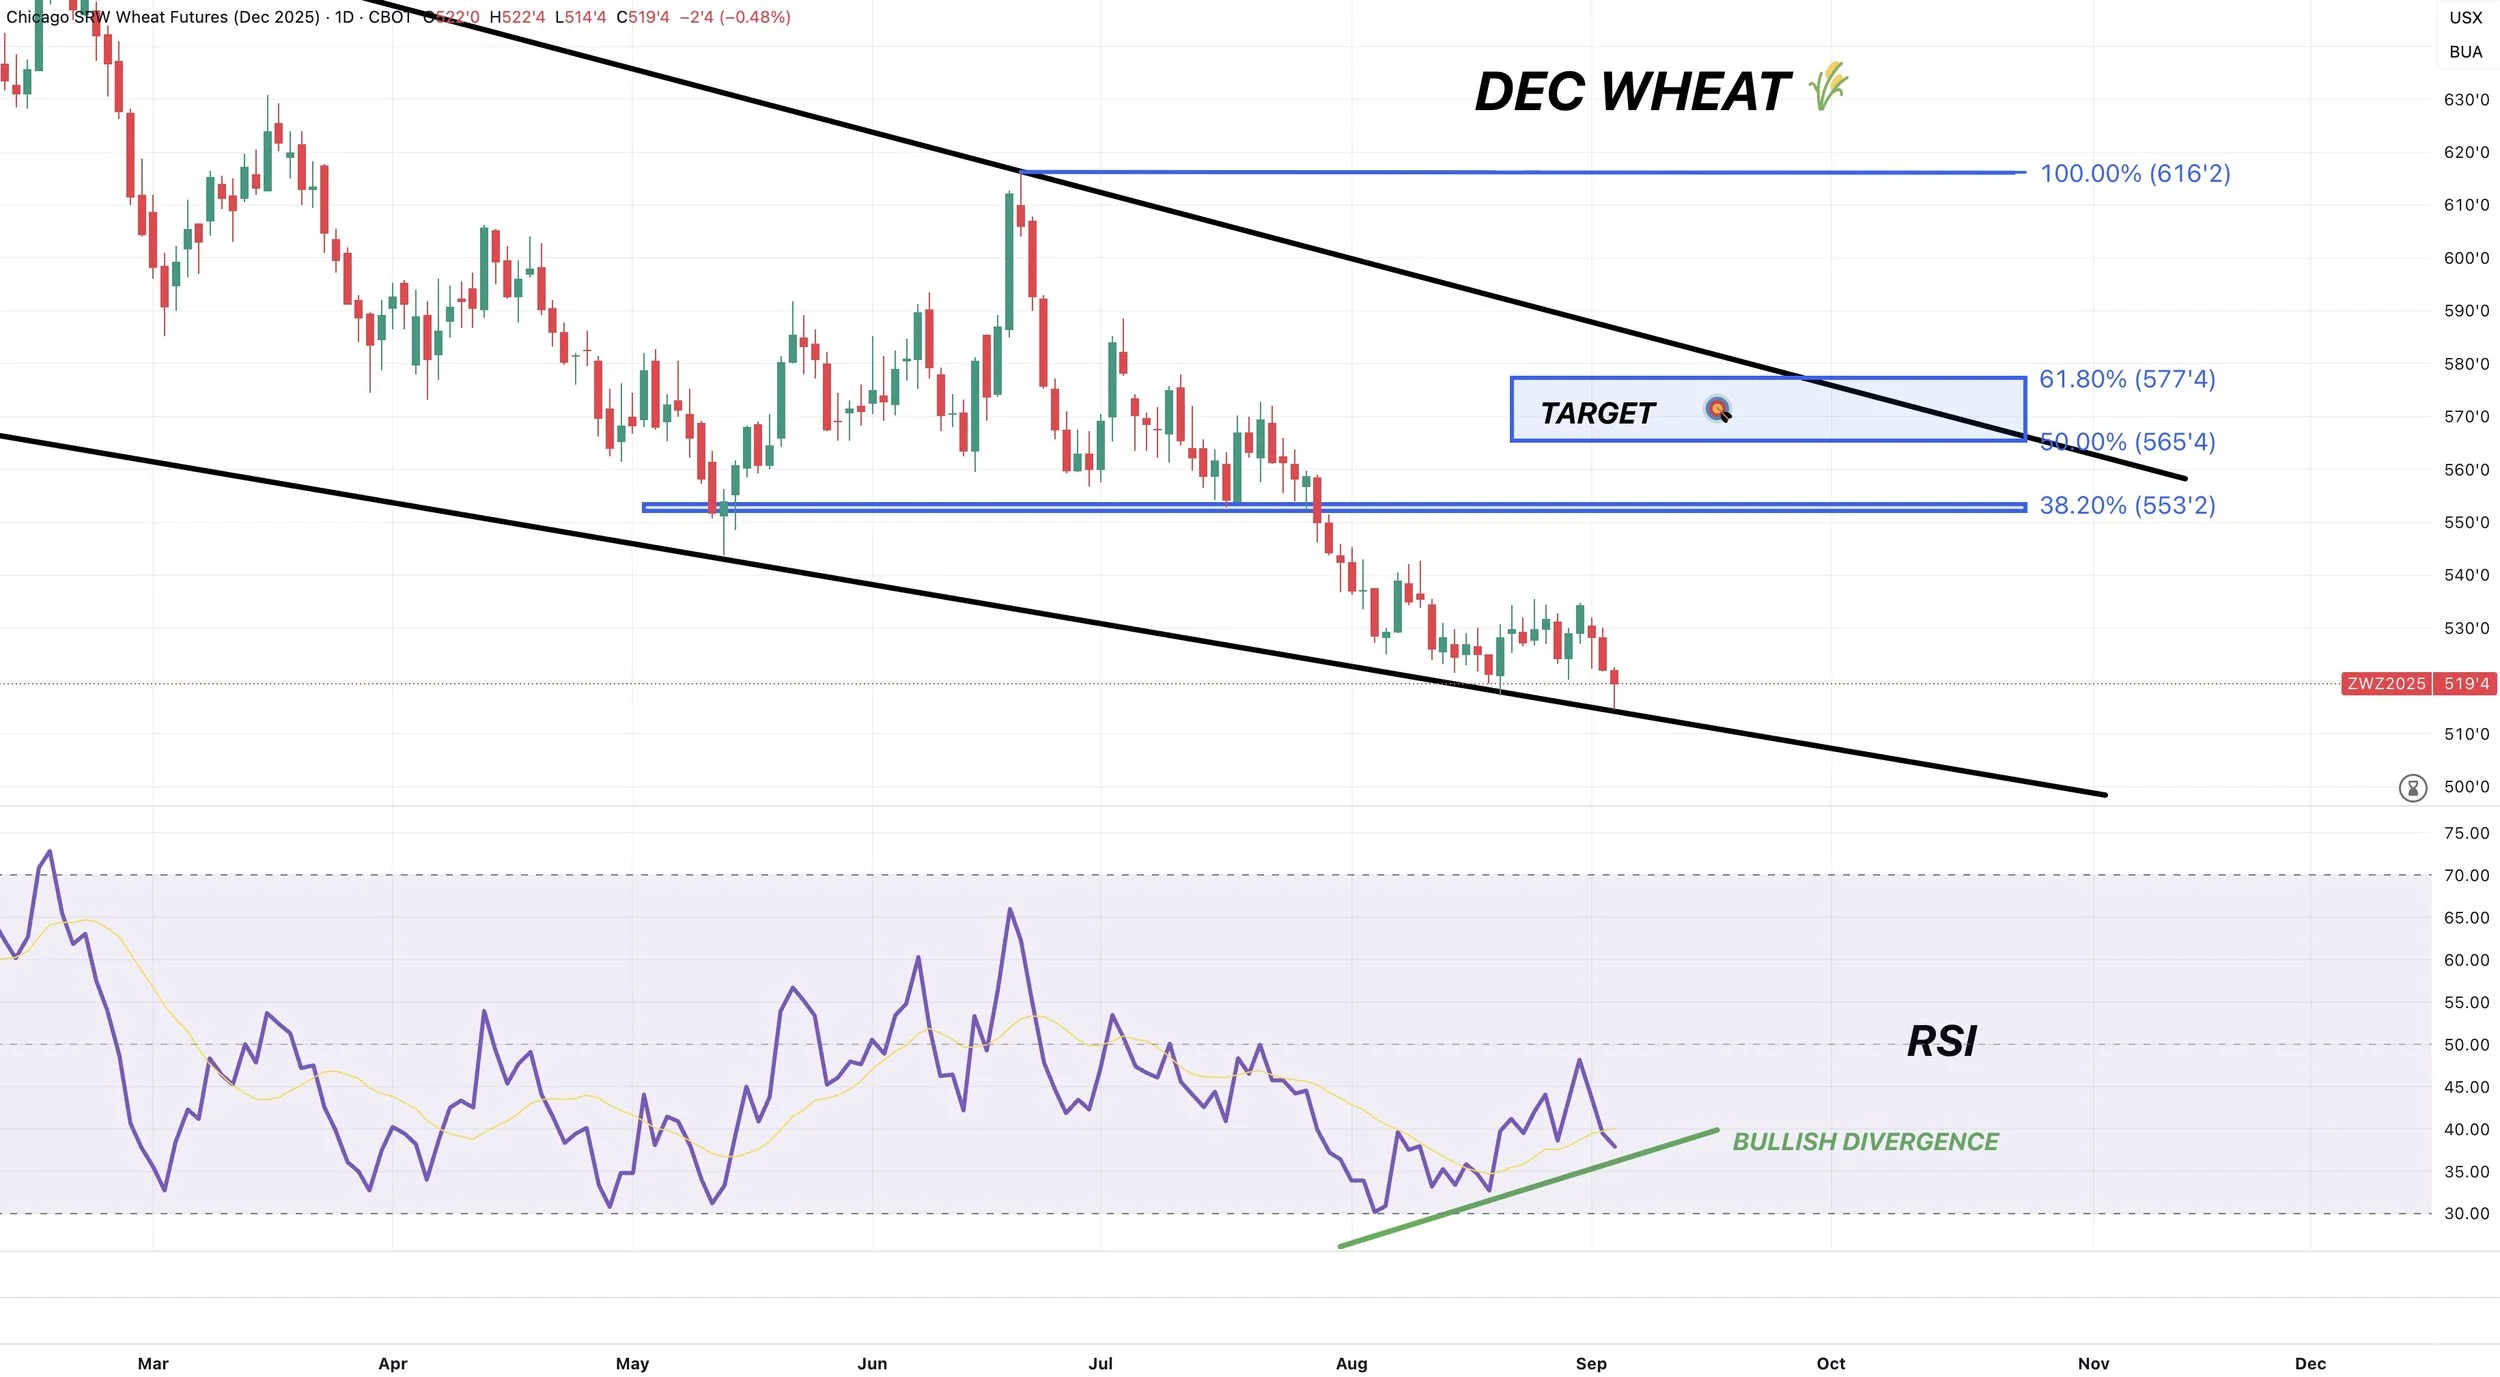
Remember how the seasonals had us topping in October?
That thought process also lines up with this chart.
Every 4 months the wheat market has provided an opportunity.
I'd like to think it happens again.

Daily KC Wheat:
Nothing to update here.
Waiting patiently for a break out.
First real resistance is all the way at $5.40 or so.
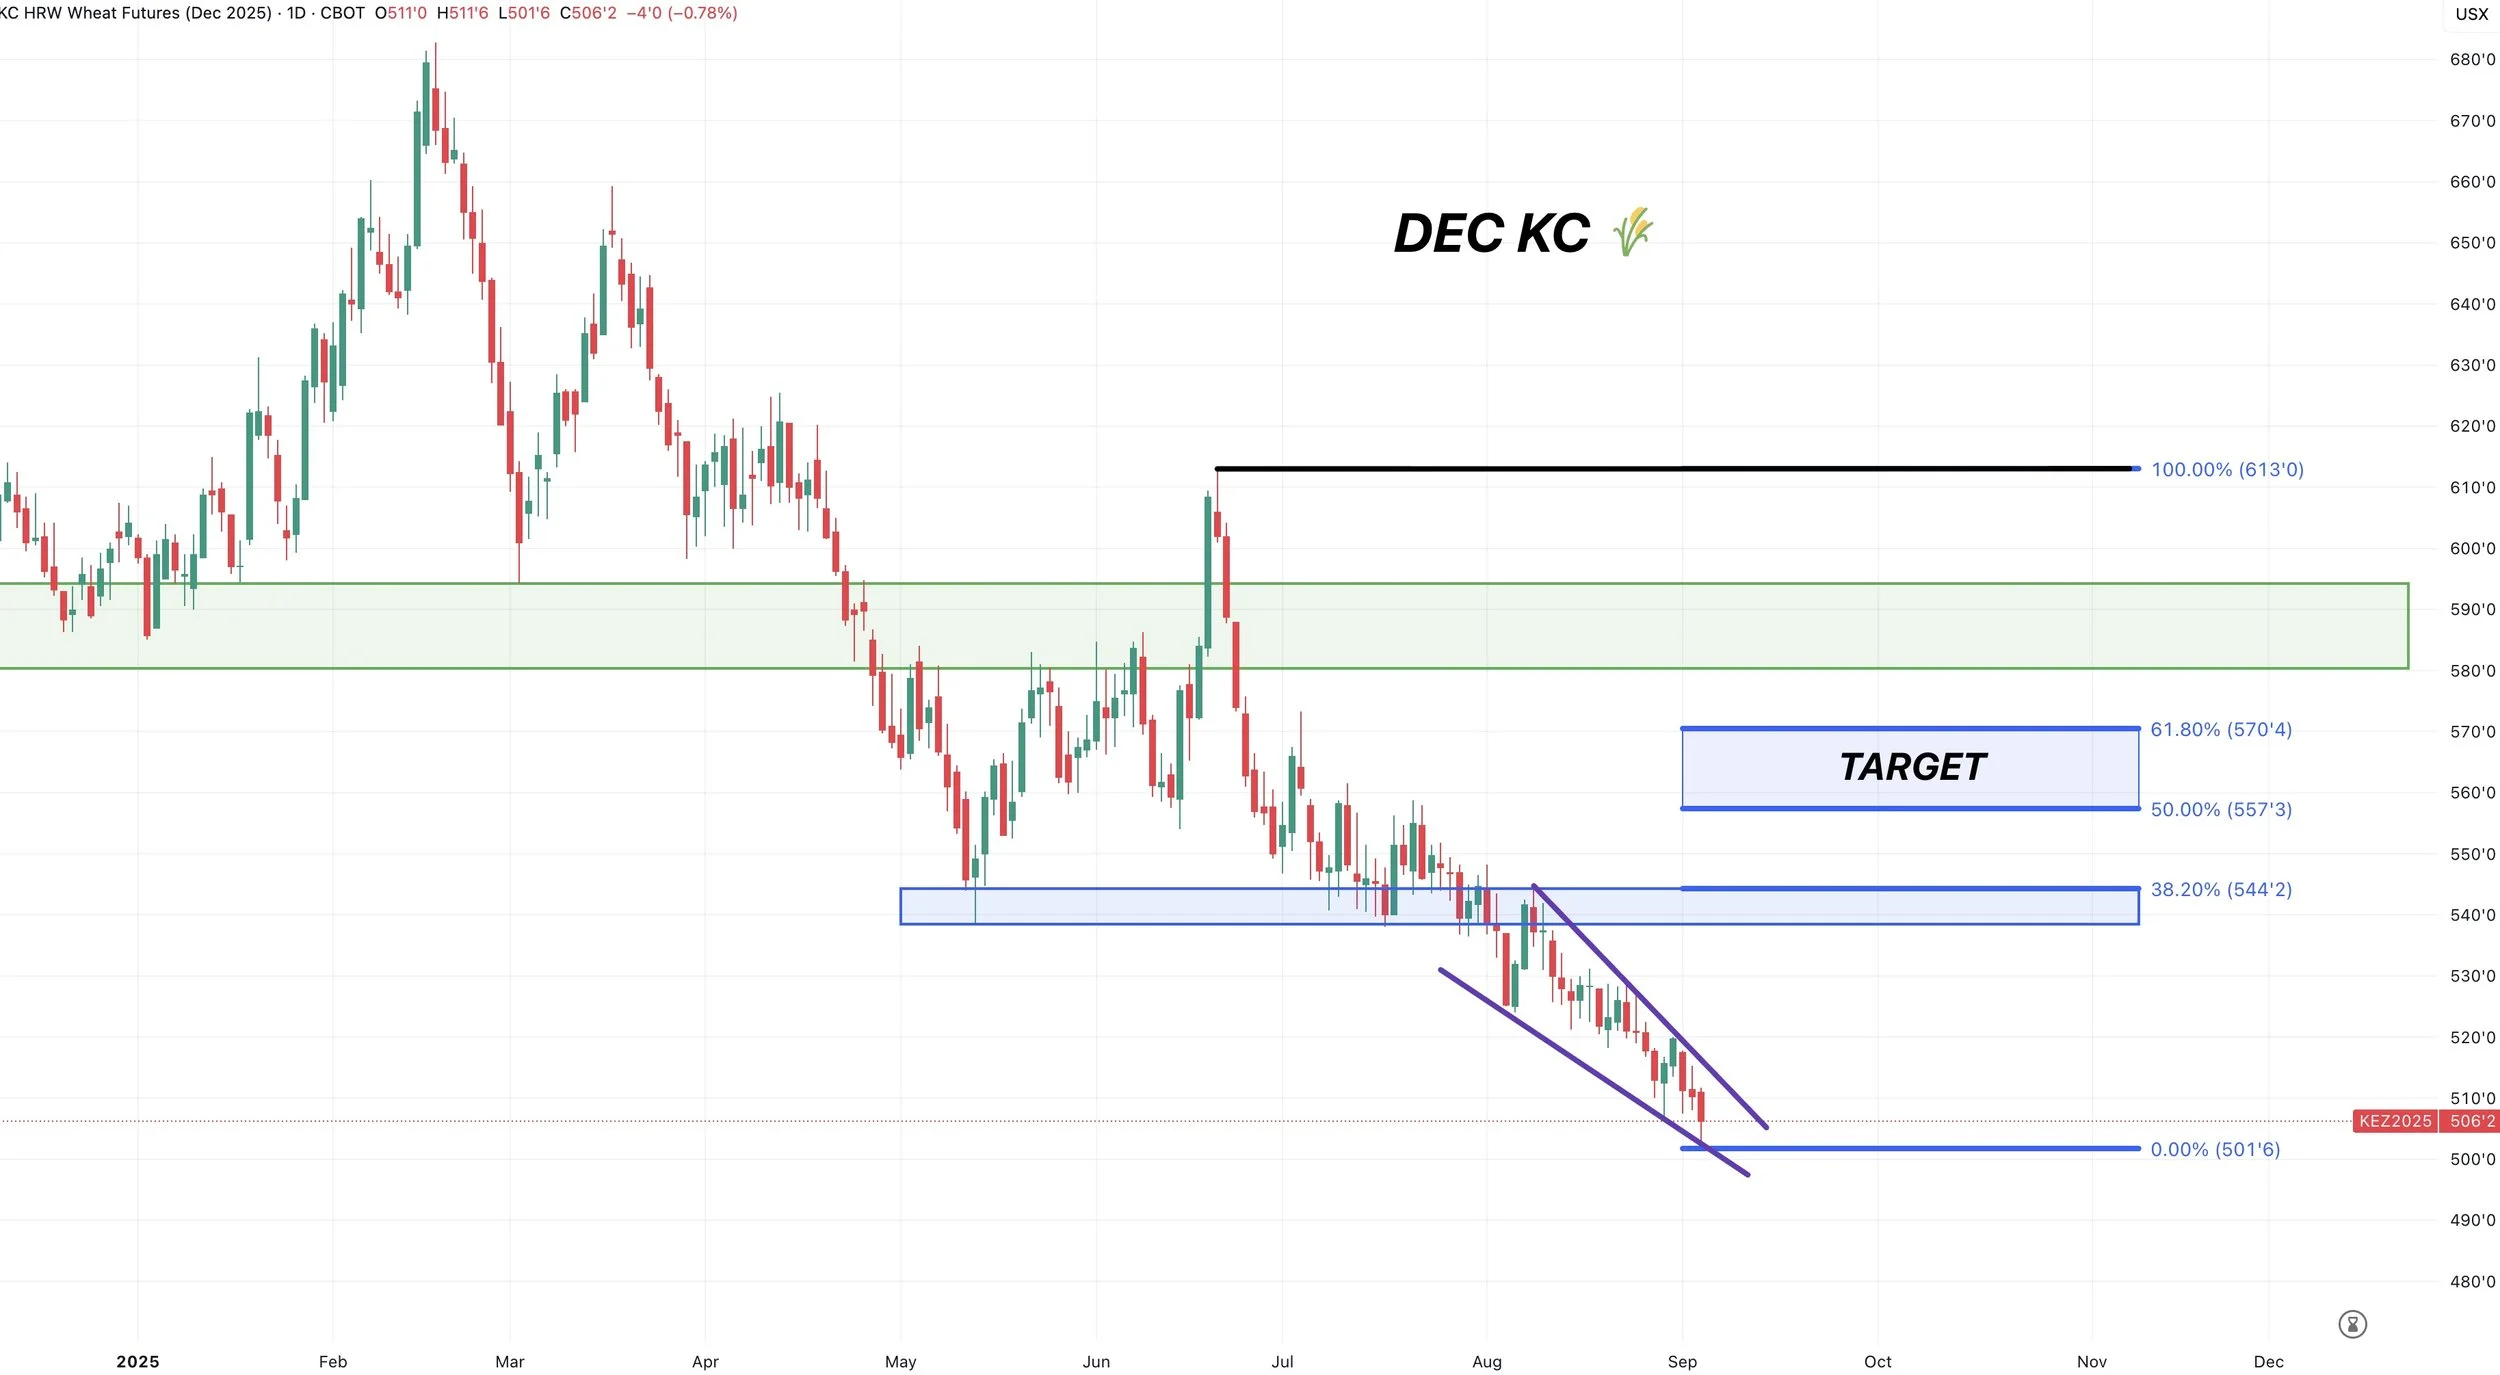
Cattle
Oct Feeder:
We closed lower for 3 days in a row.
This is the first time we have seen this in 3 months.
I do view this as a potential sign our local top is in.
Am I saying the bull market is over? No of course not. But a simple correction shouldn’t come as a surprise.
Nobody knows if this is THE top of just another mini top before the dip gets bought.
We rejected the golden fib extension.
We have not closed below the 20-day MA since June (red line).
If we do, that could open the door lower.
If we head lower, the target is the blue box.
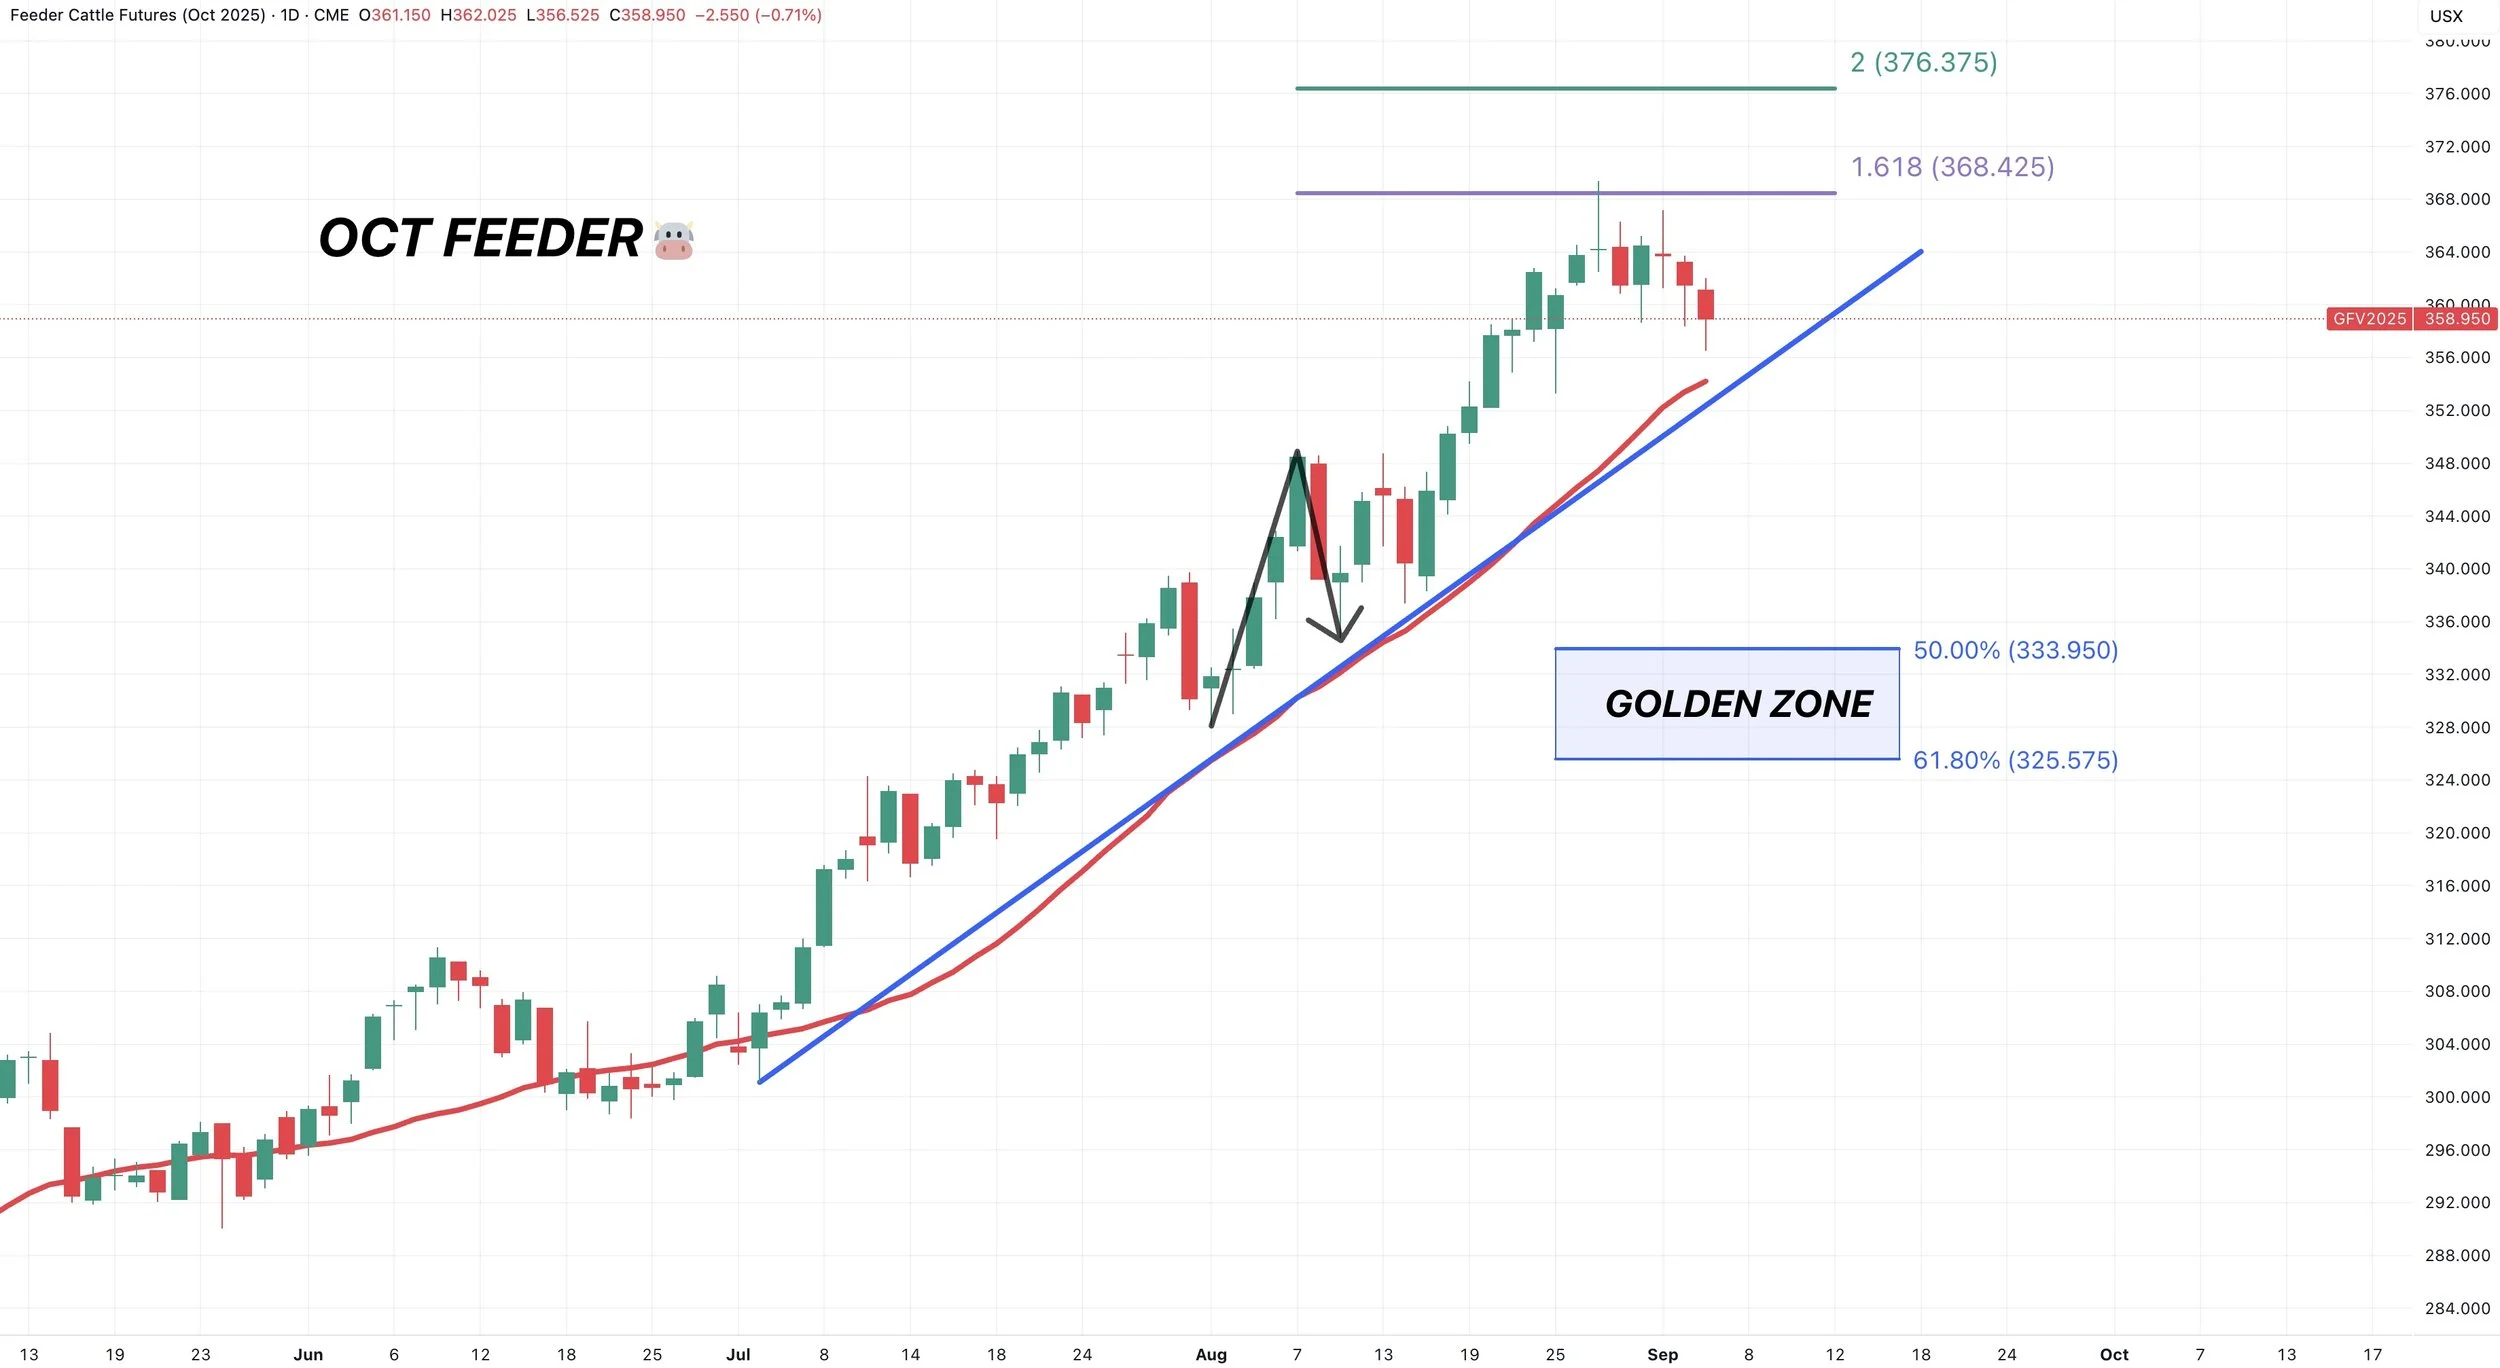
Oct Live:
Also rejected the golden fib.
Downside target if we get a true correction is the blue box.
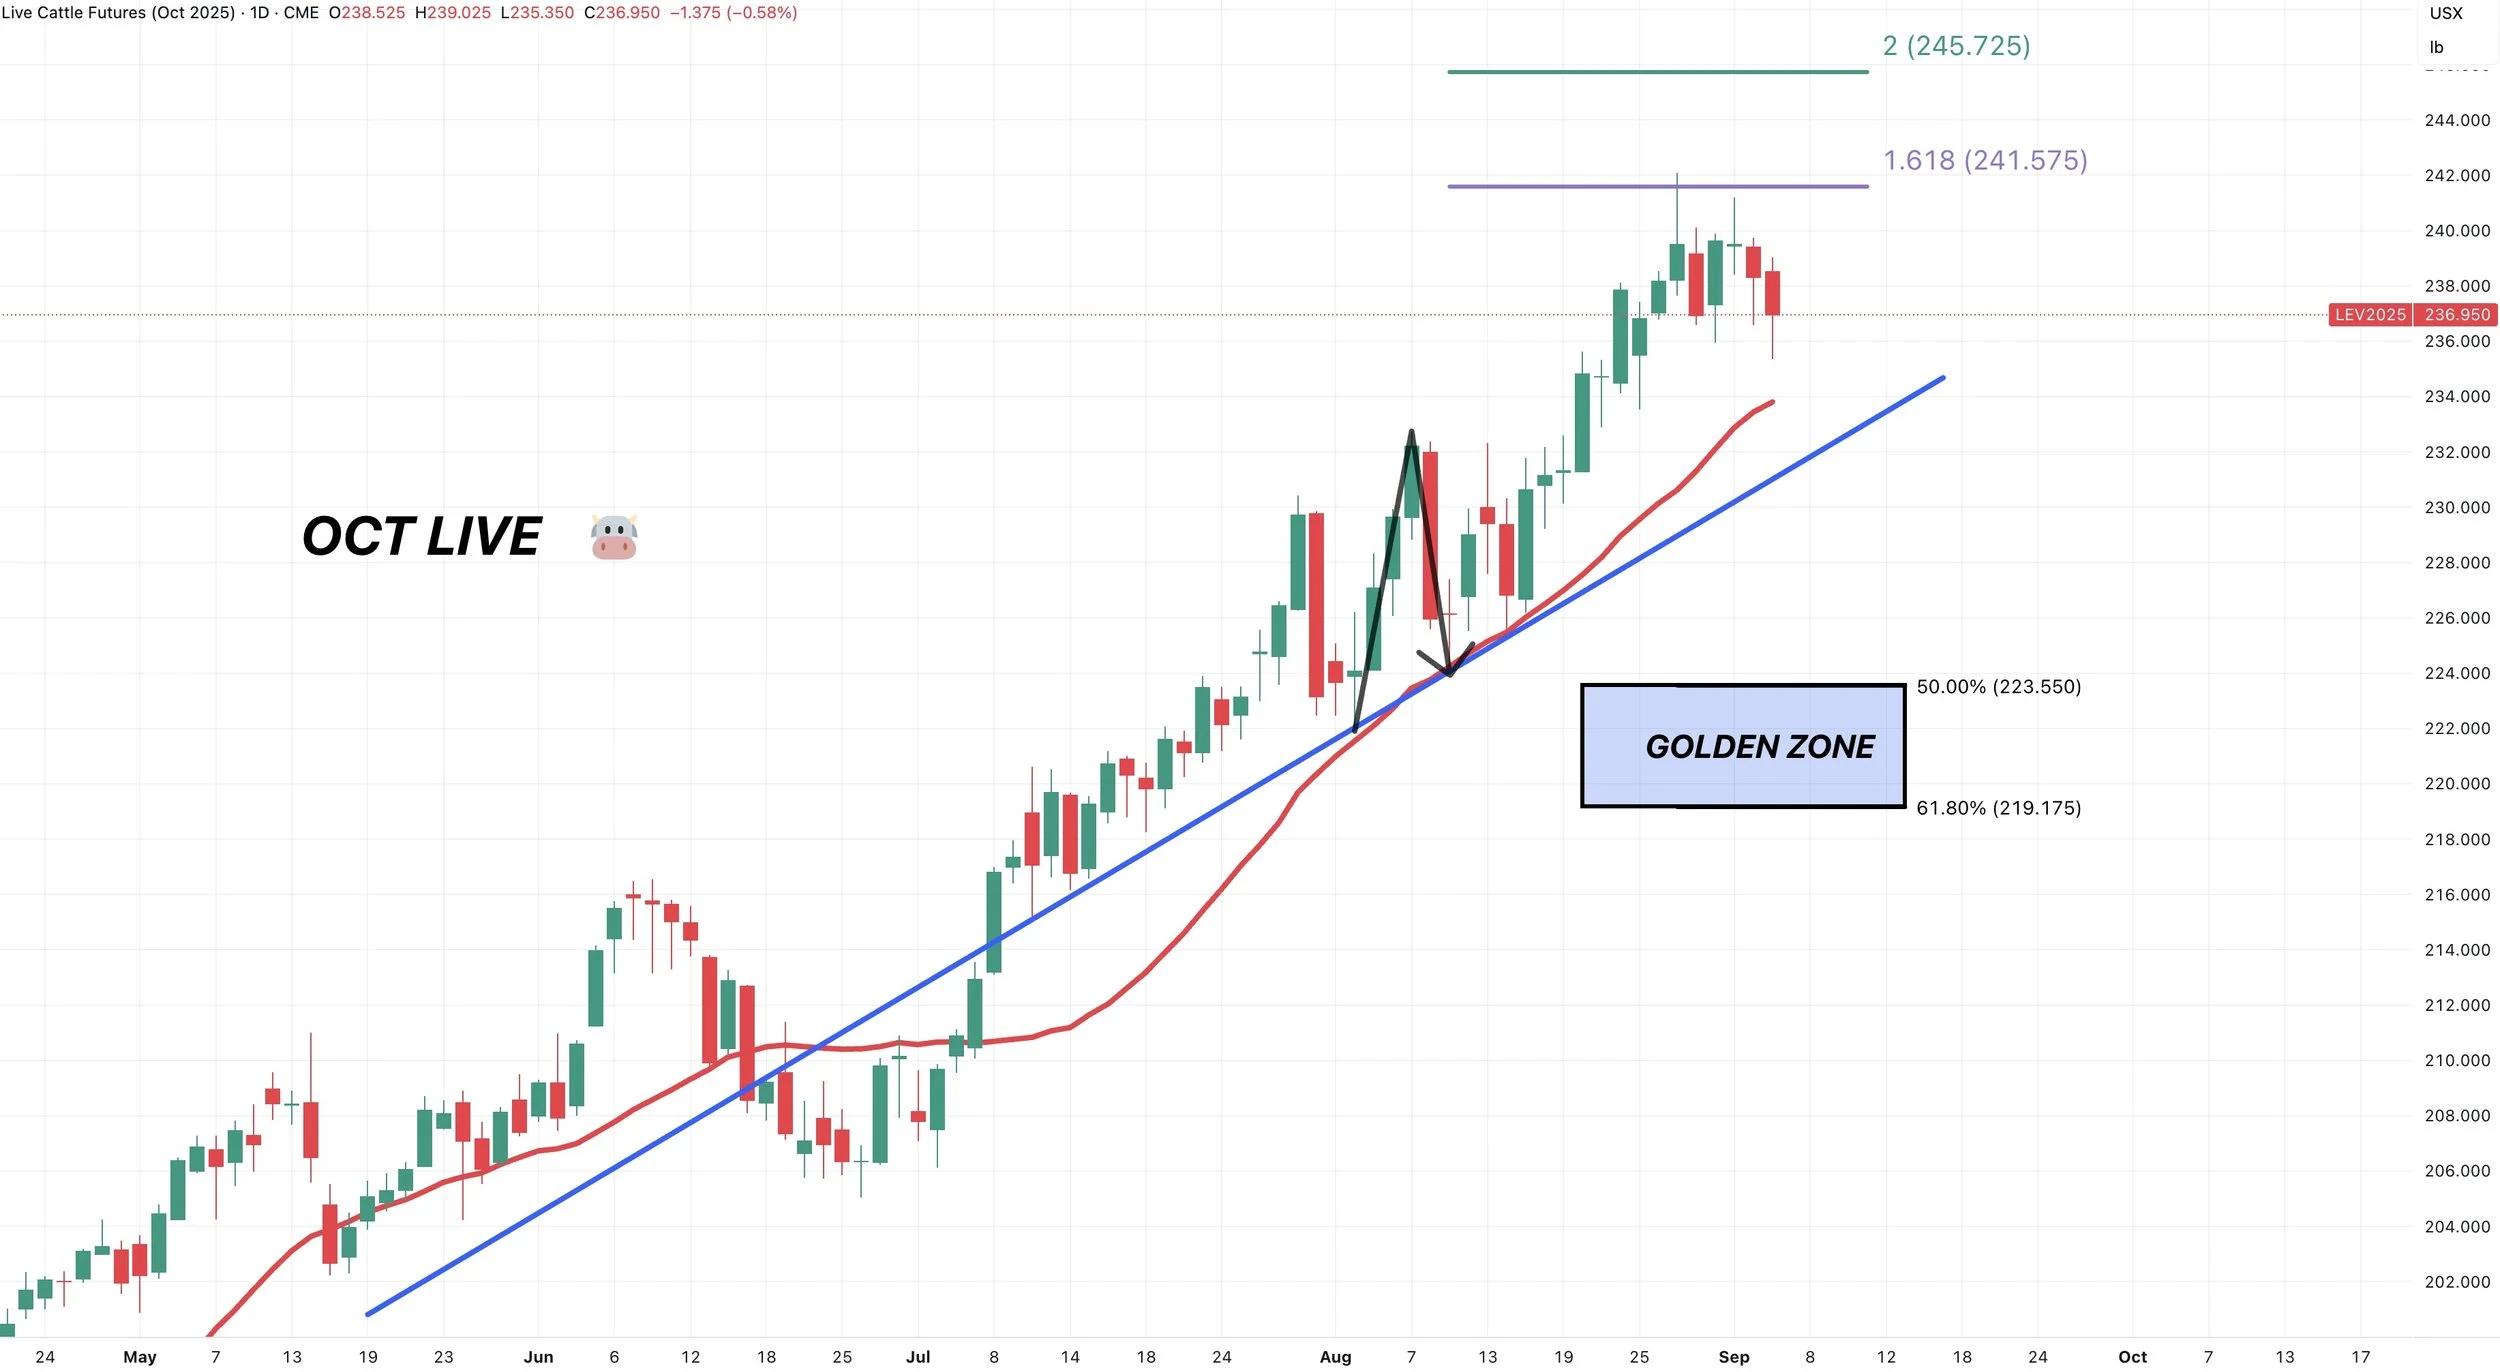
Past Sell or Protection Signals
Aug 22nd: 🌱
Soybean sell signal & hedge alert.
July 31st: 🐮
Cattle sell signal & hedge alert.
July 10th: 🐮
Cattle sell signal & hedge alert.
CLICK HERE TO VIEW
June 5th: 🐮
Cattle sell signal & hedge alert.
June 2nd: 🌾
MPLS wheat sell signal.
April 10th: 🌽
Old crop corn sell signal.
March 19th: 🐮
Cattle hedge & sell signal.
Feb 18th: 🌽 🌾
Old crop KC wheat & old crop corn signal.
Jan 23rd: 🌽 🌱
Corn & beans old crop sell signal.
CLICK HERE TO VIEW
Jan 15th: 🌽 🌱
Corn & beans hedge alert/sell signal.
Jan 2nd: 🐮
Cattle hedge alert at new all-time highs & target.
Dec 11th: 🌽
Corn sell signal at $4.51 200-day MA
CLICK HERE TO VIEW
Oct 2nd: 🌾
Wheat sell signal at $6.12 target
Sep 30th: 🌽
Corn protection signal at $4.23-26
Sep 27th: 🌱
Soybean sell & protection signal at $10.65
Sep 13th: 🌾
Wheat sell signal at $5.98
May 22nd: 🌾
Wheat sell signal when wheat traded +$7.00
Want to Talk?
Our phones are open 24/7 for you guys if you ever need anything or want to discuss your operation.
Hedge Account
Interested in a hedge account? Use the link below to set up an account or shoot Jeremey a call at (605)295-3100.
SEPTEMBER CORN RALLY?
MARKET UPDATE
You can scroll to read the usual update as well. As the written version is the exact same as the video.
Timestamps for video:
Overview: 0:00min
Record Dry August: 0:50min
Funds Buying?: 1:40min
Inflation Play: 2:55min
Corn: 4:10min
Beans: 7:30min
Wheat: 10:55min
Cattle: 12:55min
Want to talk about your situation?
(605)295-3100
Your free trial has ended
Make sure you subscribe if you’d like future access to our daily updates & our next sell signal.
Here is extended access to our Labor Day sale since you were on a trial.
Futures Prices Close
Overview
Following Friday's stellar performance, grains (outside of corn) start off September on a sour note after the 3-day weekend.
Soybeans & wheat struggled while corn battled and rallied +9 cents off it's early day lows.
On Friday, Dec corn posted its strongest daily gain since July 2nd.
Many are speculating about a rumor that China is buying US corn, and that was the reason for the strength on Friday. I would call this rumor completely false. When China buys corn, the market will probably know.
Friday's strength was a combination of several factors. It was the end of the month position squaring. First notice day pressure was out of the way.
We just had one of the driest August's on record which brings in yield uncertainty given that the USDA just gave us a 188.8 corn yield and 53.6 bean yield a few weeks ago.
Record Dry August
This August was one of the driest ever.
You can throw those 188.8 and 53.6 yield projections out the window in my opinion.
The entire state of Ohio saw it's driest August ever.
Indiana saw a top 5 driest August in 133 years.
Even the bottom 2/3rds of Illinois saw a top 5 driest August ever.
You cannot tell me these crops aren’t getting smaller.
Not to mention the the possible rust issues, pollination issues, hot nights in July etc.
The majority of this summer was ideal weather. Last year we saw the same thing. We had great potential only for it to be hindered by a dry finish.
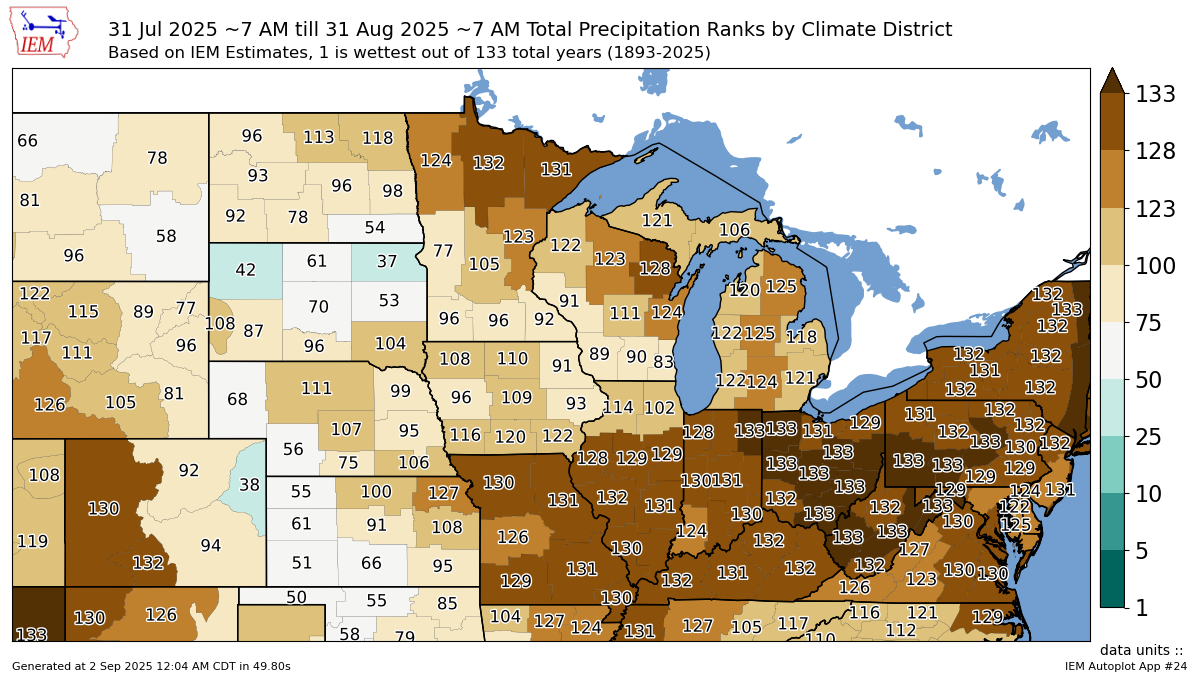
Here is the forecast for the next 7 days.
Still remains pretty dry for most regions.
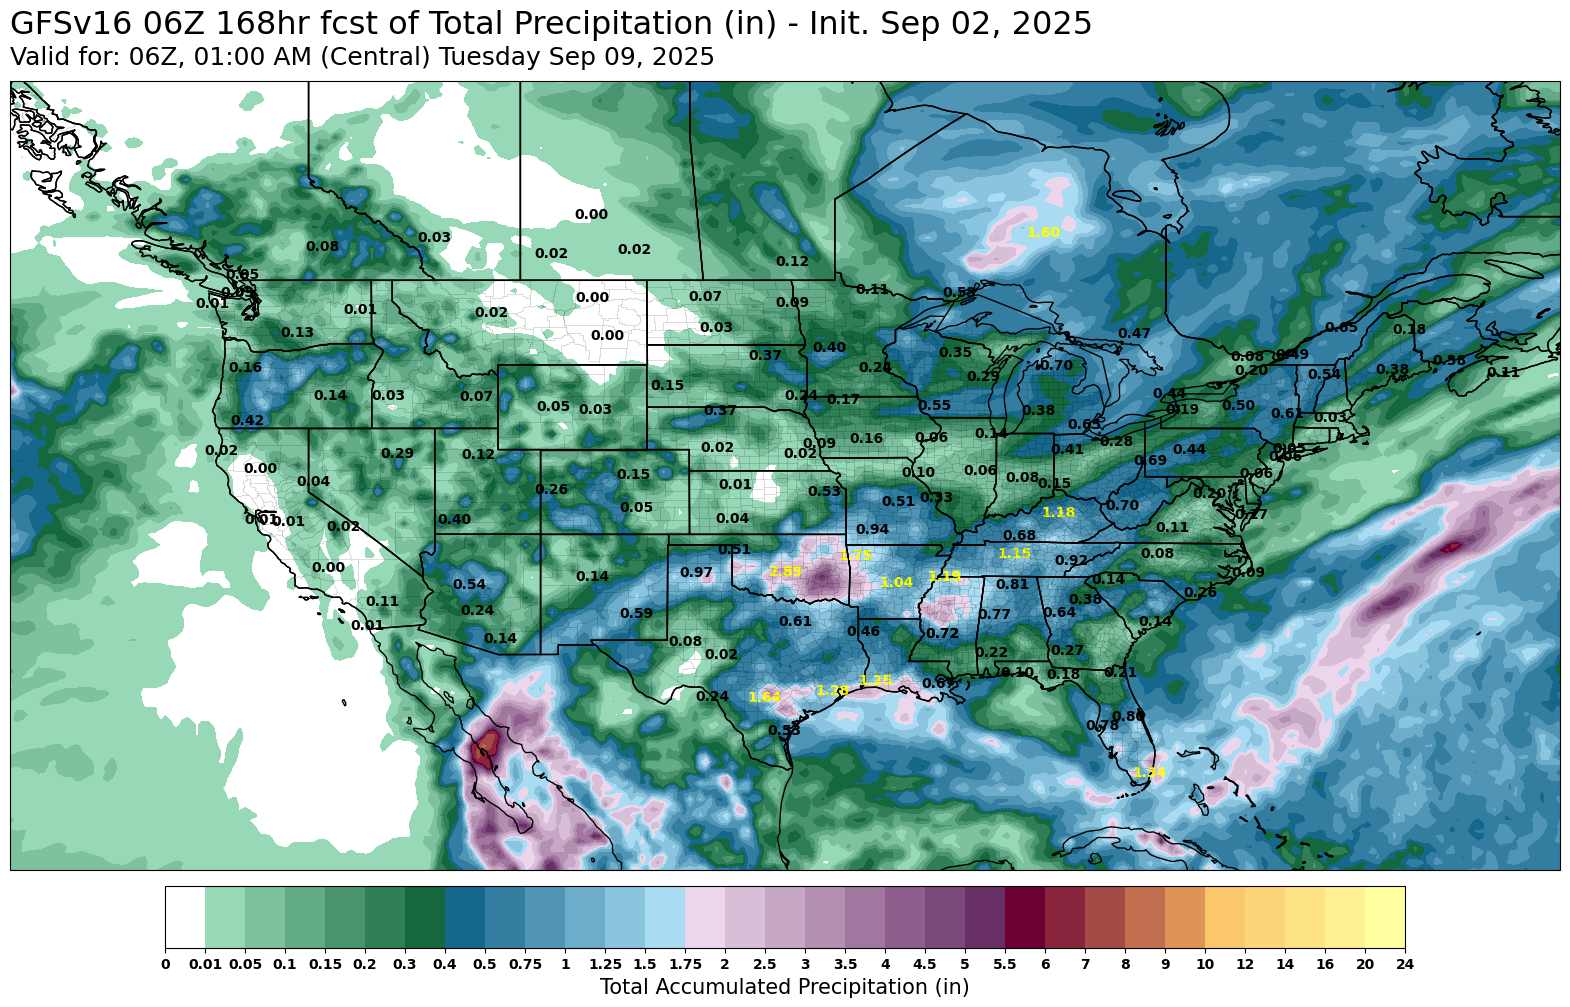
Are Funds Buying?
Corn
The funds have consistently been buying corn since July.
This is the first time we have seen consistent buying since all the way back in January.

Let's look at their actual short vs long positions.
This is not short covering we are seeing in the corn market.
It is actually more people opening up long positions.
Shorts aren’t scared yet, but some see potential in being long.
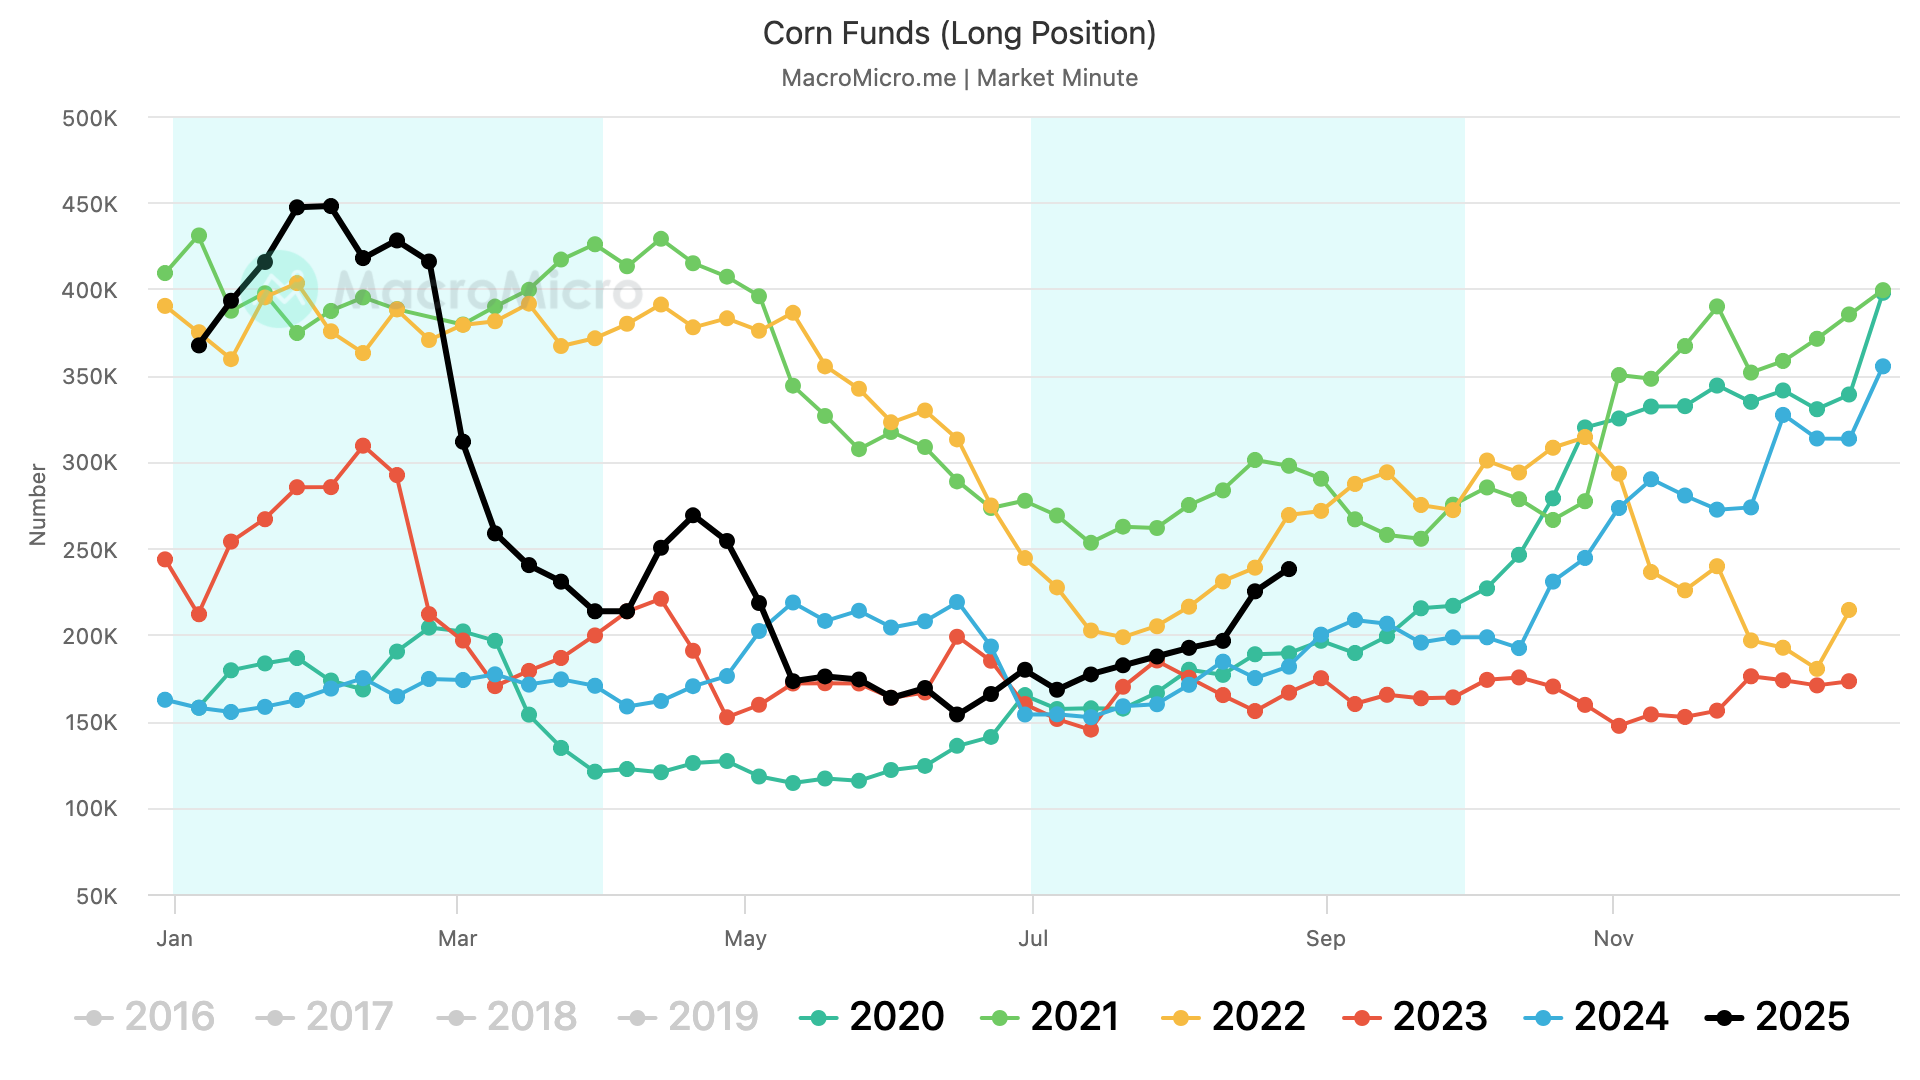

Beans
The funds have bought for 3 straight weeks in a row now.
Pretty much the most consistent buying we've seen since last fall.

Unlike corn, this entire move from the funds is entirely short covering.
Short positions in beans have plummeted, meanwhile long positions haven’t moved an inch.
Basically, there is more fear is being short this market.


Bean Meal
The funds have been short covering this market like crazy for the last month.
Just 3 weeks ago they had held their largest short position of all-time.
We are now seeing short covering and funds hit the exit door.

Wheat
The funds just starting buying again for the first time since June.
After shorting this market the entire month of August.

Interest Rates & Inflation Play
I haven’t talked about this in a while, but if you've been following along I've been talking about this for months.
The argument that perhaps the funds don’t truly get behind this market until they are confident that rates will be cut.
In a nutshell:
Rate cuts lead to higher inflation. Which usually leads to more expensive commodities.
Rate hikes lead to lower inflation. Which usually leads to cheaper commodities.
Here is a chart that shows rate cuts, rate hikes, inflation, and corn & soybeans prices.
On a big picture scale, we tend to follow inflation higher or lower.
The last rate hikes we saw were back in 2022. They marked the top in the bull market for corn and beans.
The first rate cuts we saw since 2020 happened last fall. Which happened right before the most sustained rally the corn market has seen this entire bear market.
If you notice, inflation has started to pick back up the past few months.
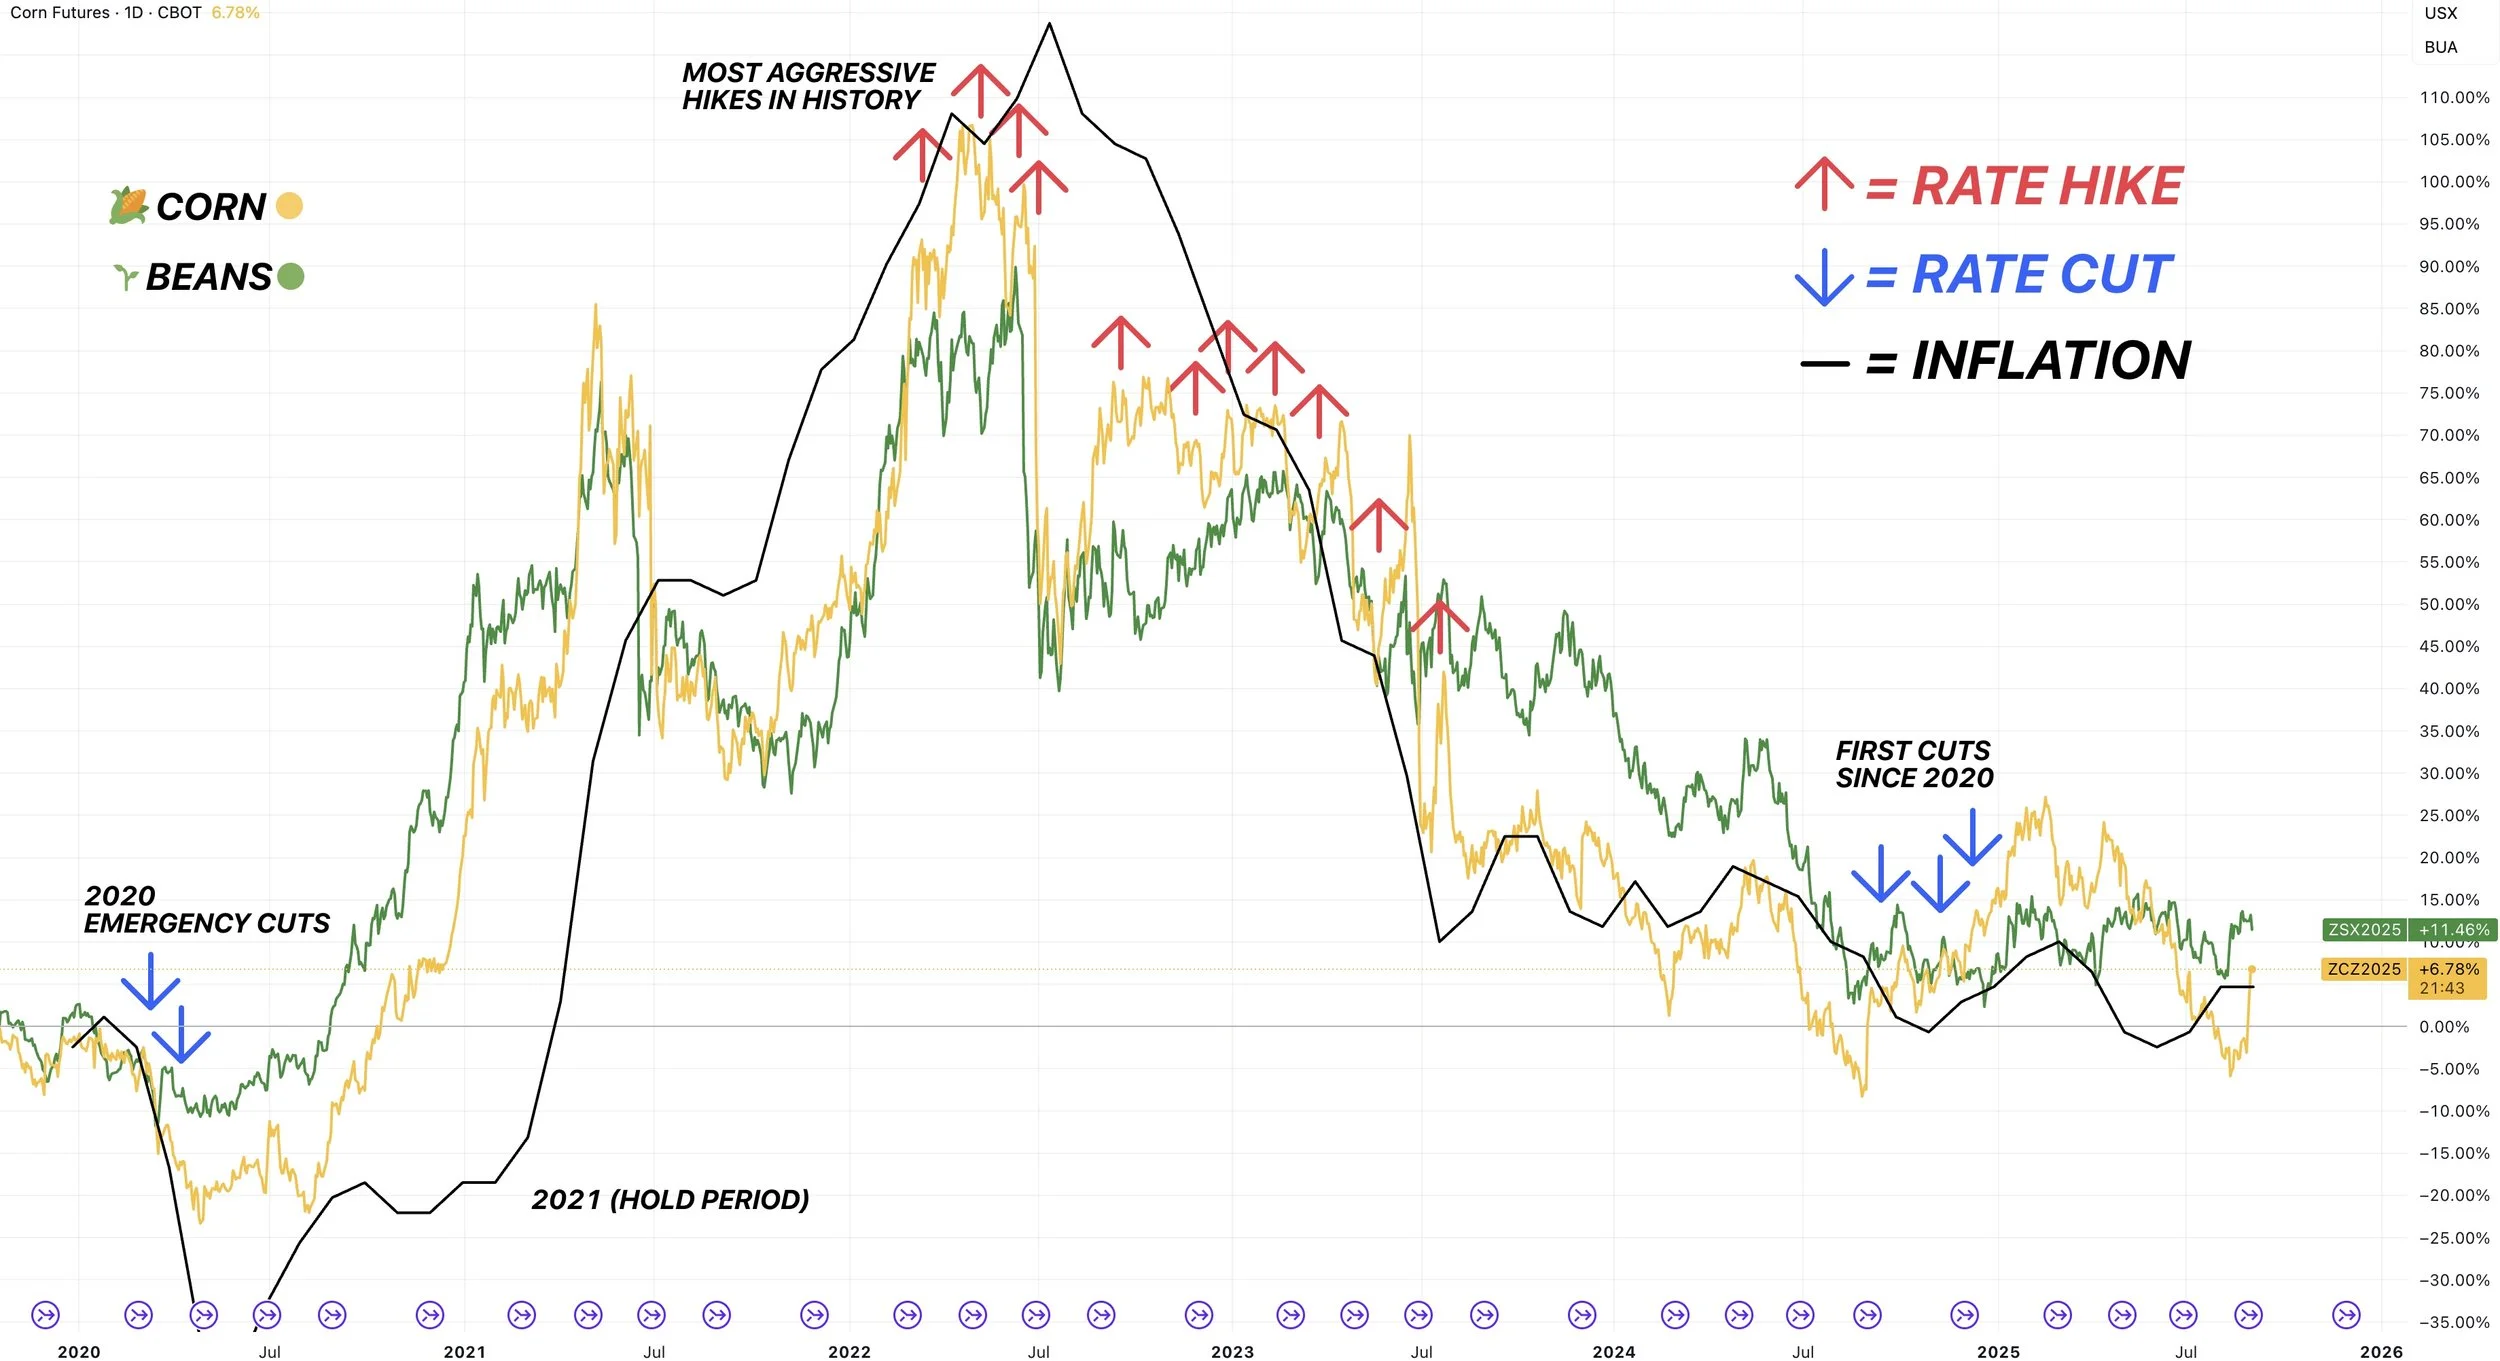
According to the betting markets, there is an 86% chance for rate cuts in September.
I could very easily see a scenario like last year pan out.
The funds are starting to buy at the exact same time they did last year.
Interest rate cuts are coming just like what we saw last fall.

Today's Main Takeaways
Corn
September Rally in Corn?
How often does the corn market rally through out the month of September?
First, here is the 10-year seasonal.
Normally, this market has pretty much bottomed on September 1st and rallied through October 1st the past decade.
I don’t think it's a coincidence that this rally is just in time for fall insurance pricing.
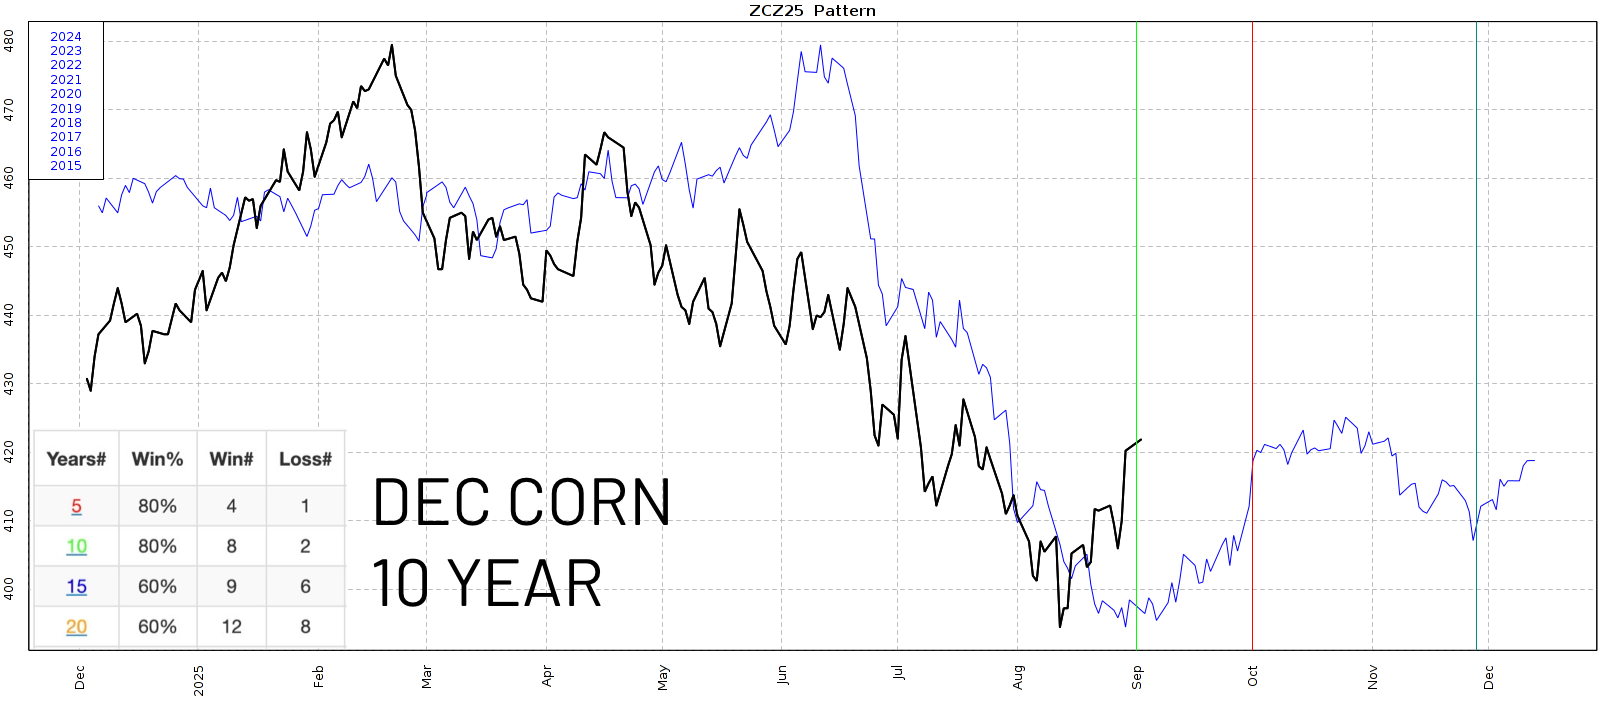
Now here is the data for corn's performance in September.
We have traded higher in September the past 8 of 10 years.
Higher the past 4 of 5 years.
The only two years we did not trade higher were 2023 and 2018.
Average rally is +18 cents.
Average loss is -4 cents.
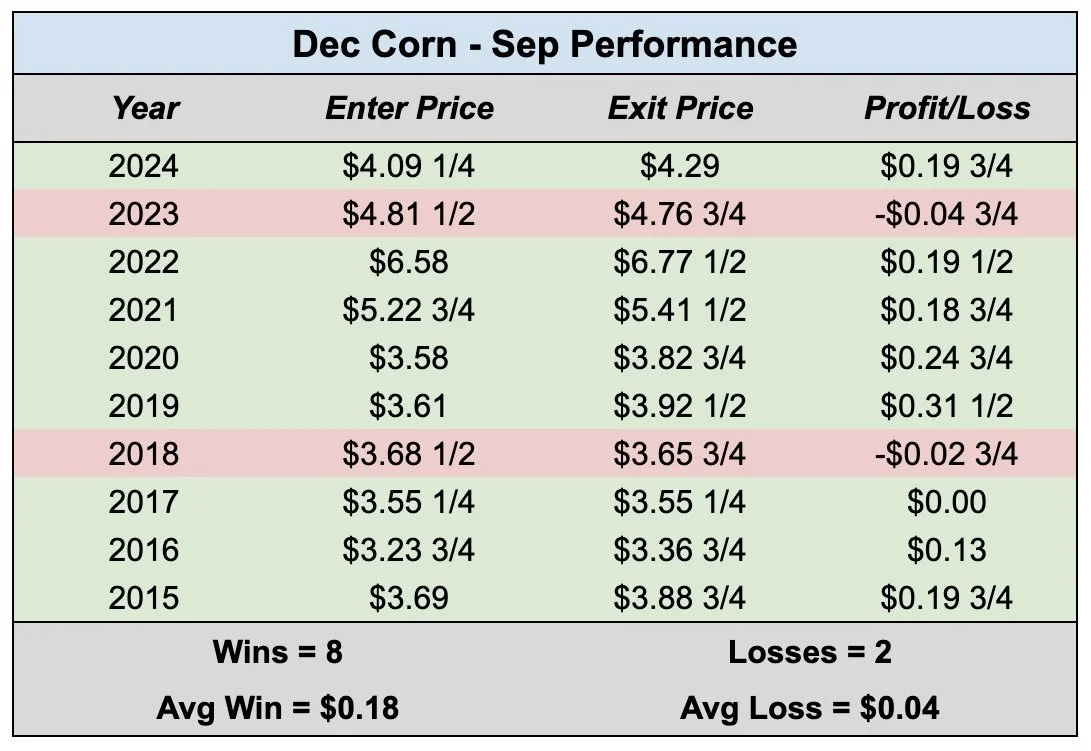
The 5 year seasonal here is pretty interesting.
We bottomed exactly where it had us bottoming.
On average the past 5 years, we continue to climb higher throughout the end of the year.
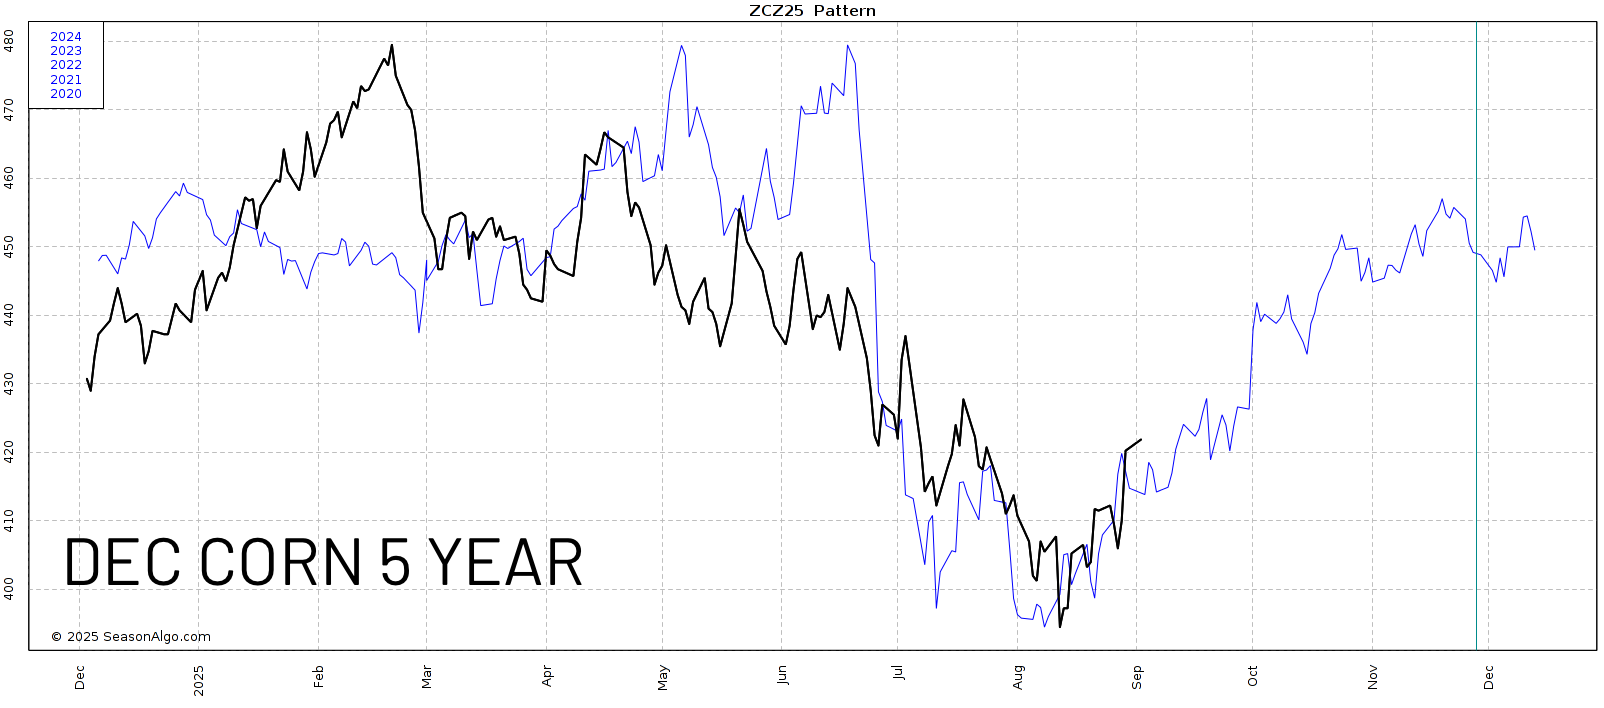
The crop is getting smaller. Demand remains at historically great levels.
I'd like to think most dips get bought in the corn market until at least the USDA report.
Because I'm sure there are plenty of traders who are curious to see where yield comes in at before getting more bearish than they were a few weeks ago, given that there is zero chance yield gets bigger.
Yield is getting smaller. But whether yield is 185 or 180 is anyone's guess.
The massive 97 million acres of corn is going to make a huge rally tough and limit our upside unless yield is closer to 180. Because even if yield only slips a little bit, we are still going to have record production.
Given that the USDA also has some giant demand projections, there is some wiggle room for them to knock demand lower if production gets adjusted lower as well.
Regardless, I do think there is a very solid chance we have printed our harvest lows, which I'll explain in the charts.
Daily Dec Chart:
We closed above the 61.8% retracement up to those mid-July highs (red box).
What does this mean?
It tells us that this rally off contract lows is seen as more than just a correction bounce. It has some impulse to it.
Which makes me believe the harvest lows are in.
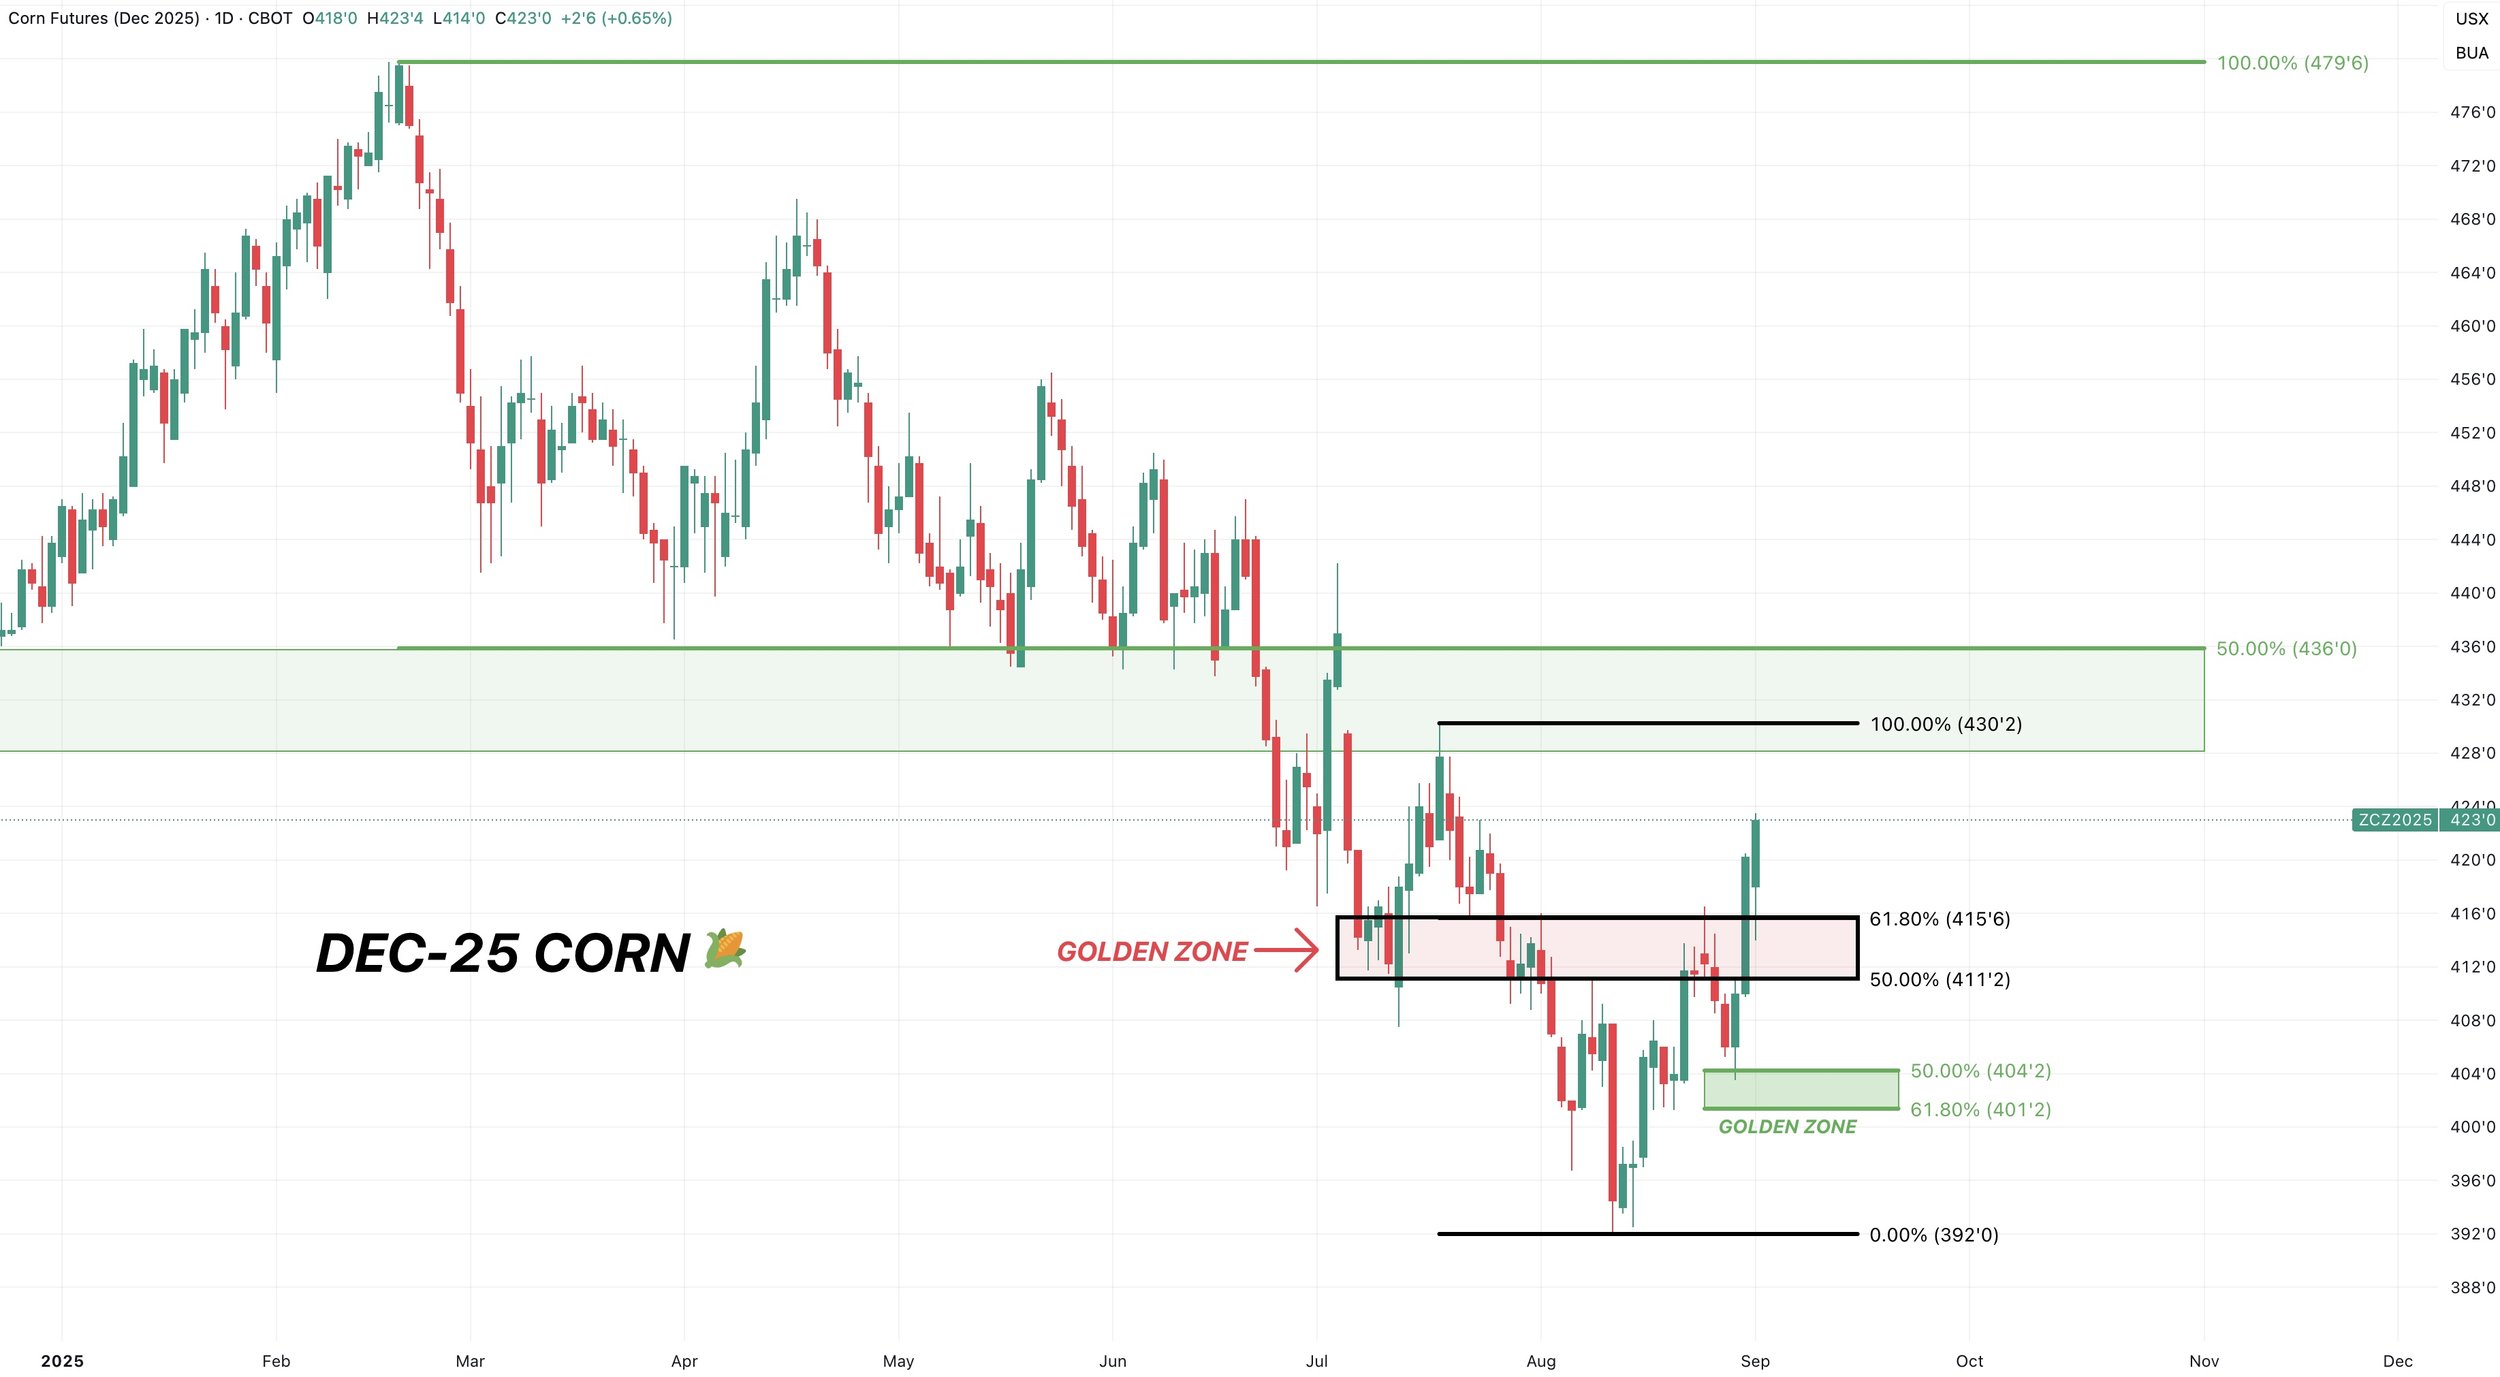
Now what?
We are potentially busting above this downward trend from April.
We rejected off this simple line several times since then.
This could spark a leg higher and get some momentum behind this market, if we break out.
I'd say we need one more day higher to confirm we're breaking out.

Target:
How high?
I am eyeing the $4.35 level.
That is where I would look to de-risk.
Not only is it old support from spring (now resistance).
This level also claws back 50% of the highs from February.

Monthly Chart:
This is a phenomenal looking chart.
We posted a hammer candle last month.
Which is viewed as a bullish sign if you see follow through to the upside.
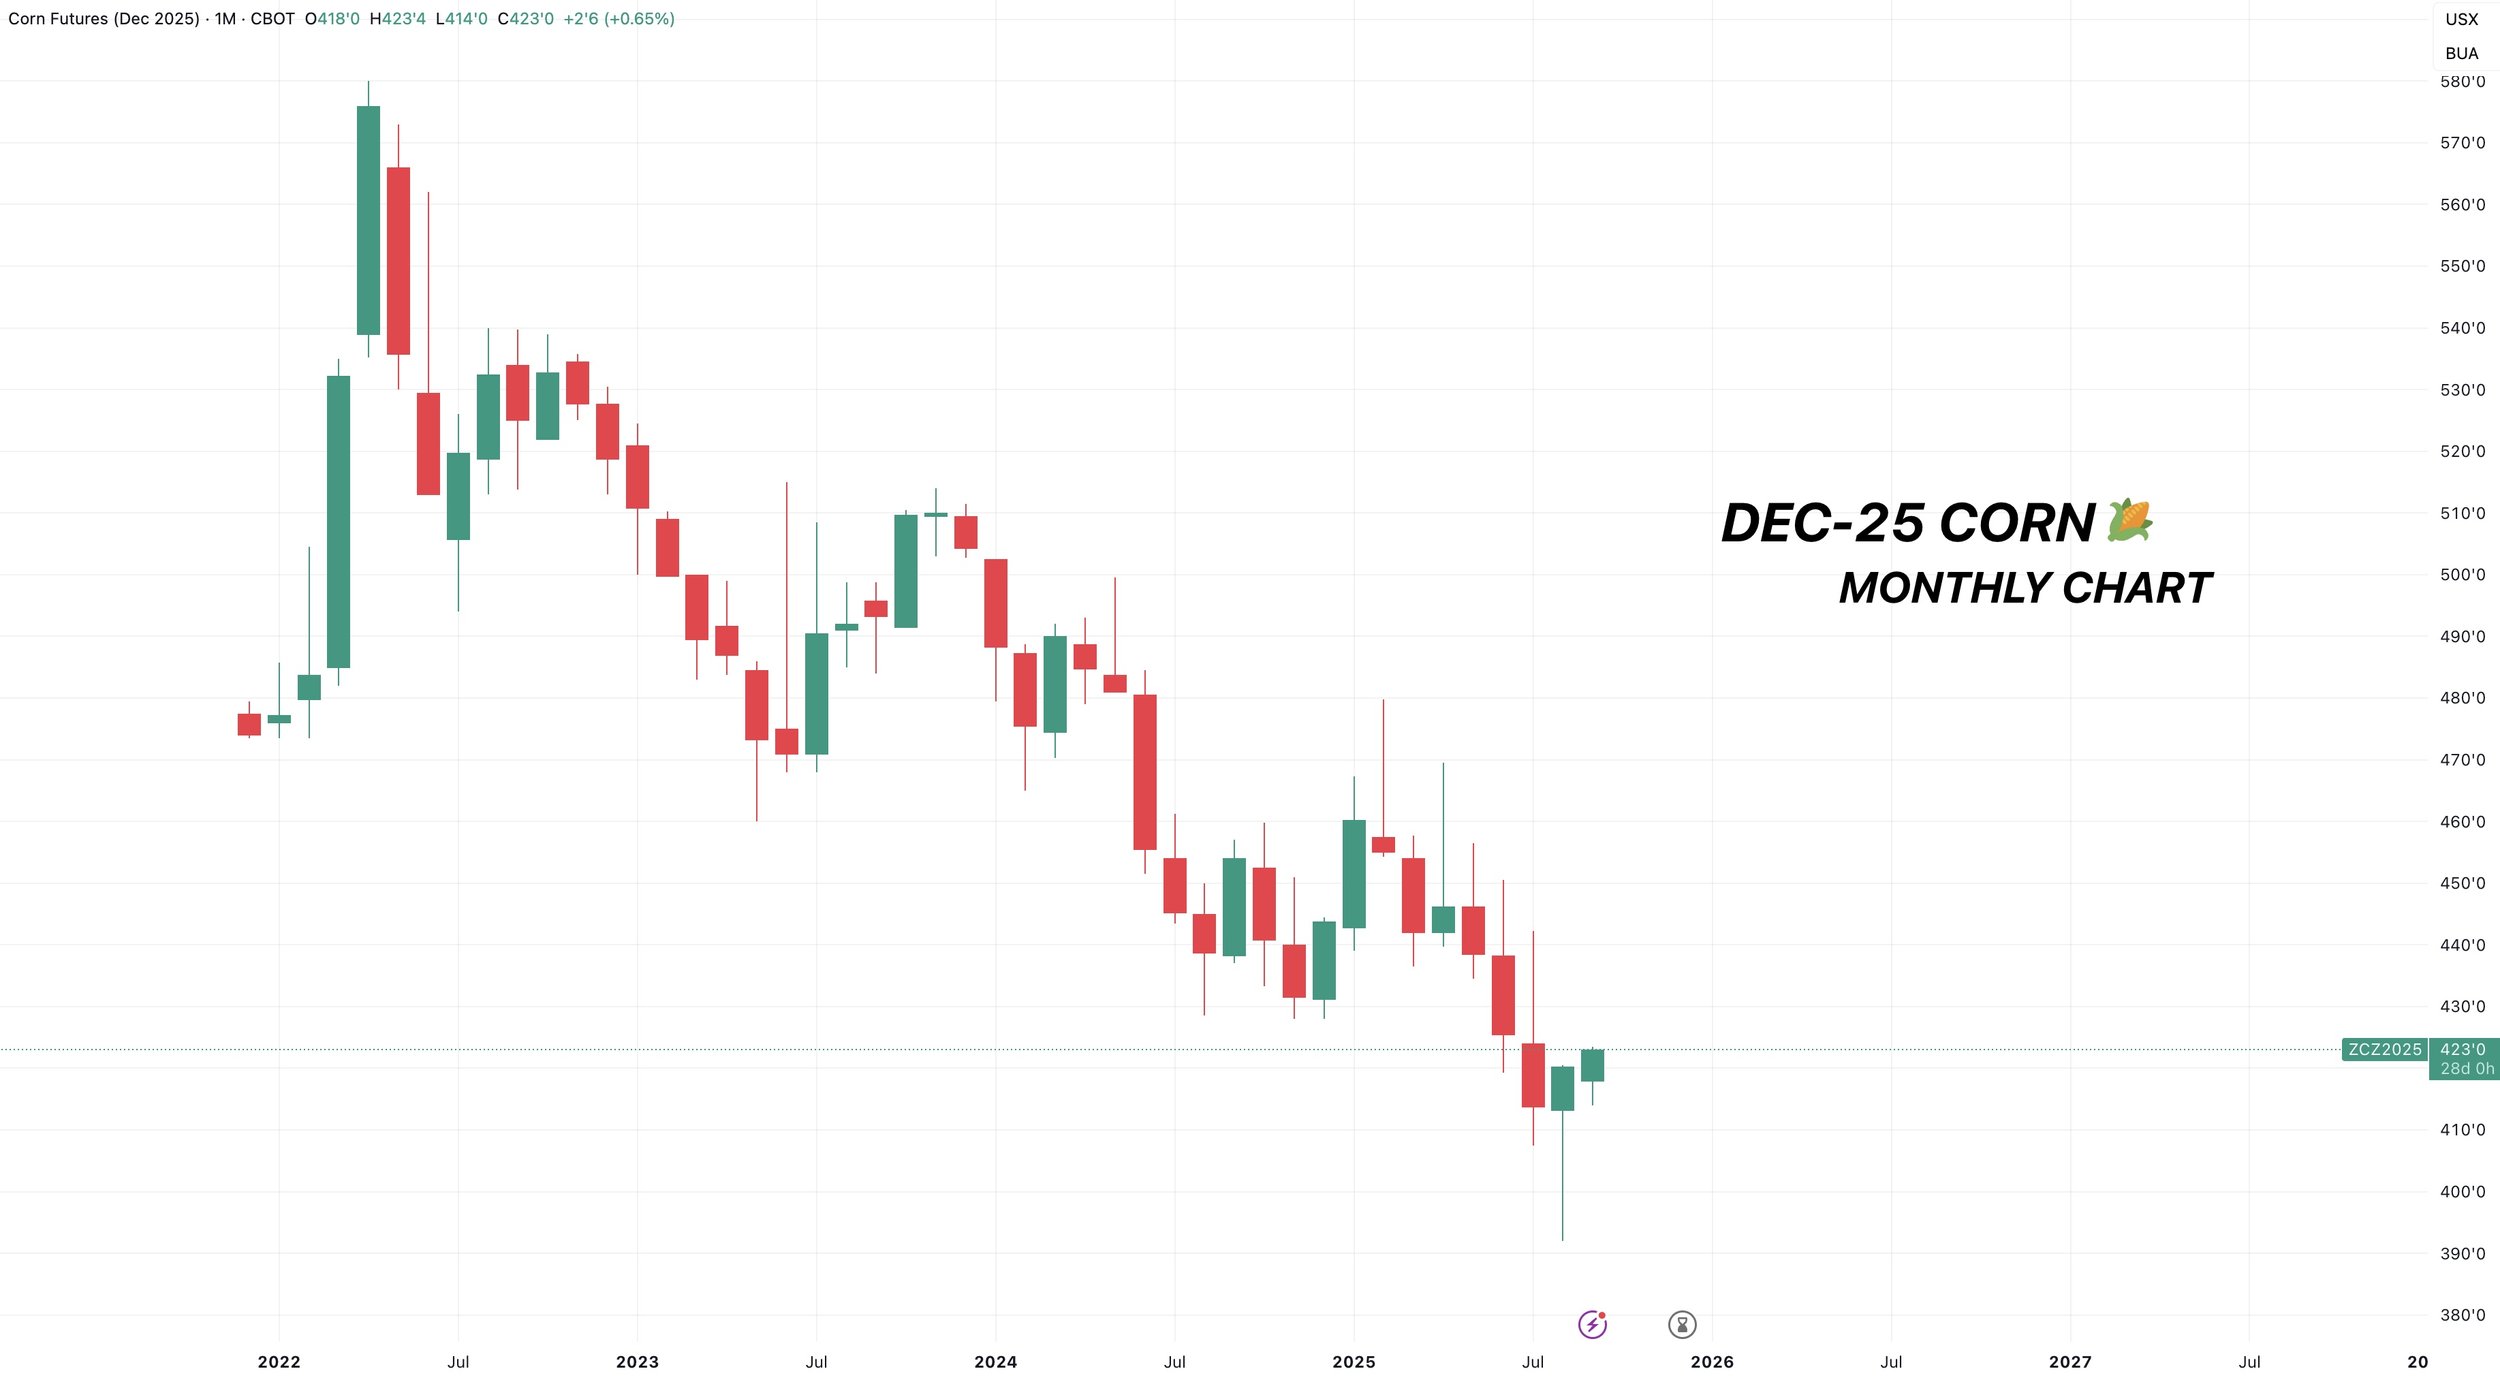
Soybeans
After market close today, soybean crop conditions came in at 65% rated G/E.
Last week we were at 69% and the trade was expecting 68%.
So a pretty big swing from last week and a surprise lower.
Maybe the record dry August is starting to show up.
You'd like to think this might spark some interest.
The soybean crop isn’t getting bigger.
August is where beans are made.
One of the driest August's on record doesn’t scream a near 54 bpa yield to me.
Soybeans have a ton of upside "potential" because the room for error on the balance sheet is razor thin.
I'm not going to get too into this today as we've went over this a thousand times.
Acres are the 2nd lowest in a decade.
This is why the balance sheet has a pathway to become incredibly tight.
But even if yield came in at 54 bpa our carryout would still be lower than last year due to the drastically small acres (without changing demand).
We've never seen a 52 bpa yield. Even if yield slipped down to 52 our carryout would drop to the lowest levels in a decade.
That is why there is "potential" for this market.
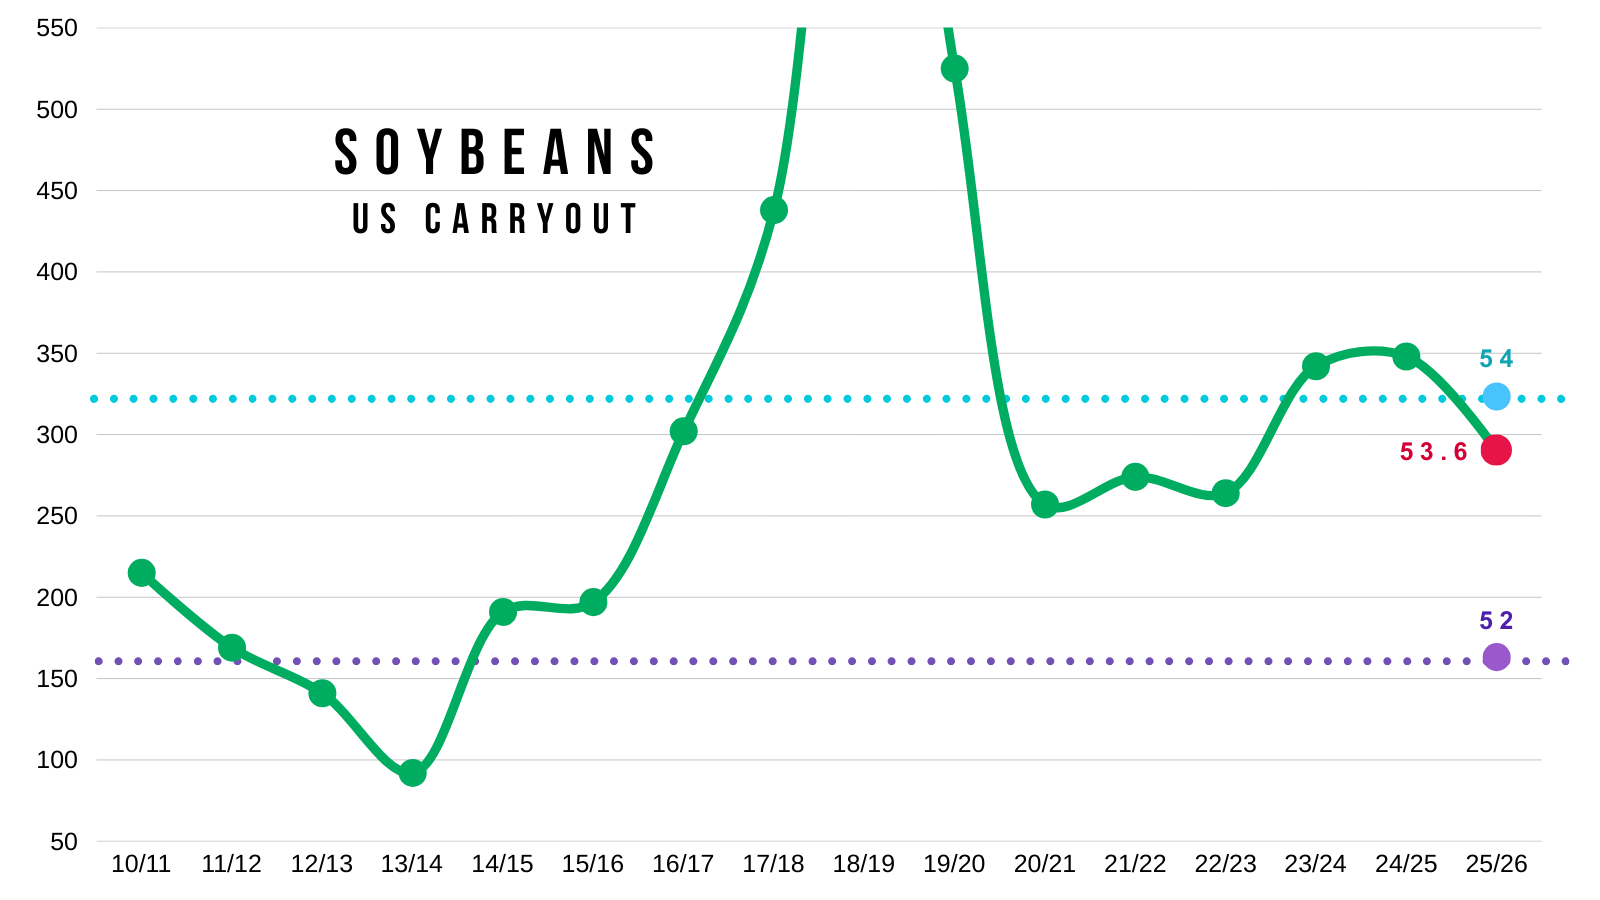
Now.. on the other hand.. none of this matters if our demand get's destoryed.
We need to sell some soybeans to China or this market could be in trouble.
Exports to China account for roughly 20% of all demand on our balance sheet. Without them, even if we have a crop failure we could still swim in beans.
But, I do think they eventually come to the table. If they do.. you can only imagine what reaction prices are going to have.
Given how tight the US balance sheet is. Instead of saying "what if China doesn’t show up" you could start asking yourself "what if China shows up".
Daily Nov Chart:
Soybeans at a crucial spot here.
We closed just above the 61.8% retracement of the recent rally.
We need to hold here or it opens the door lower. Because a bounce here will let us know if this is simply a small standard correction, or something bigger.
We should know soon.
The big picture structure of this chart remains bullish as long as we hold $10.12. Realistically we could fall all the way down there and still be completely fine.

Next Target:
We had a sell signal two Fridays ago at the highs.
My next target is still going to be $10.82 as of now.
Targets don’t have to hit. They are there to let you know to de-risk if they do.
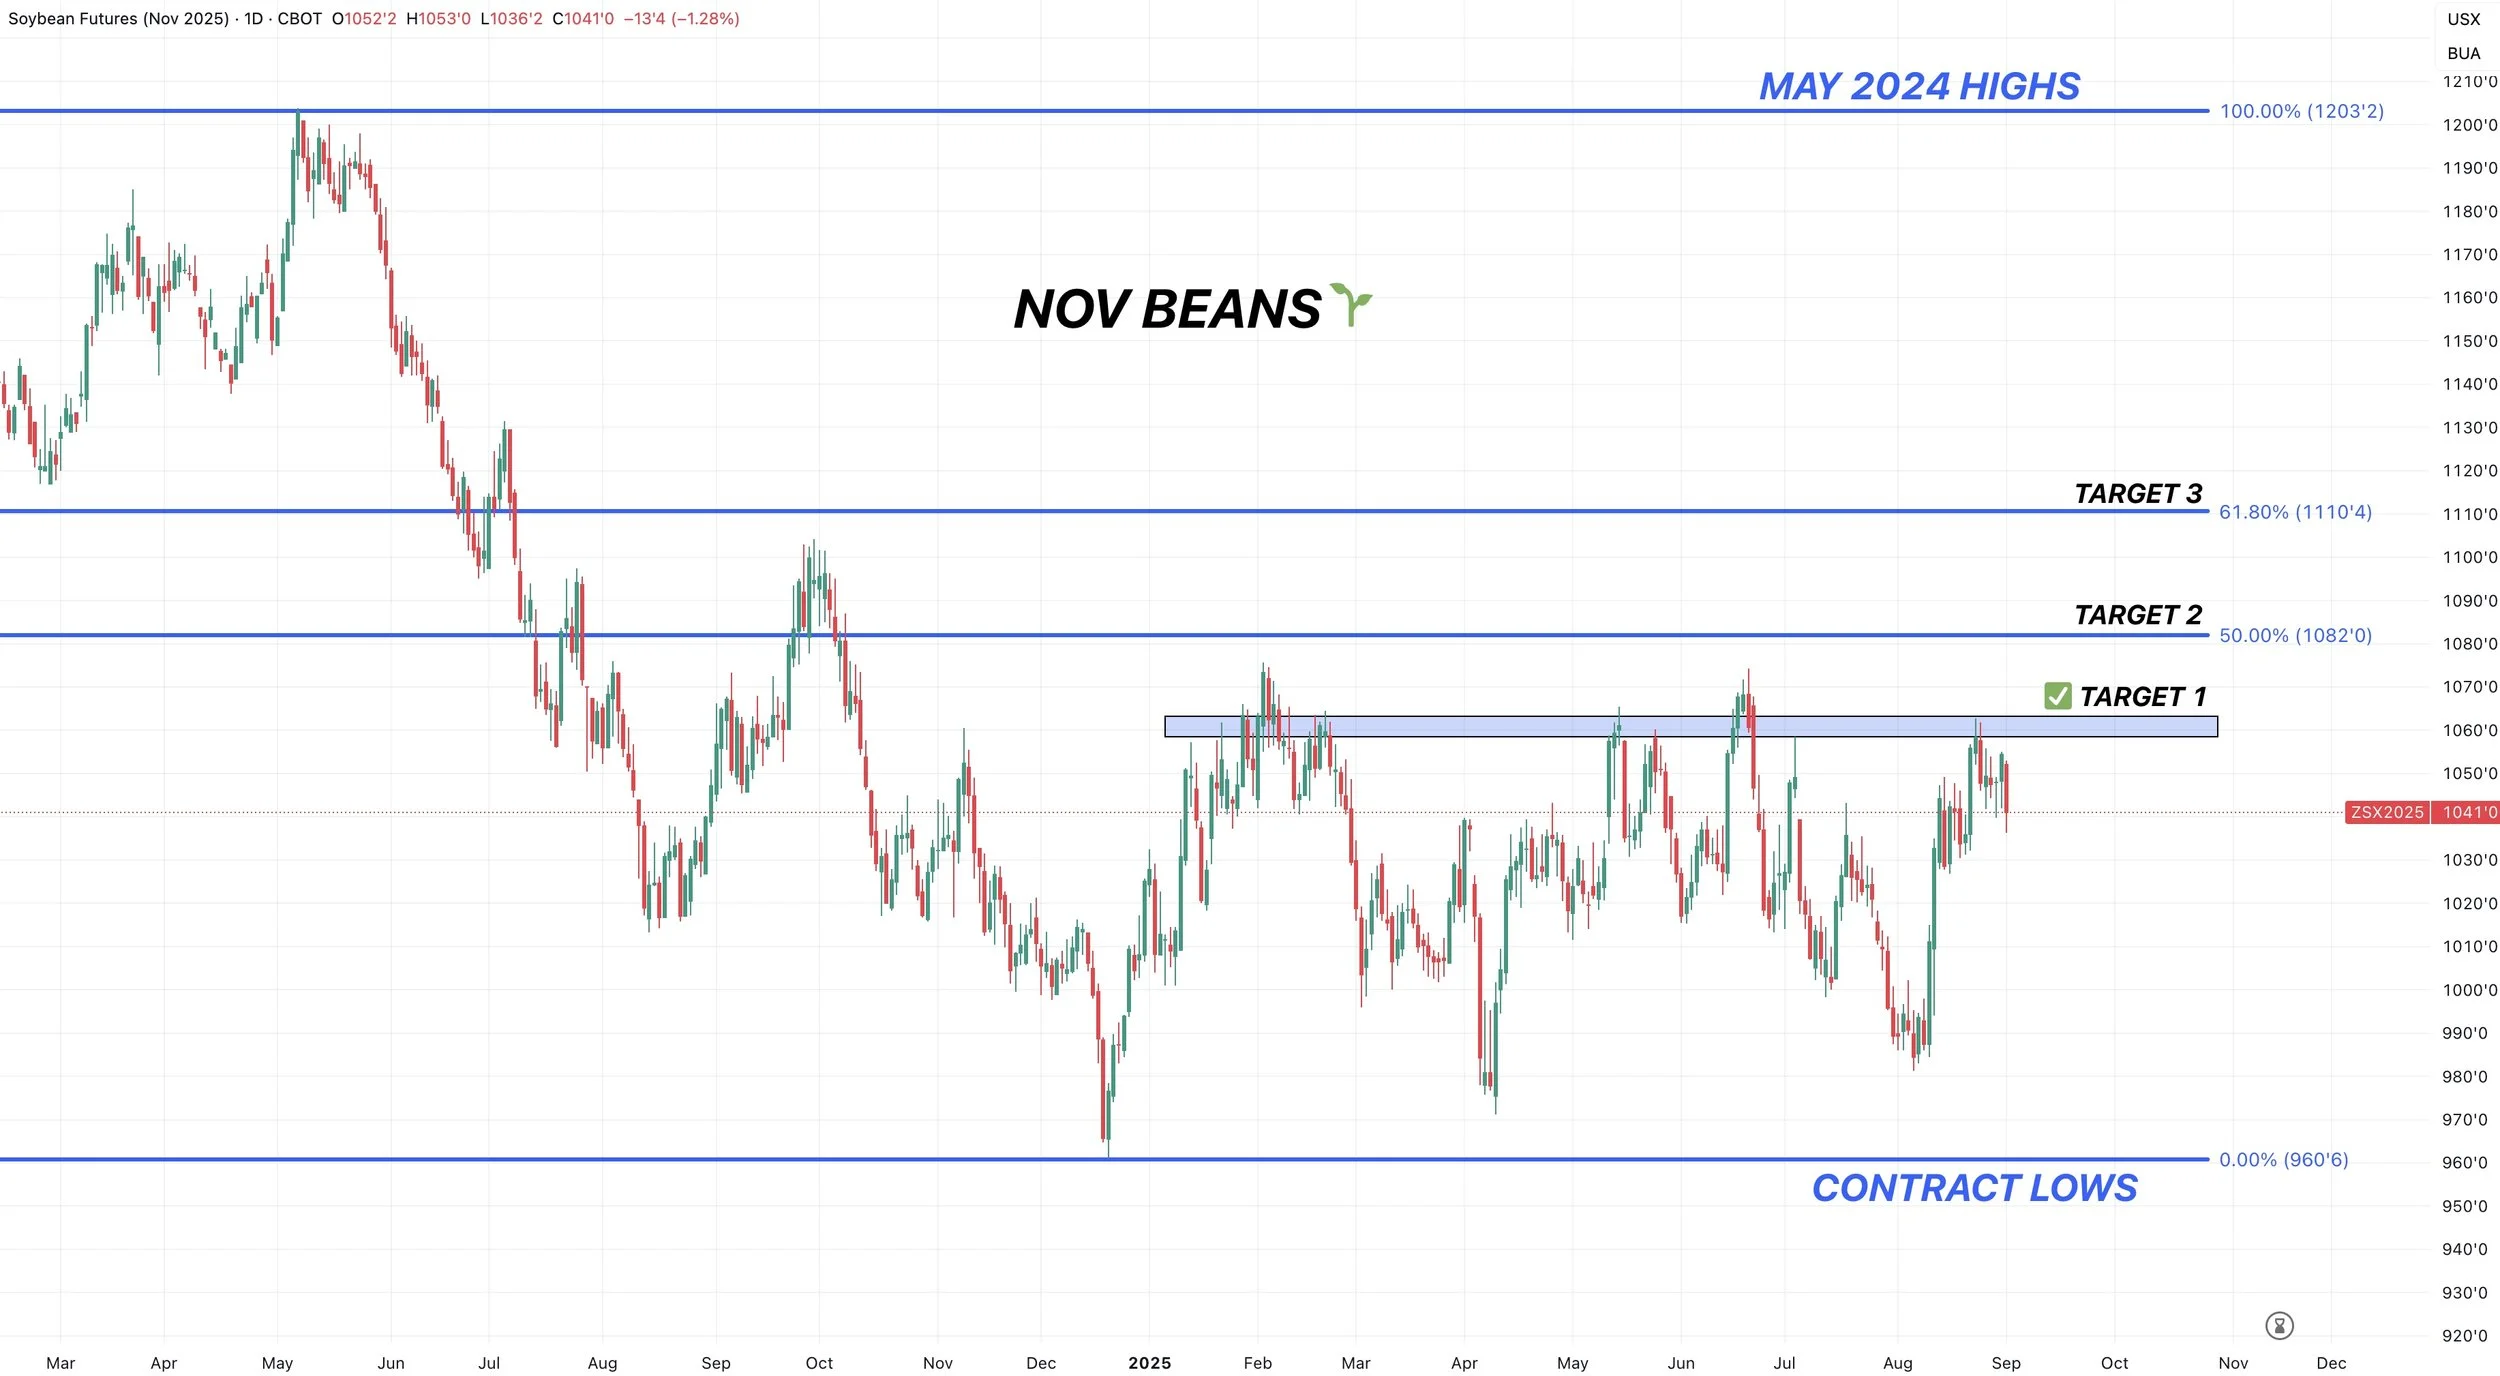
Weekly Chart:
I have no idea when or if we'll ever break above $10.80
But IF we do.. the upside in this market is at least another +50 cents higher.
We've been trapped in a small range for a year now.
Finding support right at those trade war highs.
Finding resistance right at the $10.80 resistance. Which was our lid from 2015 to 2018.
I also think we have found our long term lows. Last trade war was different than this one. Not only did we have a trade war, but Chinese demand was impacted by other factors such as swine fever.
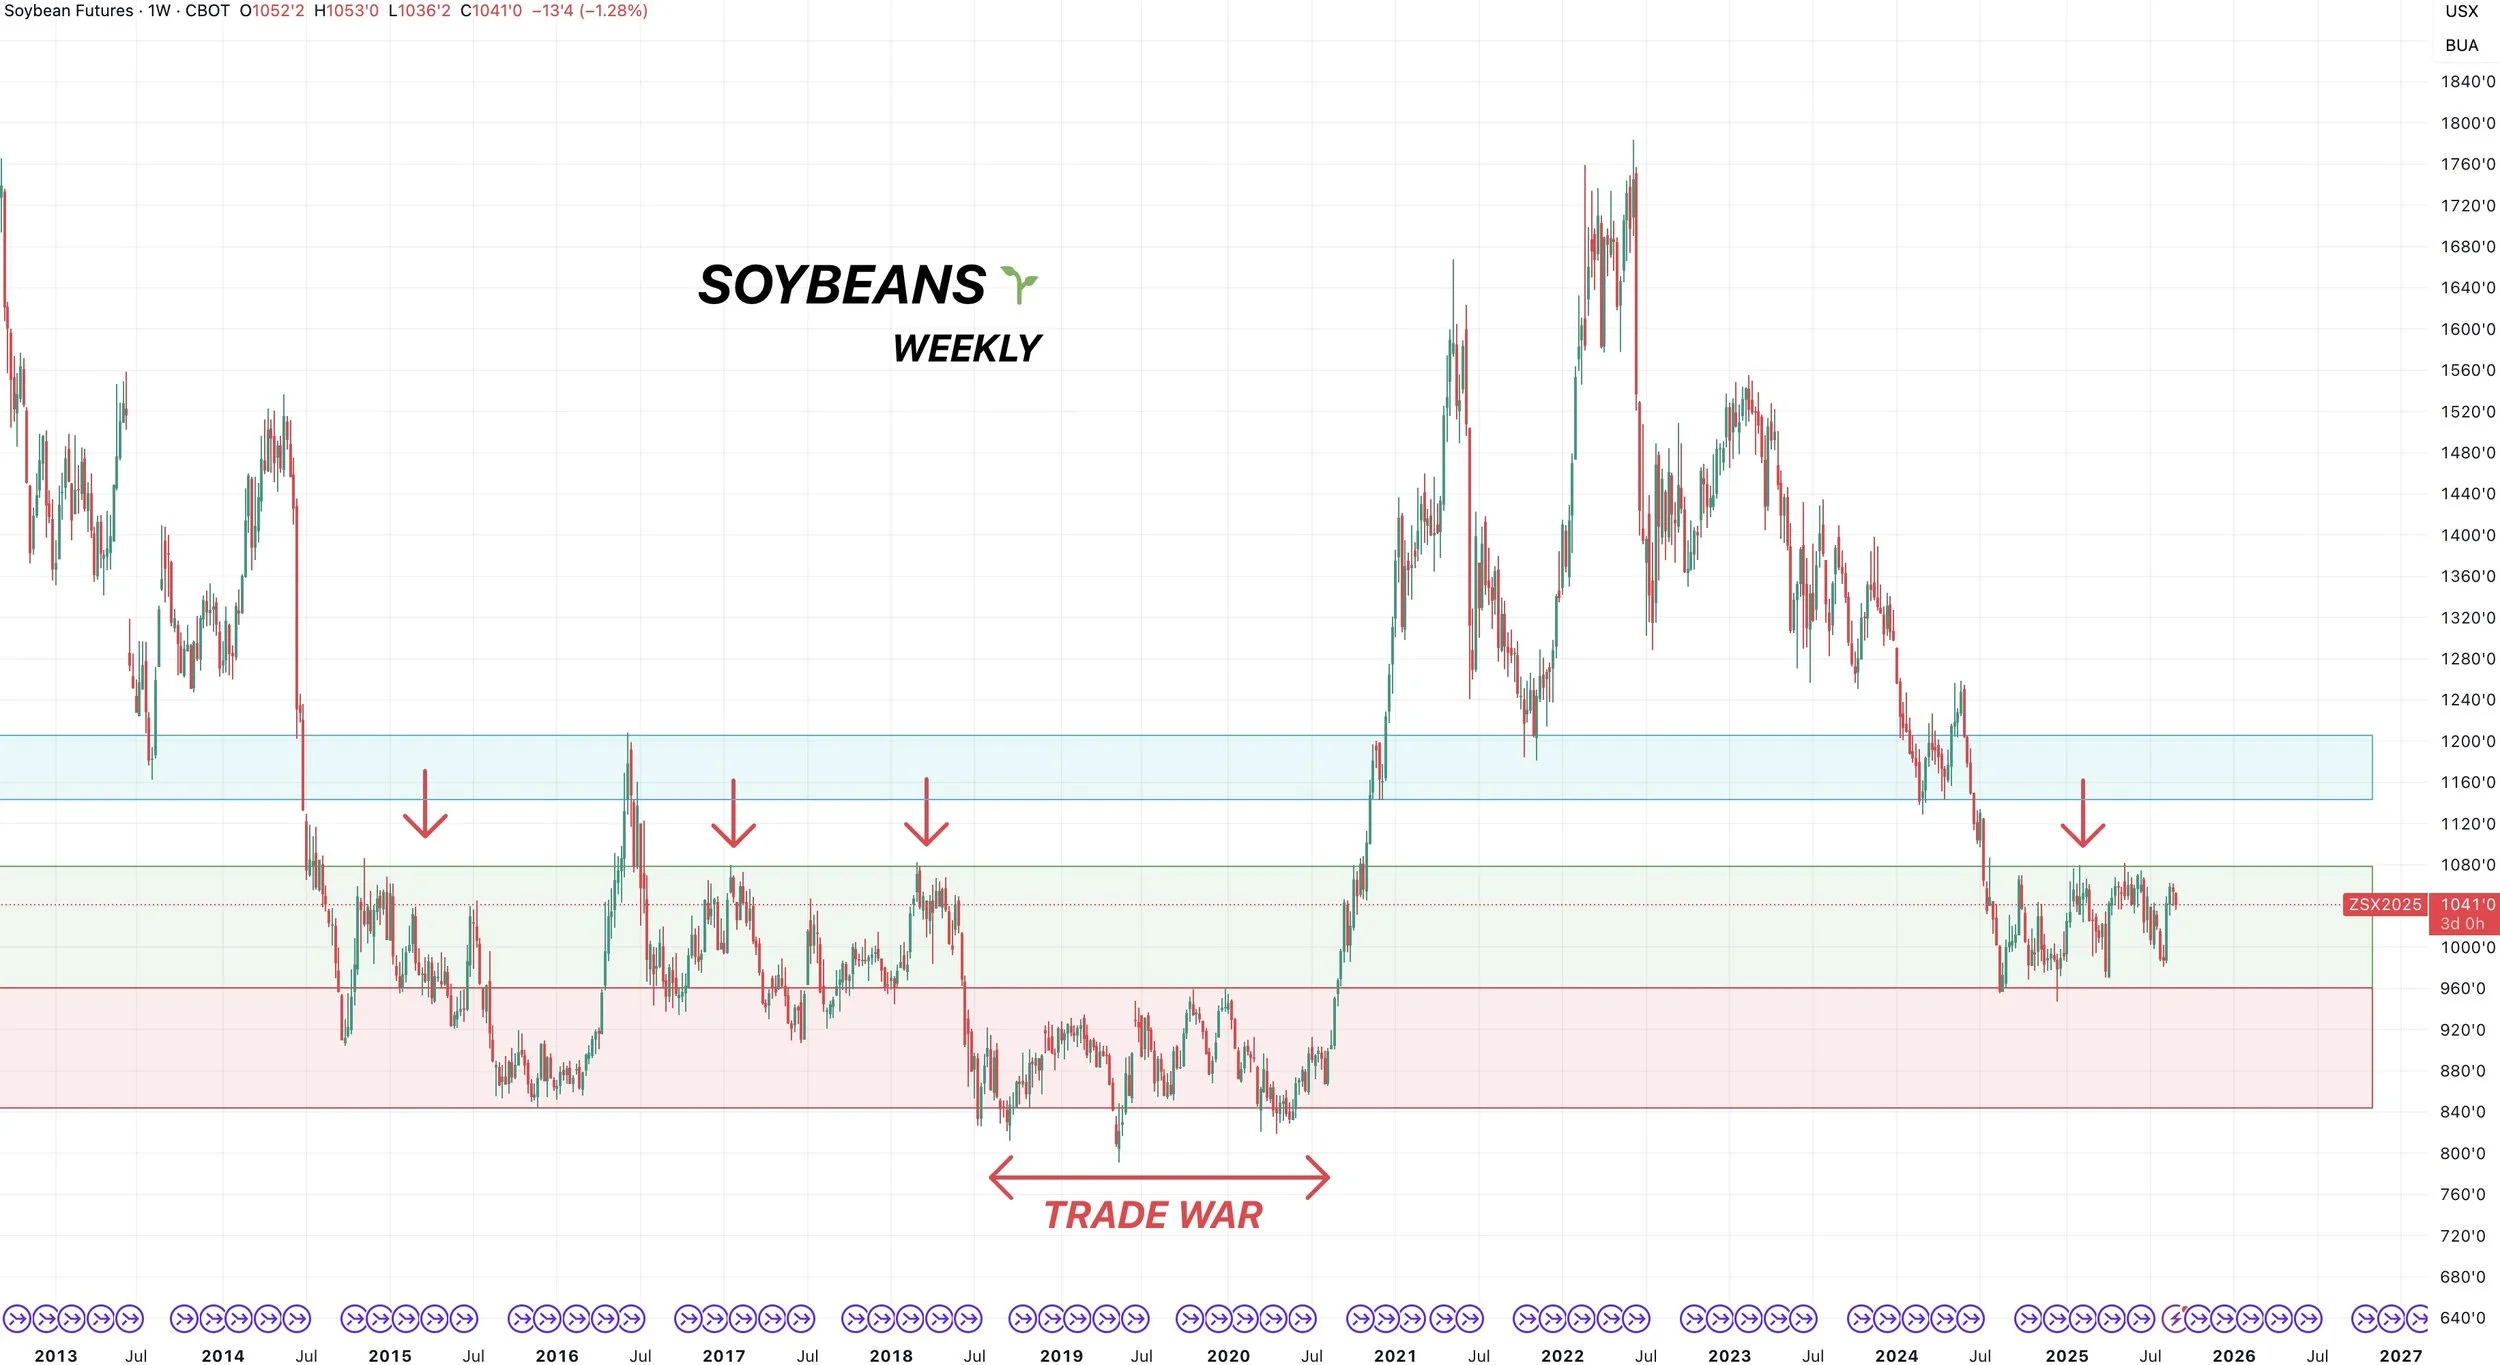
Wheat
Demand continues to impress for the wheat market.
Just look at this chart that compares this year to past years from Karen Braun.
This year is shaping out to be a in a league of it's own.
Last week's export inspections were for the best since all the way back in 2013.
Last year the wheat market bottomed on August 27th.
Which is right around where our recent lows are.
Last year after the lows, we saw a +95 cent rally going into October.
The bottom came at $5.20, which is almost the exact same price we saw our recent bottom in August.
No we don’t have to follow the exact same path and probably won’t.
But seasonally the wheat market starts to catch bid here.
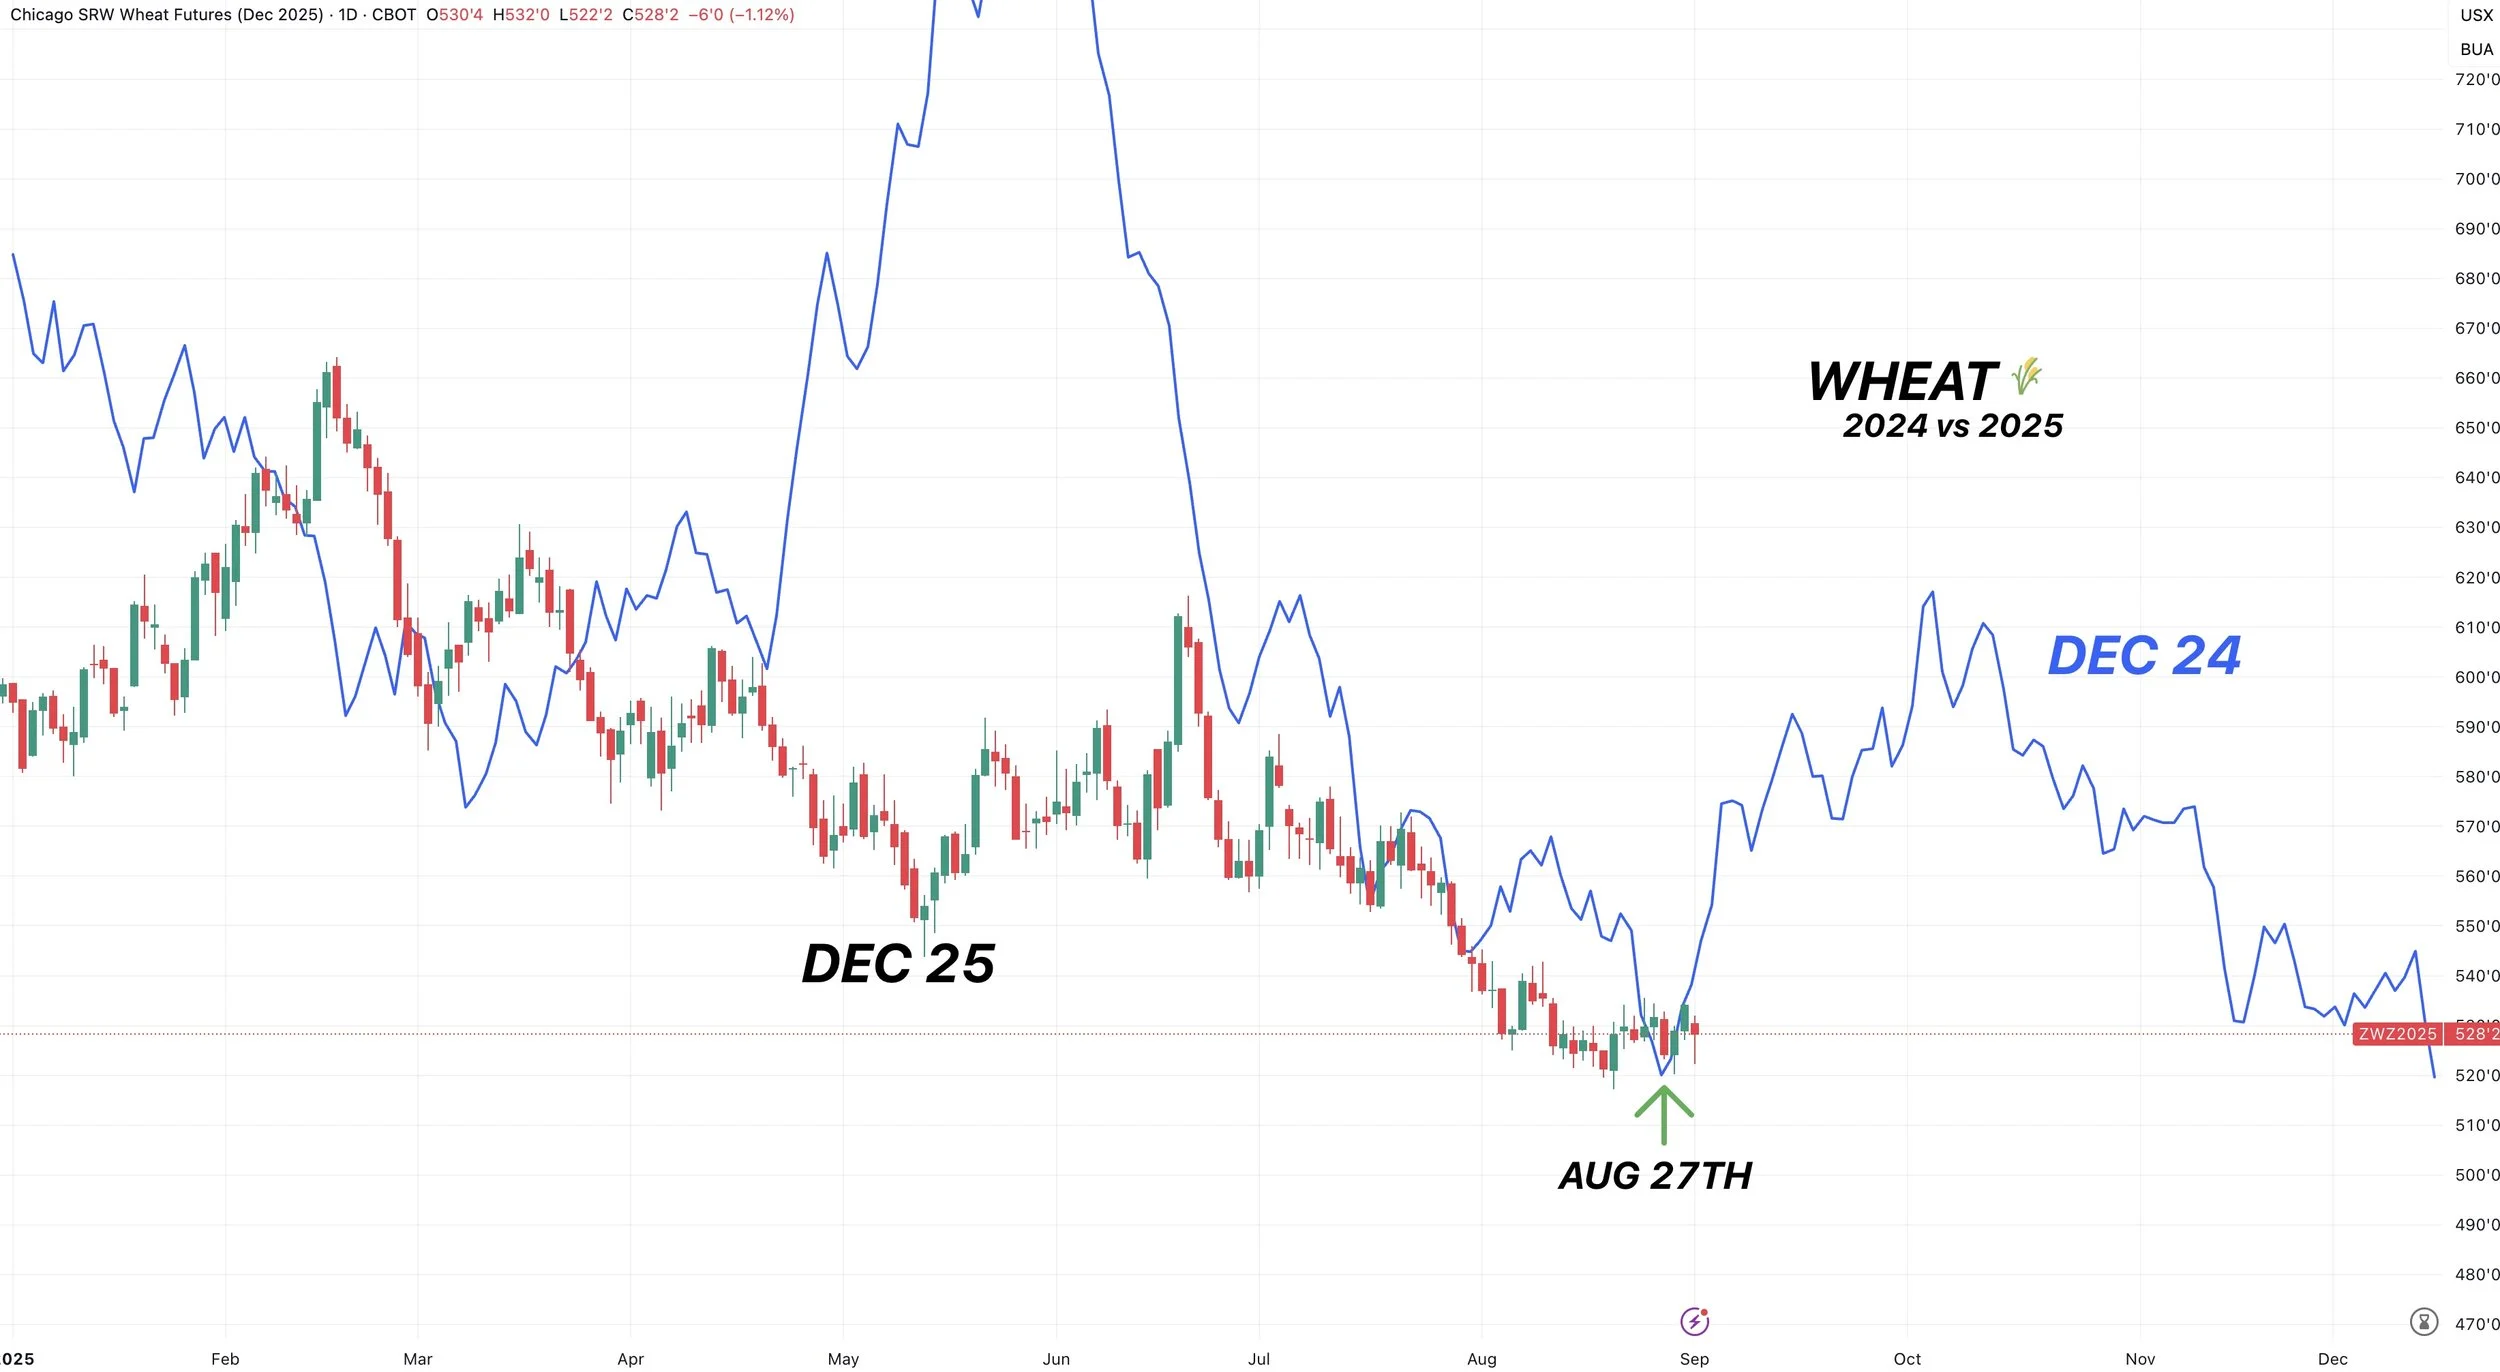
Demand is the best in years.
The funds have started to shift into buyers.
The seasonals have shifted friendly from here.
I just see wheat being undervalued here.
We recently alerted a buy signal for the wheat market. I do still like re-owning here. As the charts are still in tact.
Daily Chicago:
I still really like this chart.
We are breaking out of this falling wedge pattern which is seen as bullish (green lines).
If we can bust above the $5.35 level our next real resistance is going to be $5.55
Which is old support and claws back 38.2% of the June highs.
I am still eyeing the $5.66 to $5.78 level to de-risk heavier.
That gives back 50-61.8% of the June highs. It is also the top of this massive wedge.
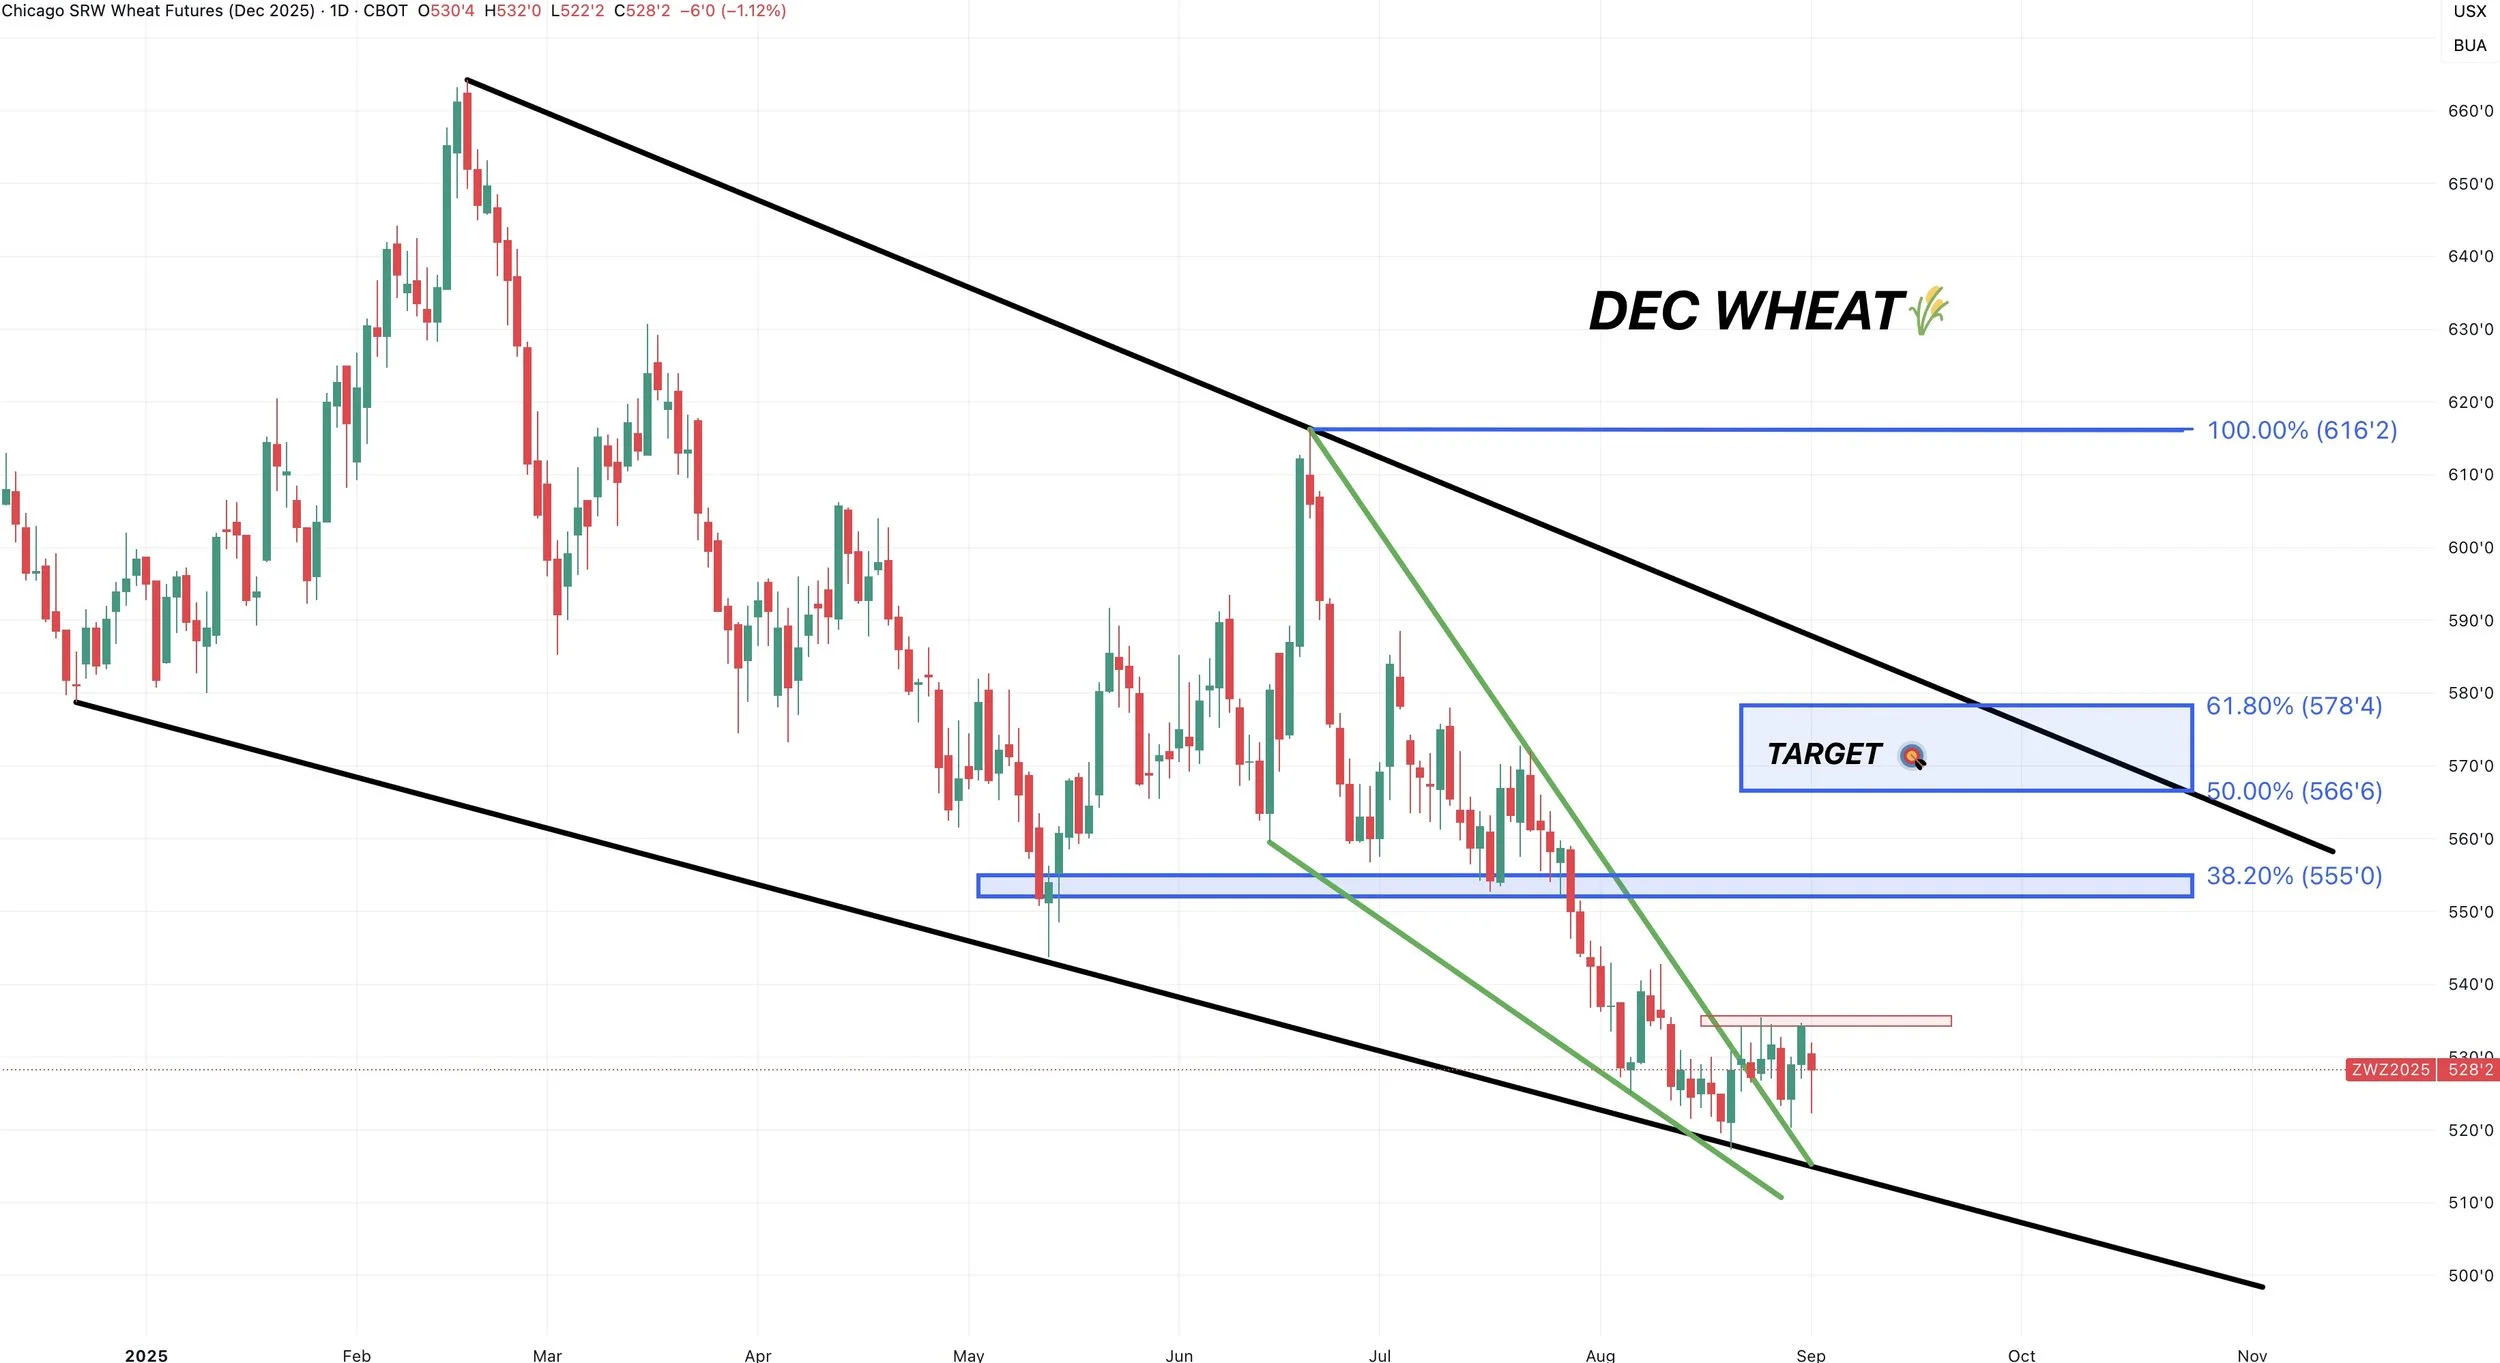
Here is the continuous chart.
Roughly every 4 months for the past year or two, the wheat market has provided an opportunity.
If it happened again, it would put the next major opportunity perhaps sometime around late October or so.
This is just a pure guess, but I think there will be opportunities. They just might not happen as soon as any of us would like.
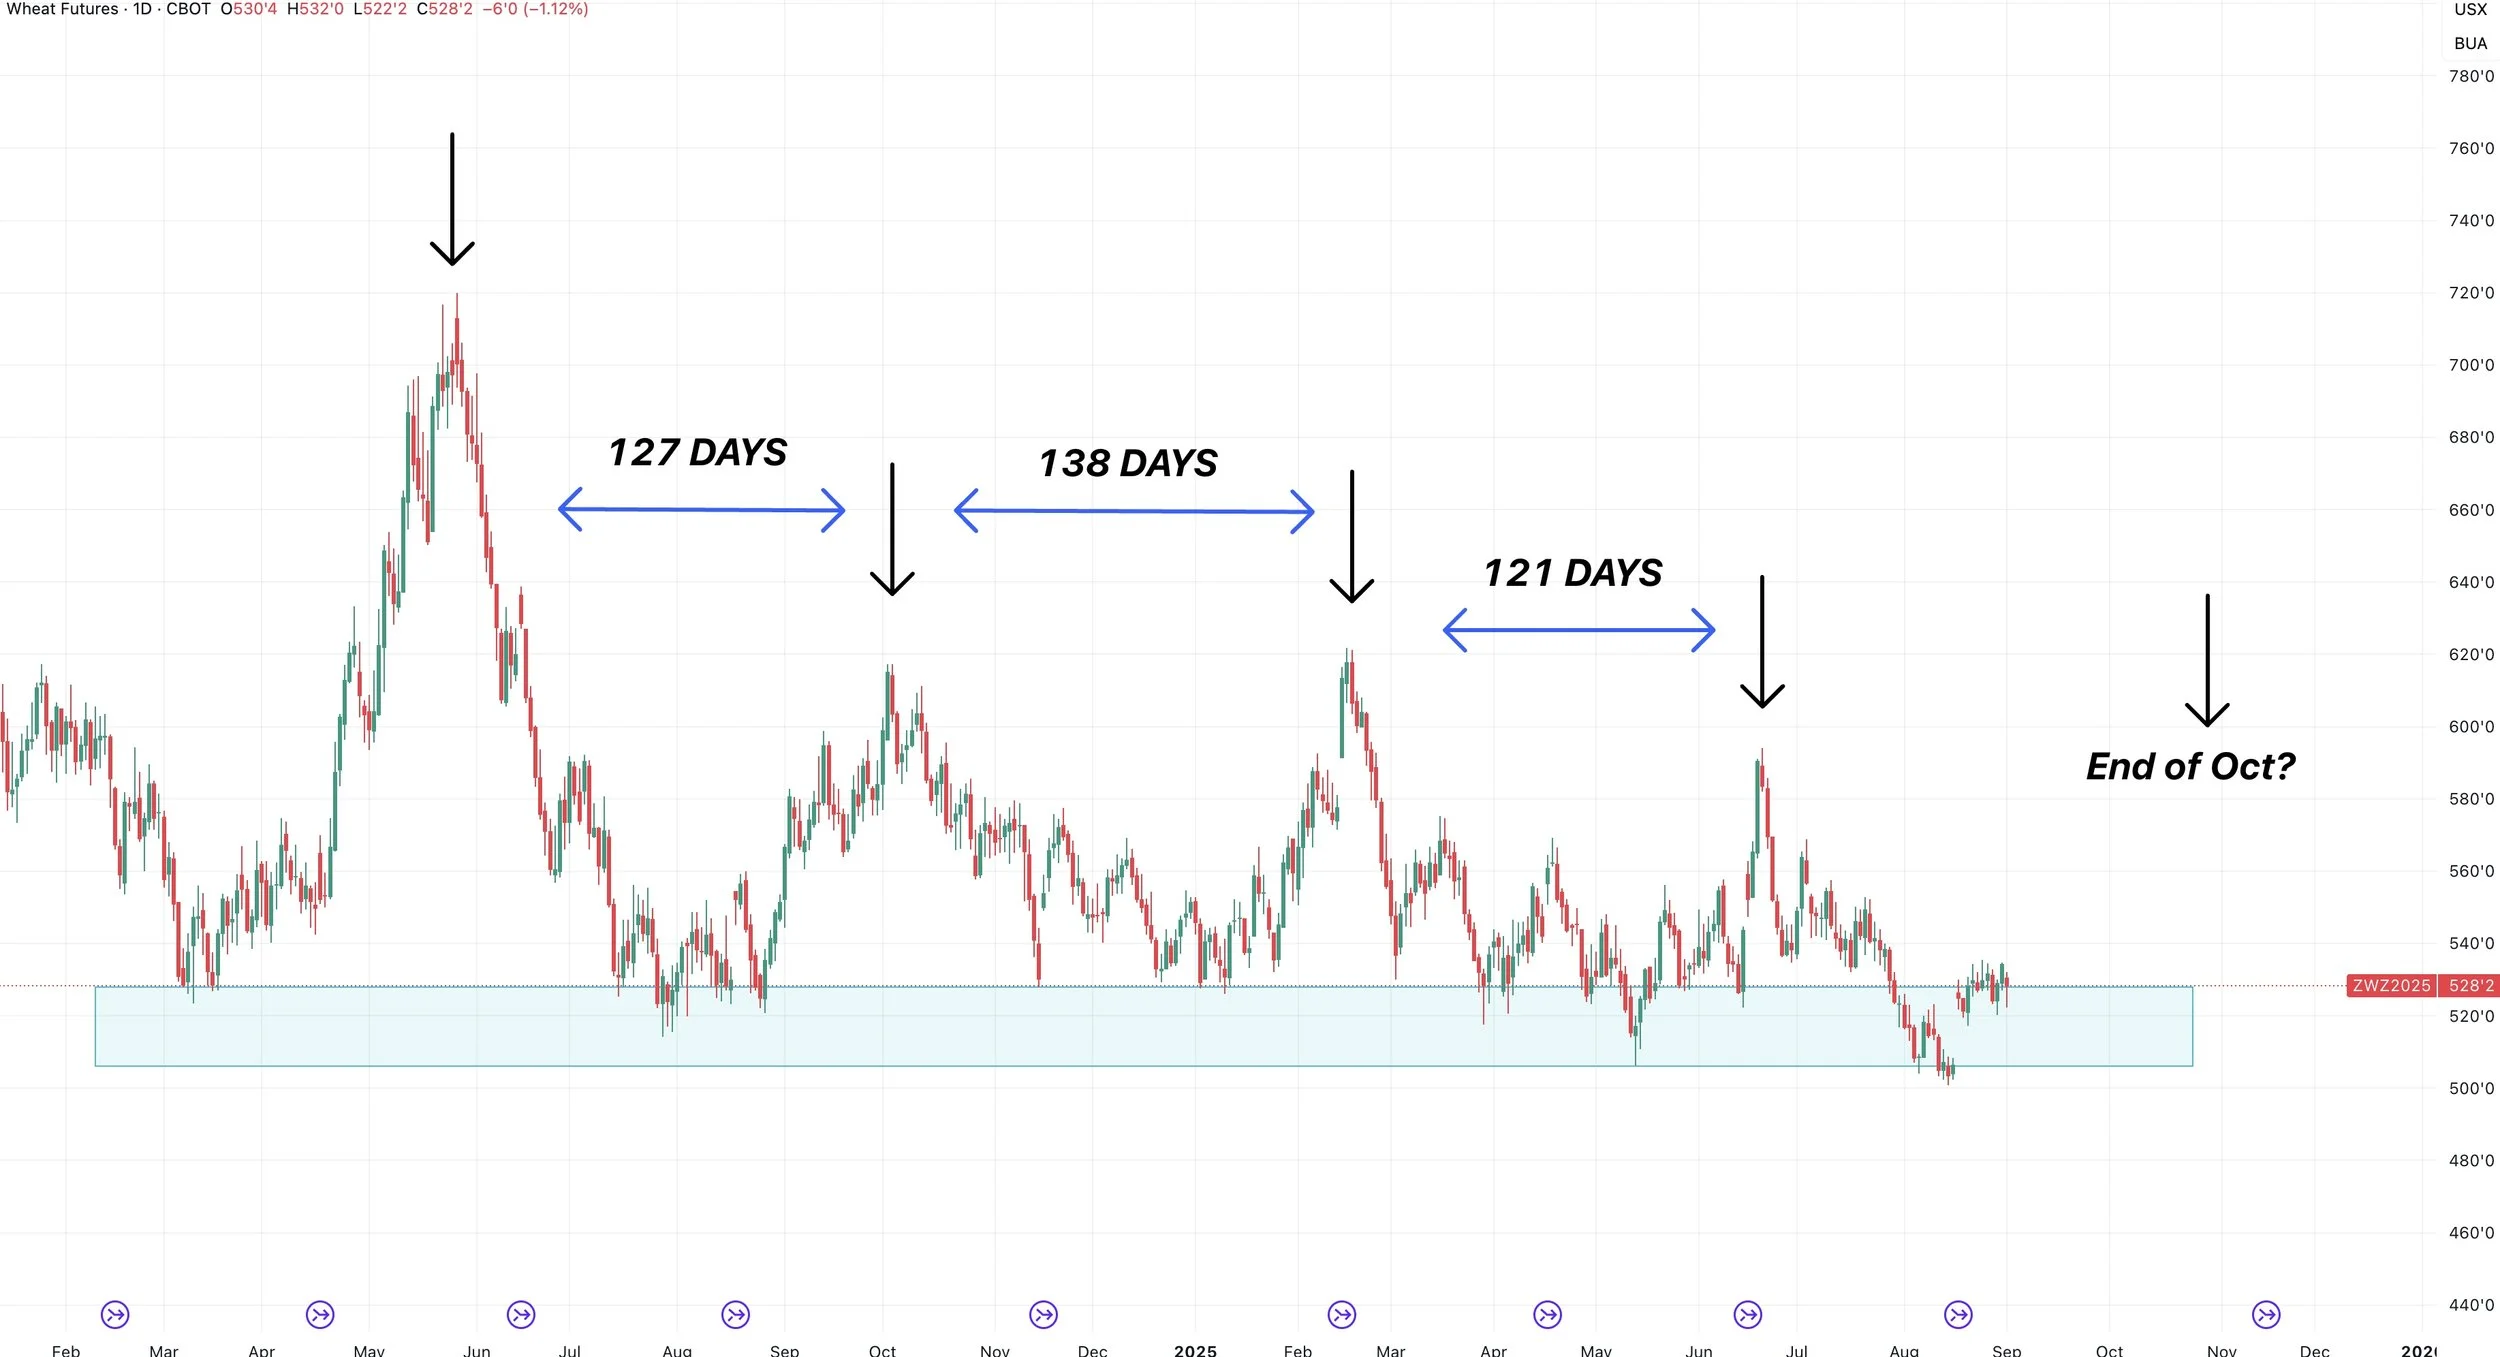
Daily KC Wheat:
Still sitting in a falling wedge pattern.
Current target is $5.59 to $5.72
Which gives back 50-61.8% of the June highs.
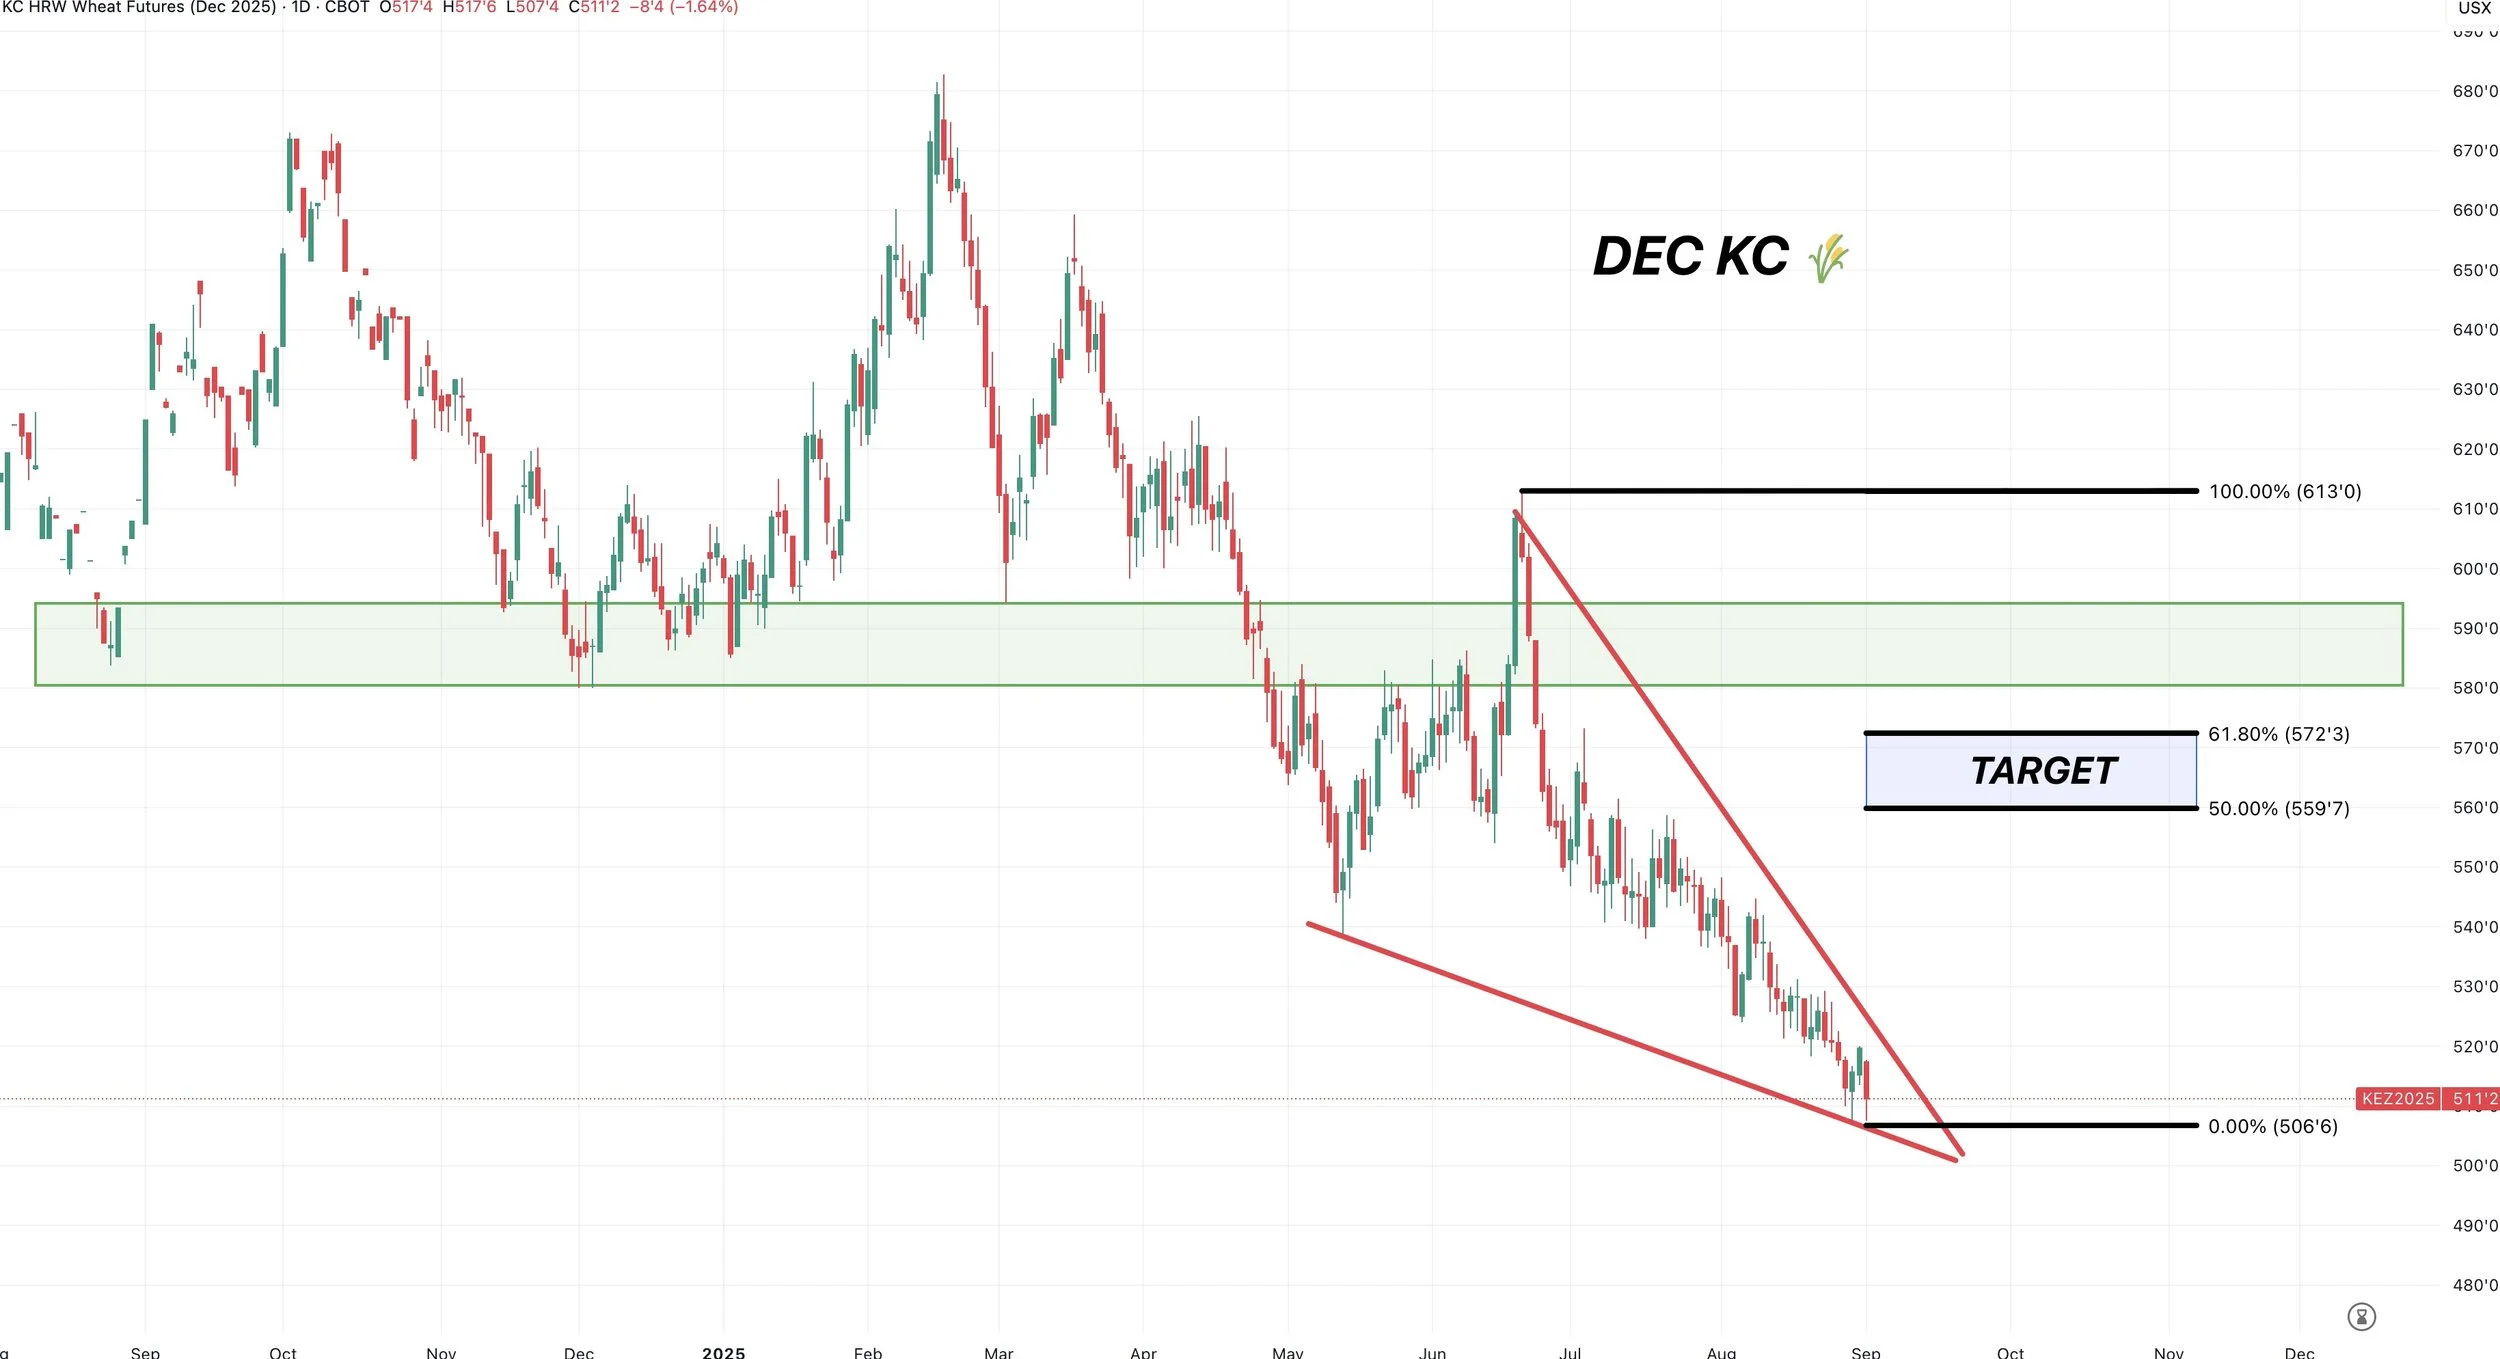
Cattle
Not much on cattle today. We still like keeping puts for downside protection in a seasonal time frame where we tend to struggle.
Oct Feeder:
We are currently rejecting the golden fib from the mid August rally & pullback (highlighted with the arrow).
If we bust above, next target is 376.375
If we start to break down, that blue box is our downside target.
I would be cautious here. As last week we nearly perfectly hit that golden fib before leaving the nasty candle last Wednesday.
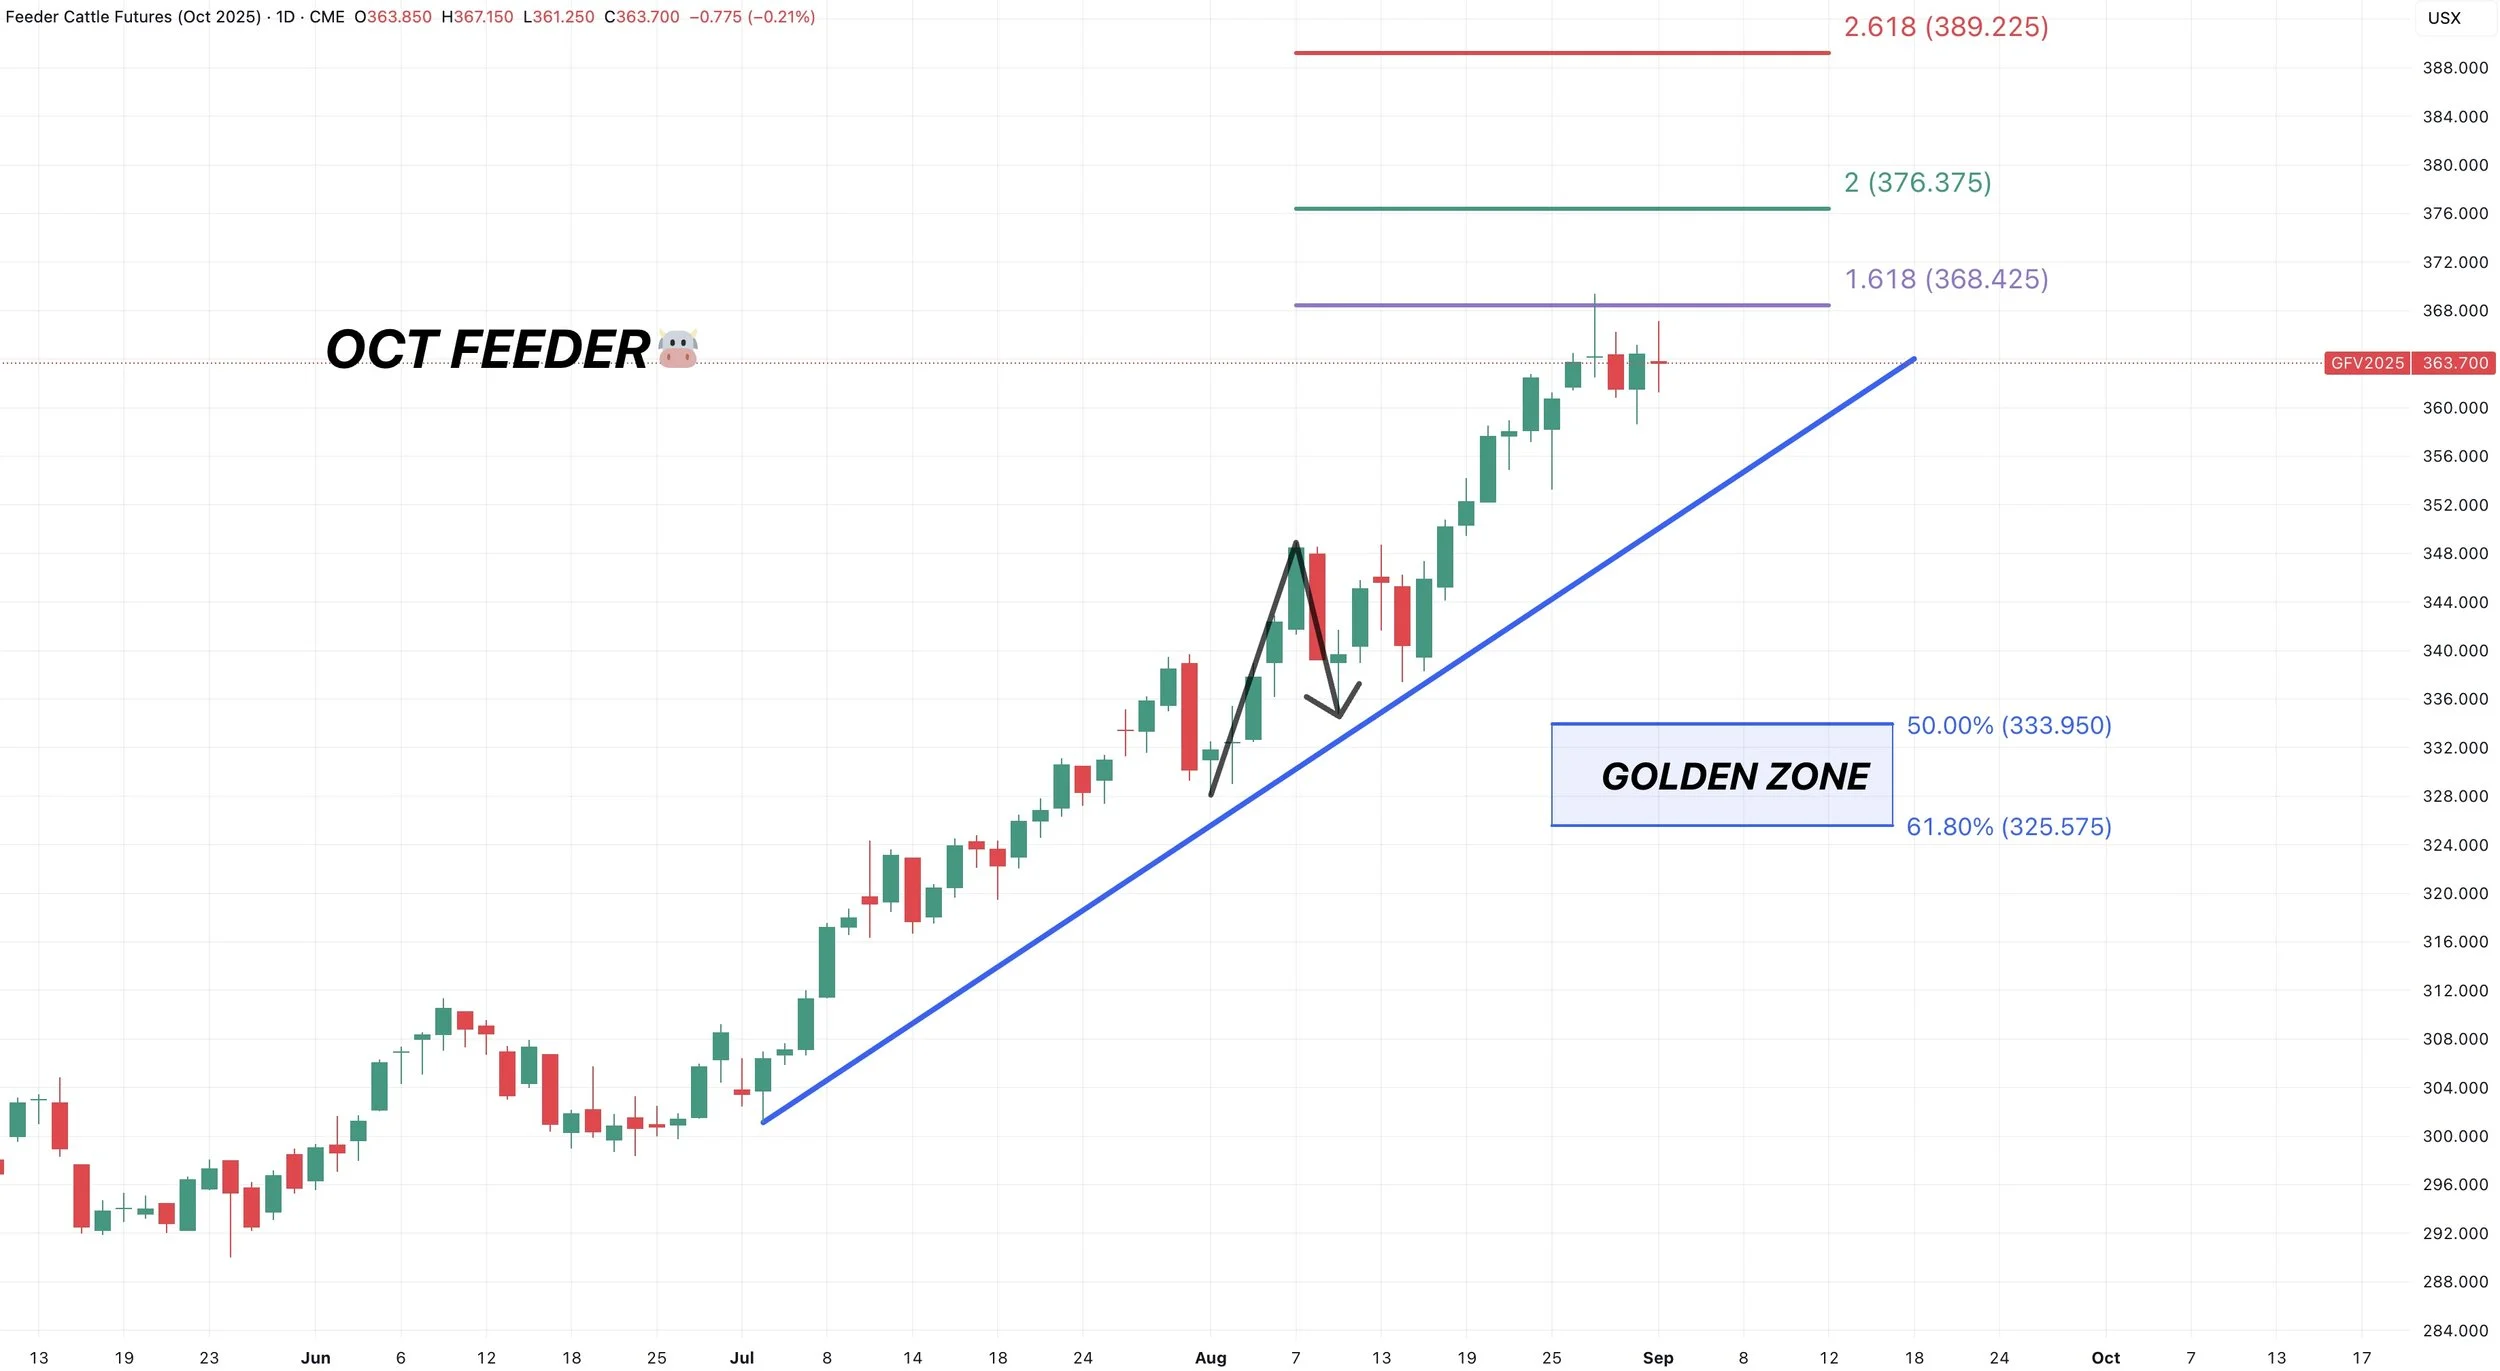
Oct Live:
Also rejecting the golden fib.
If we make new highs, the target is 245.725
If we break down, blue box is the downside target.
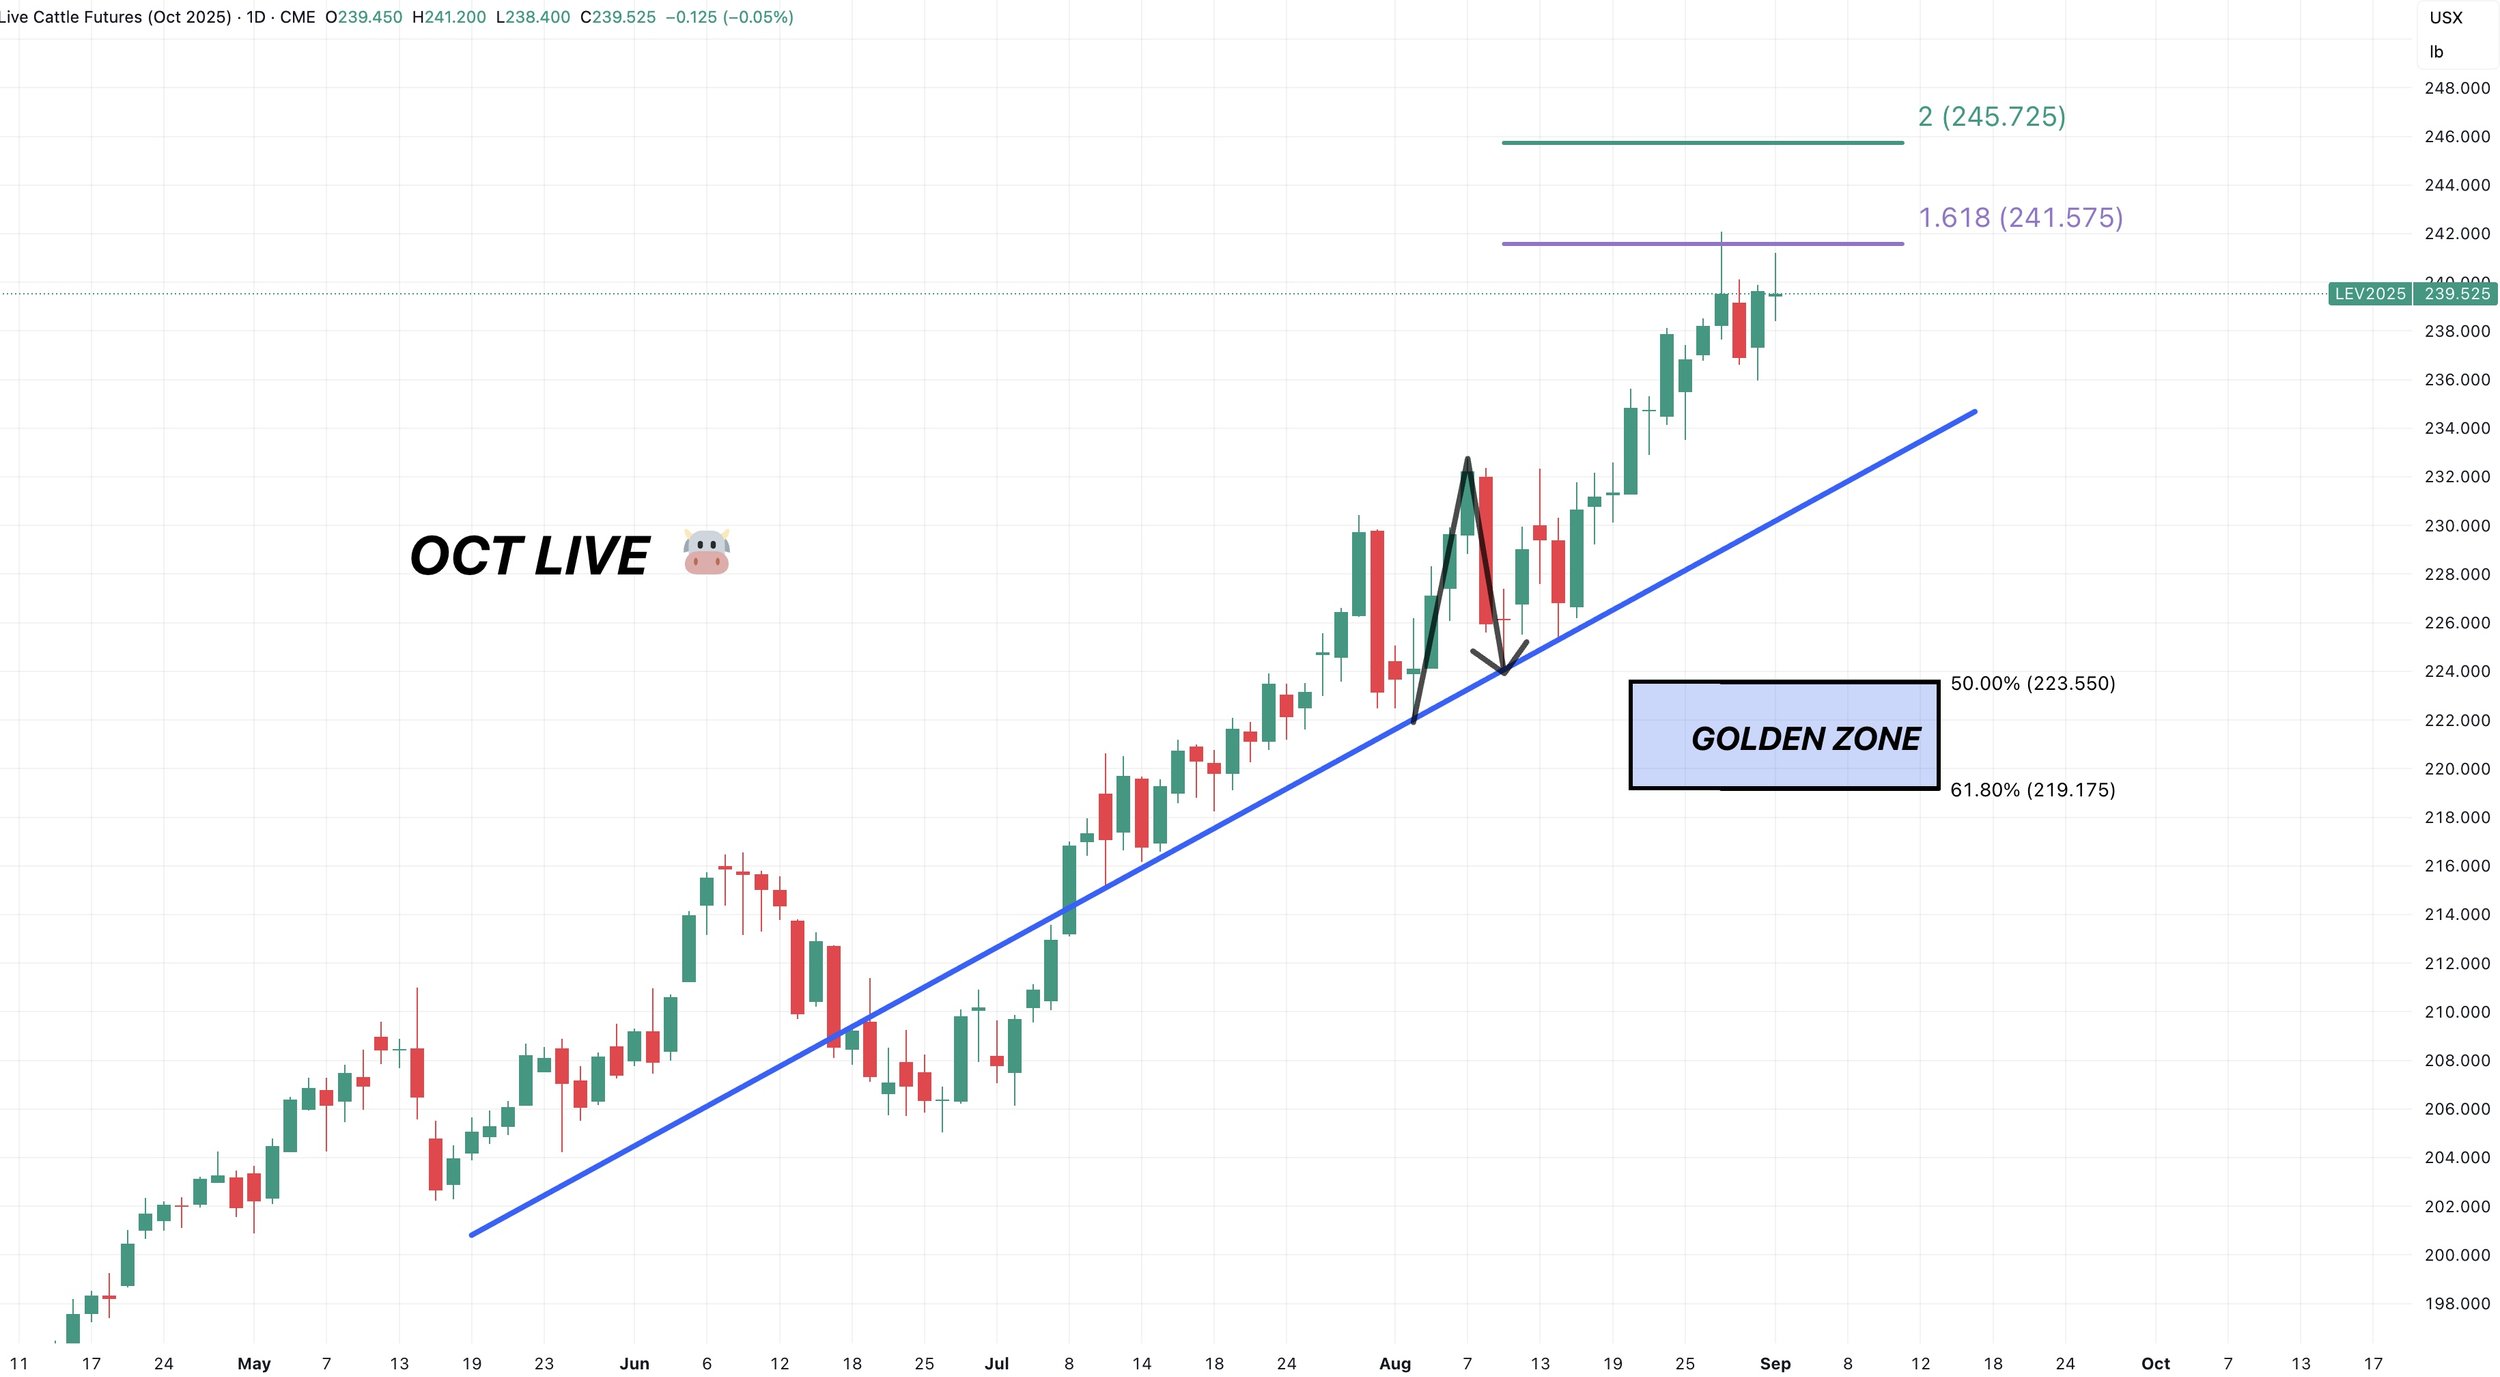
Past Sell or Protection Signals
Aug 22nd: 🌱
Soybean sell signal & hedge alert.
July 31st: 🐮
Cattle sell signal & hedge alert.
July 10th: 🐮
Cattle sell signal & hedge alert.
CLICK HERE TO VIEW
June 5th: 🐮
Cattle sell signal & hedge alert.
June 2nd: 🌾
MPLS wheat sell signal.
April 10th: 🌽
Old crop corn sell signal.
March 19th: 🐮
Cattle hedge & sell signal.
Feb 18th: 🌽 🌾
Old crop KC wheat & old crop corn signal.
Jan 23rd: 🌽 🌱
Corn & beans old crop sell signal.
CLICK HERE TO VIEW
Jan 15th: 🌽 🌱
Corn & beans hedge alert/sell signal.
Jan 2nd: 🐮
Cattle hedge alert at new all-time highs & target.
Dec 11th: 🌽
Corn sell signal at $4.51 200-day MA
CLICK HERE TO VIEW
Oct 2nd: 🌾
Wheat sell signal at $6.12 target
Sep 30th: 🌽
Corn protection signal at $4.23-26
Sep 27th: 🌱
Soybean sell & protection signal at $10.65
Sep 13th: 🌾
Wheat sell signal at $5.98
May 22nd: 🌾
Wheat sell signal when wheat traded +$7.00
Want to Talk?
Our phones are open 24/7 for you guys if you ever need anything or want to discuss your operation.
Hedge Account
Interested in a hedge account? Use the link below to set up an account or shoot Jeremey a call at (605)295-3100.
COULD THE BOTTOM BE IN?
MARKET UPDATE
You can scroll to read the usual update as well. As the written version is the exact same as the video.
Timestamps for video:
Overview: 0:00min
2024 vs 2025 Weather: 0:45min
Corn: 3:00min
Beans: 6:00min
Wheat: 9:20min
Cattle: 11:50min
Want to talk about your situation?
(605)295-3100
Want every update & signal?
Since your trial ended you no longer have access to every daily update and will not get our next sell signal. Take advantage of our Labor Day sale for full access.
Futures Prices Close
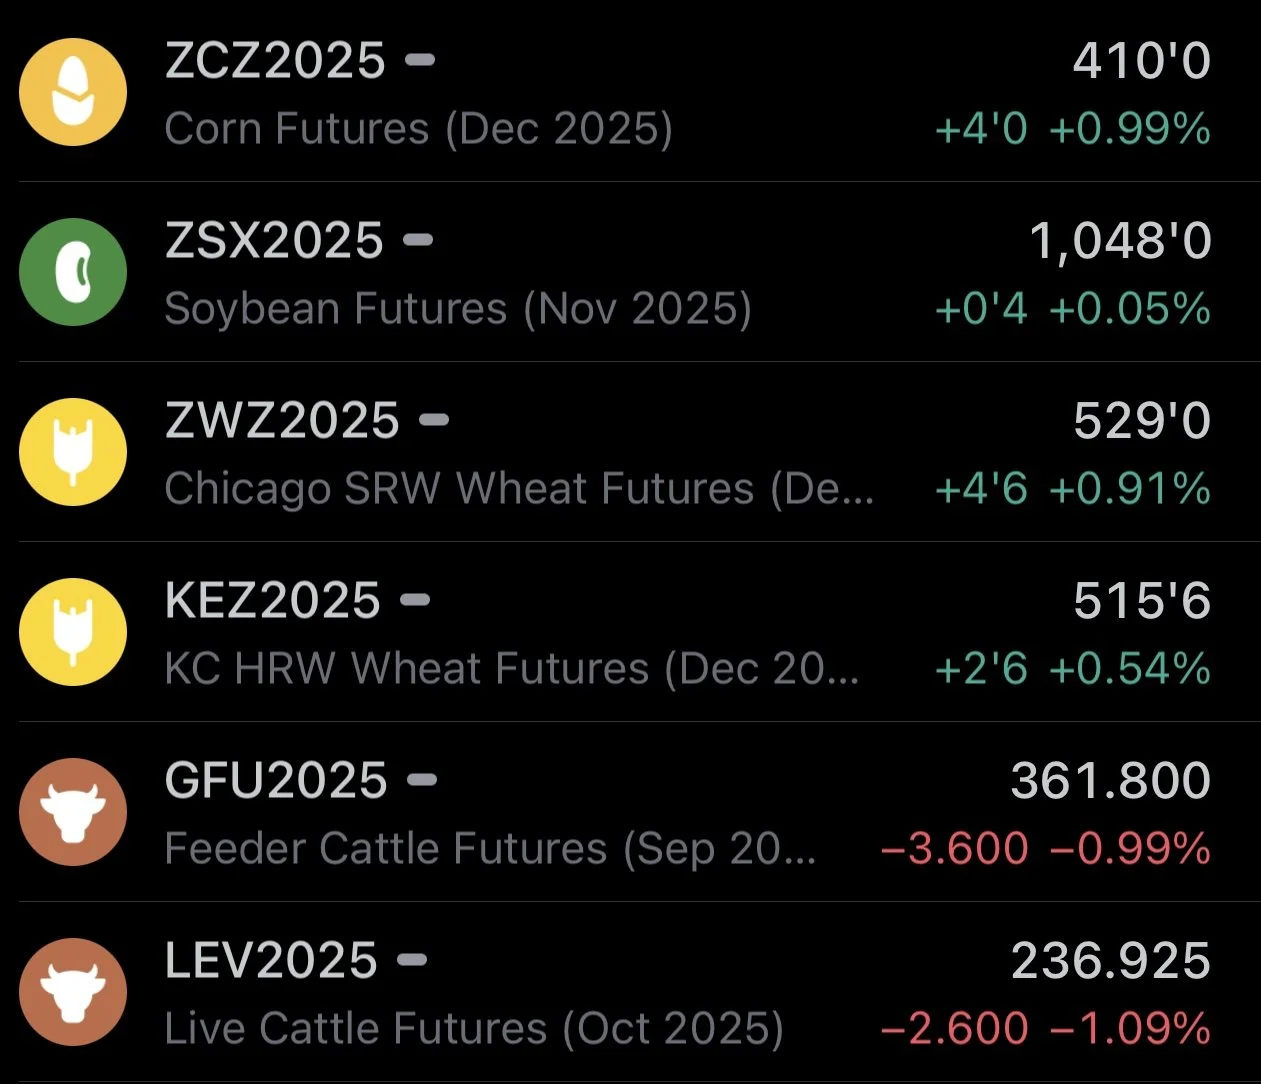
Overview
Decent action across the grains, as all opened lower and rallied off the early lows.
Meanwhile, the cattle market sees some follow through weakness following yesterday's ugly candles.
First notice day is tomorrow.
This has been a big reason for the weakness this week, especially in the corn market. This happens nearly every single contract month for the corn market if you go back and look.
Now that the natural sell pressure from first notice day is out of the way, maybe we can start to find some footing.
Bulls are arguing this dry finish could take the top end off of these crops, while corn & wheat demand continue to impress.
Bears are arguing that soybean demand is in jeopardy and we have a monster amount of corn supply.
Let's dive into the good stuff.
2024 vs 2025
On Tuesday, I showed how much drier August was for this year compared to last year.
But I wanted to take this one step further.
Last year, yield clearly took a hit with the dry finish.
Again, here is the August precip rankings for this year vs last year.
This year had a much drier August.
Especially out east. The eastern corn belt definitely has some concerns.
2025 - August Precip

2024 - August Precip
Neither this August or last year's August featured much heat at all.
2025 - Aug Low Temps
2024 - Aug Low Temps
If last August wasn’t as dry as this year, and didn’t feature any heat, where did the yield loss come from?
Here is precip and temp rankings for the first half of September last year.
It was one of the driest first halves of September on record for the central corn belt.
Meanwhile, it did also have some of the coolest nights.
2024 - Sep 1-15th Precip
2024 - Sep 1-15th Low Temps
Here is the next 10 days of precip.
It is suppose to remain dry in those same areas that have been dry all of August.
This growing season has seen some great things and some not so great things.
Let's look at the July precip & temp rankings for this year.
This July was one of the wettest on record. Especially for Iowa.
However, overnight temps were some of their hottest ever. Especially in the eastern corn belt, which is the area currently suffering from a dry August.
Overnight heat in July and August can be a silent killer. It's one of the things that can have the biggest impact on yield but doesn’t show up from the side of the road.
Do we have a record crop? Yes probably.
Do we have a 189 corn yield? I'd say probably not.
2025 - July Precip
2025 - July Low Temps
Last year August yield was 183.1 bpa.
Last year's final was 179.3 bpa.
Which is a -2.1% decrease.
Just for reference, if we saw that same decrease, it would put us at 184.8 bpa.
Today's Main Takeaways
Corn
Corn bounced right off the golden zone (which we will touch on).
The recent weakness was mostly first notice day.
Are the harvest lows in?
Last year, corn bottomed yesterday on August 27th.
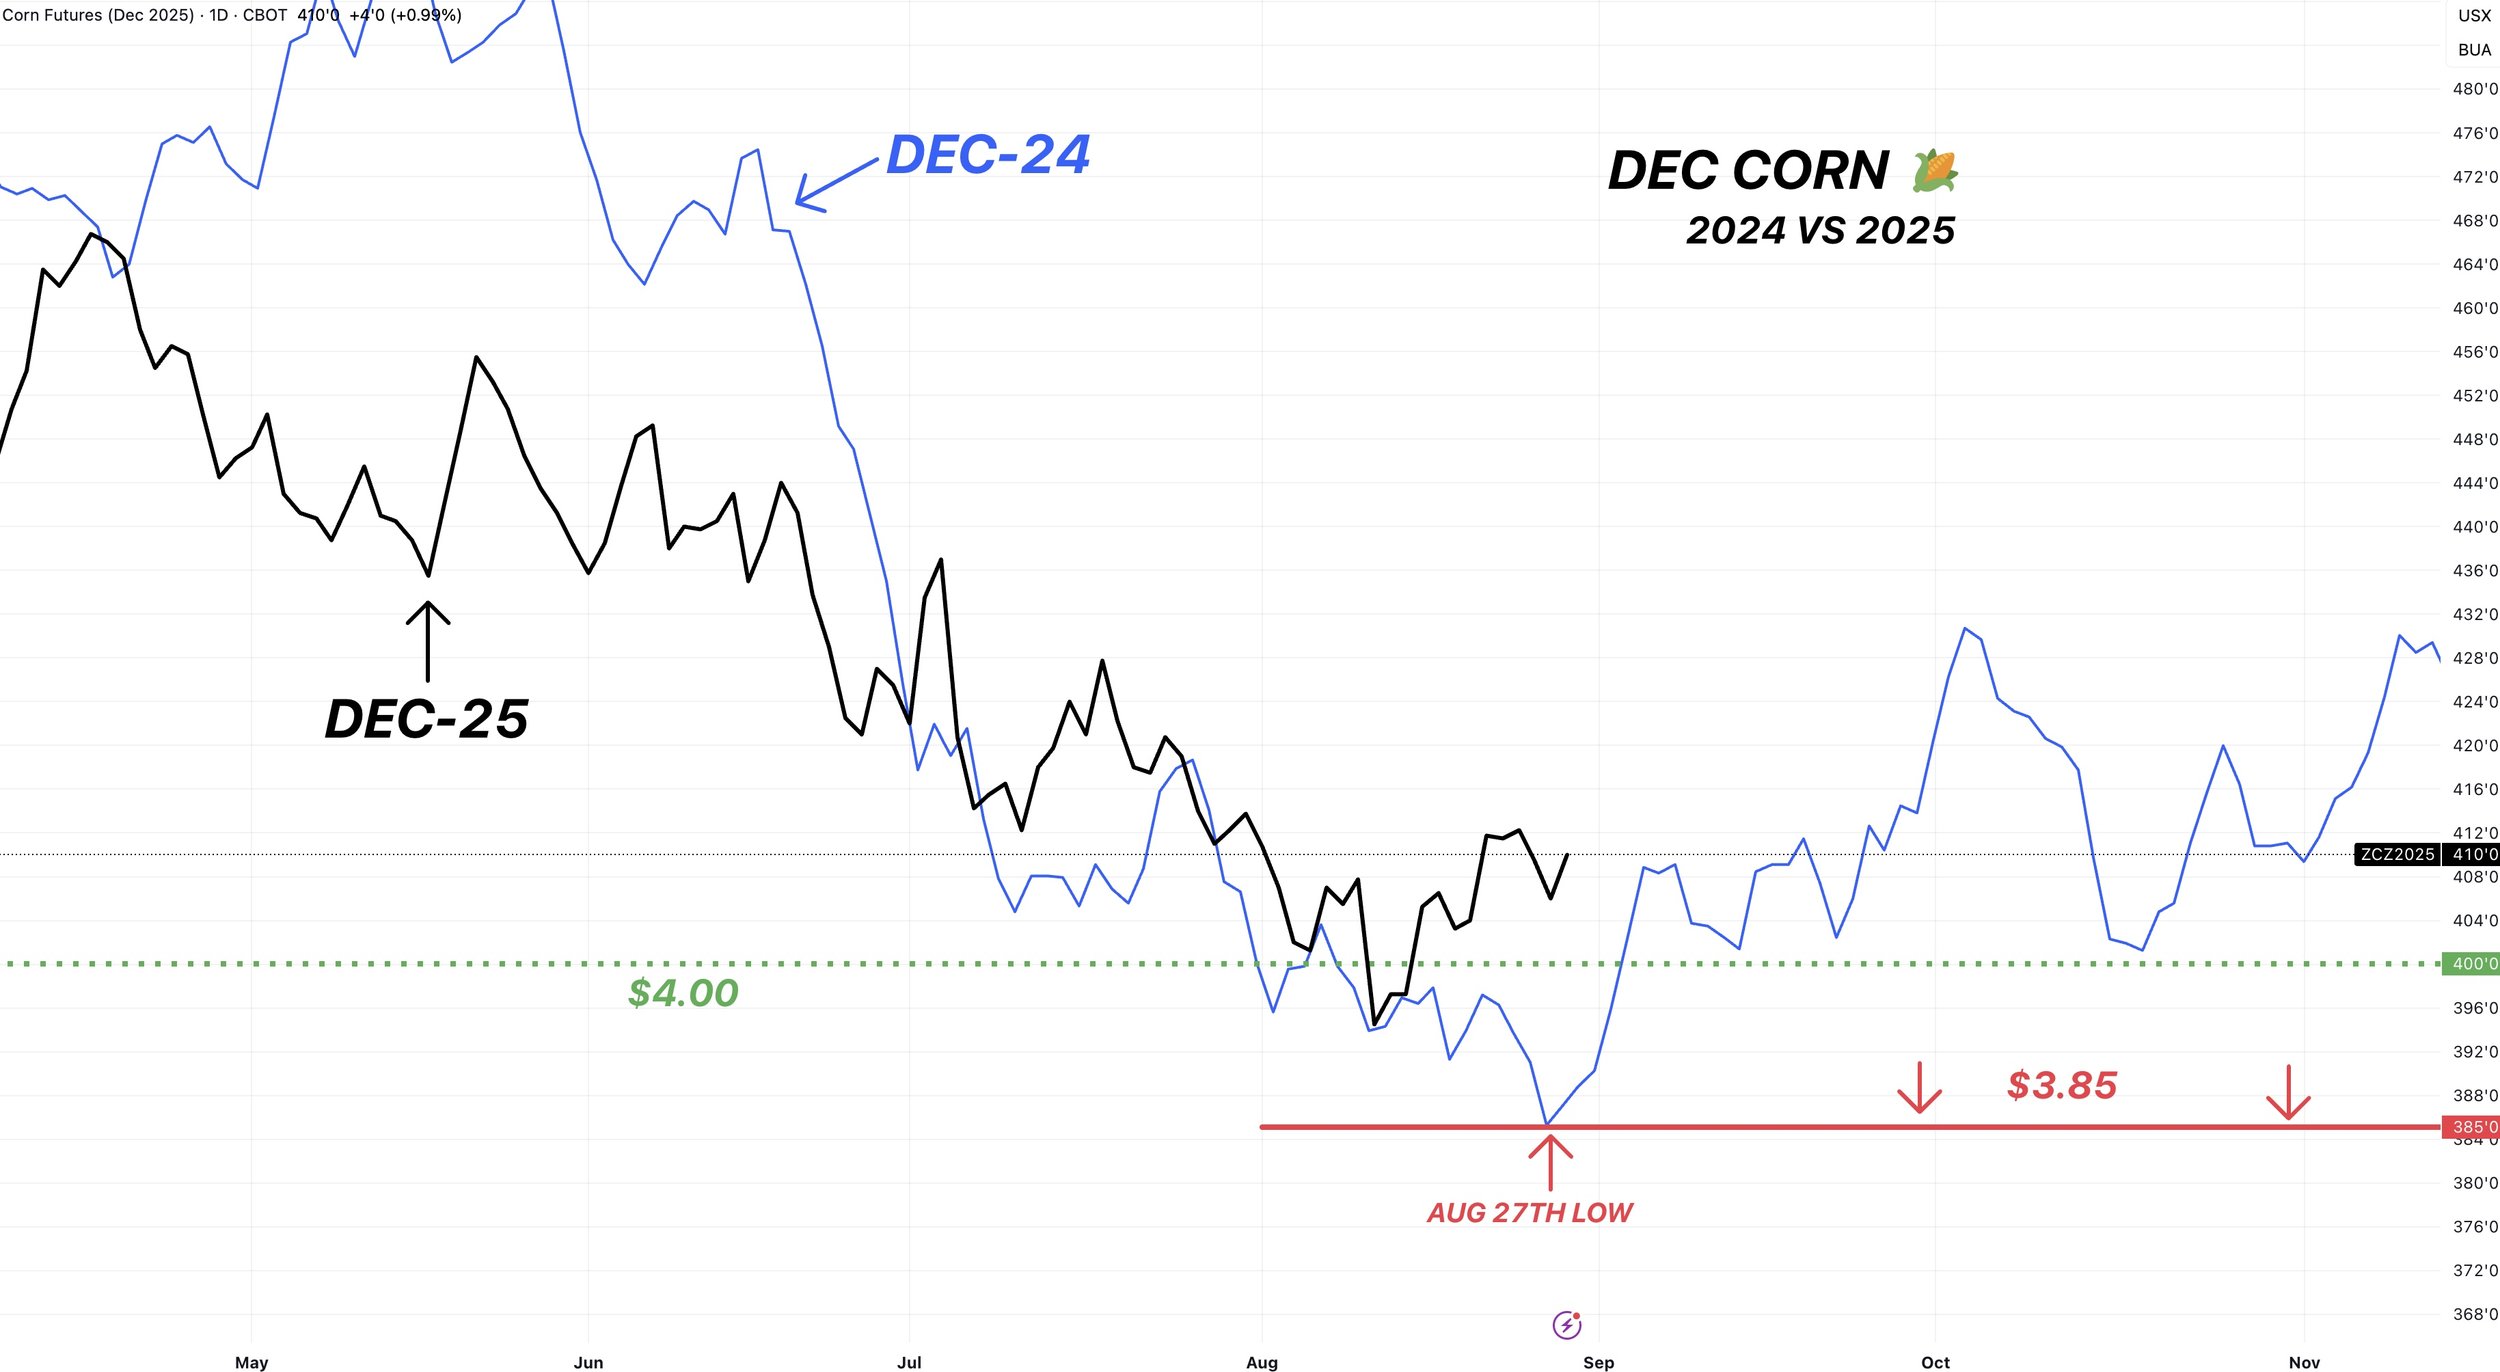
The 5 year seasonal says the bottom is in.
As this one bottomed right about where we did back in mid-August.
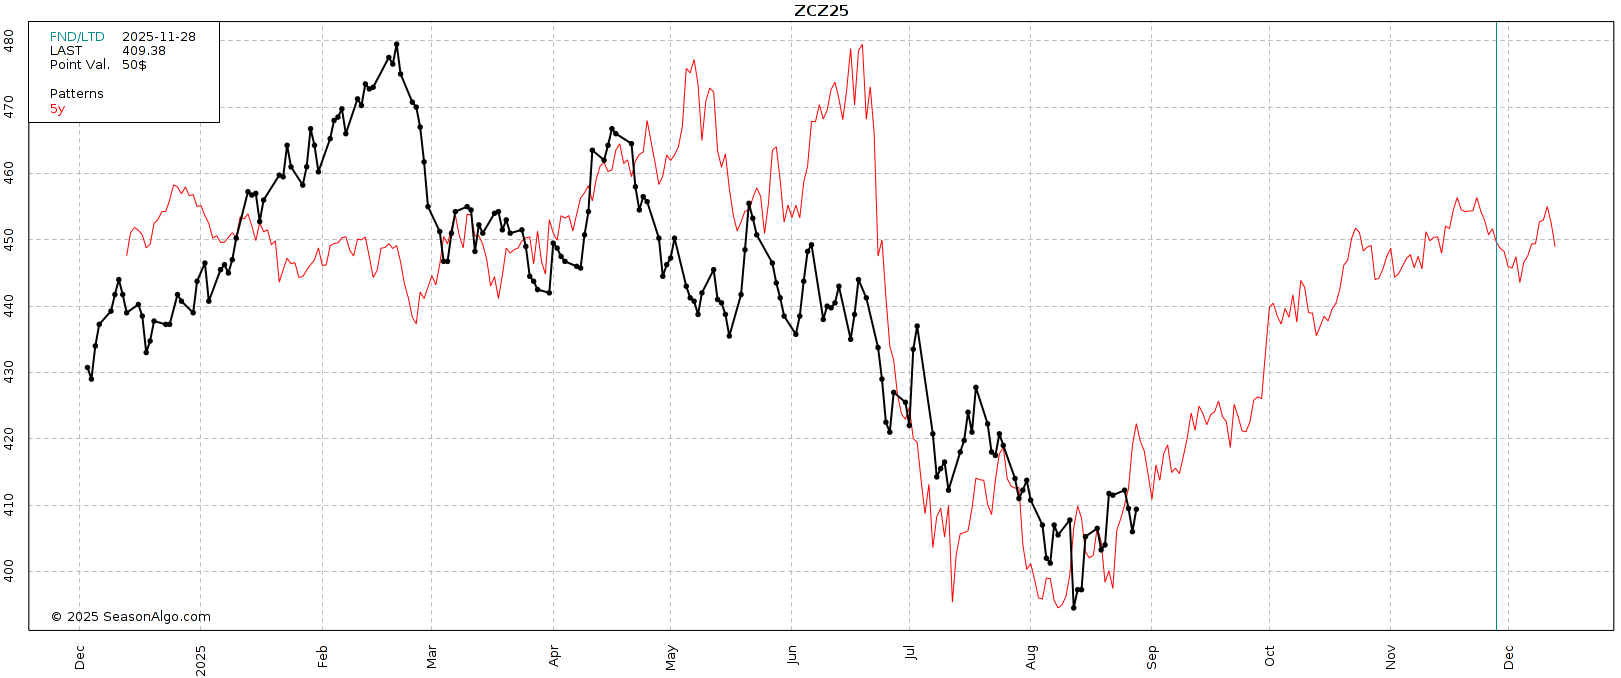
The 10 year seasonal also says the bottom is in.
As this one bottoms right about now.
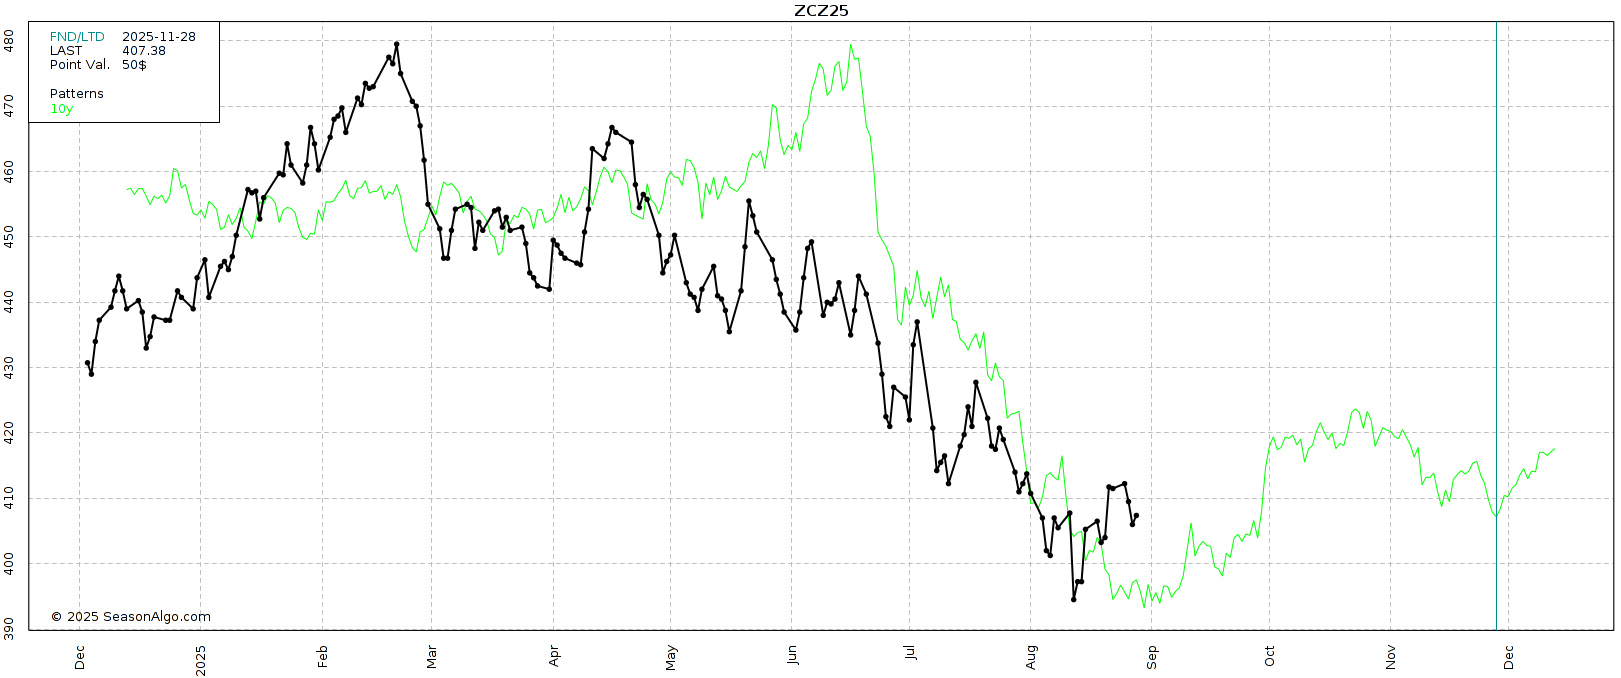
If we look at the month where Dec corn has posted it's lows the past 10 years.
50% of them occured in August or September.
This is seasonally when we bottom.
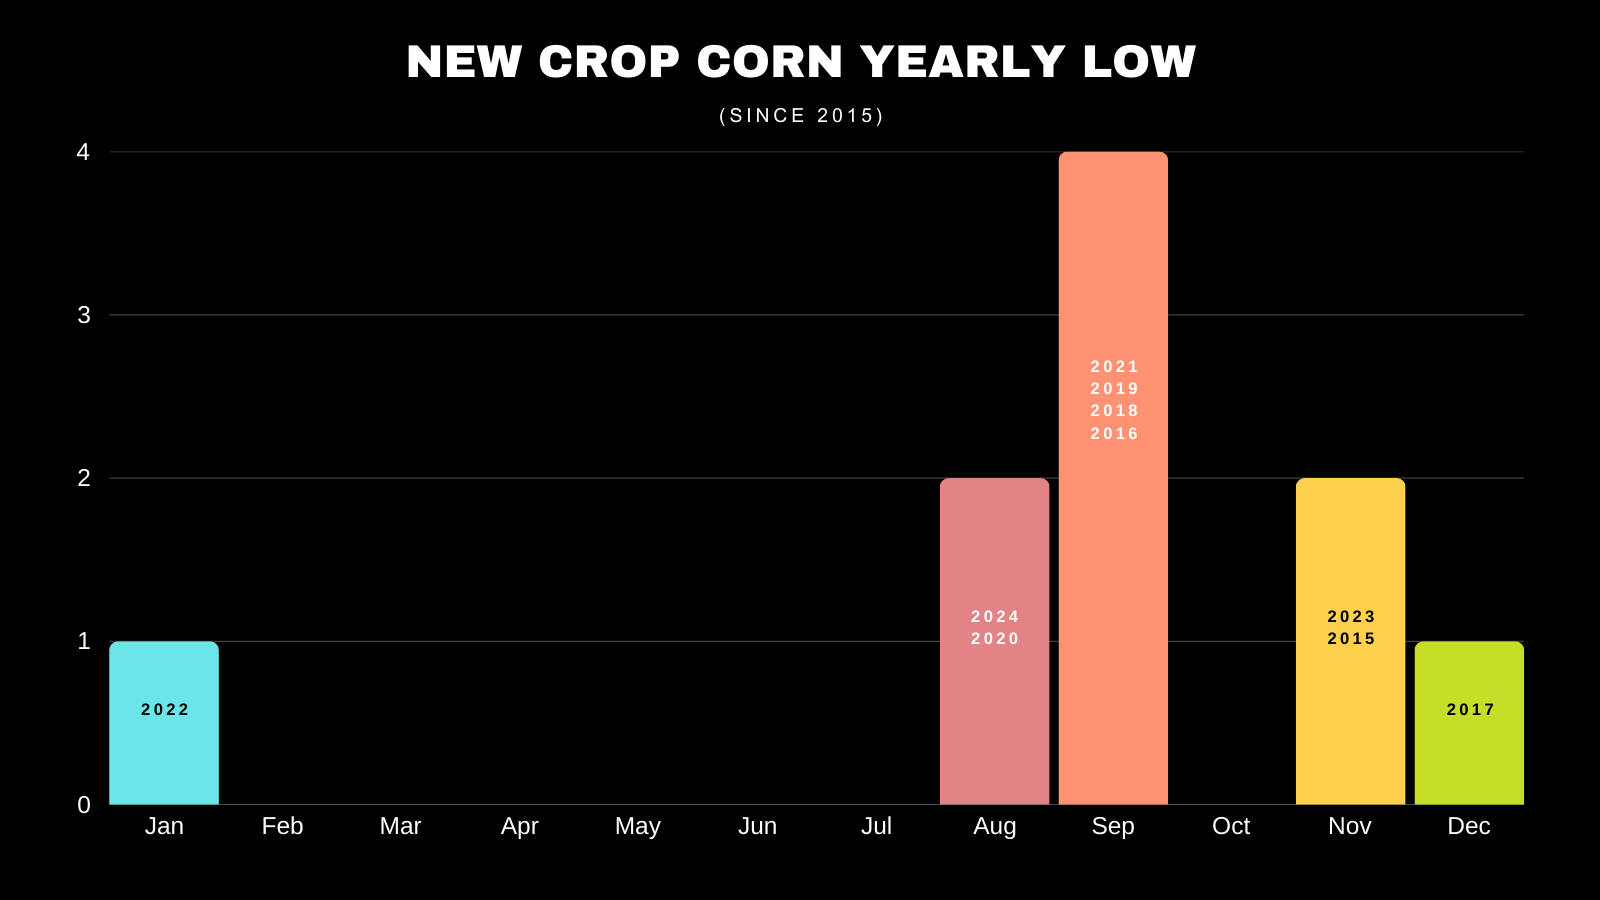
Is corn going to rally +50 cents in the next month? Doubtful.
At these levels, my bias leans higher long term towards next year and as we get into the acre battle.
But short term, it is still going to a battle to mustard a real major rally. I am talking anything north of $4.30 to $4.40.
The massive acres are going to be hard to overcome.
We have a record yield and record acres.
Higher corn prices is going to be a long process, because we do now have an extra +1 billion bushels of supply to chew through.
At the same time, I don’t think we spend much time below $4.00 if at all.
I think the blood shed is mostly over. But it isn’t time for a face melting rally either. If the lows are in, it's probably going to be more of a slow grind up.
It looks like the funds might finally be ready to stop selling this market. As they've been buying consistently for the first time since January.
Daily Dec Chart:
Corn perfectly bounced in that golden zone today.
The 50-61.8% retracements of this entire recent rally.
Good sign here. As that was the level we were looking for. That level was deep enough for a standard correction.
We also took out yesterday’s lows and closed right at yesterday's highs. Another good sign.
We still need to hold $4.01 to $4.04 or the next support is contract lows.
To the upside, if we take out $4.16 we could have a little room to run.
$4.16 is the 61.8% retracement up to the mid-July highs.
Which is exactly where we topped this recent rally at.
If we take out $4.16, I'd be confident the harvest low is in and odds would favor us heading higher.
I am not looking to de-risk unless we crawl into the $4.30 to $4.35 range. Which is where we have a ton of old support and resistance.

Here is a zoomed out chart of that support and resistance box.

Soybeans
The US and China are meeting in DC today or tomorrow but no one is expecting much to come of it.
Bears argue the problem is demand.
Which is valid. China still hasn’t bought any soybeans
However, US beans are cheaper than Brazil soybeans.
So you'd think that China would eventually come to the table. Why pay a premium?
Despite China having not bought any beans, one could argue soybean demand has actually been kind of good.
New crop soybean sales to everywhere except China and unknown destinations are the 2nd highest of all-time.
Only behind the actual 2018 trade war.
Demand to China is the only bad thing about soybean demand. The demand to everywhere else has been above average.
Here is a great chart from Karen Braun showing that.
Unlike corn, the loss of 2.5 million acres in the last USDA report completely shifted the balance sheet trajectory for beans.
If you just look at the balance sheet, you can’t help but have a friendly bias.
Disregarding demand concerns, this alone has the chance to spark an opportunity soybeans down the line.
Who knows if yield is 52 or 54.
Even if yield is 54, based on the current demand numbers, our carryout would still be lower than last year. This is soley due to less acres. That isn’t bearish.
A 52 yield would evaporate the carryout. Which would still be a record yield.
Based on the weather we saw in August, you have to question how big this crop really is at the end of the day.
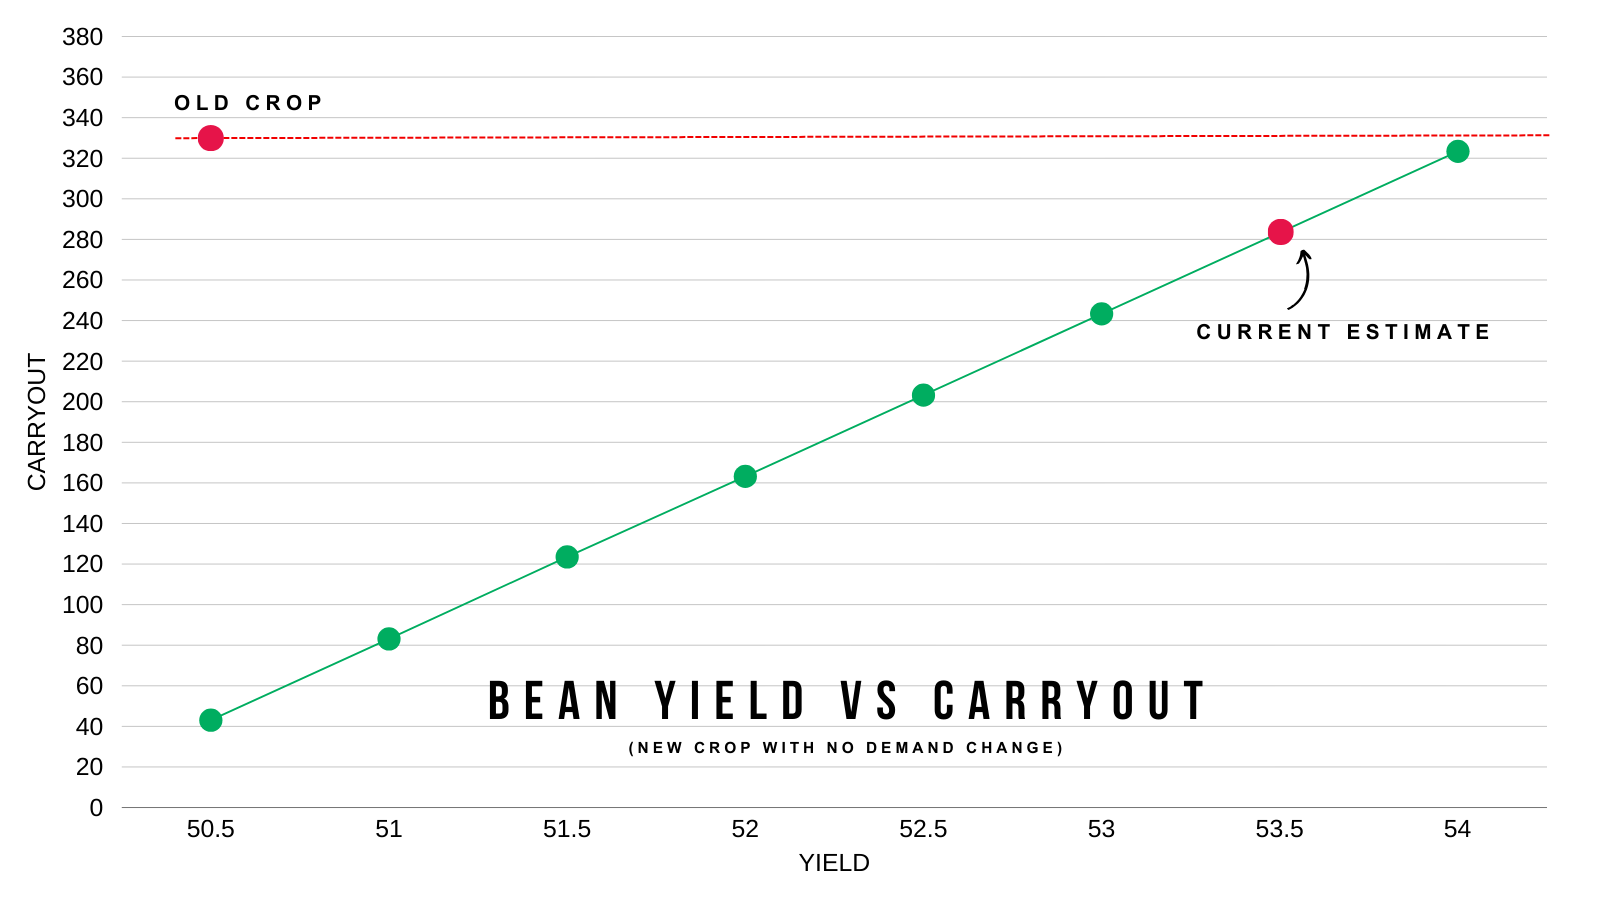
Until China starts buying, our upside is probably limited.
However, we are one trade deal away from explosive potential in soybeans.
Daily Nov Chart:
Good action in soybeans today.
We bounced right at the 61.8% retracement level of the recent mini rally.
Bulls need to there. If we fail to hold $10.40, it could easily spark a leg lower.
If $10.40 fails, the downside target would be the $10.12 to $10.22 area. Which gives back 50-61.8% of the entire rally off of $9.80
Even if we fell to $10.12, the bullish structure of this chart would still be in place. That level is seen as the line in the sand for bullish bias to remain.
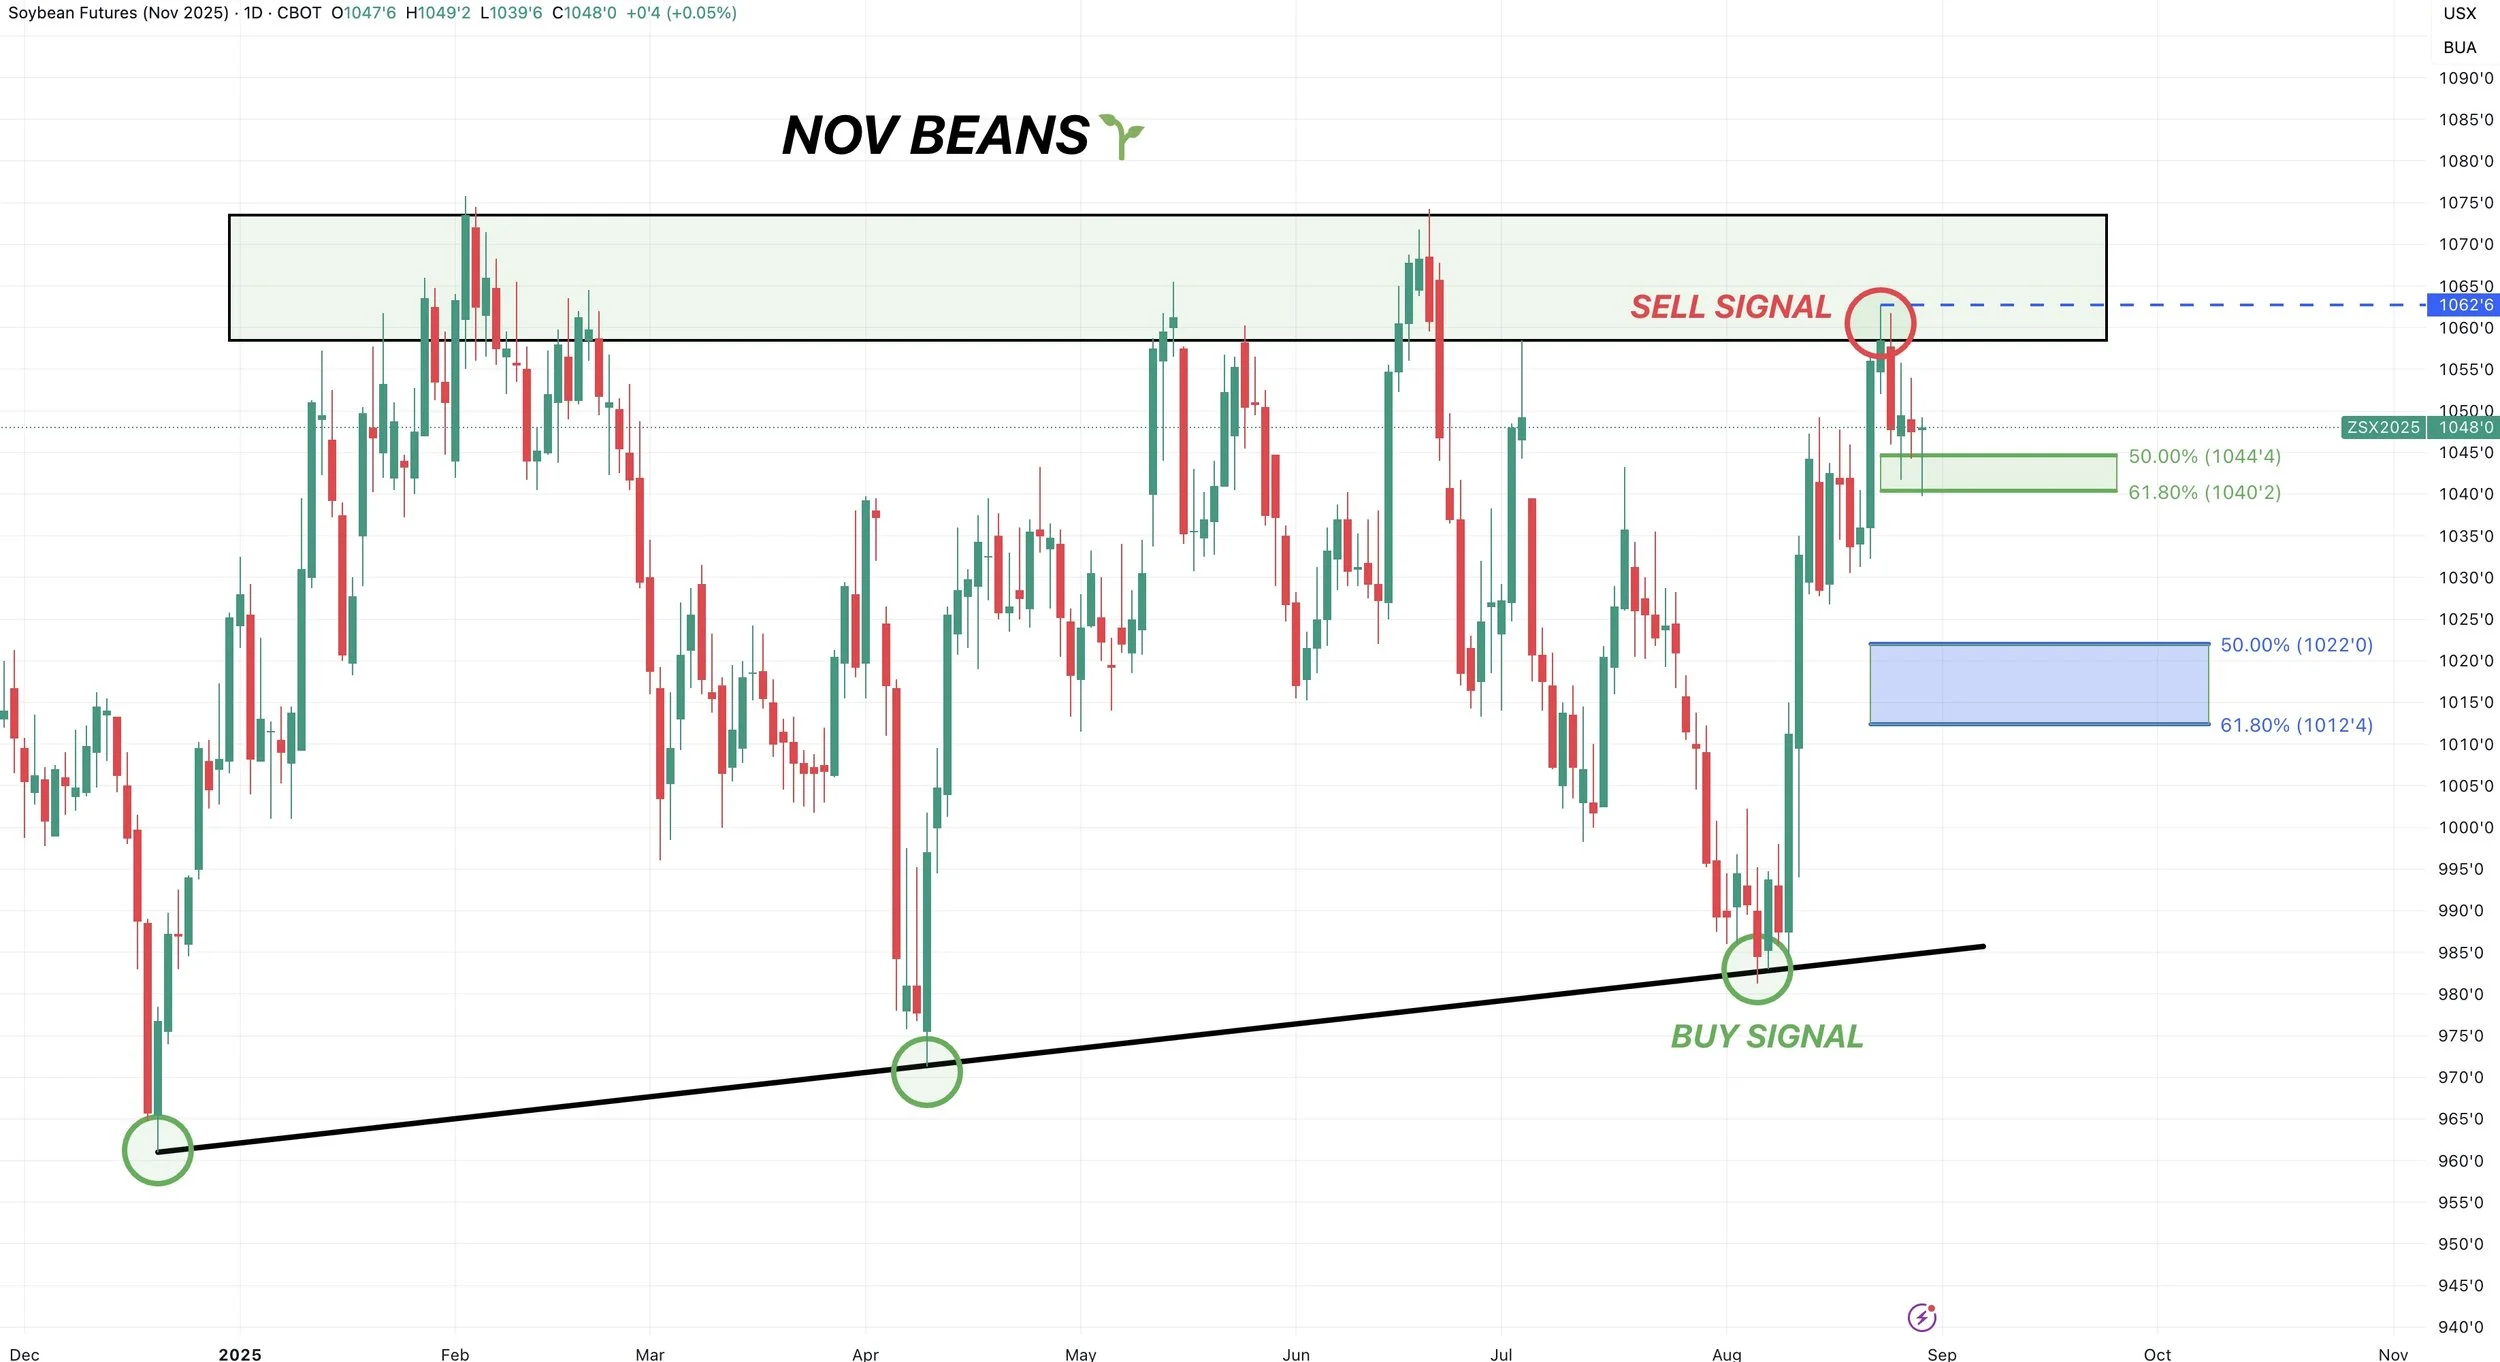
We had a sell signal last Friday.
The plan for our next sell signal is if we crawl up to the $10.80 to $10.82 range.
This is our target for a multitude of different reasons.
First reason is that $10.82 is gives us back exactly 50% of the highs from May 2024.

If we look at the contiuous chart, every single major rally over the last year has topped out at $10.80 on the front month contract.
Break above and there is incredible upside potential.
But until then.. it is seen as resistance and our next target.
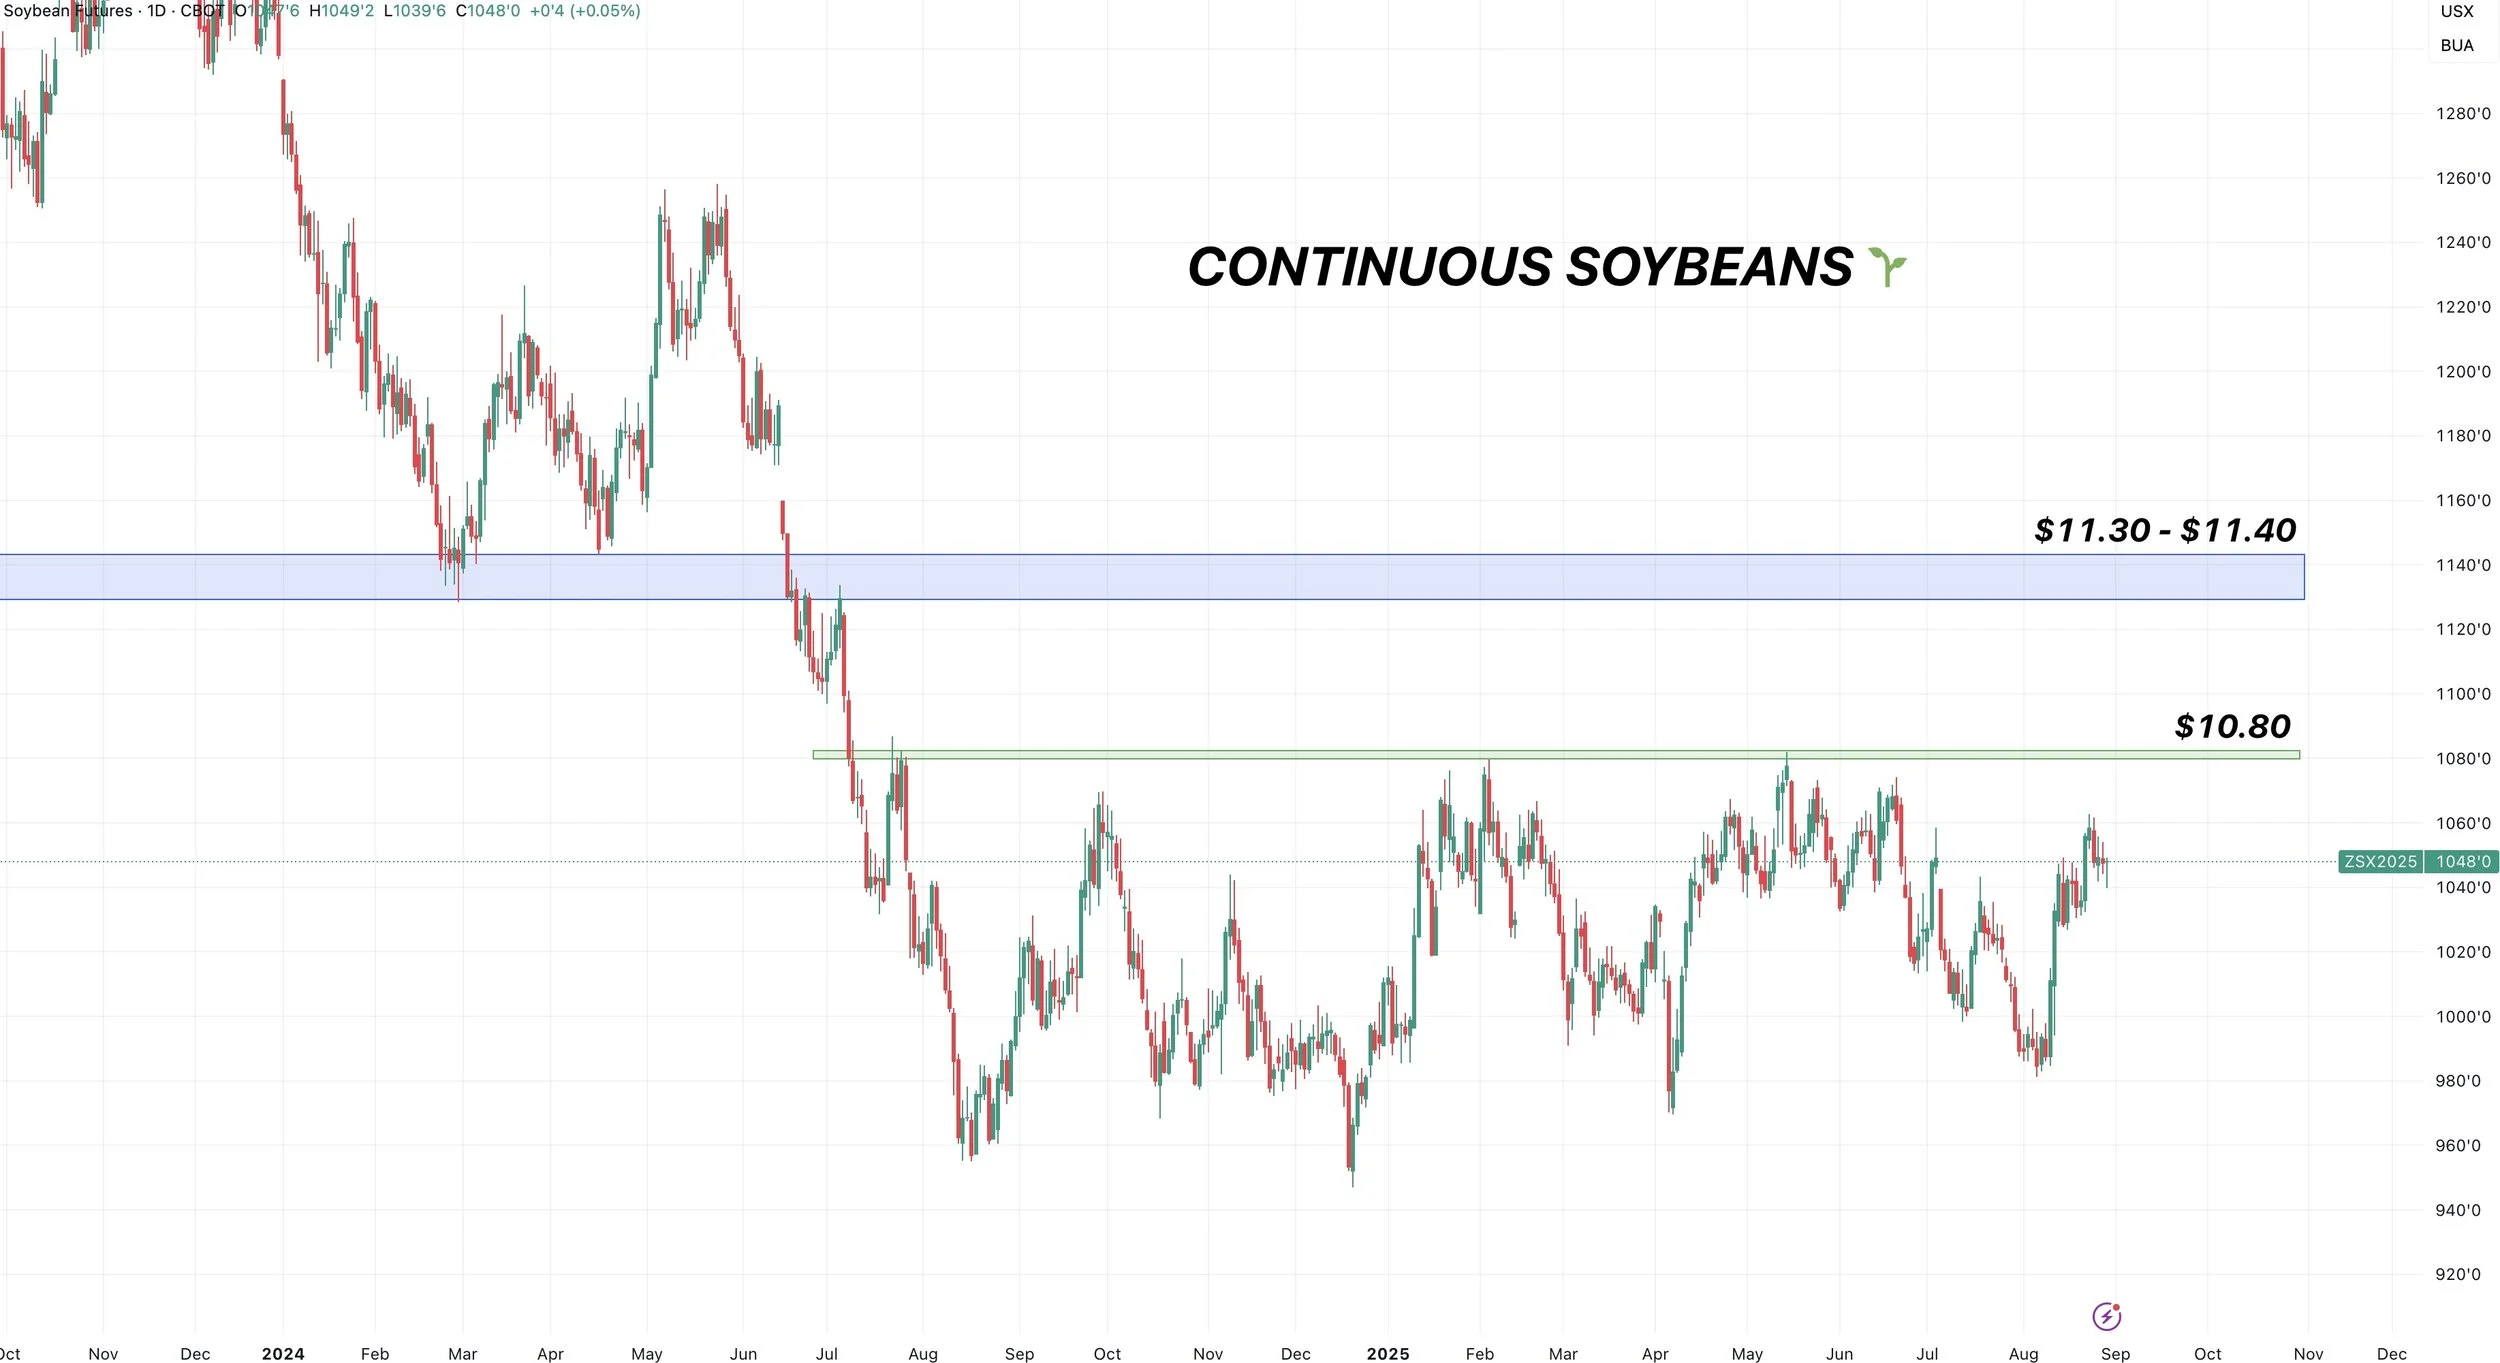
Wheat
Good price action in the wheat market today.
Overall we continue to struggle despite phenomenal demand.
Wheat export sales are at historically strong levels.
The 10 year seasonal says we bottom here pretty soon within the next week or two.

Last year the wheat market bottomed on August 27th.

Other than strong demand, there isn’t anything new to update fundamentally.
Seasonally we bottom soon.
The charts are showing a little bit of reasons to be optimistic.
Overall I still think the wheat market has more upside than downside potential here.
Last Wednesday we had a buy signal for wheat. That signal still stands and I still see wheat at an area of value here.
Daily Chicago:
On the recent mini bounce, we rejected the 61.8% retracement of the recent sell off.
So the level to watch is $5.33
If we break above, it should spark a leg higher. If you notice, we rejected that level for 5 straight days. So it is big resistance.
Break above there and I'd be more confident saying the lows are in.
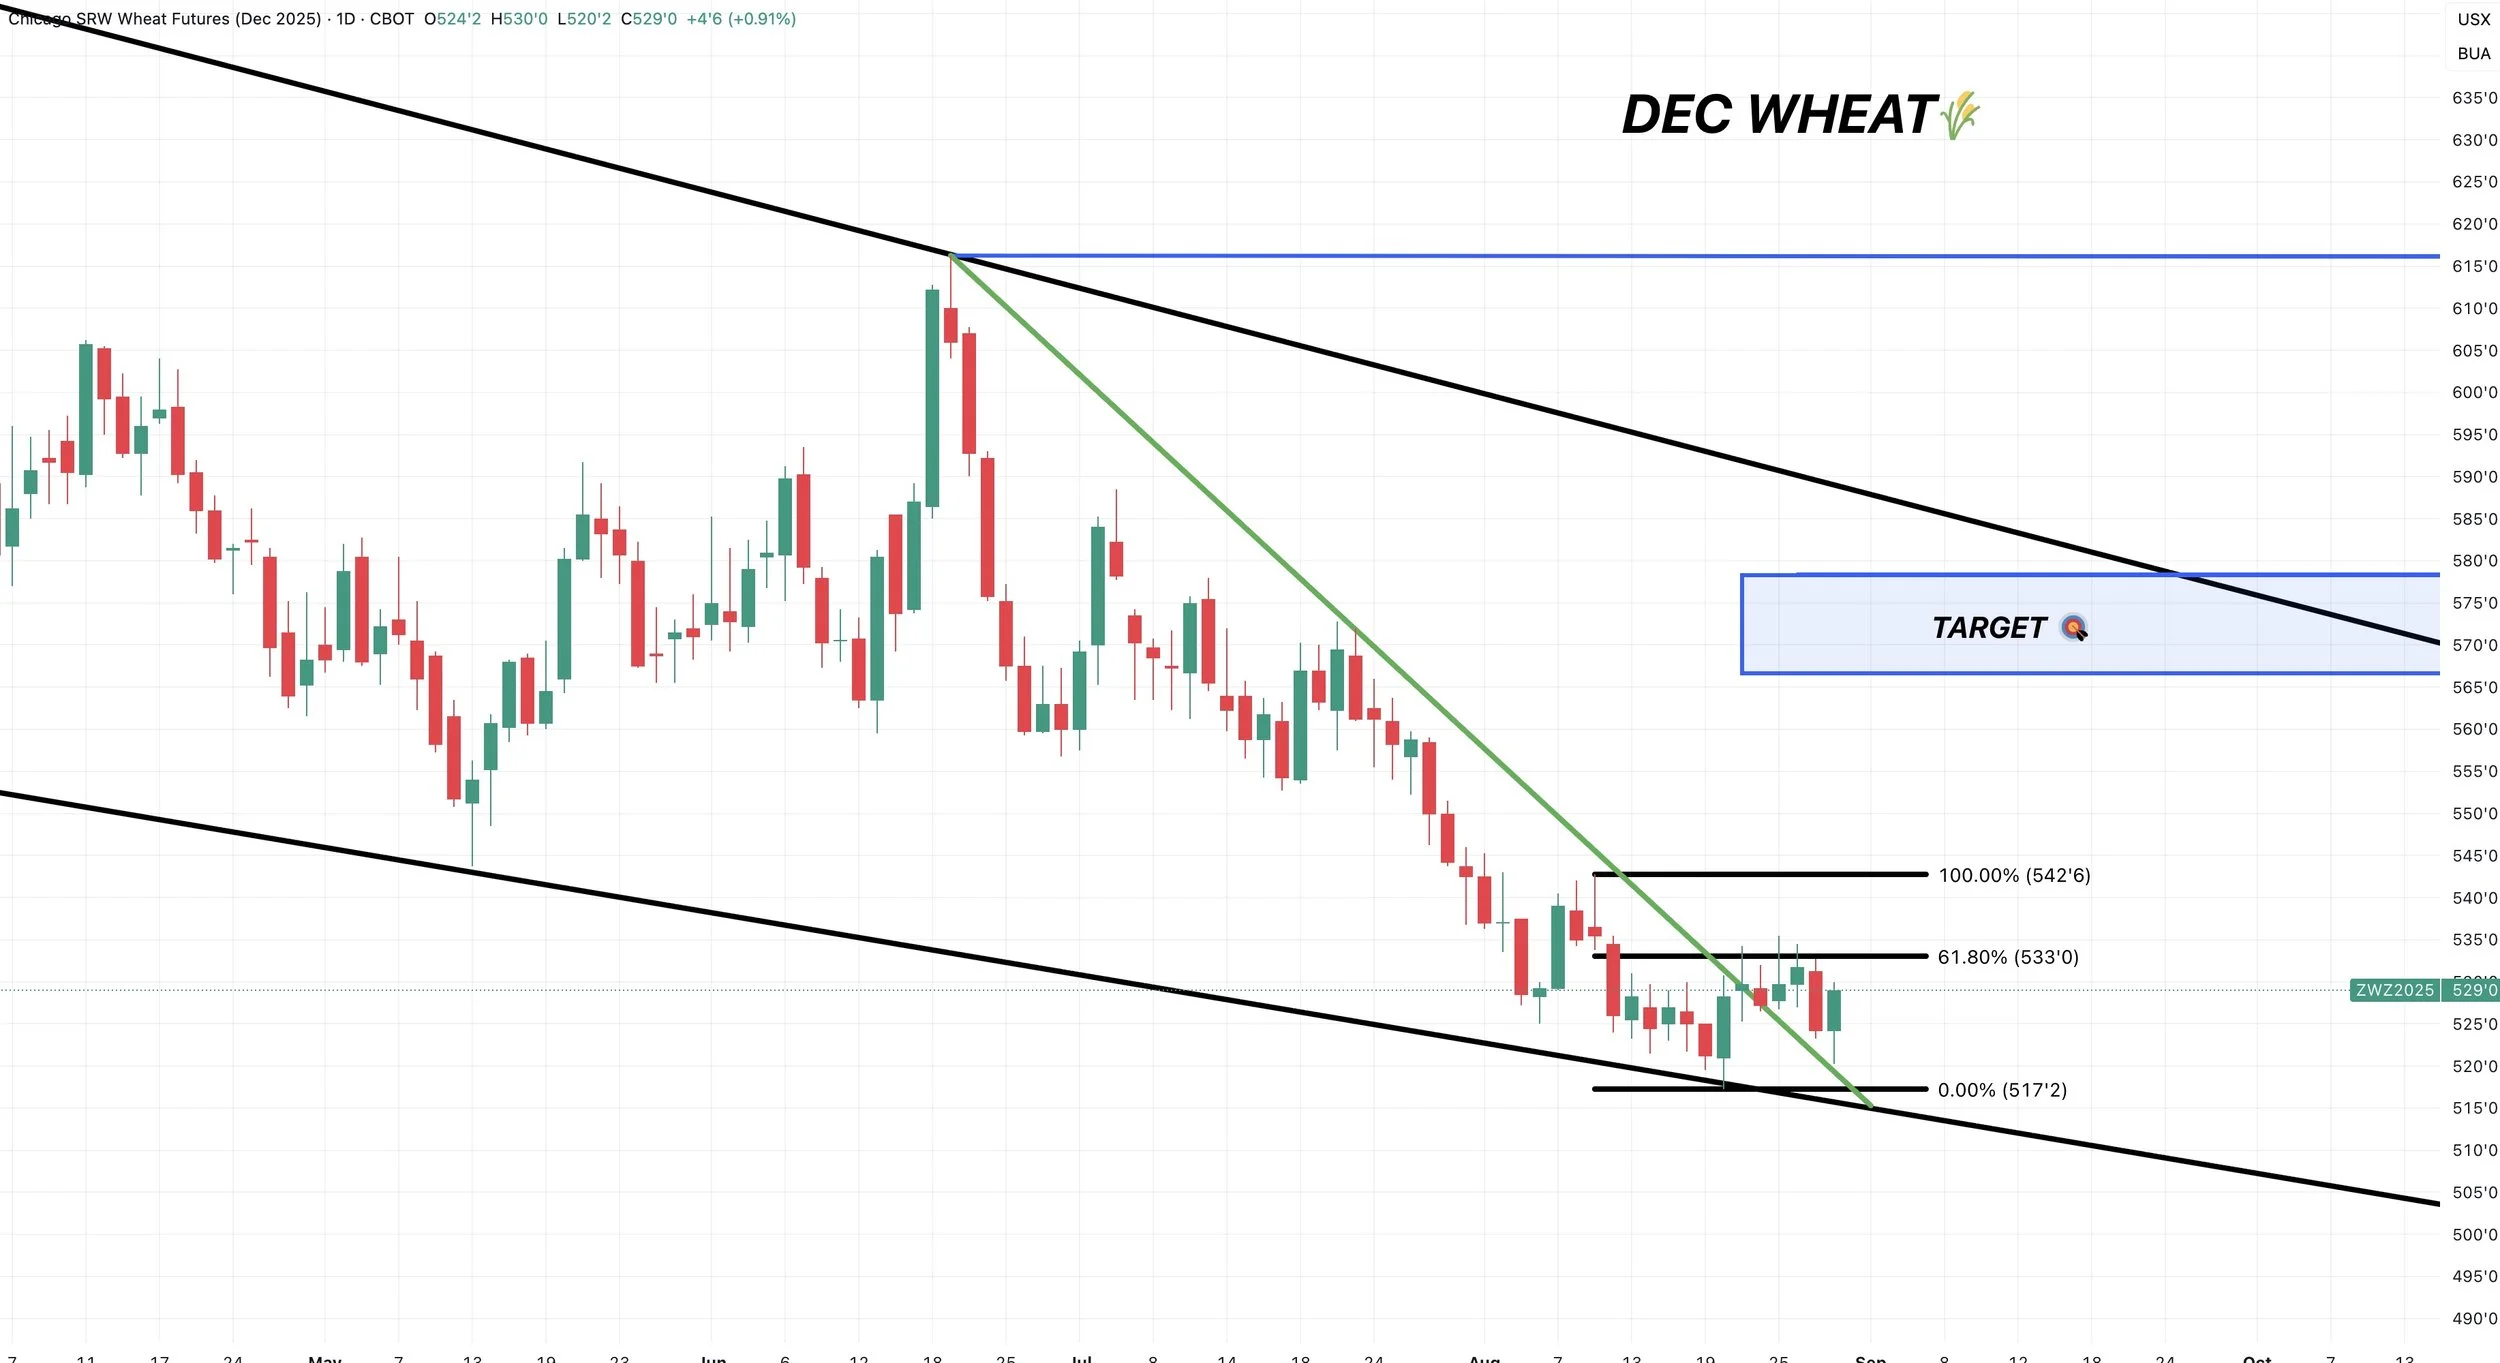
Here is the chart zoomed out.
We were sitting in a falling wedge pattern that we are potentially breaking out of.
This is seen as a bullish pattern.
Eyeing the blue box as a target.
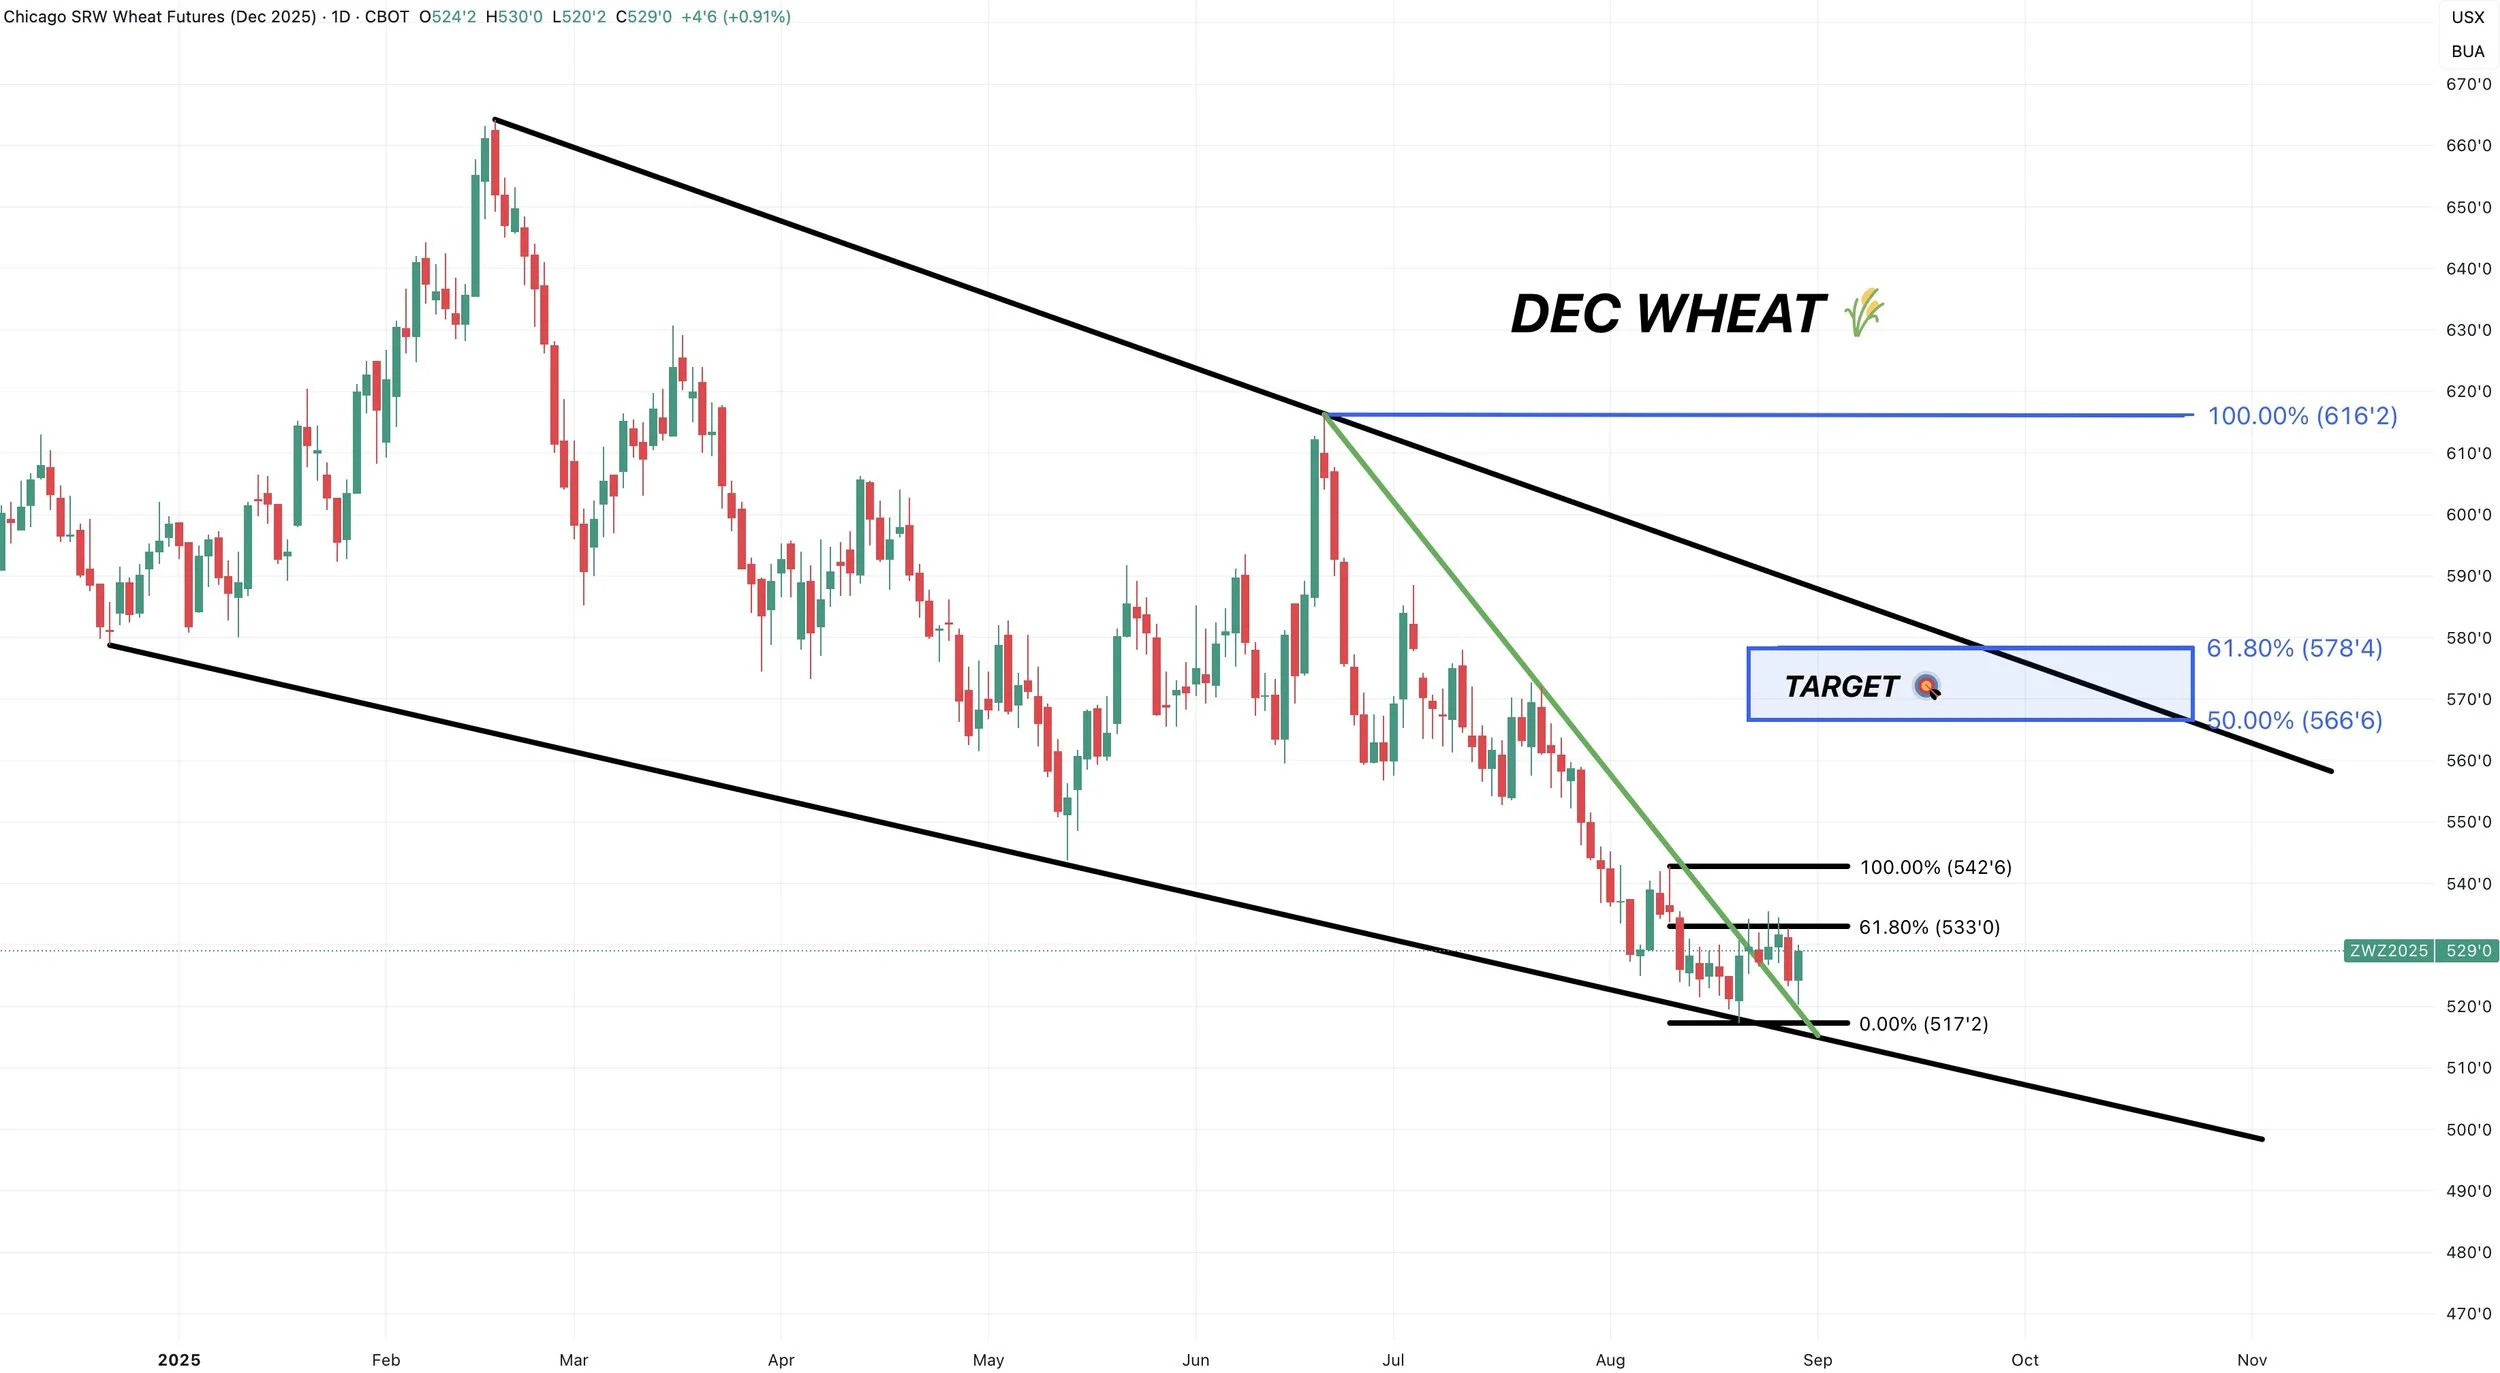
Daily KC Wheat:
Despite posting new contract lows, KC wheat is also sitting in a falling wedge pattern.
Which is a bullish pattern.

Continous KC Wheat:
When the continuous chart rolled from Sep to Dec, it left a roll gap.
As Dec was trading at a premium to Sep wheat.
Today we almost perfectly filled that gap before bouncing and reversing higher.
This is something to be optimistic about.
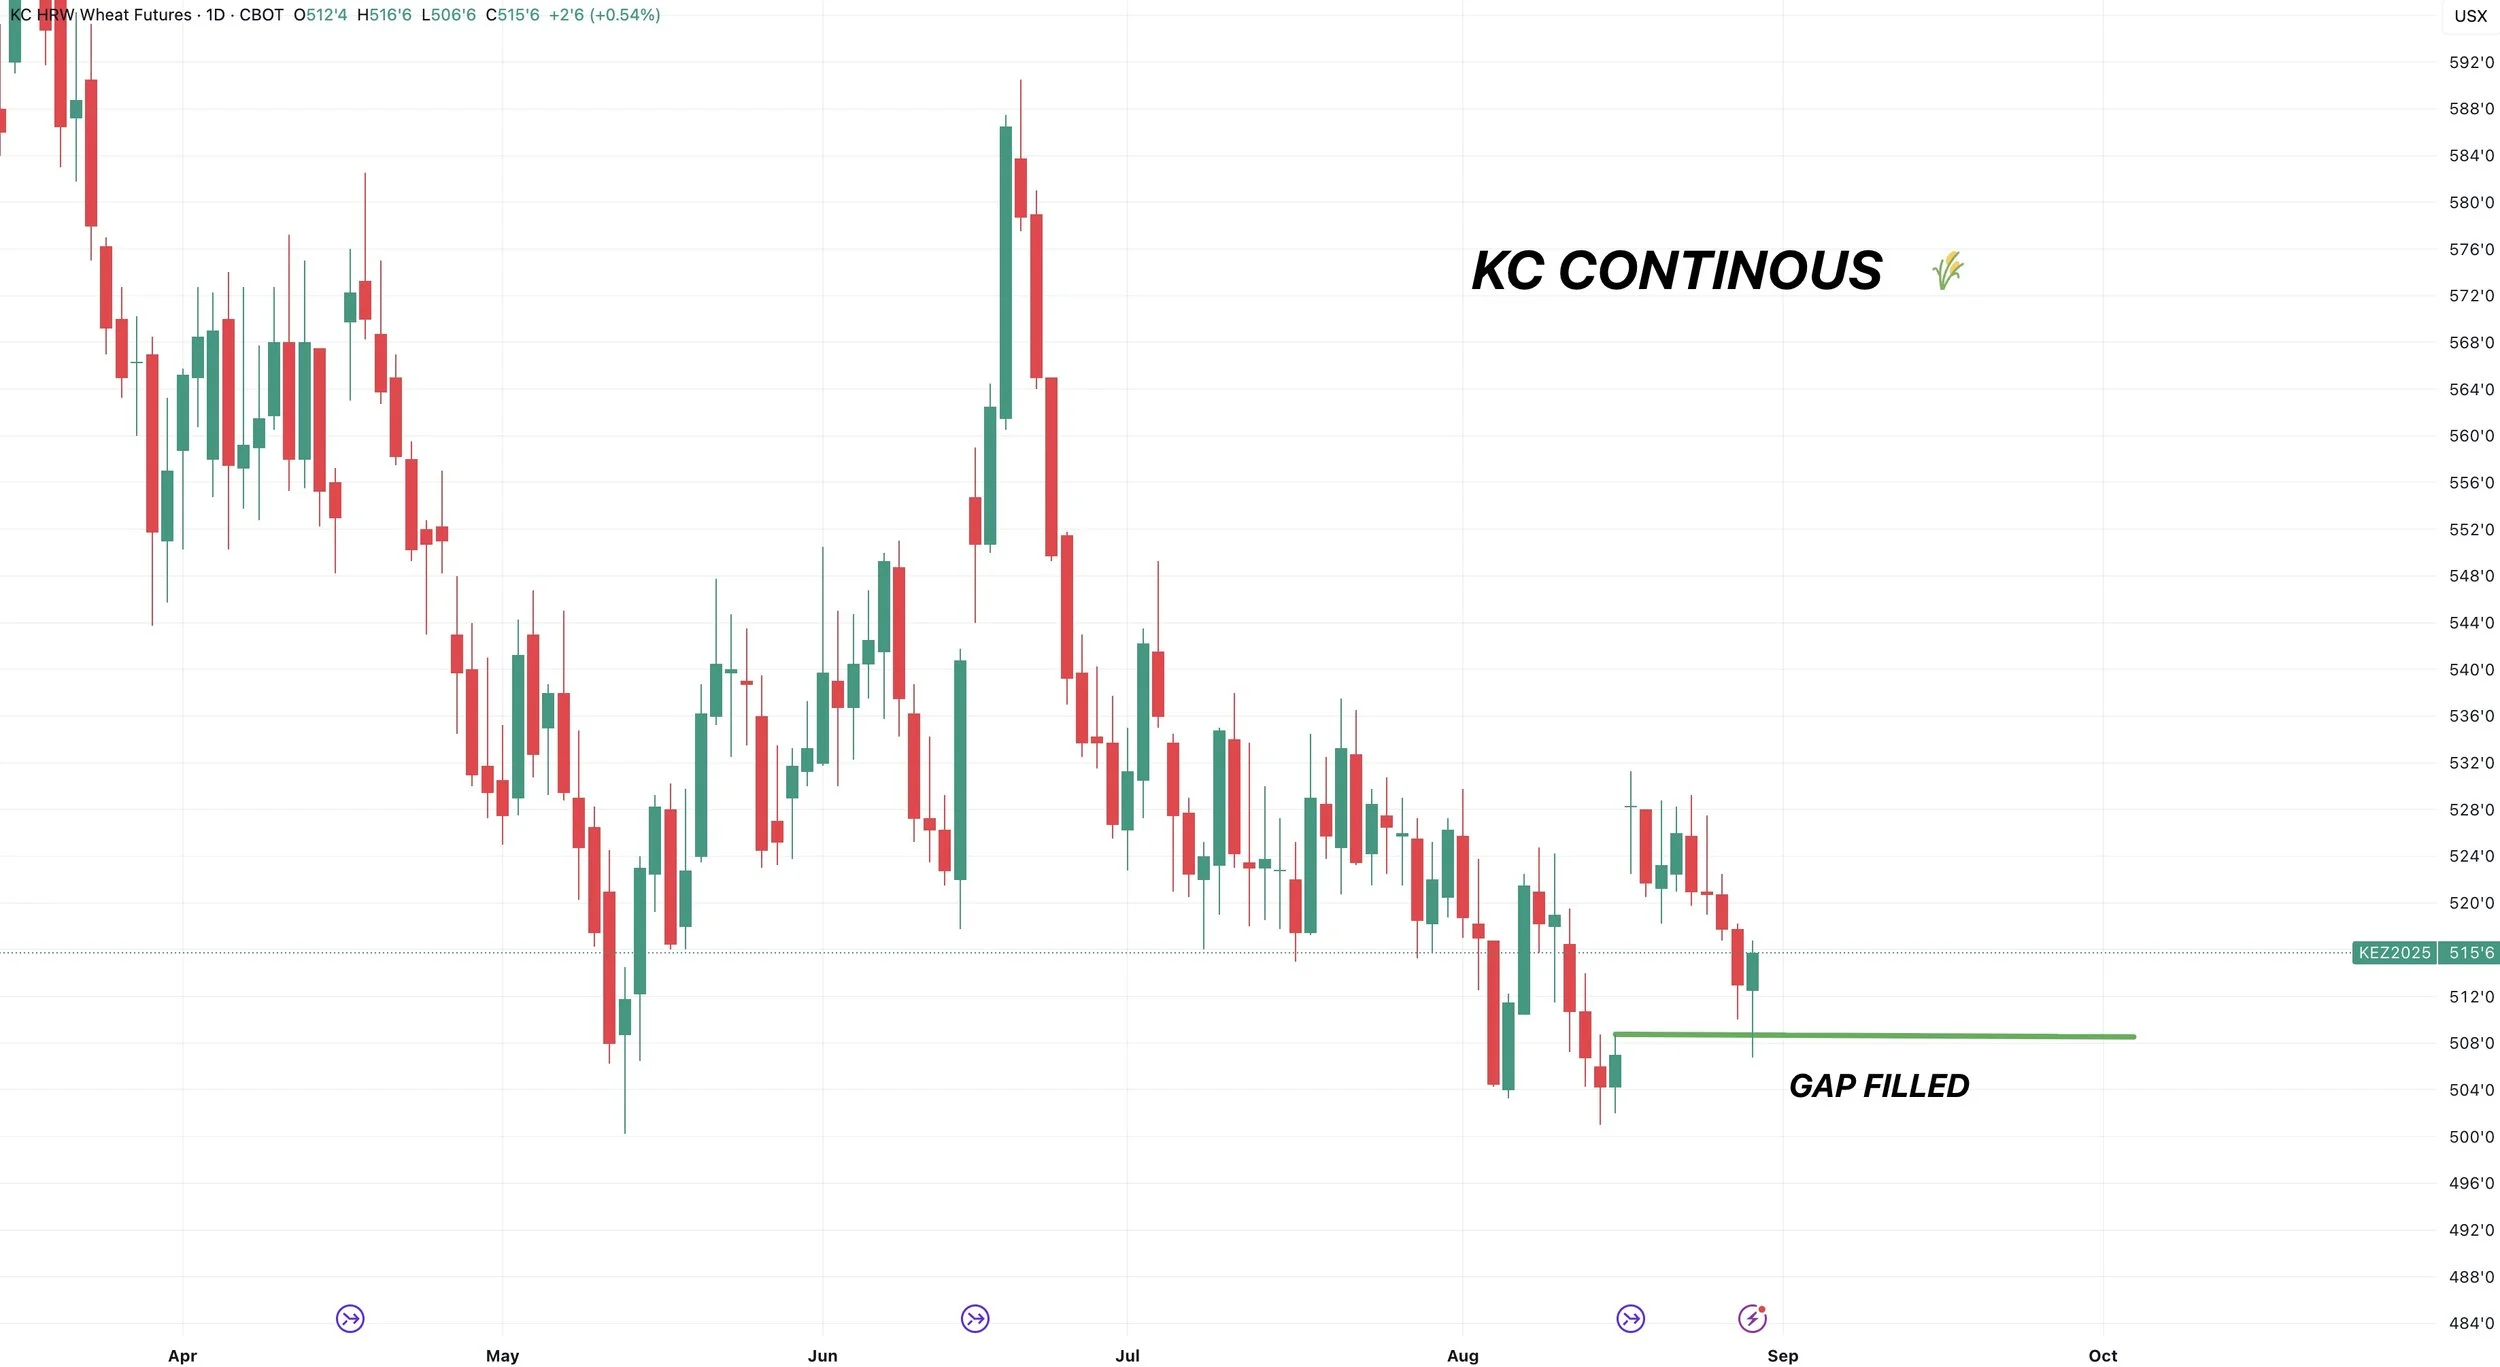
If you look at last year, we saw a very similar thing happen.
When contracts rolled, we left a gap.
A few days later we filled the gap, before finding a bottom on August 26th.
Cattle
Jim Cramer talked about cattle yesterday on Mad Money.
If you know anything about Jim Cramer, he is notoriously known for being wrong.
There are several examples of where he says he likes something and it marks a top, or he says he hates something and it marks a bottom.
This doesn’t have anything to do with cattle fundamentally, but a lot of times when a market makes headlines like this it can mark a local top.
Basically, a boat is fullest before it tips.
Thoughts from Lauren Urbanczyk:
Lauren is our partner who specializes in cattle. This is what she had to say about the market:
Yesterday both live & feeder cattle made new contracts highs but closed well off their highs.
Open interest was significantly lower yesterday in live cattle. That is what we would describe as a blow off top. However, we've seen that a few times before.
We haven’t had two down days in a row since May. I can’t remember the last time we've seen three down days in a row. However, you can only get so high.
Beef has been up the past 2 weeks in preparation for Labor Day buying and demand. So we have to question if that demand will follow through after the holiday.
We also have August live & feeder cattle expiring. If we do get a trend change, it wouldn't be surprising to see that happen at contract expiration or option expiration. It is too early to confirm we've seen the highs, but we have all of the signs of it showing.
We also have month end approaching tomorrow. The funds have a very large long position. We could see some profit taking at the end of the month. Last month at month end, the board was down hard but then of course resumed higher a couple days later. We would potentially expect weakness tomorrow with the month end. Will that be enough to trigger two or three down days in a row? That is to be determined.
We recommend using caution up here. These prices are high enough that we would look at any and all risk management strategies, custom tailored to fit your operation.
We have been rolling up calls and rolling up puts this week to capture the equity in the market. If you have LRP on that is out of the money, we can add put spreads to protect those.
Give us a call if you want to talk or have questions.
Lauren: (979)-587-9252
Jeremey: (605)295-3100
Sep Feeder:
Yesterday we left a nasty looking candle.
We posted new highs, but then reversed hard and nearly gave back the entire days rally.
Then today we followed that up with weakness.
This price action is definitely a reason to be concerned in this market.
The real warning sign is going to be this upward channel. If we break the uptrend, it could spark a real leg lower. As this market has gone straight up for months.
If this truly was the local top, we could fall as far as that blue box. That is the downside target.

Past Sell or Protection Signals
We recently incorporated these. Here are our past signals.
Aug 22nd: 🌱
Soybean sell signal & hedge alert.
July 31st: 🐮
Cattle sell signal & hedge alert.
July 10th: 🐮
Cattle sell signal & hedge alert.
CLICK HERE TO VIEW
June 5th: 🐮
Cattle sell signal & hedge alert.
June 2nd: 🌾
MPLS wheat sell signal.
April 10th: 🌽
Old crop corn sell signal.
March 19th: 🐮
Cattle hedge & sell signal.
Feb 18th: 🌽 🌾
Old crop KC wheat & old crop corn signal.
Jan 23rd: 🌽 🌱
Corn & beans old crop sell signal.
CLICK HERE TO VIEW
Jan 15th: 🌽 🌱
Corn & beans hedge alert/sell signal.
Jan 2nd: 🐮
Cattle hedge alert at new all-time highs & target.
Dec 11th: 🌽
Corn sell signal at $4.51 200-day MA
CLICK HERE TO VIEW
Oct 2nd: 🌾
Wheat sell signal at $6.12 target
Sep 30th: 🌽
Corn protection signal at $4.23-26
Sep 27th: 🌱
Soybean sell & protection signal at $10.65
Sep 13th: 🌾
Wheat sell signal at $5.98
May 22nd: 🌾
Wheat sell signal when wheat traded +$7.00
Want to Talk?
Our phones are open 24/7 for you guys if you ever need anything or want to discuss your operation.
Hedge Account
Interested in a hedge account? Use the link below to set up an account or shoot Jeremey a call at (605)295-3100.
FIRST NOTICE DAY PRESSURE. CATTLE MARGIN CALLS OVER?
AUDIO COMMENTARY
Trend is your friend in cattle
Today’s candle makes pause in cattle
Cattle making news headlines
Ride it up and protect with short term puts
Margin eating guys alive in cattle. Utilize a strategy
Could see short term weakness in corn with first notice day
What to do with your basis contracts
Weather is taking bushels off
Don’t get backed into a corner if you know you will be forced to supply the market
If your beans go to China, capture the carry & don’t deliver. Basis could get worse
Do not give in and sell a horrible basis
Still like owning wheat down here
No one is going to sell corn after being forced to sell here
Made corn lows today a year ago
Ugly candle in cattle today (chart below audio)*
Areas we need to hold (charts below audio)*
Corn, beans & wheat chart below audio*
Listen to todays audio below
Want to talk? (605)295-3100
Want every update & our next signal?
Since your free trial ended you no longer receive all of our daily updates & will not receive our next sell signal.
Take advantage of our Labor Day if you’d like full access.
CHART BREAKDOWNS
Dec Corn 🌽
We rejected right off the 61.8% level up to the mid-July highs as expected.
Now I am looking for us to test the golden zone of this entire mini rally.
That comes in at $4.01 to $4.04
We need to hold that area, or it opens the door to test those contract lows.
Whether we bounce there or not will tell us if this is just a pullback or part of a deepr correction.
To the upside, as I have been mentioning, we need to close above $4.16 to confirm we are headed higher. Until we do so, this entire rally is seen as a correctional bounce.

Nov Beans 🌱
Currently hovering above the golden zone retracement of this recent mini rally.
That comes in at $10.40 to $10.44
Ideally, we hold here. That would be a standard correction level.
If we break below the green box, it opens the door to test the bigger picture golden zone of this entire rally. Which comes in at $10.12 to $10.22 (blue box).
So $10.40 is an important spot to hold short term.
If we break above those recent highs, I think it opens to the door to test the $10.80-85 range. But need to hold this green box first.
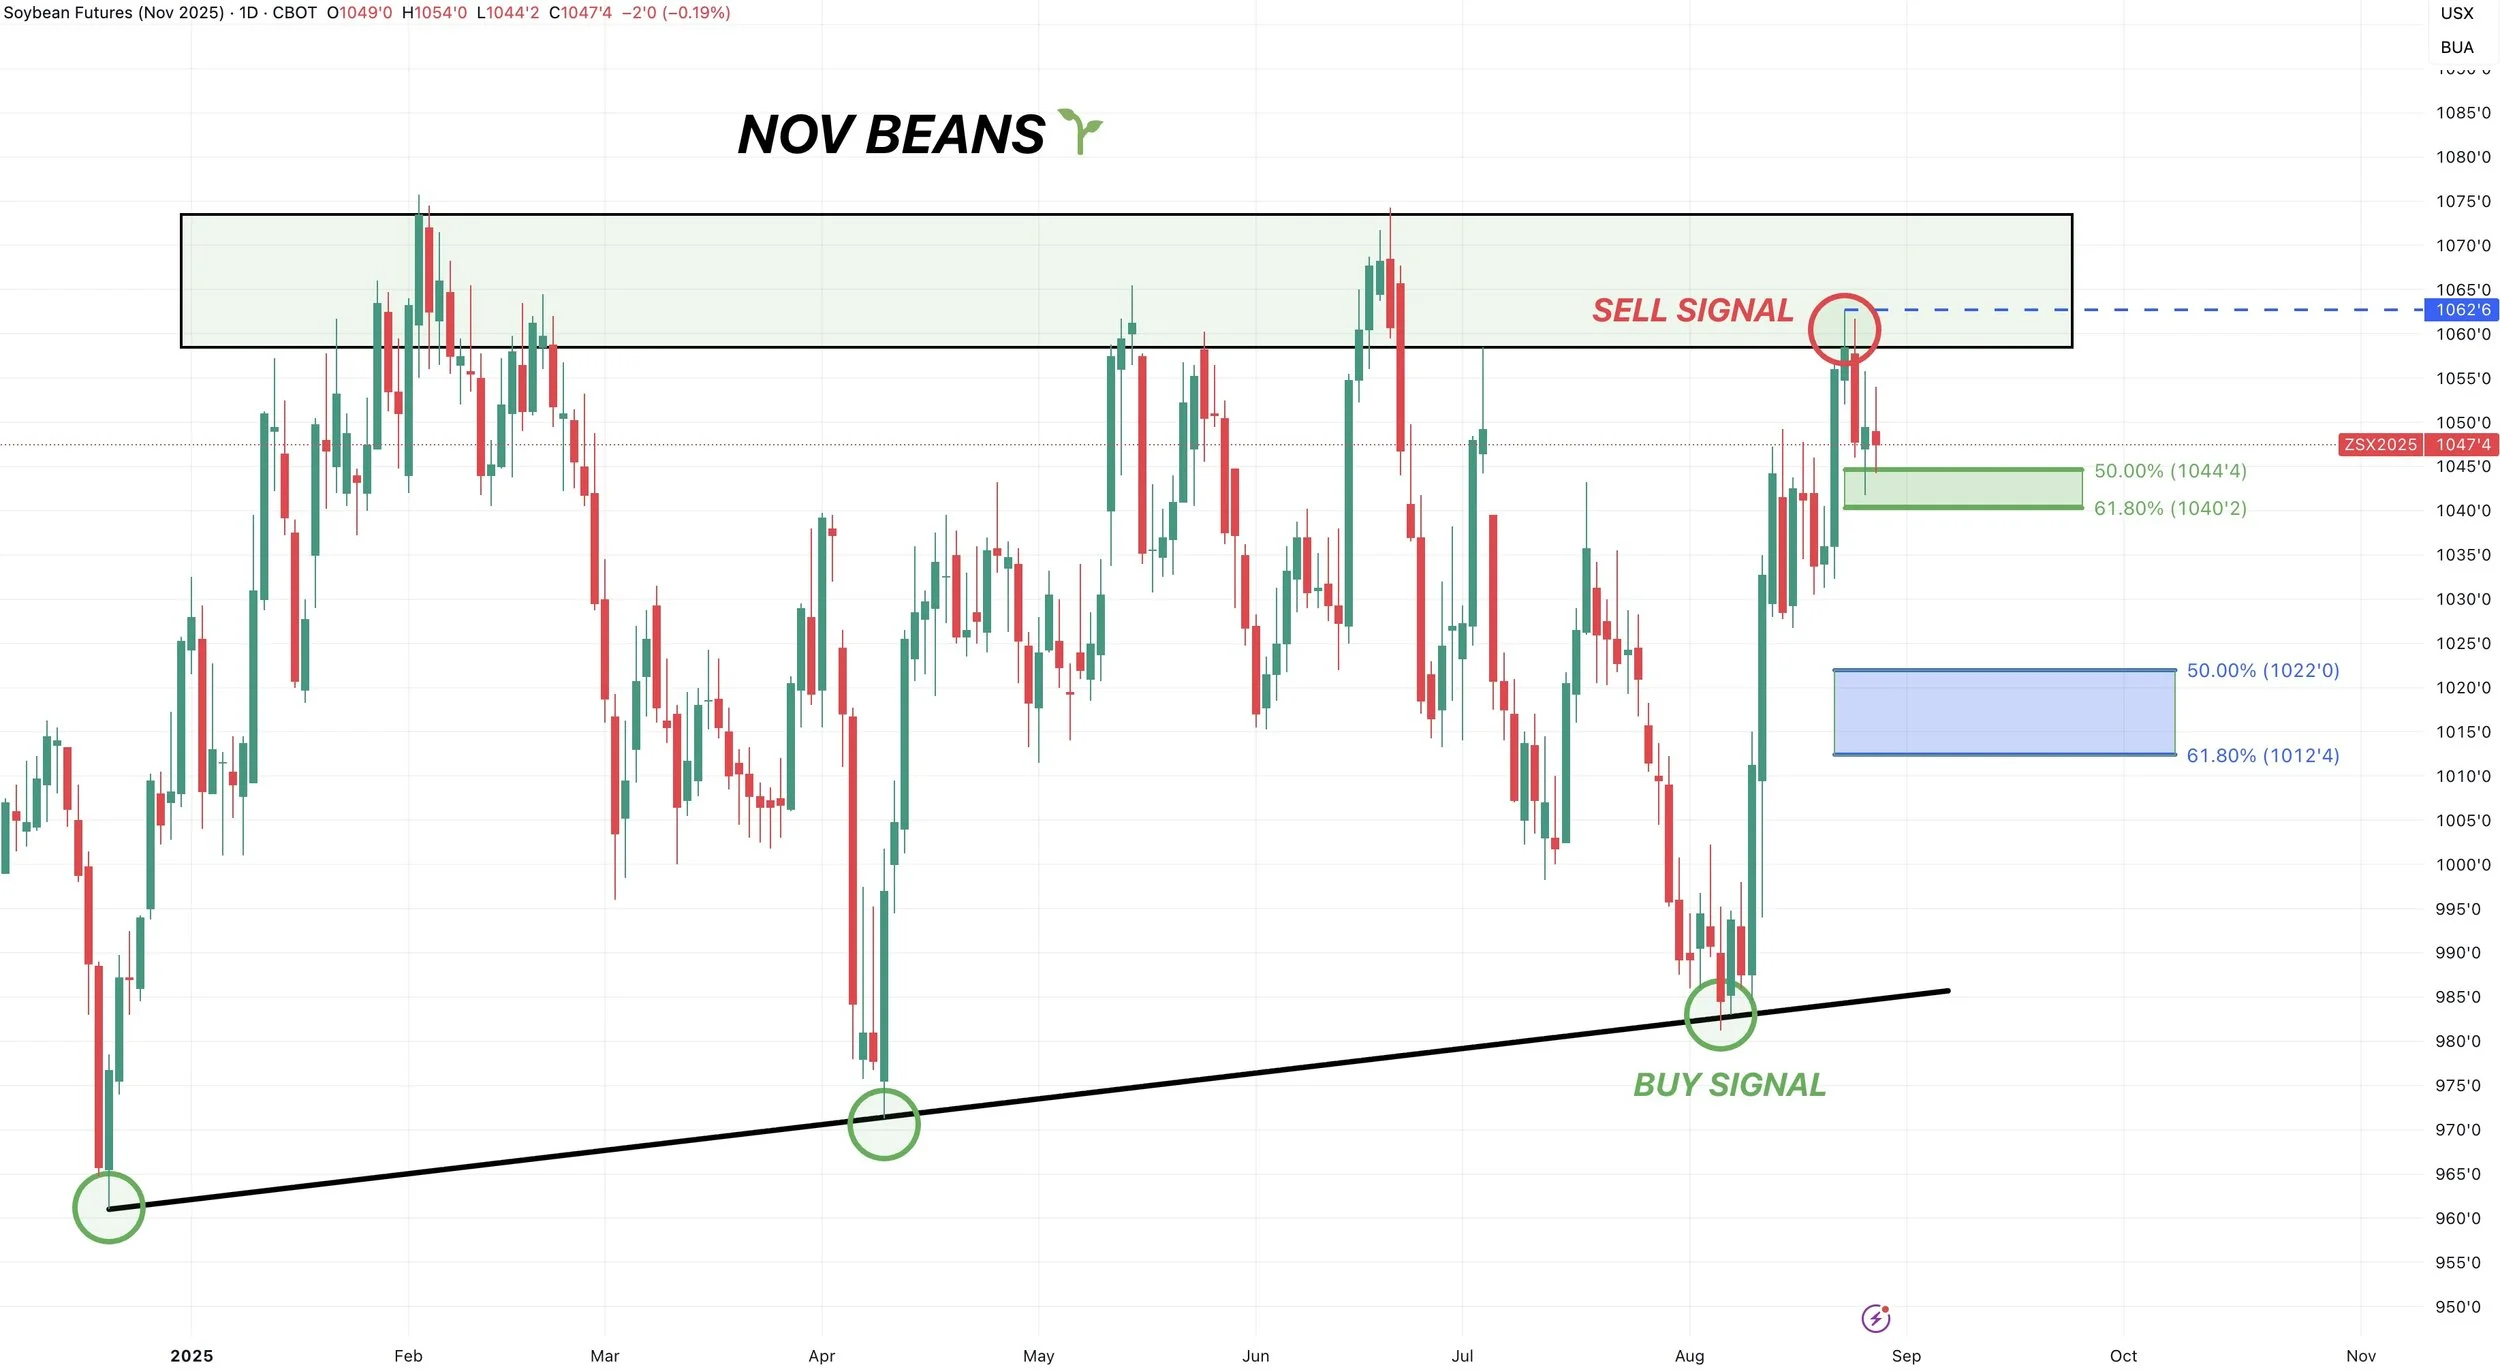
Dec Chicago Wheat 🌾
This first chart is a close up so you can view the fib levels. Scroll to see the bigger picture chart.
But we rejected right off the 61.8% level up to those early August highs.
We are now testing the 61.8% retracement of this entire mini rally.
We need to hold here or it opens the door to test contract lows again.
To the upside, if we break above $5.33 that would be our green light that we are likely headed higher.

Here is the bigger picture view.
Still sitting in this massive wedge.
Eyeing the top of the wedge if we get a real upside move.
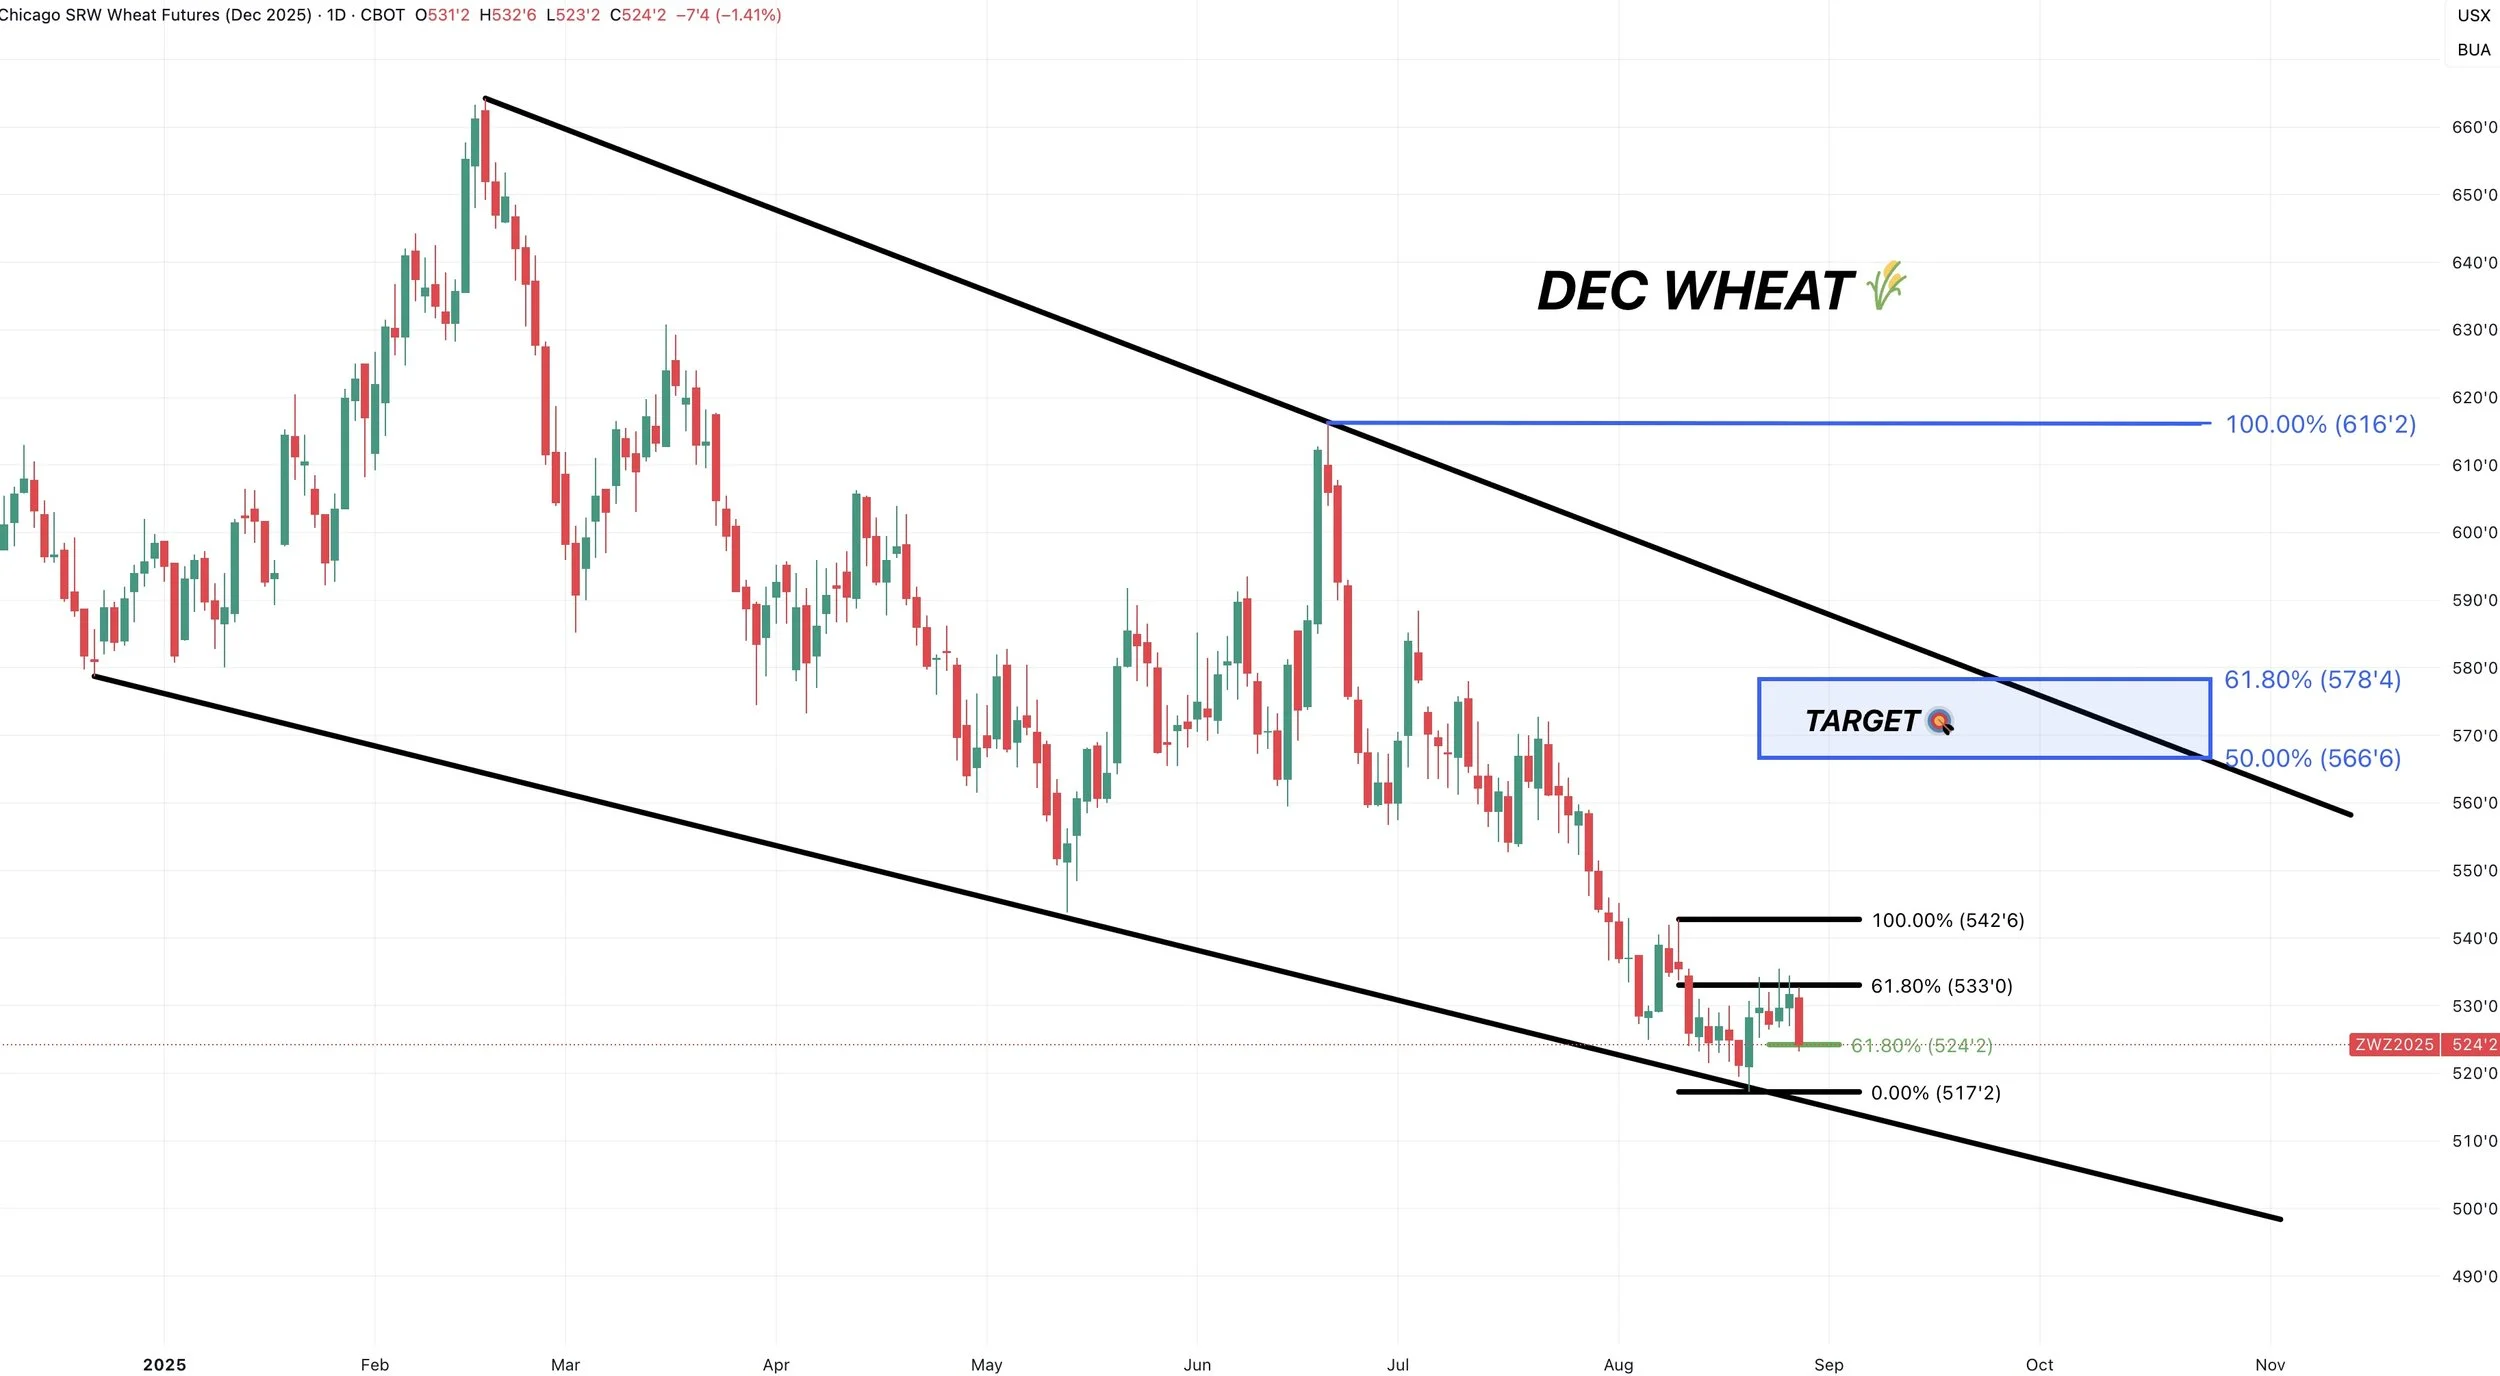
Feeder Cattle 🐮
Today we left a nasty candle.
We haven’t seen one of these in a long time after posting new highs.
This candle definitely give you a reason to be cautious here.
As this is the type of candle that often happens before a reversal.

Past Sell or Protection Signals
We recently incorporated these. Here are our past signals.
Aug 22nd: 🌱
Soybean sell signal & hedge alert.
July 31st: 🐮
Cattle sell signal & hedge alert.
July 10th: 🐮
Cattle sell signal & hedge alert.
CLICK HERE TO VIEW
June 5th: 🐮
Cattle sell signal & hedge alert.
June 2nd: 🌾
MPLS wheat sell signal.
April 10th: 🌽
Old crop corn sell signal.
March 19th: 🐮
Cattle hedge & sell signal.
Feb 18th: 🌽 🌾
Old crop KC wheat & old crop corn signal.
Jan 23rd: 🌽 🌱
Corn & beans old crop sell signal.
CLICK HERE TO VIEW
Jan 15th: 🌽 🌱
Corn & beans hedge alert/sell signal.
Jan 2nd: 🐮
Cattle hedge alert at new all-time highs & target.
Dec 11th: 🌽
Corn sell signal at $4.51 200-day MA
CLICK HERE TO VIEW
Oct 2nd: 🌾
Wheat sell signal at $6.12 target
Sep 30th: 🌽
Corn protection signal at $4.23-26
Sep 27th: 🌱
Soybean sell & protection signal at $10.65
Sep 13th: 🌾
Wheat sell signal at $5.98
May 22nd: 🌾
Wheat sell signal when wheat traded +$7.00
Want to Talk?
Our phones are open 24/7 for you guys if you ever need anything or want to discuss your operation.
Hedge Account
Interested in a hedge account? Use the link below to set up an account or shoot Jeremey a call at (605)295-3100.
Check Out Past Updates
8/26/25
LEVELS BULLS NEED TO DEFEND. CAN WHEAT FIND LIFE?
8/25/25
CORN REJECTS TARGET. CROPS GETTING SMALLER?
8/21/25
SOYBEAN BREAKOUT & USDA VS CROP TOUR
8/20/25
BUY SIGNAL
8/20/25
NAVIGATING BASIS & CATTLE BULL RUN
8/19/25
CROP CONCERNS & DRY FINISH?
8/18/25
CROP TOURS STARTING
8/15/25
CORN BOUNCING DESPITE MONSTER SUPPLY. WILL CROP TOUR SHOW ISSUES?
8/14/25
HOW TIGHT IS SOYBEAN SITUATION?
8/13/25
UPCOMING CROP TOURS & NEXT BEAN TARGET
8/12/25
MAJOR USDA SHOCK. HOW DOES THIS CHANGE THINGS?
8/11/25
TRUMP SAYS CHINA NEEDS BEANS. USDA TOMORROW
8/8/25
CALM BEFORE USDA STORM & CATTLE LIMIT DOWN
8/7/25
USDA PREVIEW & MORE DETAILS ON BUY SIGNAL
8/6/25
CORN REVERSAL? RIDING CATTLE RUN BUT BEING DISIPLINED
8/5/25
188 CORN YIELD? AUGUST CATTLE CONCERNS?
8/4/25
NEW CORN LOWS & USDA NEXT WEEK
8/1/25
STOUT DEMAND & WET JULY
7/31/25
WHERE IS CORN & BEAN BOTTOM? WAS THAT CATTLE TOP?
7/31/25
CATTLE HEDGE ALERT & SELL SIGNAL
7/30/25
ANY HOPE LEFT FOR GRAINS?
7/29/25
SEASONAL STRUGGLE CONTINUES
7/28/25
EXTREME BEARISHNESS PRICED INTO GRAINS. CATTLE WARNING SIGNS
7/25/25
NO REASON TO RALLY. NO REASON TO COLLAPSE
7/24/25
CORN DEMAND OVERSTATED? CATTLE CLOSE TO TOP?
7/23/25
JAPAN DEAL NOT ENOUGH
7/22/25
CROP RATINGS MATTER?
7/21/25
RAIN MAKES GRAIN
7/18/25
OVERNIGHT HEAT & ROOM FOR ERROR
7/17/25
POOR CORN EXPORTS MATTER? REWARD BEAN BOUNCE?
7/16/25
ARE CORN & BEANS UNDERVALUED OR NOT?
7/15/25
NEGATIVE NEWS POSITIVE ACTION IN GRAINS
7/14/25
DON’T GIVE GRAIN AWAY
7/11/25
USDA FRIENDLY CORN. MARKET DOESN’T CARE
7/10/25
JULY USDA OUT TOMORROW
7/10/25
CATTLE HEDGE ALERT & SELL SIGNAL
7/9/25
MARKET SEES RECORD CROPS
7/8/25
MONSTER CORN YIELD..?
7/7/25
TRUMP PUMP & DUMP
7/3/25
CORN & BEANS REJECT KEY SPOT. TRUMP SPEAKS IN IOWA
7/2/25
TRADE DEALS? BEANS RALLY AT GOLDEN ZONE
7/1/25
NOW WHAT FOR GRAINS?
6/30/25
BORING USDA. DIDN’T SAY HAVE TO GO LOWER
6/30/25
USDA NUMBERS
6/27/25
ALL EYES ON MONDAY
6/26/25
FIREWORKS OR BLOOD BATH MONDAY?
6/25/25
GRAINS COLLAPSING AHEAD OF JUNE REPORT
6/24/25
CORN CONTINUES SELL OFF. MAJOR USDA REPORT COMING
6/23/25
CORN CAN GO LOWER, BUT NOT FOR FOREVER
6/20/25
WHO SHOULD REWARD THE WHEAT & SOYBEAN RALLY?
6/18/25
COMPLETE CHART BREAKDOWNS
6/17/25
SOYBEANS CONTINUE BREAKOUT. NEARING SELL SIGNAL
6/16/25
CORN HAMMERED. EPA GAME CHANGER IN BEANS?
6/13/25
SOYBEANS RALLY, CHARTS, BALANCE SHEETS & MORE
6/12/25
USDA NON-EVENT. WHAT’S NEXT?
6/11/25
DIVERGENCE & SEASONAL SELL OFF?
6/10/25
BEING PATIENT VS BALANCING YOUR RISK
6/9/25
WHAT IF WE DON’T GET A WEATHER SCARE?
6/5/25
CORN & BEANS HOLDING CRUCIAL SPOTS
6/5/25
CATTLE SELL SIGNAL & HEDGE ALERT
6/4/25
HOW UNKNOWNS IMPACT MARKETING DECISIONS
6/3/25
KEY SPOTS ON THE CHARTS FOR CORN & BEANS
6/2/25
NEW LOWS IN CORN. DE-RISKING MPLS WHEAT
6/2/25
SPRING WHEAT SELL SIGNAL
5/30/25
SEASONAL RALLY STILL IN THE CARDS?
5/29/25
WHAT IS YOUR PLAN IF WE DO NOT RALLY?
5/28/25
ZERO PREMIUM IN THE GRAIN MARKETS
5/27/25
CORN CONDITIONS DISAPPOINT & JUNE OUTLOOK IMPROVES
5/23/25
TARIFFS SPOOK MARKET. GAME PLAN MOVING FORWARD
5/22/25
CHART BREAKDOWNS & TARGETS
5/21/25
RISK TO THE UPSIDE WITH WEATHER?
5/20/25
WHEAT SHORT COVERING & HISTORY OF YIELD CHANGES
5/19/25
ANYONE LEFT TO SELL WHEAT? 181 CORN YIELD POSSIBLE?
5/16/25
FUNDS SHORT CORN. MARKETS WAITING ON WEATHER
5/15/25
BEANS HAMMERED ON RUMOR & WHEAT FINDING LIFE
5/14/25
DECISIONS & POSSIBILITIES IN GRAINS
5/13/25
GRAINS RALLY OFF LOWS
5/12/25
USDA REPORT. HOW THIS CHANGES THINGS
5/9/25
BIGGEST RISKS IN USDA REPORT
5/8/25
USDA MONDAY & HISTORY OF WEATHER RALLIES
5/7/25
NEW 2025 LOWS FOR CORN
5/6/25
WHAT’S A SUMMER RALLY LOOK LIKE?
5/5/25
CORN ERASES ENTIRE APRIL RALLY
5/2/25
SELL INTO UNCERTAINTY. NOT KNOWN FACTORS
5/1/25
THE CASE AGAINST A FEB TOP IN CORN
4/30/25
APPROACHING KEY TIME PERIOD FOR GRAINS
4/29/25
PLANTING & FIRST NOTICE DAY PRESSURE. CORN CLOSE TO BOTTOM?
4/28/25
CAPTURING INVERSE & SEASONAL PREPARATION
4/25/25
HOW OFTEN DOES CORN NOT BREAK APRIL HIGHS?
4/24/25
KNOW WHEN TO SELL. BEANS BREAK 200-DAY FIRST TIME IN 483 DAYS
4/23/25
MONEY FLOW & DROUGHT CARDS
4/22/25
CRUCIAL SPOT FOR CORN & BEANS
4/21/25
NO PLANTING THREAT YET
4/18/25
POTENTIAL OPPORTUNITIES, BASIS CONTRACTS & STRATEGIES
4/16/25
HOW YIELD IMPACTS CARRYOUT. MAJOR SPOT FOR SOYBEANS
4/15/25
TOTAL CHART BREAKDOWNS & TARGETS
4/14/25
TECHNICAL SELLING IN GRAINS
4/11/25
SPECIFIC GRAIN MARKETING DECISIONS
4/10/25
USDA REPORT. HOW THIS IMPACTS CORN
4/9/25
TARIFFS GIVE. TARIFFS TAKE
4/8/25
CORN’S DIVERGING STRENGTH
4/7/25
SOLID PRICE ACTION DESPITE OUTSIDE FEAR
4/4/25
CORN PRICE ACTION SPEAKS VOLUME. ANY HOPE LEFT FOR SOYBEANS?
4/3/25
WHAT IS LEFT FOR CORN BEARS? TRADE WAR: CHARTS HOLDING SUPPORT
4/2/25
SHOULD UNKNOWNS KEEP A FLOOR UNDER GRAIN PRICES?
4/1/25
HOW DO ACRES IMPACT FUTURE OF THE GRAINS?
3/31/25
USDA REPORT: NOW WHAT?
3/28/25
ALL EYES ON USDA
3/27/25
PRE-USDA POSITIONING. DON’T GIVE GRAIN AWAY
3/26/25
HISTORY OF MARCH INTENTIONS. SOYBEANS UNDERVALUED?
3/25/25
6 DAYS UNTIL MAJOR USDA REPORT
3/24/25
HOW TO POSITION YOURSELF BEFORE PLANTING
3/21/25
REASONS TO BE OPTIMISTIC IN GRAINS?
3/20/25
WAS THAT THE BOTTOM IN CORN?
3/19/25
THE PATH HIGHER & THE DOWNSIDE RISKS IN GRAINS
3/18/25
SEASONALS, CATTLE HEDGE, CHARTS & DROUGHT?
3/17/25
WHEAT RALLIES. DON’T GET BACKED INTO A CORNER
3/14/25
MARCH 31ST REPORT THOUGHTS & WHAT’S NEXT FOR GRAINS
3/13/25
EXPLAINING RE-OWNERSHIP VS COURAGE CALLS
3/12/25
TARIFF FEARS. EU, CANADA, & ETHANOL
3/11/25
USDA SNOOZE. RECORD FUND SELLING A CONCERN?
3/10/25
USDA TOMORROW. GETTING COMFORTABLE IN MARKETING
3/7/25
HOW TIGHT IS THE WORLD & US SITUATION?
3/6/25
TARIFFS PUSHED BACK. FUTURE OPPORTUNITIES?
3/5/25
IS GRAINS BIGGEST RISK WEAK CRUDE & DEFLATION?
3/4/25
TRADE WAR BEGINS. 8TH DAY OF PAIN FOR GRAINS
3/3/25
TARIFFS ON TOMORROW. BUY SIGNAL
3/3/25
BUY SIGNAL
2/28/25
WHEN WILL THE BLEEDING STOP?
2/27/25
CORN AT CRITICAL SPOT. USDA ACRE REPORT. WAY TOO EARLY DROUGHT TALK
2/26/25
HISTORY SUGGESTS CORN TOP ISN’T IN? ACRE OUTLOOK TOMORROW
2/25/25
POSITIVE CLOSE. WHAT TO KNOW ABOUT USDA OUTLOOK
2/24/25
USDA OUTLOOK, FIRST NOTICE DAY & BRAZIL
2/21/25
WHAT TO EXPECT MOVING FORWARD IN GRAINS
2/20/25
FIRST NOTICE DAY CONCERNS. MASSIVE CORN ACRES OR NOT?
2/19/25
HOW TIGHT IS THE CORN SITUATION?
2/18/25
MORE DETAILS ON TODAYS SELL SIGNAL
2/18/25
OLD CROP KC WHEAT & CORN SELL SIGNAL
2/14/25
WHEAT BREAKING OUT ON WEATHER RISK. TECHNICALS & FUNDAMENTALS
2/12/25
GLOBAL GRAIN SITUATION, ACRE TALK, CHARTS & MORE
2/11/25
USDA: NOT A BEARISH REPORT. DISAPPOINTING PRICE ACTION
2/10/25
USDA TOMORROW. LONG TERM PATH FOR SUB 10% CORN STOCKS TO USE?
2/7/25
WHY WOULD THE FUNDS EXIT THEIR LONGS?
2/6/25
WHEAT FINALLY CATCHING A BID
2/5/25
COMPLETE THOUGHTS ON MARKETS: BACK & FORTH DISCUSSION
2/4/25
STRONG JANUARY LEAD TO STRONG YEAR? TARIFFS, CHARTS & MORE
2/3/25
TARIFFS PUSHED BACK
1/31/25
TARIFF NEWS ALL OVER THE PLACE. ARE YOU PREPARED FOR POSSIBILITIES?
1/30/25
WHEAT BULL ARGUMENT. TRUMP ADDS TARIFFS
1/29/25
CORN APPROACHES $5.00
1/28/25
TARIFFS, CORN FUNDS, SOUTH AMERICA & MORE
1/27/25
HEALTHY CORRECTION WE TALKED ABOUT & TARIFF NEWS
1/24/25
GRAINS DUE FOR SHORT TERM CORRECTION?
1/23/25
OUR ENTIRE NEW CROP SALES THOUGHTS & OLD CROP SELL SIGNAL
1/22/25
GRAINS TAKE A BREATHER. IS CORN IN A BULL OR BEAR MARKET?
1/21/25
HUGE DAY IN GRAINS. WHAT TO DO WITH OLD CROP VS NEW CROP
Read More
1/20/25
VIDEO CHART UPDATE
1/17/25
TRUMP, CHINA, ARGY & USING THE SPREADS INVERSE
1/16/25
OLD CROP LEADS US LOWER. MARKETING THOUGHTS
1/15/25
SIGNAL & HEDGE ALERT QUESTIONS EXPLAINED. IS $6 CORN EVEN POSSIBLE?
1/14/25
MORE DETAILS ON TODAYS HEDGE ALERT & SELL SIGNAL
1/14/25
CORN & SOYBEANS HEDGE ALERT/SELL SIGNAL
1/13/25
USDA GAME CHANGER OR NOT?
1/10/25
BULLISH USDA FOR CORN & BEANS
1/9/25
USDA OUT TOMORROW
1/8/25
2 DAYS UNTIL USDA. BE PREPARED
1/7/25
THE HISTORY OF THE JAN USDA & MORE
1/6/25
MAJOR USDA REPORT FRIDAY
Read More
1/3/25
UGLY DAY ACROSS THE GRAINS
CROP TOUR 182.7 YIELD & USING PROPER RISK MANAGEMENT
AUDIO COMMENTARY
Your free trial has ended
Subscribe if you would like to continue receiving our daily updates & signals
Labor Day Sale: CLICK HERE
Buying puts & rolling up in cattle. Let it run
Use proper risk management in cattle
Do not simply short cattle unless you’re prepared to deal with margin calls
EPA news pretty friendly. Bean oil rallying
Pro Farmer yield 182.7 for corn & 53 for beans
Tour is 500 million bushels lighter than USDA
Export sales off the charts strong
If we make a deal with China, that’s how you enter a bull market
Funds starting to buy corn & soybeans
Alerted soybean hedge alert & sell signal today
There is plenty of potential upside in soybeans
There has only been 4 days the soybean market closed above today’s high
Have a plan for basis. Some areas getting slaughtered on soybean basis
Buy signal still in tact for the wheat market
Like futures vs calls in the wheat market
If you want to re-own don’t chase
Interest rates supportive for money flow
Listen to today’s audio below
Want to talk? (605)295-3100
If you missed today’s soybean sell signal here is a link.
Today’s Bean Sell Signal: CLICK HERE TO VIEW
Past Sell or Protection Signals
We recently incorporated these. Here are our past signals.
Aug 22nd: 🌱
Soybean sell signal & hedge alert.
July 31st: 🐮
Cattle sell signal & hedge alert.
July 10th: 🐮
Cattle sell signal & hedge alert.
CLICK HERE TO VIEW
June 5th: 🐮
Cattle sell signal & hedge alert.
June 2nd: 🌾
MPLS wheat sell signal.
April 10th: 🌽
Old crop corn sell signal.
March 19th: 🐮
Cattle hedge & sell signal.
Feb 18th: 🌽 🌾
Old crop KC wheat & old crop corn signal.
Jan 23rd: 🌽 🌱
Corn & beans old crop sell signal.
CLICK HERE TO VIEW
Jan 15th: 🌽 🌱
Corn & beans hedge alert/sell signal.
Jan 2nd: 🐮
Cattle hedge alert at new all-time highs & target.
Dec 11th: 🌽
Corn sell signal at $4.51 200-day MA
CLICK HERE TO VIEW
Oct 2nd: 🌾
Wheat sell signal at $6.12 target
Sep 30th: 🌽
Corn protection signal at $4.23-26
Sep 27th: 🌱
Soybean sell & protection signal at $10.65
Sep 13th: 🌾
Wheat sell signal at $5.98
May 22nd: 🌾
Wheat sell signal when wheat traded +$7.00
Want to Talk?
Our phones are open 24/7 for you guys if you ever need anything or want to discuss your operation.
Hedge Account
Interested in a hedge account? Use the link below to set up an account or shoot Jeremey a call at (605)295-3100.
Check Out Past Updates
8/21/25
SOYBEAN BREAKOUT & USDA VS CROP TOUR
8/20/25
BUY SIGNAL
8/20/25
NAVIGATING BASIS & CATTLE BULL RUN
8/19/25
CROP CONCERNS & DRY FINISH?
8/18/25
CROP TOURS STARTING
8/15/25
CORN BOUNCING DESPITE MONSTER SUPPLY. WILL CROP TOUR SHOW ISSUES?
8/14/25
HOW TIGHT IS SOYBEAN SITUATION?
8/13/25
UPCOMING CROP TOURS & NEXT BEAN TARGET
8/12/25
MAJOR USDA SHOCK. HOW DOES THIS CHANGE THINGS?
8/11/25
TRUMP SAYS CHINA NEEDS BEANS. USDA TOMORROW
8/8/25
CALM BEFORE USDA STORM & CATTLE LIMIT DOWN
8/7/25
USDA PREVIEW & MORE DETAILS ON BUY SIGNAL
8/6/25
CORN REVERSAL? RIDING CATTLE RUN BUT BEING DISIPLINED
8/5/25
188 CORN YIELD? AUGUST CATTLE CONCERNS?
8/4/25
NEW CORN LOWS & USDA NEXT WEEK
8/1/25
STOUT DEMAND & WET JULY
7/31/25
WHERE IS CORN & BEAN BOTTOM? WAS THAT CATTLE TOP?
7/31/25
CATTLE HEDGE ALERT & SELL SIGNAL
7/30/25
ANY HOPE LEFT FOR GRAINS?
7/29/25
SEASONAL STRUGGLE CONTINUES
7/28/25
EXTREME BEARISHNESS PRICED INTO GRAINS. CATTLE WARNING SIGNS
7/25/25
NO REASON TO RALLY. NO REASON TO COLLAPSE
7/24/25
CORN DEMAND OVERSTATED? CATTLE CLOSE TO TOP?
7/23/25
JAPAN DEAL NOT ENOUGH
7/22/25
CROP RATINGS MATTER?
7/21/25
RAIN MAKES GRAIN
7/18/25
OVERNIGHT HEAT & ROOM FOR ERROR
7/17/25
POOR CORN EXPORTS MATTER? REWARD BEAN BOUNCE?
7/16/25
ARE CORN & BEANS UNDERVALUED OR NOT?
7/15/25
NEGATIVE NEWS POSITIVE ACTION IN GRAINS
7/14/25
DON’T GIVE GRAIN AWAY
7/11/25
USDA FRIENDLY CORN. MARKET DOESN’T CARE
7/10/25
JULY USDA OUT TOMORROW
7/10/25
CATTLE HEDGE ALERT & SELL SIGNAL
7/9/25
MARKET SEES RECORD CROPS
7/8/25
MONSTER CORN YIELD..?
7/7/25
TRUMP PUMP & DUMP
7/3/25
CORN & BEANS REJECT KEY SPOT. TRUMP SPEAKS IN IOWA
7/2/25
TRADE DEALS? BEANS RALLY AT GOLDEN ZONE
7/1/25
NOW WHAT FOR GRAINS?
6/30/25
BORING USDA. DIDN’T SAY HAVE TO GO LOWER
6/30/25
USDA NUMBERS
6/27/25
ALL EYES ON MONDAY
6/26/25
FIREWORKS OR BLOOD BATH MONDAY?
6/25/25
GRAINS COLLAPSING AHEAD OF JUNE REPORT
6/24/25
CORN CONTINUES SELL OFF. MAJOR USDA REPORT COMING
6/23/25
CORN CAN GO LOWER, BUT NOT FOR FOREVER
6/20/25
WHO SHOULD REWARD THE WHEAT & SOYBEAN RALLY?
6/18/25
COMPLETE CHART BREAKDOWNS
6/17/25
SOYBEANS CONTINUE BREAKOUT. NEARING SELL SIGNAL
6/16/25
CORN HAMMERED. EPA GAME CHANGER IN BEANS?
6/13/25
SOYBEANS RALLY, CHARTS, BALANCE SHEETS & MORE
6/12/25
USDA NON-EVENT. WHAT’S NEXT?
6/11/25
DIVERGENCE & SEASONAL SELL OFF?
6/10/25
BEING PATIENT VS BALANCING YOUR RISK
6/9/25
WHAT IF WE DON’T GET A WEATHER SCARE?
6/5/25
CORN & BEANS HOLDING CRUCIAL SPOTS
6/5/25
CATTLE SELL SIGNAL & HEDGE ALERT
6/4/25
HOW UNKNOWNS IMPACT MARKETING DECISIONS
6/3/25
KEY SPOTS ON THE CHARTS FOR CORN & BEANS
6/2/25
NEW LOWS IN CORN. DE-RISKING MPLS WHEAT
6/2/25
SPRING WHEAT SELL SIGNAL
5/30/25
SEASONAL RALLY STILL IN THE CARDS?
5/29/25
WHAT IS YOUR PLAN IF WE DO NOT RALLY?
5/28/25
ZERO PREMIUM IN THE GRAIN MARKETS
5/27/25
CORN CONDITIONS DISAPPOINT & JUNE OUTLOOK IMPROVES
5/23/25
TARIFFS SPOOK MARKET. GAME PLAN MOVING FORWARD
5/22/25
CHART BREAKDOWNS & TARGETS
5/21/25
RISK TO THE UPSIDE WITH WEATHER?
5/20/25
WHEAT SHORT COVERING & HISTORY OF YIELD CHANGES
5/19/25
ANYONE LEFT TO SELL WHEAT? 181 CORN YIELD POSSIBLE?
5/16/25
FUNDS SHORT CORN. MARKETS WAITING ON WEATHER
5/15/25
BEANS HAMMERED ON RUMOR & WHEAT FINDING LIFE
5/14/25
DECISIONS & POSSIBILITIES IN GRAINS
5/13/25
GRAINS RALLY OFF LOWS
5/12/25
USDA REPORT. HOW THIS CHANGES THINGS
5/9/25
BIGGEST RISKS IN USDA REPORT
5/8/25
USDA MONDAY & HISTORY OF WEATHER RALLIES
5/7/25
NEW 2025 LOWS FOR CORN
5/6/25
WHAT’S A SUMMER RALLY LOOK LIKE?
5/5/25
CORN ERASES ENTIRE APRIL RALLY
5/2/25
SELL INTO UNCERTAINTY. NOT KNOWN FACTORS
5/1/25
THE CASE AGAINST A FEB TOP IN CORN
4/30/25
APPROACHING KEY TIME PERIOD FOR GRAINS
4/29/25
PLANTING & FIRST NOTICE DAY PRESSURE. CORN CLOSE TO BOTTOM?
4/28/25
CAPTURING INVERSE & SEASONAL PREPARATION
4/25/25
HOW OFTEN DOES CORN NOT BREAK APRIL HIGHS?
4/24/25
KNOW WHEN TO SELL. BEANS BREAK 200-DAY FIRST TIME IN 483 DAYS
4/23/25
MONEY FLOW & DROUGHT CARDS
4/22/25
CRUCIAL SPOT FOR CORN & BEANS
4/21/25
NO PLANTING THREAT YET
4/18/25
POTENTIAL OPPORTUNITIES, BASIS CONTRACTS & STRATEGIES
4/16/25
HOW YIELD IMPACTS CARRYOUT. MAJOR SPOT FOR SOYBEANS
4/15/25
TOTAL CHART BREAKDOWNS & TARGETS
4/14/25
TECHNICAL SELLING IN GRAINS
4/11/25
SPECIFIC GRAIN MARKETING DECISIONS
4/10/25
USDA REPORT. HOW THIS IMPACTS CORN
4/9/25
TARIFFS GIVE. TARIFFS TAKE
4/8/25
CORN’S DIVERGING STRENGTH
4/7/25
SOLID PRICE ACTION DESPITE OUTSIDE FEAR
4/4/25
CORN PRICE ACTION SPEAKS VOLUME. ANY HOPE LEFT FOR SOYBEANS?
4/3/25
WHAT IS LEFT FOR CORN BEARS? TRADE WAR: CHARTS HOLDING SUPPORT
4/2/25
SHOULD UNKNOWNS KEEP A FLOOR UNDER GRAIN PRICES?
4/1/25
HOW DO ACRES IMPACT FUTURE OF THE GRAINS?
3/31/25
USDA REPORT: NOW WHAT?
3/28/25
ALL EYES ON USDA
3/27/25
PRE-USDA POSITIONING. DON’T GIVE GRAIN AWAY
3/26/25
HISTORY OF MARCH INTENTIONS. SOYBEANS UNDERVALUED?
3/25/25
6 DAYS UNTIL MAJOR USDA REPORT
3/24/25
HOW TO POSITION YOURSELF BEFORE PLANTING
3/21/25
REASONS TO BE OPTIMISTIC IN GRAINS?
3/20/25
WAS THAT THE BOTTOM IN CORN?
3/19/25
THE PATH HIGHER & THE DOWNSIDE RISKS IN GRAINS
3/18/25
SEASONALS, CATTLE HEDGE, CHARTS & DROUGHT?
3/17/25
WHEAT RALLIES. DON’T GET BACKED INTO A CORNER
3/14/25
MARCH 31ST REPORT THOUGHTS & WHAT’S NEXT FOR GRAINS
3/13/25
EXPLAINING RE-OWNERSHIP VS COURAGE CALLS
3/12/25
TARIFF FEARS. EU, CANADA, & ETHANOL
3/11/25
USDA SNOOZE. RECORD FUND SELLING A CONCERN?
3/10/25
USDA TOMORROW. GETTING COMFORTABLE IN MARKETING
3/7/25
HOW TIGHT IS THE WORLD & US SITUATION?
3/6/25
TARIFFS PUSHED BACK. FUTURE OPPORTUNITIES?
3/5/25
IS GRAINS BIGGEST RISK WEAK CRUDE & DEFLATION?
3/4/25
TRADE WAR BEGINS. 8TH DAY OF PAIN FOR GRAINS
3/3/25
TARIFFS ON TOMORROW. BUY SIGNAL
3/3/25
BUY SIGNAL
2/28/25
WHEN WILL THE BLEEDING STOP?
2/27/25
CORN AT CRITICAL SPOT. USDA ACRE REPORT. WAY TOO EARLY DROUGHT TALK
2/26/25
HISTORY SUGGESTS CORN TOP ISN’T IN? ACRE OUTLOOK TOMORROW
2/25/25
POSITIVE CLOSE. WHAT TO KNOW ABOUT USDA OUTLOOK
2/24/25
USDA OUTLOOK, FIRST NOTICE DAY & BRAZIL
2/21/25
WHAT TO EXPECT MOVING FORWARD IN GRAINS
2/20/25
FIRST NOTICE DAY CONCERNS. MASSIVE CORN ACRES OR NOT?
2/19/25
HOW TIGHT IS THE CORN SITUATION?
2/18/25
MORE DETAILS ON TODAYS SELL SIGNAL
2/18/25
OLD CROP KC WHEAT & CORN SELL SIGNAL
2/14/25
WHEAT BREAKING OUT ON WEATHER RISK. TECHNICALS & FUNDAMENTALS
2/12/25
GLOBAL GRAIN SITUATION, ACRE TALK, CHARTS & MORE
2/11/25
USDA: NOT A BEARISH REPORT. DISAPPOINTING PRICE ACTION
2/10/25
USDA TOMORROW. LONG TERM PATH FOR SUB 10% CORN STOCKS TO USE?
2/7/25
WHY WOULD THE FUNDS EXIT THEIR LONGS?
2/6/25
WHEAT FINALLY CATCHING A BID
2/5/25
COMPLETE THOUGHTS ON MARKETS: BACK & FORTH DISCUSSION
2/4/25
STRONG JANUARY LEAD TO STRONG YEAR? TARIFFS, CHARTS & MORE
2/3/25
TARIFFS PUSHED BACK
1/31/25
TARIFF NEWS ALL OVER THE PLACE. ARE YOU PREPARED FOR POSSIBILITIES?
1/30/25
WHEAT BULL ARGUMENT. TRUMP ADDS TARIFFS
1/29/25
CORN APPROACHES $5.00
1/28/25
TARIFFS, CORN FUNDS, SOUTH AMERICA & MORE
1/27/25
HEALTHY CORRECTION WE TALKED ABOUT & TARIFF NEWS
1/24/25
GRAINS DUE FOR SHORT TERM CORRECTION?
1/23/25
OUR ENTIRE NEW CROP SALES THOUGHTS & OLD CROP SELL SIGNAL
1/22/25
GRAINS TAKE A BREATHER. IS CORN IN A BULL OR BEAR MARKET?
1/21/25
HUGE DAY IN GRAINS. WHAT TO DO WITH OLD CROP VS NEW CROP
Read More
1/20/25
VIDEO CHART UPDATE
1/17/25
TRUMP, CHINA, ARGY & USING THE SPREADS INVERSE
1/16/25
OLD CROP LEADS US LOWER. MARKETING THOUGHTS
1/15/25
SIGNAL & HEDGE ALERT QUESTIONS EXPLAINED. IS $6 CORN EVEN POSSIBLE?
1/14/25
MORE DETAILS ON TODAYS HEDGE ALERT & SELL SIGNAL
1/14/25
CORN & SOYBEANS HEDGE ALERT/SELL SIGNAL
1/13/25
USDA GAME CHANGER OR NOT?
1/10/25
BULLISH USDA FOR CORN & BEANS
1/9/25
USDA OUT TOMORROW
1/8/25
2 DAYS UNTIL USDA. BE PREPARED
1/7/25
THE HISTORY OF THE JAN USDA & MORE
1/6/25
MAJOR USDA REPORT FRIDAY
Read More
1/3/25
UGLY DAY ACROSS THE GRAINS
1/2/25