
HOW YIELD IMPACTS CARRYOUT. MAJOR SPOT FOR SOYBEANS
MARKET UPDATE
You can scroll to read the usual update as well. As the written version is the exact same as the video.
Timestamps for video:
Yield vs Carryout: 0:30min
Weather & Drought: 3:40min
Corn: 5:30min
Soybeans: 7:55min
Wheat: 10:30min
Want to talk about your situation?
(605)295-3100
Futures Prices Close

Overview
Grains slighly higher across the board today.
Not a ton of fresh news.
Corn seeing a little strength from slight planting delays out east as well as sitting at chart support.
The dollar continues to collapse which is supportive of all the grains.
Markets still sitting in that waiting room until weather becomes the next big factor.
China said they are open to trade agreement talk but only if Trump shows them respect.
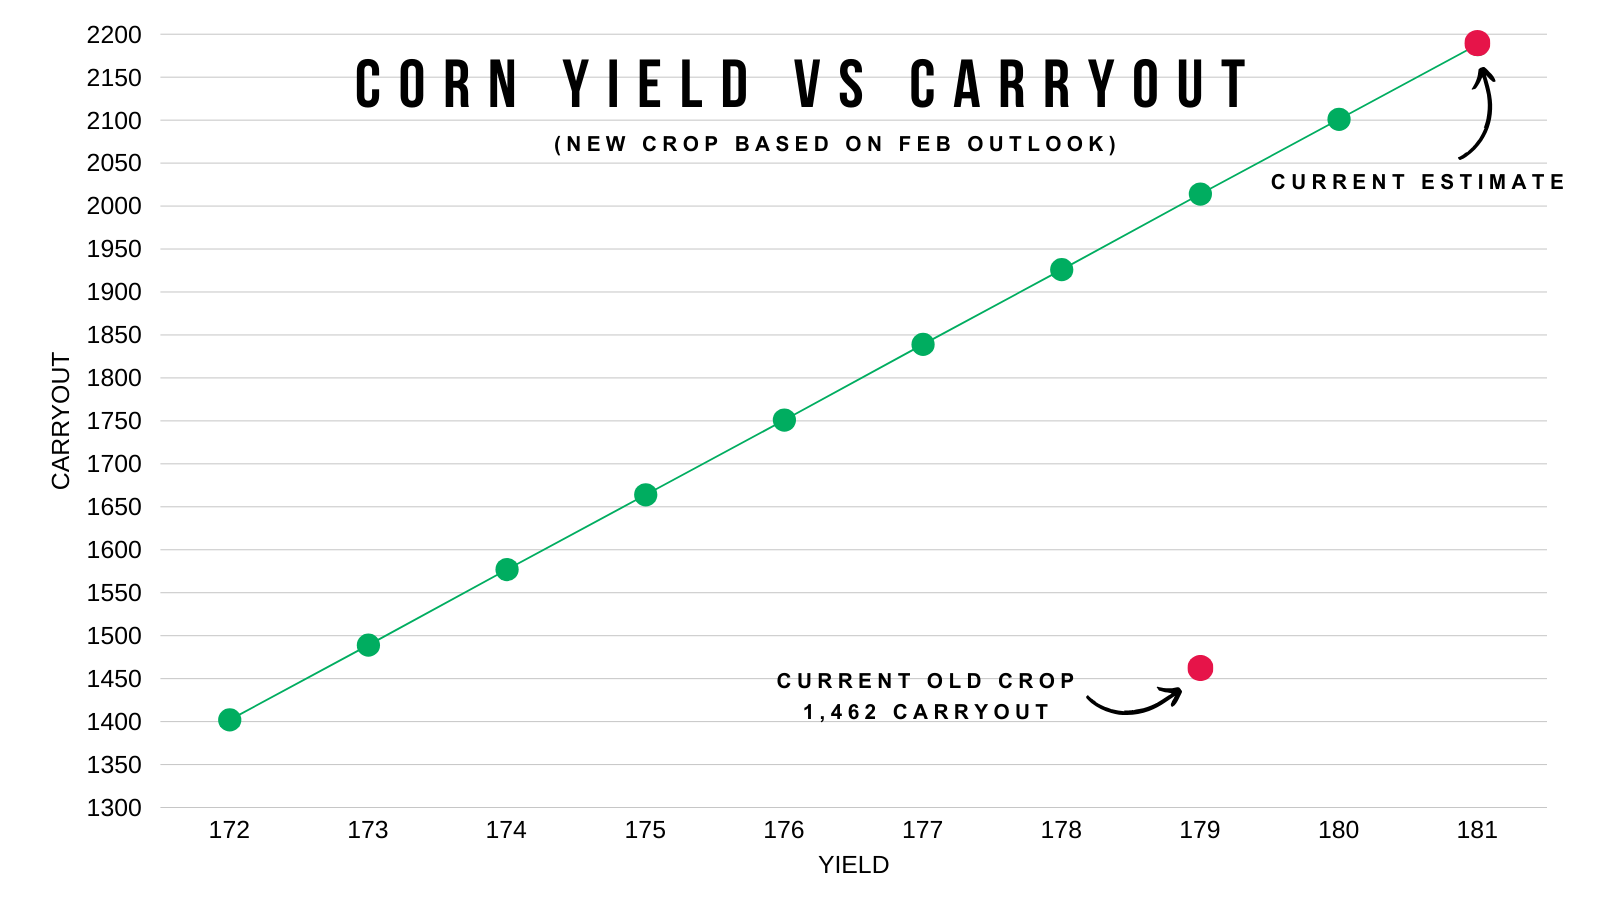
How Yield Affects Carryout
This is why we typically get those summer rallies and opportunities.
Usually it is due to a "drought scare".
That is because the moment the market starts to believe a lower yield is possible it starts pricing it in and rallies, even if the drought doesn’t end in substantial material damage.
The "thought" of drought is usually where the opportunities come unless it's a year like 2012.
Here is how yield affects the current new crop corn carryout.
Right now, it is projected at over +2 billion bushels.
To get our current carryout of 1.5 billion, we would need to see yield fall to 173 to 174.
This is without changing any demand estimates. Currently the USDA projects new crop exports at 2,400 vs the current 2,550.
Last year we started with this exact same +2 billion carryout, but we ended below 1.5 billion. This was largely due to demand (low prices trying to cure low prices).
This new crop numbrer is not bullish at all. But the market simply has to believe one of these lower yields is possible for a few days or weeks and it can lead to an opportunity.
Below is how yield affects new crop soybeans carryout.
Beans are a completely different story than corn.
We are already projected to have -100 million bushels less carryout than last year even if we raise a record 52.5 bpa yield.
Any hiccup in production could lead to the soybean carryout vanishing in a hurry. Not much room for error.
Again, this is how those opportunities unfold. If the market starts to think a 50 bpa yield is possible, that equates to a sub 100 million carryout
(This is without any changes to demand. Keep in mind, less supply leads to less demand & vice versa. We wouldn’t actually get a 0 bpa carryout with a 49 bpa yield as it will be offset with demand. But you get the idea).

We do not "have" to get a drought scare.
We didn’t get one last year.
But more often than not, we do. Those graphs above explain exactly why we usually get one.
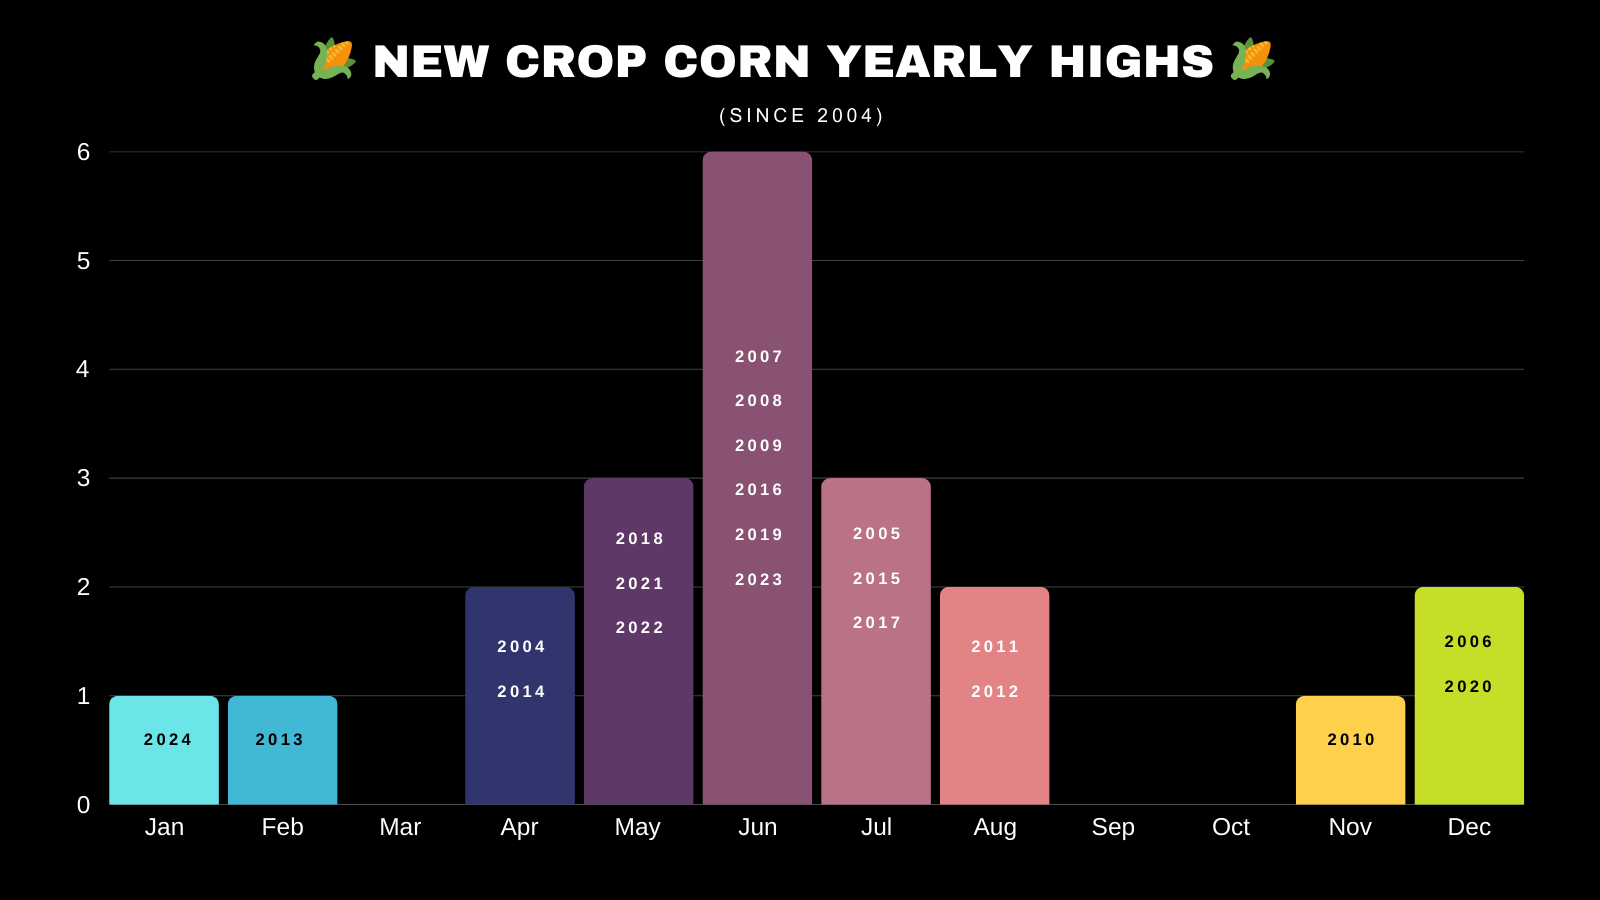
As a reminder, below is months where new crop corn and beans have posted their highs.
We are apparoaching a very clear seasonal pricing opportunity especially in corn.

Drought Update
A few weeks ago 2025 corn areas in drought where in a realm of their own with 2013.
However due to the recent rain, we are no longer absurdly dry.
Still in the top 5 dryest since 2010 but nothing crazy as a drought story is still early to begin with.

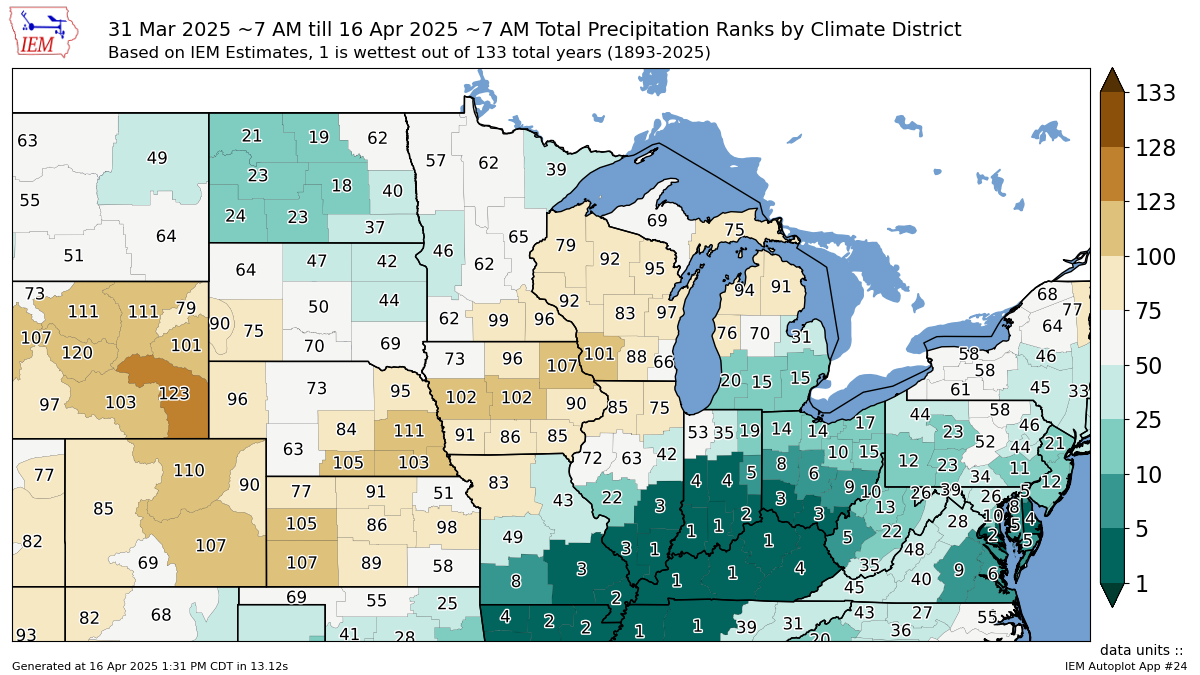
Here is the precip ranks for April so far.
It has been the wettest all-time in the south east corn corn belt.
I'm sure this has caused a little damage and will result in some planting delays, but overall it is still too early to say we are going to have a planting delay rally.
For pricing opportunities, you'd rather have a drought scare than a planting delay.
(For example 2023's summer drought rally vs last year's planting delay rally in May. Drought moves the market far more).
Short term, a planting delay is bullish but long term it helps soil moisture so it's bearish.
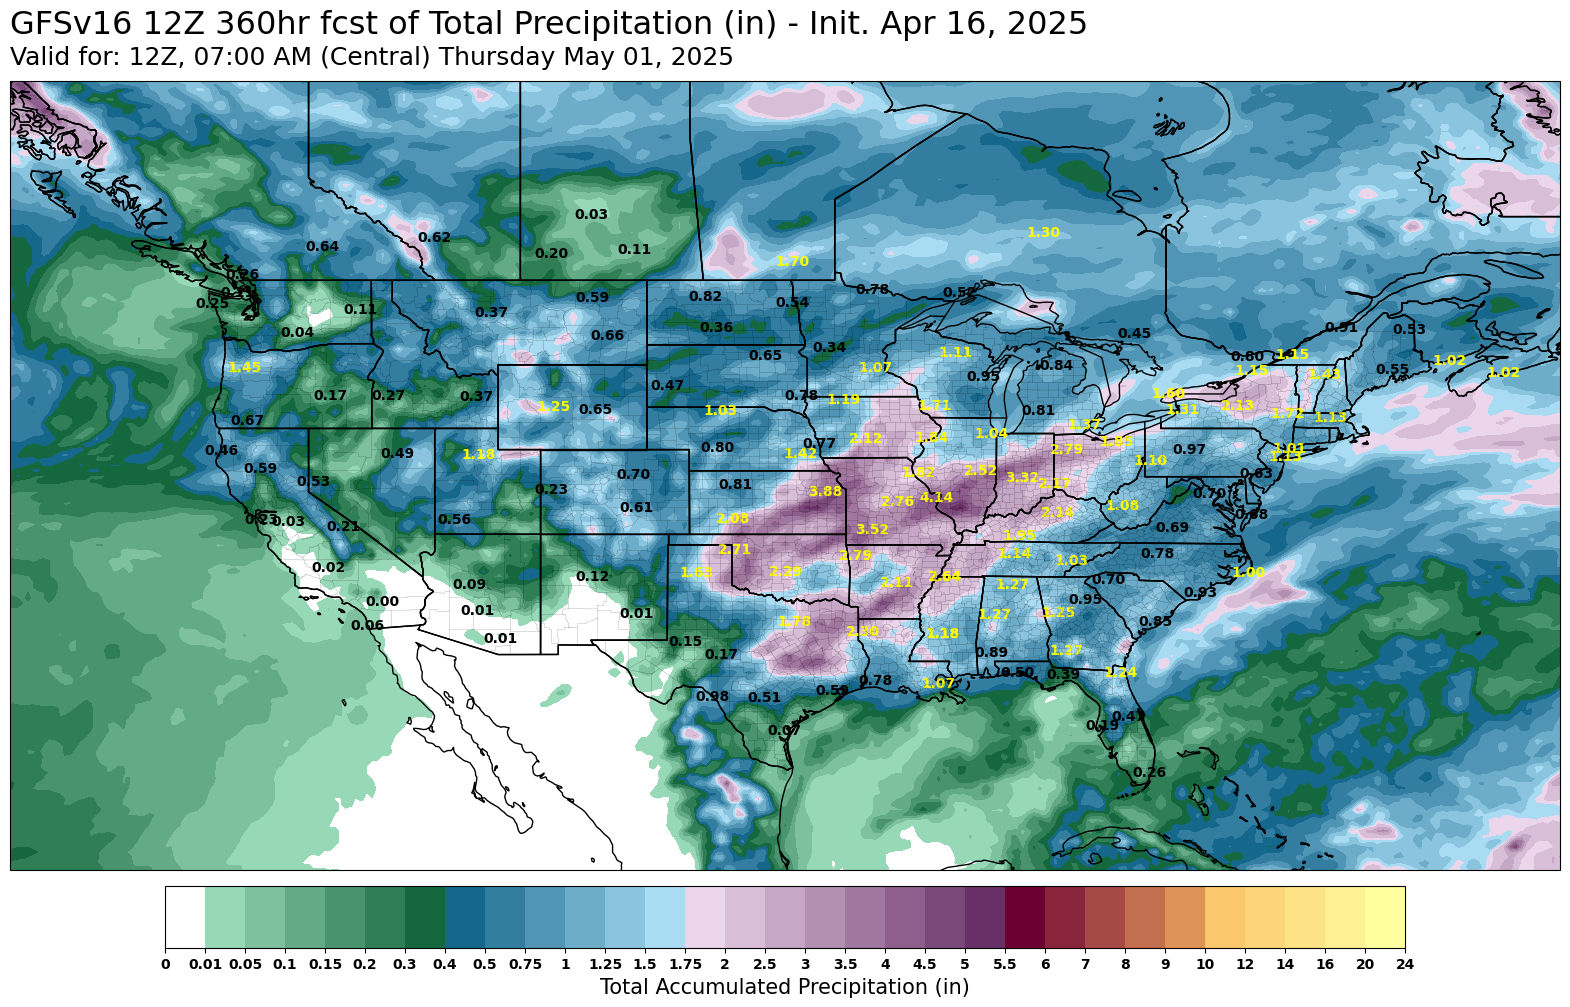
Weather Update
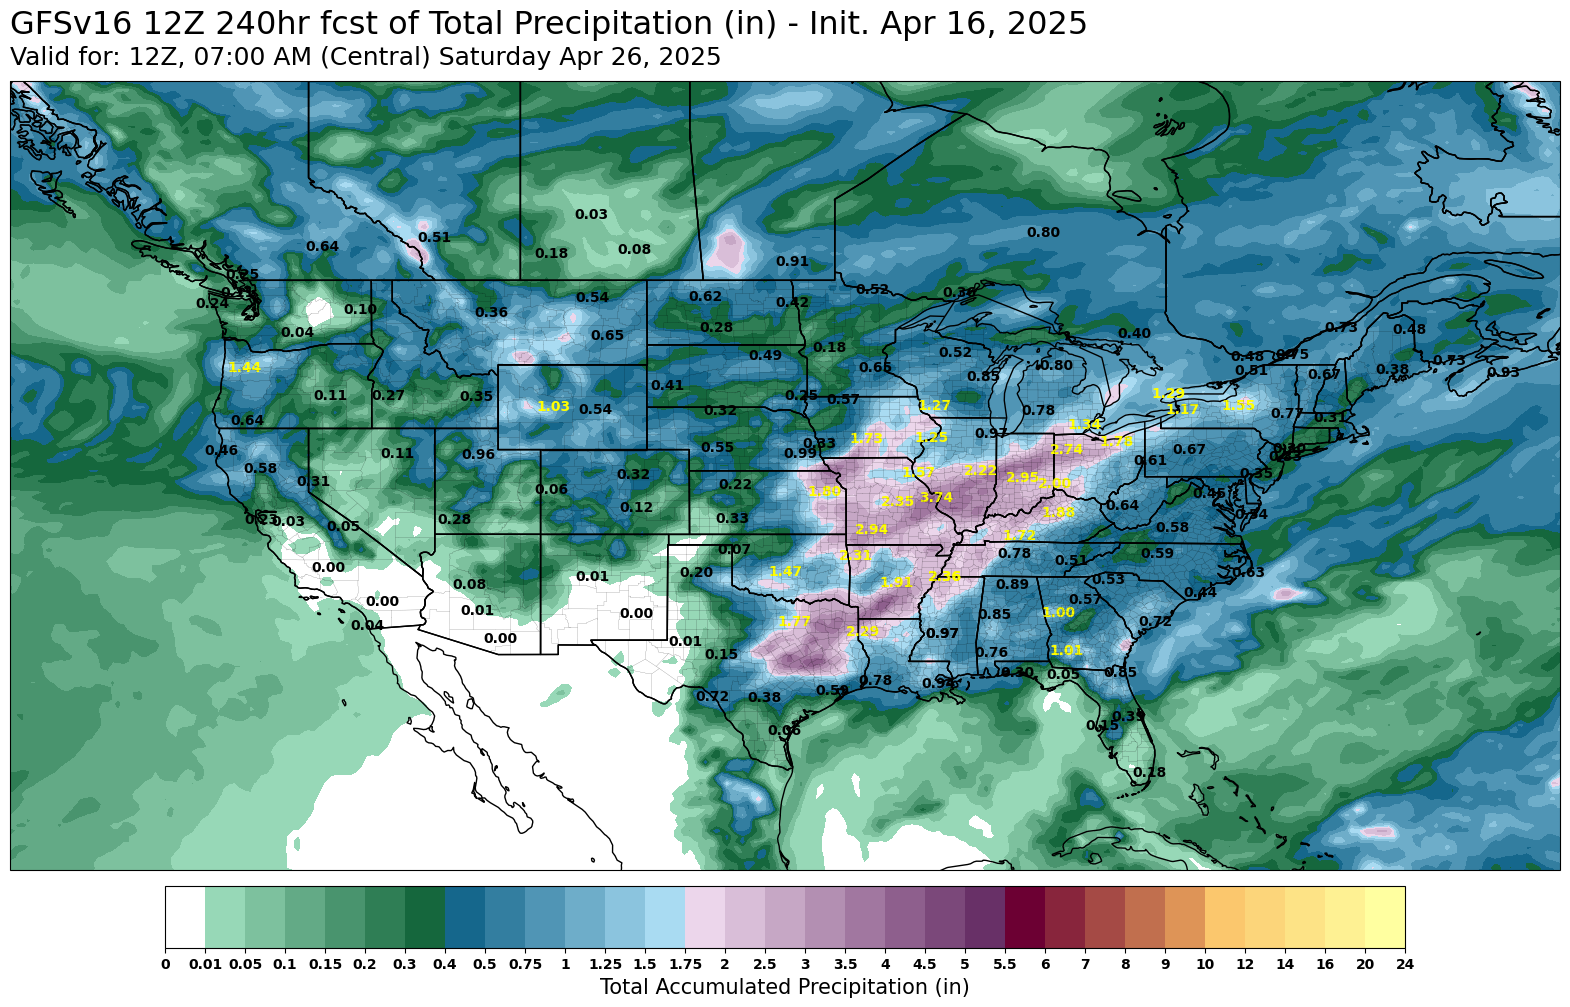
Here is the next 10-14 days.
Even more rain is expected for the south east corn belt.
The central plains are drier in comparison.
Next 10 Days
Next 14 Days
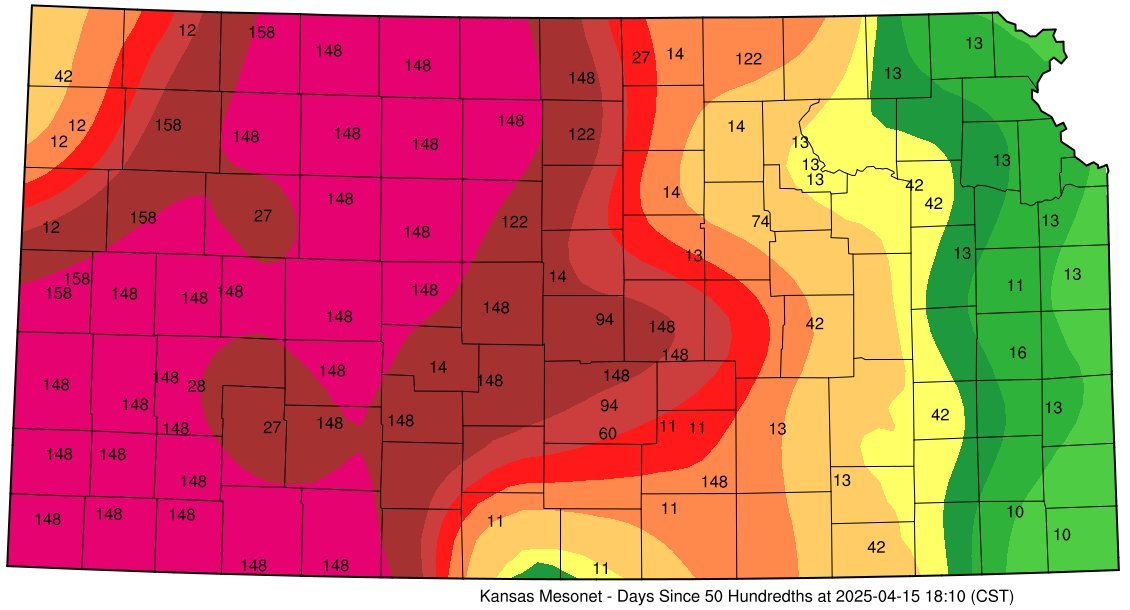
The wheat market has seen some weakness due to the forecasts calling for rain.
Here is a map of Kansas that shows how many days it has been since each area received 1/2 an inch of rain in a single.
It is going to take some real rain to fix this dryness.
I think the wheat market should realize this eventually.
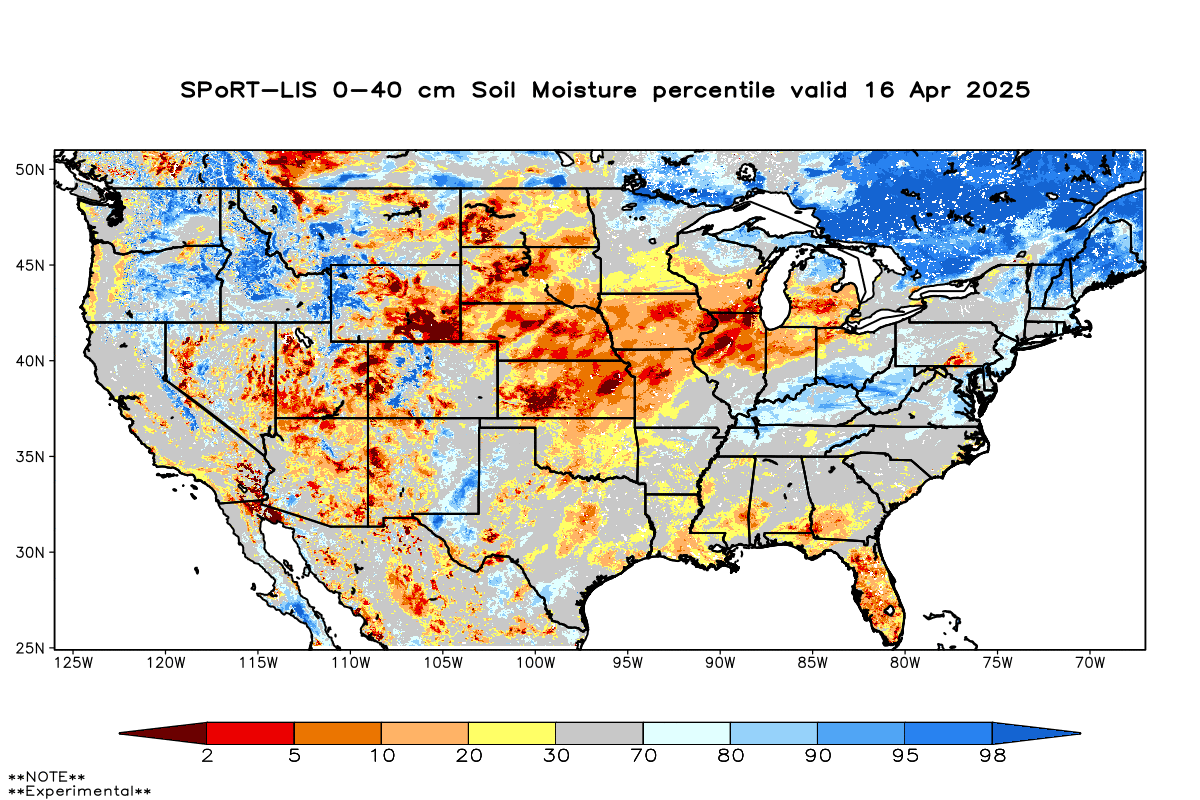
Here is the current soil moisture.
No issues out east, but areas such as Kansas, Nebraska, and Iowa all still lack moisture.
Today's Main Takeaways
Corn
Fundamentals:
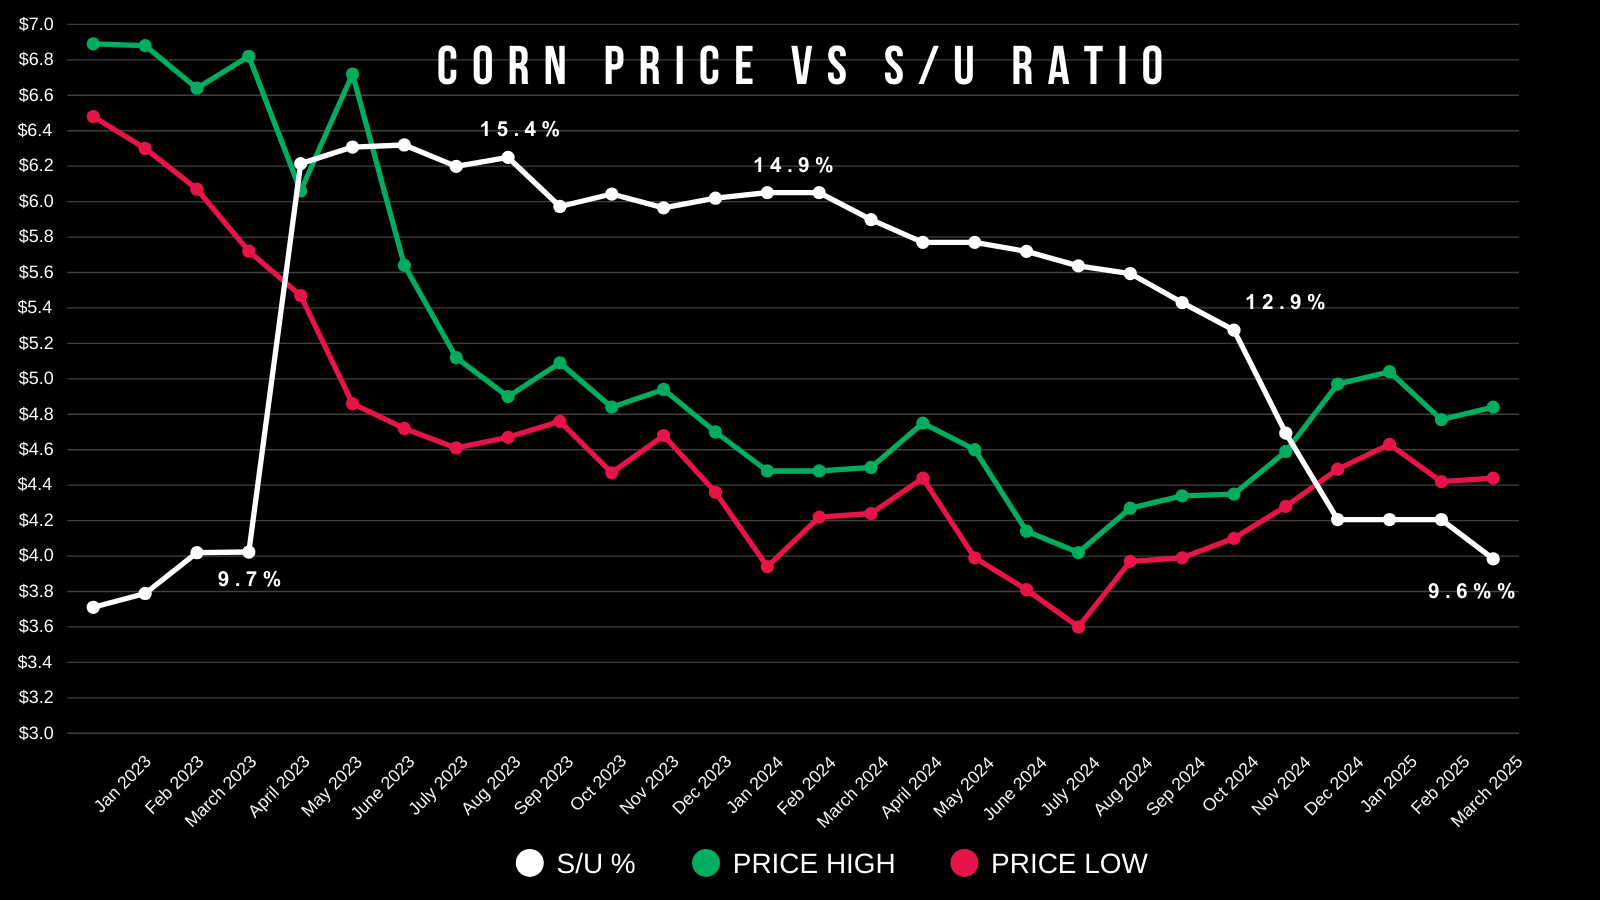
Our old crop situation is bullish. As our stocks to use ratio is below 10% for the first time in 2 years.
The last time our stocks to use ratio was below 10% corn was trading closer to $6 than $5.
Our world situation is still the tightest in 10 years.
If you remove China & the US from the equation it's actually the tightest of all-time.
The rest of the world is the tightest on corn it's ever been.
This amplifies the need for the US crop to perform.

The new crop situation does lean bearish, as our current projections are a 2.2 billion bushel carryout and over a +14% stocks to use ratio.
But at the same time, this figure does use a 181 yield which I find hard to believe.
We still have an entire growing season so overall I'm waiting to see if it bring opportunities.
If you have to move corn in the next month or two then I'd be taking advantage of this rally via a sale or puts like we mentioned in our recent sell signal.
Technicals:
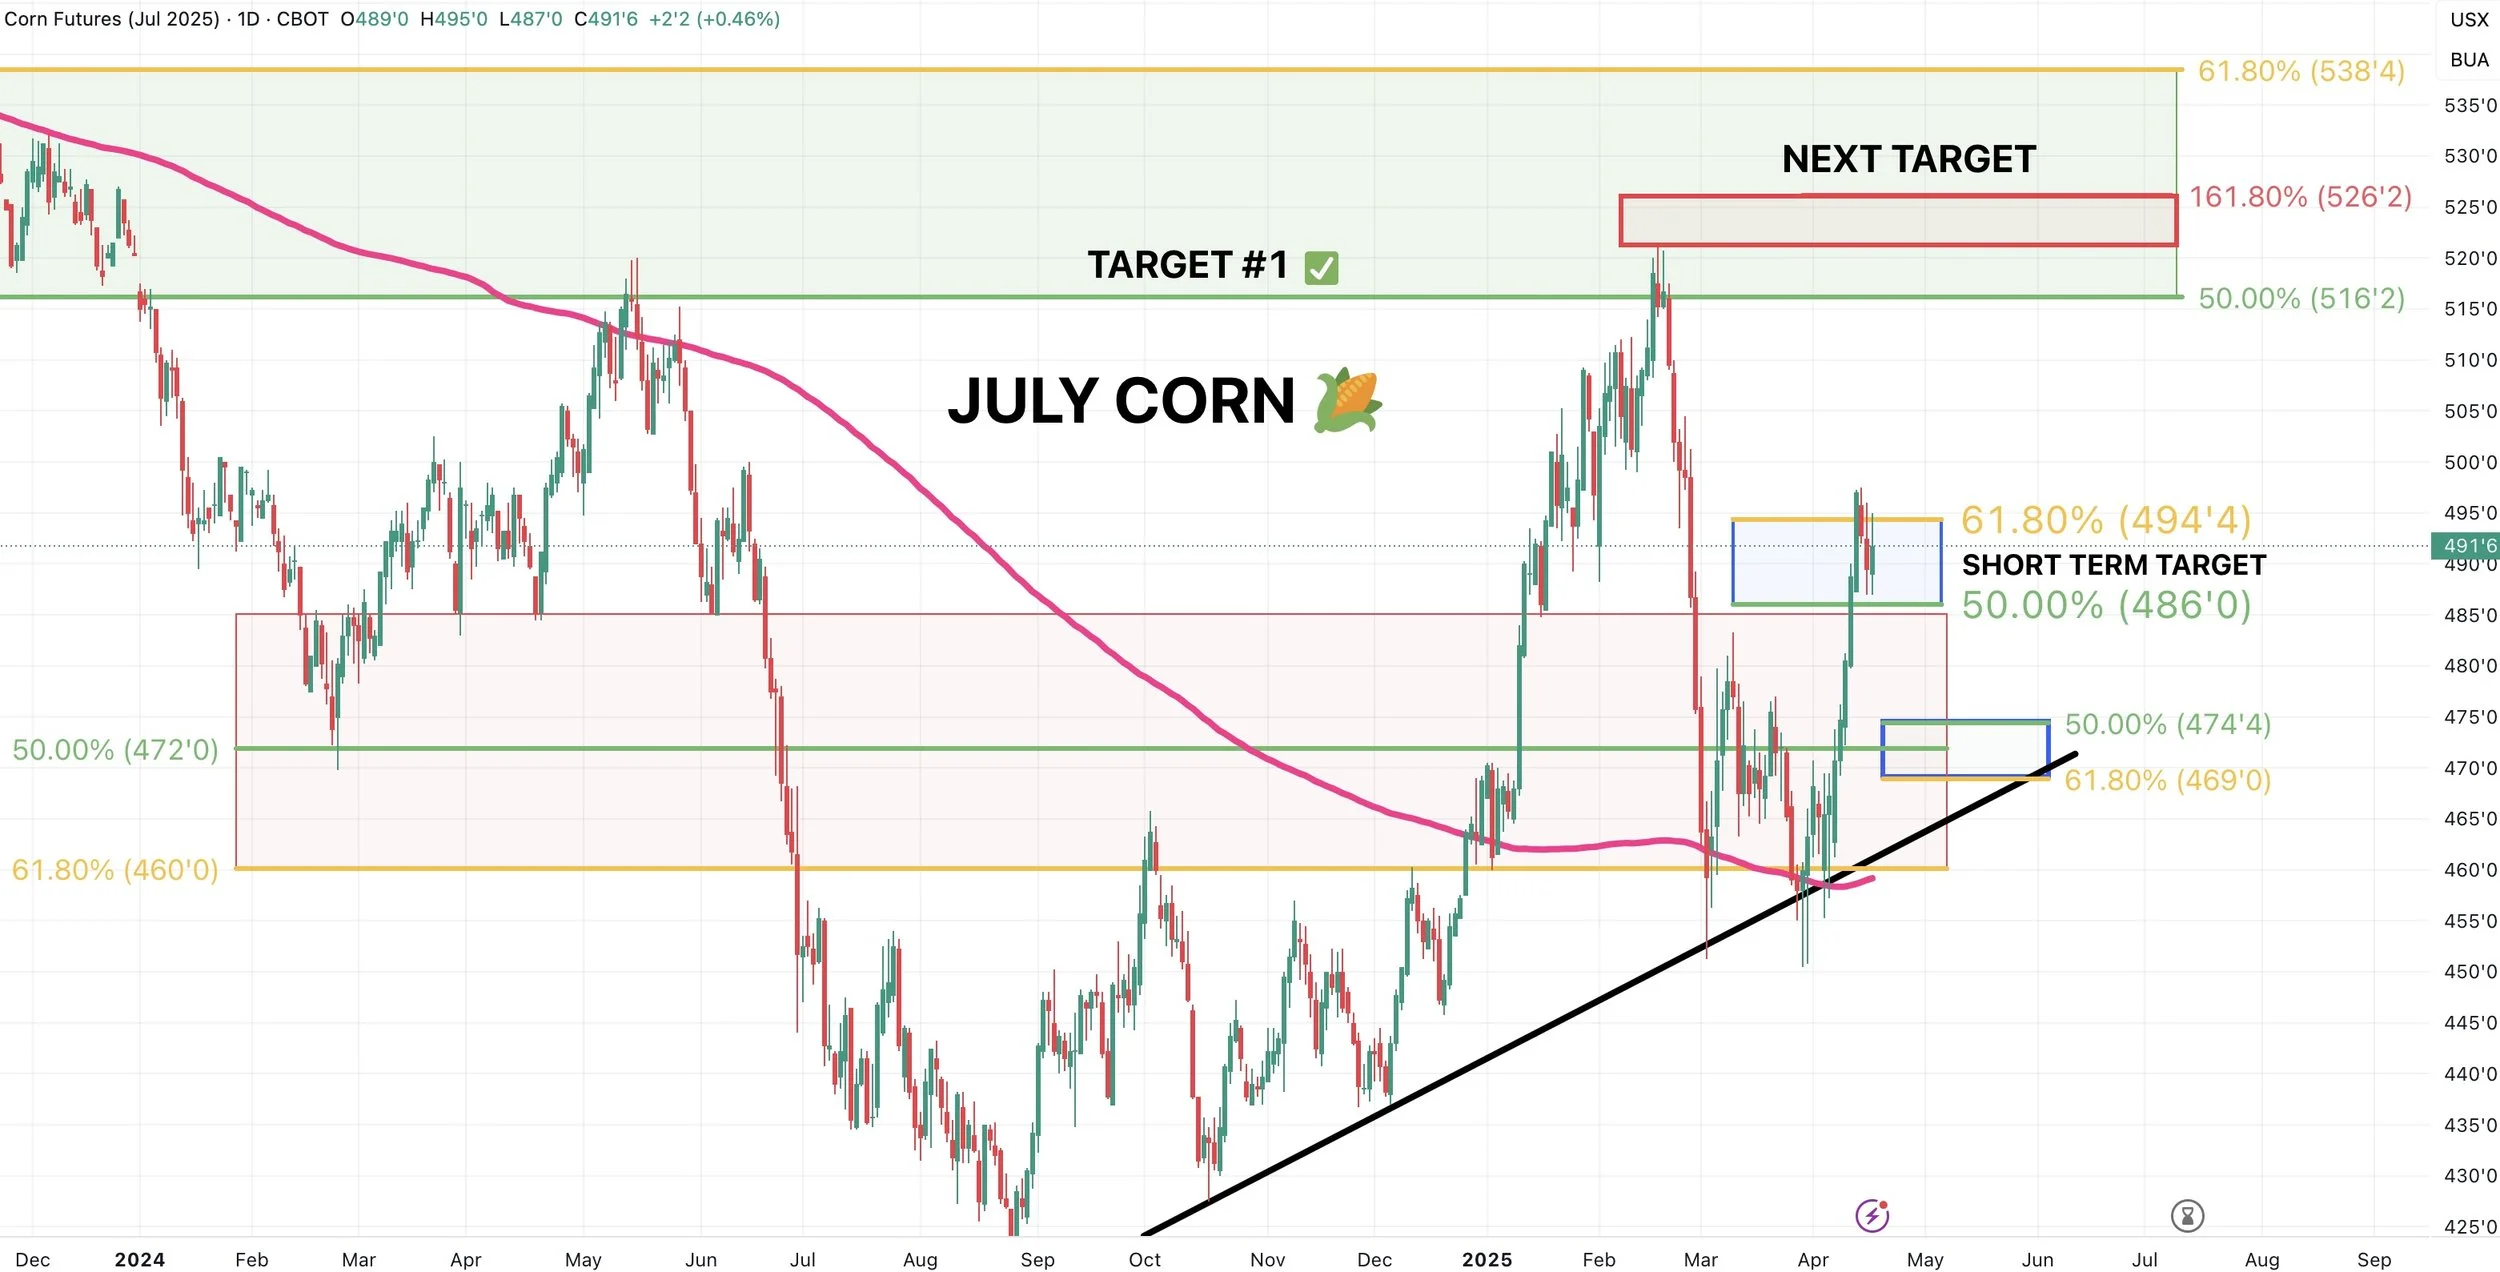
July corn is now back above key support from last spring (top of red box).
Bulls ideally hold here. If not, we probably drop down to $4.70-$4.75 (50-61.8% of this rally).
We hit target #1 ($4.86-$4.94) as we talked about the past few days.
Next target is $5.23-26.
That is the 161.8% of this rally (golden fib extension).
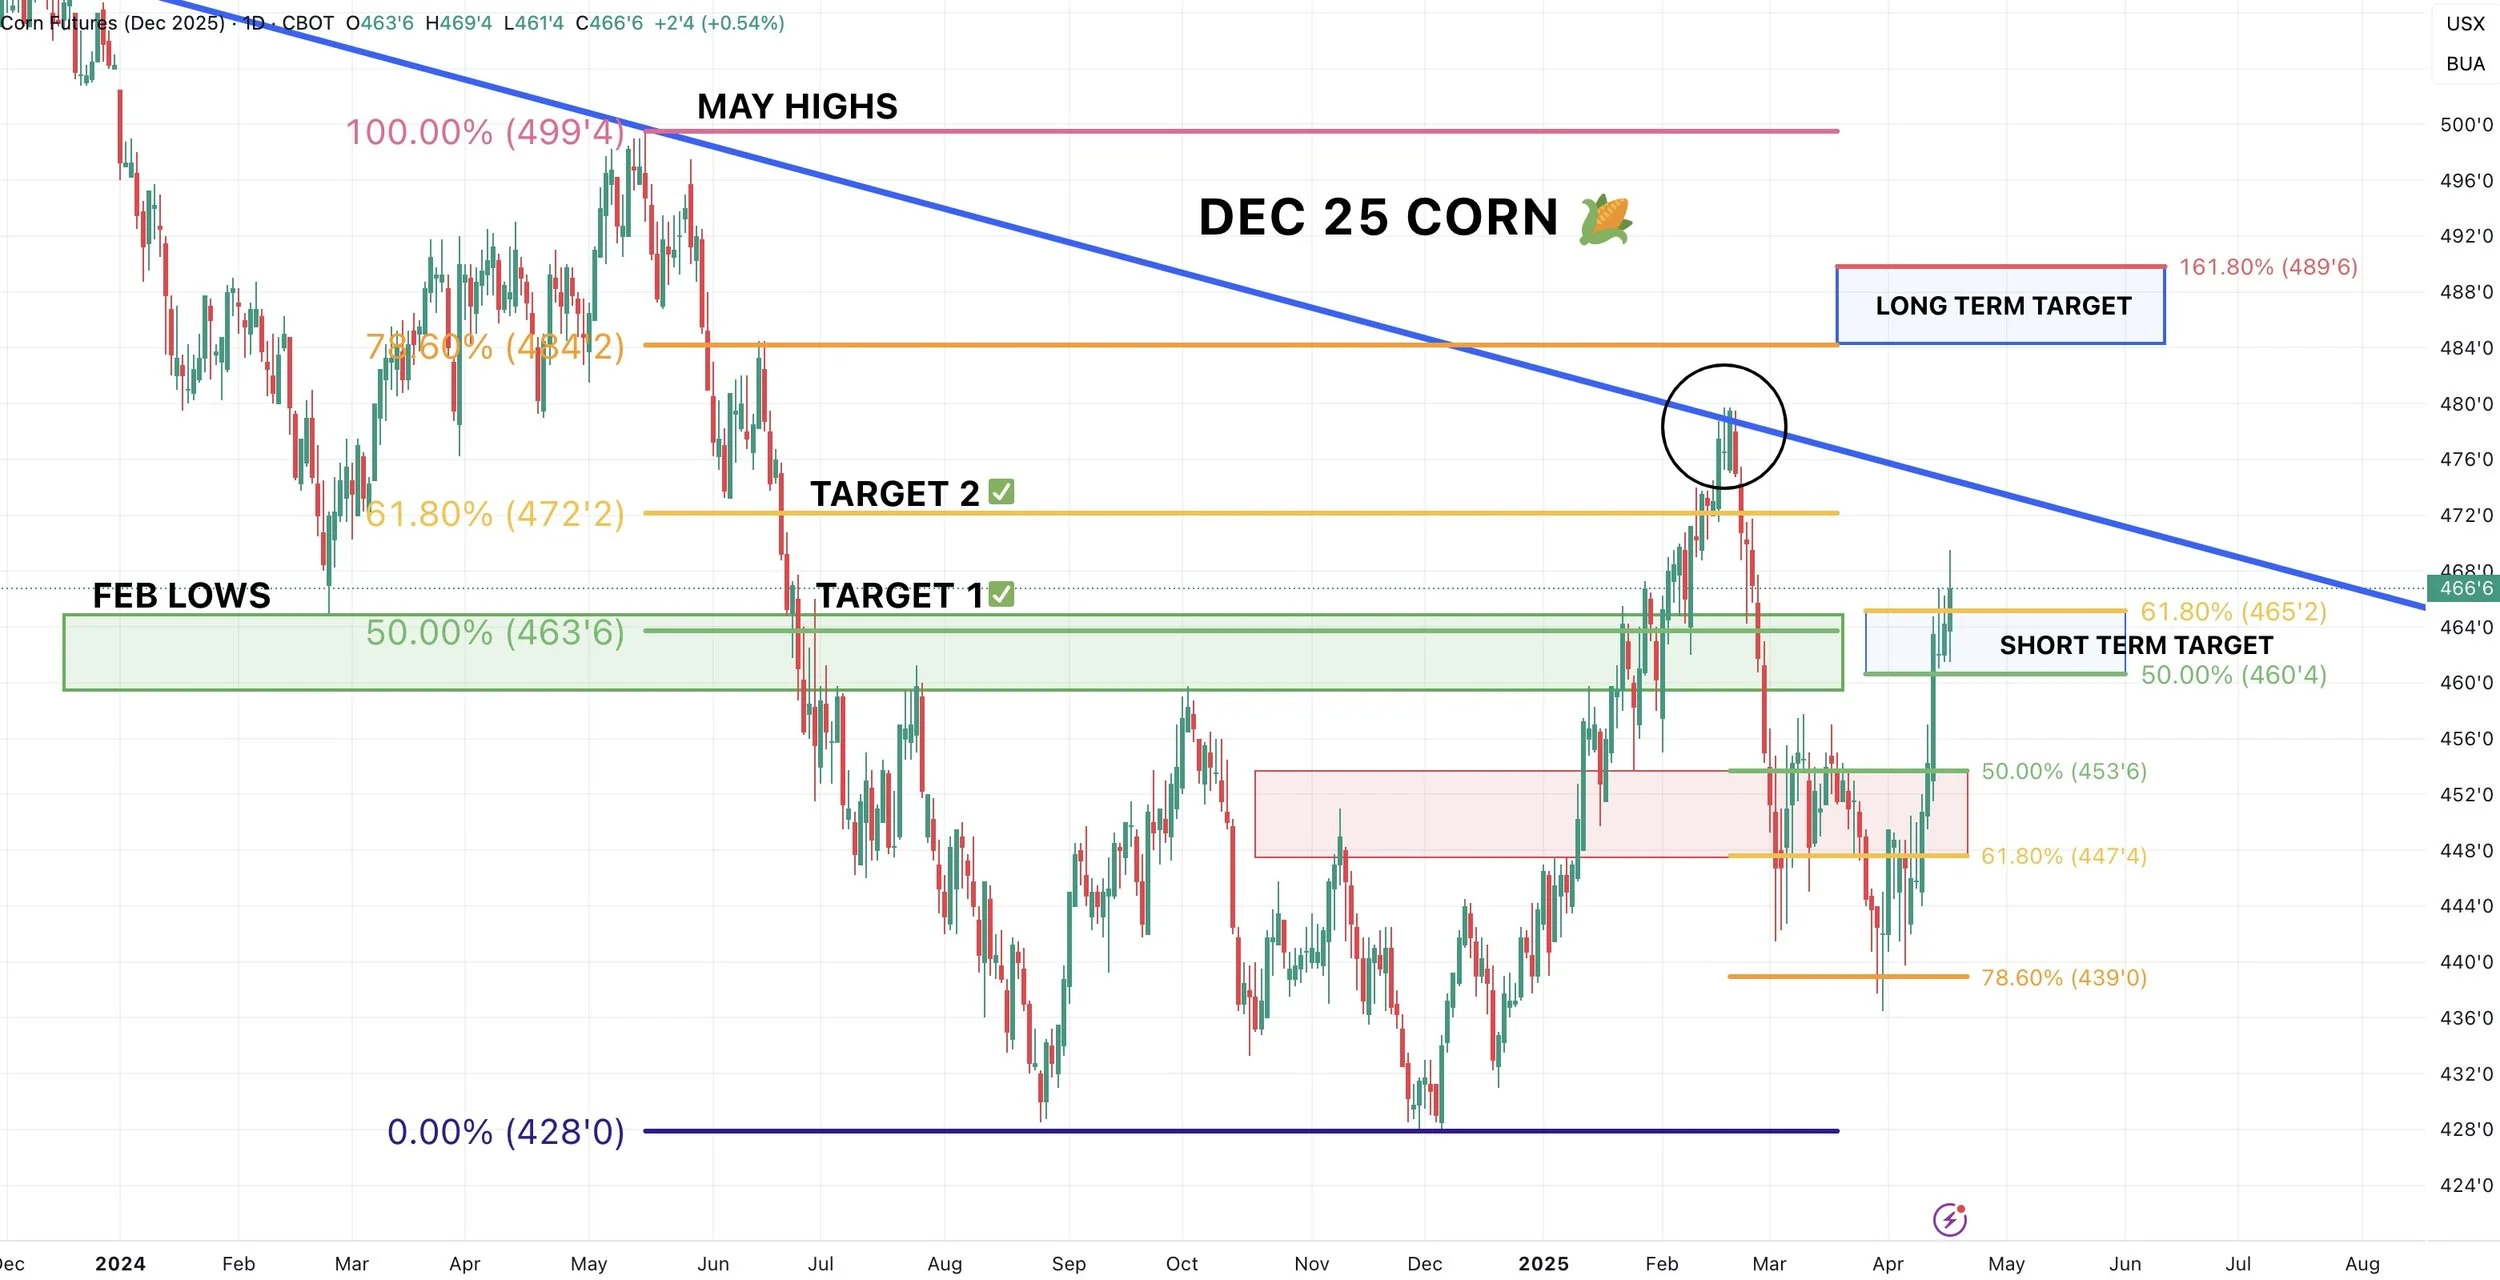
For Dec corn we hit target #1 of $4.65 (61.8% of the sell off) as well as those exact lows from Feb 2024.
So again, if you are uncomfortable this is a spot to de-risk. But I am personally remaining mostly patient.
Next target is currently $4.84 to $4.89
$4.84 gives us back 78.6% of the May 2024 highs.
$4.89 is the golden fib extension of this rally (this is subject to change, as if Dec corn continues to go higher, this fib extension also moves higher)
(Either way I'll be alerting when I am looking to sell).
Soybeans
Fundamentals:
I'm not even going to talk about the trade war, as it's a complete unknown. It has the potential to be extremely bearish or actually bullish if we strike a deal.
It is more of a long term bearish factor than it is bearish right now.
As we don’t sell any beans to China right now anyways. The problem would be if a deal isn’t made by harvest. Then we'd be in trouble. As that is when we sell beans to China.
Outside of that, the US situation is shifting friendly.
Our carryout for new crop is projected to be -25% smaller than last year even if we raise a record 52.5 bpa.
So you can only imagine how tight things could get if we don’t raise a trendline yield.
There is pretty much zero room for error in new crop production.
Technicals:
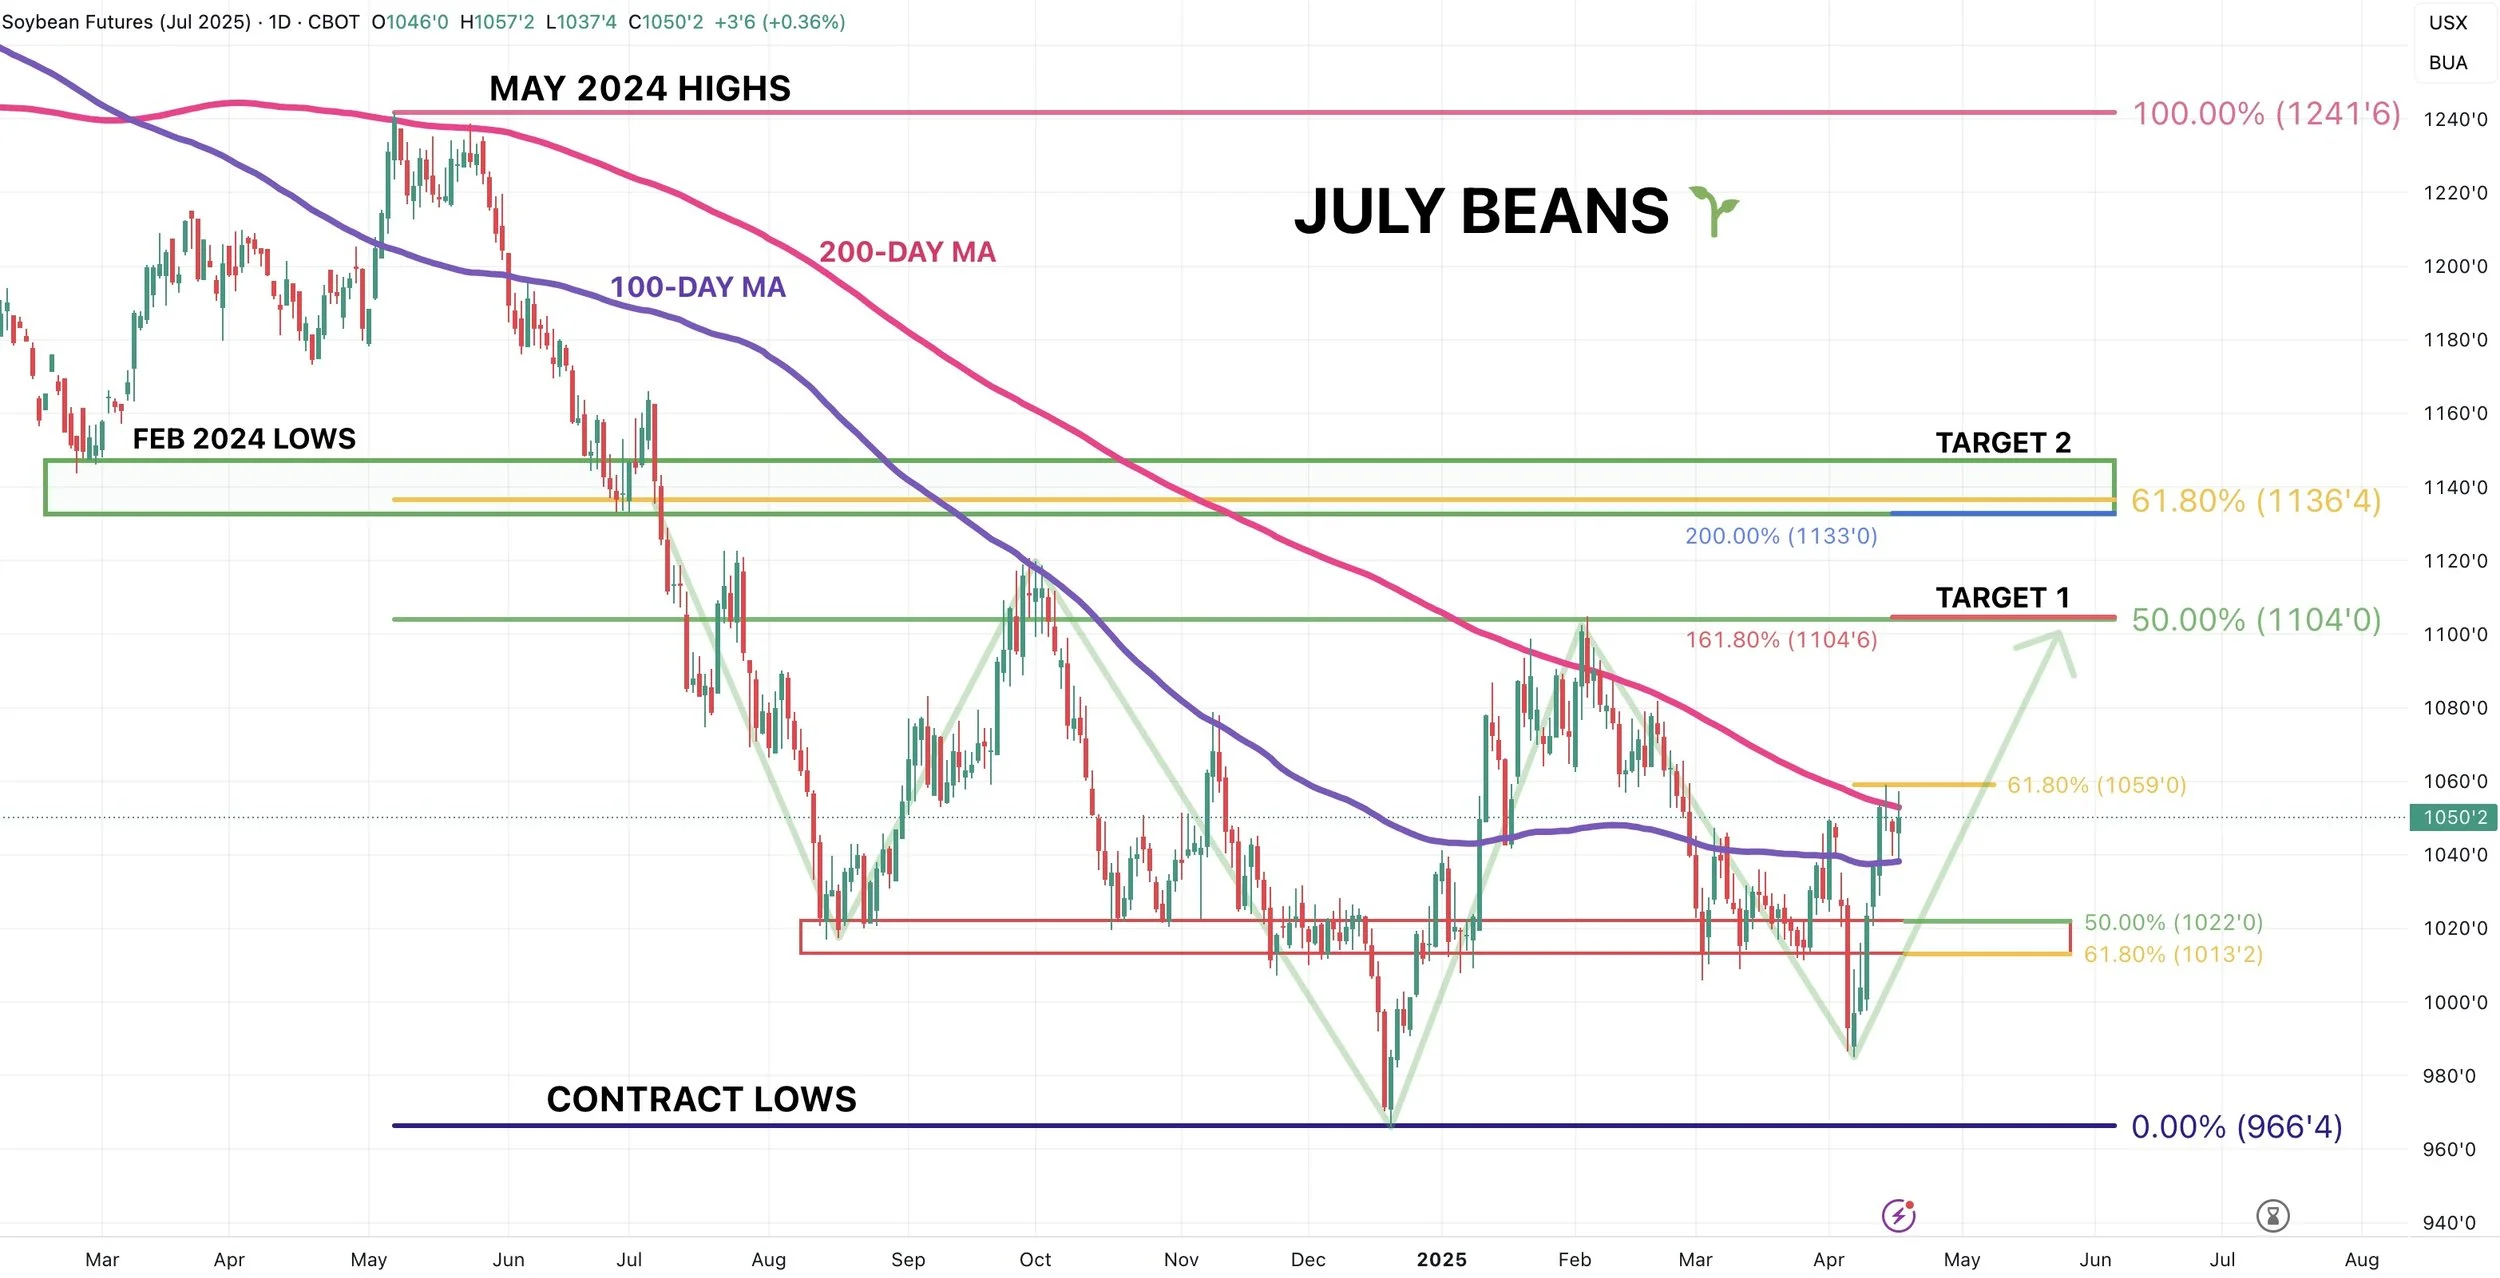
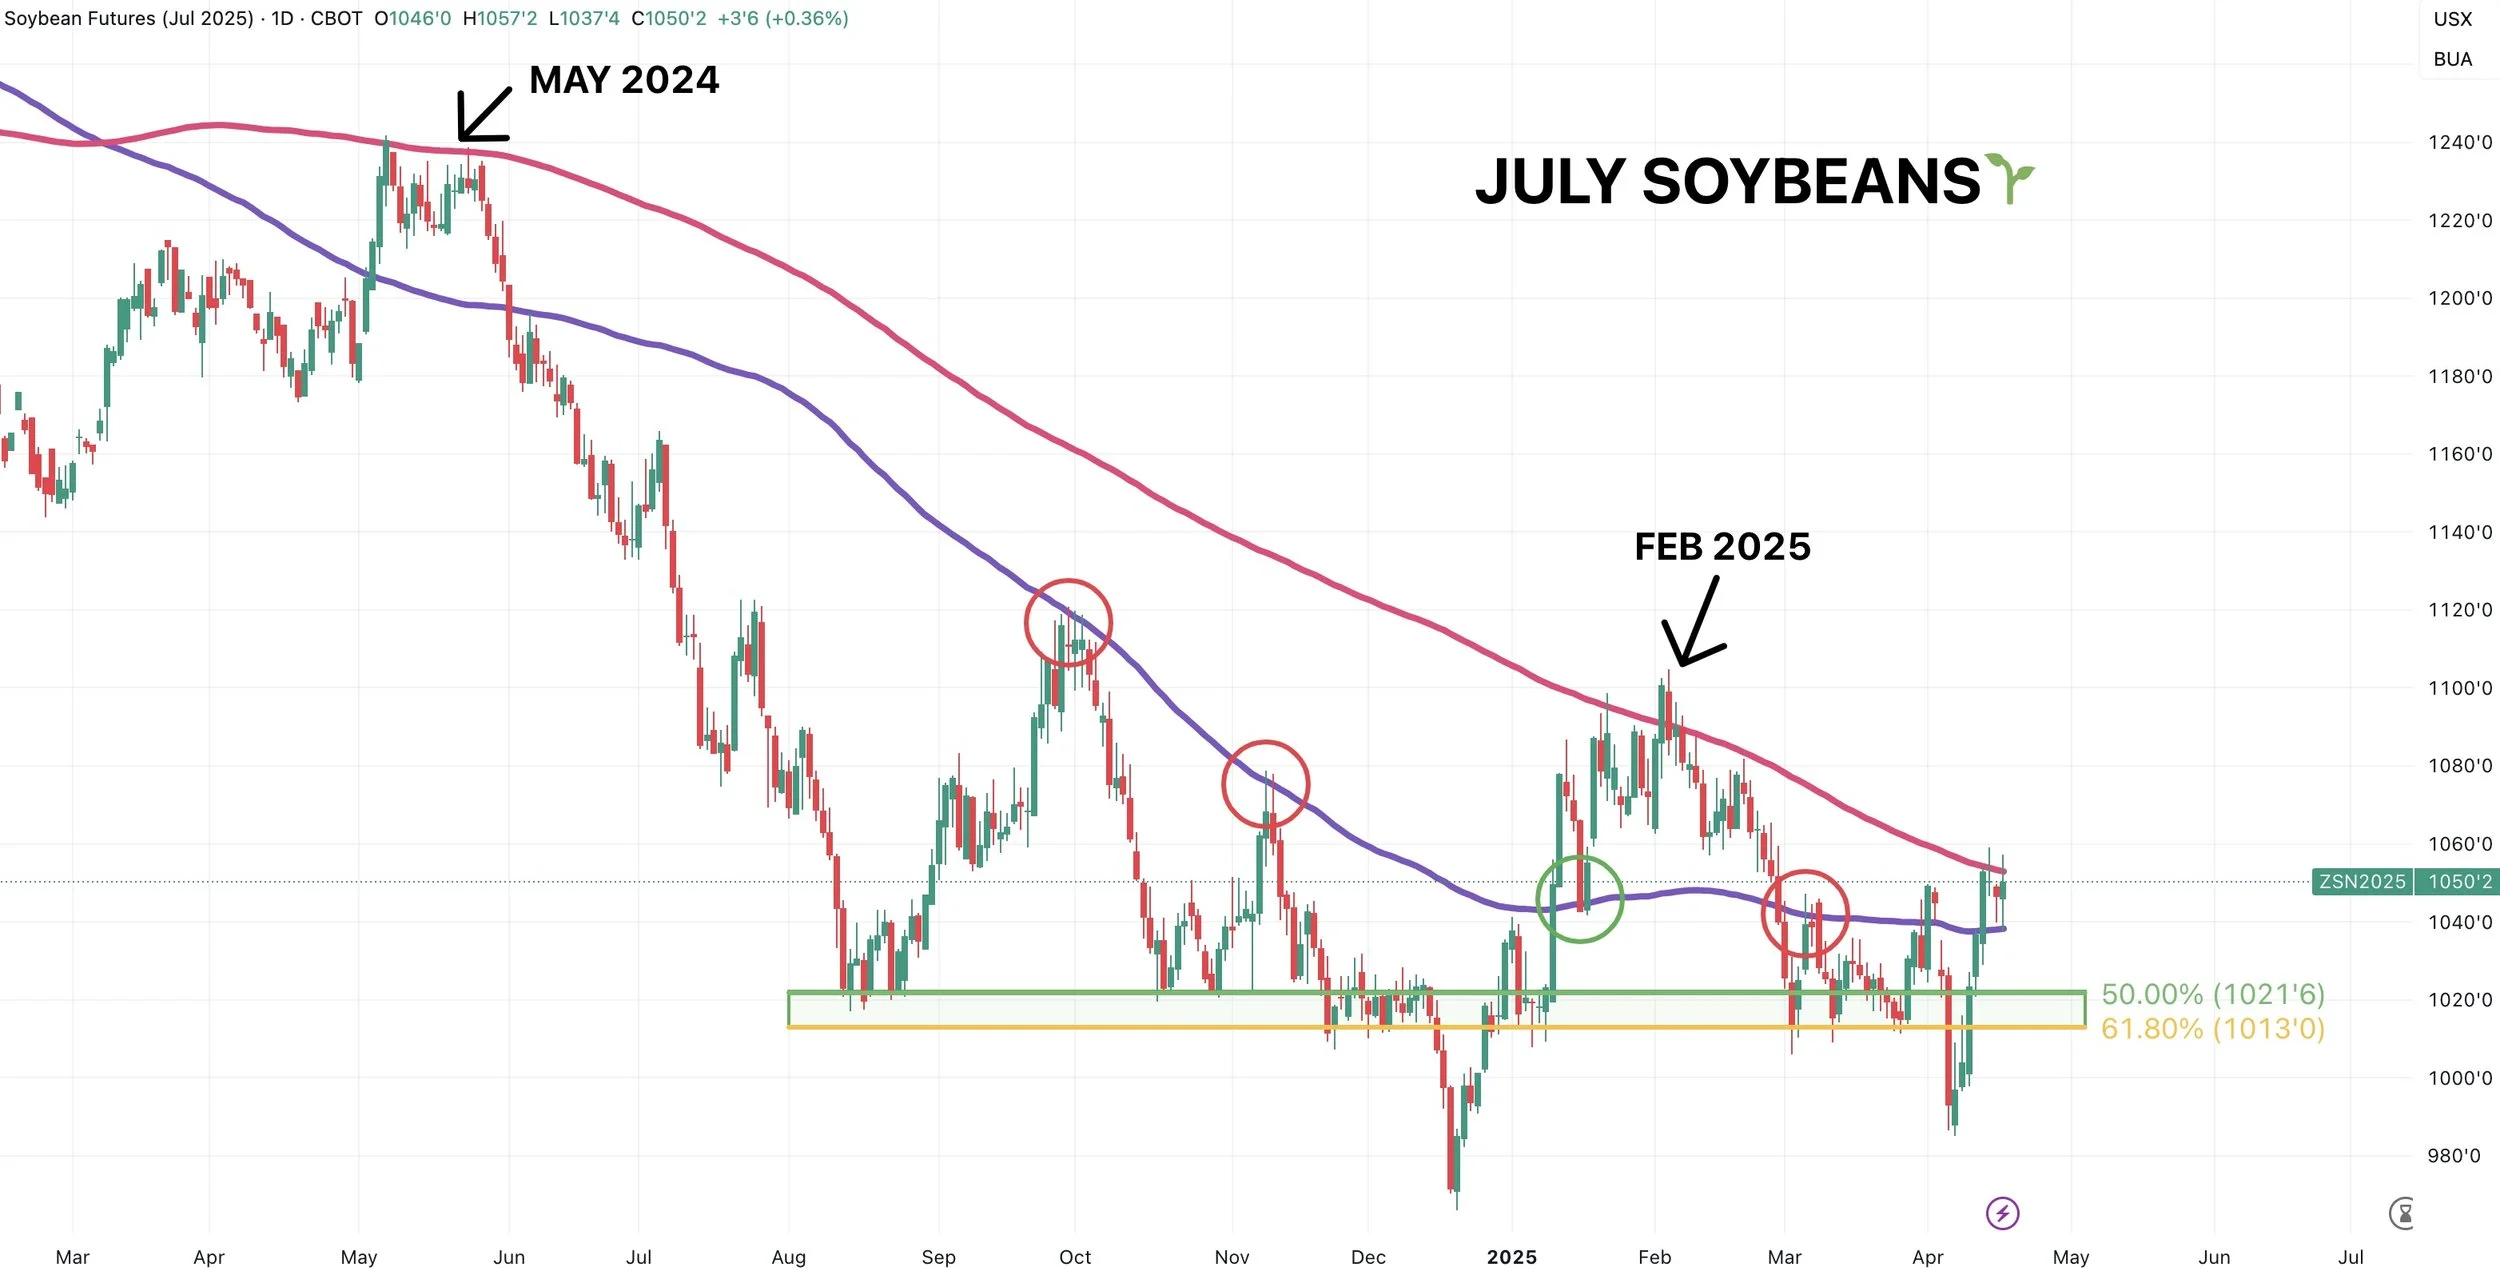
This is a major spot for soybeans. We are pretty much trapped in between the 100-day and 200-day moving averages right now.
Both of these have acted as key spots countless times.
Bulls want to hold the 100-day. If they can’t, it will trigger a leg lower and we will go down and test that old key support box.
That support box also happens to be 50-61.8% of this sell off. Which is a standard correction. So if that did happen, it wouldn’t be the end of the world.
Beans have not closed above the 200-day MA in 2 years. That is how massive of a spot we are at right now.
It makes sense that we would struggle here, as I have outlined the past several days. As we have also clawed back 61.8% of the Feb sell off (which is the most common retracement).
However, due to this being such a massive point of resistance, if we break above this is could light some fireworks under the bean market and should lead to more upside.
Being above or below the 200-day often indicates what type of market you are in. One that is in an upward trend, or a downward trend.
Next target is $11.04
That gives us back 50% of the May 2024 highs and is exactly where we peaked in February.
Here is a more simple view of the movering averages.
We have the exact same set up in Nov beans.
Trapped between the 100 & 200-day MAs.
Next target is currently $10.78 to $10.82
That is the current golden fib extension and 50% of the May 2024 highs.

Wheat
Fundamentals:
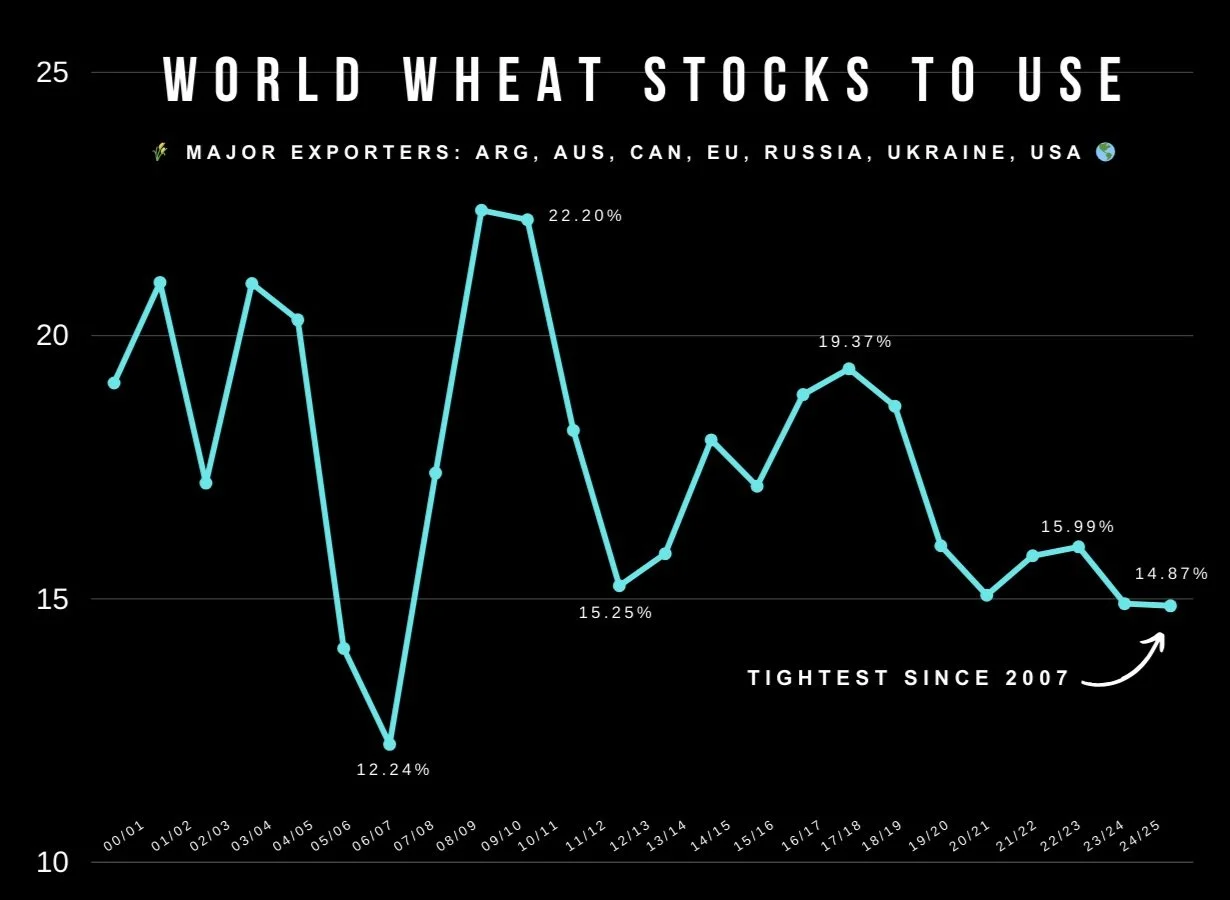
We have the tightest global situation in a decade.
Just major global exporters have the tightest situtation since 2007.
Yet, prices still hovering near multi-year lows.
The dollar is getting crushed.
The drought in Kansas could be a serious issue if they don’t get rain.
Just can’t find any reasons to get too bearish wheat here.
Simply waiting for the next opportunity.
Technicals:
The KC wheat chart is simple.
Need to hold this 8 month long support.
Looking to de-risk at the top of the range once again like we did in February.

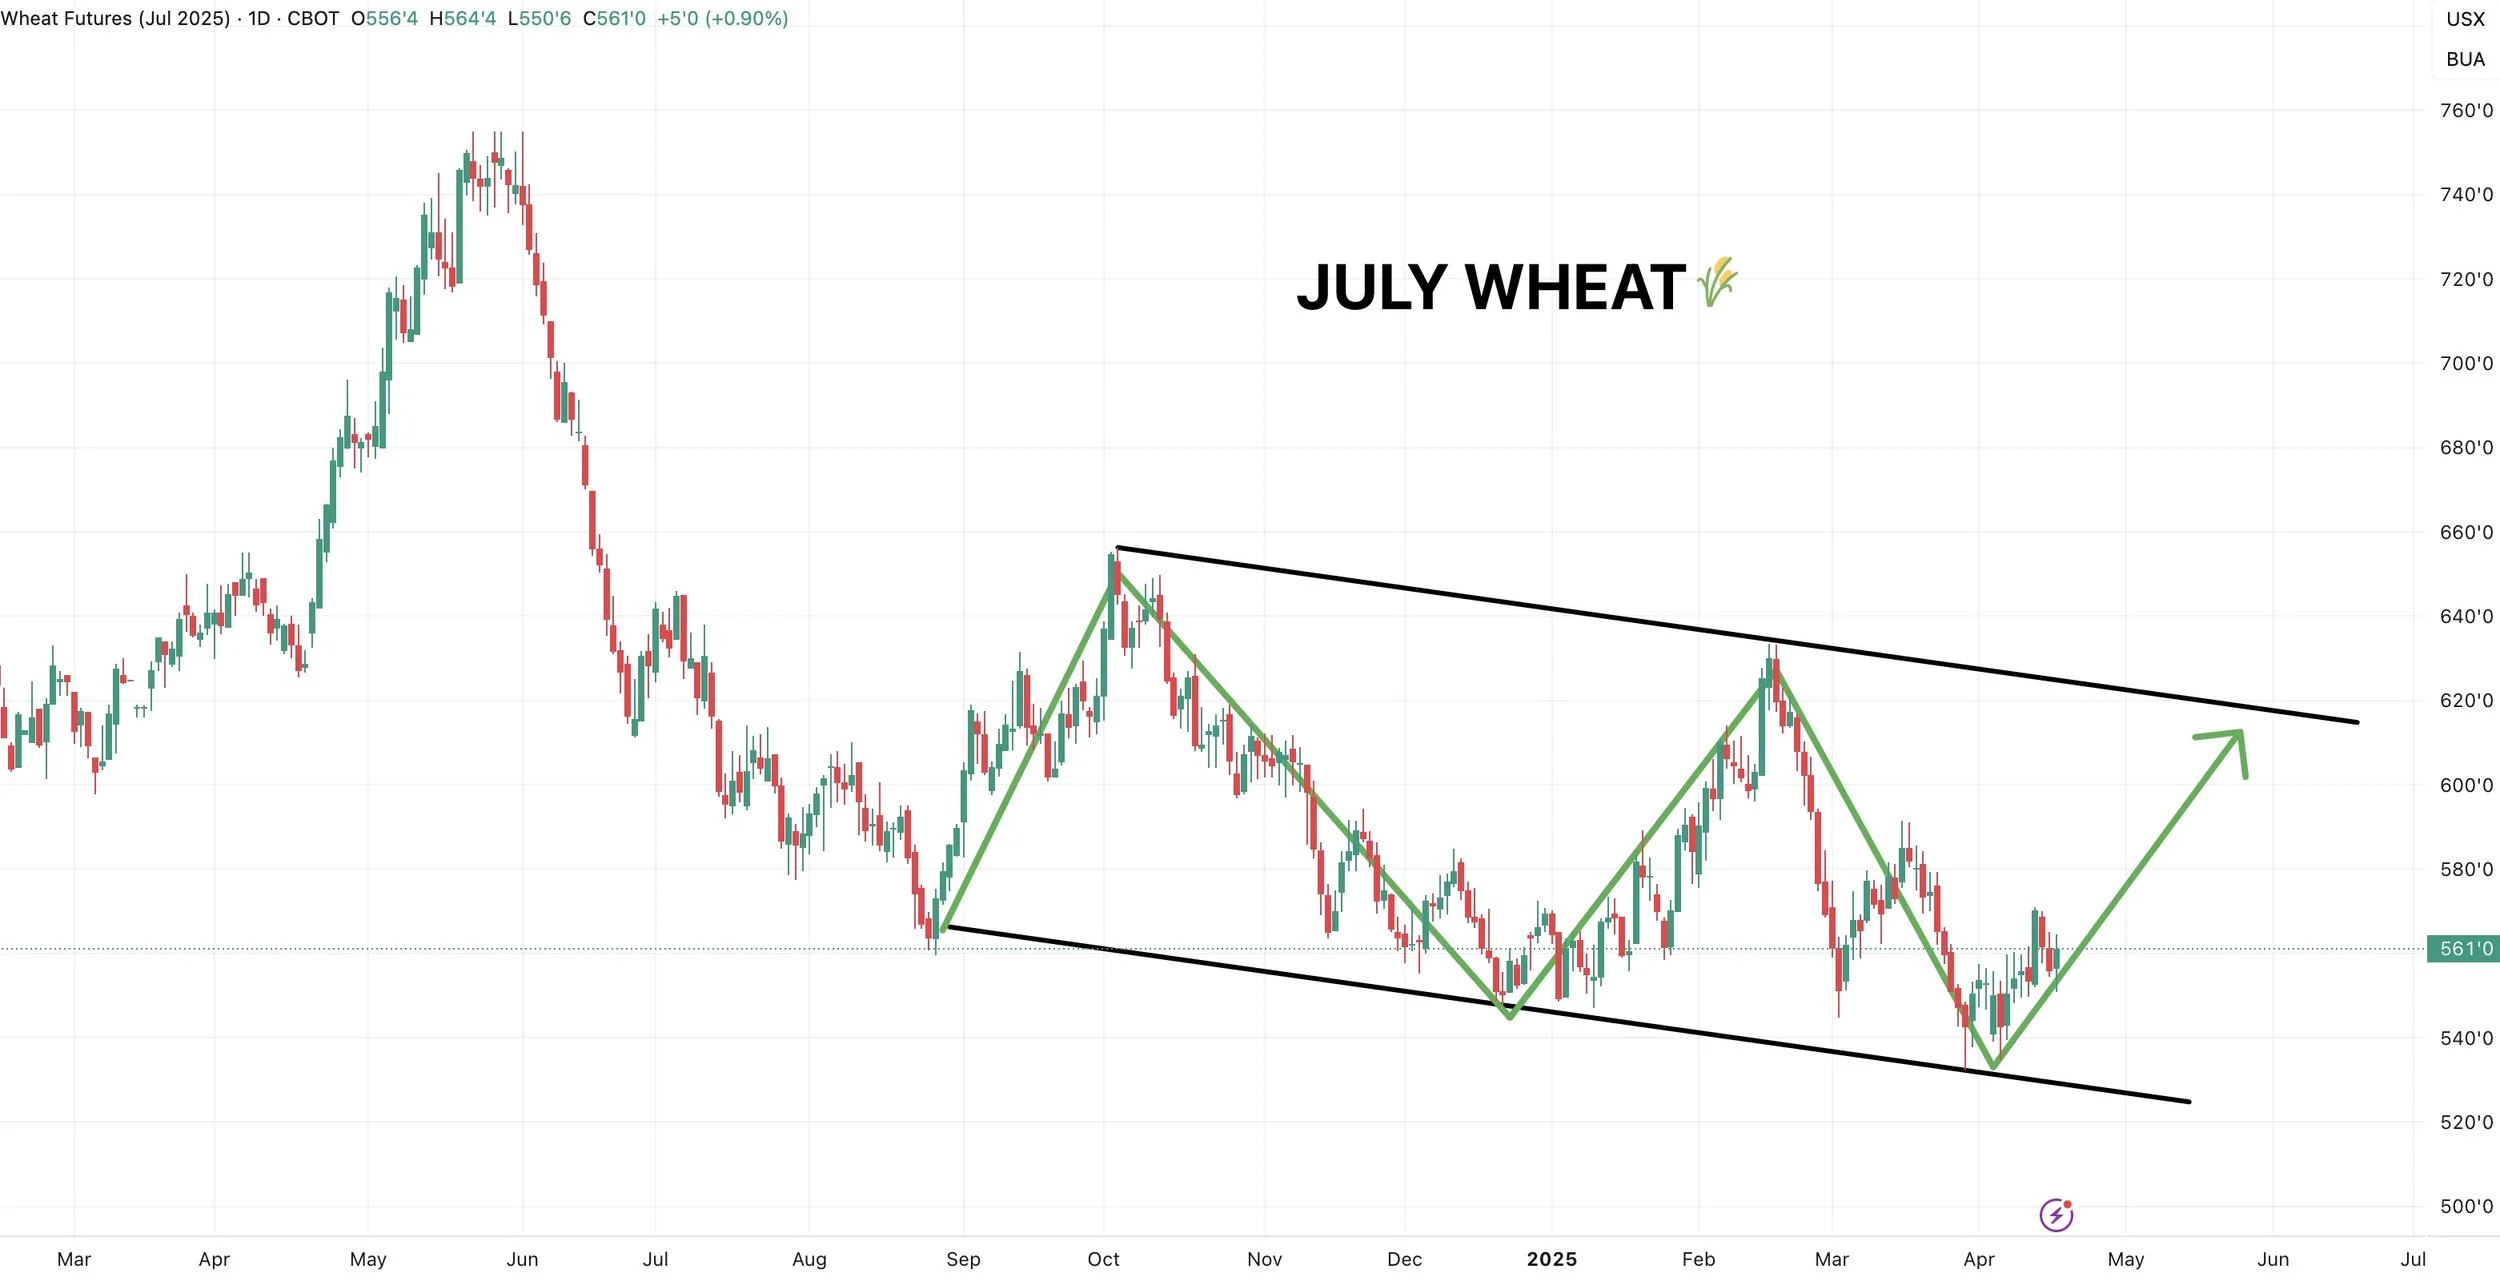
Chicago wheat also has a simple chart.
Trapped in a downward channel.
I don’t have any interest making sales until we get closer to the top of the channel.
Past Sell or Protection Signals
We recently incorporated these. Here are our past signals.
April 10th: 🌽
Old crop corn sell signal.
March 19th: 🐮
Cattle hedge & sell signal.
Feb 18th: 🌽 🌾
Old crop KC wheat & old crop corn signal.
Jan 23rd: 🌽 🌱
Corn & beans old crop sell signal.
CLICK HERE TO VIEW
Jan 15th: 🌽 🌱
Corn & beans hedge alert/sell signal.
Jan 2nd: 🐮
Cattle hedge alert at new all-time highs & target.
Dec 11th: 🌽
Corn sell signal at $4.51 200-day MA
CLICK HERE TO VIEW
Oct 2nd: 🌾
Wheat sell signal at $6.12 target
Sep 30th: 🌽
Corn protection signal at $4.23-26
Sep 27th: 🌱
Soybean sell & protection signal at $10.65
Sep 13th: 🌾
Wheat sell signal at $5.98
May 22nd: 🌾
Wheat sell signal when wheat traded +$7.00
Want to Talk?
Our phones are open 24/7 for you guys if you ever need anything or want to discuss your operation.
Hedge Account
Interested in a hedge account? Use the link below to set up an account or shoot Jeremey a call at (605)295-3100.
Check Out Past Updates
4/15/25
TOTAL CHART BREAKDOWNS & TARGETS
4/14/25
TECHNICAL SELLING IN GRAINS
4/11/25
SPECIFIC GRAIN MARKETING DECISIONS
4/10/25
USDA REPORT. HOW THIS IMPACTS CORN
4/9/25
TARIFFS GIVE. TARIFFS TAKE
4/8/25
CORN’S DIVERGING STRENGTH
4/7/25
SOLID PRICE ACTION DESPITE OUTSIDE FEAR
4/4/25
CORN PRICE ACTION SPEAKS VOLUME. ANY HOPE LEFT FOR SOYBEANS?
4/3/25
WHAT IS LEFT FOR CORN BEARS? TRADE WAR: CHARTS HOLDING SUPPORT
4/2/25
SHOULD UNKNOWNS KEEP A FLOOR UNDER GRAIN PRICES?
4/1/25
HOW DO ACRES IMPACT FUTURE OF THE GRAINS?
3/31/25
USDA REPORT: NOW WHAT?
3/28/25
ALL EYES ON USDA
3/27/25
PRE-USDA POSITIONING. DON’T GIVE GRAIN AWAY
3/26/25
HISTORY OF MARCH INTENTIONS. SOYBEANS UNDERVALUED?
3/25/25
6 DAYS UNTIL MAJOR USDA REPORT
3/24/25
HOW TO POSITION YOURSELF BEFORE PLANTING
3/21/25
REASONS TO BE OPTIMISTIC IN GRAINS?
3/20/25
WAS THAT THE BOTTOM IN CORN?
3/19/25
THE PATH HIGHER & THE DOWNSIDE RISKS IN GRAINS
3/18/25
SEASONALS, CATTLE HEDGE, CHARTS & DROUGHT?
3/17/25
WHEAT RALLIES. DON’T GET BACKED INTO A CORNER
3/14/25
MARCH 31ST REPORT THOUGHTS & WHAT’S NEXT FOR GRAINS
3/13/25
EXPLAINING RE-OWNERSHIP VS COURAGE CALLS
3/12/25
TARIFF FEARS. EU, CANADA, & ETHANOL
3/11/25
USDA SNOOZE. RECORD FUND SELLING A CONCERN?
3/10/25
USDA TOMORROW. GETTING COMFORTABLE IN MARKETING
3/7/25
HOW TIGHT IS THE WORLD & US SITUATION?
3/6/25
TARIFFS PUSHED BACK. FUTURE OPPORTUNITIES?
3/5/25
IS GRAINS BIGGEST RISK WEAK CRUDE & DEFLATION?
3/4/25
TRADE WAR BEGINS. 8TH DAY OF PAIN FOR GRAINS
3/3/25
TARIFFS ON TOMORROW. BUY SIGNAL
3/3/25
BUY SIGNAL
2/28/25
WHEN WILL THE BLEEDING STOP?
2/27/25
CORN AT CRITICAL SPOT. USDA ACRE REPORT. WAY TOO EARLY DROUGHT TALK
2/26/25
HISTORY SUGGESTS CORN TOP ISN’T IN? ACRE OUTLOOK TOMORROW
2/25/25
POSITIVE CLOSE. WHAT TO KNOW ABOUT USDA OUTLOOK
2/24/25
USDA OUTLOOK, FIRST NOTICE DAY & BRAZIL
2/21/25
WHAT TO EXPECT MOVING FORWARD IN GRAINS
2/20/25
FIRST NOTICE DAY CONCERNS. MASSIVE CORN ACRES OR NOT?
2/19/25
HOW TIGHT IS THE CORN SITUATION?
2/18/25
MORE DETAILS ON TODAYS SELL SIGNAL
2/18/25
OLD CROP KC WHEAT & CORN SELL SIGNAL
2/14/25
WHEAT BREAKING OUT ON WEATHER RISK. TECHNICALS & FUNDAMENTALS
2/12/25
GLOBAL GRAIN SITUATION, ACRE TALK, CHARTS & MORE
2/11/25
USDA: NOT A BEARISH REPORT. DISAPPOINTING PRICE ACTION
2/10/25
USDA TOMORROW. LONG TERM PATH FOR SUB 10% CORN STOCKS TO USE?
2/7/25
WHY WOULD THE FUNDS EXIT THEIR LONGS?
2/6/25
WHEAT FINALLY CATCHING A BID
2/5/25
COMPLETE THOUGHTS ON MARKETS: BACK & FORTH DISCUSSION
2/4/25
STRONG JANUARY LEAD TO STRONG YEAR? TARIFFS, CHARTS & MORE
2/3/25
TARIFFS PUSHED BACK
1/31/25
TARIFF NEWS ALL OVER THE PLACE. ARE YOU PREPARED FOR POSSIBILITIES?
1/30/25
WHEAT BULL ARGUMENT. TRUMP ADDS TARIFFS
1/29/25
CORN APPROACHES $5.00
1/28/25
TARIFFS, CORN FUNDS, SOUTH AMERICA & MORE
1/27/25
HEALTHY CORRECTION WE TALKED ABOUT & TARIFF NEWS
1/24/25
GRAINS DUE FOR SHORT TERM CORRECTION?
1/23/25
OUR ENTIRE NEW CROP SALES THOUGHTS & OLD CROP SELL SIGNAL
1/22/25
GRAINS TAKE A BREATHER. IS CORN IN A BULL OR BEAR MARKET?
1/21/25
HUGE DAY IN GRAINS. WHAT TO DO WITH OLD CROP VS NEW CROP
Read More
1/20/25
VIDEO CHART UPDATE
1/17/25
TRUMP, CHINA, ARGY & USING THE SPREADS INVERSE
1/16/25
OLD CROP LEADS US LOWER. MARKETING THOUGHTS
1/15/25
SIGNAL & HEDGE ALERT QUESTIONS EXPLAINED. IS $6 CORN EVEN POSSIBLE?
1/14/25
MORE DETAILS ON TODAYS HEDGE ALERT & SELL SIGNAL
1/14/25
CORN & SOYBEANS HEDGE ALERT/SELL SIGNAL
1/13/25
USDA GAME CHANGER OR NOT?
1/10/25
BULLISH USDA FOR CORN & BEANS
1/9/25
USDA OUT TOMORROW
1/8/25
2 DAYS UNTIL USDA. BE PREPARED
1/7/25
THE HISTORY OF THE JAN USDA & MORE
1/6/25
MAJOR USDA REPORT FRIDAY
Read More
1/3/25
UGLY DAY ACROSS THE GRAINS
1/2/25