
USDA REPORT. HOW THIS CHANGES THINGS
MARKET UPDATE
You can scroll to read the usual update as well. As the written version is the exact same as the video.
Timestamps for video:
Overview: 0:00min
How USDA Changes Things: 1:30min
Chart Breakdowns: 8:10min
Want to talk about your situation?
(605)295-3100
Futures Prices Close

Overview
Before we go over the report, I did want to mention that a trade deal between the US and China has been made as I'm sure you saw over the weekend.
This trade deal did not include anything saying China has agreed to buy more soybeans or corn.
The US simply lowered it's tariffs on China imports from 145% to just 30%. While China reduced it's tariffs on US good from 125% to just 10%.
These reductions are effective for the next 90 days.
Despite this not being a trade deal where China buys a bunch of ag, this deal aims to de-escalate the trade war. Which is a great first step in the right direction and brings true optimism and helps remove that thought process that soybean export demand is going to be awful.
They both agreed to continue negotiations.

The USDA Report
Bullish report for corn & soybeans, bearish report for wheat.
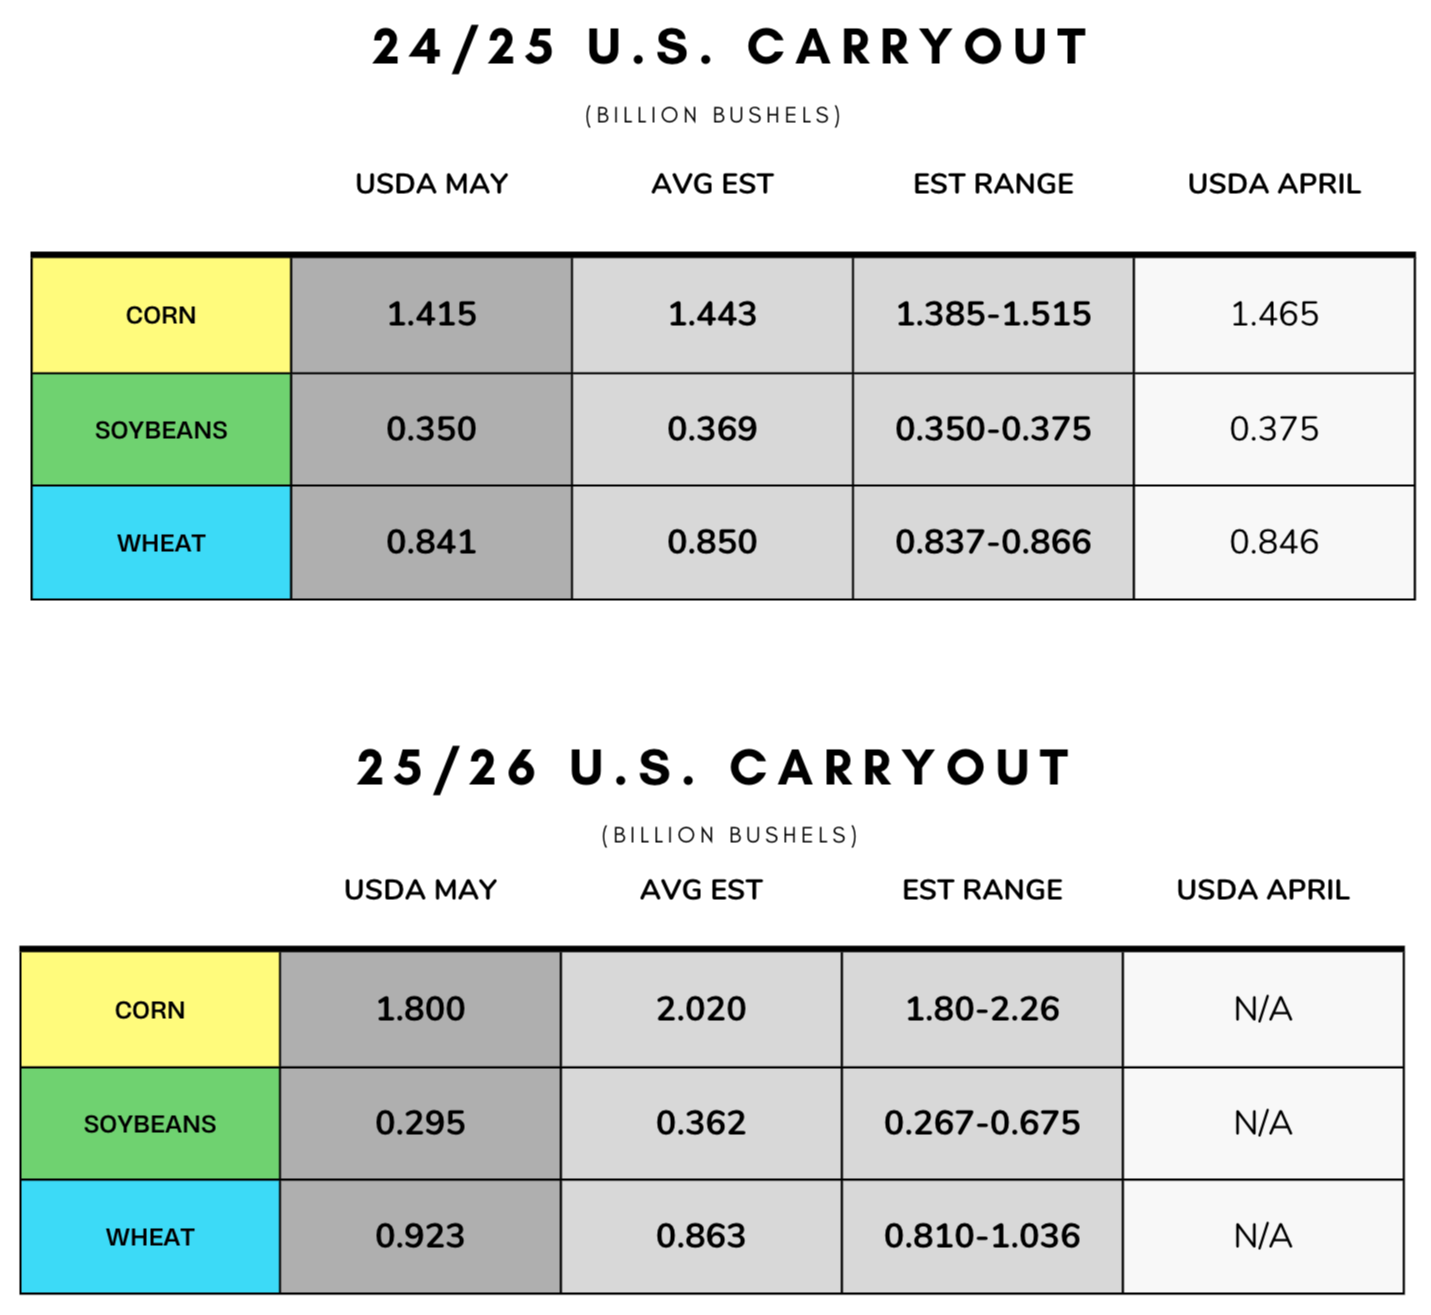
Before we dive into the numbers, here was the numbers vs the estimates
New crop corn came in well below the estimates (1.80 vs 2.02 est). Old crop was slightly below estimates as well.
New crop beans also well below the estimates (0.295 vs 0.362 est). Old crop was also slightly below estimates.
New crop wheat came in above the estimates (0.923 vs 0.863 est).
How this Changes Things
Soybeans
First let's look at the soybean numbers.
For old crop, no ground breaking changes.
We saw exports raised by +25 million to 1,850.
Which dropped carryout from 375 to 350 million bushels.
This was our first offical look at the new crop balance sheet.
There was concern that the USDA might lower exports with the tariff uncertainty.
This concern was seen in the pre-report estimates. As there was a massive range for carryout of 267 to 675 million because no one knew if the USDA would lower exports.
But they did not. Exports came in at 1,815 (vs 1,850 for old crop). Not a substantial decrease vs last year and in line with their Feb outlook estimates of 1,865. So the USDA isn’t yet concerned with the trade war's effects on exports.
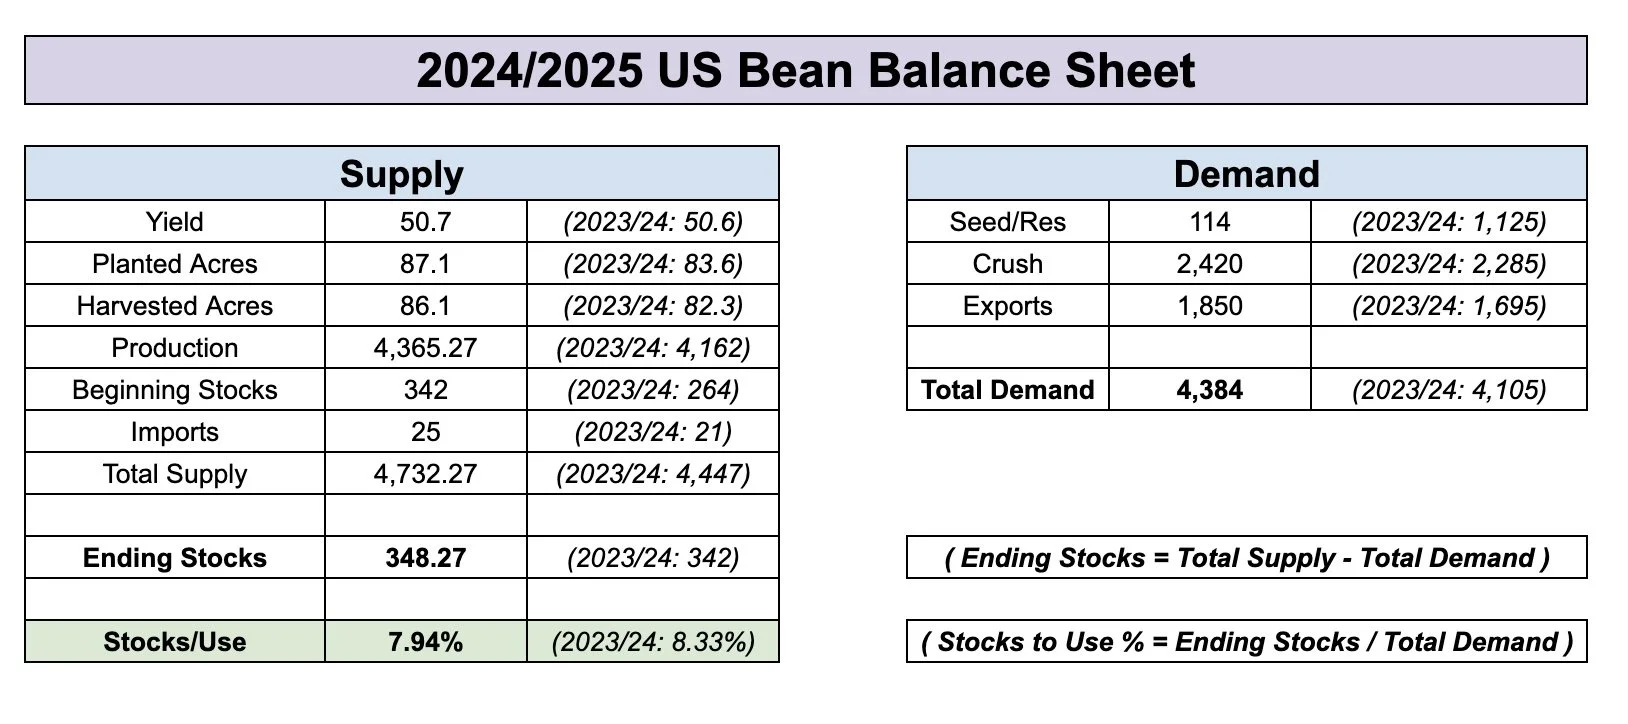
Here is the official new crop balance sheet vs the balance sheet using the Feb outlook numbers and March acres. They were relatively in line.
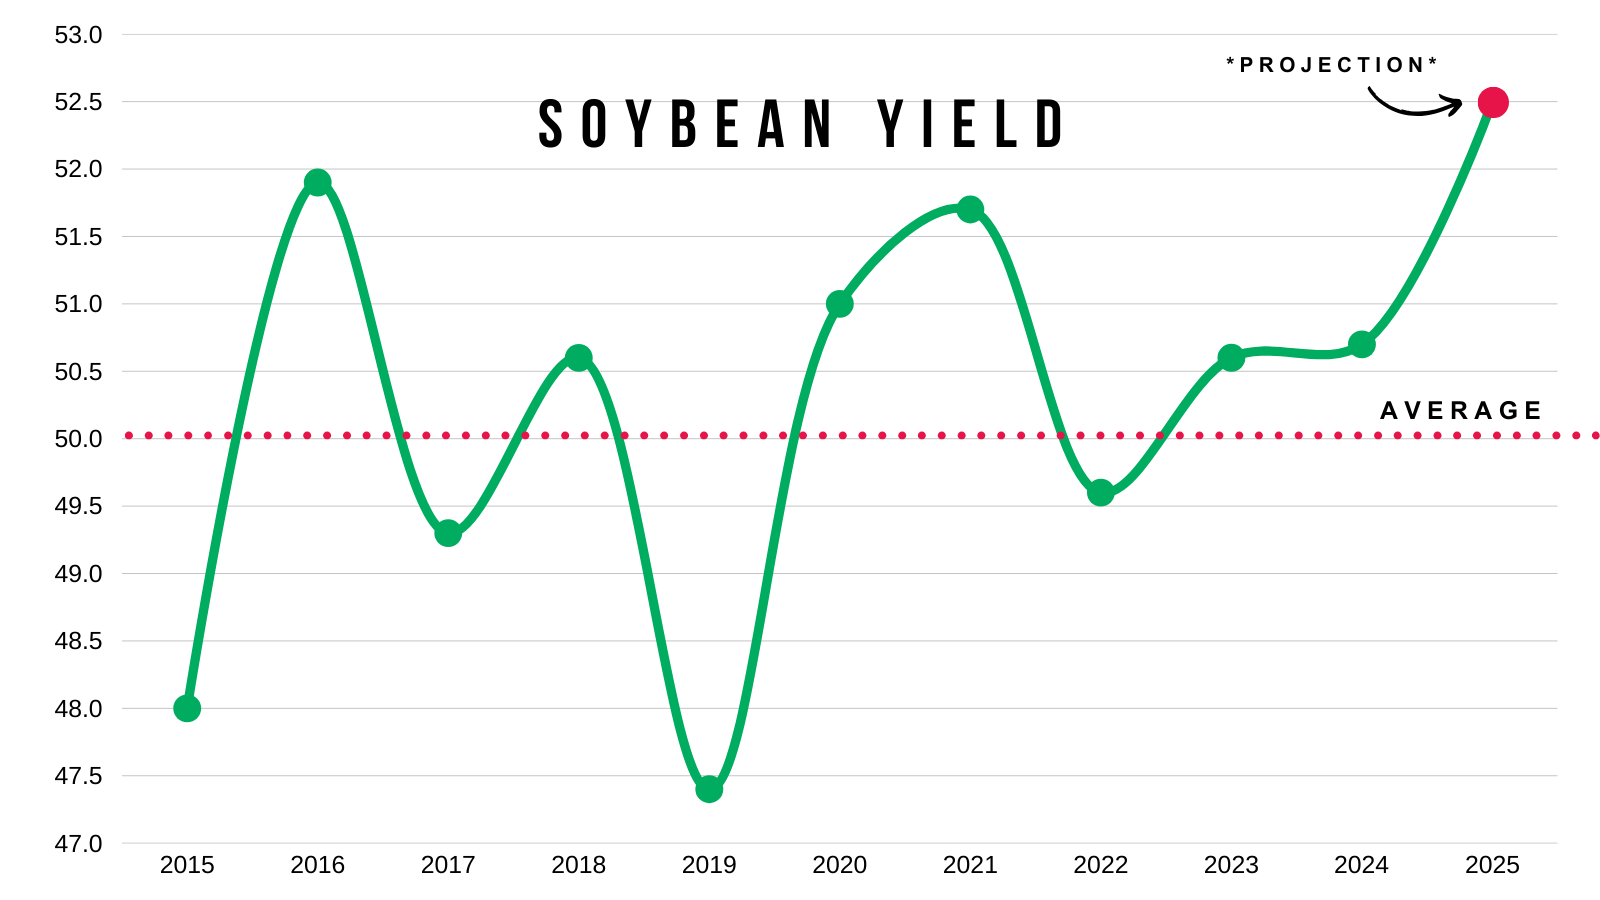
Our new crop carryout is officially -15% below last year even with a record 52.5 bpa yield.
Sitting at 295 vs 350 million bu last year.
Offical New Crop Balance Sheet
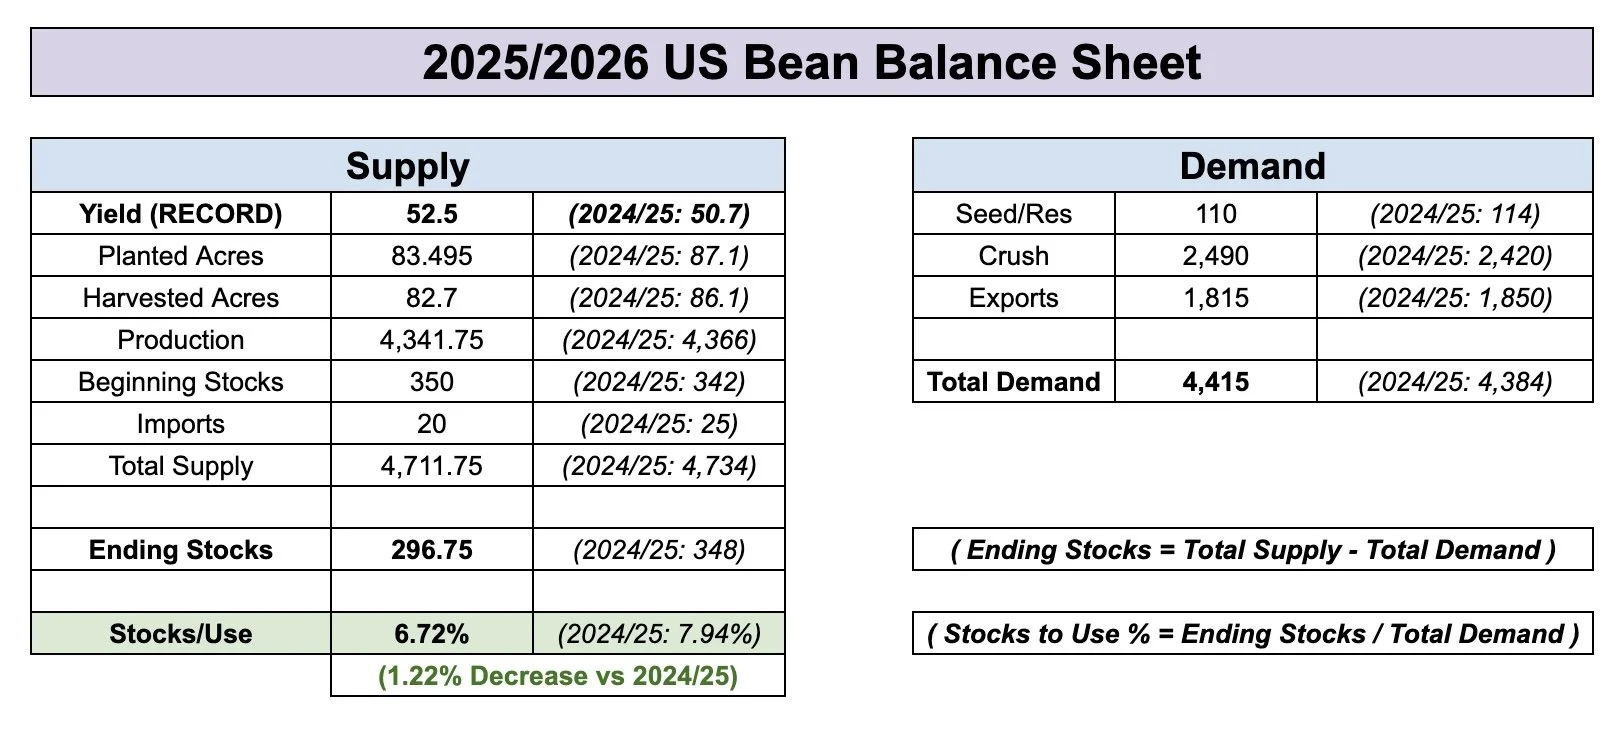
Based on Feb Outlook & March Acres
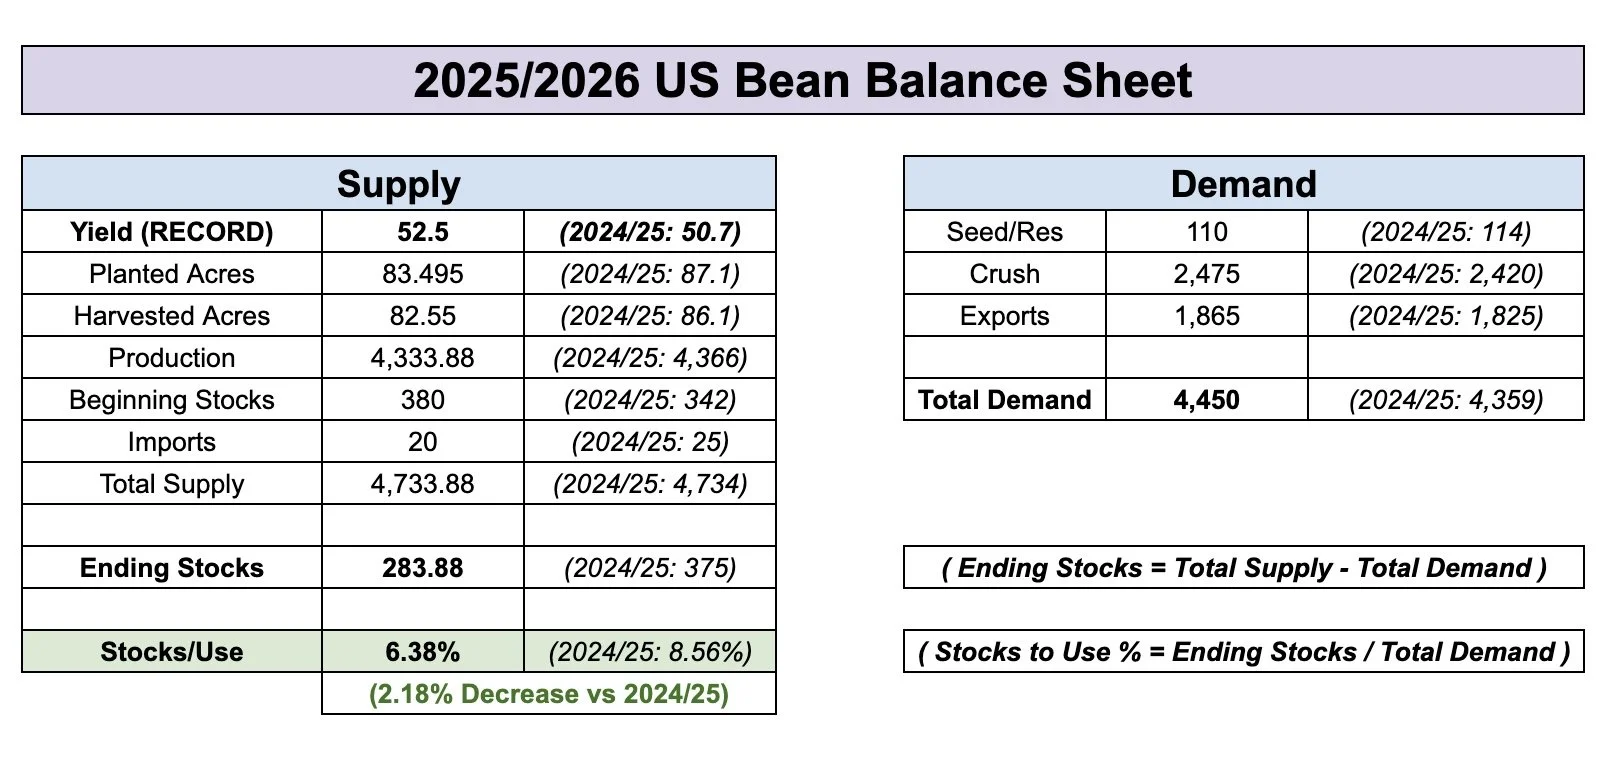
Now what if yield even just slightly disappoints and comes in at 51 bpa?
Just that minor yield change could substantially eat into the new crop carryout.
Based on the current demand numbers, it would drop carryout from 295 to 170 million.
Which would be a massive -50% decrease vs last years 350 million.
Again, this is without any changes to demand (there will be changes to demand). But the point is, there is not much room for error in this US bean crop.
If yield slips, the situation becomes tight fast.
Based on the numbers, it does feel like soybeans are undervalued and poised for some future upside.
51 Yield Scenario
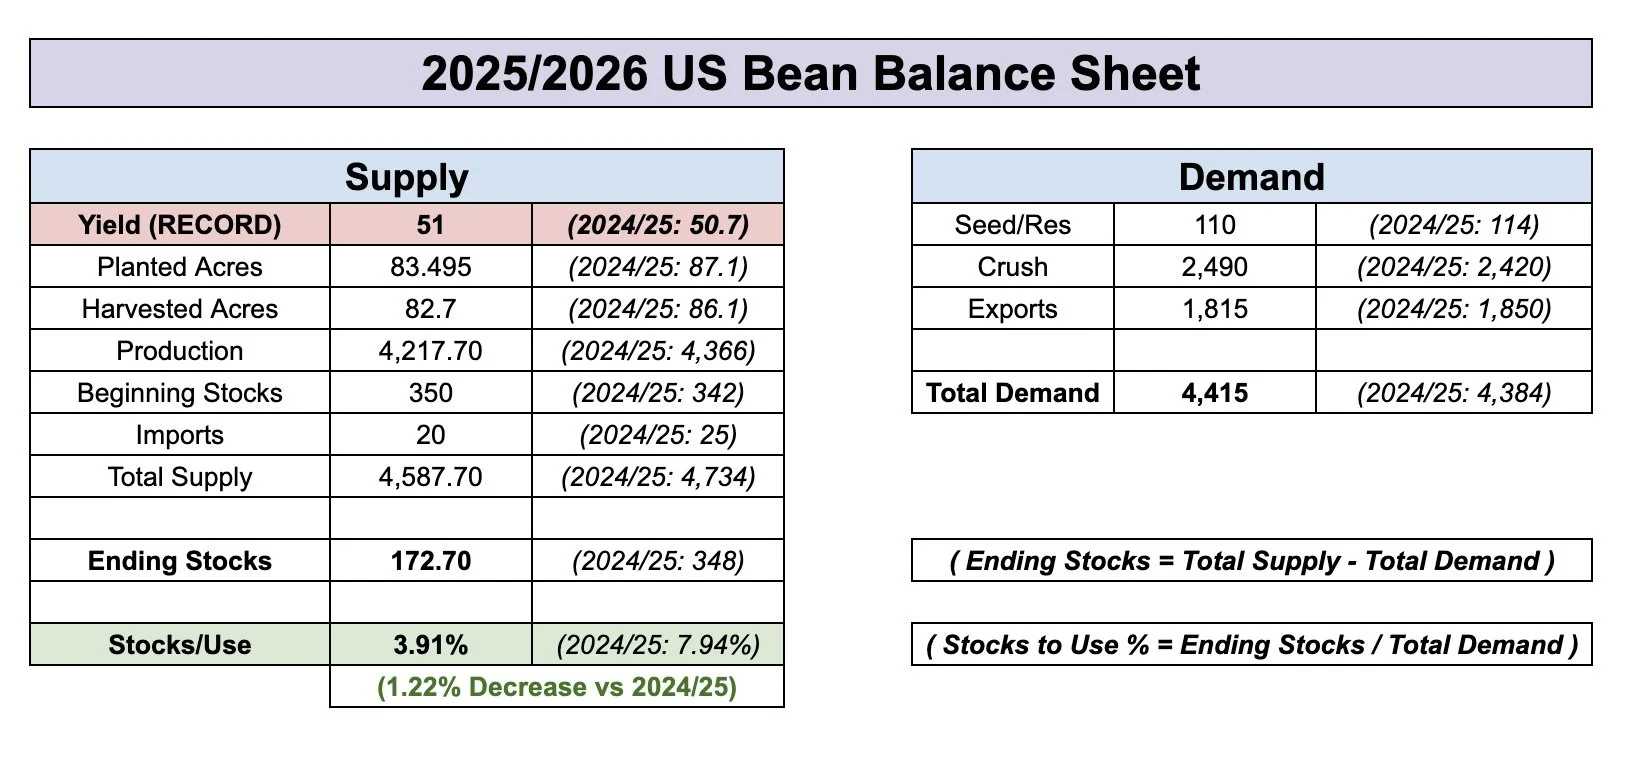
For reference we have never seen a 52 bpa yield.
Average yield for the past 10 years is 50 bpa.
Lastly here is another arguement to be made that soybeans are undervalued.
Our new crop carryout is far tighter than last year at this time, yet we are -$1.50 cheaper.
Our old crop carryout is the same as it was yet we are -$1.50 cheaper.

Corn
Now let's look at corn.
For old crop, we saw exports bumped another +50 million from 2,550 to 2,600.
This brought carryout from 1.465 to 1.415 billion.
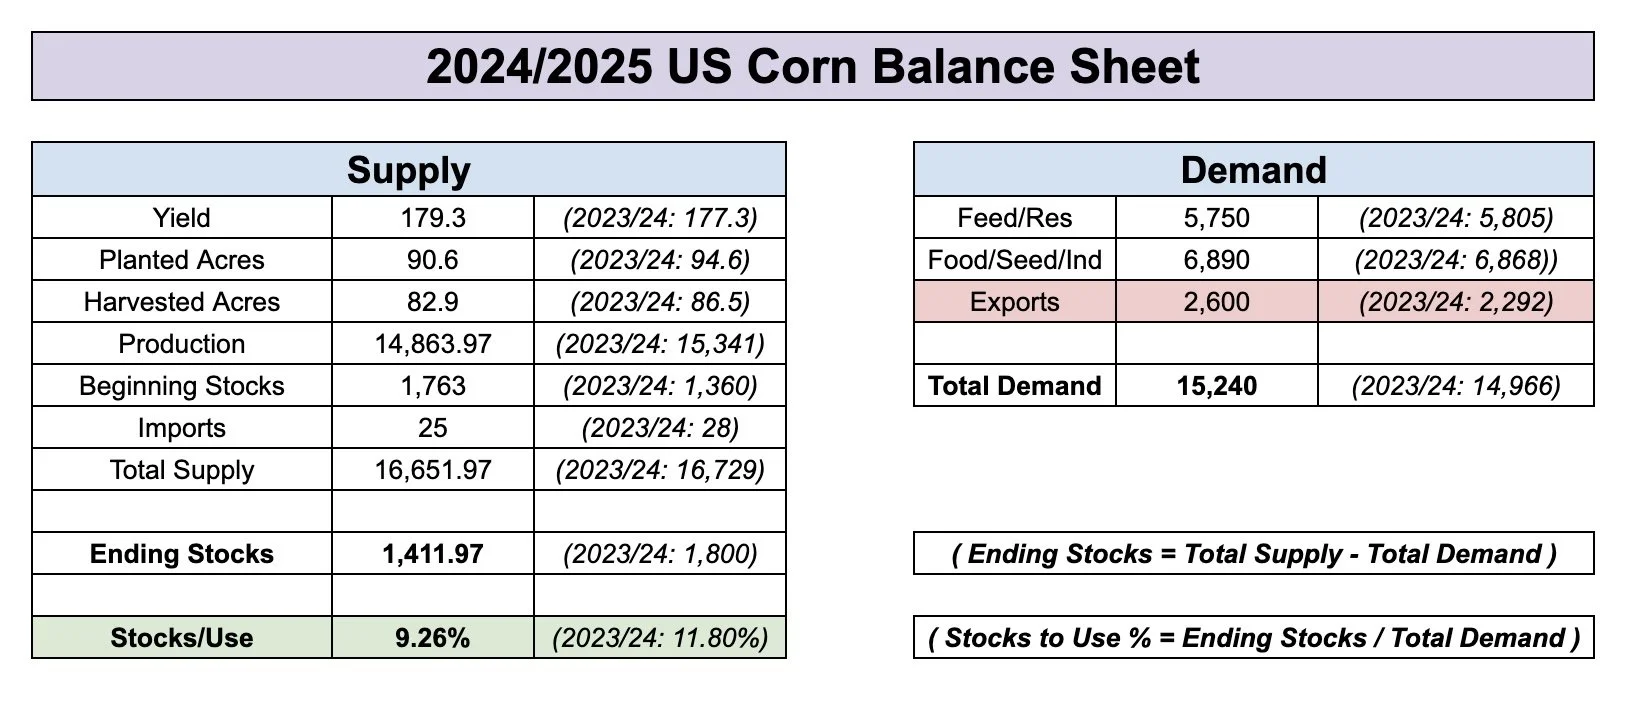
New crop is where the surprise came.
Nearly everyone was expecting a carryout north of +2 billion. Instead it came in at 1.80 billion due to a big surprise in exports.
In the Feb outlook, they were projecting exports at 2,400.
Today they put exports at 2,675. Above old crop's 2,600.
A huge +275 million increase from the Feb outlook.
This alone dropped the carryout projections from +2 billion to now just 1.80 billion bushels. A huge win for the bulls and great thing moving forward.
Here is the official balance sheet vs the Feb outlook & March acre numbers.
Offcial New Crop Balance Sheet

Based on Feb Outlook & March Acres
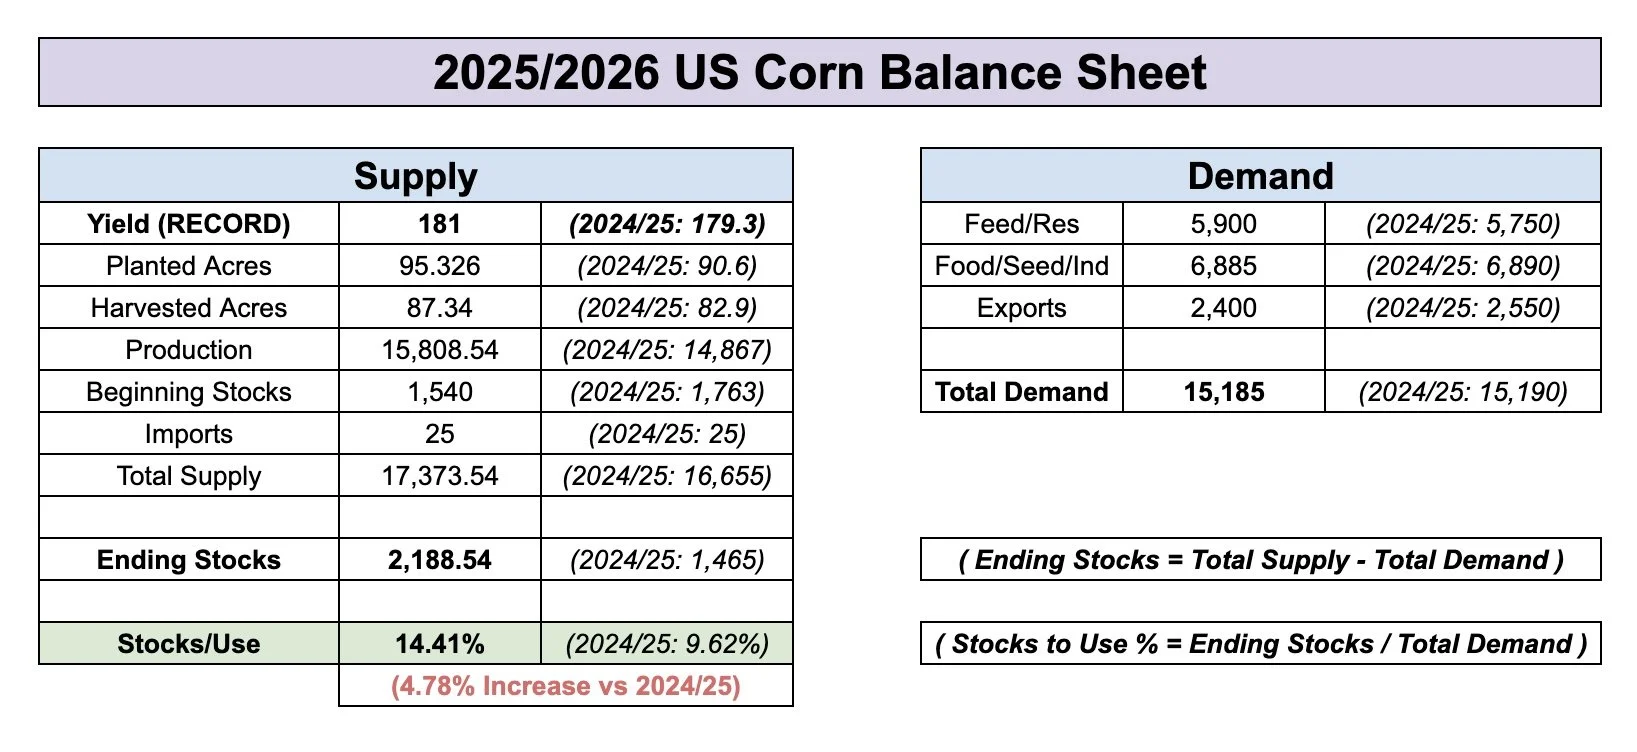
Our new crop stocks to use ratio is now projected at 11.64% compared +14% based on the Feb numbers.
This still isn’t a bullish number, but is far less burdonsome than it could’ve been.
Often times, we will see our highest carryout print of the year in the initial estimates.
So starting at 1.80 billion gives us a lot easier path than starting with 2.20 billion.
Here is a chart showing you a visualization of the official new crop stocks to use vs based on the Feb outlook numbers. A lot friendlier now but still not bullish.

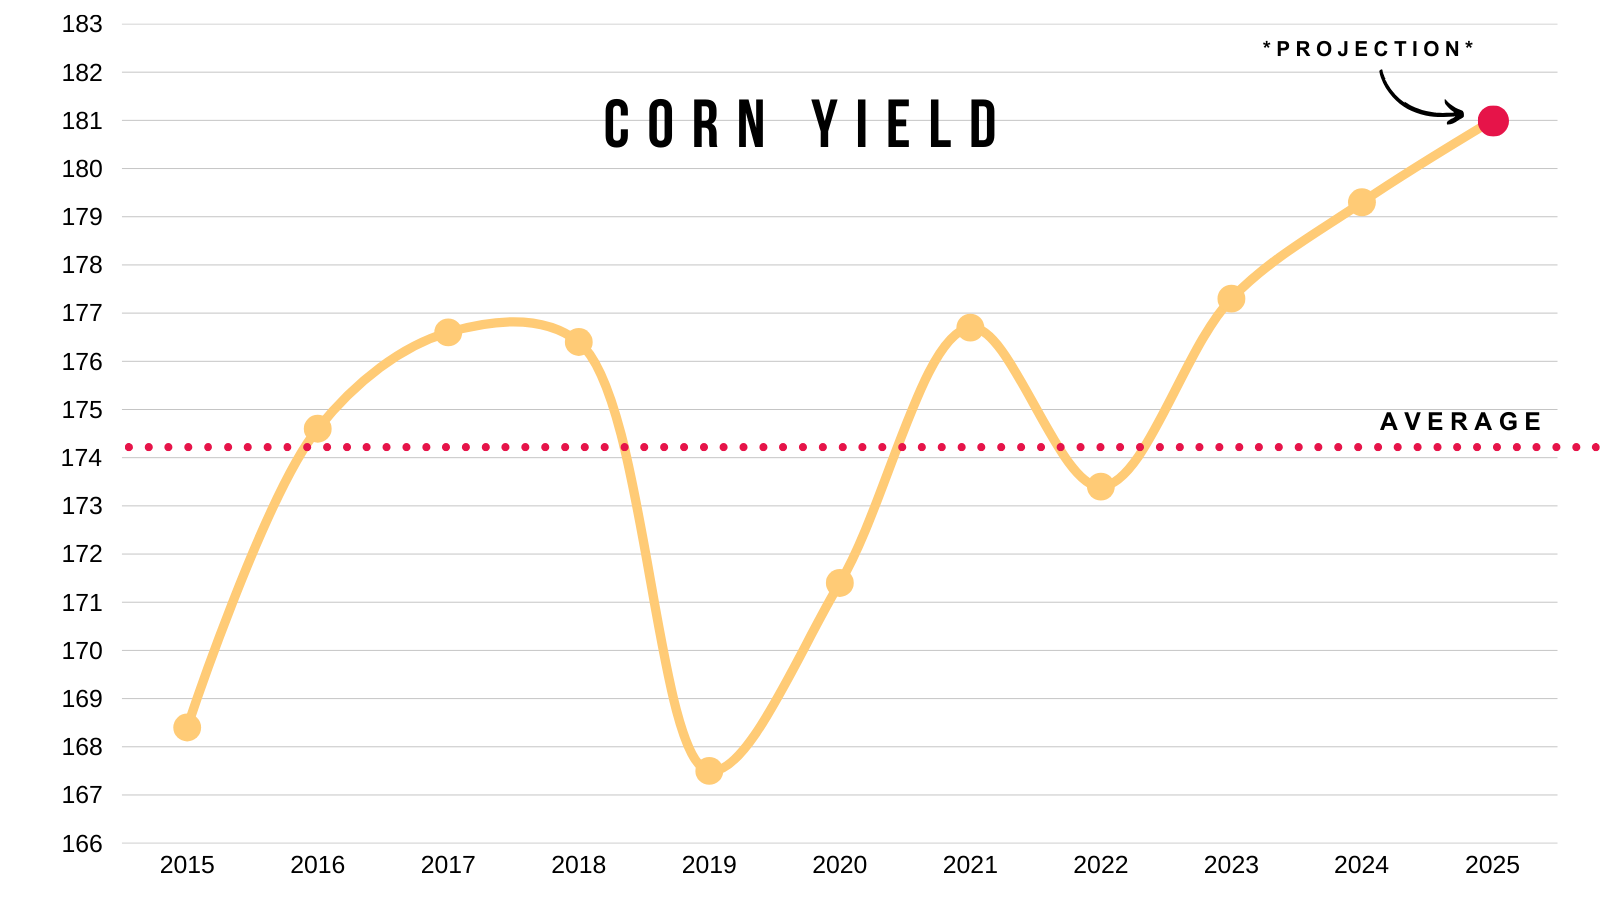
Regardless, these projections do use a 181 yield.
I find it hard to believe we are going to see a 181 yield especially with the extra acres.
Historically large acres makes it that much harder to hit trendline due to the fringe acres. Not to mention the possible drought issues this summer.
We've never even hit 180.
Average yield the past 10 years is 174 bpa.
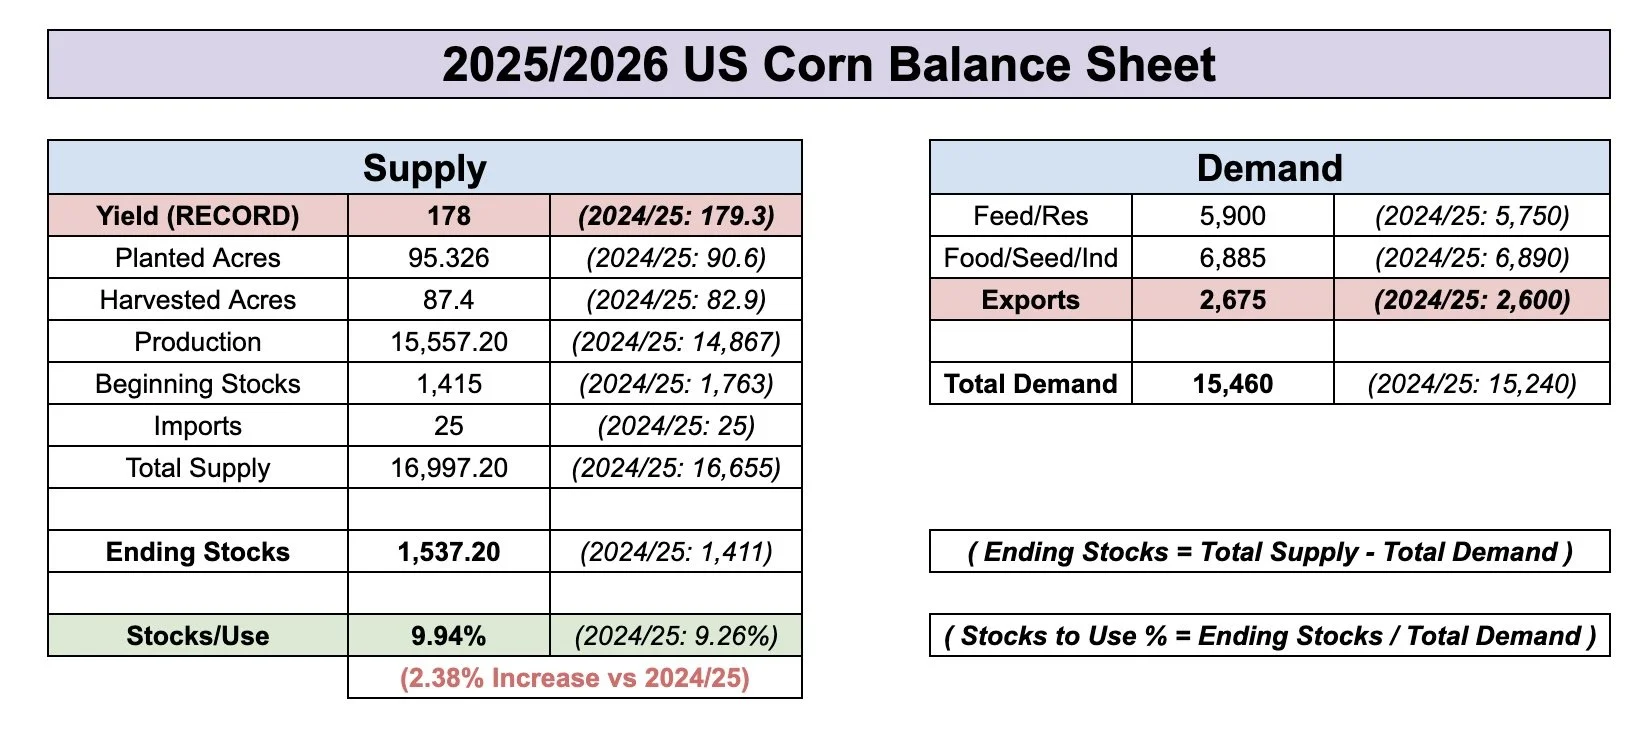
With the big bump in export projections, to get a stocks to use ratio below 10% we would now only need to see yield fall to 178 if demand remained unchanged.
That is how those weather scares happen.
If the trade starts thinking yield is closer to 175 rather than 180, they start pricing it in.
So this bump in exports and big cut to new crop carryout makes the effects of a weather scare all that more impactful.
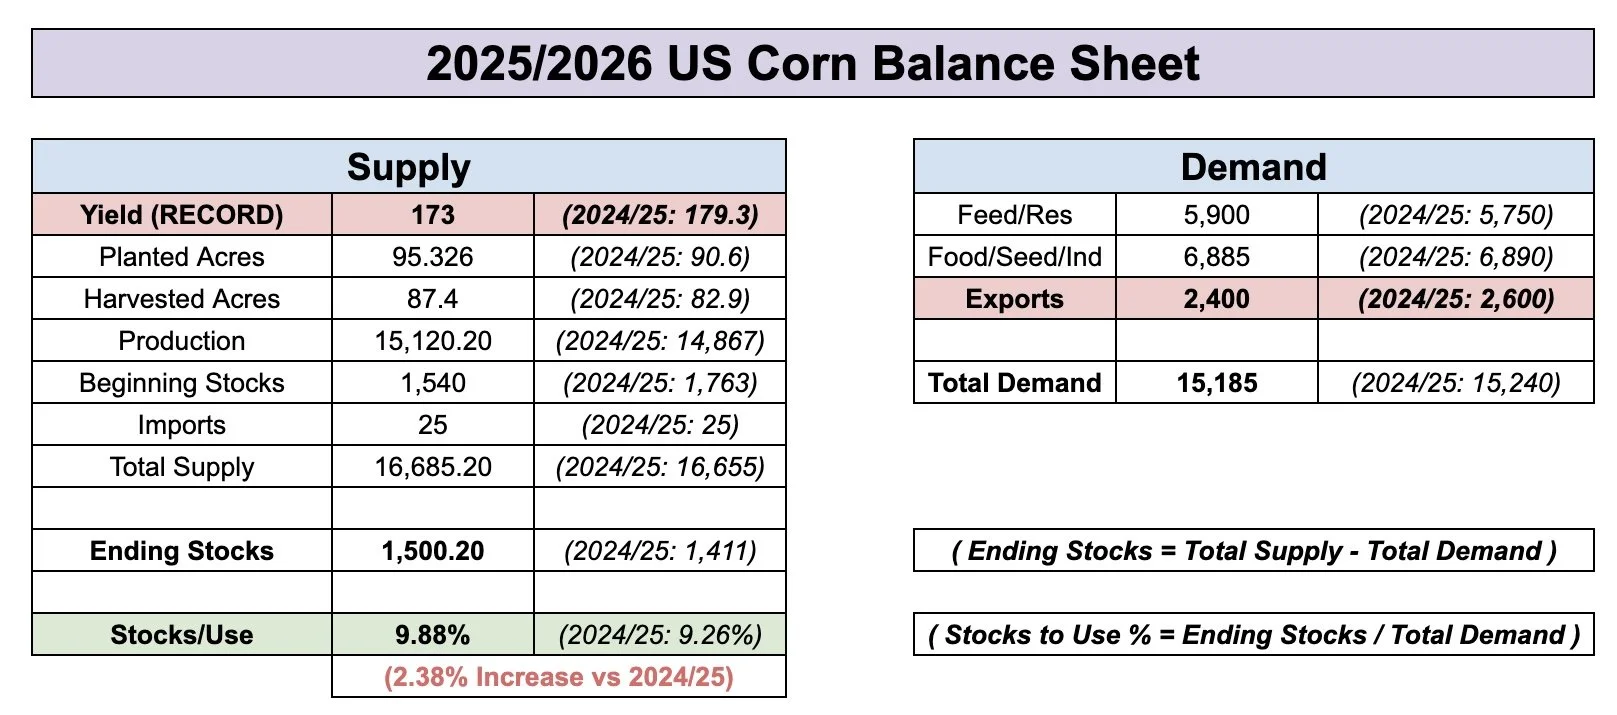
As based on the Feb outlook numbers, we would've had to see a yield of 173 to get a stocks to use ratio below 10%.
We now only need a yield of 178 to see a sub 10% stocks to use.
The change is due to demand and the bigger exports.
Below is the balance sheets with a 10% stocks to use for the current scenario vs based on the Feb outlook numbers. Essentially it now takes less cut to yield to eat into carryout.
Current New Crop Scenario With 178 Yield
Based on Feb Outlook With 173 Yield
Lastly, here is an arguement bulls could make that perhaps corn is slightly undervalued here.
Compared to last year at this time, our carryout is a lot tighter yet prices are lower.

Is the corn demand overstated?
Well, it could be.
Naturally a larger supply results in more demand. (and vice versa).
When reality hits that yield isn’t 181, the USDA will likely start to somewhat ration demand by lowering exports.
So they'll cut supply and demand at the same. Balancing the balance sheet.
But to start rationing demand, prices typically rally on tighter supply first.
The Charts
Corn
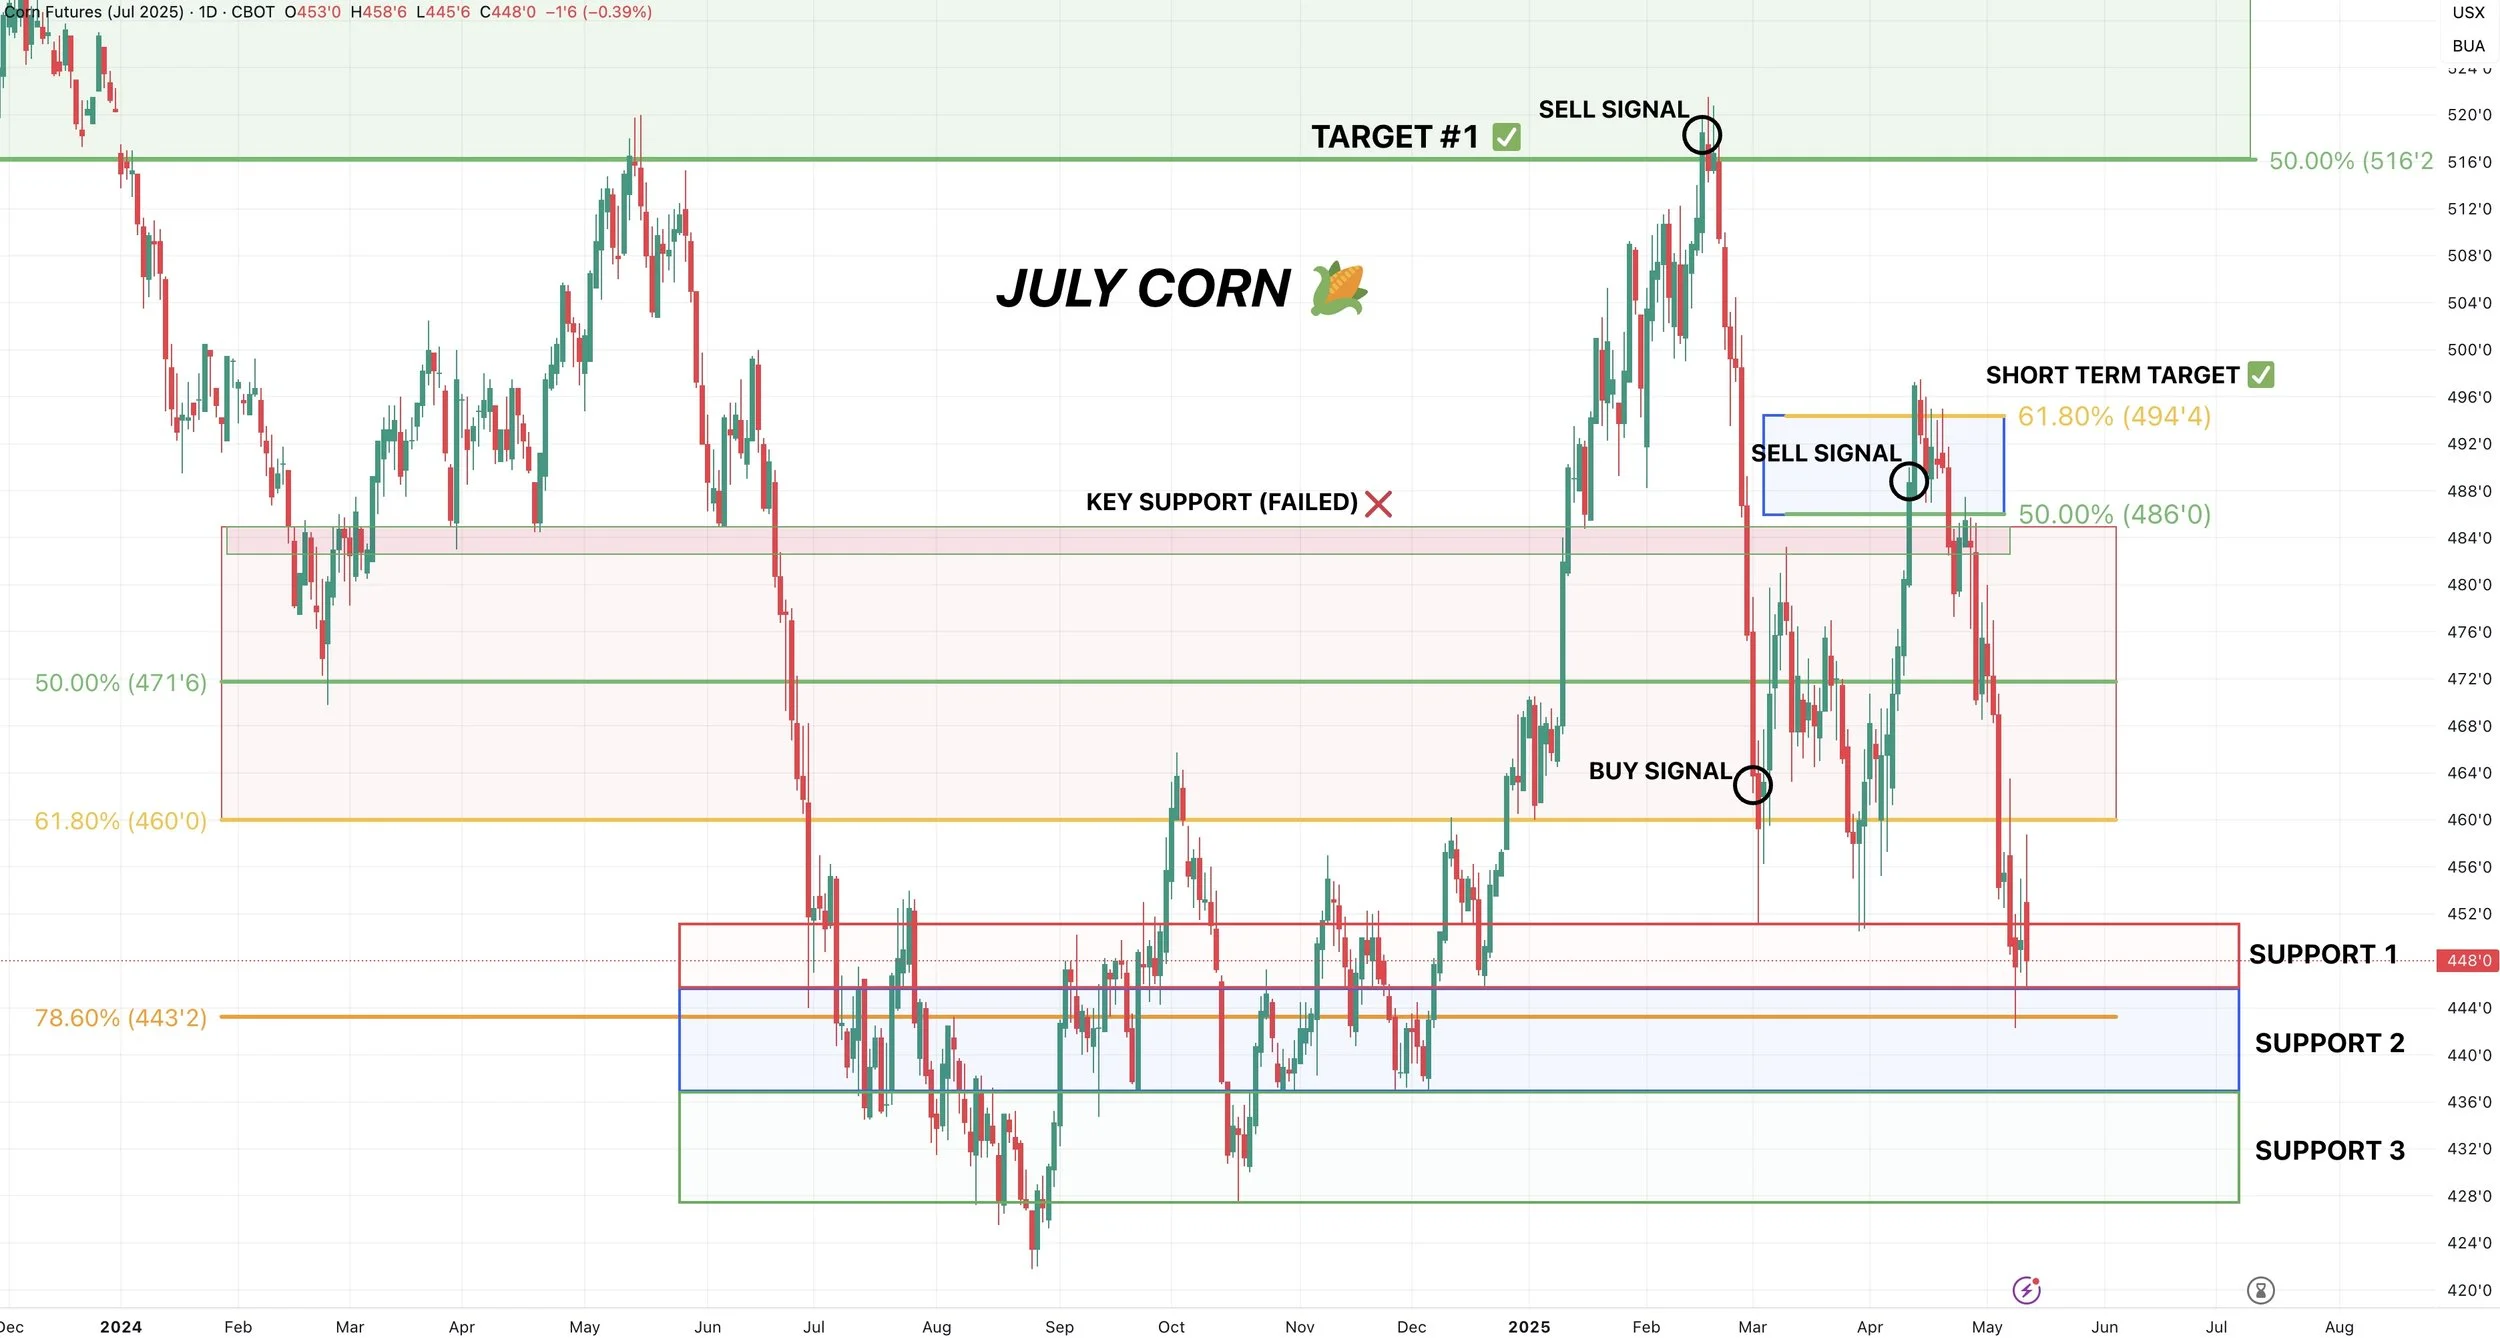
July Corn
Disappointing action in July despite a friendly report. As the spreads continue to unwind.
July corn is now only sitting at a +3 cent premium to Dec corn.
Looking at the chart, we are still finding life around this $4.45 support level and the 78.6% retracement level from the entire rally off contract lows up to the Feb highs.
Ideally we hold here, otherwise next support level is $4.37
I will have our next upside target once I believe we've put in a bottom.
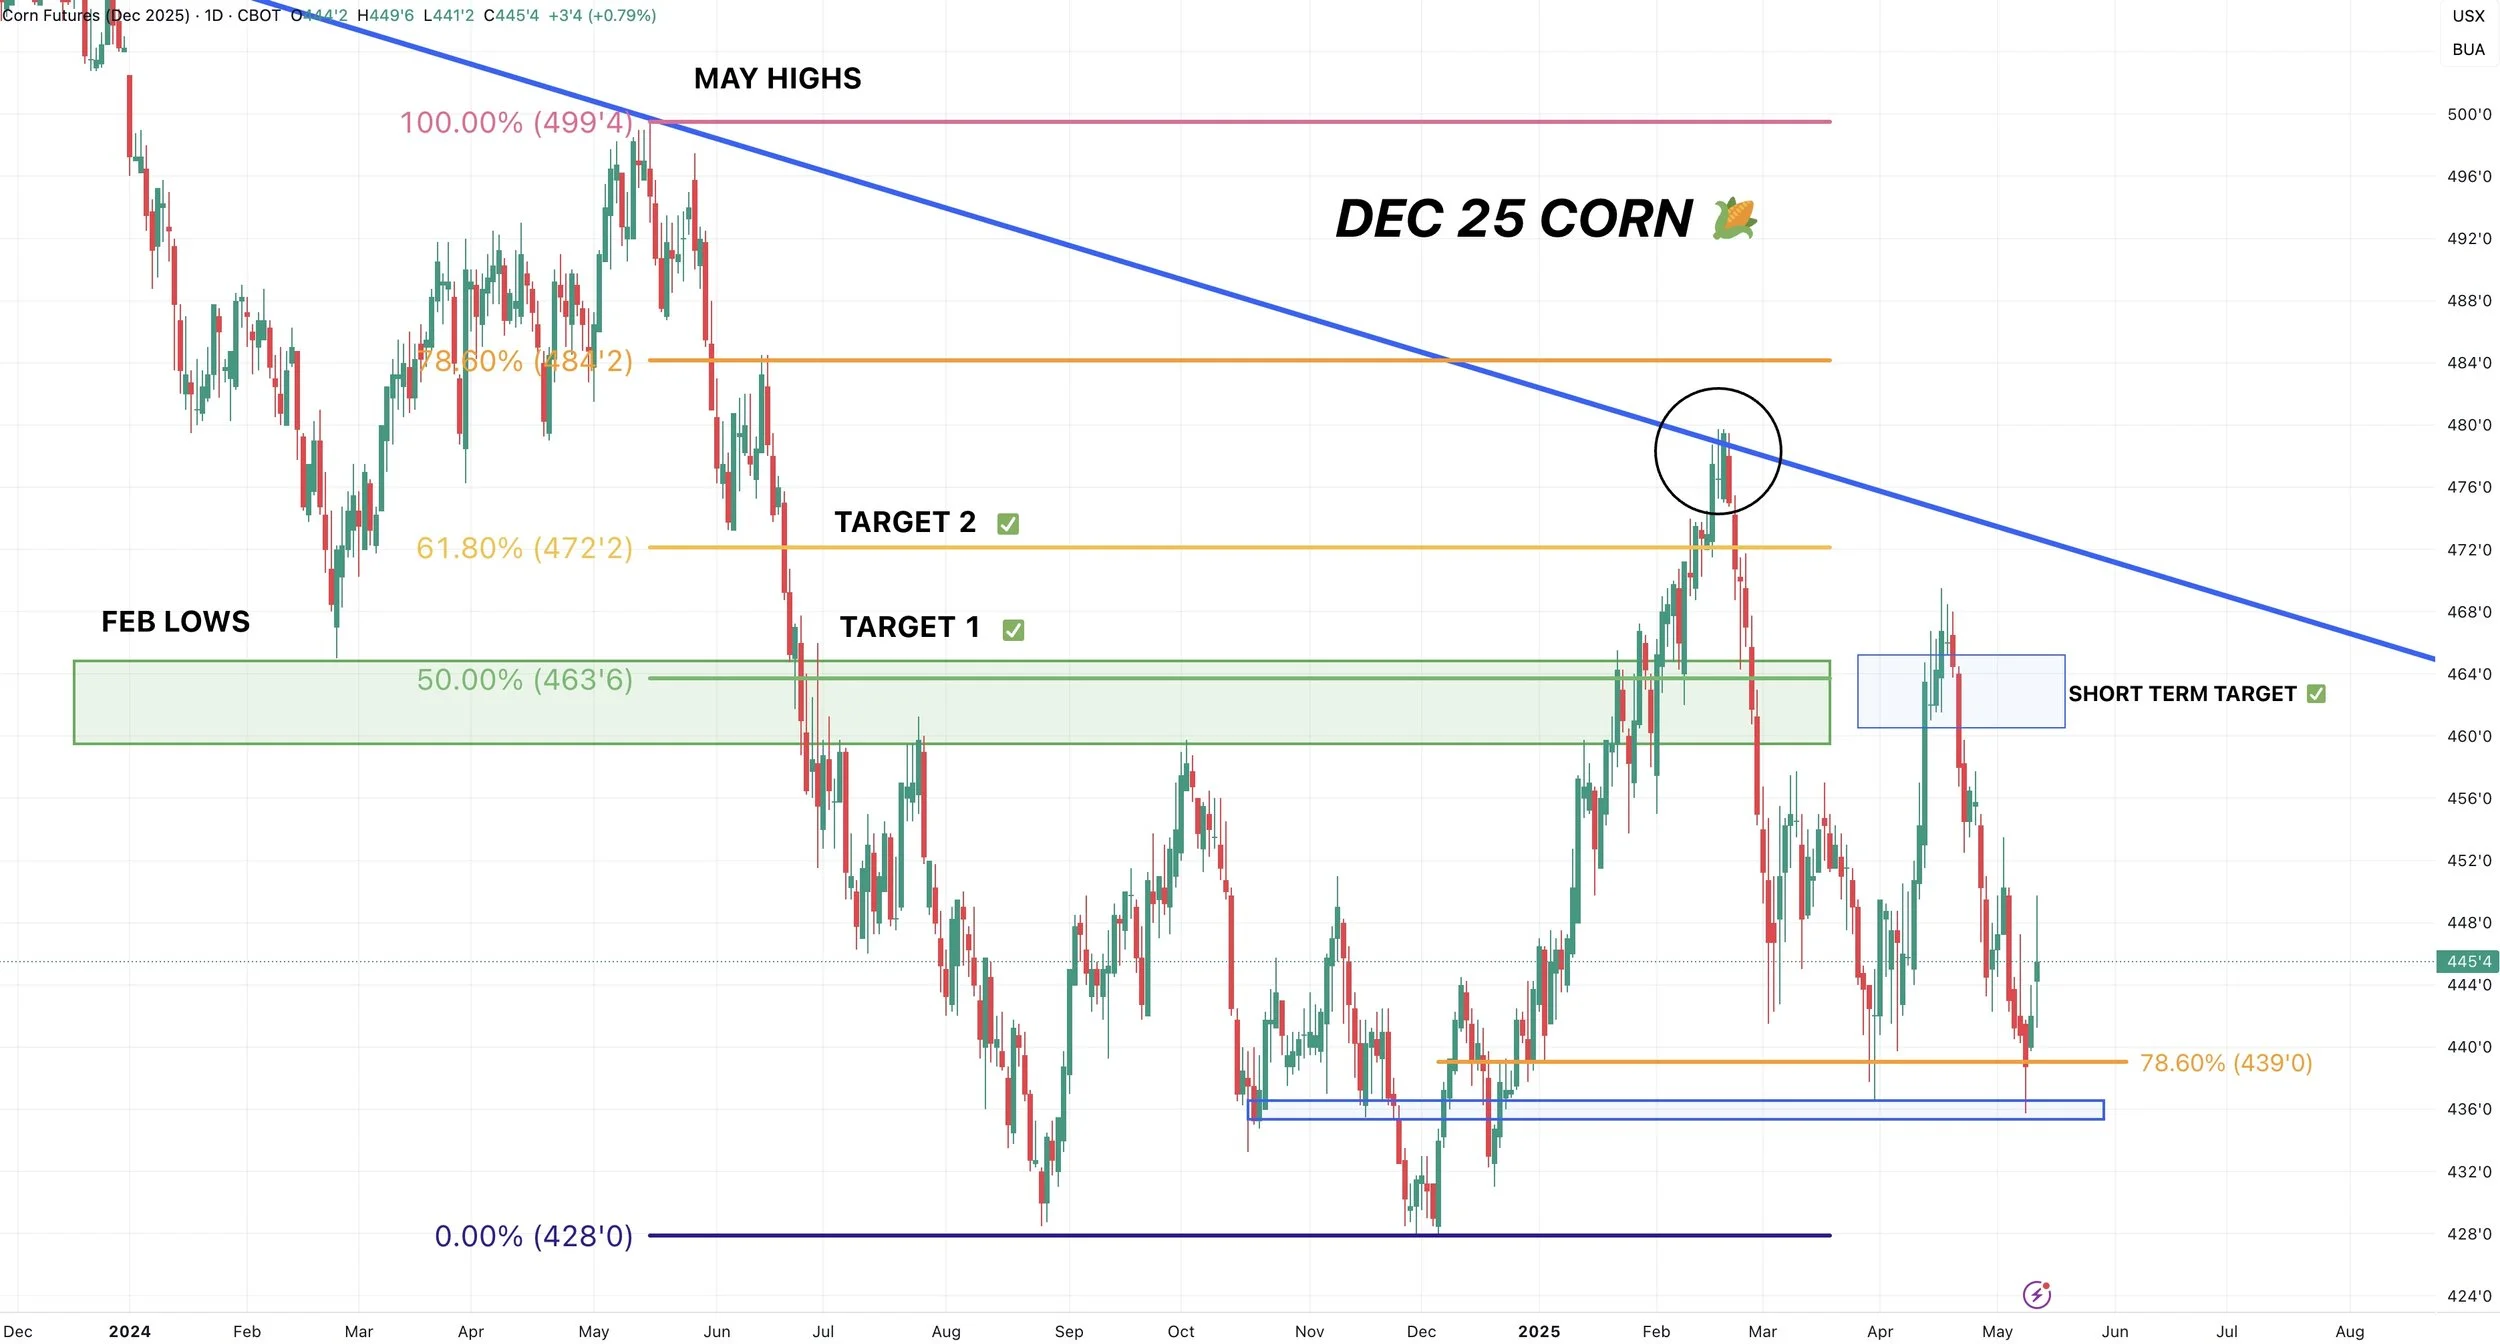
Dec Corn
Finding support and bouncing right off those March lows and the 78.6% retracement level from the entire rally off contract lows.
Given the now tighter fundamental story, I'd think we carve out lows here and build our base above $4.40
Like July, will have our next upside target once I think we found a bottom.
Soybeans
July Beans
The soybean chart looks phenomenonal.
We bounced right off the 100-day MA, which I said last week was the must hold level. As we were trapped between the 100 & 200-day MA waiting for the decision to be made.
We have a very clear break out, busting above those March highs.
We are now firmly above the 200-day MA for the first time since 2023.
The 200-day MA has marked every significant high in the soybean market. It marked out May 2024 highs and our Feb 2025 highs. So breaking above it is a massively positive thing on the charts.
Next target: $11.04
That was our Feb highs.
It reclaims exactly 50% of the May 2024 highs.
It is also the golden fib extension (161.8%) of the recent rally of $9.85 to $10.59 from the trade war fear Meaning $11.04 equals 161.8% of that rally.
***
The math of the golden fib extension:
We saw a +74 cent rally after the trade war fear from $9.85 to $10.59
74 cents X 161.8% = $1.19
$1.19 + $9.85 lows = $11.04

Here is inverted soybeans (flipped upside down).
Been showing you this chart a while.
The path of least resistance clearly looks lower in my opinion.
Another test of $11.00 makes the most sense to me.
With a clear bearish head & shoulders pattern.

Nov Beans
Nov beans look even better than July beans here.
We are above the 200-day MA for the very first time since 2023.
Just like in July beans, this marked our highs in May 2024 and Feb 2025. So it's a big deal breaking above.
Next target: $10.78-82
$10.82 gives us back exactly 50% of the May 2024 highs.
$10.78 is the golden fib extension (161.8%) of the recent rally from $9.71 to $10.37
***
The math of the golden fib:
66 cent rally x 161.8% = $1.07
$9.71 lows + $1.07 = $10.78
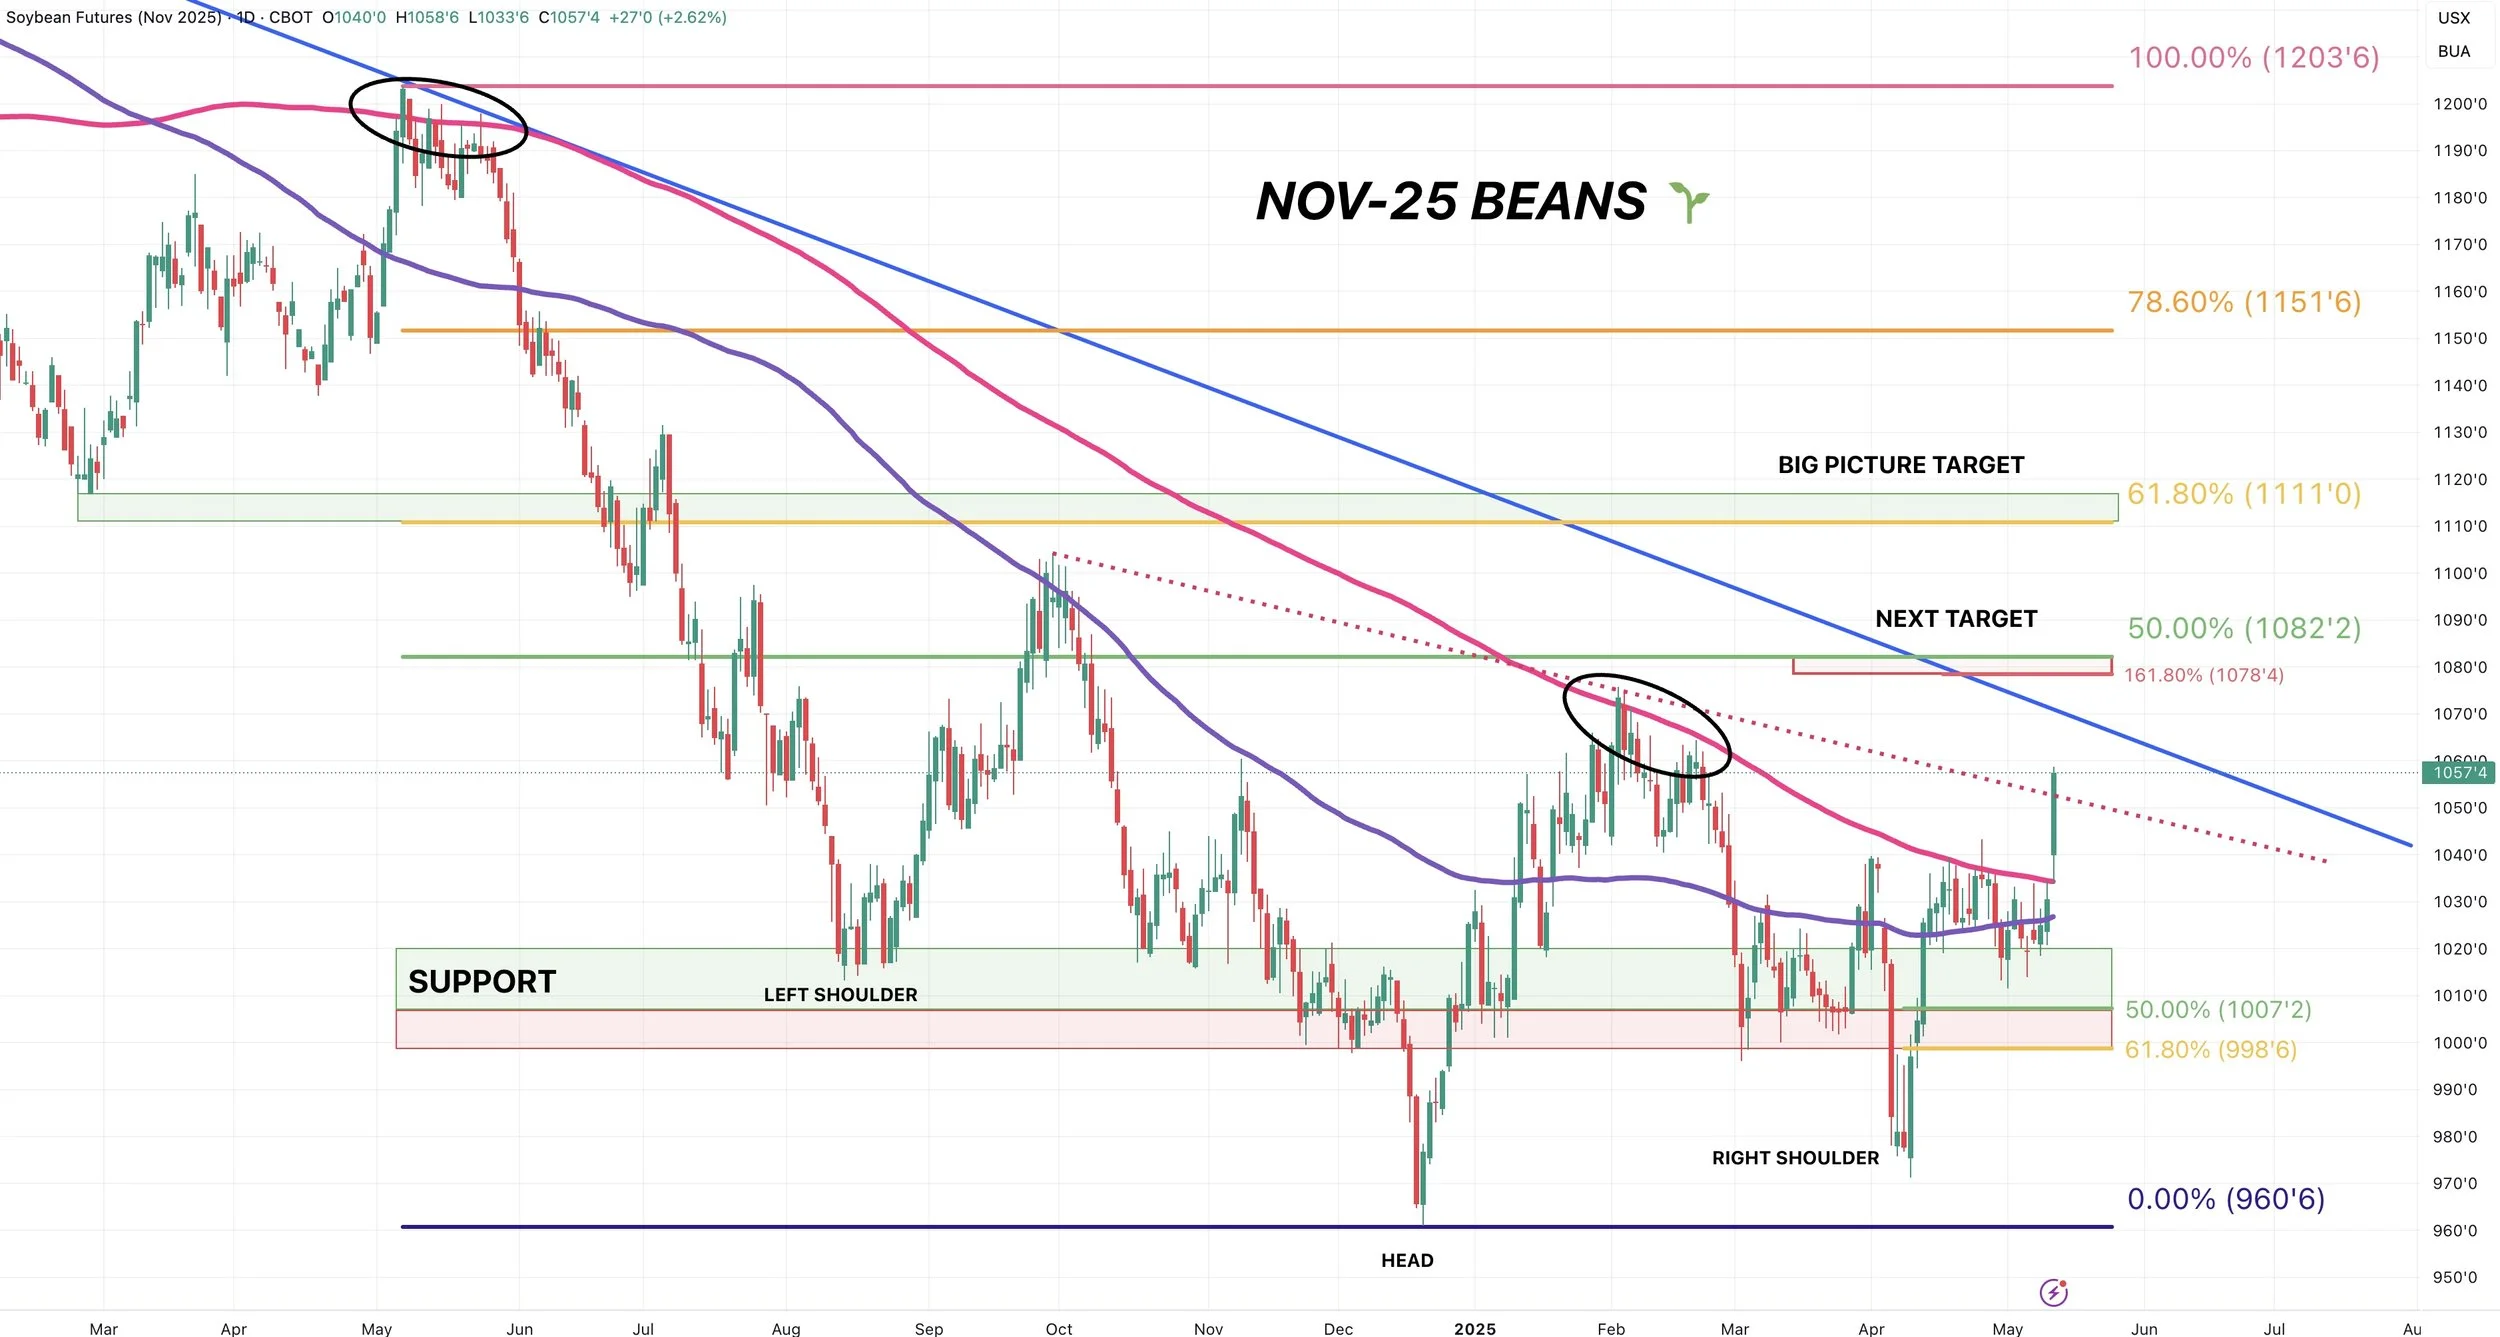
Here is the inverse head & shoulders pattern I've been showing you a while.
We are now attempting to break above the neckline.
Usually when you break above the neckline, it confirms more upside.
The implied move for this pattern is $11.80 but we will definitely be taking risk off the table before hand. (as the implied move does not have to happen, but if it does that's another spot to de-risk).

Wheat
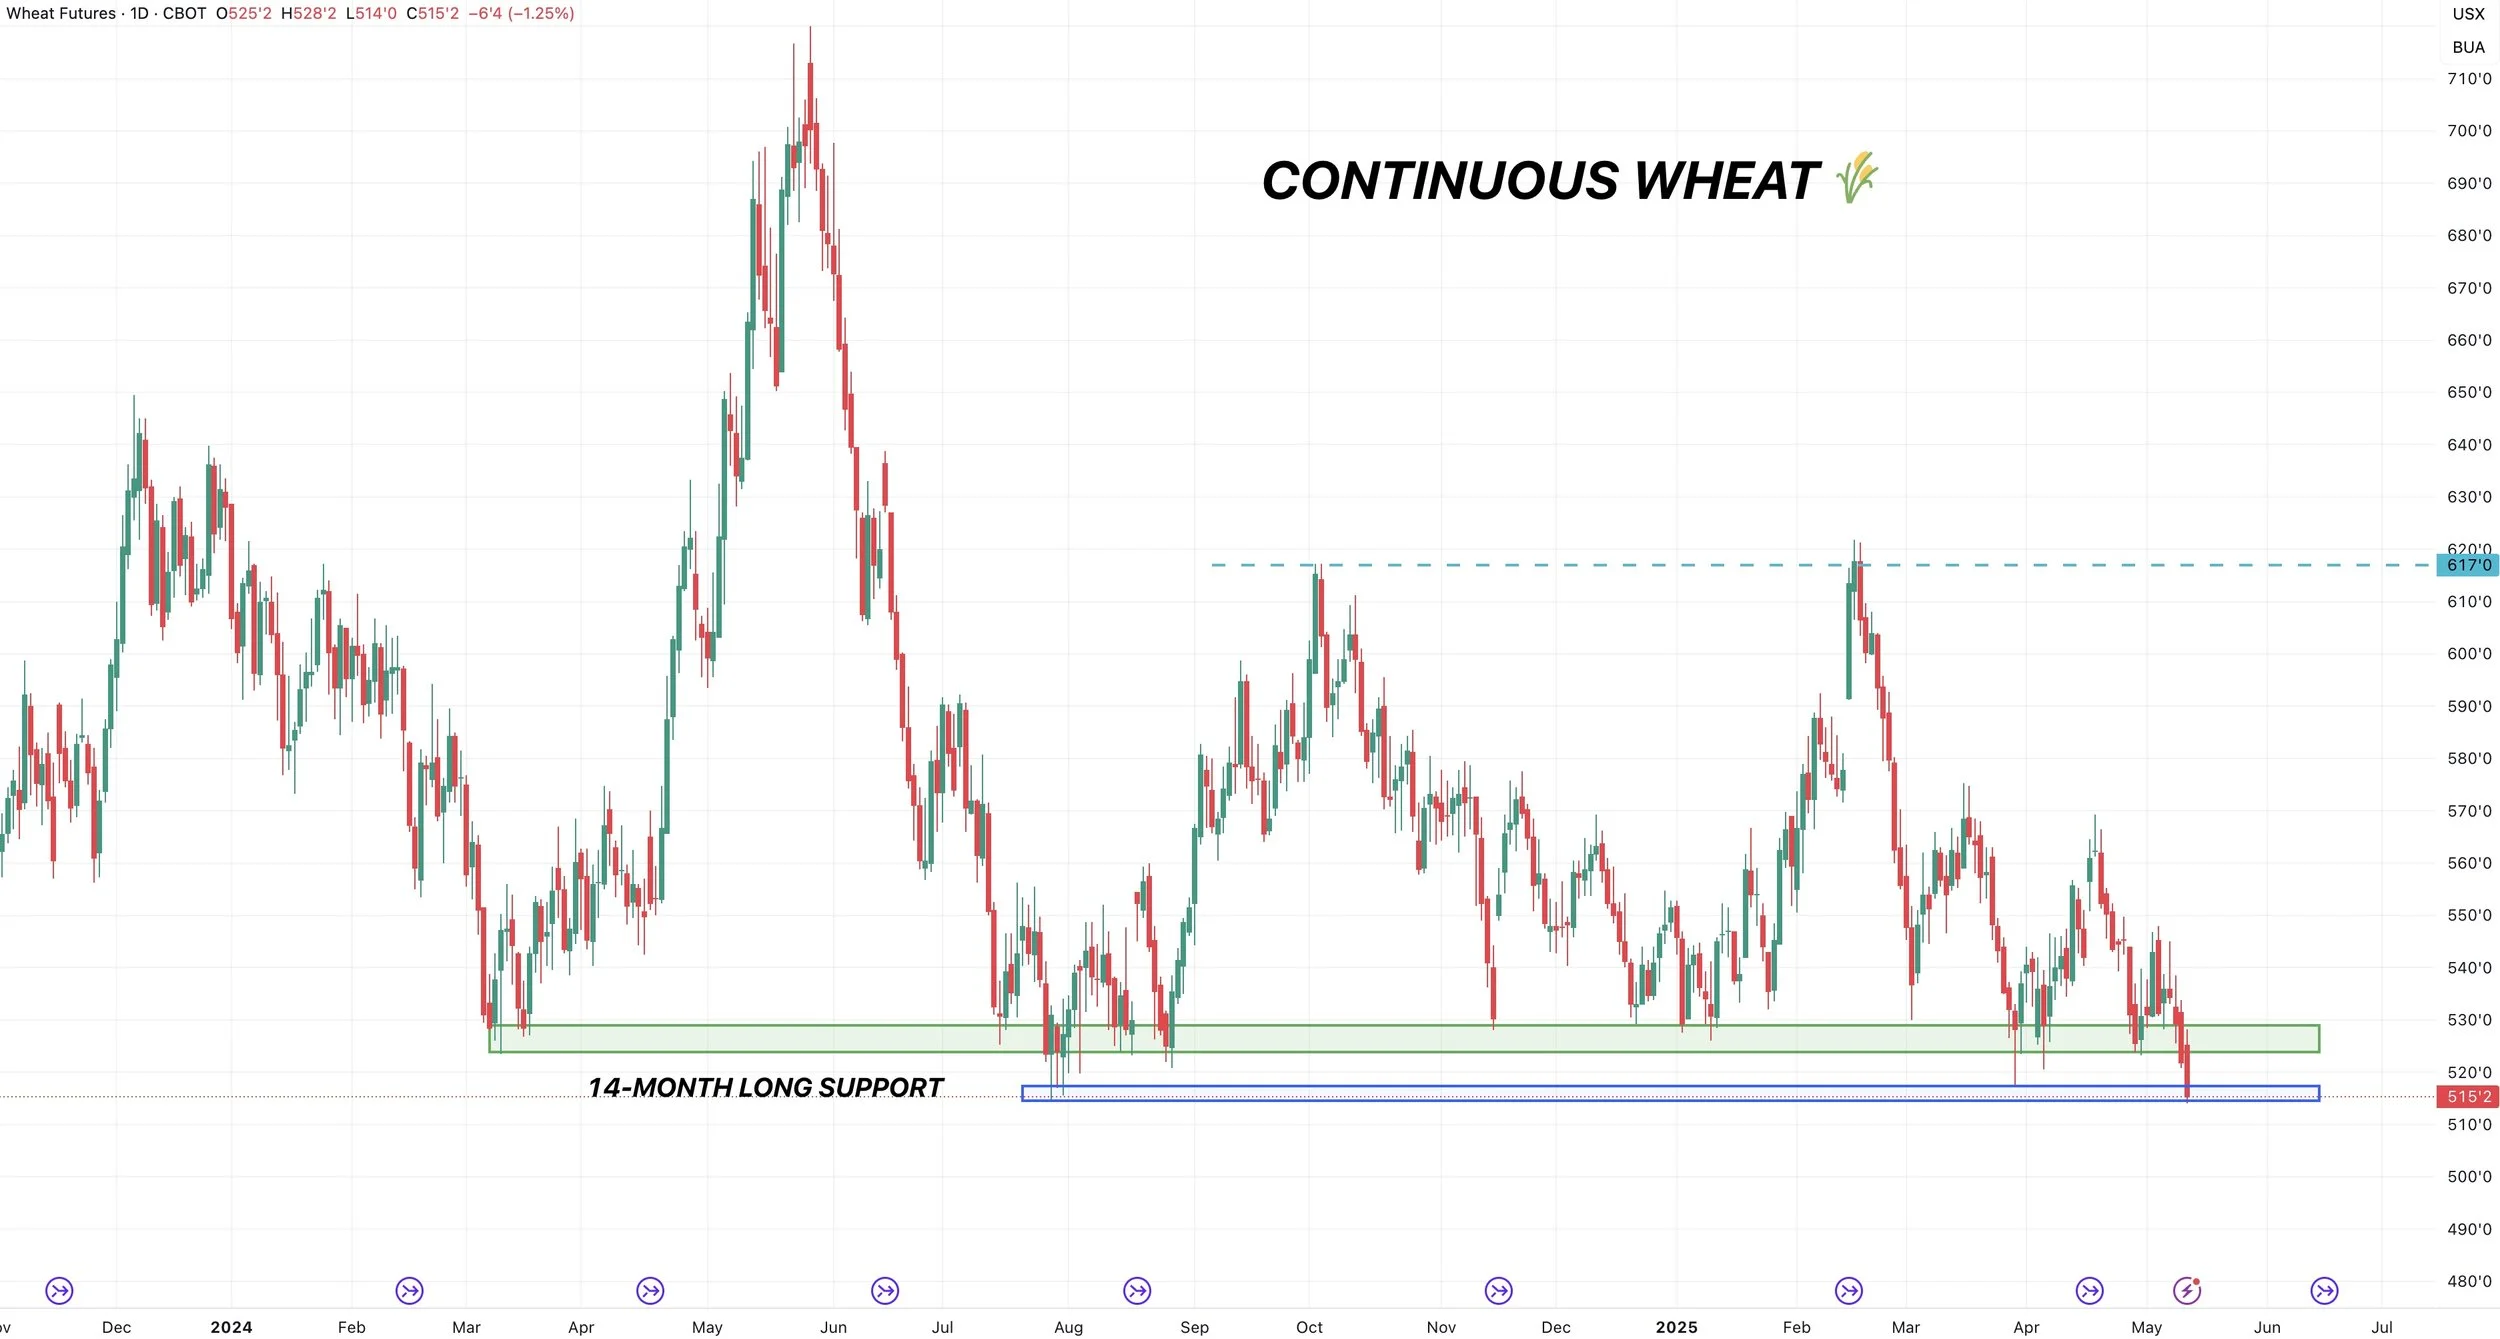
Continuous Chicago
Continuous Chicago still barely holding on to this 14-month long support box.
The wheat market is simply just searching for a bottom and cheap enough prices that will spark demand.
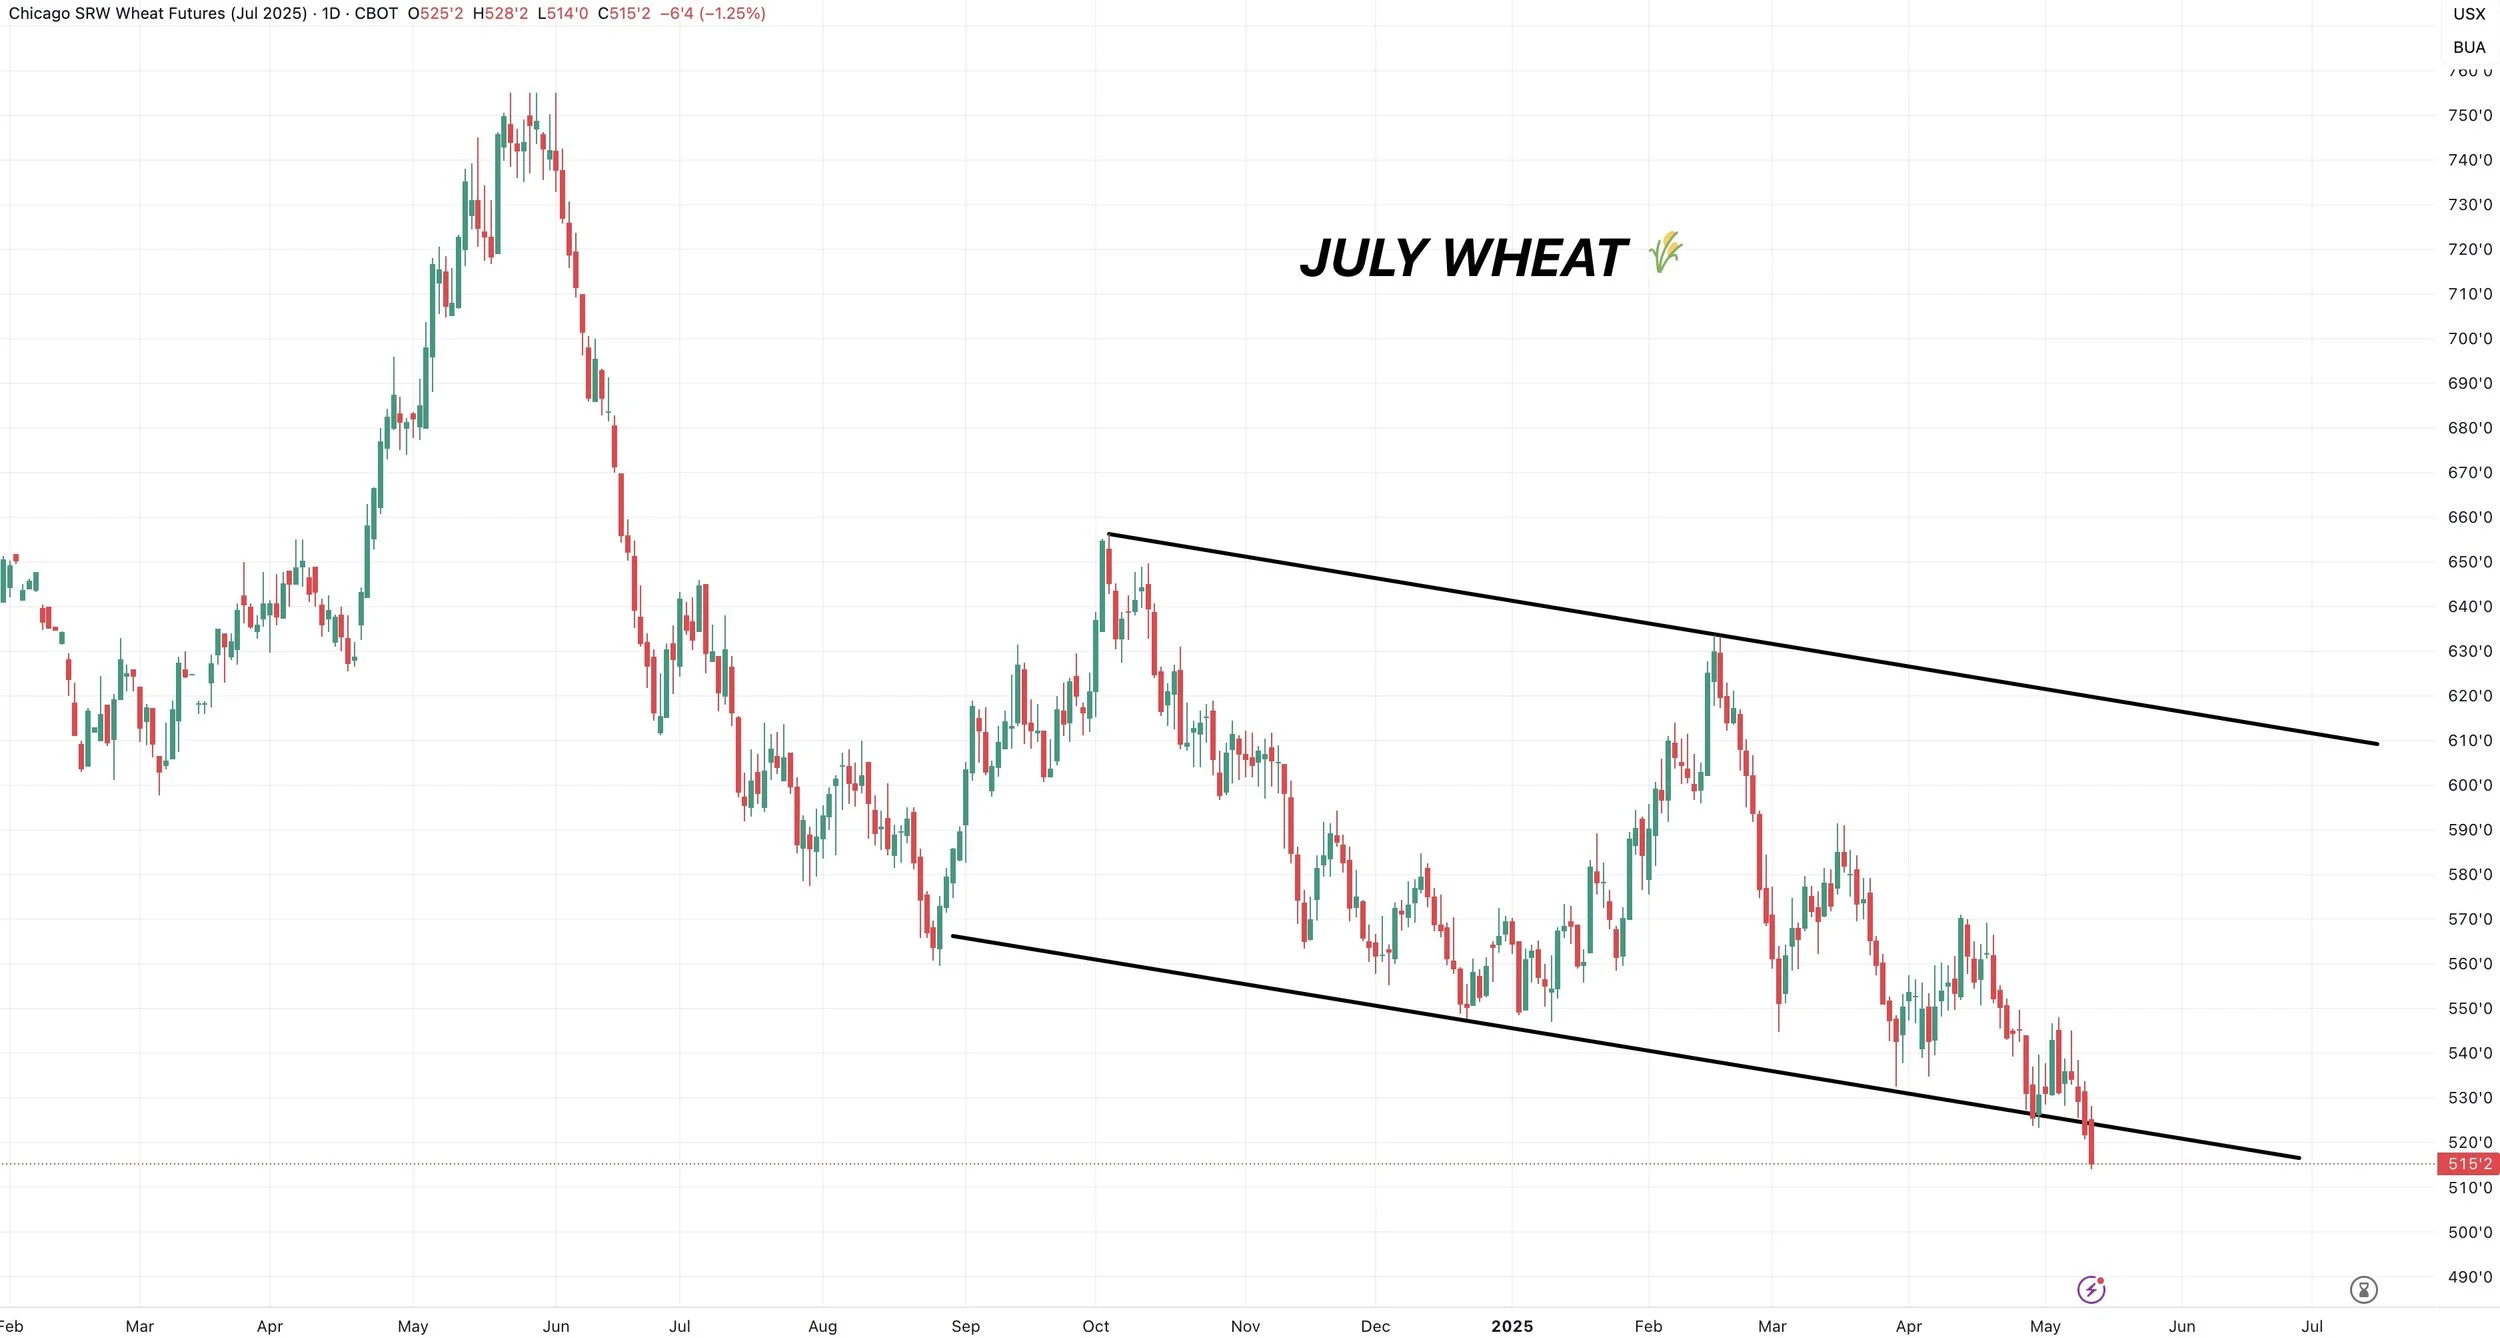
July Chicago
Ugly stuff, we broke below the bottom of this downward channel.
Like corn, I really can’t have a next definitive upside target until I think we've posted our lows.
But still eyeing the upper end of the channel for now looking long term
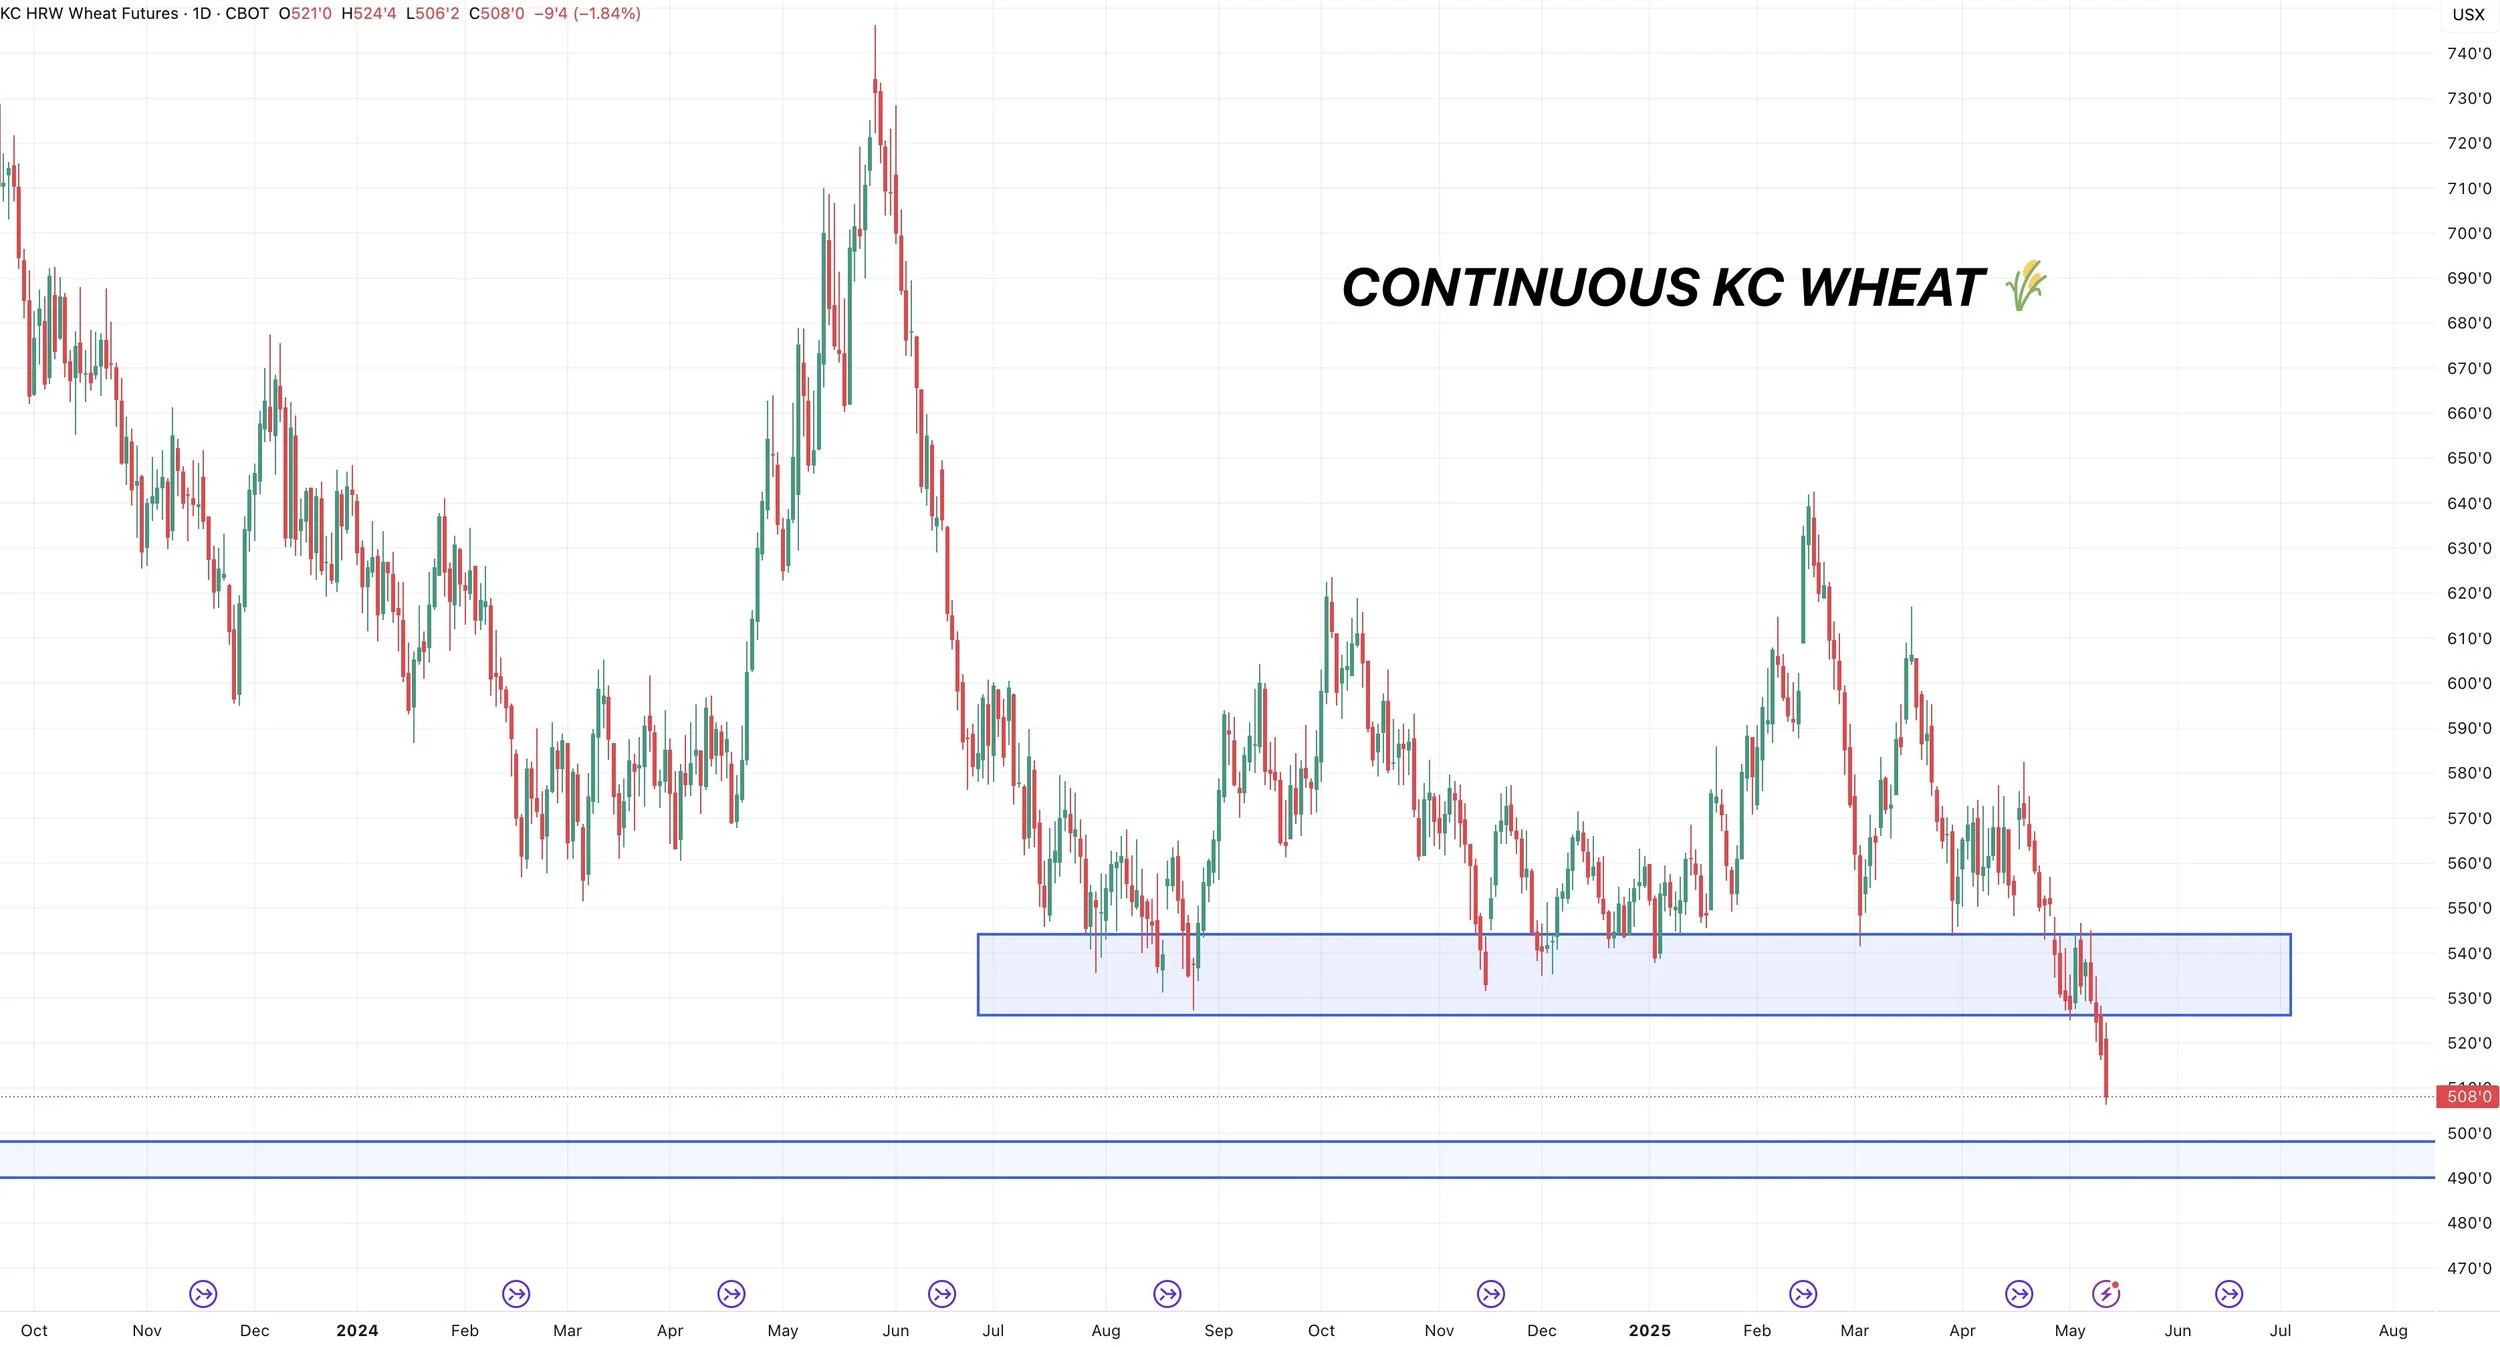
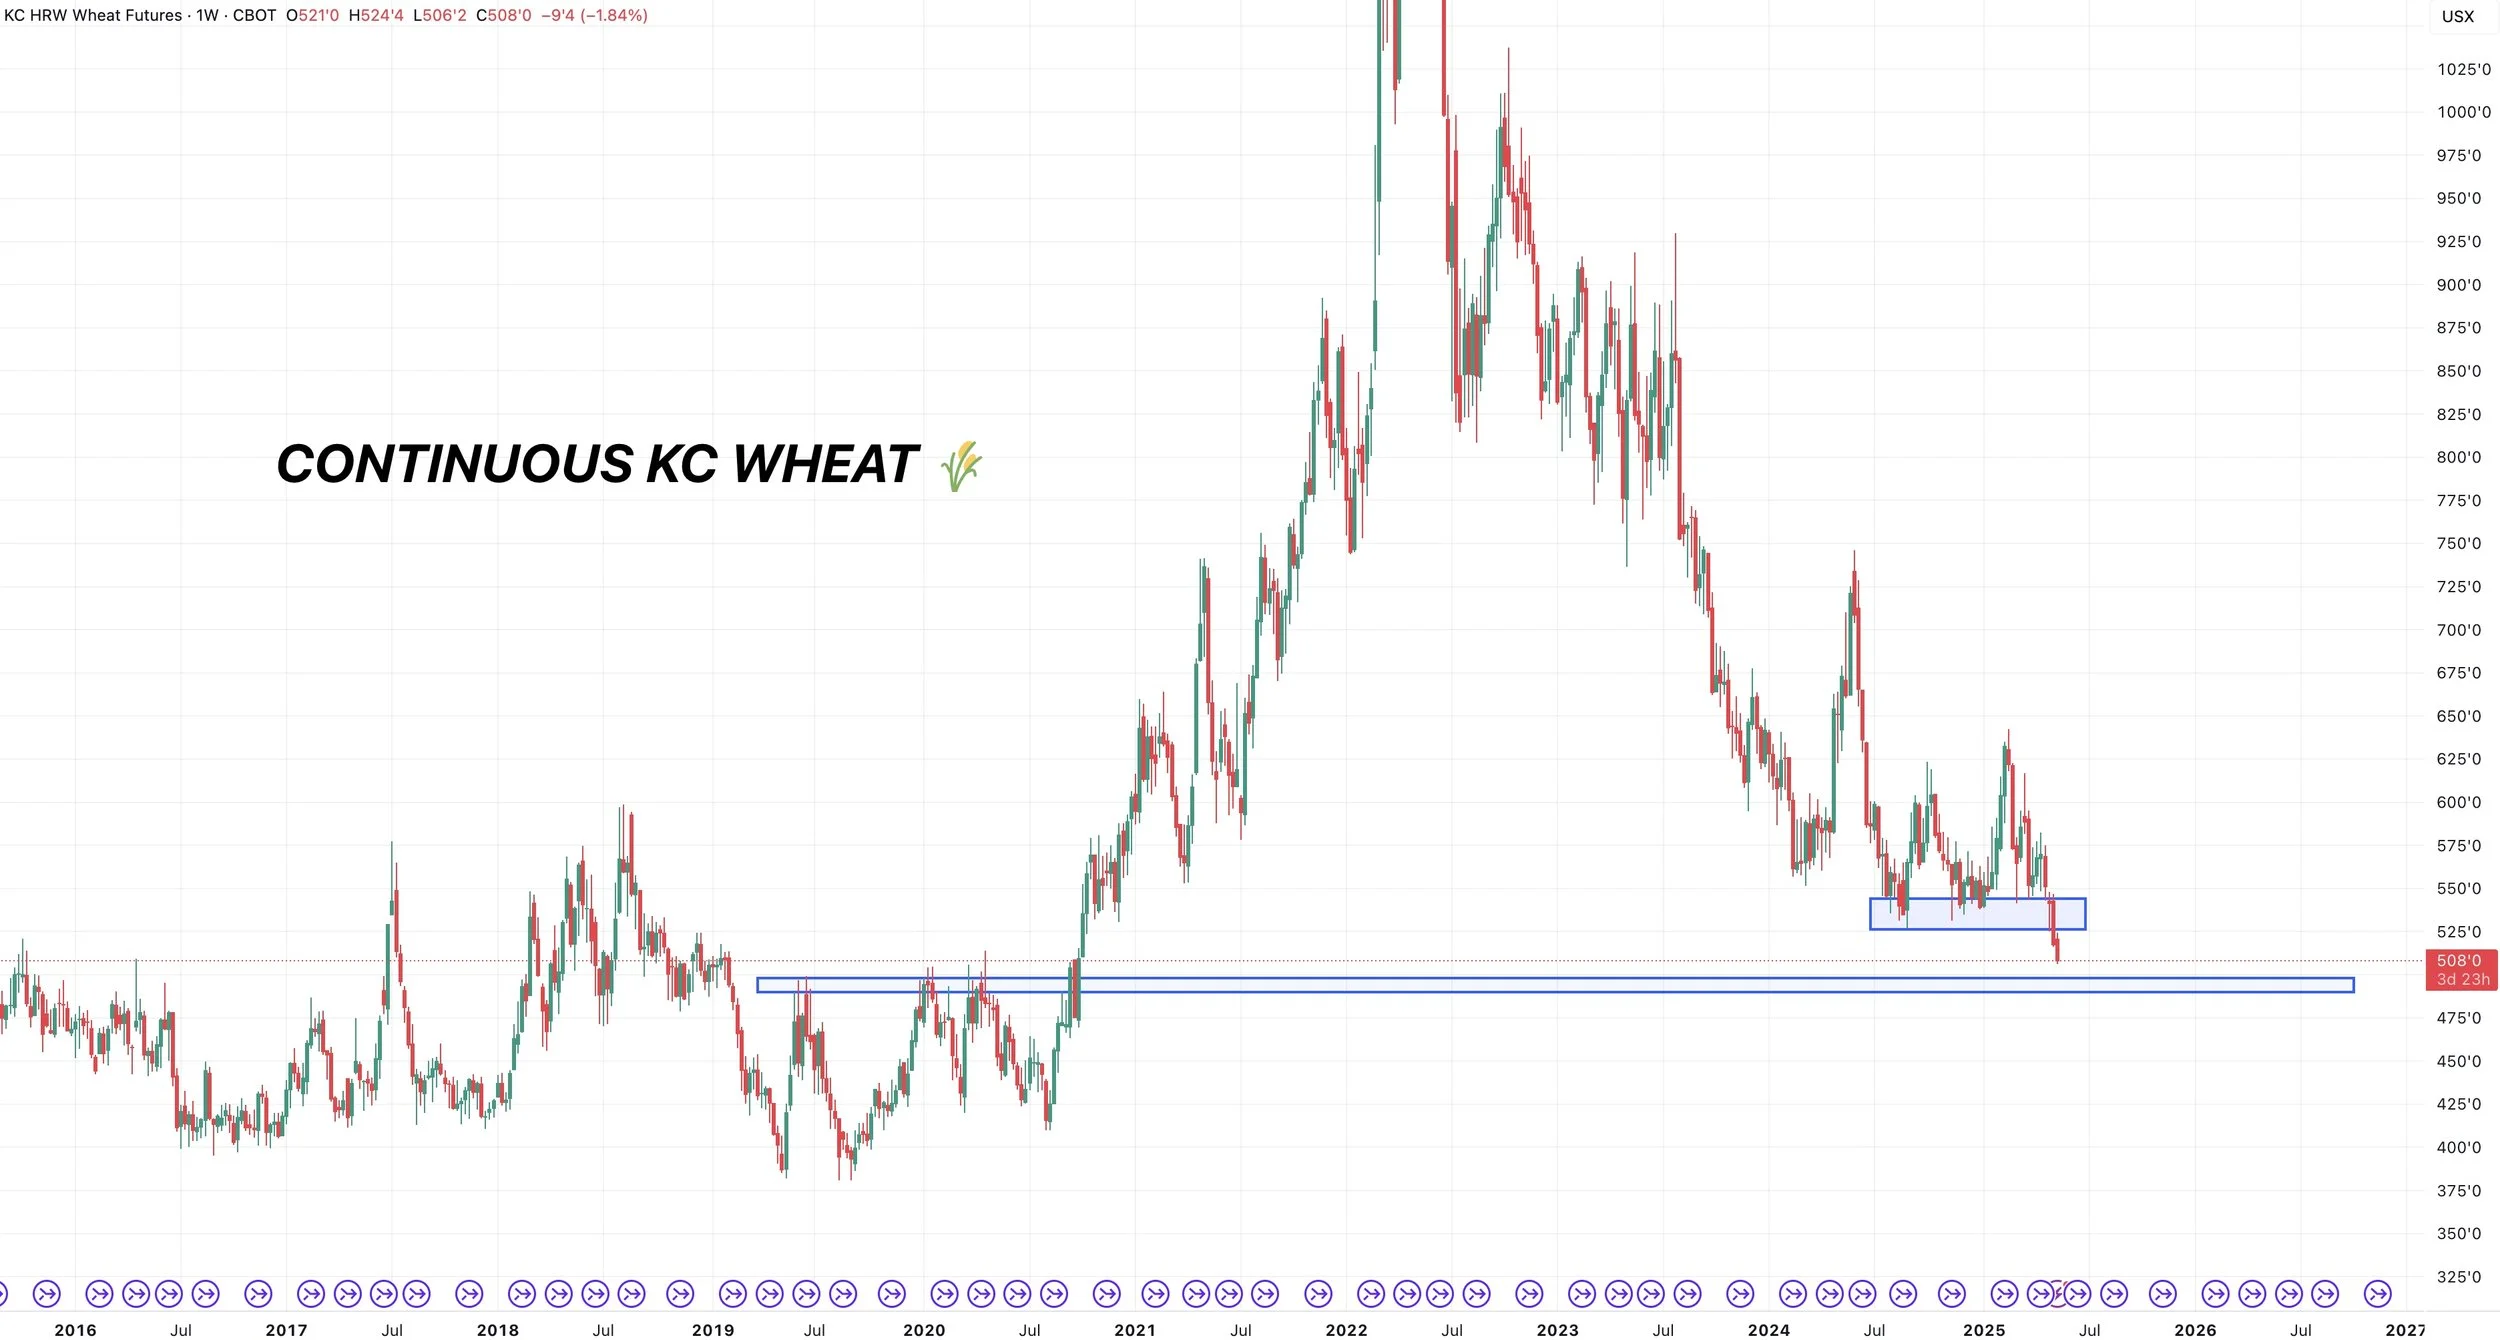
Continuous KC
Very ugly chart. We broke this massive key support that had held for a year.
If we zoom out, we are approaching some old key resistance.
Old resistance often turns into new support.
That old resistance sat at $4.90 to $5.00
So perhaps that's the level we finally find some life.
July KC
No words needed. Ugliest chart you can imagine.
Simply catching a falling knife.
Can’t call a bottom until we reclaim the red box.

Past Sell or Protection Signals
We recently incorporated these. Here are our past signals.
April 10th: 🌽
Old crop corn sell signal.
March 19th: 🐮
Cattle hedge & sell signal.
Feb 18th: 🌽 🌾
Old crop KC wheat & old crop corn signal.
Jan 23rd: 🌽 🌱
Corn & beans old crop sell signal.
CLICK HERE TO VIEW
Jan 15th: 🌽 🌱
Corn & beans hedge alert/sell signal.
Jan 2nd: 🐮
Cattle hedge alert at new all-time highs & target.
Dec 11th: 🌽
Corn sell signal at $4.51 200-day MA
CLICK HERE TO VIEW
Oct 2nd: 🌾
Wheat sell signal at $6.12 target
Sep 30th: 🌽
Corn protection signal at $4.23-26
Sep 27th: 🌱
Soybean sell & protection signal at $10.65
Sep 13th: 🌾
Wheat sell signal at $5.98
May 22nd: 🌾
Wheat sell signal when wheat traded +$7.00
Want to Talk?
Our phones are open 24/7 for you guys if you ever need anything or want to discuss your operation.
Hedge Account
Interested in a hedge account? Use the link below to set up an account or shoot Jeremey a call at (605)295-3100.
Check Out Past Updates
5/9/25
BIGGEST RISKS IN USDA REPORT
5/8/25
USDA MONDAY & HISTORY OF WEATHER RALLIES
5/7/25
NEW 2025 LOWS FOR CORN
5/6/25
WHAT’S A SUMMER RALLY LOOK LIKE?
5/5/25
CORN ERASES ENTIRE APRIL RALLY
5/2/25
SELL INTO UNCERTAINTY. NOT KNOWN FACTORS
5/1/25
THE CASE AGAINST A FEB TOP IN CORN
4/30/25
APPROACHING KEY TIME PERIOD FOR GRAINS
4/29/25
PLANTING & FIRST NOTICE DAY PRESSURE. CORN CLOSE TO BOTTOM?
4/28/25
CAPTURING INVERSE & SEASONAL PREPARATION
4/25/25
HOW OFTEN DOES CORN NOT BREAK APRIL HIGHS?
4/24/25
KNOW WHEN TO SELL. BEANS BREAK 200-DAY FIRST TIME IN 483 DAYS
4/23/25
MONEY FLOW & DROUGHT CARDS
4/22/25
CRUCIAL SPOT FOR CORN & BEANS
4/21/25
NO PLANTING THREAT YET
4/18/25
POTENTIAL OPPORTUNITIES, BASIS CONTRACTS & STRATEGIES
4/16/25
HOW YIELD IMPACTS CARRYOUT. MAJOR SPOT FOR SOYBEANS
4/15/25
TOTAL CHART BREAKDOWNS & TARGETS
4/14/25
TECHNICAL SELLING IN GRAINS
4/11/25
SPECIFIC GRAIN MARKETING DECISIONS
4/10/25
USDA REPORT. HOW THIS IMPACTS CORN
4/9/25
TARIFFS GIVE. TARIFFS TAKE
4/8/25
CORN’S DIVERGING STRENGTH
4/7/25
SOLID PRICE ACTION DESPITE OUTSIDE FEAR
4/4/25
CORN PRICE ACTION SPEAKS VOLUME. ANY HOPE LEFT FOR SOYBEANS?
4/3/25
WHAT IS LEFT FOR CORN BEARS? TRADE WAR: CHARTS HOLDING SUPPORT
4/2/25
SHOULD UNKNOWNS KEEP A FLOOR UNDER GRAIN PRICES?
4/1/25
HOW DO ACRES IMPACT FUTURE OF THE GRAINS?
3/31/25
USDA REPORT: NOW WHAT?
3/28/25
ALL EYES ON USDA
3/27/25
PRE-USDA POSITIONING. DON’T GIVE GRAIN AWAY
3/26/25
HISTORY OF MARCH INTENTIONS. SOYBEANS UNDERVALUED?
3/25/25
6 DAYS UNTIL MAJOR USDA REPORT
3/24/25
HOW TO POSITION YOURSELF BEFORE PLANTING
3/21/25
REASONS TO BE OPTIMISTIC IN GRAINS?
3/20/25
WAS THAT THE BOTTOM IN CORN?
3/19/25
THE PATH HIGHER & THE DOWNSIDE RISKS IN GRAINS
3/18/25
SEASONALS, CATTLE HEDGE, CHARTS & DROUGHT?
3/17/25
WHEAT RALLIES. DON’T GET BACKED INTO A CORNER
3/14/25
MARCH 31ST REPORT THOUGHTS & WHAT’S NEXT FOR GRAINS
3/13/25
EXPLAINING RE-OWNERSHIP VS COURAGE CALLS
3/12/25
TARIFF FEARS. EU, CANADA, & ETHANOL
3/11/25
USDA SNOOZE. RECORD FUND SELLING A CONCERN?
3/10/25
USDA TOMORROW. GETTING COMFORTABLE IN MARKETING
3/7/25
HOW TIGHT IS THE WORLD & US SITUATION?
3/6/25
TARIFFS PUSHED BACK. FUTURE OPPORTUNITIES?
3/5/25
IS GRAINS BIGGEST RISK WEAK CRUDE & DEFLATION?
3/4/25
TRADE WAR BEGINS. 8TH DAY OF PAIN FOR GRAINS
3/3/25
TARIFFS ON TOMORROW. BUY SIGNAL
3/3/25
BUY SIGNAL
2/28/25
WHEN WILL THE BLEEDING STOP?
2/27/25
CORN AT CRITICAL SPOT. USDA ACRE REPORT. WAY TOO EARLY DROUGHT TALK
2/26/25
HISTORY SUGGESTS CORN TOP ISN’T IN? ACRE OUTLOOK TOMORROW
2/25/25
POSITIVE CLOSE. WHAT TO KNOW ABOUT USDA OUTLOOK
2/24/25
USDA OUTLOOK, FIRST NOTICE DAY & BRAZIL
2/21/25
WHAT TO EXPECT MOVING FORWARD IN GRAINS
2/20/25
FIRST NOTICE DAY CONCERNS. MASSIVE CORN ACRES OR NOT?
2/19/25
HOW TIGHT IS THE CORN SITUATION?
2/18/25
MORE DETAILS ON TODAYS SELL SIGNAL
2/18/25
OLD CROP KC WHEAT & CORN SELL SIGNAL
2/14/25
WHEAT BREAKING OUT ON WEATHER RISK. TECHNICALS & FUNDAMENTALS
2/12/25
GLOBAL GRAIN SITUATION, ACRE TALK, CHARTS & MORE
2/11/25
USDA: NOT A BEARISH REPORT. DISAPPOINTING PRICE ACTION
2/10/25
USDA TOMORROW. LONG TERM PATH FOR SUB 10% CORN STOCKS TO USE?
2/7/25
WHY WOULD THE FUNDS EXIT THEIR LONGS?
2/6/25
WHEAT FINALLY CATCHING A BID
2/5/25
COMPLETE THOUGHTS ON MARKETS: BACK & FORTH DISCUSSION
2/4/25
STRONG JANUARY LEAD TO STRONG YEAR? TARIFFS, CHARTS & MORE
2/3/25
TARIFFS PUSHED BACK
1/31/25
TARIFF NEWS ALL OVER THE PLACE. ARE YOU PREPARED FOR POSSIBILITIES?
1/30/25
WHEAT BULL ARGUMENT. TRUMP ADDS TARIFFS
1/29/25
CORN APPROACHES $5.00
1/28/25
TARIFFS, CORN FUNDS, SOUTH AMERICA & MORE
1/27/25
HEALTHY CORRECTION WE TALKED ABOUT & TARIFF NEWS
1/24/25
GRAINS DUE FOR SHORT TERM CORRECTION?
1/23/25
OUR ENTIRE NEW CROP SALES THOUGHTS & OLD CROP SELL SIGNAL
1/22/25
GRAINS TAKE A BREATHER. IS CORN IN A BULL OR BEAR MARKET?
1/21/25
HUGE DAY IN GRAINS. WHAT TO DO WITH OLD CROP VS NEW CROP
Read More
1/20/25
VIDEO CHART UPDATE
1/17/25
TRUMP, CHINA, ARGY & USING THE SPREADS INVERSE
1/16/25
OLD CROP LEADS US LOWER. MARKETING THOUGHTS
1/15/25
SIGNAL & HEDGE ALERT QUESTIONS EXPLAINED. IS $6 CORN EVEN POSSIBLE?
1/14/25
MORE DETAILS ON TODAYS HEDGE ALERT & SELL SIGNAL
1/14/25
CORN & SOYBEANS HEDGE ALERT/SELL SIGNAL
1/13/25
USDA GAME CHANGER OR NOT?
1/10/25
BULLISH USDA FOR CORN & BEANS
1/9/25
USDA OUT TOMORROW
1/8/25
2 DAYS UNTIL USDA. BE PREPARED
1/7/25
THE HISTORY OF THE JAN USDA & MORE
1/6/25
MAJOR USDA REPORT FRIDAY
Read More
1/3/25
UGLY DAY ACROSS THE GRAINS
1/2/25