
THE CASE AGAINST A FEB TOP IN CORN
MARKET UPDATE
You can scroll to read the usual update as well. As the written version is the exact same as the video.
Timestamps for video:
Overview: 0:00min
Case Against Feb Top: 1:00min
Most & Least Similar Year to 2025: 1:00min
Corn: 3:40min
Soybeans: 7:10min
Wheat: 9:20min
Want to talk about your situation?
(605)295-3100
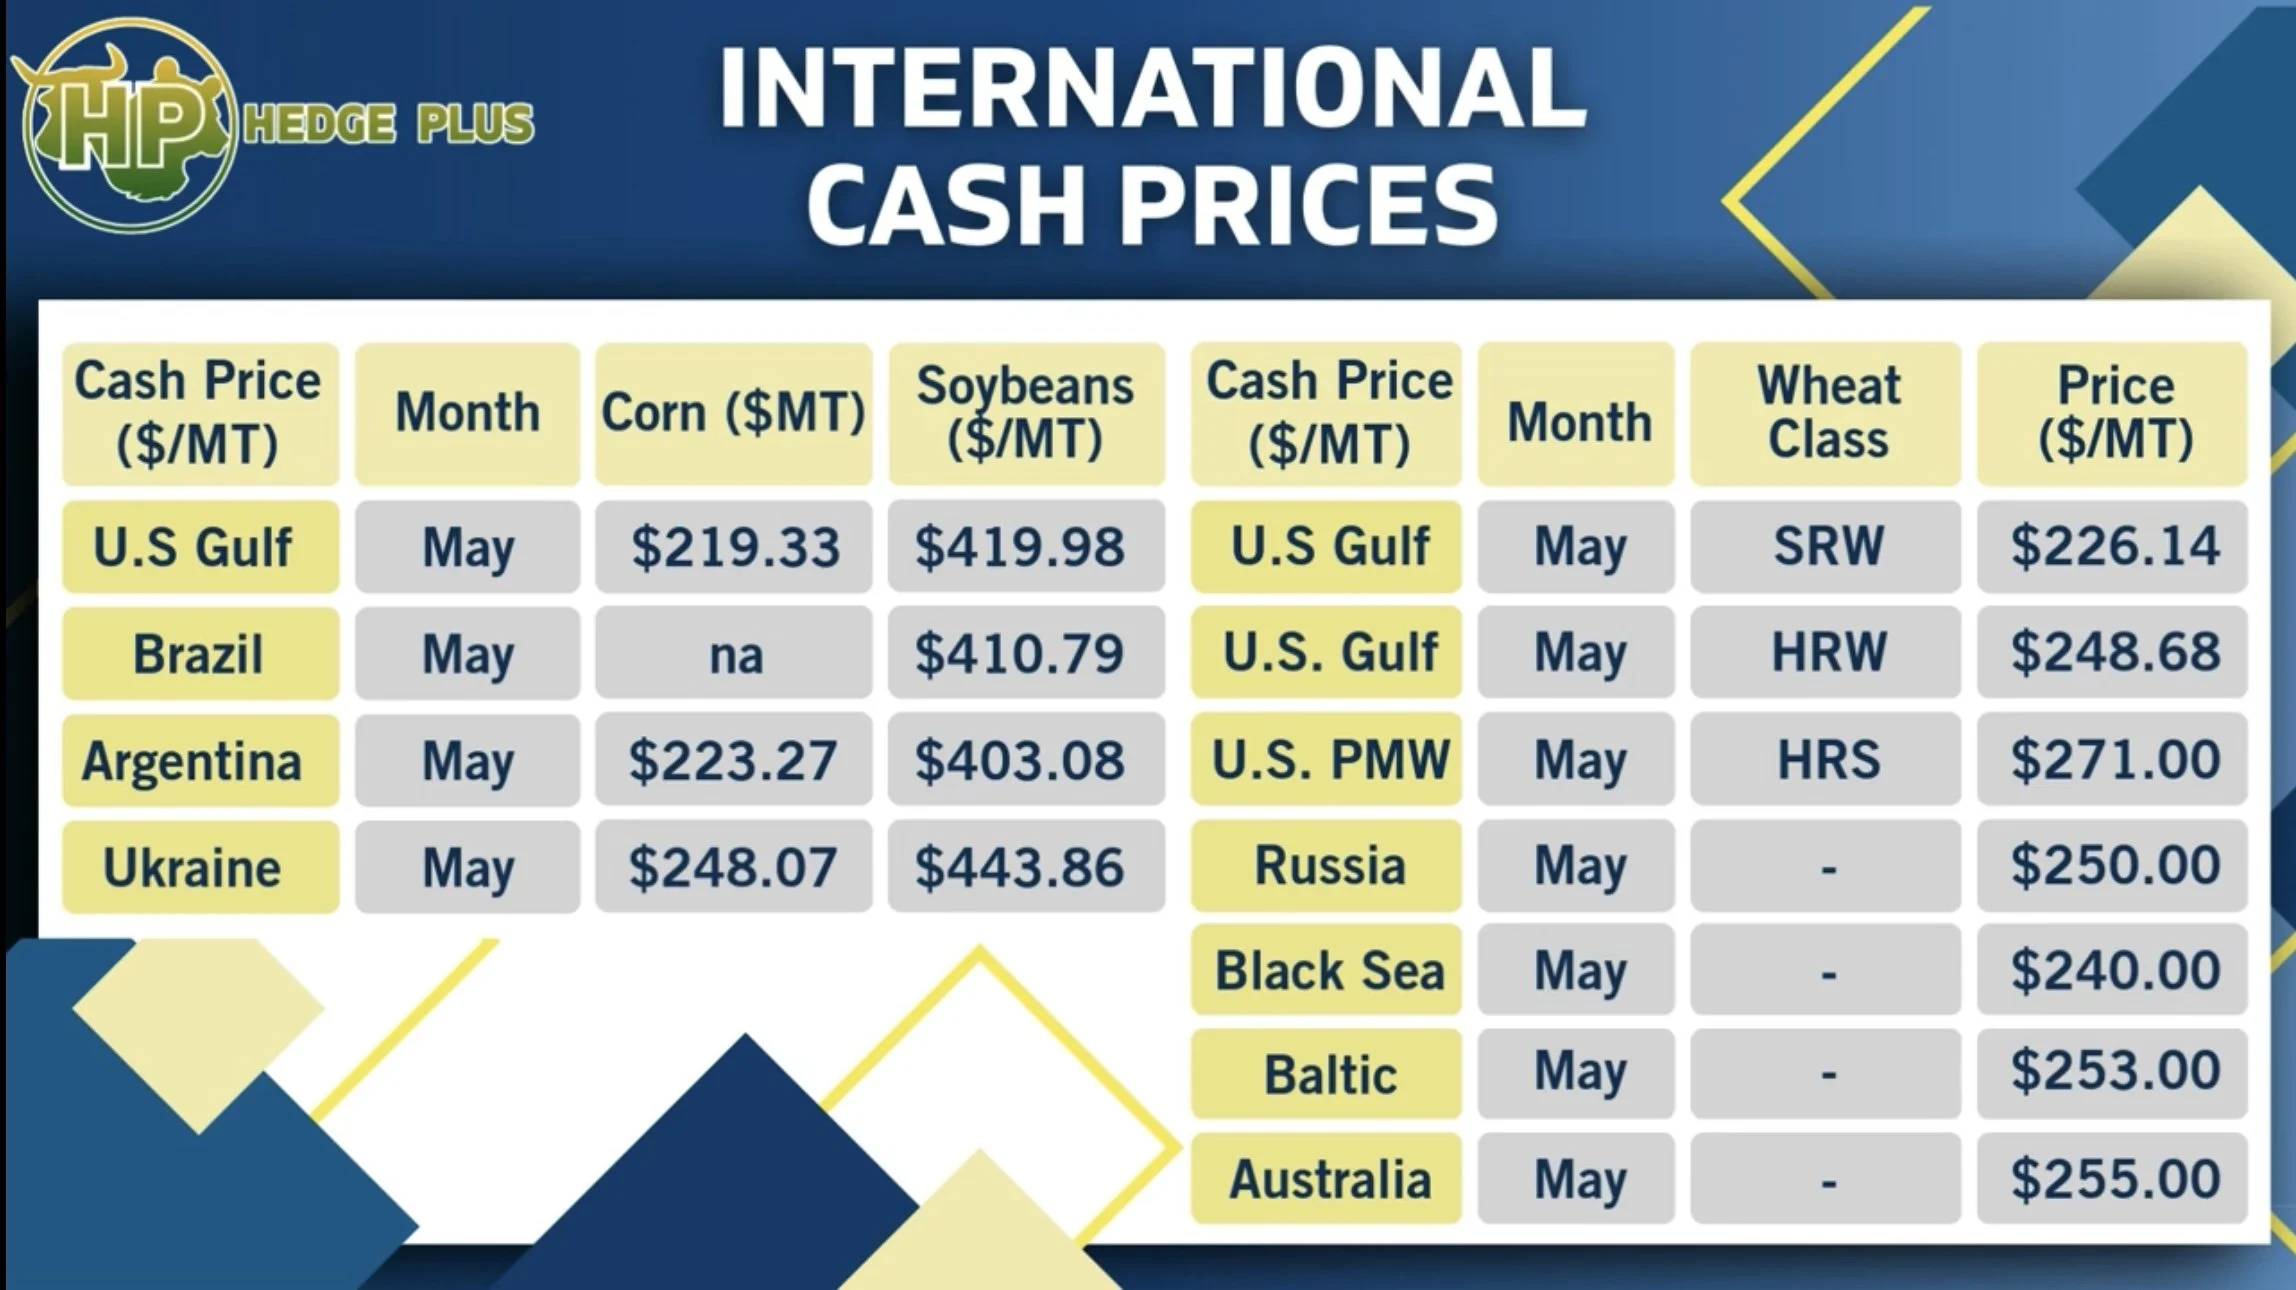
Futures Prices Close
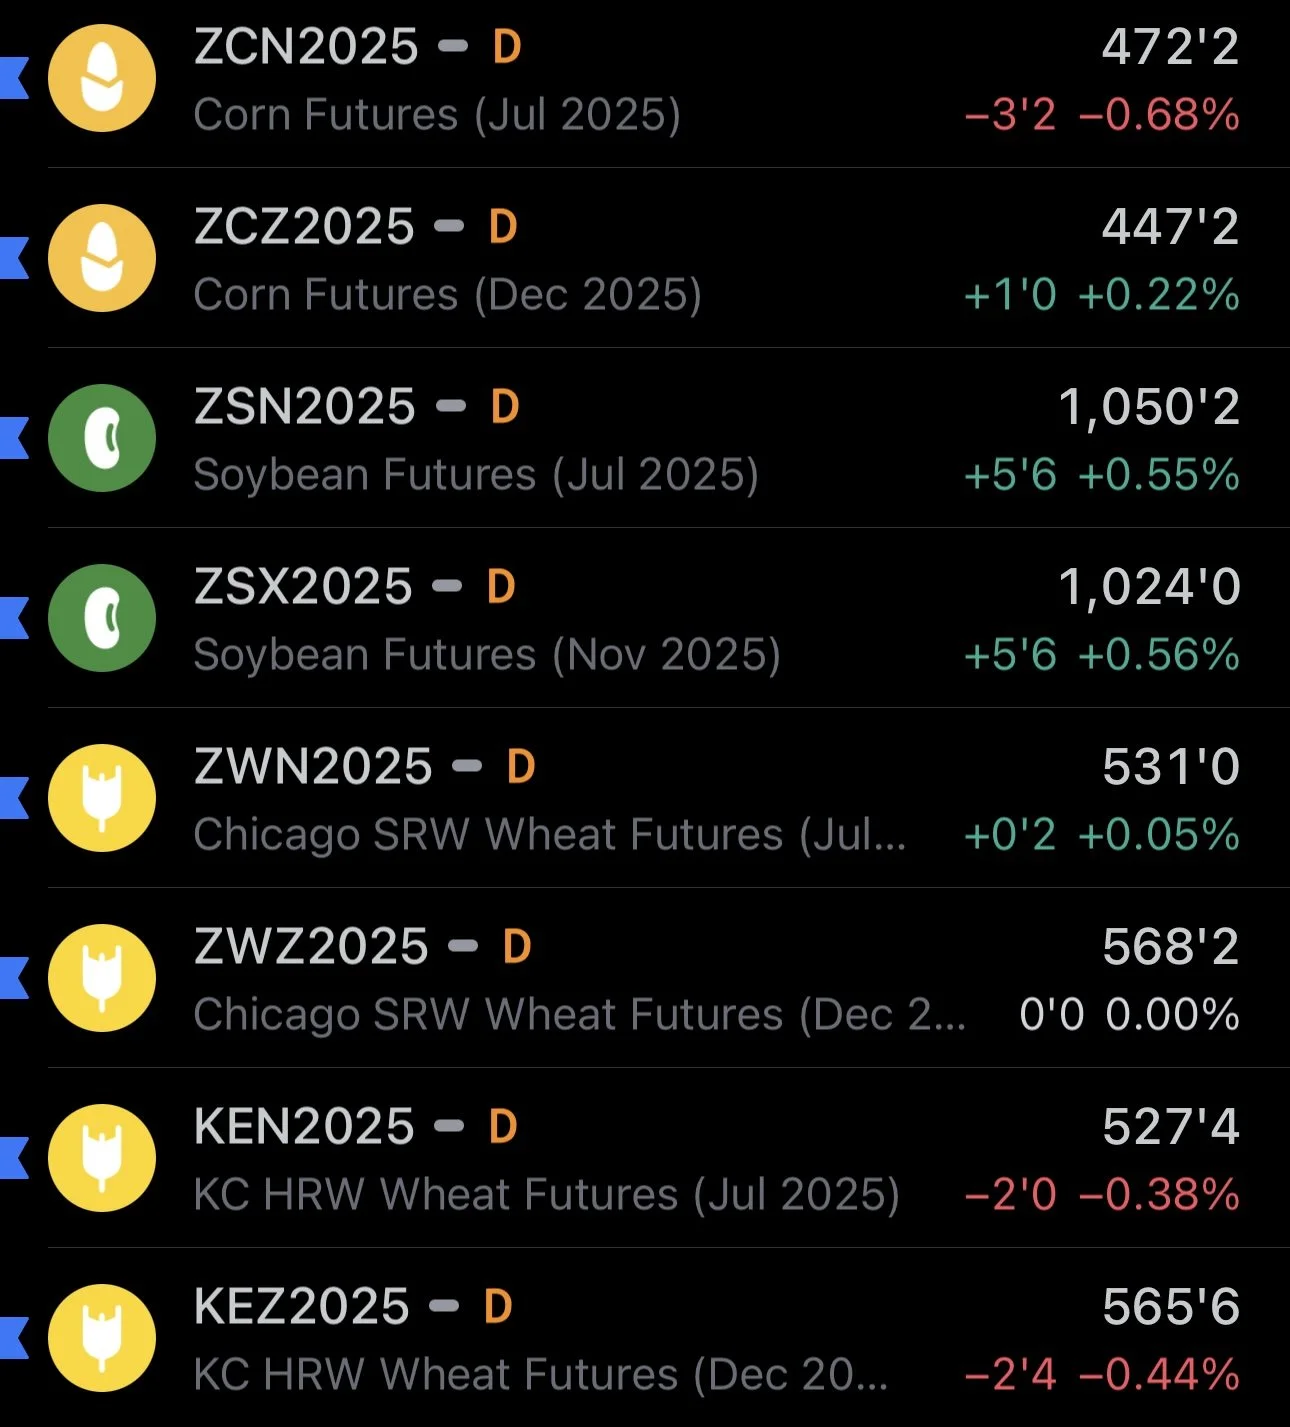
Overview
Soybeans higher while the corn and wheat market were both slightly lower.
Soybeans saw some technical buying, bouncing off the key 100-day MA bulls want to hold (will touch on later in bean section).
Soybeans also saw a little strength from optimism surrounding trade deals. As China made a statement that President Trump has reached out to start trade talks.
This comes after the recent back and forth headlines we've seen recently. Where the US claims we are in trade talks but then China says we are not in trade talks.
Additionally, we saw China listed as a buyer of soybeans in the weekly sales report that added some support.
Corn is finding some life following first notice day selling, bouncing at that downside target we have talking about (will touch on in the corn section). But fast planting should limit short term upside as weather looks favorable.
Wheat continues to see some pressure from rain in the HRW regions.
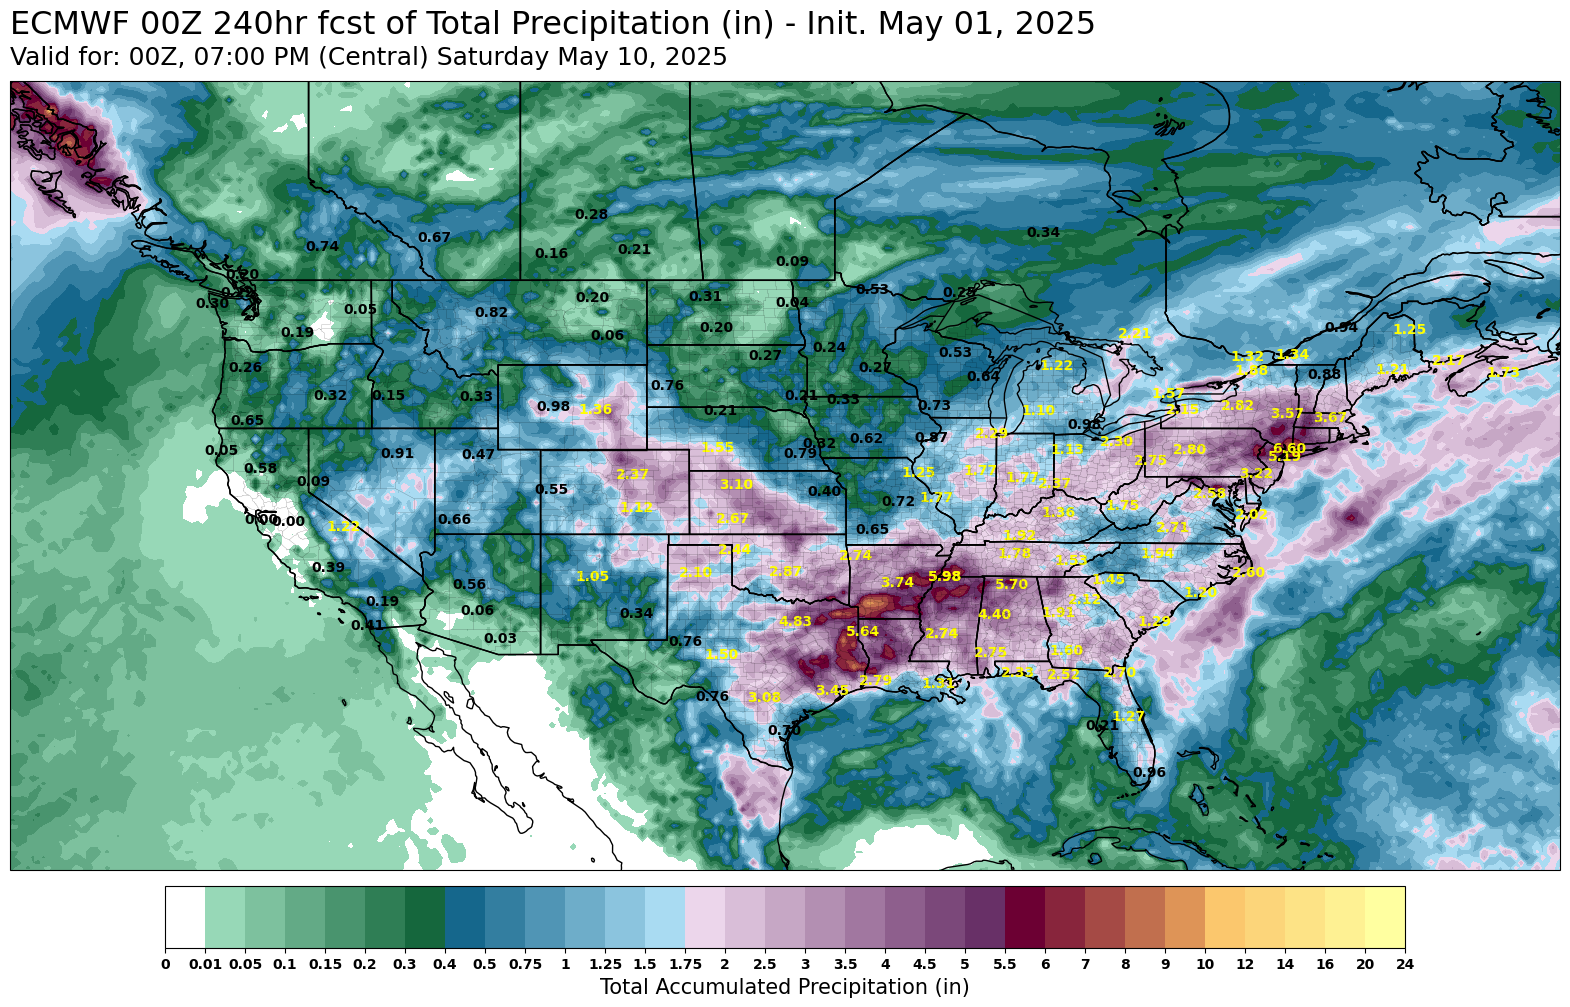
Here is the weather outlook for the next 10 days. Wetter than normal out east as well as the southern plains, but on the dry side in the central to northern corn belt.
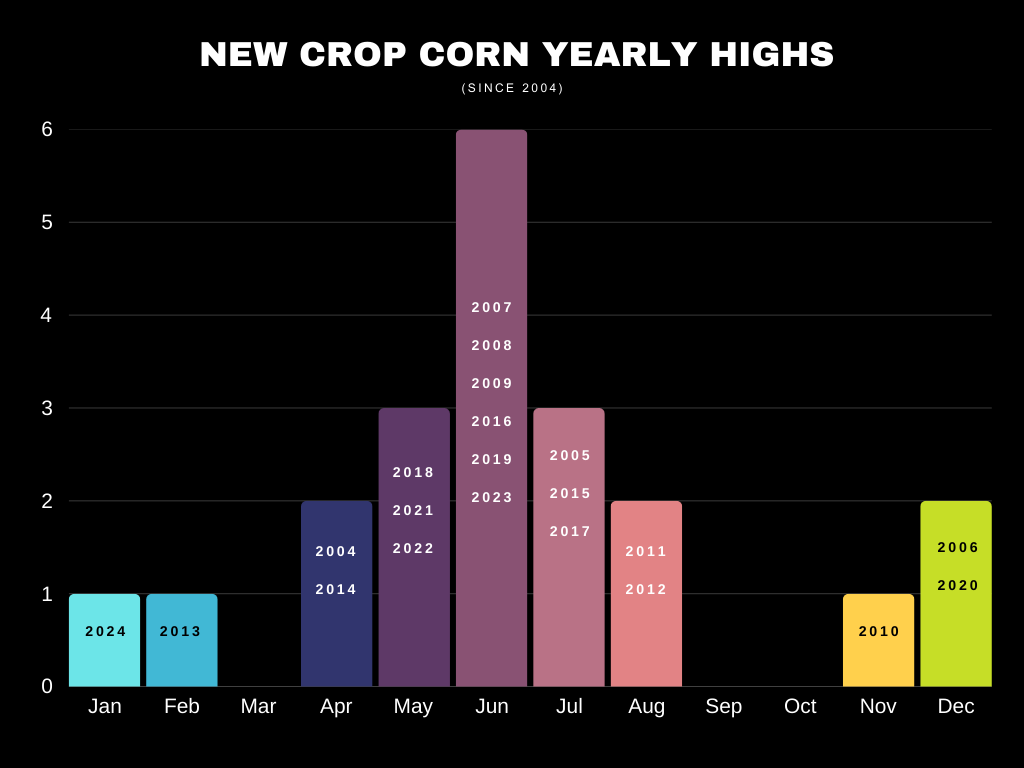
The Case Against a Feb Top in Corn
The current high for Dec-25 corn came on Feb 18th.
The high for the year has only been posted in February one time.
Which was 2013.
This is a compelling argument on it's own.. but let's dive deeper into the data.
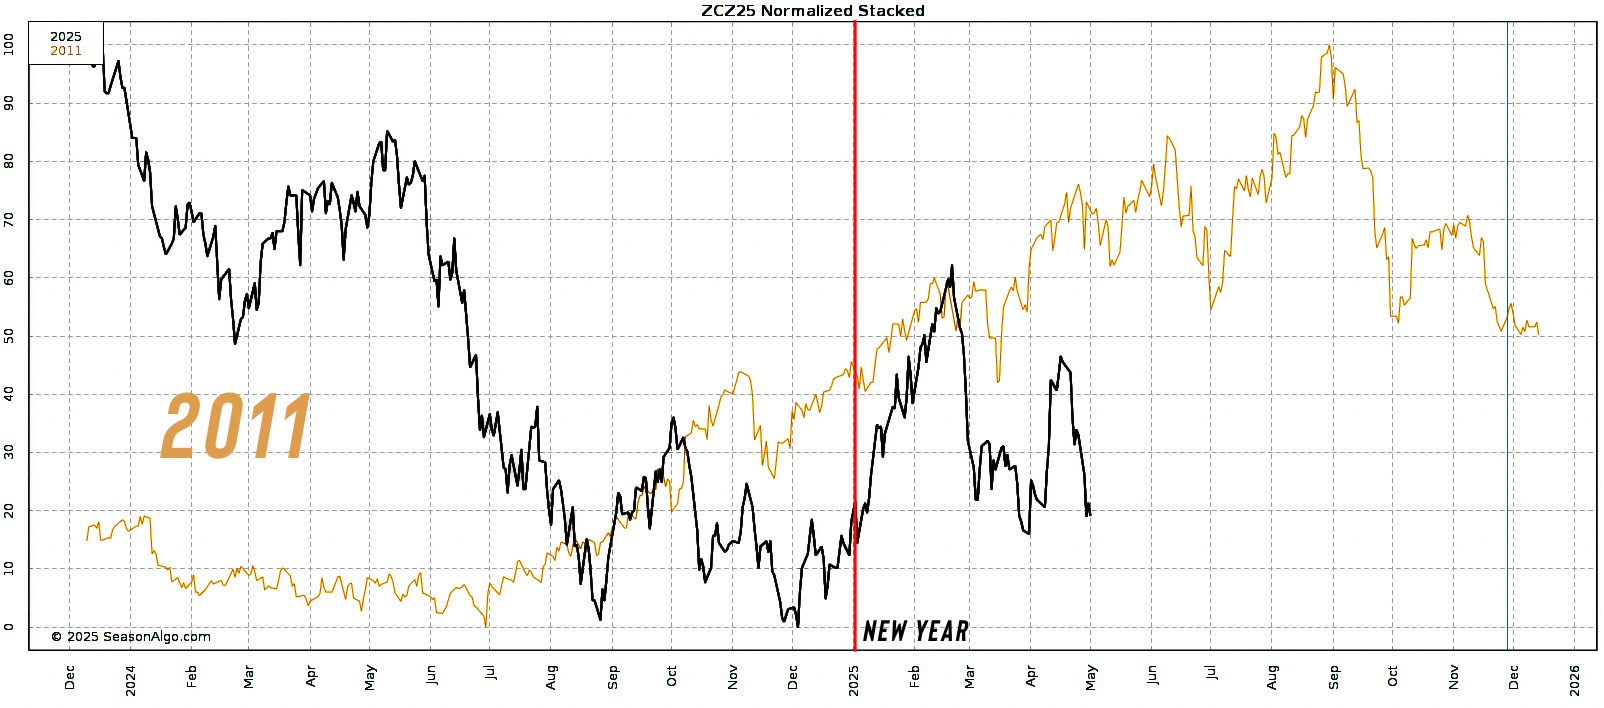
2013 is the Least Similar Year to 2025
Context matters.
2013 was coming off the historic 2012 drought rally.
Prices were already on a downfall after the rally, and February just so happened to be the highs after a small relief bounce before continuing lower the entire year.
Even more compelling: 2013 is the single least correlated year to 2025 in terms of price action.
It's not even close.
The pattern correlation is -71.5%.
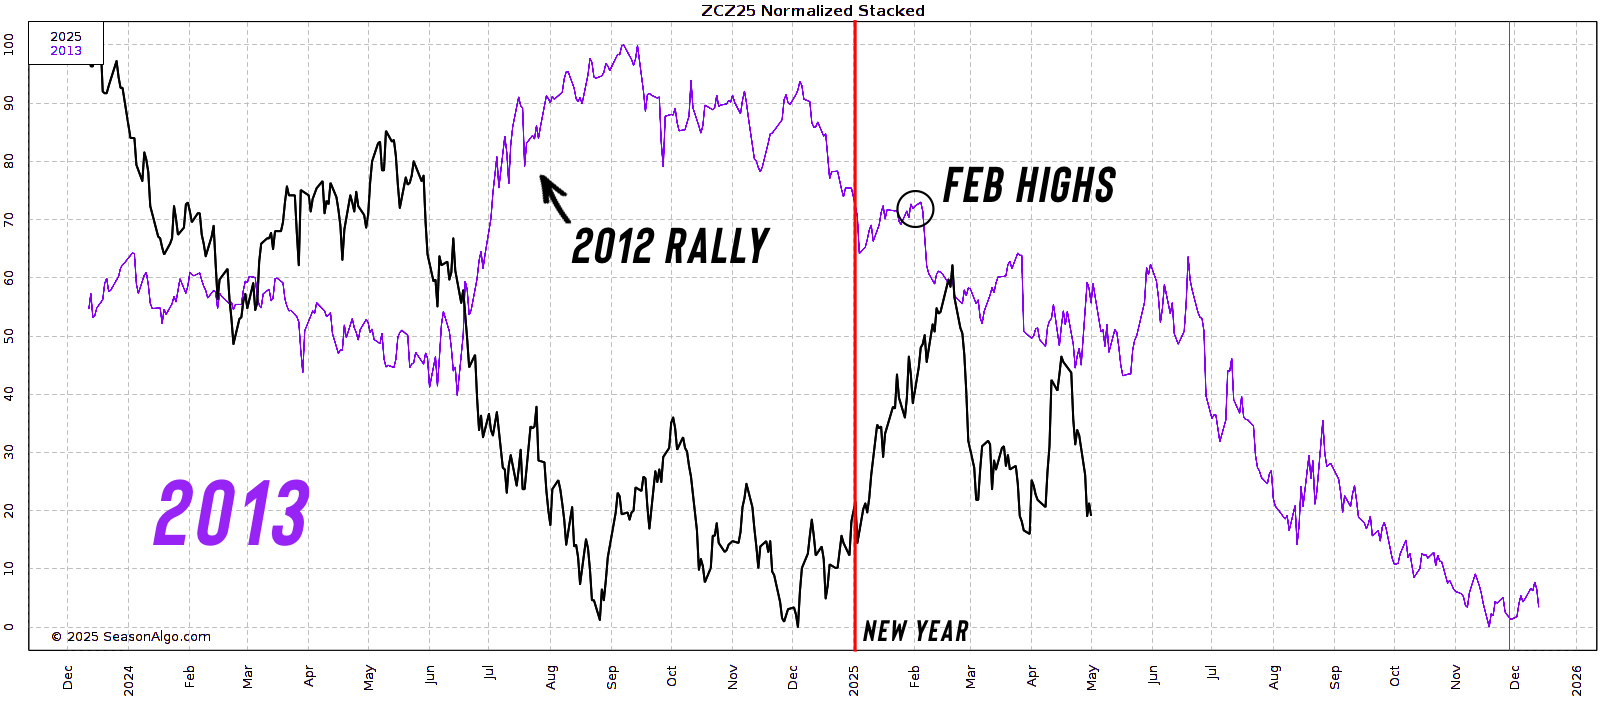
For reference the next least correlated year is 2011 at just -19.5%.
A massive difference between the 1st and 2nd least correlated years.
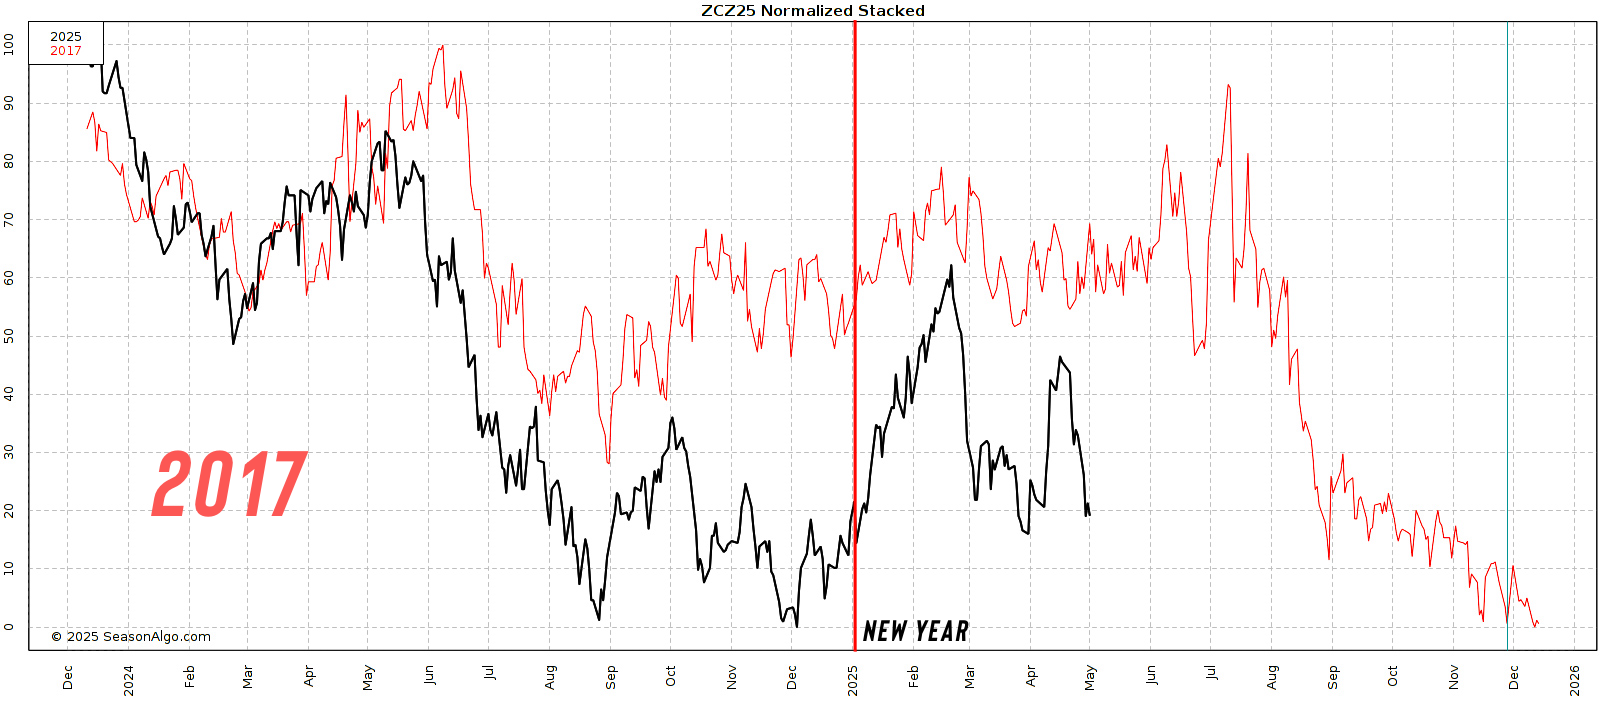
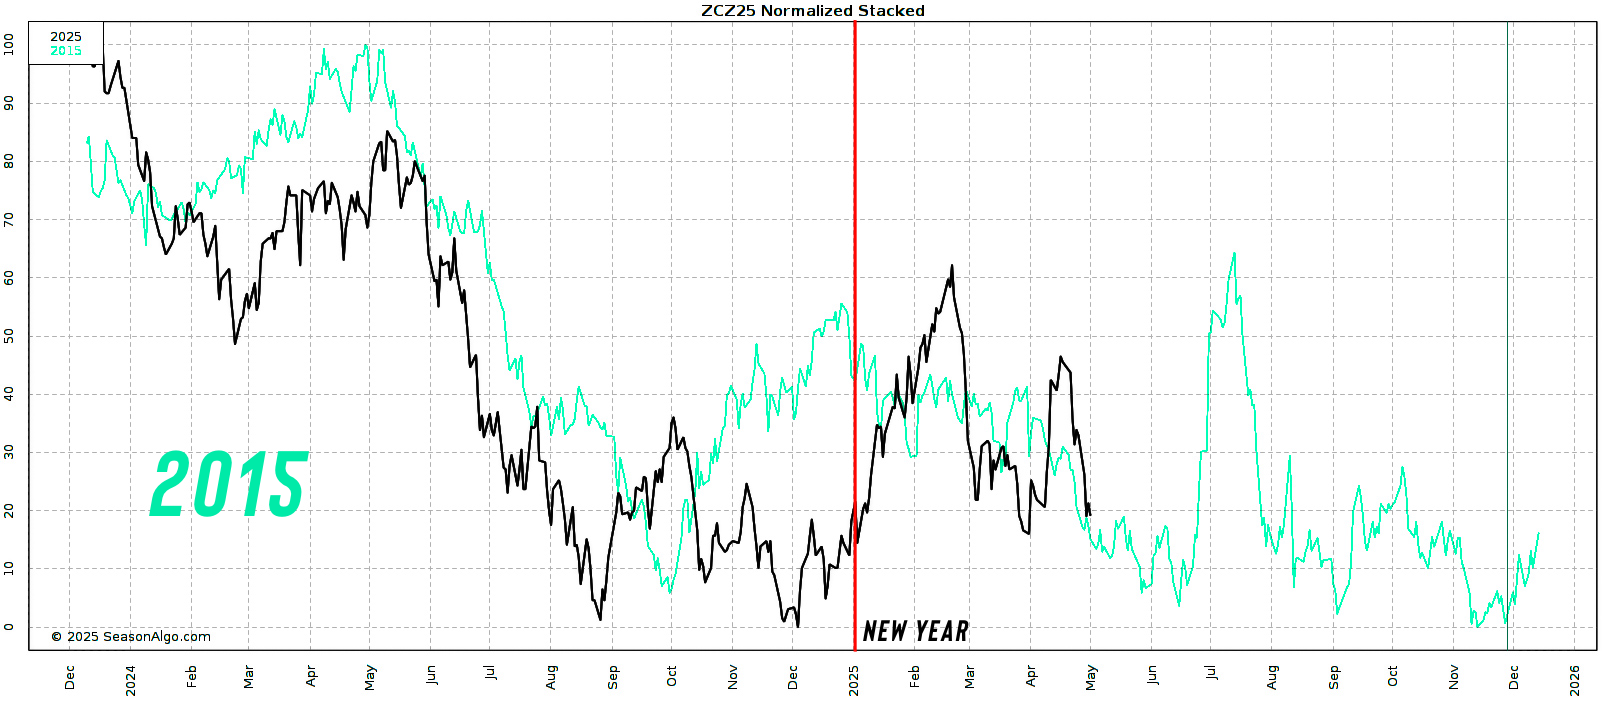
What Years are Most Similar to 2025?
Now let's focus on the most correlated years to 2025.
The most similar year is 2017, with a 73% correlation.
The 2nd most correlated year is 2015 at 59%.
Both years followed a similar path to that usual seasonal rally and topped out in the summer.
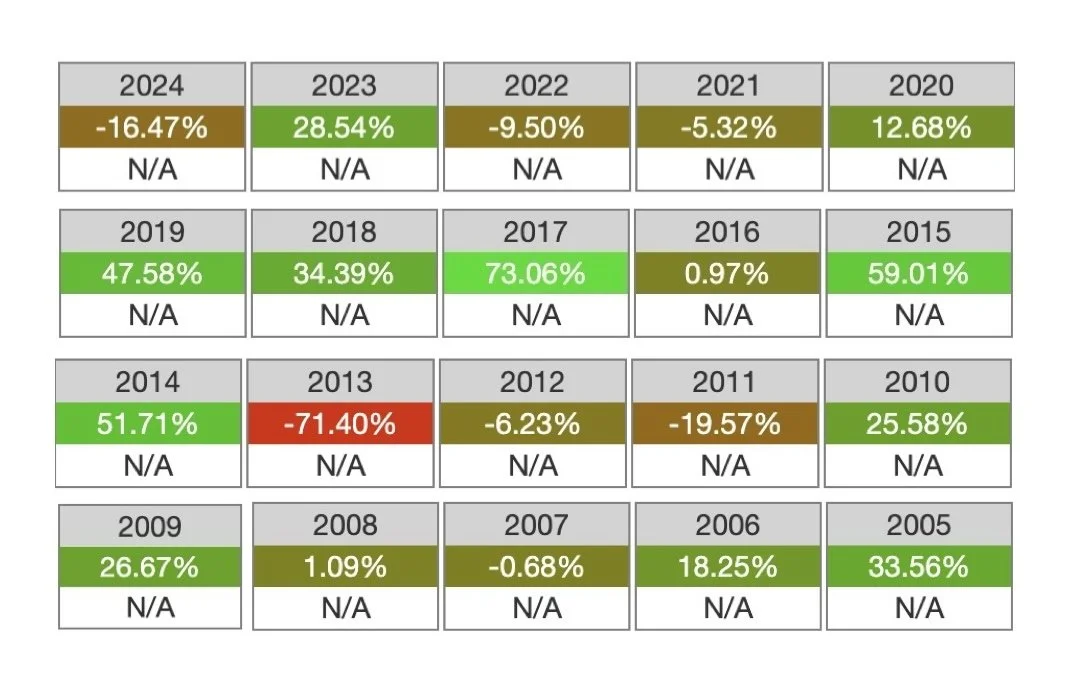
The Full Historical Picture
Below is the price action correlations for every single since 2005.
Again, 2013 is by far the least correlated year by a mile.
Despite it being the only year we have seen the corn market post it's yearly highs in February.
This creates an even bigger argument that the chances we posted our highs in February this year aren’t great.
The odds, the patterns, and history all suggest we didn’t and the seasonal trend is still in favor of an opportunity.
Of course, this is all simply data and could be completely wrong and we never take out the February highs. I am just showing you what history tells us.
For example last year was the first year we posted our highs in January. So it could happen, but the odds are in our favor.
Today's Main Takeaways
Corn
Fundamentals:
Short term I am not expecting fireworks, as fast planting could keep a lid on a major rally.
Short term there is really no reason for us to go and take out the recent lows, but there is also no reason for us to go and post new highs. So I think we could be simply sideways for a little bit.
Open interest in corn has been dropping (the number of people holding a trade) which means people are simply stepping to the sidelines waiting for something to happen.
Long term, the fundamentals especially for old crop are still friendly led by demand.
There is a solid argument the USDA should once again bump exports.
(I went over Tuesday how this could impact the balance sheet: CLICK HERE TO VIEW)
We have the cheapest corn in the world and are one of the only available suppliers right now until Brazil's crop is available. (We also have the cheapest wheat in the world)
The world knows Brazil's 2nd corn crop is coming yet we continue to sell corn.
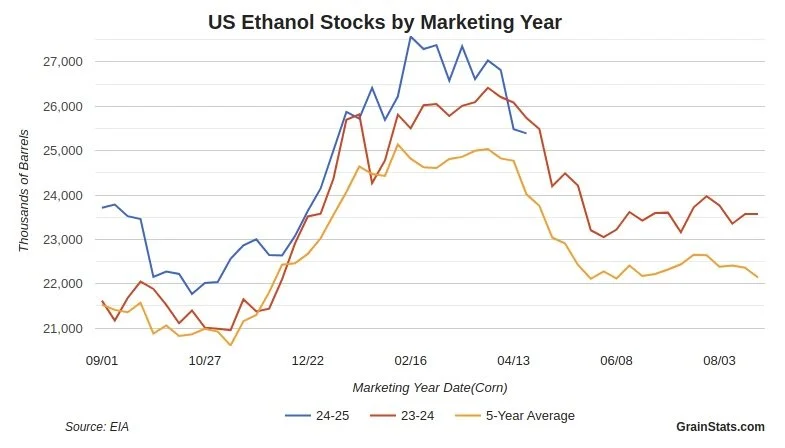
Chart from Hedge Plus
Yesterday we had ethanol numbers.
For the first time in a long time, ethanol production rose while ethanol stocks shrank. Another friendly sign for demand.
Charts from GrainStats

Bottom line, I think our downside is limited due to how strong demand is. The funds know how tight the world situation is so there isn’t a reason for them to bail ahead of growing season.
The world needs the US to have a big crop which will amplify any sort of weather scare at all.
The extended forecasts still suggest dry. I think we will see some weather premium eventually built in.
Technicals:
I still think corn carves out a bottom here. I went over these reasons on Tuesday but will again touch on them.
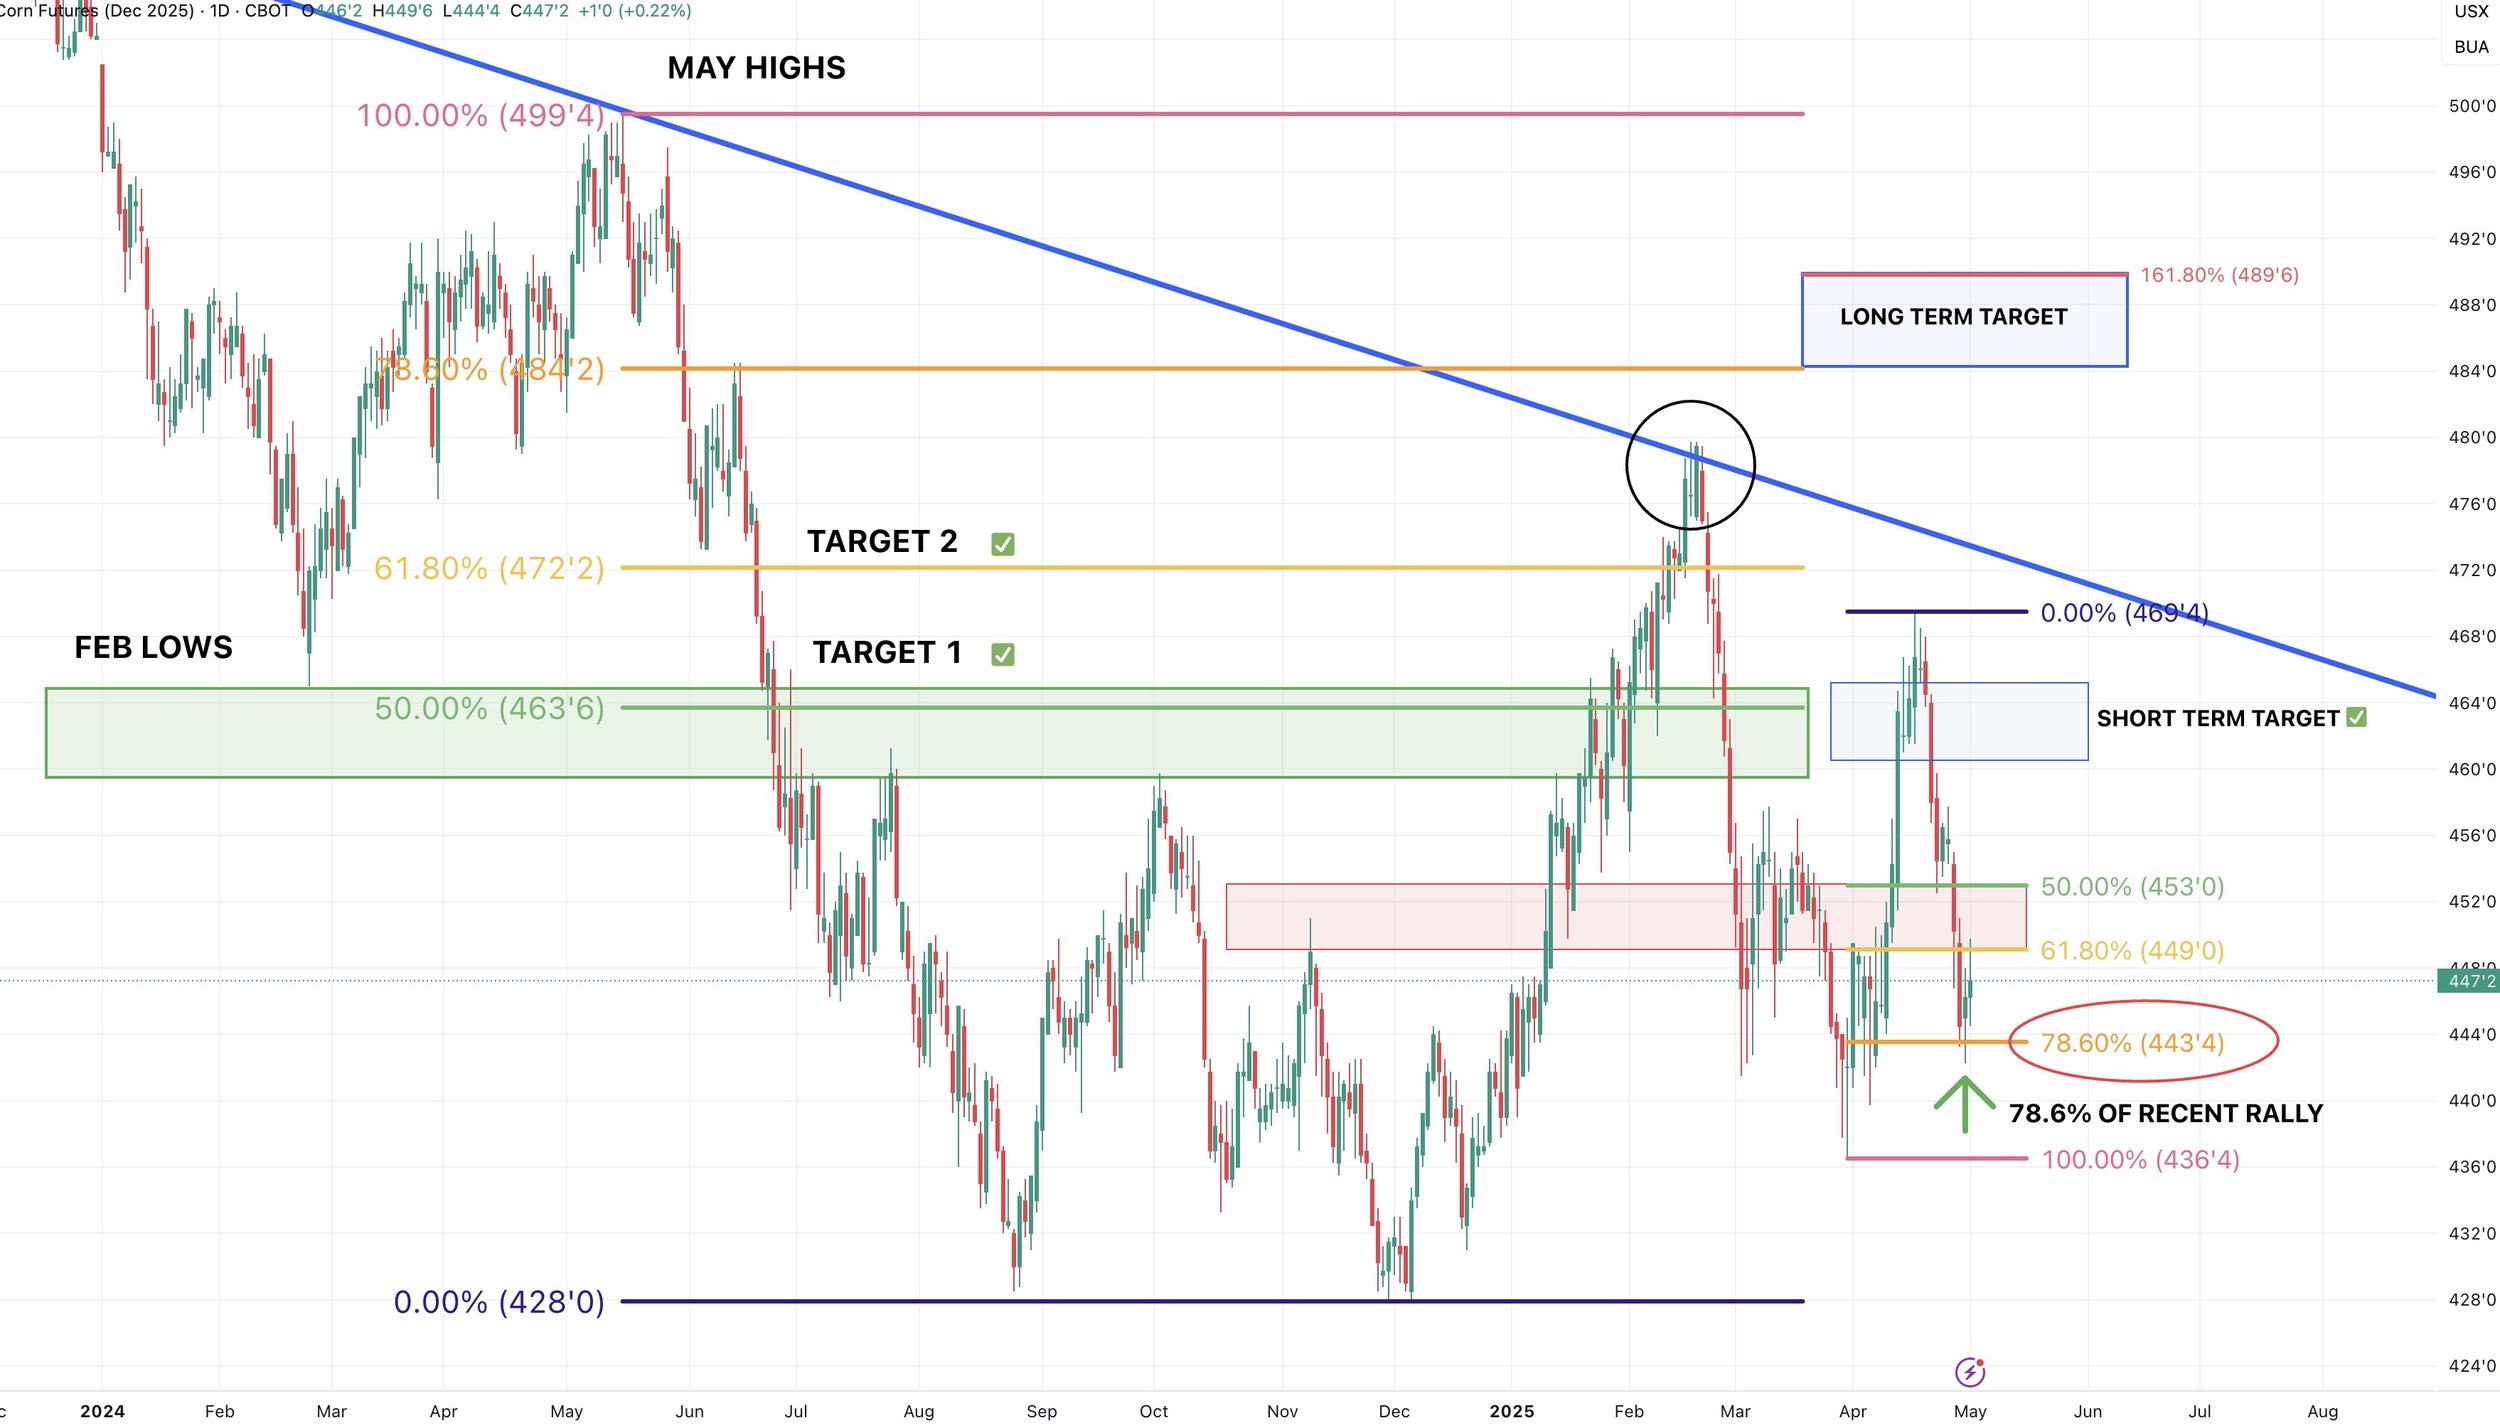
Reason #1)
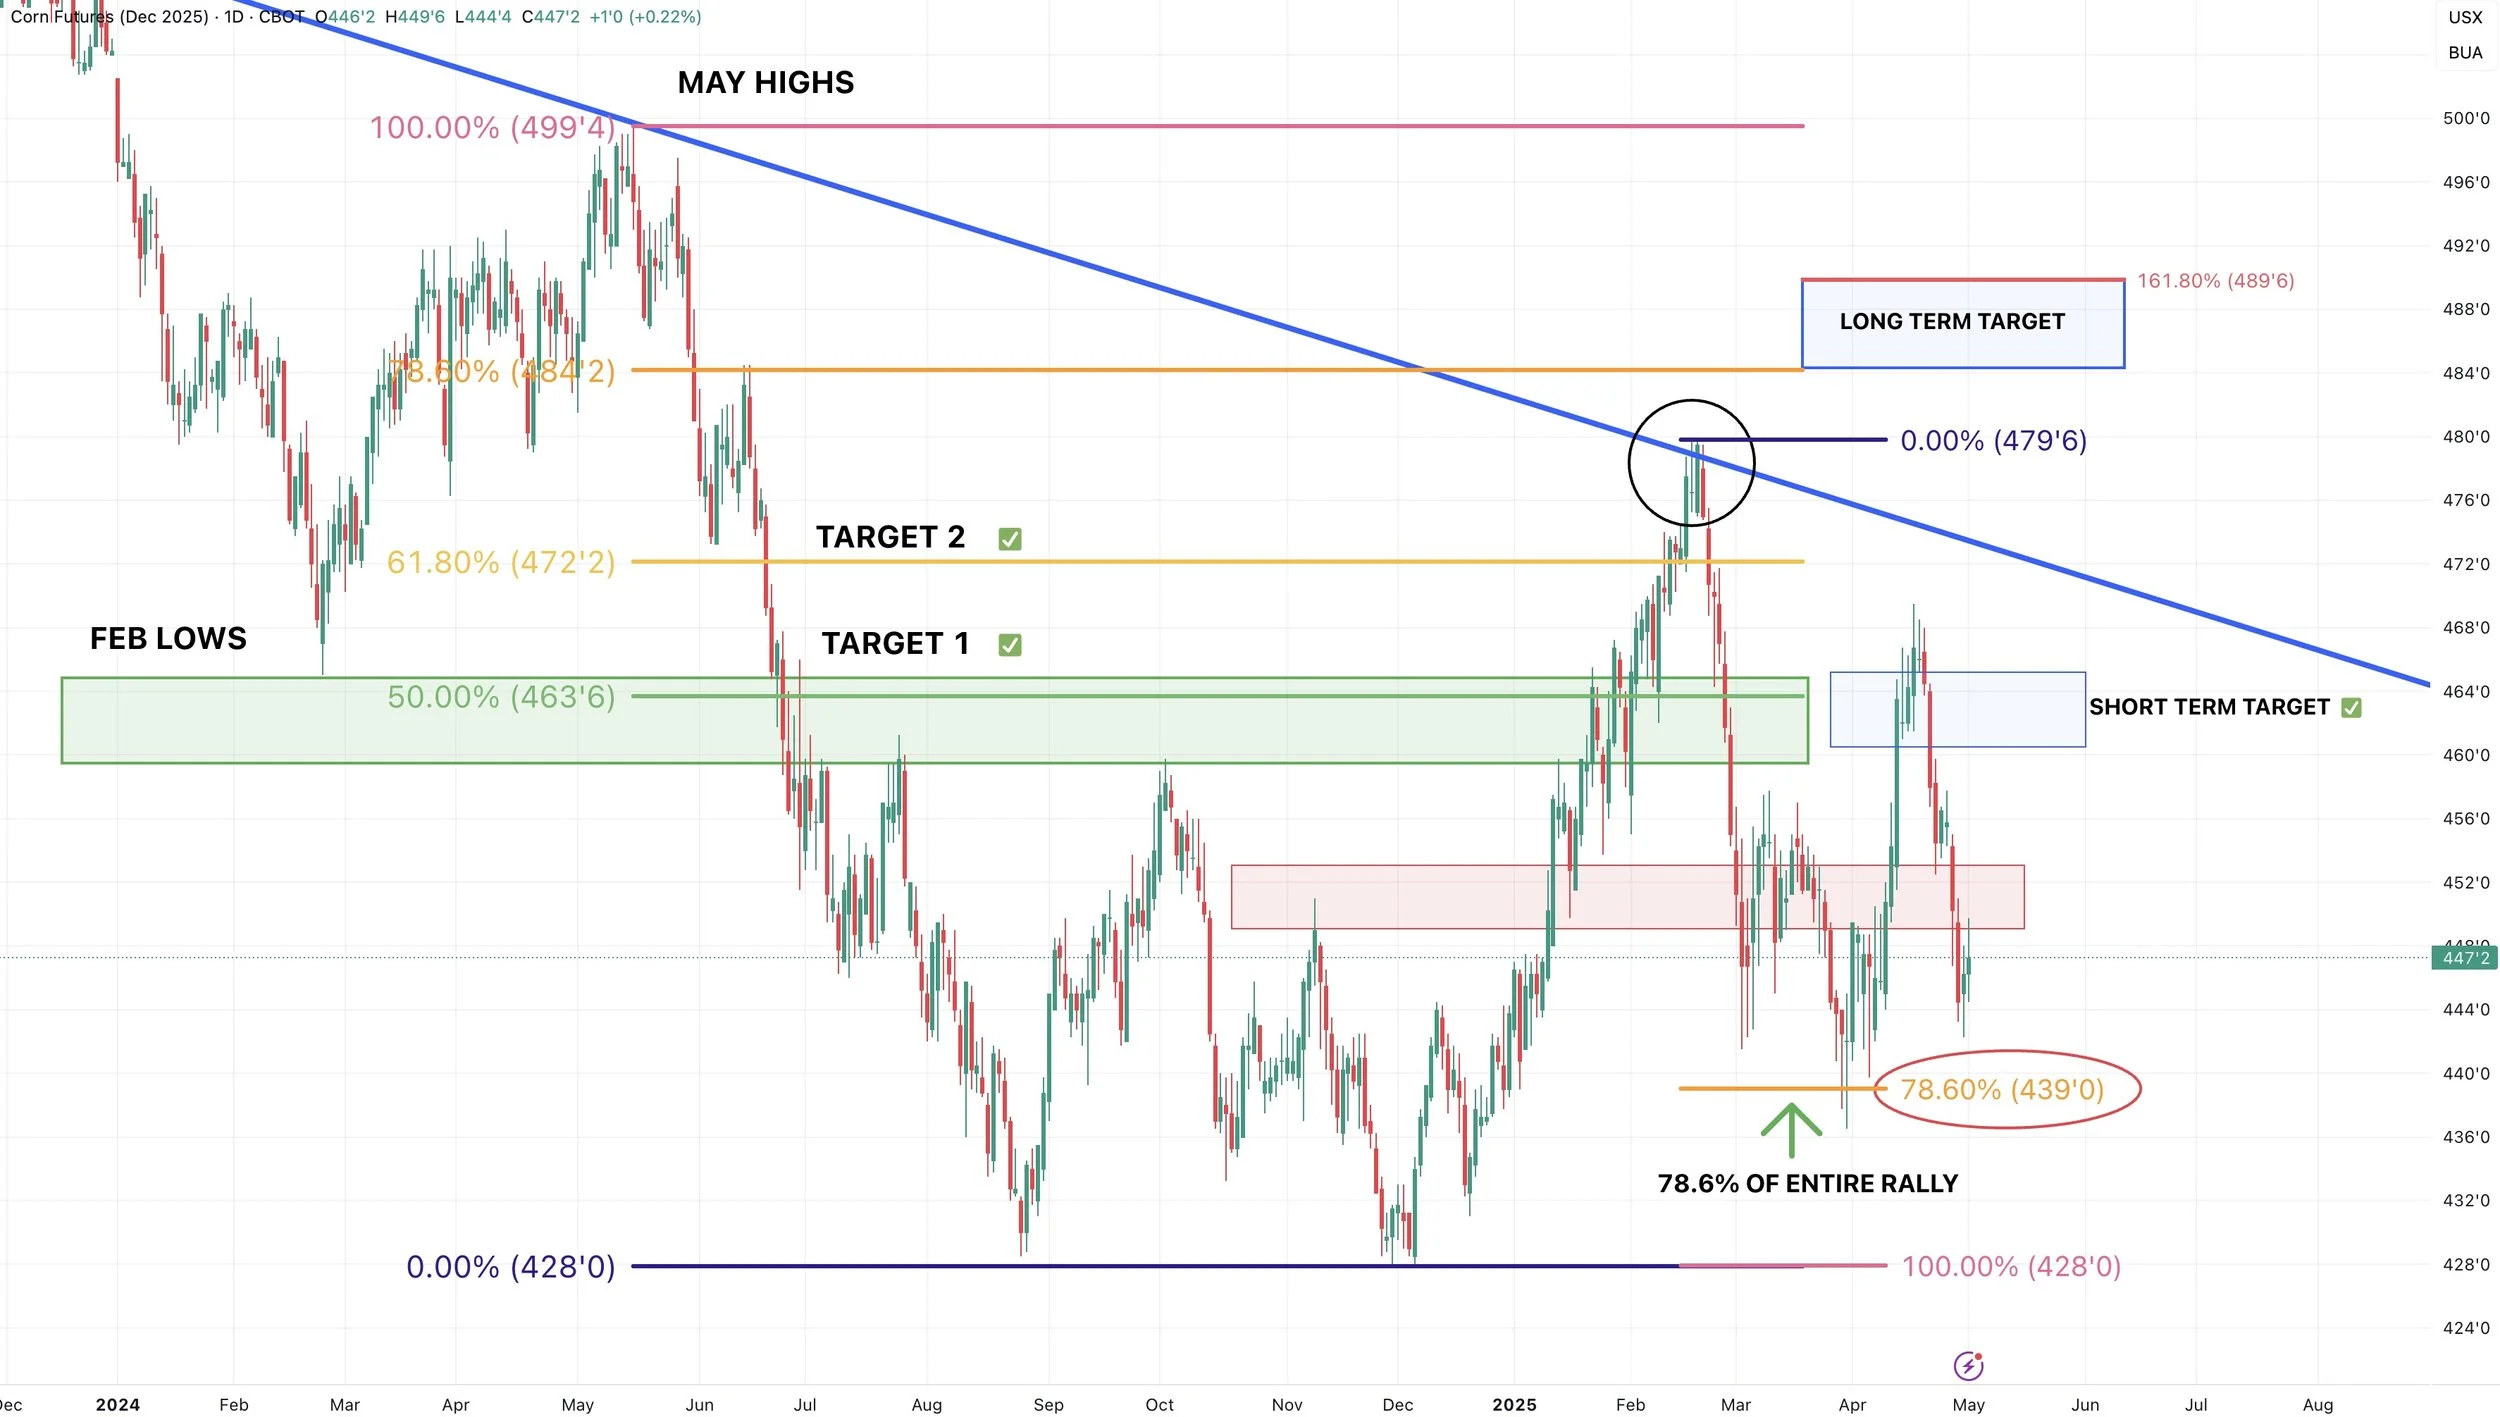
We hit the 61.8% retracement of the recent March to April rally.
How common of a level is this?
On the recent rally.. we clawed back 61.8% of the sell off from the Feb highs (top small blue box). That is exactly where we topped out.
On the massive sell off in Feb-March.. we bottomed at the 61.8% retracement from the entire August to Feb rally. (yellow line at bottom of big red box).
The 61.8% level has been very key for corn.
Next Upside Target: Still $5.23-26

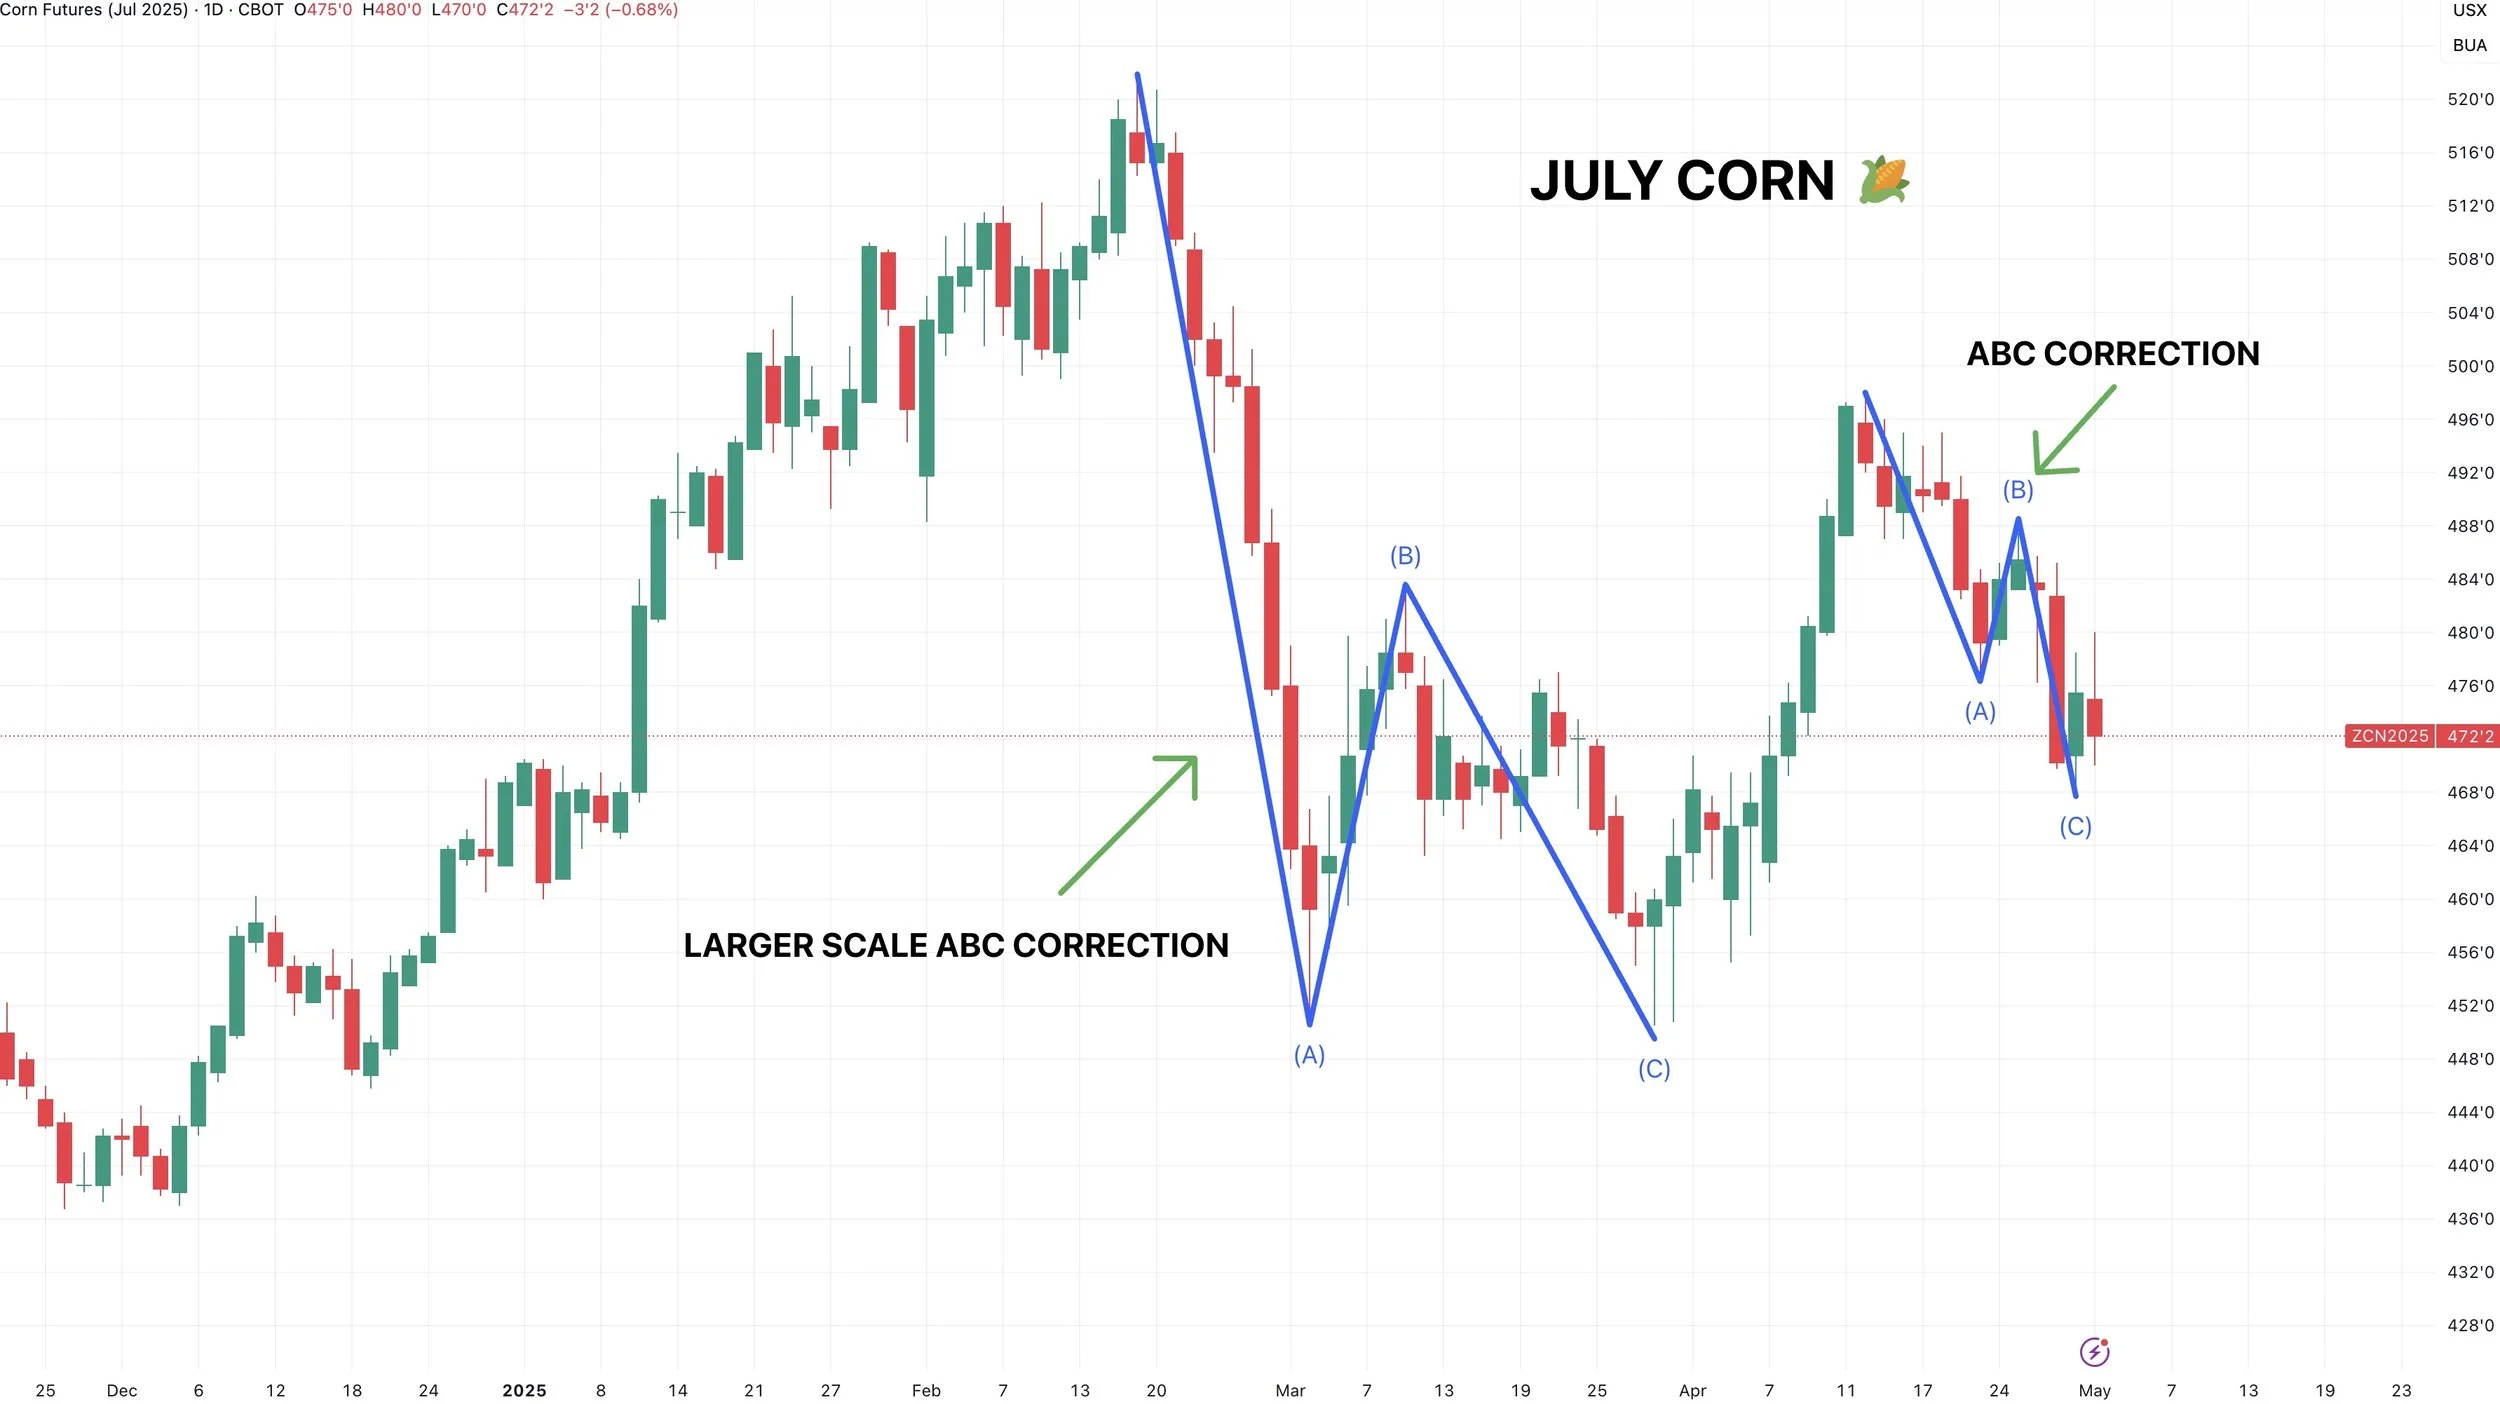
Reason #2)
Corrections usually happen in 3 moves.
An ABC correction is the most common pullback pattern in markets.
We now have our 3 moves lower.
We saw the same pullback pattern on the Feb sell off just on a larger scale.

Reason #3)
The stochastics are bottomed out.
The dotted lines mark other times it bottomed out. It's not perfect but often signals when we are close to a bottom.

Carving out some lows here in Dec-25 corn makes sense as well.
Again, not calling for a face melting rally. I just think the heavy bled shed could be over.
We gave back 78.6% of the recent rally and are bouncing here (1st chart shows this).
The 78.6% retracement of the entire rally from contract lows up to the Feb highs is also the exact level that we bounced at back in March after the major sell off. (2nd chart shows this).
Soybeans
Fundamentals:
Trade deals and tariffs have a more potential upside effect than they do downside risk here.
We already have 145% tariffs on China and traded the initial shock news.
Reality is that a trade war doesn’t matter until harvest.
However, a trade deal could be a massively positive thing and would leave the demand story a lot friendly than before. The last one in 2020 led to a bull market.
Yes we have a big Brazil crop. Yes the world has a lot of beans. But we have already traded and priced this in for several months.
There is zero weather premium built into this market. Due to less acres, unless we raise a record yield there is a very real path for the new crop soybean situation to become incredibly tight.
Just like corn, I think there will opportunities.
Technicals:
Today we bounced right off the 100-day MA.
This is a key spot to hold. If we break below we likely drop to $10.26 to $10.16
Which is old key support and the golden zone retracement of this recent rally.
Next Upside Target: Still $11.04
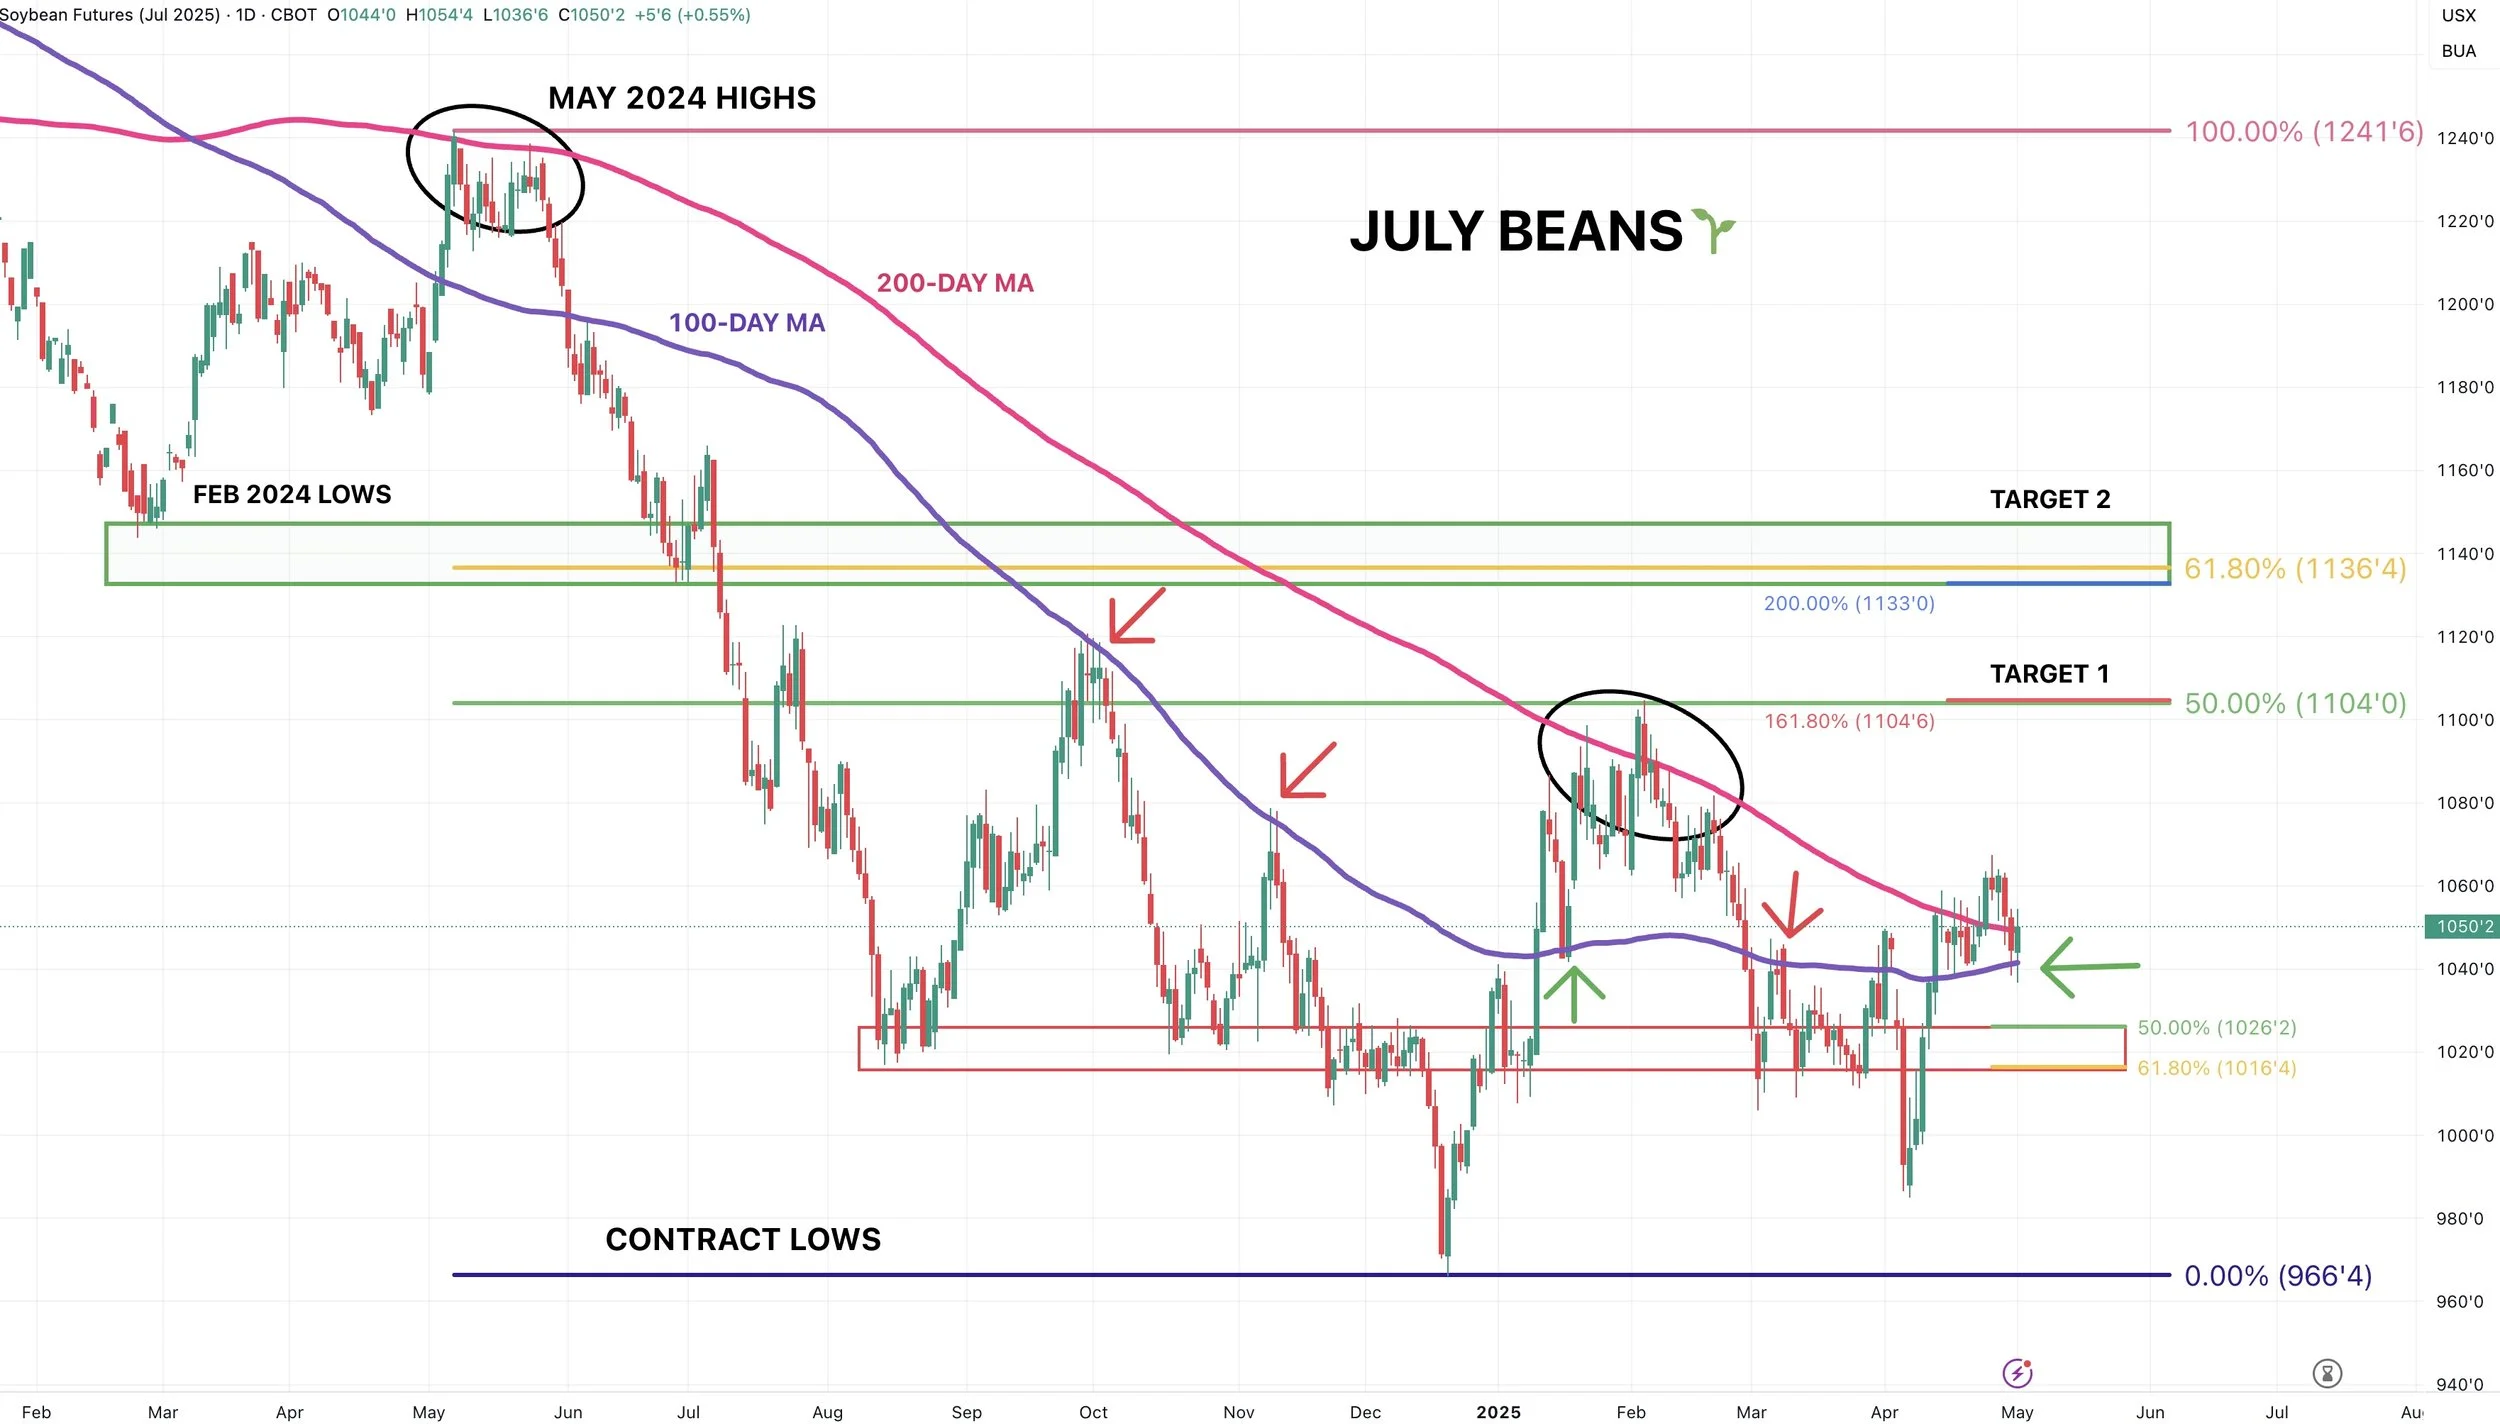
I have been showing you this pattern since February.
This inverse head & shoulders pattern is still in tact.
The implied move for this is over $12 (possible but would be a hard task). I'll be de-risking well before hand but likely leaving a little gun powder in case.
Either way it's a bullish reversal pattern that happens after a downward trend.

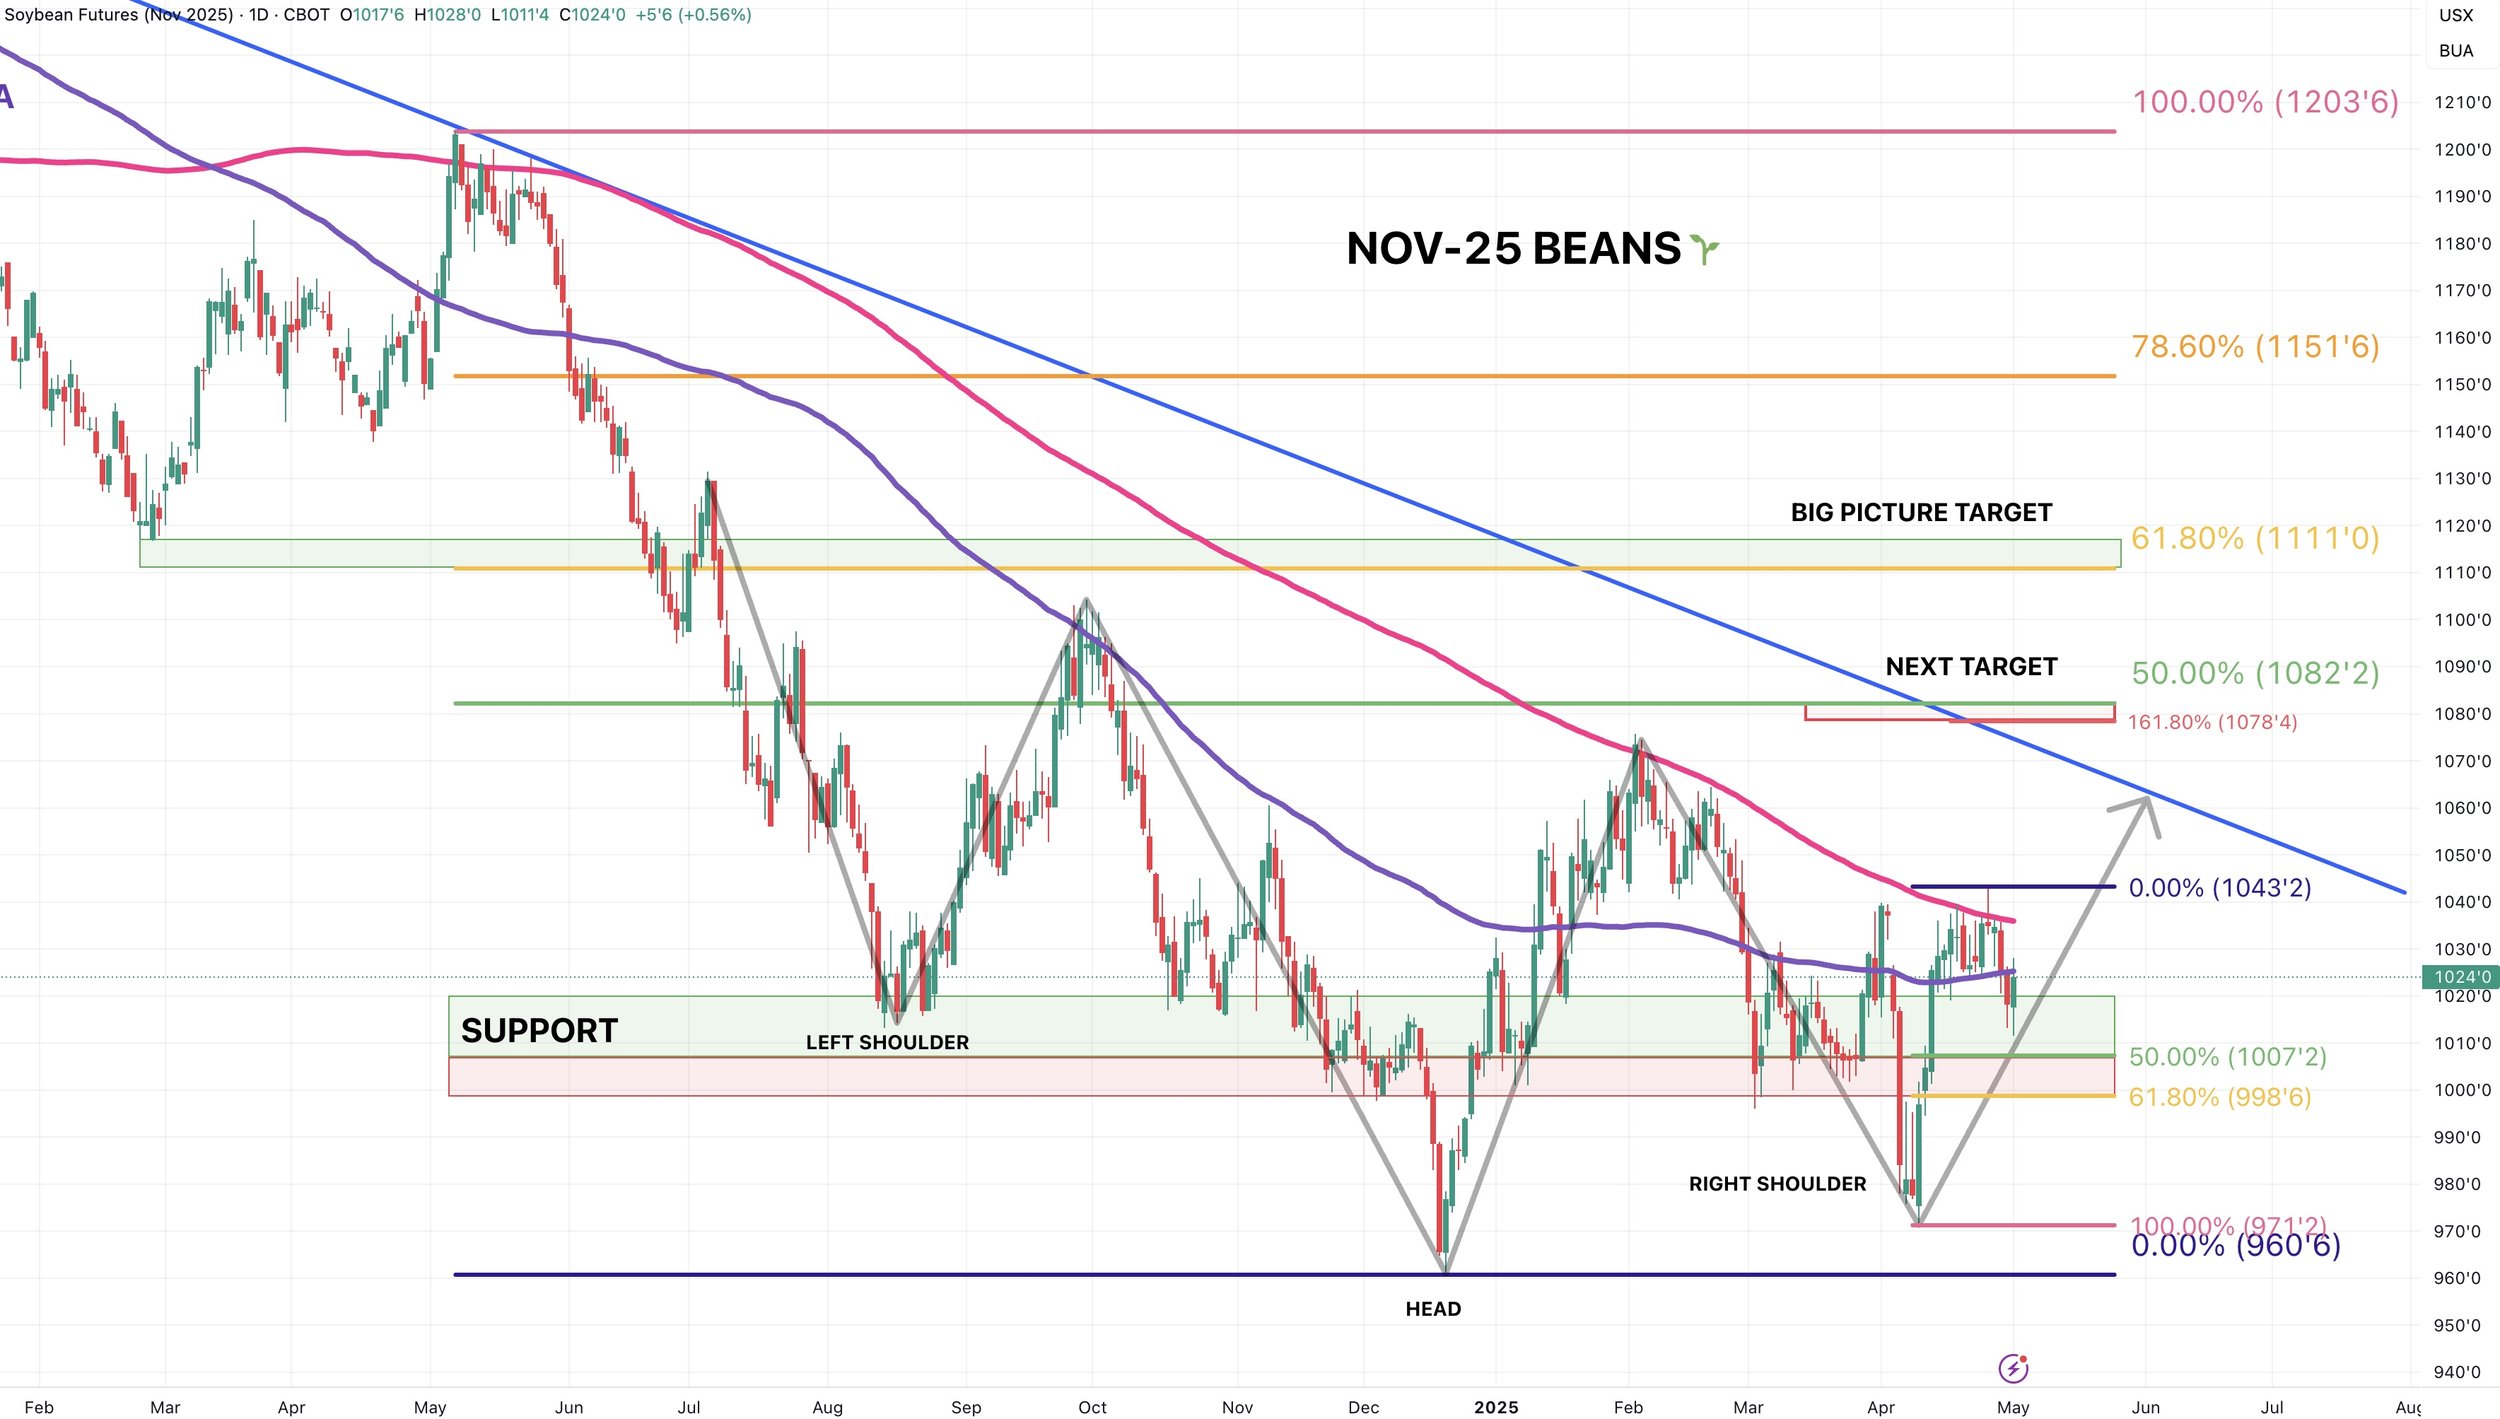
I showed this recently, but this is inverse beans.
It still looks like the risk is lower.
Another test of $11.00 still makes the most sense to me.

If Nov beans break above the 200-day it should lead to more upside.
Next target: Still $10.78-82
Wheat
Fundamentals:
We continue to see pressure from rains in growing areas.
The funds are still heavily short and need a spark to ignite some buying.
They do not have a reason to cover today, but on a global scale, the wheat story is still friendly.
The EU and Russia are both set to start trending dry, which could add support and be a reason. However, the issue is that we might have to wait until we get close to the middle of May for temps to be warm enough to matter.
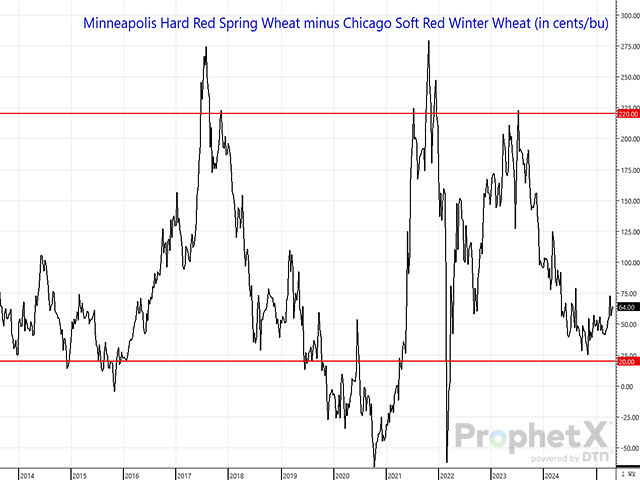
This chart from DTN is for you Canadian and northern plains wheat producers.
This is the Minneapolis to Chicago wheat spread (Price of MPLS - Price of Chicago).
Recently Minneapolis wheat has been at some of it's most undervalued levels compared to Chicago in history.
However, it's starting to pick up some ground. As the market might be starting to notice that US farmers are planning to plant their least spring wheat acres since 1970.
The tighter supply could breathe some life into spring wheat down the line.
Technicals:
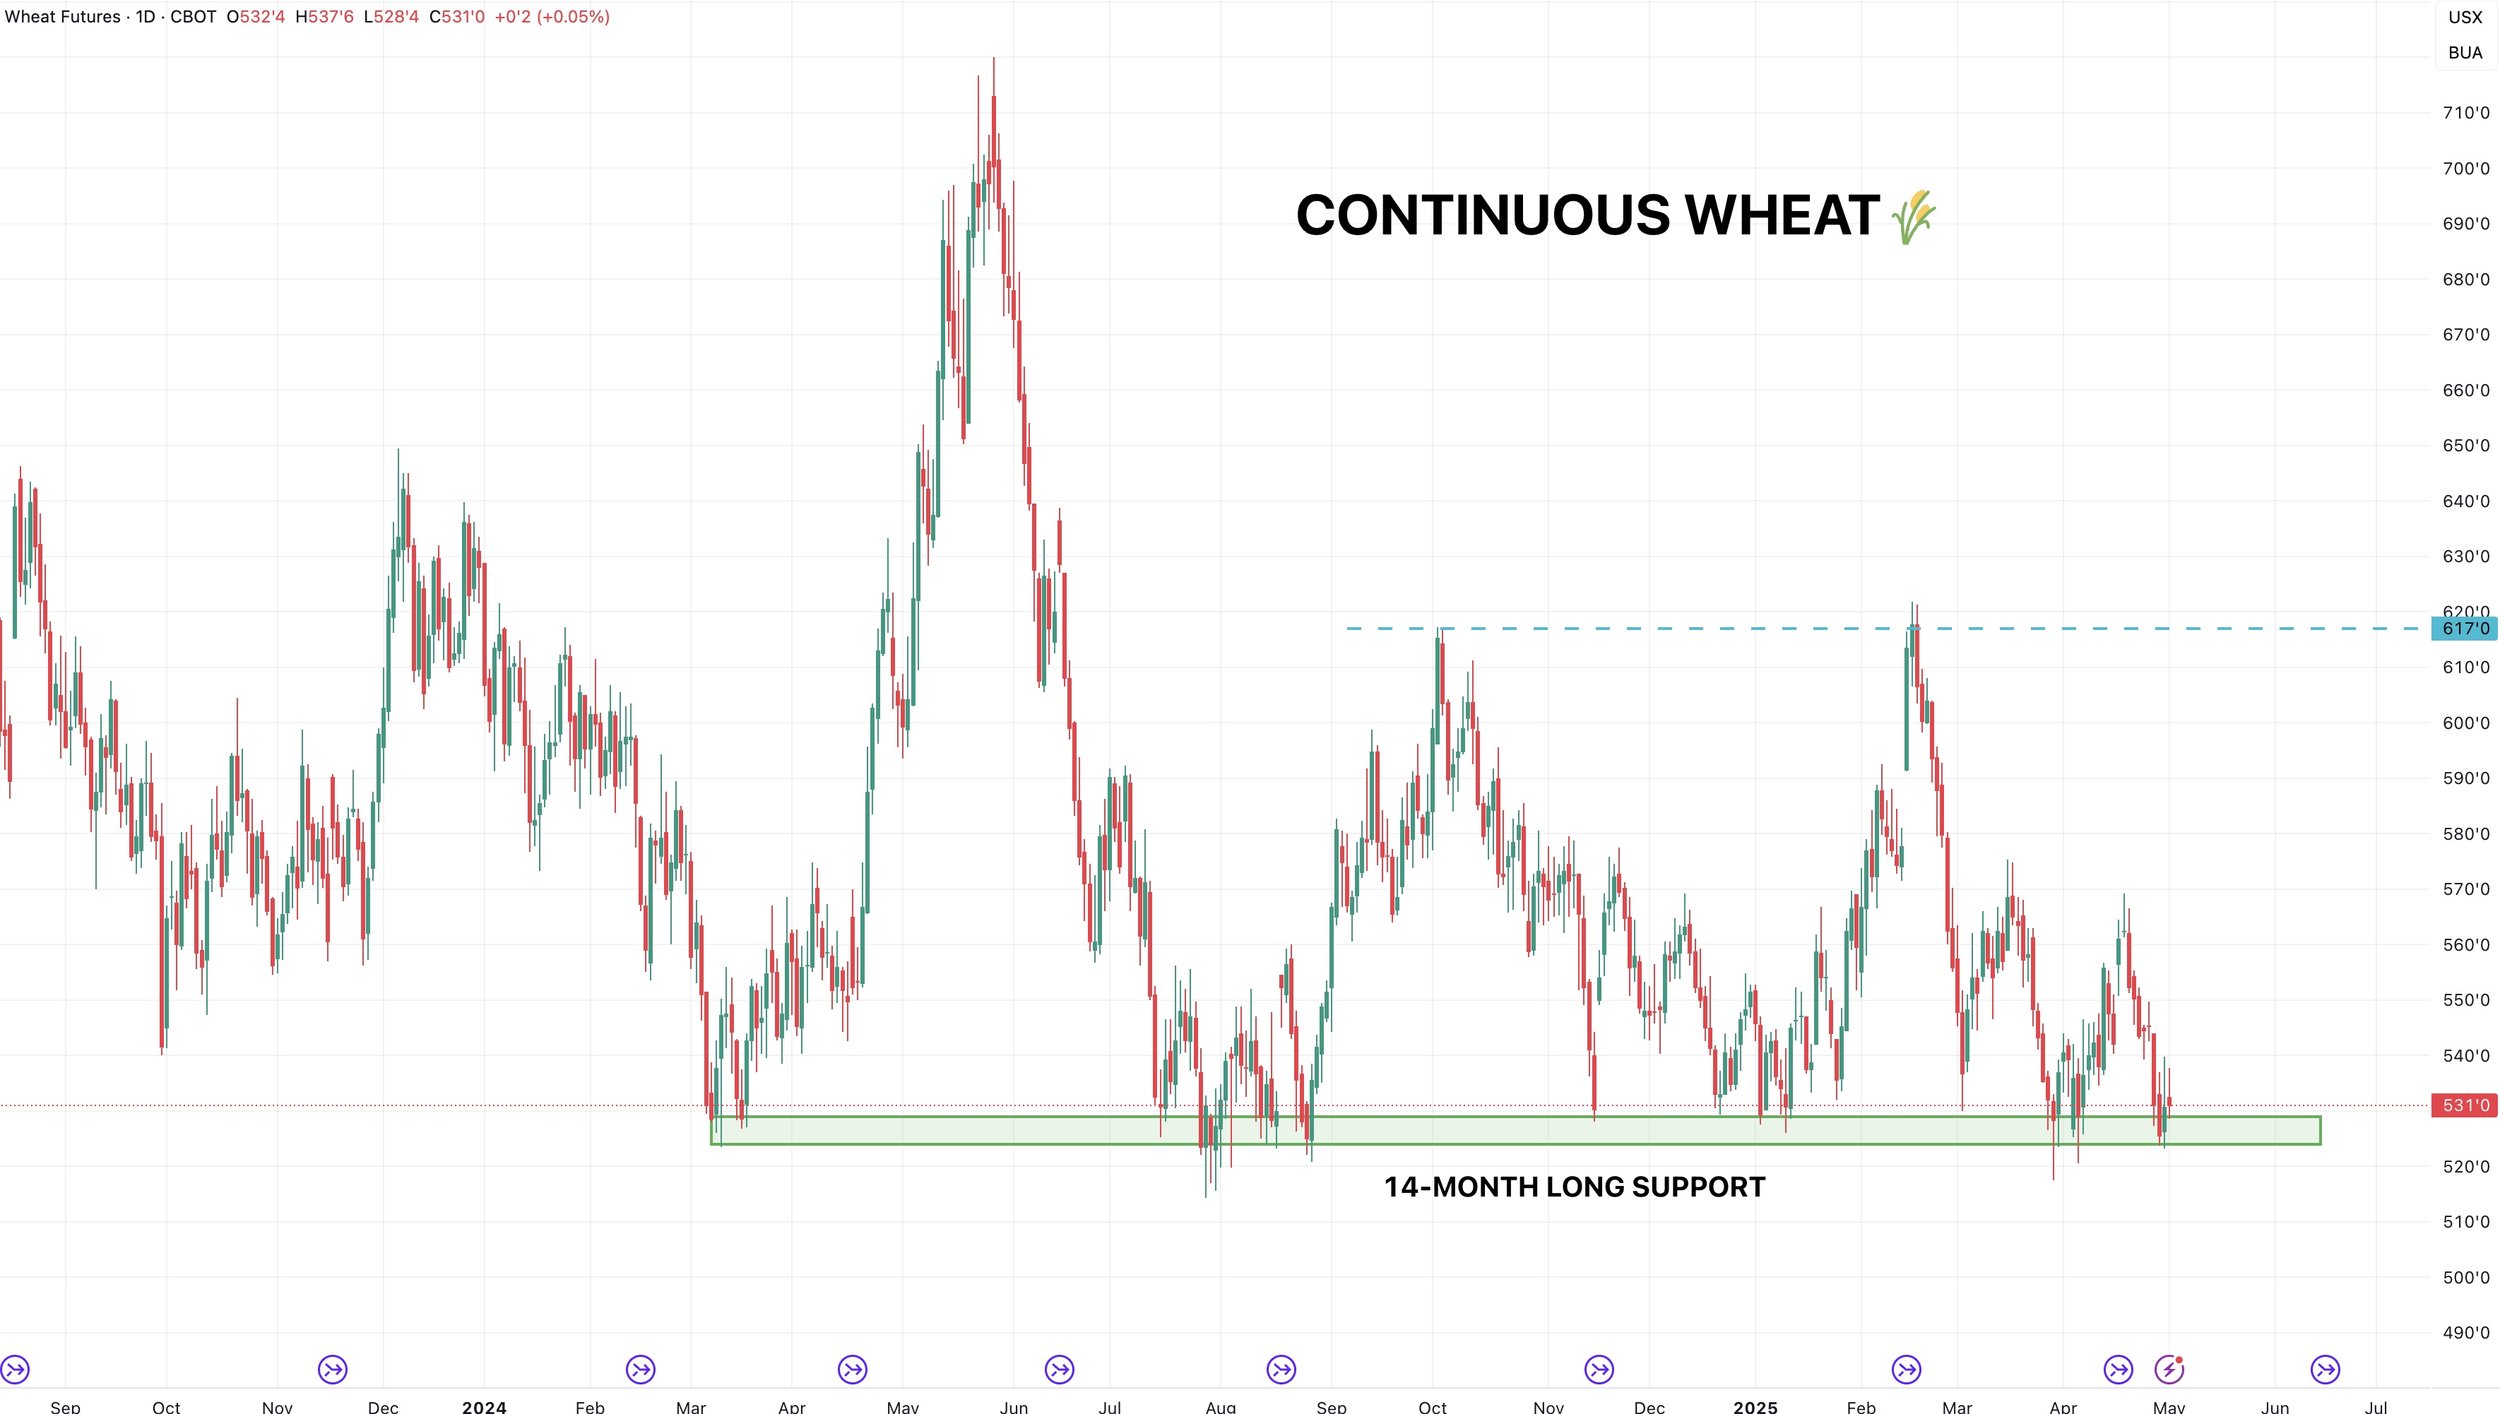
One of the only positive things to say about the wheat market is that despite contract lows in the July contracts, both the continuous charts for KC and Chicago wheat are sitting at very heavy support levels.
Continuous Chicago has held this support for 419 days.
A huge level bulls want to hold to avoid trying to catch a falling knife if it breaks.
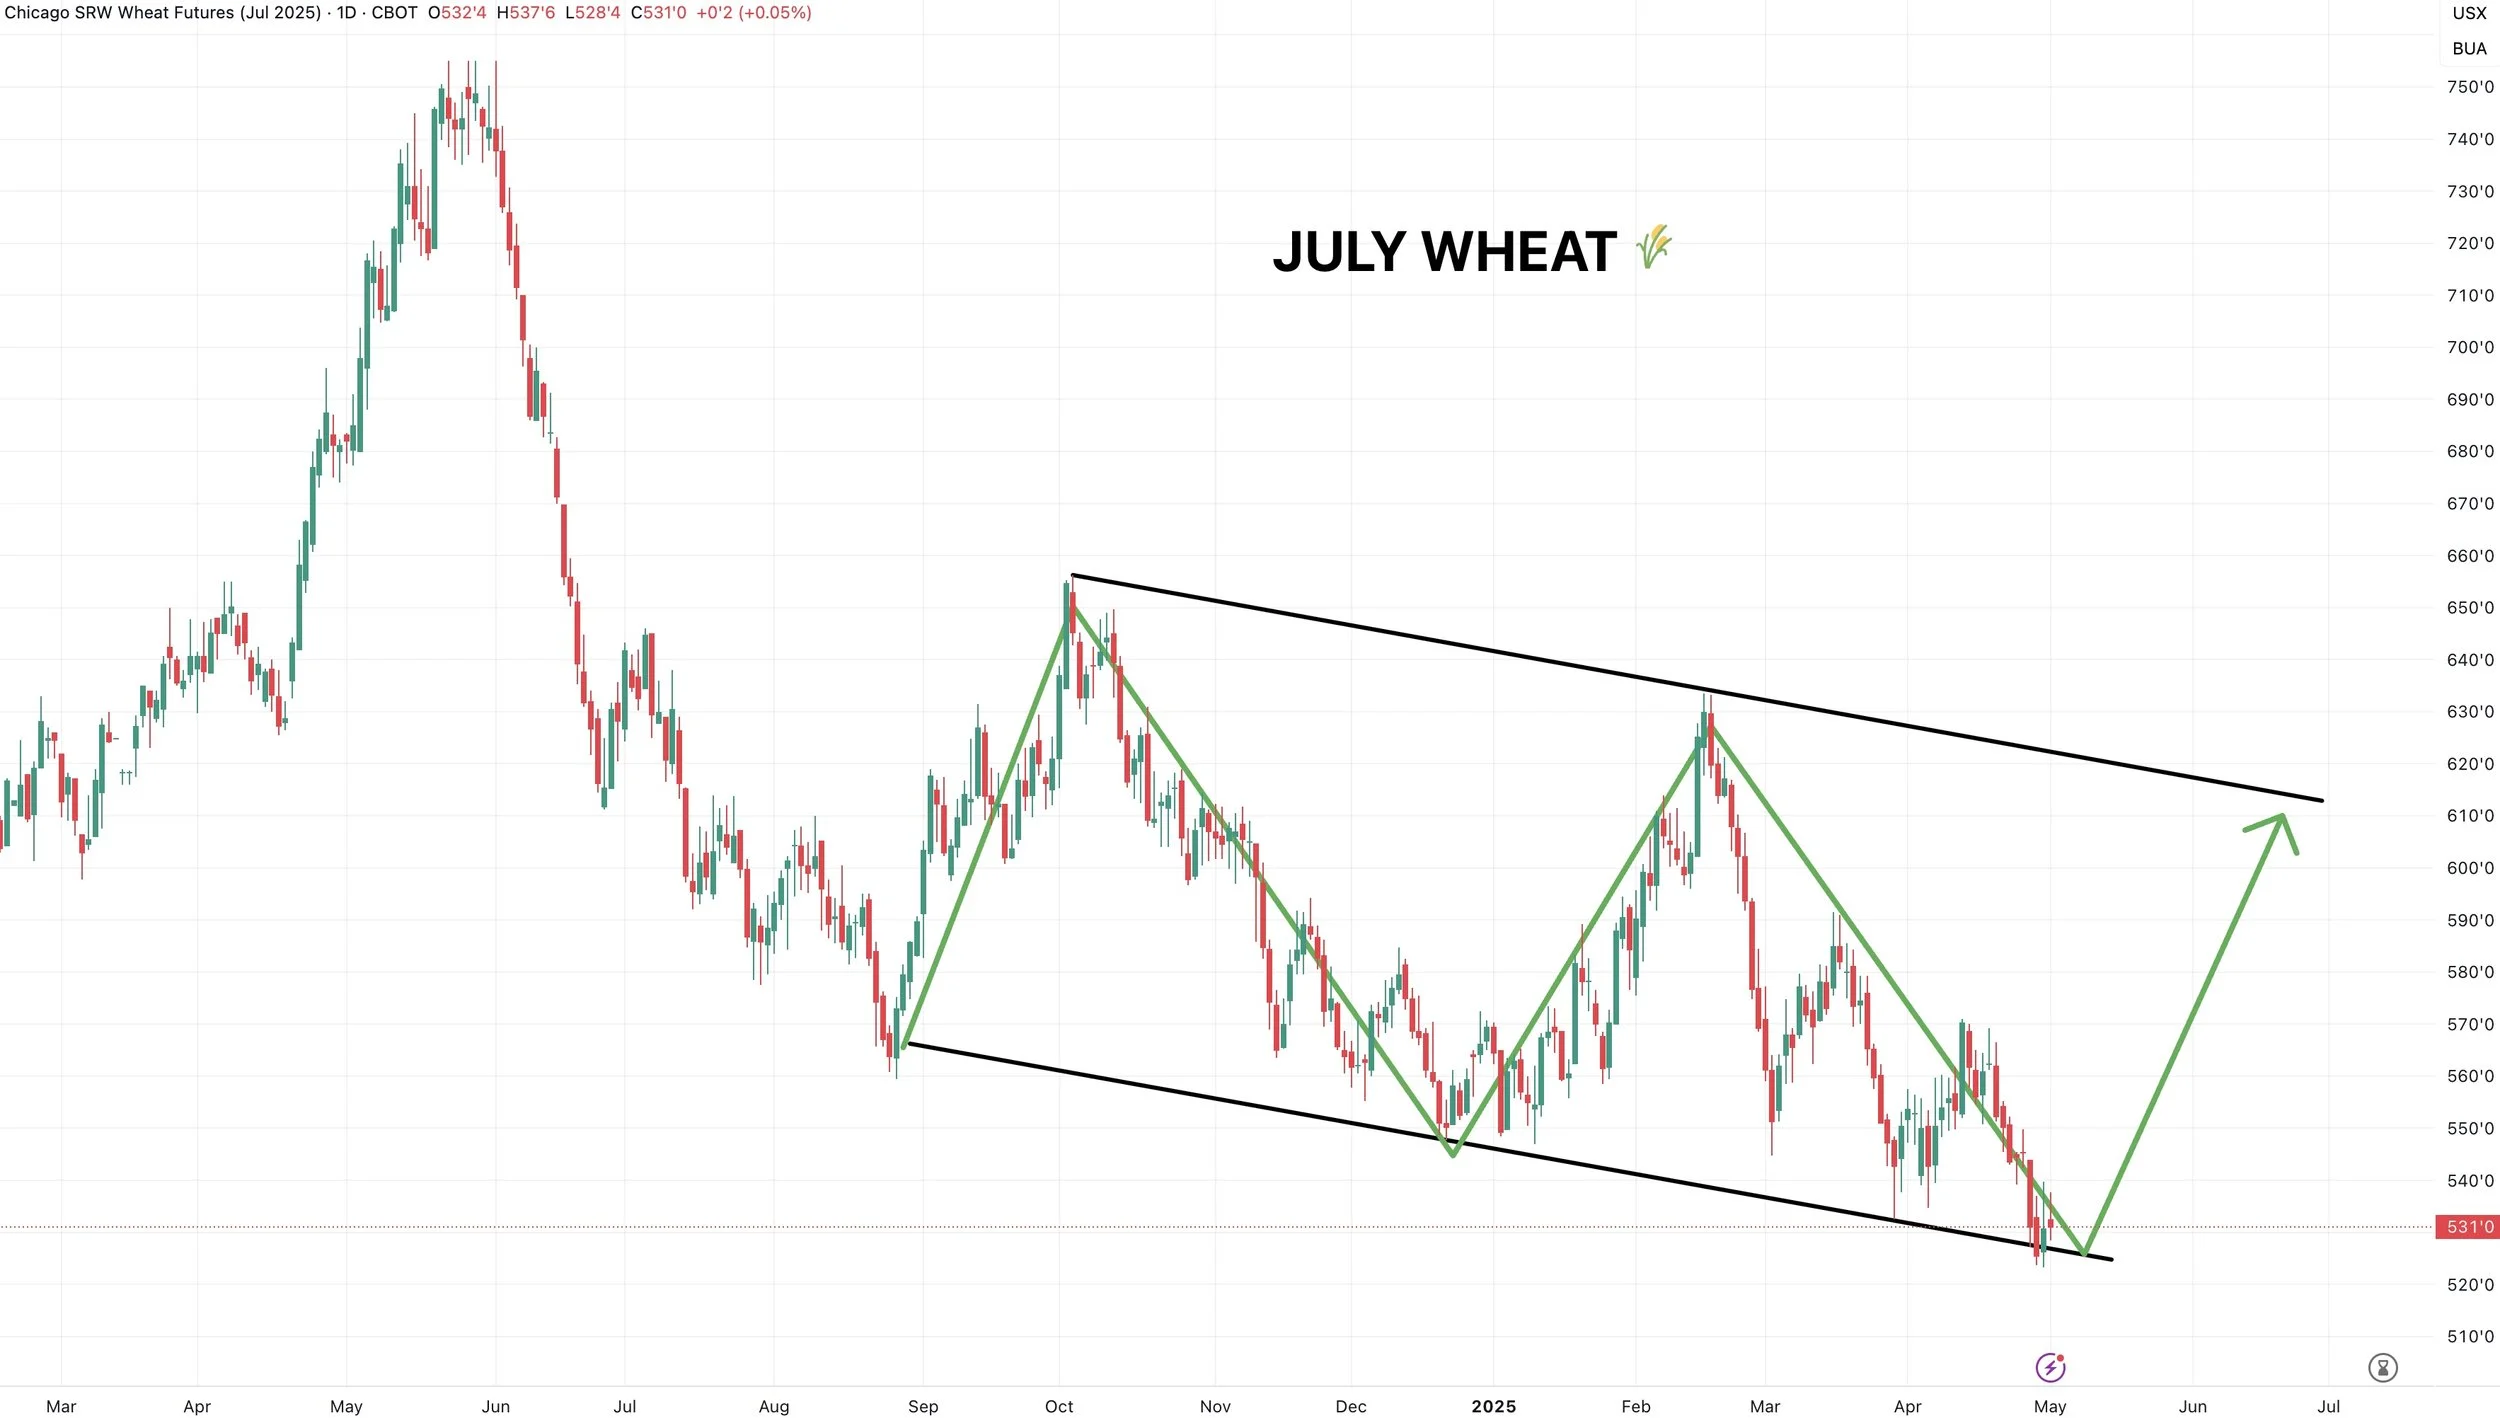
July Chicago is still managing to cling on to the bottom of this downward channel despite the contract lows.
Still don’t have any interest selling wheat until we get closer to the top of the channel.
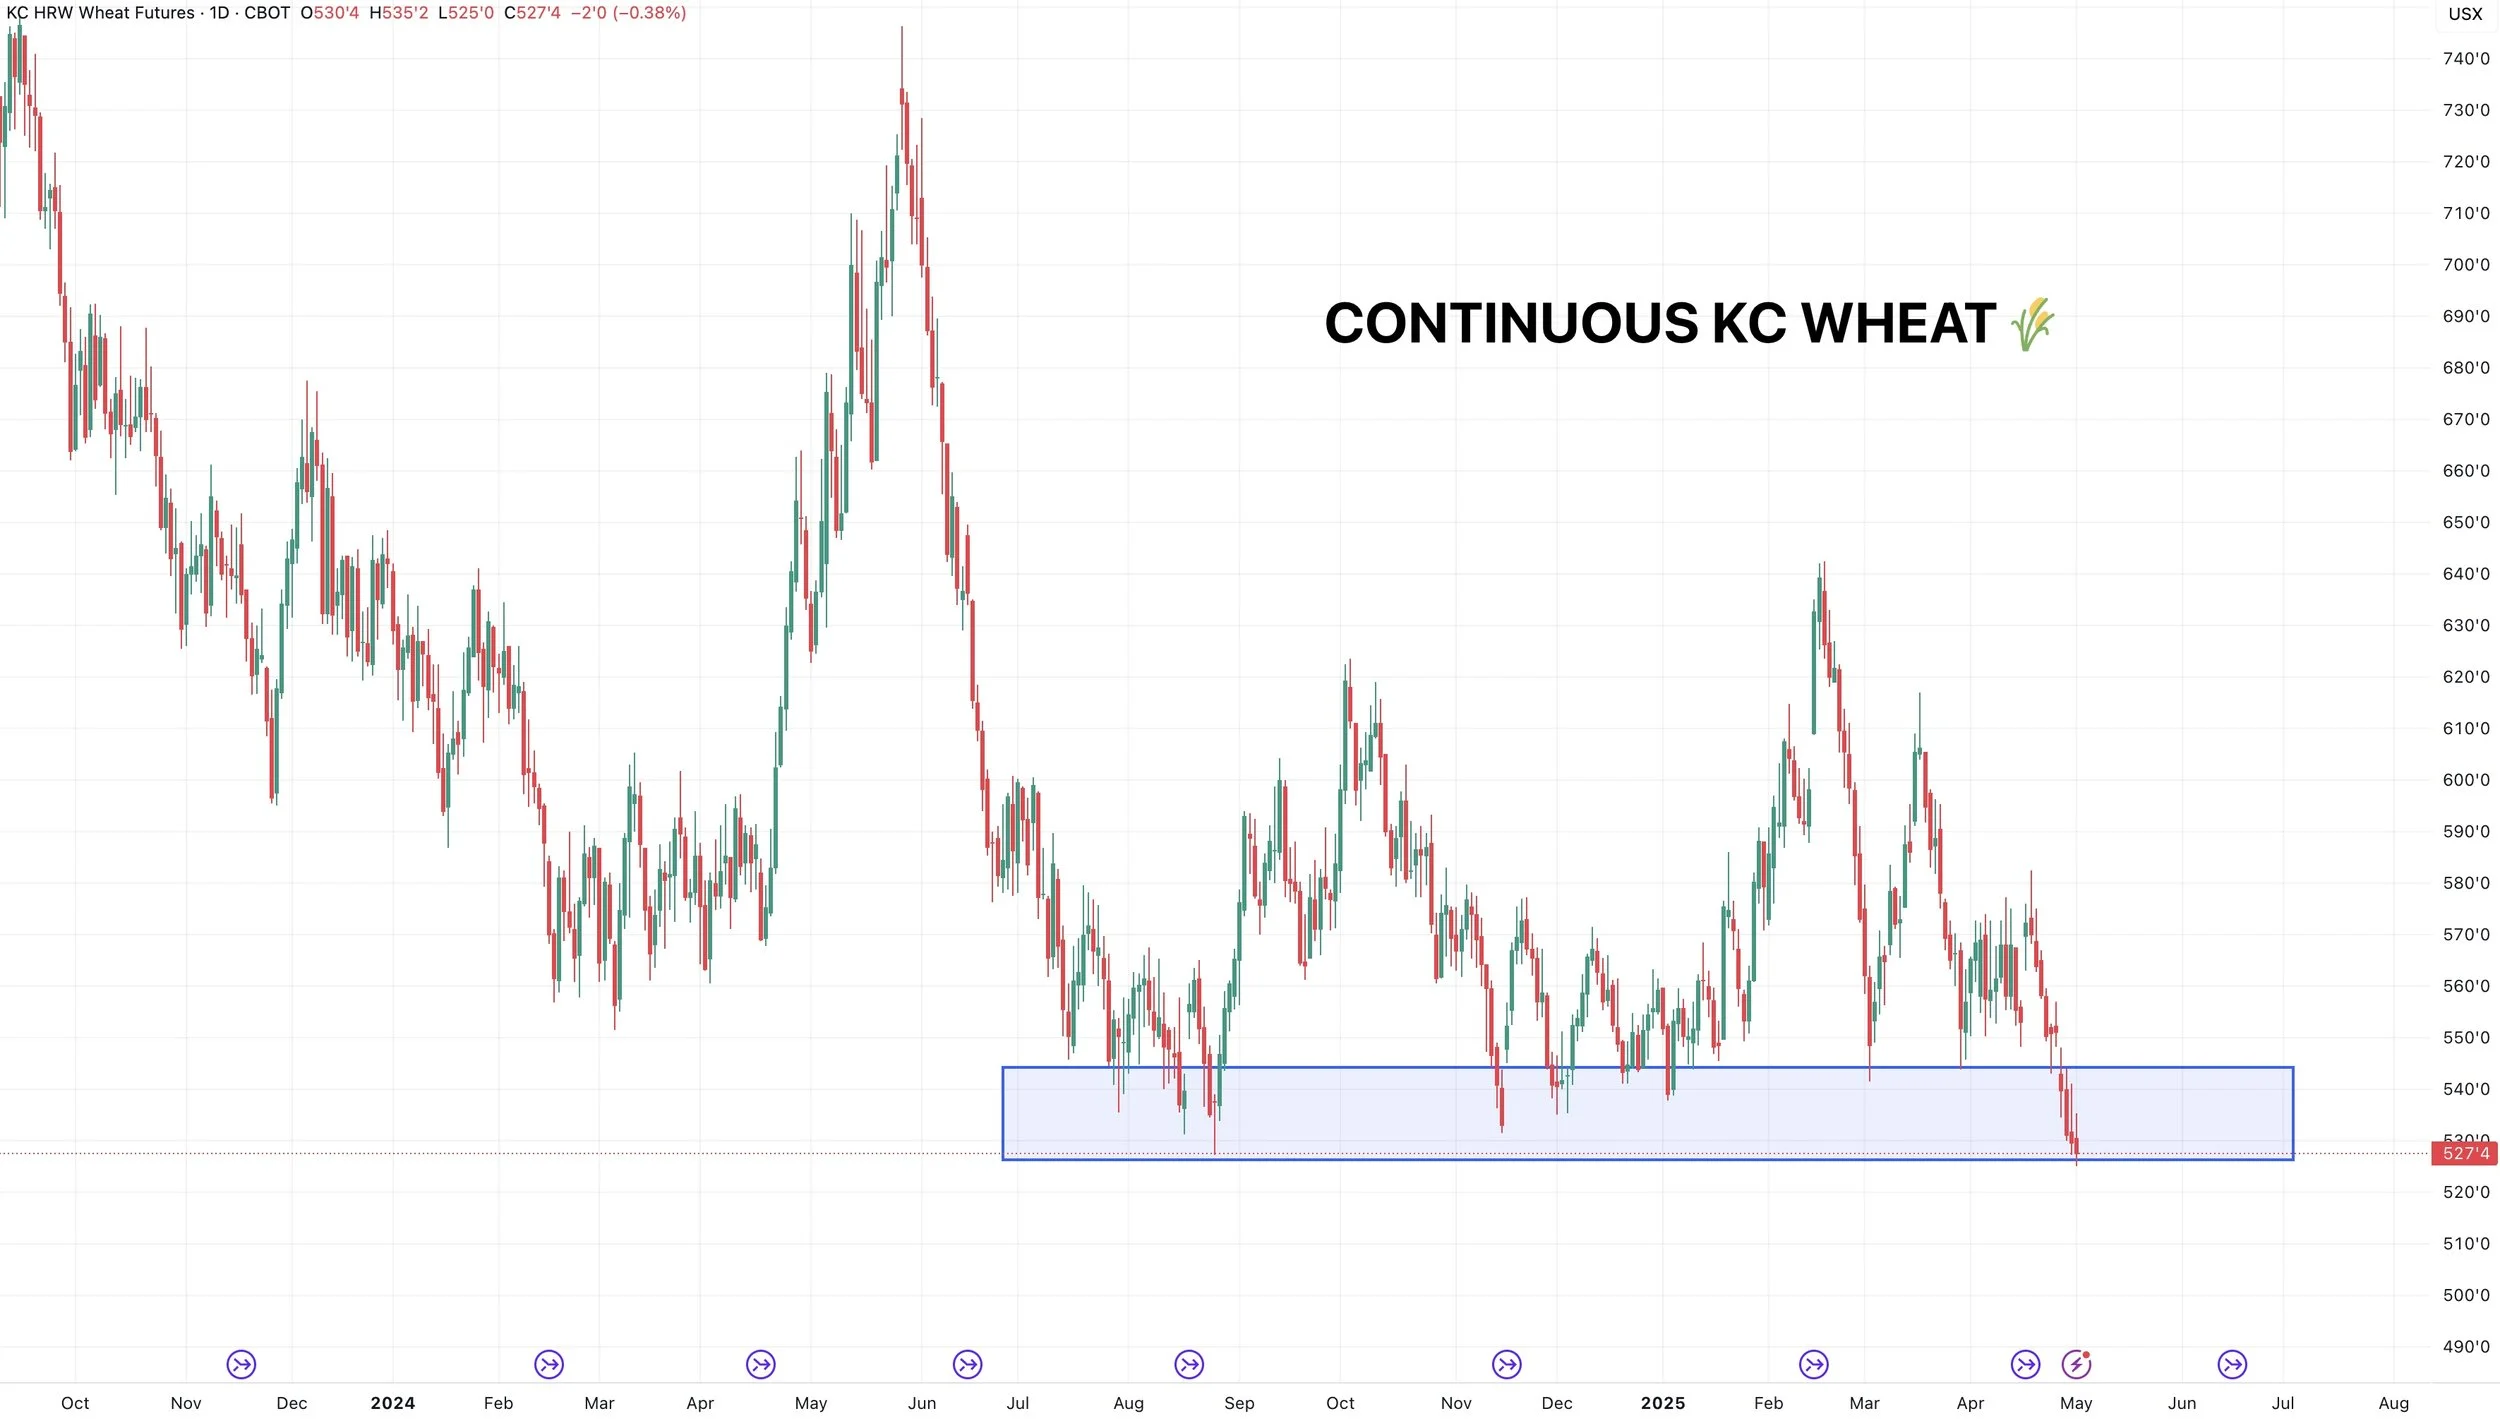
Here is continuous KC wheat.
Just like Chicago, we are at some major support bulls want to hold.
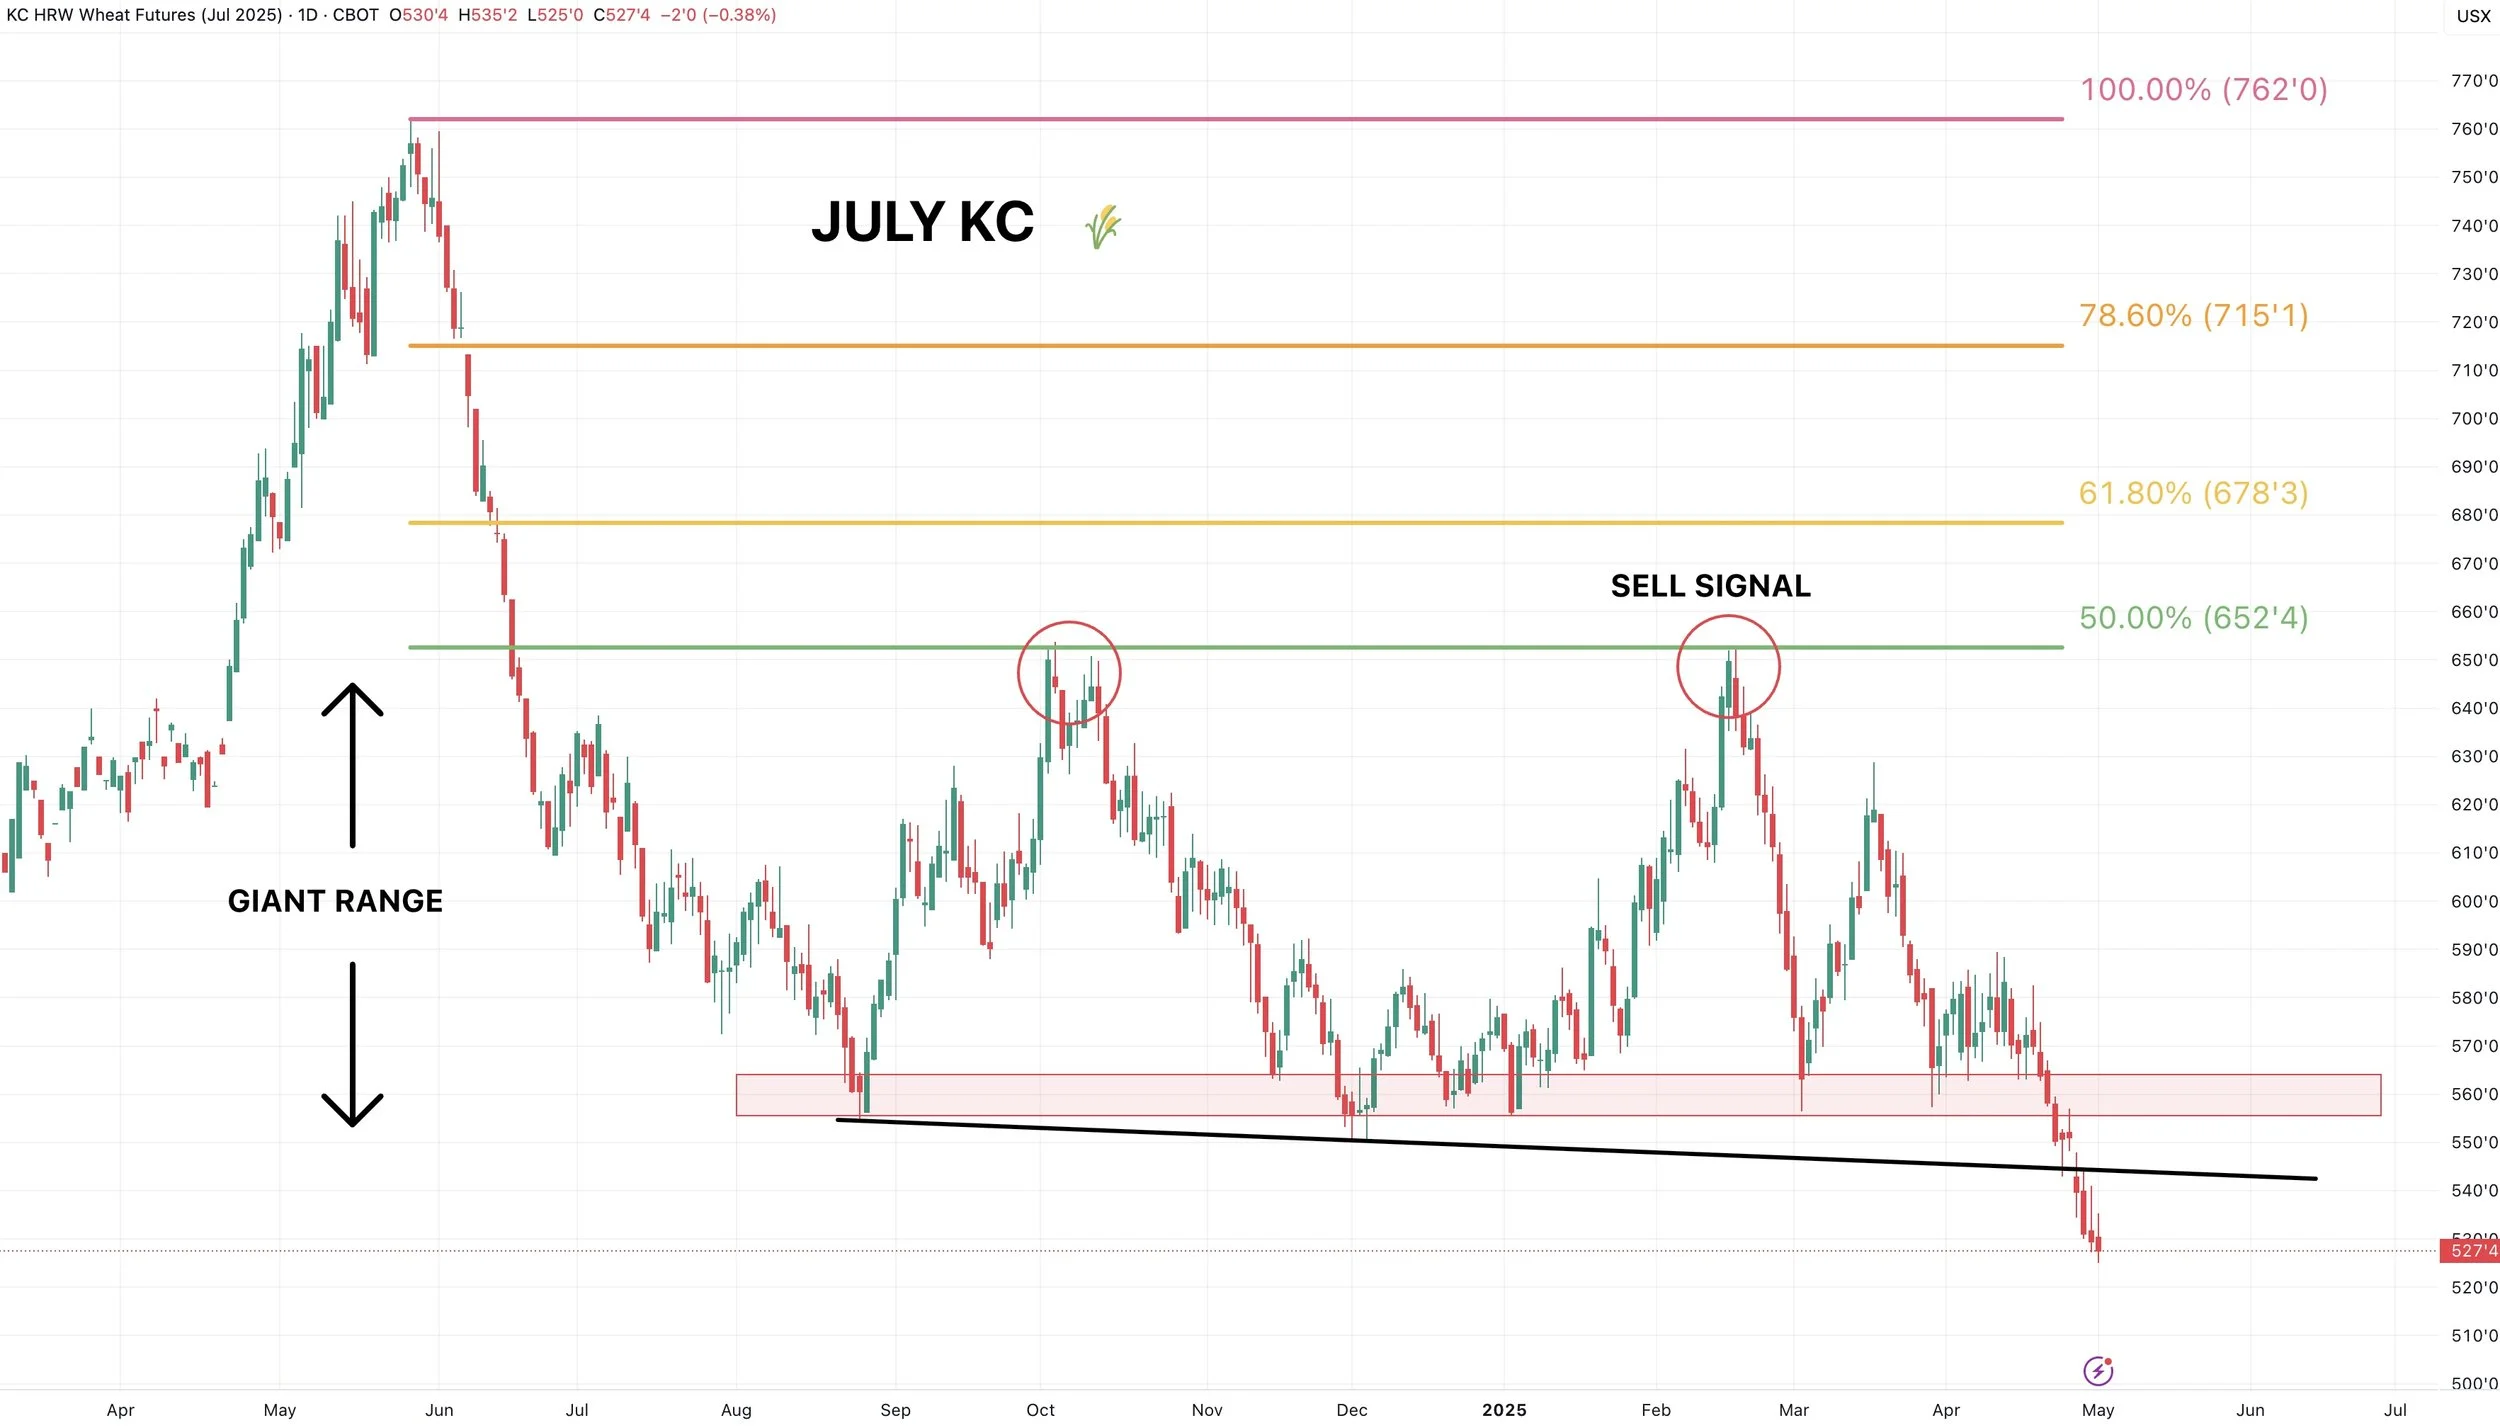
July KC wheat looks as ugly as it gets.
Would like to see us crawl back over the red box before even asking if we put in a bottom.
Past Sell or Protection Signals
We recently incorporated these. Here are our past signals.
April 10th: 🌽
Old crop corn sell signal.
March 19th: 🐮
Cattle hedge & sell signal.
Feb 18th: 🌽 🌾
Old crop KC wheat & old crop corn signal.
Jan 23rd: 🌽 🌱
Corn & beans old crop sell signal.
CLICK HERE TO VIEW
Jan 15th: 🌽 🌱
Corn & beans hedge alert/sell signal.
Jan 2nd: 🐮
Cattle hedge alert at new all-time highs & target.
Dec 11th: 🌽
Corn sell signal at $4.51 200-day MA
CLICK HERE TO VIEW
Oct 2nd: 🌾
Wheat sell signal at $6.12 target
Sep 30th: 🌽
Corn protection signal at $4.23-26
Sep 27th: 🌱
Soybean sell & protection signal at $10.65
Sep 13th: 🌾
Wheat sell signal at $5.98
May 22nd: 🌾
Wheat sell signal when wheat traded +$7.00
Want to Talk?
Our phones are open 24/7 for you guys if you ever need anything or want to discuss your operation.
Hedge Account
Interested in a hedge account? Use the link below to set up an account or shoot Jeremey a call at (605)295-3100.
Check Out Past Updates
4/30/25
APPROACHING KEY TIME PERIOD FOR GRAINS
4/29/25
PLANTING & FIRST NOTICE DAY PRESSURE. CORN CLOSE TO BOTTOM?
4/28/25
CAPTURING INVERSE & SEASONAL PREPARATION
4/25/25
HOW OFTEN DOES CORN NOT BREAK APRIL HIGHS?
4/24/25
KNOW WHEN TO SELL. BEANS BREAK 200-DAY FIRST TIME IN 483 DAYS
4/23/25
MONEY FLOW & DROUGHT CARDS
4/22/25
CRUCIAL SPOT FOR CORN & BEANS
4/21/25
NO PLANTING THREAT YET
4/18/25
POTENTIAL OPPORTUNITIES, BASIS CONTRACTS & STRATEGIES
4/16/25
HOW YIELD IMPACTS CARRYOUT. MAJOR SPOT FOR SOYBEANS
4/15/25
TOTAL CHART BREAKDOWNS & TARGETS
4/14/25
TECHNICAL SELLING IN GRAINS
4/11/25
SPECIFIC GRAIN MARKETING DECISIONS
4/10/25
USDA REPORT. HOW THIS IMPACTS CORN
4/9/25
TARIFFS GIVE. TARIFFS TAKE
4/8/25
CORN’S DIVERGING STRENGTH
4/7/25
SOLID PRICE ACTION DESPITE OUTSIDE FEAR
4/4/25
CORN PRICE ACTION SPEAKS VOLUME. ANY HOPE LEFT FOR SOYBEANS?
4/3/25
WHAT IS LEFT FOR CORN BEARS? TRADE WAR: CHARTS HOLDING SUPPORT
4/2/25
SHOULD UNKNOWNS KEEP A FLOOR UNDER GRAIN PRICES?
4/1/25
HOW DO ACRES IMPACT FUTURE OF THE GRAINS?
3/31/25
USDA REPORT: NOW WHAT?
3/28/25
ALL EYES ON USDA
3/27/25
PRE-USDA POSITIONING. DON’T GIVE GRAIN AWAY
3/26/25
HISTORY OF MARCH INTENTIONS. SOYBEANS UNDERVALUED?
3/25/25
6 DAYS UNTIL MAJOR USDA REPORT
3/24/25
HOW TO POSITION YOURSELF BEFORE PLANTING
3/21/25
REASONS TO BE OPTIMISTIC IN GRAINS?
3/20/25
WAS THAT THE BOTTOM IN CORN?
3/19/25
THE PATH HIGHER & THE DOWNSIDE RISKS IN GRAINS
3/18/25
SEASONALS, CATTLE HEDGE, CHARTS & DROUGHT?
3/17/25
WHEAT RALLIES. DON’T GET BACKED INTO A CORNER
3/14/25
MARCH 31ST REPORT THOUGHTS & WHAT’S NEXT FOR GRAINS
3/13/25
EXPLAINING RE-OWNERSHIP VS COURAGE CALLS
3/12/25
TARIFF FEARS. EU, CANADA, & ETHANOL
3/11/25
USDA SNOOZE. RECORD FUND SELLING A CONCERN?
3/10/25
USDA TOMORROW. GETTING COMFORTABLE IN MARKETING
3/7/25
HOW TIGHT IS THE WORLD & US SITUATION?
3/6/25
TARIFFS PUSHED BACK. FUTURE OPPORTUNITIES?
3/5/25
IS GRAINS BIGGEST RISK WEAK CRUDE & DEFLATION?
3/4/25
TRADE WAR BEGINS. 8TH DAY OF PAIN FOR GRAINS
3/3/25
TARIFFS ON TOMORROW. BUY SIGNAL
3/3/25
BUY SIGNAL
2/28/25
WHEN WILL THE BLEEDING STOP?
2/27/25
CORN AT CRITICAL SPOT. USDA ACRE REPORT. WAY TOO EARLY DROUGHT TALK
2/26/25
HISTORY SUGGESTS CORN TOP ISN’T IN? ACRE OUTLOOK TOMORROW
2/25/25
POSITIVE CLOSE. WHAT TO KNOW ABOUT USDA OUTLOOK
2/24/25
USDA OUTLOOK, FIRST NOTICE DAY & BRAZIL
2/21/25
WHAT TO EXPECT MOVING FORWARD IN GRAINS
2/20/25
FIRST NOTICE DAY CONCERNS. MASSIVE CORN ACRES OR NOT?
2/19/25
HOW TIGHT IS THE CORN SITUATION?
2/18/25
MORE DETAILS ON TODAYS SELL SIGNAL
2/18/25
OLD CROP KC WHEAT & CORN SELL SIGNAL
2/14/25
WHEAT BREAKING OUT ON WEATHER RISK. TECHNICALS & FUNDAMENTALS
2/12/25
GLOBAL GRAIN SITUATION, ACRE TALK, CHARTS & MORE
2/11/25
USDA: NOT A BEARISH REPORT. DISAPPOINTING PRICE ACTION
2/10/25
USDA TOMORROW. LONG TERM PATH FOR SUB 10% CORN STOCKS TO USE?
2/7/25
WHY WOULD THE FUNDS EXIT THEIR LONGS?
2/6/25
WHEAT FINALLY CATCHING A BID
2/5/25
COMPLETE THOUGHTS ON MARKETS: BACK & FORTH DISCUSSION
2/4/25
STRONG JANUARY LEAD TO STRONG YEAR? TARIFFS, CHARTS & MORE
2/3/25
TARIFFS PUSHED BACK
1/31/25
TARIFF NEWS ALL OVER THE PLACE. ARE YOU PREPARED FOR POSSIBILITIES?
1/30/25
WHEAT BULL ARGUMENT. TRUMP ADDS TARIFFS
1/29/25
CORN APPROACHES $5.00
1/28/25
TARIFFS, CORN FUNDS, SOUTH AMERICA & MORE
1/27/25
HEALTHY CORRECTION WE TALKED ABOUT & TARIFF NEWS
1/24/25
GRAINS DUE FOR SHORT TERM CORRECTION?
1/23/25
OUR ENTIRE NEW CROP SALES THOUGHTS & OLD CROP SELL SIGNAL
1/22/25
GRAINS TAKE A BREATHER. IS CORN IN A BULL OR BEAR MARKET?
1/21/25
HUGE DAY IN GRAINS. WHAT TO DO WITH OLD CROP VS NEW CROP
Read More
1/20/25
VIDEO CHART UPDATE
1/17/25
TRUMP, CHINA, ARGY & USING THE SPREADS INVERSE
1/16/25
OLD CROP LEADS US LOWER. MARKETING THOUGHTS
1/15/25
SIGNAL & HEDGE ALERT QUESTIONS EXPLAINED. IS $6 CORN EVEN POSSIBLE?
1/14/25
MORE DETAILS ON TODAYS HEDGE ALERT & SELL SIGNAL
1/14/25
CORN & SOYBEANS HEDGE ALERT/SELL SIGNAL
1/13/25
USDA GAME CHANGER OR NOT?
1/10/25
BULLISH USDA FOR CORN & BEANS
1/9/25
USDA OUT TOMORROW
1/8/25
2 DAYS UNTIL USDA. BE PREPARED
1/7/25
THE HISTORY OF THE JAN USDA & MORE
1/6/25
MAJOR USDA REPORT FRIDAY
Read More
1/3/25
UGLY DAY ACROSS THE GRAINS
1/2/25