
BEANS HAMMERED ON RUMOR & WHEAT FINDING LIFE
MARKET UPDATE
You can scroll to read the usual update as well. As the written version is the exact same as the video.
Timestamps for video:
Overview: 0:00min
Corn: 1:30min
Beans: 6:00min
Wheat: 10:20min
Want to talk about your situation?
(605)295-3100
Futures Prices Close

Overview
Wheat continues to find some life while the soybean market got hammered today as soybean oil was limit down on some RVO rumors.
Why did soybeans & soy oil sell off so hard?
Lee Zeldin, the EPA's leader, said that new rules for mixing bio fuels into fuel (known as RVOs) would be set in "the next few months".

2 Reasons for the Sell Off:
1) Traders had been expecting these rules sooner
2) Traders were hoping for higher biofuel amounts
But now we have a delay to go along with rumors of lower targets. So this sparked an immediate sell off in the market.
As rumors popped up that the 2026 D4 mandate could come in at 4.65 billion gallons, while most in the industry were expecting a number closer to 5.5-6 billion. Again, just a rumor.
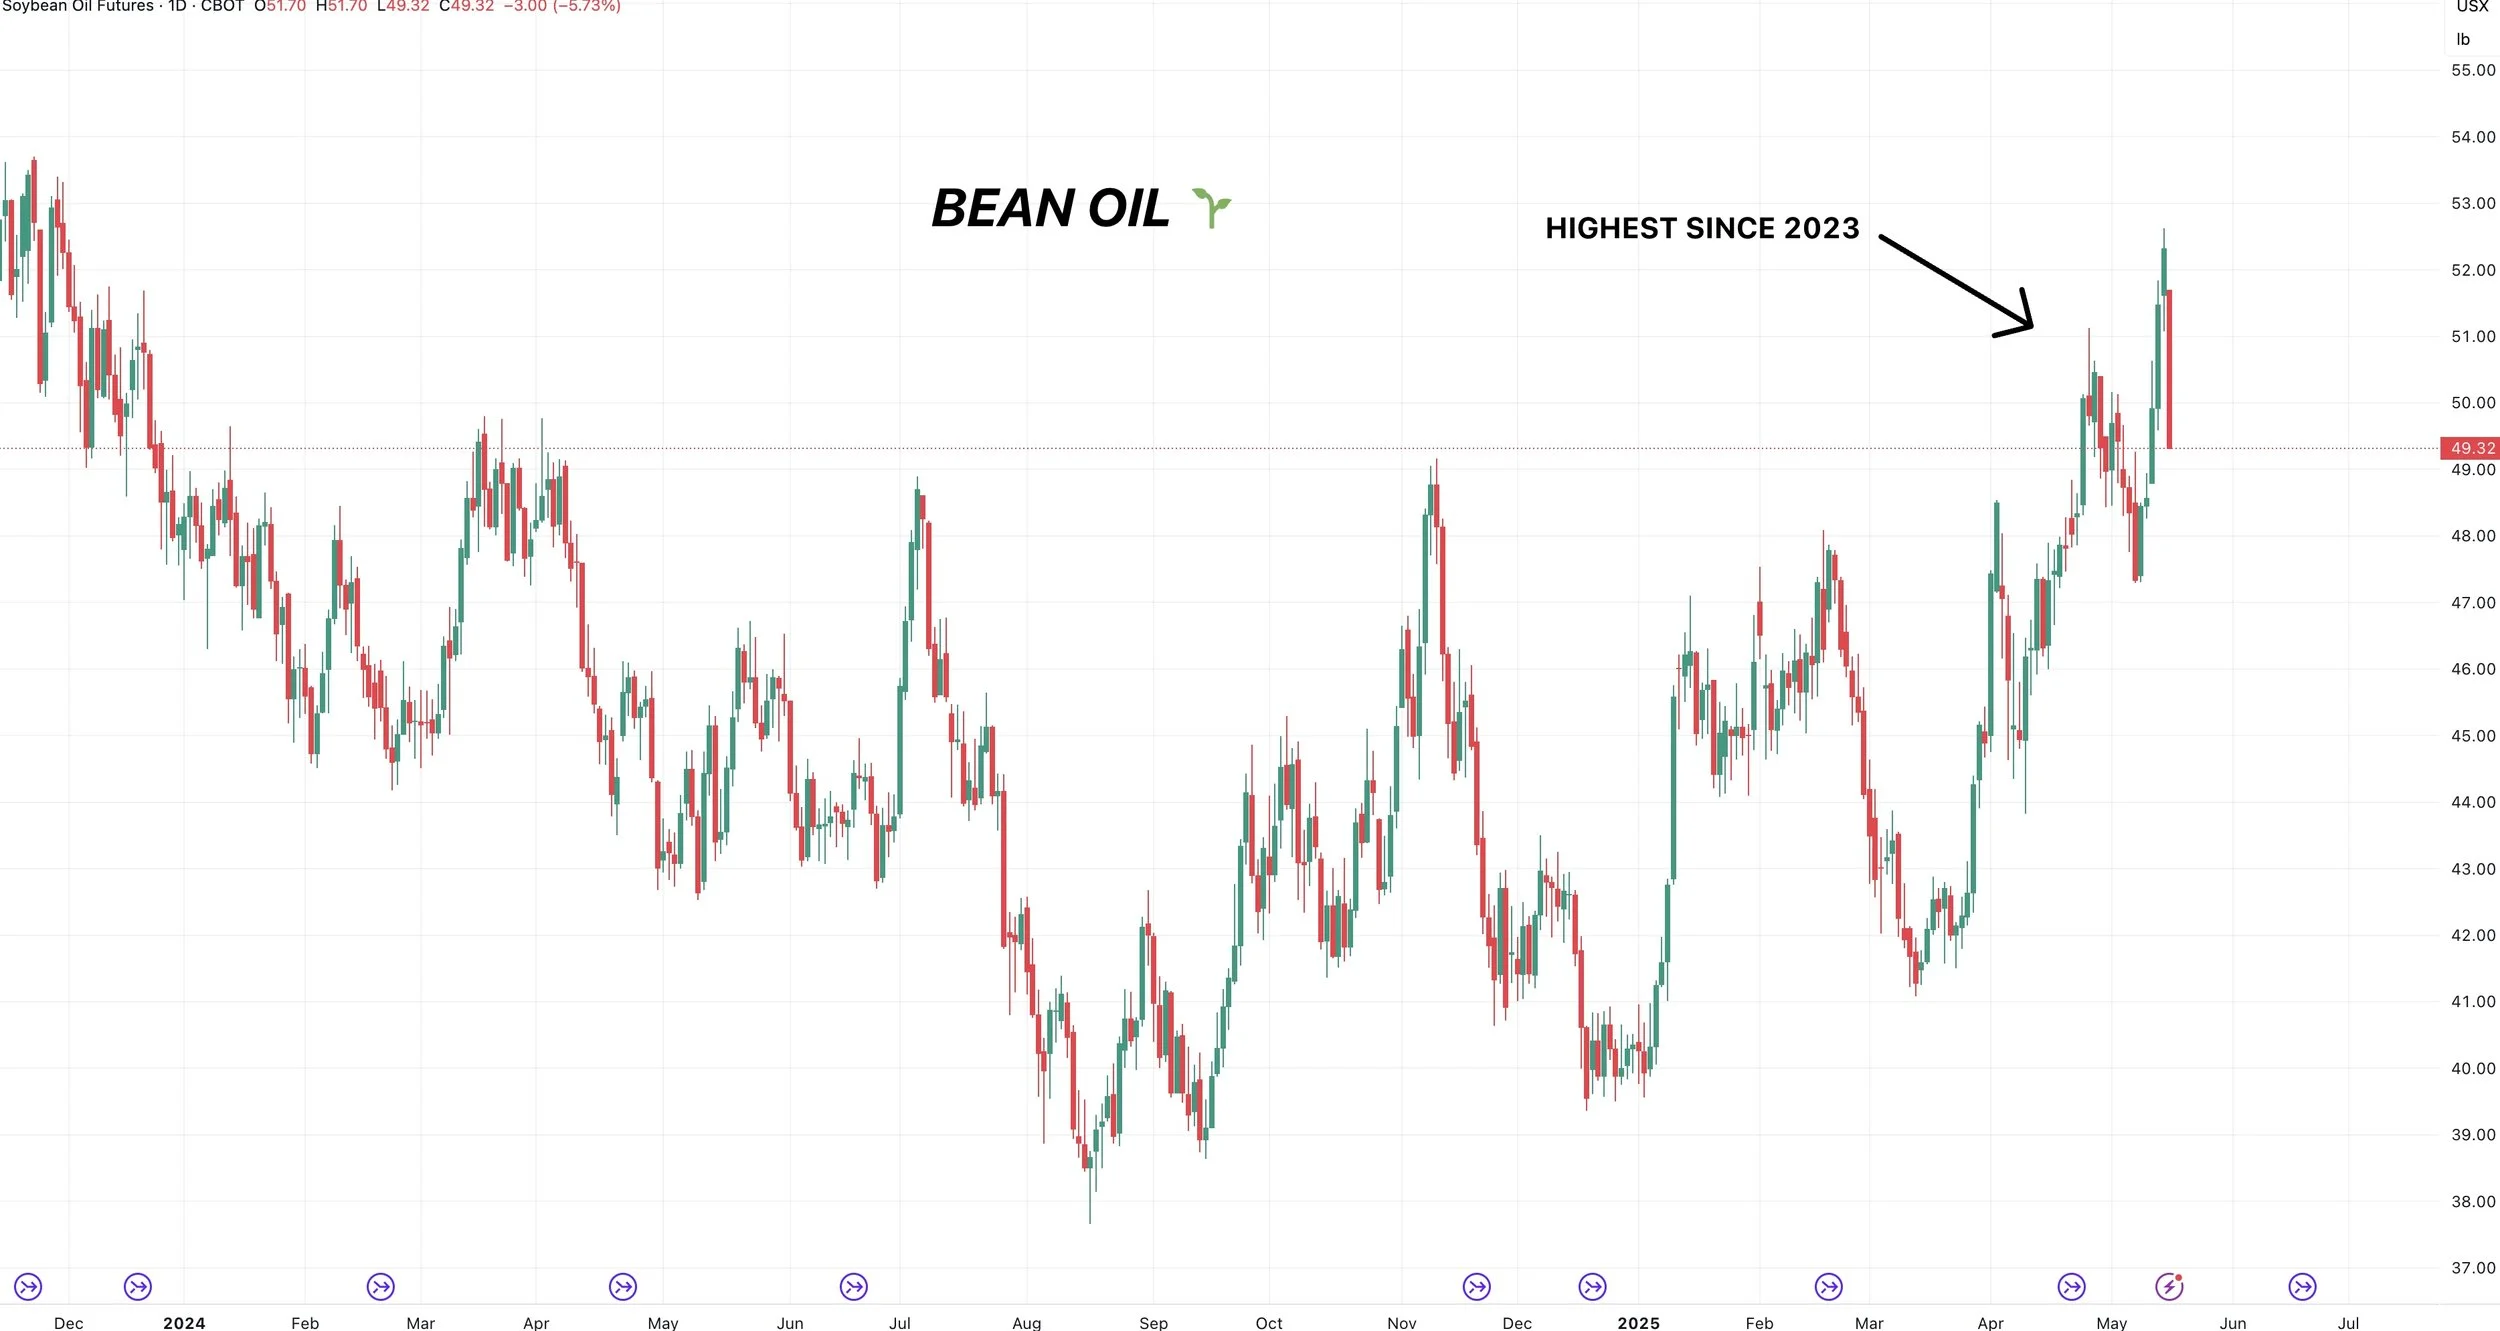
Soybeans and soybean oil had been seeing some support from optimism surrounding policies. Hence why we had seen the soybean oil market recently rally to it's highest levels since 2023.
In simple terms, soybean oil dropped because it is used to make biofuel. Less biofuel demand = less need for soybean oil. Soybeans fell because they are used to make soybean oil.
This news led to soybean oil being locked limit down today, down nearly -6%.
Todays Main Takeaways
Corn
Fundamentals
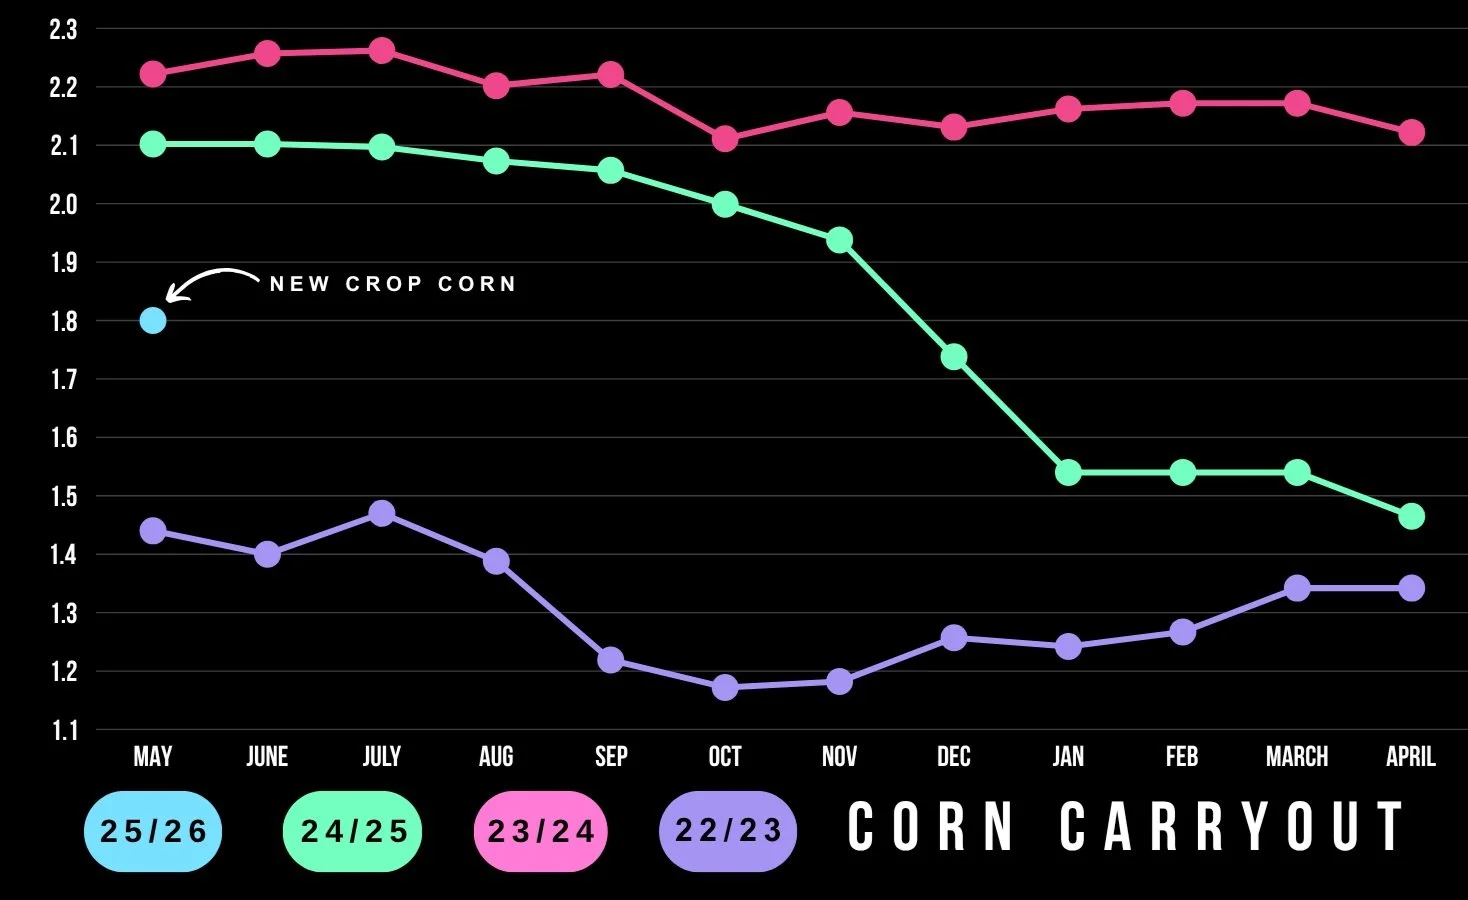
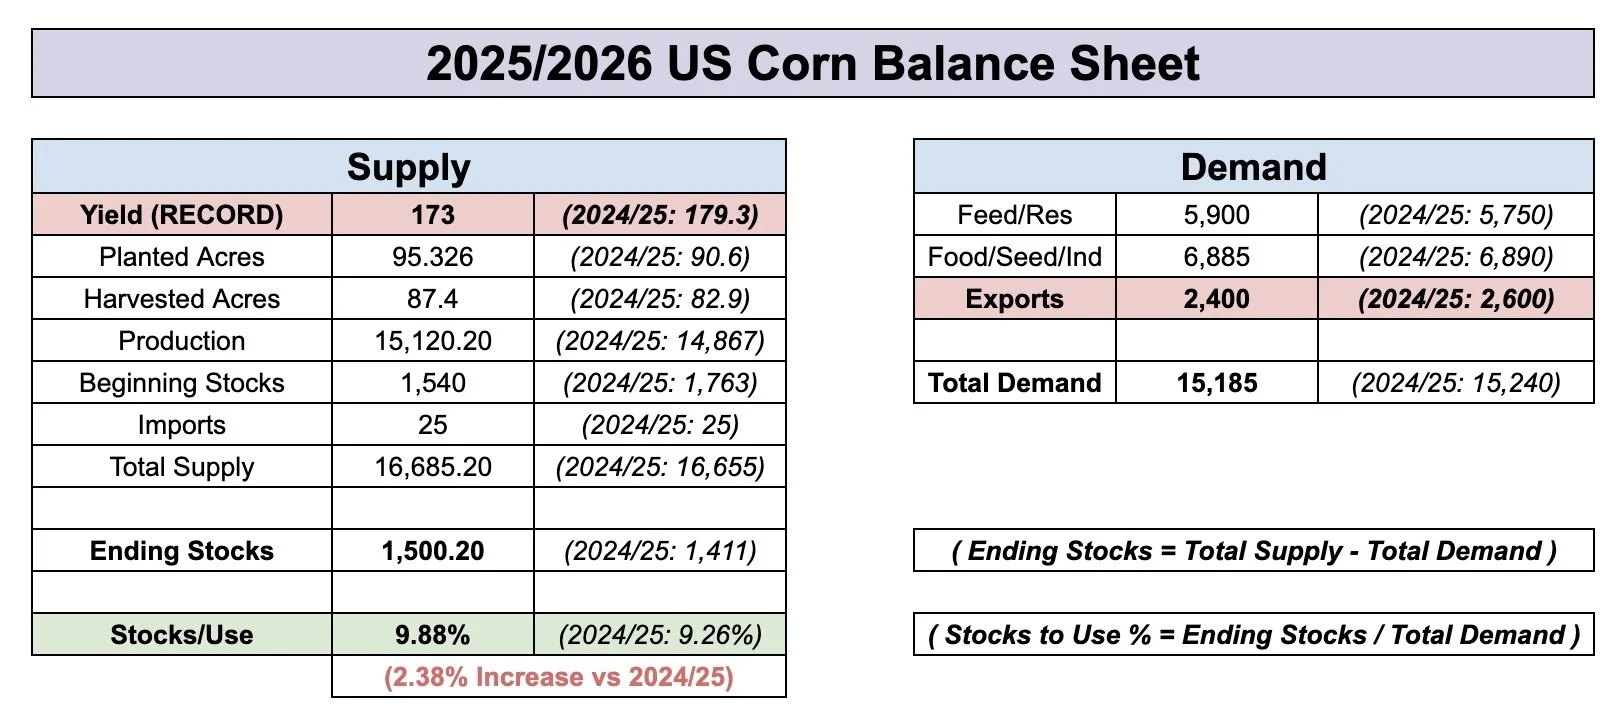
We have the tightest starting carryout for new crop corn in 3 years.
On one hand, this gives us an easier path lower in comparison.
Often times we will see our highest carryout print of the year in the initial estimates as it of course usually uses a large trendline yield.
On the other hand, to get this carryout the USDA gave us a big demand number (Exports estimated at 2,675 million bu vs 2,600 for old crop).
So once they realize yield probably isn’t 181 bpa, they likely start to cut back on these export estimates.
But, the good news is that to ration demand lower, usually prices go higher first on a supply rally.
The bad news is that a supply rally doesn’t last long like a demand driven one does.
So a bit of a double edged sword. But starting the marketing year at a 1.8 billion bu carryout is a lot more bullish than starting off with a 2.2 billion one.
Short term there isn’t a ton to get excited about in the corn market.
As the market will need some weather premium to move substantially higher. As of right now, there is no risk short term.
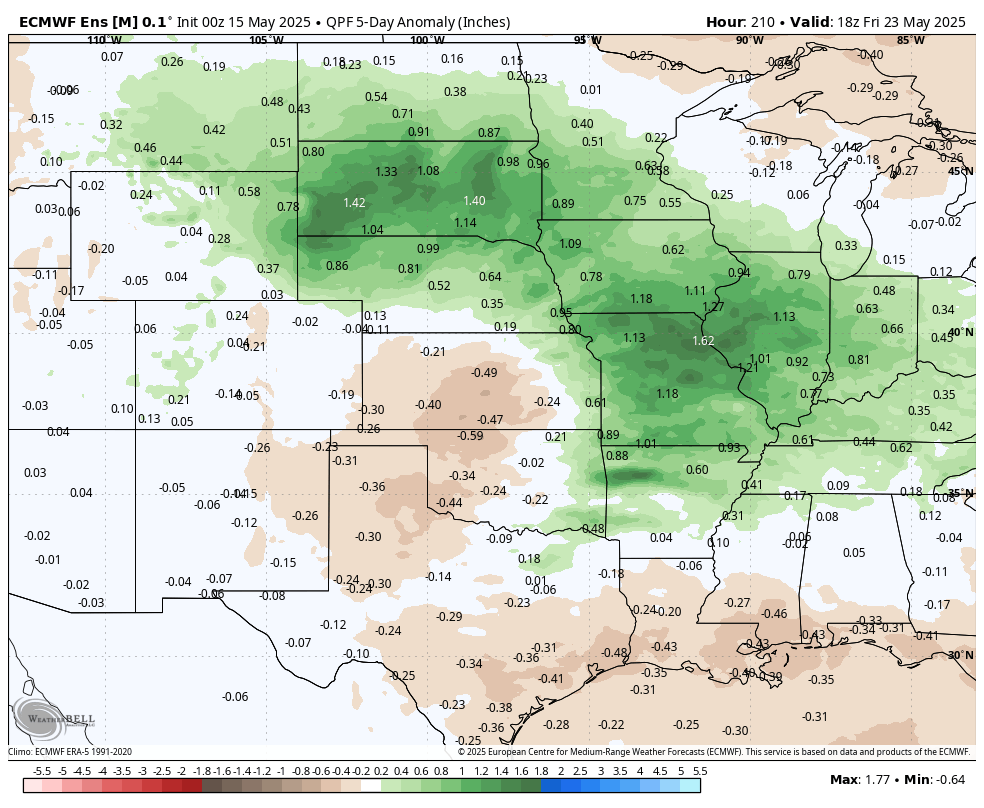
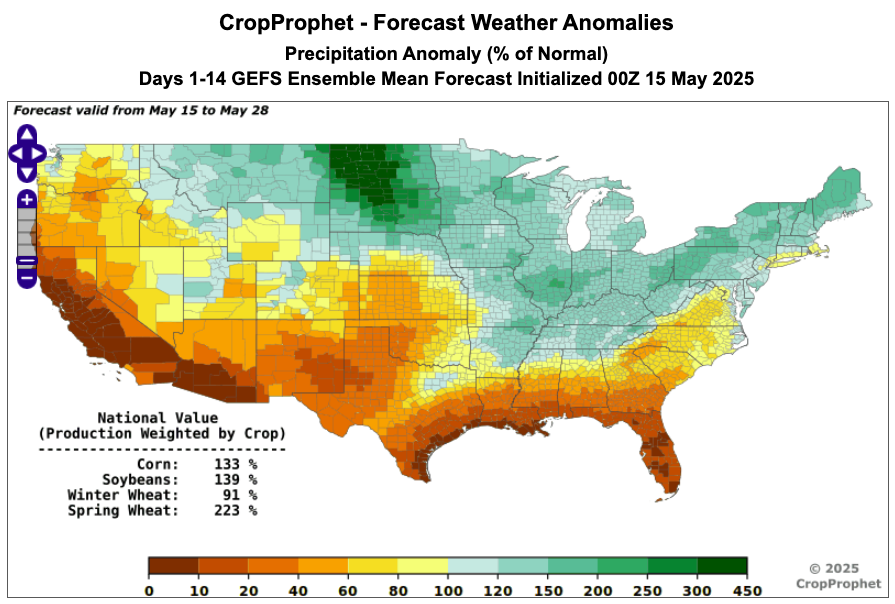
Below is the next 8-14 days of rain.
We already have the vast majority of this crop in the ground, now we are going to be seeing decent rains across most of the corn belt. So this is bearish.
From Empire Weather
From Crop Prophet
Does this mean we still can’t have a "weather scare"?
No of course not. It's the middle of May and we still have a long ways to go before this crop is made.
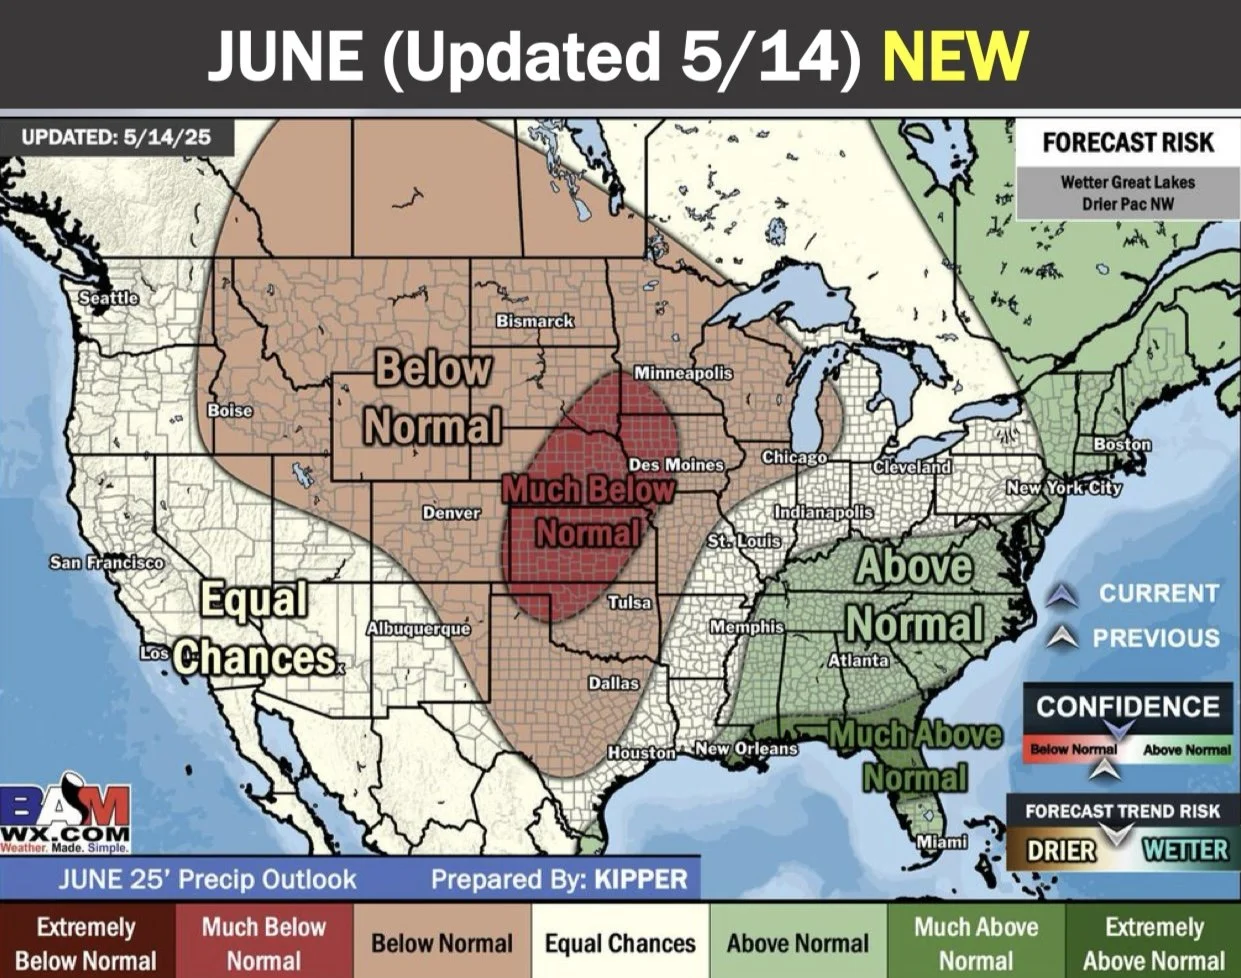
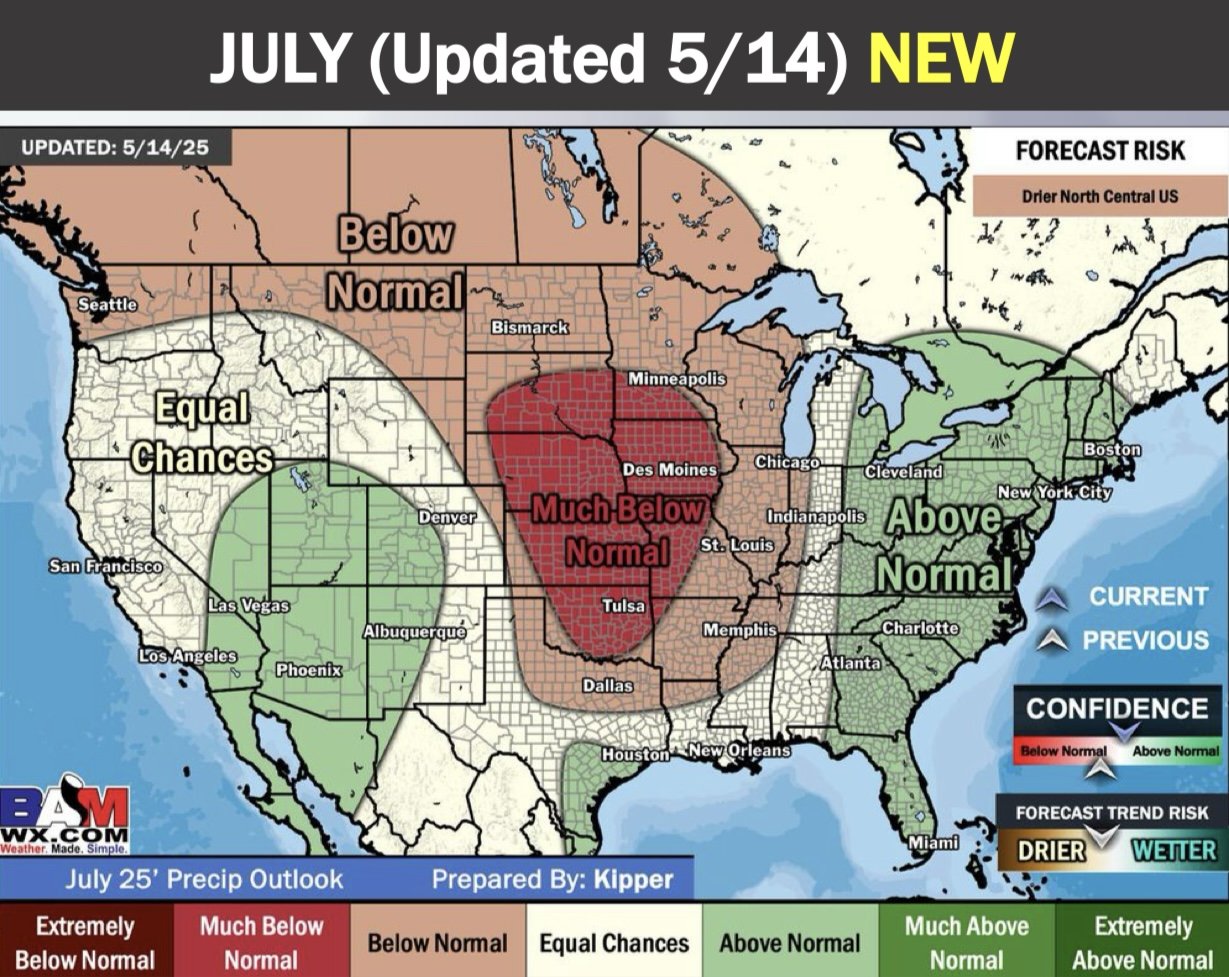
The extended forecasts for summer still suggest drier than normal.
Here is the Government outlooks.
Jun-Jul-Aug
Jul-Aug-Sep
Here is BAM Weather's outlook.
This market has zero weather premium built into it.
The USDA report changed a lot.
We are now looking at a potentially much tighter new crop corn situation than everyone originally thought.
Which does make a weather scare all that more impactful if we get one.
Here is an example of this I showed on Monday.
To get a stocks to use ratio below 10%, we would now only need to see a yield of 178.
Before this report, everyone thought we would see a new crop carryout of +2 billion bu. Because back in the February outlook, that is what the numbers said.
Based on the projections in February, we would’ve had to see yield drop all the way down to 173 to get a stocks to use ratio below 10%.
That is a massive difference and will make any sort of weather premium rally more amplified. As it now takes less of a yield loss to create a tighter balance sheet.
This is all simply due to the USDA raising their expectations for new crop exports.
(The balance sheet scenarios do not take into account for changes to demand).
Current 178 Scenario

173 Scenario Based on Feb Outlook
We do not "have" to get a weather scare.
But more often than not, we at the very least see some weather premium built into this market.
If we do run into a weather scare, the tighter balance sheets open the door for an even bigger opportunity at a rally.
Technicals:
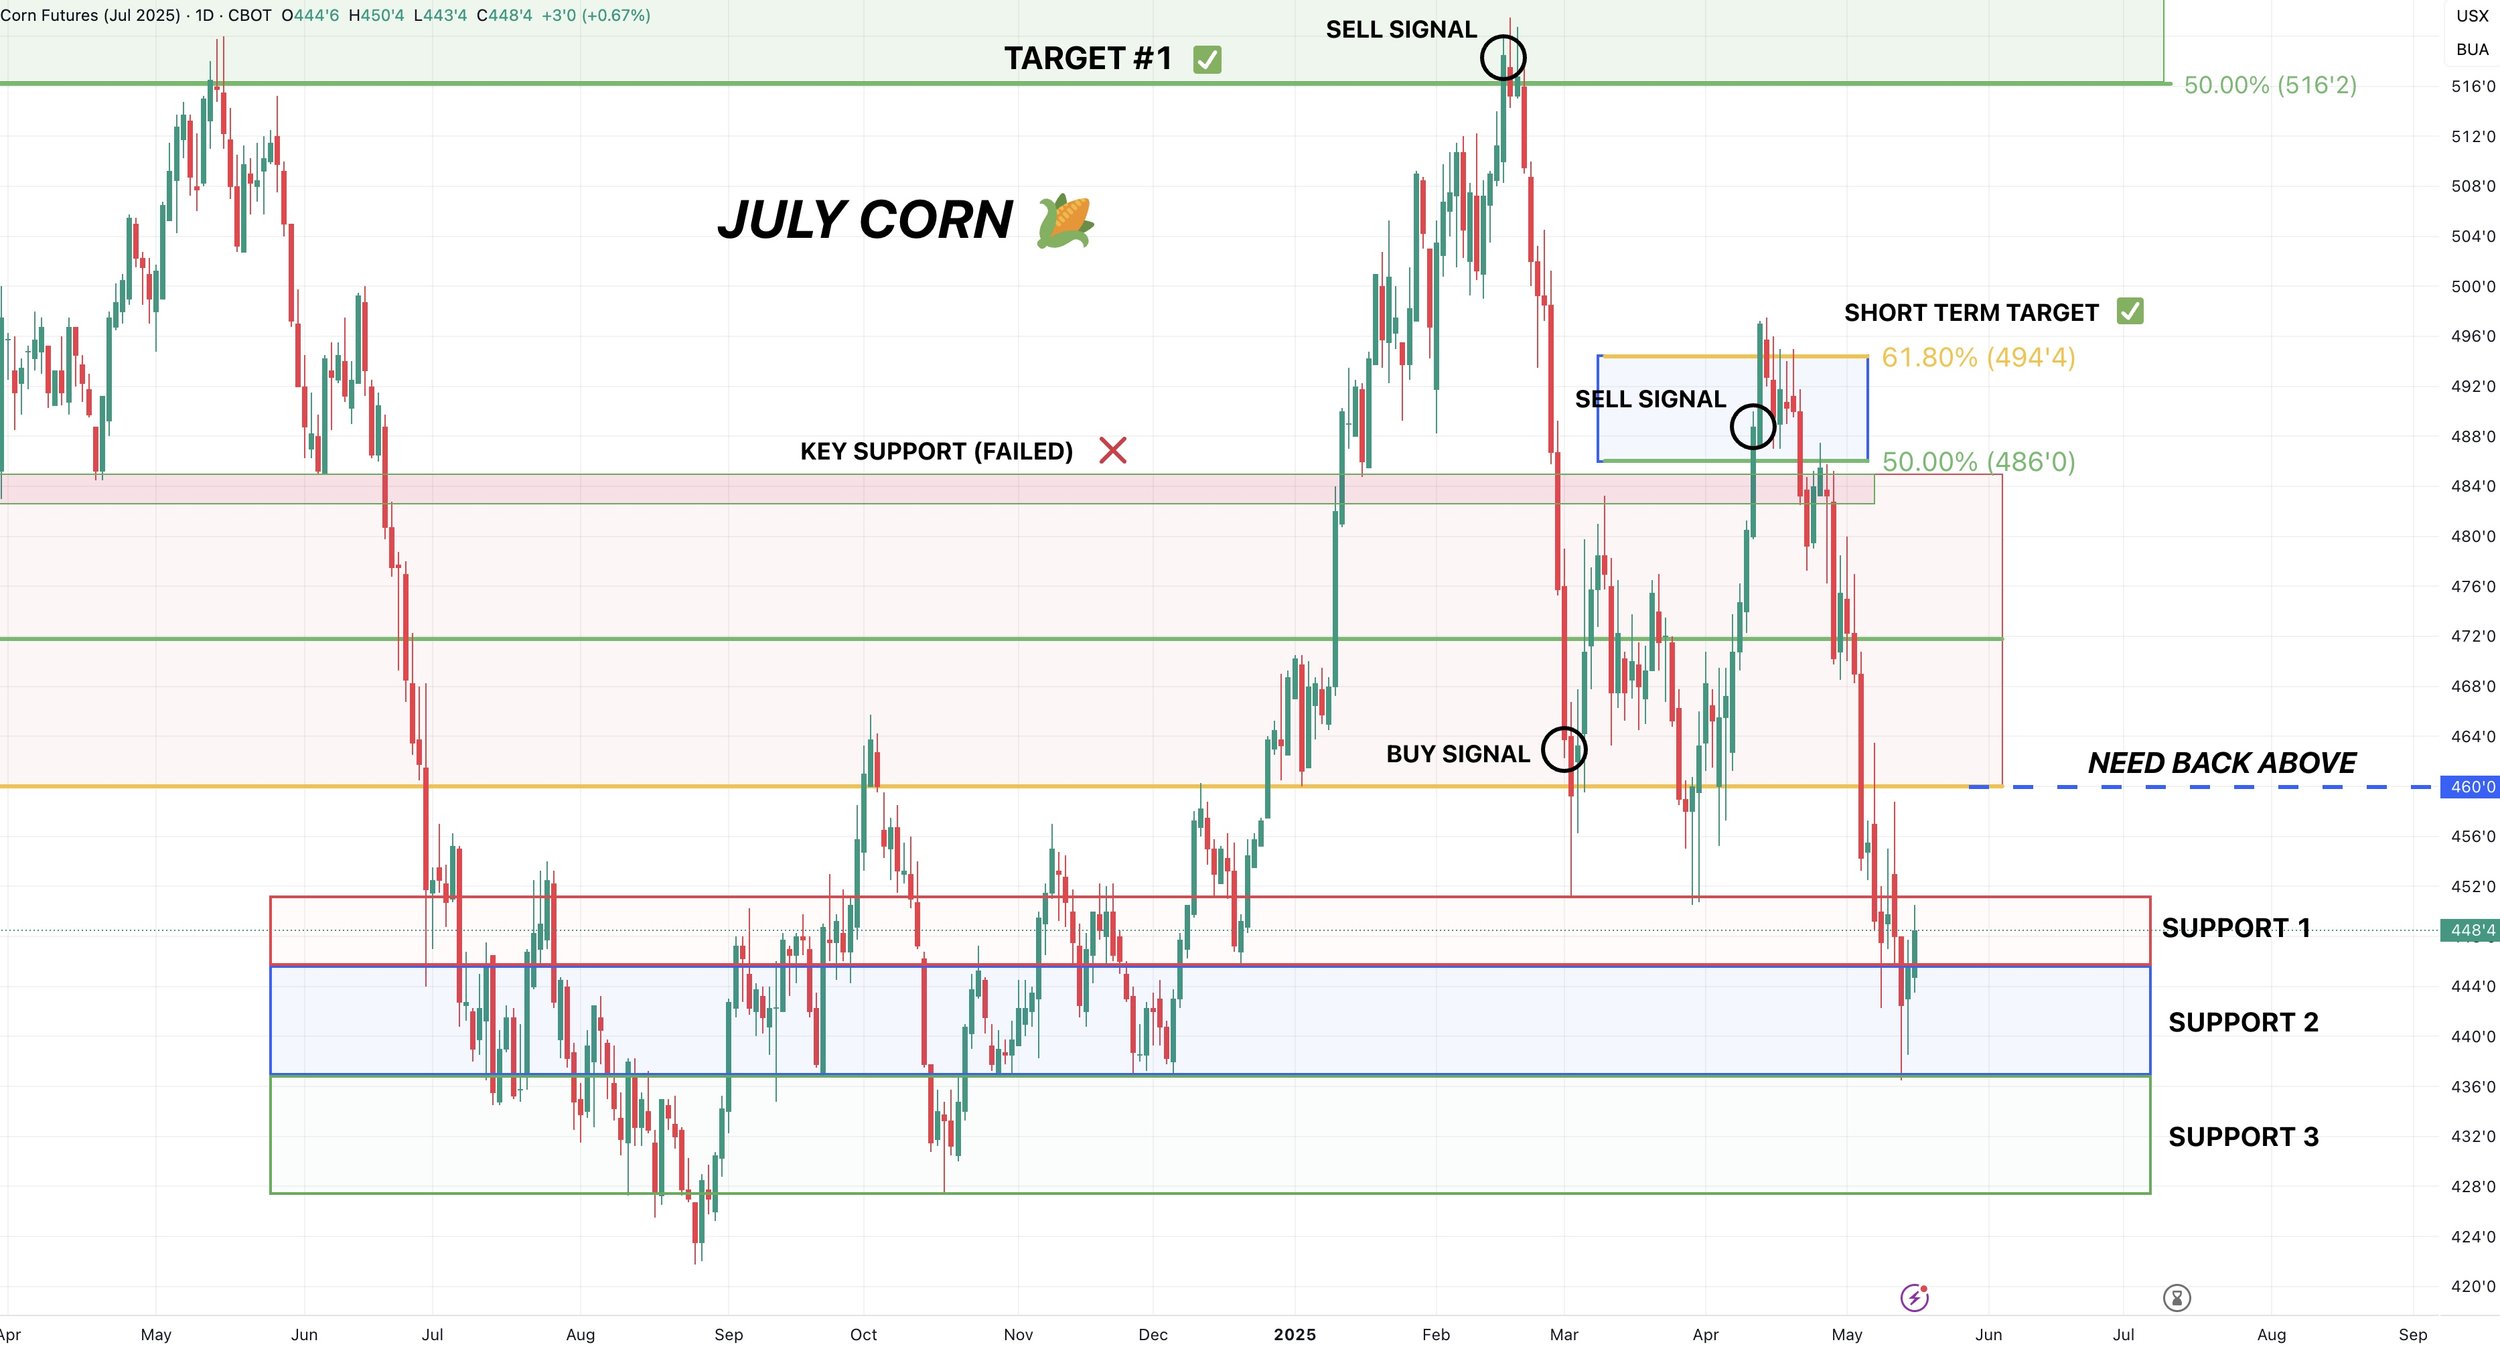
I need to see July corn above $4.60 to be confident we found a bottom.
Until then, bulls need to hold $4.37 as that is the last support level until contract lows.
Not much to update on Dec corn either.
Need to hold this blue box, otherwise the next support is contract lows.
Will have our upside target once I'm confident we put in a low.

Soybeans
Fundamentals
I'm not a biofuel expert by any stretch of the imagination.
I don’t know what the government is going to do about these policies.
What I do know is that the US situation for soybeans is shifting more and more friendly than it had been recently.
Here is a tidbit from the May USDA report. Where carryout was on that day and the price of soybeans.
May 12th 2025
New Crop Carryout: 295 million bu
Price of Nov Beans: $10.58
May 10th, 2024
New Crop Carryout: 445 million bu
Price of Nov Beans: $12.06
New crop carryout for the May USDA report was -35% lower than it was last year. Yet, prices are -$1.50 cheaper.
This could suggest soybeans are undervalued here in comparison.
Not to mention.. this lower carryout includes a record 52.5 bpa yield.
Could a record yield happen? Of course.
But soybeans have the most weather risk simply due to having less acres. Meaning that any swing in yield can create a massive impact on the supply and demand outlook.
For reference:
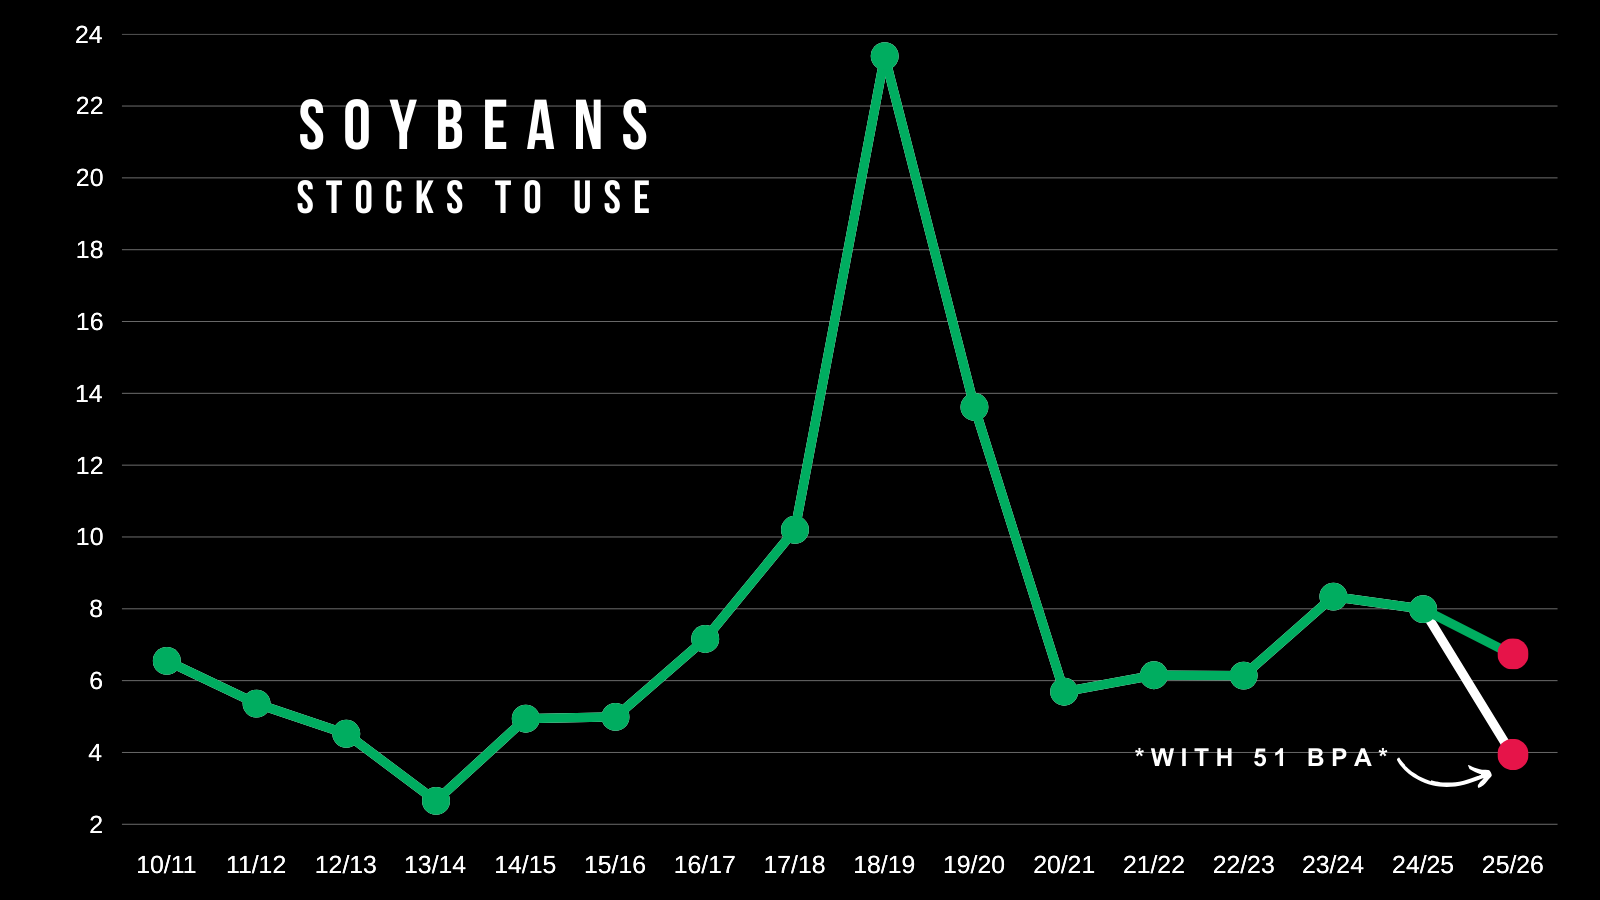
Here is a chart showing soybeans stocks to use ratio since 2010.
The green line is using a 52.5 bpa yield.
The white line is using just a 51 bpa yield.
Right now we are projected to have the tightest stocks to use in 3 years.
But if yield even falls to just 51 bpa, that number drastically falls to it's tightest levels in over a decade.
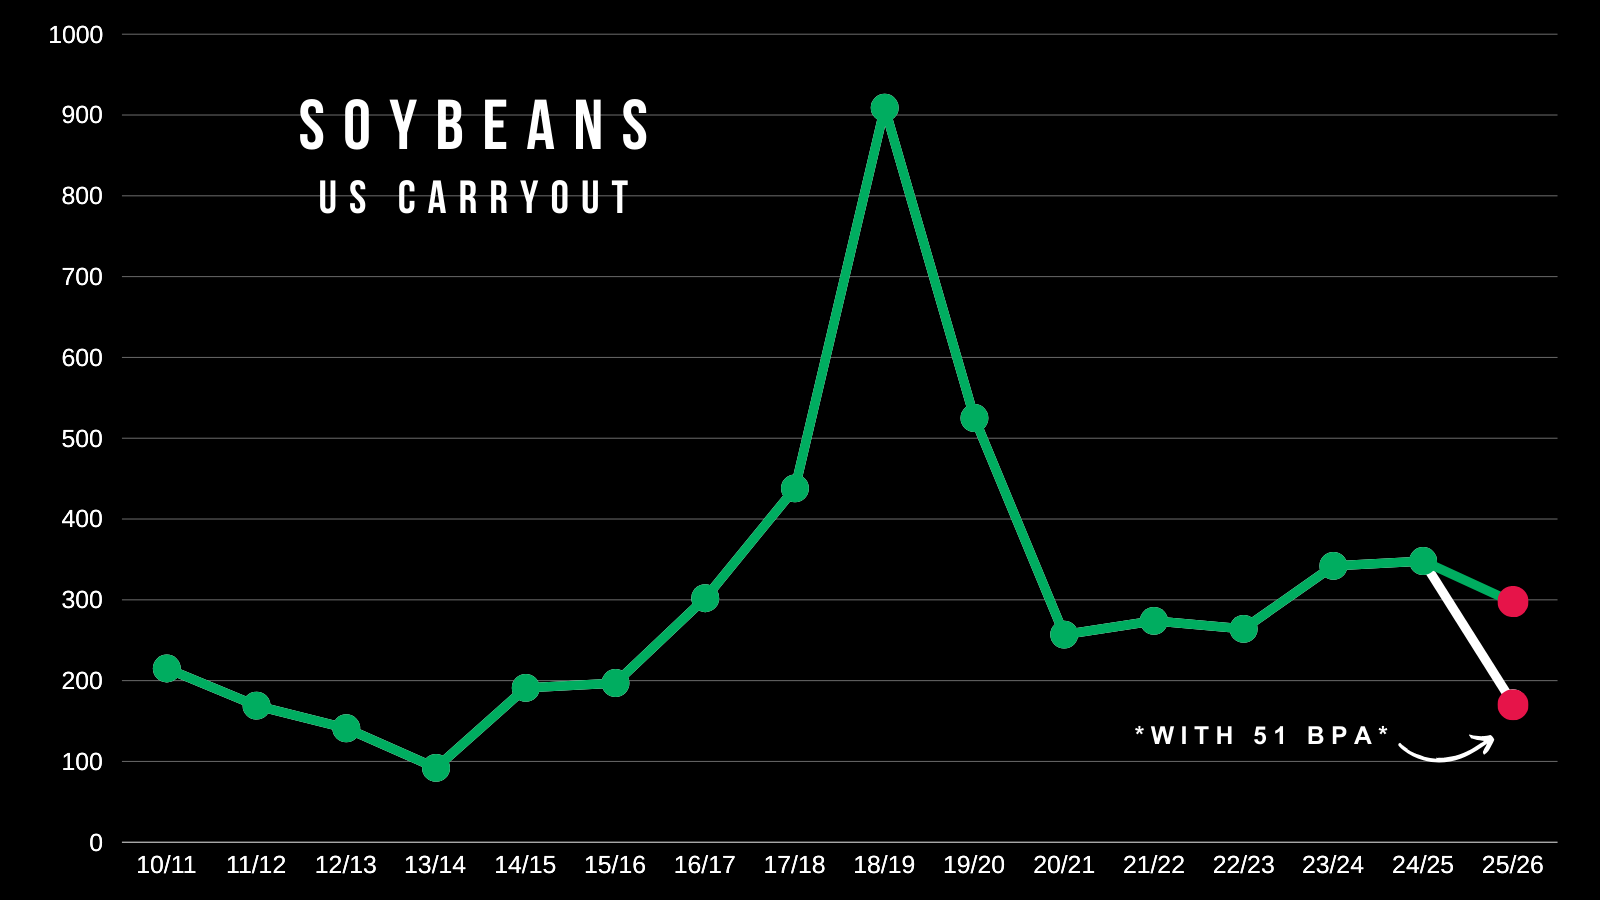
Here is the same chart but showing soybean carryout instead.
Again, carryout is tighter than in recent years.
But a yield of 51 could massively eat into this carryout.
This is possible due to far less acres this year.
There is just simply not a ton of room for error in the US crop.
We don’t have to rally short term.
As a good portion of this recent rally was led by soybean oil on hopes that biodiesel blending requirements would be addressed soon.
With reports saying that this will now be discussed in the coming months instead, the market is naturally giving back some of that premium it had built in.
We still have an entire weather market ahead and I think it should lead to an opportunity.
Technicals:
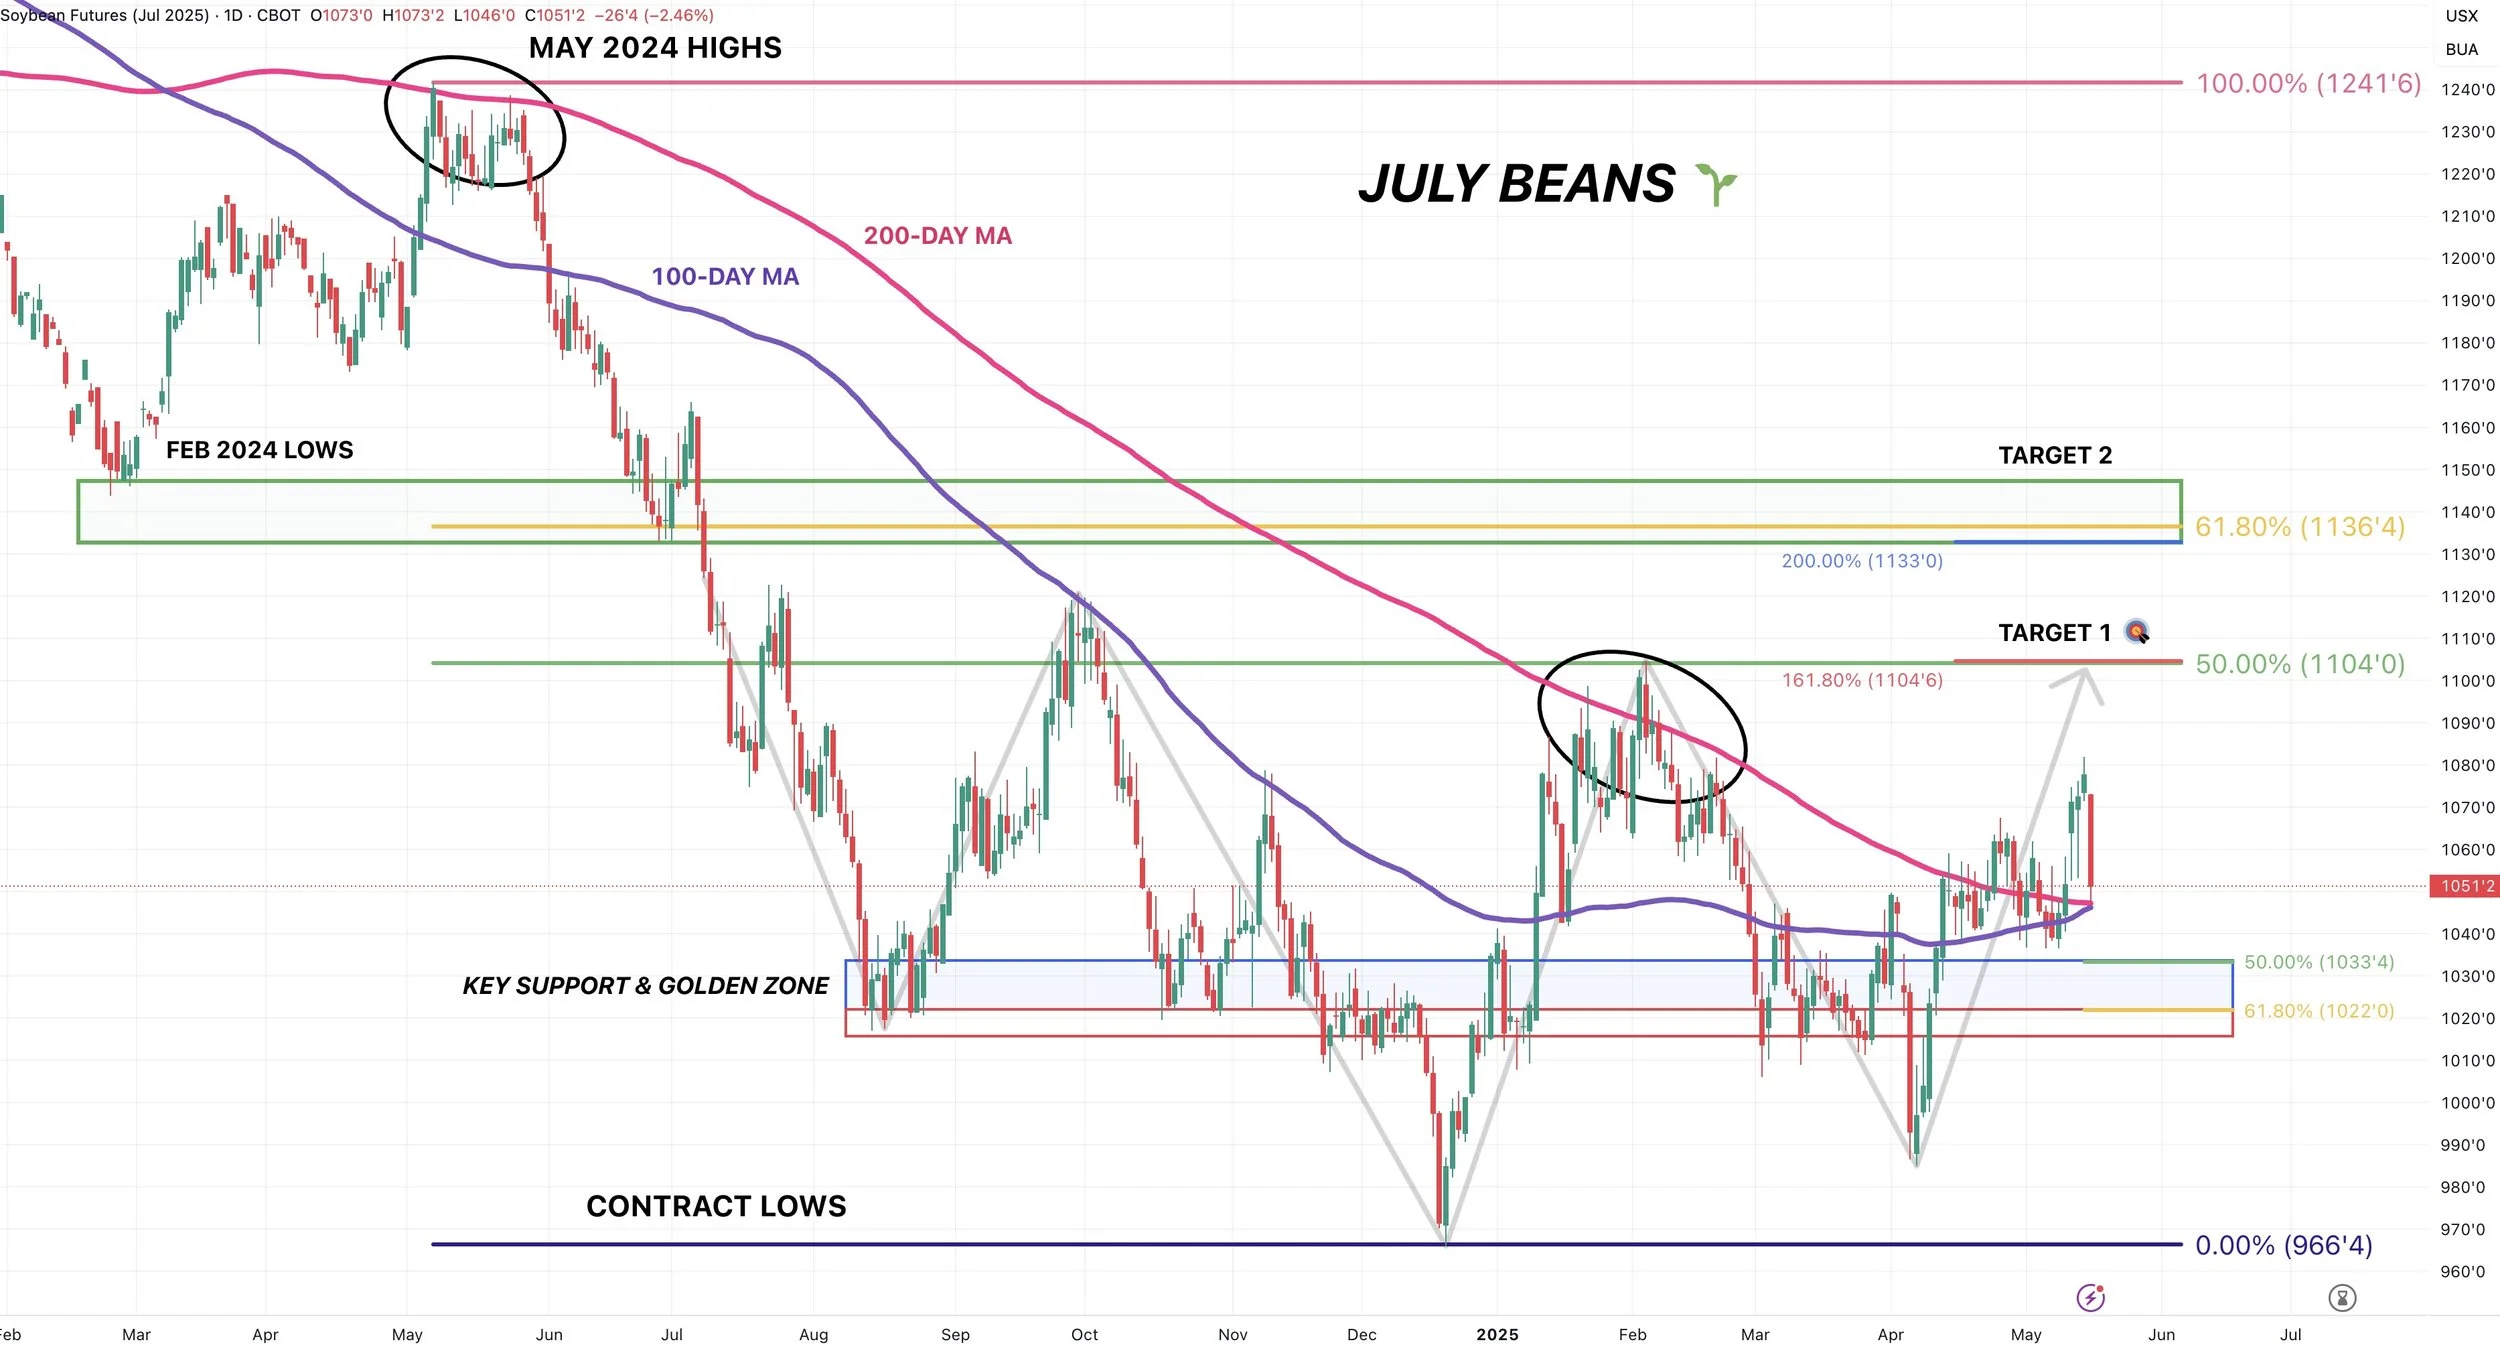
July beans came right down to the 200-day MA today before bouncing.
It makes sense we would find support here.
The 200-day was massive resistance for 2 years.
We finally broke above it. Old resistance usually acts as new support.
So a bounce here makes sense. If we do not bounce here, we likely drop into the blue box. Which is the 50-61.8% retracements of the entire rally since the trade war sell off.
Next target is still $11.04.
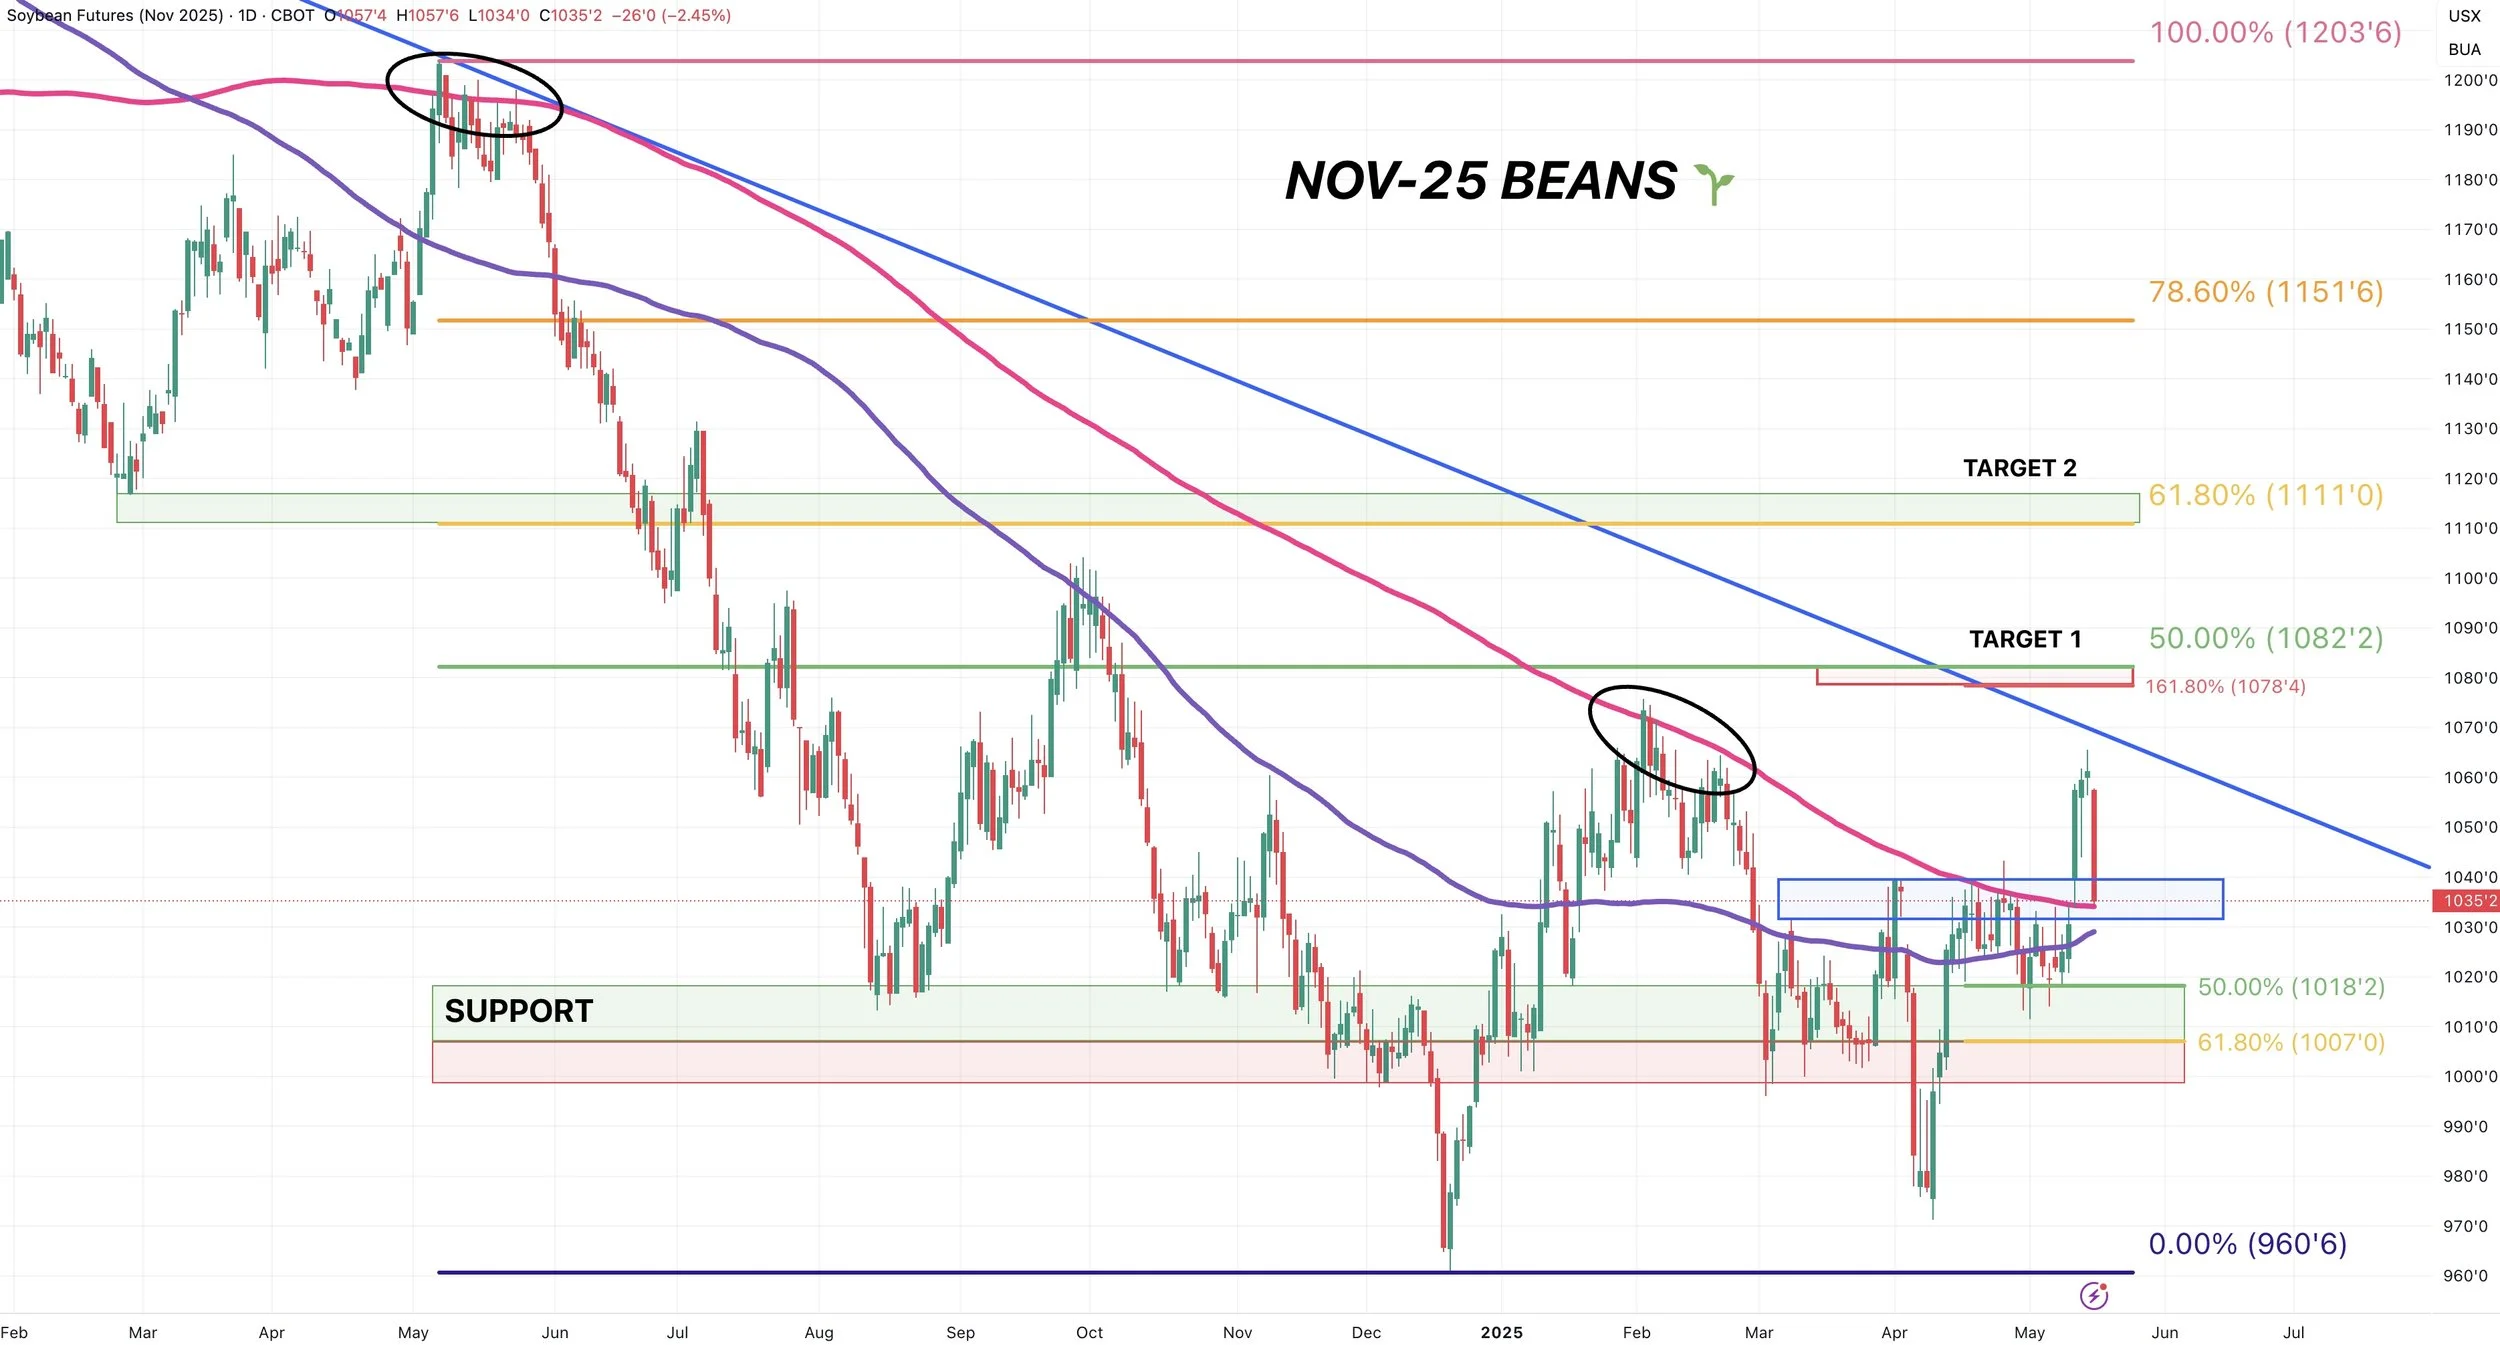
Nov beans also closed right at the 200-day MA.
Once again, this was major resistance as it marked our highs in May 2024 and back in February.
So a bounce here and turning the 200-day into support would make sense.
This blue box is also past resistance from March to April.
Old resistance usually creates new support.
Failure to hold here could drop us into the green box.
Next target is still $10.78-82
Here is a more simplistic view of Nov beans and the 200-day MA.
Again, it has kept a lid on us for years.
If we can build a base of support, it would be a very positive sign.

Wheat
Fundamentals:
The wheat market is finally finding some life.
Sometimes the wheat market makes zero sense.
Day 1 of the Kansas winter wheat crop tours scouts found an average yield of 50.5 bpa vs their 5-year average of 45.1 bpa. This was the highest yield estimate for day 1 since 2021.
Day 2 of the crop tour scouts since an average yield of 53.3 bpa, which was up 42.4 bpa compared to last year and well above the 5-year average of 42.3 bpa.
Yet.. the wheat market is finally trading higher.
This can often be one of those signs that we've put in a top or a bottom in a market.
In this case, we at the bottom of the range and we get bearish news yet prices go higher.
In other cases, we are at the top end of the range and we get bullish news yet prices go lower.
It's hard to think we will see a face melting rally going into winter wheat harvest, as seasonally this is about the time of year we would typically be posting our highs.
But on the bright side, perhaps these low prices are finally attracting some buyers on the export market. As export sales were surprisingly strong today.
Wheat doesn’t have to rally tomorrow, but maybe the heavy blood shed is over for now.
Regardless, I don’t see the logic into selling into 5-year lows here after a -$1.40 sell off.
As a spec, does it really make sense to get overly short at $5 wheat? I'd say probably not.
Technicals:
July Chicago has now clawed itself back into the downward channel.
We could’ve just seen a classic bear trap below as the past 3 days of price action looks solid.
Regardless, not looking to de-risk until closer to the top of the channel.

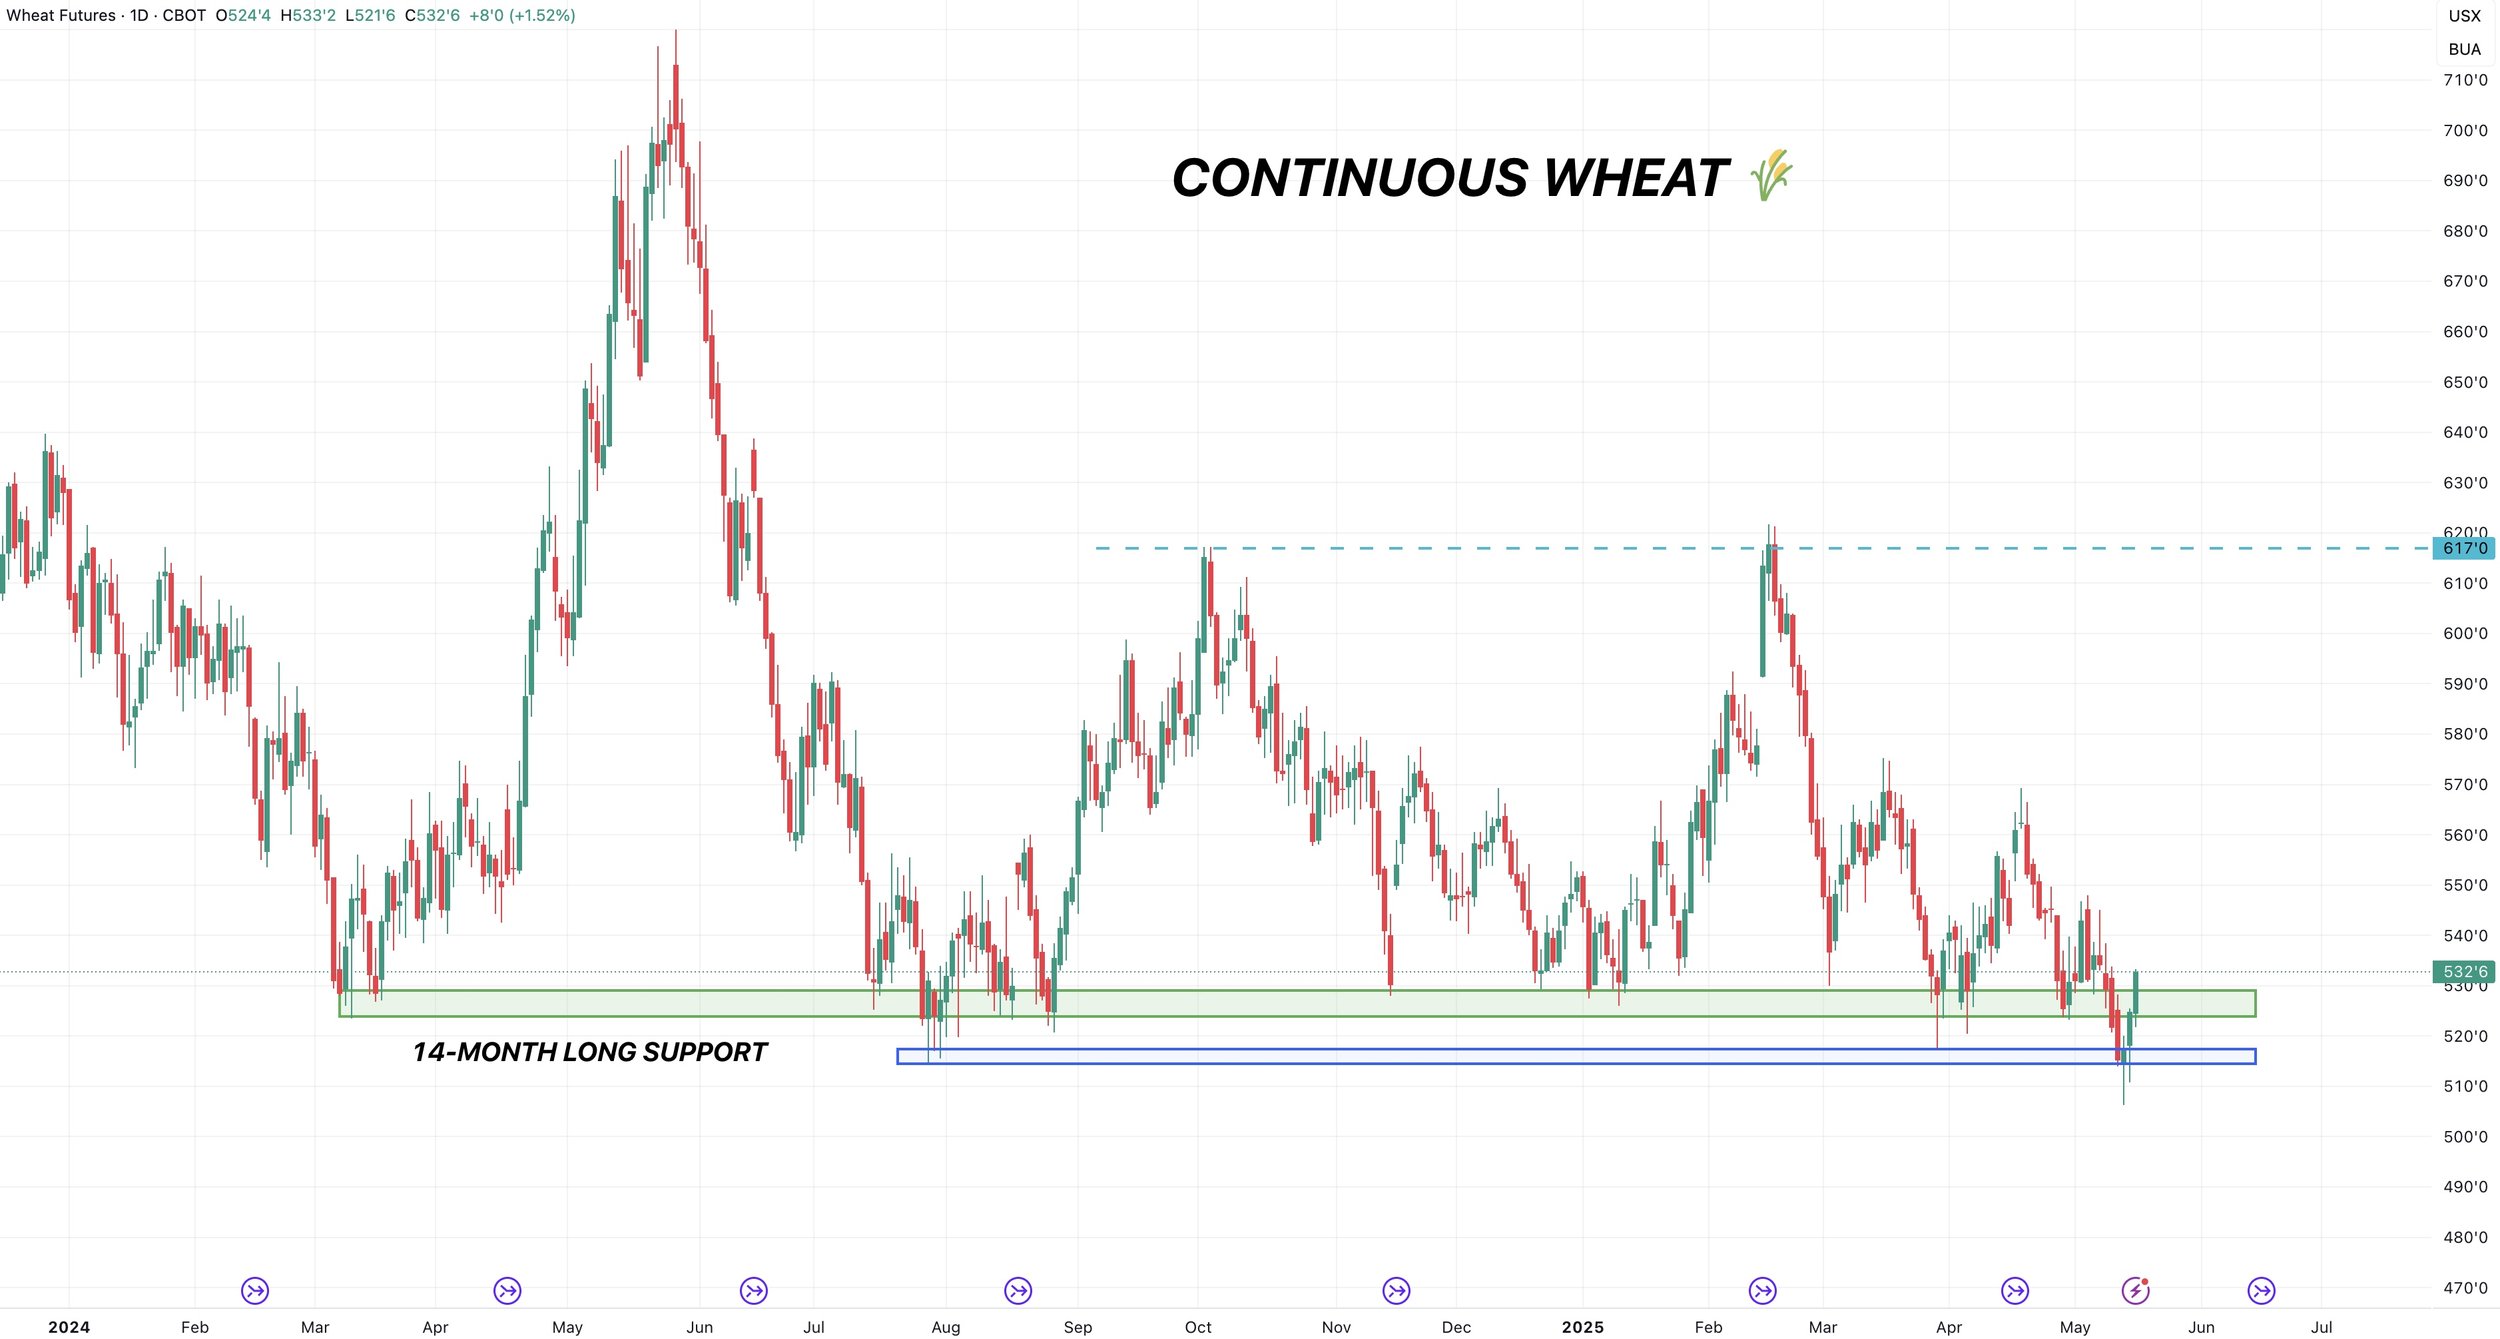
Continuous wheat catching a bid exactly where it needed to.
As a beneath that blue support we have zero support.
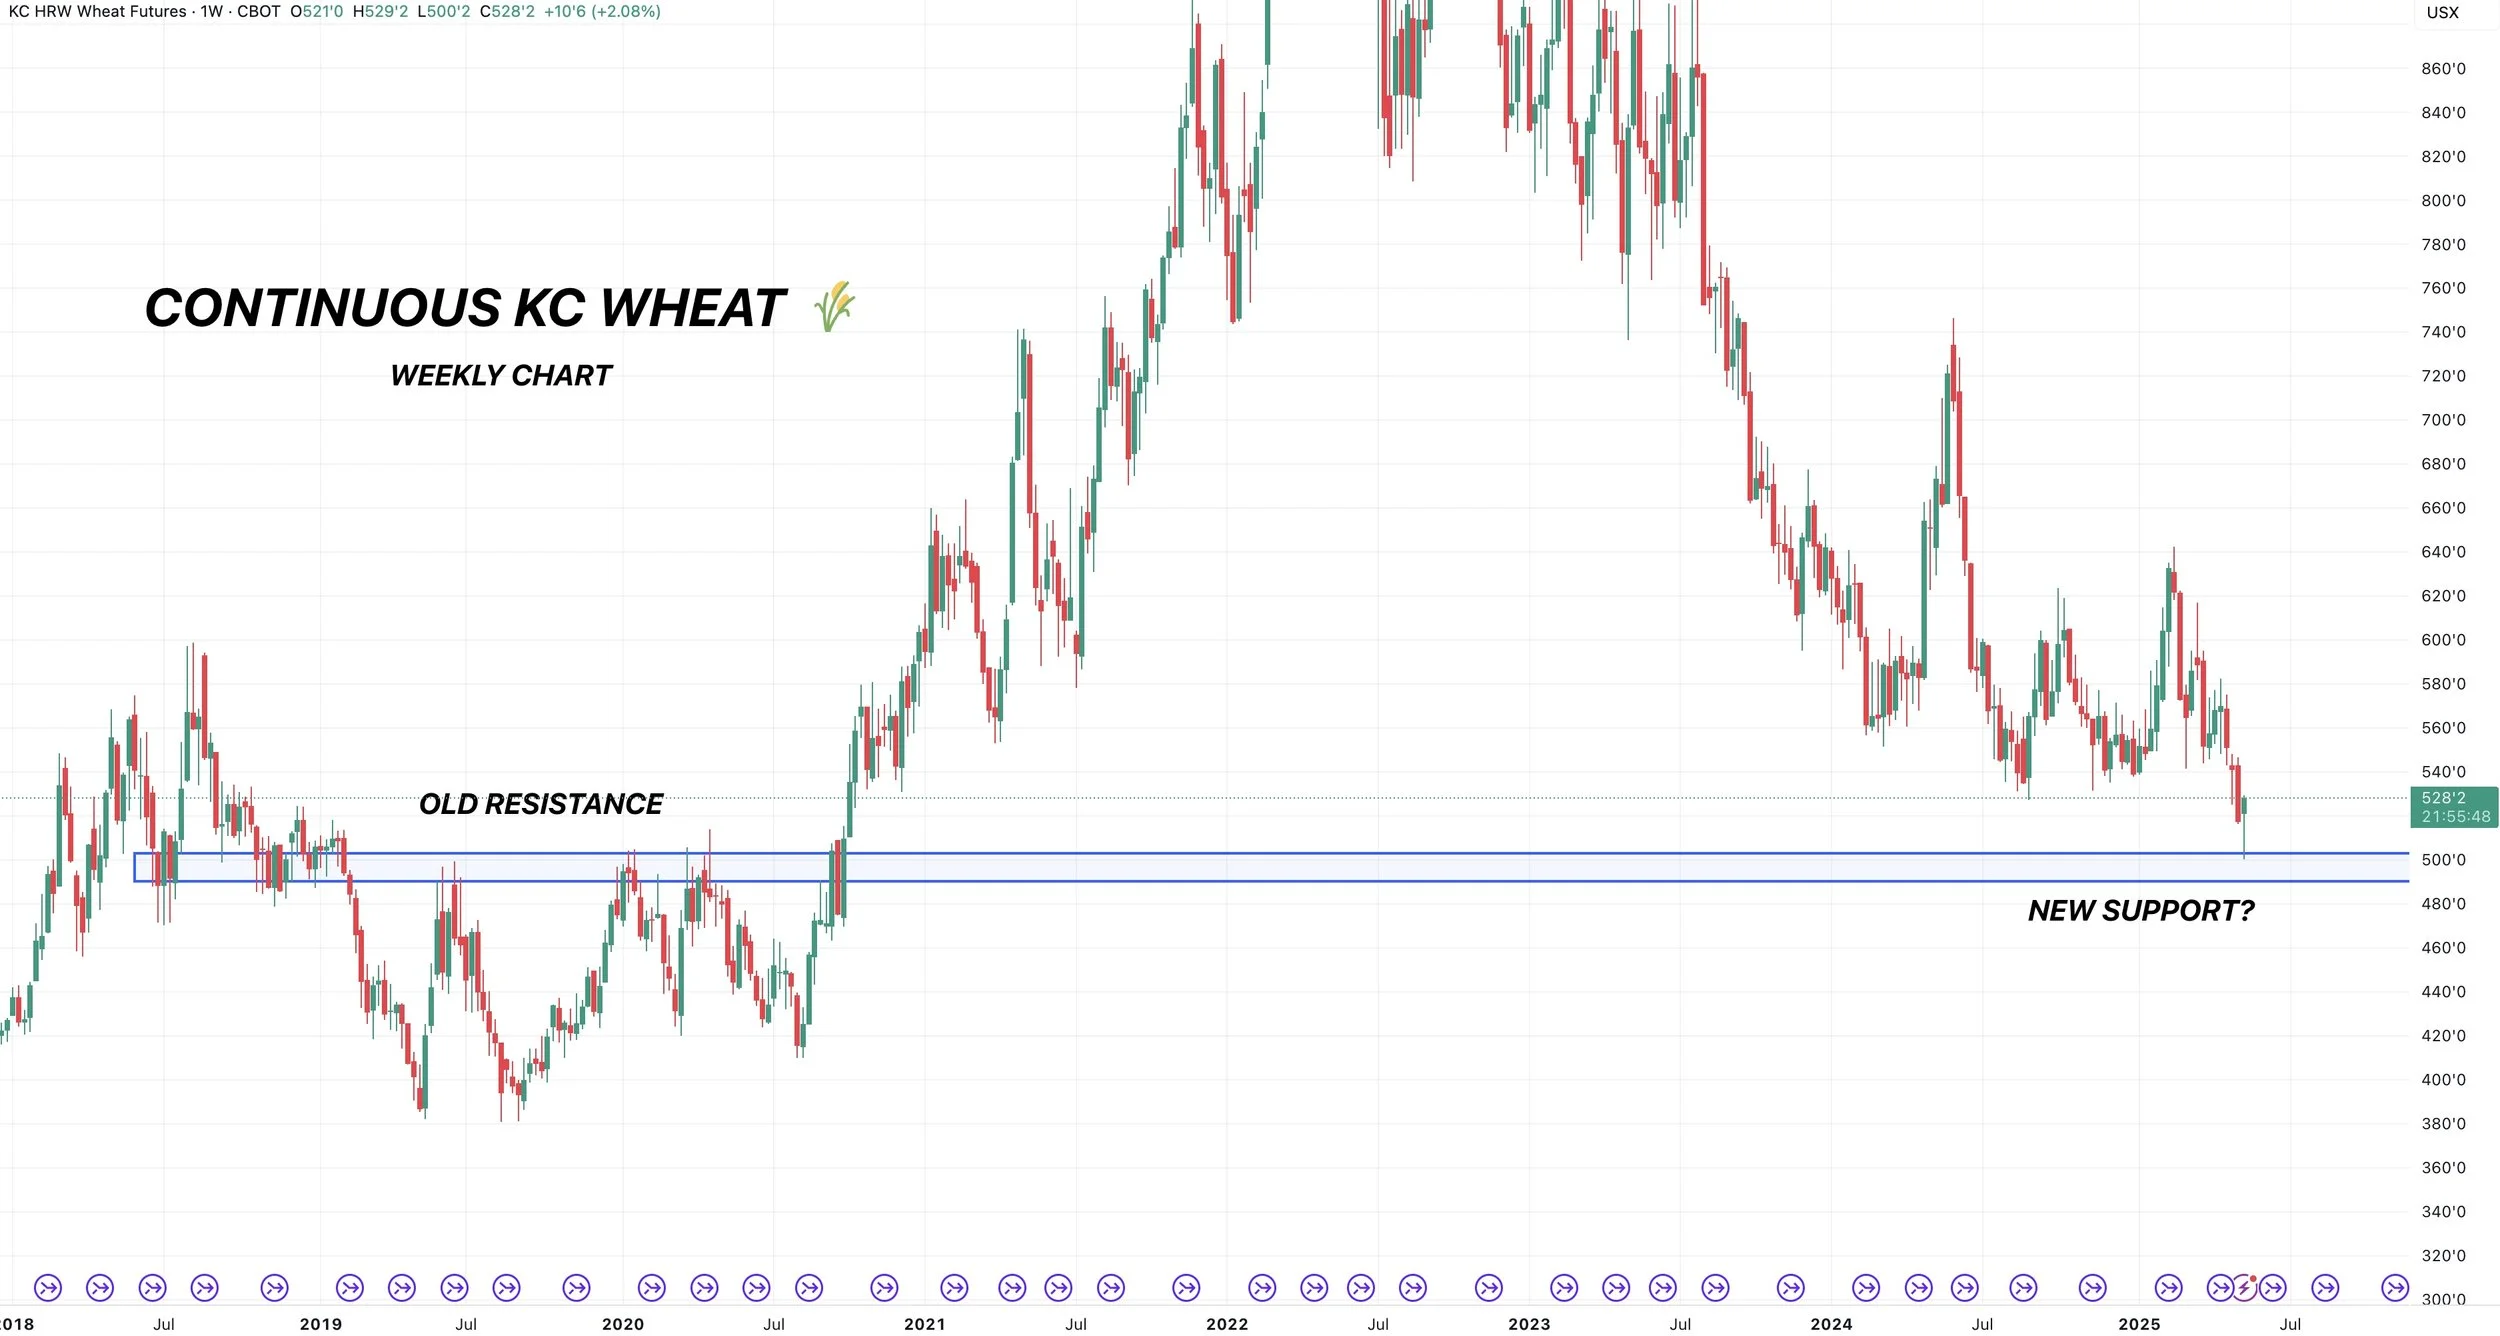
Here is weekly KC wheat.
We bounced right at that old resistance from 2019-20 like I mentioned I would like to see on Monday.
Could’ve very well found our lows here.
Very nice weekly candle as well.
July KC is seeing some nice price action.
But to be fully convinced we posted our lows I'd like to see us work our way into the red box.

Past Sell or Protection Signals
We recently incorporated these. Here are our past signals.
April 10th: 🌽
Old crop corn sell signal.
March 19th: 🐮
Cattle hedge & sell signal.
Feb 18th: 🌽 🌾
Old crop KC wheat & old crop corn signal.
Jan 23rd: 🌽 🌱
Corn & beans old crop sell signal.
CLICK HERE TO VIEW
Jan 15th: 🌽 🌱
Corn & beans hedge alert/sell signal.
Jan 2nd: 🐮
Cattle hedge alert at new all-time highs & target.
Dec 11th: 🌽
Corn sell signal at $4.51 200-day MA
CLICK HERE TO VIEW
Oct 2nd: 🌾
Wheat sell signal at $6.12 target
Sep 30th: 🌽
Corn protection signal at $4.23-26
Sep 27th: 🌱
Soybean sell & protection signal at $10.65
Sep 13th: 🌾
Wheat sell signal at $5.98
May 22nd: 🌾
Wheat sell signal when wheat traded +$7.00
Want to Talk?
Our phones are open 24/7 for you guys if you ever need anything or want to discuss your operation.
Hedge Account
Interested in a hedge account? Use the link below to set up an account or shoot Jeremey a call at (605)295-3100.
Check Out Past Updates
5/14/25
DECISIONS & POSSIBILITIES IN GRAINS
5/13/25
GRAINS RALLY OFF LOWS
5/12/25
USDA REPORT. HOW THIS CHANGES THINGS
5/9/25
BIGGEST RISKS IN USDA REPORT
5/8/25
USDA MONDAY & HISTORY OF WEATHER RALLIES
5/7/25
NEW 2025 LOWS FOR CORN
5/6/25
WHAT’S A SUMMER RALLY LOOK LIKE?
5/5/25
CORN ERASES ENTIRE APRIL RALLY
5/2/25
SELL INTO UNCERTAINTY. NOT KNOWN FACTORS
5/1/25
THE CASE AGAINST A FEB TOP IN CORN
4/30/25
APPROACHING KEY TIME PERIOD FOR GRAINS
4/29/25
PLANTING & FIRST NOTICE DAY PRESSURE. CORN CLOSE TO BOTTOM?
4/28/25
CAPTURING INVERSE & SEASONAL PREPARATION
4/25/25
HOW OFTEN DOES CORN NOT BREAK APRIL HIGHS?
4/24/25
KNOW WHEN TO SELL. BEANS BREAK 200-DAY FIRST TIME IN 483 DAYS
4/23/25
MONEY FLOW & DROUGHT CARDS
4/22/25
CRUCIAL SPOT FOR CORN & BEANS
4/21/25
NO PLANTING THREAT YET
4/18/25
POTENTIAL OPPORTUNITIES, BASIS CONTRACTS & STRATEGIES
4/16/25
HOW YIELD IMPACTS CARRYOUT. MAJOR SPOT FOR SOYBEANS
4/15/25
TOTAL CHART BREAKDOWNS & TARGETS
4/14/25
TECHNICAL SELLING IN GRAINS
4/11/25
SPECIFIC GRAIN MARKETING DECISIONS
4/10/25
USDA REPORT. HOW THIS IMPACTS CORN
4/9/25
TARIFFS GIVE. TARIFFS TAKE
4/8/25
CORN’S DIVERGING STRENGTH
4/7/25
SOLID PRICE ACTION DESPITE OUTSIDE FEAR
4/4/25
CORN PRICE ACTION SPEAKS VOLUME. ANY HOPE LEFT FOR SOYBEANS?
4/3/25
WHAT IS LEFT FOR CORN BEARS? TRADE WAR: CHARTS HOLDING SUPPORT
4/2/25
SHOULD UNKNOWNS KEEP A FLOOR UNDER GRAIN PRICES?
4/1/25
HOW DO ACRES IMPACT FUTURE OF THE GRAINS?
3/31/25
USDA REPORT: NOW WHAT?
3/28/25
ALL EYES ON USDA
3/27/25
PRE-USDA POSITIONING. DON’T GIVE GRAIN AWAY
3/26/25
HISTORY OF MARCH INTENTIONS. SOYBEANS UNDERVALUED?
3/25/25
6 DAYS UNTIL MAJOR USDA REPORT
3/24/25
HOW TO POSITION YOURSELF BEFORE PLANTING
3/21/25
REASONS TO BE OPTIMISTIC IN GRAINS?
3/20/25
WAS THAT THE BOTTOM IN CORN?
3/19/25
THE PATH HIGHER & THE DOWNSIDE RISKS IN GRAINS
3/18/25
SEASONALS, CATTLE HEDGE, CHARTS & DROUGHT?
3/17/25
WHEAT RALLIES. DON’T GET BACKED INTO A CORNER
3/14/25
MARCH 31ST REPORT THOUGHTS & WHAT’S NEXT FOR GRAINS
3/13/25
EXPLAINING RE-OWNERSHIP VS COURAGE CALLS
3/12/25
TARIFF FEARS. EU, CANADA, & ETHANOL
3/11/25
USDA SNOOZE. RECORD FUND SELLING A CONCERN?
3/10/25
USDA TOMORROW. GETTING COMFORTABLE IN MARKETING
3/7/25
HOW TIGHT IS THE WORLD & US SITUATION?
3/6/25
TARIFFS PUSHED BACK. FUTURE OPPORTUNITIES?
3/5/25
IS GRAINS BIGGEST RISK WEAK CRUDE & DEFLATION?
3/4/25
TRADE WAR BEGINS. 8TH DAY OF PAIN FOR GRAINS
3/3/25
TARIFFS ON TOMORROW. BUY SIGNAL
3/3/25
BUY SIGNAL
2/28/25
WHEN WILL THE BLEEDING STOP?
2/27/25
CORN AT CRITICAL SPOT. USDA ACRE REPORT. WAY TOO EARLY DROUGHT TALK
2/26/25
HISTORY SUGGESTS CORN TOP ISN’T IN? ACRE OUTLOOK TOMORROW
2/25/25
POSITIVE CLOSE. WHAT TO KNOW ABOUT USDA OUTLOOK
2/24/25
USDA OUTLOOK, FIRST NOTICE DAY & BRAZIL
2/21/25
WHAT TO EXPECT MOVING FORWARD IN GRAINS
2/20/25
FIRST NOTICE DAY CONCERNS. MASSIVE CORN ACRES OR NOT?
2/19/25
HOW TIGHT IS THE CORN SITUATION?
2/18/25
MORE DETAILS ON TODAYS SELL SIGNAL
2/18/25
OLD CROP KC WHEAT & CORN SELL SIGNAL
2/14/25
WHEAT BREAKING OUT ON WEATHER RISK. TECHNICALS & FUNDAMENTALS
2/12/25
GLOBAL GRAIN SITUATION, ACRE TALK, CHARTS & MORE
2/11/25
USDA: NOT A BEARISH REPORT. DISAPPOINTING PRICE ACTION
2/10/25
USDA TOMORROW. LONG TERM PATH FOR SUB 10% CORN STOCKS TO USE?
2/7/25
WHY WOULD THE FUNDS EXIT THEIR LONGS?
2/6/25
WHEAT FINALLY CATCHING A BID
2/5/25
COMPLETE THOUGHTS ON MARKETS: BACK & FORTH DISCUSSION
2/4/25
STRONG JANUARY LEAD TO STRONG YEAR? TARIFFS, CHARTS & MORE
2/3/25
TARIFFS PUSHED BACK
1/31/25
TARIFF NEWS ALL OVER THE PLACE. ARE YOU PREPARED FOR POSSIBILITIES?
1/30/25
WHEAT BULL ARGUMENT. TRUMP ADDS TARIFFS
1/29/25
CORN APPROACHES $5.00
1/28/25
TARIFFS, CORN FUNDS, SOUTH AMERICA & MORE
1/27/25
HEALTHY CORRECTION WE TALKED ABOUT & TARIFF NEWS
1/24/25
GRAINS DUE FOR SHORT TERM CORRECTION?
1/23/25
OUR ENTIRE NEW CROP SALES THOUGHTS & OLD CROP SELL SIGNAL
1/22/25
GRAINS TAKE A BREATHER. IS CORN IN A BULL OR BEAR MARKET?
1/21/25
HUGE DAY IN GRAINS. WHAT TO DO WITH OLD CROP VS NEW CROP
Read More
1/20/25
VIDEO CHART UPDATE
1/17/25
TRUMP, CHINA, ARGY & USING THE SPREADS INVERSE
1/16/25
OLD CROP LEADS US LOWER. MARKETING THOUGHTS
1/15/25
SIGNAL & HEDGE ALERT QUESTIONS EXPLAINED. IS $6 CORN EVEN POSSIBLE?
1/14/25
MORE DETAILS ON TODAYS HEDGE ALERT & SELL SIGNAL
1/14/25
CORN & SOYBEANS HEDGE ALERT/SELL SIGNAL
1/13/25
USDA GAME CHANGER OR NOT?
1/10/25
BULLISH USDA FOR CORN & BEANS
1/9/25
USDA OUT TOMORROW
1/8/25
2 DAYS UNTIL USDA. BE PREPARED
1/7/25
THE HISTORY OF THE JAN USDA & MORE
1/6/25
MAJOR USDA REPORT FRIDAY
Read More
1/3/25
UGLY DAY ACROSS THE GRAINS
1/2/25