
SEPTEMBER CORN RALLY?
MARKET UPDATE
You can scroll to read the usual update as well. As the written version is the exact same as the video.
Timestamps for video:
Overview: 0:00min
Record Dry August: 0:50min
Funds Buying?: 1:40min
Inflation Play: 2:55min
Corn: 4:10min
Beans: 7:30min
Wheat: 10:55min
Cattle: 12:55min
Want to talk about your situation?
(605)295-3100
Your free trial has ended
Make sure you subscribe if you’d like future access to our daily updates & our next sell signal.
Here is extended access to our Labor Day sale since you were on a trial.
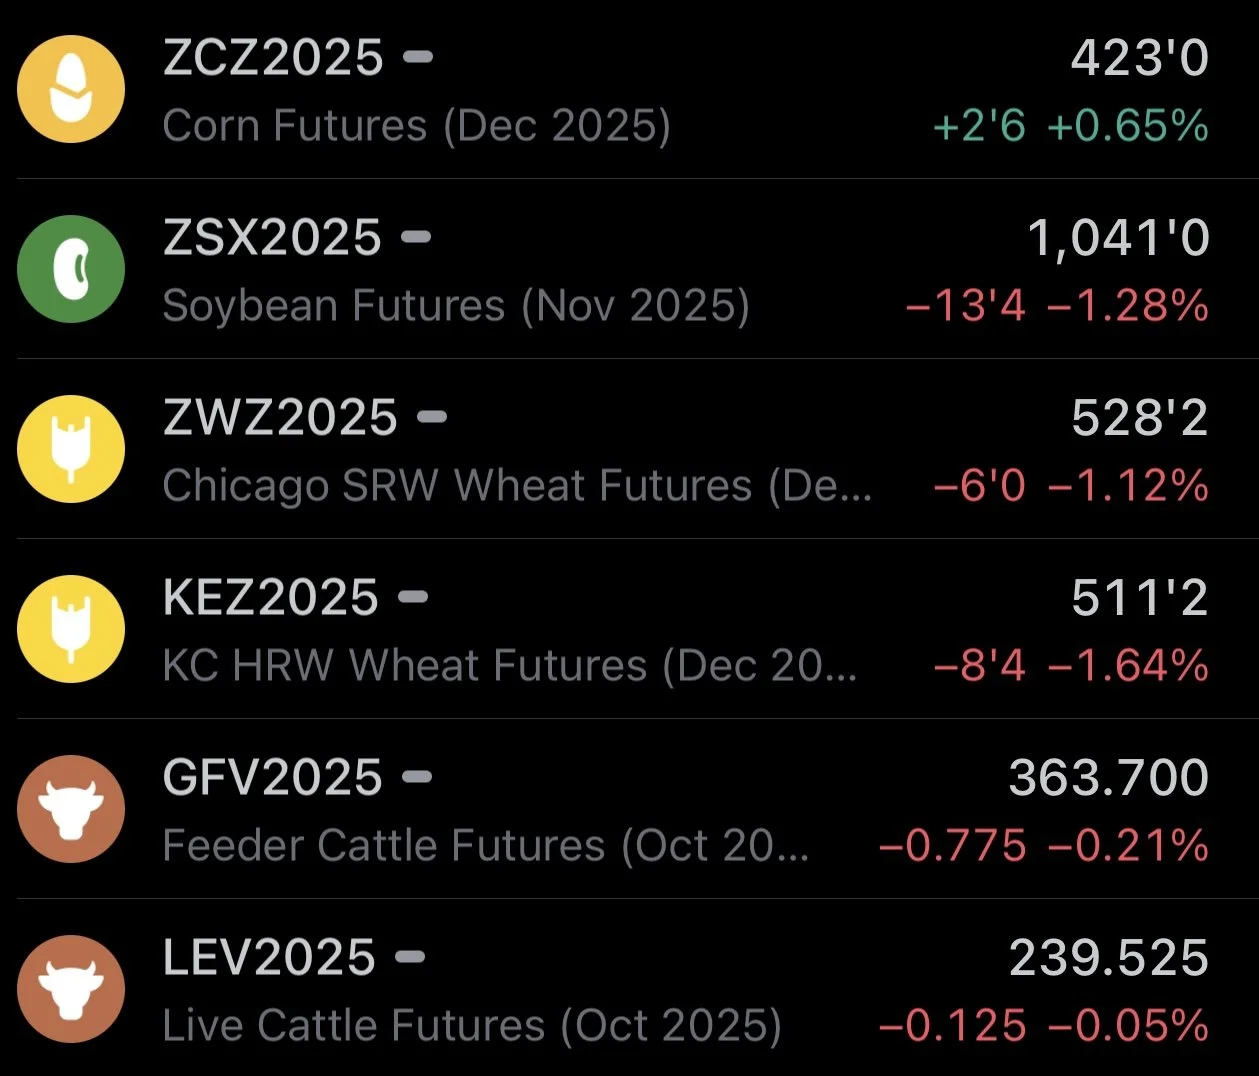
Futures Prices Close
Overview
Following Friday's stellar performance, grains (outside of corn) start off September on a sour note after the 3-day weekend.
Soybeans & wheat struggled while corn battled and rallied +9 cents off it's early day lows.
On Friday, Dec corn posted its strongest daily gain since July 2nd.
Many are speculating about a rumor that China is buying US corn, and that was the reason for the strength on Friday. I would call this rumor completely false. When China buys corn, the market will probably know.
Friday's strength was a combination of several factors. It was the end of the month position squaring. First notice day pressure was out of the way.
We just had one of the driest August's on record which brings in yield uncertainty given that the USDA just gave us a 188.8 corn yield and 53.6 bean yield a few weeks ago.
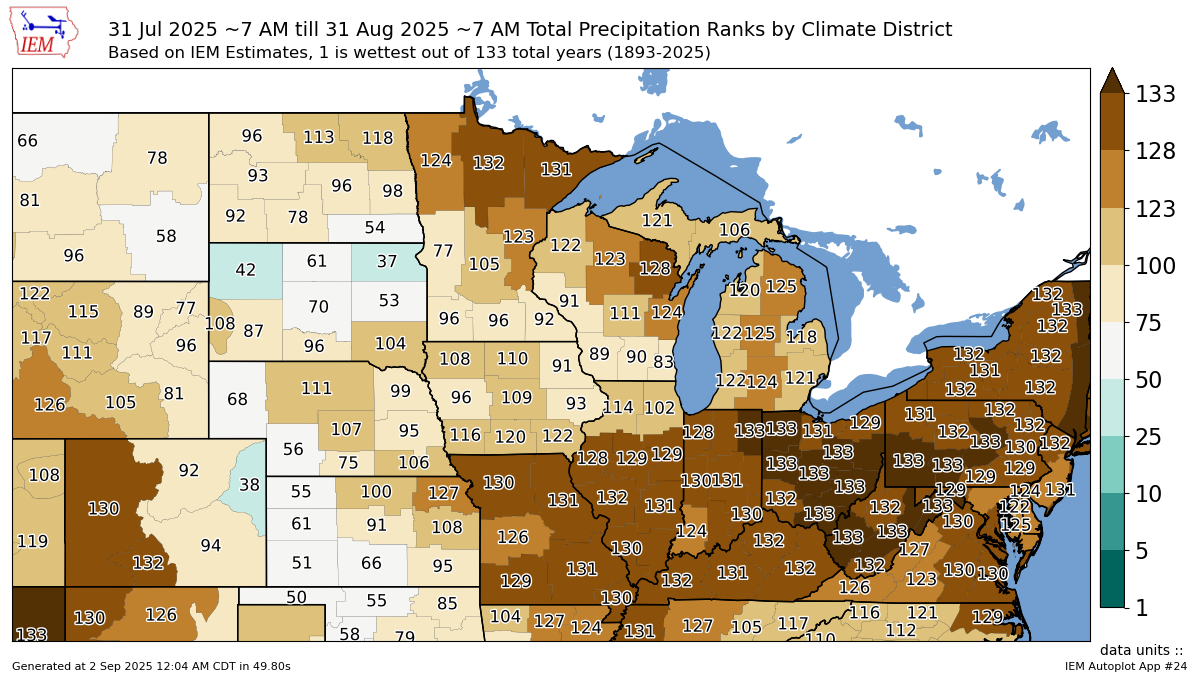
Record Dry August
This August was one of the driest ever.
You can throw those 188.8 and 53.6 yield projections out the window in my opinion.
The entire state of Ohio saw it's driest August ever.
Indiana saw a top 5 driest August in 133 years.
Even the bottom 2/3rds of Illinois saw a top 5 driest August ever.
You cannot tell me these crops aren’t getting smaller.
Not to mention the the possible rust issues, pollination issues, hot nights in July etc.
The majority of this summer was ideal weather. Last year we saw the same thing. We had great potential only for it to be hindered by a dry finish.
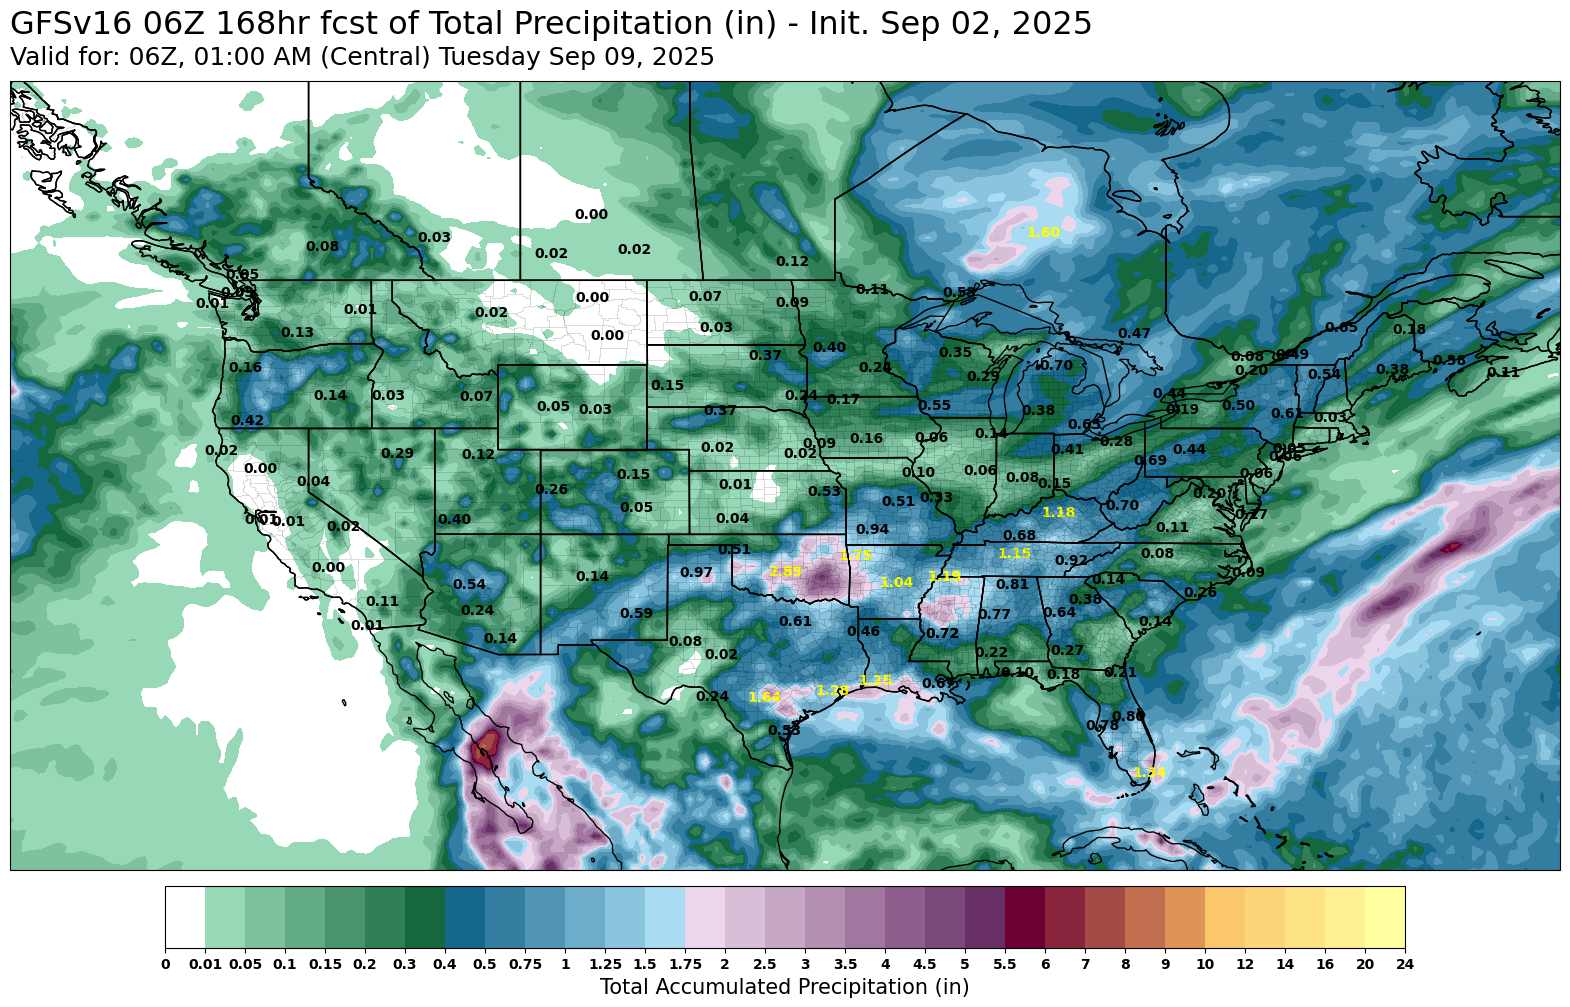
Here is the forecast for the next 7 days.
Still remains pretty dry for most regions.
Are Funds Buying?
Corn
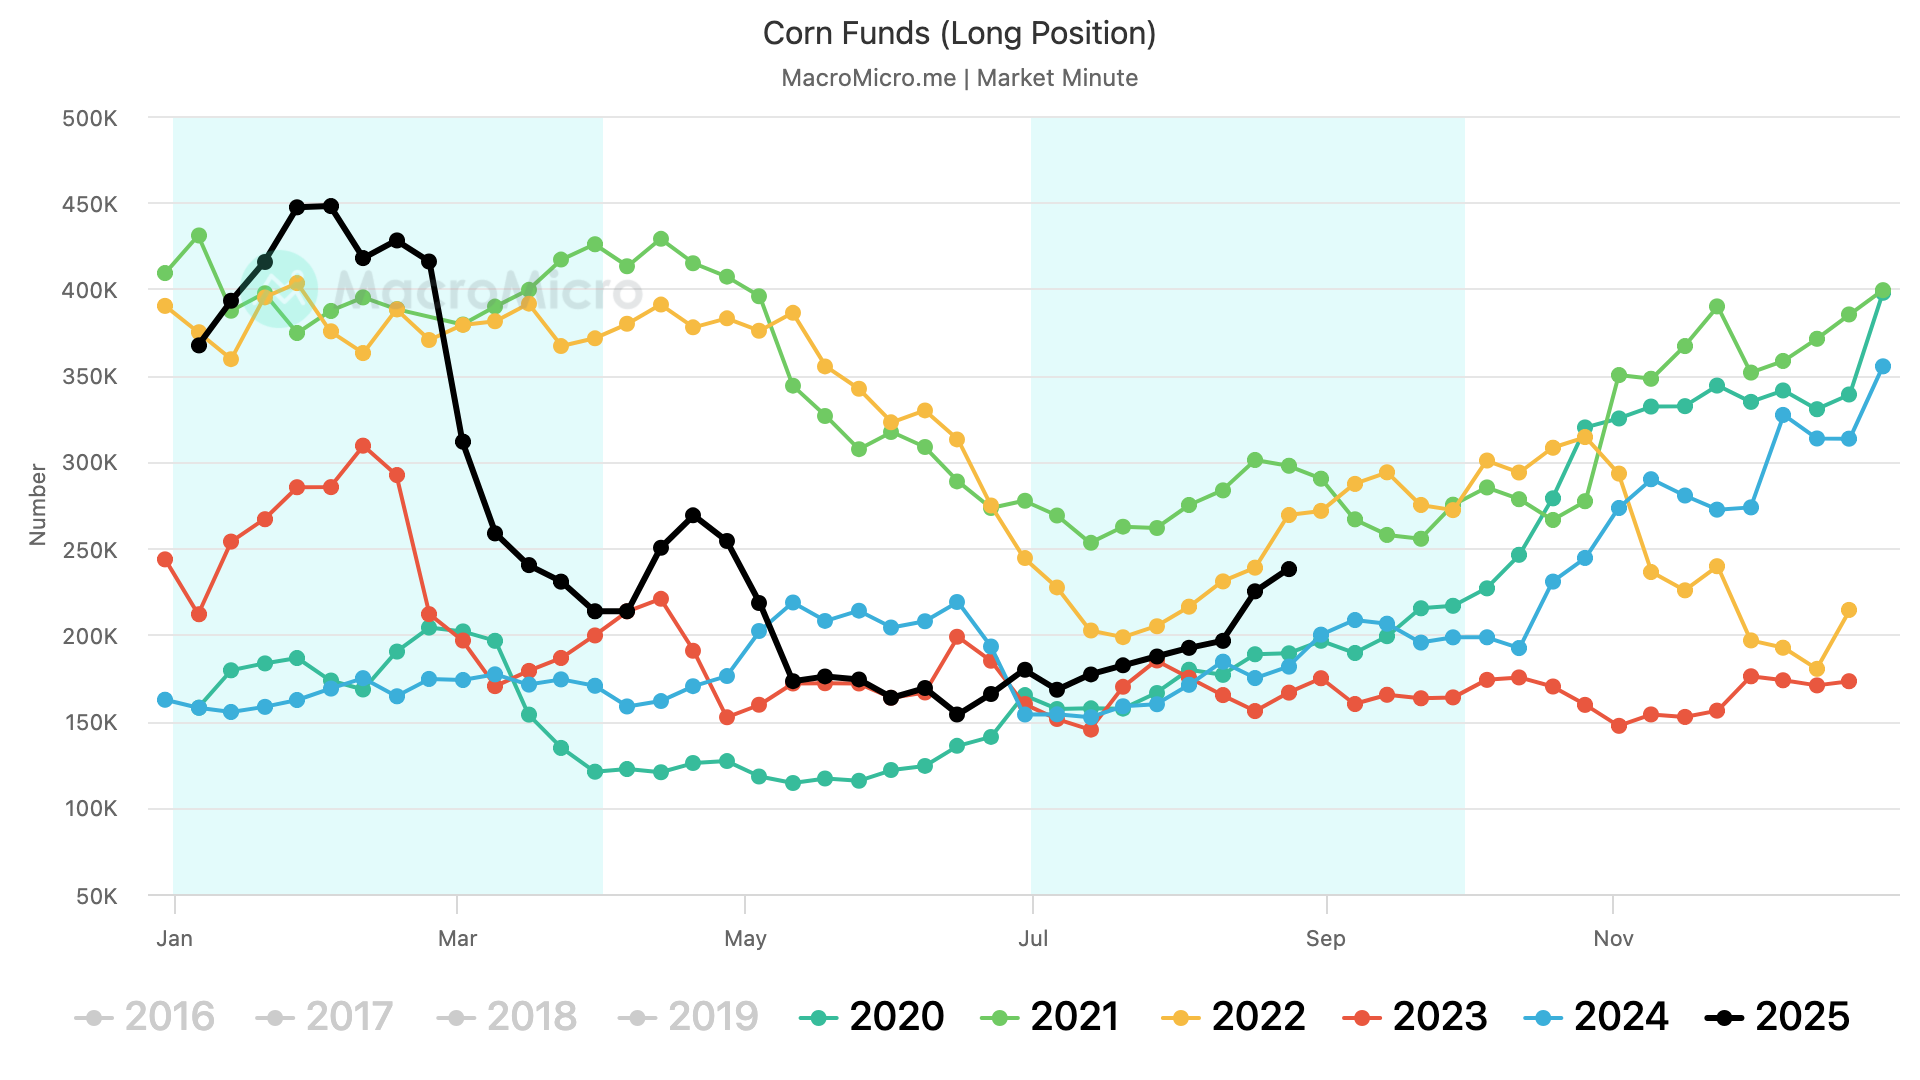
The funds have consistently been buying corn since July.
This is the first time we have seen consistent buying since all the way back in January.

Let's look at their actual short vs long positions.
This is not short covering we are seeing in the corn market.
It is actually more people opening up long positions.
Shorts aren’t scared yet, but some see potential in being long.

Beans
The funds have bought for 3 straight weeks in a row now.
Pretty much the most consistent buying we've seen since last fall.

Unlike corn, this entire move from the funds is entirely short covering.
Short positions in beans have plummeted, meanwhile long positions haven’t moved an inch.
Basically, there is more fear is being short this market.


Bean Meal
The funds have been short covering this market like crazy for the last month.
Just 3 weeks ago they had held their largest short position of all-time.
We are now seeing short covering and funds hit the exit door.

Wheat
The funds just starting buying again for the first time since June.
After shorting this market the entire month of August.

Interest Rates & Inflation Play
I haven’t talked about this in a while, but if you've been following along I've been talking about this for months.
The argument that perhaps the funds don’t truly get behind this market until they are confident that rates will be cut.
In a nutshell:
Rate cuts lead to higher inflation. Which usually leads to more expensive commodities.
Rate hikes lead to lower inflation. Which usually leads to cheaper commodities.
Here is a chart that shows rate cuts, rate hikes, inflation, and corn & soybeans prices.
On a big picture scale, we tend to follow inflation higher or lower.
The last rate hikes we saw were back in 2022. They marked the top in the bull market for corn and beans.
The first rate cuts we saw since 2020 happened last fall. Which happened right before the most sustained rally the corn market has seen this entire bear market.
If you notice, inflation has started to pick back up the past few months.
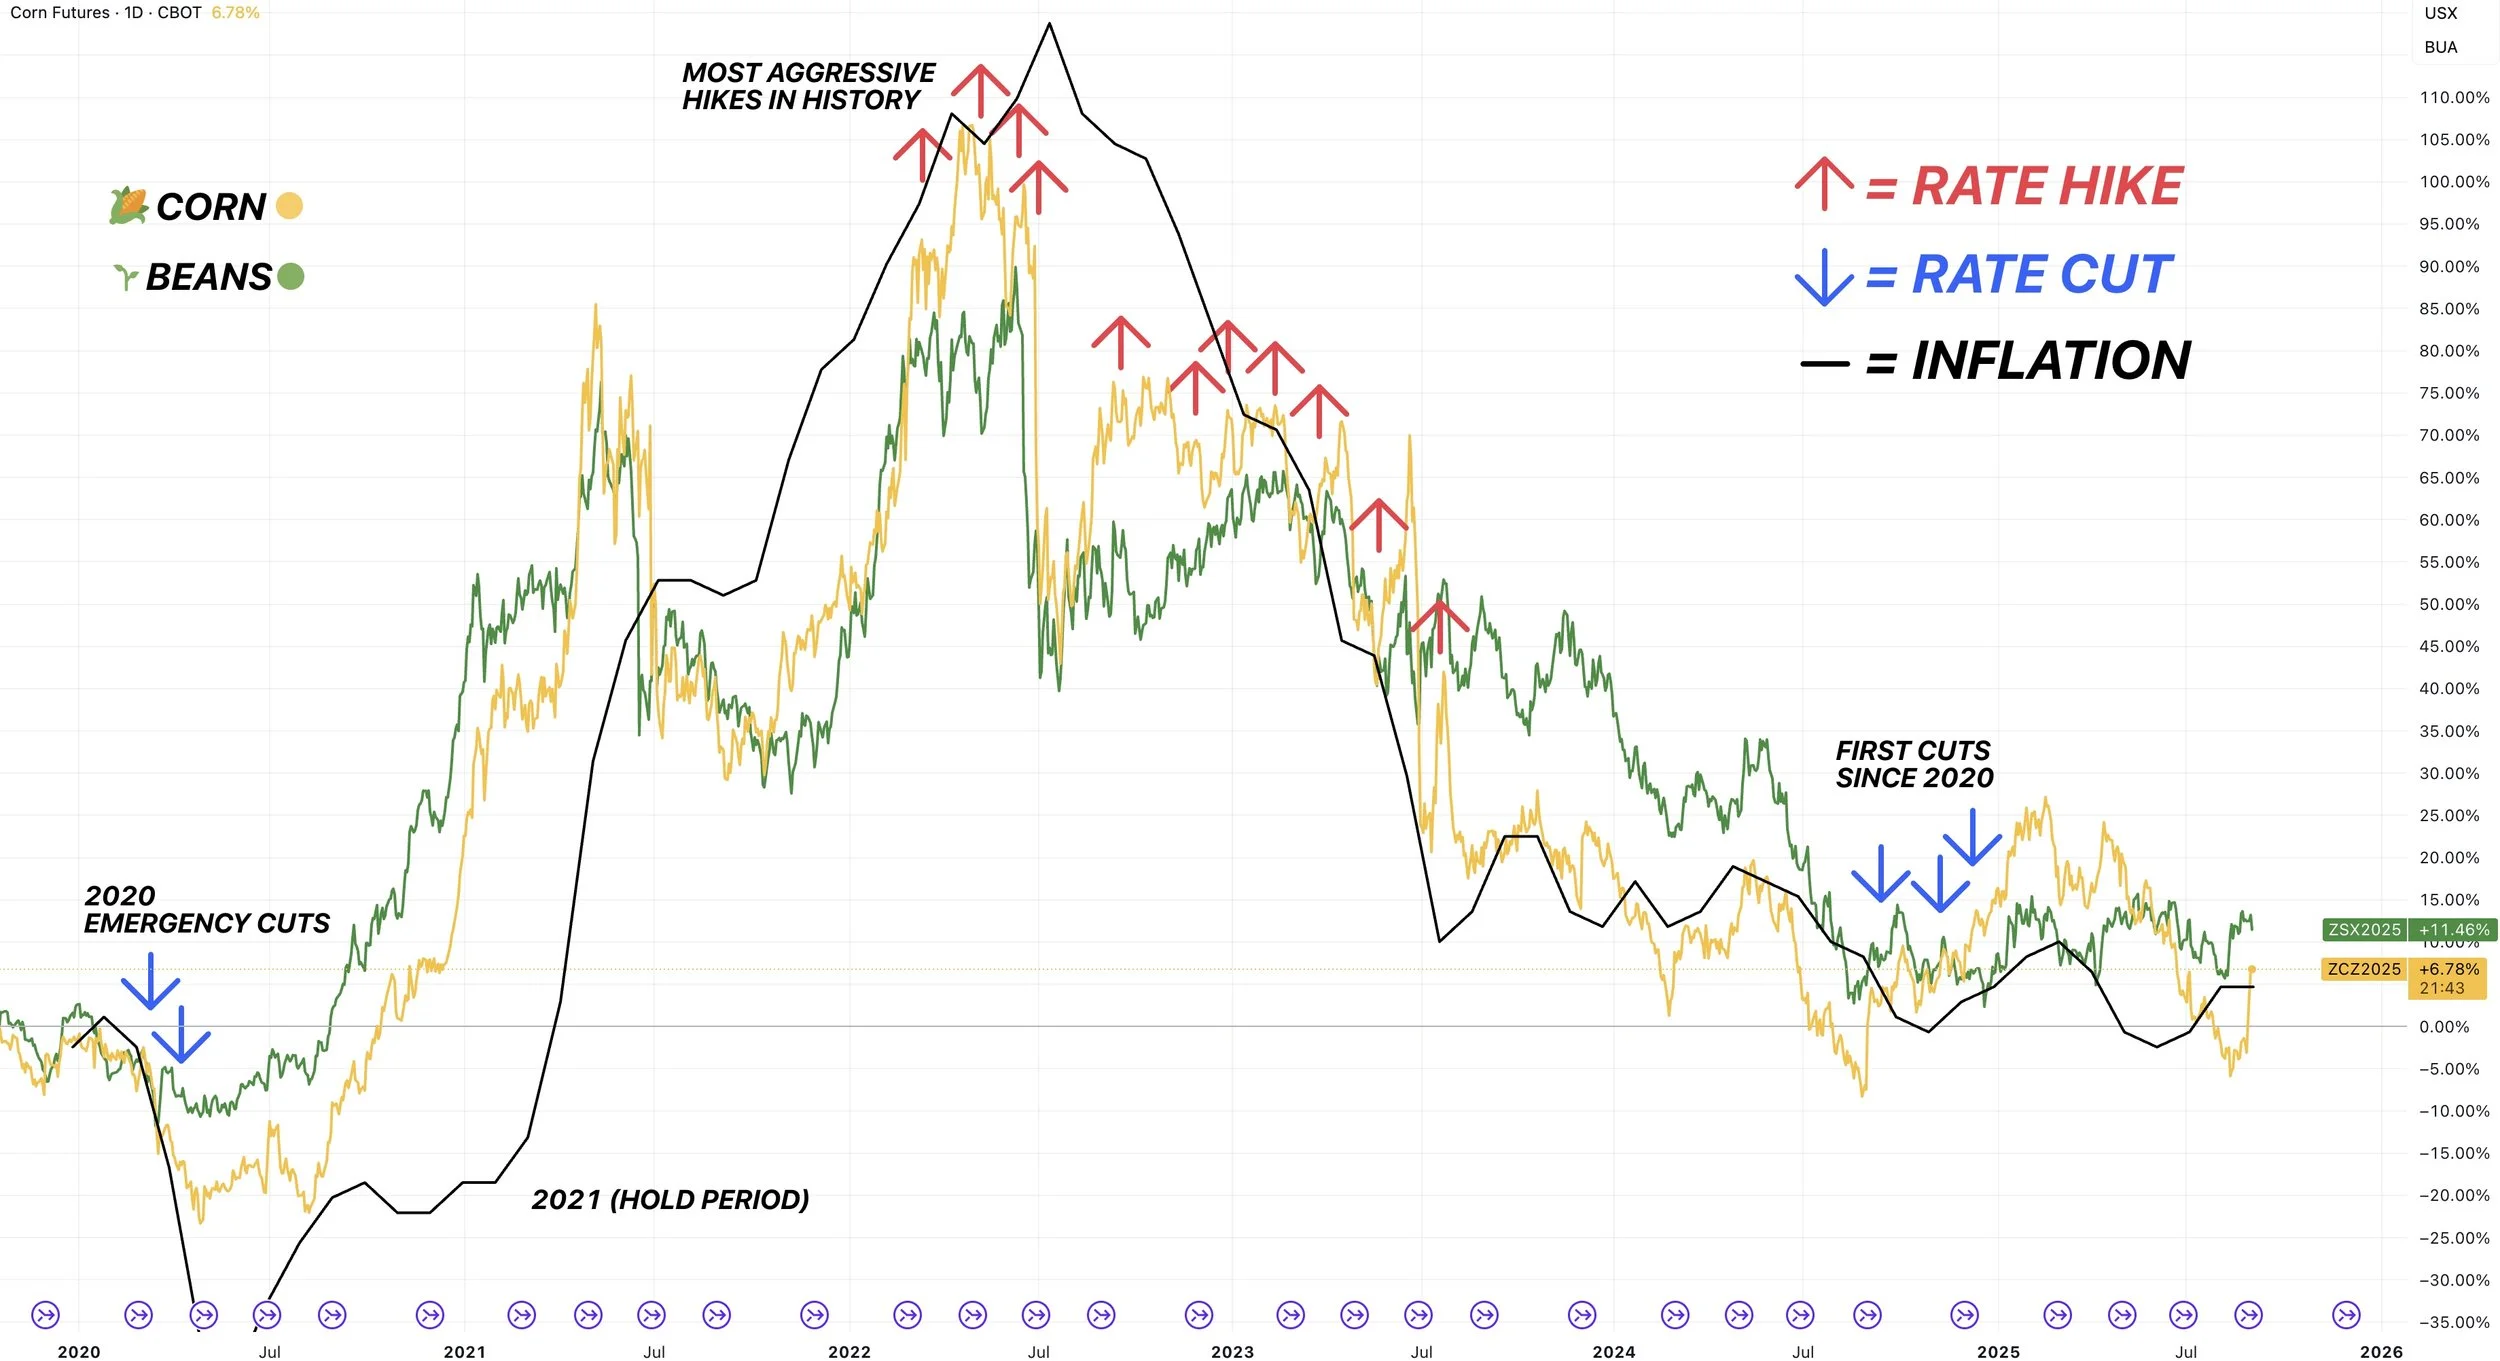
According to the betting markets, there is an 86% chance for rate cuts in September.
I could very easily see a scenario like last year pan out.
The funds are starting to buy at the exact same time they did last year.
Interest rate cuts are coming just like what we saw last fall.

Today's Main Takeaways
Corn
September Rally in Corn?
How often does the corn market rally through out the month of September?
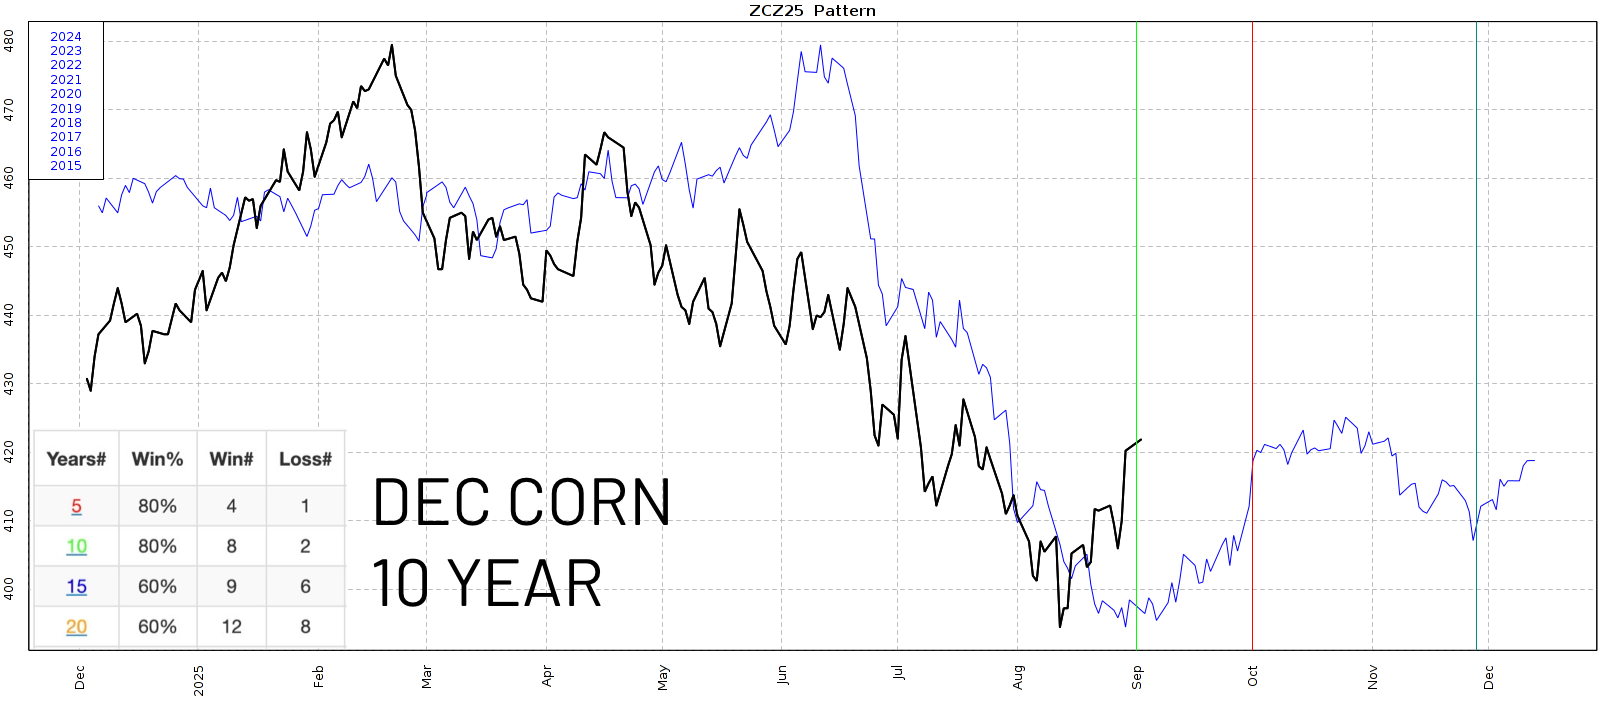
First, here is the 10-year seasonal.
Normally, this market has pretty much bottomed on September 1st and rallied through October 1st the past decade.
I don’t think it's a coincidence that this rally is just in time for fall insurance pricing.
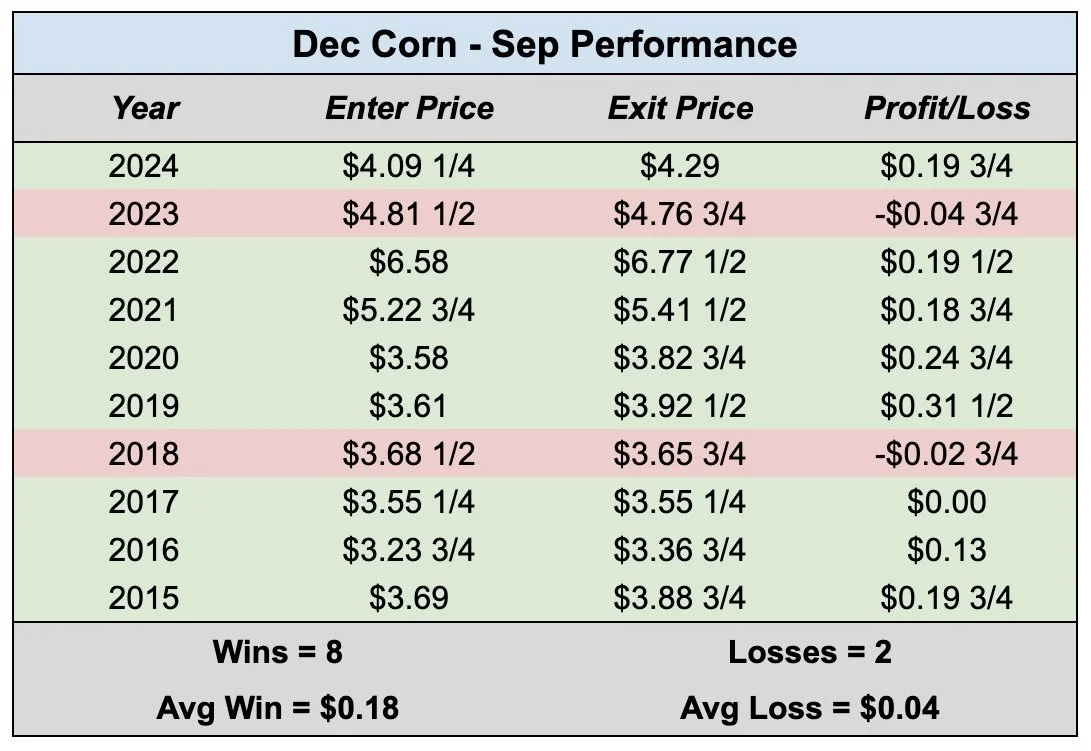
Now here is the data for corn's performance in September.
We have traded higher in September the past 8 of 10 years.
Higher the past 4 of 5 years.
The only two years we did not trade higher were 2023 and 2018.
Average rally is +18 cents.
Average loss is -4 cents.
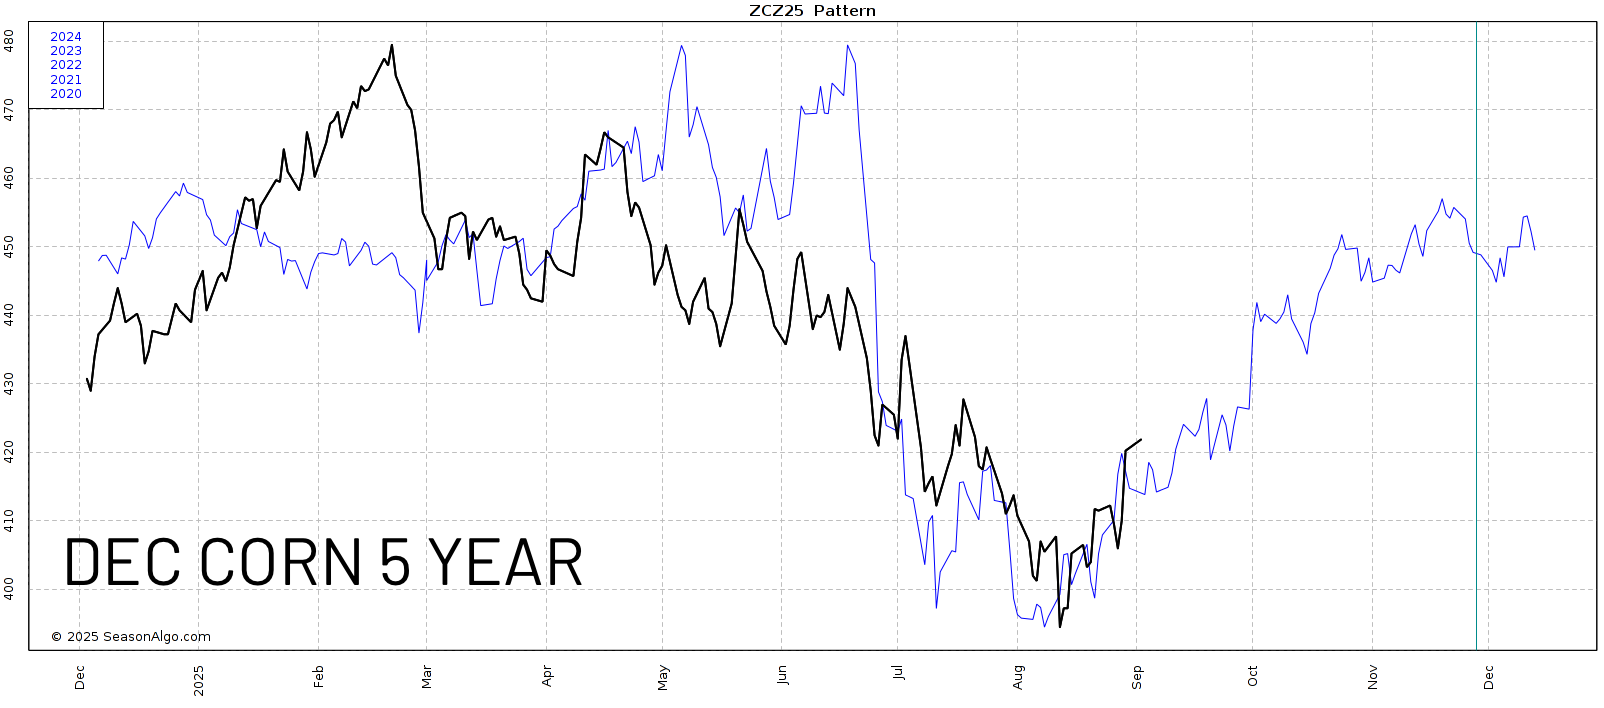
The 5 year seasonal here is pretty interesting.
We bottomed exactly where it had us bottoming.
On average the past 5 years, we continue to climb higher throughout the end of the year.
The crop is getting smaller. Demand remains at historically great levels.
I'd like to think most dips get bought in the corn market until at least the USDA report.
Because I'm sure there are plenty of traders who are curious to see where yield comes in at before getting more bearish than they were a few weeks ago, given that there is zero chance yield gets bigger.
Yield is getting smaller. But whether yield is 185 or 180 is anyone's guess.
The massive 97 million acres of corn is going to make a huge rally tough and limit our upside unless yield is closer to 180. Because even if yield only slips a little bit, we are still going to have record production.
Given that the USDA also has some giant demand projections, there is some wiggle room for them to knock demand lower if production gets adjusted lower as well.
Regardless, I do think there is a very solid chance we have printed our harvest lows, which I'll explain in the charts.
Daily Dec Chart:
We closed above the 61.8% retracement up to those mid-July highs (red box).
What does this mean?
It tells us that this rally off contract lows is seen as more than just a correction bounce. It has some impulse to it.
Which makes me believe the harvest lows are in.
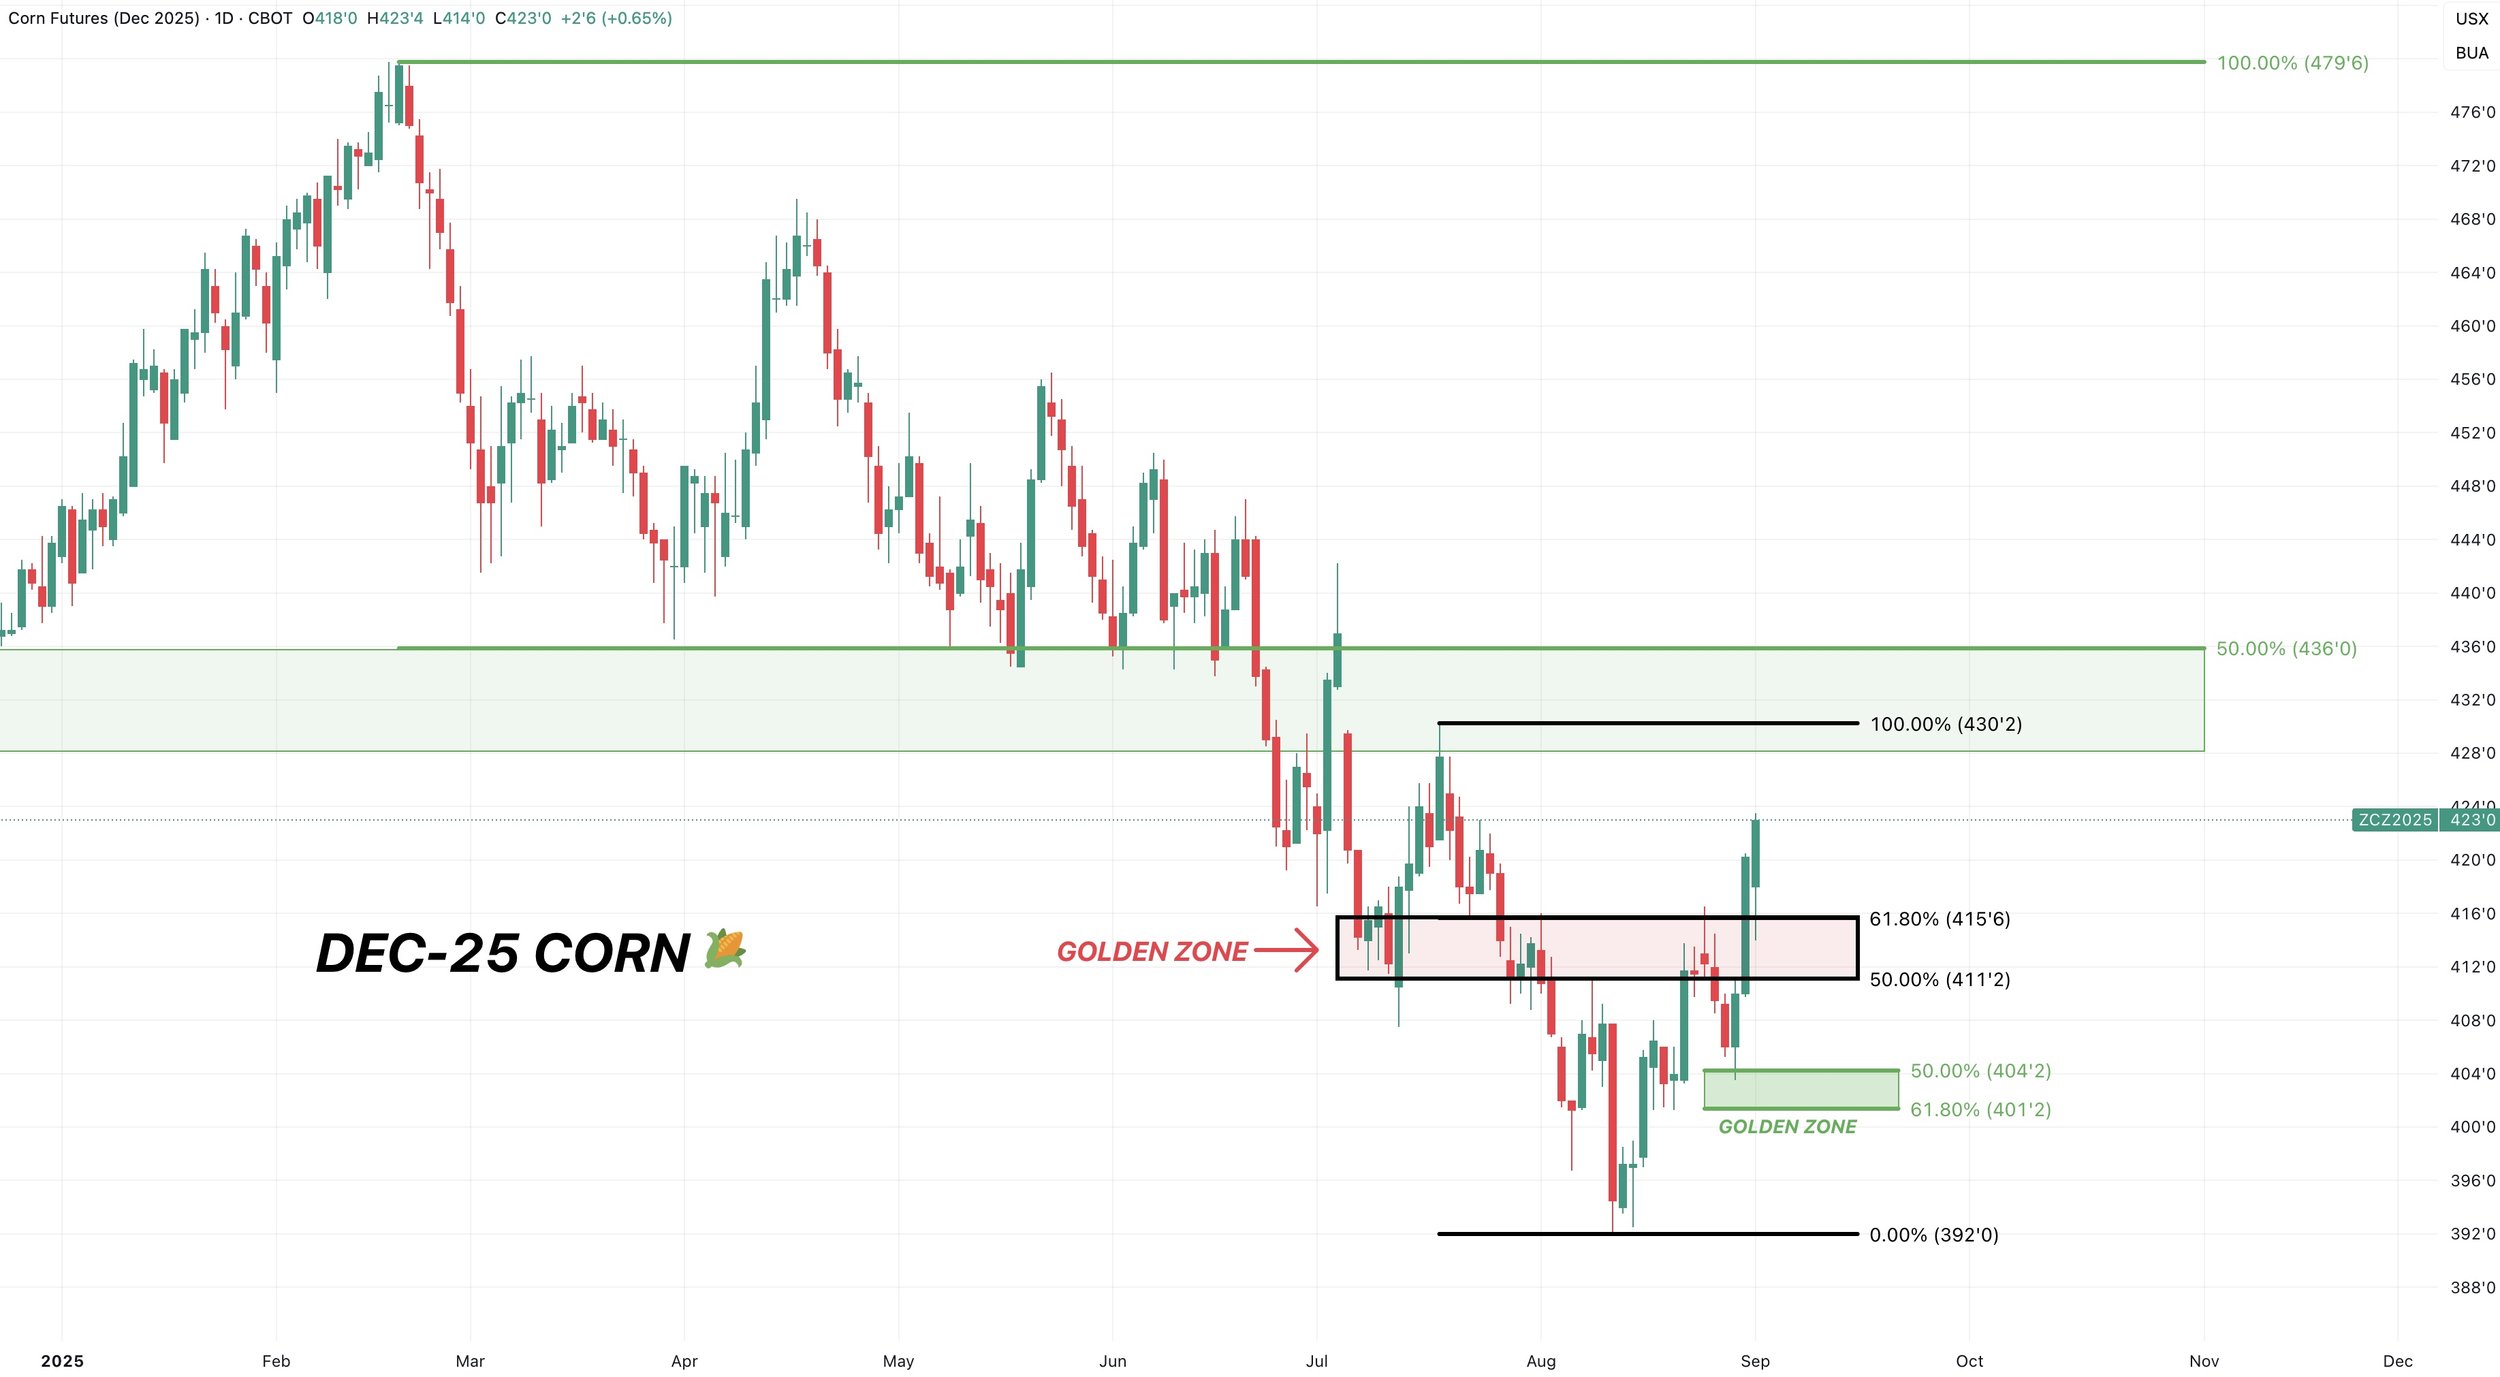
Now what?
We are potentially busting above this downward trend from April.
We rejected off this simple line several times since then.
This could spark a leg higher and get some momentum behind this market, if we break out.
I'd say we need one more day higher to confirm we're breaking out.

Target:
How high?
I am eyeing the $4.35 level.
That is where I would look to de-risk.
Not only is it old support from spring (now resistance).
This level also claws back 50% of the highs from February.

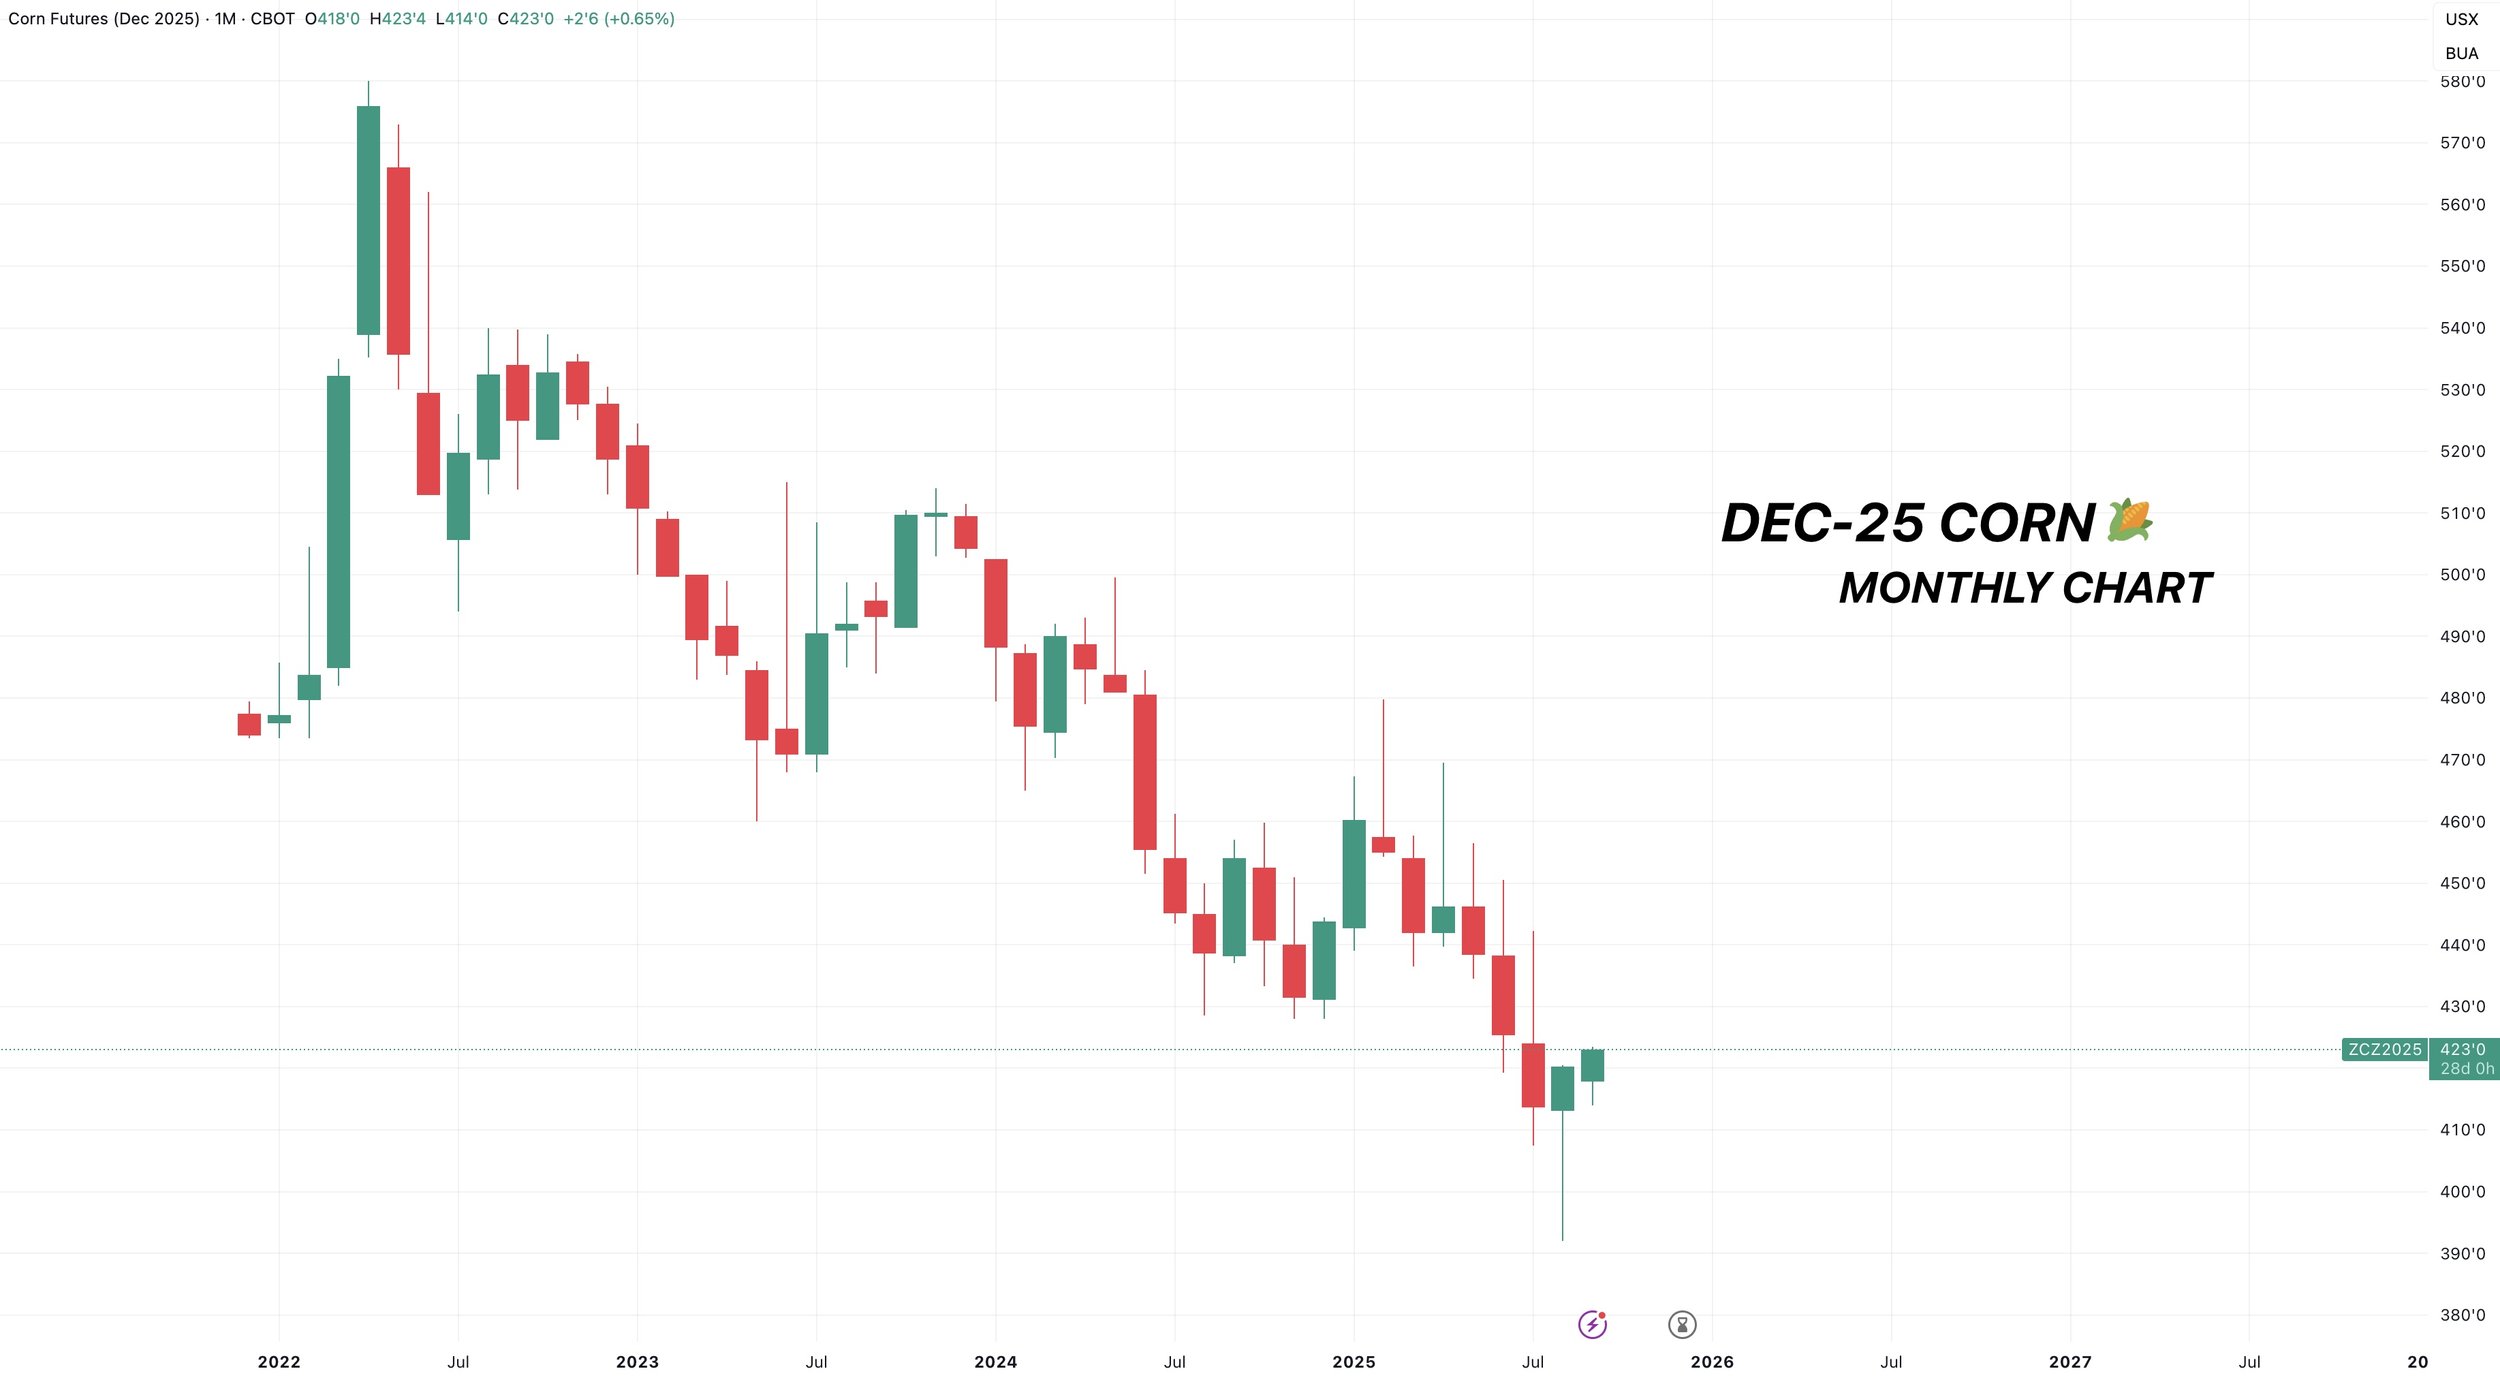
Monthly Chart:
This is a phenomenal looking chart.
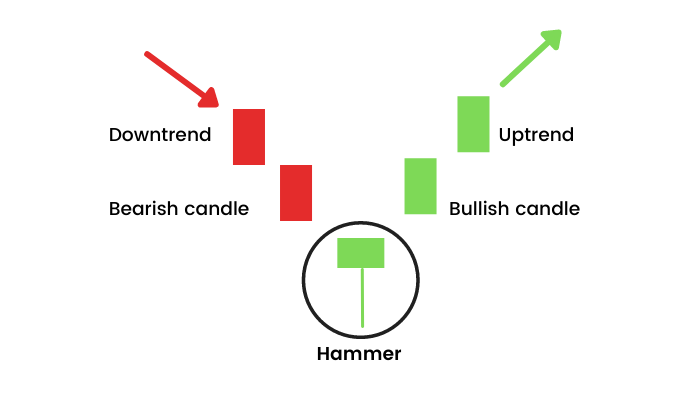
We posted a hammer candle last month.
Which is viewed as a bullish sign if you see follow through to the upside.
Soybeans
After market close today, soybean crop conditions came in at 65% rated G/E.
Last week we were at 69% and the trade was expecting 68%.
So a pretty big swing from last week and a surprise lower.
Maybe the record dry August is starting to show up.
You'd like to think this might spark some interest.
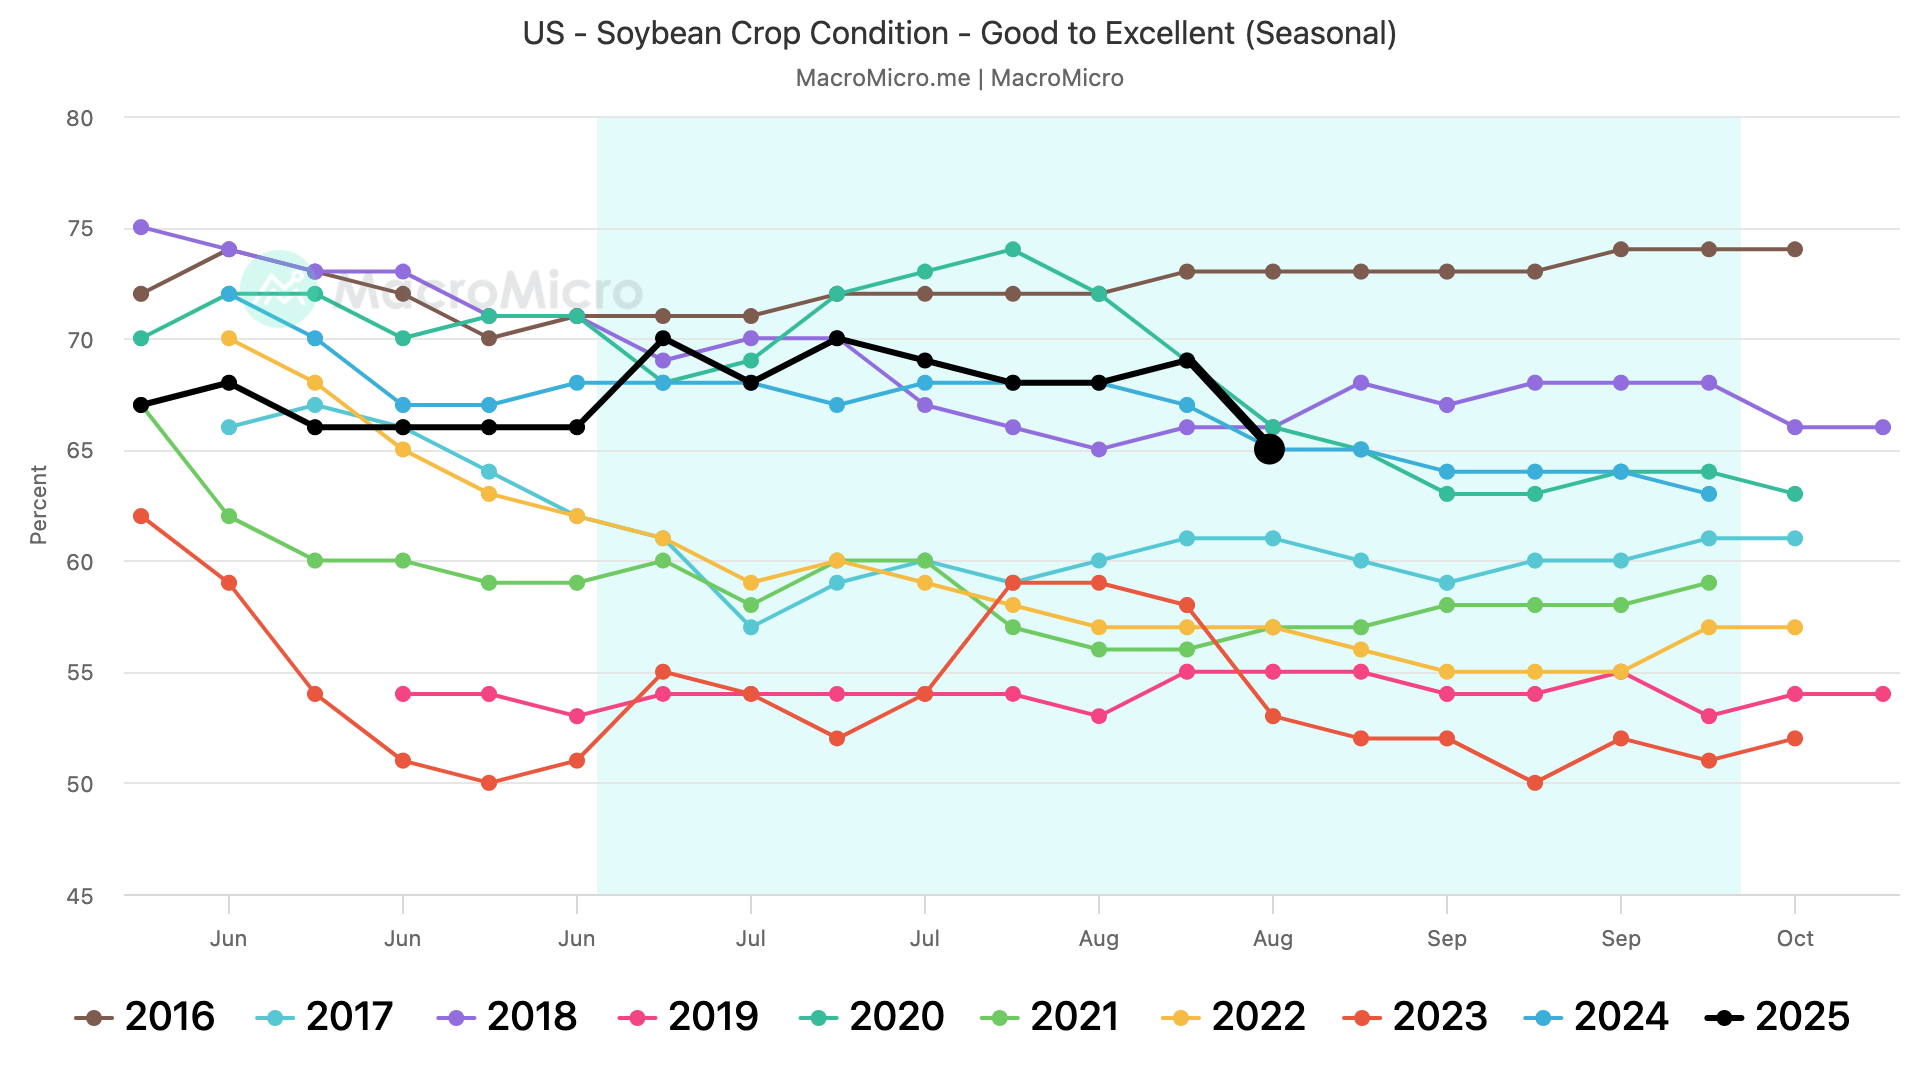
The soybean crop isn’t getting bigger.
August is where beans are made.
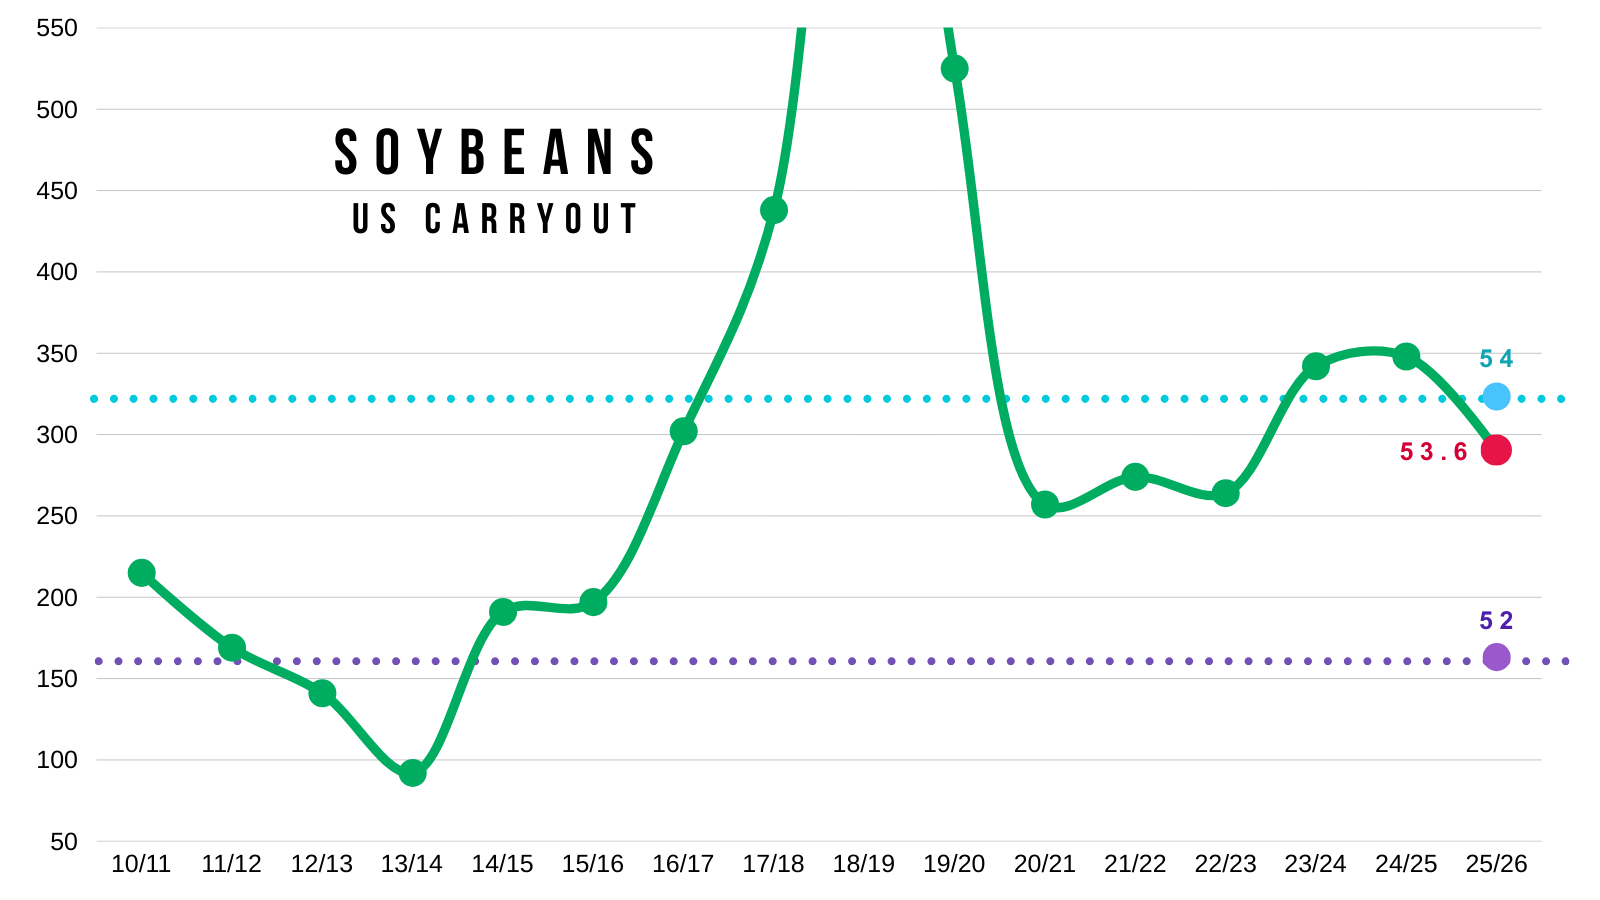
One of the driest August's on record doesn’t scream a near 54 bpa yield to me.
Soybeans have a ton of upside "potential" because the room for error on the balance sheet is razor thin.
I'm not going to get too into this today as we've went over this a thousand times.
Acres are the 2nd lowest in a decade.
This is why the balance sheet has a pathway to become incredibly tight.
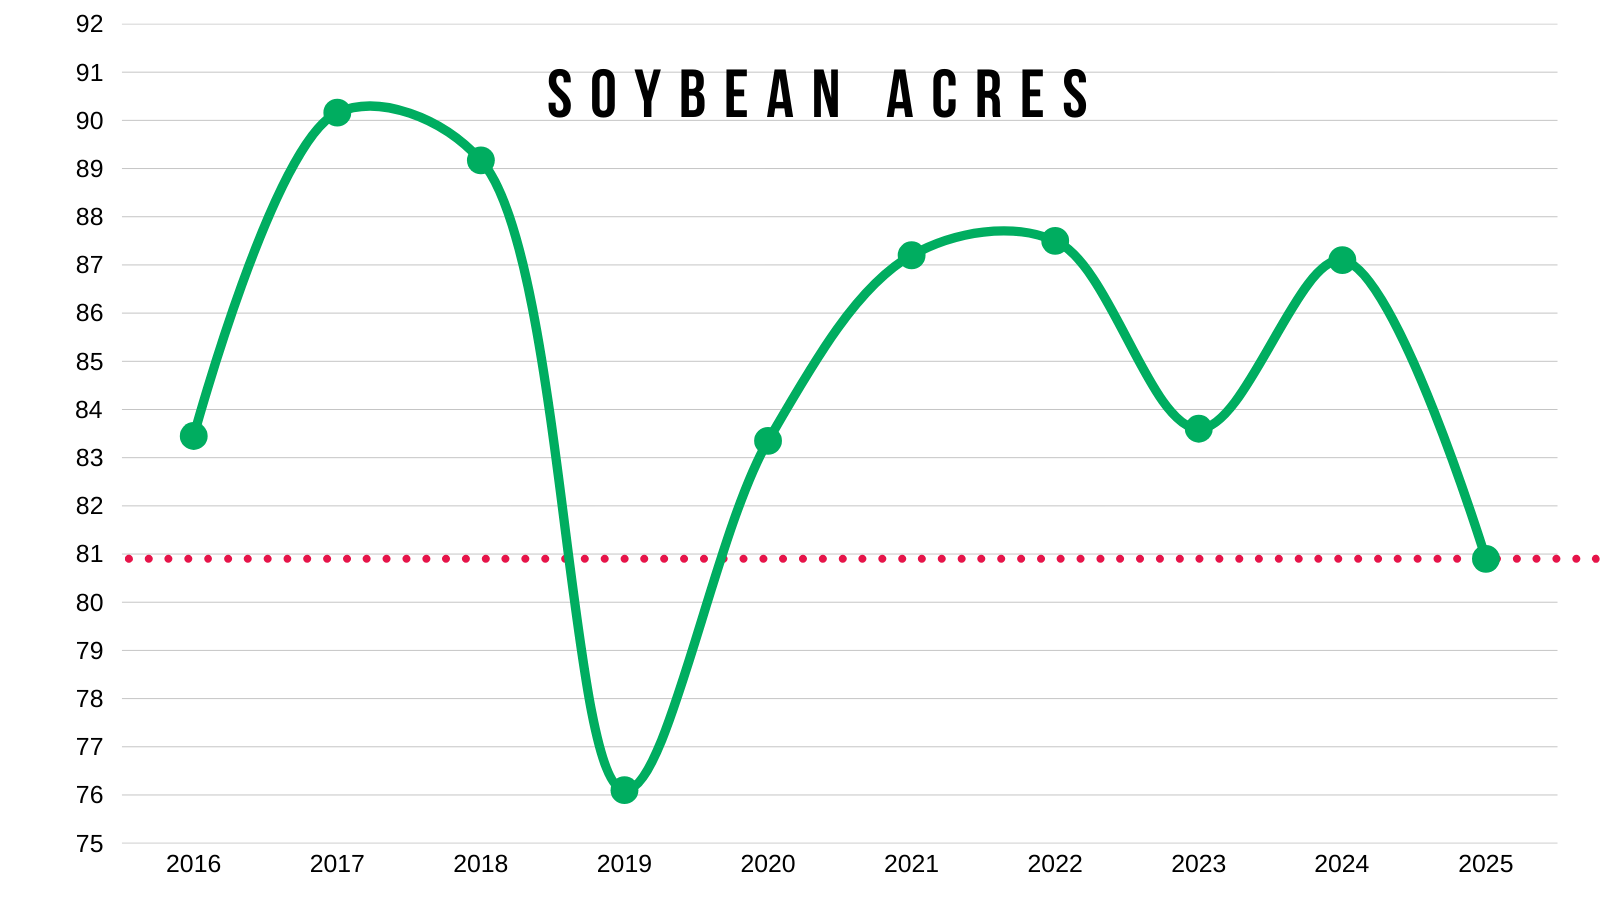
But even if yield came in at 54 bpa our carryout would still be lower than last year due to the drastically small acres (without changing demand).
We've never seen a 52 bpa yield. Even if yield slipped down to 52 our carryout would drop to the lowest levels in a decade.
That is why there is "potential" for this market.
Now.. on the other hand.. none of this matters if our demand get's destoryed.
We need to sell some soybeans to China or this market could be in trouble.
Exports to China account for roughly 20% of all demand on our balance sheet. Without them, even if we have a crop failure we could still swim in beans.
But, I do think they eventually come to the table. If they do.. you can only imagine what reaction prices are going to have.
Given how tight the US balance sheet is. Instead of saying "what if China doesn’t show up" you could start asking yourself "what if China shows up".
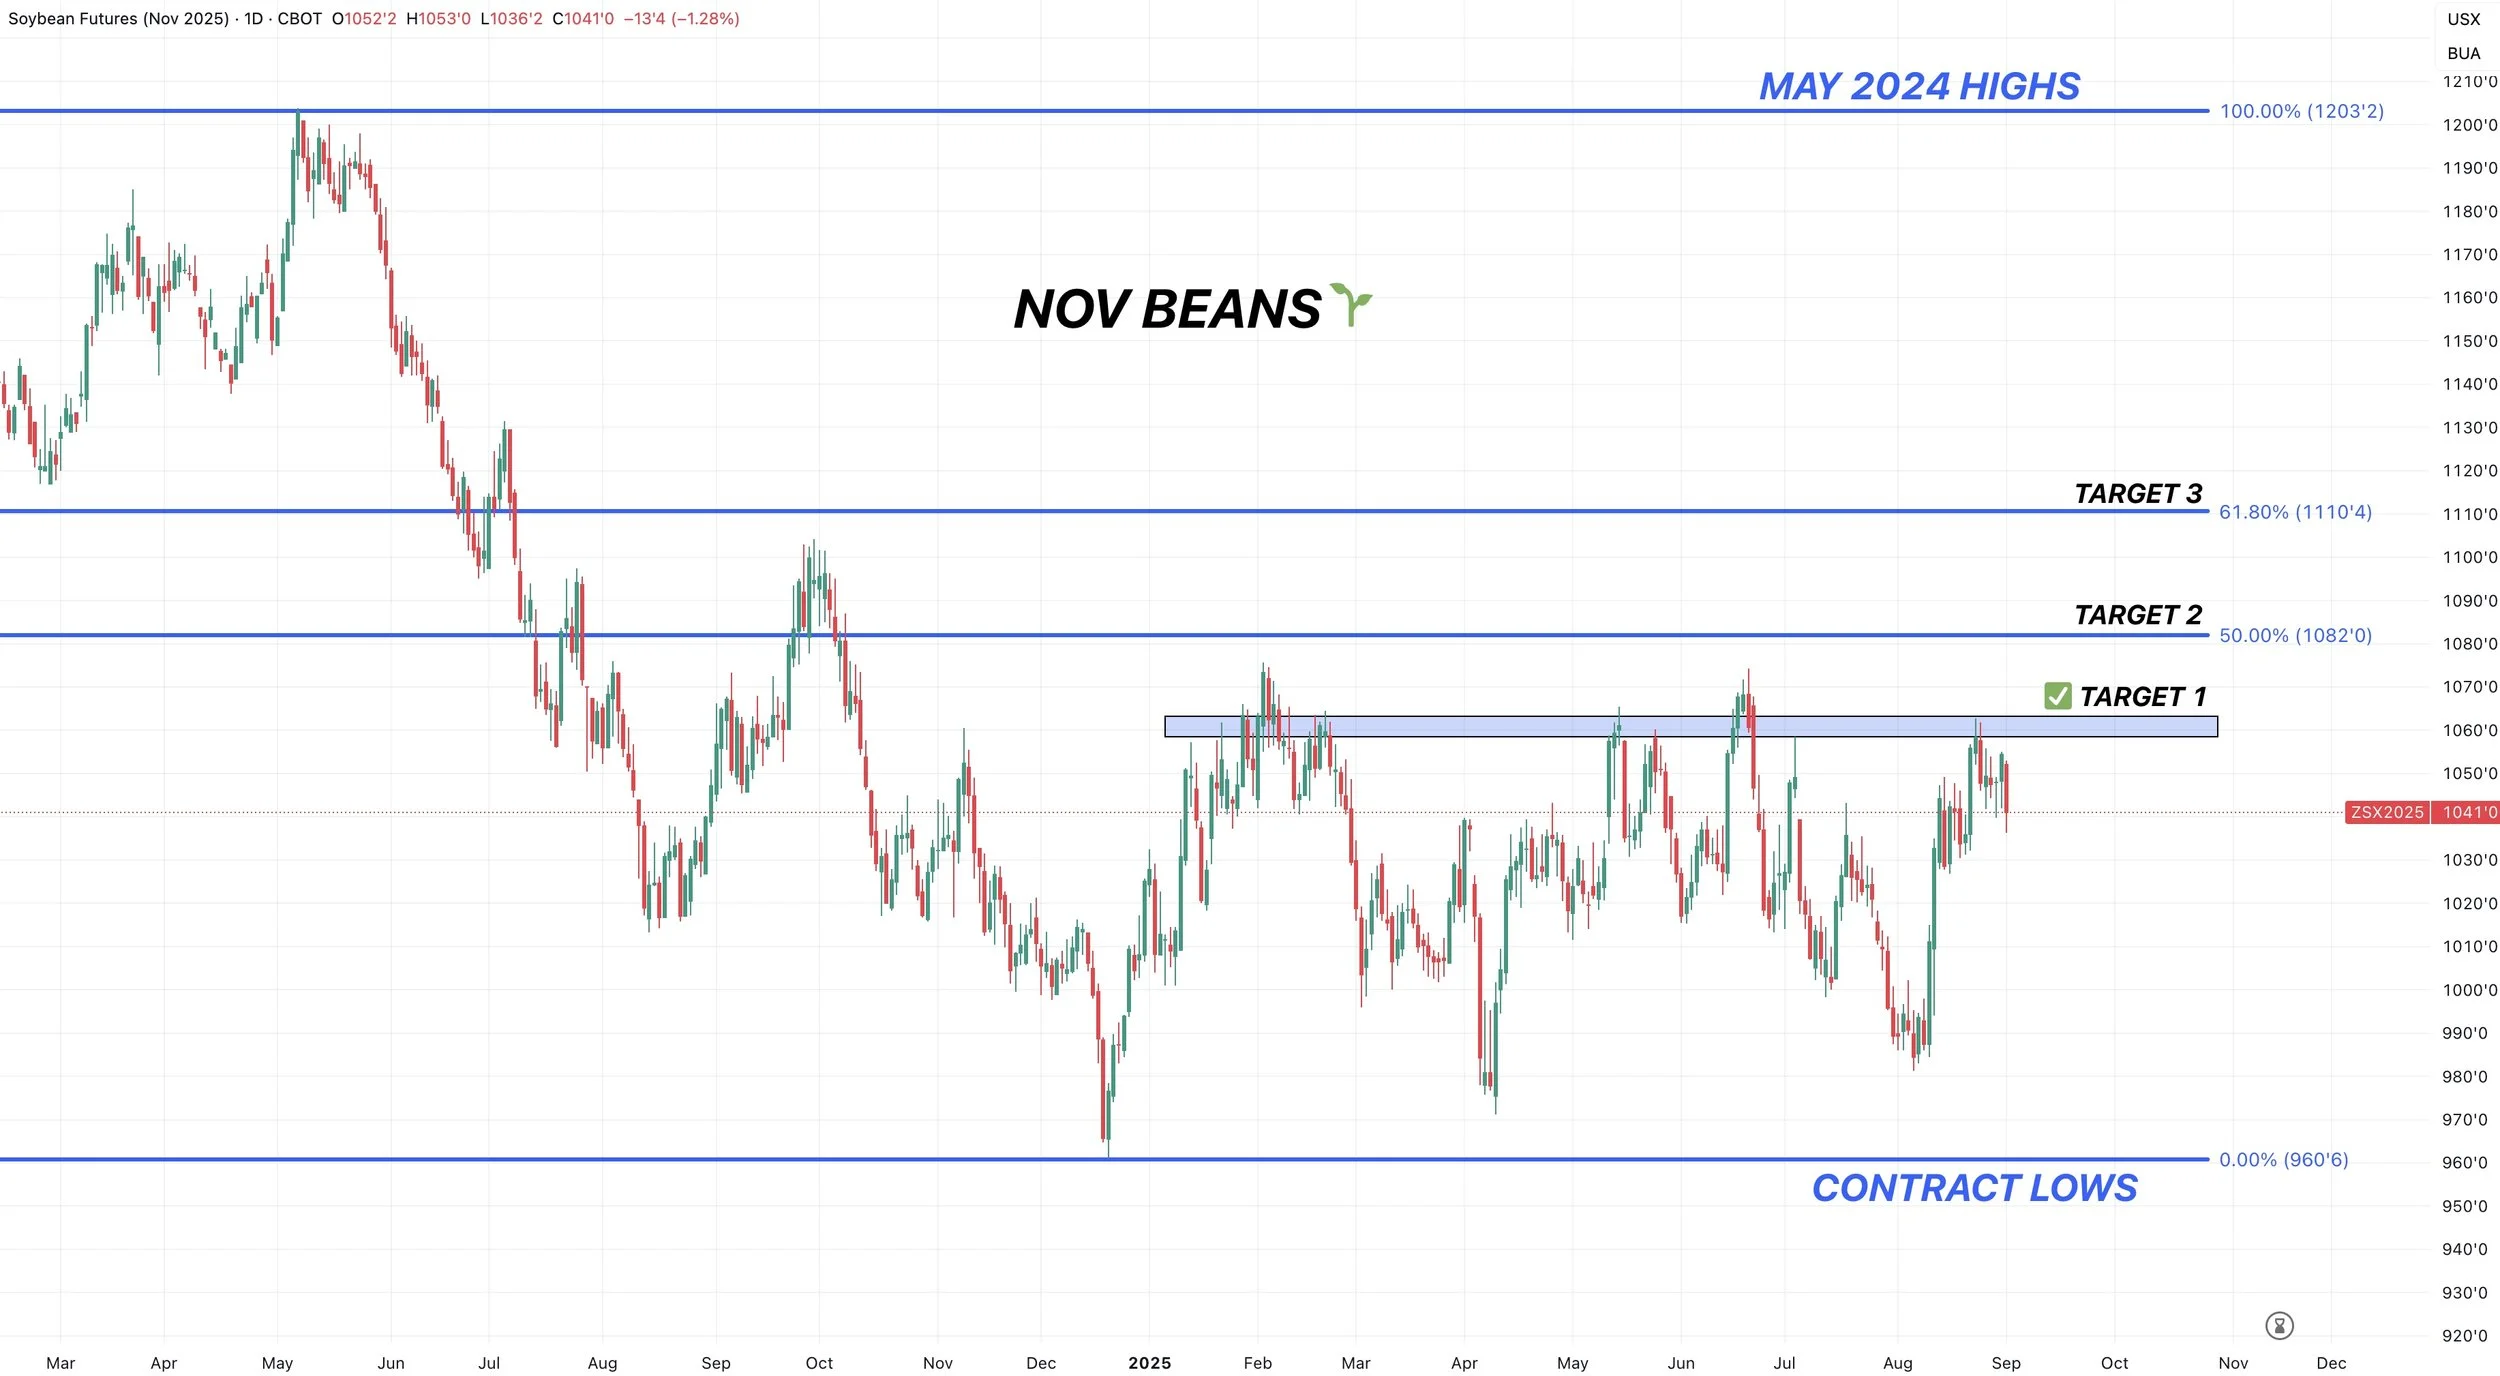
Daily Nov Chart:
Soybeans at a crucial spot here.
We closed just above the 61.8% retracement of the recent rally.
We need to hold here or it opens the door lower. Because a bounce here will let us know if this is simply a small standard correction, or something bigger.
We should know soon.
The big picture structure of this chart remains bullish as long as we hold $10.12. Realistically we could fall all the way down there and still be completely fine.

Next Target:
We had a sell signal two Fridays ago at the highs.
My next target is still going to be $10.82 as of now.
Targets don’t have to hit. They are there to let you know to de-risk if they do.
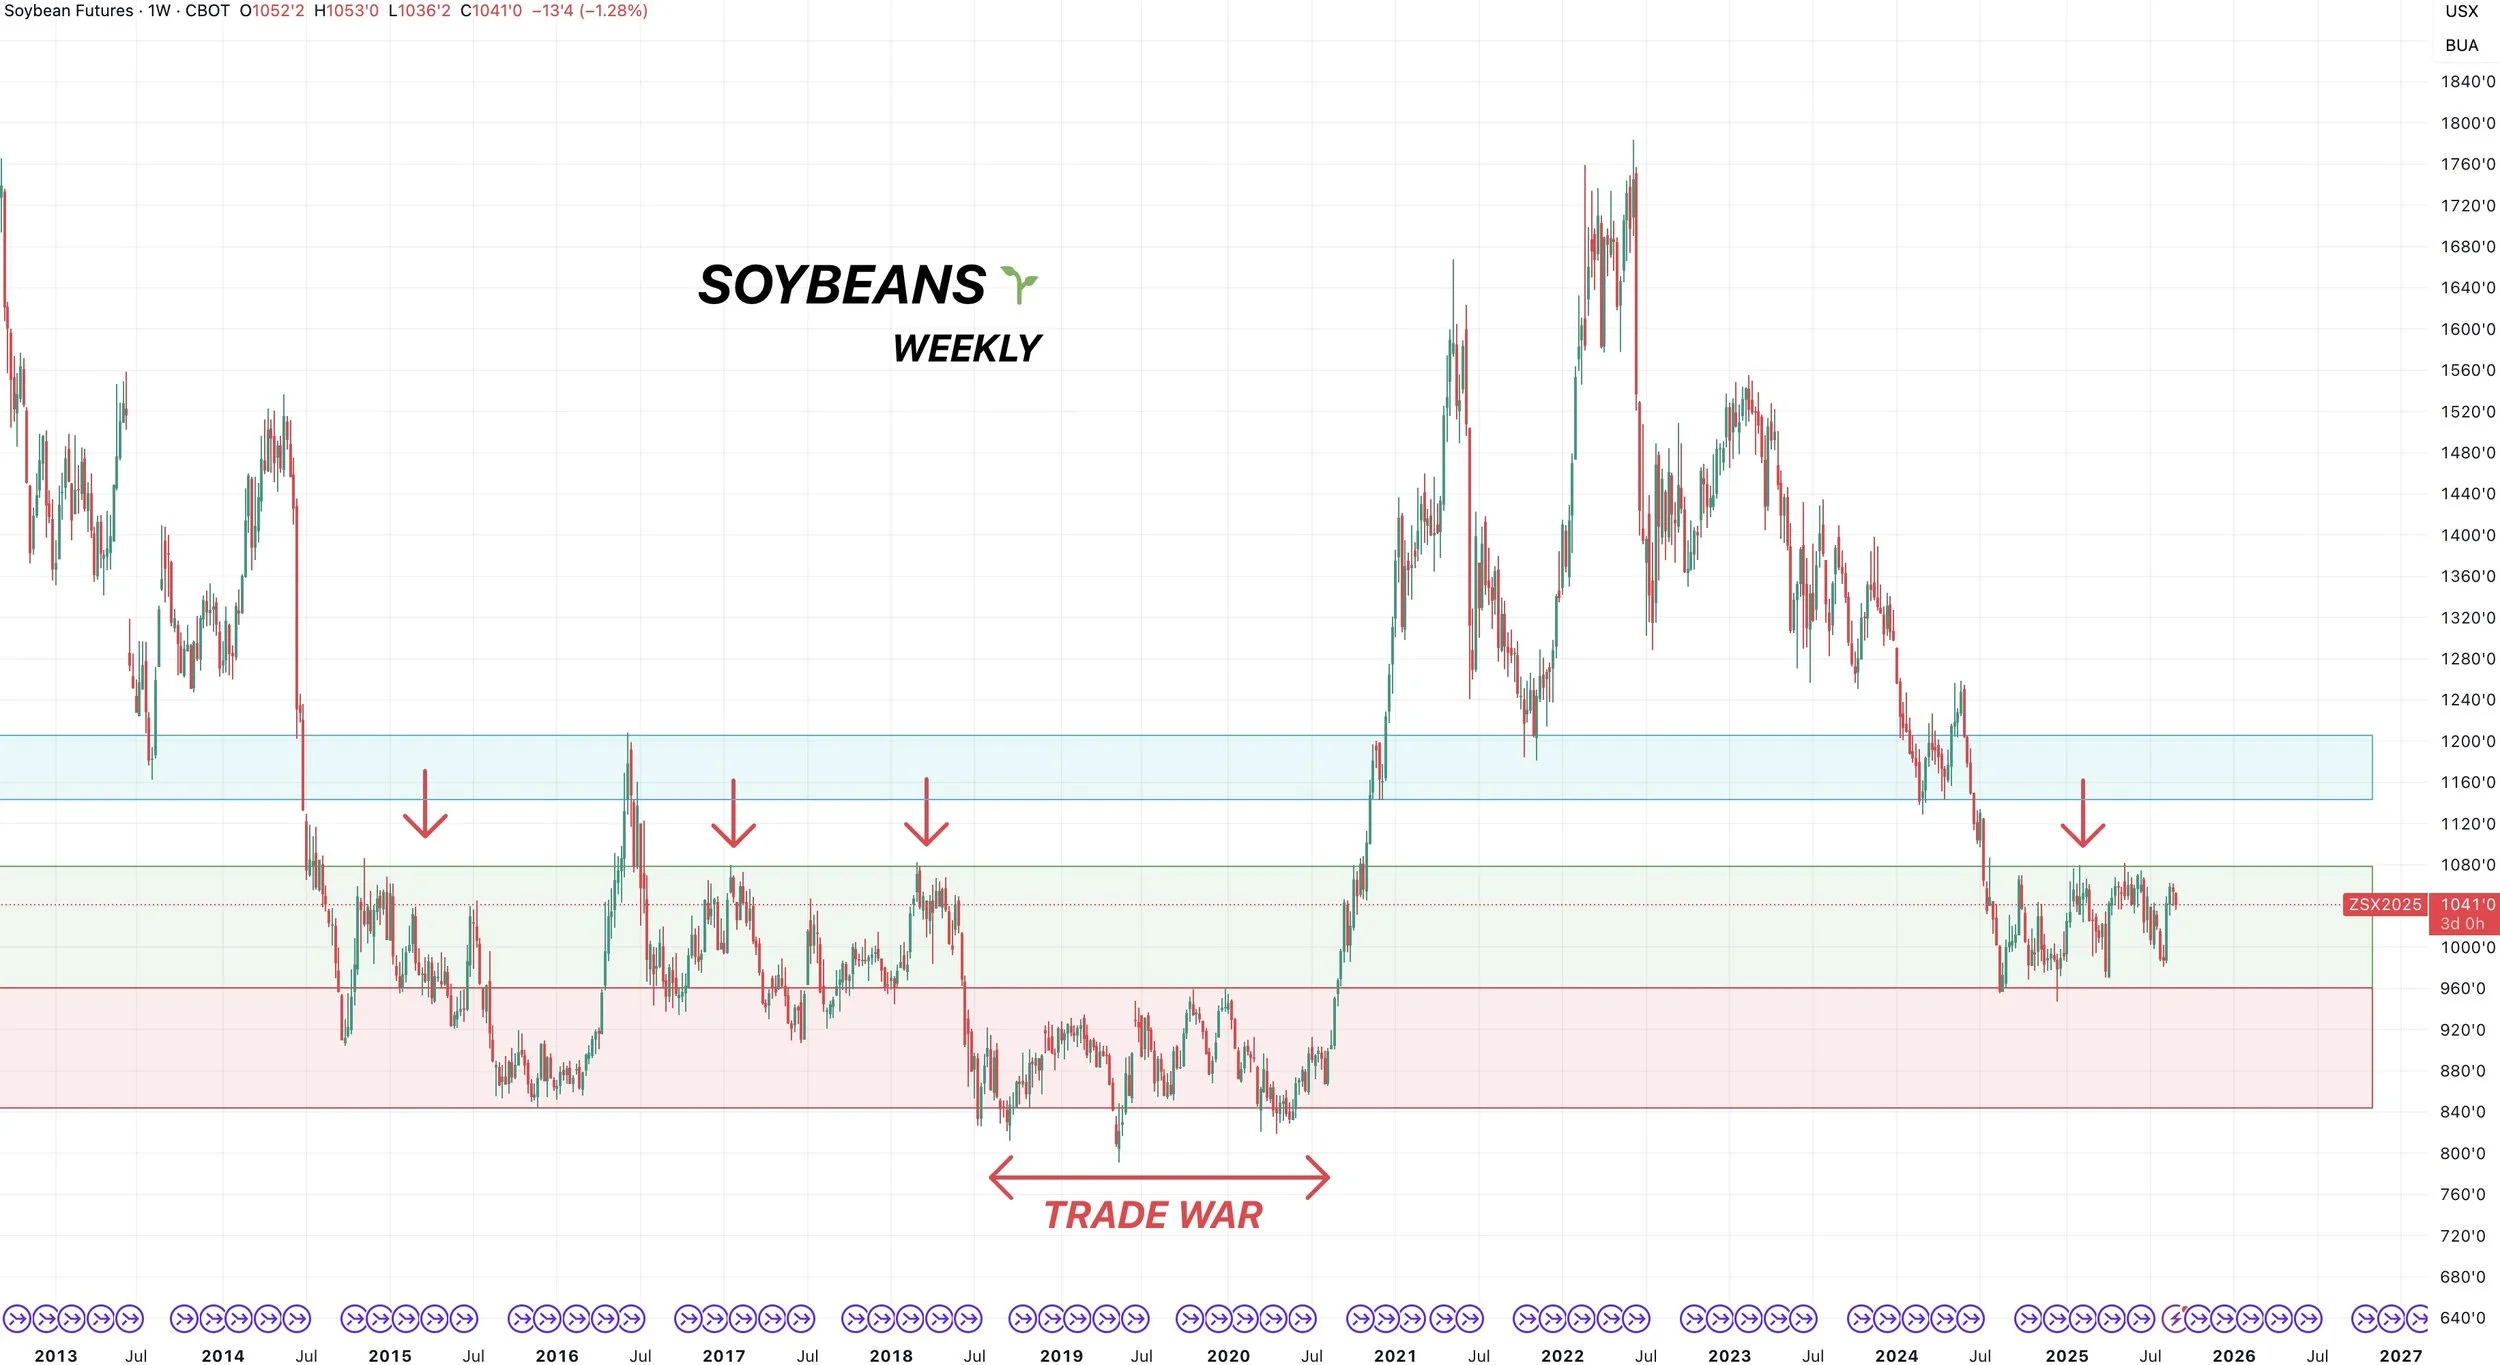
Weekly Chart:
I have no idea when or if we'll ever break above $10.80
But IF we do.. the upside in this market is at least another +50 cents higher.
We've been trapped in a small range for a year now.
Finding support right at those trade war highs.
Finding resistance right at the $10.80 resistance. Which was our lid from 2015 to 2018.
I also think we have found our long term lows. Last trade war was different than this one. Not only did we have a trade war, but Chinese demand was impacted by other factors such as swine fever.
Wheat
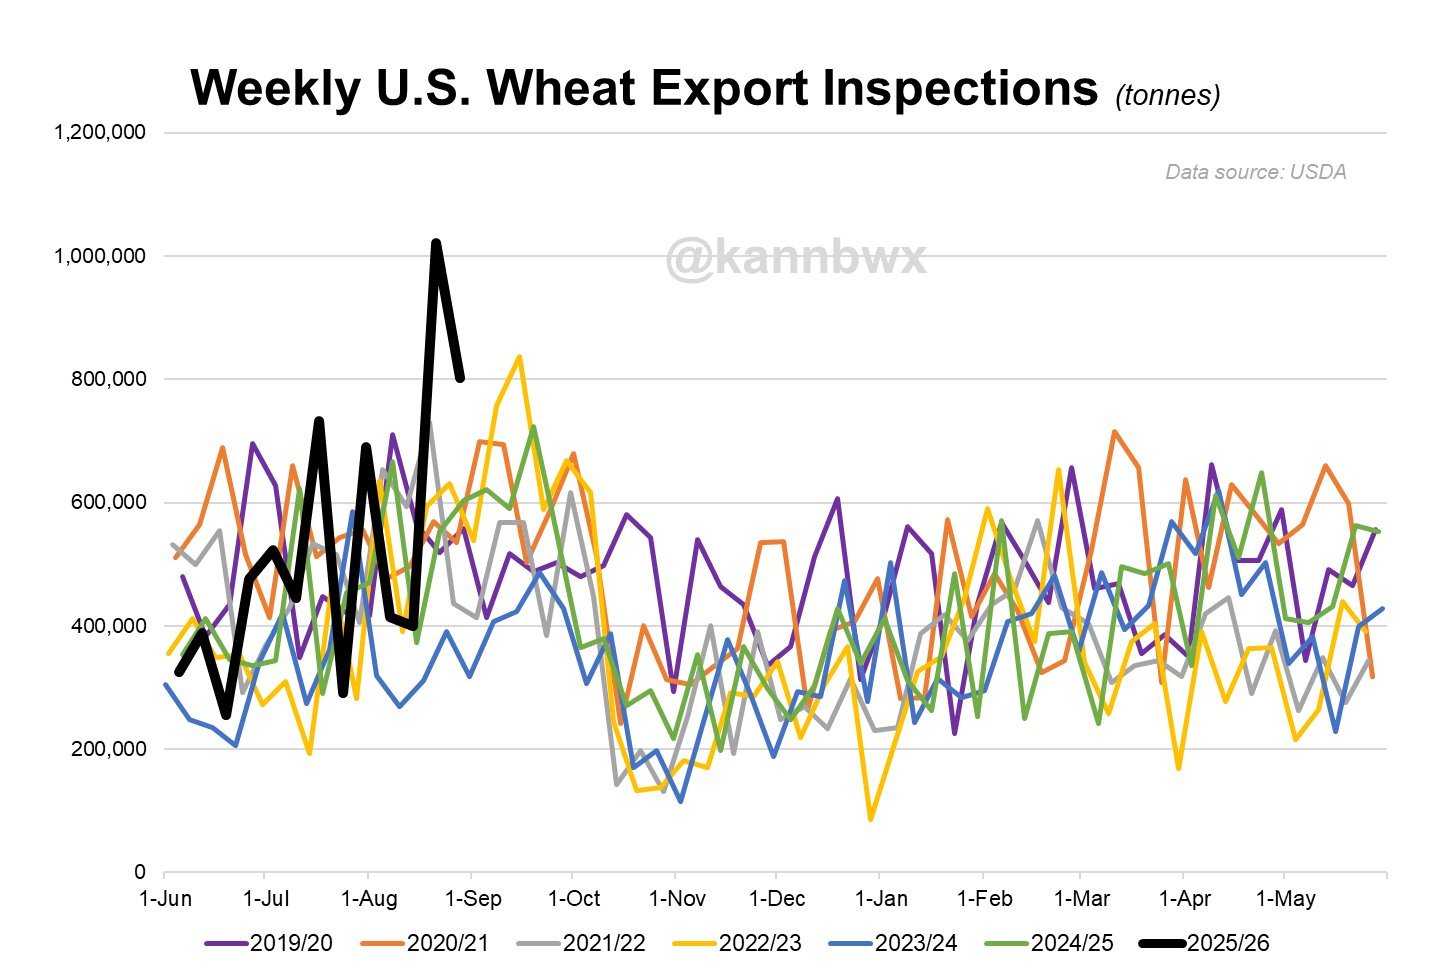
Demand continues to impress for the wheat market.
Just look at this chart that compares this year to past years from Karen Braun.
This year is shaping out to be a in a league of it's own.
Last week's export inspections were for the best since all the way back in 2013.
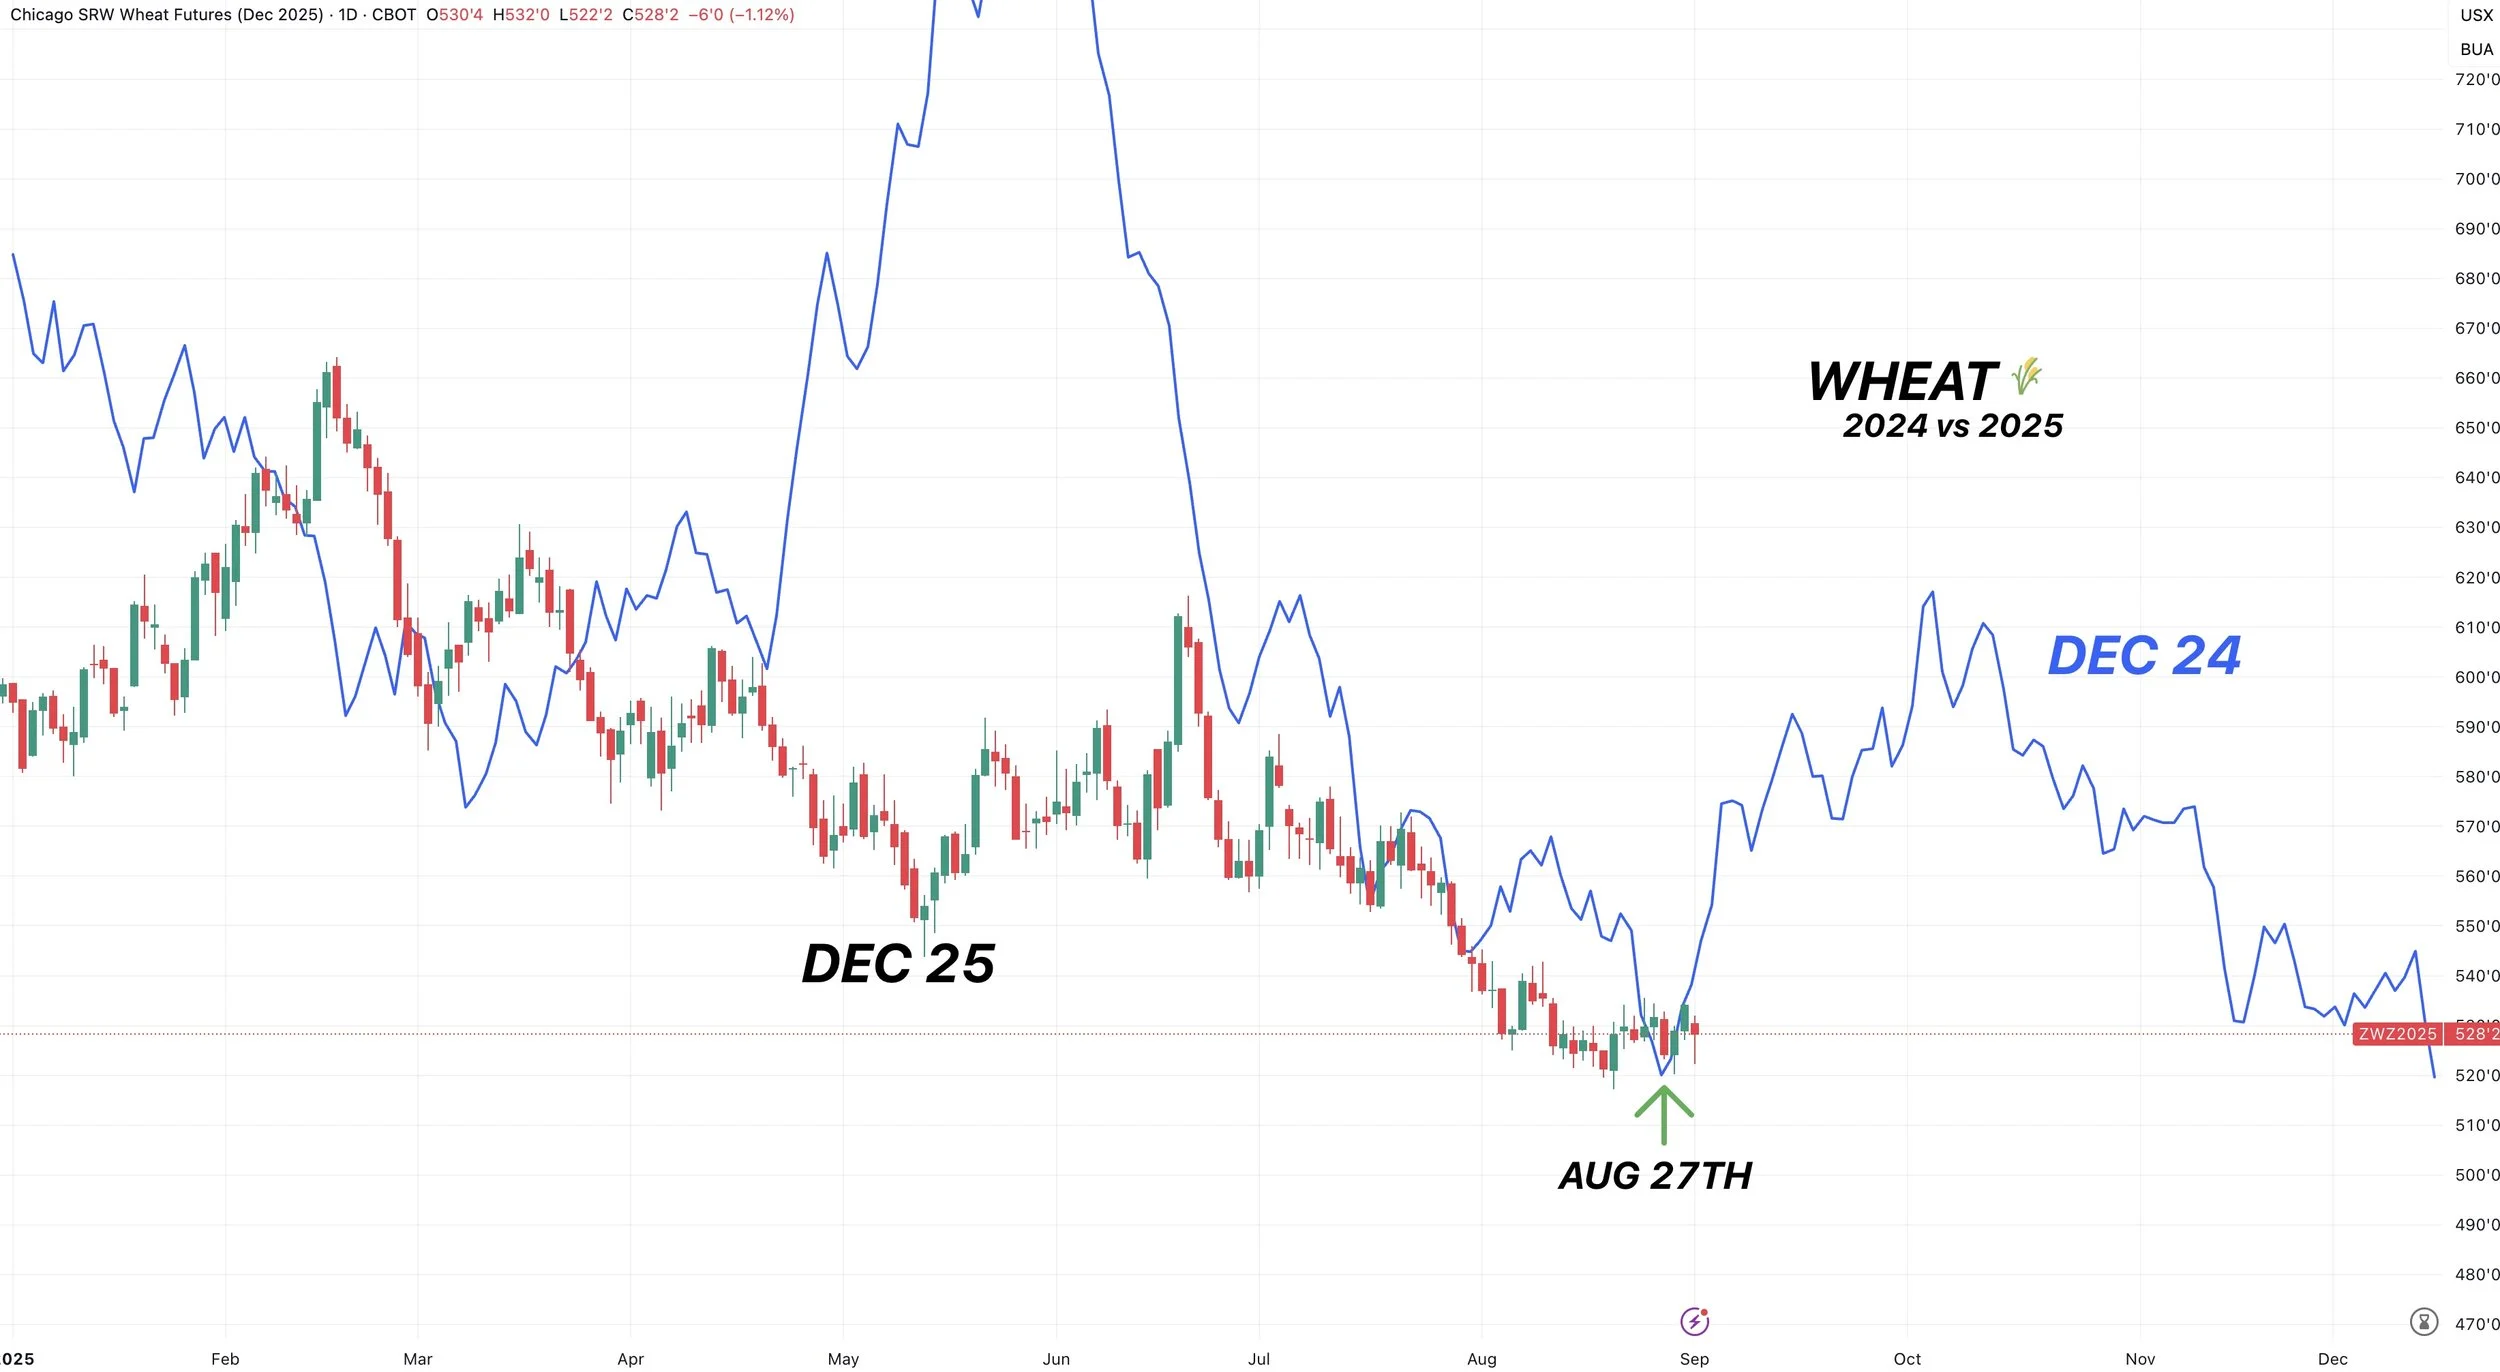
Last year the wheat market bottomed on August 27th.
Which is right around where our recent lows are.
Last year after the lows, we saw a +95 cent rally going into October.
The bottom came at $5.20, which is almost the exact same price we saw our recent bottom in August.
No we don’t have to follow the exact same path and probably won’t.
But seasonally the wheat market starts to catch bid here.
Demand is the best in years.
The funds have started to shift into buyers.
The seasonals have shifted friendly from here.
I just see wheat being undervalued here.
We recently alerted a buy signal for the wheat market. I do still like re-owning here. As the charts are still in tact.
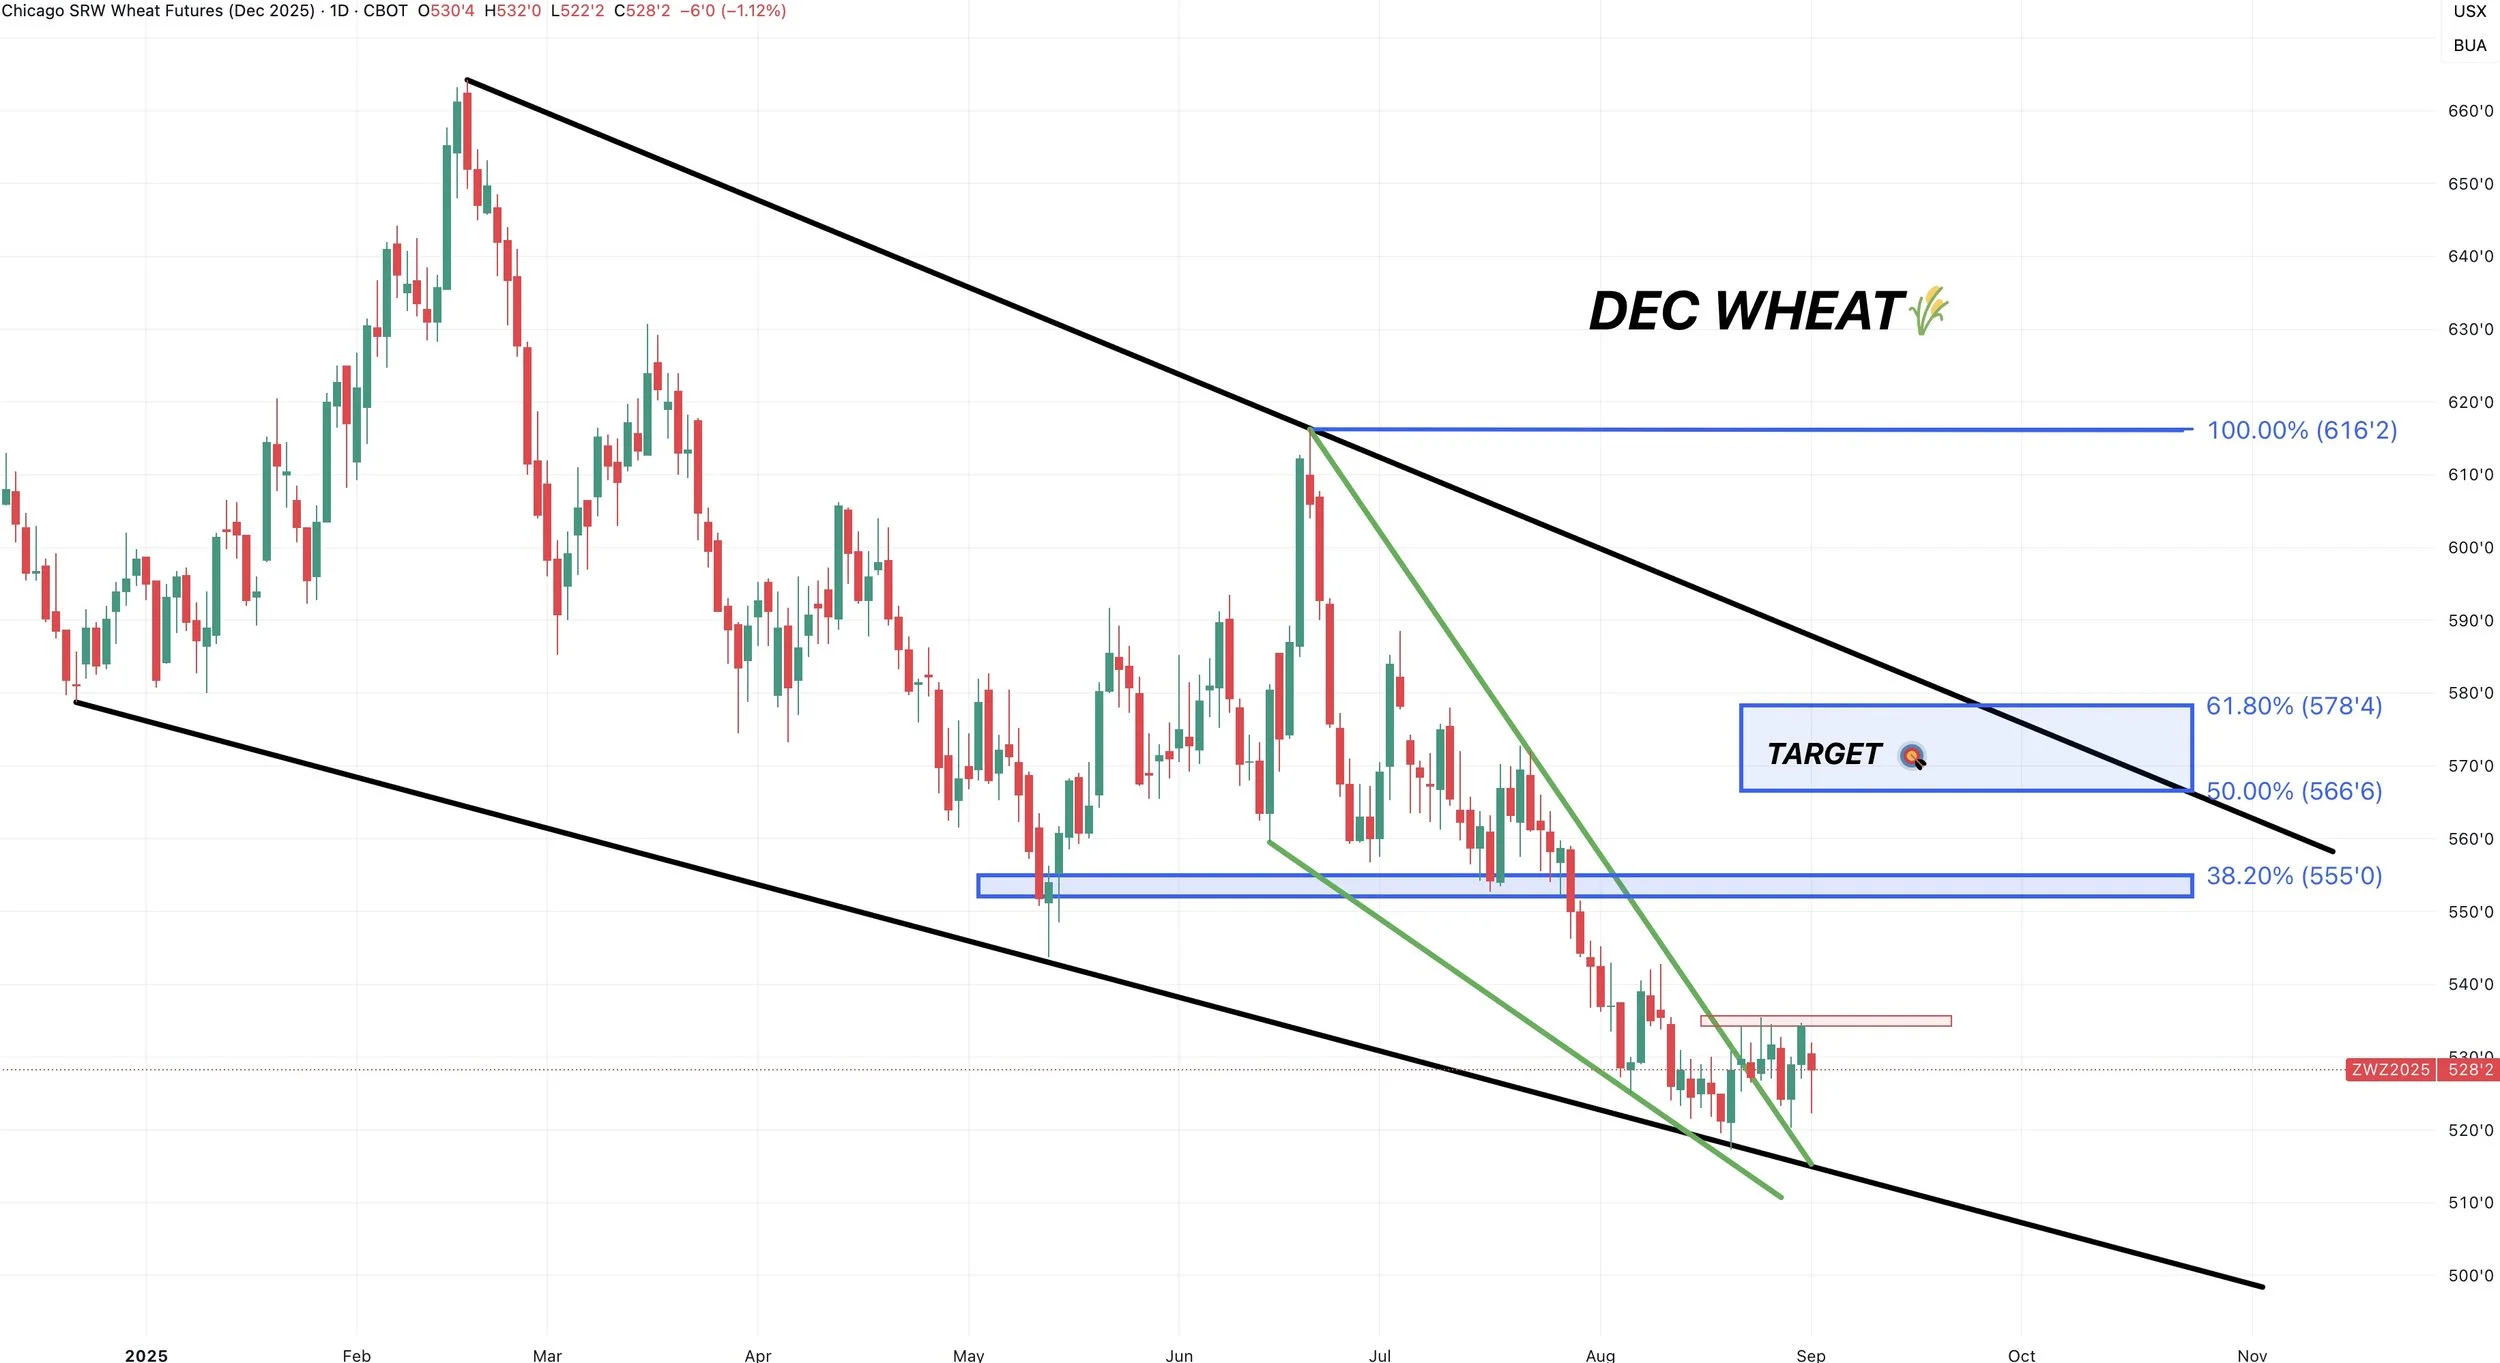
Daily Chicago:
I still really like this chart.
We are breaking out of this falling wedge pattern which is seen as bullish (green lines).
If we can bust above the $5.35 level our next real resistance is going to be $5.55
Which is old support and claws back 38.2% of the June highs.
I am still eyeing the $5.66 to $5.78 level to de-risk heavier.
That gives back 50-61.8% of the June highs. It is also the top of this massive wedge.
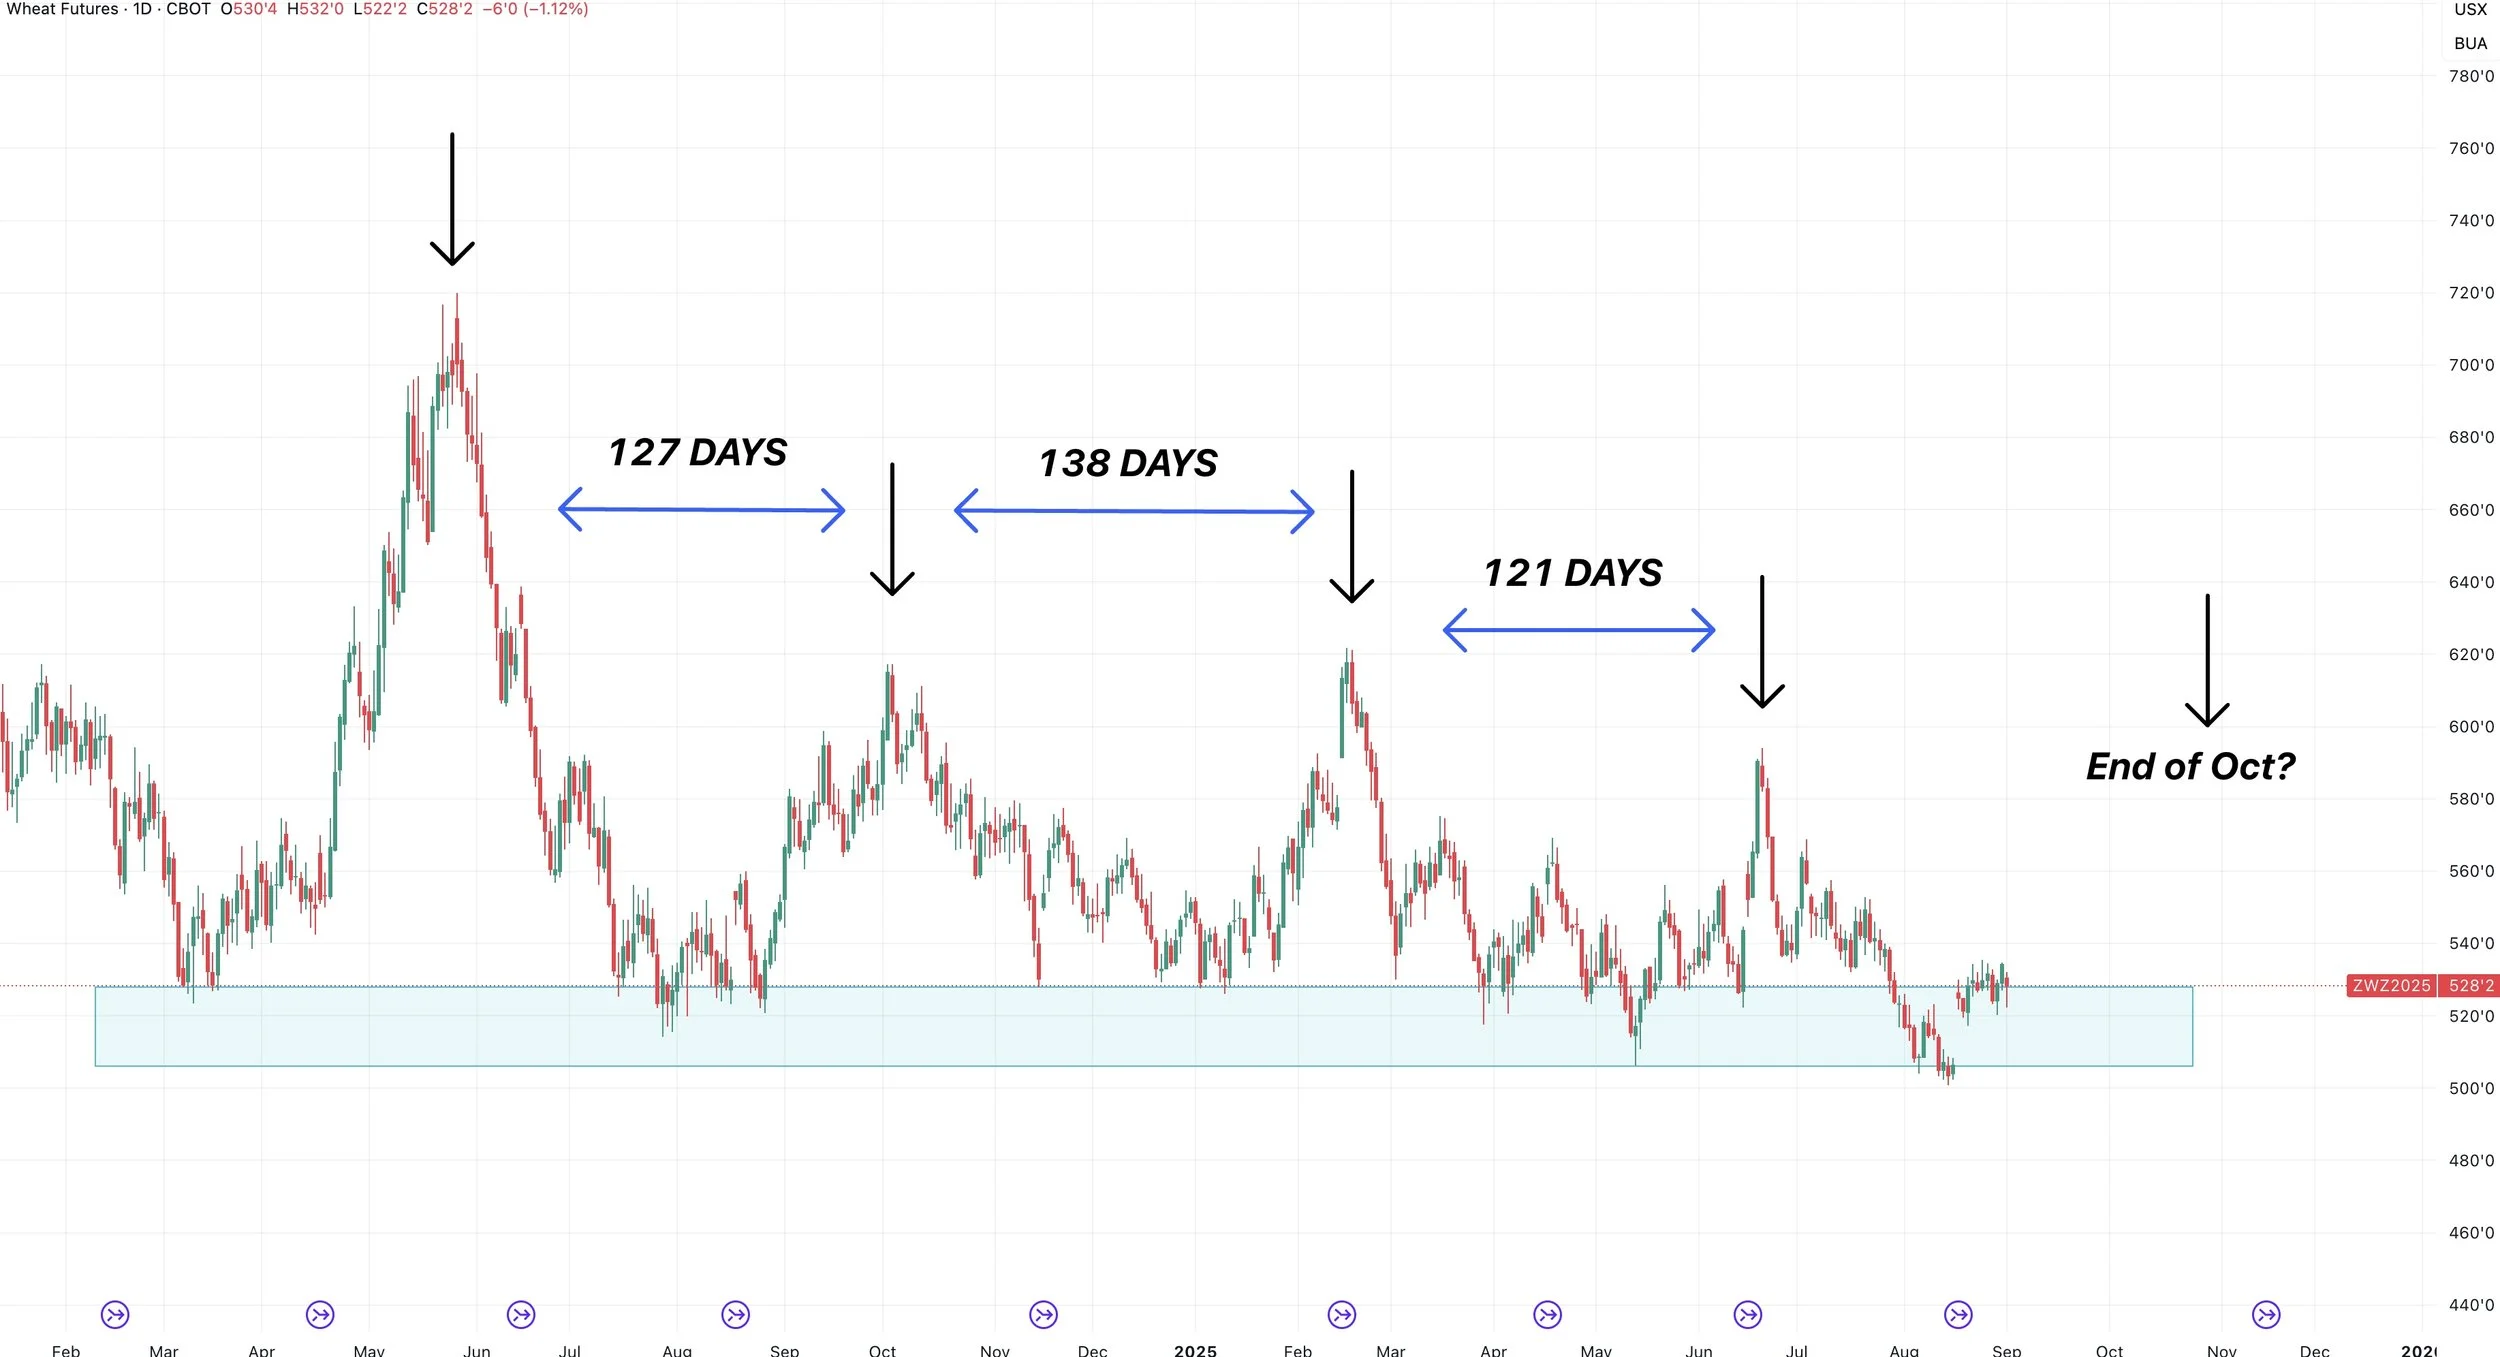
Here is the continuous chart.
Roughly every 4 months for the past year or two, the wheat market has provided an opportunity.
If it happened again, it would put the next major opportunity perhaps sometime around late October or so.
This is just a pure guess, but I think there will be opportunities. They just might not happen as soon as any of us would like.
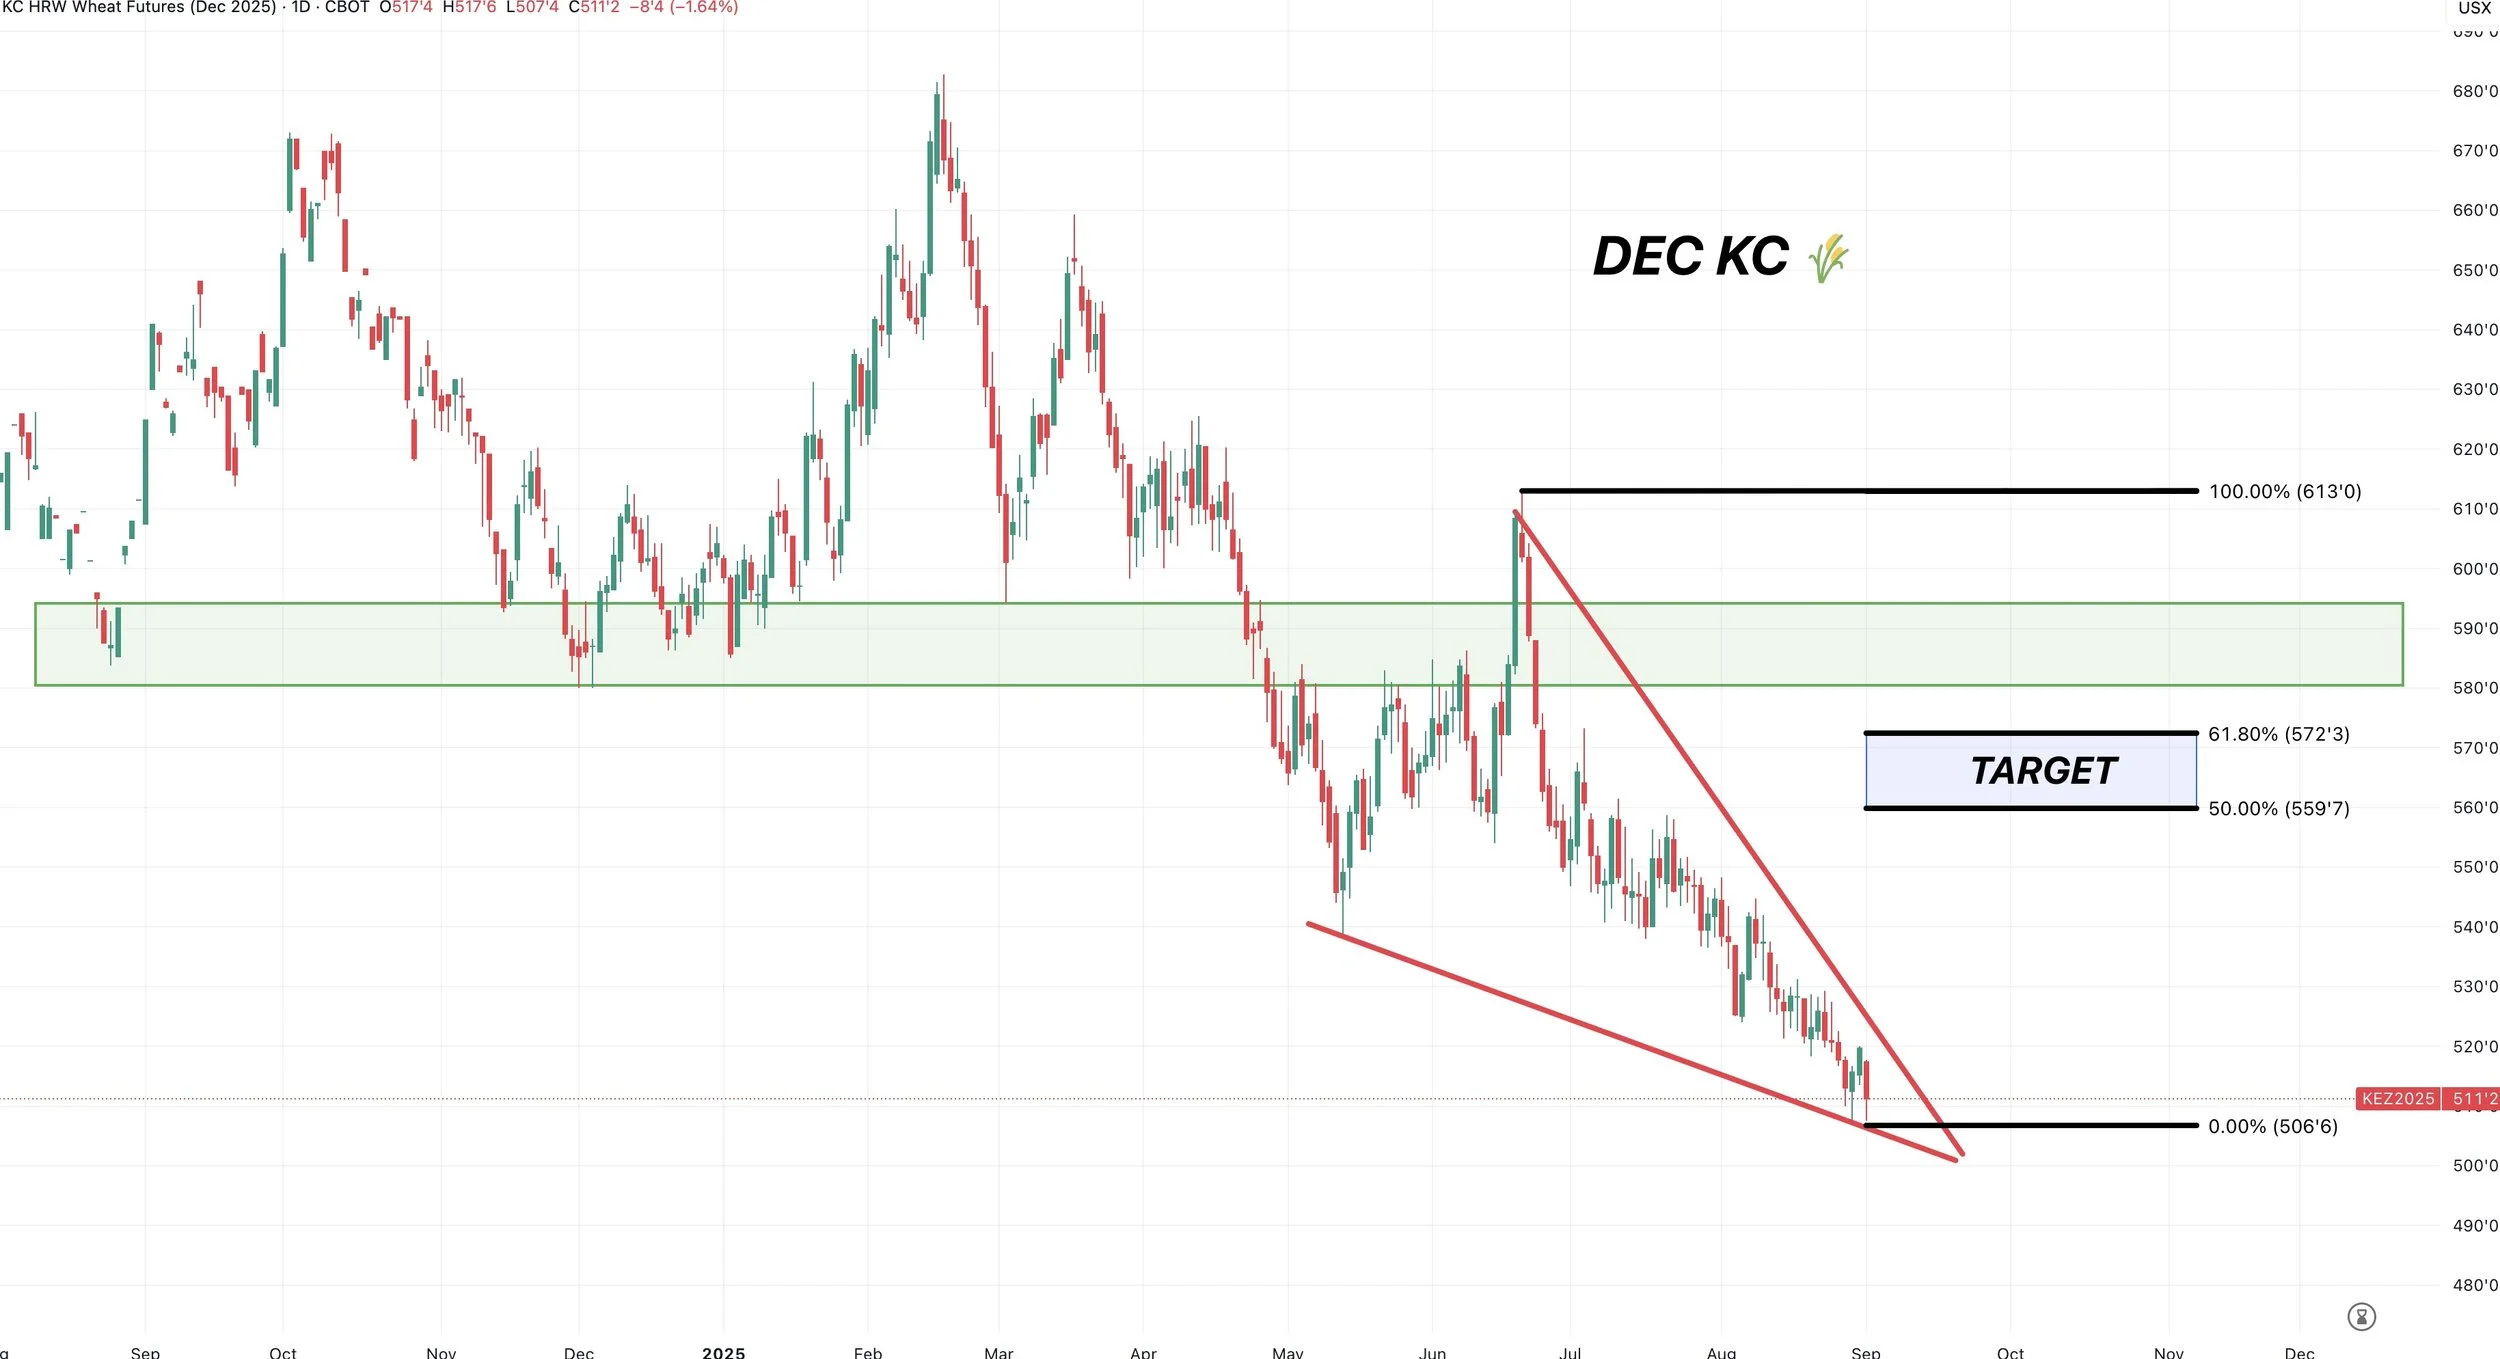
Daily KC Wheat:
Still sitting in a falling wedge pattern.
Current target is $5.59 to $5.72
Which gives back 50-61.8% of the June highs.
Cattle
Not much on cattle today. We still like keeping puts for downside protection in a seasonal time frame where we tend to struggle.
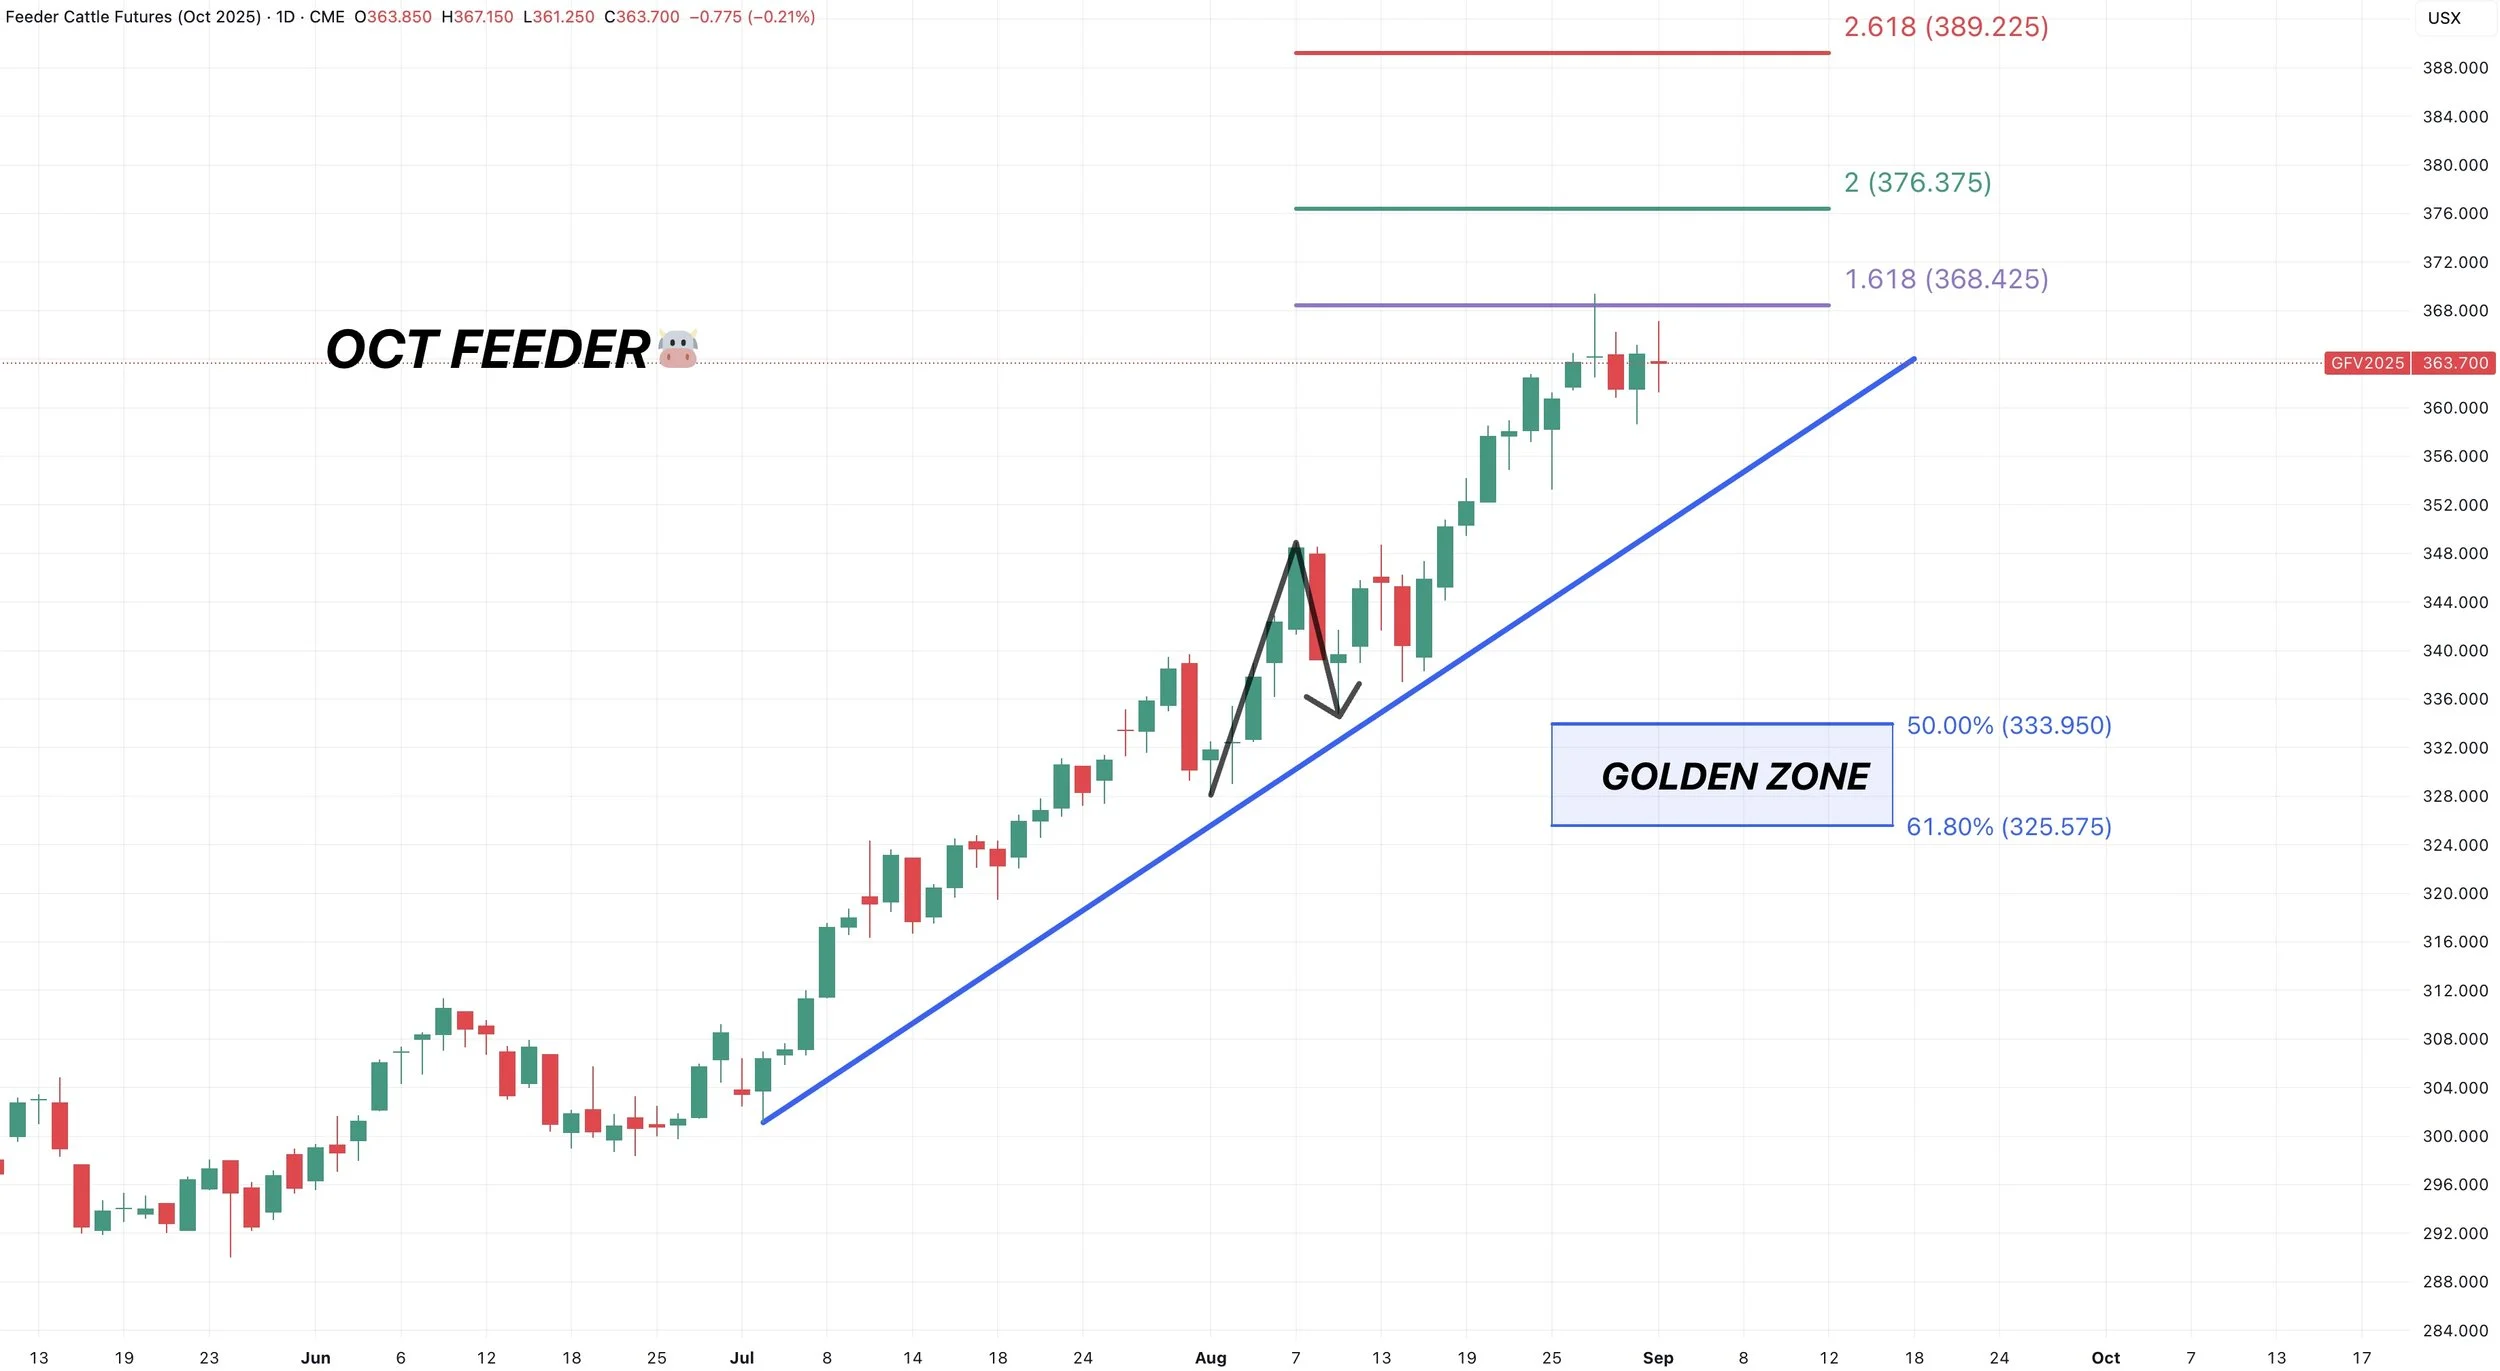
Oct Feeder:
We are currently rejecting the golden fib from the mid August rally & pullback (highlighted with the arrow).
If we bust above, next target is 376.375
If we start to break down, that blue box is our downside target.
I would be cautious here. As last week we nearly perfectly hit that golden fib before leaving the nasty candle last Wednesday.
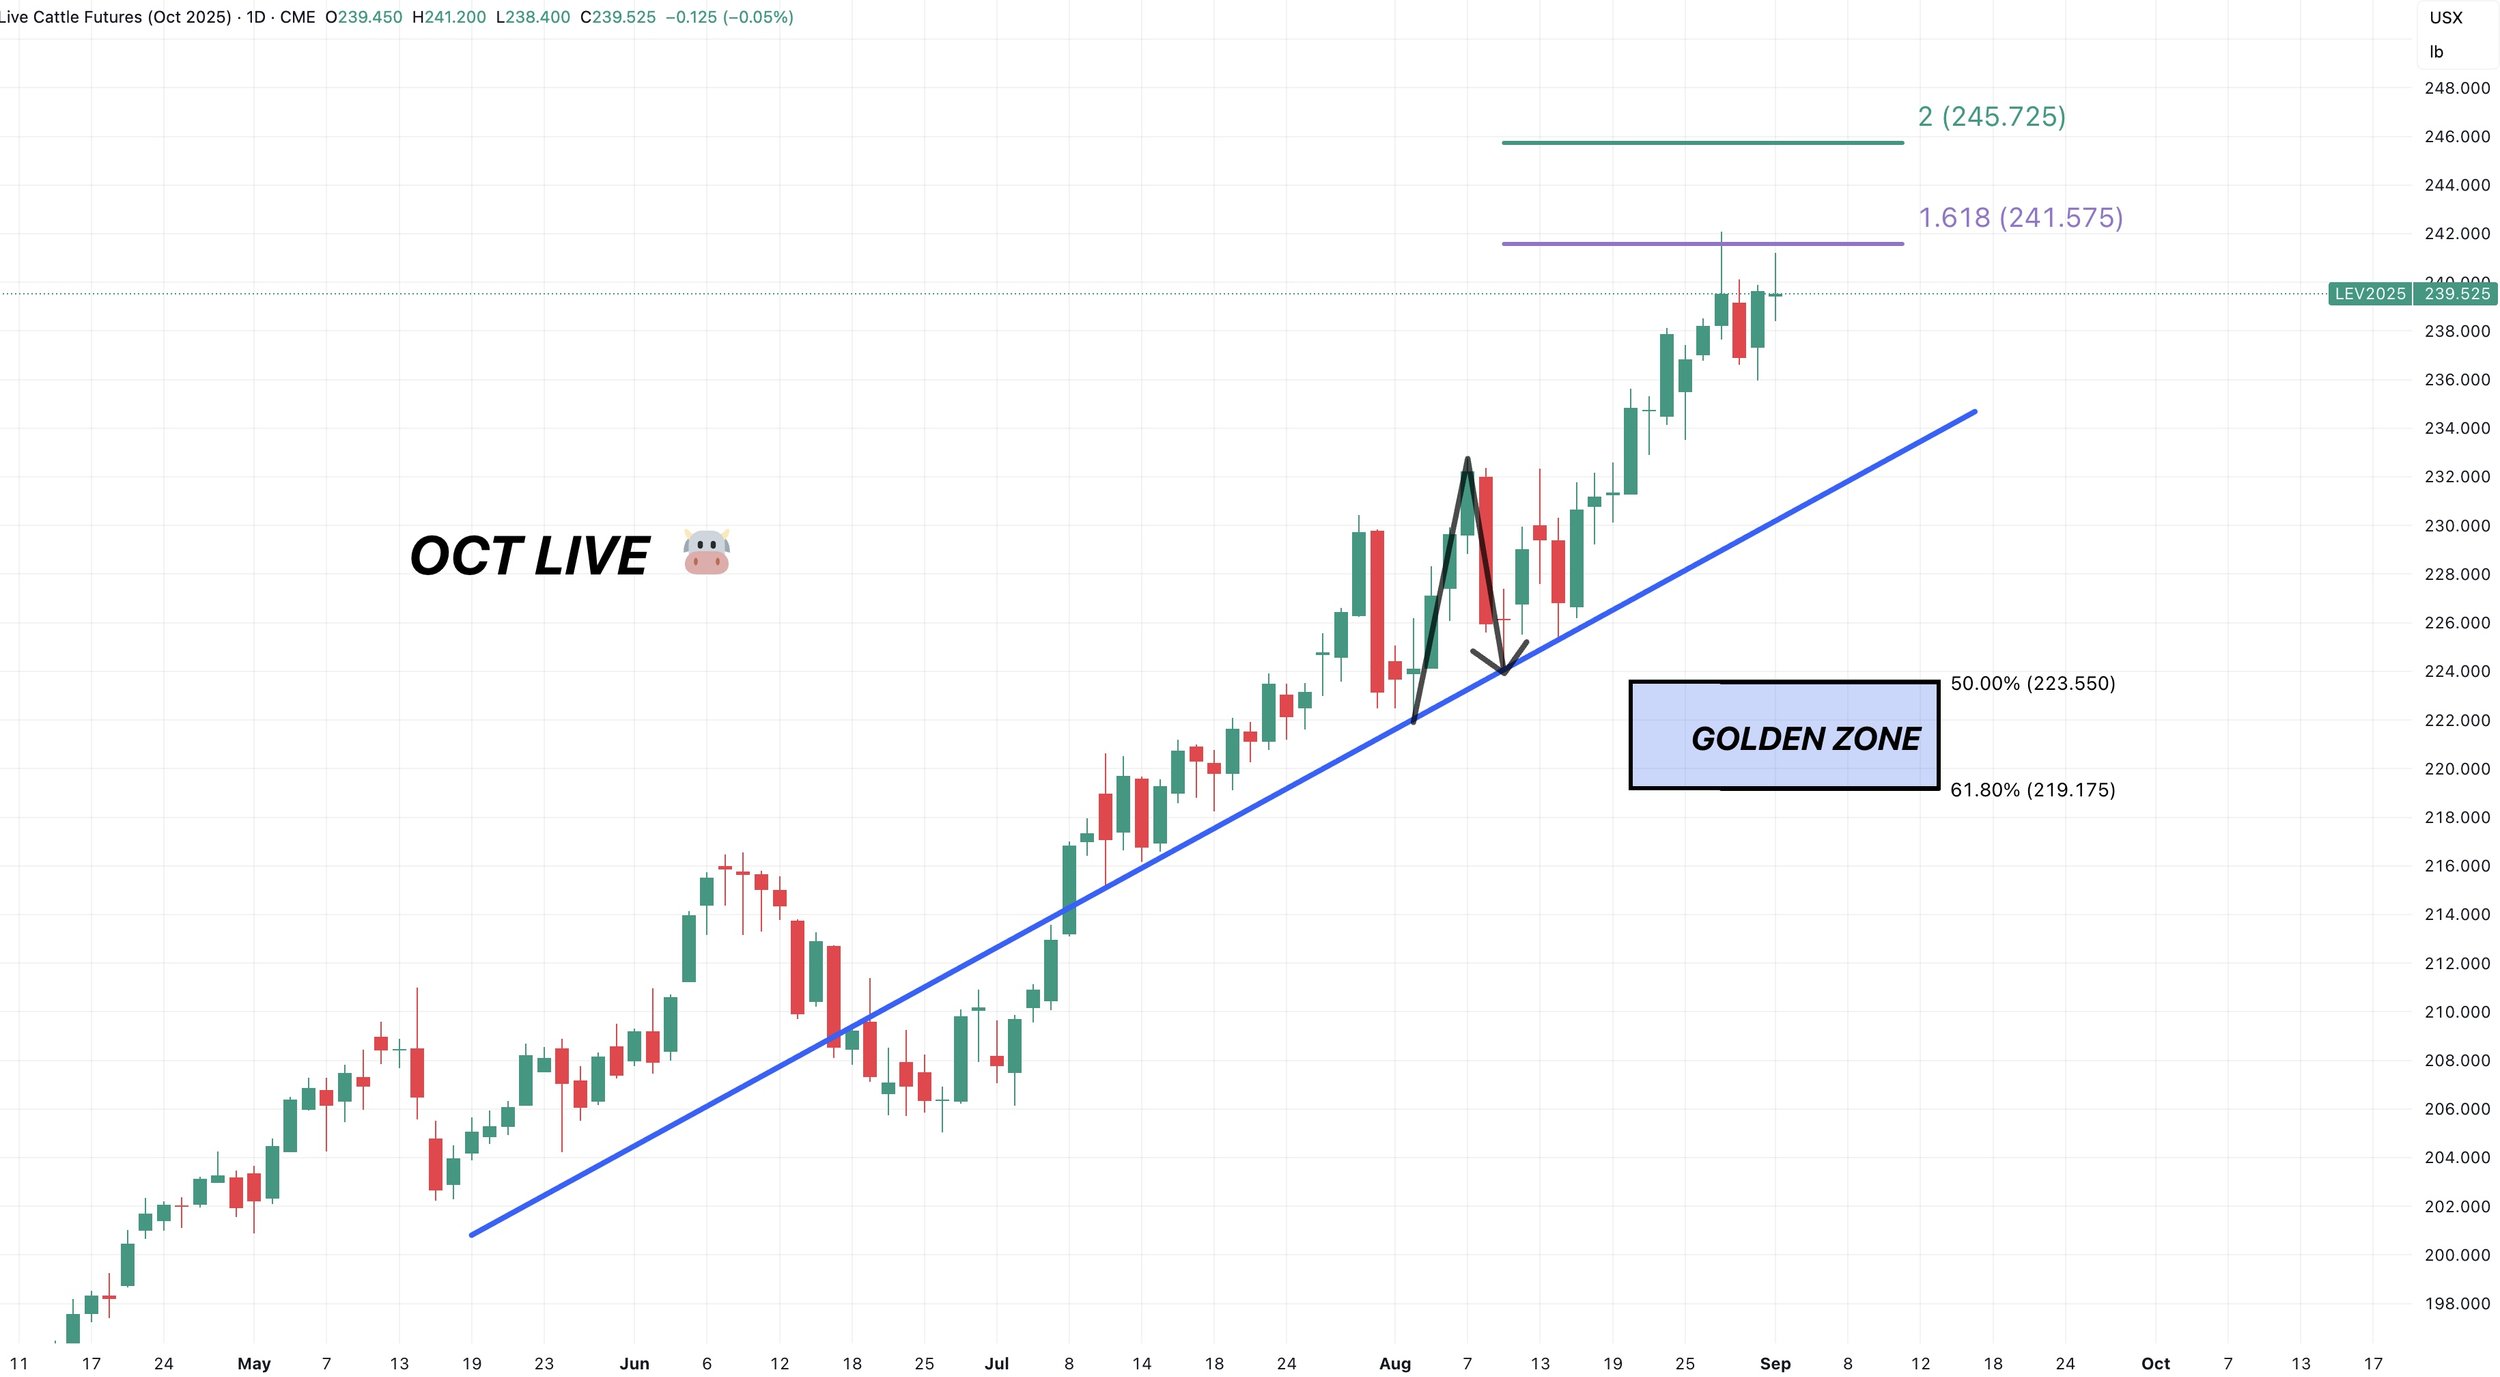
Oct Live:
Also rejecting the golden fib.
If we make new highs, the target is 245.725
If we break down, blue box is the downside target.
Past Sell or Protection Signals
Aug 22nd: 🌱
Soybean sell signal & hedge alert.
July 31st: 🐮
Cattle sell signal & hedge alert.
July 10th: 🐮
Cattle sell signal & hedge alert.
CLICK HERE TO VIEW
June 5th: 🐮
Cattle sell signal & hedge alert.
June 2nd: 🌾
MPLS wheat sell signal.
April 10th: 🌽
Old crop corn sell signal.
March 19th: 🐮
Cattle hedge & sell signal.
Feb 18th: 🌽 🌾
Old crop KC wheat & old crop corn signal.
Jan 23rd: 🌽 🌱
Corn & beans old crop sell signal.
CLICK HERE TO VIEW
Jan 15th: 🌽 🌱
Corn & beans hedge alert/sell signal.
Jan 2nd: 🐮
Cattle hedge alert at new all-time highs & target.
Dec 11th: 🌽
Corn sell signal at $4.51 200-day MA
CLICK HERE TO VIEW
Oct 2nd: 🌾
Wheat sell signal at $6.12 target
Sep 30th: 🌽
Corn protection signal at $4.23-26
Sep 27th: 🌱
Soybean sell & protection signal at $10.65
Sep 13th: 🌾
Wheat sell signal at $5.98
May 22nd: 🌾
Wheat sell signal when wheat traded +$7.00
Want to Talk?
Our phones are open 24/7 for you guys if you ever need anything or want to discuss your operation.
Hedge Account
Interested in a hedge account? Use the link below to set up an account or shoot Jeremey a call at (605)295-3100.