
ARGY NEWS BLOOD BATH
MARKET UPDATE
You can scroll to read the usual update as well. As the written version is the exact same as the video.
Timestamps for video:
Argy News: 0:00min
Trump & China: 2:30min
Dollar & Demand: 3:25min
Corn: 4:25min
Beans: 7:00min
Wheat: 11:05min
Cattle: 13:10min
Want to talk about your situation?
(605)295-3100
Your free trial has ended..
Don’t miss our next sell signal or future updates. Lock in our harvest sale so you’re ready for the next opportunity
Futures Prices Close
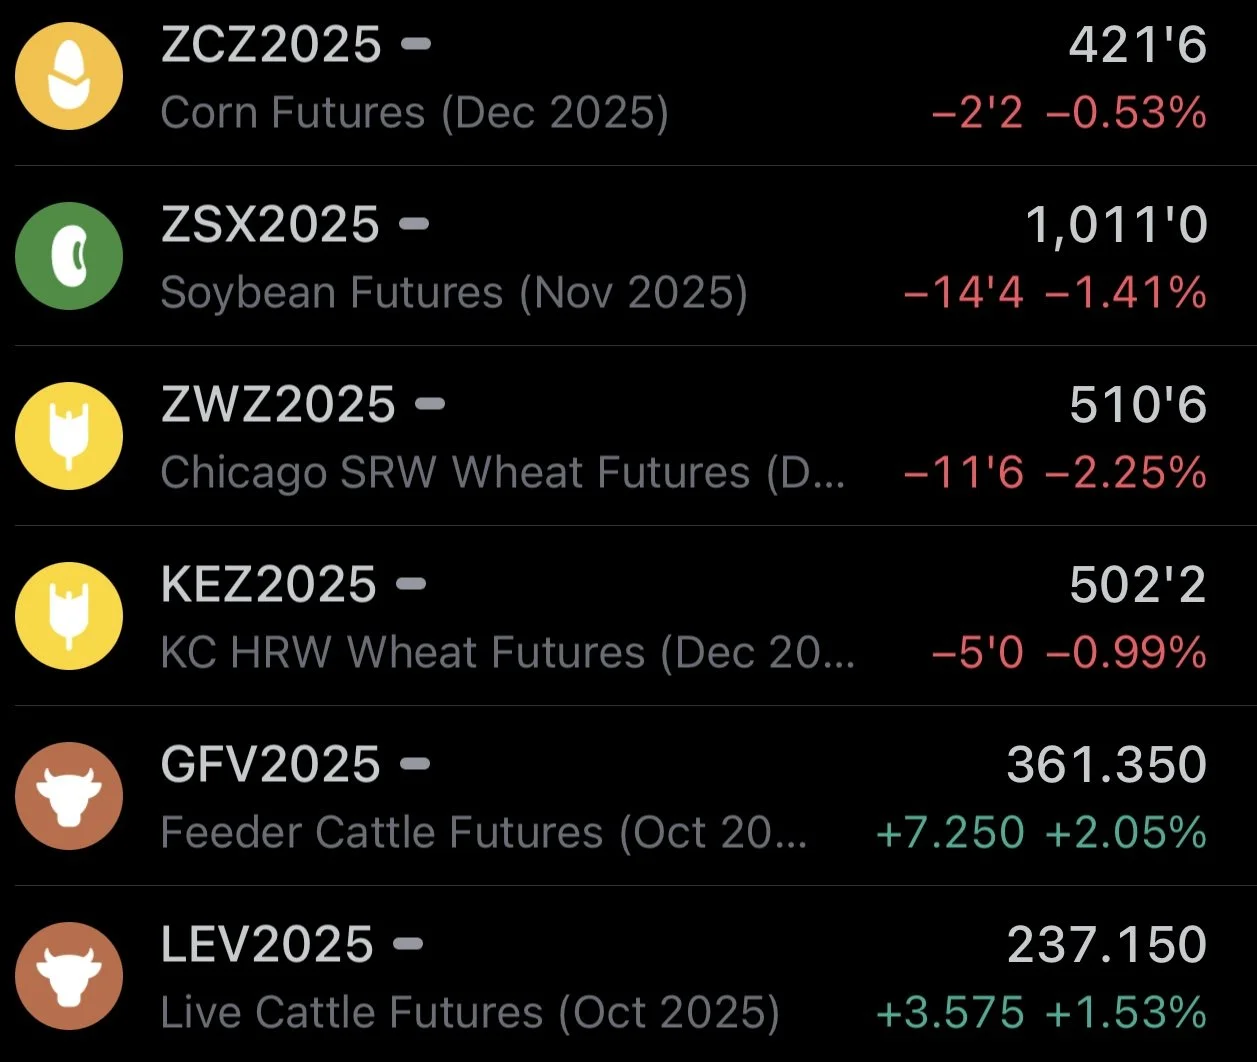
Overview
Blood bath in the grains to start the week. Soybeans and wheat we were hit hard while corn actually showed some nice resilience.
Meanwhile the cattle market continues to bounce in the golden zone off the back of screw worm news and a neutral to friendly cattle on feed report (we'll talk more about this in the cattle section).
Why the sell off in grains?
Some news caught the market off guard this morning. The news was that Argentina is removing export taxes on all grains until October 31st.
Before today, export tax for them was 9.5% on corn and wheat, and 26% on soybeans. It is now zero.
Why is this a big deal?
It essentially floods the market with cheaper product. Because this lowers the cost of exporting for Argentina, and incentivizes them to ramp up their exports. Pushing more supply to the market and adding competitive pressure to US exports.
More competition for our exports is bad for our prices. Because less exports results in more supply here at home.
Why did Argentina do this?
Normally, when they export, they are taxed every time they sent product out of the country. Which cuts into profits. Removing this tax now lets them keep more money for their product.
Removing this encourages farmers to sell their grain and bring more cash into their economy.
They want to help their economy because the value of the Argentina Peso is down -99% vs the US Dollar in the last 10 years.
Essentially, Argentina is hoping that this will accelerate exports and help stabilize their economy.

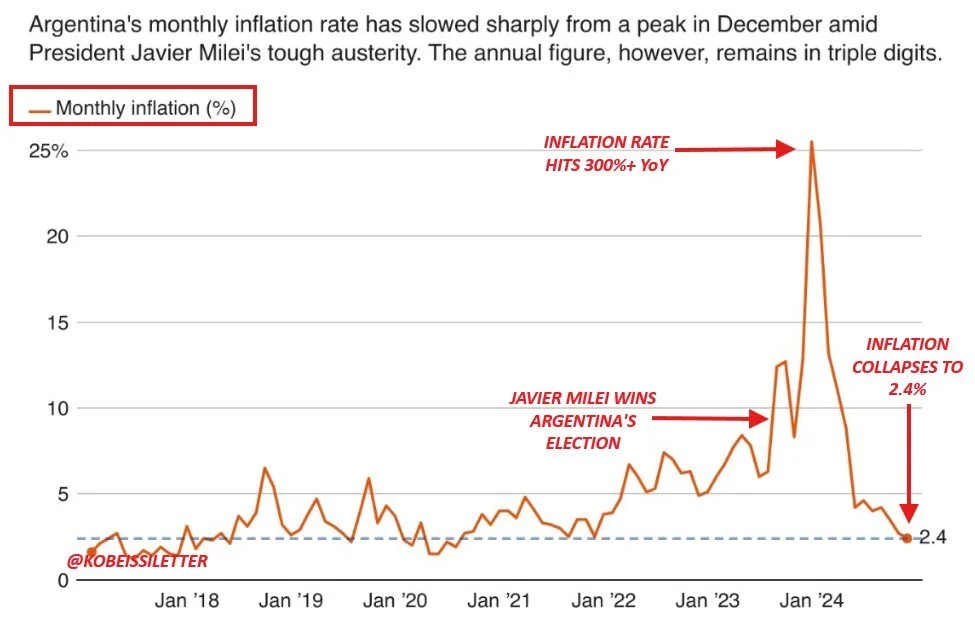
Argentina farmers are holding on to a lot of grain because they think selling now won’t give them enough money. This tax cut might help a little bit, but it is probably only a temporary fix to a bigger issue.
In 2023, Argentina inflation hit 300% and their inflation rate was above 25% per month.
Since then it has fallen down to 2% a month or 34% a year. Which is an improvement, but compared to the US we have a 2% yearly inflation target.
I'm not sure how negative of effect this is actually going to have on our exports. The tax cut is only for a month, and a lot of times the intial reaction to news can often be worse than the actual effects.
However, for soybeans specifically, having Argentina that much more competitive during prime shipping season isn’t friendly. Especially given China is already avoiding the US.
China & Trump
We talked about this in yesterday’s audio, but this was the biggest reason for the weakness on Friday in soybeans.
On Friday, soybeans were up +10 cents at one point during the call.
Immediately after the call we sold off and then closed down -12 cents because the call Trump and China had was a disappointment to say the least.
I mentioned last week that I thought it would be a nothing burger for ag and be mostly about TikTok. Which it was.
Their call mentioned absolutely nothing about soybeans.
Trump also mentioned that he wouldn’t be visiting China until early next year.
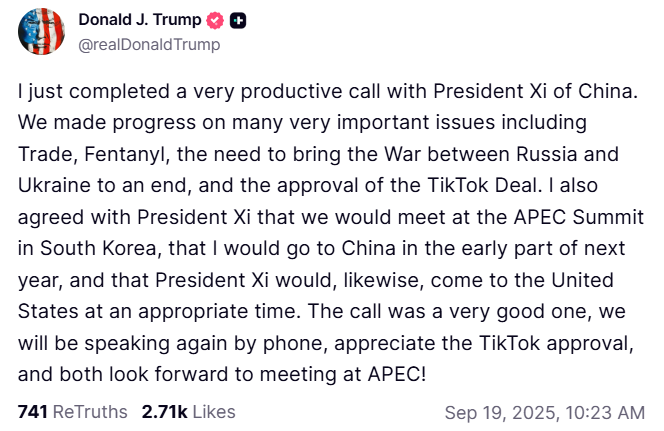
However, Trump did say he will meet with China's President in South Korea on October 31st.
The current trade truce deadline between the China and US is on Nov 10th.
So perhaps we get some good news then.
The issue is that if no progress is made until early next year, we would miss prime time shipping season.

US Dollar & Demand
I don’t believe there is a true correlation to the US dollar and grain prices.
Often times people will say "the wheat market is down because the dollar is higher today".
Well that just isn’t the case. If it was, wheat should’ve been posting an enormous rally. Cleary it hasn’t.
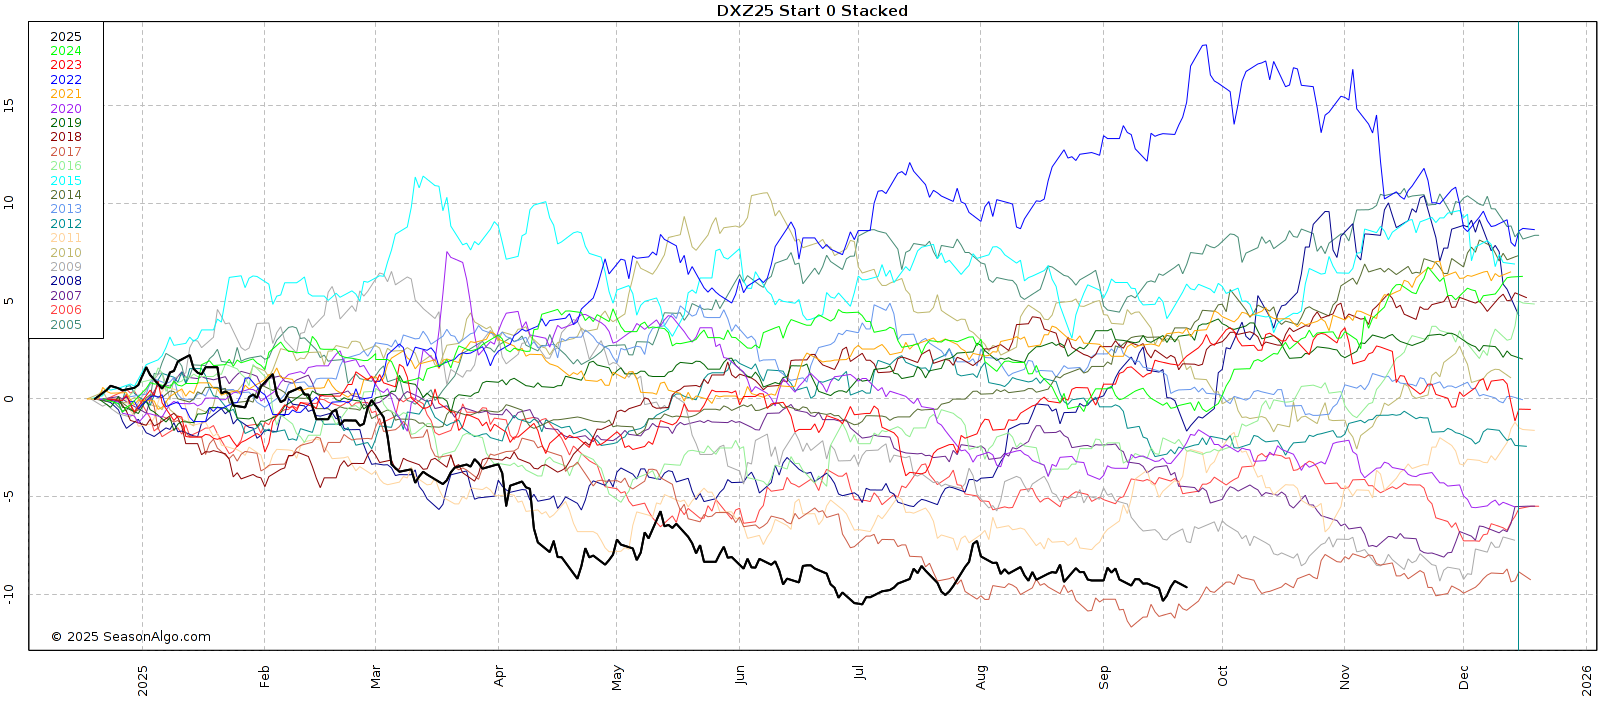
Here is the US dollar performance vs the wheat market performance the past few years.
Really no correlation. Especially this year.
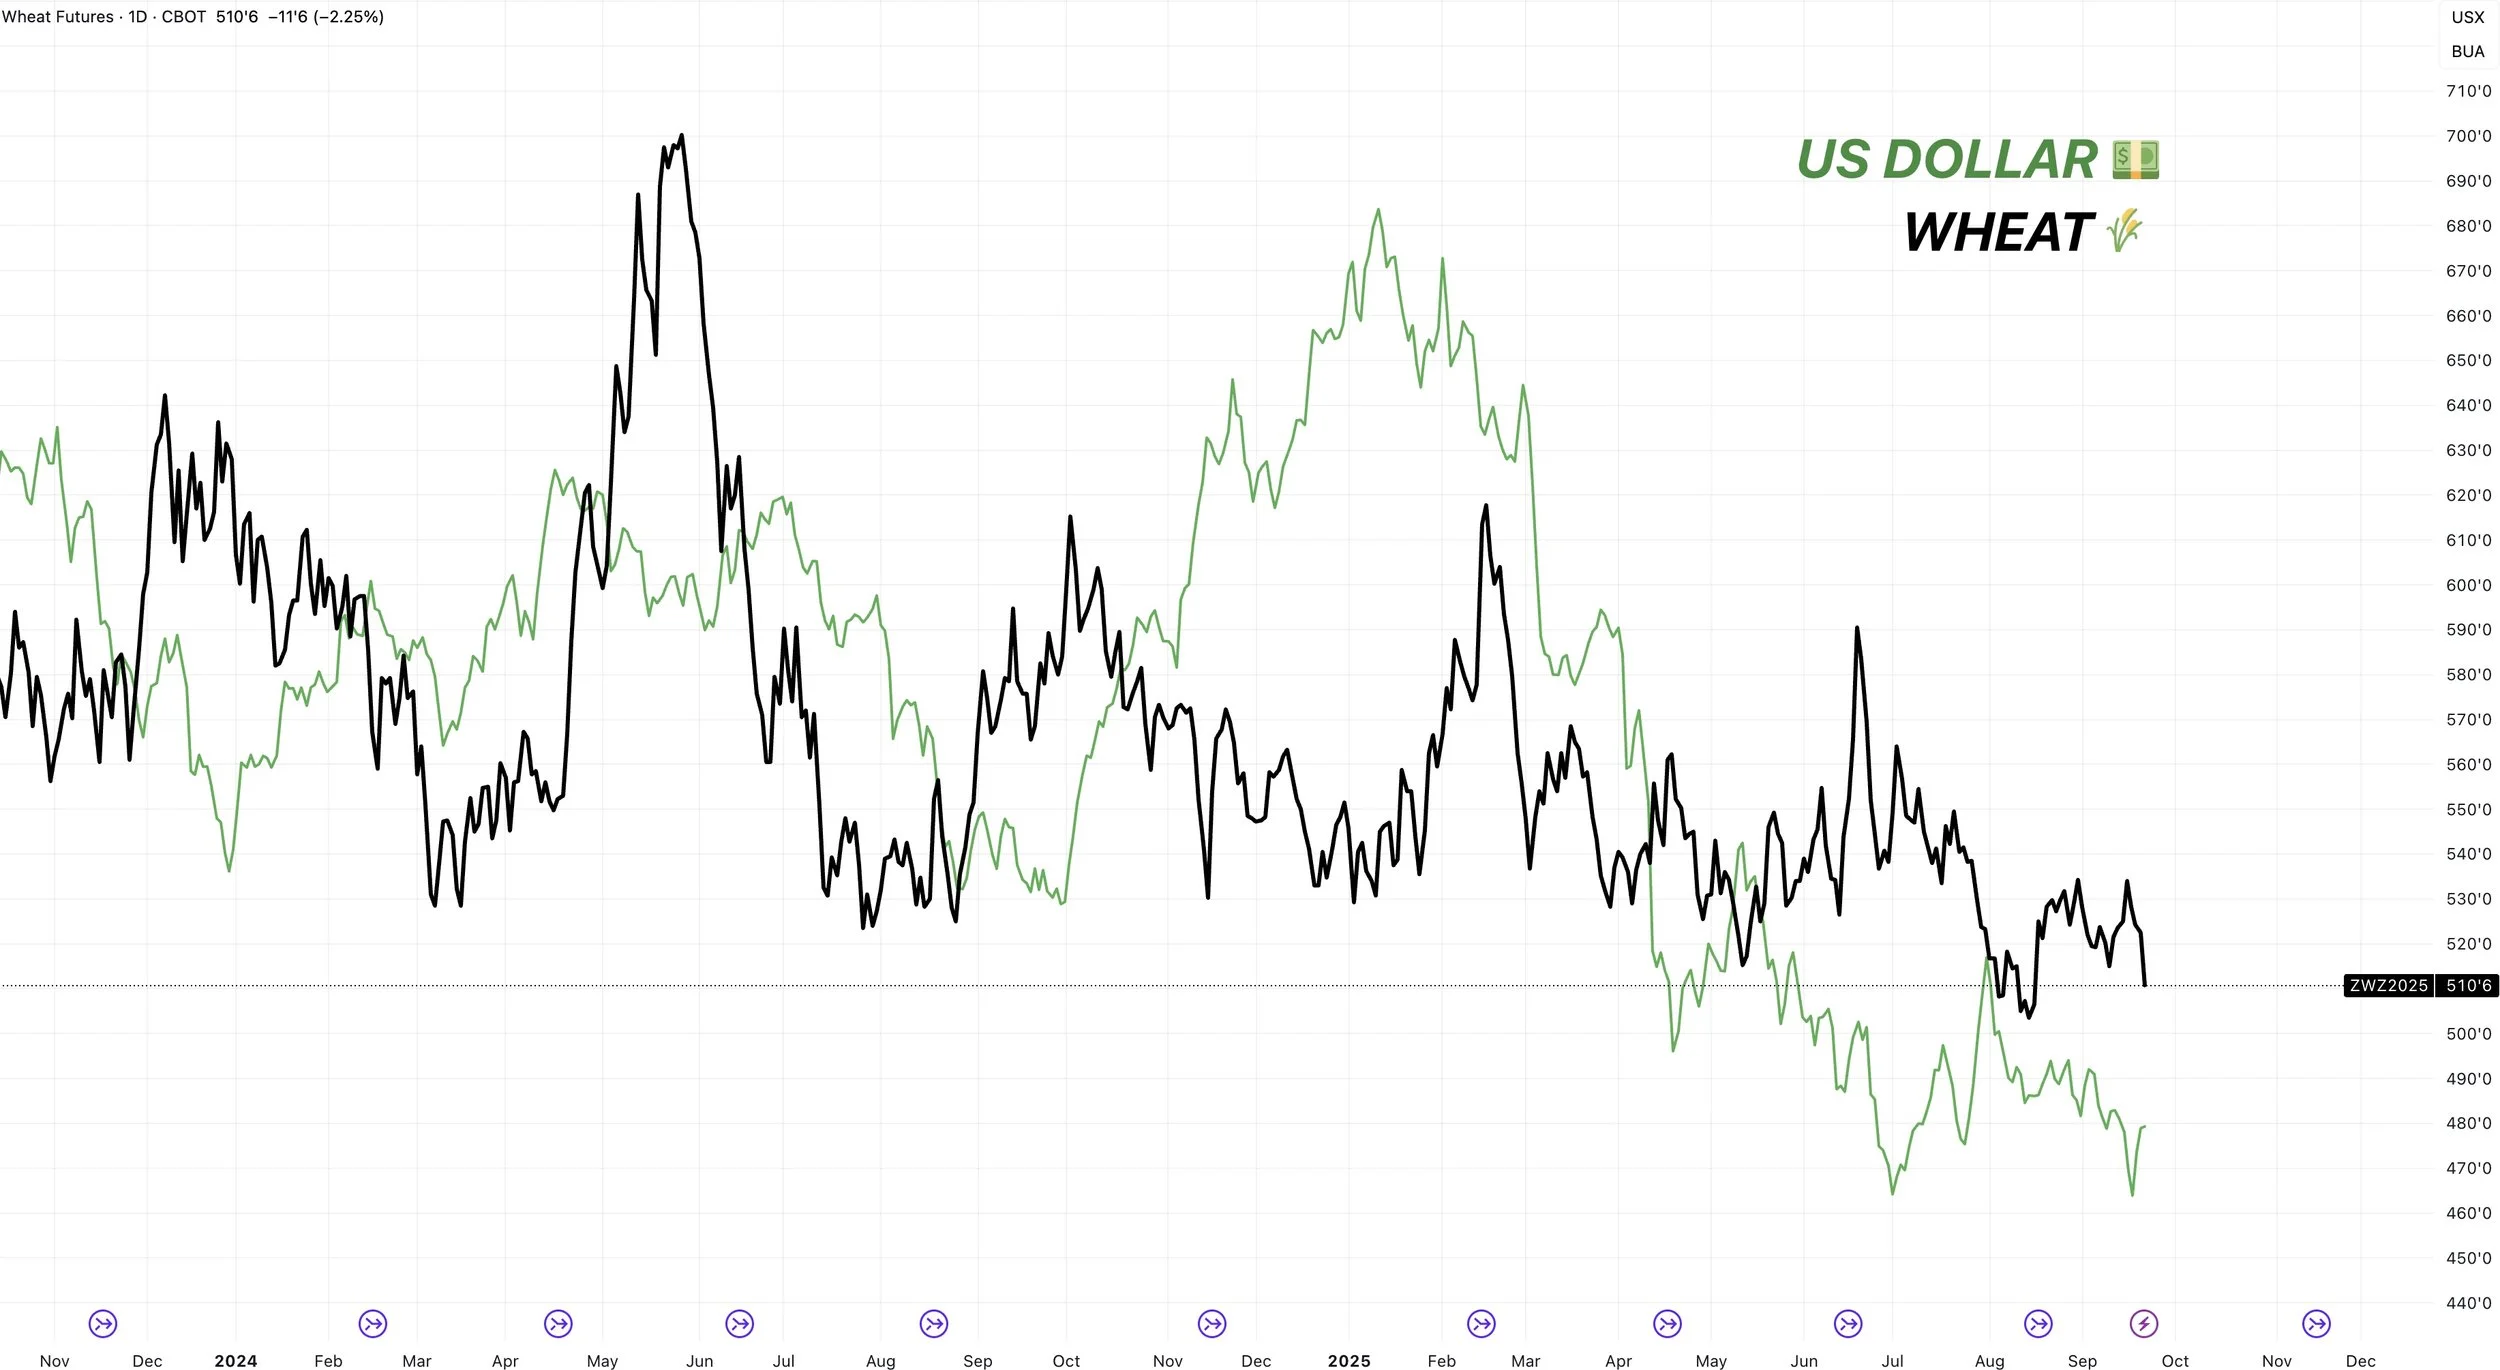
Despite this, a weaker US dollar is in fact friendly for the grains. It just isn’t a day to day correlation.
A weaker dollar makes us that much more competitive on exports and helps boost demand.
The US dollar is on track for one of it's weakest years in decades.
(2025 is in black)*
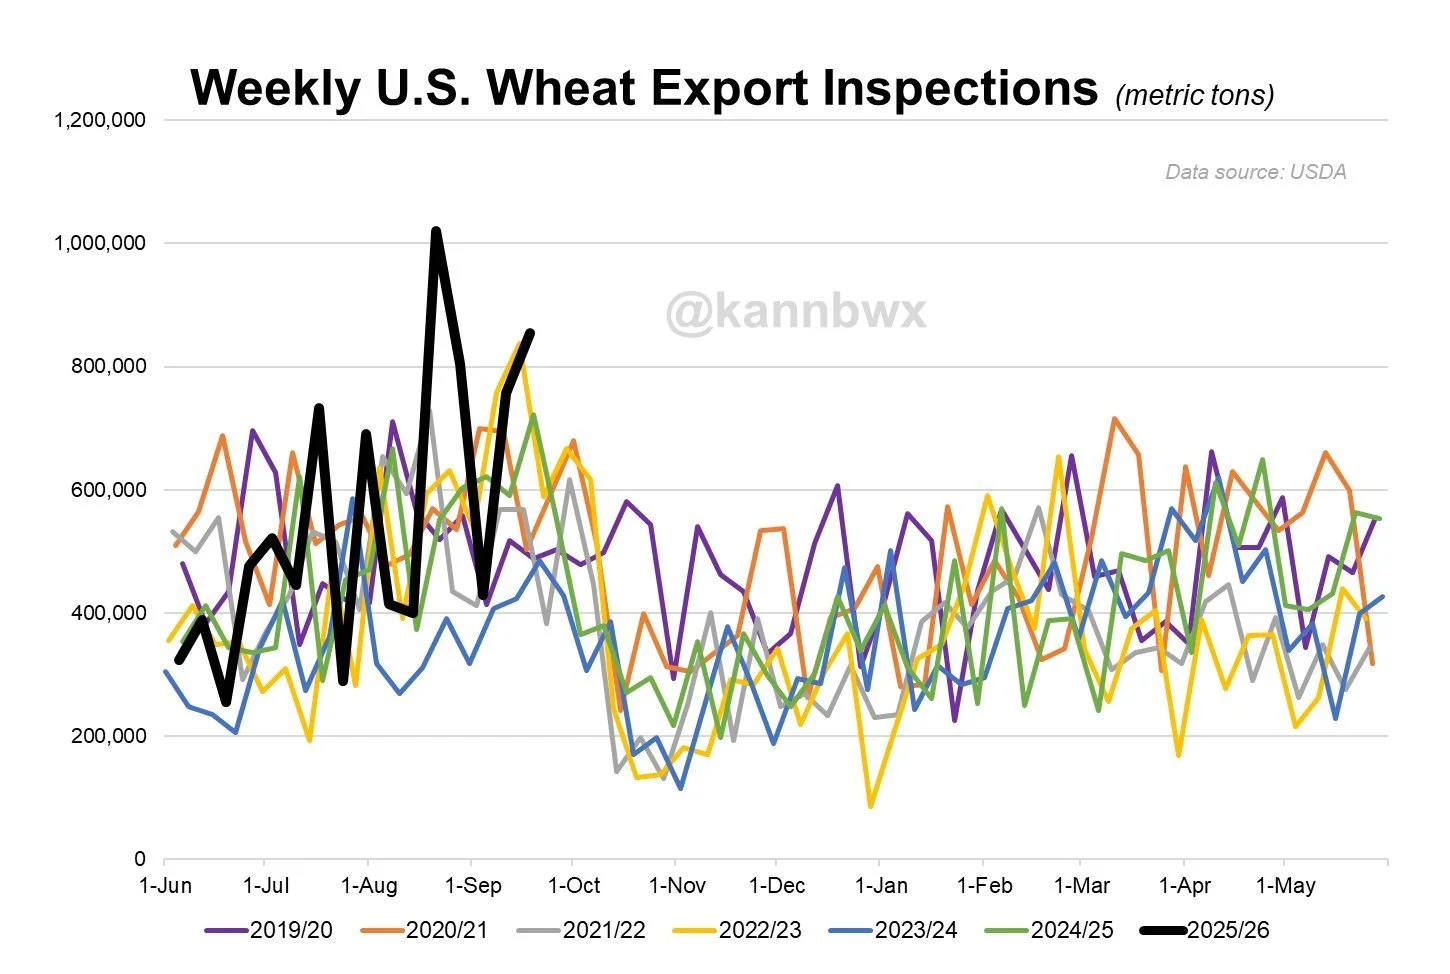
Corn and wheat demand are also posting some of their strongest export numbers in years.
For example wheat exports are up +21% vs last year.
They are the strongest compared to expectations in 12 years.
Chart from Karen Braun
Today's Main Takeaways
Corn
The first thing I wanted to talk about in corn today was StoneX's Arlan Suderman.
In Market to Market last week, he was asked where he truly thinks this crop is at.
His Answer: 178 to 182
He said:
"I wouldn’t be surprised if it was lower than that, but I would be surprised if it was higher than that."

Arlan is the same person many were upset with just a few months ago because his yield survey model had a 188 corn yield back in August.
It's pretty clear this crop is getting smaller.
August StoneX Survey
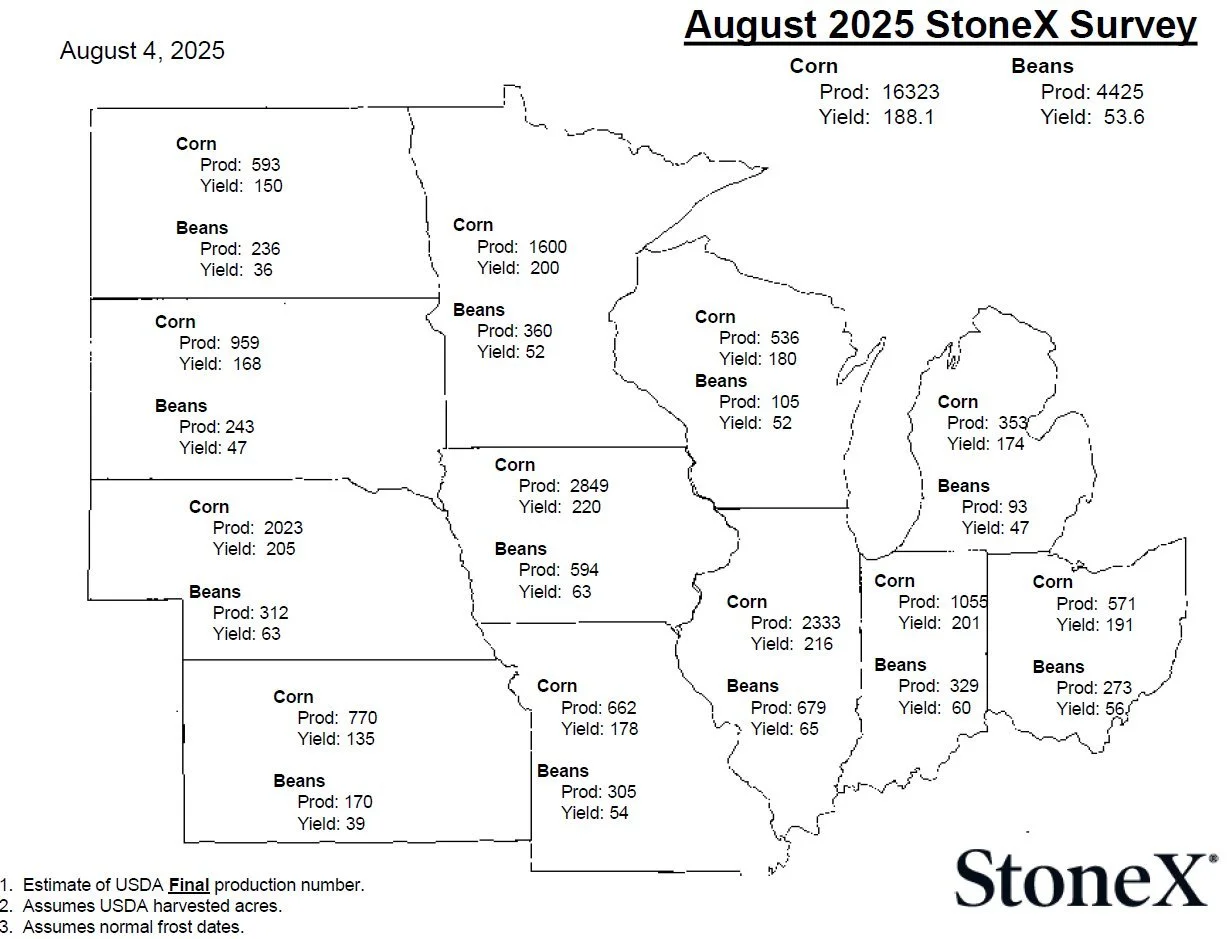
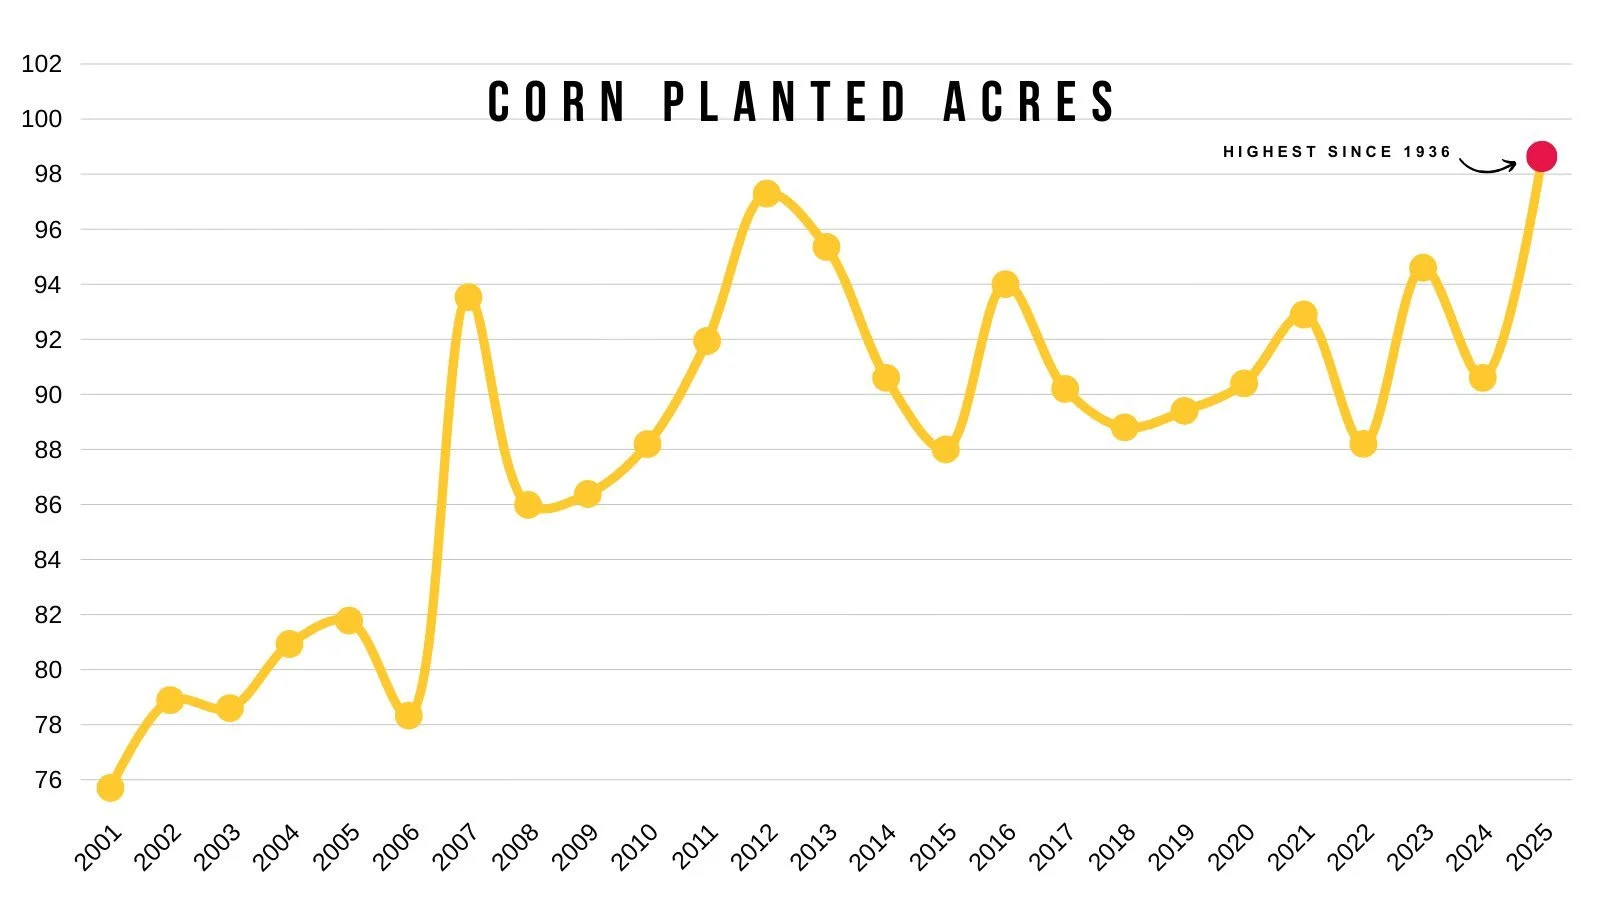
Even if yield is 180 or so, we are still going to have a record crop and record acres.
Which makes it hard for corn to simply run away here, especially heading into harvest. We just saw a +40 cent rally ahead of harvest and normally it’s hard to rally through out harvest.
Now despite the fact we will have record production no matter how you cut the pie, this isn’t anything new.
The market is aware of this and has been pricing this in for months.
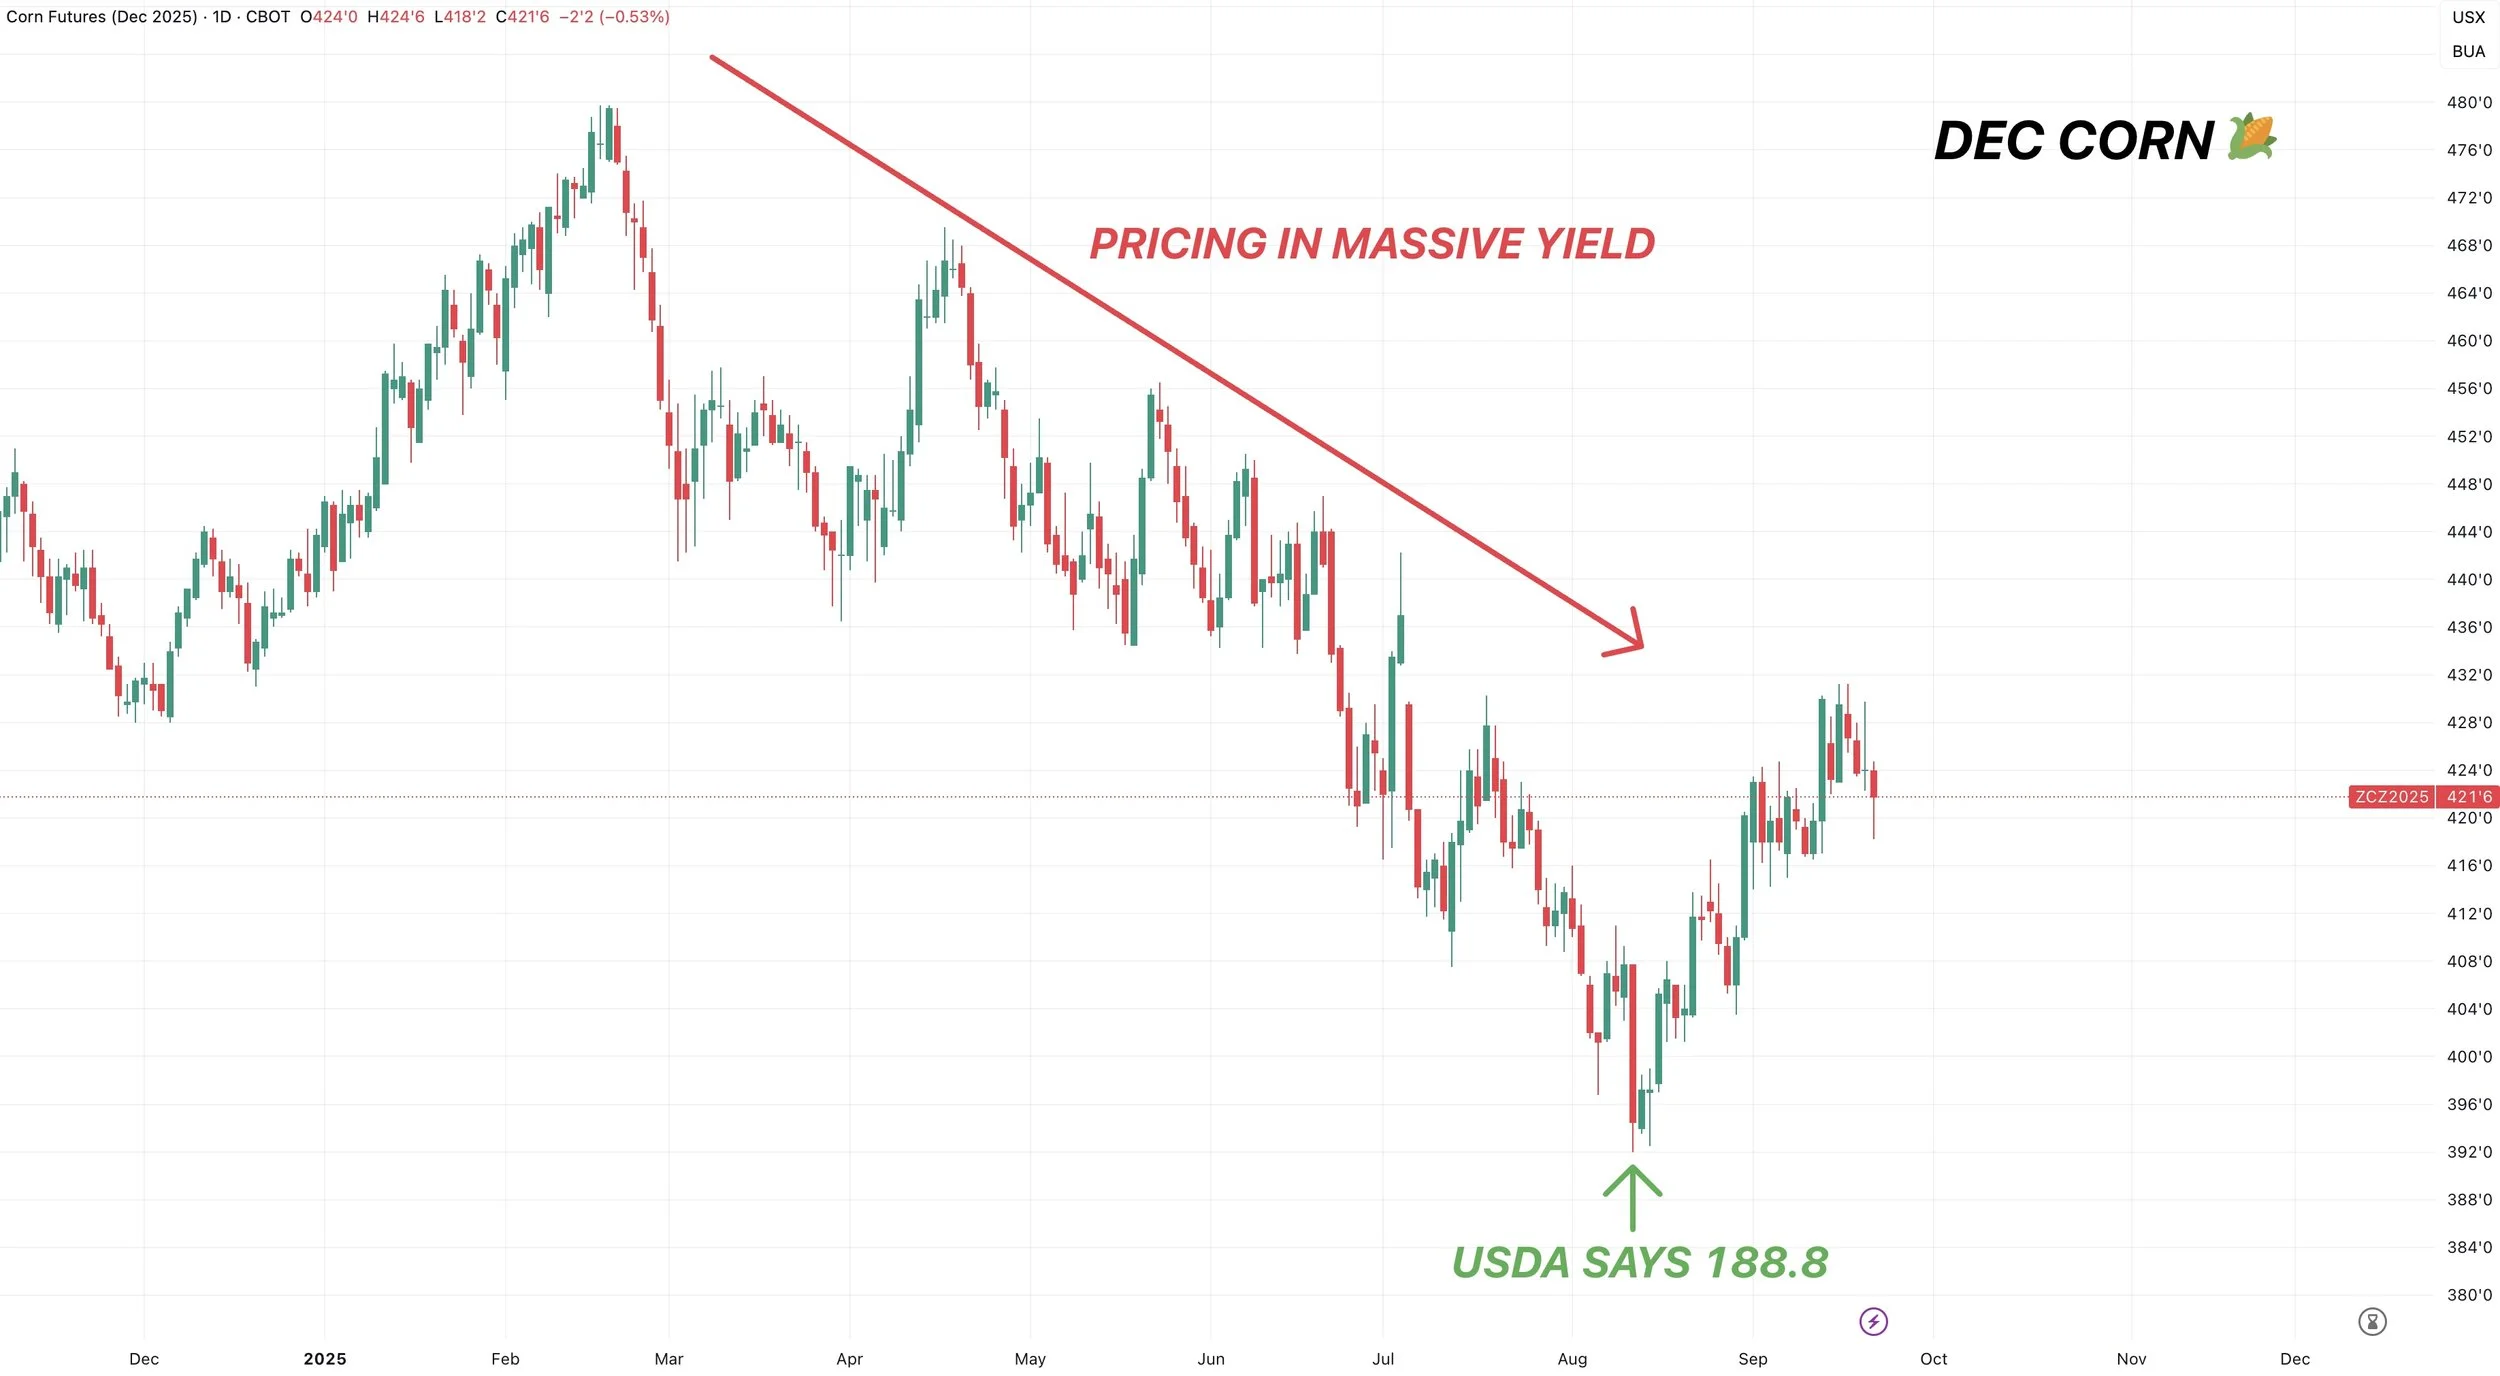
This market already priced in a near 190 yield.
The day the USDA gave us a 188.8 yield and added +1 billion bushels of supply to the balance sheet marked the exact lows in this market.
Because it was priced in.
Now although the record acres and production might make it hard to see dramatically higher corn here in the short term, that doesn’t mean we have to be bearish corn.
There really isn’t a reason to be overly bearish when the market already priced in about as bearish of a scenario you could paint.
The farther out you look at corn, the more friendly the possible situation becomes.
I mean do you really think we will keep 98 million acres of corn next year?
This comes after creating some massive demand down here.
Final Thoughts:
I have a hard time thinking corn is going to be a runaway train short term here.
We have too much supply to get overly bullish, but we have strong enough demand to not be bearish. With a crop that is getting smaller, not larger, after pricing in a massive yield just a month ago.
I still think the harvest lows are in and I remain optimistic looking towards next year.
Ready to take advantage of opportunities when they come.
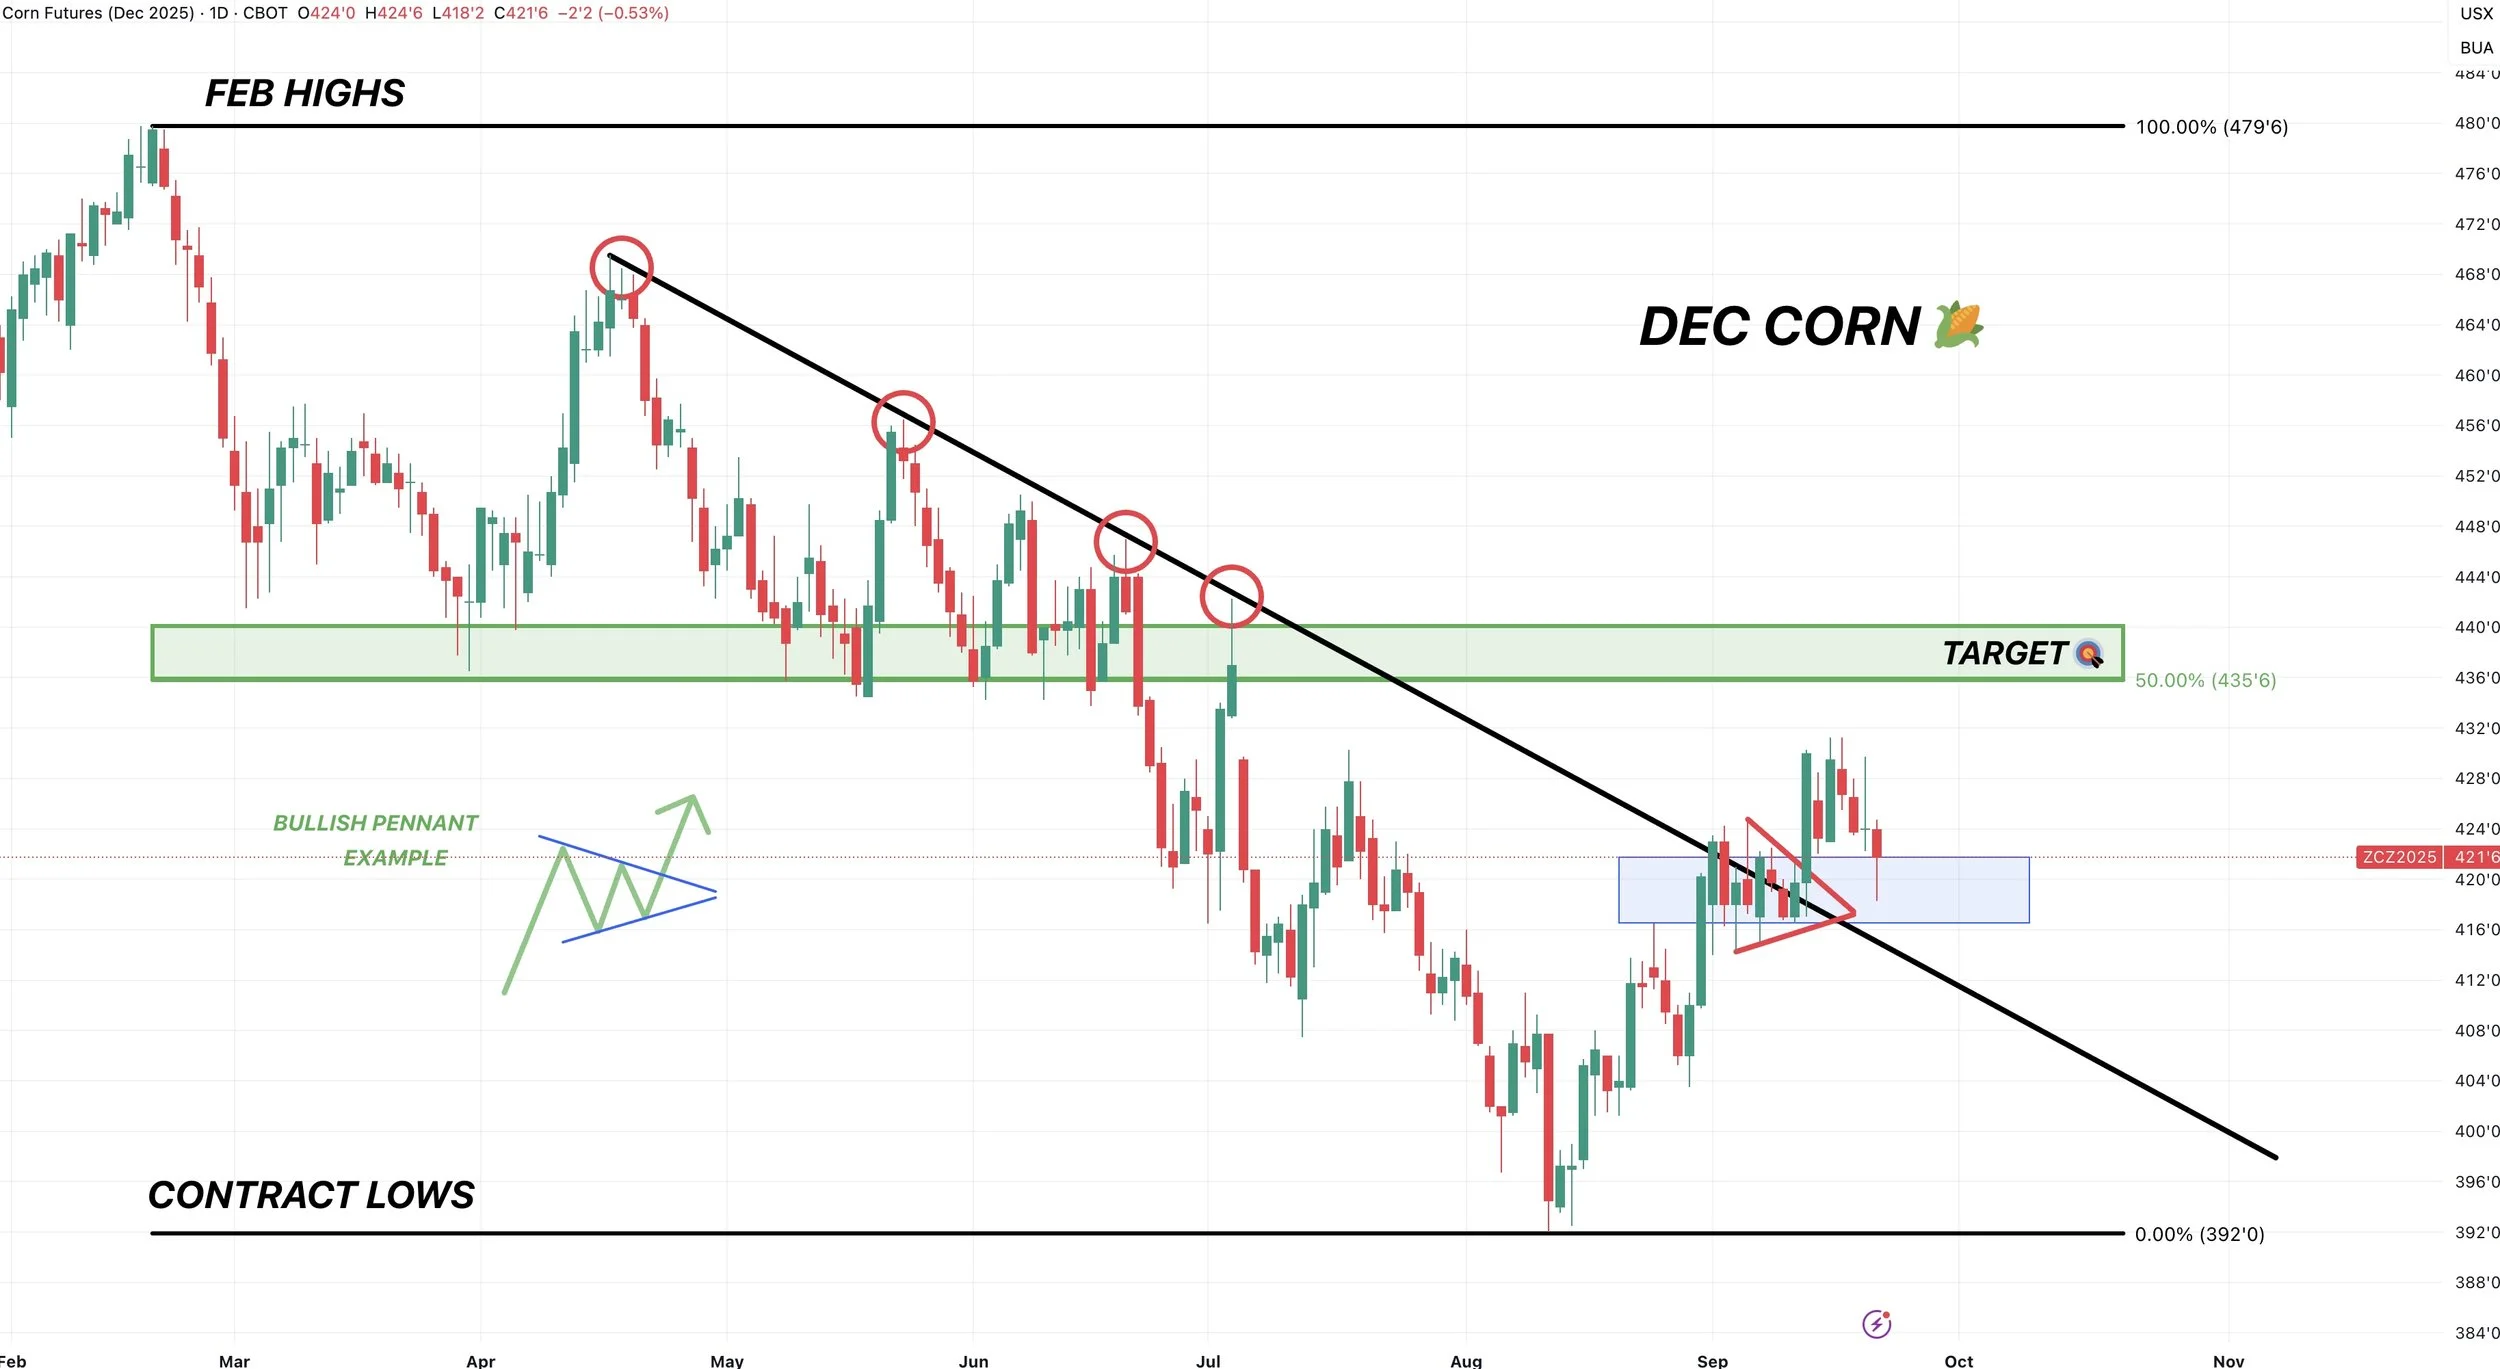
Daily Dec Chart:
Corn was the bright spot in grains today.
We closed slightly lower but well off the early lows.
We are essentially just back testing this small range from the beginning of the month (blue box).
My current game plan is still to de-risk at $4.35
That is 50% of the Feb highs and key support from spring.
Soybeans
Soybeans got hit with back to back bearish headlines.
First the lack of a China deal Friday and then the Argentina tax cut this morning.
Soybeans are now down over -50 cents from the recent highs and have given back the entire rally that the USDA report gave us after dropping acres.

The soybean market is a tricky one to navigate here.
On one hand, we still have zero beans sold to China. You can’t get overly bullish until we know whether our export program is in jeopardy or not.
On the other hand, it's hard to get too bearish knowing that our supply is getting smaller with not a ton of room for error.
Basically, the exact opposite story in corn. Corn has too much supply but amazing demand. Beans have a potential supply problem, but not enough demand.
You could realistically make an argument that soybeans could be $9 or $12 by this same time next year, and both arguments could be valid.
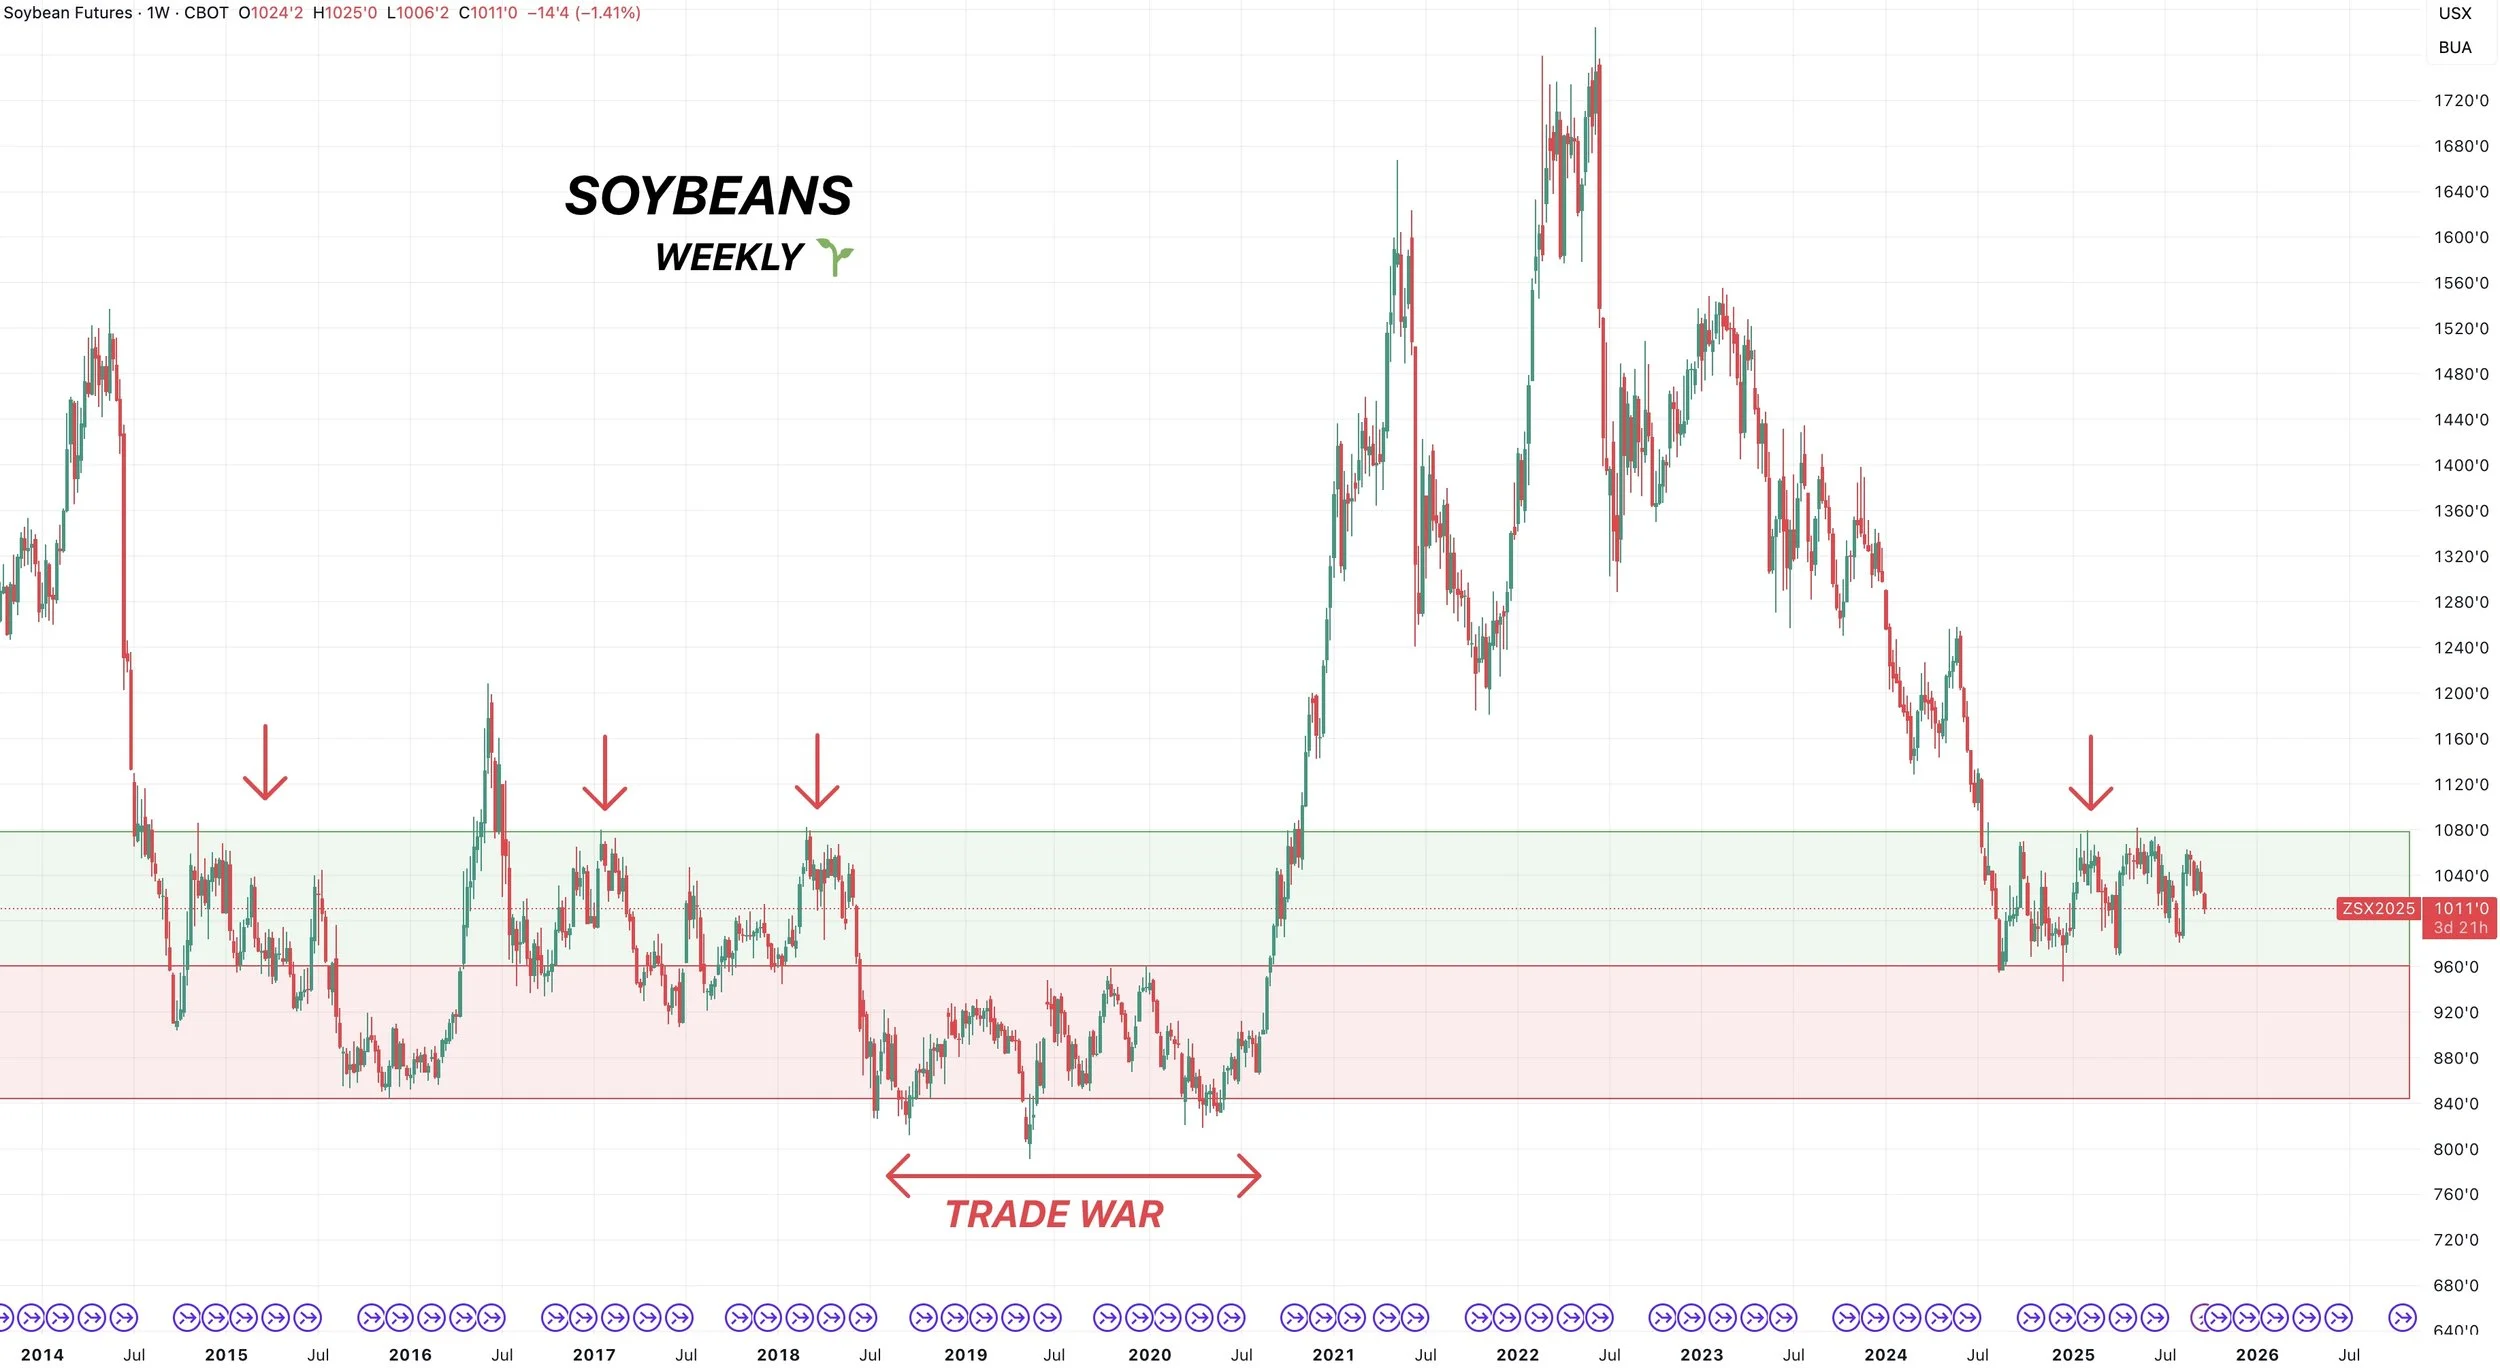
On a big picture scale, soybeans have traded completely sideways for a year now.
Trapped in an +/- 80 cent range since last year.
This is the longest and smallest range we've seen in a very long time.
There are so many unknowns and possibilities in this market, and the direction has yet to be decided.
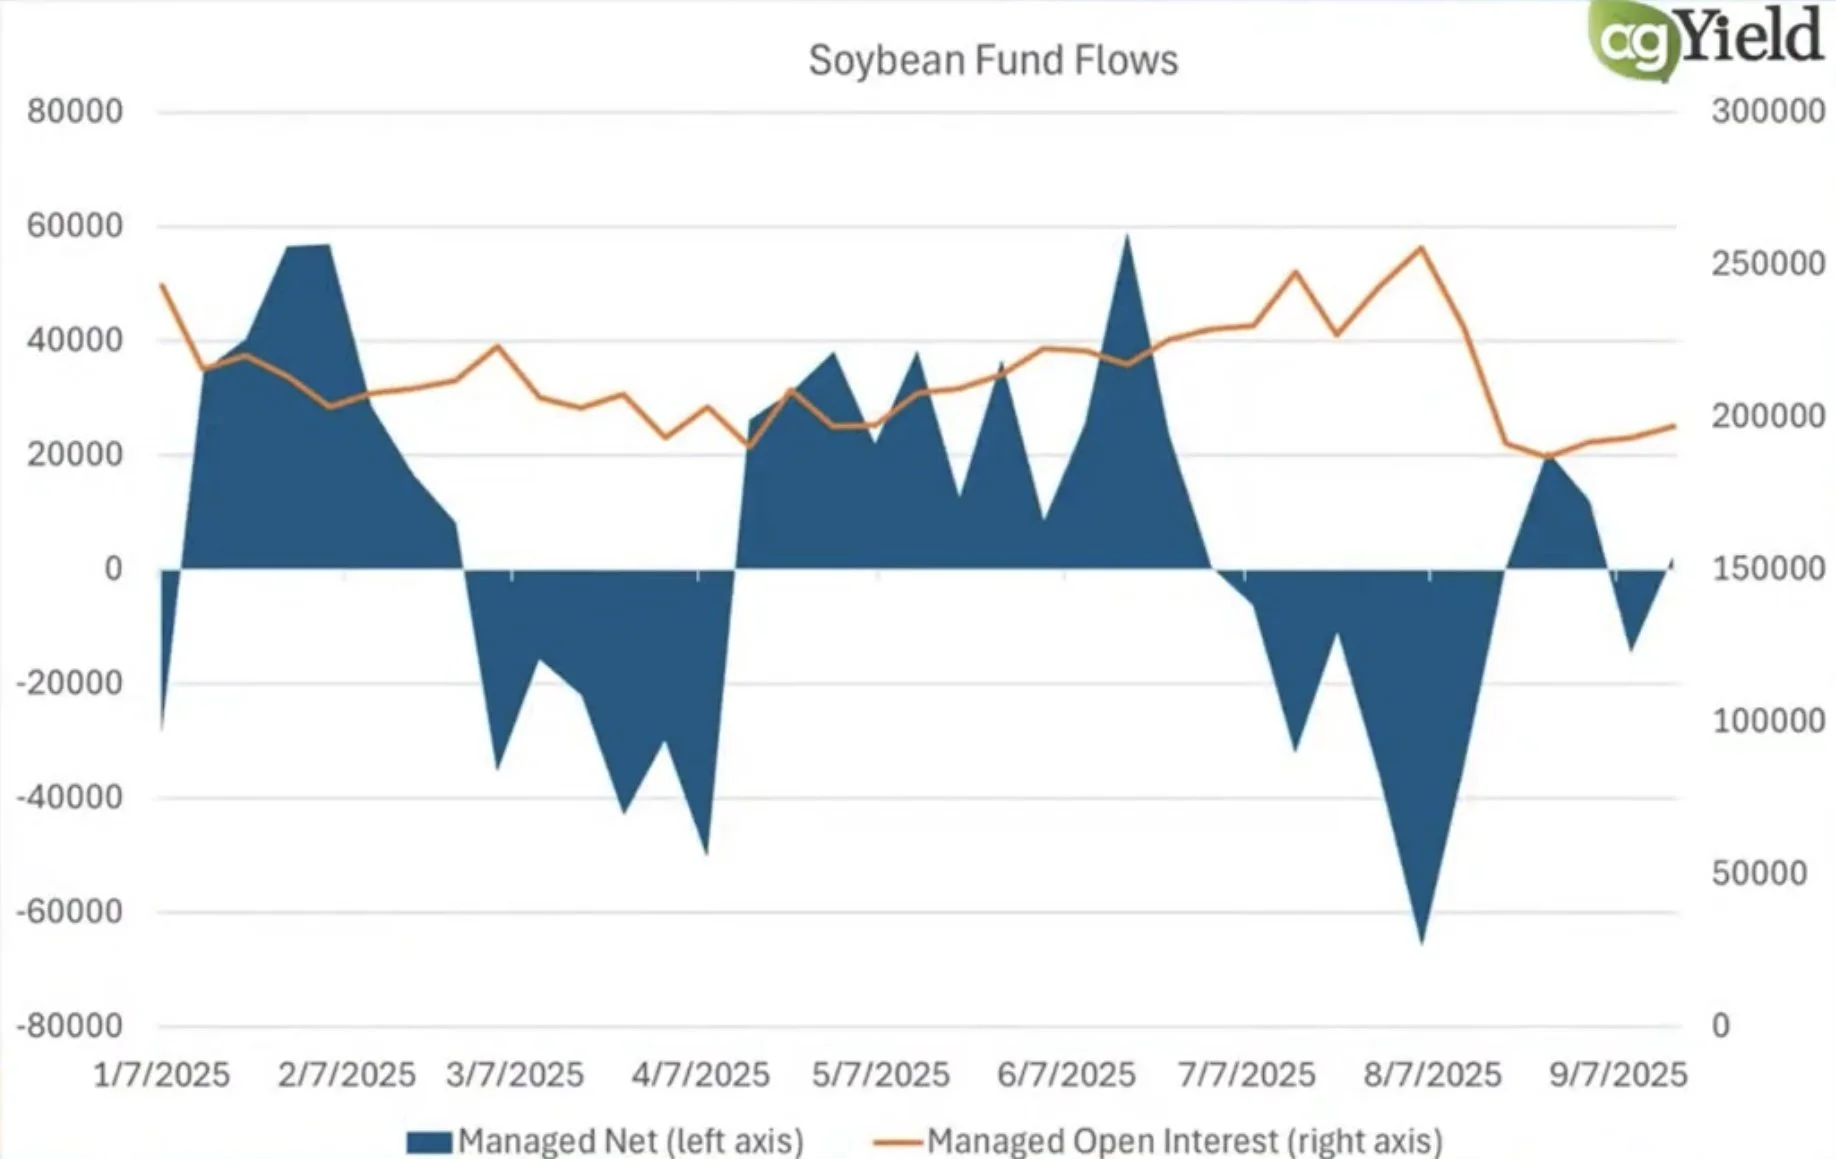
The funds positioning in this market paints a good picture as to how much uncertainty there is in this market.
The funds haven’t been too long or too short this market the entire year, they keep flip flopping right around an even position.

Here is a chart from Ag Yield that shows the funds position and the funds open interest.
Their position has gone sideways (Blue).
At the same time, open interest has declined sizeably (Orange).
Basically, the funds don’t even know what to do with this market.
No one really knows whether China is going to come to the table or not. That is the risk in this market.
If China continues to refuse, then we could see more downside.
If China buys, the soybean balance sheet could get awfully tight as yield is getting smaller on a balance sheet that can’t afford to lose supply given the smaller acres.
One potential wild card coming up soon is going to be Brazil.
Will they get a production scare? And if they do, will that be enough to spook China buyers to come the US if they don’t think Brazil's crop will be as big as they expected?
There are so many unknowns in this market.
I've been showing the 5-year seasonal for a few weeks now and how this is seasonally a weak time frame.
Here is all of the seasonals combined.
Seasonally, we are selling off right on schedule. As this is often our weakest time frame of the year.
Usually that bottom then comes around the first week of October.

Daily Nov Chart:
Soybeans are now below $10.12 which is the 61.8% retracement of the entire rally off of $9.80
We closed today at $10.11, just one penny below the must hold level.
Either this is a bull trap and we bounce right now, or we are headed lower.
We should know tomorrow.
This level is a must hold spot. If we close below $10.12 again, then this sell off is no longer viewed as correctional. It is seen as something bigger.
We have a gap of air lower down to that trend that marked multiple bottoms in this market. So if we break below here, that is the next point of interest.

One other thing I am seeing here.
Today we closed right at the 1 to 1 move lower from the first sell off after the August highs. (Marked with purple arrows)
Meaning that this 4 day sell now equals exactly the size of that first sell off we saw.
If you remember back at the $9.80 lows, we found our bottom at the 1 to 1 move lower from the previous sell off as well.
As that mid-July to August sell off equaled the same size as the sell off we saw after the 4th of July. (Marked with blue arrows)
This is a must hold spot.

Wheat
Nothing fresh fundamentally in the wheat market, as wheat continues to do what wheat always does.
I do think that we would’ve found our lows if it hadn’t been for the Argentina news spooking the market.
The most friendly factor in wheat has been demand. It continues to surpass expectations.
This is a bullish long term factor, but the wheat market just lacks that one catalyst to really push this market higher.
Although we lack a defining catalyst, I can’t get bearish wheat down at these levels.
Seasonally wheat still carves out lows here.

Seasonal lows played out pretty perfectly in both the corn & soybean market this year.
I'd like to think wheat eventually catches a bid here as well at a time where it should, but time will telll.
Corn 5 Year Seasonal

Beans 5 Year Seasonal

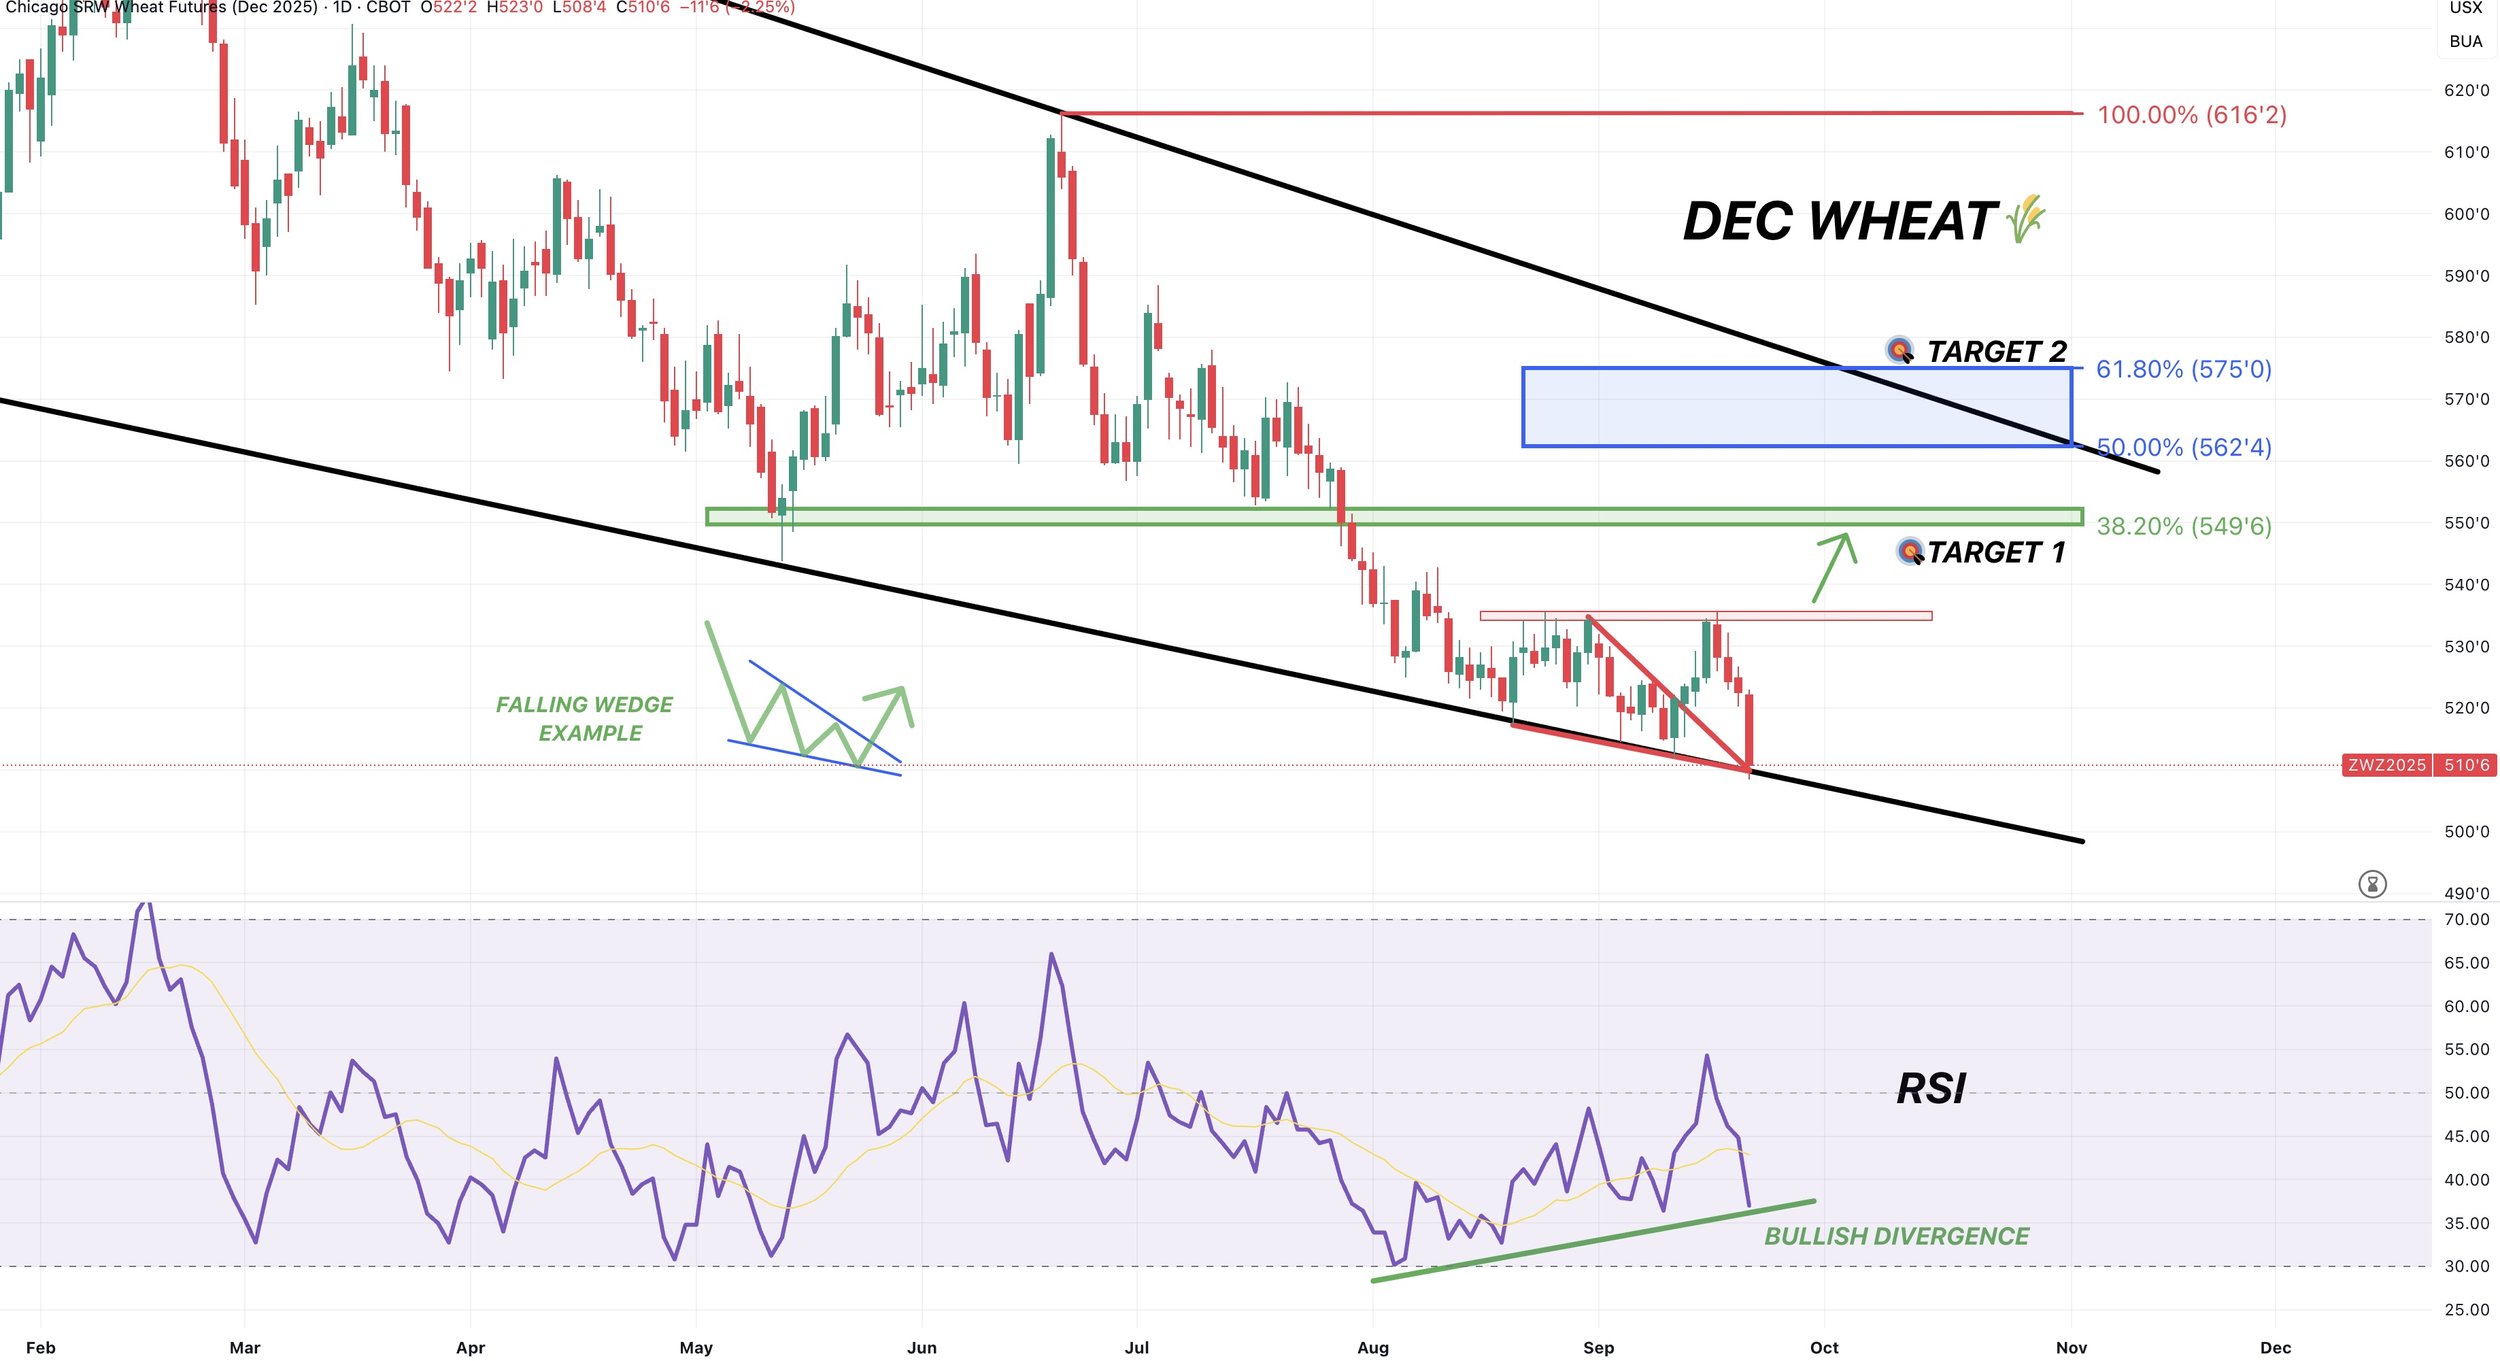
Daily Chicago:
We had that falling wedge breakout, but then rejected right at key resistance.
That $5.35 level if going to be a major level to break above.
As I have been saying for a few weeks, if we break above that level that is going to be our sign saying that this market is finally ready to head higher.
We are now sitting right back down at the bottom of this channel.
This is where this market has bounced a dozen times before. Hopefully we do it once again.

Chicago wheat is still showing massive bullish divergence like it has been for a few weeks now.
We posted yet another round of contract lows, yet the RSI continues to post higher highs.
Daily KC Wheat:
We failed the breakout of the downward channel (pink lines).
Still sitting in a large wedge pattern.
Bounced right at some support today.
If we take out last week's highs I think that'll be our indication the low is in.
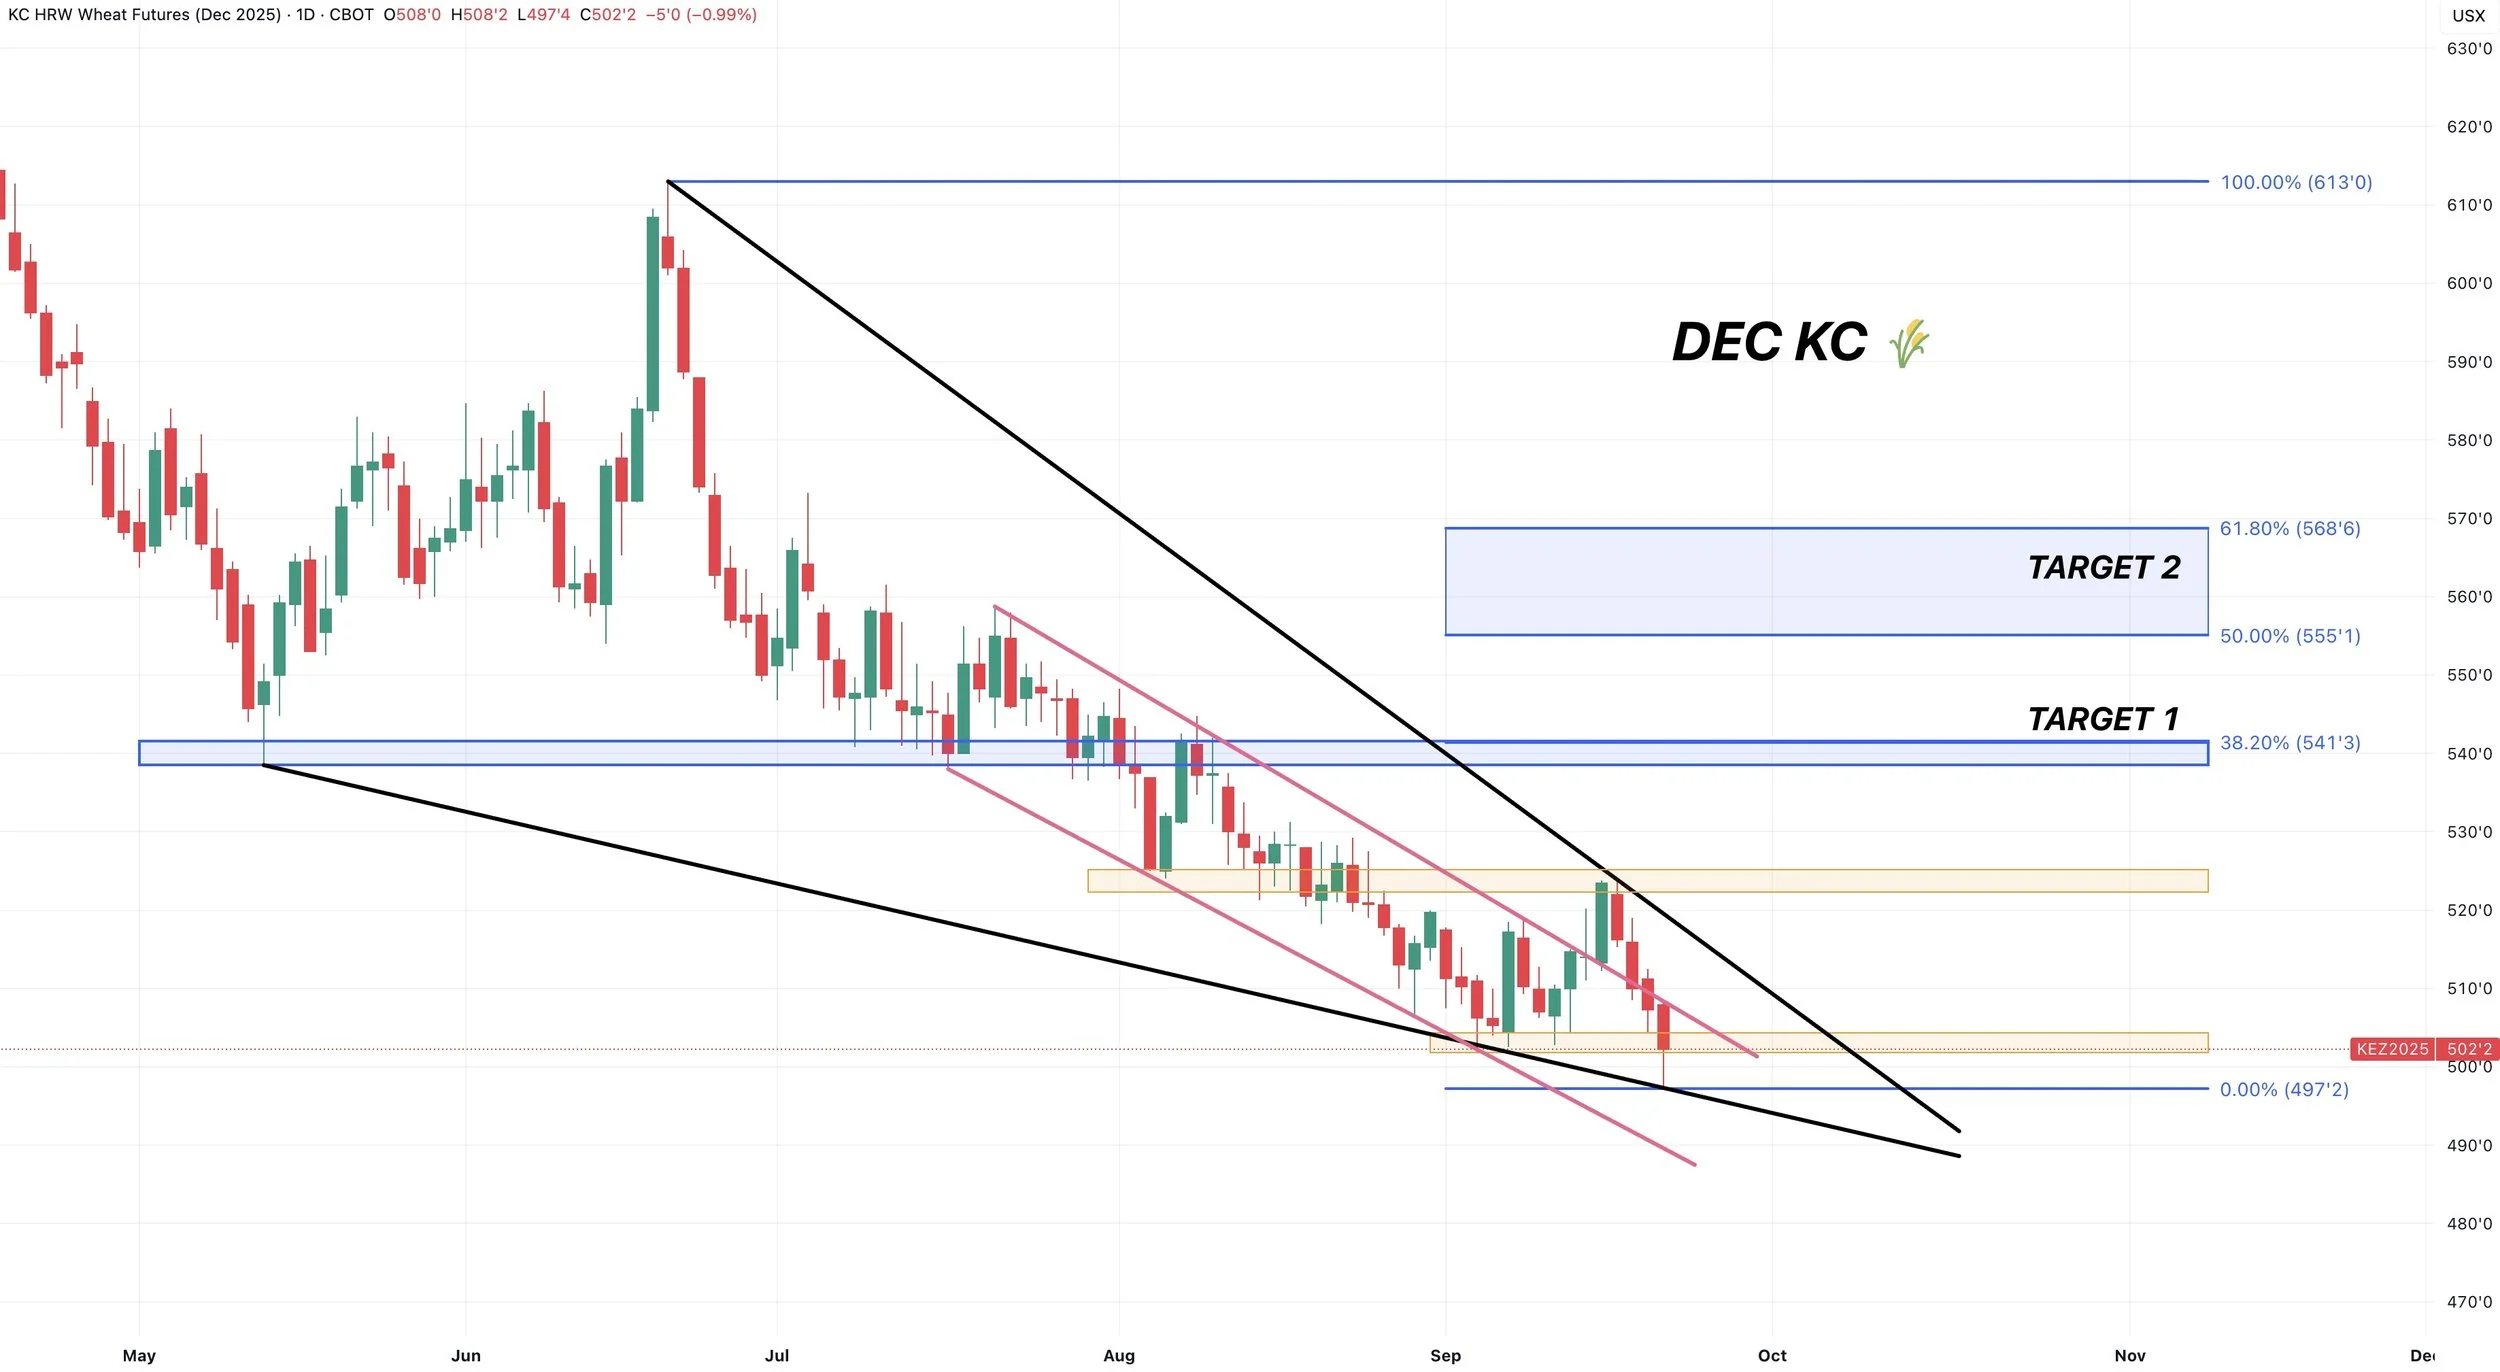
KC wheat is also now showing bullish divergence on the RSI as well.
We posted new lows, meanwhile the RSI did not.

Cattle
Impressive day for cattle off the back of few different pieces of news.
The biggest reason for the strength was screw worm news.
The story that is going around is that an 8 month old calf started in the southern Mexico area (which is an area known to be effected withs crew worm) was brought up to a feed yard roughly 70 miles away from the Texas border. The calf then tested positive for screw worm.
This is now the most northern detection of the screwworm during this outbreak.
Some think that the last few weeks of weakness was partly due to speculation that they would talk about reopening the border.
This news further delays the border re-opening, and it doesn’t appear like it will happen soon.

The other piece of news was the cattle on feed report.
The report wasn’t super bullish or bearish. As it came in around expectations.
But the report still told us there is a tight situation.
Placements are down -10% vs 2024, and are the lowest in 10 years.
Marketing numbers are down -14% vs 2024, and are the lowest on record since the series began in 1996.
Here is the numbers vs the estimates:

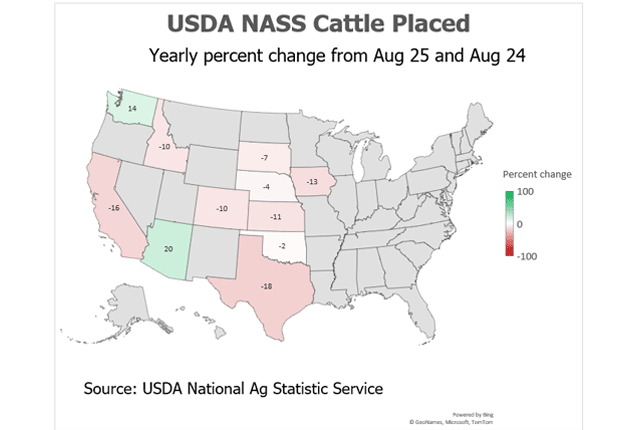
Here is a state by state breakdown of placements vs 2024.
Only two states are higher compared to last year.
There is a supply problem in this market. But that problem is also known.
The biggest question in this market is, when is this problem finally priced in?
Eventually, this market will turn lower once it is priced in. It's just hard to say exactly when that will be.
Oct Feeder:
Feeders look pretty good here.
We bounced perfectly in the golden zone from those August 1st lows. Right where we needed to.
We now reclaimed over 61.8% of this sell off. So odds favor us now going to test those highs again.
If not, the must hold spot is the red box.
I still like keeping downside protection up here via puts for most of you.

Let's say we go and post new highs.
We would more than likely be showing some serious bearish divergence.
With prices making new highs but the RSI not.
Unless the RSI goes and posts a new high as well.
Something to keep an eye on moving forward if we post new highs.

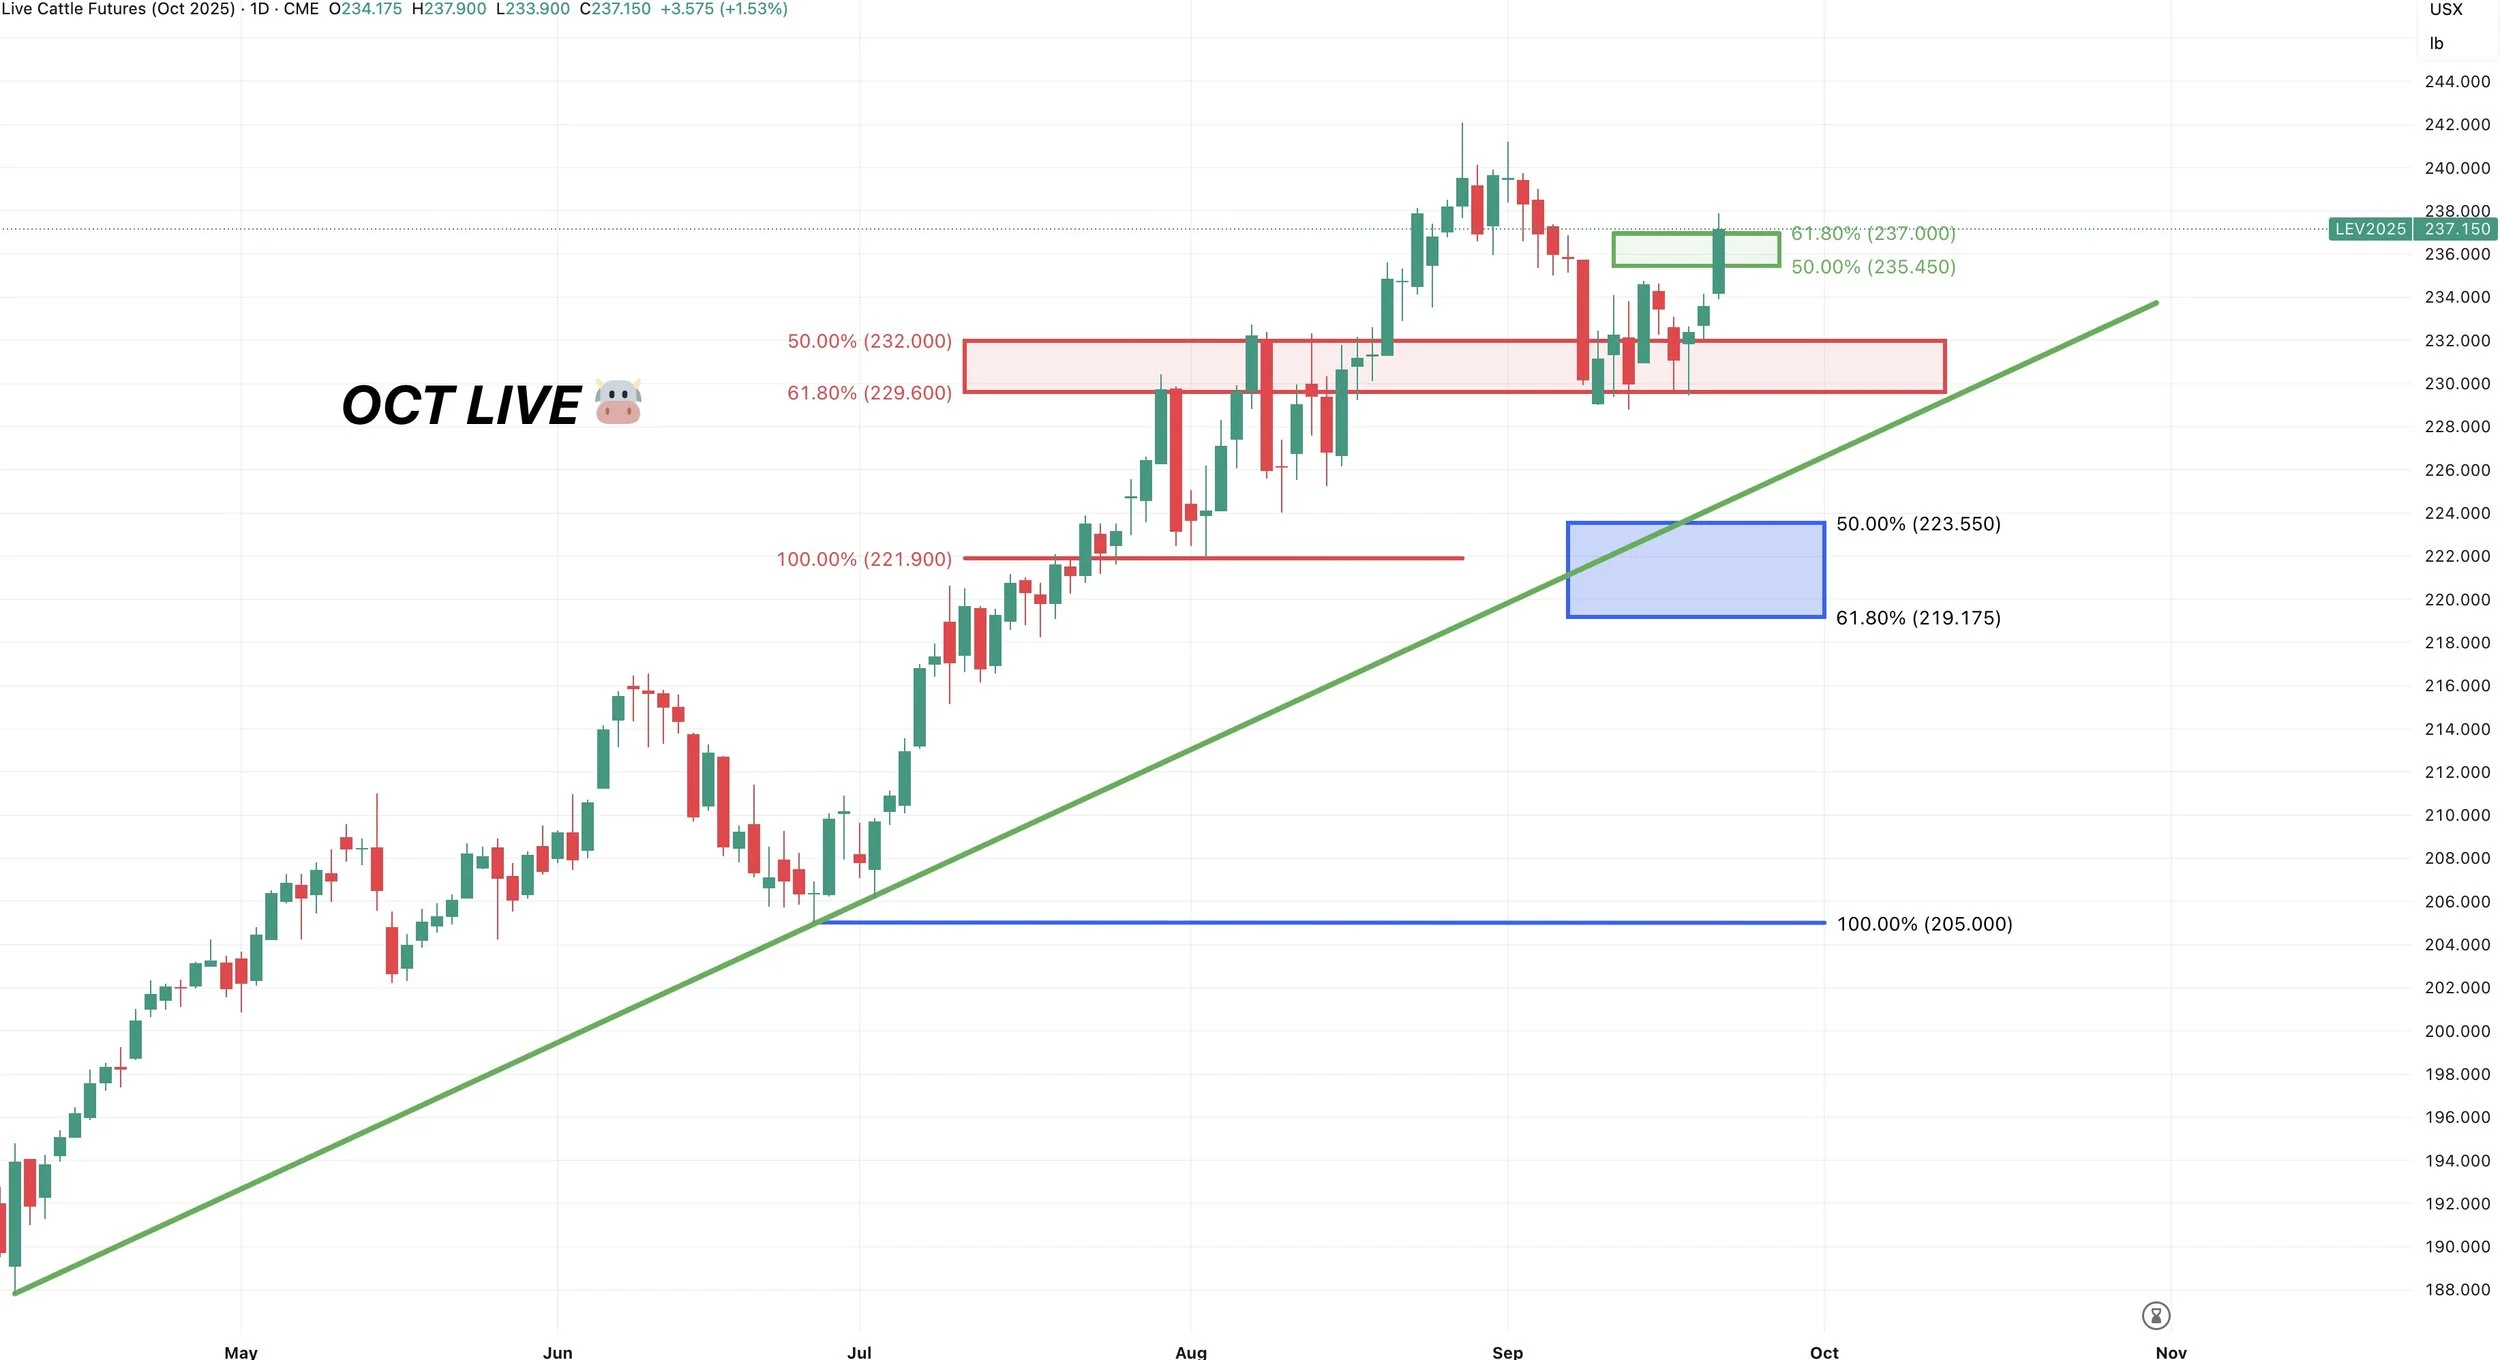
Oct Live:
Live cattle also bounced right in the golden zone perfectly.
We closed right at the 61.8% retracement of the recent sell off. So we need one more push to say we are going to test the highs.
The must hold spot is going to be the red box for now.
Past Sell or Protection Signals
Aug 22nd: 🌱
Soybean sell signal & hedge alert.
July 31st: 🐮
Cattle sell signal & hedge alert.
July 10th: 🐮
Cattle sell signal & hedge alert.
CLICK HERE TO VIEW
June 5th: 🐮
Cattle sell signal & hedge alert.
June 2nd: 🌾
MPLS wheat sell signal.
April 10th: 🌽
Old crop corn sell signal.
March 19th: 🐮
Cattle hedge & sell signal.
Feb 18th: 🌽 🌾
Old crop KC wheat & old crop corn signal.
Jan 23rd: 🌽 🌱
Corn & beans old crop sell signal.
CLICK HERE TO VIEW
Jan 15th: 🌽 🌱
Corn & beans hedge alert/sell signal.
Jan 2nd: 🐮
Cattle hedge alert at new all-time highs & target.
Dec 11th: 🌽
Corn sell signal at $4.51 200-day MA
CLICK HERE TO VIEW
Oct 2nd: 🌾
Wheat sell signal at $6.12 target
Sep 30th: 🌽
Corn protection signal at $4.23-26
Sep 27th: 🌱
Soybean sell & protection signal at $10.65
Sep 13th: 🌾
Wheat sell signal at $5.98
May 22nd: 🌾
Wheat sell signal when wheat traded +$7.00
Want to Talk?
Our phones are open 24/7 for you guys if you ever need anything or want to discuss your operation.
Hedge Account
Interested in a hedge account? Use the link below to set up an account or shoot Jeremey a call at (605)295-3100.