
USDA & CORN TRUTH FINALLY EXPLAINED
MARKET UPDATE
You can scroll to read the usual update as well. As the written version is the exact same as the video.
Timestamps for video:
USDA: 0:00min
Corn: 4:15min
Beans: 7:10min
Wheat: 9:00min
Cattle: 10:45min
Want to talk about your situation?
(605)295-3100
USDA Sale Ends Tonight
Your free trial has expired
Subscribe if you would like to keep getting our daily updates. Don’t miss our next sell signal
Futures Prices Close

Overview
Grains lower across the board with today's USDA report.
Today we had the quarterly stocks, which is our final old crop balance sheets, along with wheat production.
The report provided a bearish surprise in both corn & wheat.
Old crop corn stocks came in above expectations due to a cut to feed & residul demand.
Old crop wheat stocks also came in above expectations due to finding extra winter wheat acres.
Meanwhile, the report was essentially neutral for soybeans with no major changes made.
Let's dive right into the report and what it means..
Corn Truth Finally Explained
As expected, this was bearish for corn.
Here is the numbers in case you missed them.
Corn came in +200 million higher than estimates.
Wheat was +80 million higher than estimates.
Beans were just under the estimates.
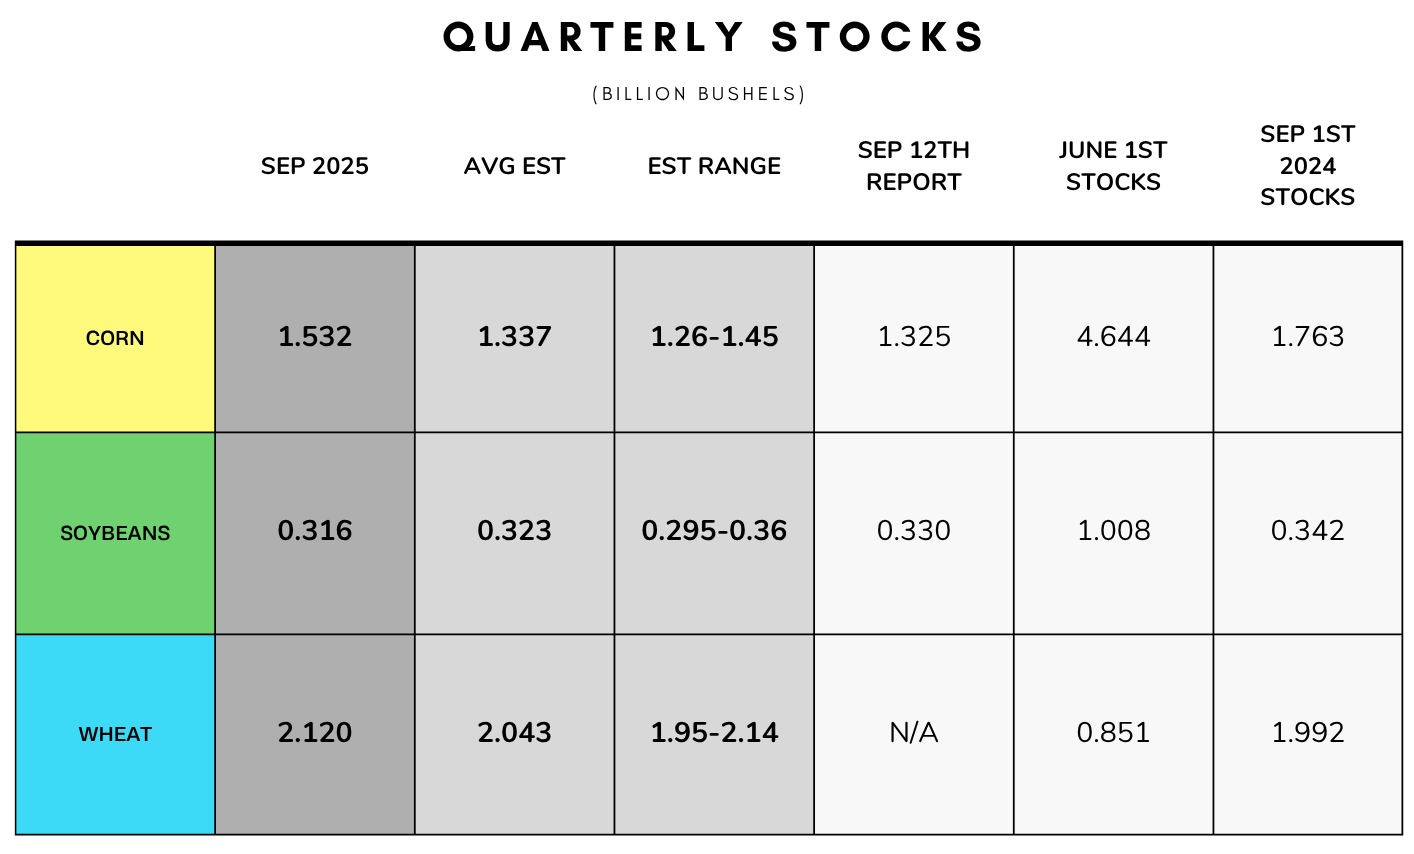
The USDA found an extra +200 million bushels of old crop corn.
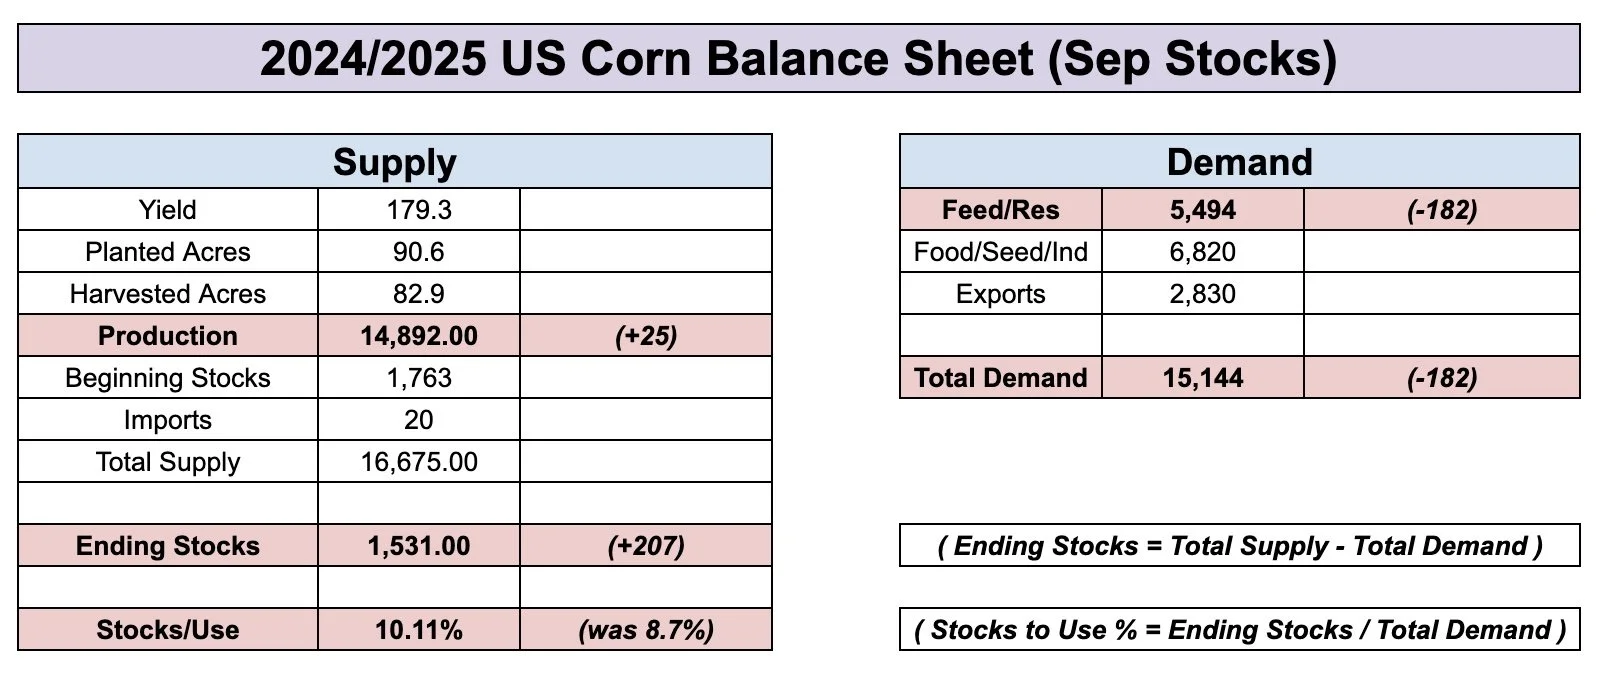
This change in old crop did NOT come from last year's crop being bigger. They left production virutally unchanged.
The USDA dropped old crop feed & residual demand by almost -200 million. Which is where the entirety of this change came from.
We had said all week that this was the biggest risk for this report. Because this market simply never traded like we had a sub 9% stocks to use ratio or a 1.3 billion bushel carryout.
So almost everyone expected that this report would provide an explanation as to why corn performed so poorly the last year despite the supposedly friendly balance sheet. That is exactly what we got.
The market has been hinting at us for months that this crop was never at a 1.3 billion carryout.
Instead, it was actually at 1.5 billion.
Instead of an 8.7% stocks to use ratio. It was actually over 10%.
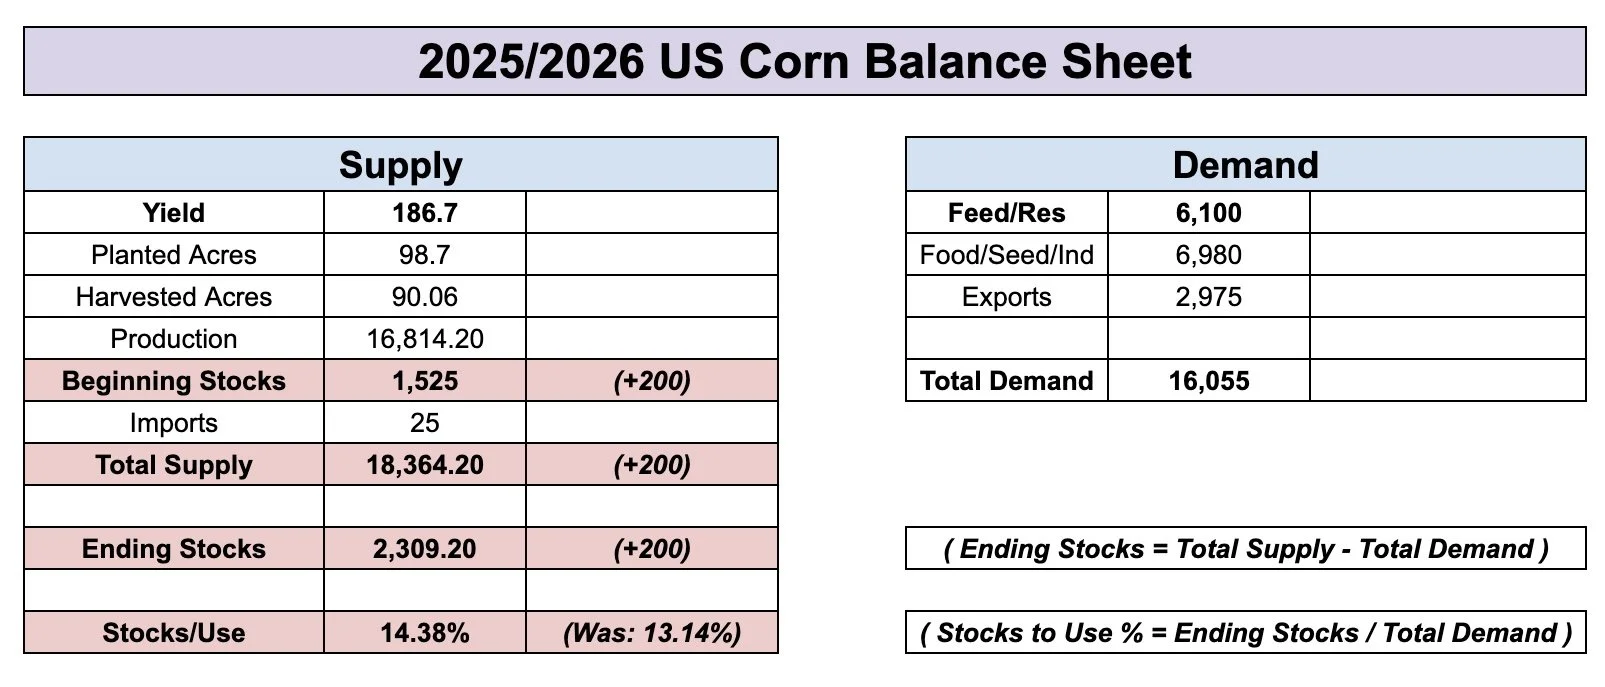
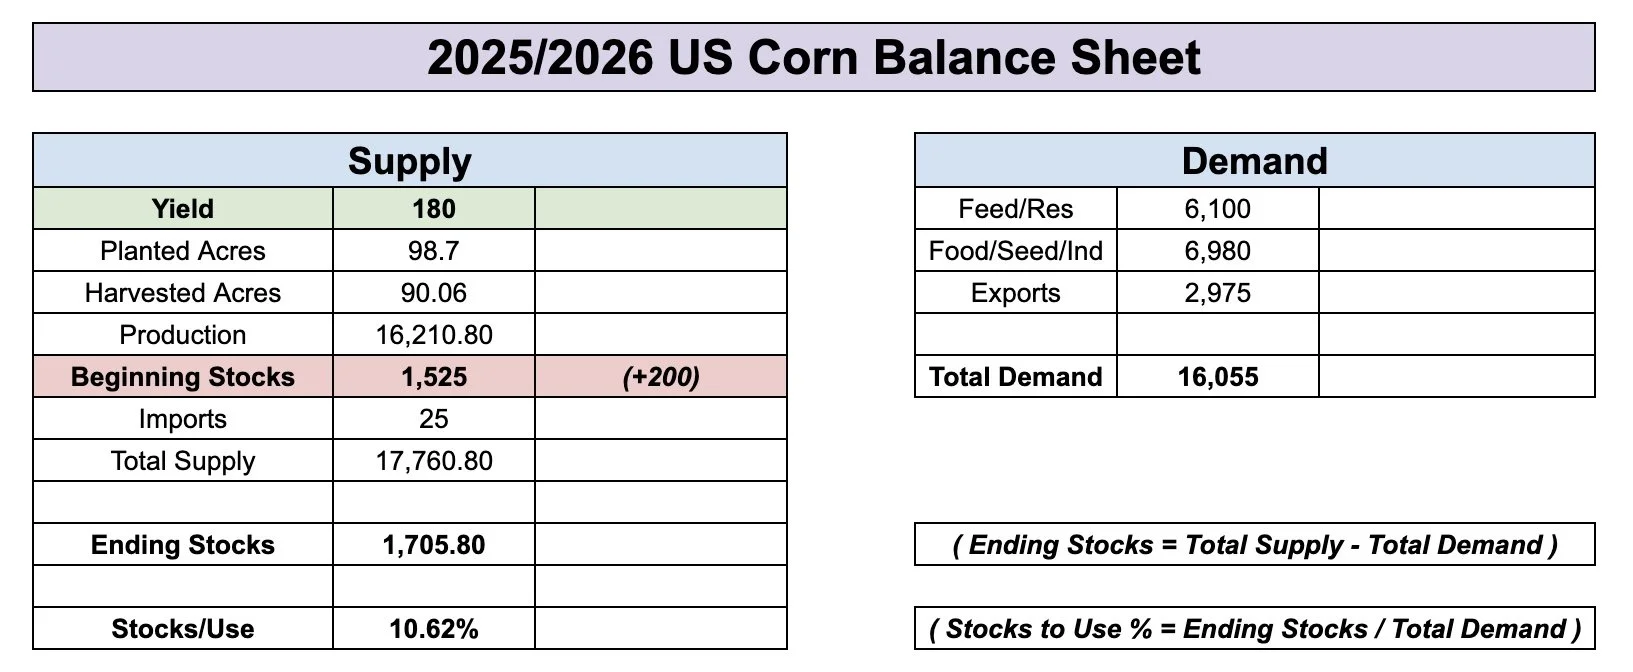
Here is the final old crop balance sheet with the new updated numbers vs what it looked like before this report.
Old Crop Before Report
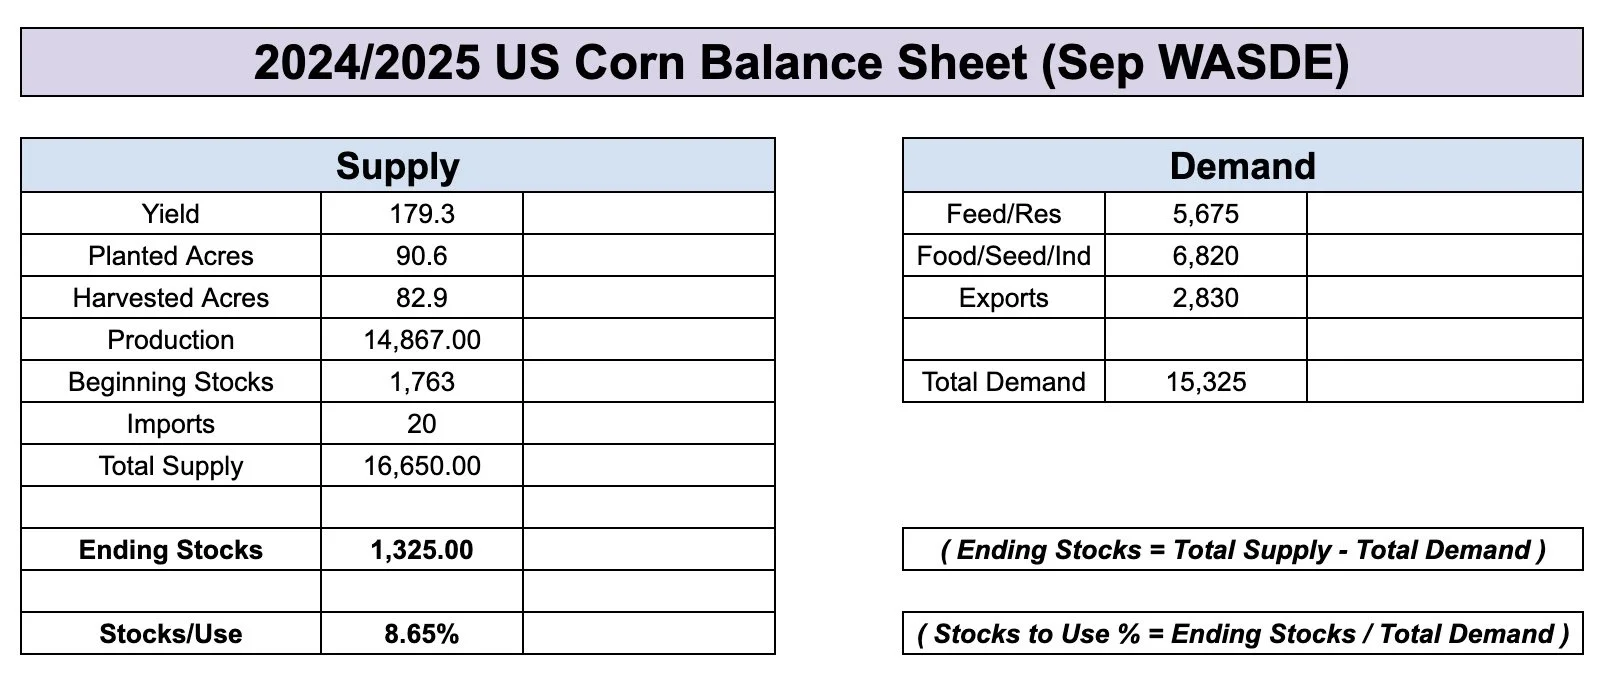
Final Old Crop Balance Sheet
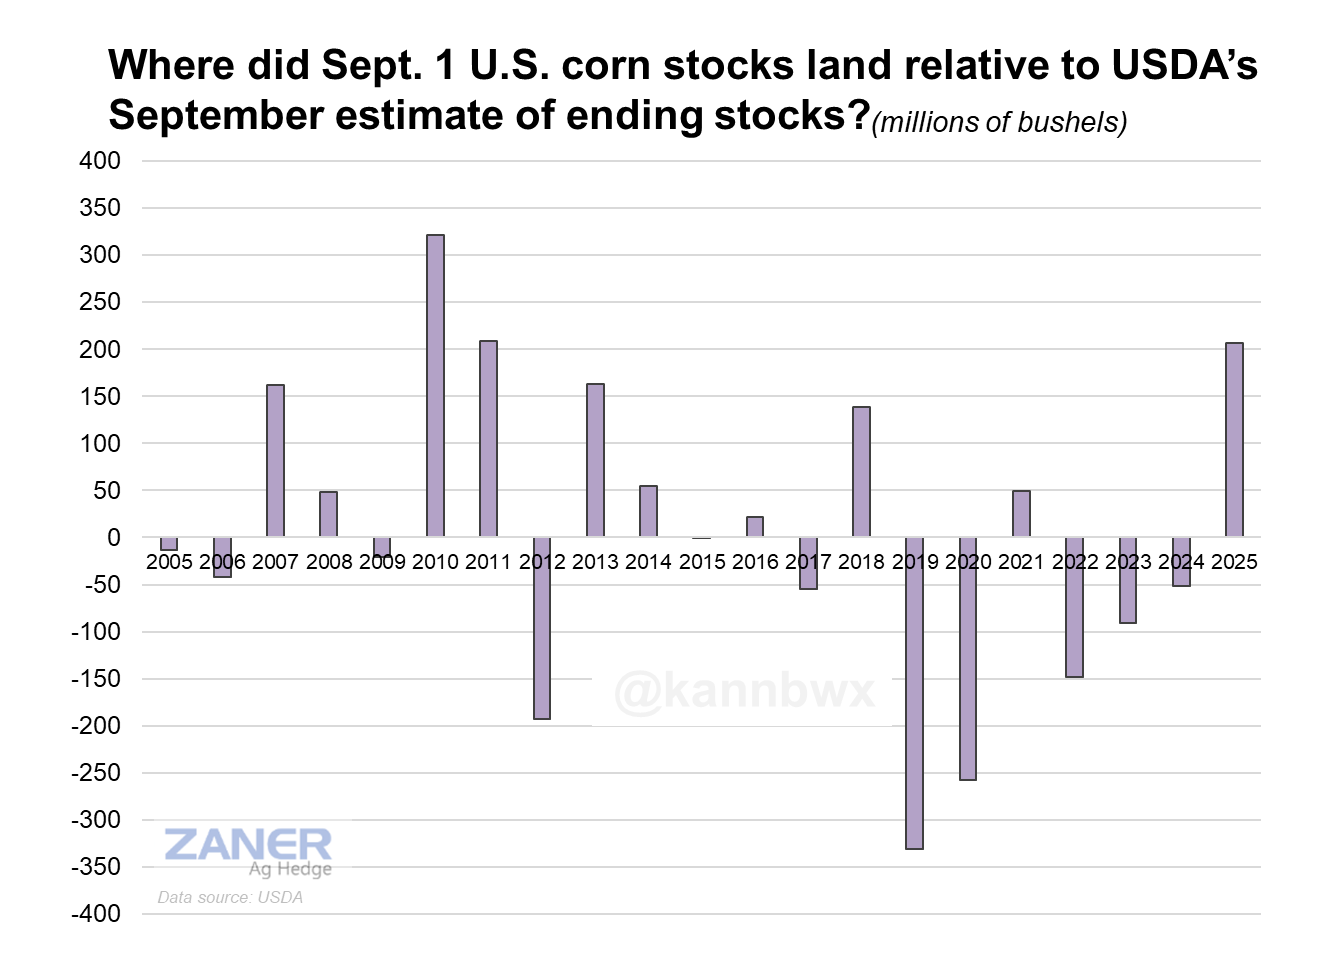
Here is a good visual from Karen Braun that shows how corn stocks changed from the Sep WASDE to the Sep Stocks Report.
This was the 2nd biggest upside change in decades. Only behind 2010.
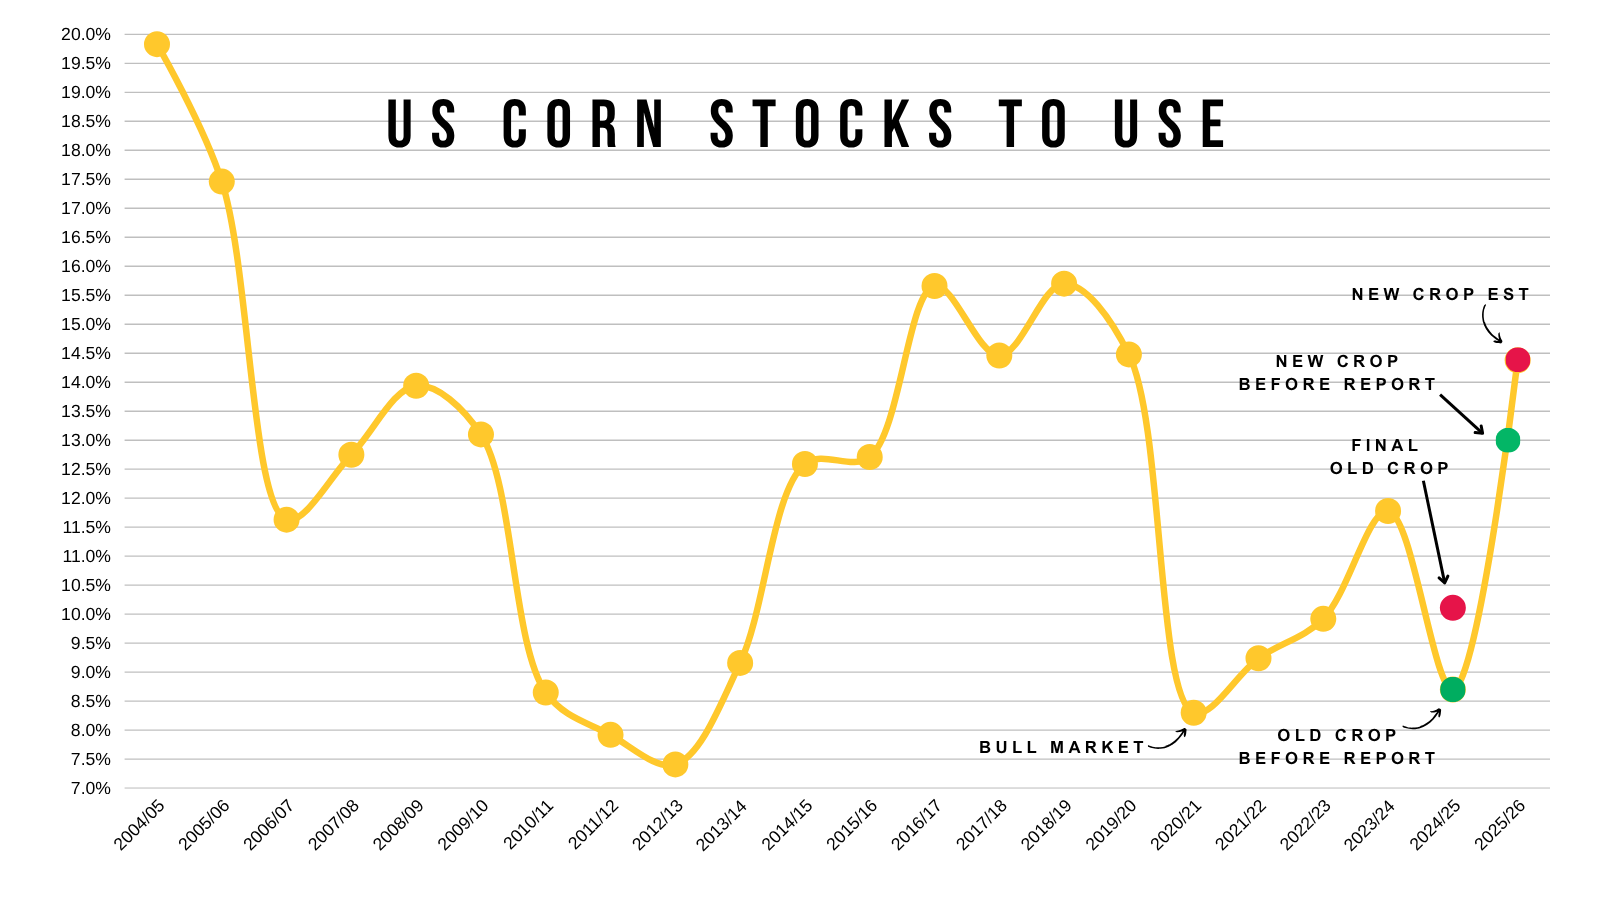
Here is a visual of the stocks to use ratio over the years.
Which includes new crop with the fresh 2.3 billion carryout, along with old crop before & after this report.
There is a big difference between being below 9% and being over 10%.
But at least we partially know why this corn market never traded like it should have.
A sub 9% stocks to use ratio indicates a full blown bull market, but it was never actually true.
What does this mean for new crop corn?
Not only did we find +200 million bushels of old crop corn, but it automatically carries over to new crop and adds another +200 million bushels of supply to the new crop balance sheet.
As this gets added to "beginning stocks".
So instead of a 2.1 billion bushel carryout, this now gives us a whopping 2.3 billion bushel carryout without making any other changes.
(2.1 billion + 200 million = 2.3 billion)
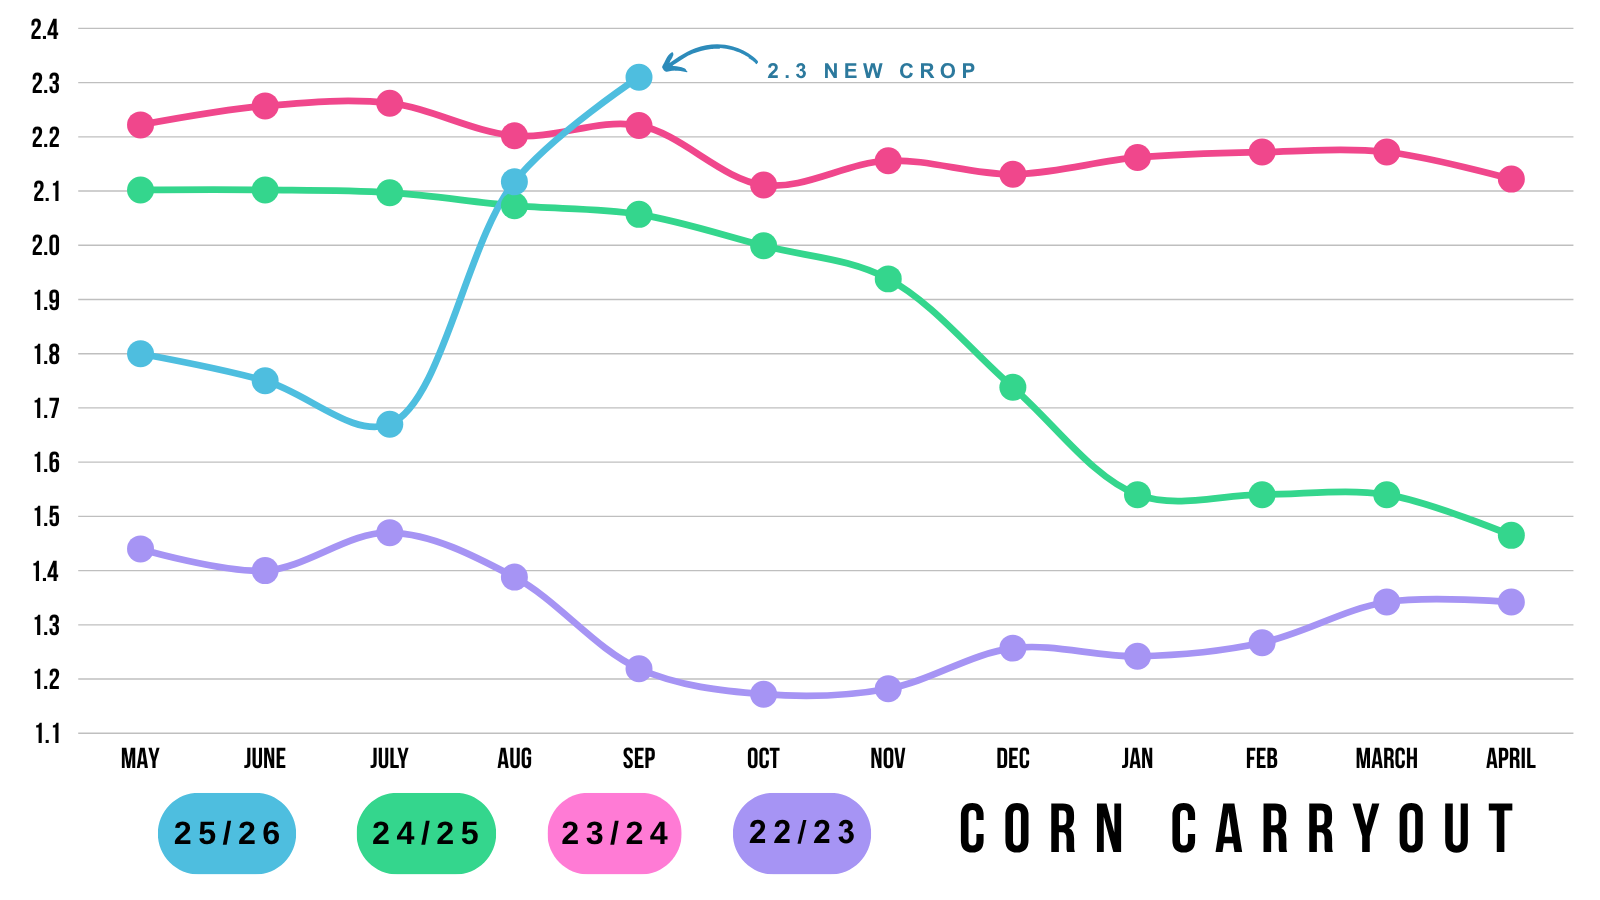
Here is a visual of carryout the last few years.
2.3 is a pretty bearish number.
This 2.3 is not set in stone, as the USDA can make some other changes by the next report.
But purely using their numbers from the Sep WASDE report, while adding this extra supply leaves you with 2.3 billion.
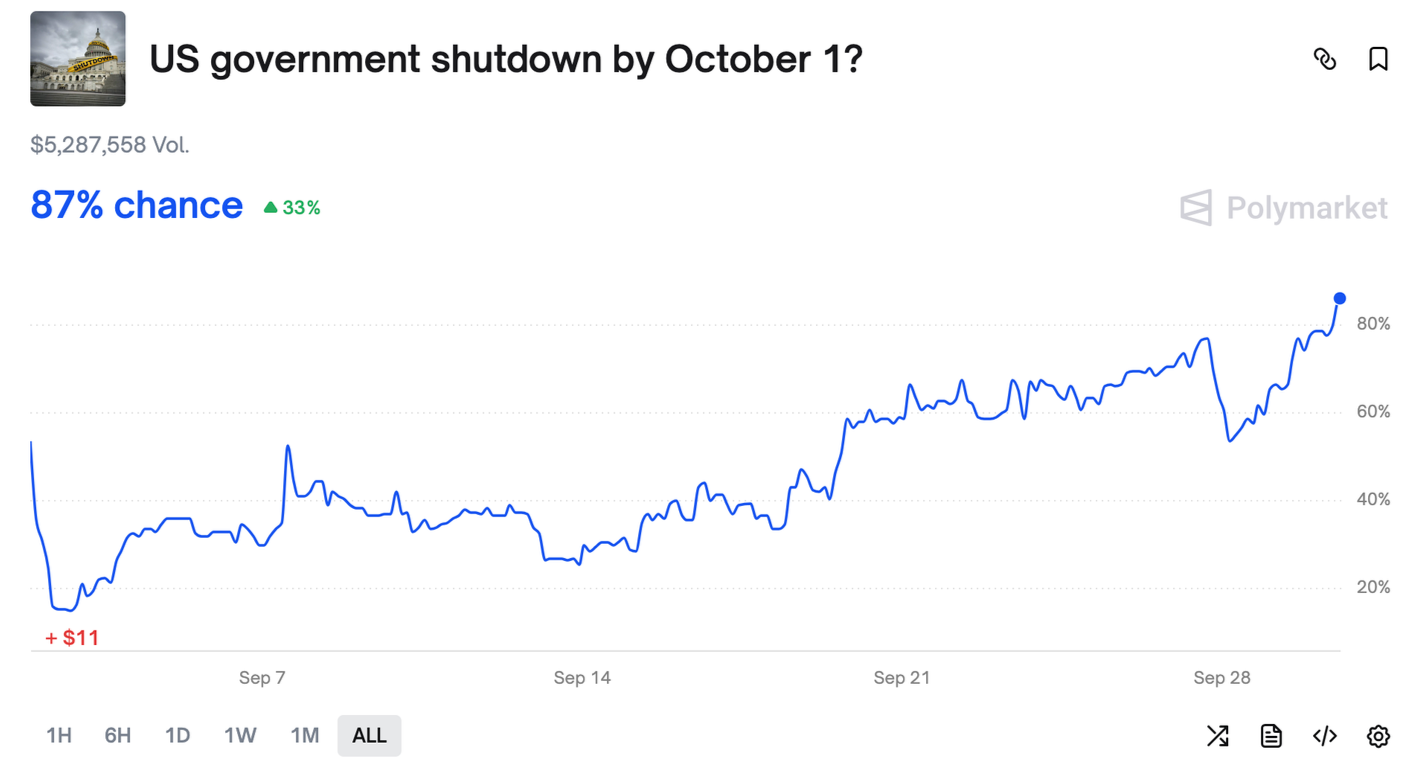
Government Shut Down?
I just wanted to mention this quickly.
There is an 87% chance that the government will shut down today according to the betting markets.
If this happens, we may or may not get the October USDA report. As the USDA is a government agency.
The USDA report is scheduled for October 9th. However, I believe they compile the data during the first week of October.
Today's Main Takeaways
Corn
The corn market continues to have bearish surprise after bearish surprise thrown at it.
We had more acres TWICE.
A record yield.
Now more stocks.
This report was not friendly for corn at all. It makes it that much harder to paint a friendly situation.
But.. the market was expecting this to a certain extent. This corn market has battled through some incredibly bearish headlines.
Here is what I mean when I say this makes it even that much harder to paint a bullish scenario in corn.
Here is the current balance sheet from the Sep WASDE, with the added beginning stocks once again for reference.
Without changing anything else, we now have a 2.3 billion bushel carryout.

Now here is what the balance sheet would’ve looked like if you hadn’t added that extra +200 million bushels of supply and if yield fell all the way down to 180 bpa.
Cuts to demand would’ve offset some of this, but without changing demand it would’ve resulted in a carryout of 1.5 and a stocks to use ratio below 10%.
180 Yield Before This Report (New Crop)

Now instead.. since we have an extra +200 million.. if yield dropped to 180 it would only result in a carryout of 1.7 with a near 11% stocks to use ratio. Which isn’t super bullish.
This is without changing demand.
If yield gets cut, the USDA is almost certainly going to be cutting some of those lofty demand numbers as well.
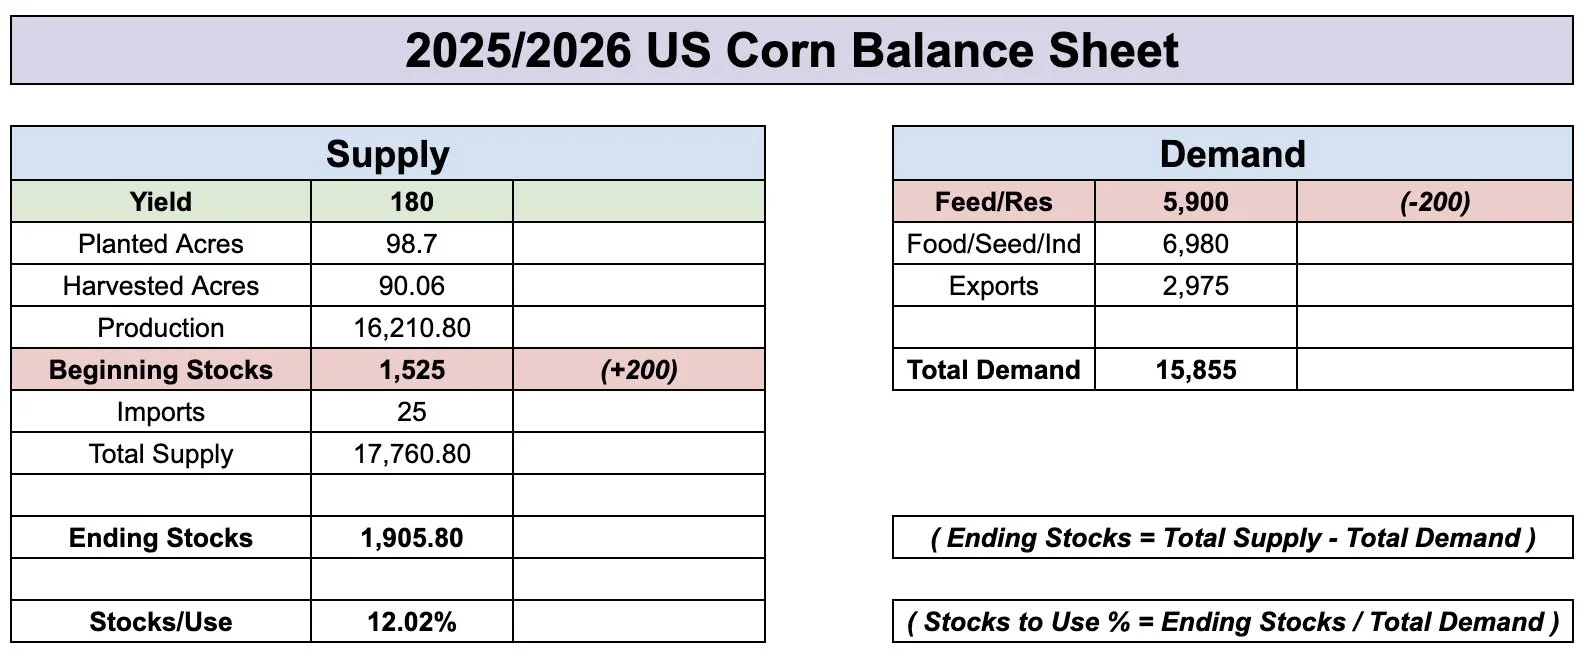
180 Yield After This Report (New Crop)
Most believe feed demand is at least +200 million too high.
After all.. they did just cut our old crop feed & residual demand by -200 million as well.
If that is the case, there is a possible scenario where we wind up with a 180 yield and still have a near 2 billion bushel carryout.
In this scenario we dropped yield to 180 and cut feed demand by -200 million. It results in a carryout of 1.9 billion.
This is why this extra supply it makes it even harder to eat into that carryout.
180 Yield With -200 Million Feed & Residual
Am I super bearish corn here? No of course not.
I still think our harvest lows are in and that this market has priced in a lot of bearishness.
We have had 3 very bearish corn reports in a row, and the corn market has held in there.
However, it is incredibly hard to paint some mega bullish scenario in corn unless yield somehow winds up in the realm of 175.
Short term we do also still have to deal with that harvest pressure.
Dec Corn Chart:
Despite the bearish numbers, we didn’t have that awful of price action. Only down -6 cents on the day.
Currently we are right at this cluster of support and bounce nicely off the lows today.
Break below and we could test that red box.
We need to hold that red box to keep an upward bias. That is the golden zone retracement of the entire rally off of contract lows.

Soybeans
This USDA report virtually made zero changes to the soybean situation.
We still have zero business to China.
The biggest question is.. will our losses in demand offset the possible losses in supply?
If China truly stays away, it would take an immense cut to yield to offset that type of demand loss.
China is the wild card.
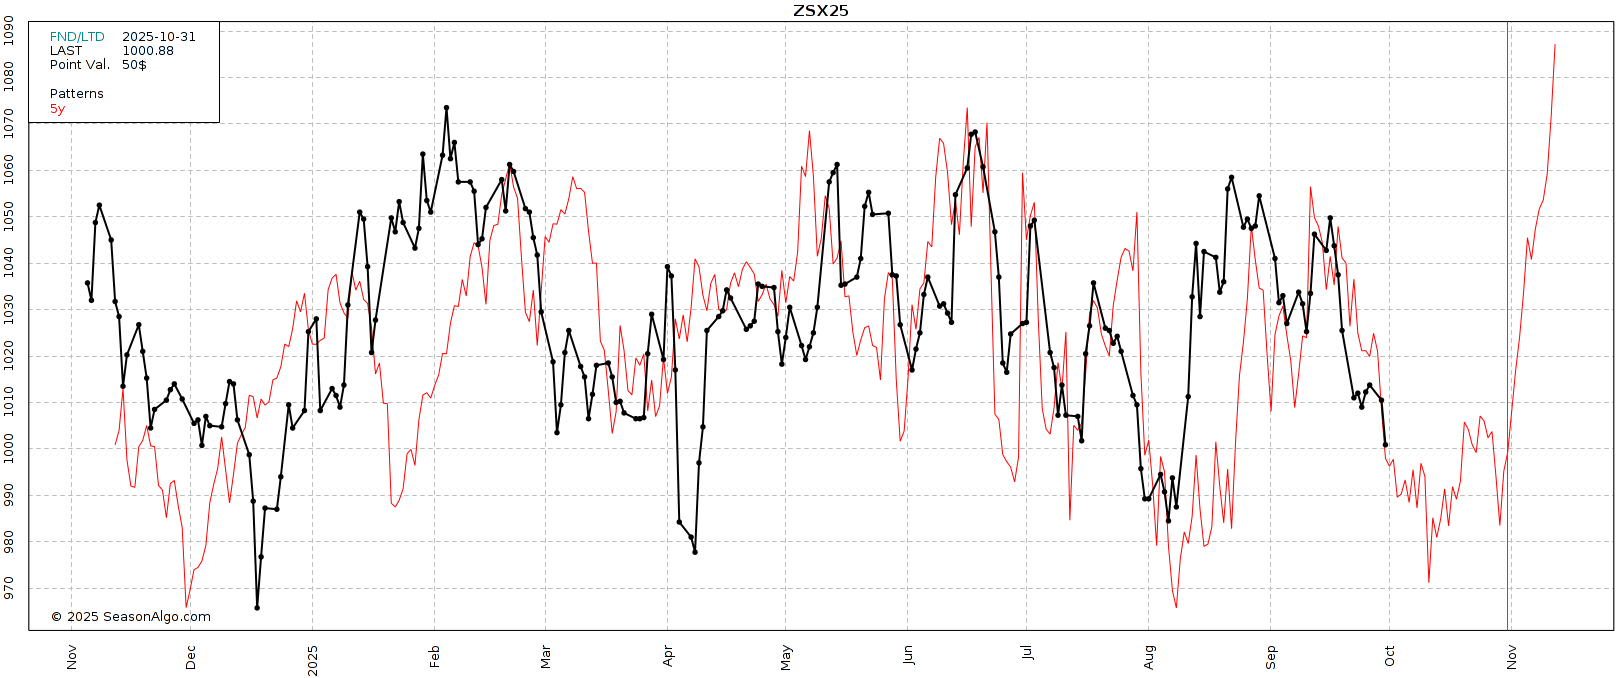
Seasonally this is soybeans weakest time of the year as well.
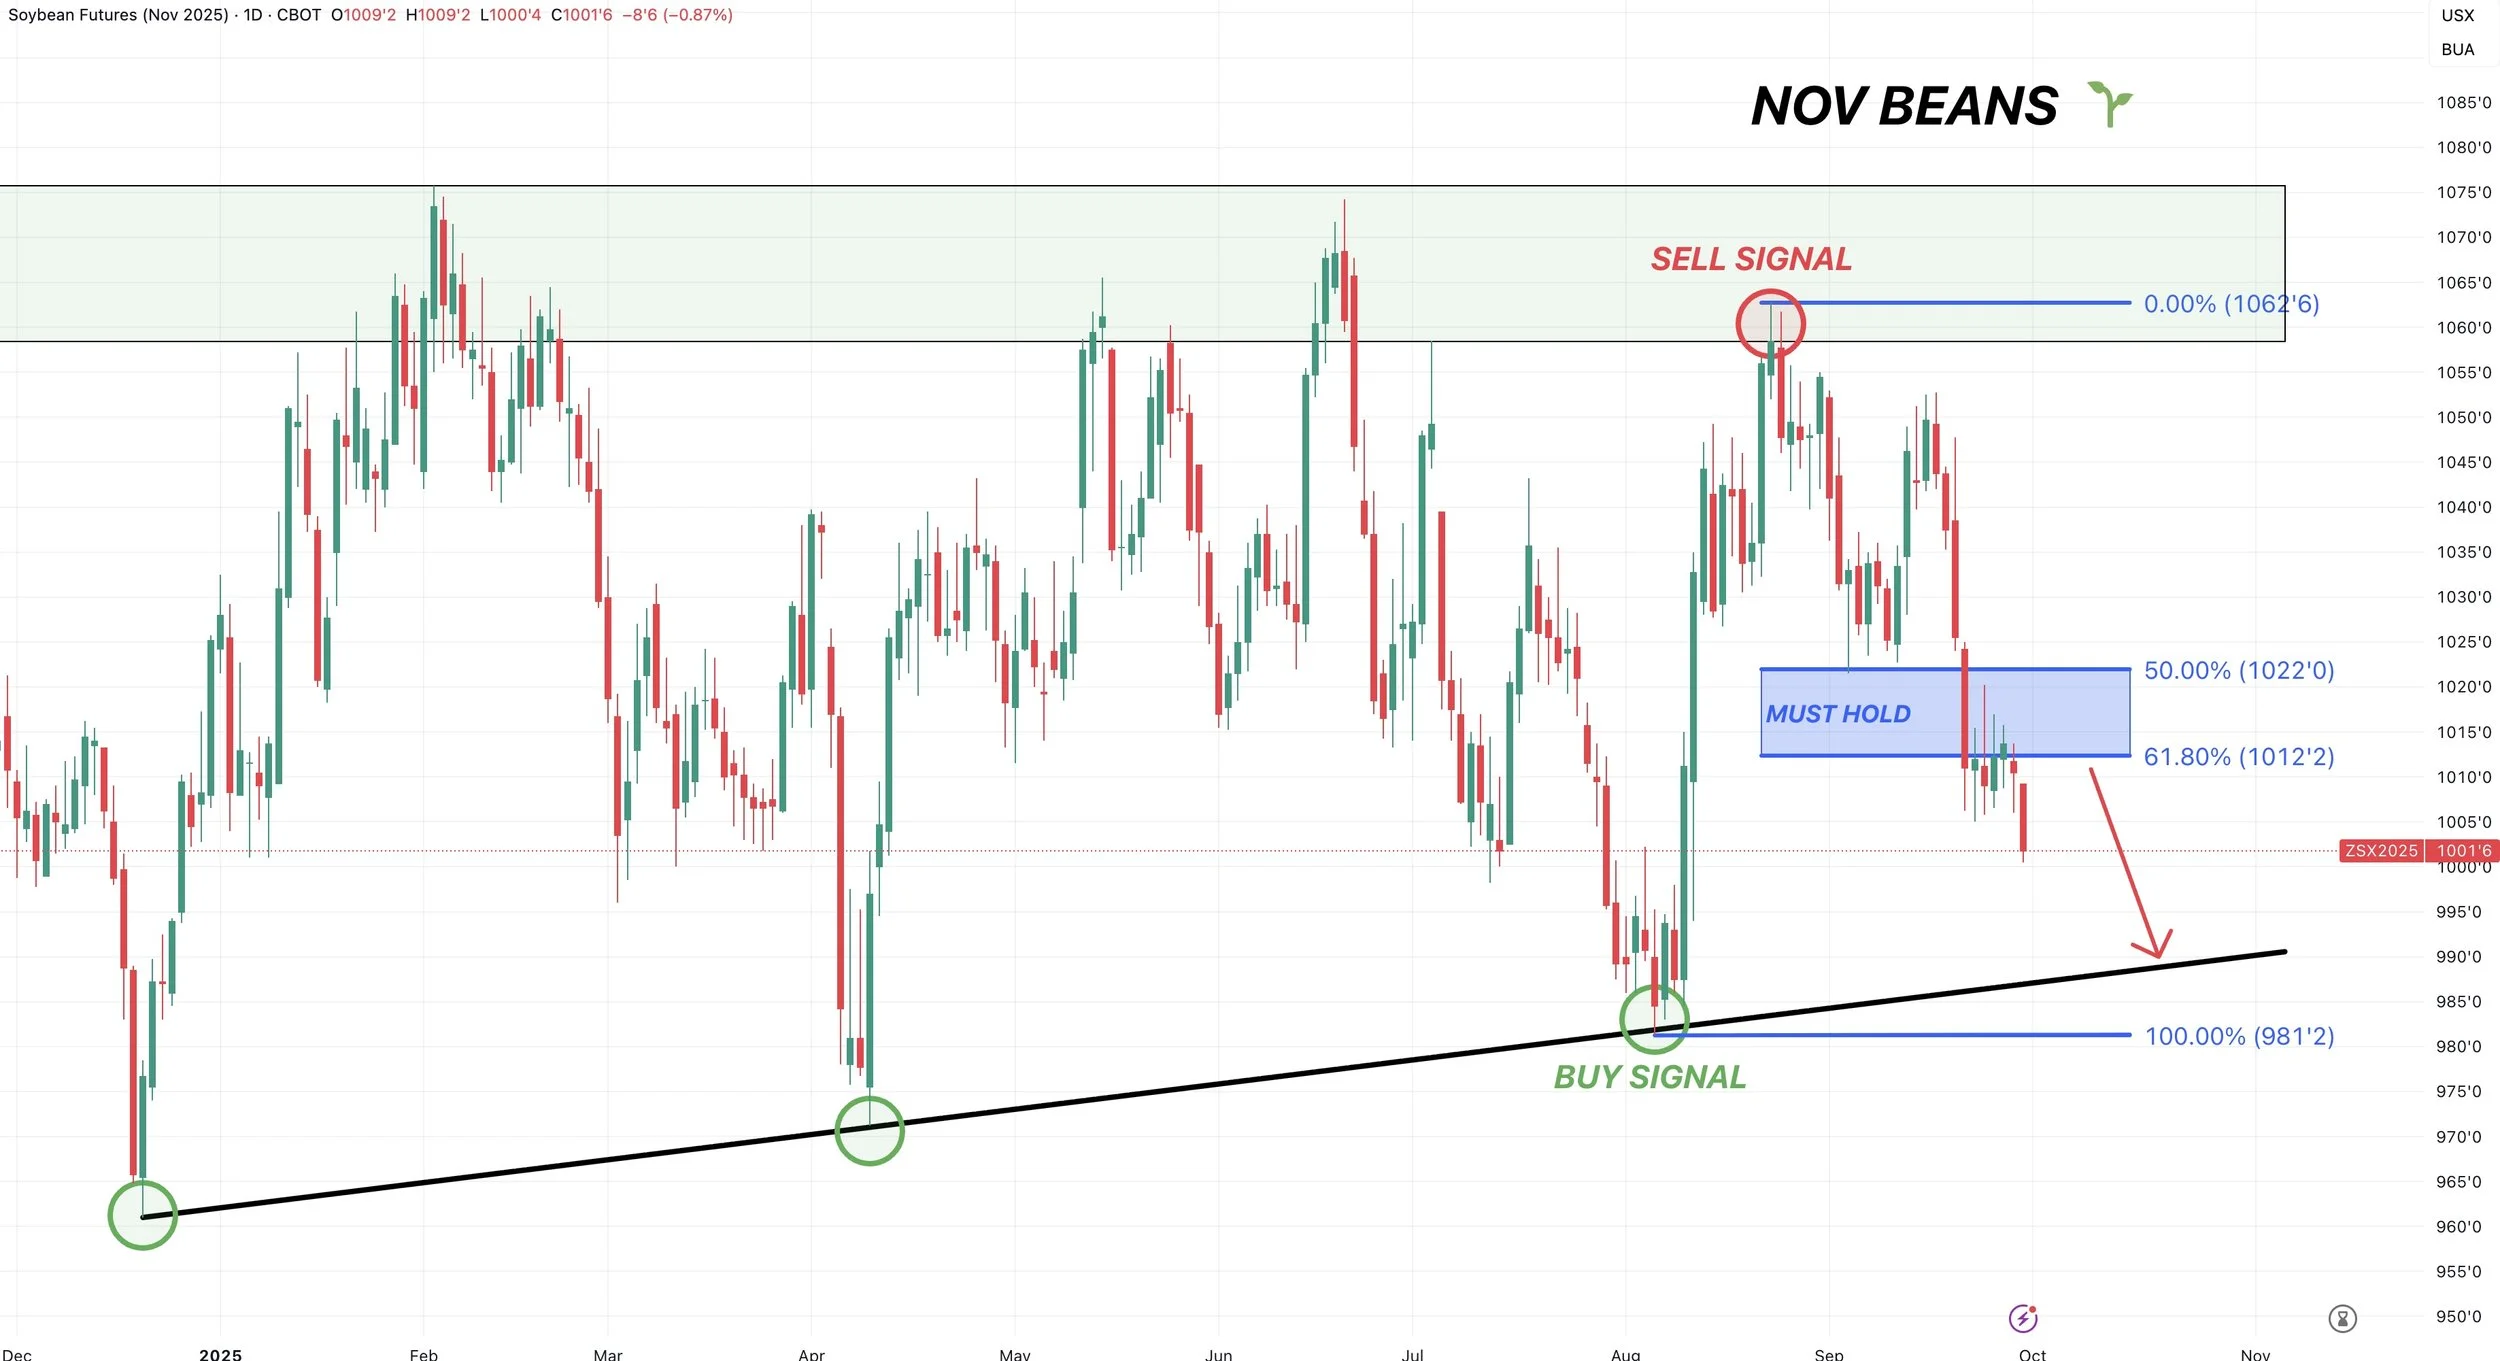
Nov Beans Chart:
We posted new lows for the move today and are now very cleary below that must hold spot. Which was the 61.8% retracement down to the lows.
This tell us that this sell off is probably something bigger.
Where could we post our lows?
I could easily see us falling down to the $9.90 range.
That is about where that trendline comes in that marked the last 3 major bottoms in this market.
That is where I would potentially look at some re-ownership strategies.
What Should You Do With Beans?
There are a few different strategies you can use in soybeans.
We have a massive carry in this market. The market is telling you to simply store soybeans and caputure that carry.
Another possible strategy would to simply sell soybeans off the combine and re-own with a call option, as this is cheaper than storage & interest costs.
Implied volatility for soybeans are at some historically low levels. This means options are cheap because the market isn’t expecting big moves.
However, with the 2nd option you could give up a lot of basis potential.
Give us a call or text if you have questions or want specific advice tailored to you: (605)295-3100
Wheat
The report was bearish for wheat just like corn.
Winter wheat surprised high. Winter wheat production is now up almost +4% vs last year.
We saw spring wheat also surprise high, but spring wheat production is still down over -8% compared to last year.
The interesting thing about this report is that the production increase came almost entirely from more acres. As the USDA left yield unchanged.
They added +450k of harvested acres to Texas with overall winter wheat acres jumping by +773k. Which was an unpredictable surprise.
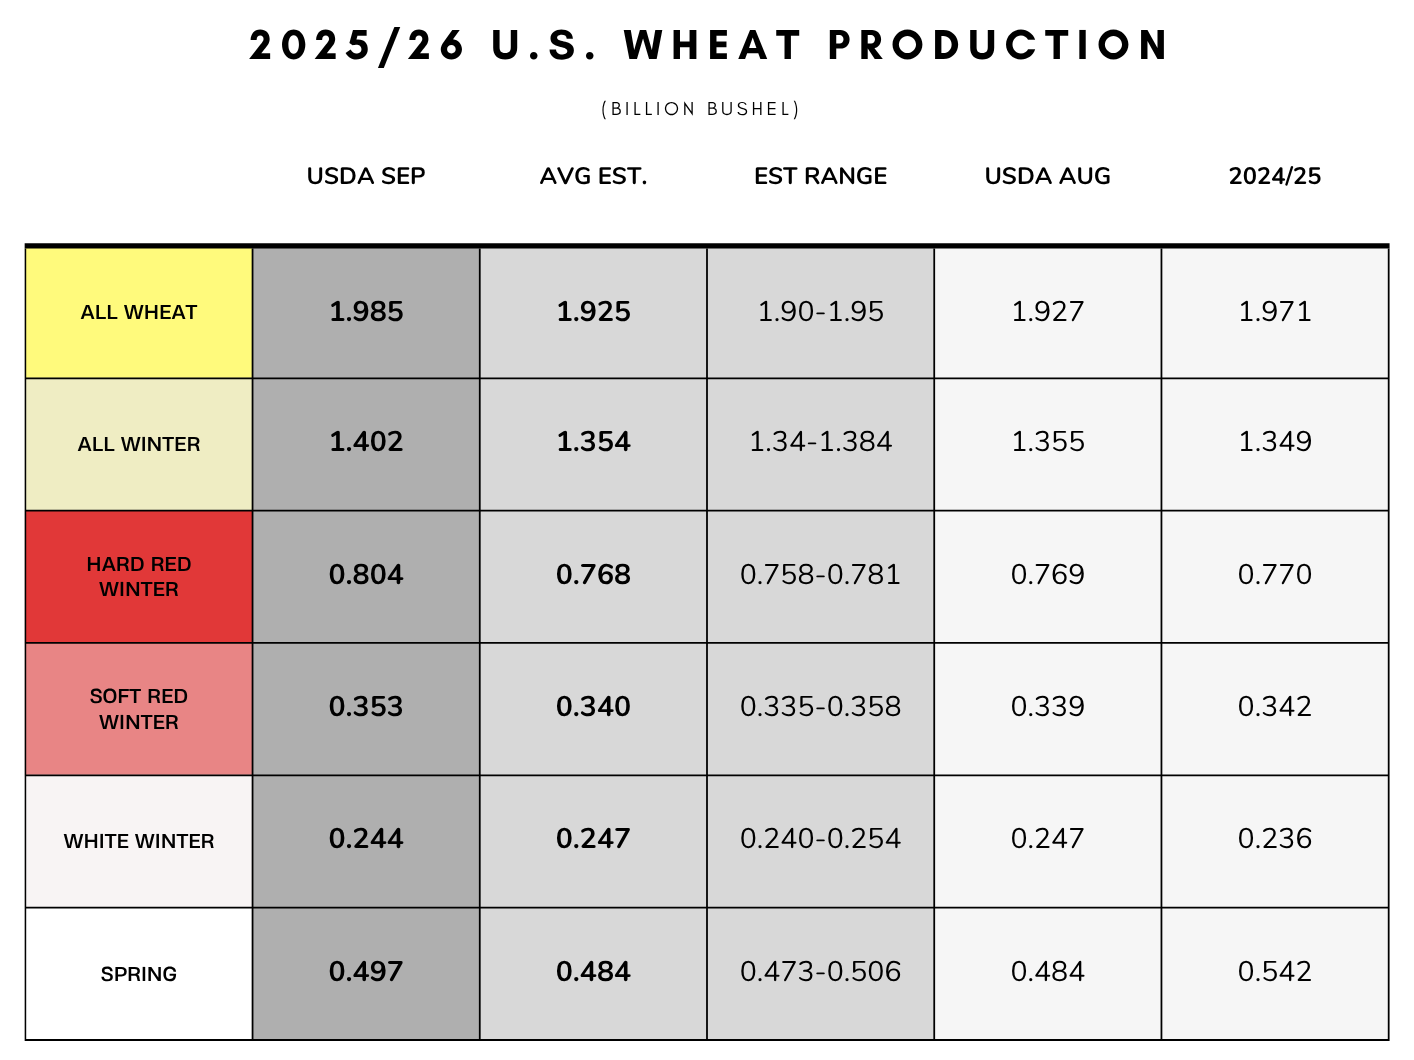
This report was bearish no doubt.
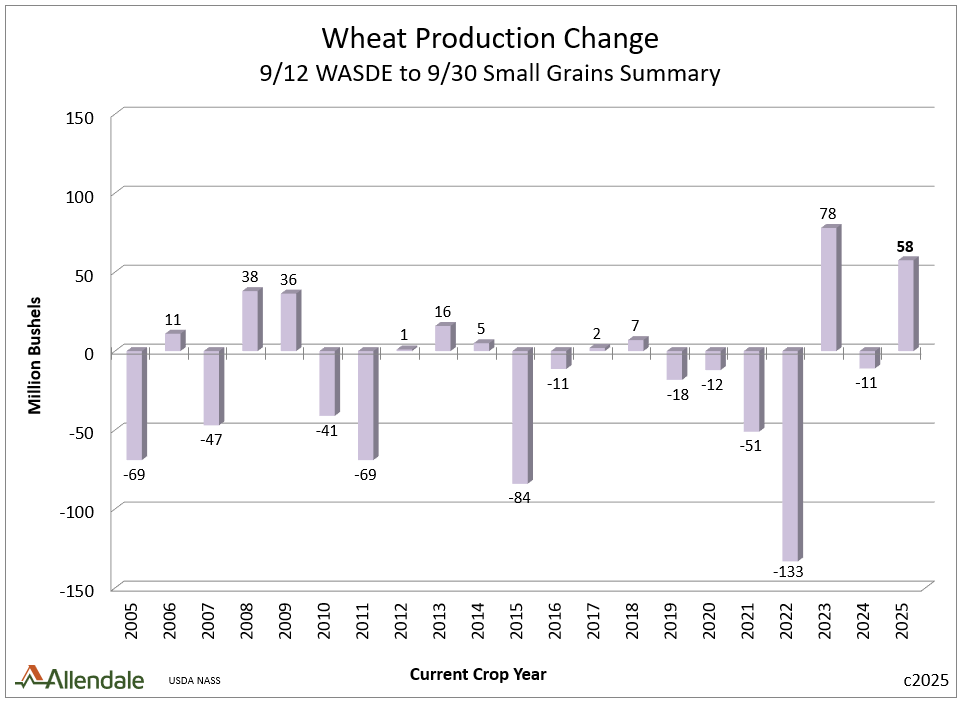
This was the 2nd largest increase to production we have seen in this report in over 20 years.
However, I still have a hard time getting overly bearish at $5.00 wheat.
Despite selling off today, the charts didn’t create any damange and are still in tact.
Seasonally this is still the time of year where we usually find some life.
I am still being patient waiting for an opportunity.
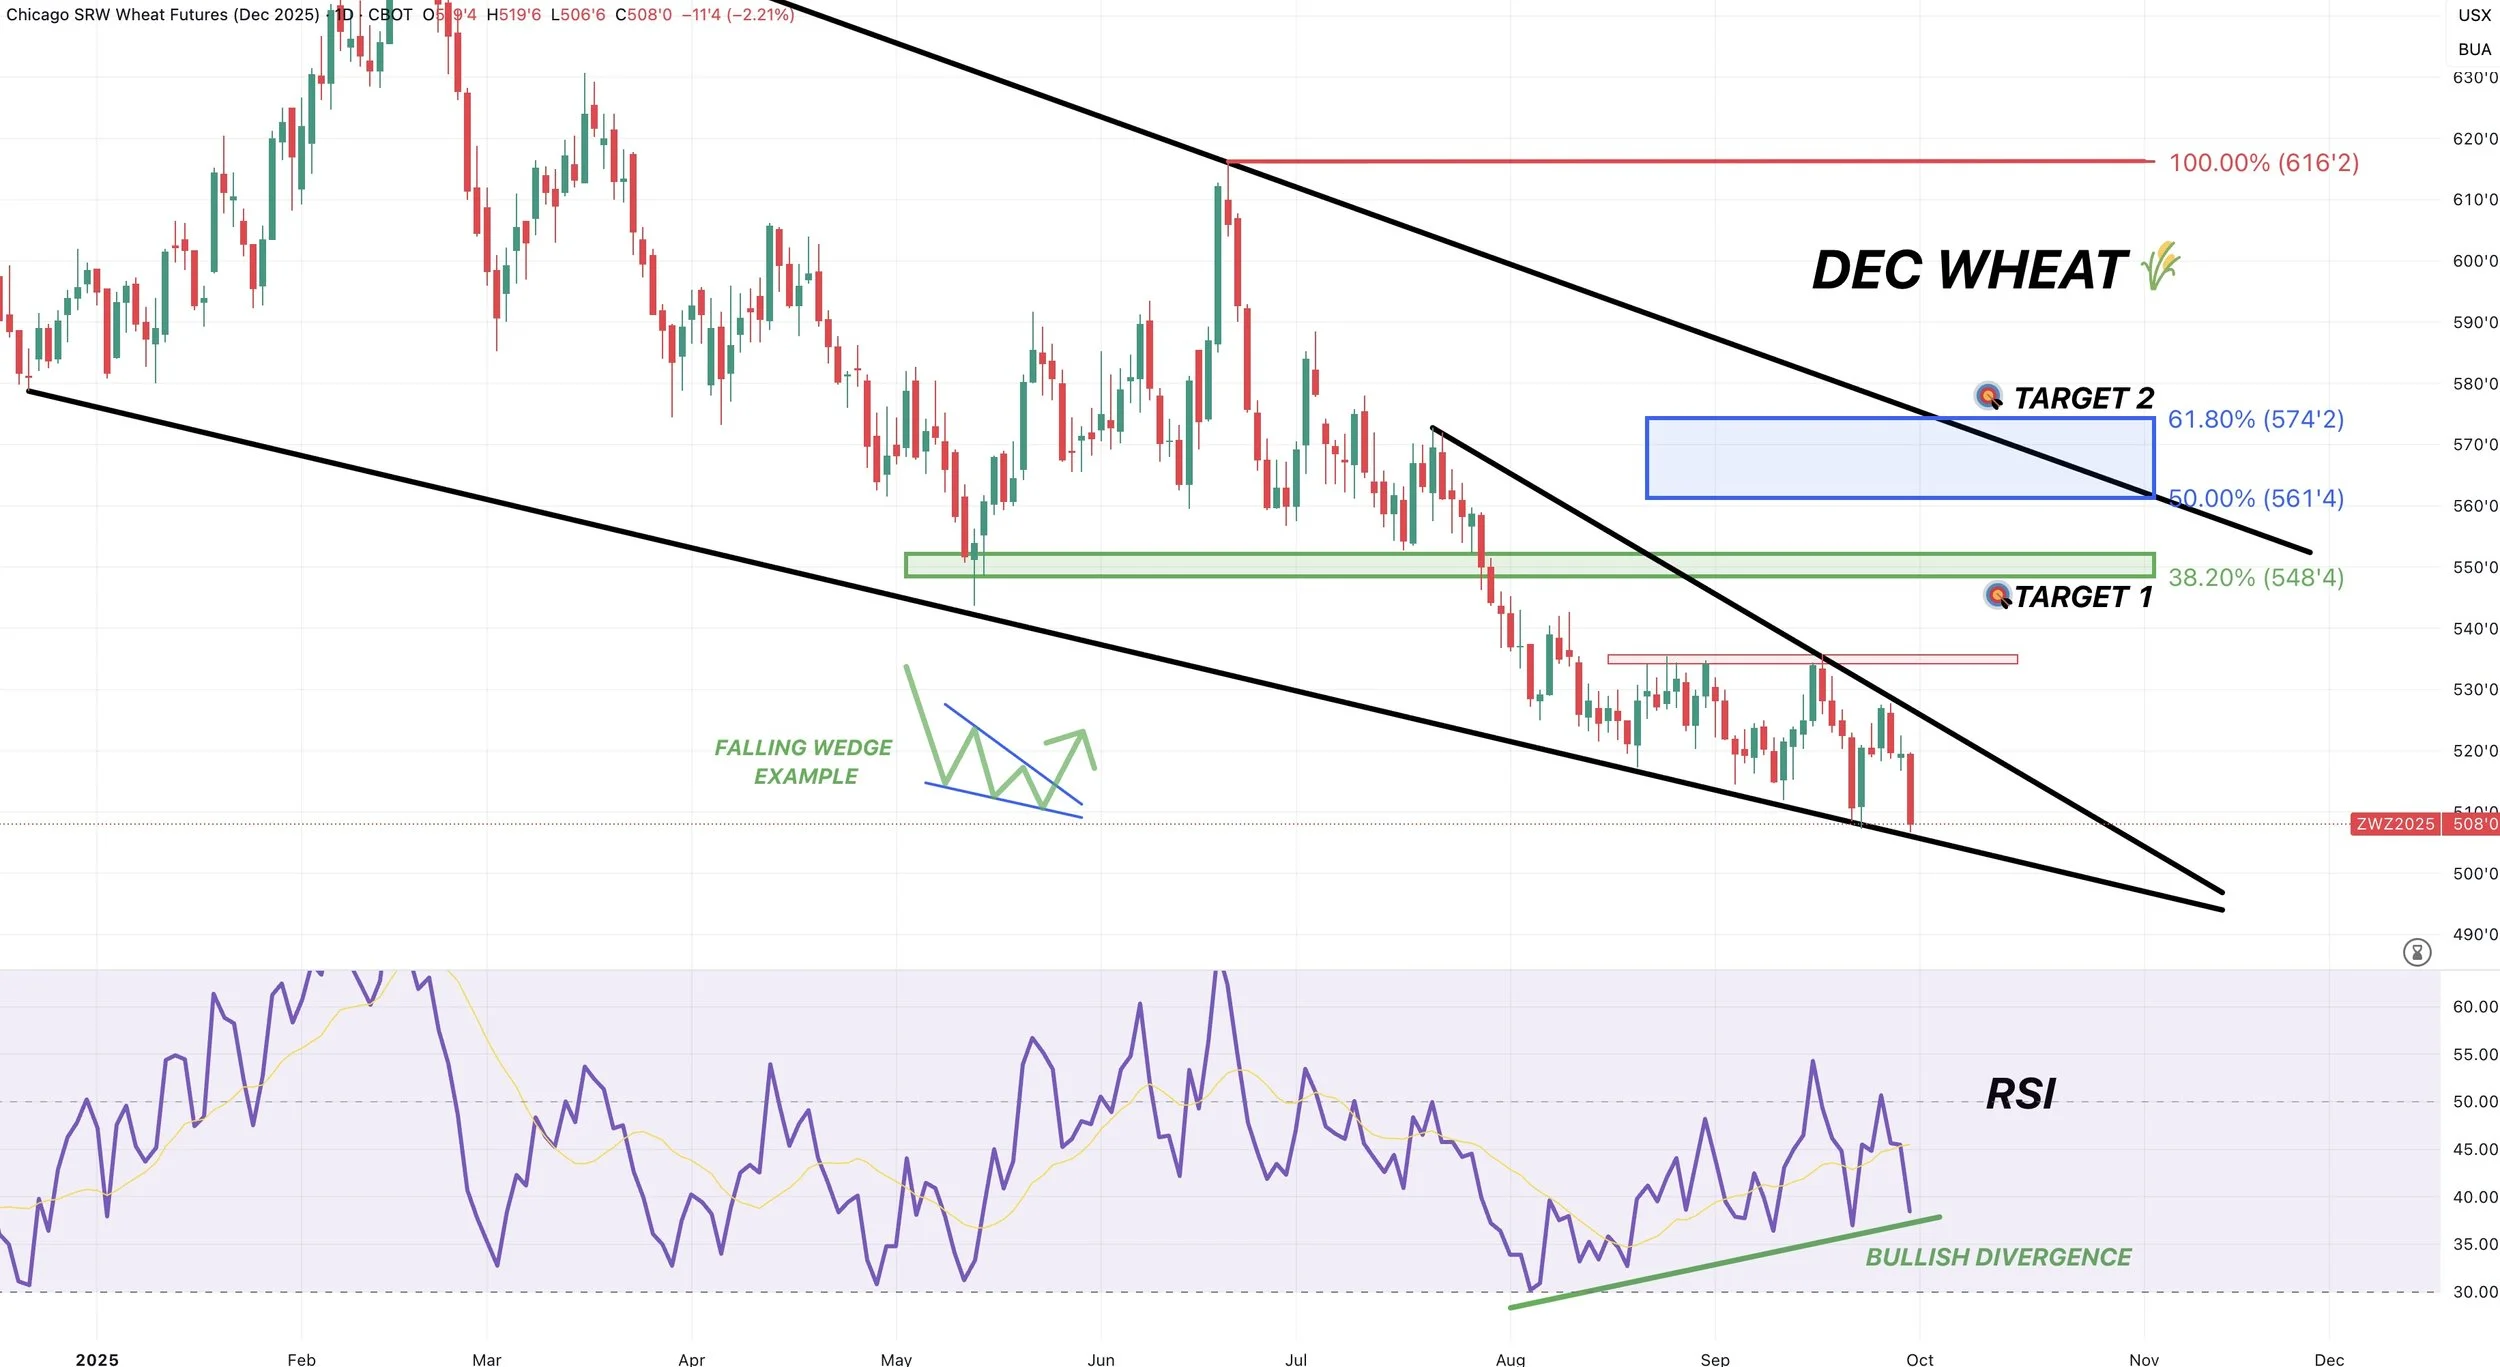
Dec Chicago Chart:
We are right back down to the bottom of this channel once again.
This is where we have continued to bounce for months, so I would like to think we continue to defend it.
This falling wedge pattern is starting to get pretty tight.
Bulls want to see us bust of out this wedge higher to get some momentum.

Despite posting contract lows once again.. the RSI once again did not post a new low.
We continue to show bullish divergence on the RSI and have been showing this for weeks now.
Dec KC Wheat Chart:
KC wheat also sitting in this falling wedge pattern.
Waiting for a direction and decision to be made.
Bulls watching for a breakout.

Cattle
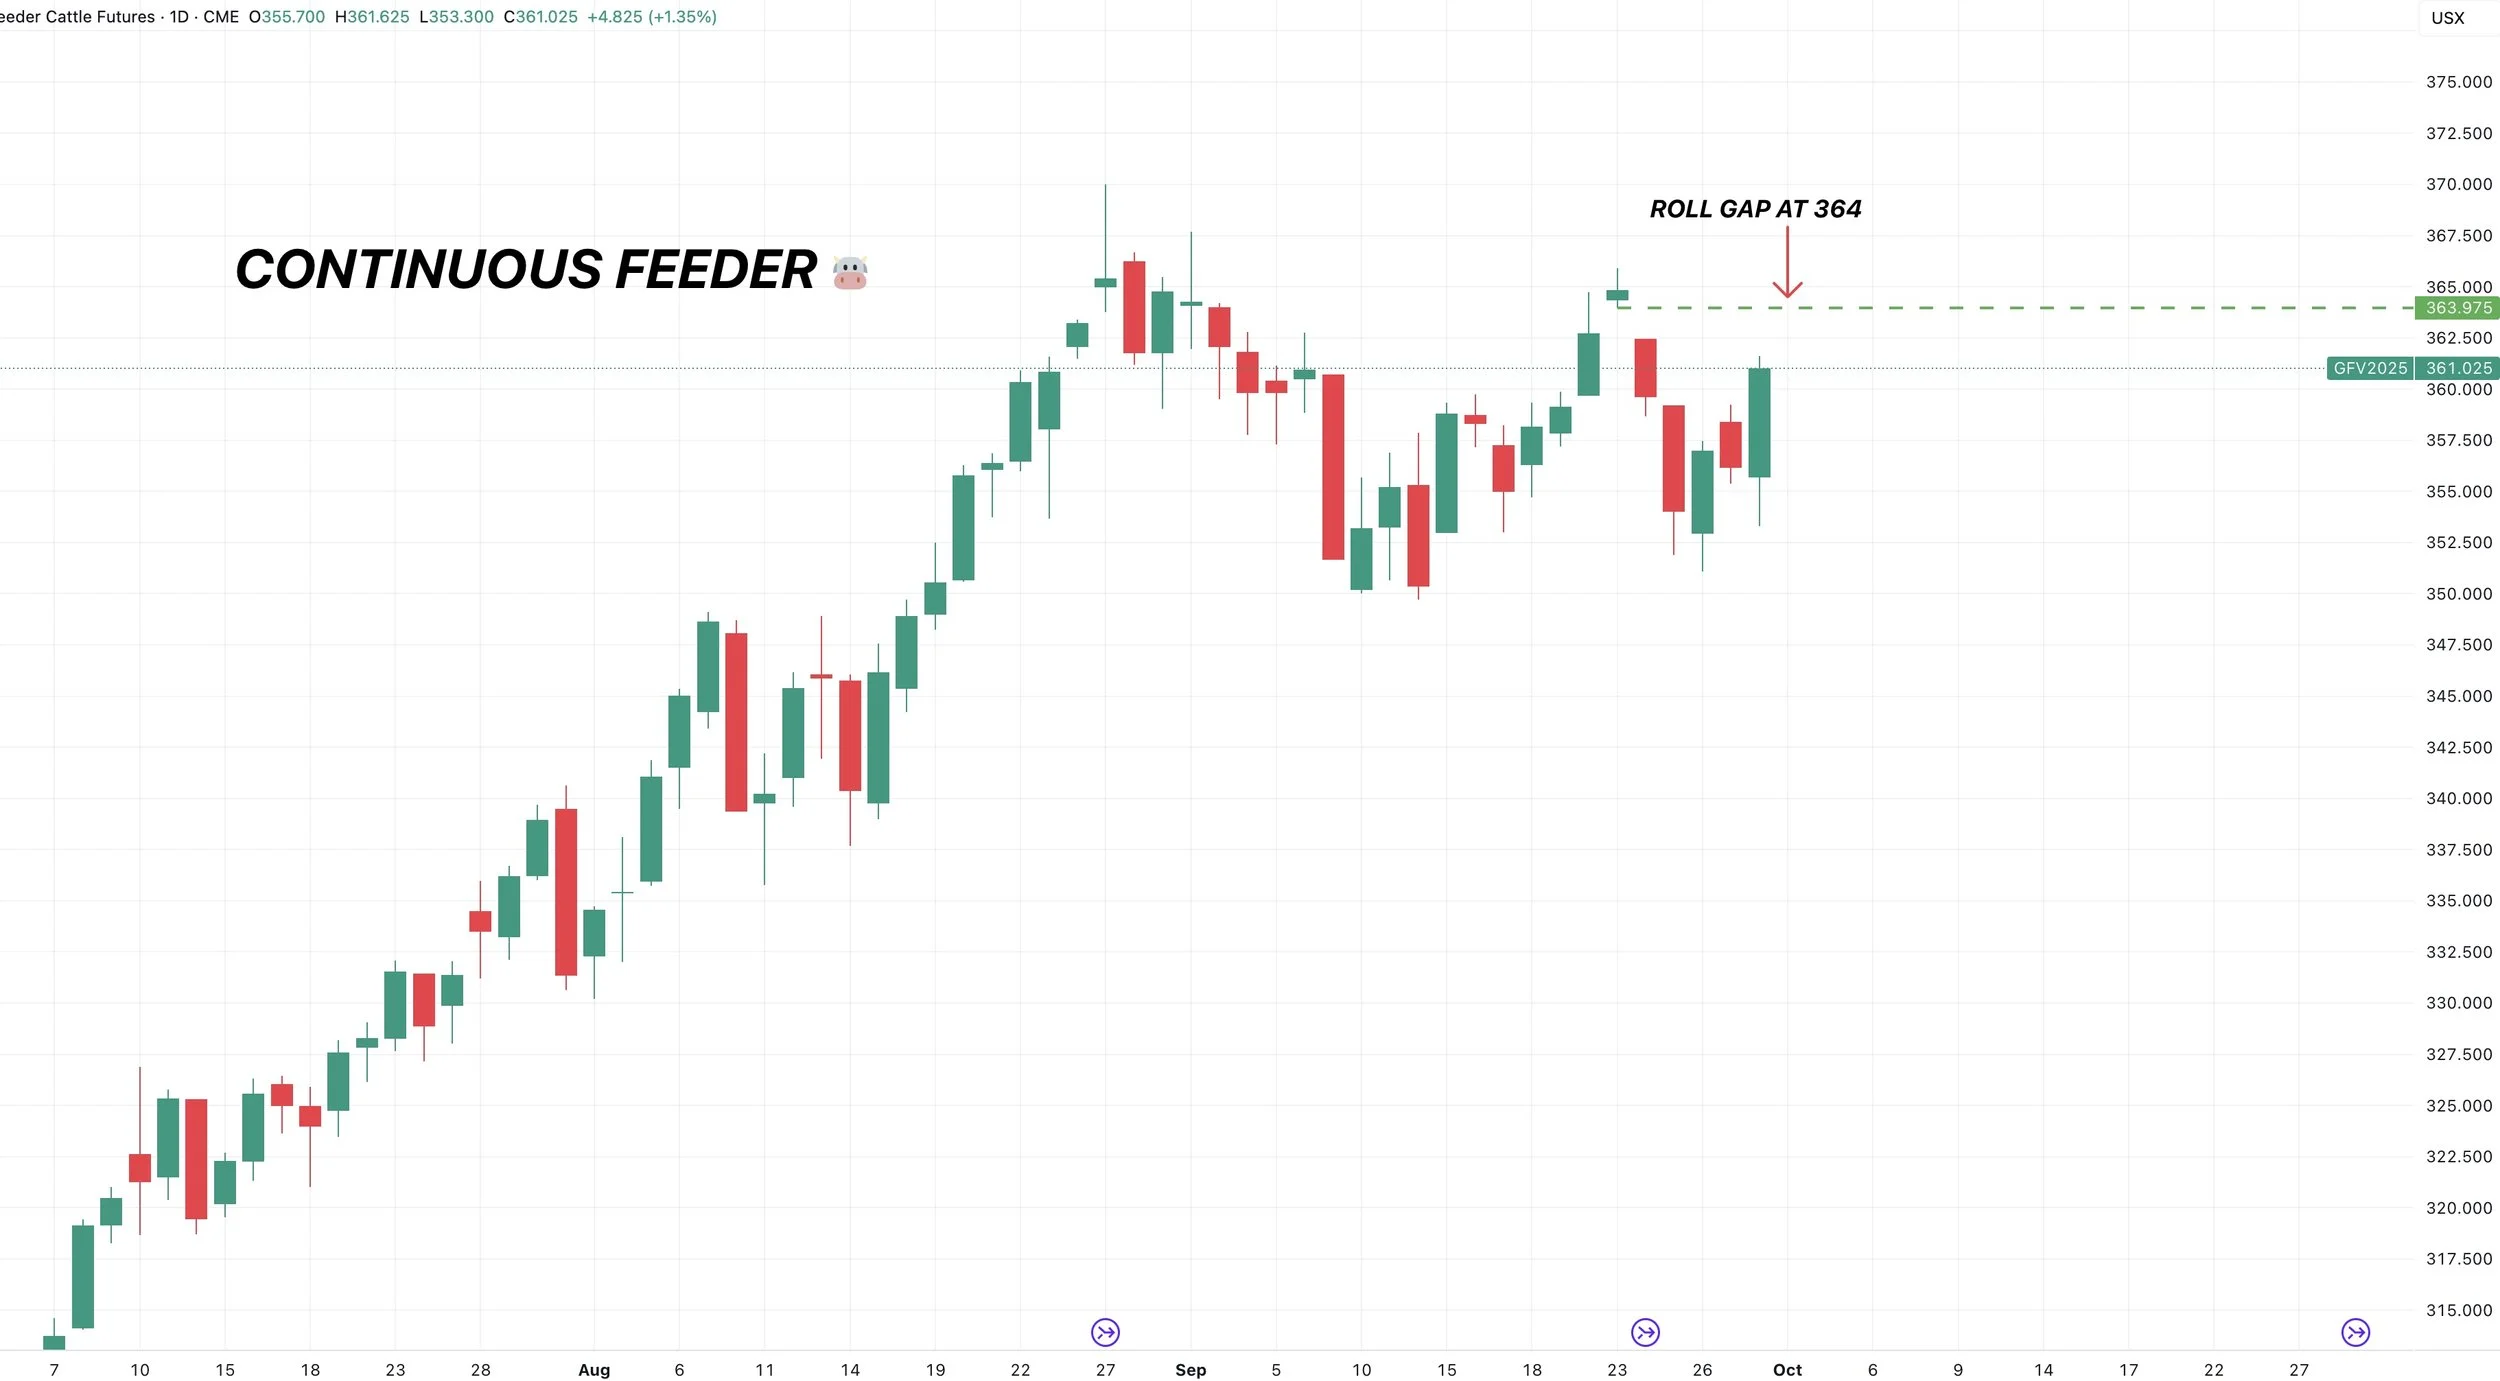
Continous Feeder Chart:
When front month feeders rolled from Sep to Oct, we left a roll gap at 364.
Oct Feeder Chart:
If we look at Oct feeder, that 364 level would also challenge those recent highs.
If we break above that level it is probably a sign we're going to go post new contract highs.
To the downside, need to hold the red box or we could very easily drop down to the blue one.

Feeder Monthly Chart:
This was our first month where we traded lower for the month since all the way back in October of last year.
Nearly an entire year without a single red month.
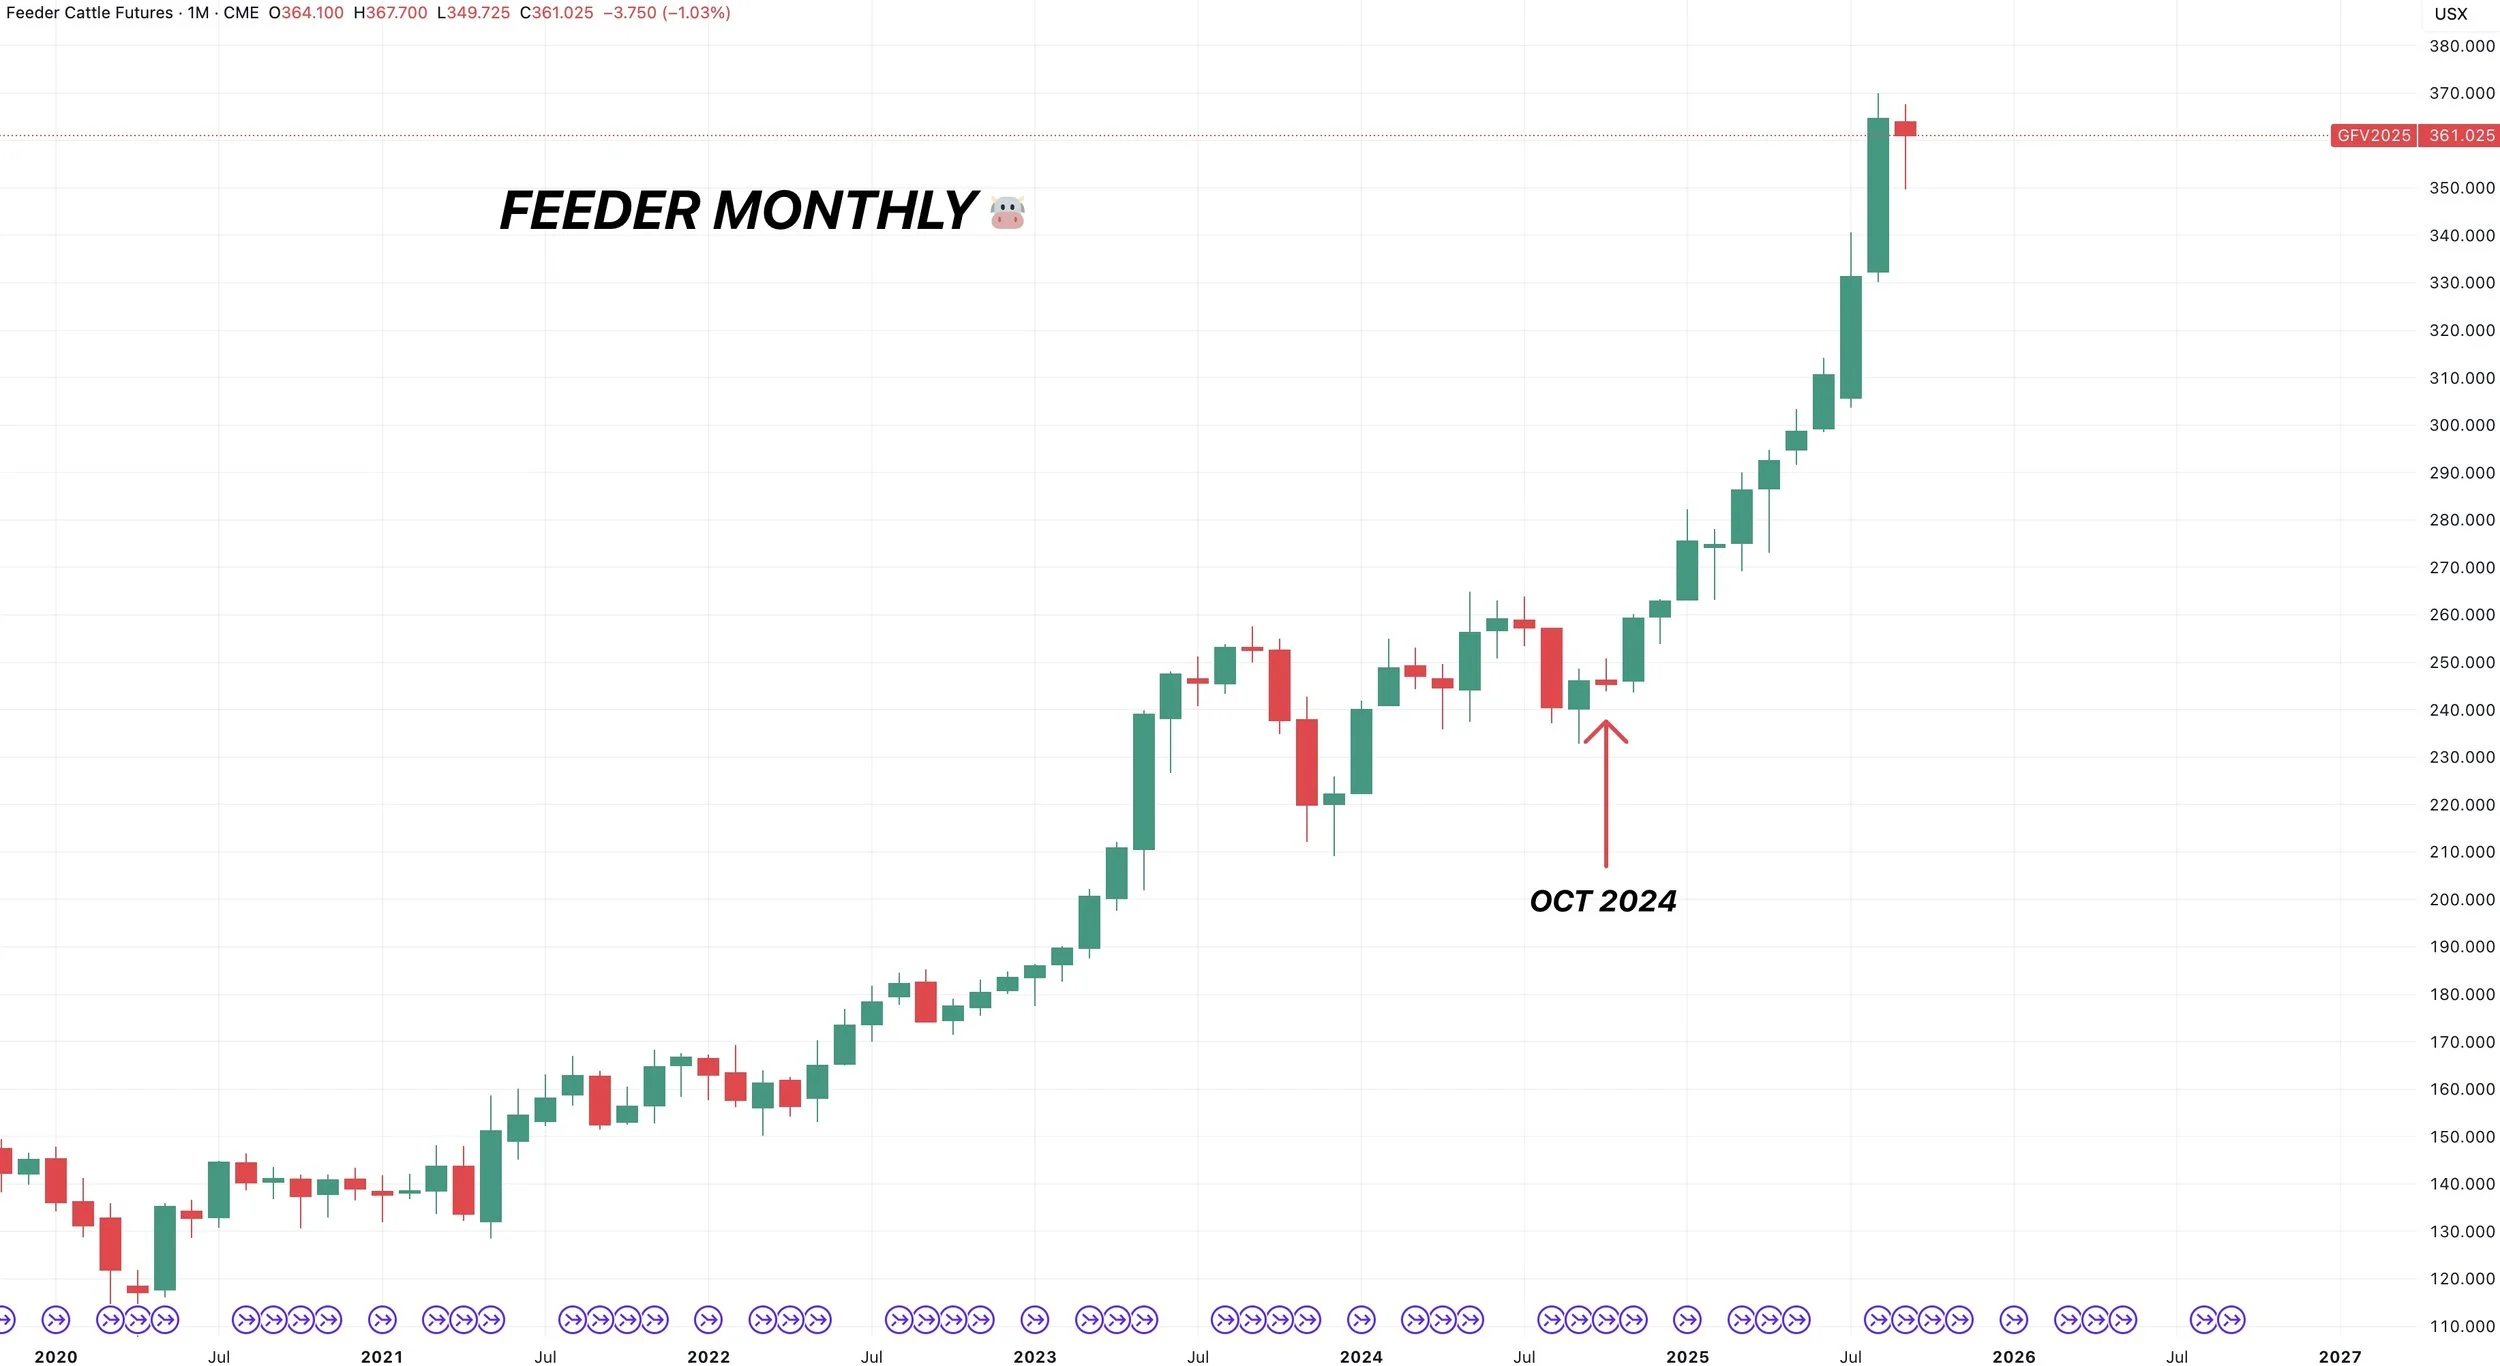
We could easily go and post new highs in this market.
But that doesn’t mean I am not going to be managing my risk up here.
I am still very cautious up here.
If we look at open interest, it has been droppping by a large amount.
Open interest is the total number of long or short positions in the market. Basically, market participants have been leaving.
If you pair this with cattle posting it's first month lower in a year, it definitely makes me all that more cautious up here.

The funds have also been jumping out of those record-long positions.
They are now holding their smallest long position since last year.

Past Sell or Protection Signals
Aug 22nd: 🌱
Soybean sell signal & hedge alert.
July 31st: 🐮
Cattle sell signal & hedge alert.
July 10th: 🐮
Cattle sell signal & hedge alert.
CLICK HERE TO VIEW
June 5th: 🐮
Cattle sell signal & hedge alert.
June 2nd: 🌾
MPLS wheat sell signal.
April 10th: 🌽
Old crop corn sell signal.
March 19th: 🐮
Cattle hedge & sell signal.
Feb 18th: 🌽 🌾
Old crop KC wheat & old crop corn signal.
Jan 23rd: 🌽 🌱
Corn & beans old crop sell signal.
CLICK HERE TO VIEW
Jan 15th: 🌽 🌱
Corn & beans hedge alert/sell signal.
Jan 2nd: 🐮
Cattle hedge alert at new all-time highs & target.
Dec 11th: 🌽
Corn sell signal at $4.51 200-day MA
CLICK HERE TO VIEW
Oct 2nd: 🌾
Wheat sell signal at $6.12 target
Sep 30th: 🌽
Corn protection signal at $4.23-26
Sep 27th: 🌱
Soybean sell & protection signal at $10.65
Sep 13th: 🌾
Wheat sell signal at $5.98
May 22nd: 🌾
Wheat sell signal when wheat traded +$7.00
Want to Talk?
Our phones are open 24/7 for you guys if you ever need anything or want to discuss your operation.
Hedge Account
Interested in a hedge account? Use the link below to set up an account or shoot Jeremey a call at (605)295-3100.