
CHART BREAKDOWNS & TARGETS
MARKET UPDATE
You can scroll to read the usual update as well. As the written version is the exact same as the video.
Timestamps for video:
Corn: 0:00min
Soybeans: 4:10min
Wheat: 8:45min
Cattle: 11:00min
Want to talk about your situation?
(605)295-3100
Futures Prices Close

Overview
Today we are simply going to be diving into the charts.
Our next targets & things to watch out for.
When we put out targets, it is not me saying prices will go there. Targets are simply there for you to know it is time to pull the trigger if we get there.
Charts In Order:
Corn (July & Dec)
Soybeans (July & Nov)
Wheat (KC & Chicago)
Cattle (Live & Feeder)
Corn
July Corn
We climbed back over $4.60. That is the level I wanted to see us clear to say we've put in a bottom for now.
However, we are now up against some solid resistance.
This box was our highs from last fall. It is also where we found support on the March sell off.
Old support is now resistance.
So this is a big spot for corn. If we can clear this, then my next target is going to be $4.79-89
That is a little bigger target than I am going to show you next in Dec corn. This is because we have alerted several sell signals in old crop corn well above where are today. Most of you are likely mostly sold or just sitting on gambling bushels.

July Corn: Inverted
Here is another reason why this current level is an important level.
This is an inverted chart (meaning flipped upside down to give a fresh new perspective).
We had a clear downtrend. On the April sell off, we busted above it. We are now currently back testing it. So a rejection would make sense as it's resistance (support on the inverted chart).
On the flip side, if we bust this trend, then we have plenty of room to run. Again a big level.

Dec Corn: Weekly
Dec corn is currently on pace for one of it's best weeks since June 2023.
We took out the last 3 weeks entire price action in just 3 days this week.
That is some impressive strength.

Dec Corn: Targets
Dec corn just posted it's first higher high since April (past highs circled in black).
We are currently hovering right inbetween the golden zone (50-61.8% retracements) up to the April highs from the recent lows.
We rejected right off the 61.8% level.
If we can break this level, our first target is going to be $4.60 to $4.62. That is where I will be looking to take off some risk.
Then if we can climb up to our 2nd and 3rd targets of $4.72 to $4.84 I will be looking to de-risk a lot heavier.
$4.72 is 2nd target as it reclaims 61.8% of the May 2024 highs.
$4.84 is the 3rd target as it reclaims 78.6% of the May 2024 highs.

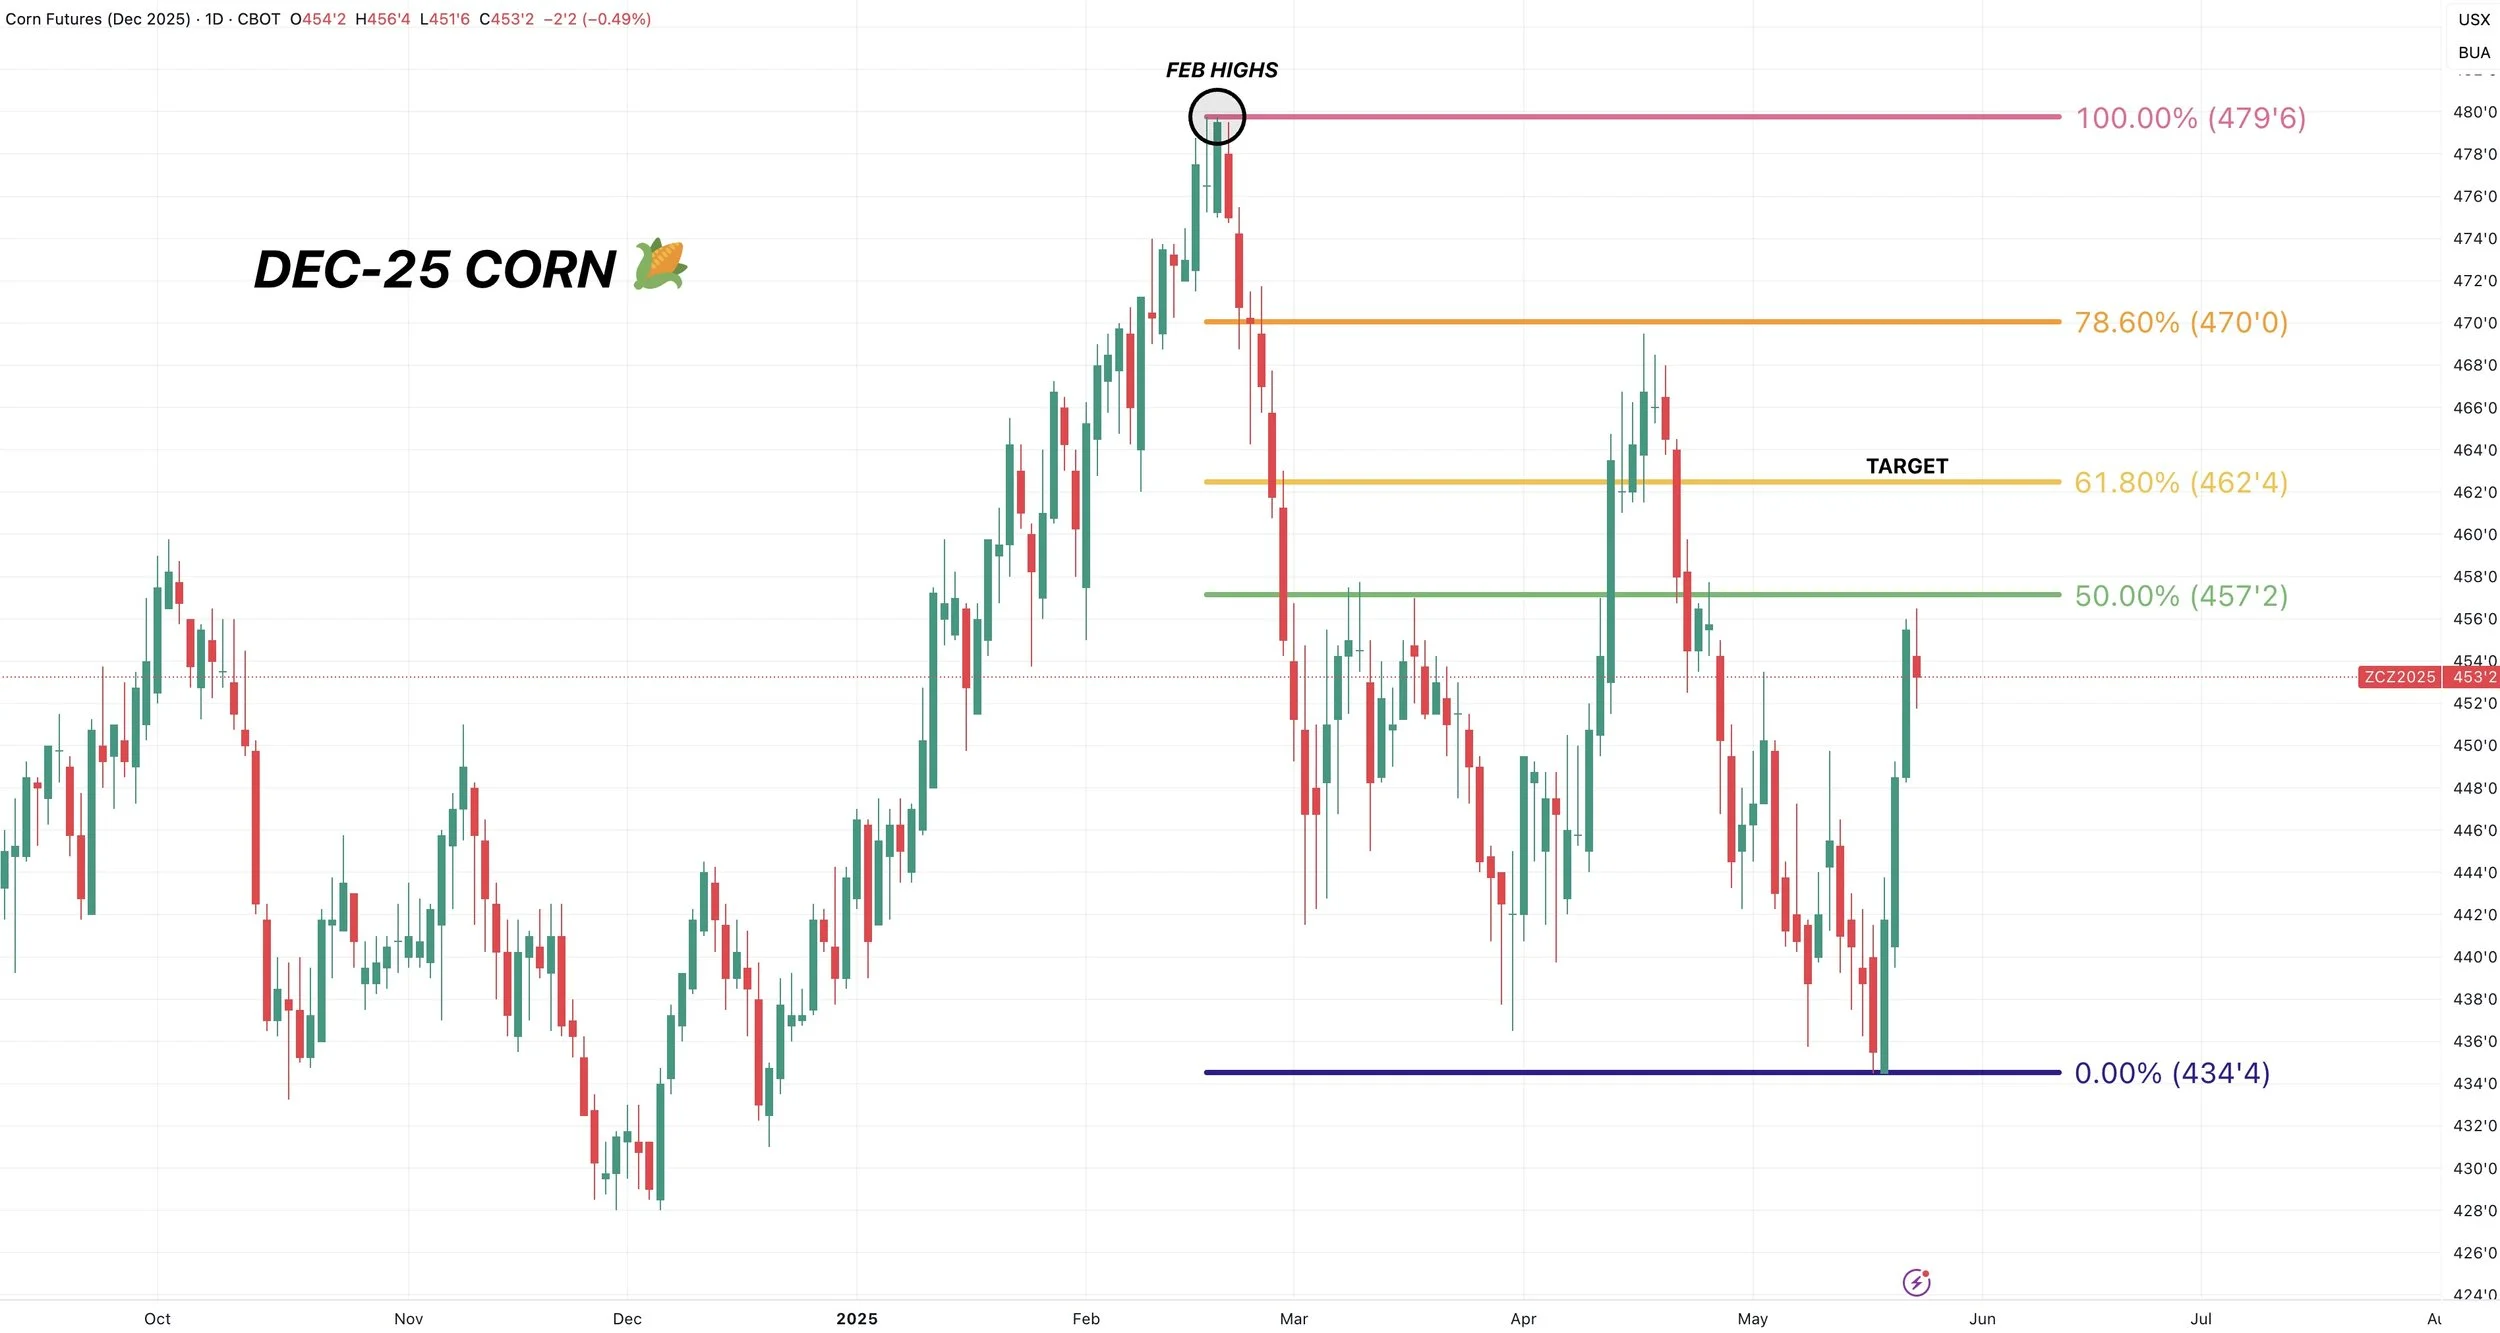
Dec Corn: Why $4.60
$4.60 is our old highs from last fall.
It is also 61.8% of the Feb highs from the contract lows.
We posted our first higher highs since April and are above the 50% level, next level is 61.8% at $4.60

Dec Corn: Why $4.62
Here is the retracments from the April highs to the recent lows.
Again, you can see we are currently trapped between the 50-61.8% levels.
A break above this level, and $4.62 is the next level.
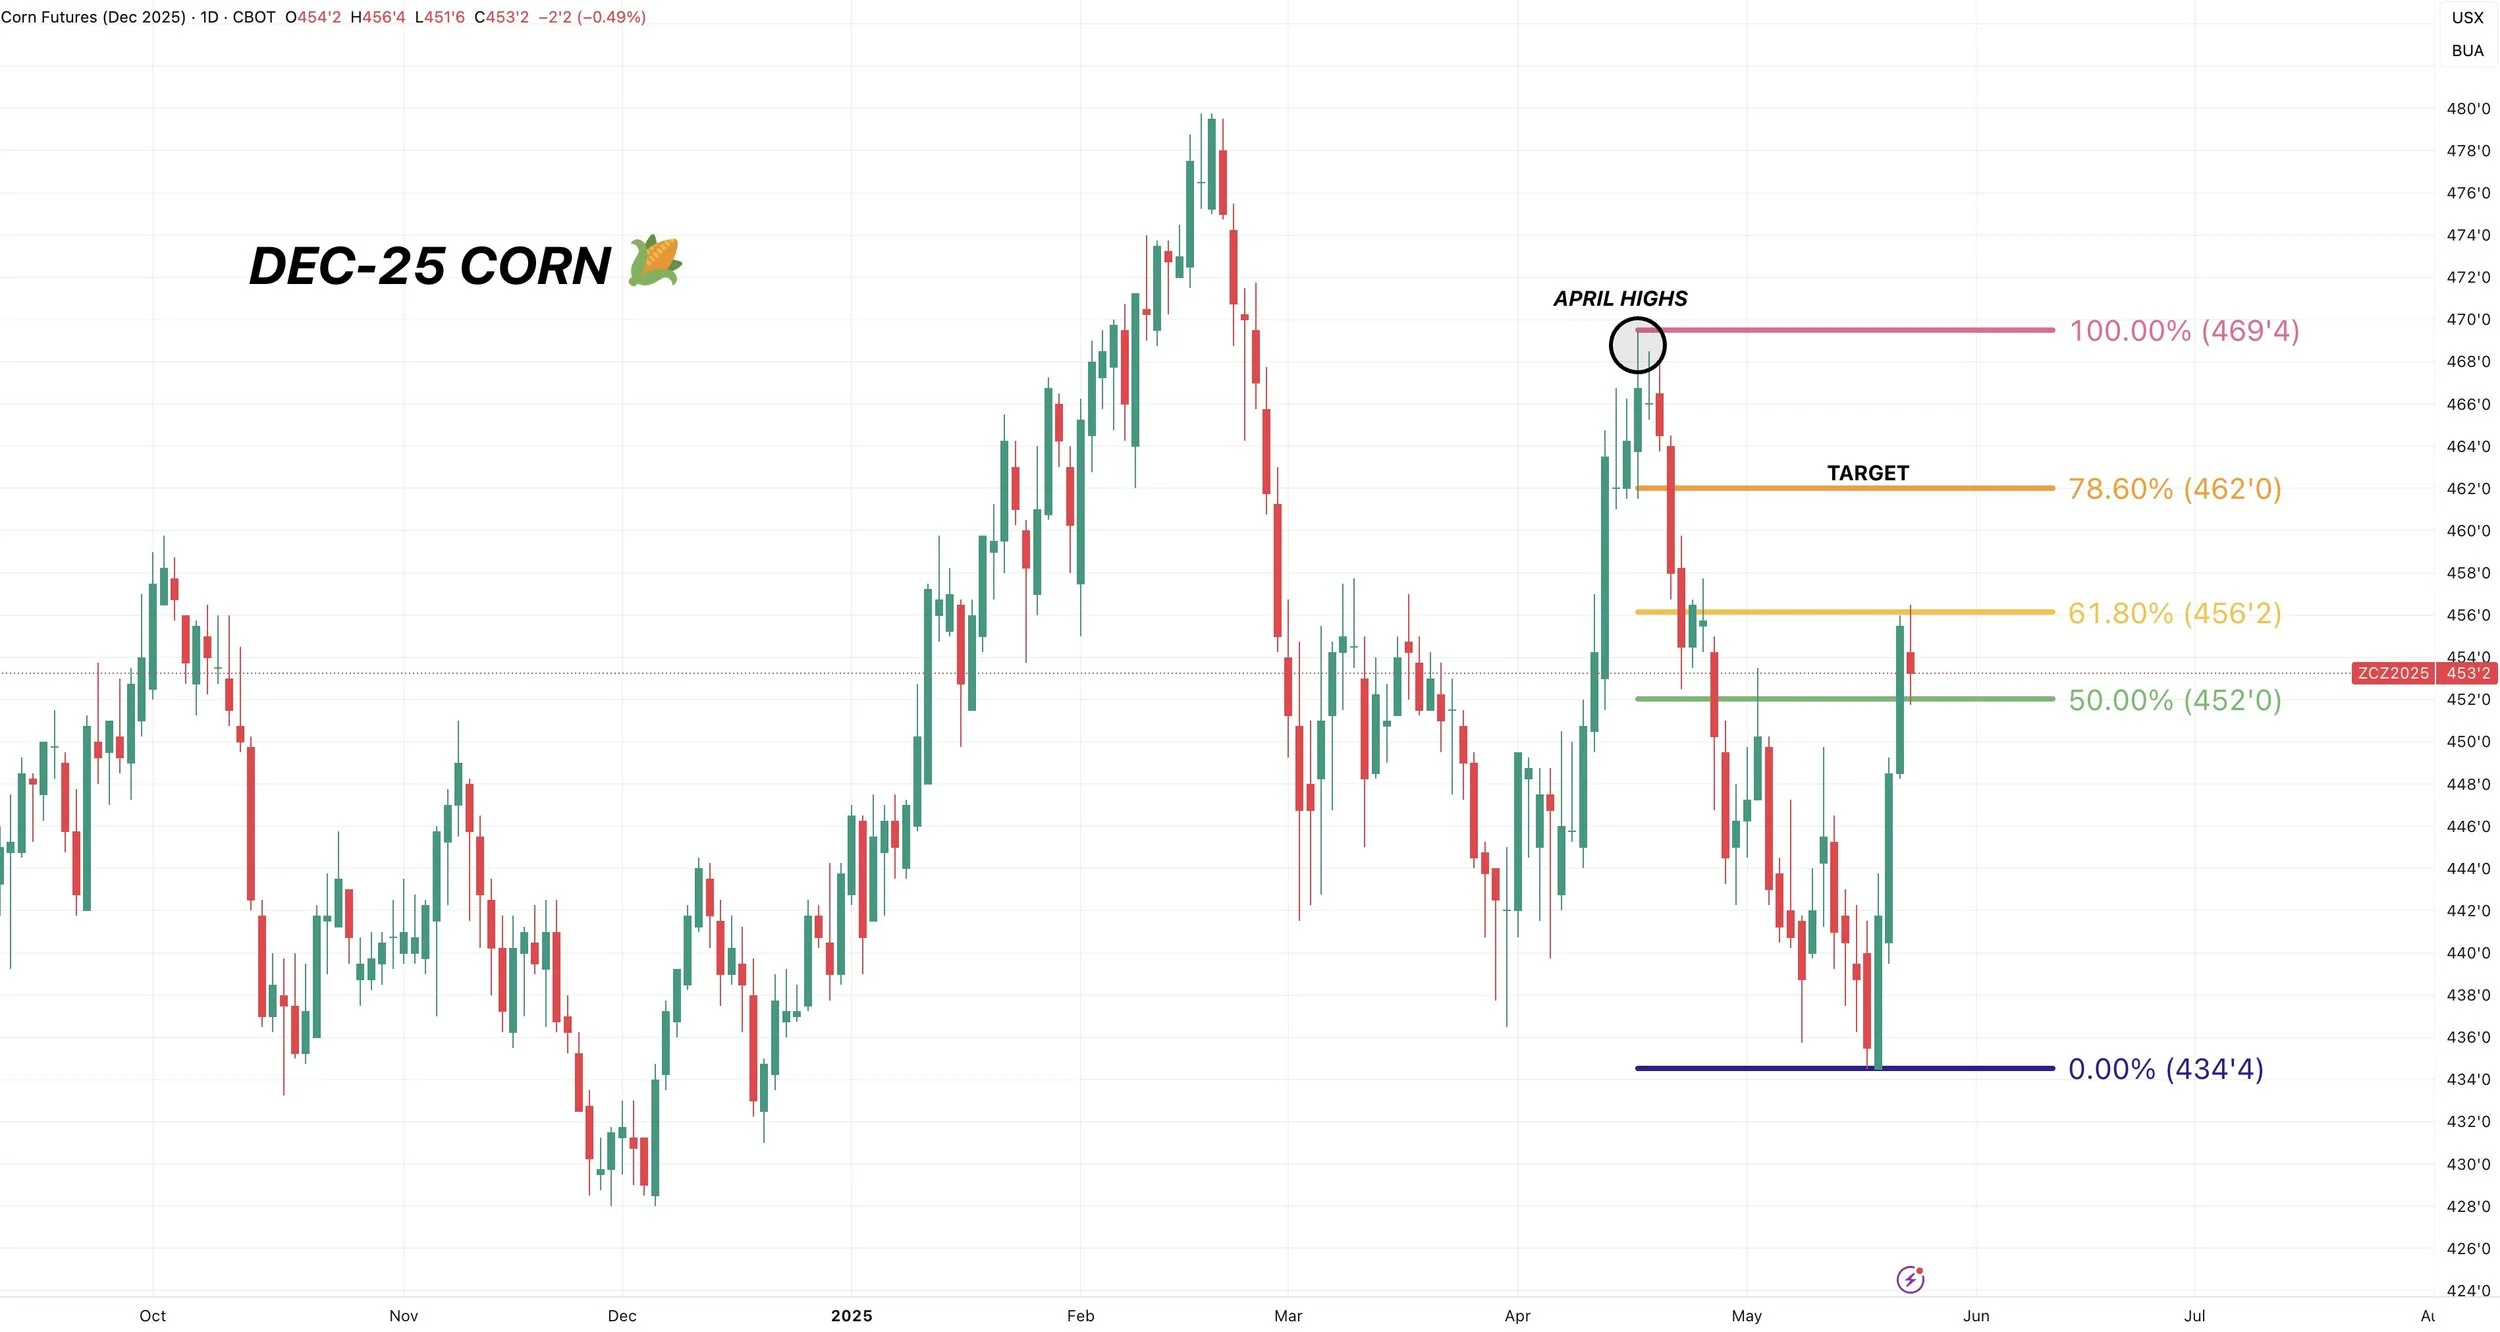
If you move these retracements to the Feb highs instead of the April highs, $4.62 also happens to give us back 61.8%.
So that is few reasons why $4.60 to $4.62 is our next target.
Soybeans
July Beans: Targets
We continue to bounce off the 200-day MA just like we want to see.
Next upside target remains the same as it has for months.
1st target: $11.04
That gives us back 50% of the May 2024 highs from the contract lows.
2nd target: $11.30-40 level
$11.36 gives back 61.8% of the May 2024 highs. $11.44 is our Feb lows.
We will have more precise details on the 2nd target when and if it comes.
Downside Risk: if we fail to hold the 200-day MA we will likely fall down into the blue box. That is our old key support and would happen to give back 50-61.8% of this entire rally since March.

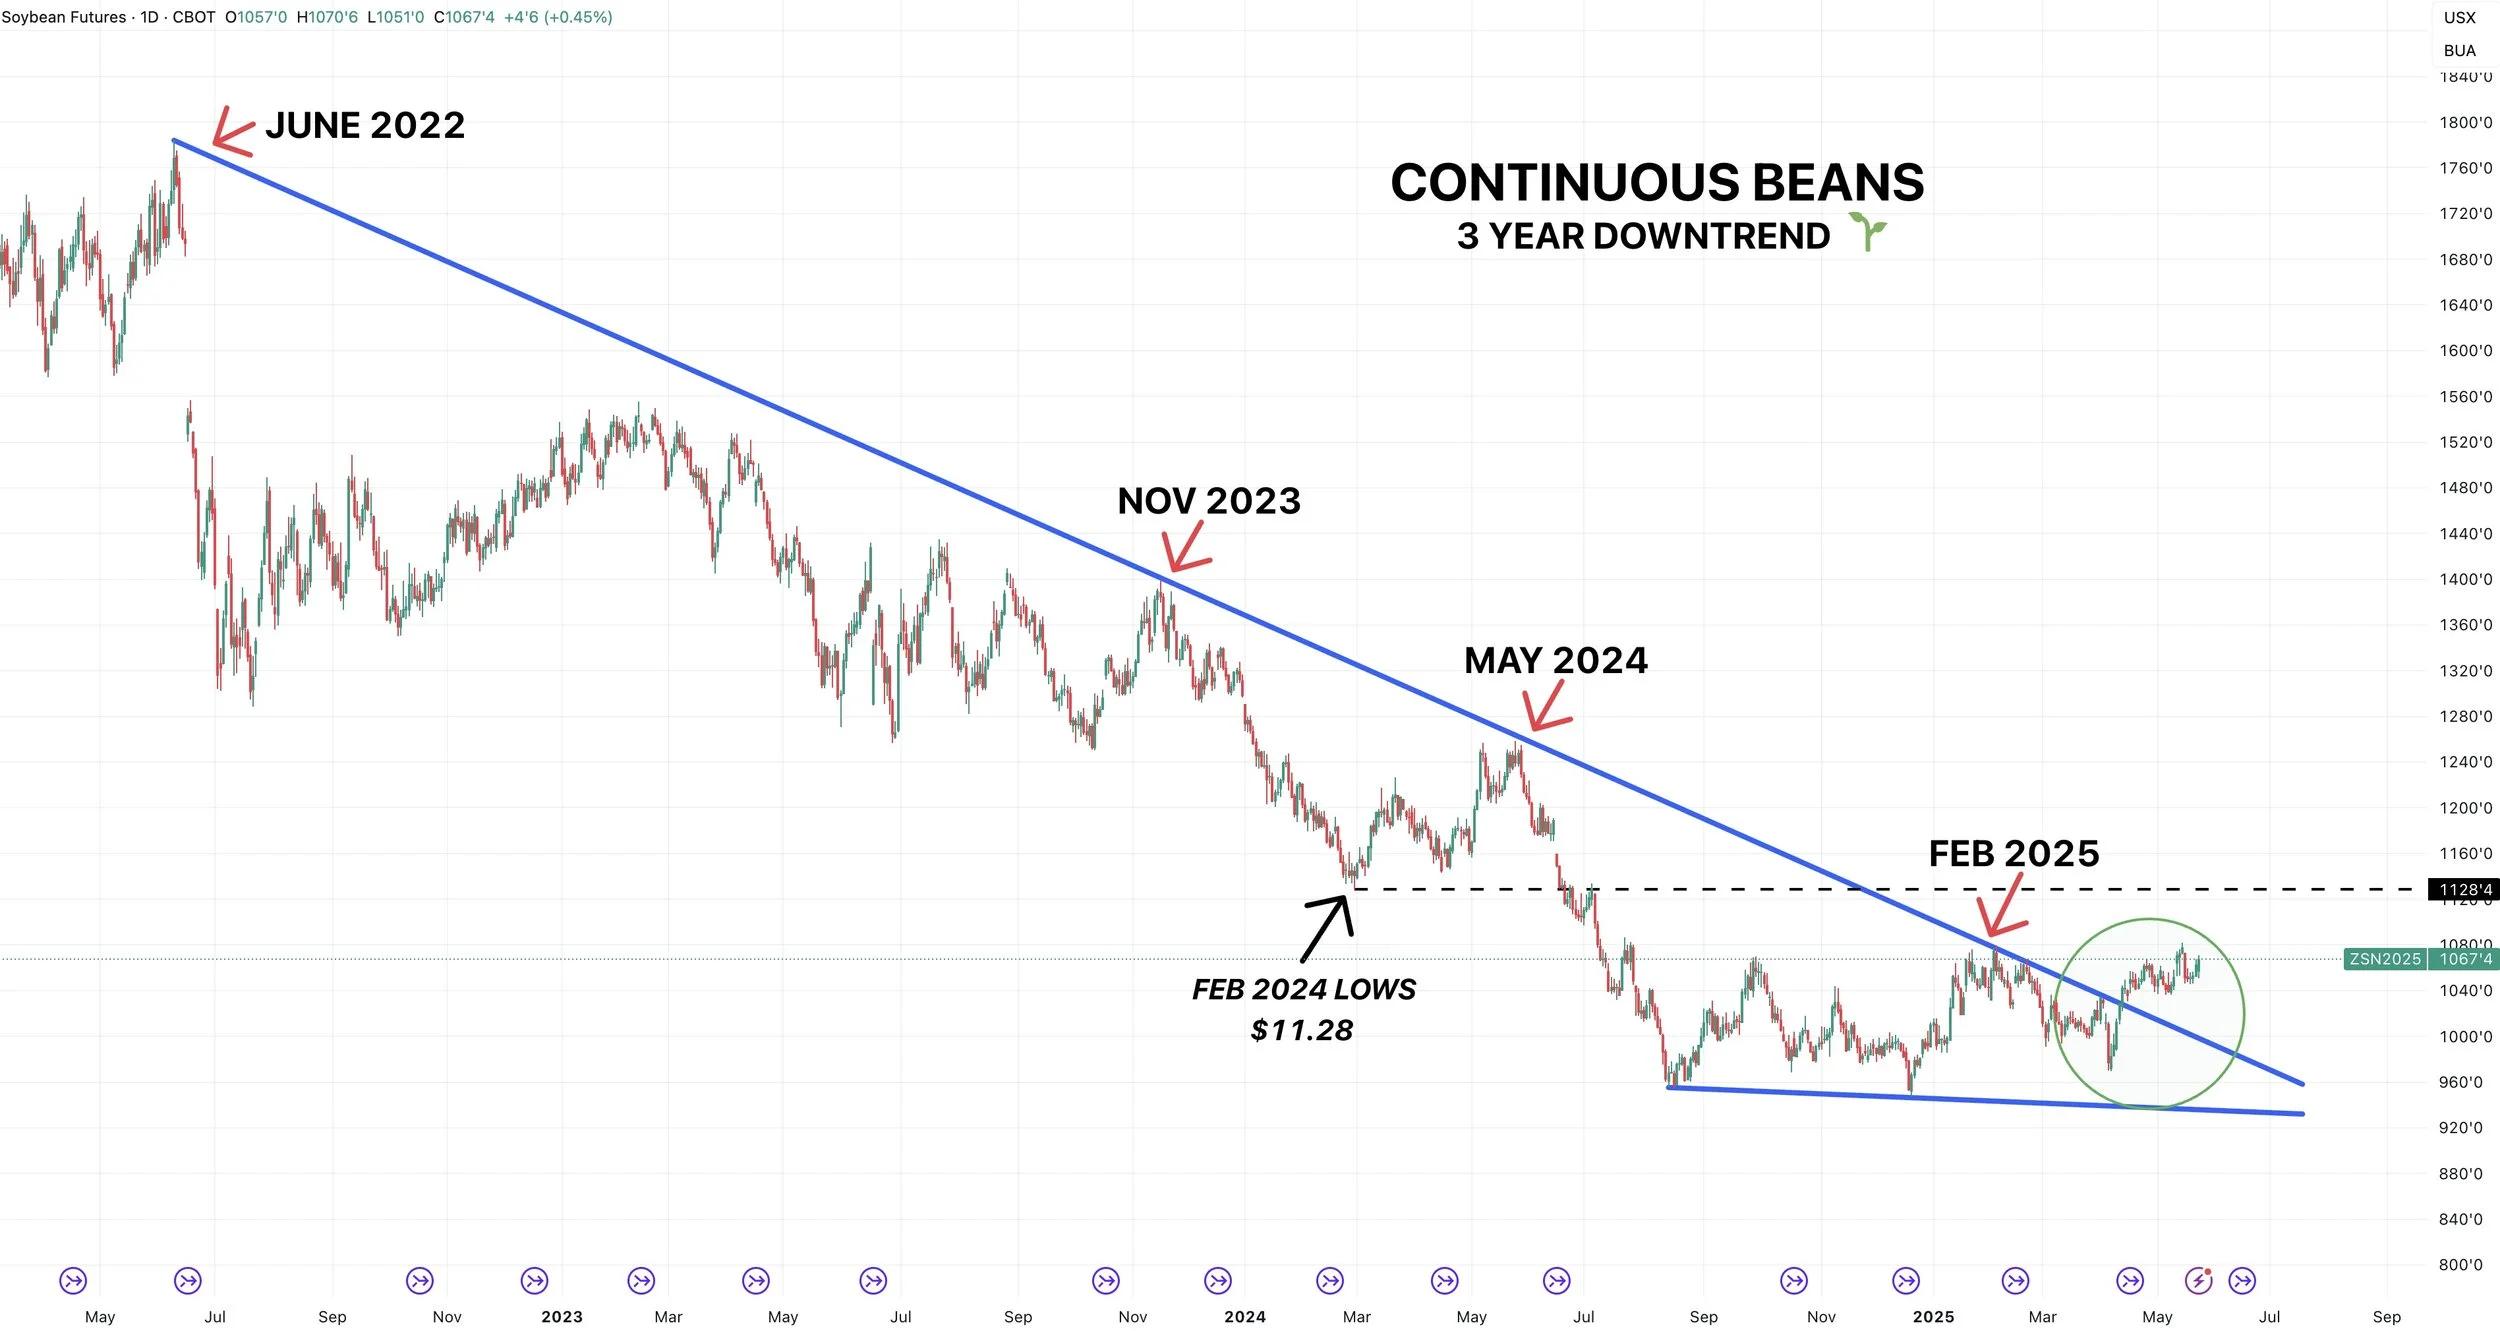
Continuous Beans
Here is another reason why I think soybeans could see some upside.
We broke this downtrend that had kept a lid on us for 3 years.
If we break above the recent highs, the next resistance on this chart will be our lows from Feb 2024 at $11.28
Which happens to line up with that 2nd target we just talked about in July beans.
July Beans: Inverted
This is another reason why that $11.00 mark is our next target.
This is one of my favorite soybean charts because of how simple it is.
When you flip soybeans upside down, it clearly looks like we want to test that $11.00 magnet once again.
We've tested it twice already. Clear bearish head and shoulders pattern.
If we can break $10.80 I would like to think there is nothing stopping us from getting to $11.00 minimum.

Nov Beans: Targets
1st target: $10.78-82
$10.82 claws back 50% of the May 2024 highs.
2nd target: $11.11
That would claw back 61.8% of the May highs. It also happens to be those lows from Feb 2024.

Nov Beans: Significance of 200-Day MA
We continue to bounce right off that 200-day MA which is exactly what bulls want to see.
It marked our highs in May last year and Feb this year.
That big of resistance should offer great support.
That is the must hold level moving forward.
Being above the 200-day for the first time since 2023 is a very positive sign and indicates our trend might be shifting higher for the first time.

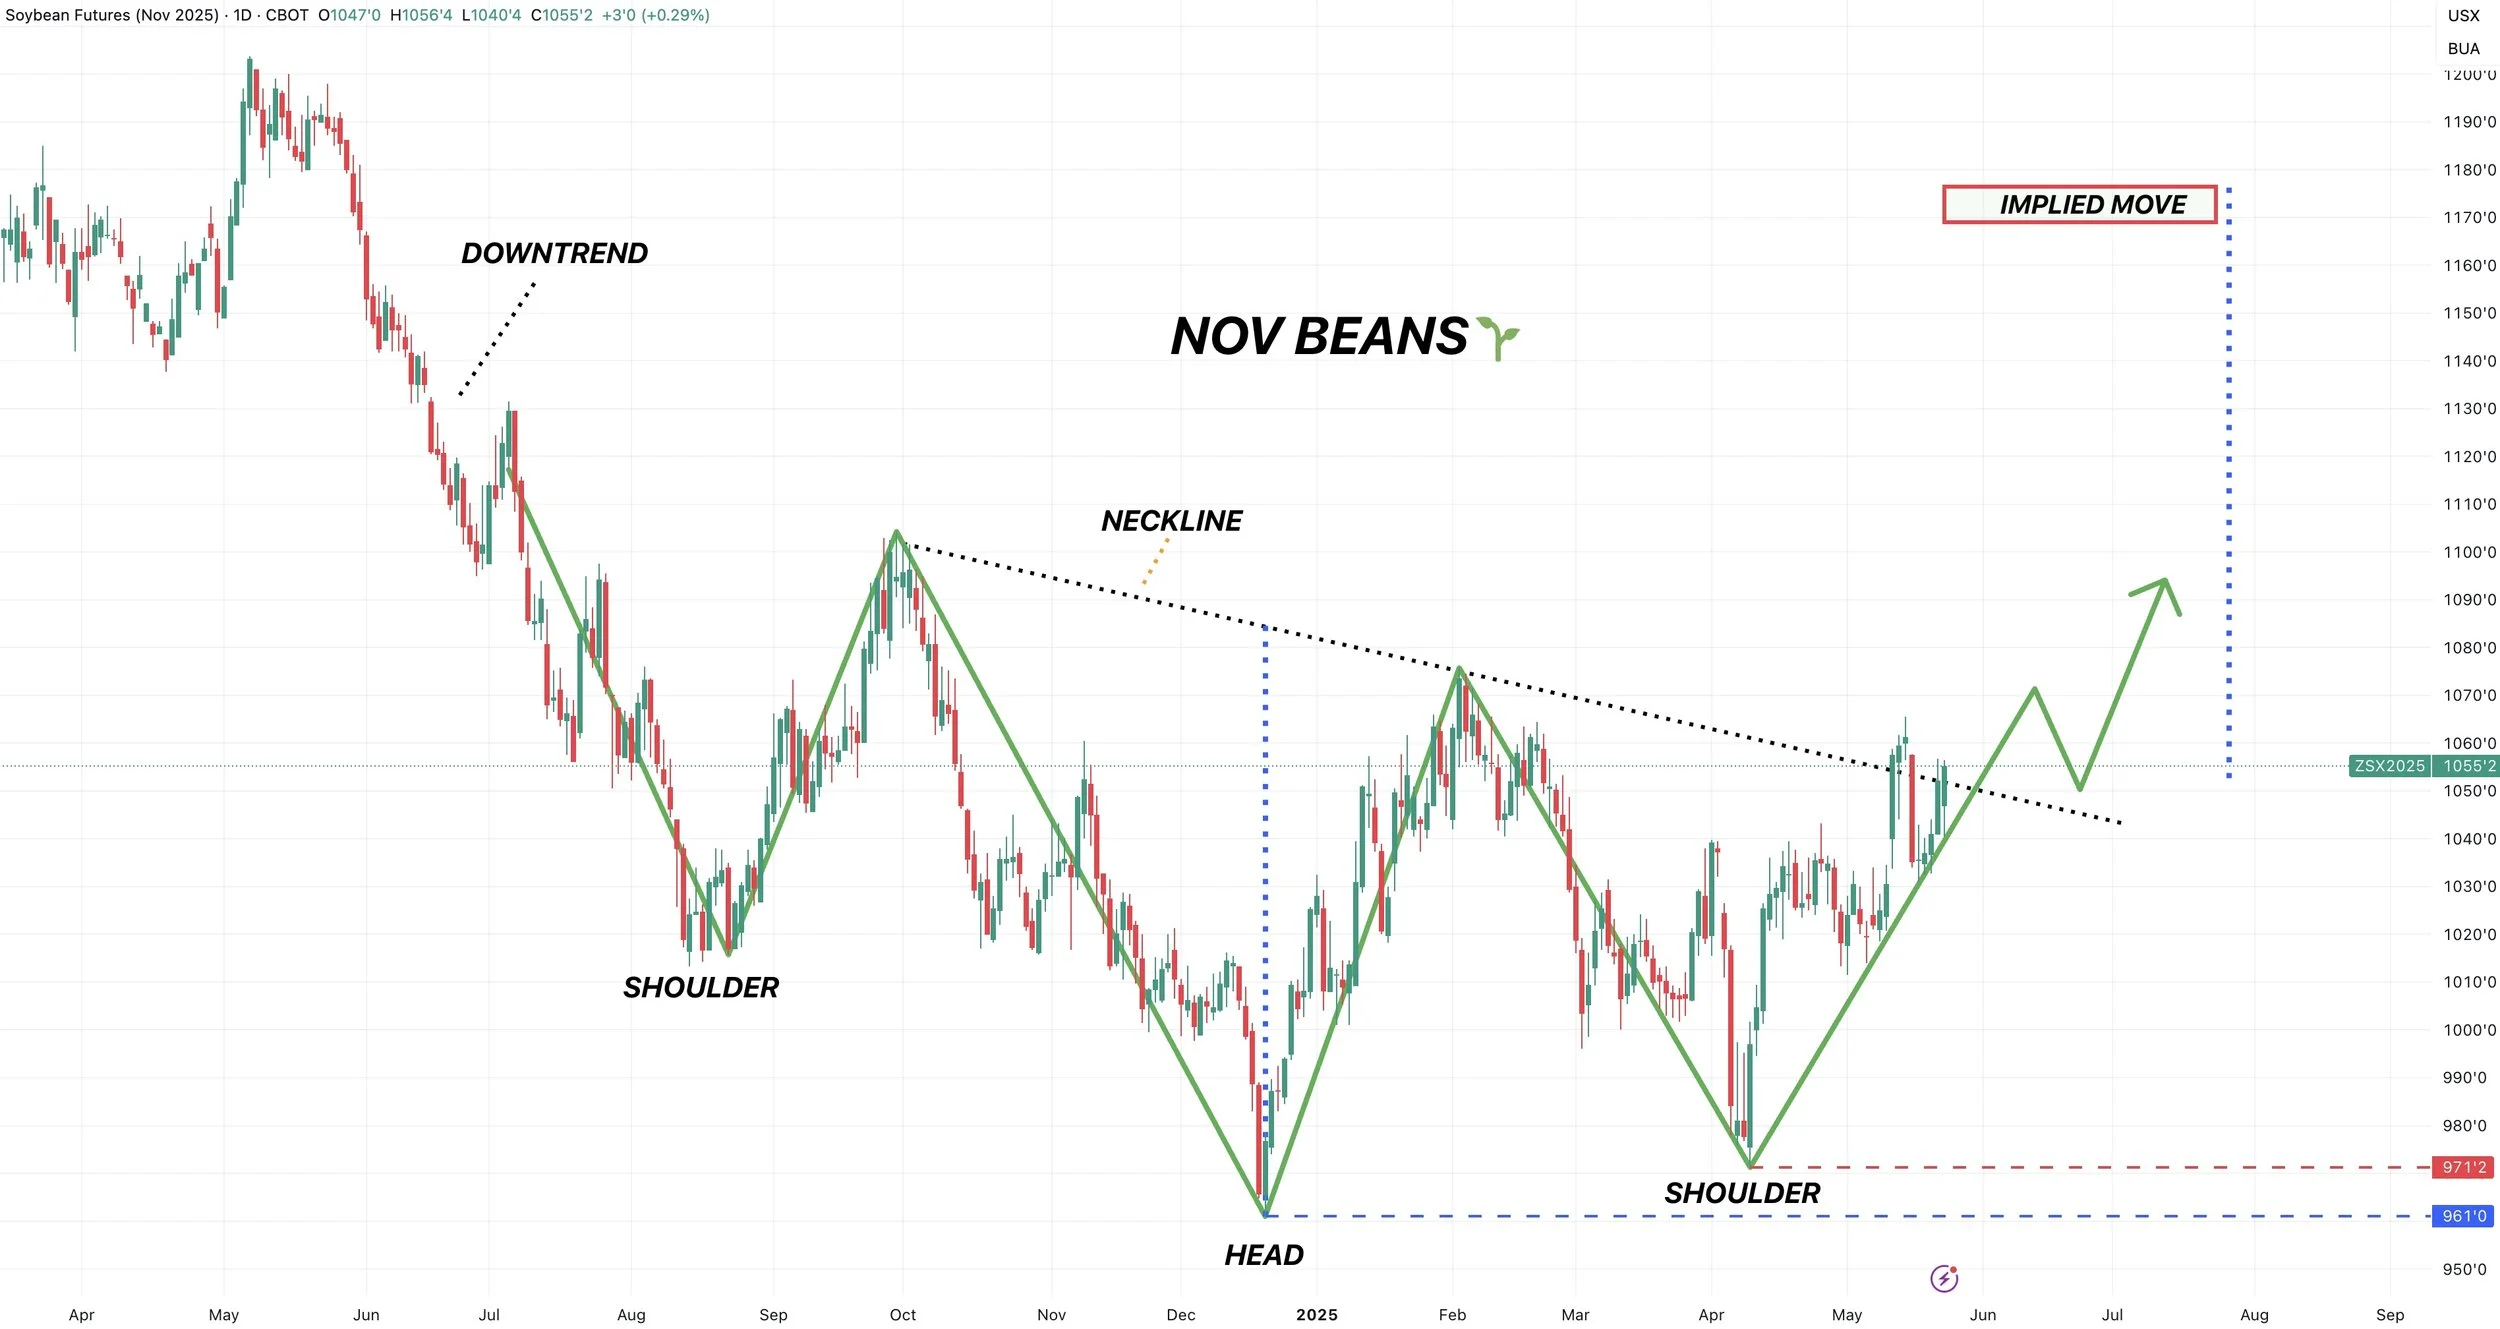
July & Nov Beans: Inverse Head & Shoulders
I have been showing you these patterns since February.
We still have very clear bullish inverse head & shoulders patterns in both July and Nov beans.
Nov beans look more bullish than July beans, as Nov is attempting to break above it's neckline. Where as July still has a long ways to go.
Breaking above the neckline typically confirms more upside. Nov beans are extremely close to doing so but not yet.
The implied move for July is over $12 and is $11.80 for Nov.
I am not trying to get you all bulled up, as the implied moves don’t seem that likely and would take some outside factors to make happen. But if we did ever climb up to those levels, the implied moves would be a good indication of where to take risk off if we happened to get some major rally.

Wheat
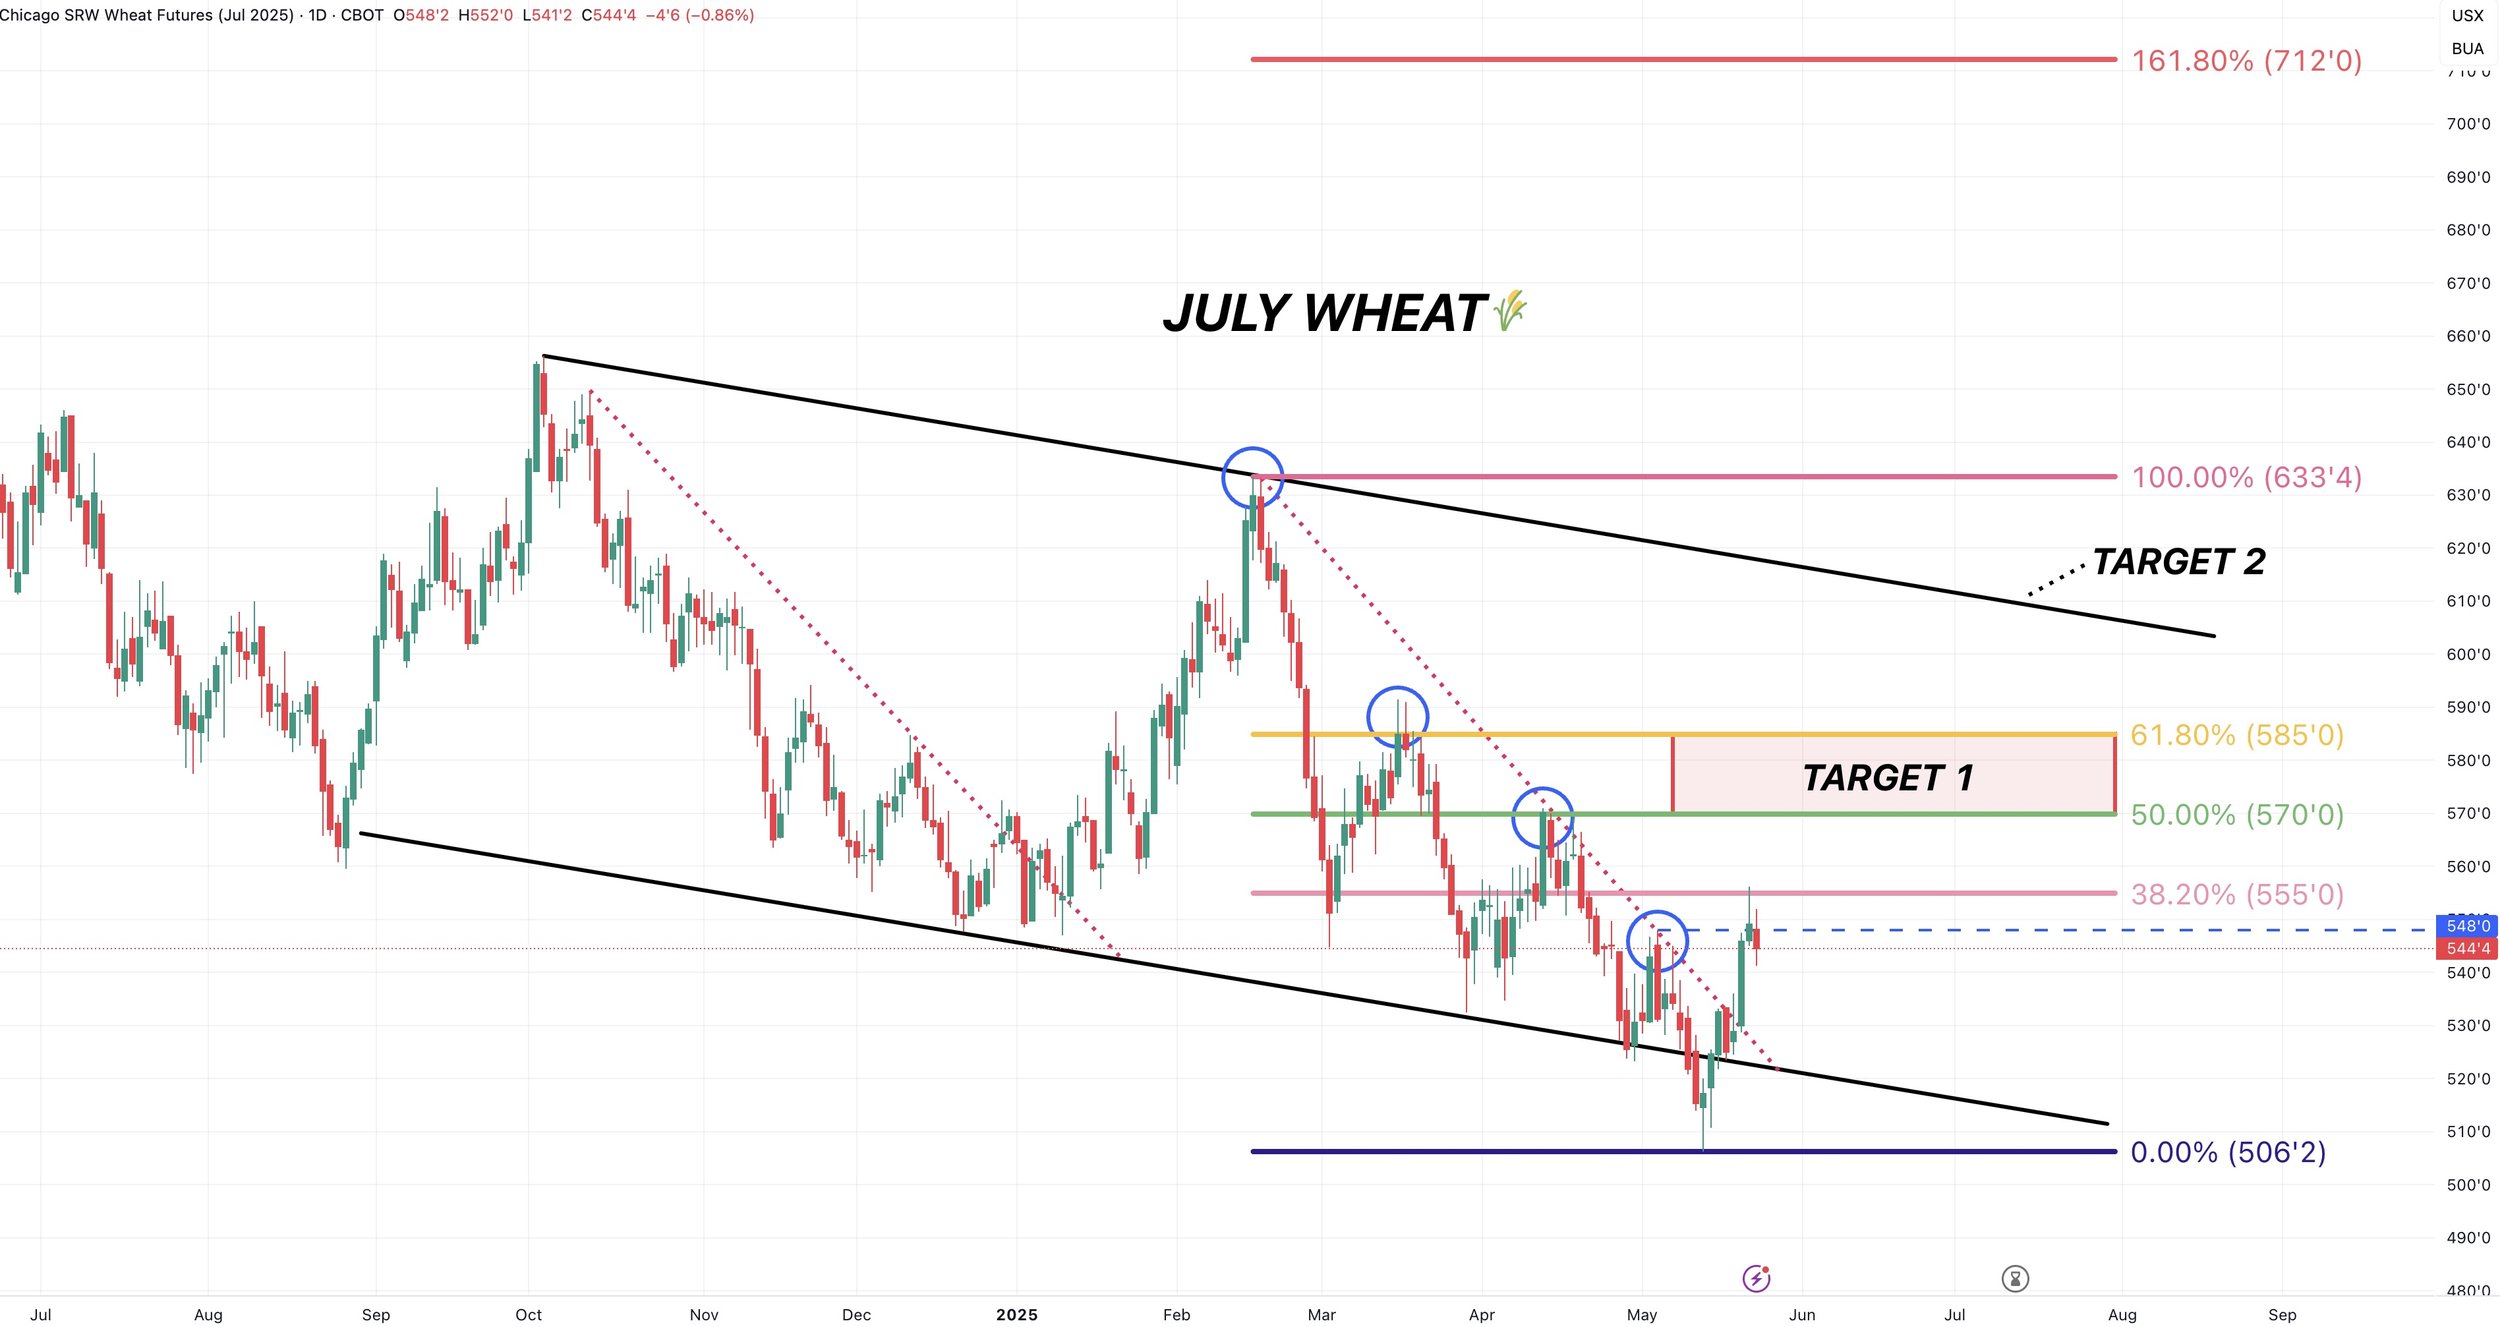
July Wheat
We posted our first higher high since all the way back in February.
That is a good sign.
Currently rejecting the 38.2% retracement up to those Feb highs from the recent lows.
If we can break above this level, our first target to de-risk is $5.70 to $5.85
Which is 50-61.8% of the Feb highs.
2nd bigger picture target would be the top of this downward channel that marked our Oct 2024 highs and recent Feb highs.
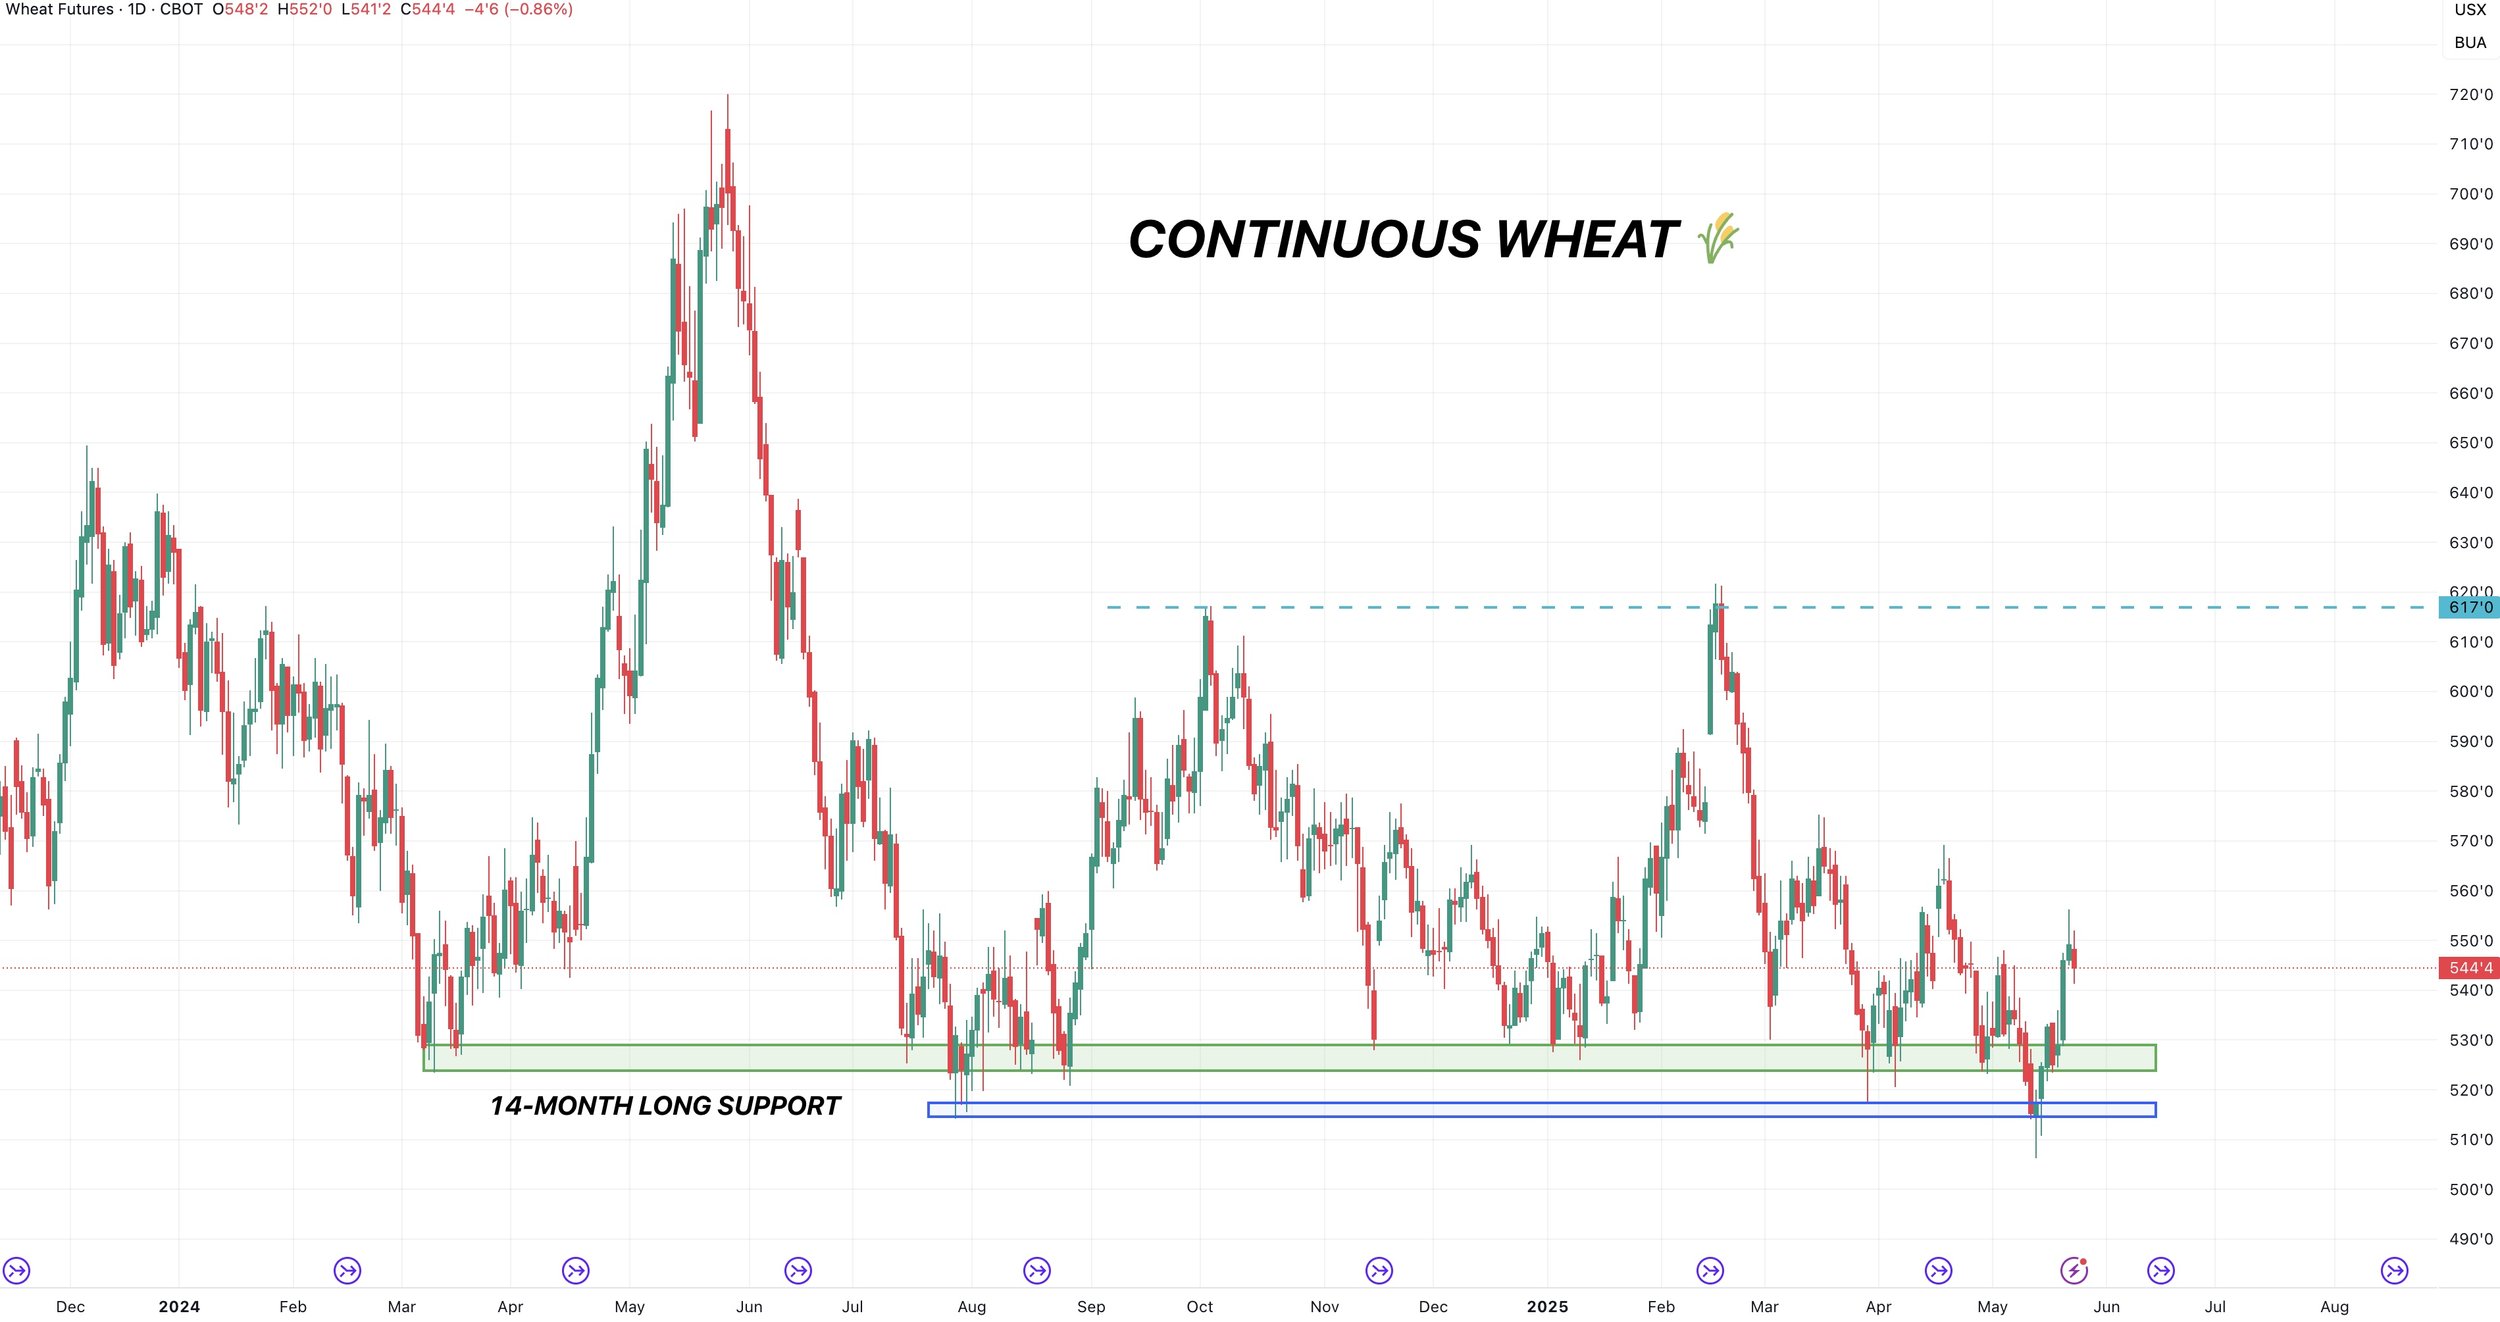
Continuous Chicago Wheat
We held this support for over a year.
We bounced exactly where we needed to avoid catching a falling knife.
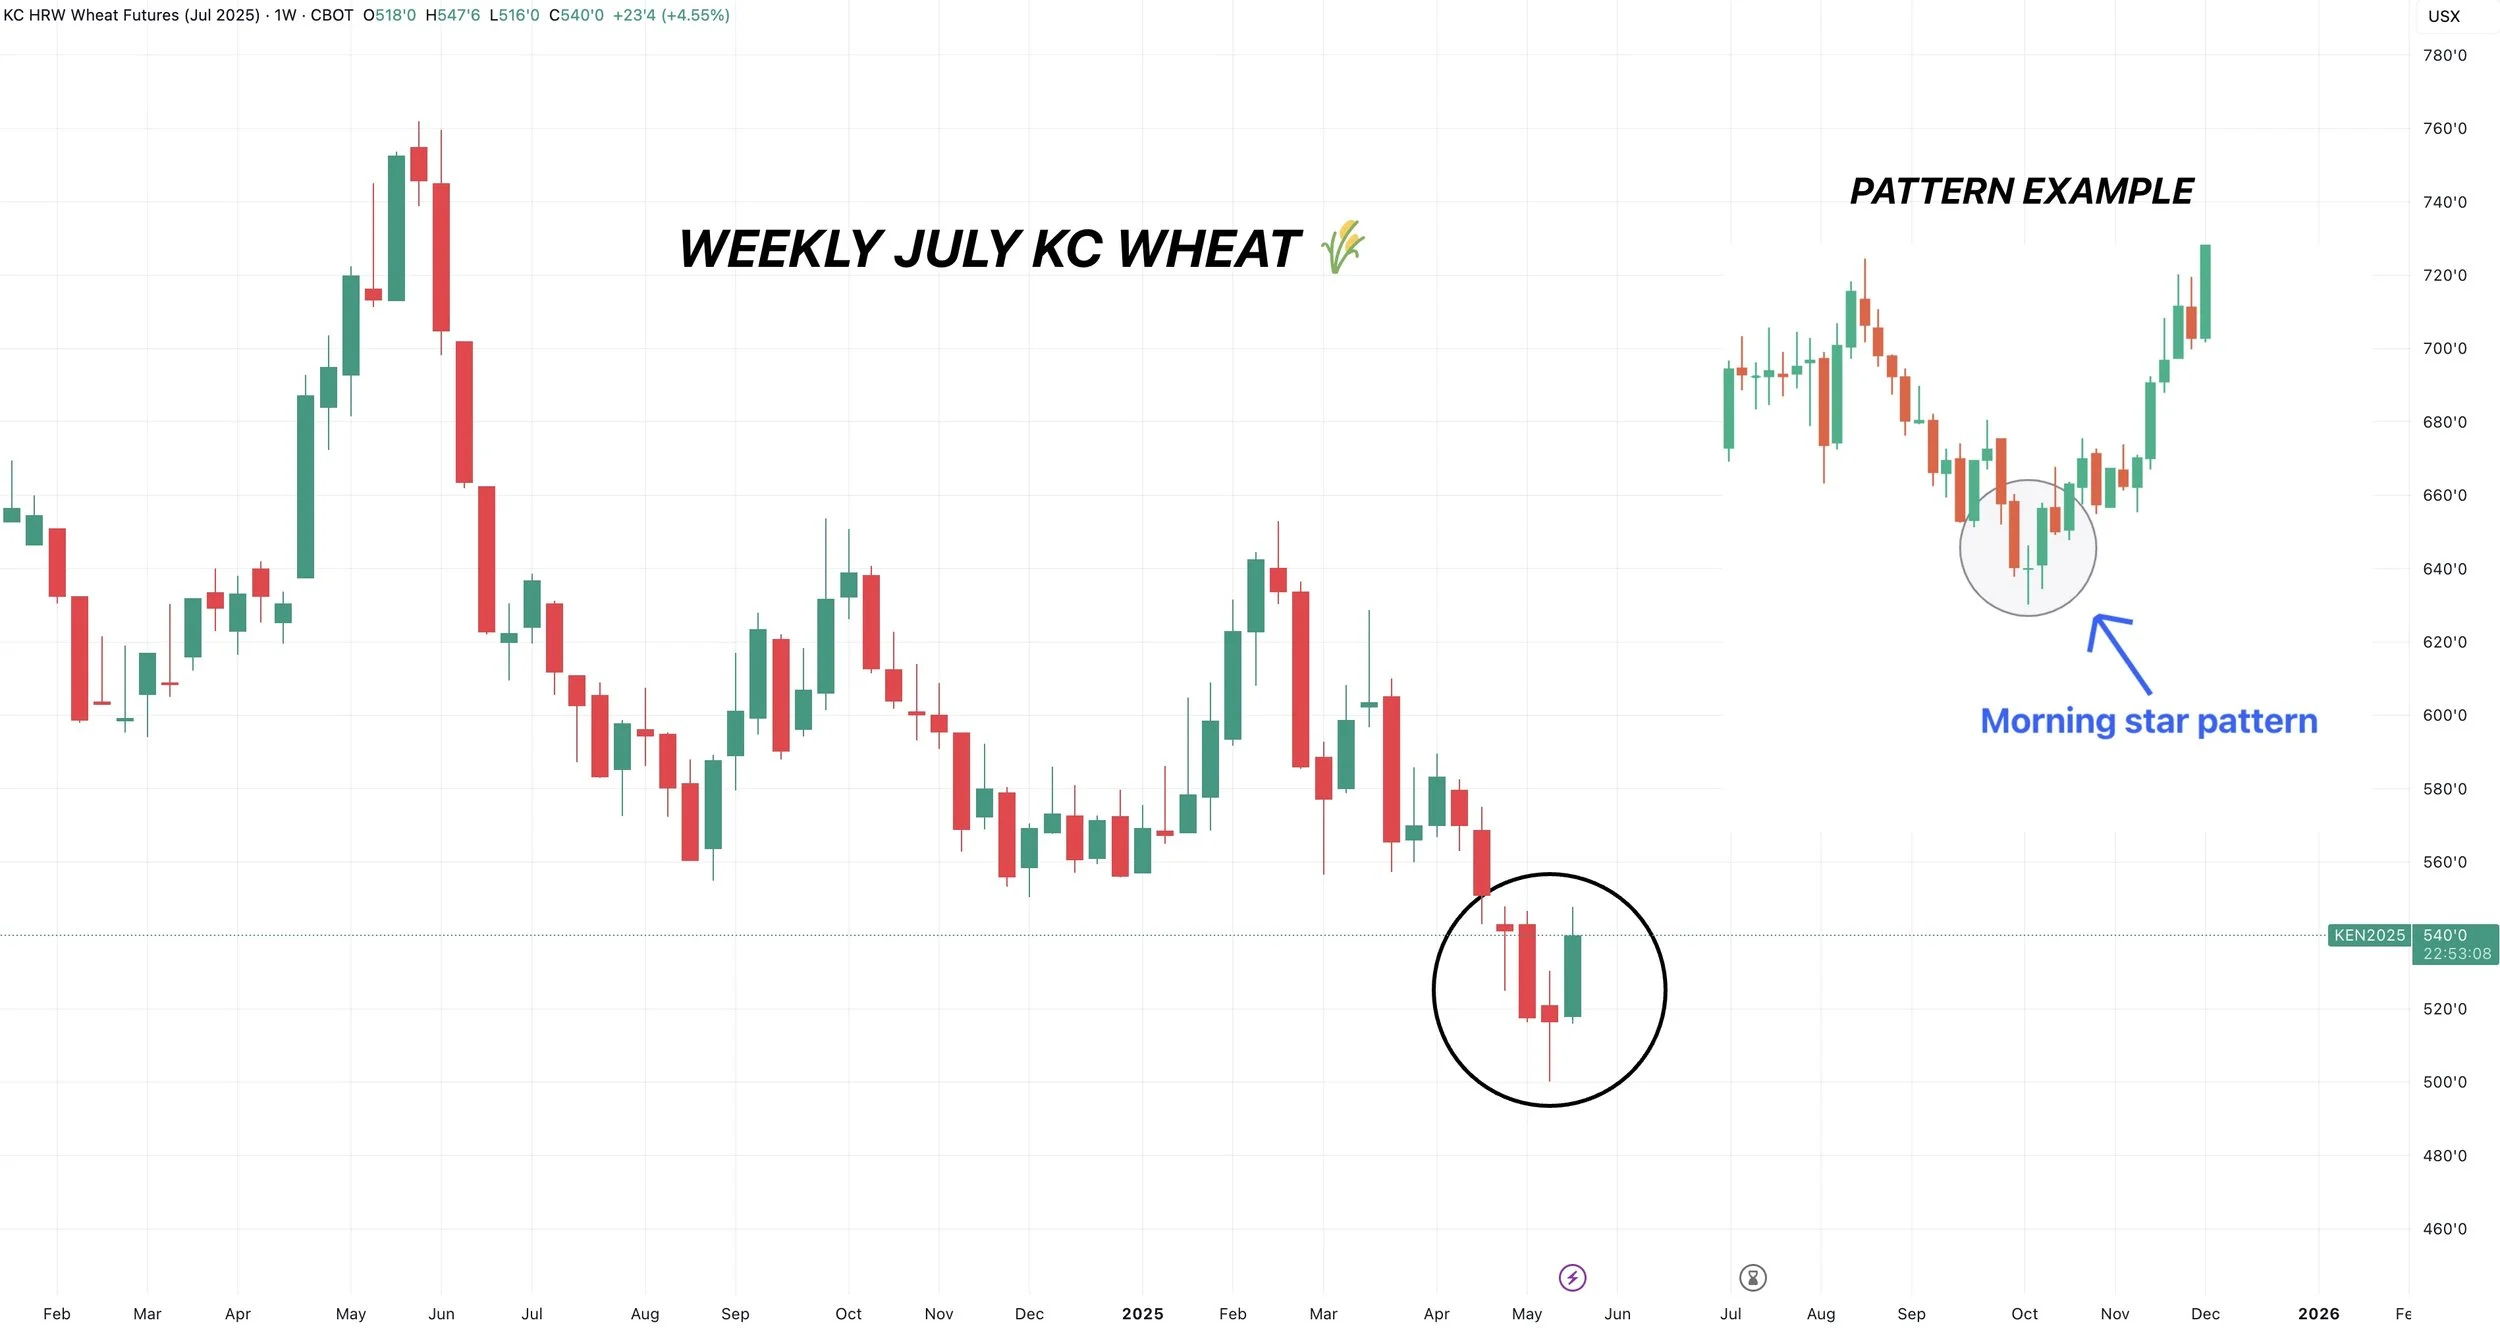
July KC Wheat
KC is currently backtesting it's old support trendline.
We need to break above this to confirm more upside.
Old support is now resistance.
Our first target to de-risk is $5.76 to $5.94 (50-61.8% of the Feb highs).

Weekly KC Wheat: Morning Star
We are forming a potential morningstar pattern on the weekly chart.
This is a bullish pattern that can sometimes indicate a reversal.
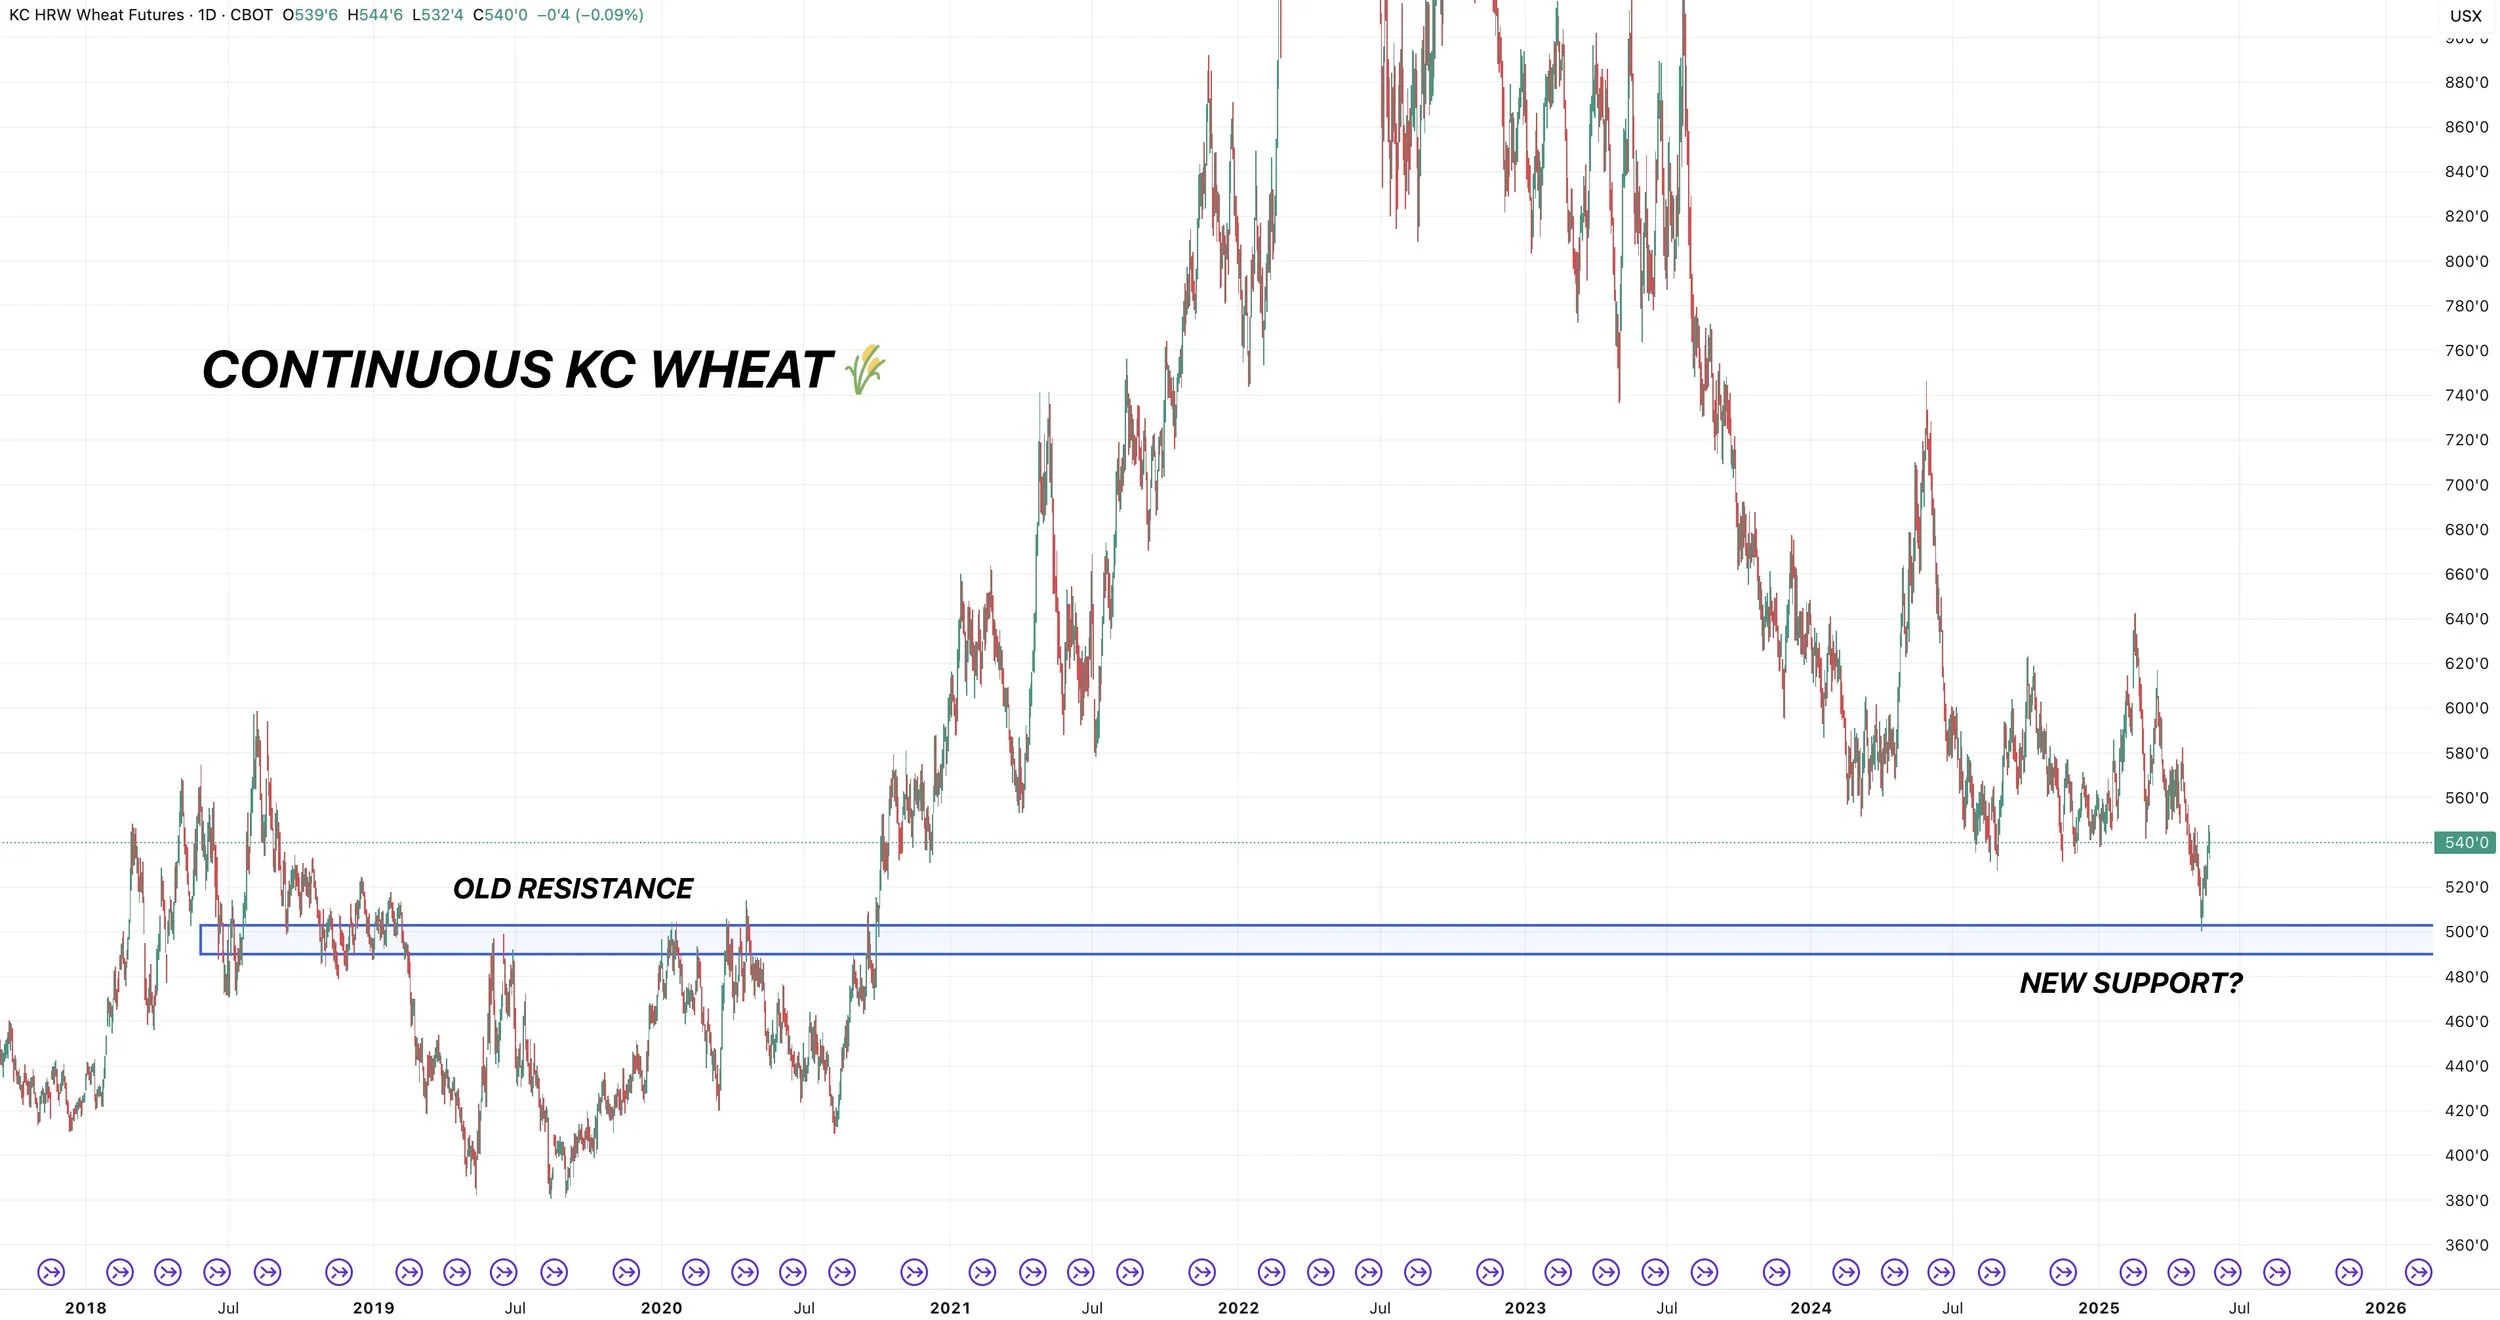
Continuous KC Wheat
Those recent lows just happened to be our old resistance from 2019-2020.
Bulls are hoping that can be our new floor moving forward.
Cattle
August Live Cattle
We will possibly be alerting a sell signal in cattle tomorrow depending on what the price action looks like.
For starters, corrections usually happen in 3 moves. A down, B up, C down.
So this could possibly just be that B wave relief bounce before heading lower.
If we continue higher, the golden fib extension of the 184-204 rally is 216.375
If that was indeed our highs, we could easily fall down to the 199-196 range. As that would be the golden zone of the big rally.

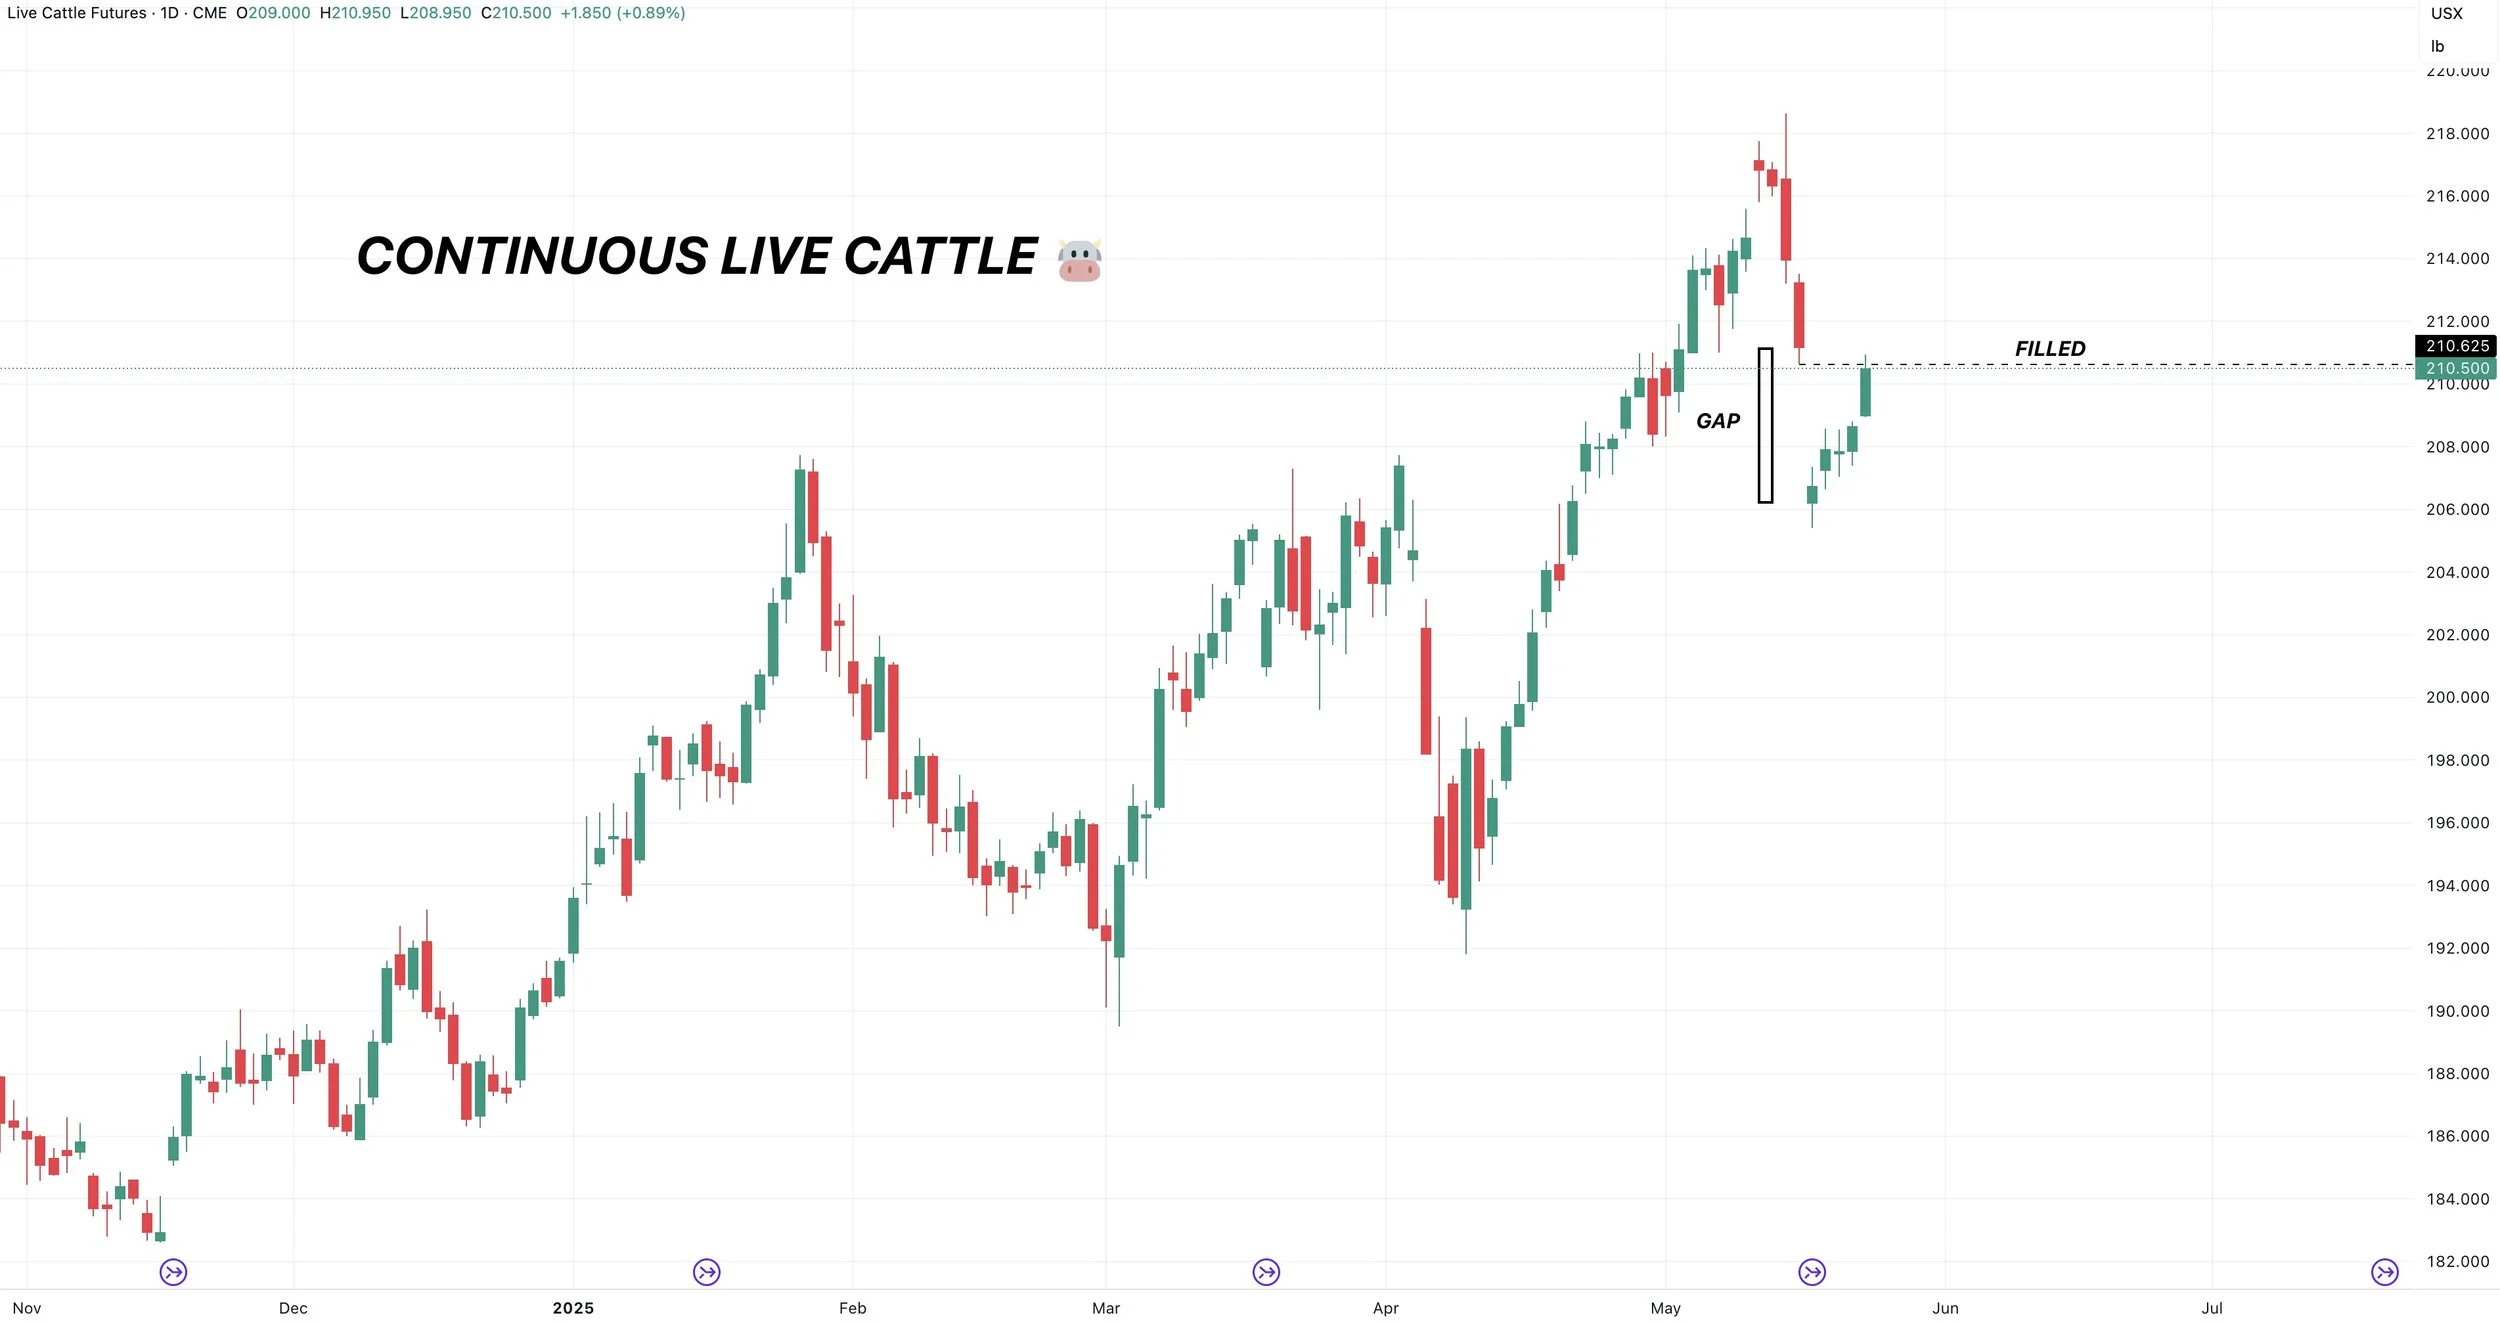
Continuous Live Cattle: Gap Filled
This is why we should know tomorrow whether it's time to alert a sell signal.
The continuous chart left a gap lower when the contracts changed (due to an inverse in the market).
Gaps can act as magnets. We have now filled that gap lower exactly.
So we want to know if the market simply wanted to fill that gap before heading lower or if the market wants to keep running.
We either fail right here or probably continue higher. Should know really soon.
August Feeder Cattle
If August feeder keeps running, currently eyeing 313.800
If that was the top, we could easily drop down to 286-290

Past Sell or Protection Signals
We recently incorporated these. Here are our past signals.
April 10th: 🌽
Old crop corn sell signal.
March 19th: 🐮
Cattle hedge & sell signal.
Feb 18th: 🌽 🌾
Old crop KC wheat & old crop corn signal.
Jan 23rd: 🌽 🌱
Corn & beans old crop sell signal.
CLICK HERE TO VIEW
Jan 15th: 🌽 🌱
Corn & beans hedge alert/sell signal.
Jan 2nd: 🐮
Cattle hedge alert at new all-time highs & target.
Dec 11th: 🌽
Corn sell signal at $4.51 200-day MA
CLICK HERE TO VIEW
Oct 2nd: 🌾
Wheat sell signal at $6.12 target
Sep 30th: 🌽
Corn protection signal at $4.23-26
Sep 27th: 🌱
Soybean sell & protection signal at $10.65
Sep 13th: 🌾
Wheat sell signal at $5.98
May 22nd: 🌾
Wheat sell signal when wheat traded +$7.00
Want to Talk?
Our phones are open 24/7 for you guys if you ever need anything or want to discuss your operation.
Hedge Account
Interested in a hedge account? Use the link below to set up an account or shoot Jeremey a call at (605)295-3100.
Check Out Past Updates
5/21/25
RISK TO THE UPSIDE WITH WEATHER?
5/20/25
WHEAT SHORT COVERING & HISTORY OF YIELD CHANGES
5/19/25
ANYONE LEFT TO SELL WHEAT? 181 CORN YIELD POSSIBLE?
5/16/25
FUNDS SHORT CORN. MARKETS WAITING ON WEATHER
5/15/25
BEANS HAMMERED ON RUMOR & WHEAT FINDING LIFE
5/14/25
DECISIONS & POSSIBILITIES IN GRAINS
5/13/25
GRAINS RALLY OFF LOWS
5/12/25
USDA REPORT. HOW THIS CHANGES THINGS
5/9/25
BIGGEST RISKS IN USDA REPORT
5/8/25
USDA MONDAY & HISTORY OF WEATHER RALLIES
5/7/25
NEW 2025 LOWS FOR CORN
5/6/25
WHAT’S A SUMMER RALLY LOOK LIKE?
5/5/25
CORN ERASES ENTIRE APRIL RALLY
5/2/25
SELL INTO UNCERTAINTY. NOT KNOWN FACTORS
5/1/25
THE CASE AGAINST A FEB TOP IN CORN
4/30/25
APPROACHING KEY TIME PERIOD FOR GRAINS
4/29/25
PLANTING & FIRST NOTICE DAY PRESSURE. CORN CLOSE TO BOTTOM?
4/28/25
CAPTURING INVERSE & SEASONAL PREPARATION
4/25/25
HOW OFTEN DOES CORN NOT BREAK APRIL HIGHS?
4/24/25
KNOW WHEN TO SELL. BEANS BREAK 200-DAY FIRST TIME IN 483 DAYS
4/23/25
MONEY FLOW & DROUGHT CARDS
4/22/25
CRUCIAL SPOT FOR CORN & BEANS
4/21/25
NO PLANTING THREAT YET
4/18/25
POTENTIAL OPPORTUNITIES, BASIS CONTRACTS & STRATEGIES
4/16/25
HOW YIELD IMPACTS CARRYOUT. MAJOR SPOT FOR SOYBEANS
4/15/25
TOTAL CHART BREAKDOWNS & TARGETS
4/14/25
TECHNICAL SELLING IN GRAINS
4/11/25
SPECIFIC GRAIN MARKETING DECISIONS
4/10/25
USDA REPORT. HOW THIS IMPACTS CORN
4/9/25
TARIFFS GIVE. TARIFFS TAKE
4/8/25
CORN’S DIVERGING STRENGTH
4/7/25
SOLID PRICE ACTION DESPITE OUTSIDE FEAR
4/4/25
CORN PRICE ACTION SPEAKS VOLUME. ANY HOPE LEFT FOR SOYBEANS?
4/3/25
WHAT IS LEFT FOR CORN BEARS? TRADE WAR: CHARTS HOLDING SUPPORT
4/2/25
SHOULD UNKNOWNS KEEP A FLOOR UNDER GRAIN PRICES?
4/1/25
HOW DO ACRES IMPACT FUTURE OF THE GRAINS?
3/31/25
USDA REPORT: NOW WHAT?
3/28/25
ALL EYES ON USDA
3/27/25
PRE-USDA POSITIONING. DON’T GIVE GRAIN AWAY
3/26/25
HISTORY OF MARCH INTENTIONS. SOYBEANS UNDERVALUED?
3/25/25
6 DAYS UNTIL MAJOR USDA REPORT
3/24/25
HOW TO POSITION YOURSELF BEFORE PLANTING
3/21/25
REASONS TO BE OPTIMISTIC IN GRAINS?
3/20/25
WAS THAT THE BOTTOM IN CORN?
3/19/25
THE PATH HIGHER & THE DOWNSIDE RISKS IN GRAINS
3/18/25
SEASONALS, CATTLE HEDGE, CHARTS & DROUGHT?
3/17/25
WHEAT RALLIES. DON’T GET BACKED INTO A CORNER
3/14/25
MARCH 31ST REPORT THOUGHTS & WHAT’S NEXT FOR GRAINS
3/13/25
EXPLAINING RE-OWNERSHIP VS COURAGE CALLS
3/12/25
TARIFF FEARS. EU, CANADA, & ETHANOL
3/11/25
USDA SNOOZE. RECORD FUND SELLING A CONCERN?
3/10/25
USDA TOMORROW. GETTING COMFORTABLE IN MARKETING
3/7/25
HOW TIGHT IS THE WORLD & US SITUATION?
3/6/25
TARIFFS PUSHED BACK. FUTURE OPPORTUNITIES?
3/5/25
IS GRAINS BIGGEST RISK WEAK CRUDE & DEFLATION?
3/4/25
TRADE WAR BEGINS. 8TH DAY OF PAIN FOR GRAINS
3/3/25
TARIFFS ON TOMORROW. BUY SIGNAL
3/3/25
BUY SIGNAL
2/28/25
WHEN WILL THE BLEEDING STOP?
2/27/25
CORN AT CRITICAL SPOT. USDA ACRE REPORT. WAY TOO EARLY DROUGHT TALK
2/26/25
HISTORY SUGGESTS CORN TOP ISN’T IN? ACRE OUTLOOK TOMORROW
2/25/25
POSITIVE CLOSE. WHAT TO KNOW ABOUT USDA OUTLOOK
2/24/25
USDA OUTLOOK, FIRST NOTICE DAY & BRAZIL
2/21/25
WHAT TO EXPECT MOVING FORWARD IN GRAINS
2/20/25
FIRST NOTICE DAY CONCERNS. MASSIVE CORN ACRES OR NOT?
2/19/25
HOW TIGHT IS THE CORN SITUATION?
2/18/25
MORE DETAILS ON TODAYS SELL SIGNAL
2/18/25
OLD CROP KC WHEAT & CORN SELL SIGNAL
2/14/25
WHEAT BREAKING OUT ON WEATHER RISK. TECHNICALS & FUNDAMENTALS
2/12/25
GLOBAL GRAIN SITUATION, ACRE TALK, CHARTS & MORE
2/11/25
USDA: NOT A BEARISH REPORT. DISAPPOINTING PRICE ACTION
2/10/25
USDA TOMORROW. LONG TERM PATH FOR SUB 10% CORN STOCKS TO USE?
2/7/25
WHY WOULD THE FUNDS EXIT THEIR LONGS?
2/6/25
WHEAT FINALLY CATCHING A BID
2/5/25
COMPLETE THOUGHTS ON MARKETS: BACK & FORTH DISCUSSION
2/4/25
STRONG JANUARY LEAD TO STRONG YEAR? TARIFFS, CHARTS & MORE
2/3/25
TARIFFS PUSHED BACK
1/31/25
TARIFF NEWS ALL OVER THE PLACE. ARE YOU PREPARED FOR POSSIBILITIES?
1/30/25
WHEAT BULL ARGUMENT. TRUMP ADDS TARIFFS
1/29/25
CORN APPROACHES $5.00
1/28/25
TARIFFS, CORN FUNDS, SOUTH AMERICA & MORE
1/27/25
HEALTHY CORRECTION WE TALKED ABOUT & TARIFF NEWS
1/24/25
GRAINS DUE FOR SHORT TERM CORRECTION?
1/23/25
OUR ENTIRE NEW CROP SALES THOUGHTS & OLD CROP SELL SIGNAL
1/22/25
GRAINS TAKE A BREATHER. IS CORN IN A BULL OR BEAR MARKET?
1/21/25
HUGE DAY IN GRAINS. WHAT TO DO WITH OLD CROP VS NEW CROP
Read More
1/20/25
VIDEO CHART UPDATE
1/17/25
TRUMP, CHINA, ARGY & USING THE SPREADS INVERSE
1/16/25
OLD CROP LEADS US LOWER. MARKETING THOUGHTS
1/15/25
SIGNAL & HEDGE ALERT QUESTIONS EXPLAINED. IS $6 CORN EVEN POSSIBLE?
1/14/25
MORE DETAILS ON TODAYS HEDGE ALERT & SELL SIGNAL
1/14/25
CORN & SOYBEANS HEDGE ALERT/SELL SIGNAL
1/13/25
USDA GAME CHANGER OR NOT?
1/10/25
BULLISH USDA FOR CORN & BEANS
1/9/25
USDA OUT TOMORROW
1/8/25
2 DAYS UNTIL USDA. BE PREPARED
1/7/25
THE HISTORY OF THE JAN USDA & MORE
1/6/25
MAJOR USDA REPORT FRIDAY
Read More
1/3/25
UGLY DAY ACROSS THE GRAINS
1/2/25