
HOW BIG OF AN IMPACT DID USDA MAKE?
MARKET UPDATE
You can scroll to read the usual update as well. As the written version is the exact same as the video.
Timestamps for video:
USDA Impact: 0:25min
Corn: 7:25min
Beans: 9:45min
Wheat: 12:05min
Cattle: 13:45min
Want to talk about your situation?
(605)295-3100
Your free trial has ended
Subscribe if you would like to keep getting our daily update and our next sell signal.
Here is extended access to our most recent sale.
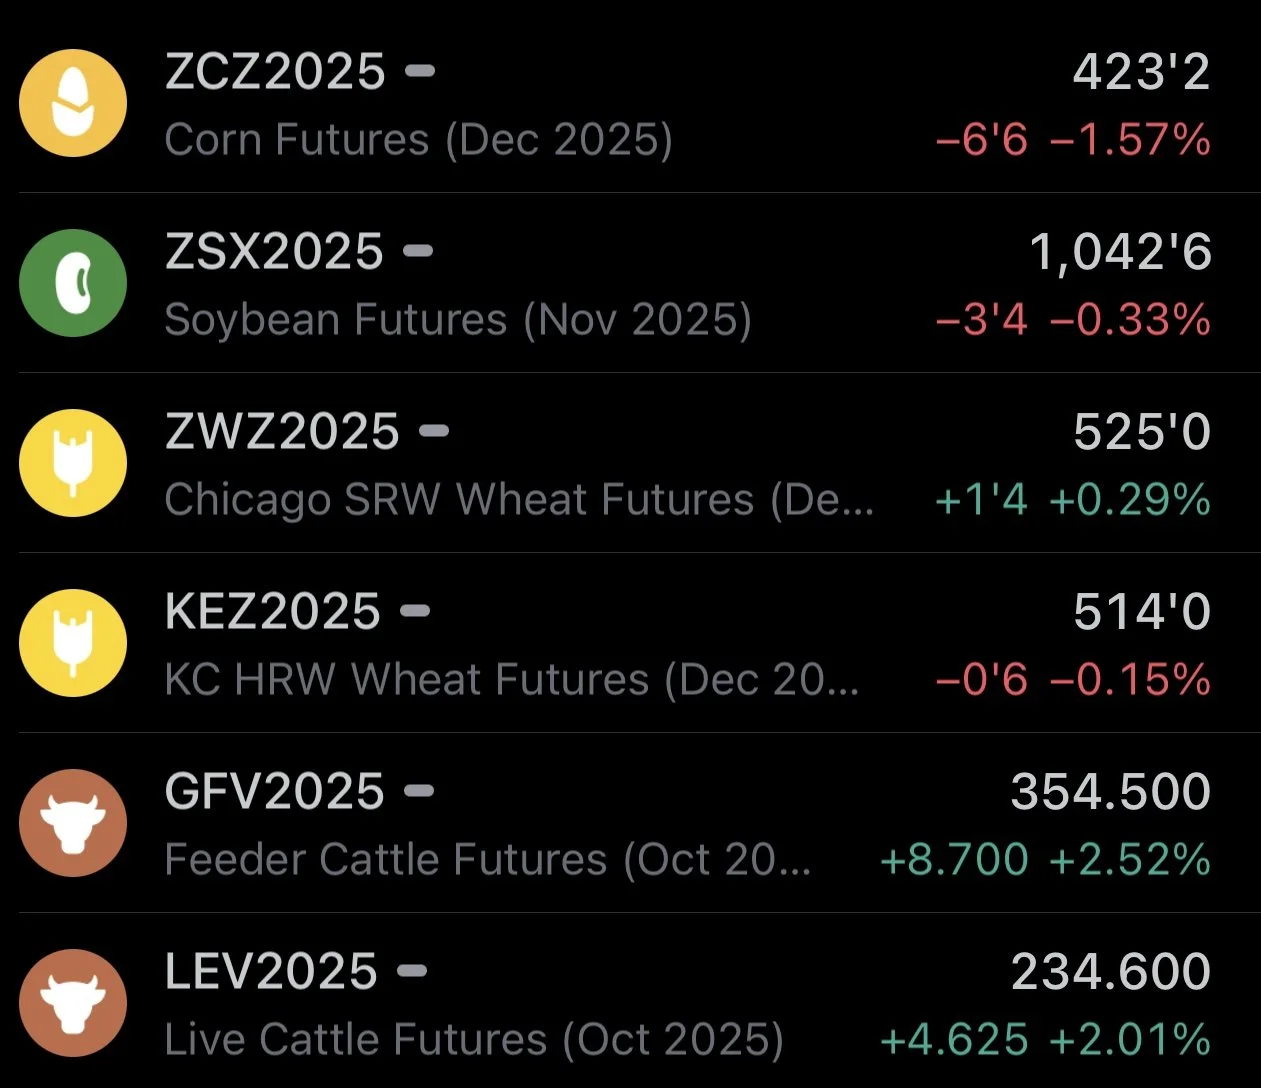
Futures Prices Close
Overview
Grains mostly lower following the impressive price action after Friday's USDA report.
Meanwhile the cattle finds some life after posting it's worst week of the year last week.
Friday's report was anything but bullish, yet prices had a bullish reaction.
How Did USDA Change Things?
Let's take a little deeper dive into what the USDA did on Friday and how this changes things moving forward.
Corn
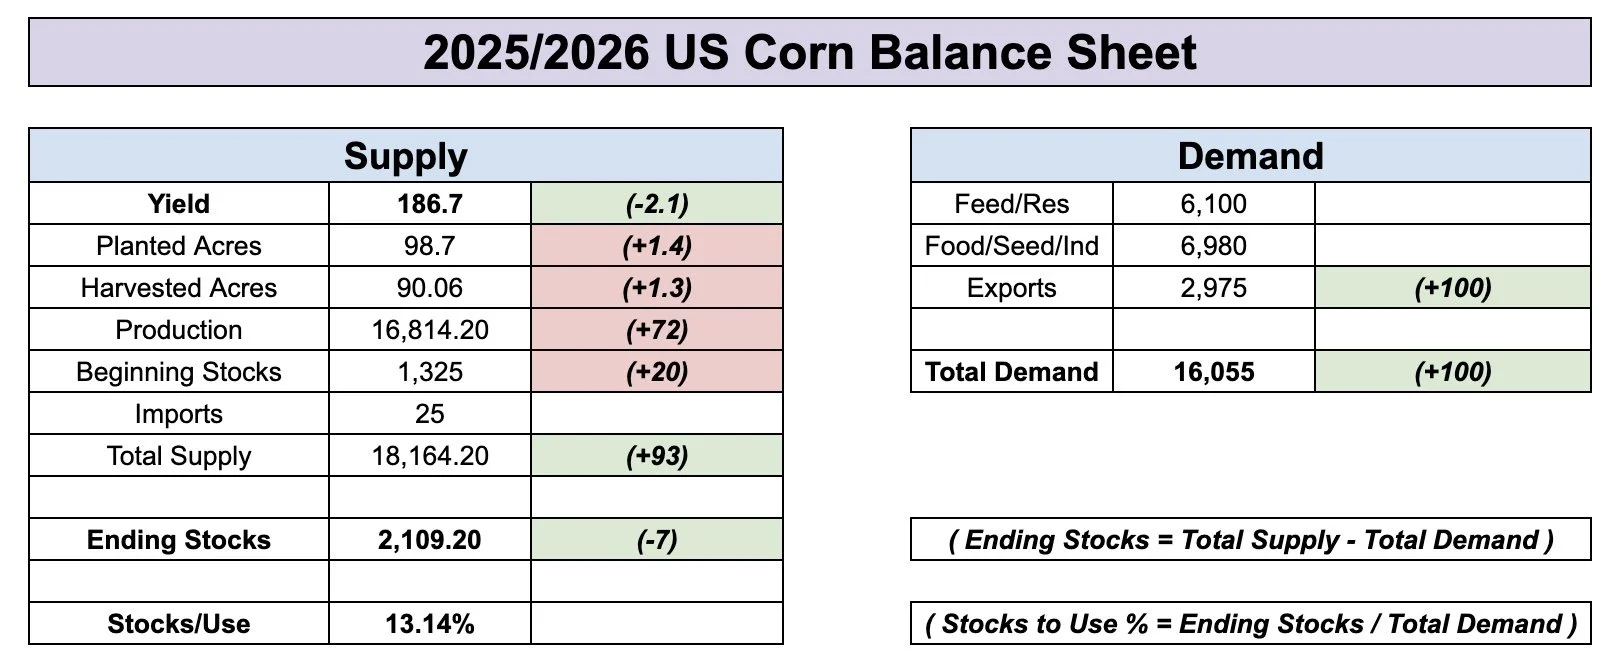
We got the cut to yield everyone was expecting, but the surprise came in acres.
As the USDA found yet another +1.4 million acres.
This bump in acres more than offset the cut we saw to yield. Leading to a net increase of around +90 million bushels on the supply side of the balance sheet despite seeing yield drop -2.1 bpa.
At the same time, the USDA once again raised our exports. This time by +100 million. Which offset the increase in supply, leading to a very small net decrease to our carryout, virtually unchanged.
Here is the balance sheet and the changes the USDA made.
Green = Bullish
Red = Bearish
Current Balance Sheet
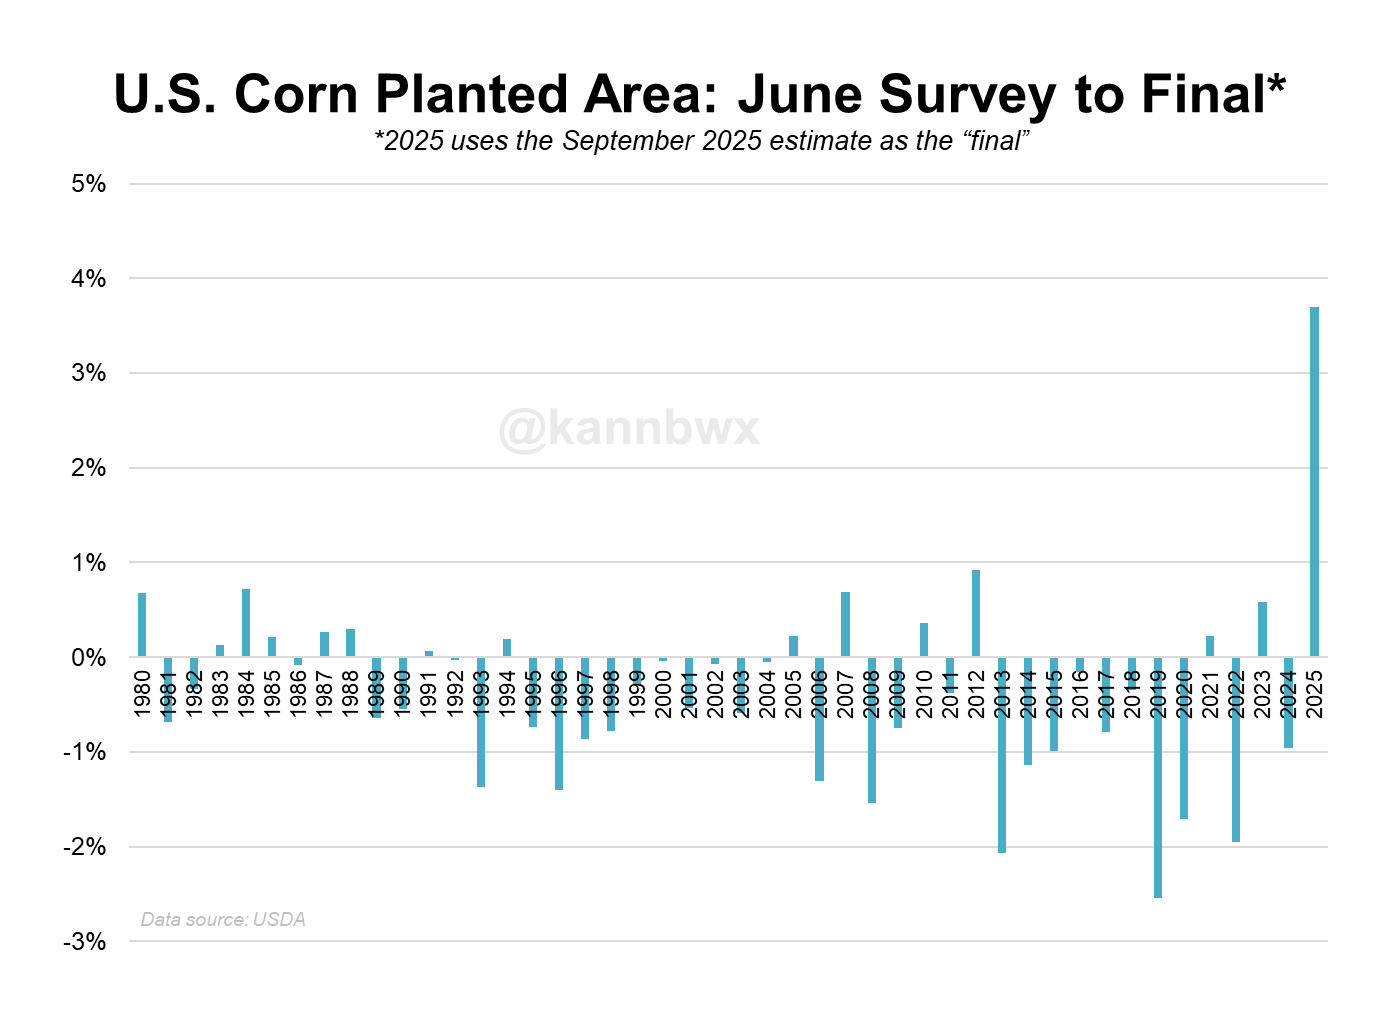
Want to know the craziest thing about the last two reports?
Here is a chart from Karen Braun show casing the USDA's corn acre change from the June survey to the Sep report.
These acre changes were unprecedented. We have never, ever seen anything like this before.
In the past 50 years, we have never seen acres jump by +1%. Only a handful of years even came close to +1%.
This year acres jumped nearly +4%.
That is how much of an anomaly these acre increase have been.
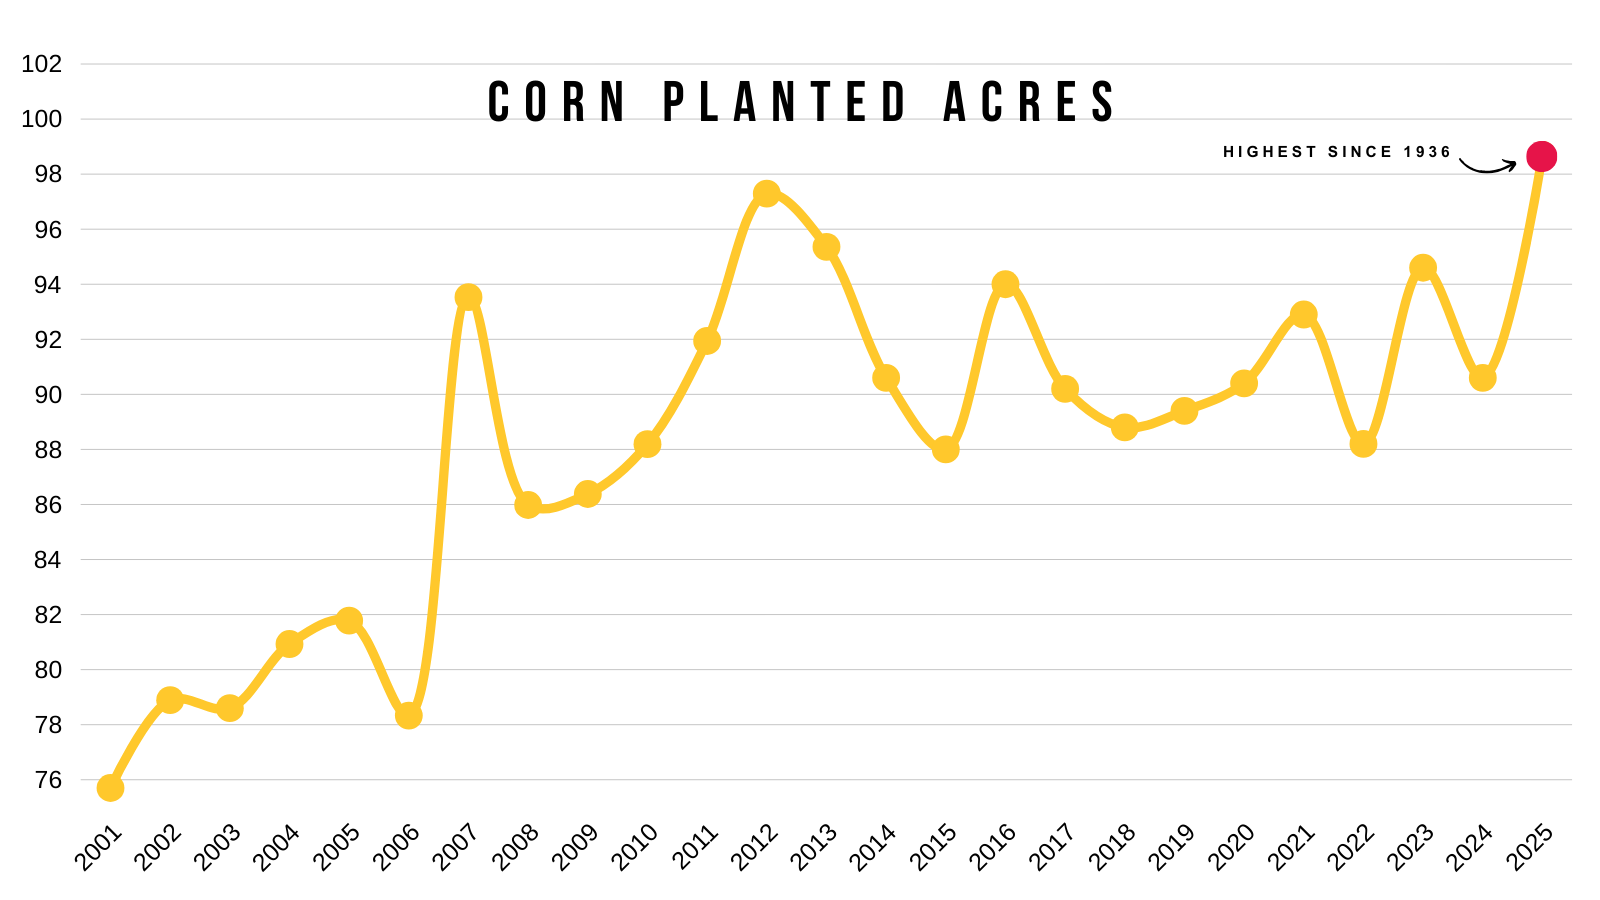
With this recent acre increase, acres are now essentially at an all-time high.
This is the most acres we've seen in 89 years, since 1936.
How big of an impact did this report have on corn?
It made it that much harder to achieve a tighter carryout if yield continues to fall. Because the acres add that much supply.
Here are a few examples.
None of these include demand changes. If the USDA drops supply, they will drop demand to offset some of the supply loss.
Scenarios:
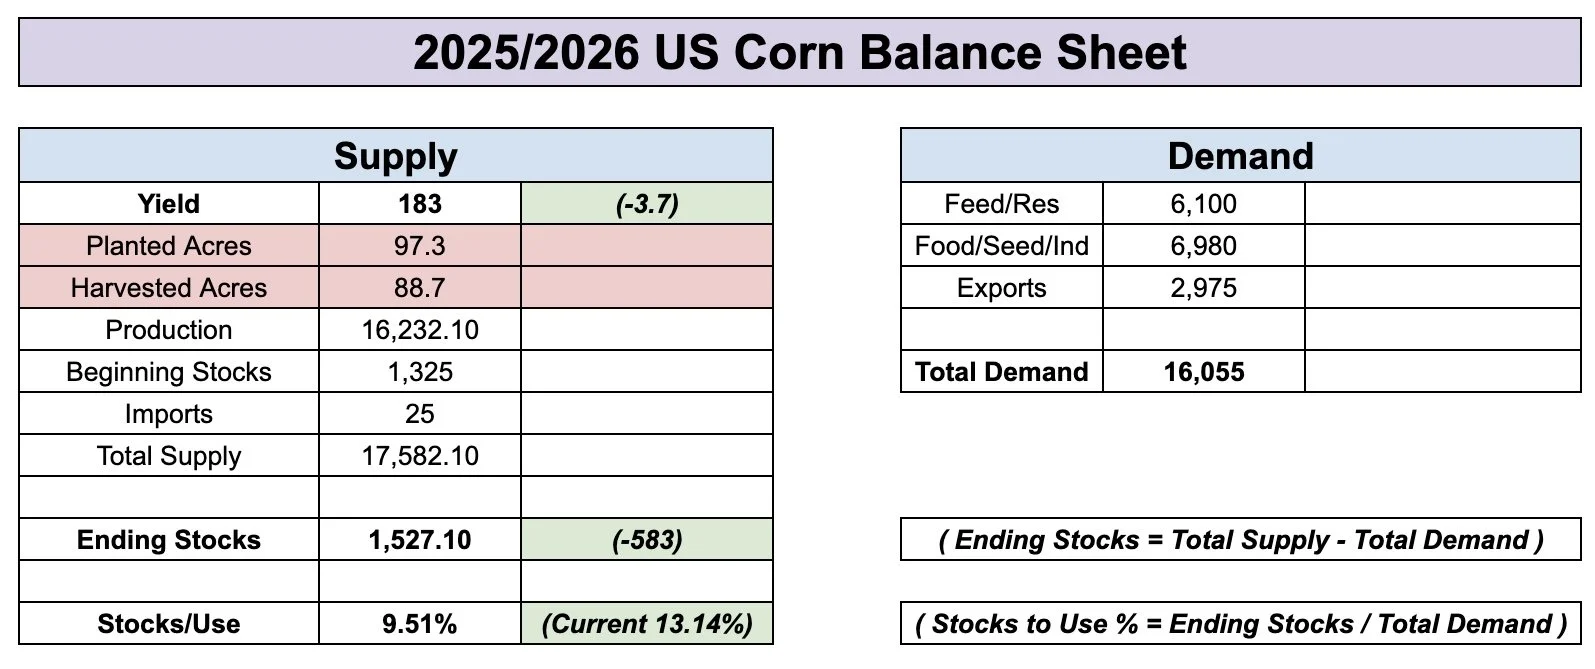
But let's say yield were to come in at 183.
If the USDA would have left acres unchanged at 88.7, a 183 yield would have created a somewhat bullish scenario.
As it would have dropped carryout down to 1.5 billion and dropped our stocks to use ratio below 10%.
183 Yield & 88.7 Harvest Acres
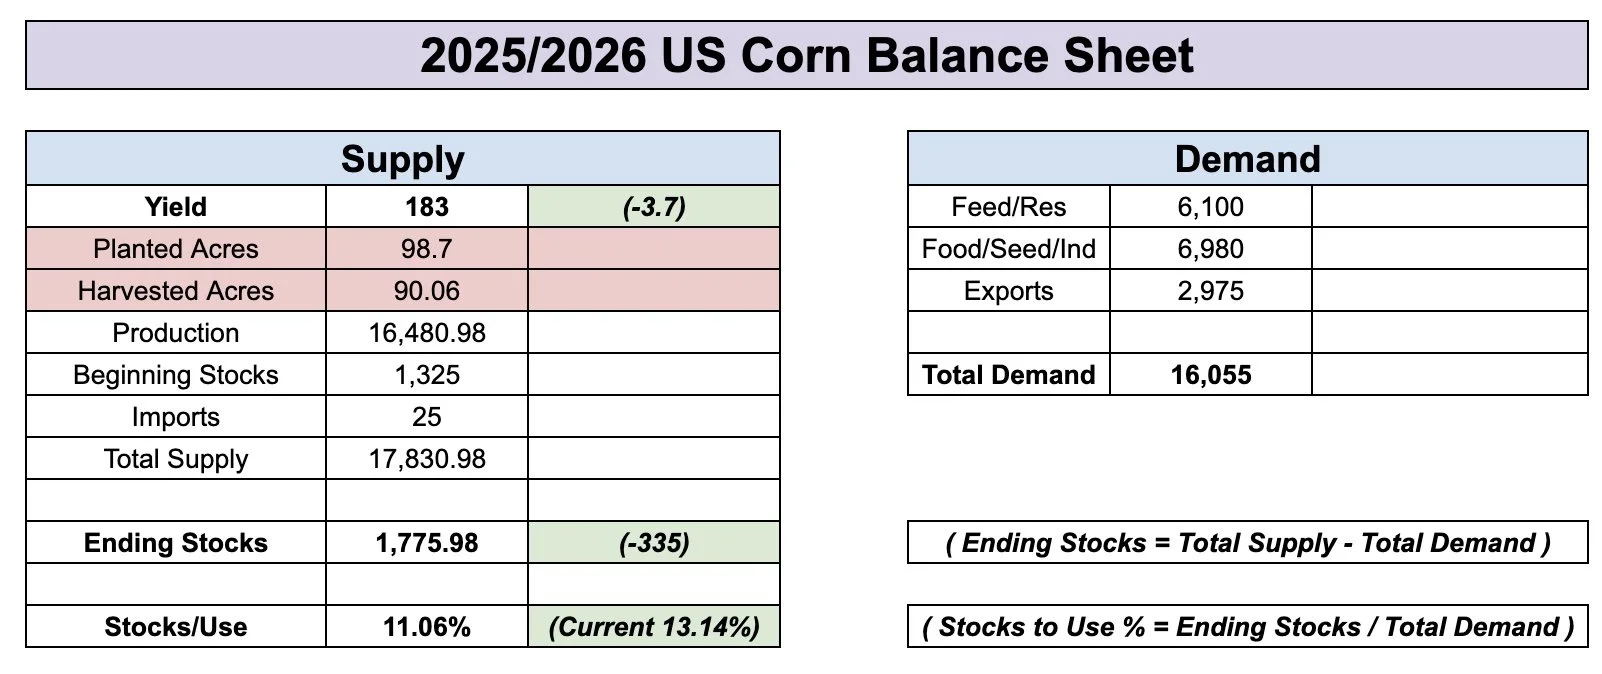
But instead, if we were to now drop yield down to 183 with the 90 million acres, it doesn’t make nearly as bullish of an impact.
Without changing demand, it would result in a near 1.8 billion bushel carryout and a stocks to use ratio of 11%.
Neither of those are extremely bullish scenarios.
183 Yield & 90 Harvest Acres
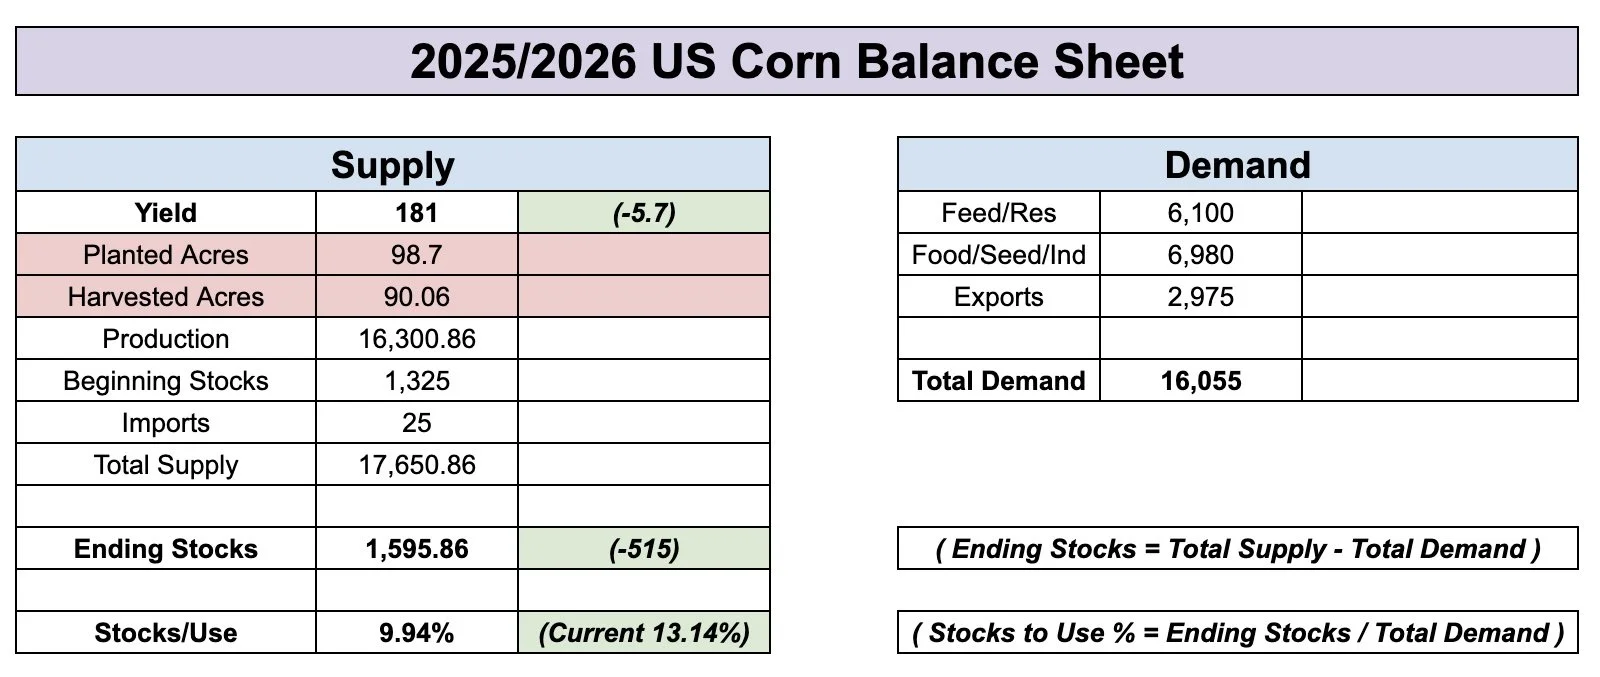
Typically, the rule of thumb is that a stocks to use ratio under 10% is considered decently bullish.
Before this bump in acres on Friday, it would’ve only took a 184 yield to see a stocks to use ratio below 10%.
184 Yield & 88.7 Harvest Acres

With the added acres, it would now take a 181 yield to get a stocks to use ratio below 10%.
So a friendly outcome is still possible, but it now takes that much more of a drop in yield to achieve the same results.
181 Yield & 90 Harvest Acres
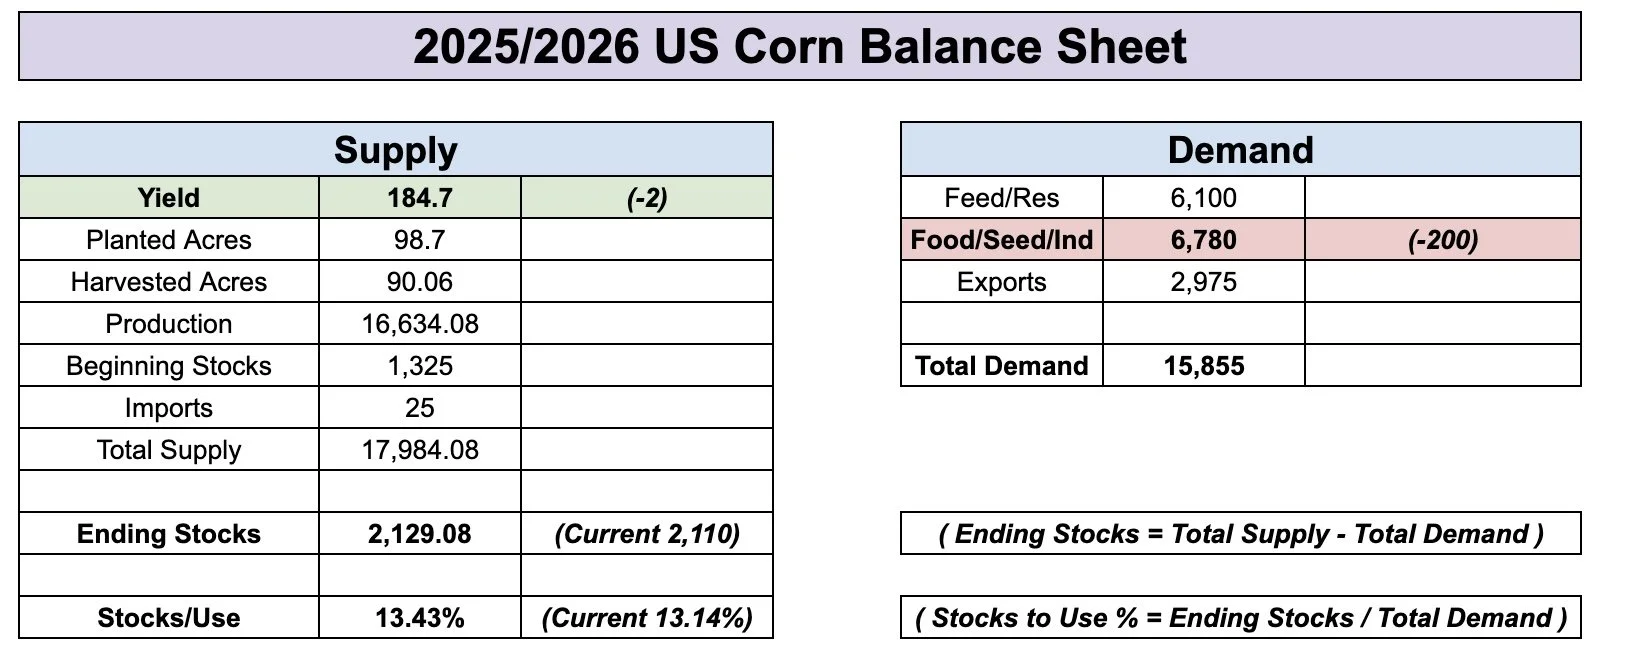
There are several who would argue that our feed & residual demand is too high and needs to be cut by at least 200 million.
What kind of impact would that have?
If we dropped feed by -200 million, it would take a -2 bpa decrease in yield to offset that loss in demand.
In this scenario:
Feed: Cut by -200 million
Yield: Cut by -2 bpa
Result: Carryout essentially unchanged
So the most acres on record really does make it hard to paint a mega bullish situation.
184.7 Yield & -200 Million Feed
Now of course, there is always that scenario where yield just simply isn’t there at all.
Let's say yield is all the way down at 179.
Without changing demand, it would result in a stocks to use ratio below 9%. Which is very bullish.
179 Yield & No Demand Change

Now let's say yield is 179.
But feed demand is also 200 million too high.
That low of yield would still create a decently bullish scenario.
So in reality, it is going to take a decently large cut to yield to see a super bullish situation in corn.
179 Yield & -200 Million Feed

Soybeans
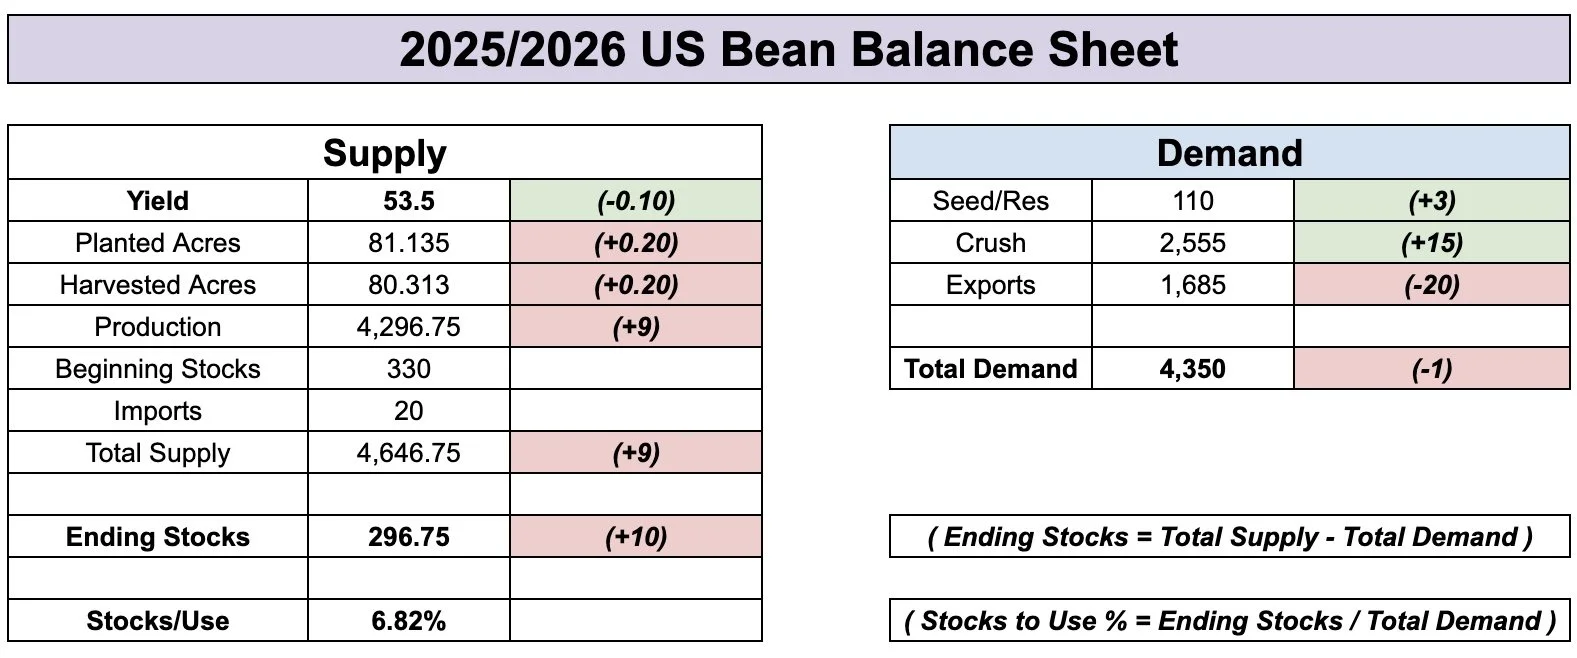
The USDA really did not make any major changes on the soybean balance sheet.
They found an extra 200k acres.
But the yield cut of -0.10 offset most of this change. Resulting in a slight increase to total supply.
At the same time, the USDA did drop soybean exports by -20 million. However they raised crush and seed & residual demand which led to a wash on the demand balance sheet.
The net result was a slight increase to carryout but nothing dramatic.
I don’t think there is any way yield doesn’t get revised lower from here given we just saw one of the driest Augusts on record.
The USDA's export estimates are also probably too high.
The real question is which one is going to outweigh the other?
The loss in supply or the loss in demand?
Exports are going to be the wild card.
Does China come to the table or not?
How does the USDA account for this?
It's really anyone's guess.
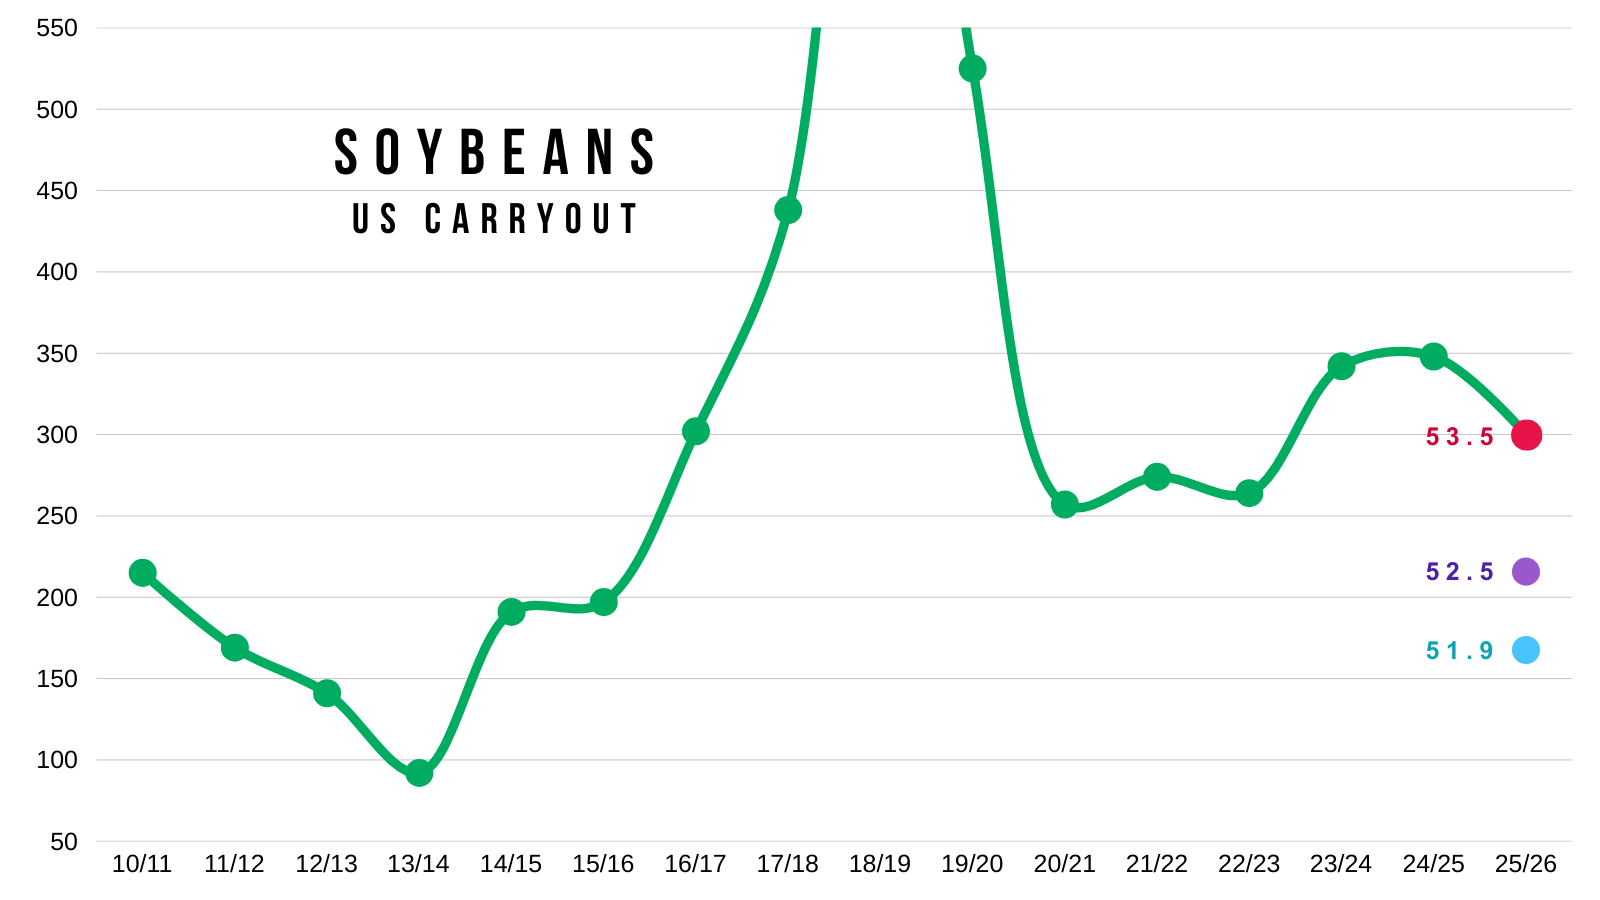
But if we completely ignore demand and only look at the supply side of the balance sheet, it is still razor thin when it comes to room for error.
This does not include demand changes, but if yield came just -1 bpa lower at 52.5 it would potentially put our carryout at it's lowest levels in nearly a decade.
If yield came in at our current 51.9 record from 2016, it would be one of the tightest situations in a long time.
So that is why soybeans have a story. We could see a record yield yet see our tightest carryout in a decade.
Although I am sure we will see exports cut, which will offset some of this. The biggest question is by how much.
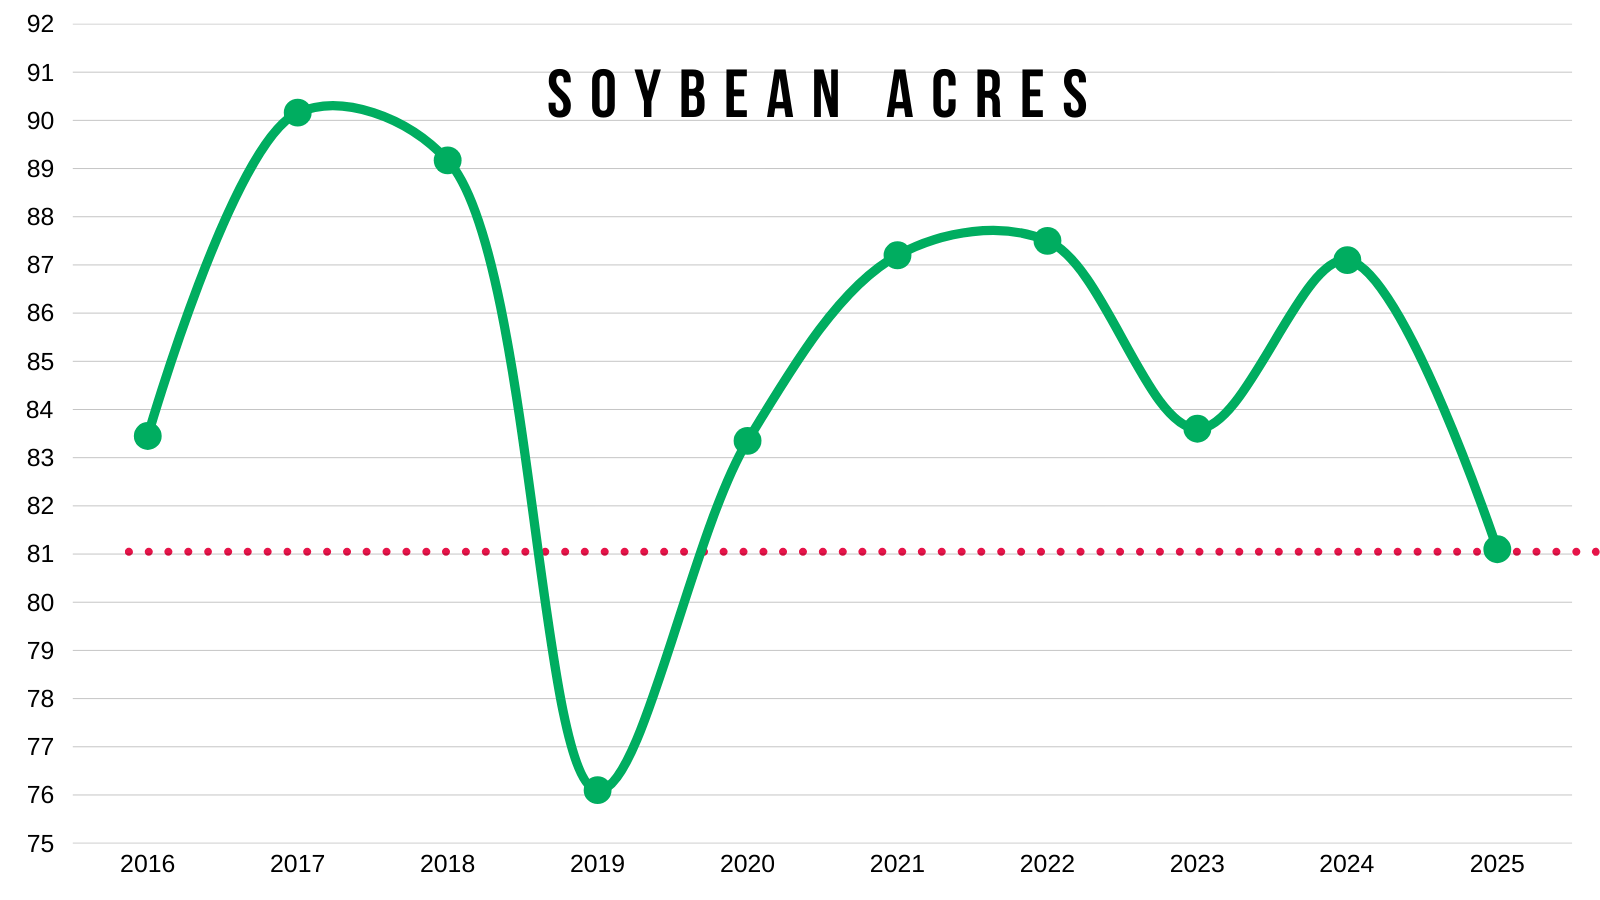
This is pretty much only possible due to having less acres this year.
Acres are still the 2nd lowest in at least a decade.
Only trailing behind 2019.
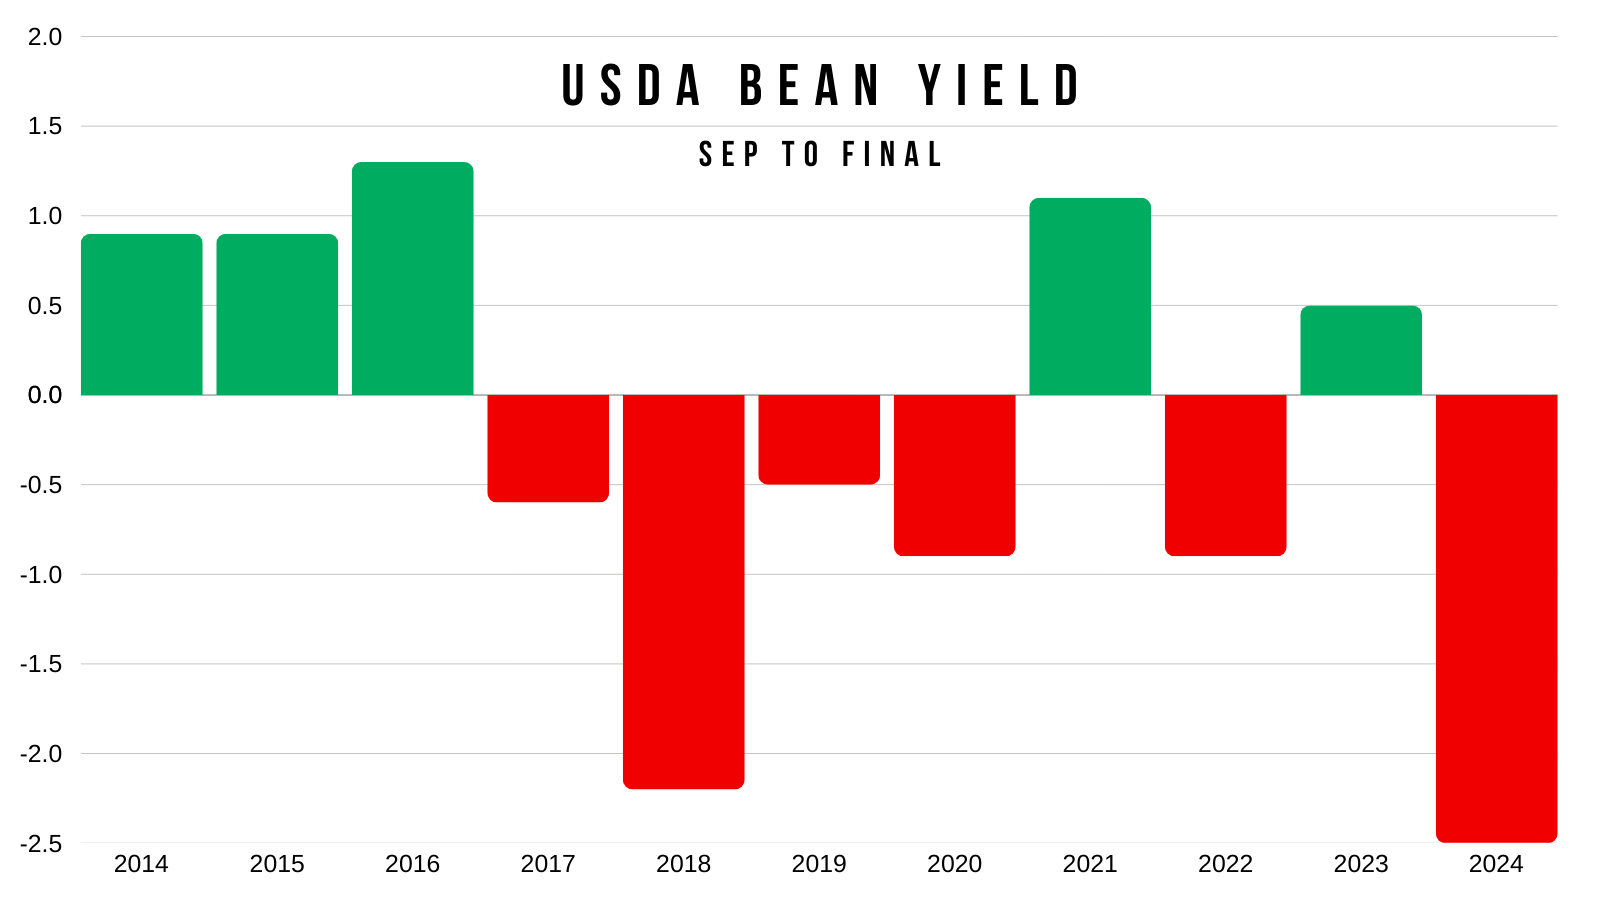
Sep vs Final Yield
Corn
It's actually about 50/50 the past decade whether we see an increase or a decrease in yield from Sep to final.
However, the last 3 of 4 changes lower were by more than -4 bpa.
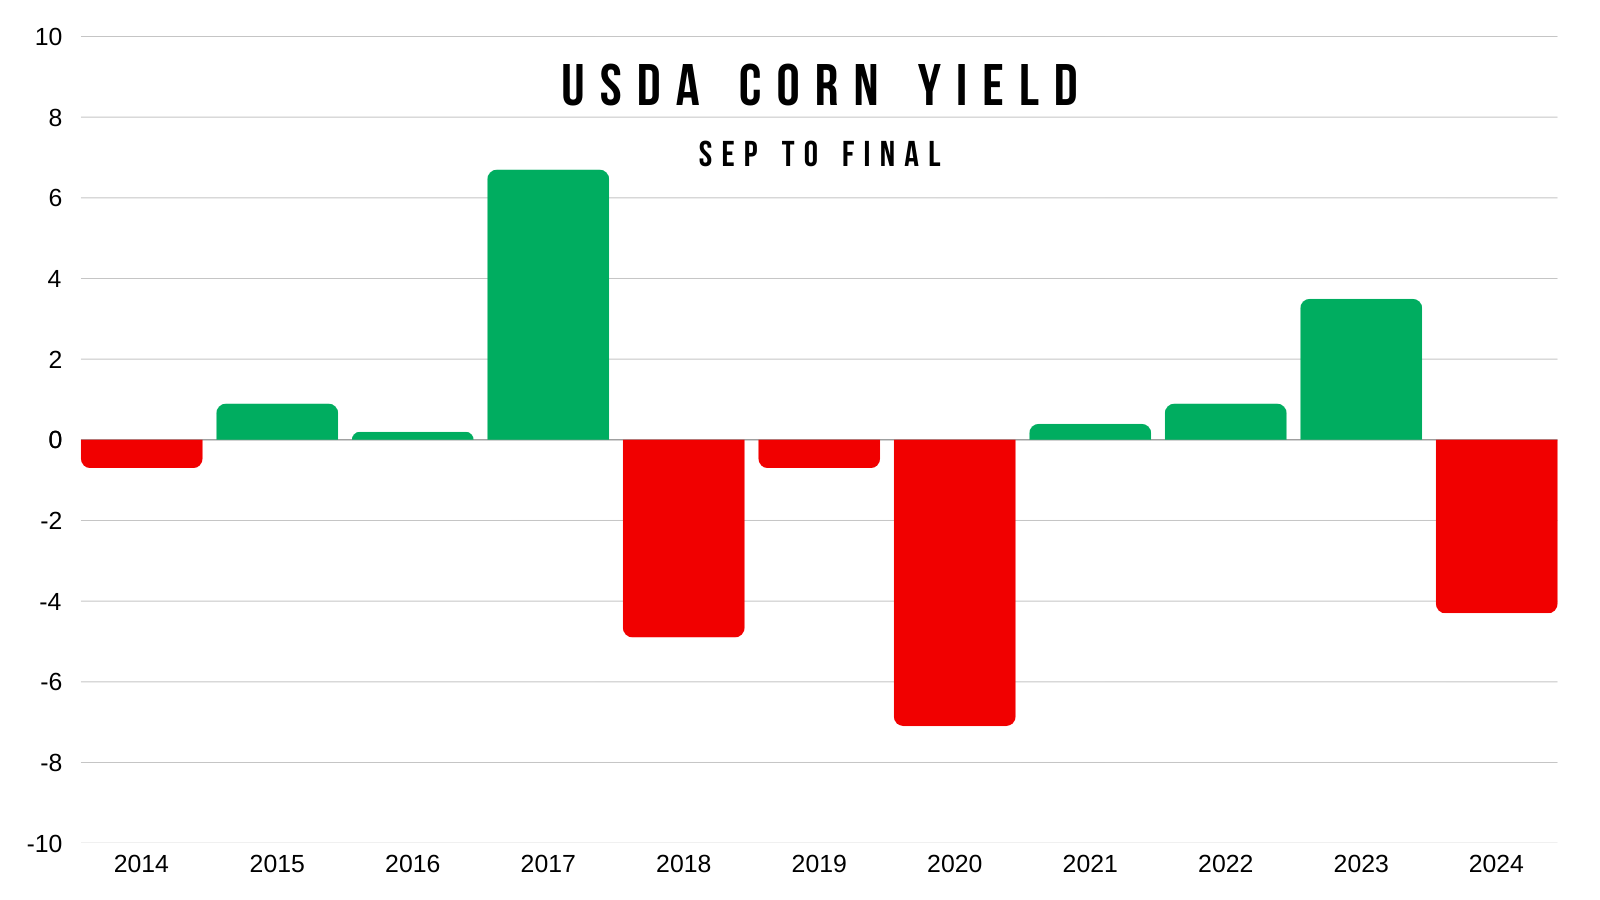
Soybeans
Soybeans have a more clear trend of dropping from Sep to final.
As yield has dropped 6 of the last 8 years.
Last year was the biggest of the decade at nearly -2.5 bpa.
Today's Main Takeaways
Corn
Altough corn has a harder path to a substantially tight balance sheet given the increase in acres.
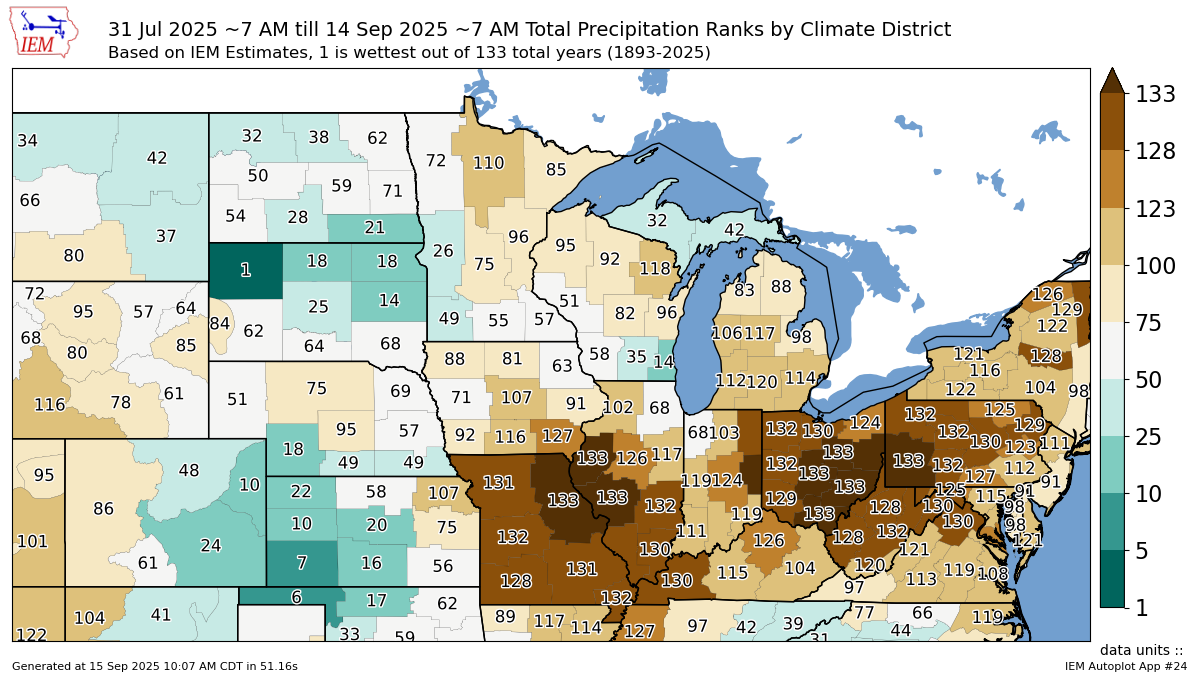
You have to imagine yield is getting smaller, perhaps even drastically smaller.
Here is the precip rankings from August 1st until today.
This doesn’t scream yield is 7 bushels an acre higher than anything we've seen before.
Here is data from the NOAA that actually weighs primary corn & soybean growing areas precipitation for August.
It was the driest since 2013.

I am not $5.00 corn bullish here yet by any stretch of the imagination.
However, I still think we've seen our lows for the year.
We've already priced in the biggest yield we are going to see.
The trade and the funds are very aware that yield is getting smaller, not larger.
Seasonally we carve out lows exactly where we just did.
Our lows this year were marked on the exact day the USDA printed a 189 yield.
Here is a March corn seasonal that aligns nicely with my thoughts on how this market could play out.
Red = 5 Year Seasonal
Green = 10 Year Seasonal
Both say we top around October 1st. Right in time for insurance pricing.
Both then suggest we go sideways to slightly lower into the end of the year, but do not revist those harvest lows.
Before heading higher into the new year when the USDA probably comes clean about where yield is at.

Technicals:
We saw a big sell off today but no damage was done on the charts.
Since we rallied big on Friday, today's candle was a complete inside day.
We didn’t take out Friday's highs or lows.
Which ever we take out first will decide our short term momentum.
Regardless, the chart looks pretty solid here.
First off, we broke out of a bullish pennant pattern.
Secondly, we finally broke this simple downward trend that had marked several highs since all the way back in April.
Momentum looks like it has shifted higher.
Now what?
I am eyeing $4.35 to de-risk.
That gives back 50% of our February highs.
It is also old key support from back in spring.
I will be alerting a sell signal & hedge alert if this hits.

Soybeans
Soybeans have a battle.
Will the loss in supply offset the loss in demand?
You have to wonder if the demand problem in soybeans could get corrected by a supply problem.
That is how tight the balance sheet is on the supply side.
August is the make or break month for beans.
I can’t imagine the driest August on record doesn’t result in lower yields.
If yield slips and export demand is fine, soybeans have an incredible amount of upside.
But export demand and China is going to be the wild card.
We are quickly approaching that time frame where we are going to need China to start buying our soybeans.

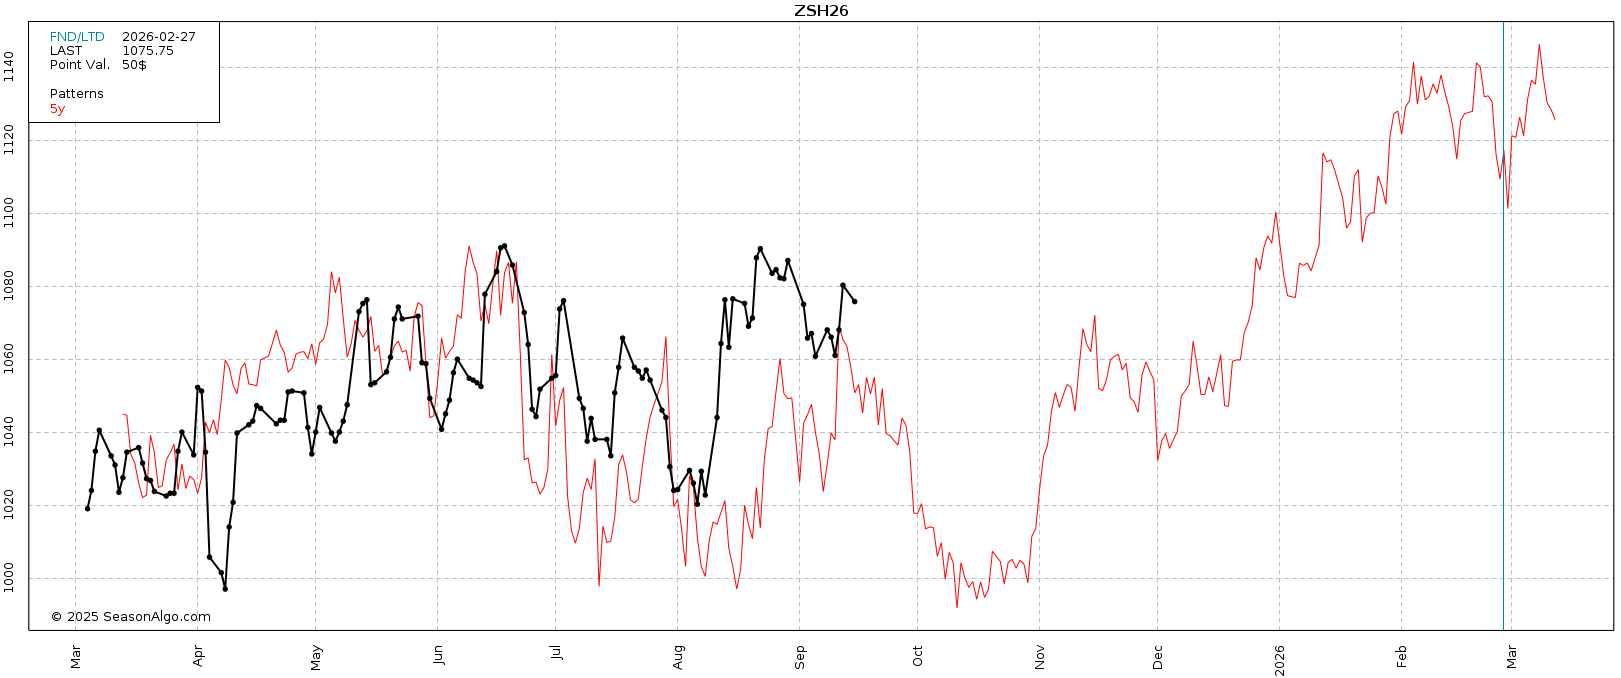
Here is a 5 year seasonal for March beans.
Typically we do start to struggle here pretty soon before finding a bottom in October.
We then typically head higher into the end of the year off the back of South America production uncertainty.
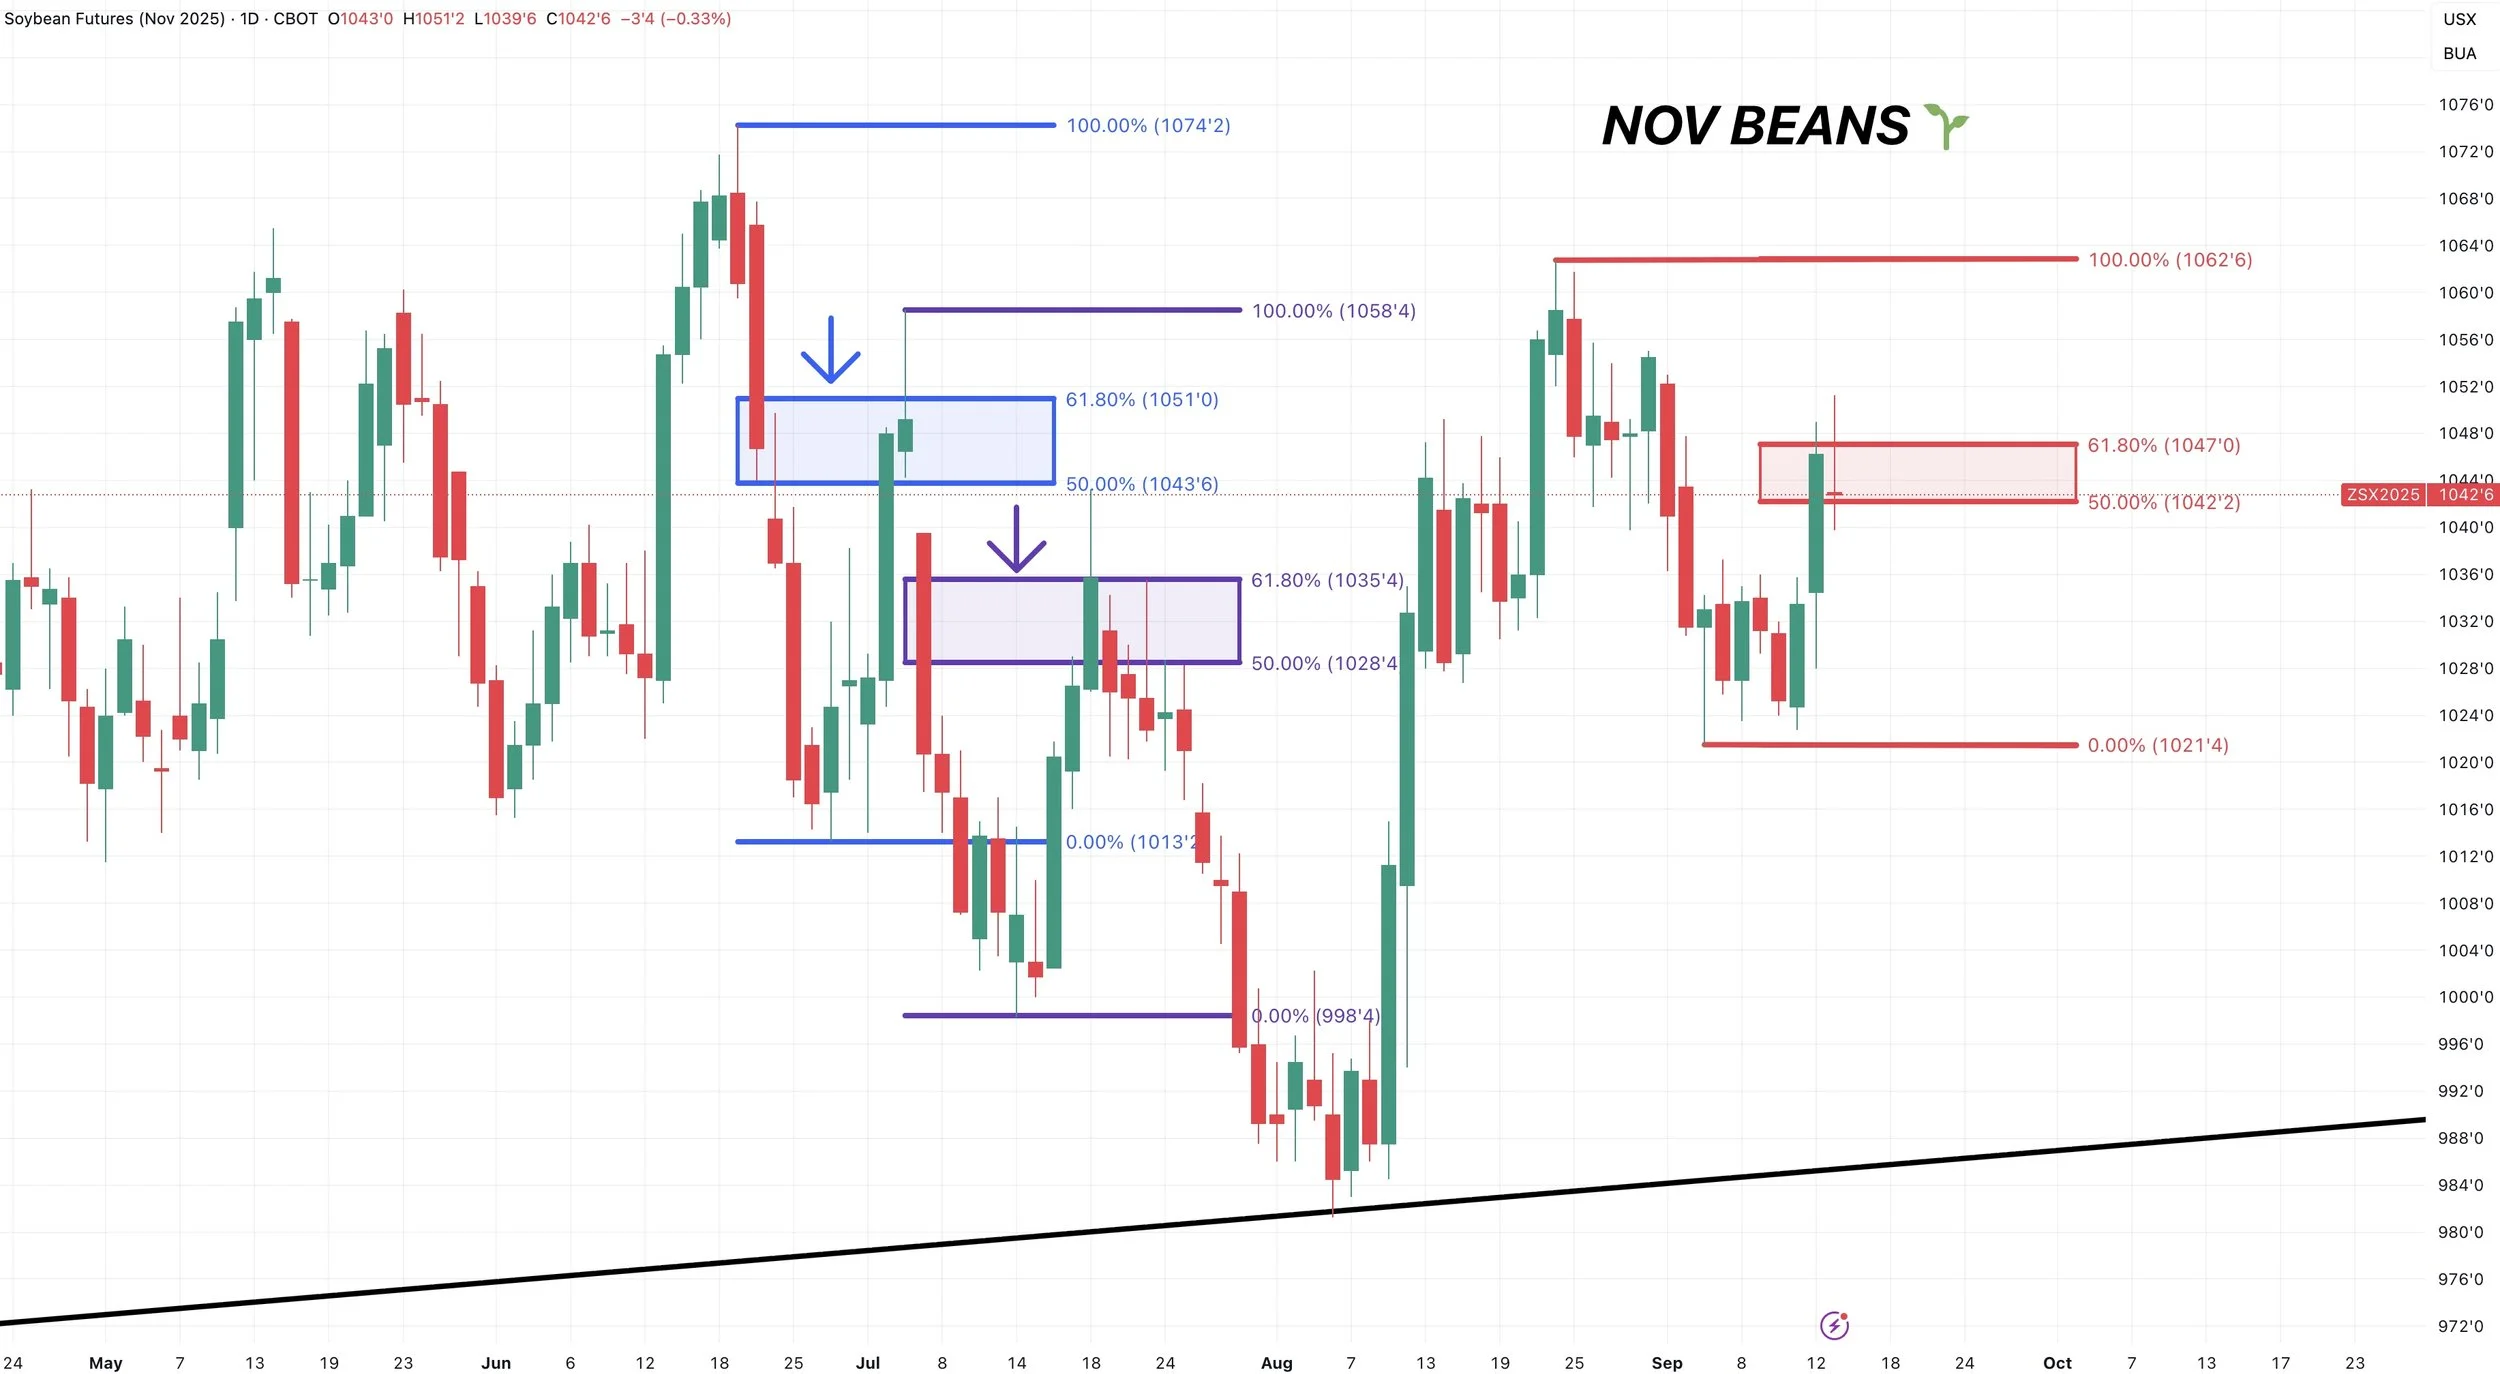
Daily Nov Chart:
Nov soybeans are rejecting right off the 61.8% retracement up to those recent highs.
This is a major spot and decision point in the market.
If we break above, it tells us this bounce has room to run and is no longer viewed as a correctional bounce. It would suggest our lows are in and we are headed higher.
If we fail here, it is still possible that we could go and post new lows.
The line in the sand to remain bullish is that blue box. Which we bounced off of perfectly near the recent lows.

Here is a chart that shows how powerful the 61.8% level tends to be.
I outlined the last two correctional bounces following those June highs.
Both of them rejected at the 61.8% level before heading lower.
That is why this level is so key.
Since we alerted a sell signal at those recent highs, our next target to de-risk is still going to be $10.82
As $10.82 gives back 50% of the May 2024 highs.
If you did not follow our sell signal at Target #1, then by all means de-risk if that first target hits again.

Wheat
Wheat continues to struggle near contract lows.
There isn’t one definitive catalyst saying "wheat has to go higher".
But I do still think wheat will eventually find some life down at these levels.
For starters, seasonally this is a bullish time period.
Wheat has traded higher from Sep 1st to Oct 1st the past 8 of 10 years.
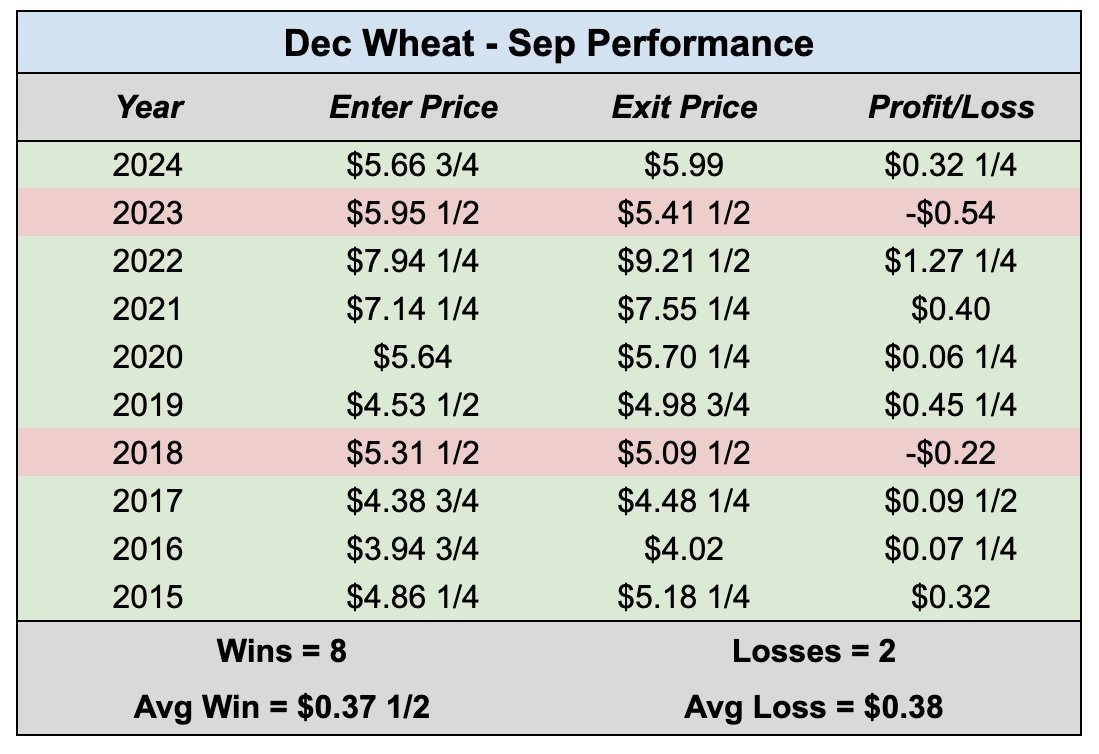
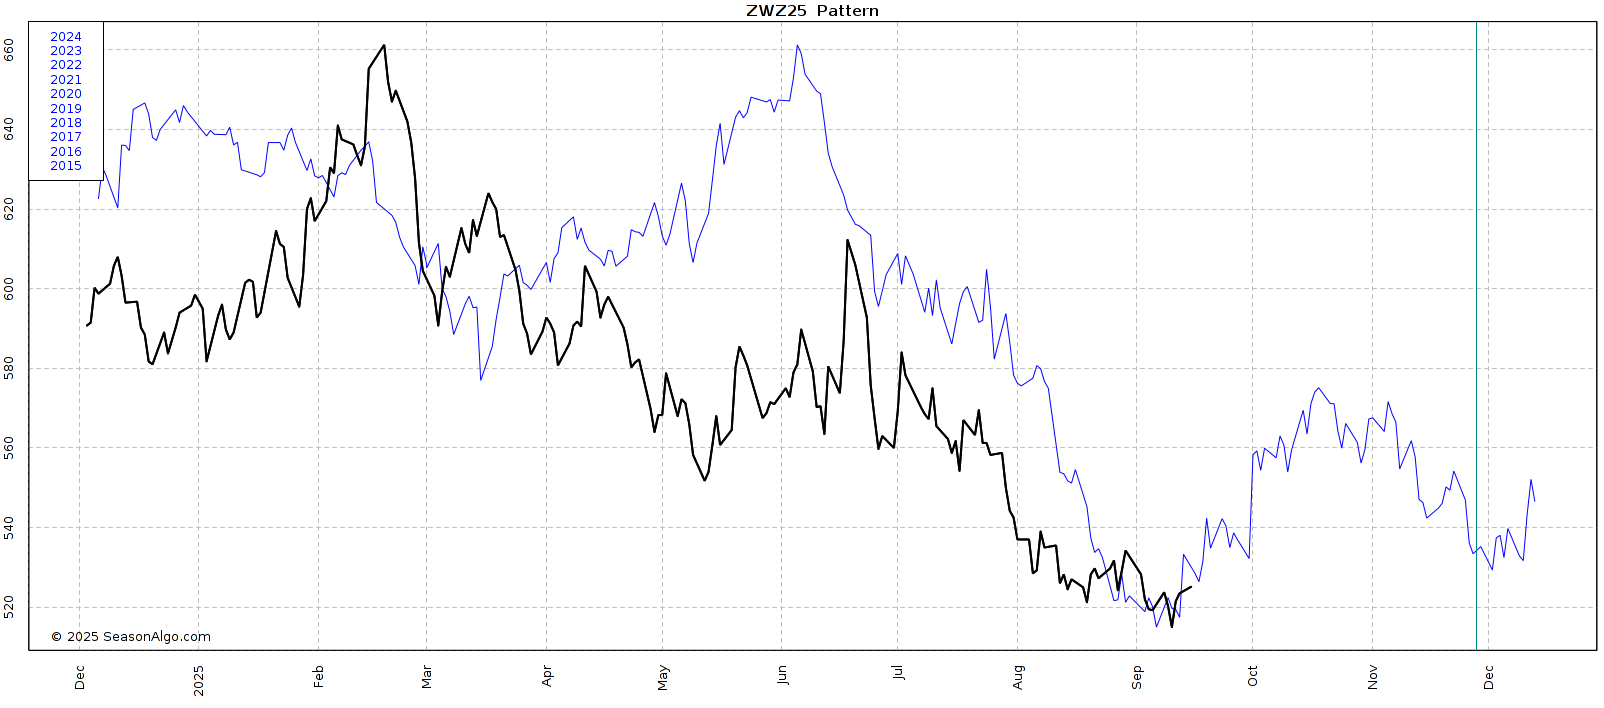
Here is a 10 year seasonal for Dec wheat.
Typically we find a bottom right about now.
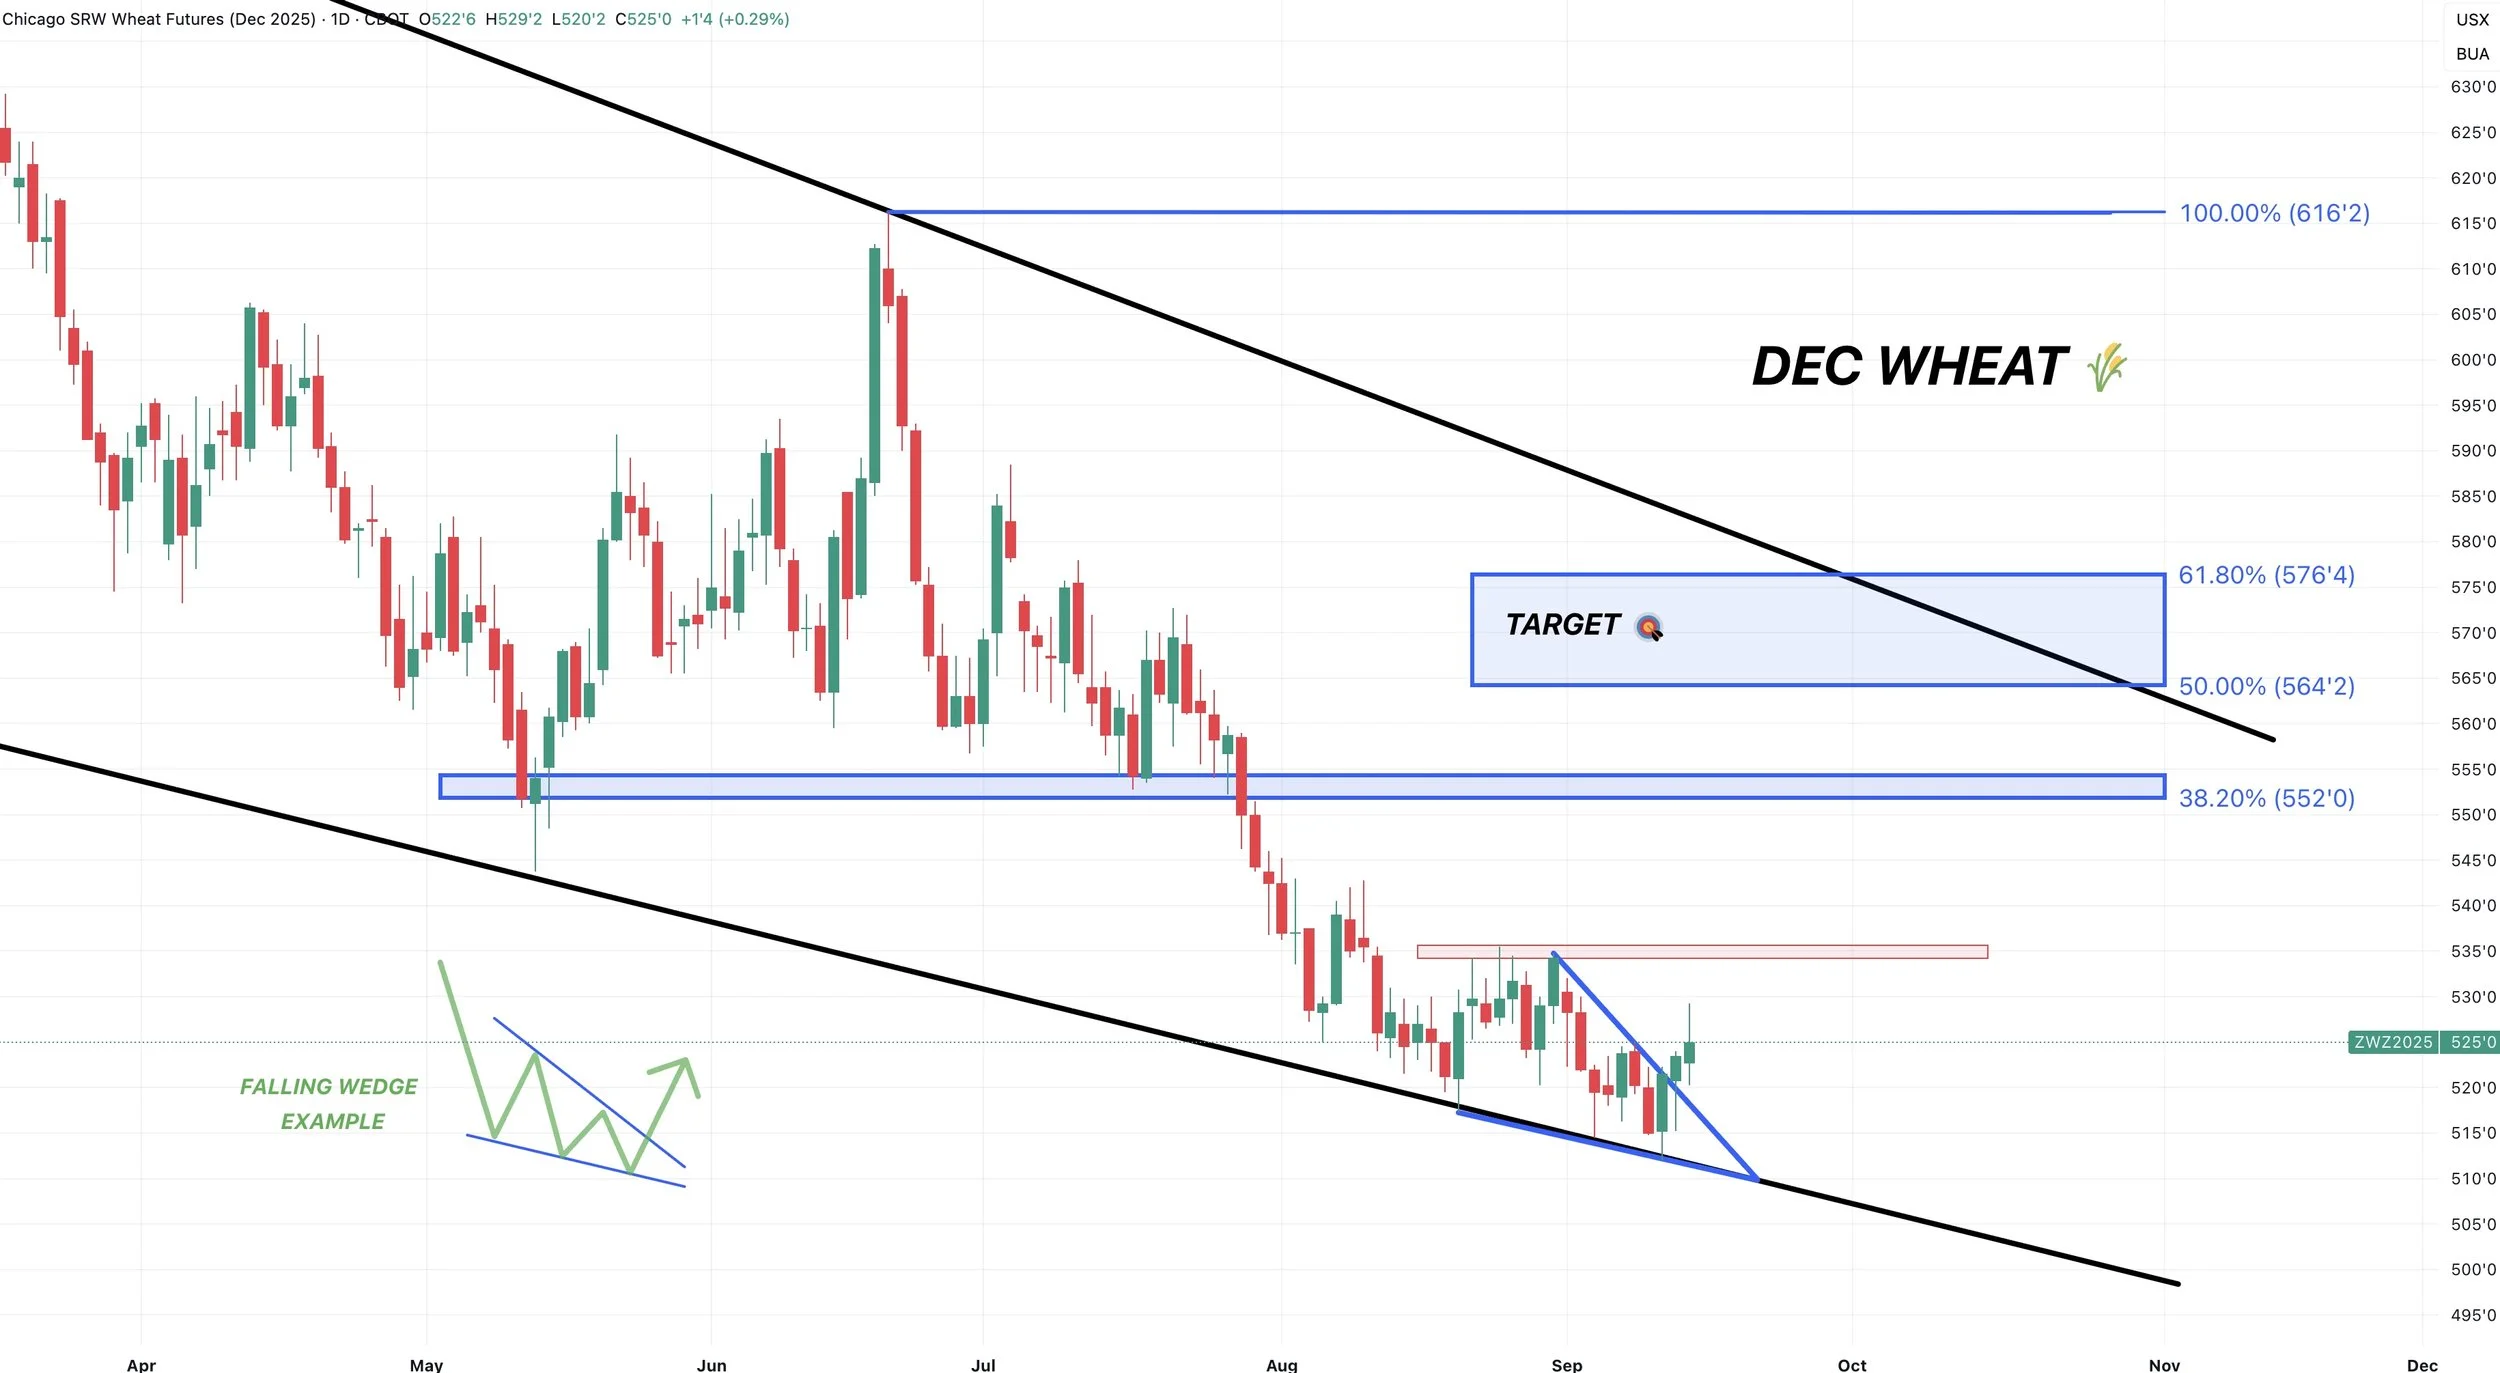
Daily Chicago:
The charts are the biggest reason my bias leans higher here for the wheat market.
We have a falling wedge pattern that we are breaking out of.
If we clear $5.35 that would be our green light telling us this market is ready to move higher.
I think that should ignite a move to $5.52 before finding major resistance.
That is 38.2% of the June highs and old support.
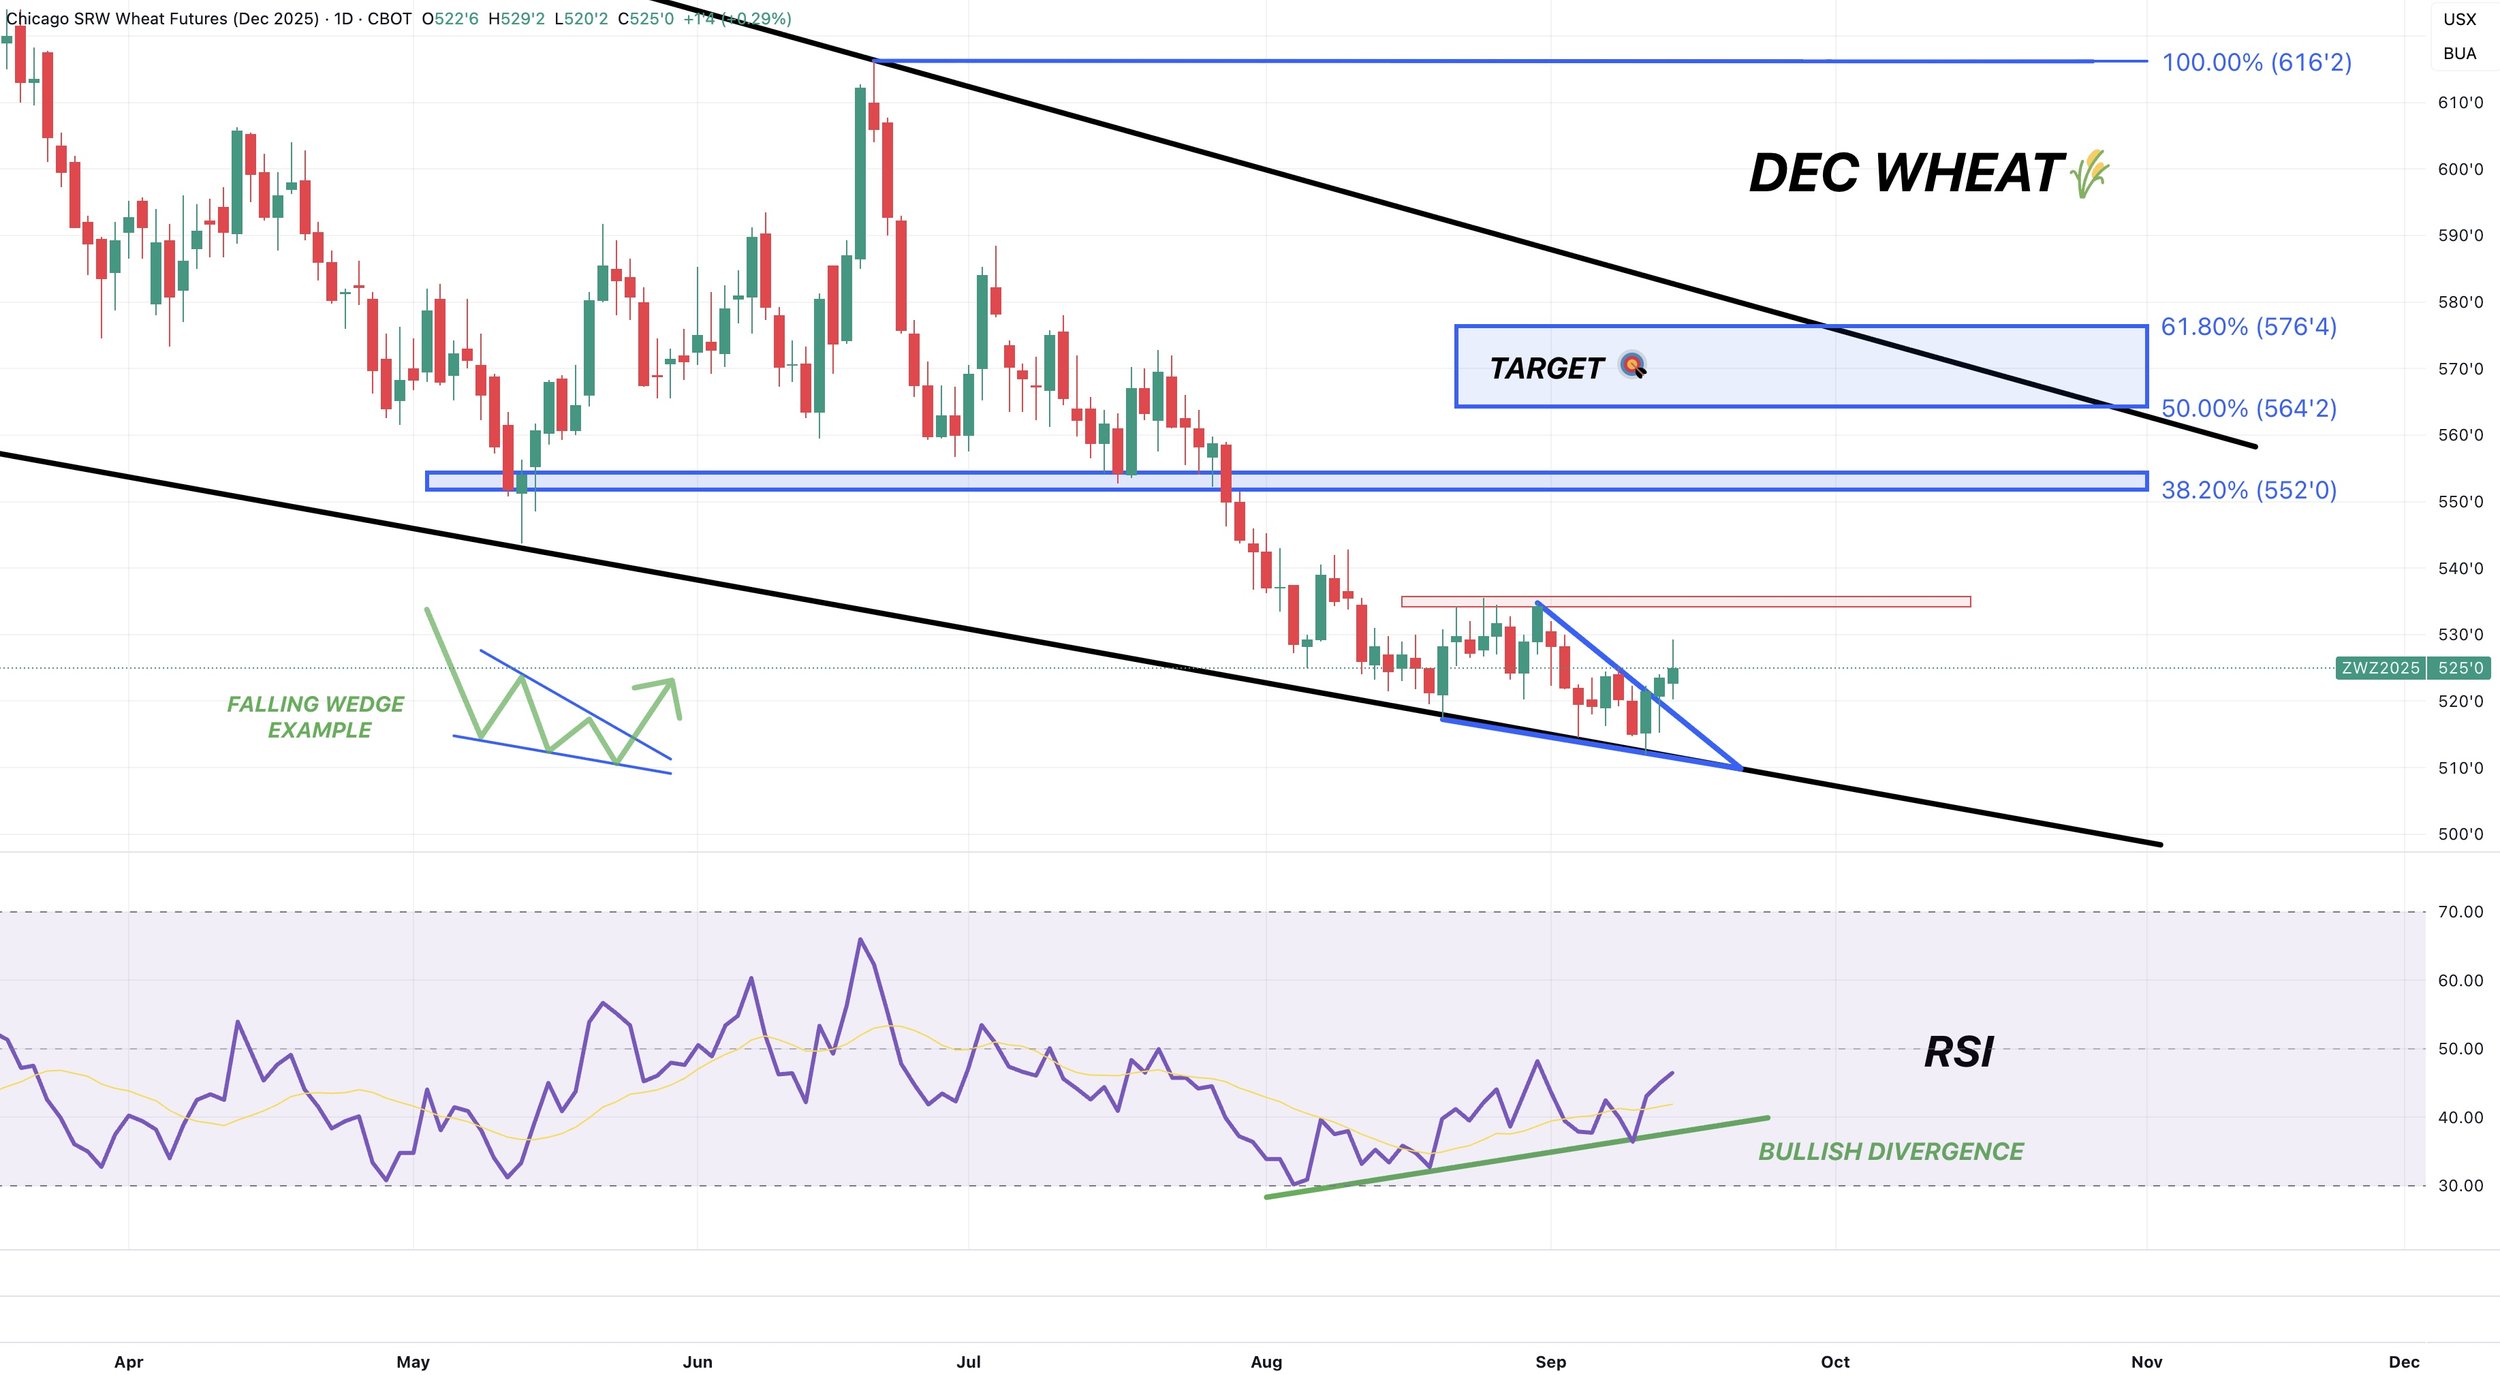
We are also showing some massive bullish divergence.
Prices continue to trickle lower, yet the RSI is not.
This tells us that downside momentum is getting weak.
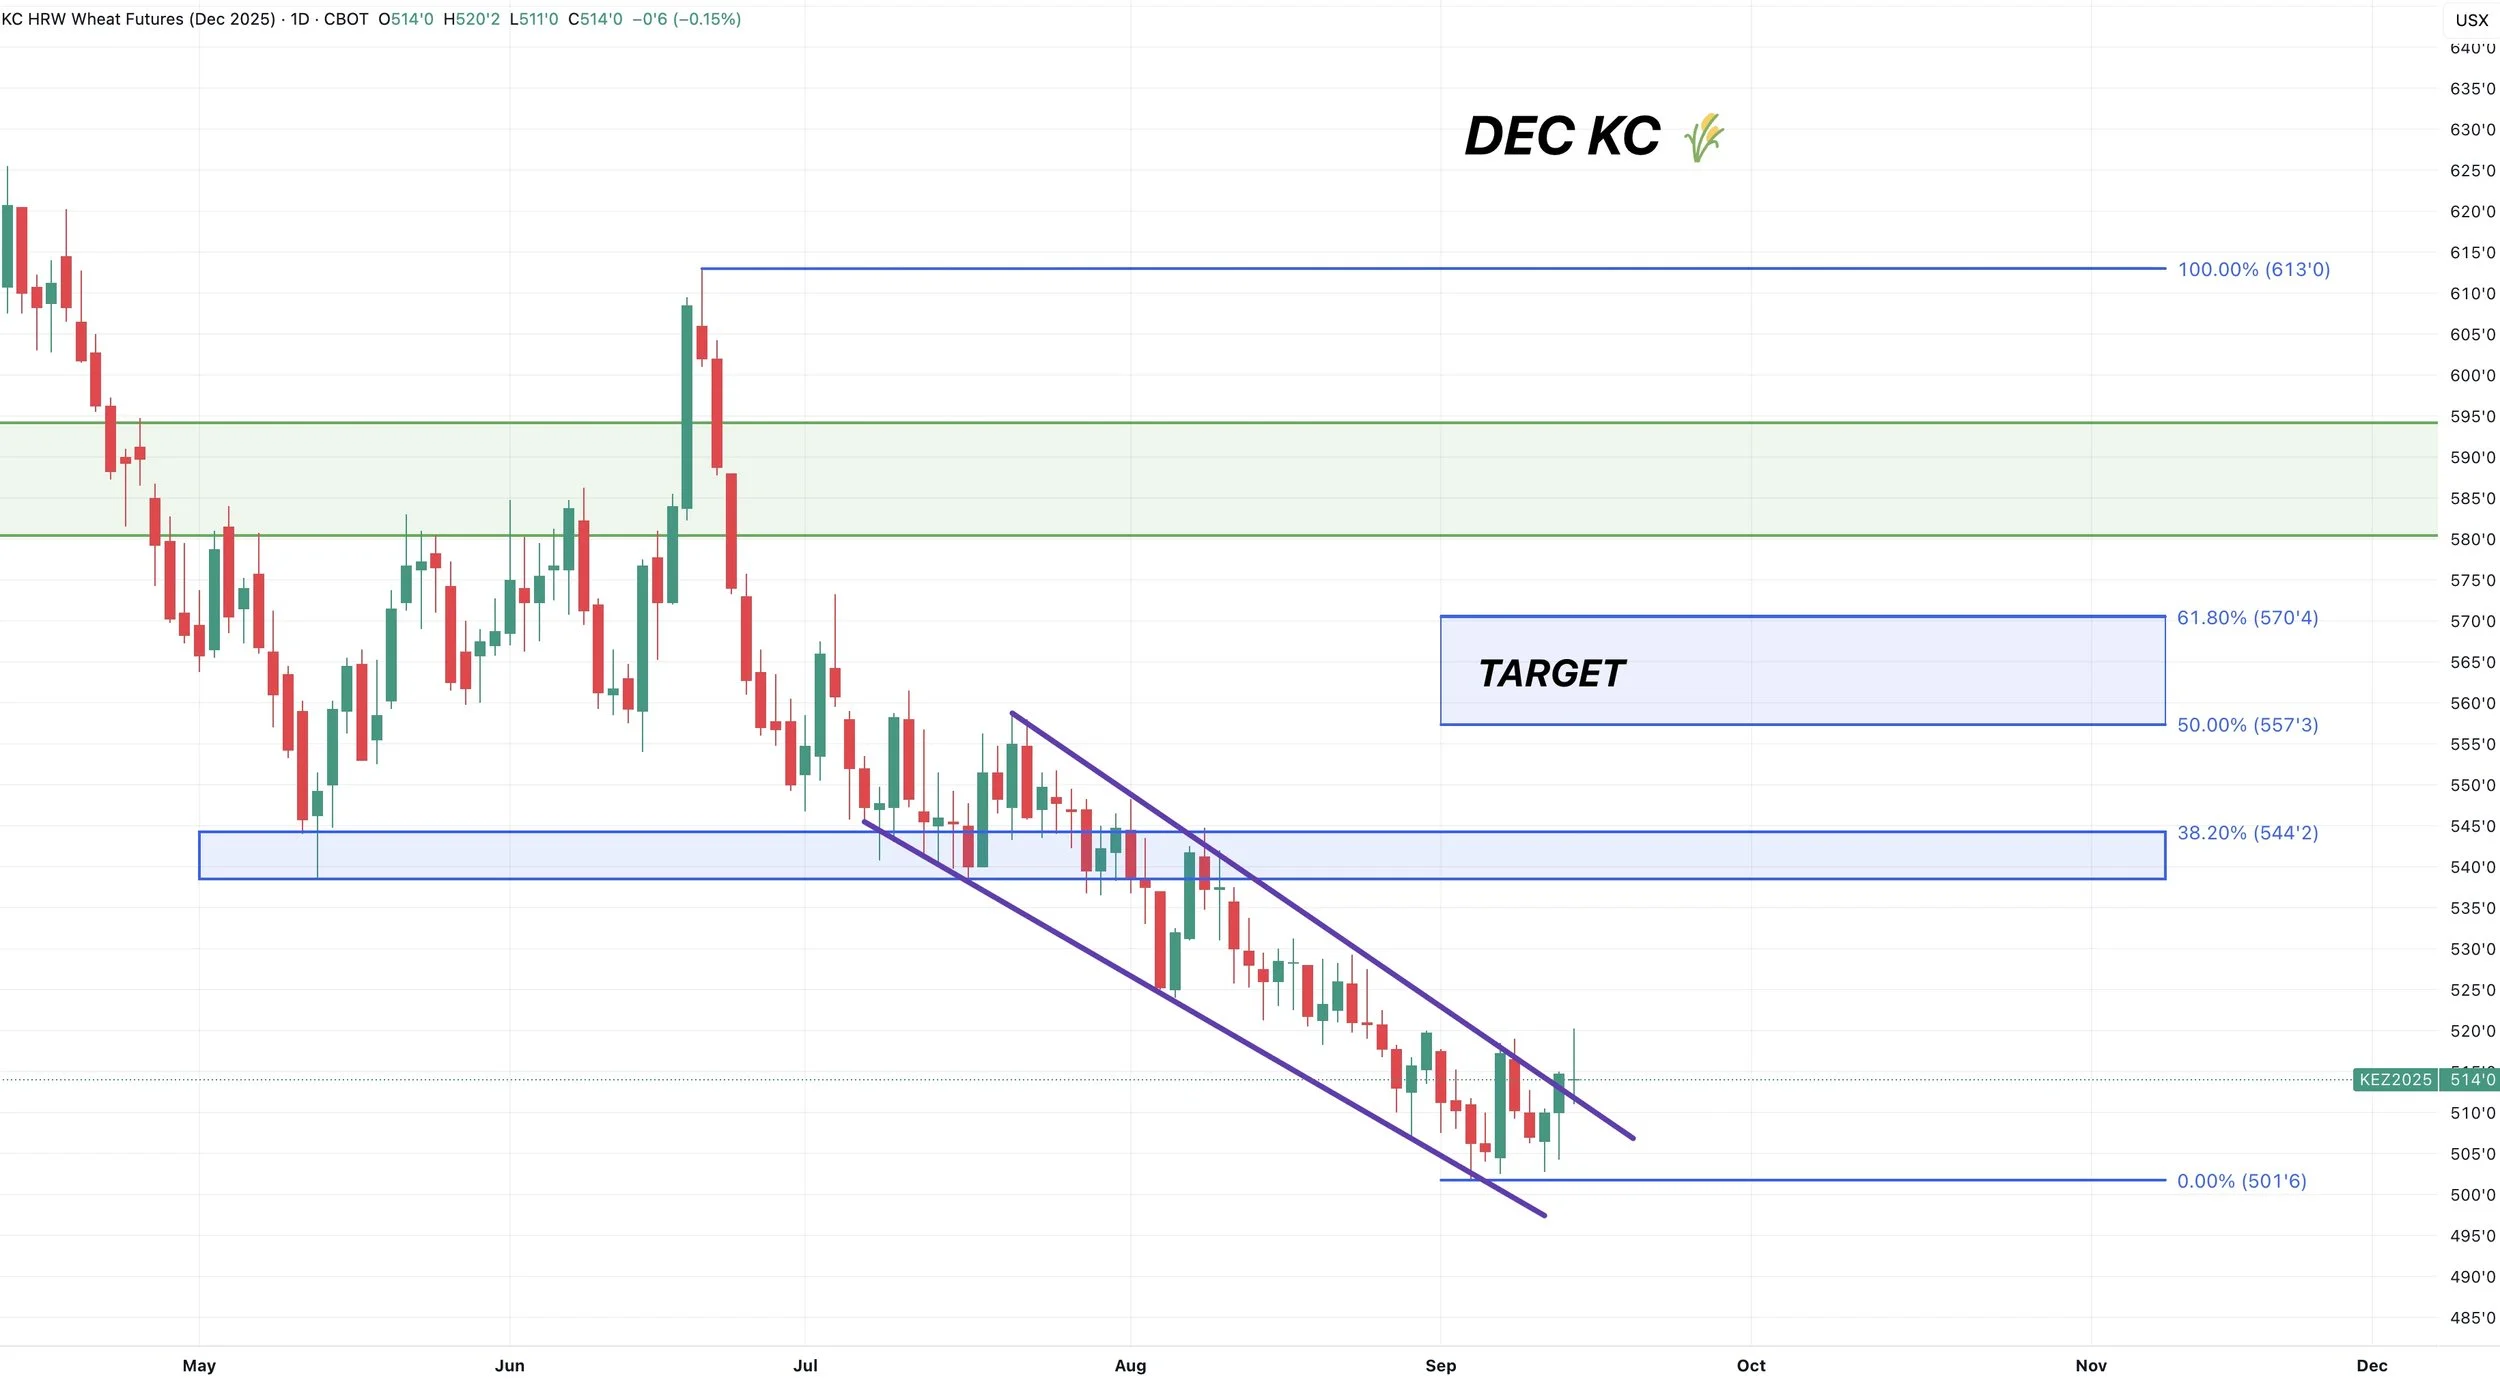
Daily KC Wheat:
KC potentially trying to break out of this downward channel.
First real resistance comes in at the $5.40 range if we get the breakout.
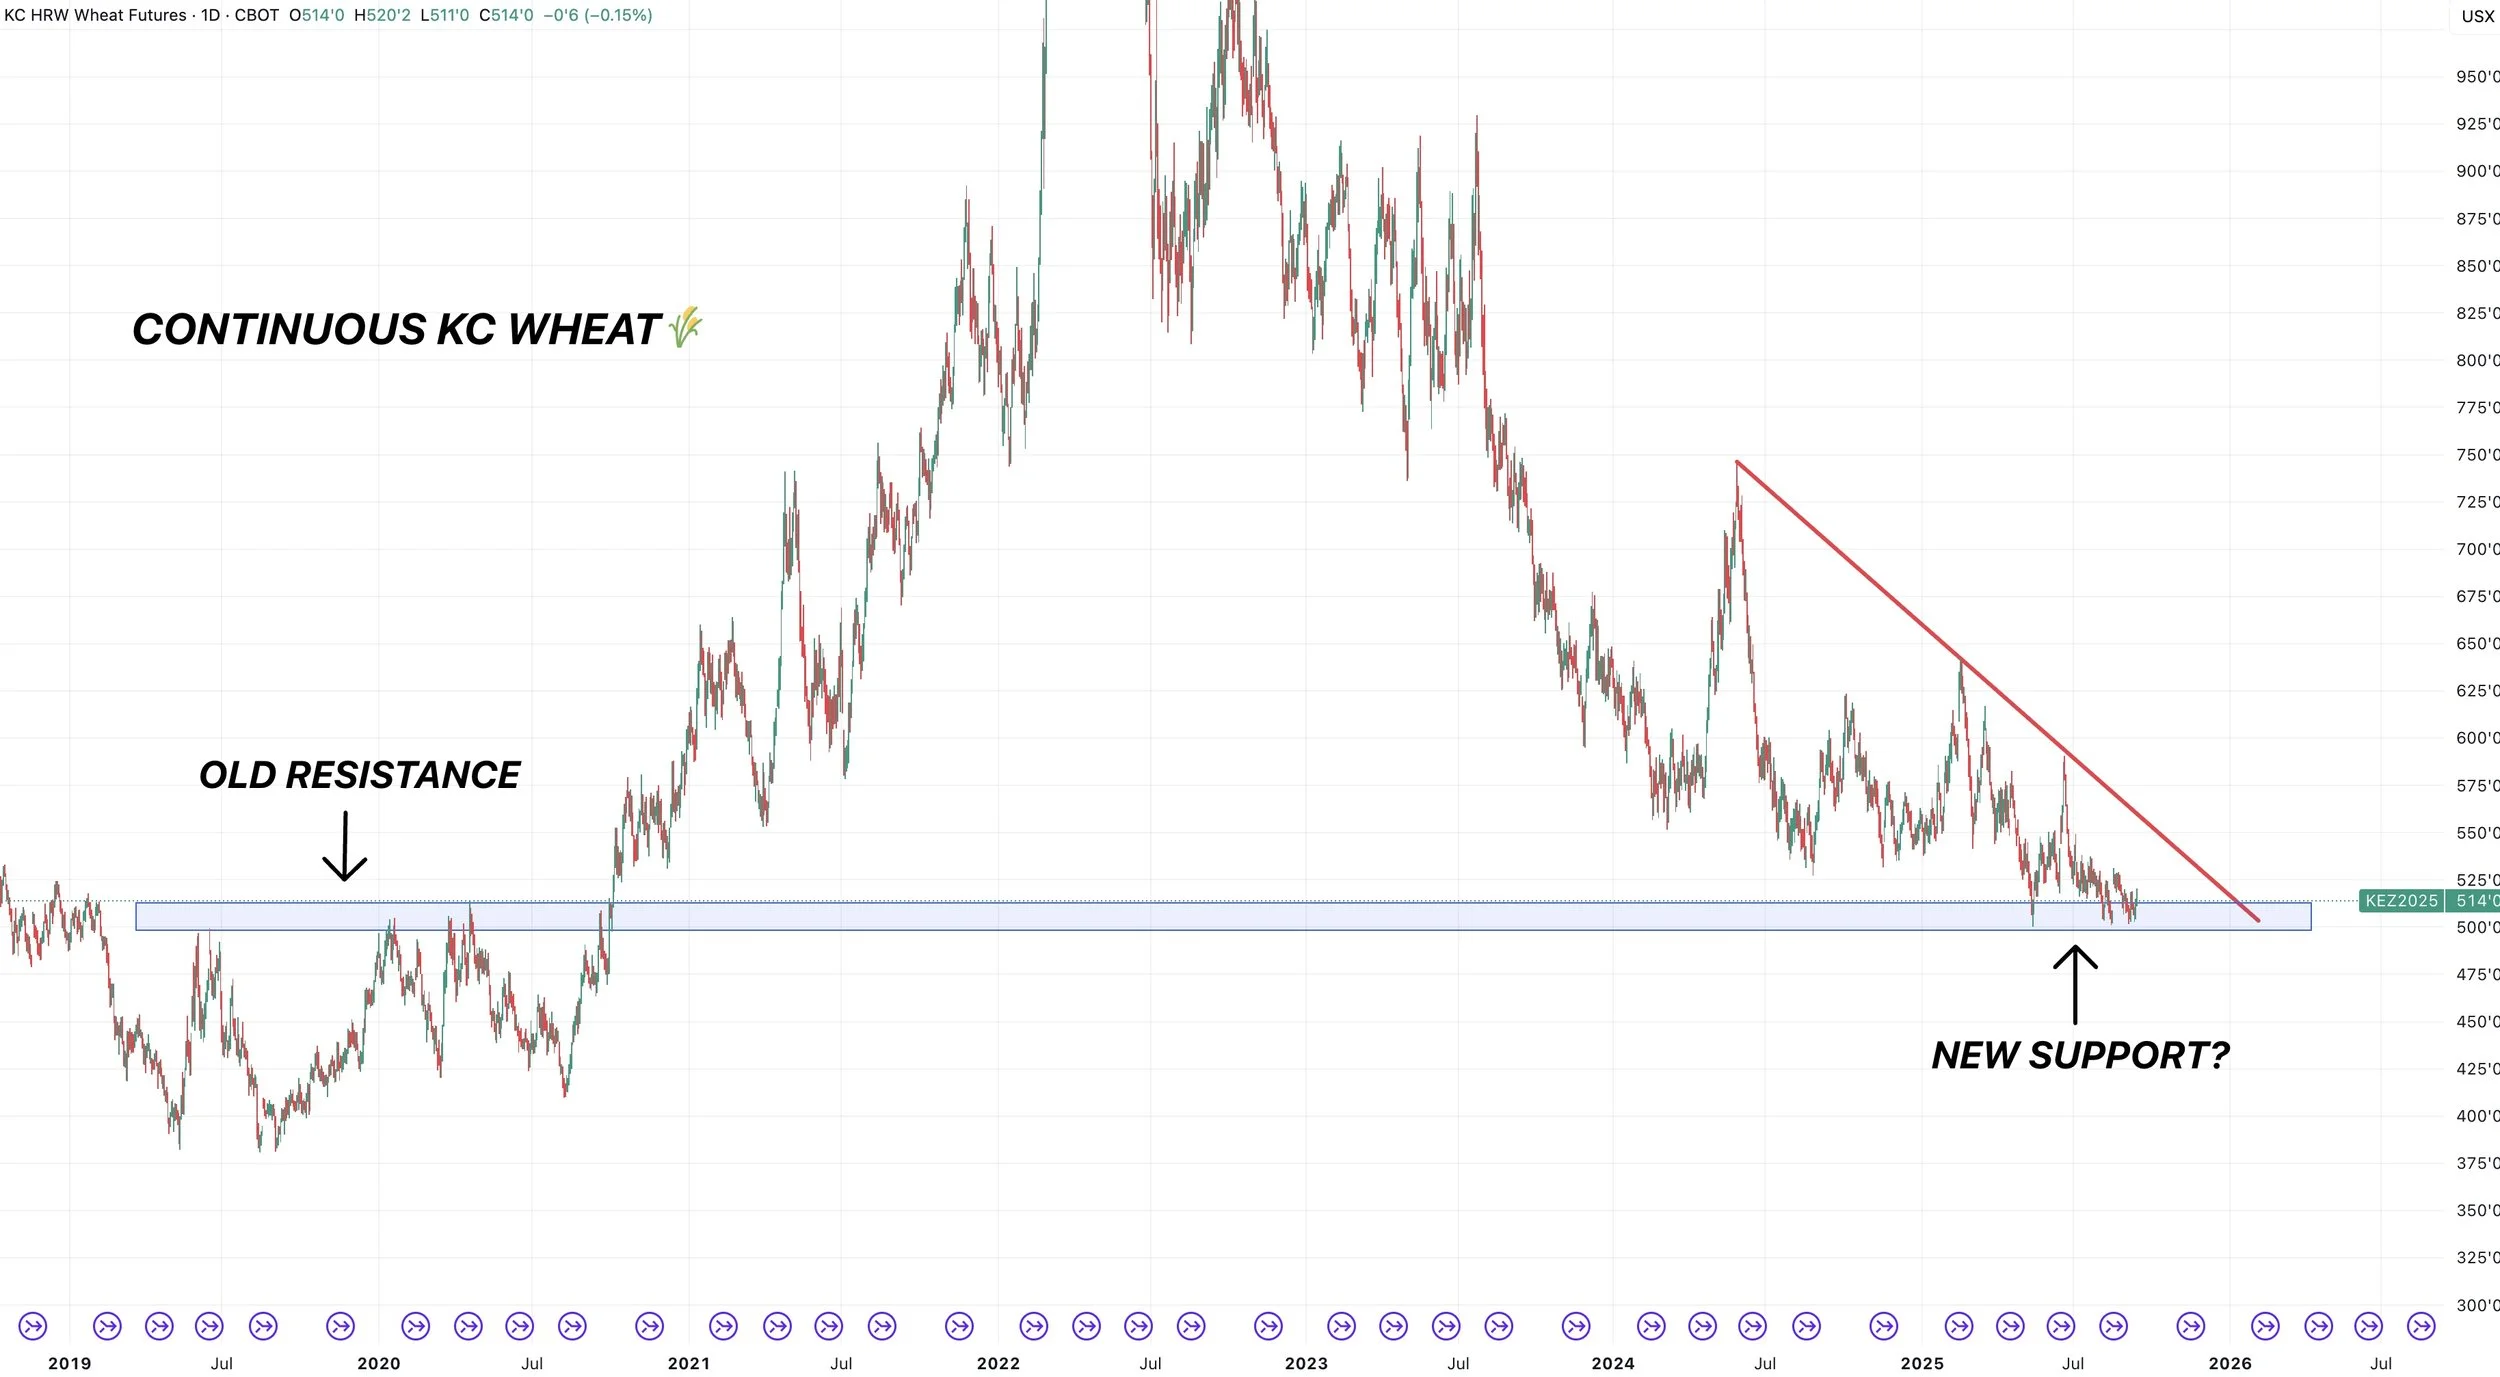
Here is a continuous chart for KC wheat.
This makes me hopeful that these levels will be long term lows.
We are finding support right where we found resistance back in 2019 and 2020.
A classic case of old resistance turning into new support.
Cattle
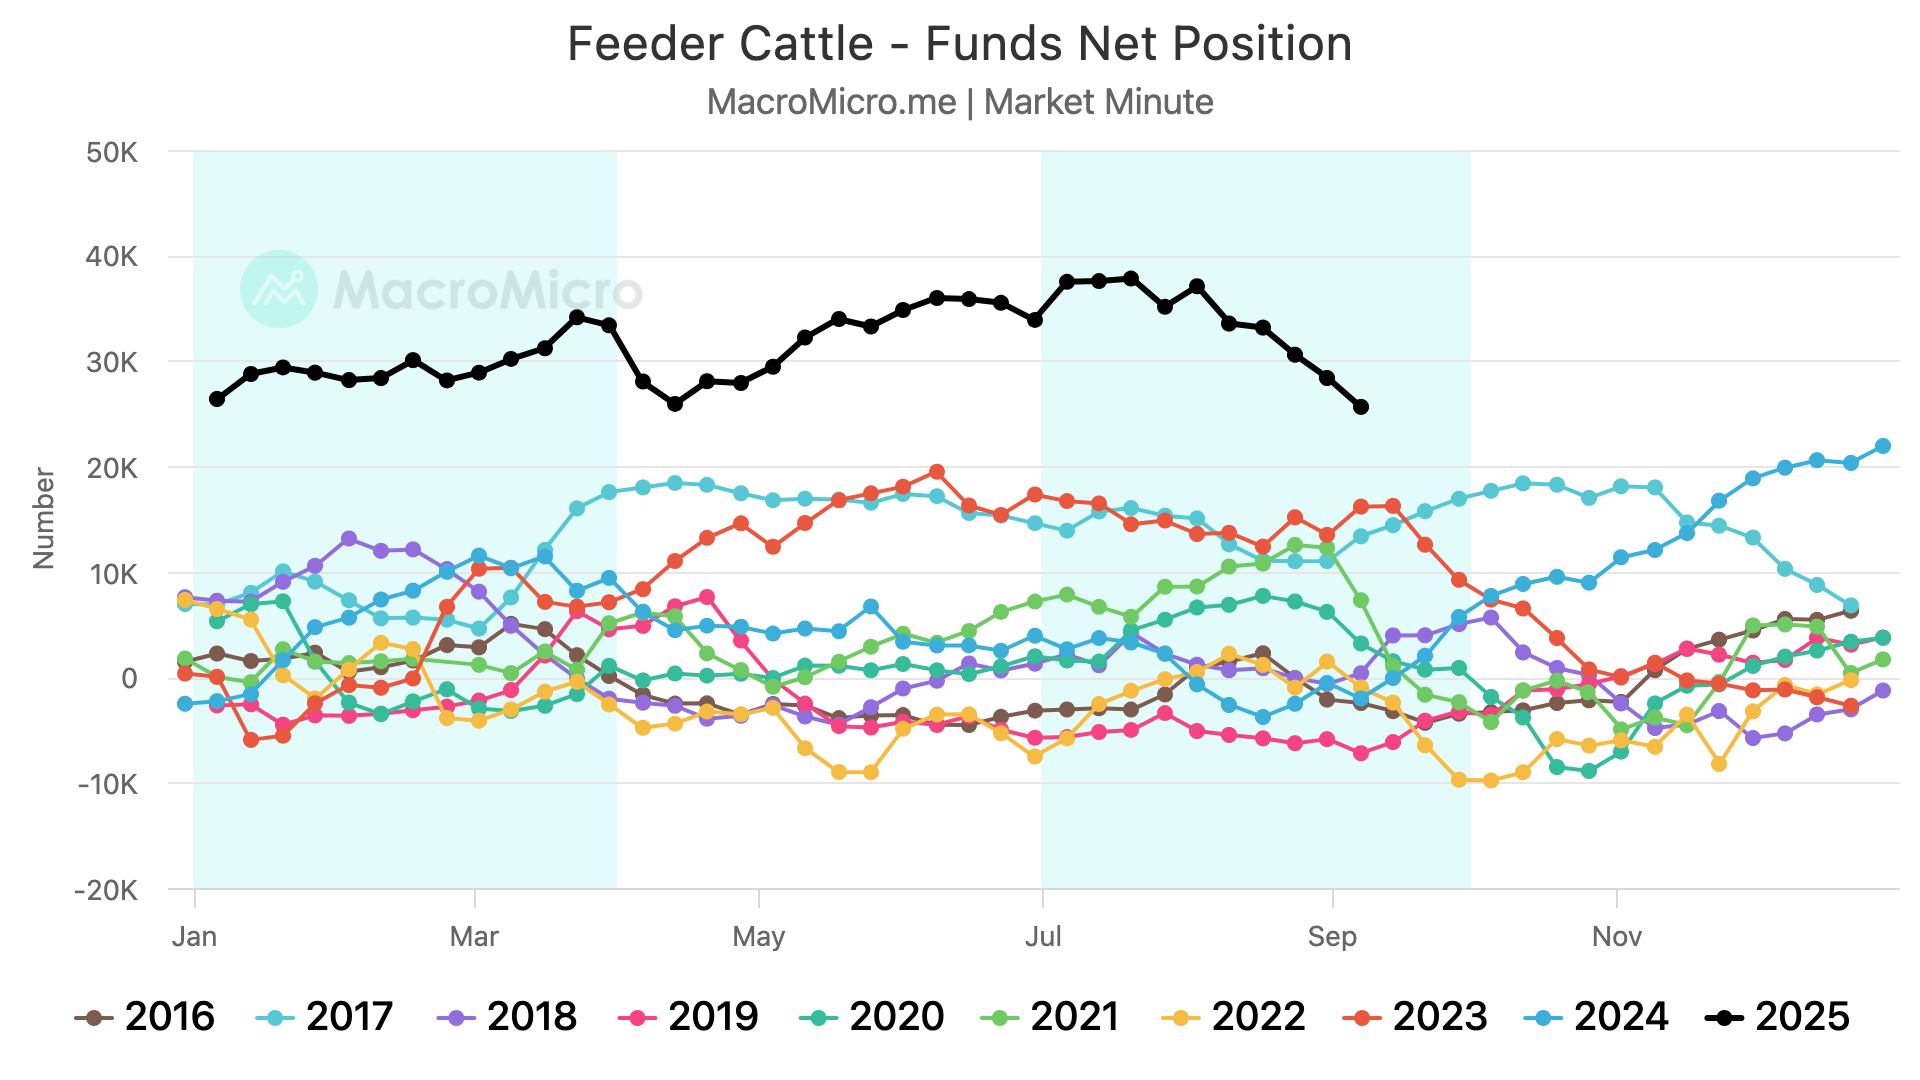
One thing I wanted to point out was the funds.
They have been selling a lot of cattle after holding a massive record long position.
This is now their smallest long position they've held all year long.
So that has to be a sign of caution in this market, as it appears the funds are taking some profit.
Seasonally we tend to struggle here until around late October to early November.
But this a bull market, and anything can happen in a bull market.
Just another reason to have some caution up here.
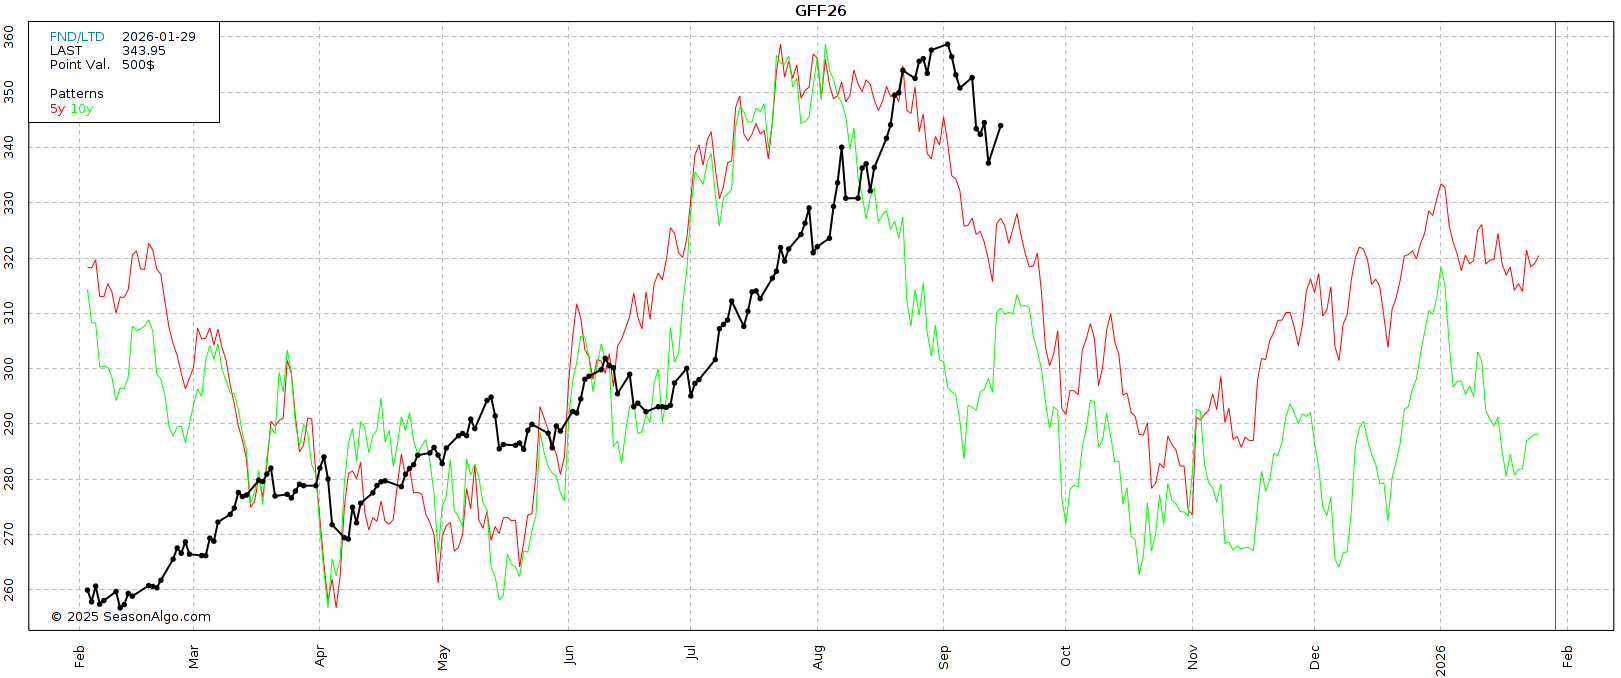
Oct Feeder:
We are finding life right in the golden zone from those August 1st lows.
This is deep enough for a standard correction.
However, that 343.875 is going to be a big level to hold.
If we cannot hold that level, it opens the door lower.
Perhaps as low as 325 to 334. Which is the golden zone from the entire rally since June.
If we drop down to that level, I think that would be a great spot to look at some re-ownership strategies.
To say that we have found a bottom here, I need a close above 360. As that reclaims 61.8% of this sell off.

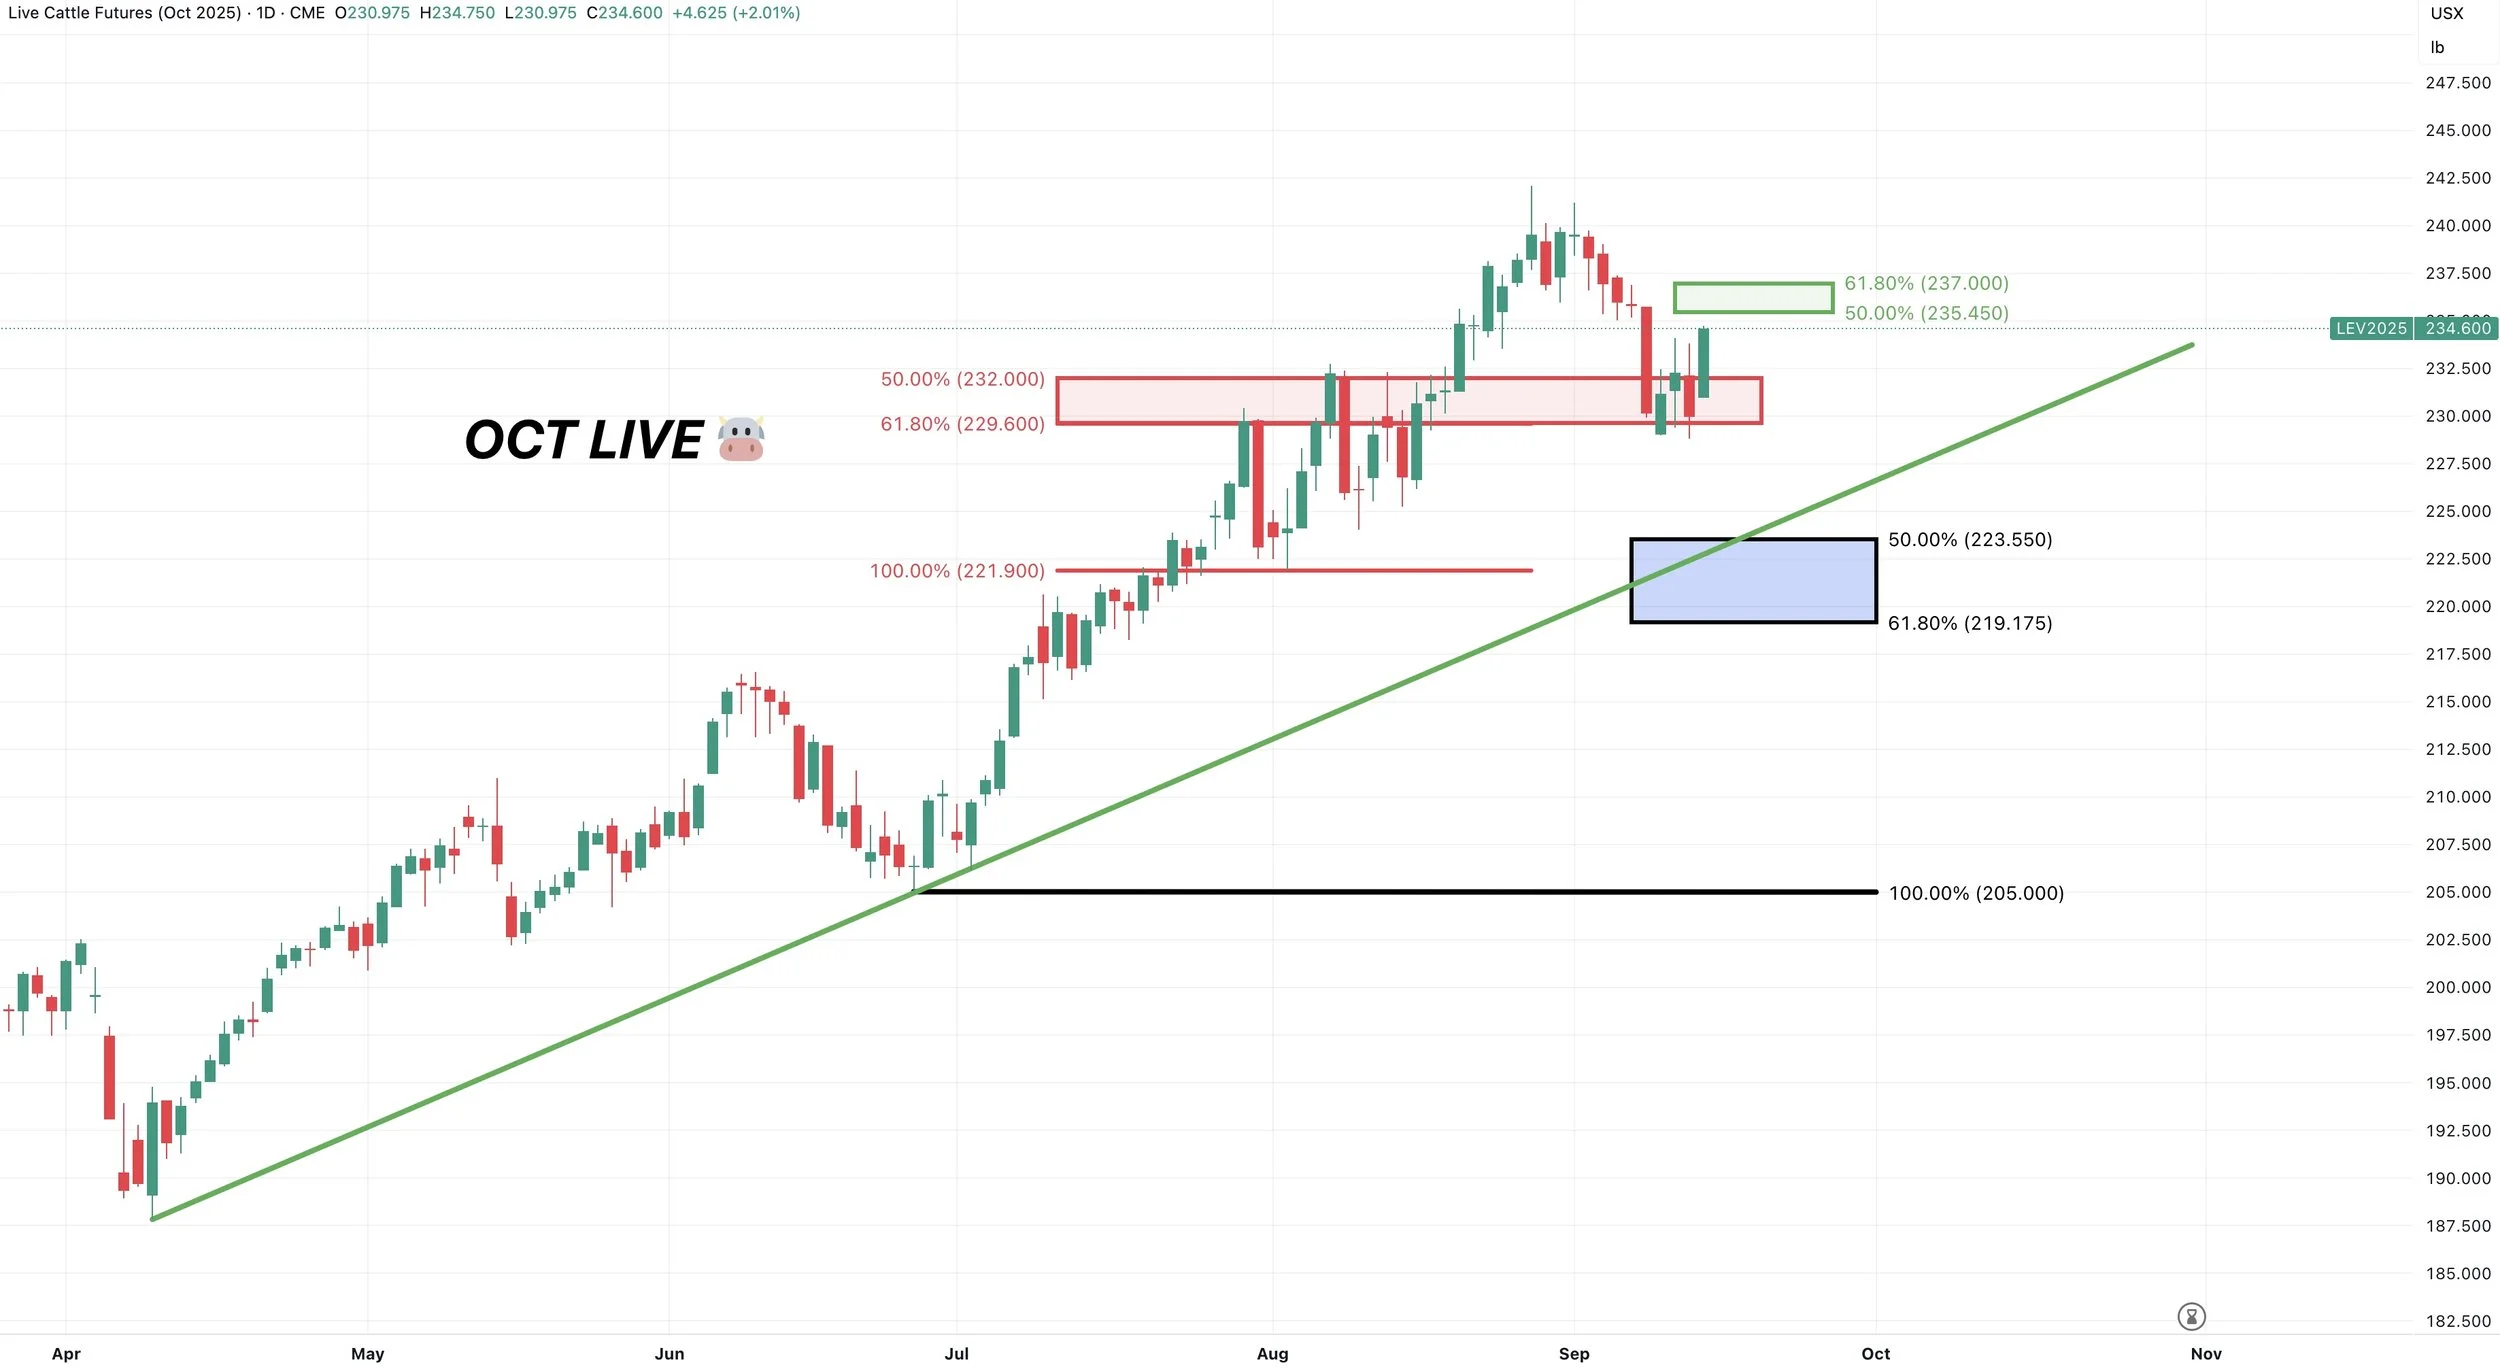
Oct Live:
Live cattle also bouncing in the golden zone.
229.600 is a huge spot to hold.
If we break below, it opens the door lower to the next golden zone.
If we close above 237 then we could be more confident the lows are in.
Past Sell or Protection Signals
Aug 22nd: 🌱
Soybean sell signal & hedge alert.
July 31st: 🐮
Cattle sell signal & hedge alert.
July 10th: 🐮
Cattle sell signal & hedge alert.
CLICK HERE TO VIEW
June 5th: 🐮
Cattle sell signal & hedge alert.
June 2nd: 🌾
MPLS wheat sell signal.
April 10th: 🌽
Old crop corn sell signal.
March 19th: 🐮
Cattle hedge & sell signal.
Feb 18th: 🌽 🌾
Old crop KC wheat & old crop corn signal.
Jan 23rd: 🌽 🌱
Corn & beans old crop sell signal.
CLICK HERE TO VIEW
Jan 15th: 🌽 🌱
Corn & beans hedge alert/sell signal.
Jan 2nd: 🐮
Cattle hedge alert at new all-time highs & target.
Dec 11th: 🌽
Corn sell signal at $4.51 200-day MA
CLICK HERE TO VIEW
Oct 2nd: 🌾
Wheat sell signal at $6.12 target
Sep 30th: 🌽
Corn protection signal at $4.23-26
Sep 27th: 🌱
Soybean sell & protection signal at $10.65
Sep 13th: 🌾
Wheat sell signal at $5.98
May 22nd: 🌾
Wheat sell signal when wheat traded +$7.00
Want to Talk?
Our phones are open 24/7 for you guys if you ever need anything or want to discuss your operation.
Hedge Account
Interested in a hedge account? Use the link below to set up an account or shoot Jeremey a call at (605)295-3100.