
MAJOR USDA SHOCK. HOW DOES THIS CHANGE THINGS?
MARKET UPDATE
You can scroll to read the usual update as well. As the written version is the exact same as the video.
Timestamps for video:
Corn: 0:40min
Beans: 6:30min
Wheat: 10:00min
Cattle: 11:25min
Want to talk about your situation?
(605)295-3100
Futures Prices Close
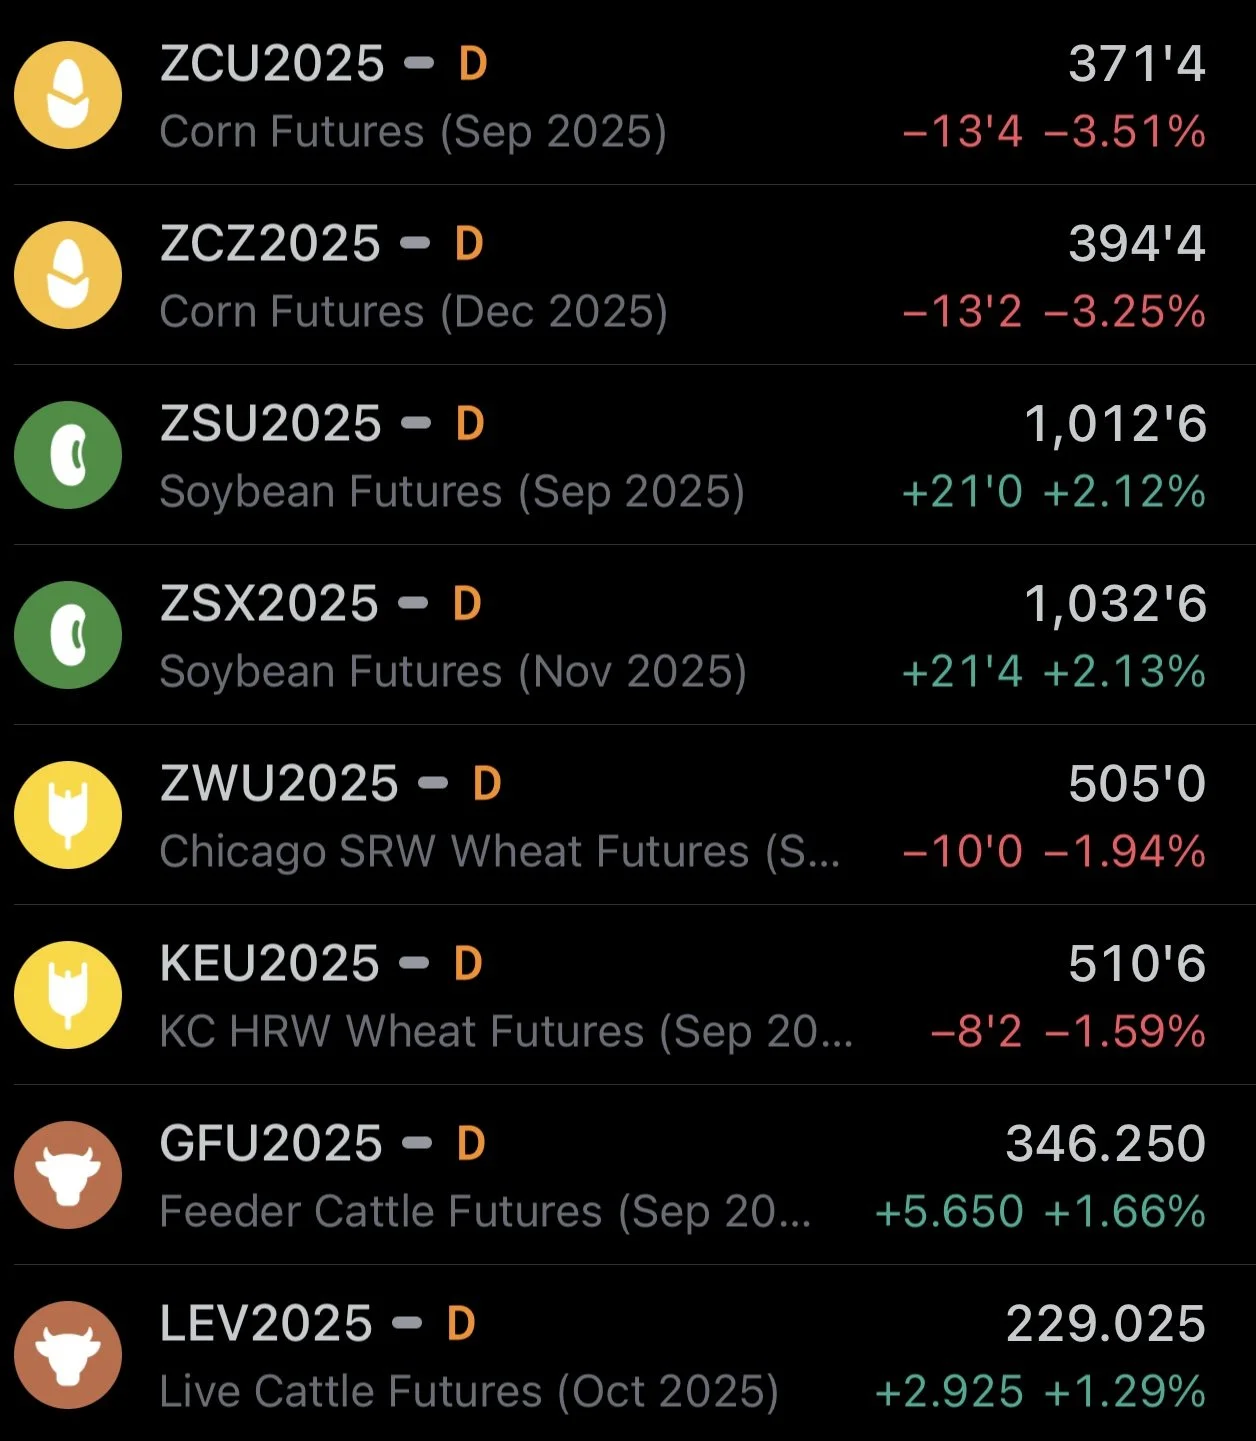
Overview
Corn and wheat fall apart while soybeans rally on the USDA report data dump.
This report provided a ton of shocks and shakes things up in a big way.
Some would say this was one of the biggest surprises ever.
Let's go over how this report changes things moving forward.
Here were the numbers in case you missed them earlier.


Corn
This report was pretty bearish for corn.
Not only did yield surpass every estimate, acres were higher than estimates well.
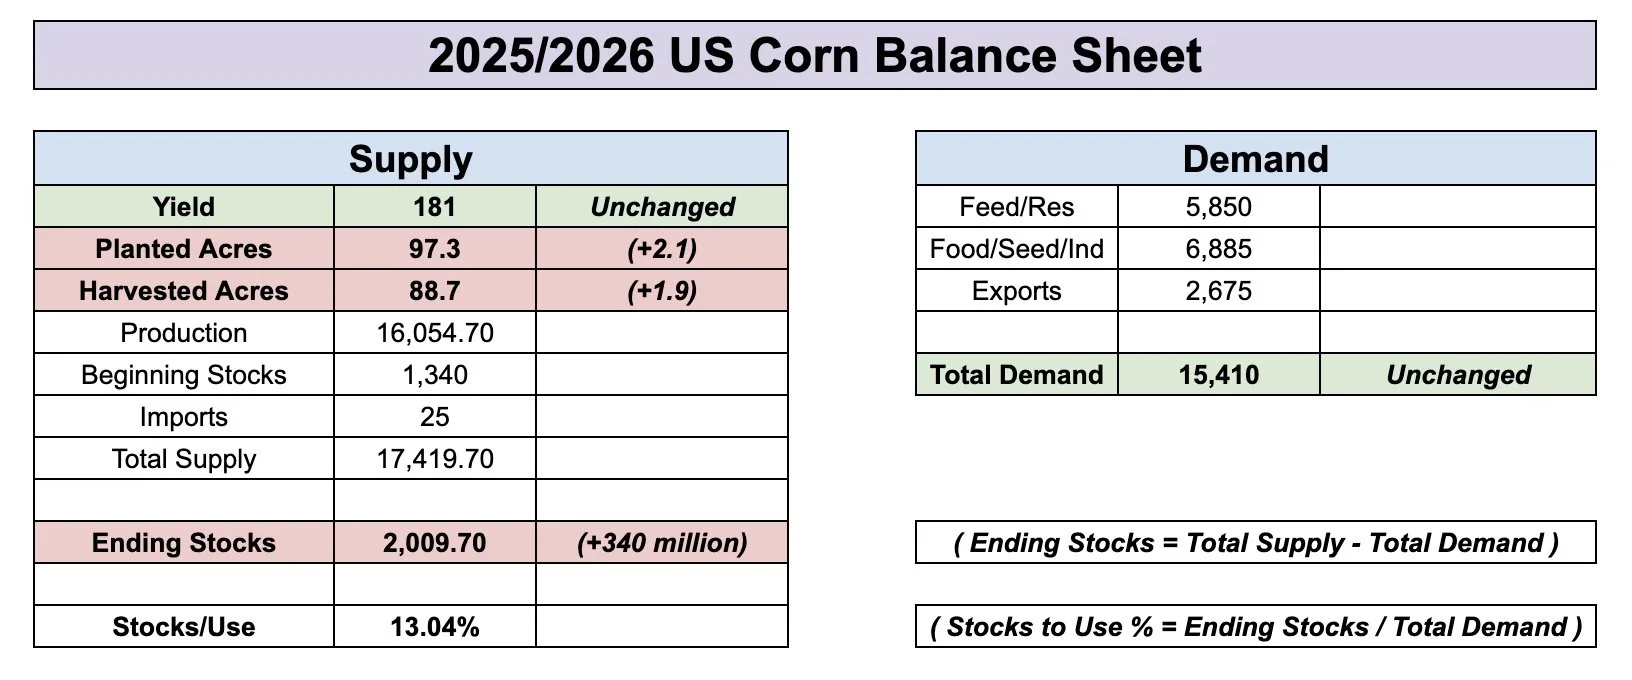
Here is a visual of what was changed on the new crop balance sheet.
Red = Bearish
Green = Bullish
With the monster yield and huge acres, supply increased by +1 billion bushels. A massive jump.
But I guess it could’ve been worse. As the USDA also adjusted demand by +545 million bushels, which offset a little over half of the production increase.
Resulting in a net change of +457 million bushels to carryout.
A demand increase was warranted given how stellar it has been. However, some would say these demand numbers might be a little lofty.

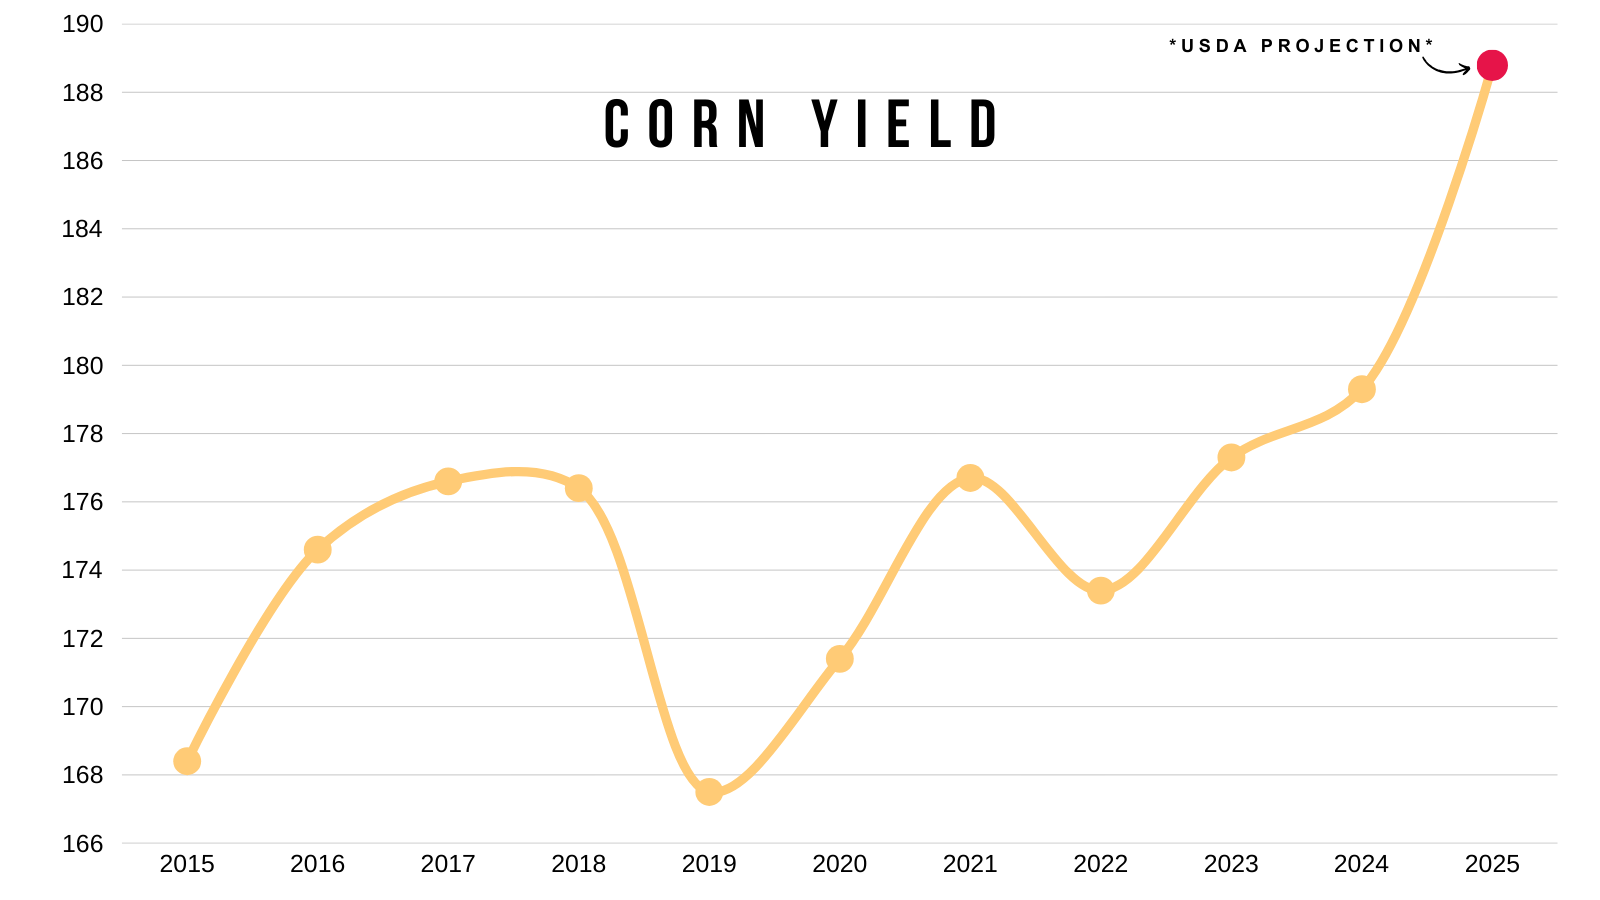
We saw corn yield jump all the way to 188.8 bpa..
Surpassing even StoneX's massive 188 projection.
The average trade estimate was 184.4 bpa.
This 188.8 number is +9.5 bpa higher than last year's record 179.3.
Believe it or not, the biggest shock wasn’t the yield.
It was acres.
Everyone was expecting a massive yield.
No one was expecting this large of an increase in acres.
Harvest acres jumped nearly +2 million, to 88.7 million.
We have never.. ever.. seen anything like this in the August report.
This was by far the biggest acre adjustment of all-time.
Since at least 2000, we have never seen acres bumped in August.. until today.
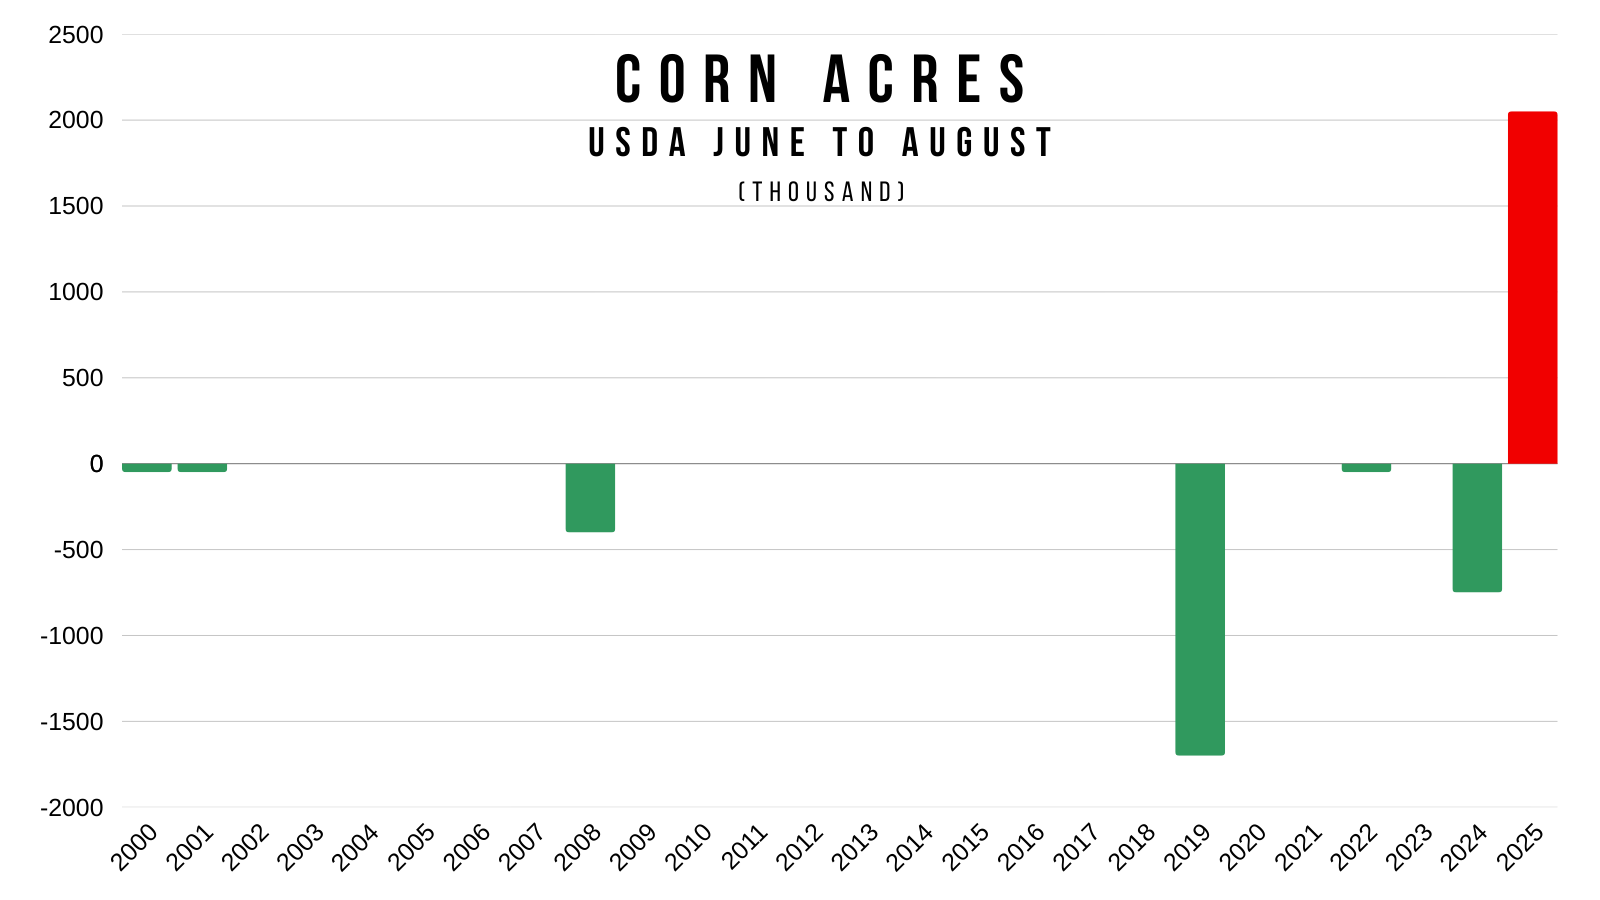
Even if yield would've been left at 181 and demand remained unchanged, the bump in acres alone would have printed a +2 billion bushel carryout.
As acres alone added nearly +350 million bushels of supply. Which was completely unexpected.
(Here is the balance sheet from July if you left yield and demand unchanged and only adjusted the acres higher)
Corn acres are now the 2nd hightest of all-time.
The highest in over a decade.
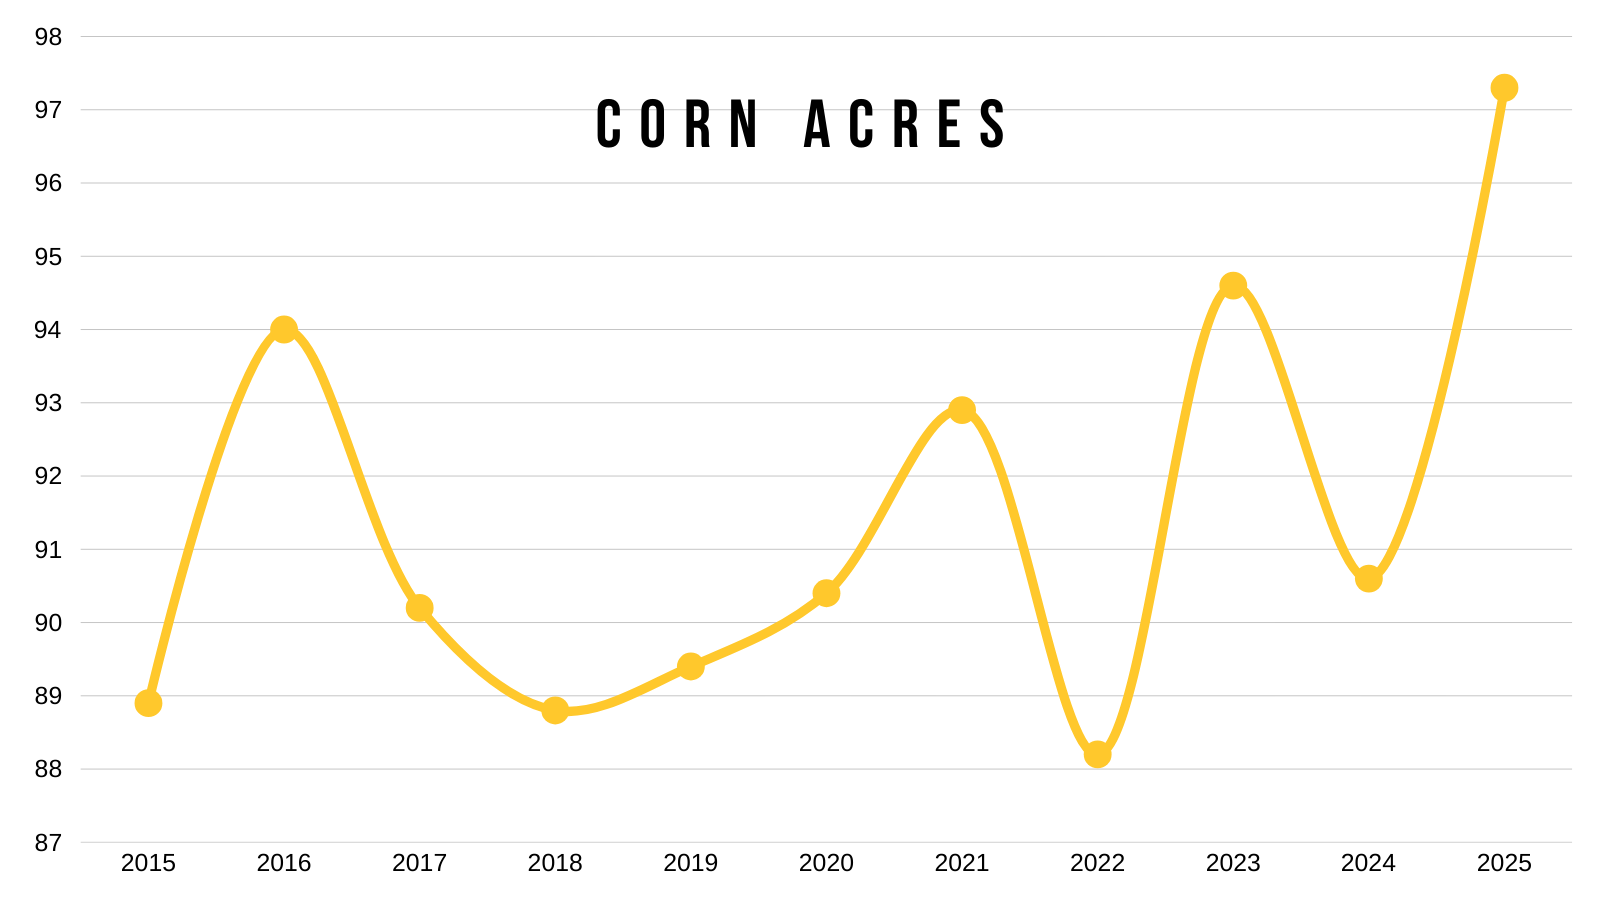
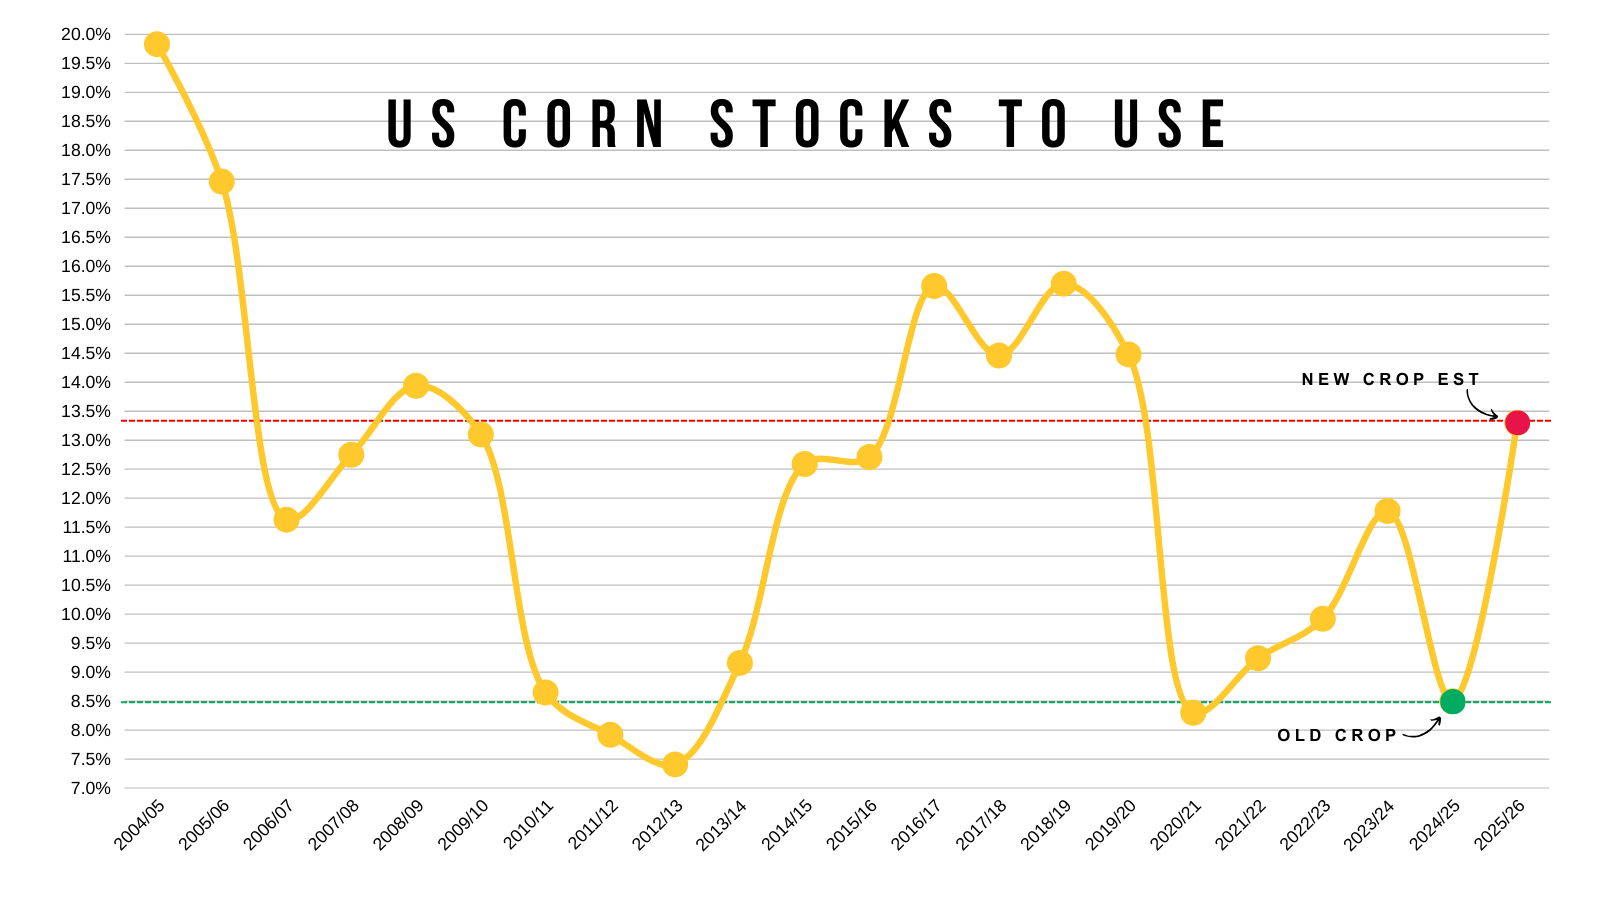
Despite our old crop balance sheet being one of the tightest of all-time, new crop's stocks to use ratio is now sitting at it's highest levels since 2019/20.
At nearly 13.5% vs old crop's 8.5%.
That new crop number is far from being a bullish number.
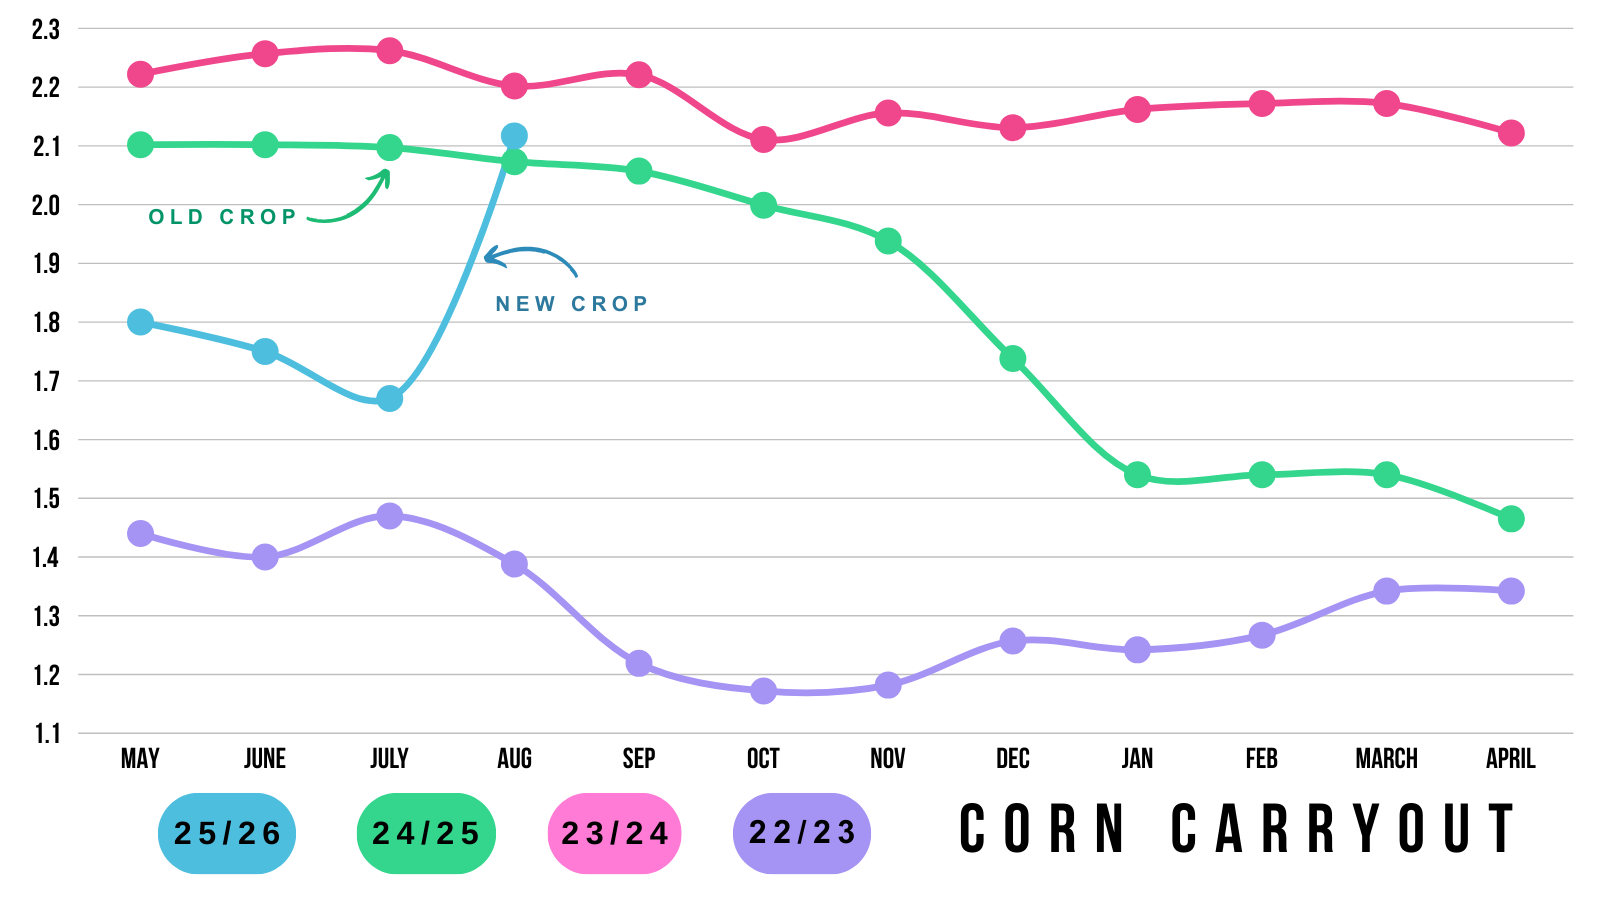
Despite the massive yield and biggest acreage number of all-time, compared to last year at this same time carryout is only 80 million bushels bigger than last year.
Not bullish by any means. But it speaks volume as to how strong demand is.
We have a record yield and record large acres. Yet carryout is hardly bigger than it was YOY.
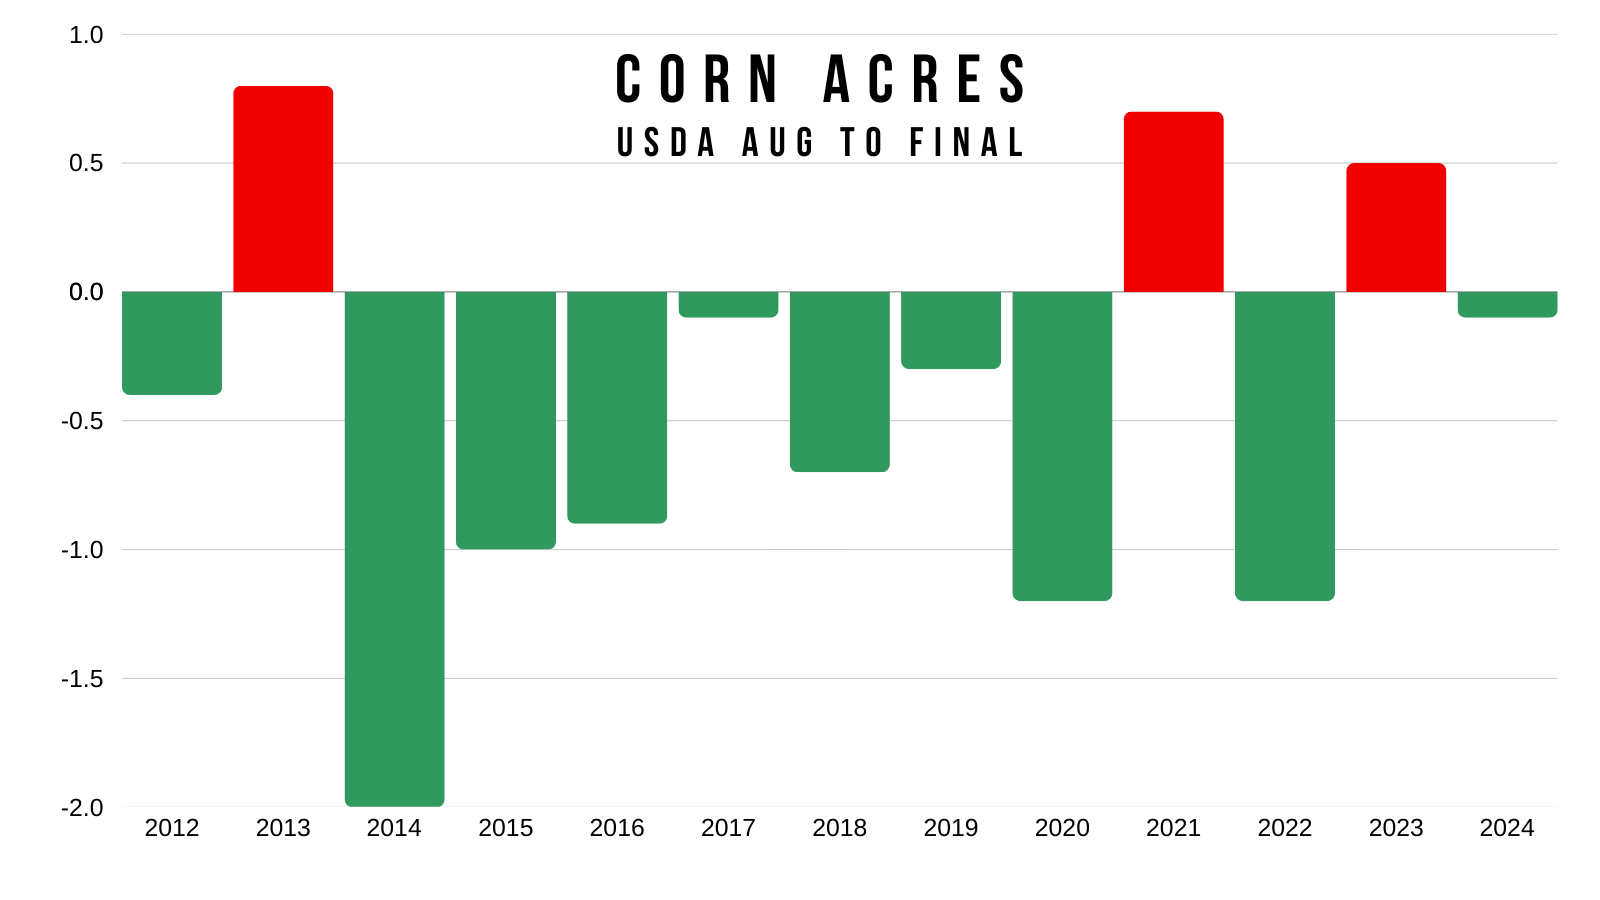
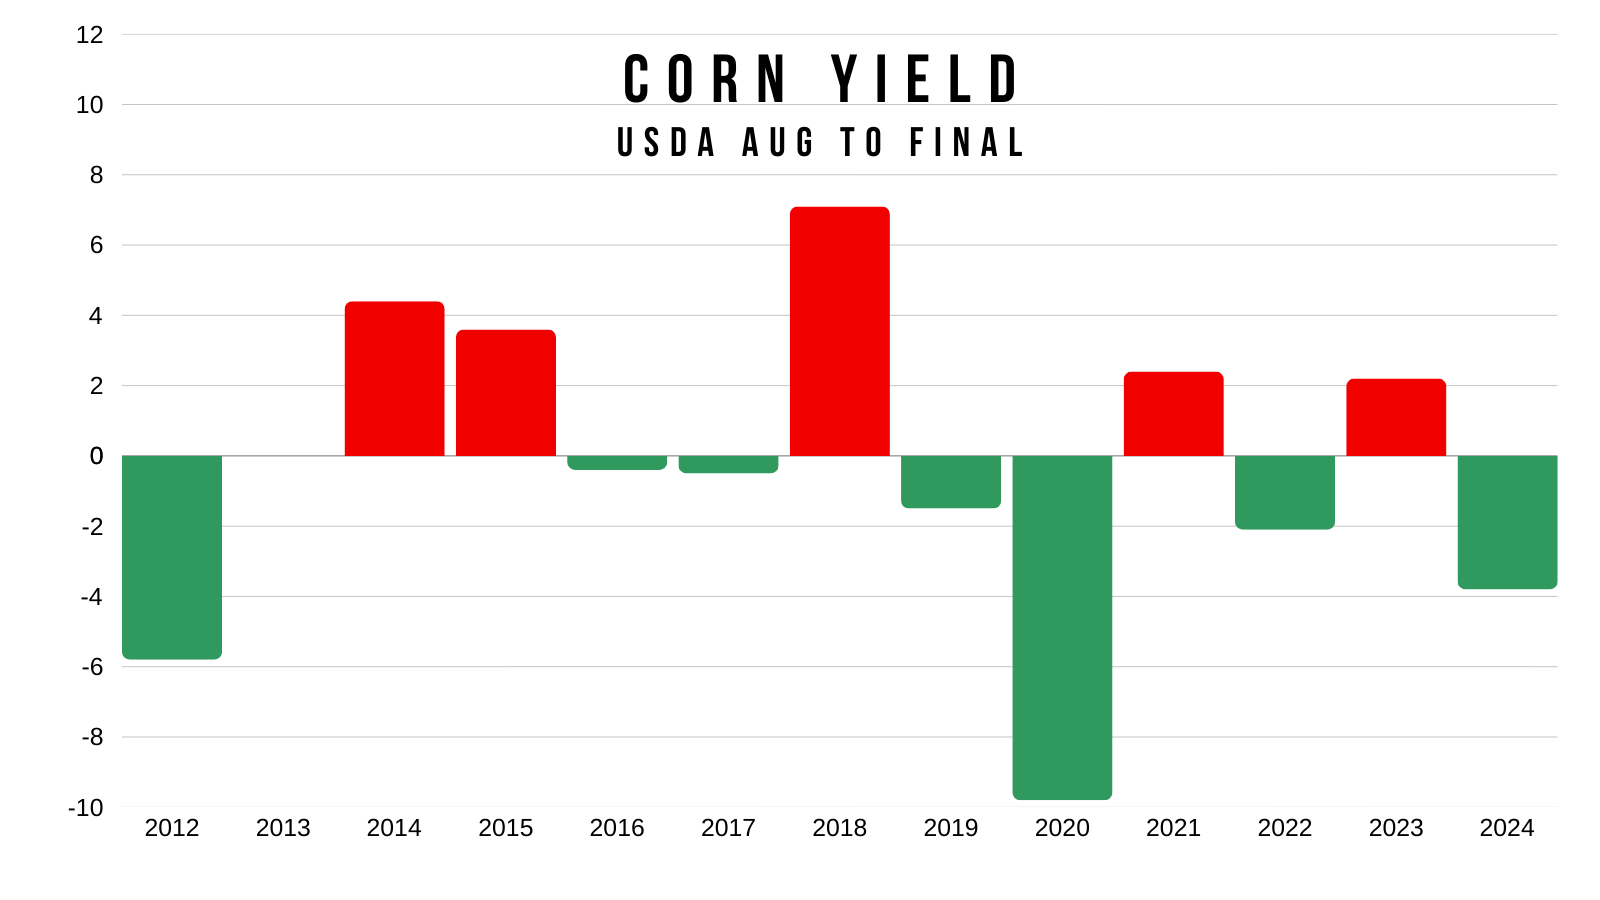
The USDA more often than not, does tend to lower both it's yield and acre numbers after August.
Here is a visual of the past changes after August to final.
Final Thoughts for Corn:
On the bright side, I don’t see a world where this isn’t our highest yield print we see. We are nearly +10 bushels higher than anything we have seen before.
This report is based on satellite data. It did not include walking in the fields. So it does not account for the pollination issues, tassle issues etc. that show up when boots hit the ground.
On one hand we just added +1 billlion bushels of corn on the supply side of the balance sheet. Which is an awful lot of corn.
But we also added over +500 million bushels of demand on the balance sheets. What happens if yield isn’t 189 at the end of the day?
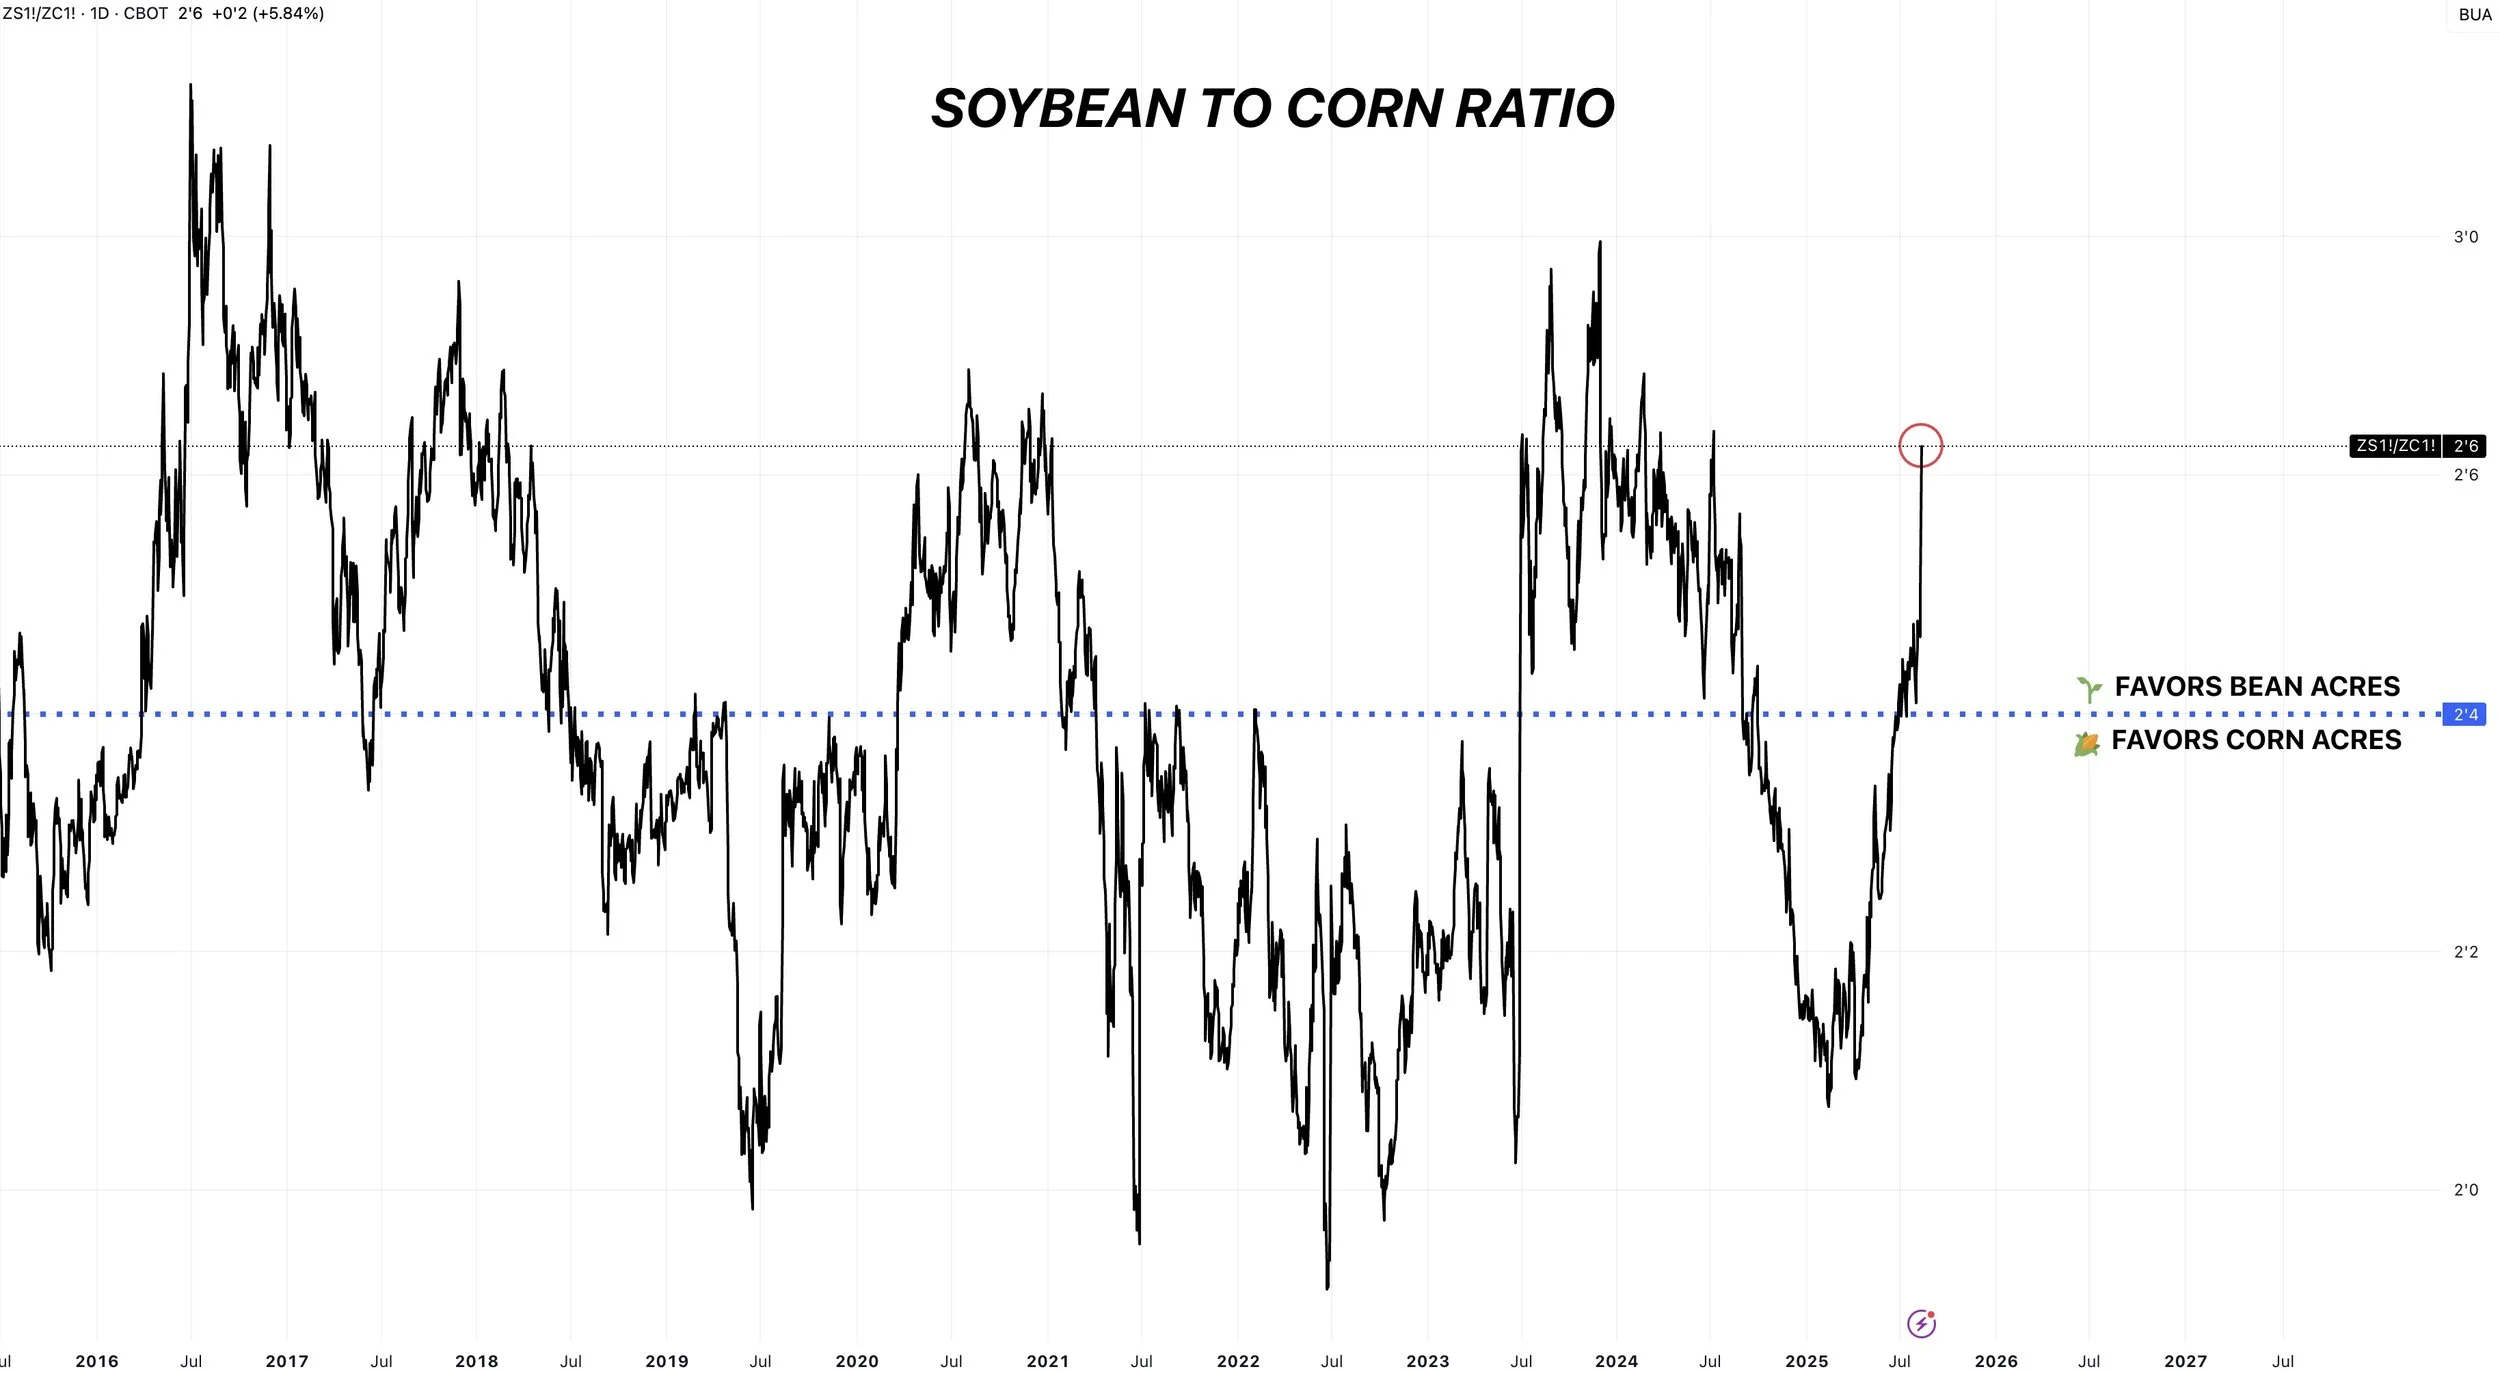
Looking towards next year.. we are no doubt more than likely going to be seeing a lot less corn acres.
Look at the corn to soybean ratio. It went from extreme lows to now extreme highs.
Doesn’t help prices today, but very well could next year.
If the numbers would have came in around expectations, we probably would have been able to find our harvest lows because those type of numbers were priced in.
The market doesn’t necessarily price in "yield".
It prices in overall supply & demand.
We have been saying the market was pricing in a +185 yield because that would’ve spit out a 2 billion bushel carryout.
Even with a 189 yield and bigger acres, we just got a 2.12 billion carryout due to the big increase in demand.
Which is slightly larger than what was originally thought to be priced in. Which means some additional downside here should not come as a surprise.
It might be hard to see a major rally here short term until closer to harvest.
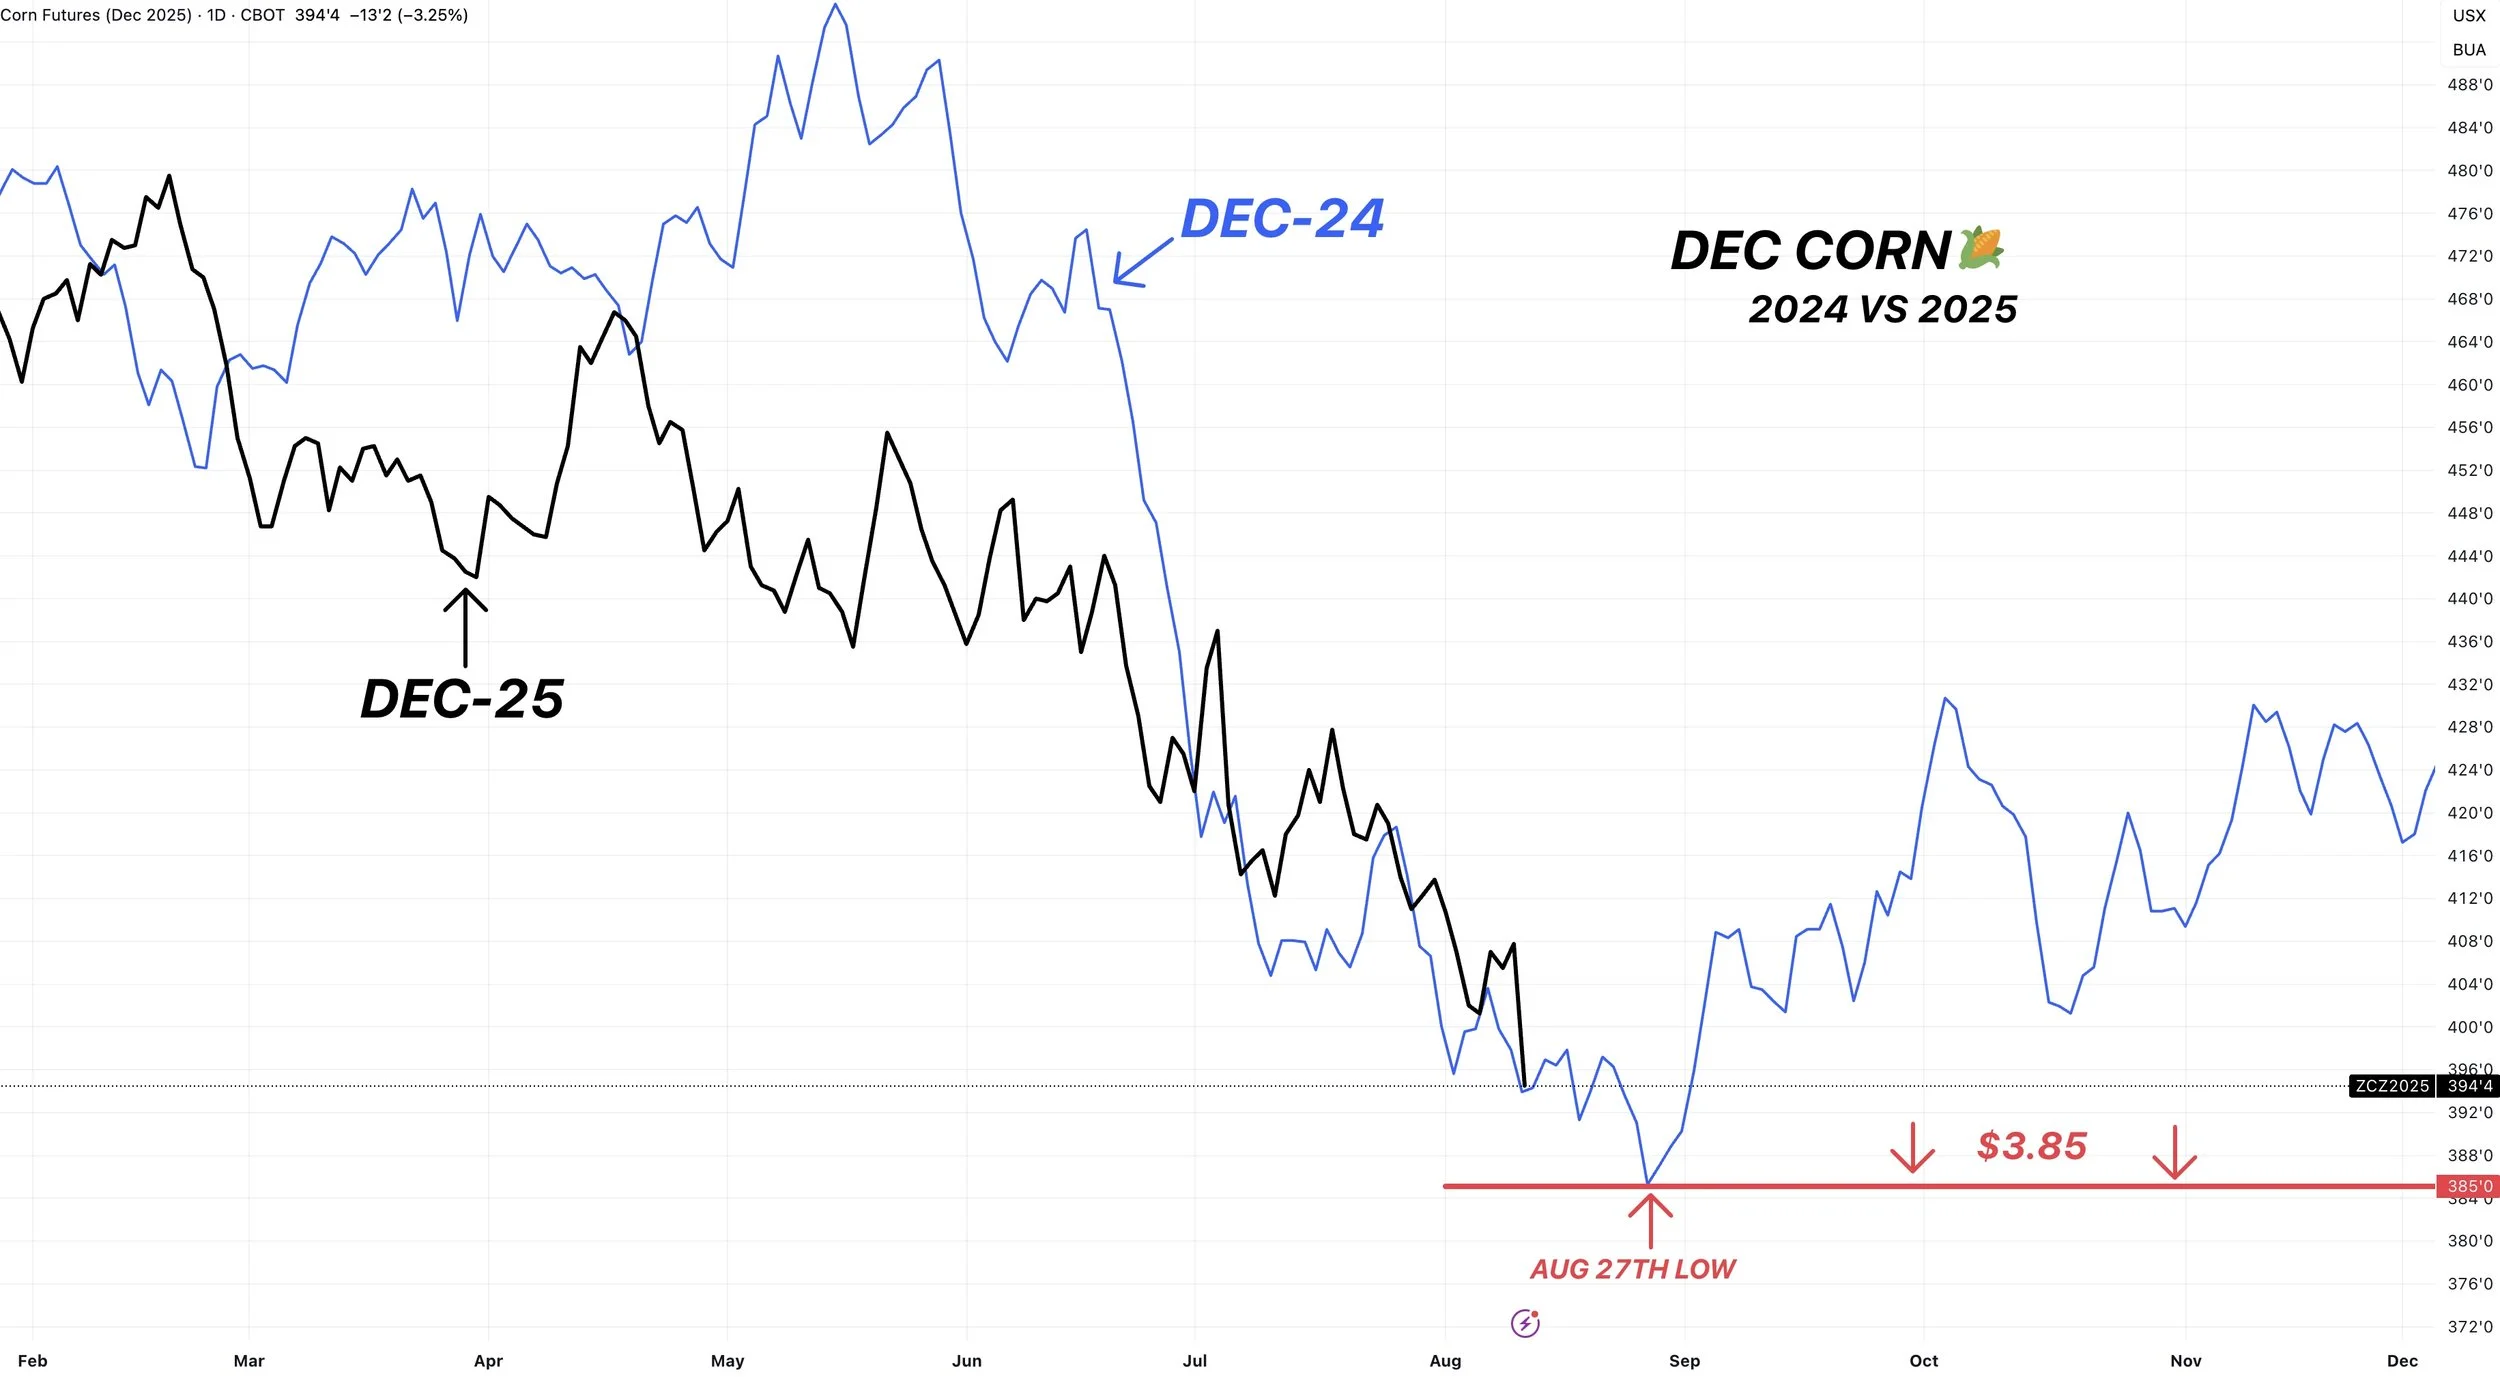
How low do we go?
Hard to say. Our lows last year were $3.85 with a carryout slightly tighter than today. So with this report, challenging those lows now seems possible.
Regardless, we aren’t selling corn down here anyway this far below the cost of production.
I'd still like to think we find our true harvest lows within the next 30 days.
Perhaps they come on first notice day towards the end of the month.
Where all of those basis contracts etc will have to be priced and that natural sell pressure lifts off the market.
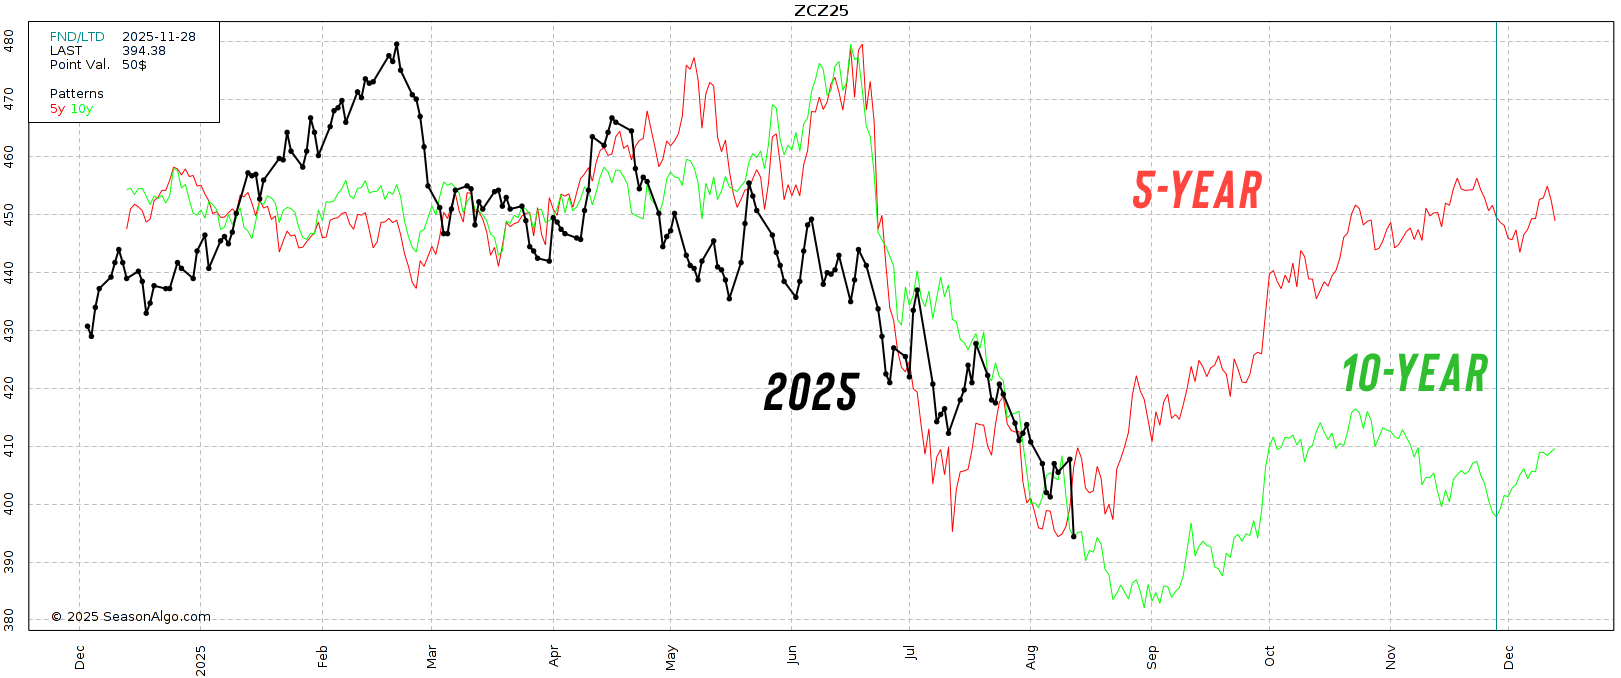
That is seasonal when we make them.
If low prices continue to hold through October, crop revenue insurance payments should be boosted. (Kind of ironic we seasonally post lows before).
Technicals:
Dec corn doesn’t look to hot after today's action.
We failed to hold the 100% fib extension from the 4th of July weekend sell off.
The next fib level is the 123.6% level at $3.87
Can’t get excited until we break the downtrend from July.

Soybeans
Unlike corn, the report was bullish for soybeans.
From the lows to the highs today, soybeans saw a +40 cent rally.
Here is a visual of the new crop balance sheet changes made.
Yield jumped, but the cut to harvested acres more than offset the yield increase. Resulting in a total supply reduction of -63 million bushels.
Some of this was offset with a -43 million cut to demand.
Resulting in a final carryout change of -20 million.
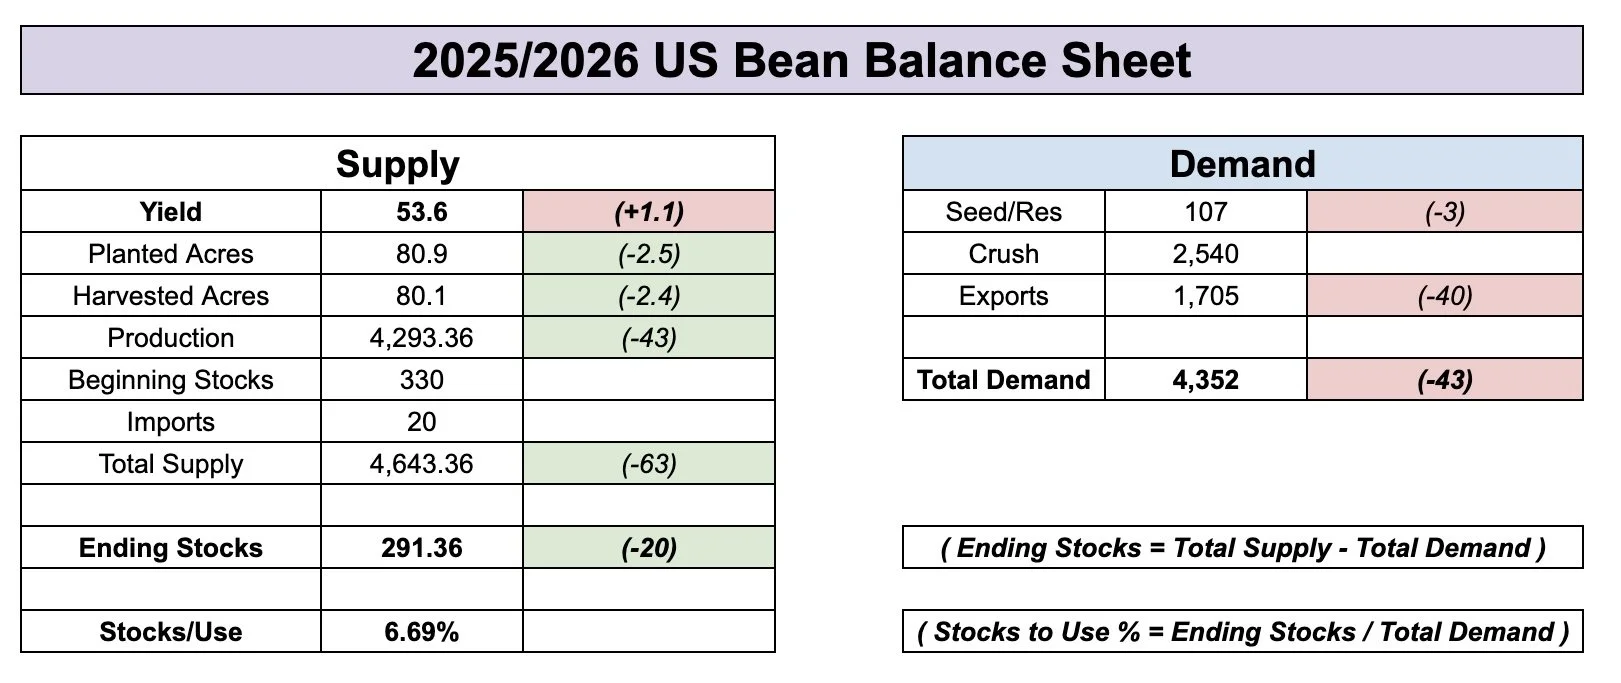
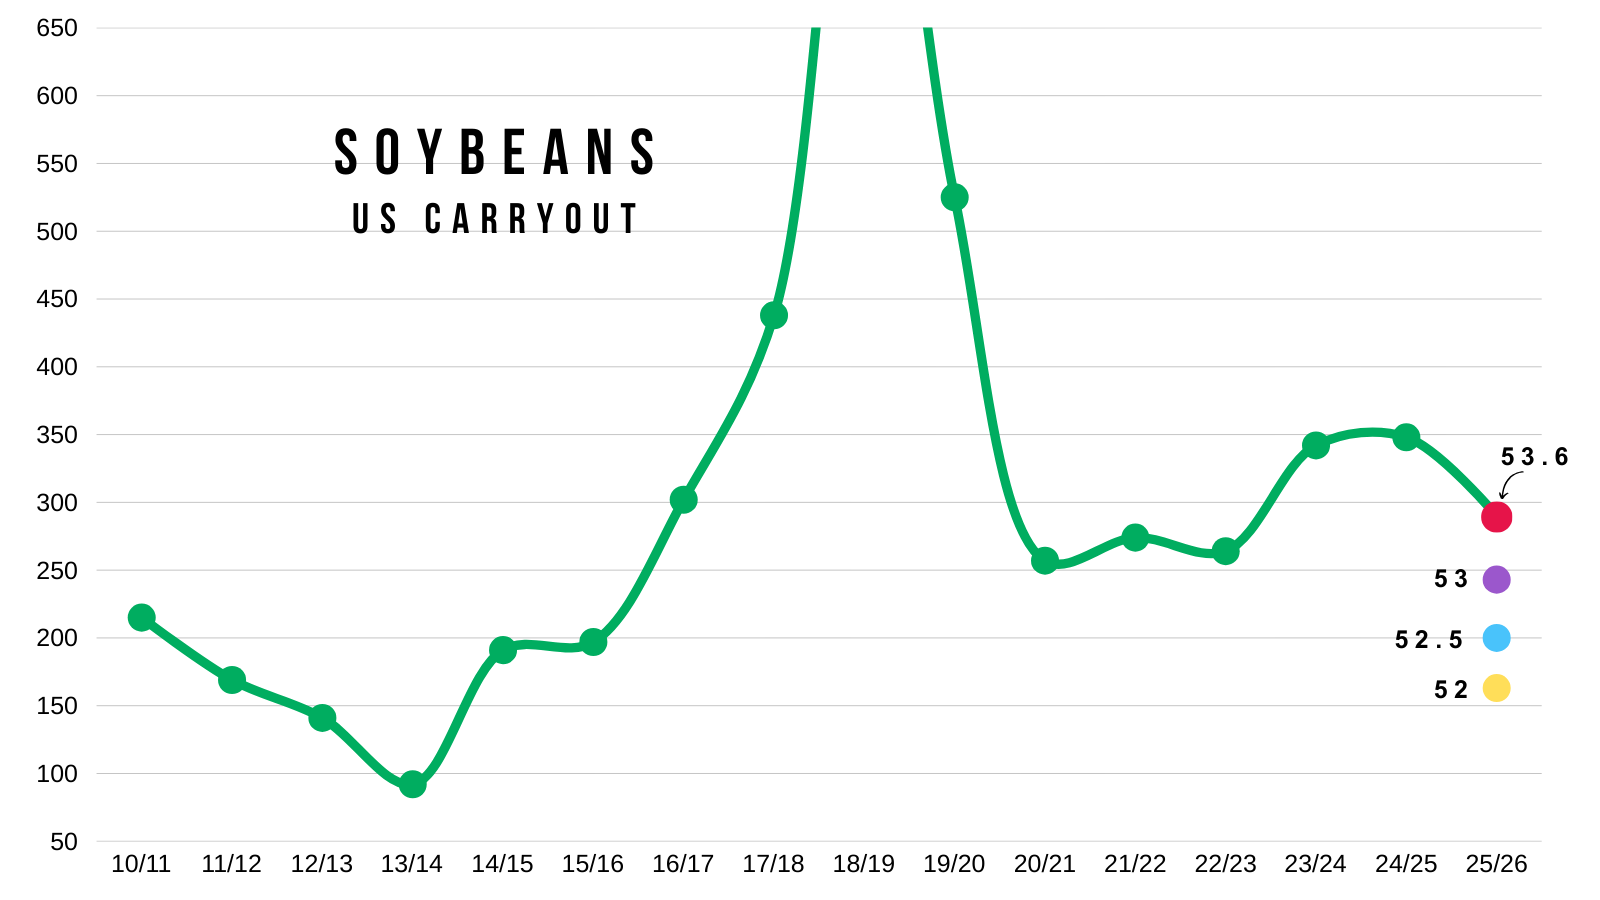
Yield surprised high, coming in at 53.6 vs the 52.9 estimates.
Bigger than anything we have ever seen before, but it's still a little early to pencil in final bean yield as we have all of August left.

So you are telling me that even if yield really is 53.6 bpa... our carryout is still the lowest it has been in 3 years?
Seems like a big deal to me.
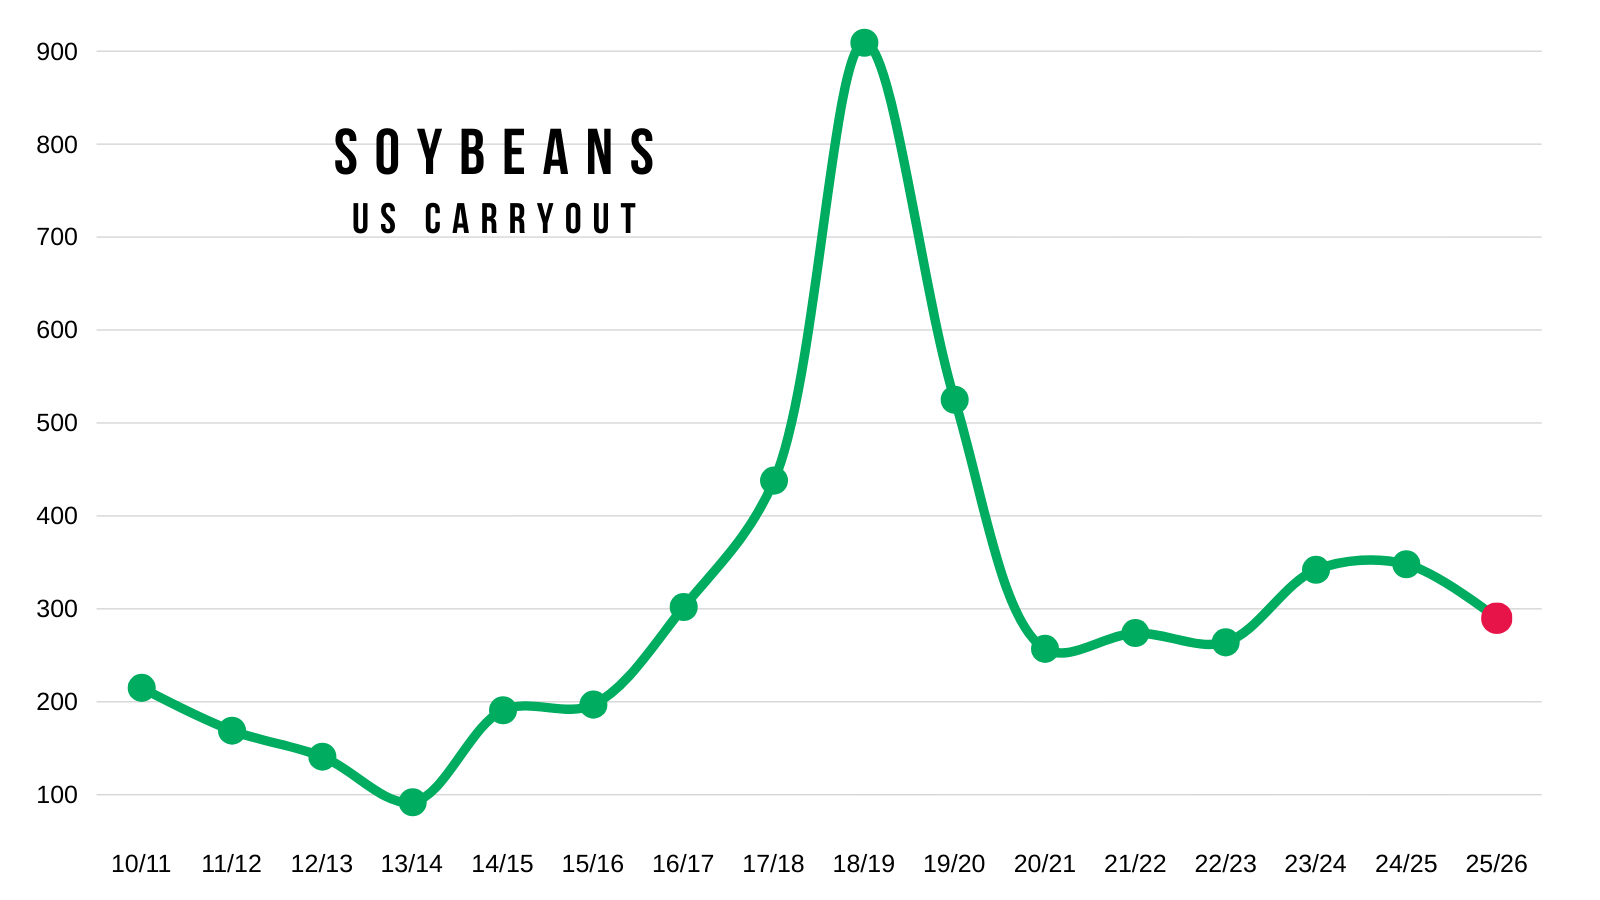
The room for error on the balance sheet was already razor thin.
This cut to acres make that room for error even smaller.
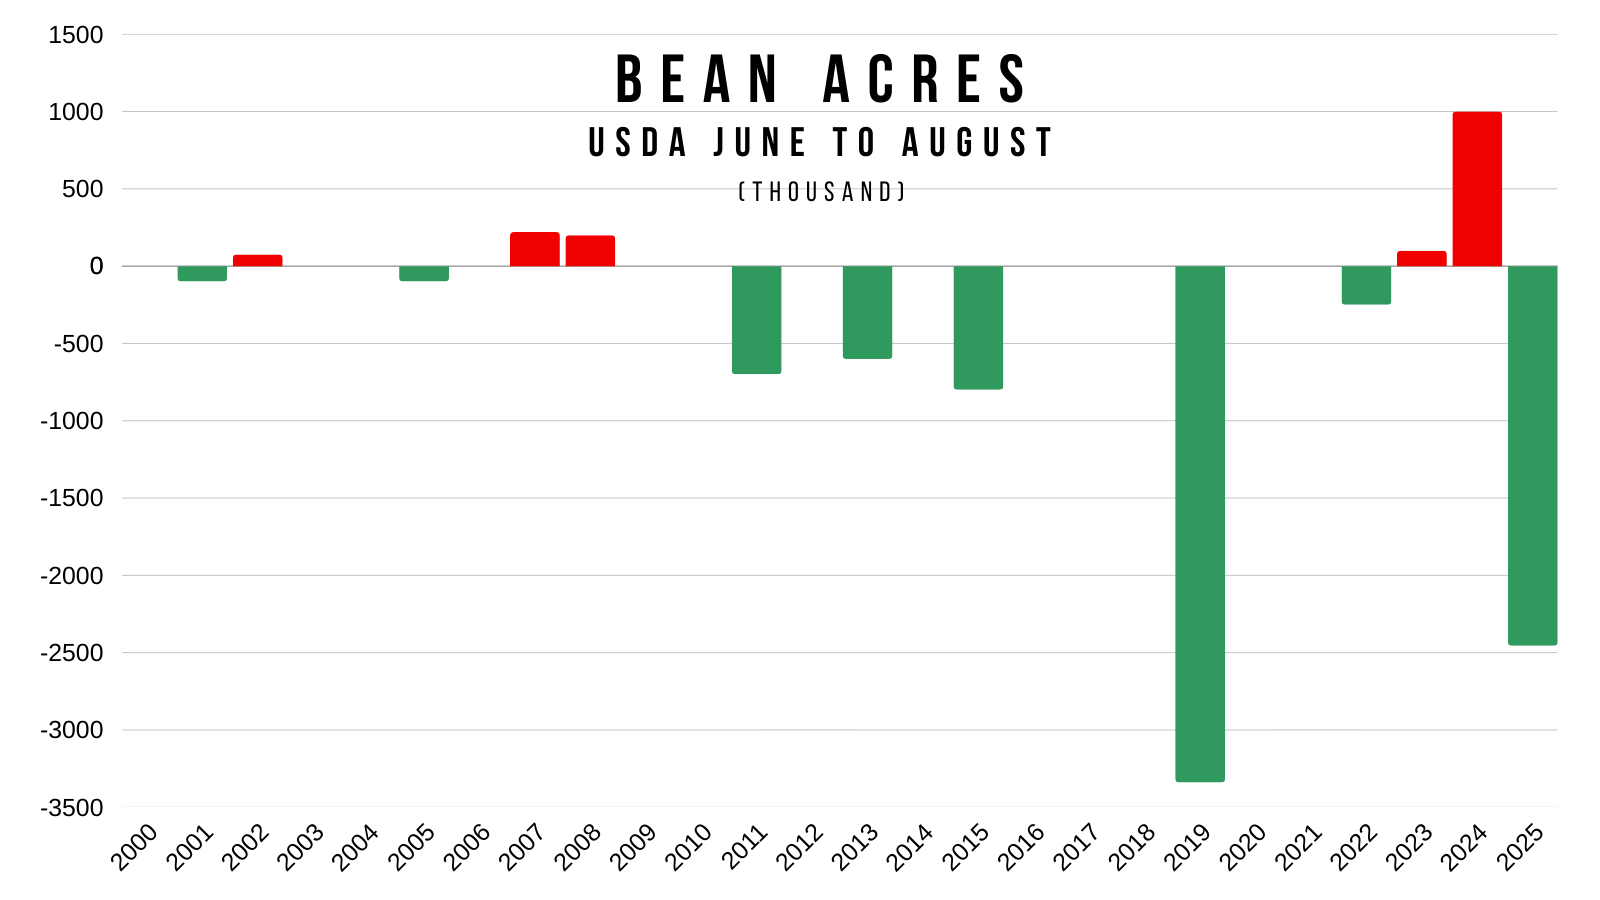
Acres came in at their 2nd lowest of the last decade.
Only behind 2019.

This was the 2nd largest acre change on the August report of all-time.
Again only behind 2019.
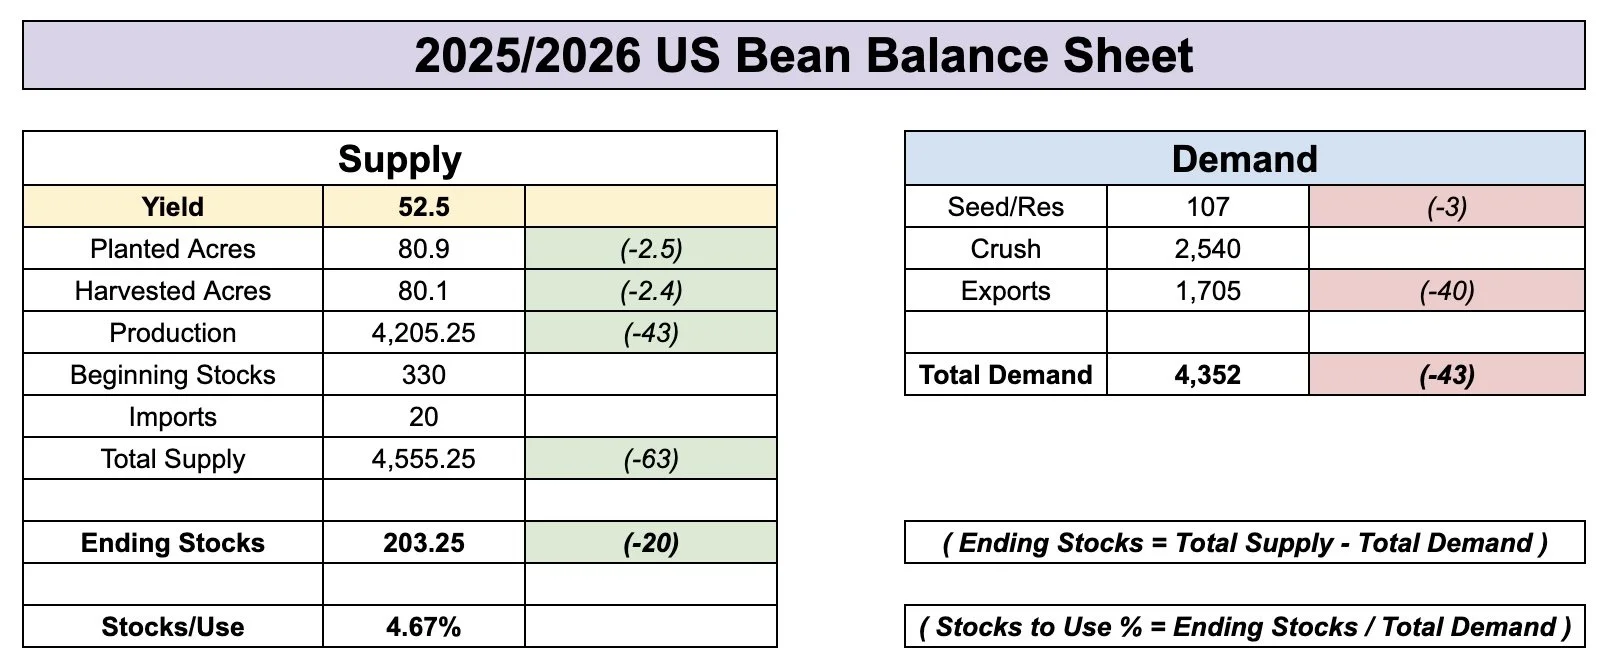
Here is what the new current balance sheet looks like if yield came in at 52.5 bpa (the original USDA estimate) while adding the new lower acres and leaving demand unchanged.
It drops carryout to 200 million bushels.
(As always, demand will be reduced to offset some of this, so not entirely accurate. But shows there is very little room for error)
Here is a visual on how changes to yield impacts carryout (without changing demand).
Absolutely zero room for error.
That original 52.5 yield the USDA had would peg carryout at it's lowest level in a decade. (blue dot)
I am not guessing yield here at all. Simply showing the the impact of yield.
Final Thoughts for Beans:
This report made the new crop soybean balance sheet even tighter. It made that already thin room for error on yield even smaller.
I think this could very well lead to opportunities.
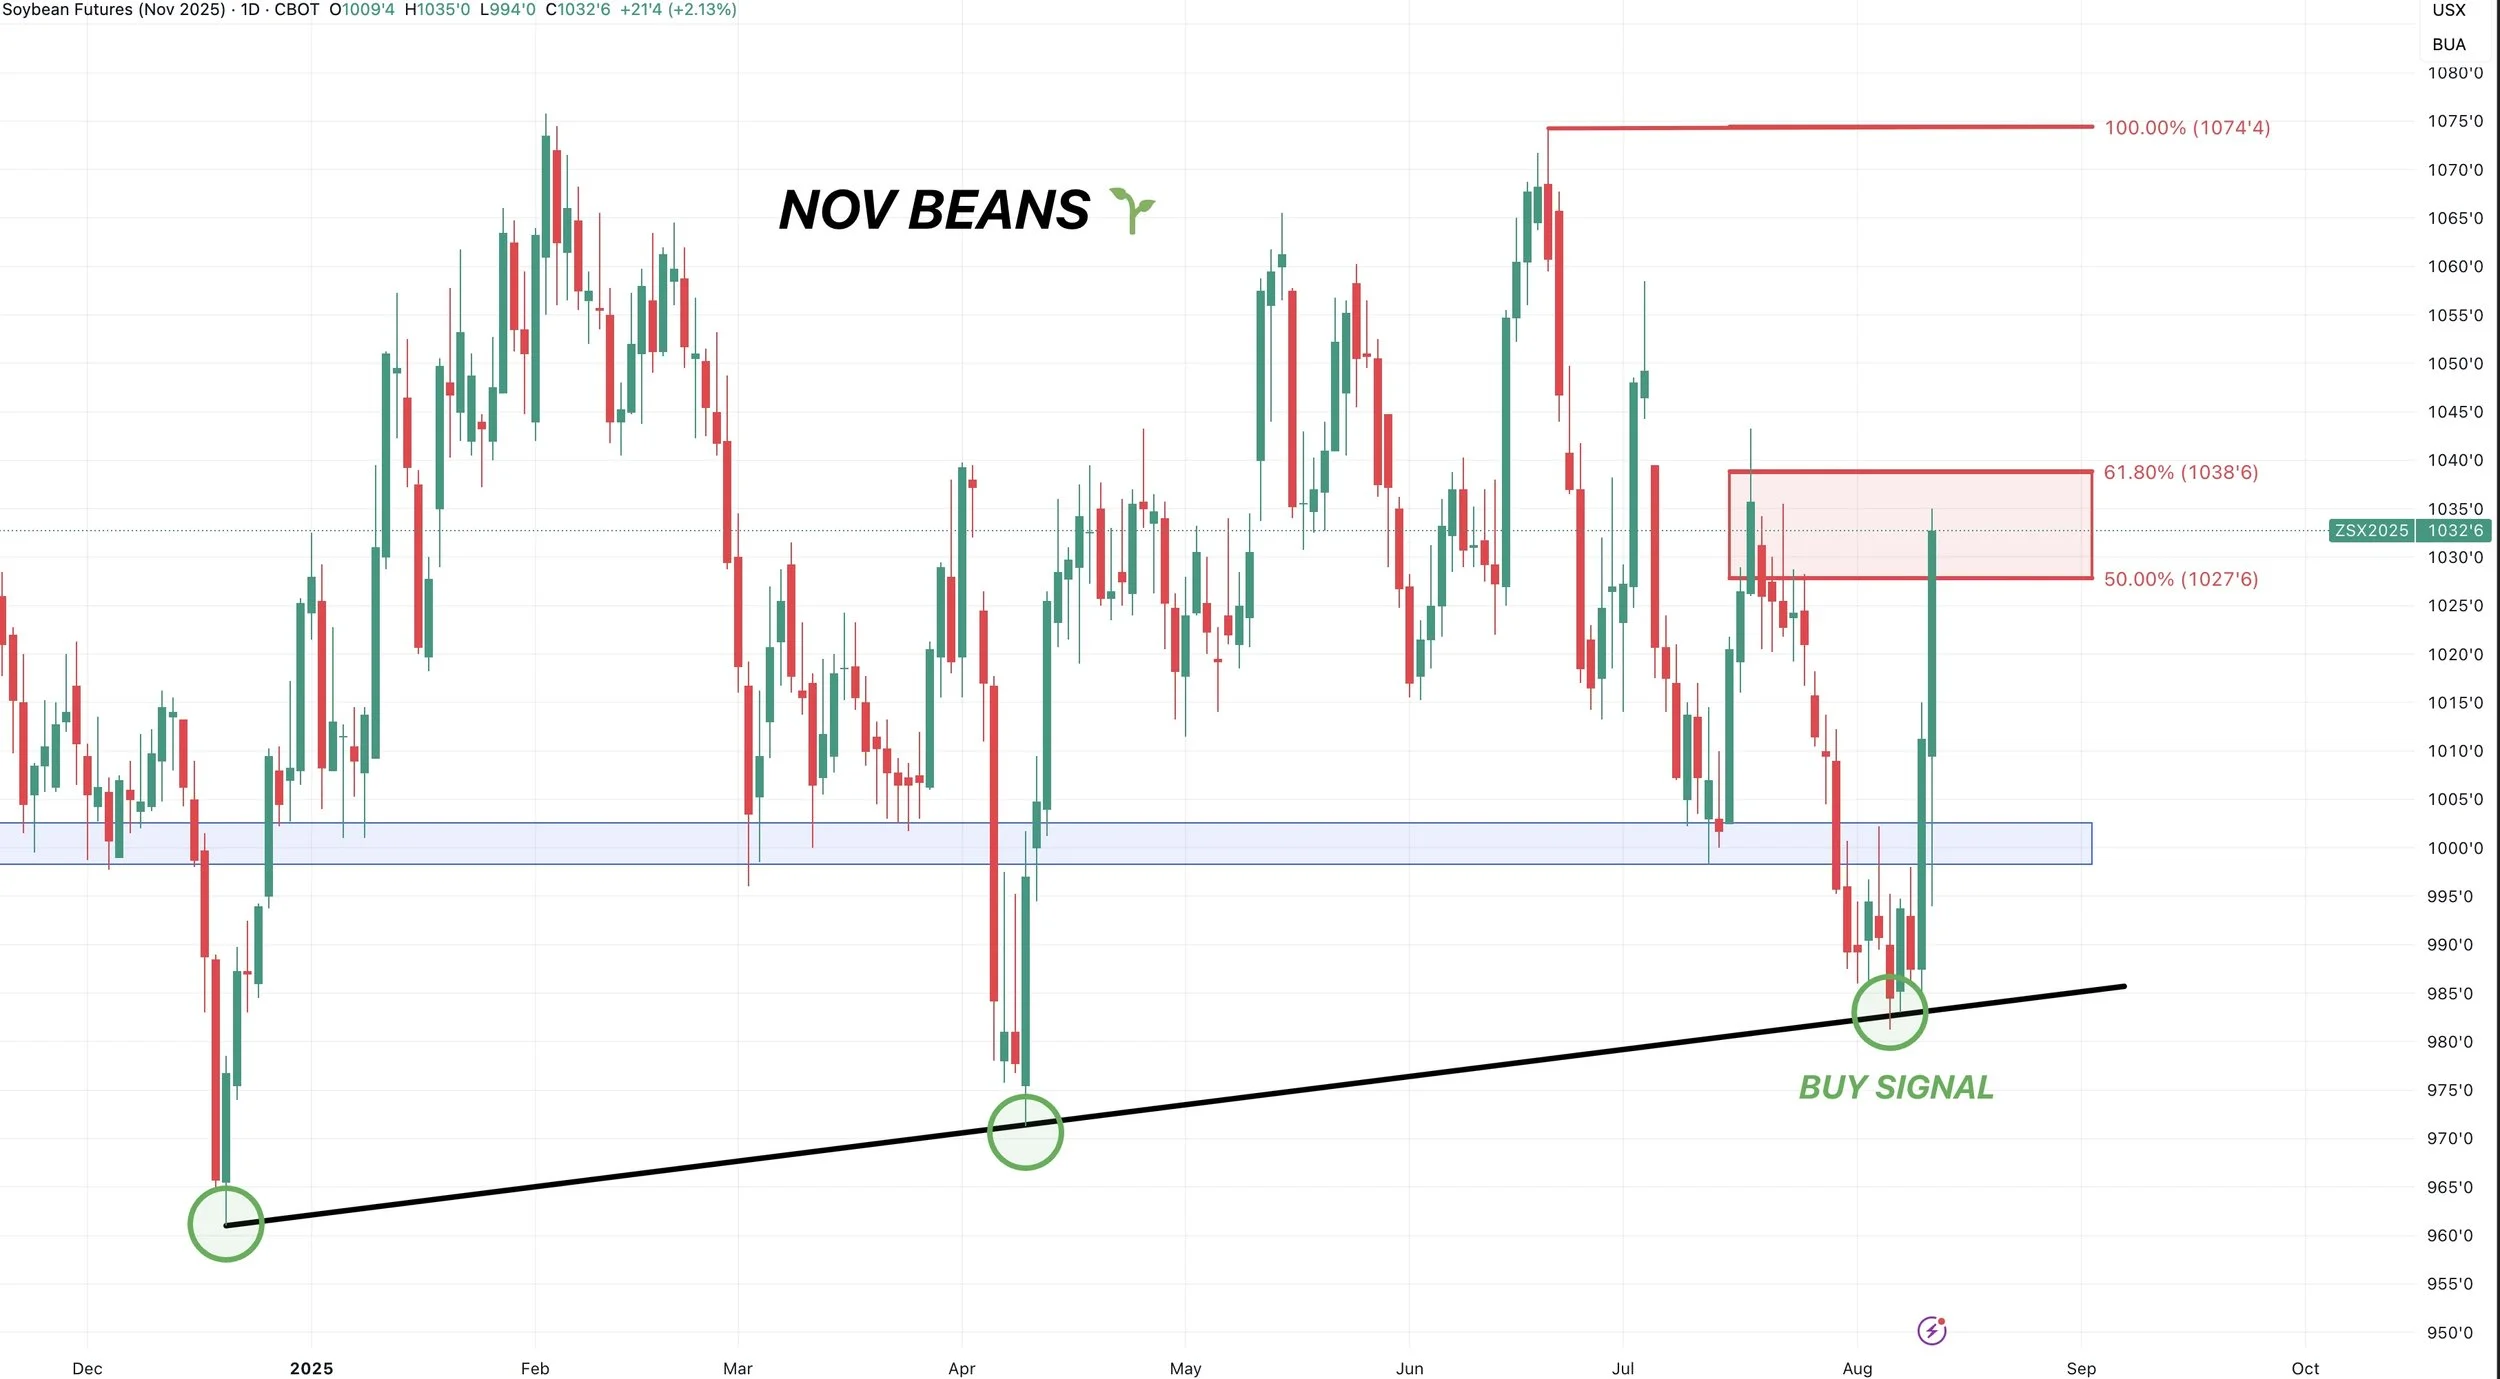
The biggest question mark is going to be China and demand.
Traders might be somewhat hesitant to truly get behind this market until we have confirmation and see something from China.
But would Trump really tweet that China needs soybeans if they weren’t going to eventually be buying our beans?
I think this ends the argument that if a deal is struck with China, it won’t include beans.
Now what happens if Trump strikes a deal with China? We already saw how soybeans reacted to just one tweet yesterday. Of course, no one knows when or if we will strike one. But the potential is certainly there.
We don’t have to go tremendously higher. But there are definitely a few possible factors that could result in us doing so if the cards fall right.
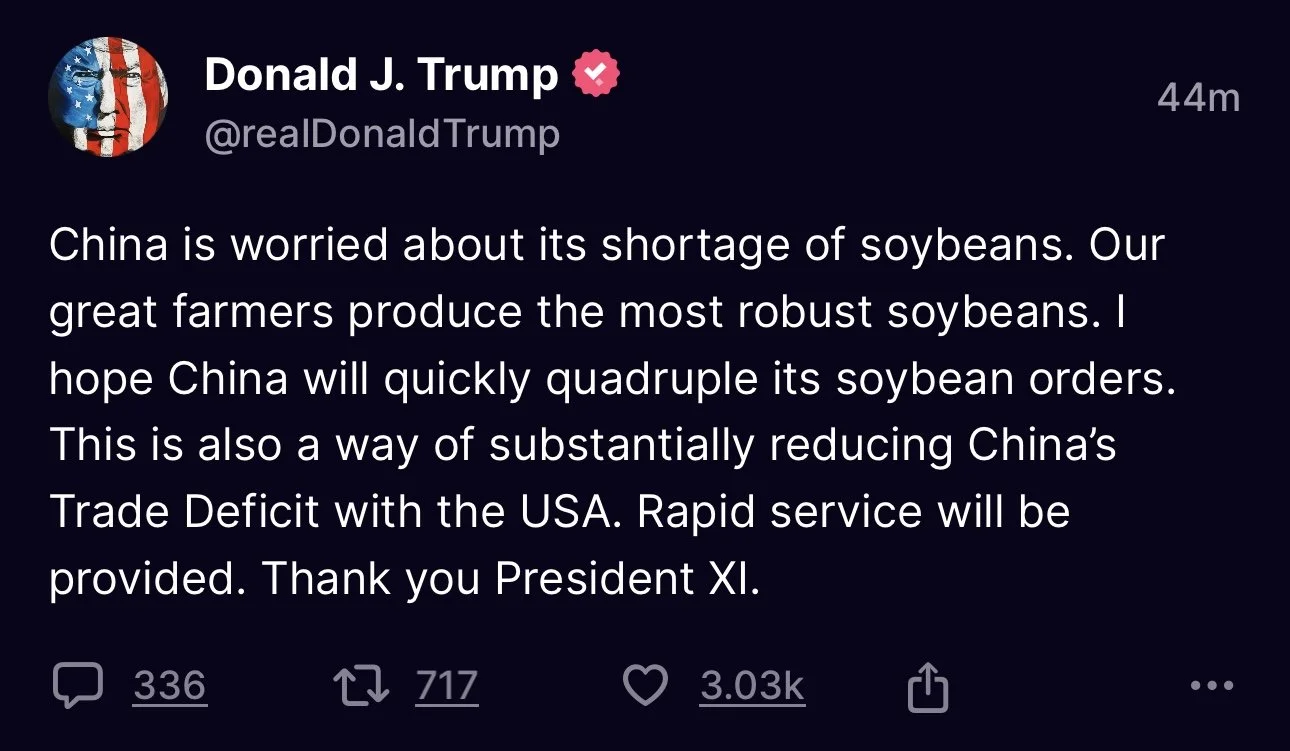
Technicals:
Nov beans blasted above the 61.8% retracement of the recent sell off.
That is a great sign and indicates this is more than just a corrective bounce.
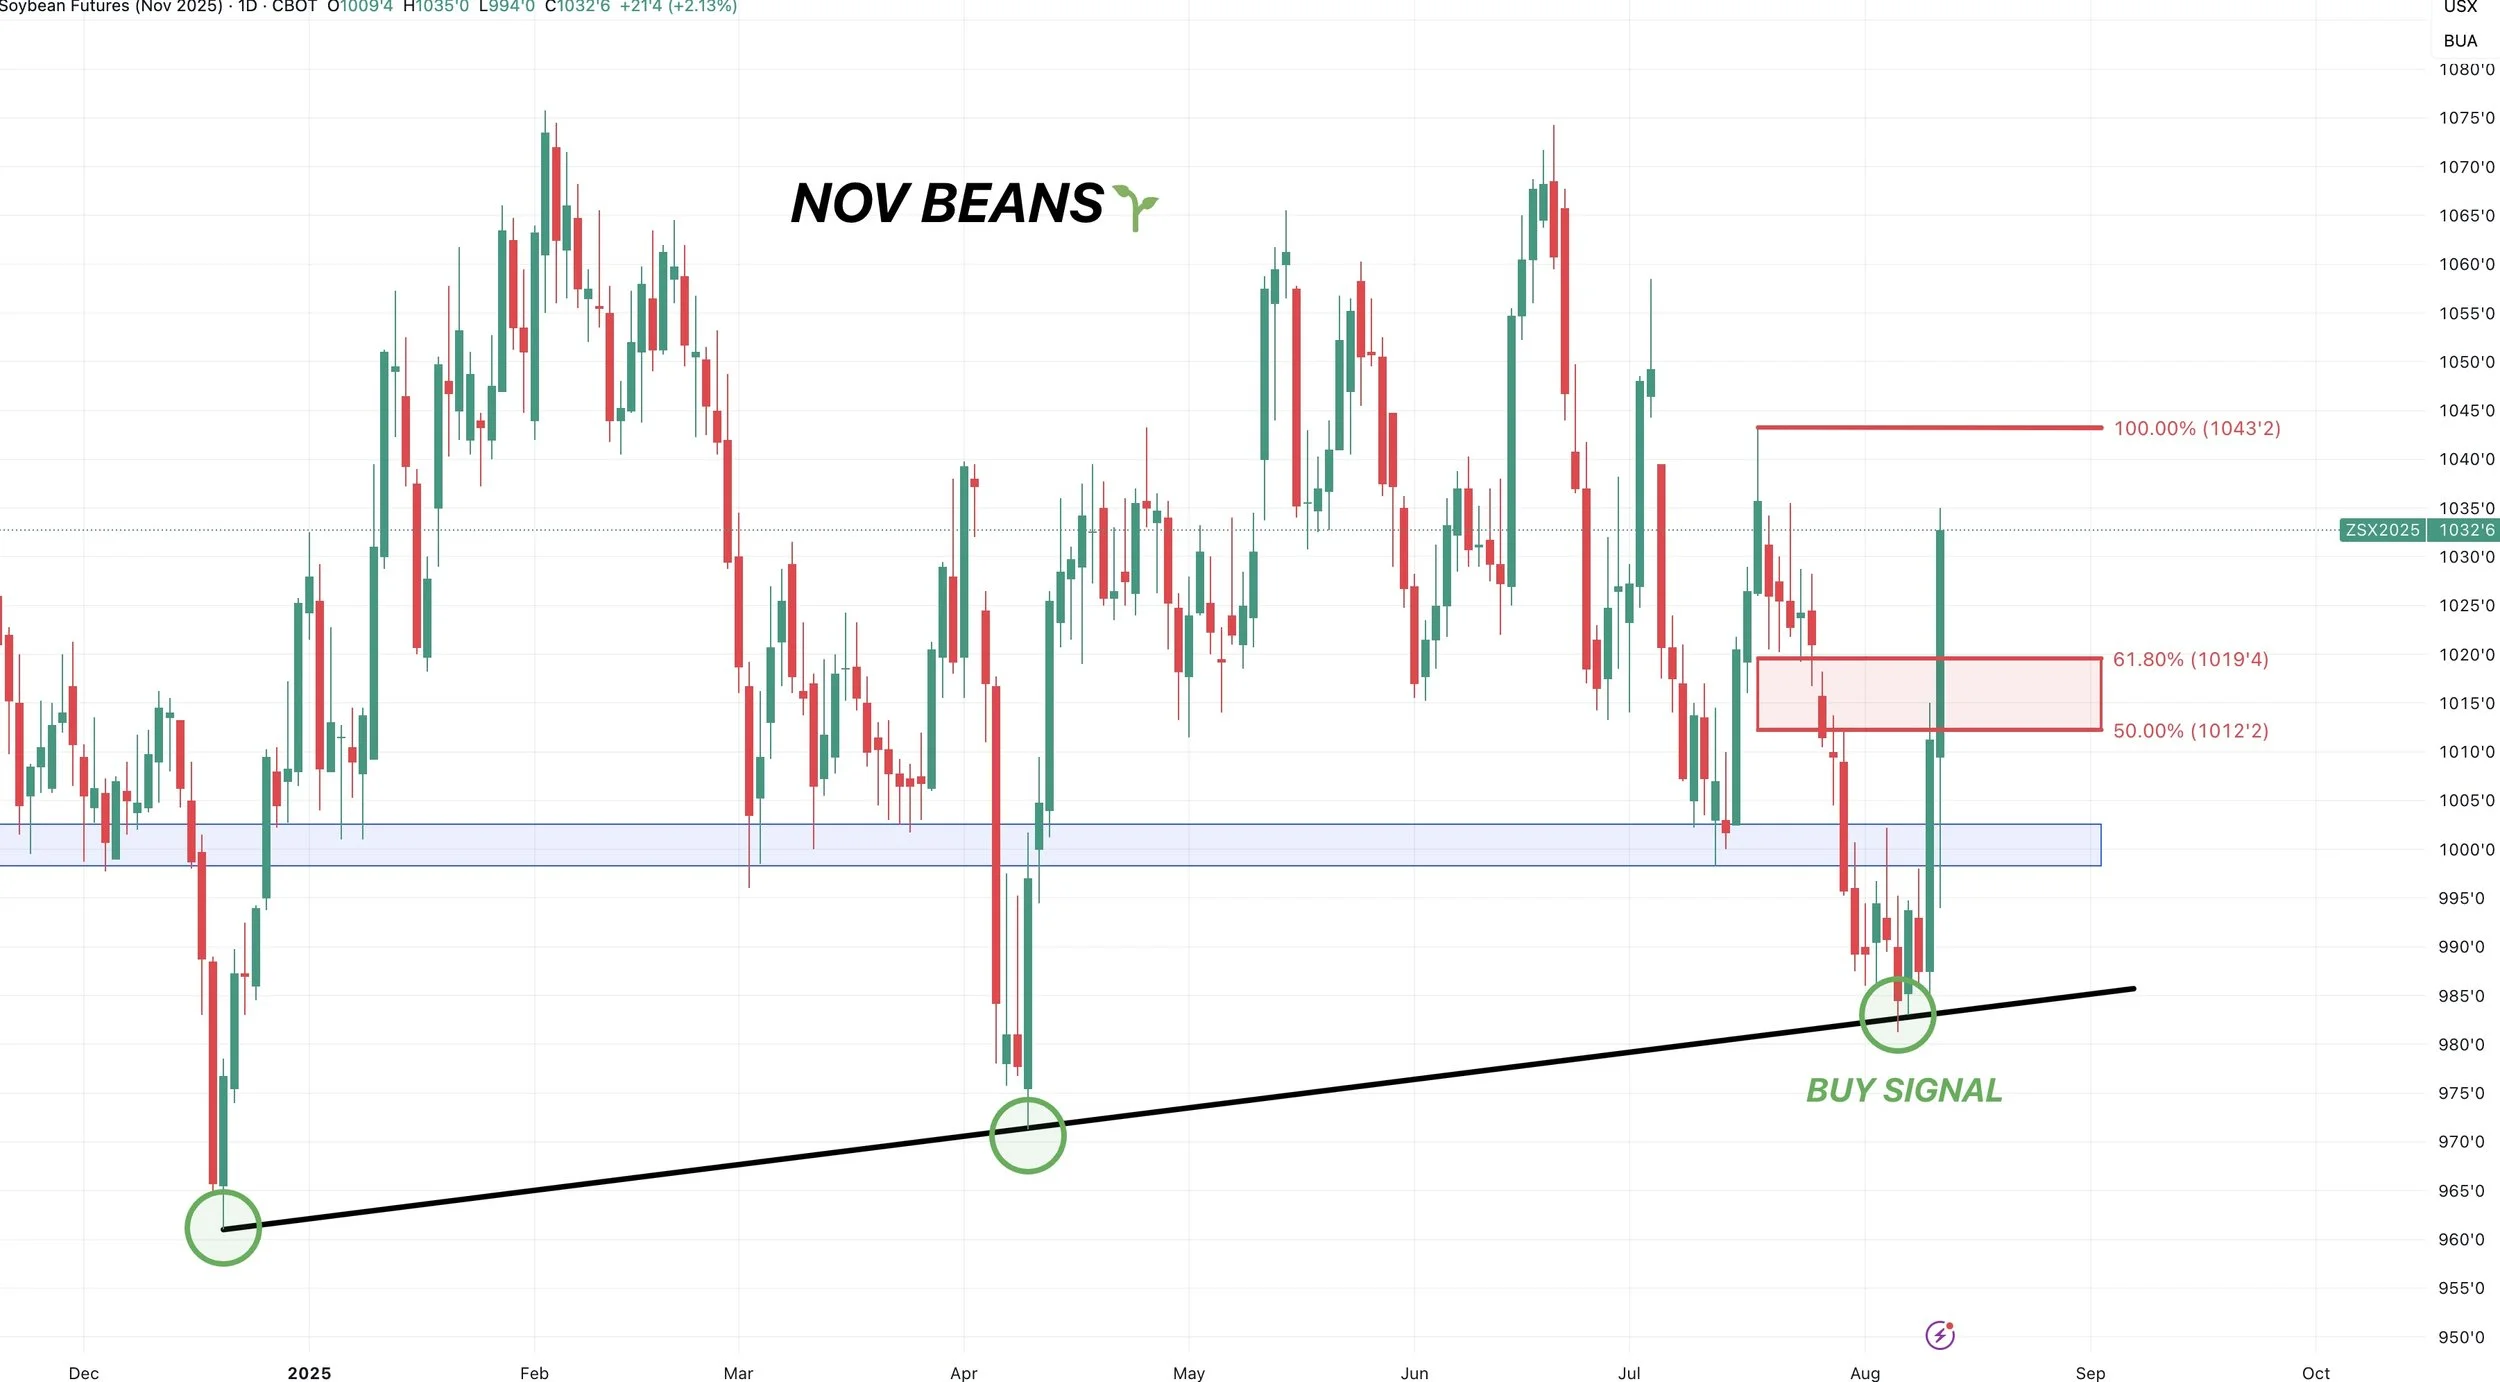
We are now sitting in the golden zone from the entire sell off.
The 50-61.8% retracements up to those June highs.
That $10.39 level is a big level. That is where the market typically makes a decision.
If we close above $10.39 it opens the door higher.
We are also breaking out of this falling wedge pattern.
This is seen as bullish.

Wheat
The corn and soybean numbers stole the show today, so we won’t spend a ton of time on wheat.
There weren’t any major changes on the report for wheat. It seems like it was mostly drug lower from the weakness in corn.
US ending stocks and world ending stocks were both slightly lower than expected for the wheat market.
But the US situation still isn’t in bullish territory.

Wheat production was a tad bearish overall but not massively.
Winter wheat acres surprised high.
Spring wheat acres surprised low.
The increase in winter offset the losses in spring, resulting in slightly higher overall production.

Bottom Line:
Wheat doesn’t have that "one factor" or "catalyst" to spark a major rally out of nowhere.
But at the same time, we are sitting at undervalued price levels in my opinion long term.
It might not happen today, or next week, but I think the wheat market is nearing some meaningful lows.
It just doesn’t have anything to get excited about today.
Technicals:
The charts actually don’t look half bad for the wheat market despite sitting at contract lows.
Sep Chicago is still sitting at the bottom of this massive wedge.

Sep Chicago is also showing some bullish RSI divergence.
(Prices made new lows, the RSI did not)
Which simply hints downside momentum is weakening.
Doesn’t mean we have to rally. But some optimism there.

KC wheat also still sitting in this massive wedge pattern.

Cattle
The cattle market continues to try and claw back the recent pullback.
Not much to update as most of the focus today was the USDA report.
I have no idea when this market is going to top.
What I do know is that I do not want to be unprotected when it does.
We want to simply put in floors and allow the bull market to run.
We like keeping puts under this thing. I am not a fan of using futures as that is where you can run into margin call problems if the run continues.
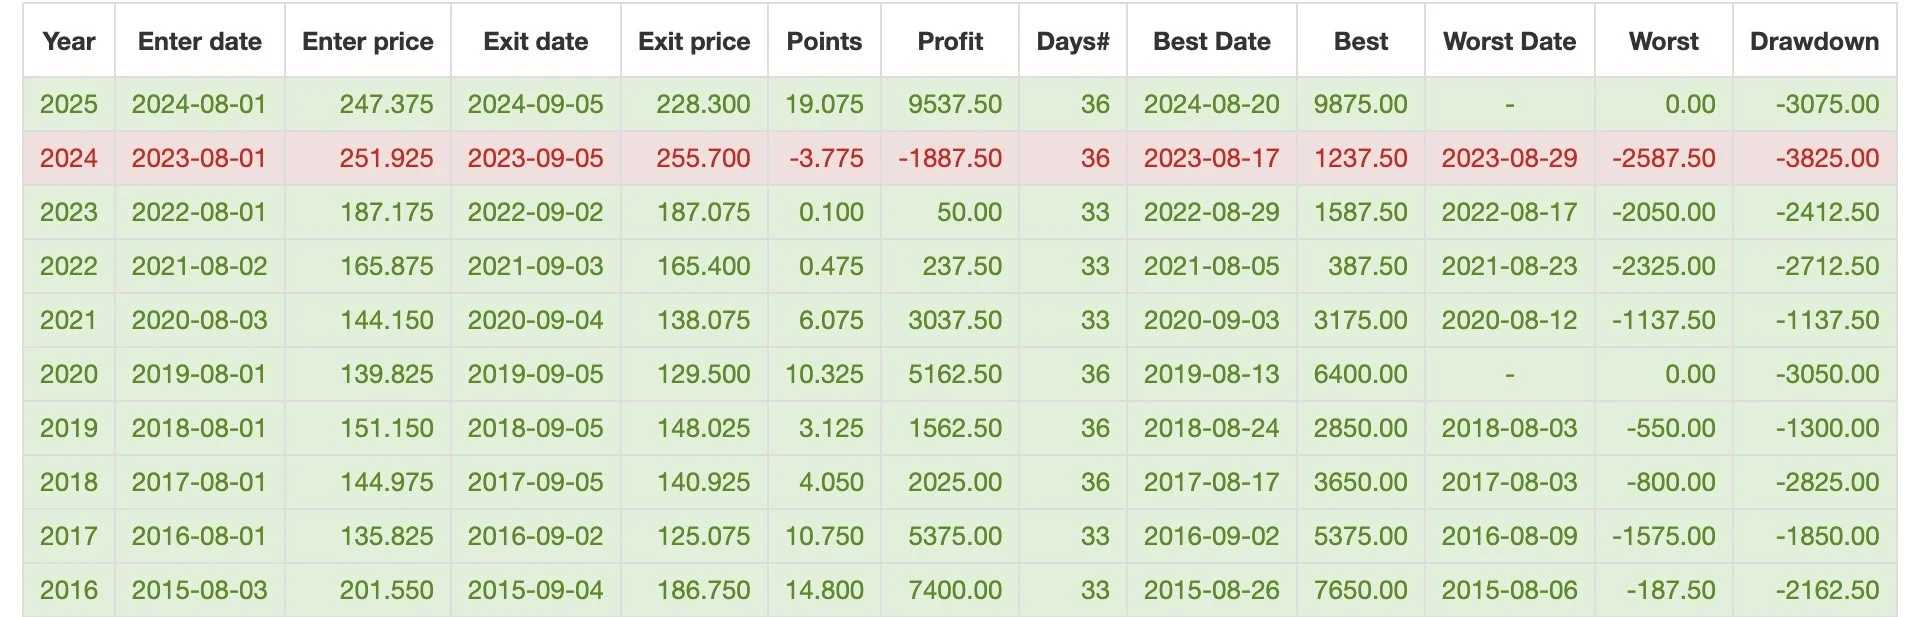
Like we have talked about several times, seasonally we do struggle.
As the last 9 of 10 years, cattle has traded lower in the month of August. Another reason to be cautious.
Again, not calling a top. Simply managing my risk.
Sep Feeder Chart:
If the run continues, that 2nd target still remains.
If we get a sizeable pullback, looking for at least the blue box. Which gives back 50-61.8% of the entire rally since June.
(The box moves higher if we make new highs)

Oct Live Chart:
Still sitting in our target box.
If we get a real pullback, looking for the blue box.

Past Sell or Protection Signals
We recently incorporated these. Here are our past signals.
July 31st: 🐮
Cattle sell signal & hedge alert.
July 10th: 🐮
Cattle sell signal & hedge alert.
CLICK HERE TO VIEW
June 5th: 🐮
Cattle sell signal & hedge alert.
June 2nd: 🌾
MPLS wheat sell signal.
April 10th: 🌽
Old crop corn sell signal.
March 19th: 🐮
Cattle hedge & sell signal.
Feb 18th: 🌽 🌾
Old crop KC wheat & old crop corn signal.
Jan 23rd: 🌽 🌱
Corn & beans old crop sell signal.
CLICK HERE TO VIEW
Jan 15th: 🌽 🌱
Corn & beans hedge alert/sell signal.
Jan 2nd: 🐮
Cattle hedge alert at new all-time highs & target.
Dec 11th: 🌽
Corn sell signal at $4.51 200-day MA
CLICK HERE TO VIEW
Oct 2nd: 🌾
Wheat sell signal at $6.12 target
Sep 30th: 🌽
Corn protection signal at $4.23-26
Sep 27th: 🌱
Soybean sell & protection signal at $10.65
Sep 13th: 🌾
Wheat sell signal at $5.98
May 22nd: 🌾
Wheat sell signal when wheat traded +$7.00
Want to Talk?
Our phones are open 24/7 for you guys if you ever need anything or want to discuss your operation.
Hedge Account
Interested in a hedge account? Use the link below to set up an account or shoot Jeremey a call at (605)295-3100.
Check Out Past Updates
8/11/25
TRUMP SAYS CHINA NEEDS BEANS. USDA TOMORROW
8/8/25
CALM BEFORE USDA STORM & CATTLE LIMIT DOWN
8/7/25
USDA PREVIEW & MORE DETAILS ON BUY SIGNAL
8/6/25
CORN REVERSAL? RIDING CATTLE RUN BUT BEING DISIPLINED
8/5/25
188 CORN YIELD? AUGUST CATTLE CONCERNS?
8/4/25
NEW CORN LOWS & USDA NEXT WEEK
8/1/25
STOUT DEMAND & WET JULY
7/31/25
WHERE IS CORN & BEAN BOTTOM? WAS THAT CATTLE TOP?
7/31/25
CATTLE HEDGE ALERT & SELL SIGNAL
7/30/25
ANY HOPE LEFT FOR GRAINS?
7/29/25
SEASONAL STRUGGLE CONTINUES
7/28/25
EXTREME BEARISHNESS PRICED INTO GRAINS. CATTLE WARNING SIGNS
7/25/25
NO REASON TO RALLY. NO REASON TO COLLAPSE
7/24/25
CORN DEMAND OVERSTATED? CATTLE CLOSE TO TOP?
7/23/25
JAPAN DEAL NOT ENOUGH
7/22/25
CROP RATINGS MATTER?
7/21/25
RAIN MAKES GRAIN
7/18/25
OVERNIGHT HEAT & ROOM FOR ERROR
7/17/25
POOR CORN EXPORTS MATTER? REWARD BEAN BOUNCE?
7/16/25
ARE CORN & BEANS UNDERVALUED OR NOT?
7/15/25
NEGATIVE NEWS POSITIVE ACTION IN GRAINS
7/14/25
DON’T GIVE GRAIN AWAY
7/11/25
USDA FRIENDLY CORN. MARKET DOESN’T CARE
7/10/25
JULY USDA OUT TOMORROW
7/10/25
CATTLE HEDGE ALERT & SELL SIGNAL
7/9/25
MARKET SEES RECORD CROPS
7/8/25
MONSTER CORN YIELD..?
7/7/25
TRUMP PUMP & DUMP
7/3/25
CORN & BEANS REJECT KEY SPOT. TRUMP SPEAKS IN IOWA
7/2/25
TRADE DEALS? BEANS RALLY AT GOLDEN ZONE
7/1/25
NOW WHAT FOR GRAINS?
6/30/25
BORING USDA. DIDN’T SAY HAVE TO GO LOWER
6/30/25
USDA NUMBERS
6/27/25
ALL EYES ON MONDAY
6/26/25
FIREWORKS OR BLOOD BATH MONDAY?
6/25/25
GRAINS COLLAPSING AHEAD OF JUNE REPORT
6/24/25
CORN CONTINUES SELL OFF. MAJOR USDA REPORT COMING
6/23/25
CORN CAN GO LOWER, BUT NOT FOR FOREVER
6/20/25
WHO SHOULD REWARD THE WHEAT & SOYBEAN RALLY?
6/18/25
COMPLETE CHART BREAKDOWNS
6/17/25
SOYBEANS CONTINUE BREAKOUT. NEARING SELL SIGNAL
6/16/25
CORN HAMMERED. EPA GAME CHANGER IN BEANS?
6/13/25
SOYBEANS RALLY, CHARTS, BALANCE SHEETS & MORE
6/12/25
USDA NON-EVENT. WHAT’S NEXT?
6/11/25
DIVERGENCE & SEASONAL SELL OFF?
6/10/25
BEING PATIENT VS BALANCING YOUR RISK
6/9/25
WHAT IF WE DON’T GET A WEATHER SCARE?
6/5/25
CORN & BEANS HOLDING CRUCIAL SPOTS
6/5/25
CATTLE SELL SIGNAL & HEDGE ALERT
6/4/25
HOW UNKNOWNS IMPACT MARKETING DECISIONS
6/3/25
KEY SPOTS ON THE CHARTS FOR CORN & BEANS
6/2/25
NEW LOWS IN CORN. DE-RISKING MPLS WHEAT
6/2/25
SPRING WHEAT SELL SIGNAL
5/30/25
SEASONAL RALLY STILL IN THE CARDS?
5/29/25
WHAT IS YOUR PLAN IF WE DO NOT RALLY?
5/28/25
ZERO PREMIUM IN THE GRAIN MARKETS
5/27/25
CORN CONDITIONS DISAPPOINT & JUNE OUTLOOK IMPROVES
5/23/25
TARIFFS SPOOK MARKET. GAME PLAN MOVING FORWARD
5/22/25
CHART BREAKDOWNS & TARGETS
5/21/25
RISK TO THE UPSIDE WITH WEATHER?
5/20/25
WHEAT SHORT COVERING & HISTORY OF YIELD CHANGES
5/19/25
ANYONE LEFT TO SELL WHEAT? 181 CORN YIELD POSSIBLE?
5/16/25
FUNDS SHORT CORN. MARKETS WAITING ON WEATHER
5/15/25
BEANS HAMMERED ON RUMOR & WHEAT FINDING LIFE
5/14/25
DECISIONS & POSSIBILITIES IN GRAINS
5/13/25
GRAINS RALLY OFF LOWS
5/12/25
USDA REPORT. HOW THIS CHANGES THINGS
5/9/25
BIGGEST RISKS IN USDA REPORT
5/8/25
USDA MONDAY & HISTORY OF WEATHER RALLIES
5/7/25
NEW 2025 LOWS FOR CORN
5/6/25
WHAT’S A SUMMER RALLY LOOK LIKE?
5/5/25
CORN ERASES ENTIRE APRIL RALLY
5/2/25
SELL INTO UNCERTAINTY. NOT KNOWN FACTORS
5/1/25
THE CASE AGAINST A FEB TOP IN CORN
4/30/25
APPROACHING KEY TIME PERIOD FOR GRAINS
4/29/25
PLANTING & FIRST NOTICE DAY PRESSURE. CORN CLOSE TO BOTTOM?
4/28/25
CAPTURING INVERSE & SEASONAL PREPARATION
4/25/25
HOW OFTEN DOES CORN NOT BREAK APRIL HIGHS?
4/24/25
KNOW WHEN TO SELL. BEANS BREAK 200-DAY FIRST TIME IN 483 DAYS
4/23/25
MONEY FLOW & DROUGHT CARDS
4/22/25
CRUCIAL SPOT FOR CORN & BEANS
4/21/25
NO PLANTING THREAT YET
4/18/25
POTENTIAL OPPORTUNITIES, BASIS CONTRACTS & STRATEGIES
4/16/25
HOW YIELD IMPACTS CARRYOUT. MAJOR SPOT FOR SOYBEANS
4/15/25
TOTAL CHART BREAKDOWNS & TARGETS
4/14/25
TECHNICAL SELLING IN GRAINS
4/11/25
SPECIFIC GRAIN MARKETING DECISIONS
4/10/25
USDA REPORT. HOW THIS IMPACTS CORN
4/9/25
TARIFFS GIVE. TARIFFS TAKE
4/8/25
CORN’S DIVERGING STRENGTH
4/7/25
SOLID PRICE ACTION DESPITE OUTSIDE FEAR
4/4/25
CORN PRICE ACTION SPEAKS VOLUME. ANY HOPE LEFT FOR SOYBEANS?
4/3/25
WHAT IS LEFT FOR CORN BEARS? TRADE WAR: CHARTS HOLDING SUPPORT
4/2/25
SHOULD UNKNOWNS KEEP A FLOOR UNDER GRAIN PRICES?
4/1/25
HOW DO ACRES IMPACT FUTURE OF THE GRAINS?
3/31/25
USDA REPORT: NOW WHAT?
3/28/25
ALL EYES ON USDA
3/27/25
PRE-USDA POSITIONING. DON’T GIVE GRAIN AWAY
3/26/25
HISTORY OF MARCH INTENTIONS. SOYBEANS UNDERVALUED?
3/25/25
6 DAYS UNTIL MAJOR USDA REPORT
3/24/25
HOW TO POSITION YOURSELF BEFORE PLANTING
3/21/25
REASONS TO BE OPTIMISTIC IN GRAINS?
3/20/25
WAS THAT THE BOTTOM IN CORN?
3/19/25
THE PATH HIGHER & THE DOWNSIDE RISKS IN GRAINS
3/18/25
SEASONALS, CATTLE HEDGE, CHARTS & DROUGHT?
3/17/25
WHEAT RALLIES. DON’T GET BACKED INTO A CORNER
3/14/25
MARCH 31ST REPORT THOUGHTS & WHAT’S NEXT FOR GRAINS
3/13/25
EXPLAINING RE-OWNERSHIP VS COURAGE CALLS
3/12/25
TARIFF FEARS. EU, CANADA, & ETHANOL
3/11/25
USDA SNOOZE. RECORD FUND SELLING A CONCERN?
3/10/25
USDA TOMORROW. GETTING COMFORTABLE IN MARKETING
3/7/25
HOW TIGHT IS THE WORLD & US SITUATION?
3/6/25
TARIFFS PUSHED BACK. FUTURE OPPORTUNITIES?
3/5/25
IS GRAINS BIGGEST RISK WEAK CRUDE & DEFLATION?
3/4/25
TRADE WAR BEGINS. 8TH DAY OF PAIN FOR GRAINS
3/3/25
TARIFFS ON TOMORROW. BUY SIGNAL
3/3/25
BUY SIGNAL
2/28/25
WHEN WILL THE BLEEDING STOP?
2/27/25
CORN AT CRITICAL SPOT. USDA ACRE REPORT. WAY TOO EARLY DROUGHT TALK
2/26/25
HISTORY SUGGESTS CORN TOP ISN’T IN? ACRE OUTLOOK TOMORROW
2/25/25
POSITIVE CLOSE. WHAT TO KNOW ABOUT USDA OUTLOOK
2/24/25
USDA OUTLOOK, FIRST NOTICE DAY & BRAZIL
2/21/25
WHAT TO EXPECT MOVING FORWARD IN GRAINS
2/20/25
FIRST NOTICE DAY CONCERNS. MASSIVE CORN ACRES OR NOT?
2/19/25
HOW TIGHT IS THE CORN SITUATION?
2/18/25
MORE DETAILS ON TODAYS SELL SIGNAL
2/18/25
OLD CROP KC WHEAT & CORN SELL SIGNAL
2/14/25
WHEAT BREAKING OUT ON WEATHER RISK. TECHNICALS & FUNDAMENTALS
2/12/25
GLOBAL GRAIN SITUATION, ACRE TALK, CHARTS & MORE
2/11/25
USDA: NOT A BEARISH REPORT. DISAPPOINTING PRICE ACTION
2/10/25
USDA TOMORROW. LONG TERM PATH FOR SUB 10% CORN STOCKS TO USE?
2/7/25
WHY WOULD THE FUNDS EXIT THEIR LONGS?
2/6/25
WHEAT FINALLY CATCHING A BID
2/5/25
COMPLETE THOUGHTS ON MARKETS: BACK & FORTH DISCUSSION
2/4/25
STRONG JANUARY LEAD TO STRONG YEAR? TARIFFS, CHARTS & MORE
2/3/25
TARIFFS PUSHED BACK
1/31/25
TARIFF NEWS ALL OVER THE PLACE. ARE YOU PREPARED FOR POSSIBILITIES?
1/30/25
WHEAT BULL ARGUMENT. TRUMP ADDS TARIFFS
1/29/25
CORN APPROACHES $5.00
1/28/25
TARIFFS, CORN FUNDS, SOUTH AMERICA & MORE
1/27/25
HEALTHY CORRECTION WE TALKED ABOUT & TARIFF NEWS
1/24/25
GRAINS DUE FOR SHORT TERM CORRECTION?
1/23/25
OUR ENTIRE NEW CROP SALES THOUGHTS & OLD CROP SELL SIGNAL
1/22/25
GRAINS TAKE A BREATHER. IS CORN IN A BULL OR BEAR MARKET?
1/21/25
HUGE DAY IN GRAINS. WHAT TO DO WITH OLD CROP VS NEW CROP
Read More
1/20/25
VIDEO CHART UPDATE
1/17/25
TRUMP, CHINA, ARGY & USING THE SPREADS INVERSE
1/16/25
OLD CROP LEADS US LOWER. MARKETING THOUGHTS
1/15/25
SIGNAL & HEDGE ALERT QUESTIONS EXPLAINED. IS $6 CORN EVEN POSSIBLE?
1/14/25
MORE DETAILS ON TODAYS HEDGE ALERT & SELL SIGNAL
1/14/25
CORN & SOYBEANS HEDGE ALERT/SELL SIGNAL
1/13/25
USDA GAME CHANGER OR NOT?
1/10/25
BULLISH USDA FOR CORN & BEANS
1/9/25
USDA OUT TOMORROW
1/8/25
2 DAYS UNTIL USDA. BE PREPARED
1/7/25
THE HISTORY OF THE JAN USDA & MORE
1/6/25
MAJOR USDA REPORT FRIDAY
Read More
1/3/25
UGLY DAY ACROSS THE GRAINS
1/2/25