
SOYBEAN BREAKOUT & USDA VS CROP TOUR
MARKET UPDATE
You can scroll to read the usual update as well. As the written version is the exact same as the video.
Timestamps for video:
Crop Tour vs USDA: 0:00min
Corn: 5:40min
Beans: 8:10min
Bean Target & Charts: 11:10min
Wheat: 14:15min
Cattle: 15:55min
Want to talk about your situation?
(605)295-3100
Your free trial has ended
Subscribe if you’d like to receive our next sell signal & keep getting our daily updates
Labor Day Sale: CLICK HERE
Futures Prices Close
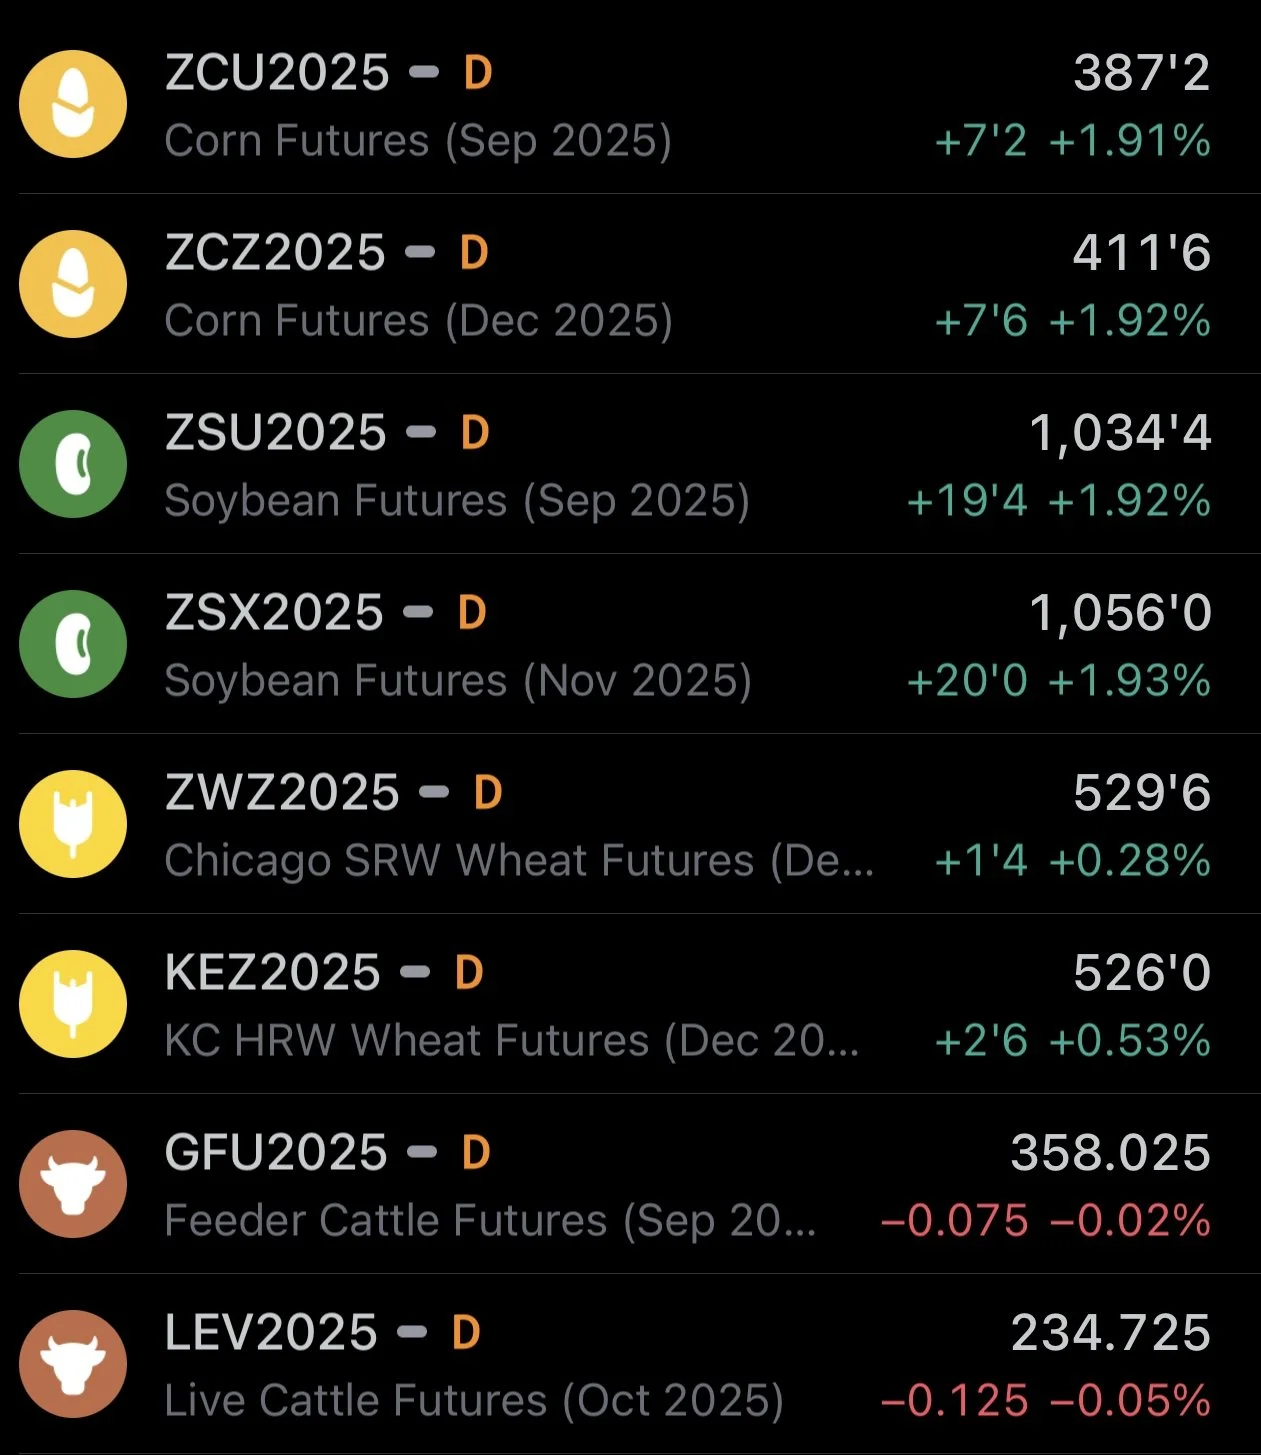
Overview
Great day for the grains today as soybeans break above $10.50, rallying to 2-month highs. While the corn market sees some life, now trading higher than where we were before the bearish USDA report.
Today, we're going to go over the full crop tour vs USDA comparisons.
Then we'll get into some EPA news behind the bean rally, the phenomenal corn demand, and dive into the charts.
Yesterday we alerted a wheat buy signal, which we touch more on later.
If you followed our recent corn buy signal, we hit our short term target and up against resistance. So make sure you look at that as well.
Full USDA vs Crop Tour Comparison
This data shows just the 5 states we have the full crop tour numbers for.
So it does not include Minnesota and Iowa. But we know Iowa is going to have a monster crop.
But let's dive into the data.
What does this data tell us? Is the USDA too high on some states?
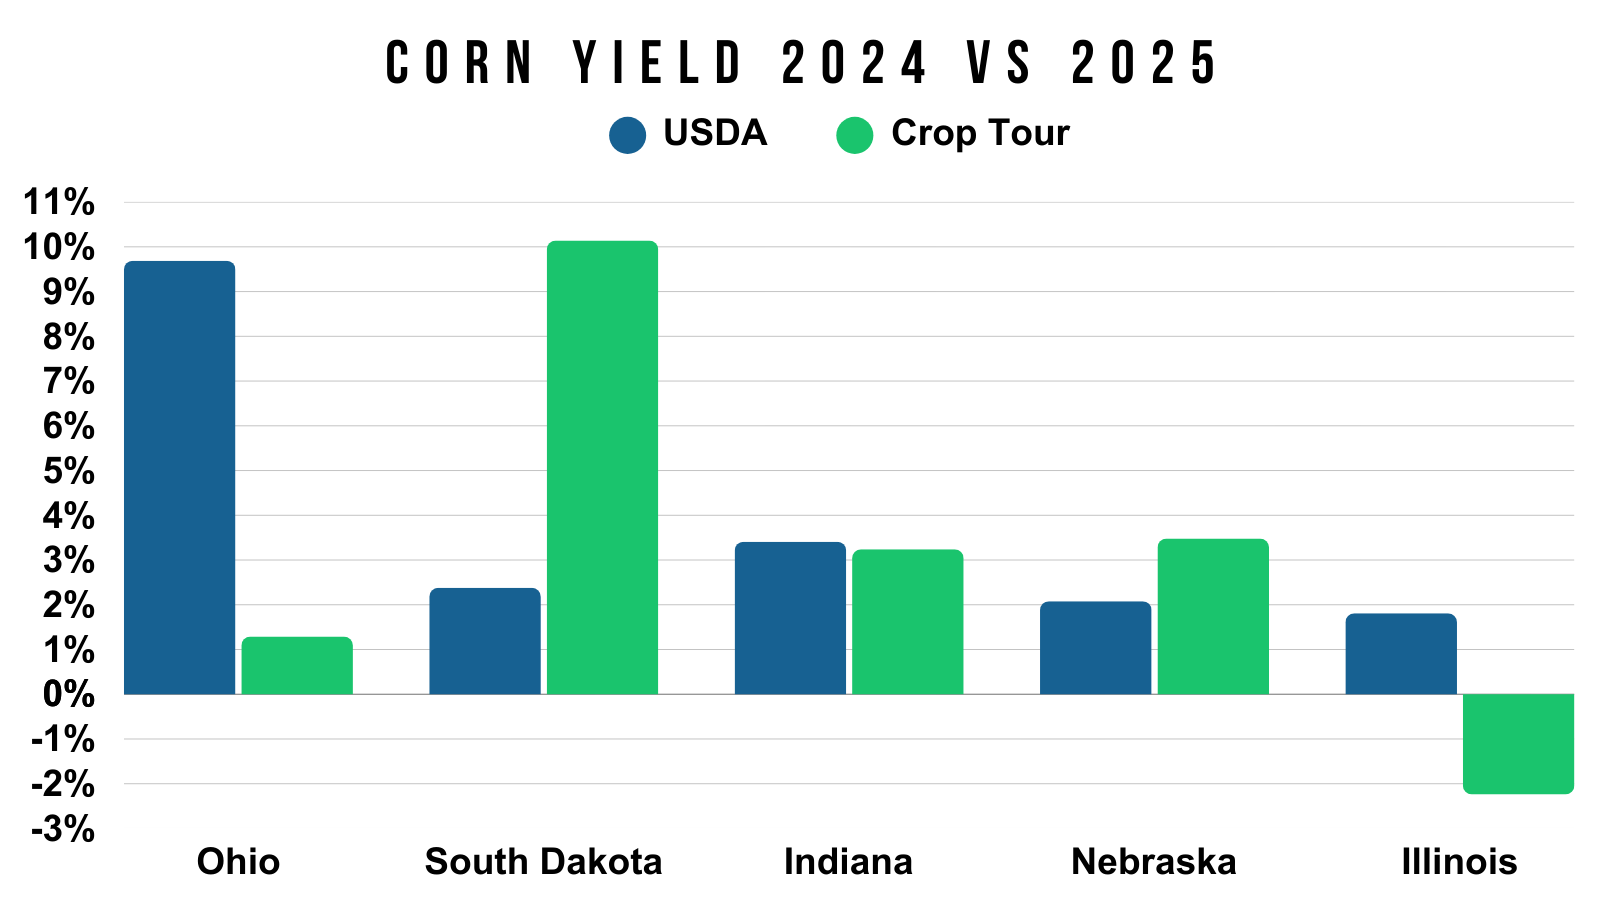
This first chart shows how both the crop tour and USDA see the crop changing year over year.
I think this is a better representation than straight up yield numbers, because the tour is historically way off on the actual yield numbers.
But this chart shows how much bigger or smaller the tour sees yield, compared to how much bigger or smaller the USDA sees yield.
Ohio: The USDA sees this crop as being way bigger than last year by +9.7%. Meanwhile, the crop tour only sees the crop being 1.3% bigger than last year. A massive difference.
South Dakota: The USDA only sees their crop +2.4% bigger than last year. However, the tour sees it as +10.1% bigger. But the caveat here is that the tour only covers a small corner of the state. Our next chart will go over why this huge number isn’t entirely accurate.
Indiana: The USDA has the crop +3.4% bigger, the tour has it +3.25% bigger. Pretty close numbers.
Nebraska: The USDA sees the crop +2.1% bigger, the crop tour had it +3.5% bigger. So the tour thinks it's slightly bigger than the USDA does.
Illinois: Here is where things get interesting. The USDA has Illinois corn up +1.8% vs last year. The tour actually has it down -2.25% vs last year. Which means the USDA is probably too optimistic.
"But the tour isn’t always accurate."
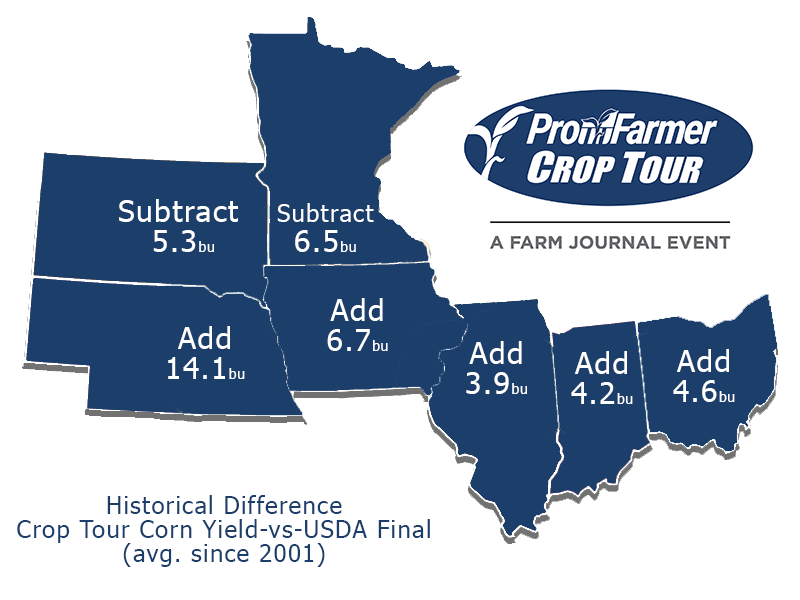
That is correct. Which is why they provide us with their historical differences.
How much they are usually off compared to the USDA.
Here is that data.
Usually the tour is too light on every state besides South Dakota and Minnestoa. For those two, the tour usually has the crop too big.
Which explains the big South Dakota number (again they only toured a small corner in the southeastern part of the state).
Since the tour is usually off, let's compile the data to see where the crops might actually be at.
Below is the USDA's yield, the crop tour's yield, and what yield would be if the tour missed by their historical average. (based on the chart above).
Ohio:
USDA: 196
Crop Tour: 185.69
Historical: 190.79 (+5.1)
South Dakota:
USDA: 168
Crop Tour: 174.18
Historical: 169.58 (-4.6)
Indiana:
USDA: 205
Crop Tour: 193.82
Historical: 198.32 (+4.5)
Nebraska:
USDA: 192
Crop Tour: 179.50
Historical: 193.6 (+14.1)
Illinois:
USDA: 221
Crop Tour: 199.57
Historical: 203.77 (+4.2)
The biggest takeaways from this?
The USDA is probably too high on their Illinois and Ohio estimates. Perhaps too high on Indiana as well. Basically the central/eastern corn belt.
They are probably relatively close on their Nebraska and South Dakota estimates.
What happens to production if our 2nd biggest producing state of Illinois is way too light vs the estimates?
Here is a visual of the numbers we just mentioned.

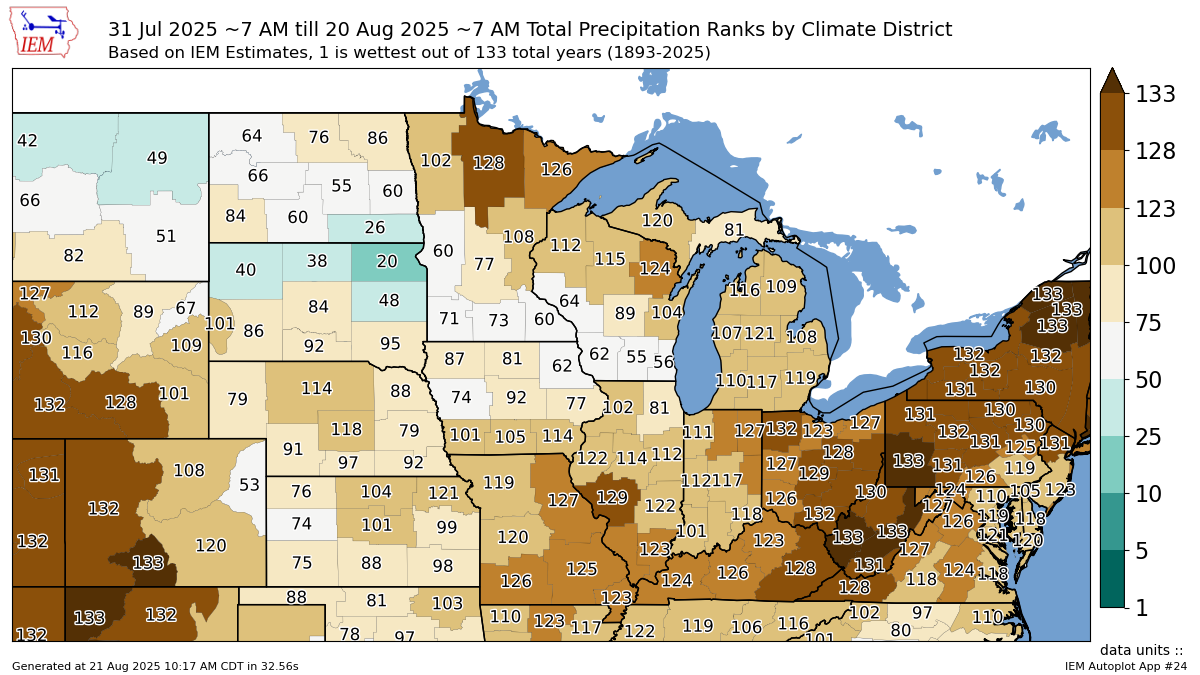
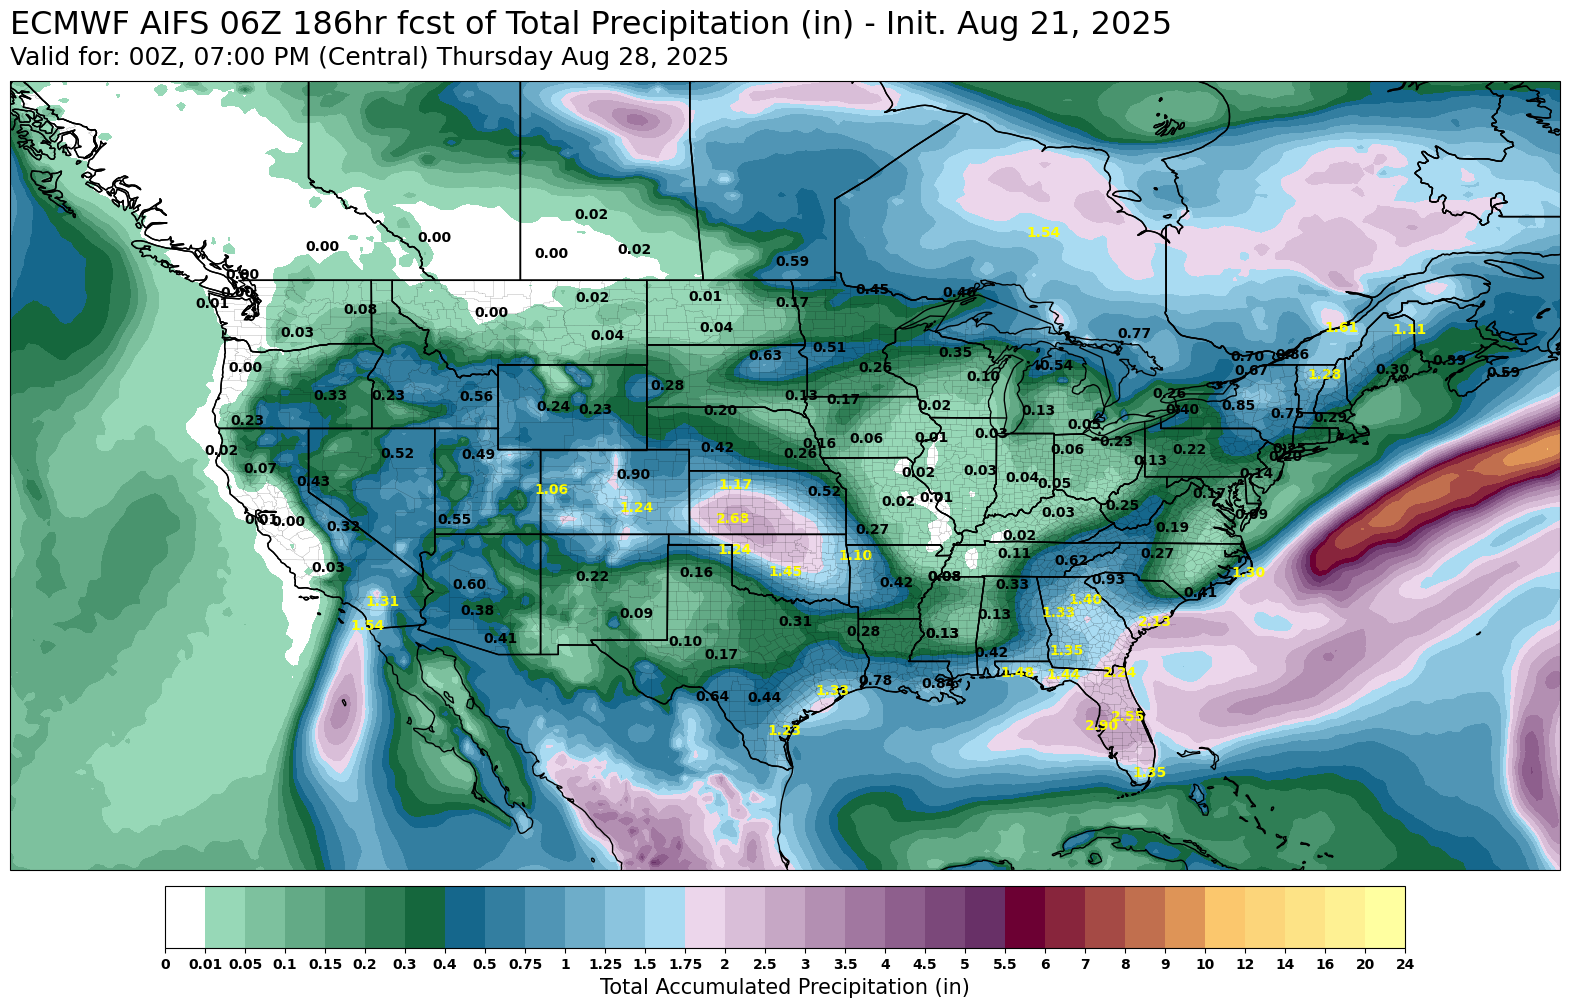
Dry August Finish
Here is the precip rankings for August.
It sure is a good thing that August whether doesn’t matter to production *insert sarcasm*
Nearly the entire corn belt has been dry this August.
Especially the eastern corn belt.
Which further ignites the idea that the USDA is probably too high on their eastern states yield estimates. Just like the crop tour data suggests.
To add on to this, the forecast for the next week is dry too.
With virtually zero rain across most of the corn belt.
August weather matters. We saw what happened last year.
Today's Main Takeaways
Corn
Amazing New Crop Demand:
New crop corn exports continue to shatter expectations.
Here are two great charts from Karen Braun to give you a visual on just how strong new crop corn demand has been.
Here is export sales through today's date vs other years.
We have already achieved 23% of the USDA 25/26 marketing year forecast.
By far the 2nd highest only behind the China led buying in 2021/22.
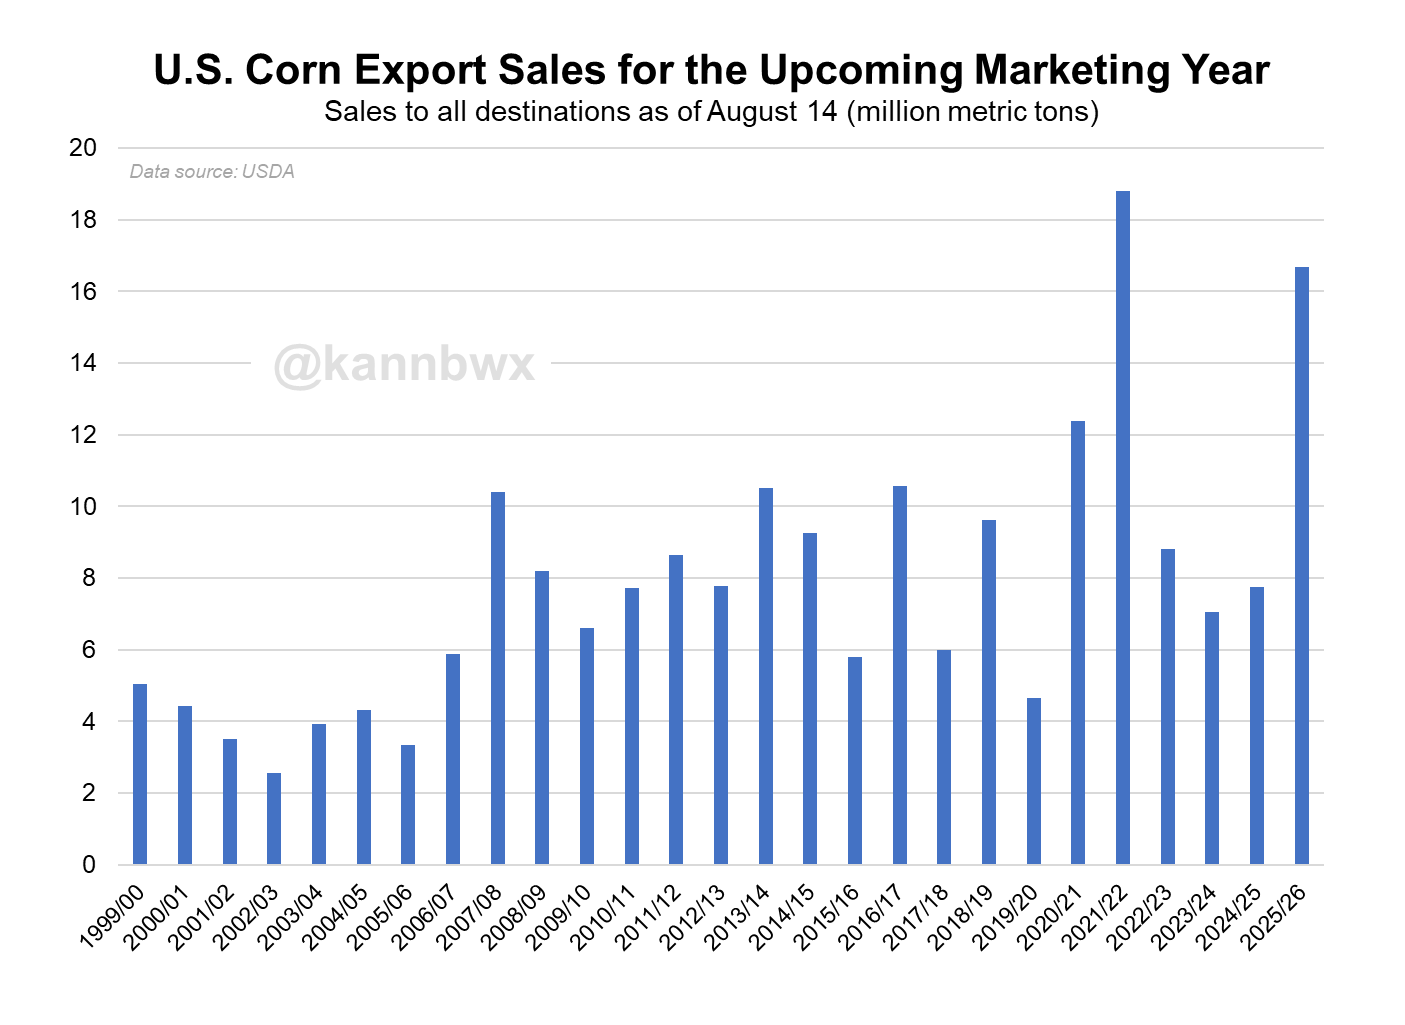
Since 2021/22 was led entirely by China.
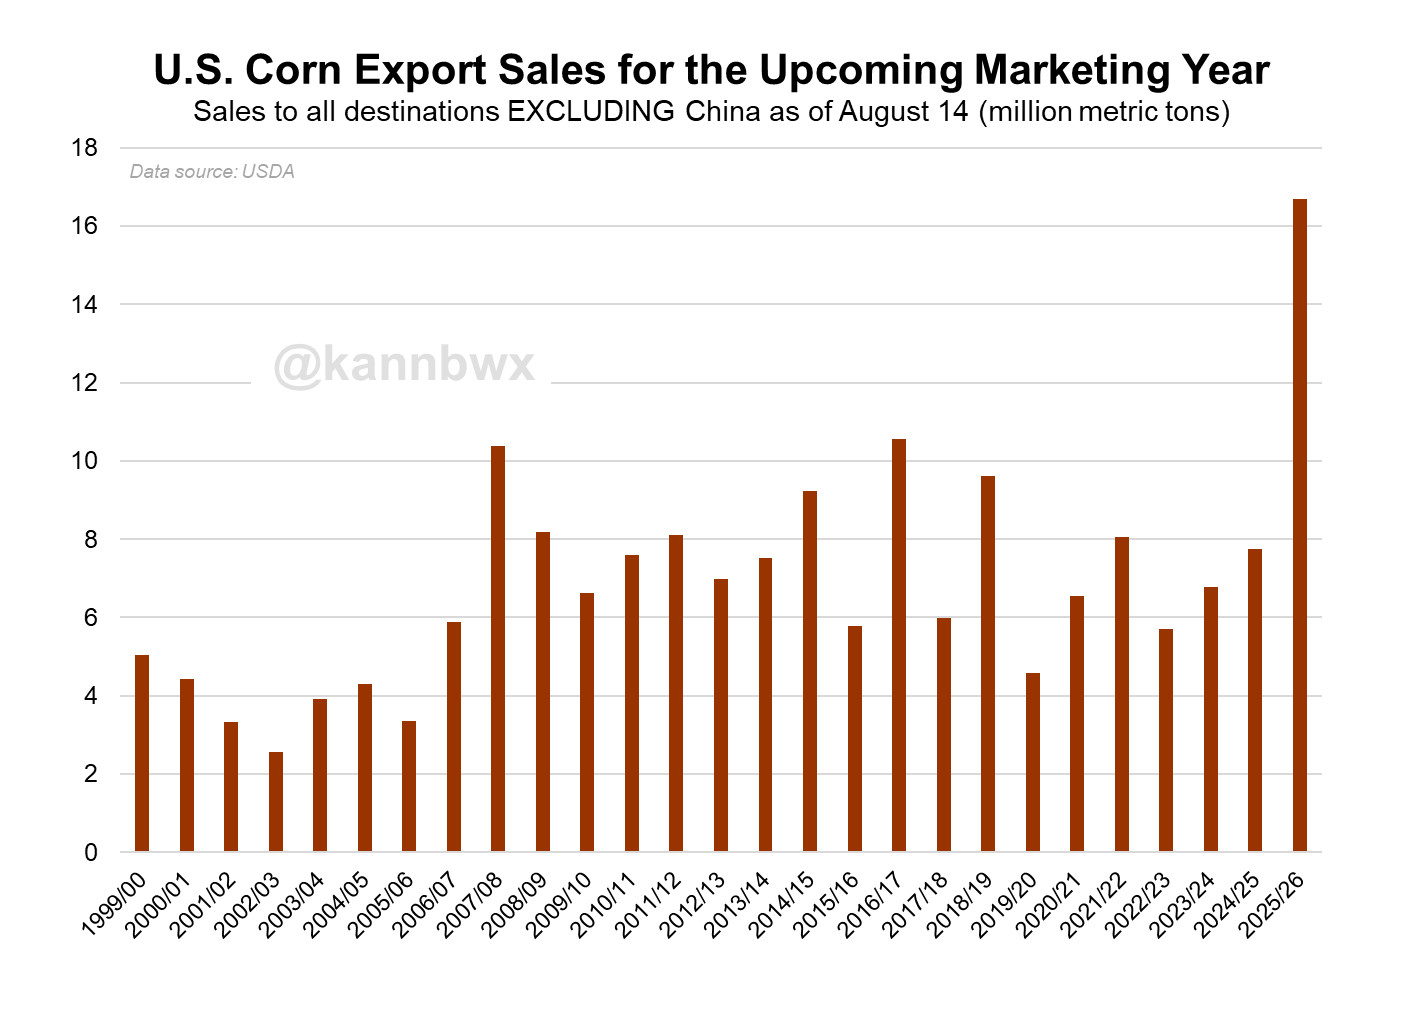
Here is what new crop exports look like if you removed China.
Absolutely massive numbers.
Surpassing every single other year by a mile.
As we are nearly +60% higher than the next highest year of 2016/17.
It doesn’t look like export demand isn’t going anywhere.
Not much else on corn today, as it's usually the one we do the deepest dive on.
Currently just remaining patient.
We don’t have a reason to see a face melting rally tomorrow, as we do have an additional 1 billion bushels of supply to chew through.
We could go lower, but I don’t see a reason why we'd have to spend an extended amount of time below $4.00
We got our highest production print of the year we are going to see.
Demand is stellar.
Seasonally we carve out lows here within the next few weeks if we haven’t already.
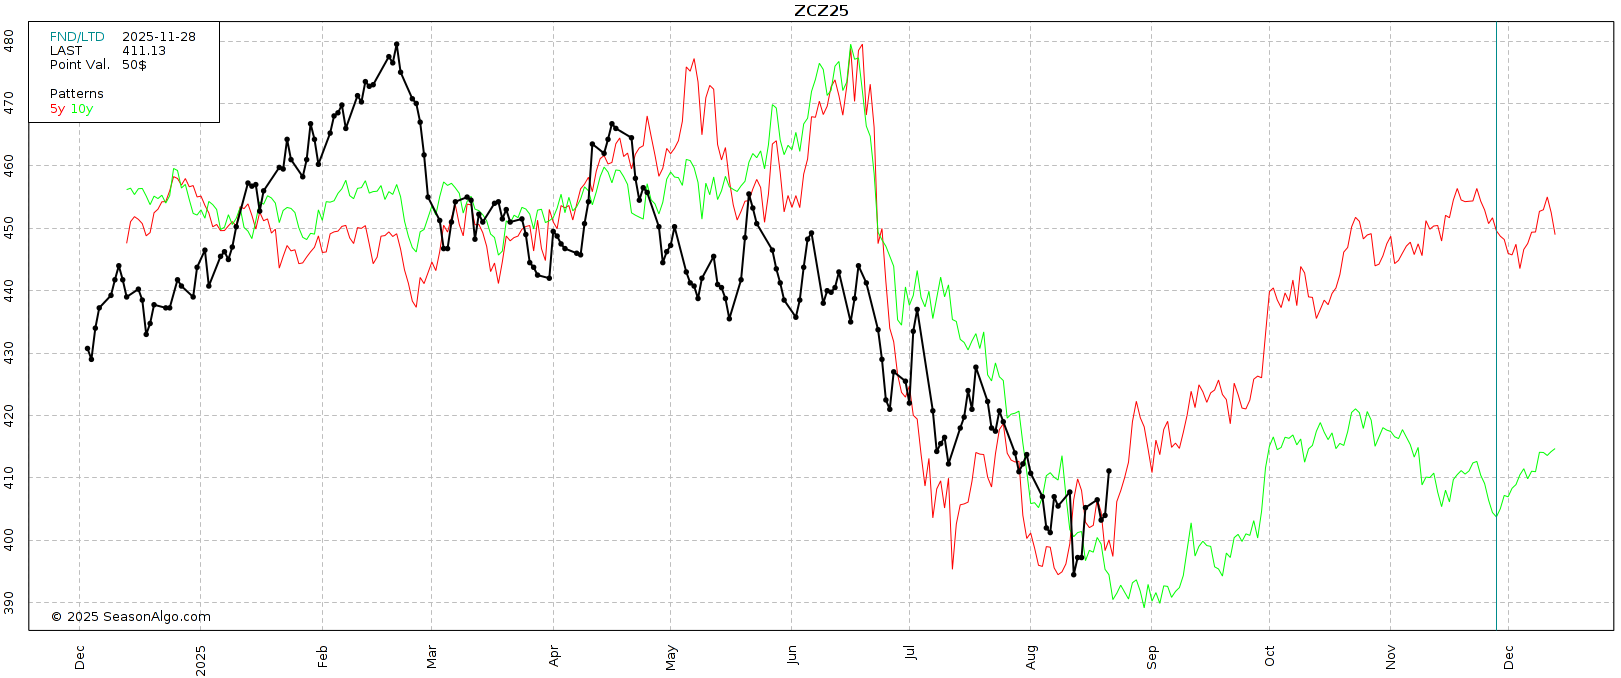
Weekly Dec Chart:
First let's look at the weekly chart for Dec corn.
I actually like this chart a lot.
It makes me "hopeful" we've put in our lows. But still no confirmation.
Last week we printed a very nice candle, rallying +14 cents off the lows. Leaving a dragon fly, which is considered bullish if you get follow through to the upside.
Currently, we are seeing some follow through and are above last week's high which is a good sign.

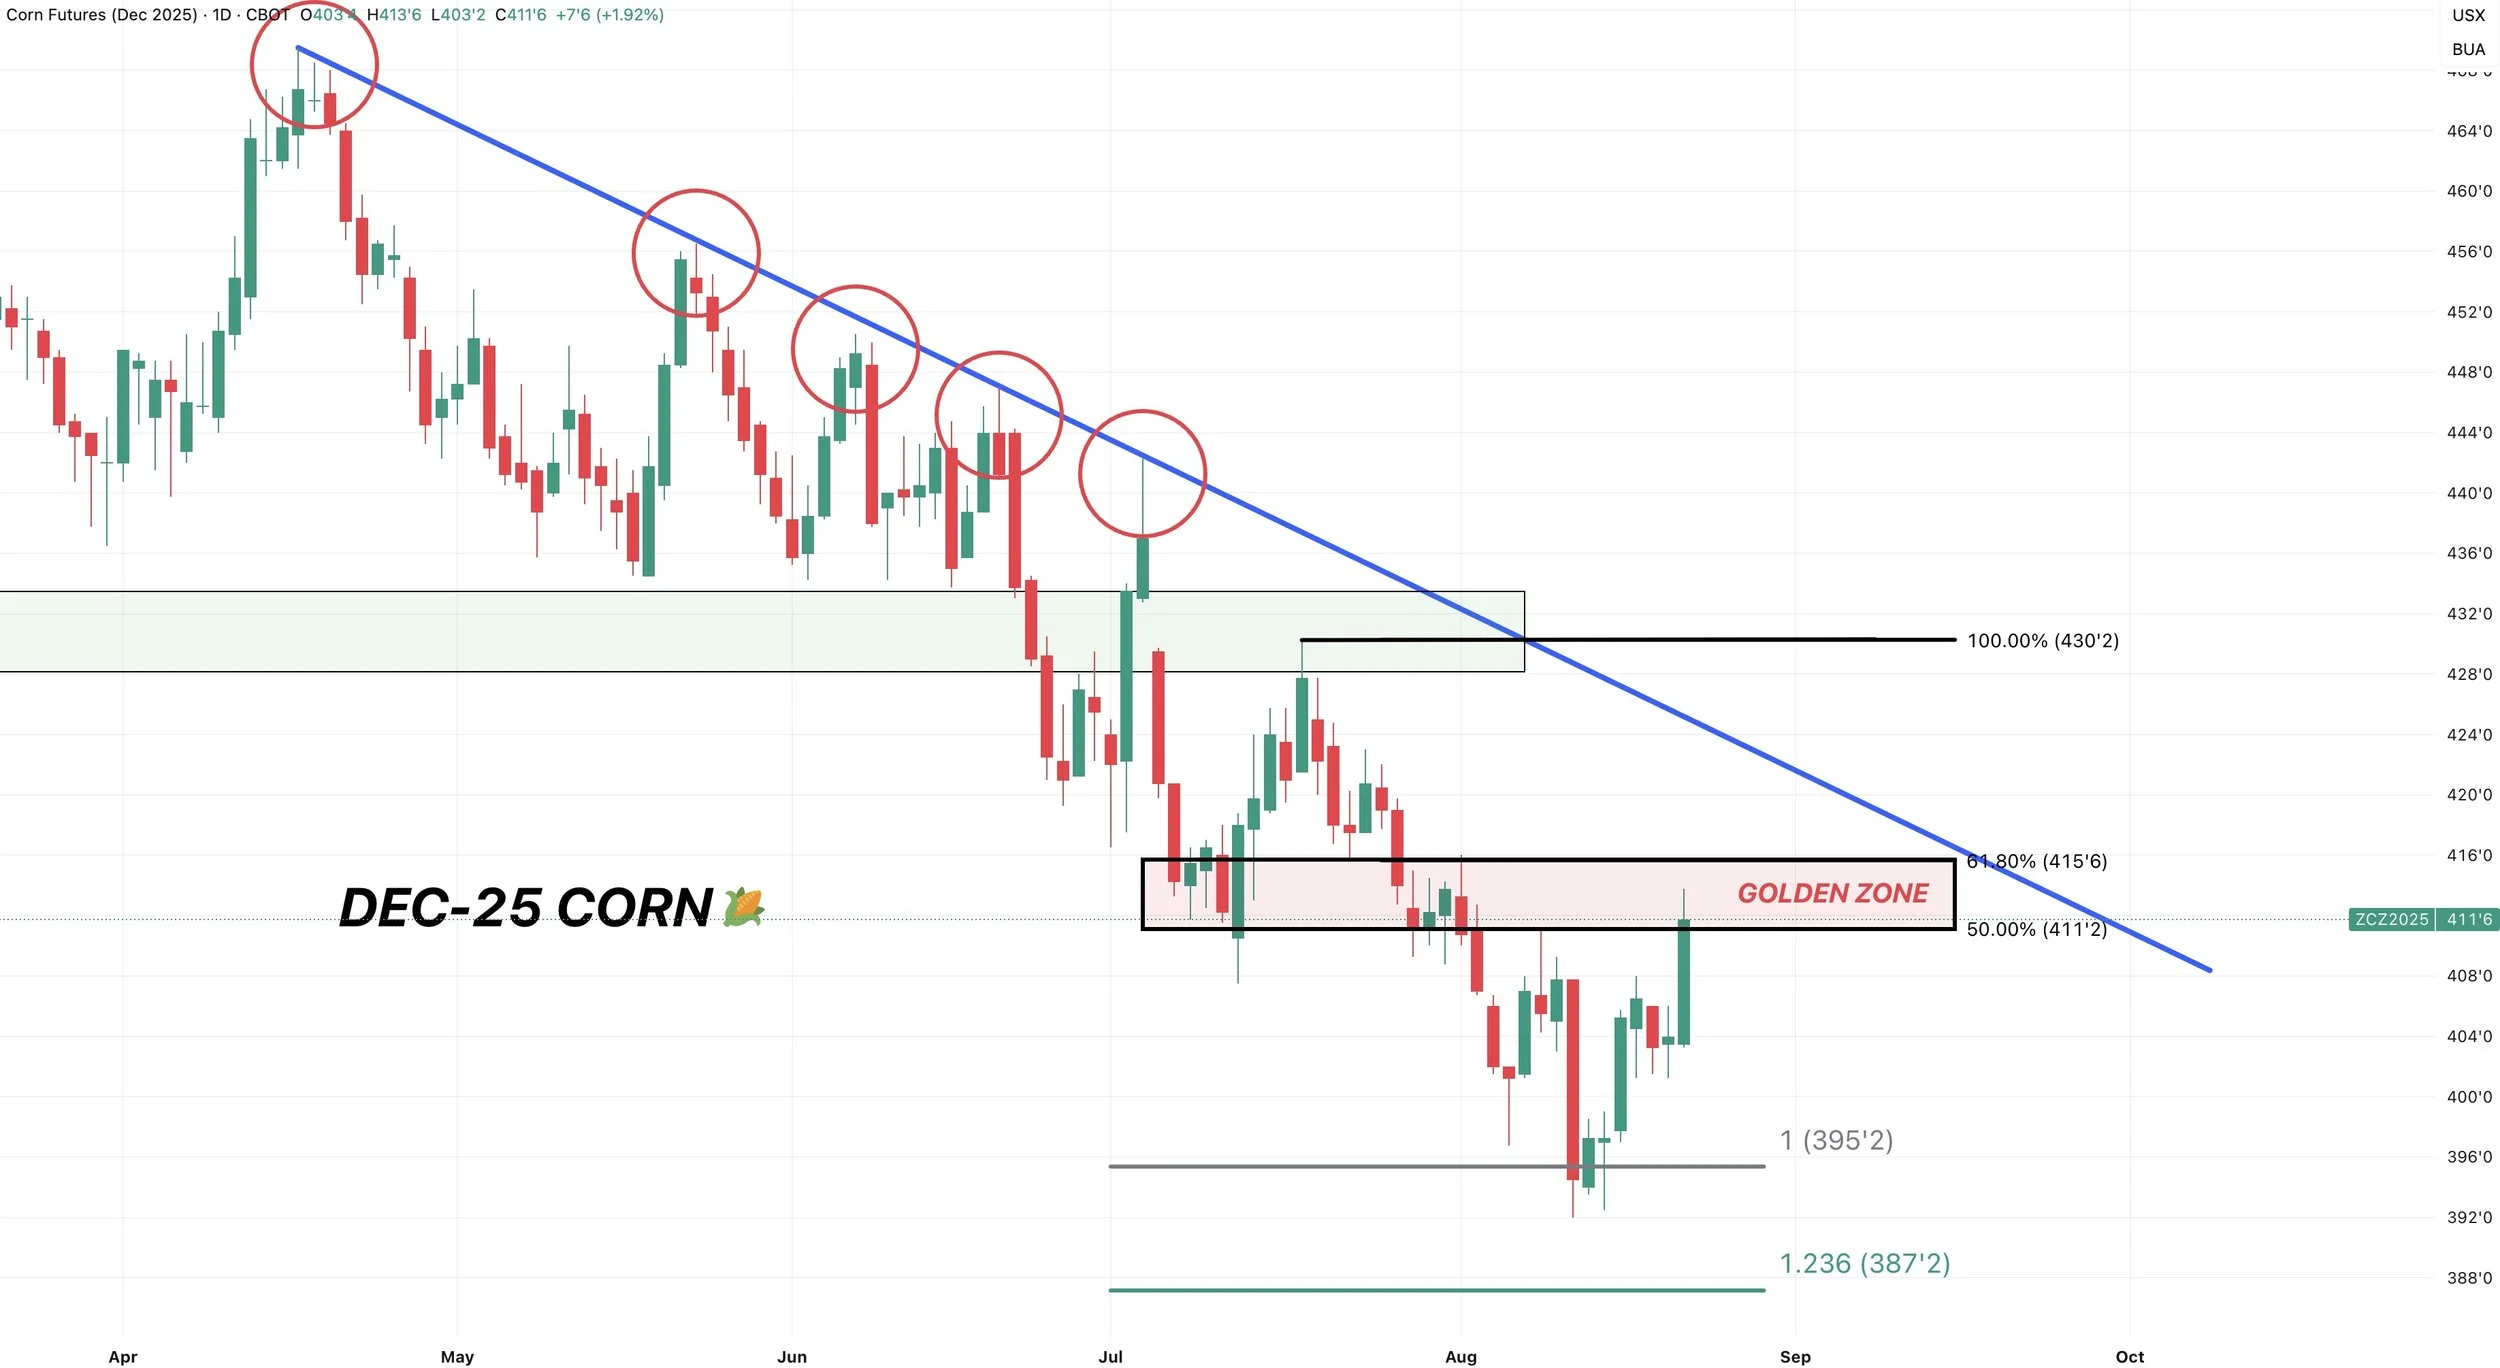
Daily Dec Chart:
We are right up against resistance here. Between here and $4.16.
$4.11 is the 50% retracement to the mid-July highs.
$4.16 is the 61.8% retracement.
That is the golden zone.
If I had to guess, I think we probably reject that red box. (I would love to be wrong). But that's the area of decision for the market.
From a technical standpoint, this mini rally is seen as a corrective bounce unless we close above $4.16.
Which unfortunately means the door is still technically open for us to make new lows. But a close above $4.16 would make me more confident the bottom is truly in here and tell us this is more than just a bounce.
If you are still holding a long position from our buy signal, that red box has been my target to exit that signal.
Soybeans
Like corn, export sales were actually great for soybeans as well.
Today we saw soybean oil take off, which supported this rally.
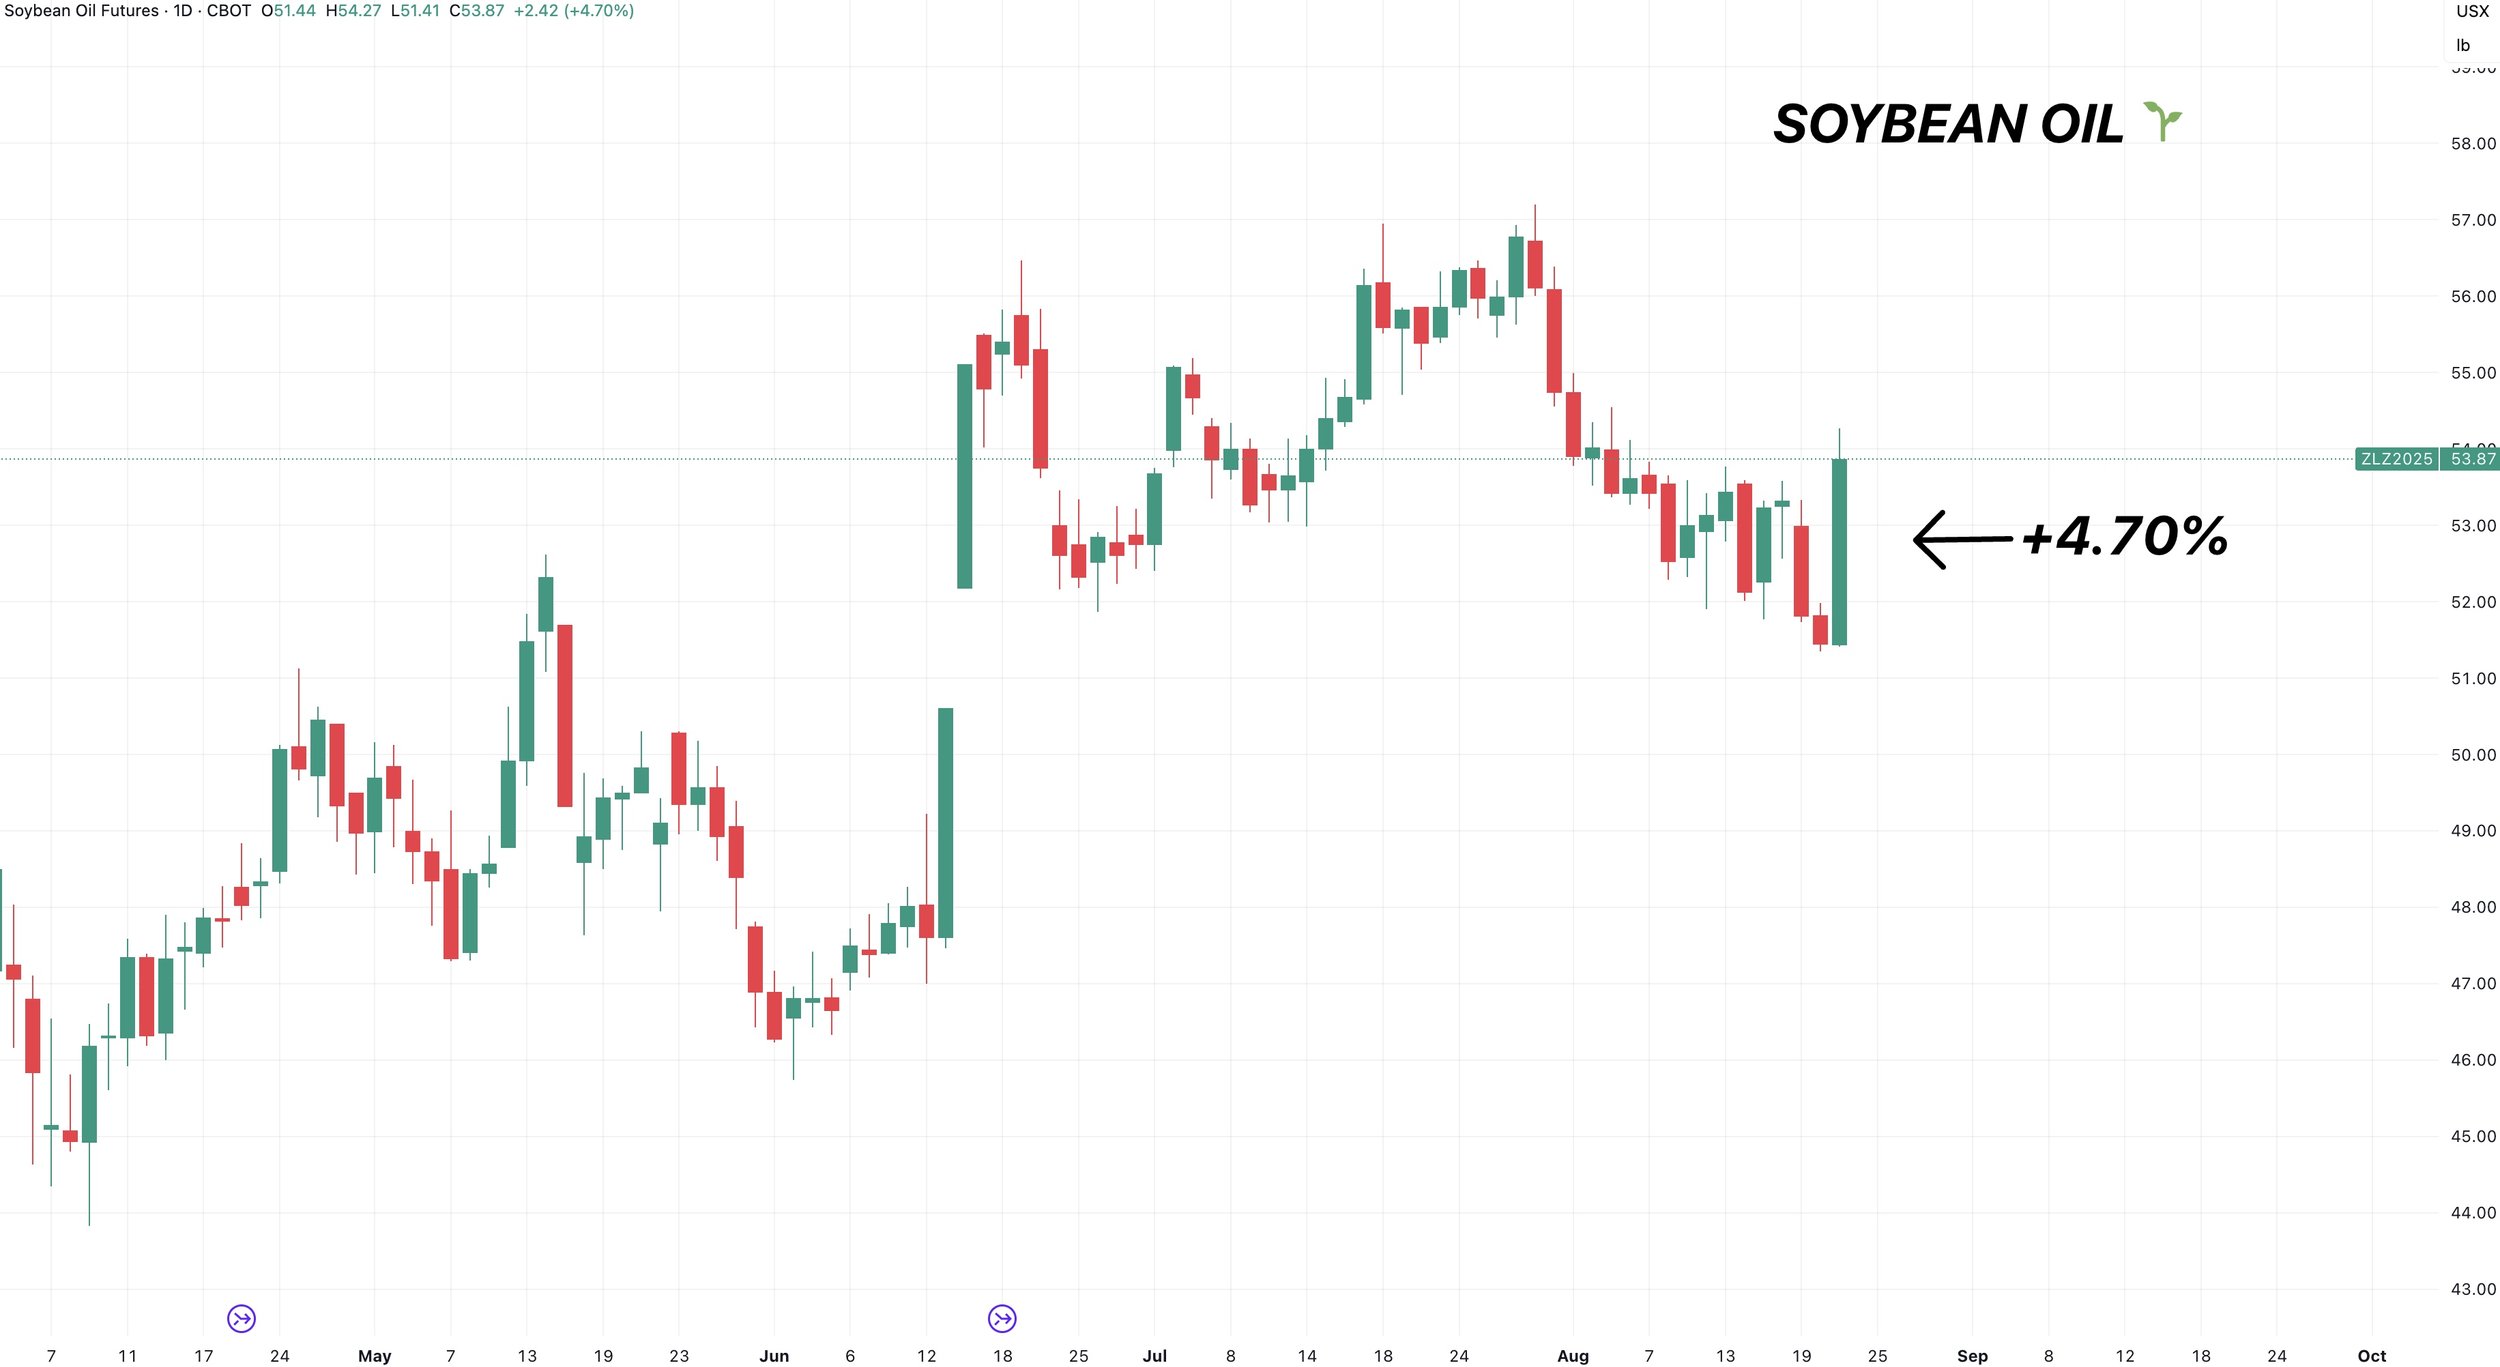
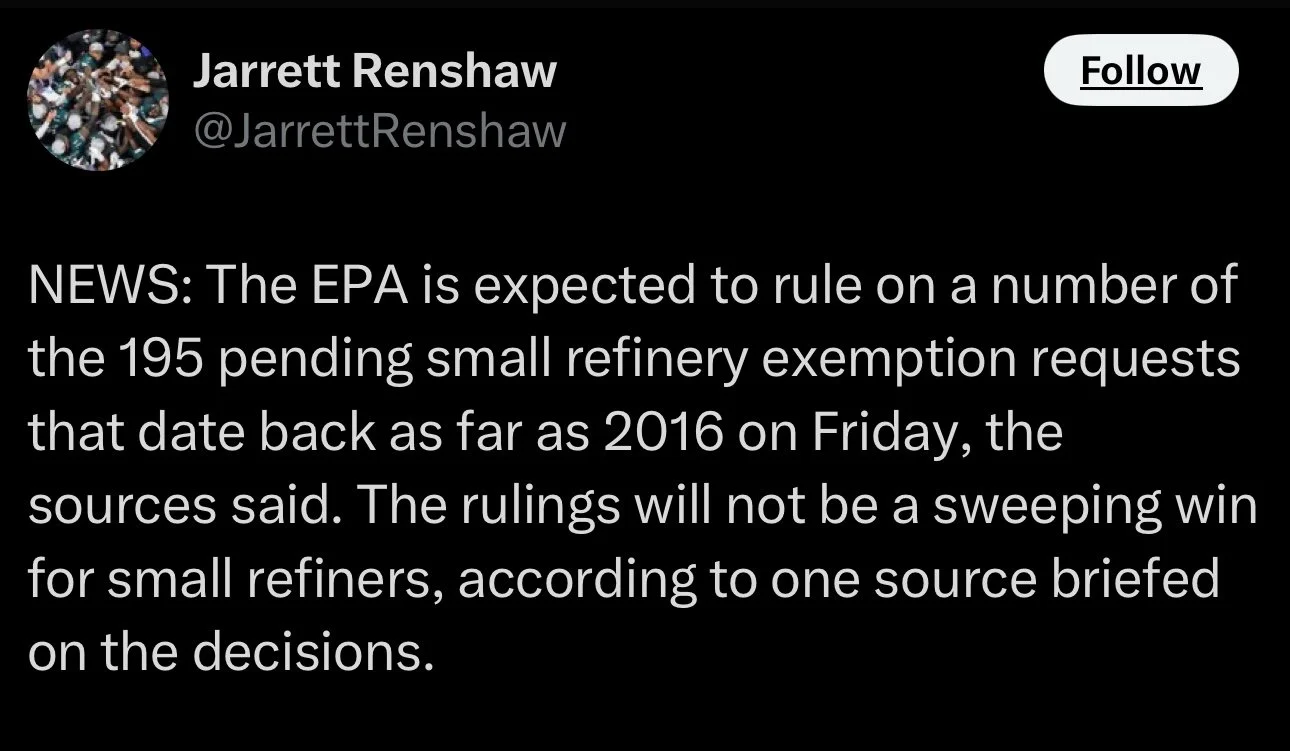
This rally was driven by biofuel headlines.
Tomorrow, the EPA is expected to rule on a number of 195 pending small refinery exemption requests that date back as far as 2016.
Why are we rallying?
Reuters and others are claiming that small refineries will not get their exemptions.
If the EPA says no to most of these exemptions, small refineries will have to use more biofuel. Which is bullish.
If the EPA says yes, then it'll lead to less demand, which is bearish.
Insiders seem to think they'll say no.
As a result, soybean oil is soaring today.
However, Reuters has been notorious for putting out fake news on EPA headlines. So that's a risk.
There is also the chance for this to be a buy the rumor sell the fact event. Where we rally on the rumor, then sell off once it's confirmed. This happens all the time.
Meal Market:
Meal is once again rejecting this key spot we talked about earlier this week.
As we've rejected here twice.
The 61.8% retracement of this entire sell off.
Bust above, and it opens the door to more upside, which I think it should spark some short covering from the funds. Who are holding a record short position.
Doing so would be supportive for the bean market. A meal led rally. Which hasn’t happened in what feels like ages.

Here is the funds meal position for reference.
What could go wrong?


Meal spreads recently widened to extreme levels.
Spreads are now going parabolic. Straight up the last 3 days.
Going from a -12 carryout to now a +1 premium.
Erasing the entire year trading range in 3 days.
I'm not sure, but shorts could be starting to get squeezed.

Soybean Fundamentals:
As for soybean fundamentals, the biggest question mark is Chinese demand.
They still haven’t bought any new crop beans (that anyone knows of).
A slight concern, but still too early to say we aren’t going to have any demand for beans.
We saw the exact same thing happen the last 2 years and exports turned out fine.
Although we weren’t in the middle of a potential trade war.

If China starts buying soybeans or we ink an actual trade agreement with China, that would be by far the biggest bullish catalyst. But it's still an unknown.
The other biggest potential friendly factor is the US soybean balance sheet.
Since acres got cut drastically, the margin for error on soybean yield is non-existent.
Even if we see a a 54 bpa yield, our carryout is still tighter than last year.
Here is a chart I've shown before. Highlighting how carryout is effected by yield changes. As always, on this chart demand is left unchanged. Which won’t actually happen. If supply is cut, demand will be as well.
But the room for error is razor thin like I've been mentioning for months.

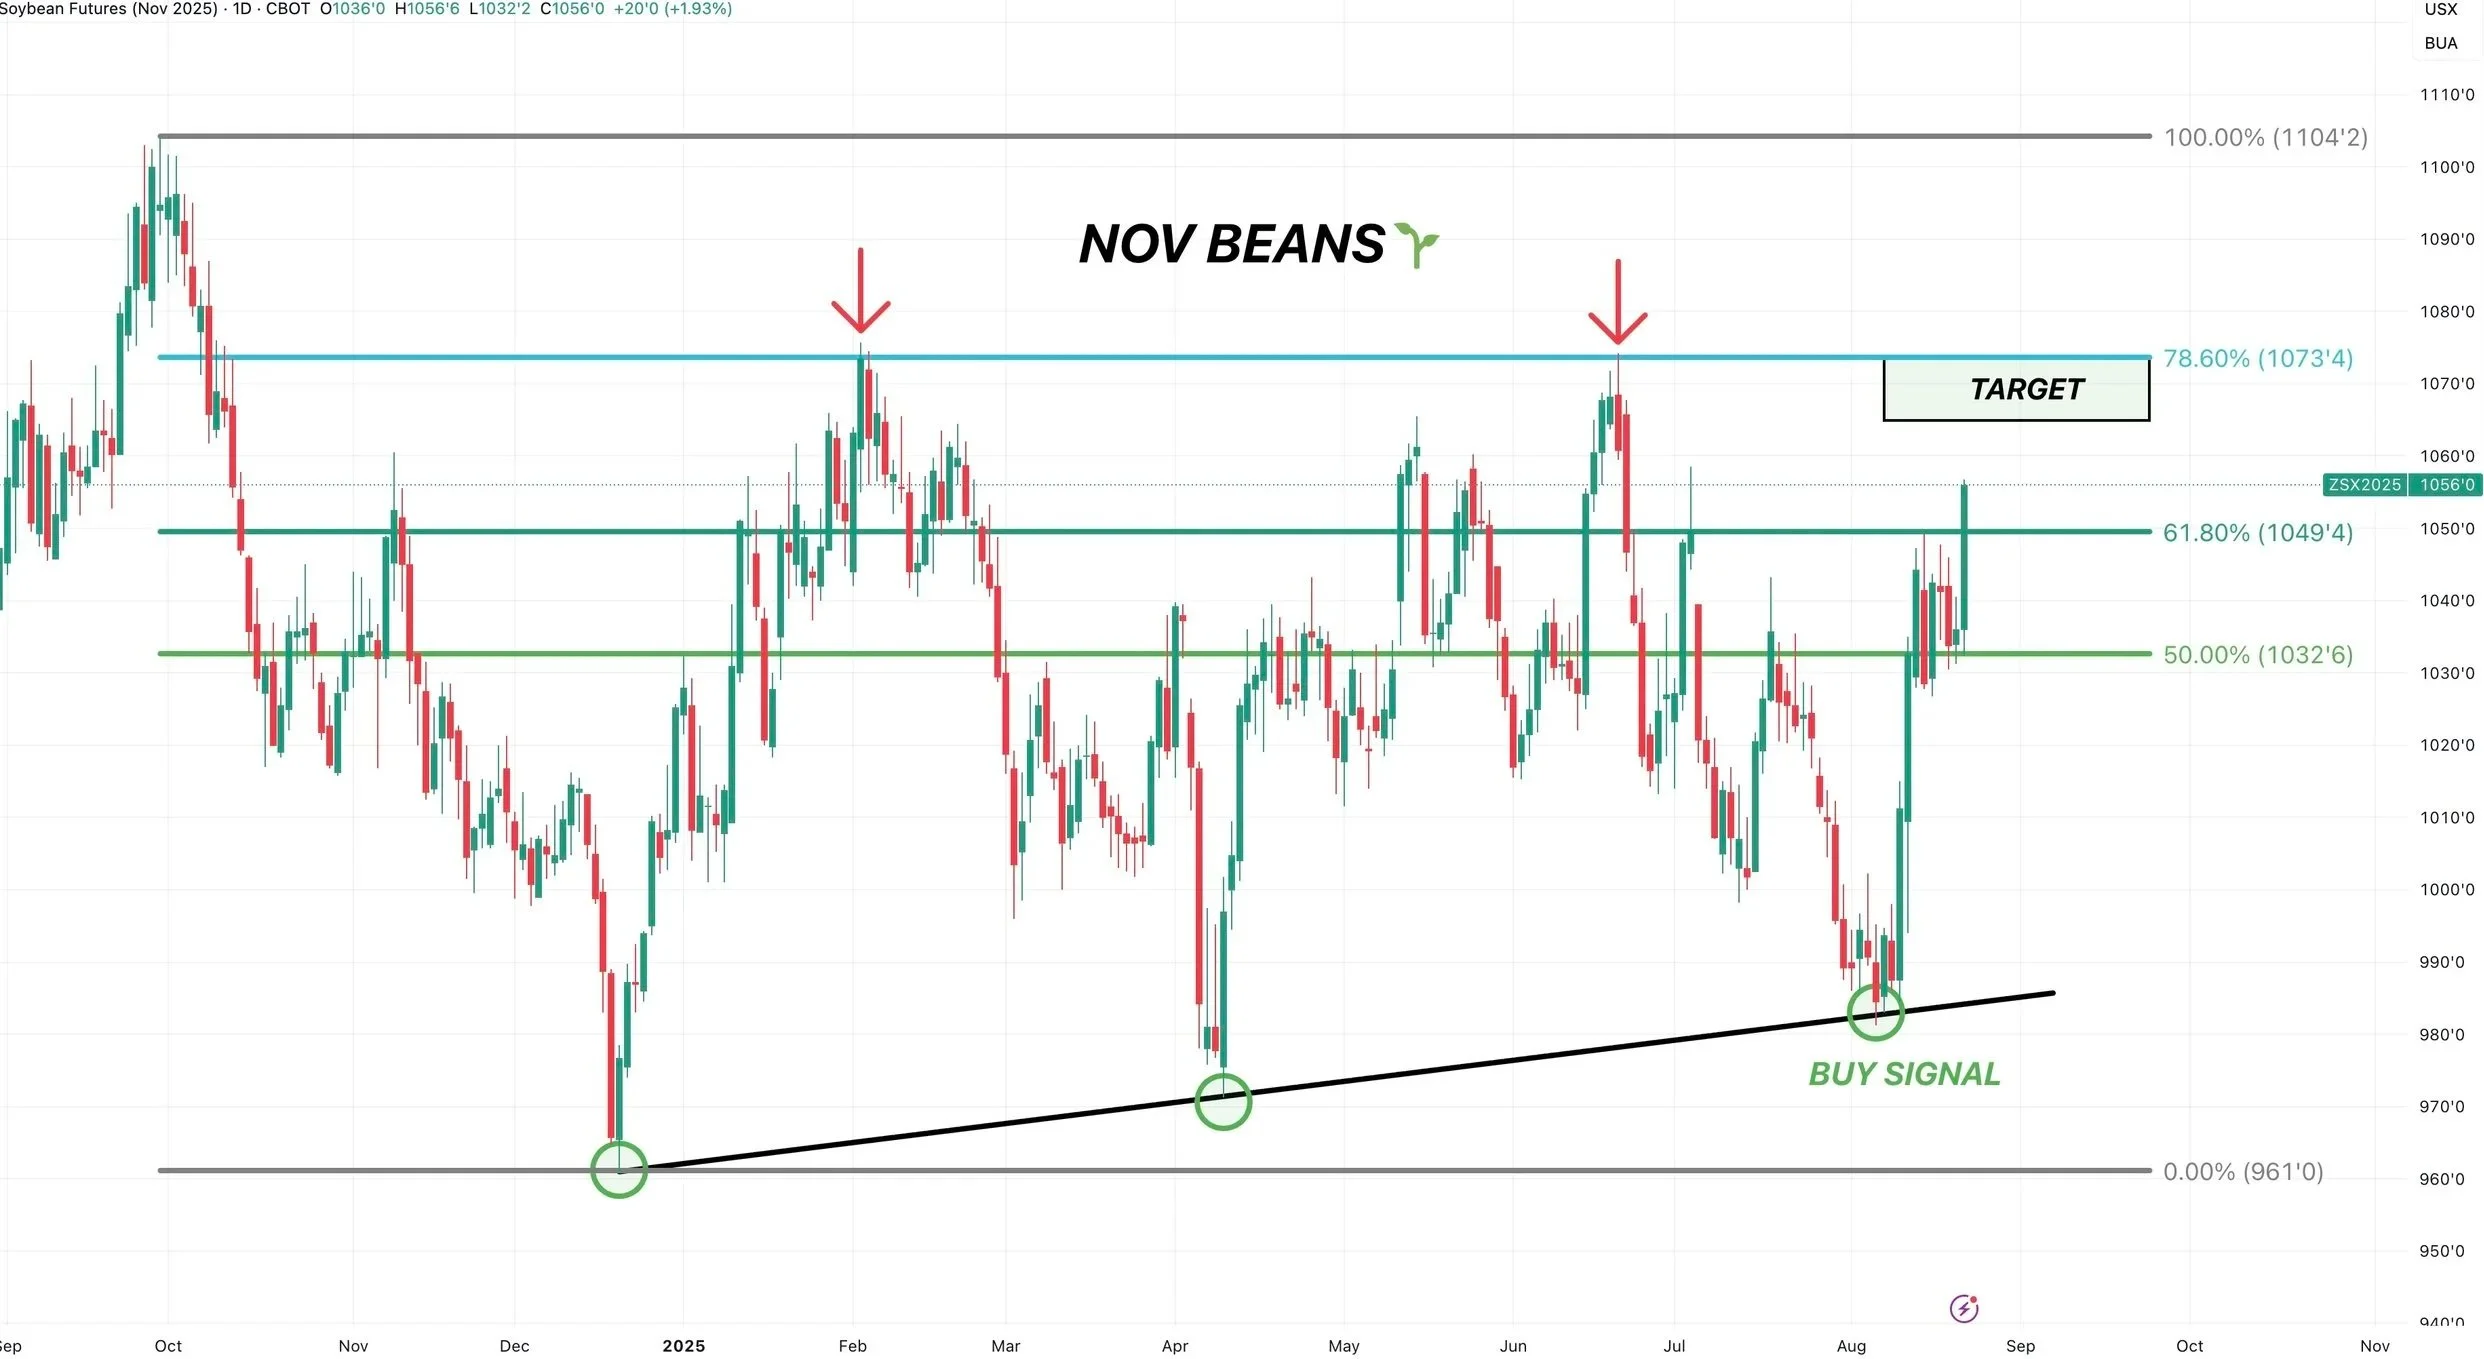
Daily Nov Chart:
The chart is starting to look really promising.
We are busting out of this bullish pennant pattern (in my last update I thought it was a potential bull flag, but it has developed into a pennant. Both are bullish).
Today we closed above last week's highs of $10.49
This was seen as a key level to break.
Us breaking above opens the door to run to the $10.65 to $10.70 range.
That is where I will be alerting a sell signal.

Here is another reason why I think we could see a leg higher.
$10.49 is the 61.8% retracement from contract lows up to the harvest highs from last year.
On last week's rally, that is exactly where we rejected.
Now that we closed above, the next fib level is the 78.6% level at $10.73
Which is exactly where our last two major tops in this market occured. Back in June and February.
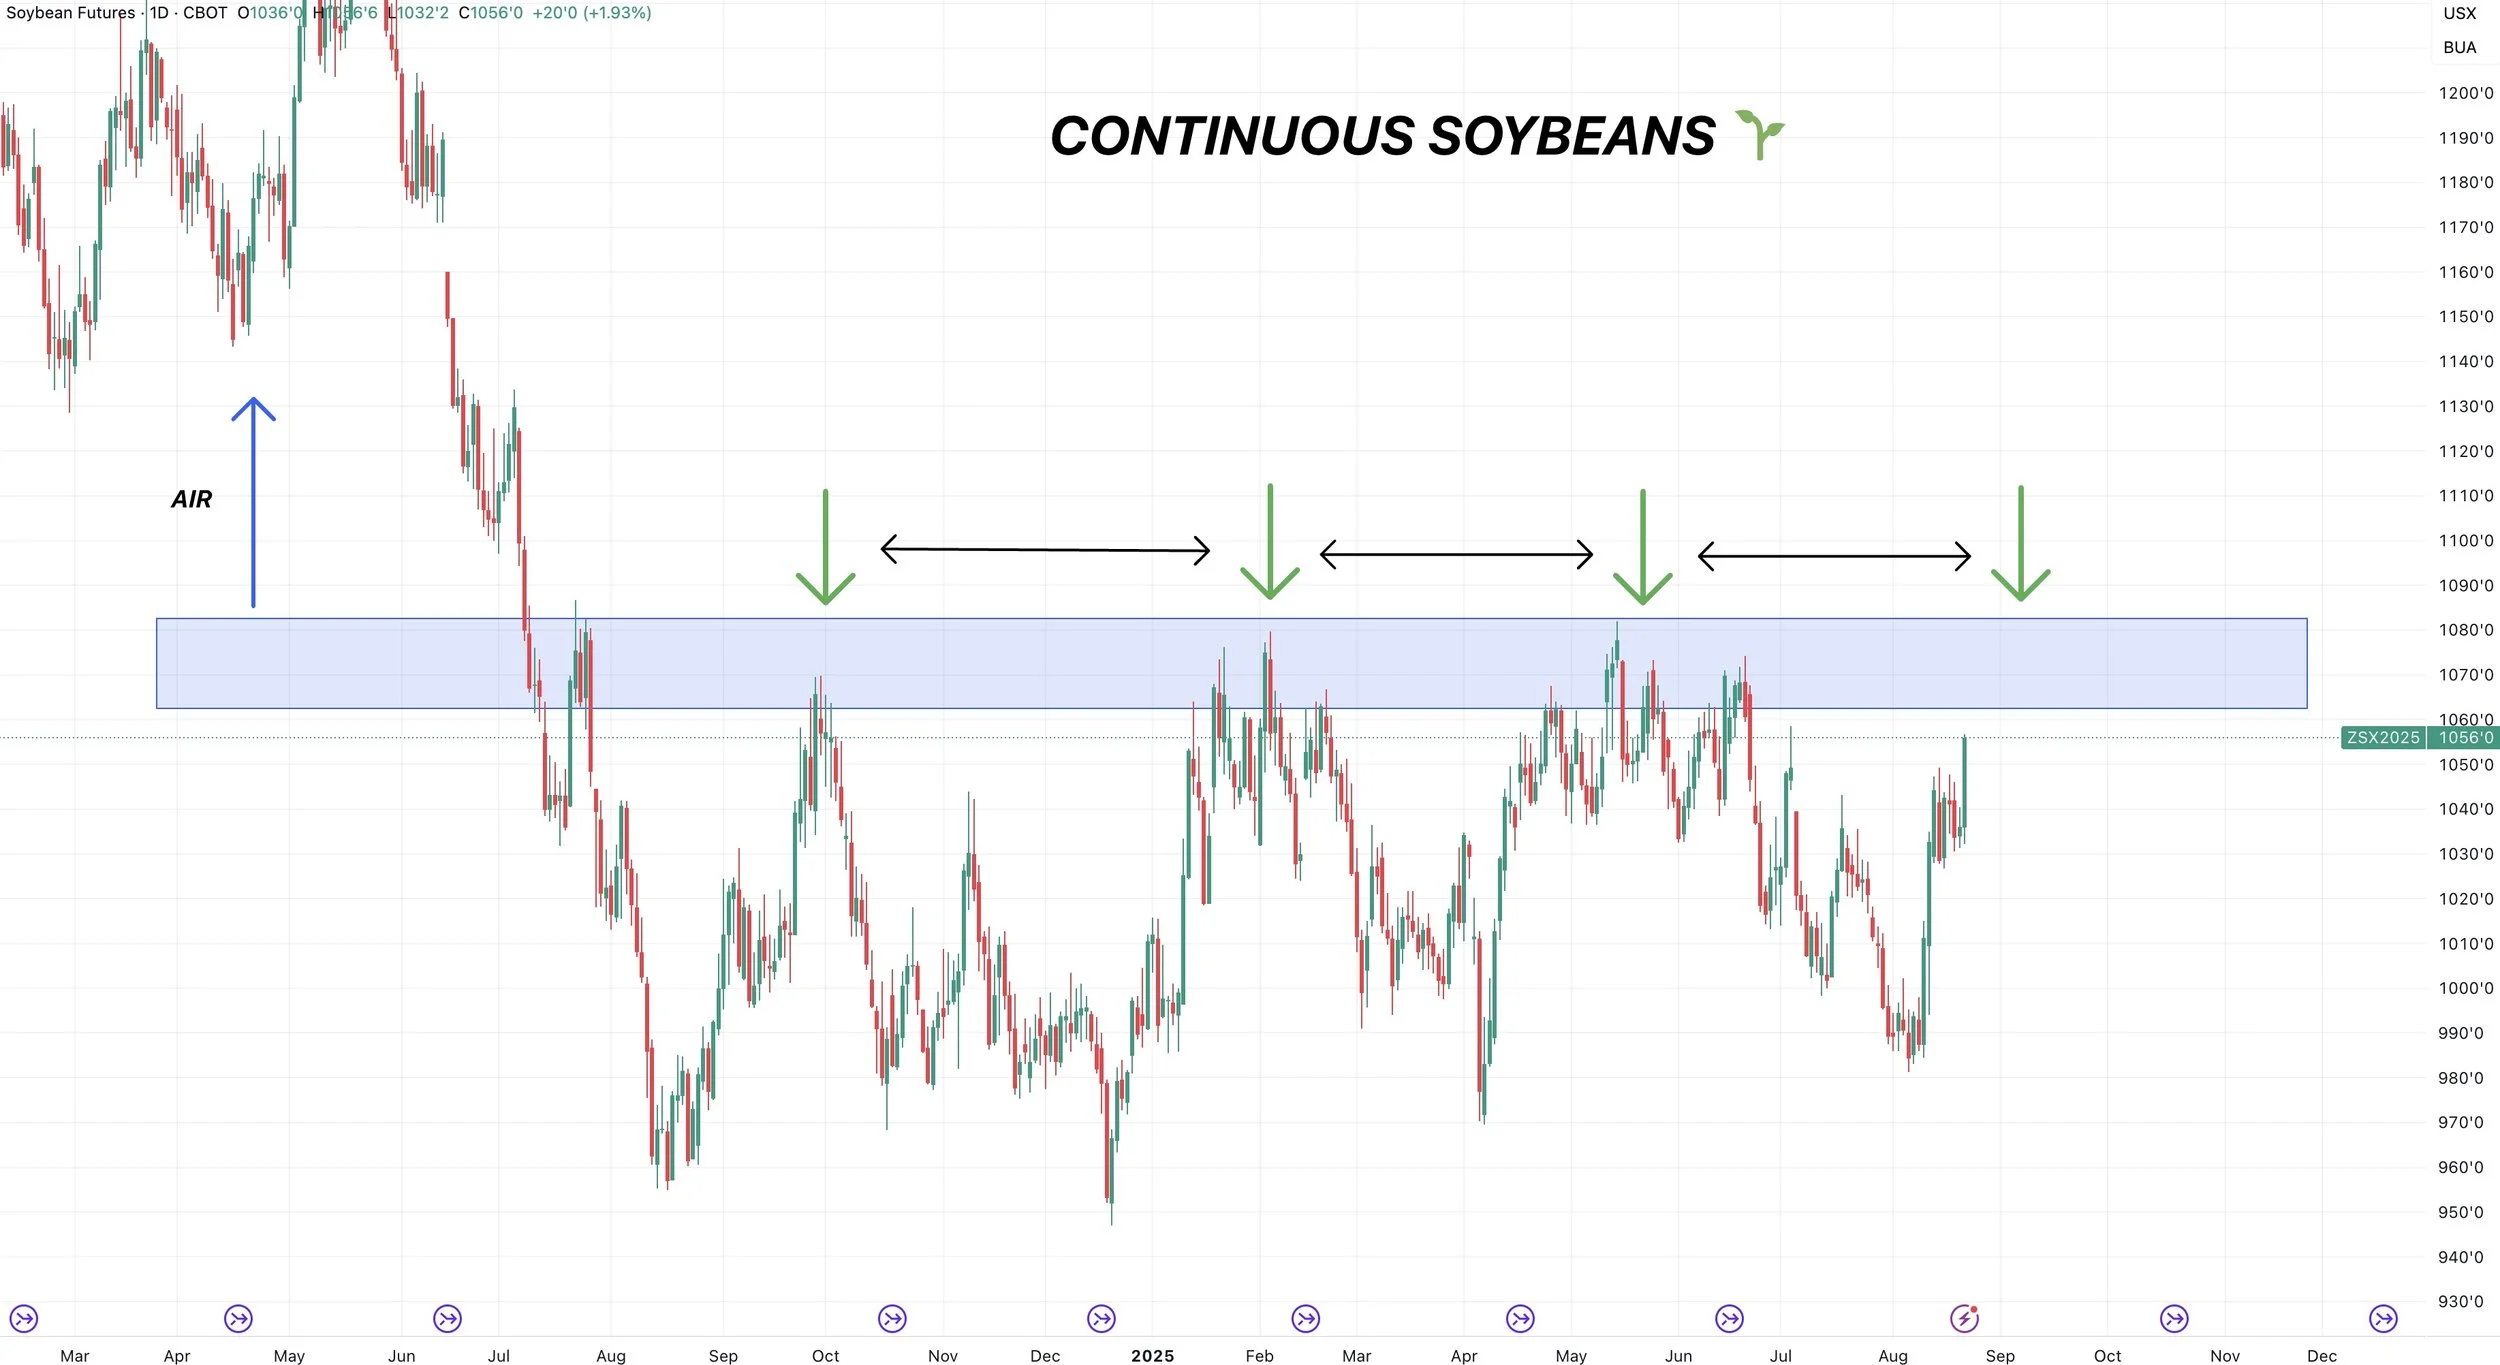
Continuous Chart:
Yet here is another reason why I think we have room to run up to $10.65 or potentially higher like I've been talking about for a while.
This is the continuous chart. Which simply uses front month soybeans and currently uses Nov beans.
Every 3 months, prices have came up to the $10.65 to $10.80 range before making a major top.
It's been like clock work every 3 months.
It has been about 3 months since we posted our last major high in this box.
So I would like to think we get another run up towards that box.
Break above the box and the upside is wide open. But that hasn’t happened. Until then, it's seen as resistance.
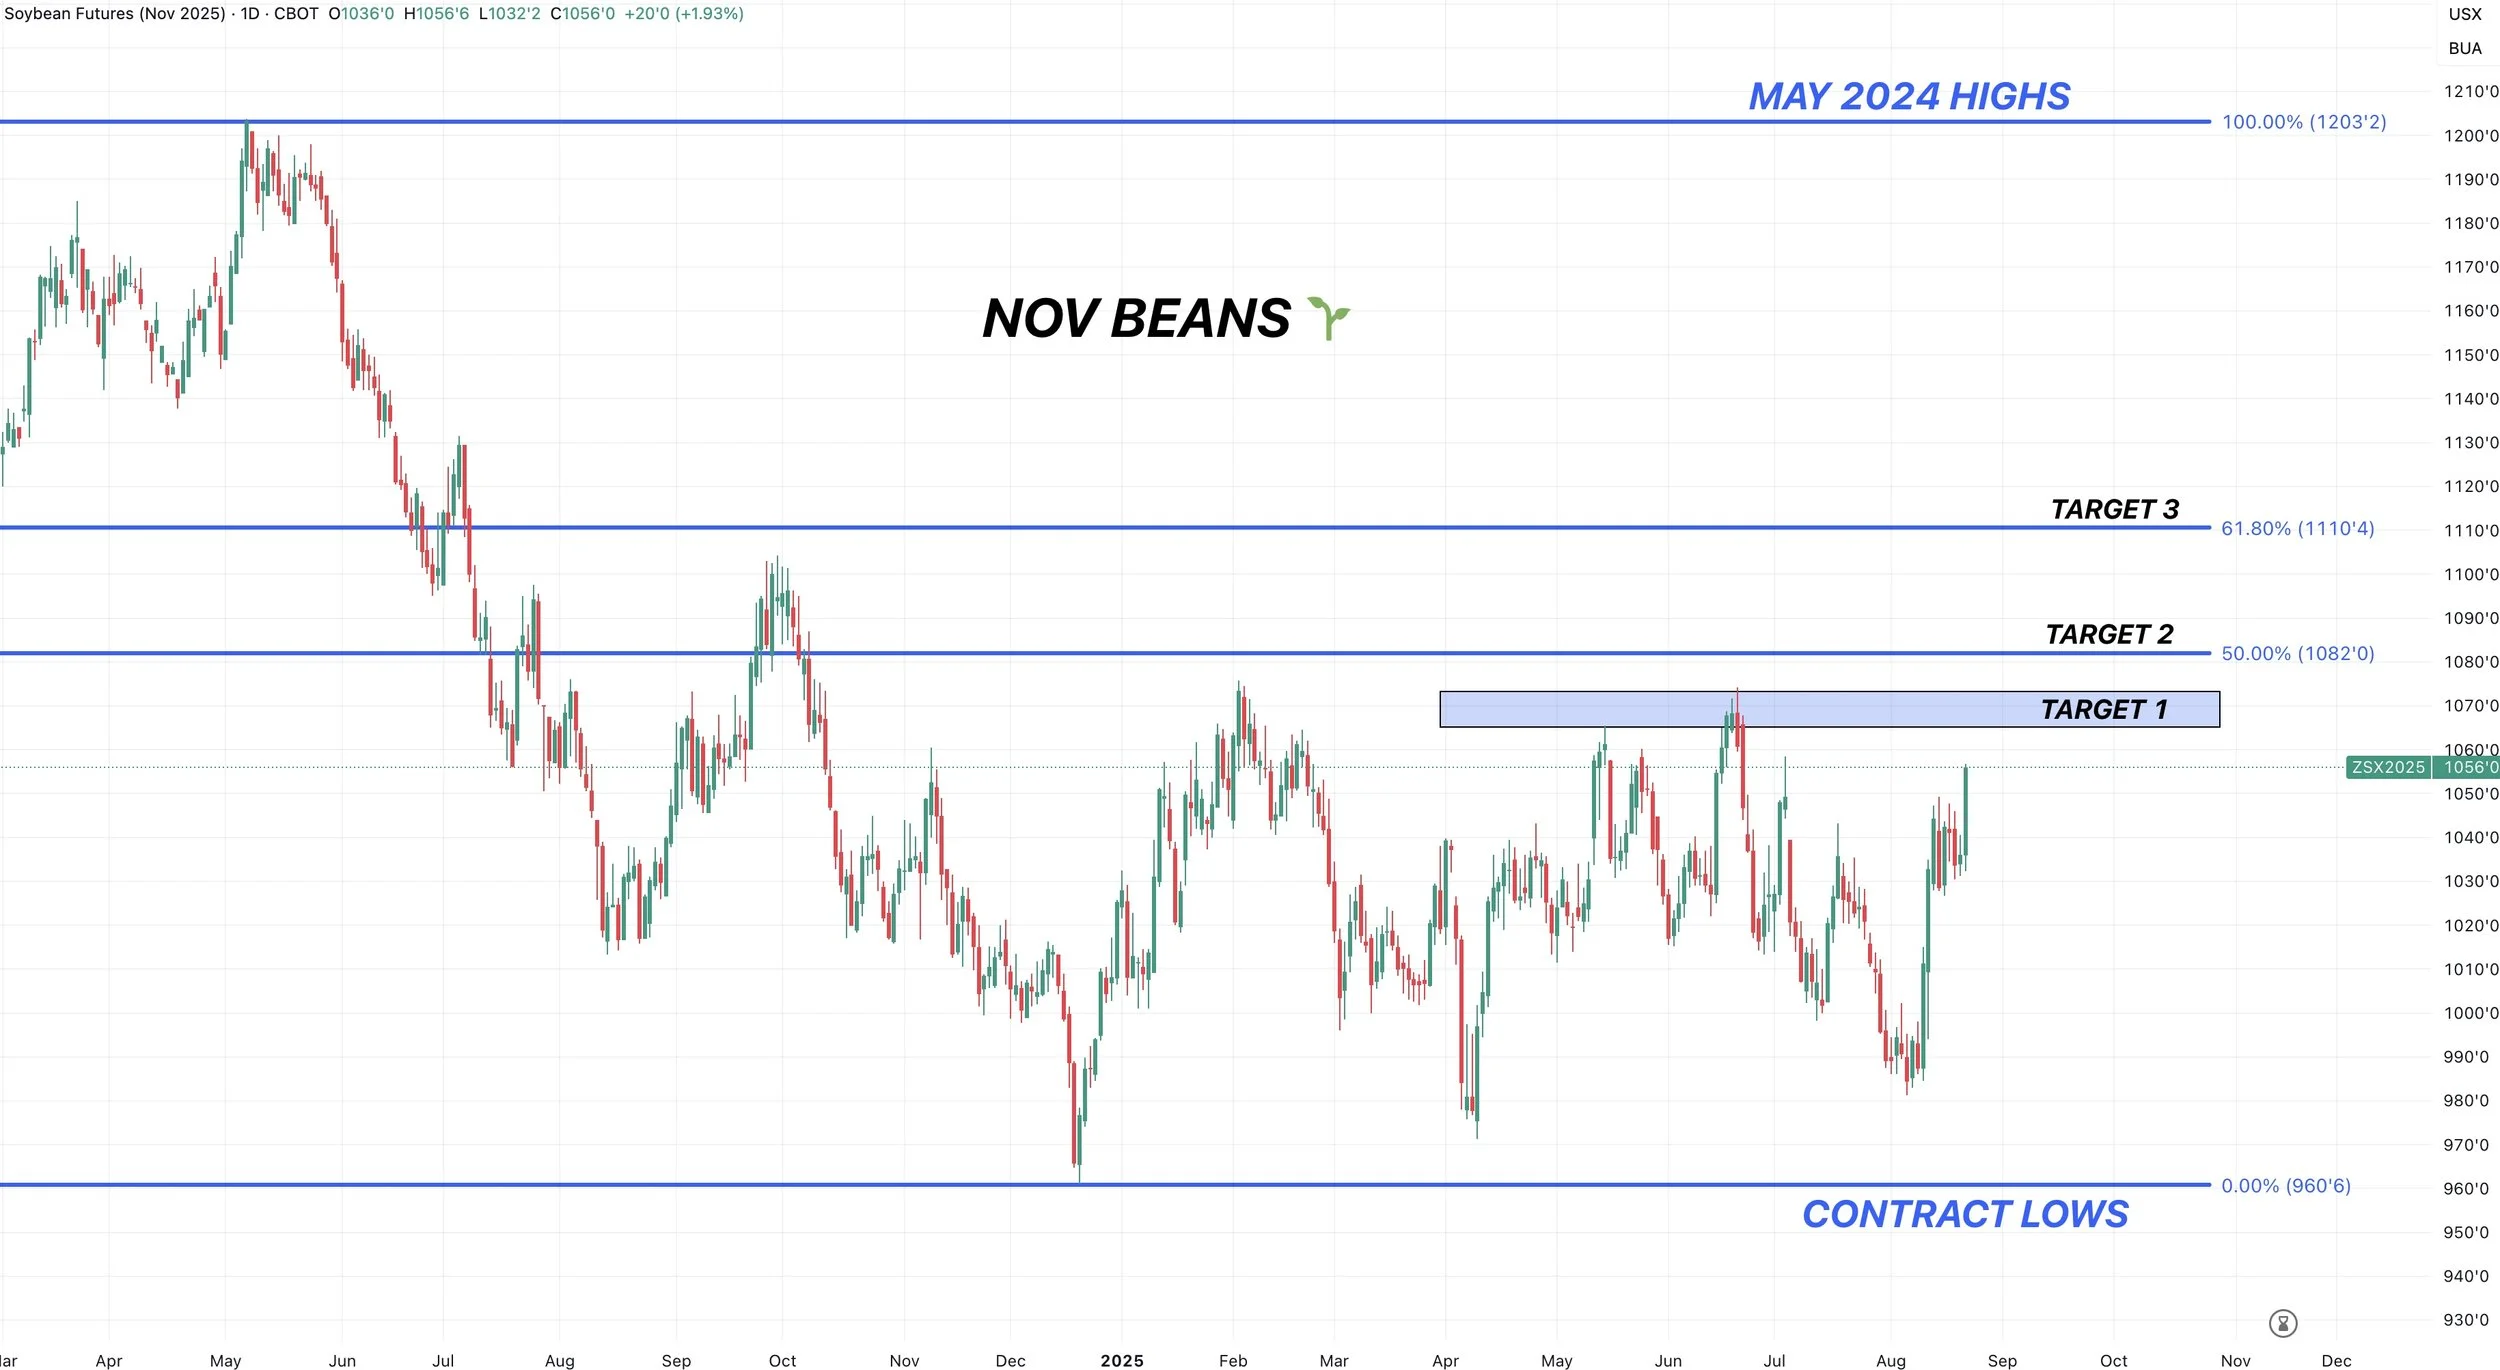
Current Game Plan:
I have been extremely patient on soybean sell signals this year.
This is my current game plan for sell signals (subject to change).
Sale #1: $10.65-70
Sale #2: $10.82
Sale #3: $11.10
None of these have to happen. They are simply targets to let you know it's a good spot to layer off some risk if they hit.
$10.65-70 is that first target we talked about.
$10.82 is the 50% retracement up to the May 2024 highs.
$11.10 is the 61.8% retracement.
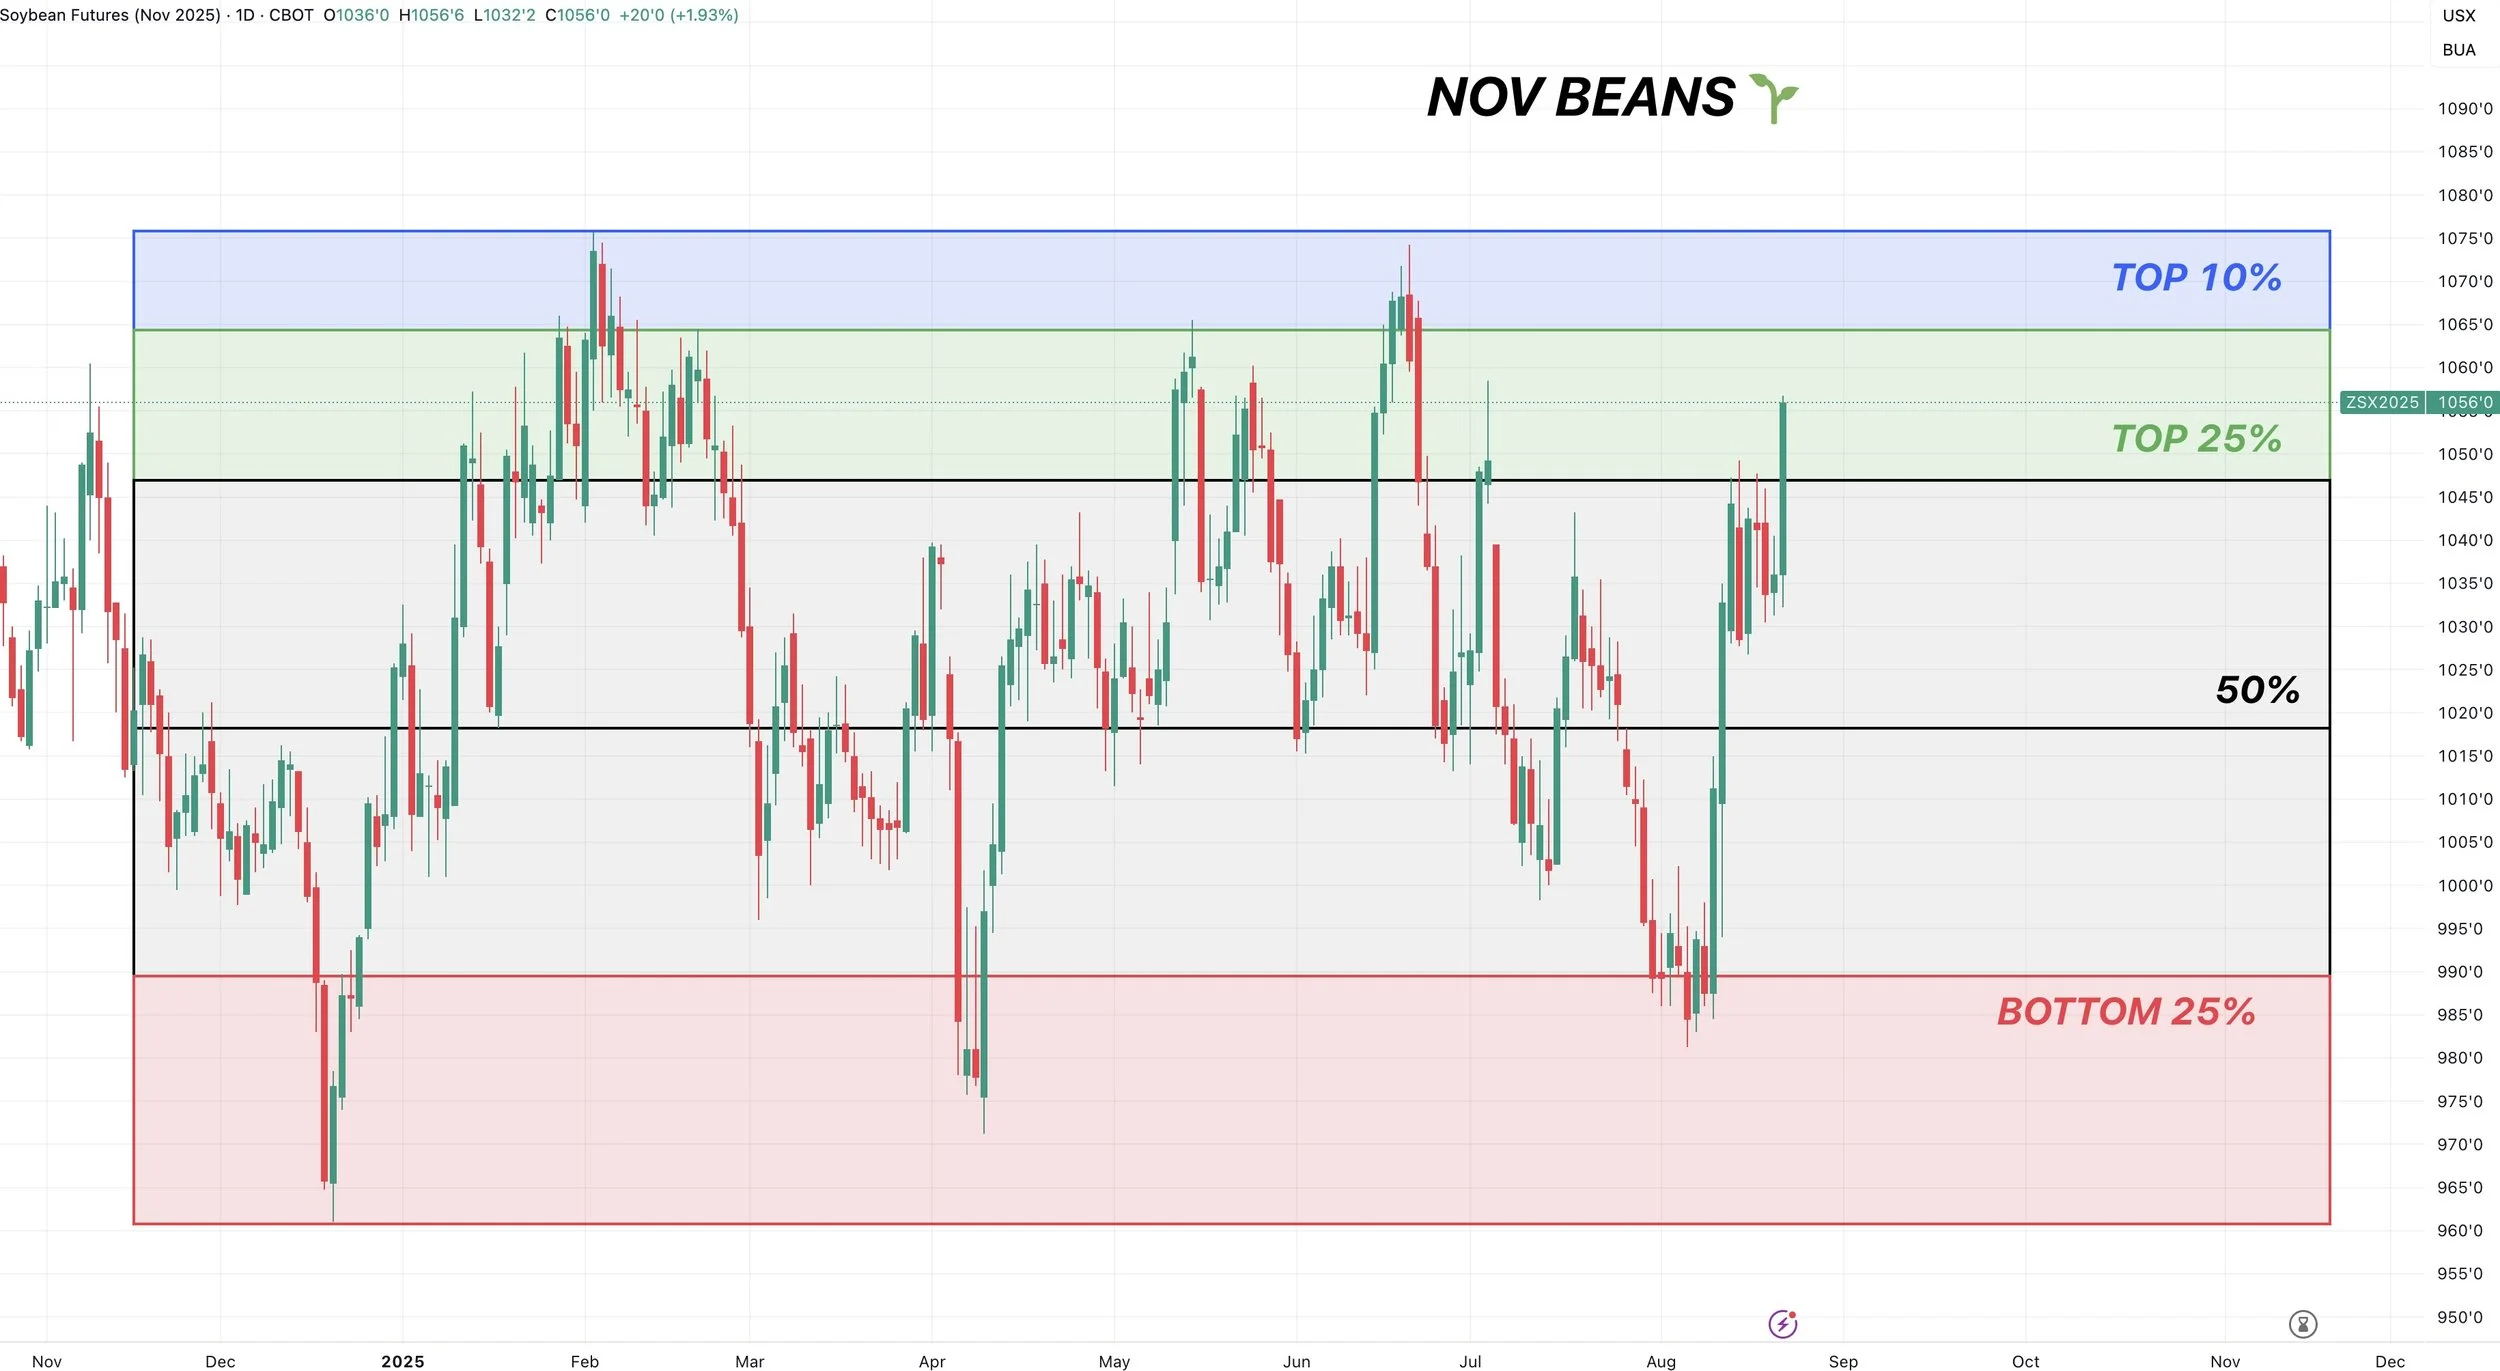
Top 25% of Prices:
We are now back in the top 25% of prices we have seen this year.
This is never a bad place to look at rewarding a rally and to take some risk off the table.
So if you need to make a sale, then by all means do so.
If you have to move something by harvest, I still like keeping downside protection.
Personally, I am waiting for another +10 cents to alert a full blown sell signal. Which would put us back in the top 10% of prices we've seen. If we get there.
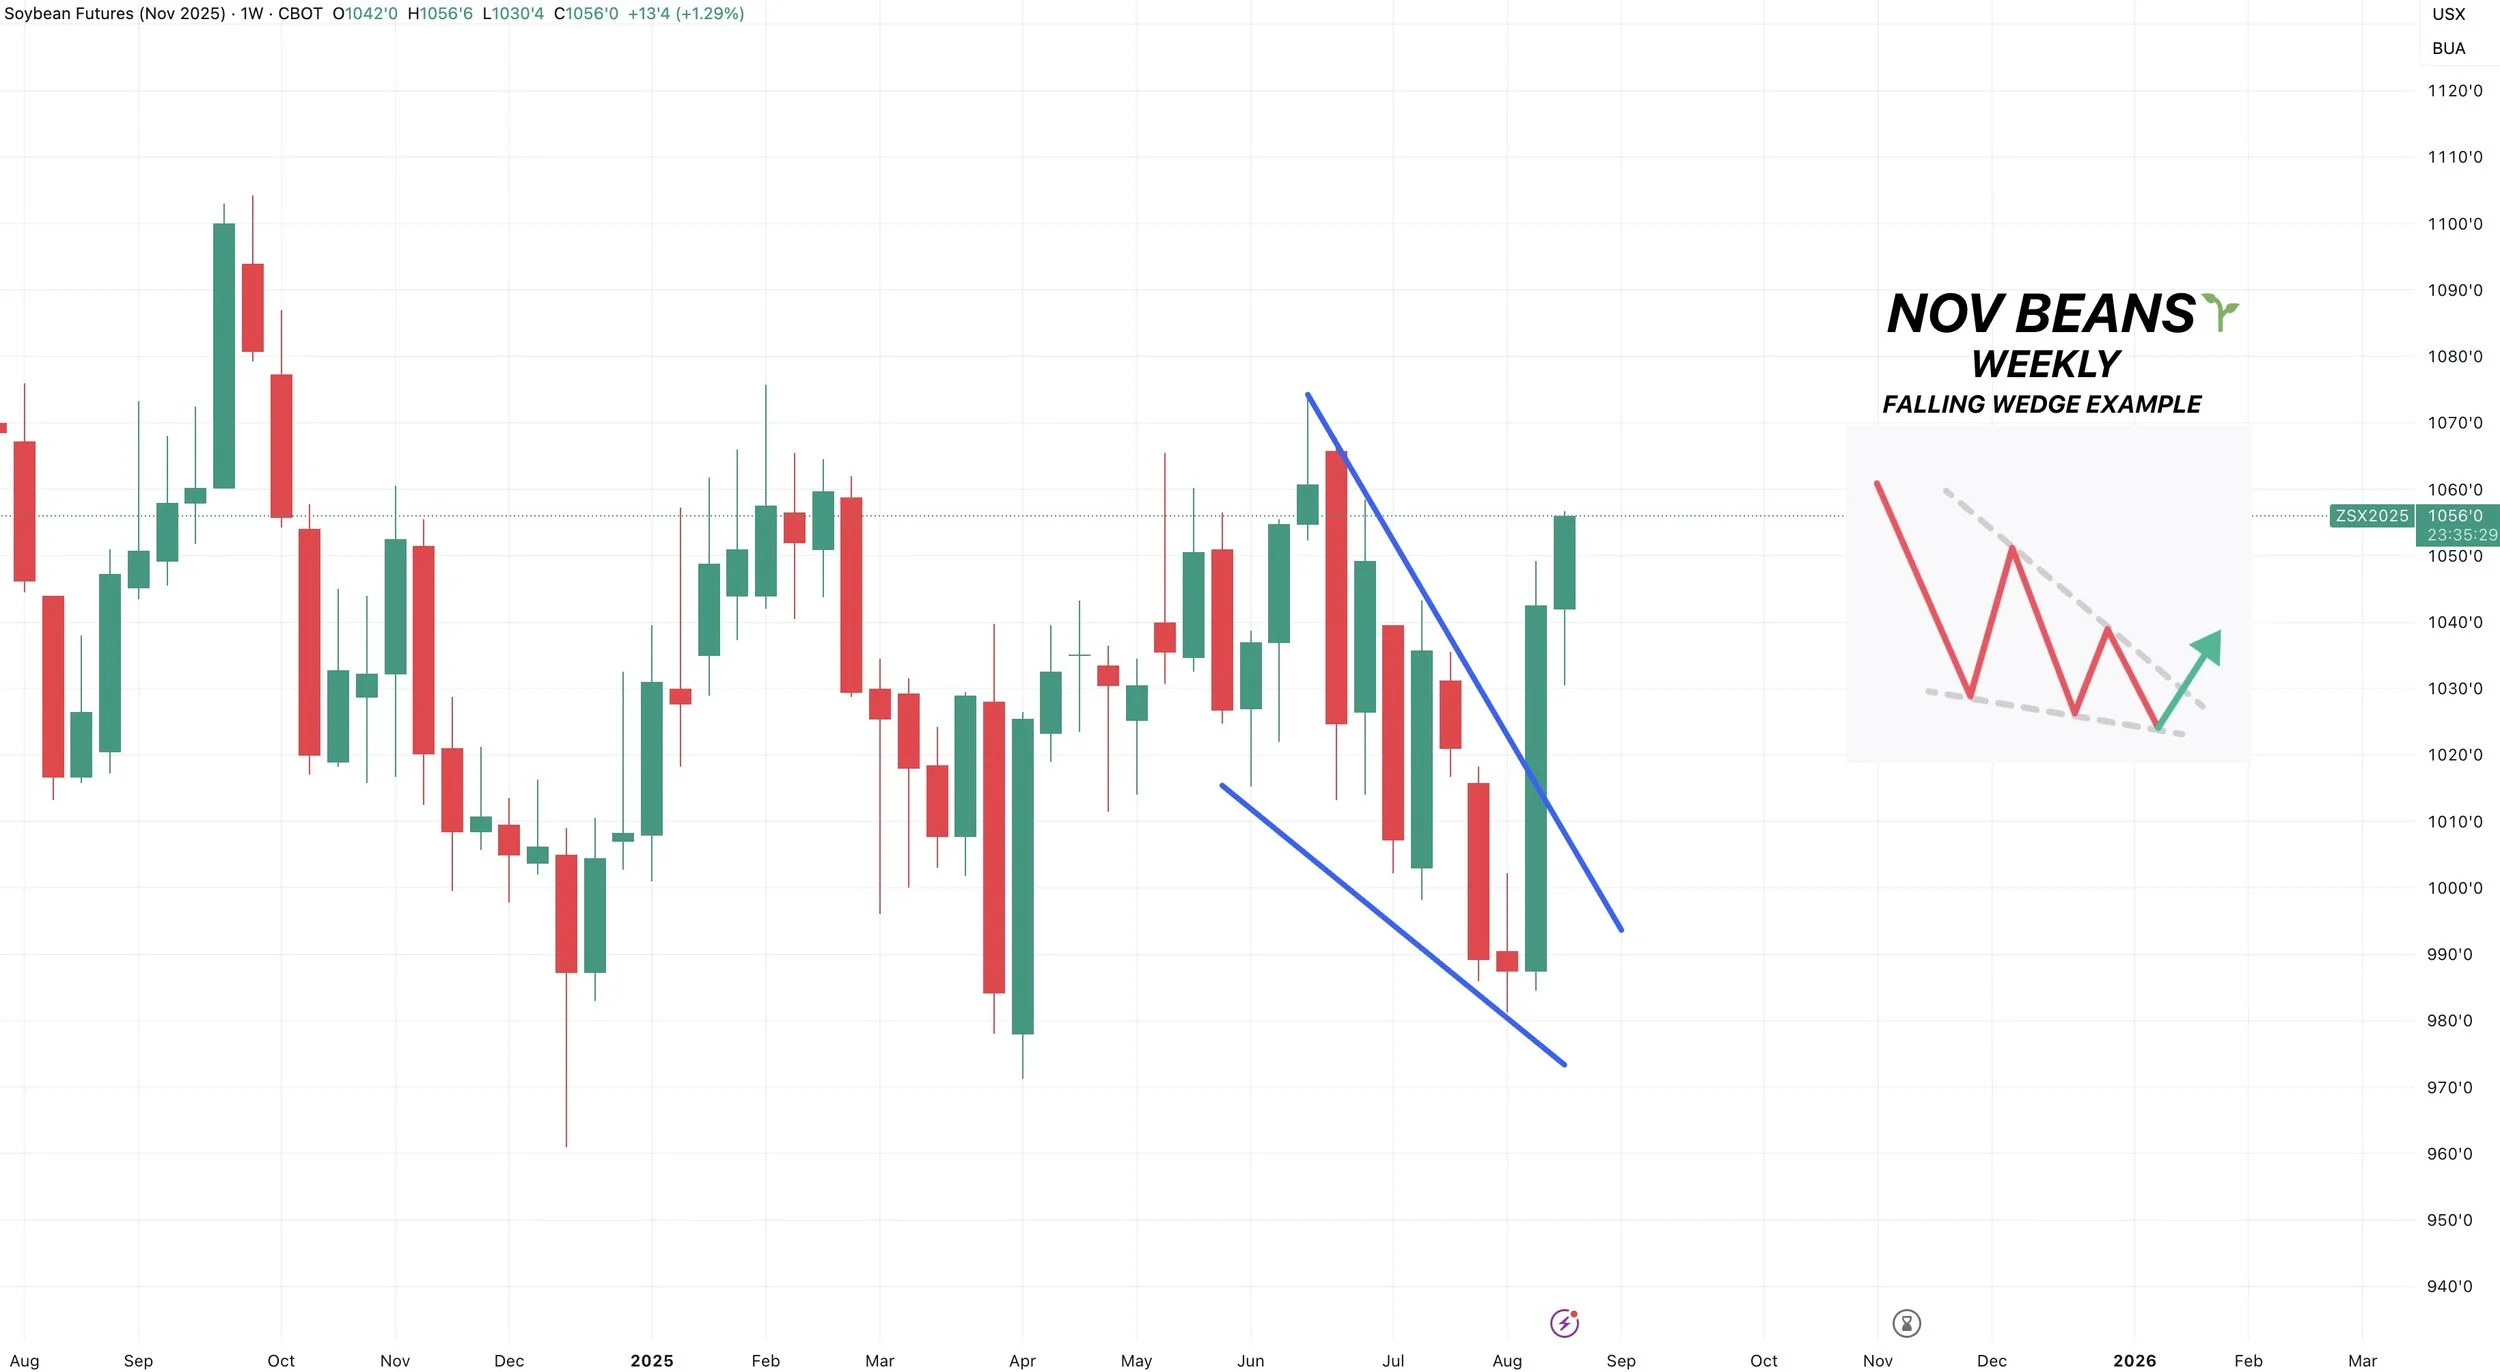
Weekly Chart:
Just look at the weekly chart.
We have a clean breakout of this falling wedge pattern and are getting follow through.
Wheat
Yesterday we alerted a buy signal for the wheat market.
This was purely a technical driven buy signal based on the charts.
Here was the buy signal if you missed it: CLICK HERE
There isn’t much fresh fundamental news, so let's get into the charts and the buy signal.
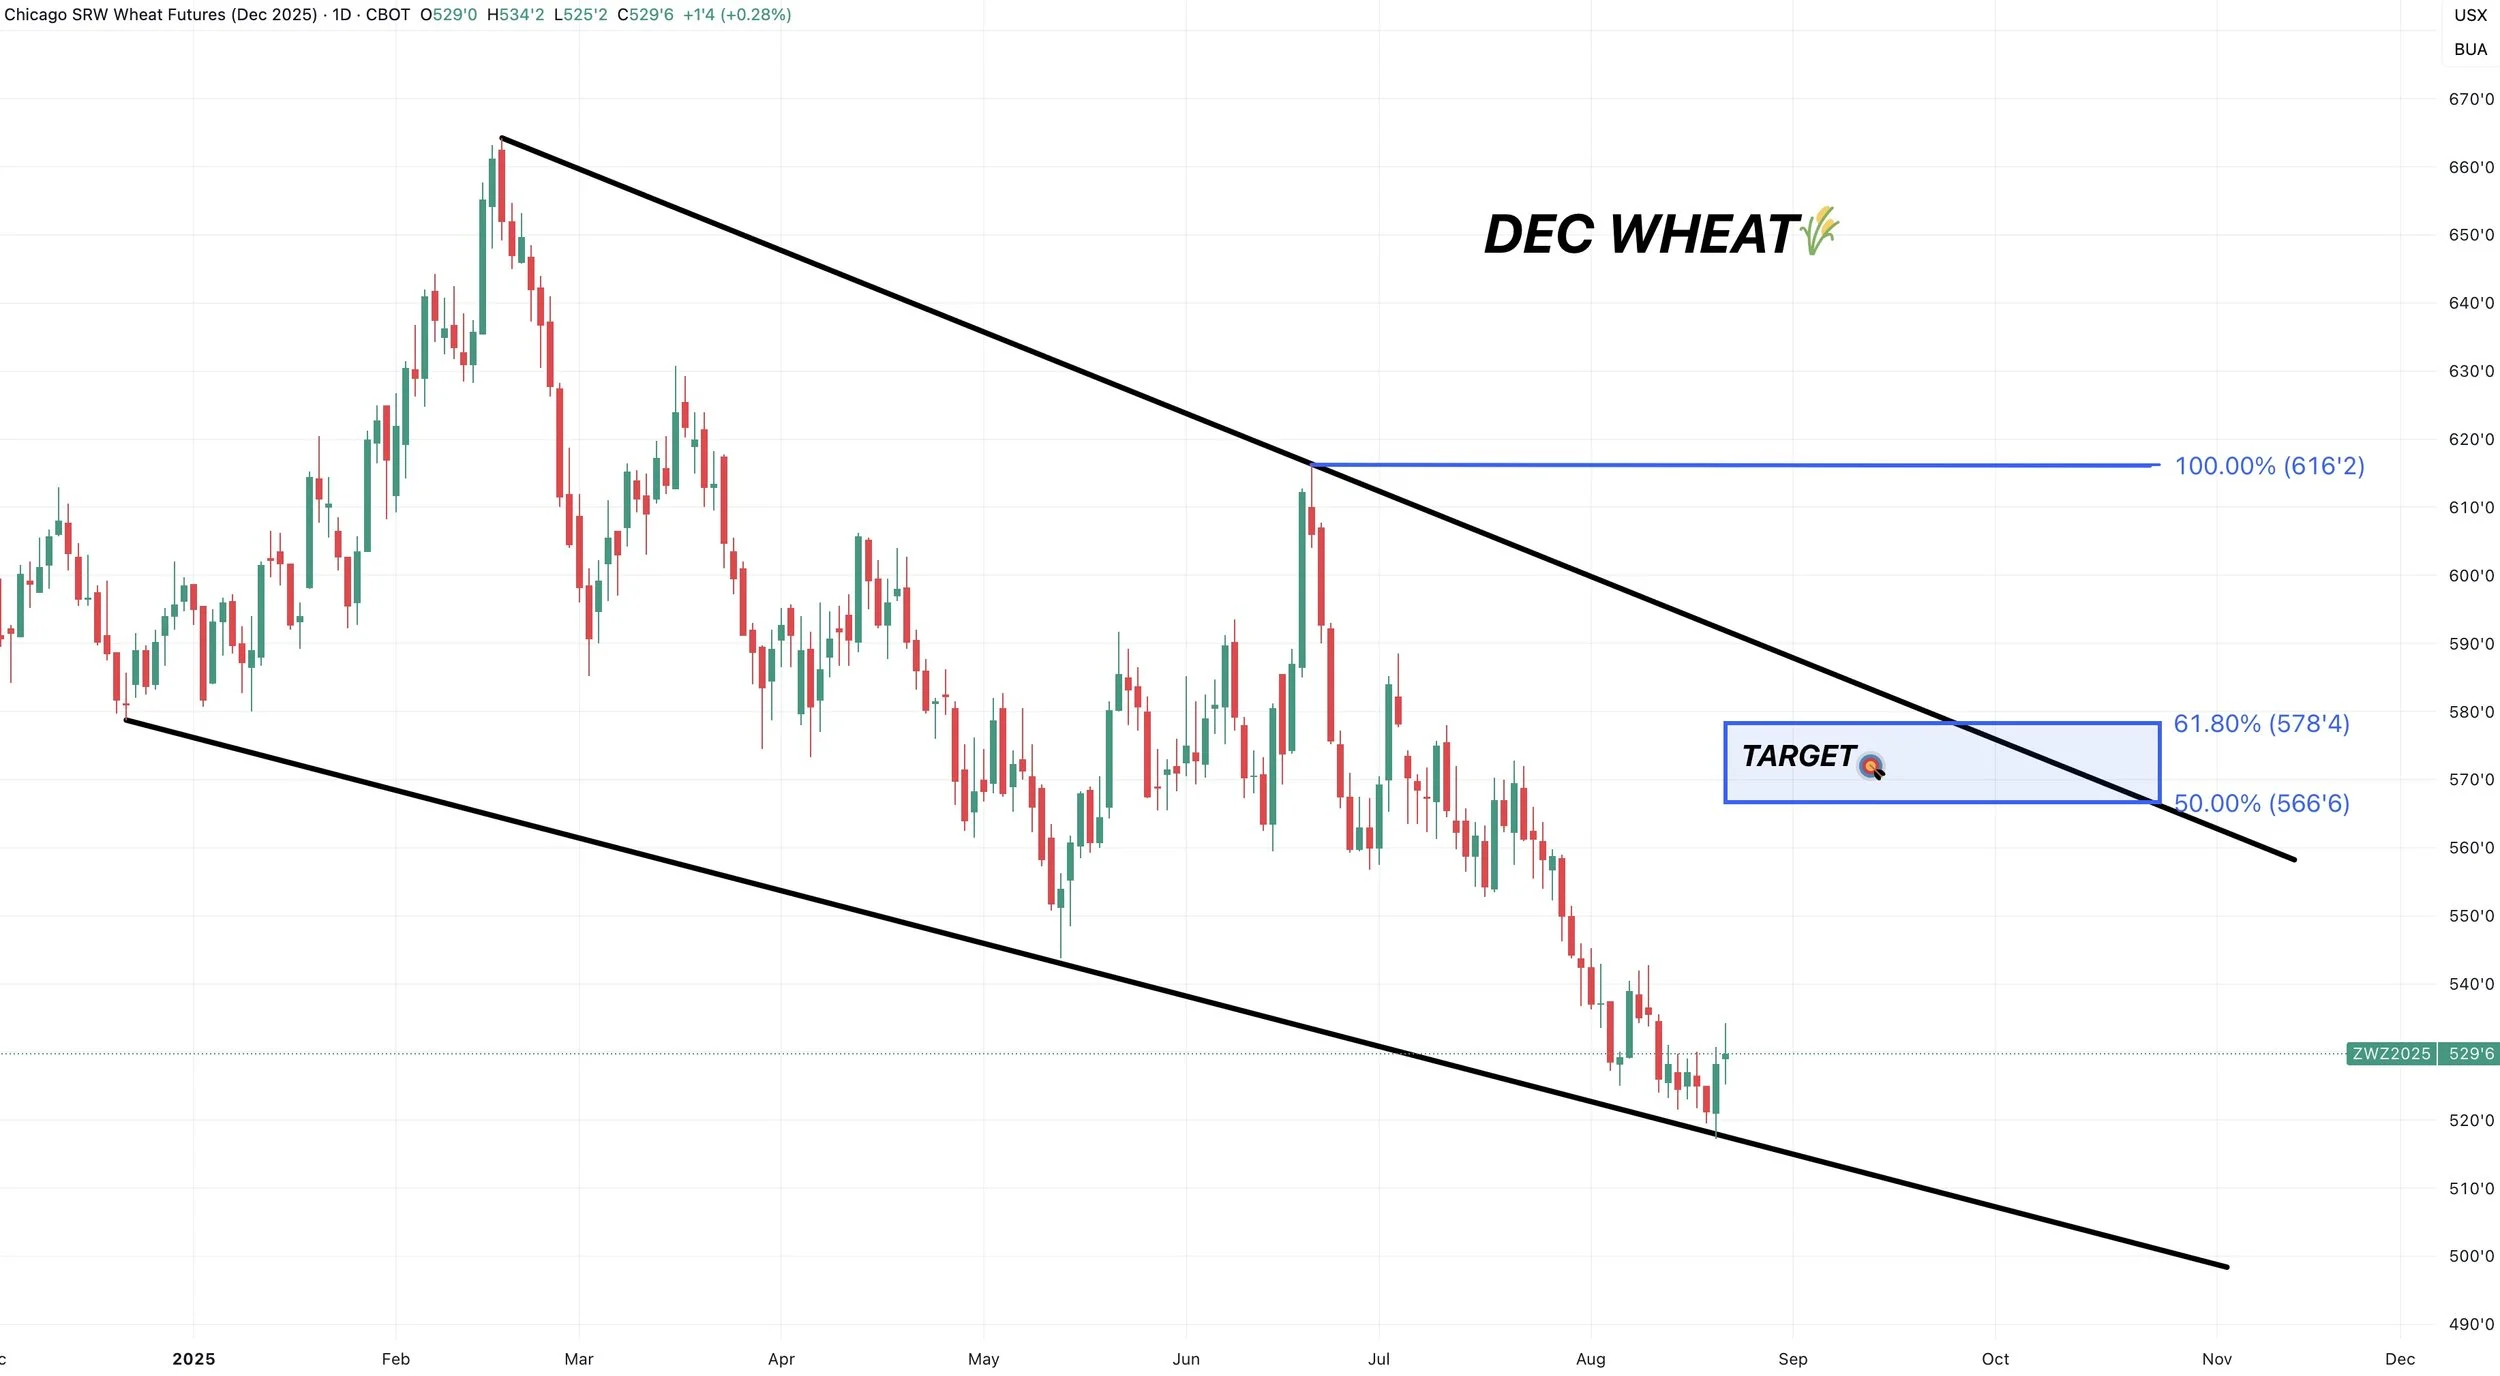
Daily Chicago:
Yesterday we posted a bullish key reversal.
We posted new contract lows then closed above the prevoius days highs.
We are also sitting at the bottom of this massive wedge pattern.
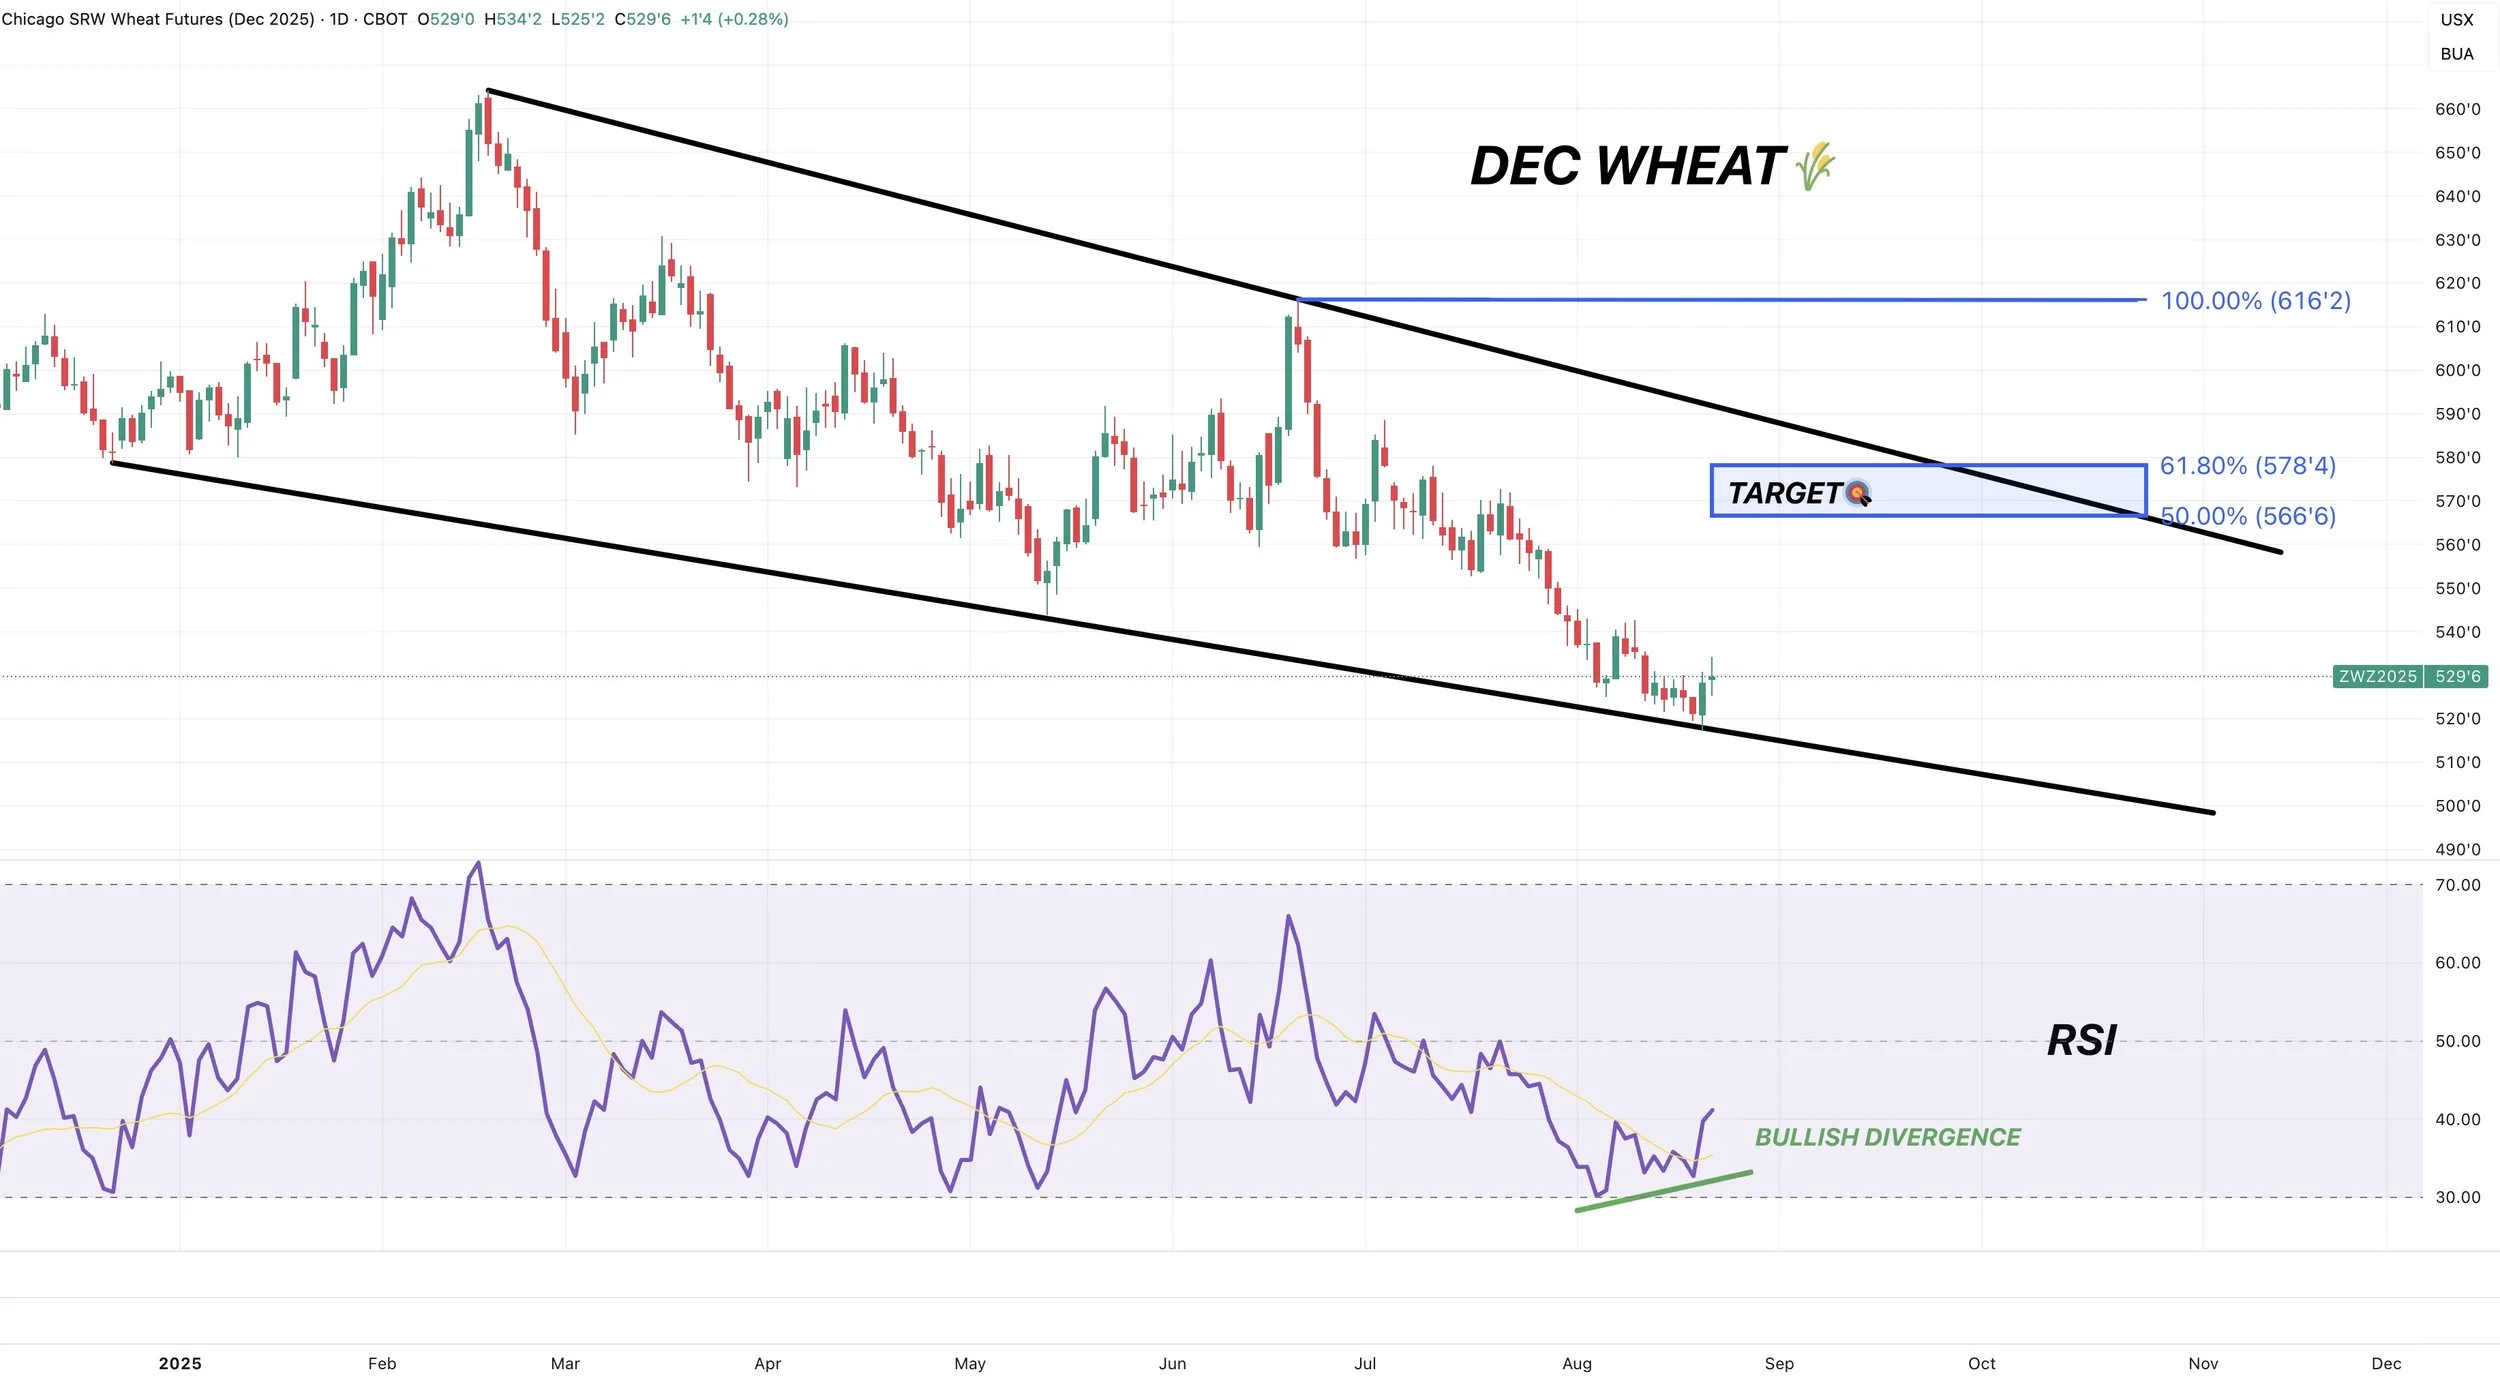
We are also showing bullish RSI divergence.
Prices made new contract lows.
The RSI made a higher high and bounced.
When the RSI doesn’t follow prices, it create divergence.
In this case, it is a sign that downside momentum is getting weaker.
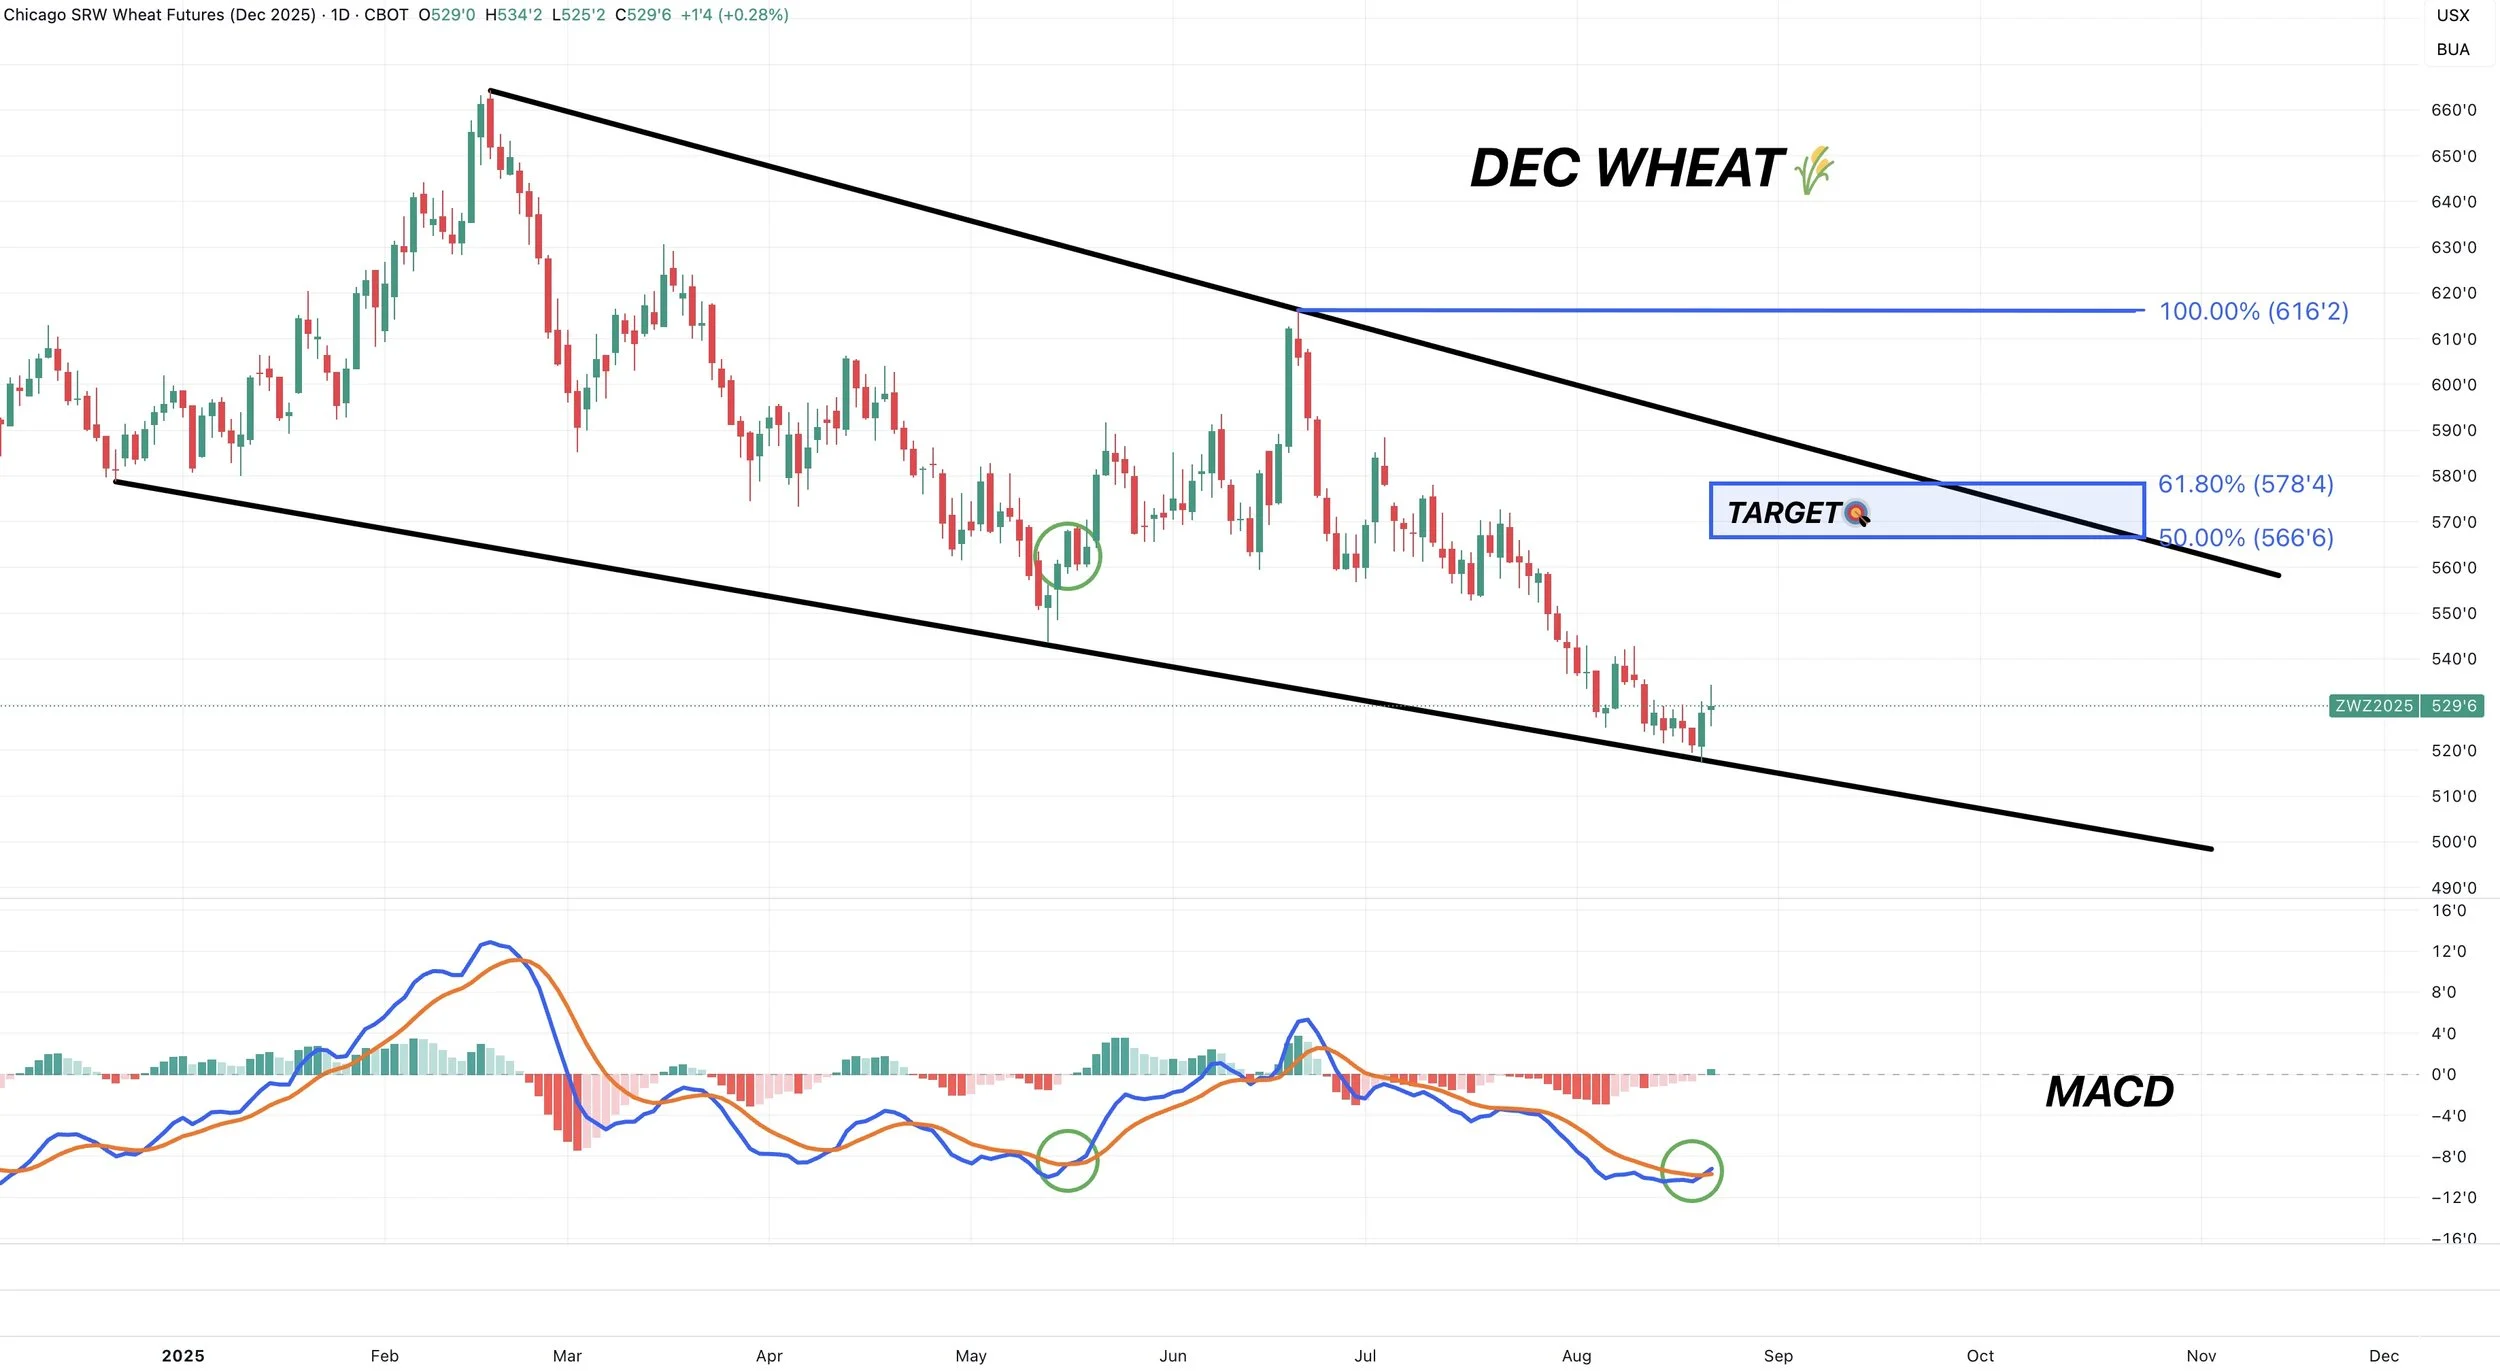
The MACD just crossed bullish for the first time since May.
Last time, it marked our lows and stayed bullish until June.
The MACD is basically just a mometum indicator.
It suggests momentum is shifting higher.
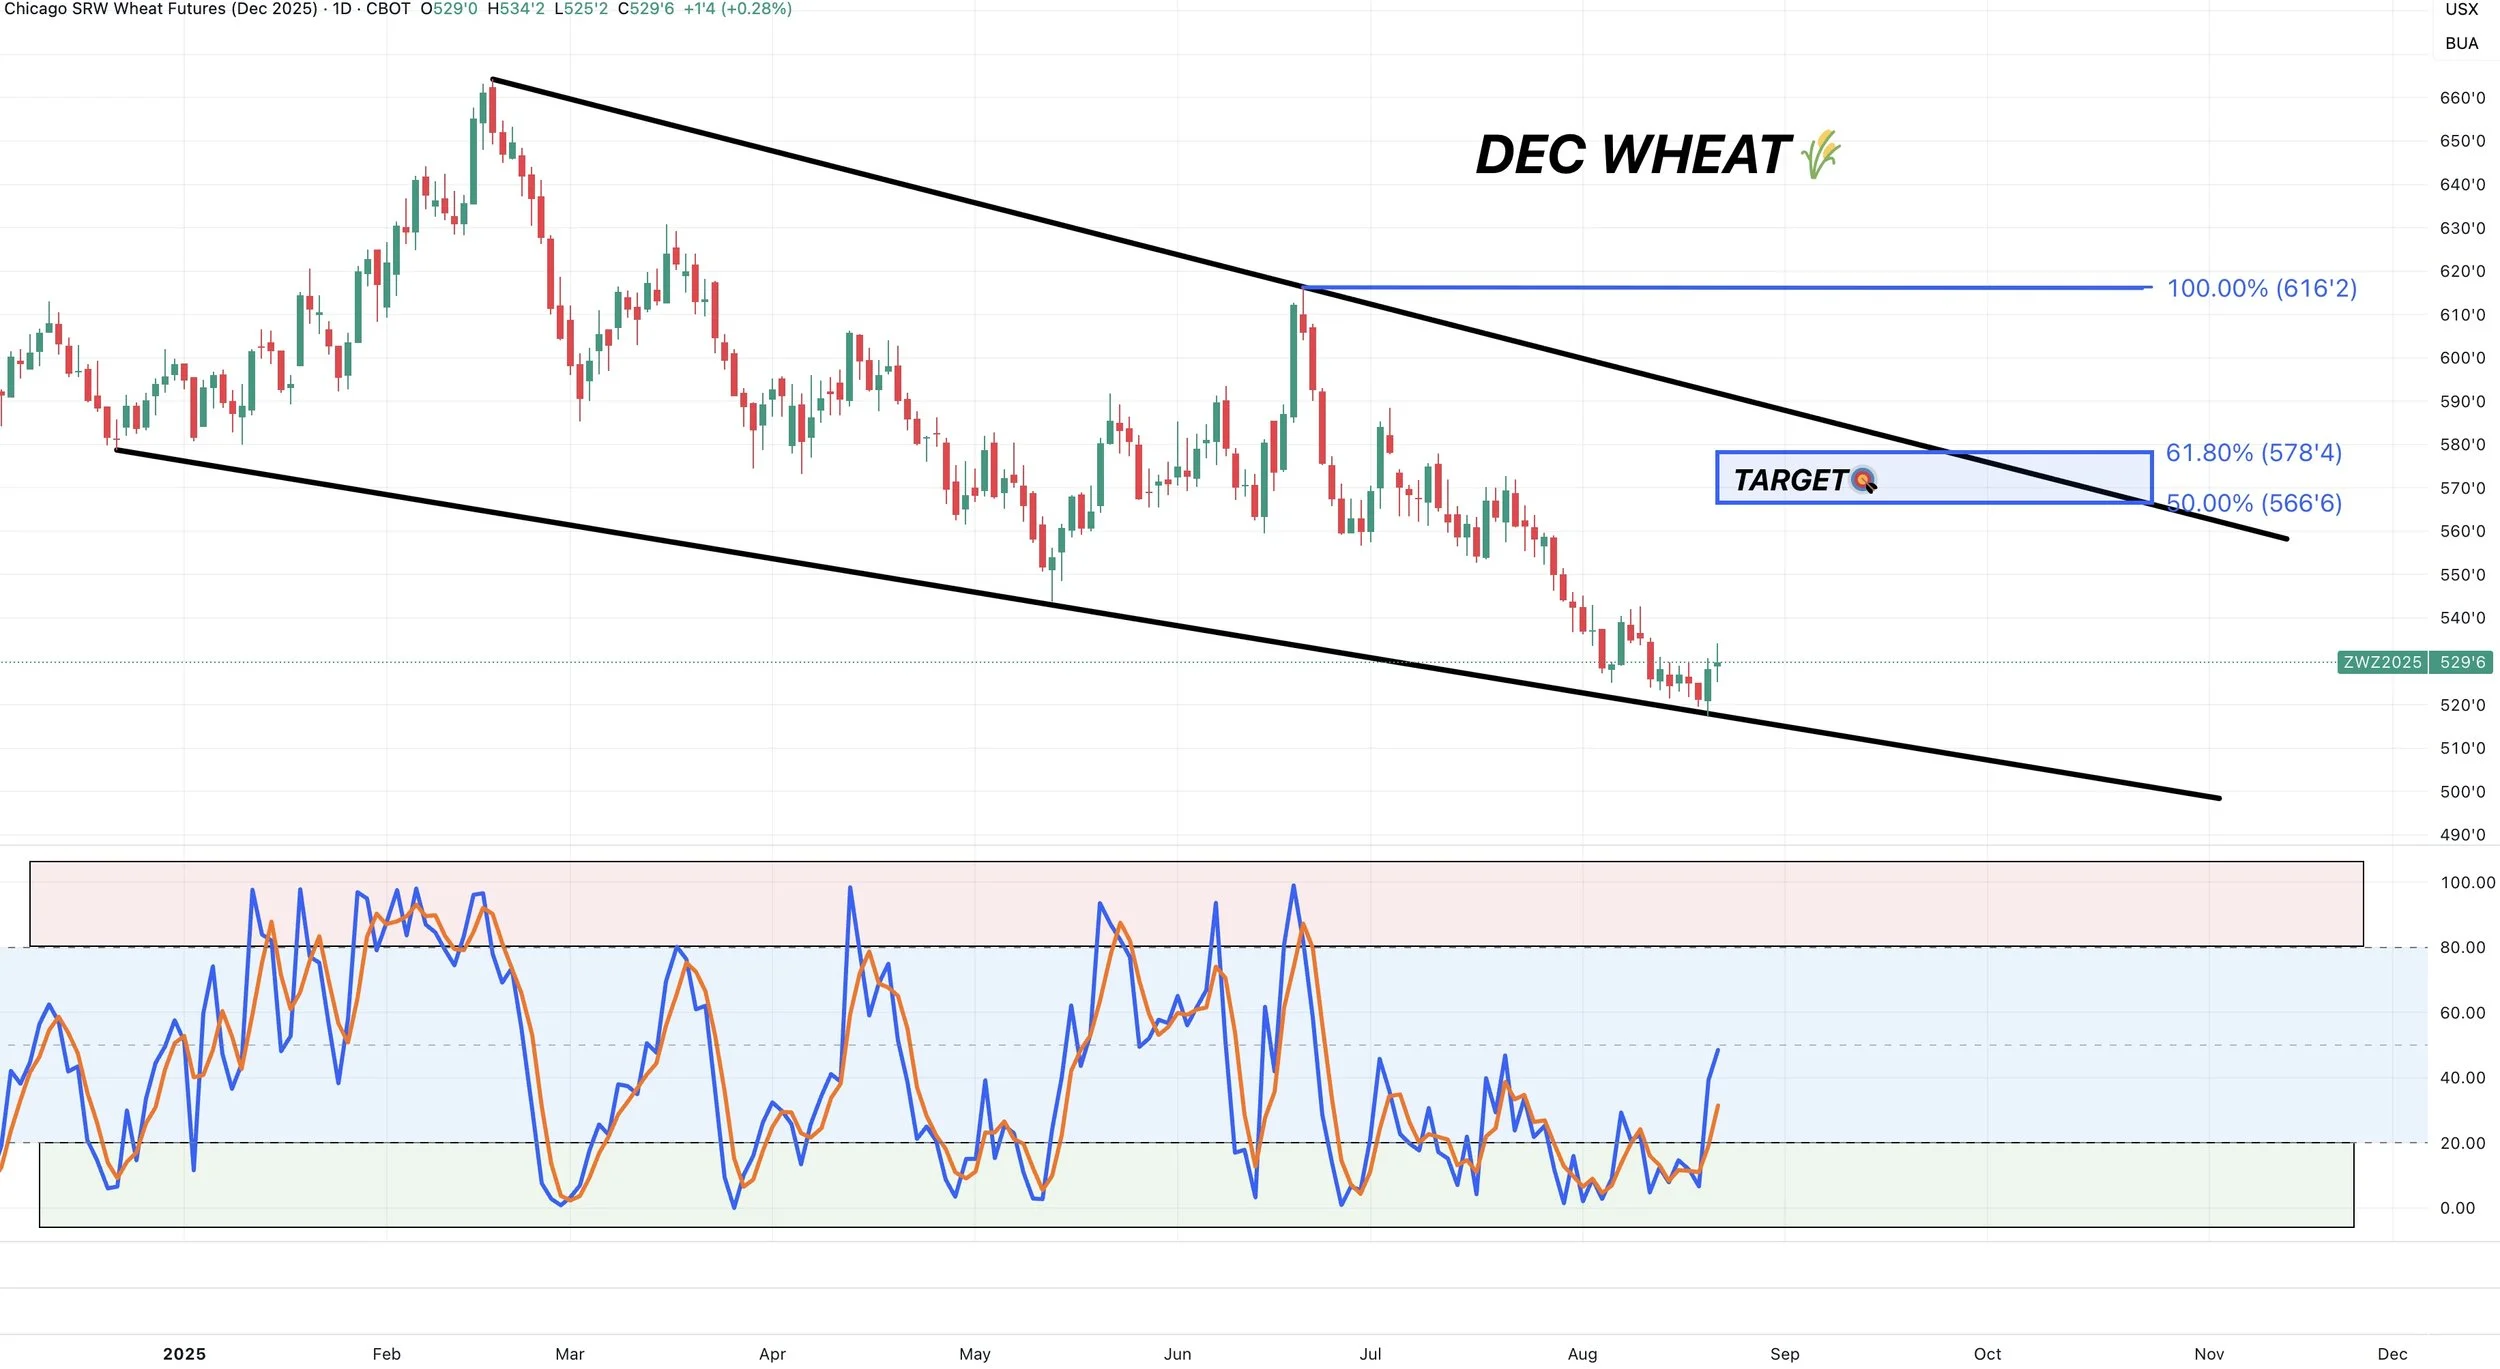
The stochastics were also completely bottomed out.
Now shifting higher.
If you follow Roach Ag, this indicator is how they identify their sell and buy signals.
When it's in the green box, it's a buy signal.
When it's in the red box, it's a sell signal.
It is a great tool, but I like to use several different moving parts in my technical analysis. As stochastics aren’t perfect. Because they can remain elevated or bottomed for an extended period of time.
Nonetheless, it was another reason to give me conviction here.
Daily KC Wheat:
KC wheat is also hovering right at the bottom of this massive wedge pattern.
Currently bouncing right off of it.

KC also posted bullish RSI divergence.
Prices made a lower low.
The RSI made a higher high.

Cattle
Very little to update on the cattle market.
It's getting harder to chart and come up with targets because every pullback is small and short lived.
So I apologize if my targets & analysis vary day to day, as I'm constantly seeing new stuff on the charts.
Feeders have not seen back to back red days in two months.
I like keeping puts on here for downside protection, because things could get nasty when and if we decide to get an actual correction. I prefer to stay away from futures.
Just look at this monthly chart. We haven’t seen a red month this year.
A massive +46% rally without a single red month.

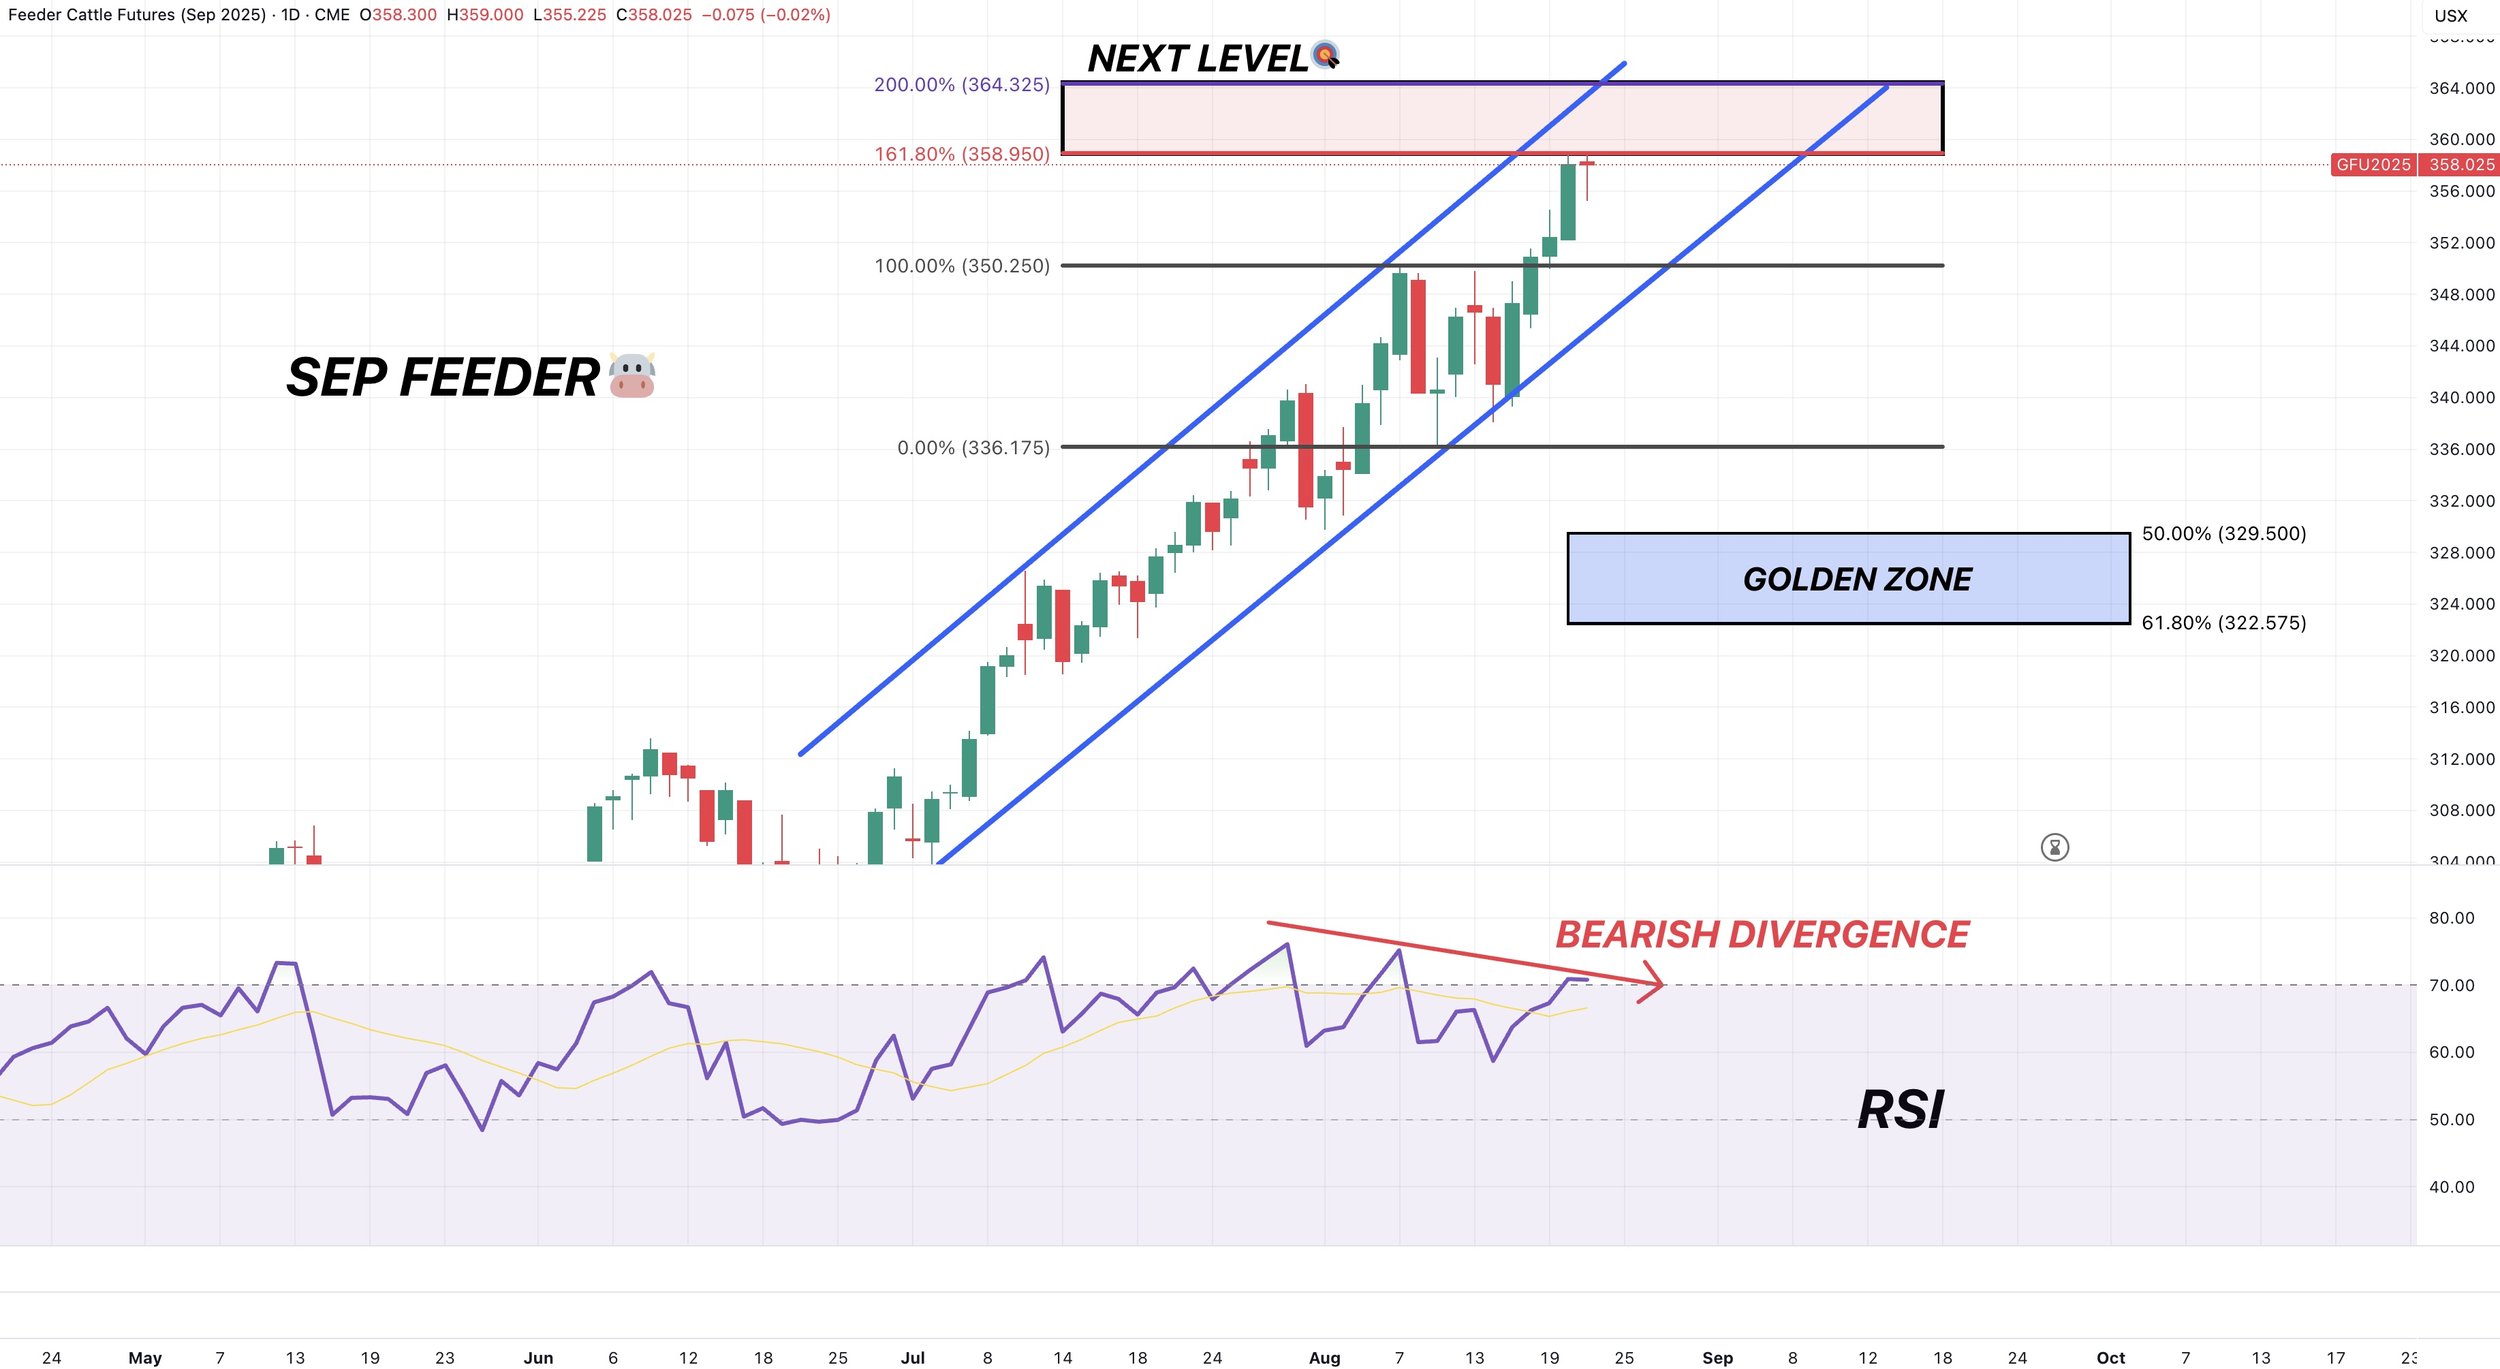
Sep Feeder:
We tapped the golden fib from the most recent sell off.
The 161.8% level.
So a pullback here would make sense.
If not, our next level is going to be a tad over 364.
Still watching the bottom of this channel. If we break it, that is going to be our first sign of true weakness.
If that happens, our downside target is the blue box.

We are still showing bearish divergence.
This doesn’t mean we fall out of bed tomorrow.
It is simply a possible warning sign.
When this cattle market decides to pull back, it could be aggressive.
Oct Live:
Oct live cattle hit the golden fib from the July 31st sell off and rejected there.
So a pull back here makes sense as well.
If not, the next level is the 200% just shy of 239.

Past Sell or Protection Signals
We recently incorporated these. Here are our past signals.
July 31st: 🐮
Cattle sell signal & hedge alert.
July 10th: 🐮
Cattle sell signal & hedge alert.
CLICK HERE TO VIEW
June 5th: 🐮
Cattle sell signal & hedge alert.
June 2nd: 🌾
MPLS wheat sell signal.
April 10th: 🌽
Old crop corn sell signal.
March 19th: 🐮
Cattle hedge & sell signal.
Feb 18th: 🌽 🌾
Old crop KC wheat & old crop corn signal.
Jan 23rd: 🌽 🌱
Corn & beans old crop sell signal.
CLICK HERE TO VIEW
Jan 15th: 🌽 🌱
Corn & beans hedge alert/sell signal.
Jan 2nd: 🐮
Cattle hedge alert at new all-time highs & target.
Dec 11th: 🌽
Corn sell signal at $4.51 200-day MA
CLICK HERE TO VIEW
Oct 2nd: 🌾
Wheat sell signal at $6.12 target
Sep 30th: 🌽
Corn protection signal at $4.23-26
Sep 27th: 🌱
Soybean sell & protection signal at $10.65
Sep 13th: 🌾
Wheat sell signal at $5.98
May 22nd: 🌾
Wheat sell signal when wheat traded +$7.00
Want to Talk?
Our phones are open 24/7 for you guys if you ever need anything or want to discuss your operation.
Hedge Account
Interested in a hedge account? Use the link below to set up an account or shoot Jeremey a call at (605)295-3100.
Check Out Past Updates
8/20/25
BUY SIGNAL
8/20/25
NAVIGATING BASIS & CATTLE BULL RUN
8/19/25
CROP CONCERNS & DRY FINISH?
8/18/25
CROP TOURS STARTING
8/15/25
CORN BOUNCING DESPITE MONSTER SUPPLY. WILL CROP TOUR SHOW ISSUES?
8/14/25
HOW TIGHT IS SOYBEAN SITUATION?
8/13/25
UPCOMING CROP TOURS & NEXT BEAN TARGET
8/12/25
MAJOR USDA SHOCK. HOW DOES THIS CHANGE THINGS?
8/11/25
TRUMP SAYS CHINA NEEDS BEANS. USDA TOMORROW
8/8/25
CALM BEFORE USDA STORM & CATTLE LIMIT DOWN
8/7/25
USDA PREVIEW & MORE DETAILS ON BUY SIGNAL
8/6/25
CORN REVERSAL? RIDING CATTLE RUN BUT BEING DISIPLINED
8/5/25
188 CORN YIELD? AUGUST CATTLE CONCERNS?
8/4/25
NEW CORN LOWS & USDA NEXT WEEK
8/1/25
STOUT DEMAND & WET JULY
7/31/25
WHERE IS CORN & BEAN BOTTOM? WAS THAT CATTLE TOP?
7/31/25
CATTLE HEDGE ALERT & SELL SIGNAL
7/30/25
ANY HOPE LEFT FOR GRAINS?
7/29/25
SEASONAL STRUGGLE CONTINUES
7/28/25
EXTREME BEARISHNESS PRICED INTO GRAINS. CATTLE WARNING SIGNS
7/25/25
NO REASON TO RALLY. NO REASON TO COLLAPSE
7/24/25
CORN DEMAND OVERSTATED? CATTLE CLOSE TO TOP?
7/23/25
JAPAN DEAL NOT ENOUGH
7/22/25
CROP RATINGS MATTER?
7/21/25
RAIN MAKES GRAIN
7/18/25
OVERNIGHT HEAT & ROOM FOR ERROR
7/17/25
POOR CORN EXPORTS MATTER? REWARD BEAN BOUNCE?
7/16/25
ARE CORN & BEANS UNDERVALUED OR NOT?
7/15/25
NEGATIVE NEWS POSITIVE ACTION IN GRAINS
7/14/25
DON’T GIVE GRAIN AWAY
7/11/25
USDA FRIENDLY CORN. MARKET DOESN’T CARE
7/10/25
JULY USDA OUT TOMORROW
7/10/25
CATTLE HEDGE ALERT & SELL SIGNAL
7/9/25
MARKET SEES RECORD CROPS
7/8/25
MONSTER CORN YIELD..?
7/7/25
TRUMP PUMP & DUMP
7/3/25
CORN & BEANS REJECT KEY SPOT. TRUMP SPEAKS IN IOWA
7/2/25
TRADE DEALS? BEANS RALLY AT GOLDEN ZONE
7/1/25
NOW WHAT FOR GRAINS?
6/30/25
BORING USDA. DIDN’T SAY HAVE TO GO LOWER
6/30/25
USDA NUMBERS
6/27/25
ALL EYES ON MONDAY
6/26/25
FIREWORKS OR BLOOD BATH MONDAY?
6/25/25
GRAINS COLLAPSING AHEAD OF JUNE REPORT
6/24/25
CORN CONTINUES SELL OFF. MAJOR USDA REPORT COMING
6/23/25
CORN CAN GO LOWER, BUT NOT FOR FOREVER
6/20/25
WHO SHOULD REWARD THE WHEAT & SOYBEAN RALLY?
6/18/25
COMPLETE CHART BREAKDOWNS
6/17/25
SOYBEANS CONTINUE BREAKOUT. NEARING SELL SIGNAL
6/16/25
CORN HAMMERED. EPA GAME CHANGER IN BEANS?
6/13/25
SOYBEANS RALLY, CHARTS, BALANCE SHEETS & MORE
6/12/25
USDA NON-EVENT. WHAT’S NEXT?
6/11/25
DIVERGENCE & SEASONAL SELL OFF?
6/10/25
BEING PATIENT VS BALANCING YOUR RISK
6/9/25
WHAT IF WE DON’T GET A WEATHER SCARE?
6/5/25
CORN & BEANS HOLDING CRUCIAL SPOTS
6/5/25
CATTLE SELL SIGNAL & HEDGE ALERT
6/4/25
HOW UNKNOWNS IMPACT MARKETING DECISIONS
6/3/25
KEY SPOTS ON THE CHARTS FOR CORN & BEANS
6/2/25
NEW LOWS IN CORN. DE-RISKING MPLS WHEAT
6/2/25
SPRING WHEAT SELL SIGNAL
5/30/25
SEASONAL RALLY STILL IN THE CARDS?
5/29/25
WHAT IS YOUR PLAN IF WE DO NOT RALLY?
5/28/25
ZERO PREMIUM IN THE GRAIN MARKETS
5/27/25
CORN CONDITIONS DISAPPOINT & JUNE OUTLOOK IMPROVES
5/23/25
TARIFFS SPOOK MARKET. GAME PLAN MOVING FORWARD
5/22/25
CHART BREAKDOWNS & TARGETS
5/21/25
RISK TO THE UPSIDE WITH WEATHER?
5/20/25
WHEAT SHORT COVERING & HISTORY OF YIELD CHANGES
5/19/25
ANYONE LEFT TO SELL WHEAT? 181 CORN YIELD POSSIBLE?
5/16/25
FUNDS SHORT CORN. MARKETS WAITING ON WEATHER
5/15/25
BEANS HAMMERED ON RUMOR & WHEAT FINDING LIFE
5/14/25
DECISIONS & POSSIBILITIES IN GRAINS
5/13/25
GRAINS RALLY OFF LOWS
5/12/25
USDA REPORT. HOW THIS CHANGES THINGS
5/9/25
BIGGEST RISKS IN USDA REPORT
5/8/25
USDA MONDAY & HISTORY OF WEATHER RALLIES
5/7/25
NEW 2025 LOWS FOR CORN
5/6/25
WHAT’S A SUMMER RALLY LOOK LIKE?
5/5/25
CORN ERASES ENTIRE APRIL RALLY
5/2/25
SELL INTO UNCERTAINTY. NOT KNOWN FACTORS
5/1/25
THE CASE AGAINST A FEB TOP IN CORN
4/30/25
APPROACHING KEY TIME PERIOD FOR GRAINS
4/29/25
PLANTING & FIRST NOTICE DAY PRESSURE. CORN CLOSE TO BOTTOM?
4/28/25
CAPTURING INVERSE & SEASONAL PREPARATION
4/25/25
HOW OFTEN DOES CORN NOT BREAK APRIL HIGHS?
4/24/25
KNOW WHEN TO SELL. BEANS BREAK 200-DAY FIRST TIME IN 483 DAYS
4/23/25
MONEY FLOW & DROUGHT CARDS
4/22/25
CRUCIAL SPOT FOR CORN & BEANS
4/21/25
NO PLANTING THREAT YET
4/18/25
POTENTIAL OPPORTUNITIES, BASIS CONTRACTS & STRATEGIES
4/16/25
HOW YIELD IMPACTS CARRYOUT. MAJOR SPOT FOR SOYBEANS
4/15/25
TOTAL CHART BREAKDOWNS & TARGETS
4/14/25
TECHNICAL SELLING IN GRAINS
4/11/25
SPECIFIC GRAIN MARKETING DECISIONS
4/10/25
USDA REPORT. HOW THIS IMPACTS CORN
4/9/25
TARIFFS GIVE. TARIFFS TAKE
4/8/25
CORN’S DIVERGING STRENGTH
4/7/25
SOLID PRICE ACTION DESPITE OUTSIDE FEAR
4/4/25
CORN PRICE ACTION SPEAKS VOLUME. ANY HOPE LEFT FOR SOYBEANS?
4/3/25
WHAT IS LEFT FOR CORN BEARS? TRADE WAR: CHARTS HOLDING SUPPORT
4/2/25
SHOULD UNKNOWNS KEEP A FLOOR UNDER GRAIN PRICES?
4/1/25
HOW DO ACRES IMPACT FUTURE OF THE GRAINS?
3/31/25
USDA REPORT: NOW WHAT?
3/28/25
ALL EYES ON USDA
3/27/25
PRE-USDA POSITIONING. DON’T GIVE GRAIN AWAY
3/26/25
HISTORY OF MARCH INTENTIONS. SOYBEANS UNDERVALUED?
3/25/25
6 DAYS UNTIL MAJOR USDA REPORT
3/24/25
HOW TO POSITION YOURSELF BEFORE PLANTING
3/21/25
REASONS TO BE OPTIMISTIC IN GRAINS?
3/20/25
WAS THAT THE BOTTOM IN CORN?
3/19/25
THE PATH HIGHER & THE DOWNSIDE RISKS IN GRAINS
3/18/25
SEASONALS, CATTLE HEDGE, CHARTS & DROUGHT?
3/17/25
WHEAT RALLIES. DON’T GET BACKED INTO A CORNER
3/14/25
MARCH 31ST REPORT THOUGHTS & WHAT’S NEXT FOR GRAINS
3/13/25
EXPLAINING RE-OWNERSHIP VS COURAGE CALLS
3/12/25
TARIFF FEARS. EU, CANADA, & ETHANOL
3/11/25
USDA SNOOZE. RECORD FUND SELLING A CONCERN?
3/10/25
USDA TOMORROW. GETTING COMFORTABLE IN MARKETING
3/7/25
HOW TIGHT IS THE WORLD & US SITUATION?
3/6/25
TARIFFS PUSHED BACK. FUTURE OPPORTUNITIES?
3/5/25
IS GRAINS BIGGEST RISK WEAK CRUDE & DEFLATION?
3/4/25
TRADE WAR BEGINS. 8TH DAY OF PAIN FOR GRAINS
3/3/25
TARIFFS ON TOMORROW. BUY SIGNAL
3/3/25
BUY SIGNAL
2/28/25
WHEN WILL THE BLEEDING STOP?
2/27/25
CORN AT CRITICAL SPOT. USDA ACRE REPORT. WAY TOO EARLY DROUGHT TALK
2/26/25
HISTORY SUGGESTS CORN TOP ISN’T IN? ACRE OUTLOOK TOMORROW
2/25/25
POSITIVE CLOSE. WHAT TO KNOW ABOUT USDA OUTLOOK
2/24/25
USDA OUTLOOK, FIRST NOTICE DAY & BRAZIL
2/21/25
WHAT TO EXPECT MOVING FORWARD IN GRAINS
2/20/25
FIRST NOTICE DAY CONCERNS. MASSIVE CORN ACRES OR NOT?
2/19/25
HOW TIGHT IS THE CORN SITUATION?
2/18/25
MORE DETAILS ON TODAYS SELL SIGNAL
2/18/25
OLD CROP KC WHEAT & CORN SELL SIGNAL
2/14/25
WHEAT BREAKING OUT ON WEATHER RISK. TECHNICALS & FUNDAMENTALS
2/12/25
GLOBAL GRAIN SITUATION, ACRE TALK, CHARTS & MORE
2/11/25
USDA: NOT A BEARISH REPORT. DISAPPOINTING PRICE ACTION
2/10/25
USDA TOMORROW. LONG TERM PATH FOR SUB 10% CORN STOCKS TO USE?
2/7/25
WHY WOULD THE FUNDS EXIT THEIR LONGS?
2/6/25
WHEAT FINALLY CATCHING A BID
2/5/25
COMPLETE THOUGHTS ON MARKETS: BACK & FORTH DISCUSSION
2/4/25
STRONG JANUARY LEAD TO STRONG YEAR? TARIFFS, CHARTS & MORE
2/3/25
TARIFFS PUSHED BACK
1/31/25
TARIFF NEWS ALL OVER THE PLACE. ARE YOU PREPARED FOR POSSIBILITIES?
1/30/25
WHEAT BULL ARGUMENT. TRUMP ADDS TARIFFS
1/29/25
CORN APPROACHES $5.00
1/28/25
TARIFFS, CORN FUNDS, SOUTH AMERICA & MORE
1/27/25
HEALTHY CORRECTION WE TALKED ABOUT & TARIFF NEWS
1/24/25
GRAINS DUE FOR SHORT TERM CORRECTION?
1/23/25
OUR ENTIRE NEW CROP SALES THOUGHTS & OLD CROP SELL SIGNAL
1/22/25
GRAINS TAKE A BREATHER. IS CORN IN A BULL OR BEAR MARKET?
1/21/25
HUGE DAY IN GRAINS. WHAT TO DO WITH OLD CROP VS NEW CROP
Read More
1/20/25
VIDEO CHART UPDATE
1/17/25
TRUMP, CHINA, ARGY & USING THE SPREADS INVERSE
1/16/25
OLD CROP LEADS US LOWER. MARKETING THOUGHTS
1/15/25
SIGNAL & HEDGE ALERT QUESTIONS EXPLAINED. IS $6 CORN EVEN POSSIBLE?
1/14/25
MORE DETAILS ON TODAYS HEDGE ALERT & SELL SIGNAL
1/14/25
CORN & SOYBEANS HEDGE ALERT/SELL SIGNAL
1/13/25
USDA GAME CHANGER OR NOT?
1/10/25
BULLISH USDA FOR CORN & BEANS
1/9/25
USDA OUT TOMORROW
1/8/25
2 DAYS UNTIL USDA. BE PREPARED
1/7/25
THE HISTORY OF THE JAN USDA & MORE
1/6/25
MAJOR USDA REPORT FRIDAY
Read More
1/3/25
UGLY DAY ACROSS THE GRAINS
1/2/25