
HOW TIGHT IS SOYBEAN SITUATION?
MARKET UPDATE
You can scroll to read the usual update as well. As the written version is the exact same as the video.
Timestamps for video:
Overview: 0:00min
Corn: 1:30min
Beans: 6:25min
Wheat: 11:30min
Cattle: 12:35min
Want to talk about your situation?
(605)295-3100
Futures Prices Close

Overview
Grains mostly lower as the soybean market runs into some profit taking following the +60 cent rally. Meanwhile the cattle market sees some heavy pressure.
Not a big news day following the major USDA report on Tuesday.
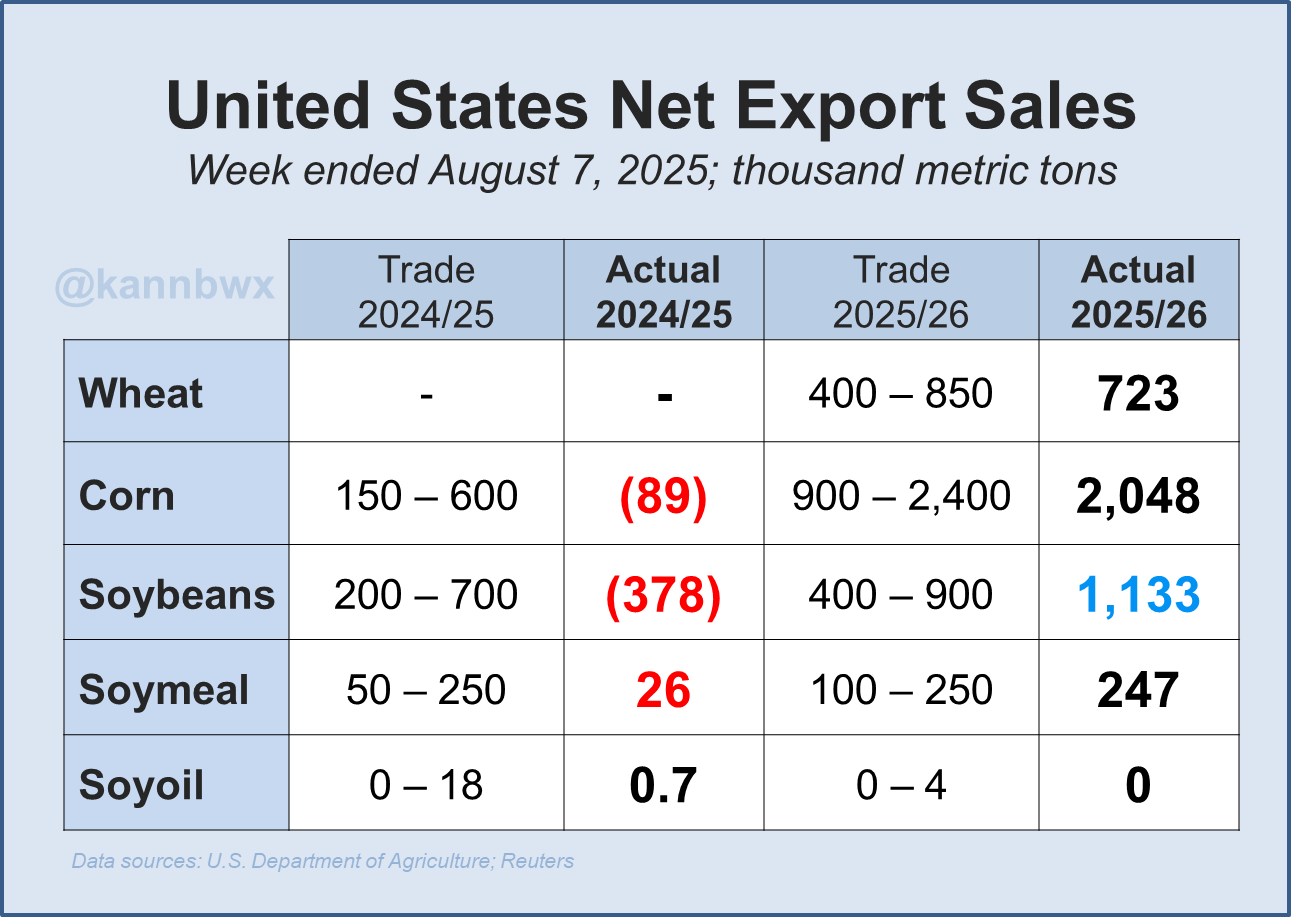
We had export sales out this morning. We saw yet another huge week of new crop corn sales and finally saw some great new crop soybean sales as well.
However, we did see old crop sale cancellations, with the rolling of old crop sales to new crop.
Chart from Karen Braun
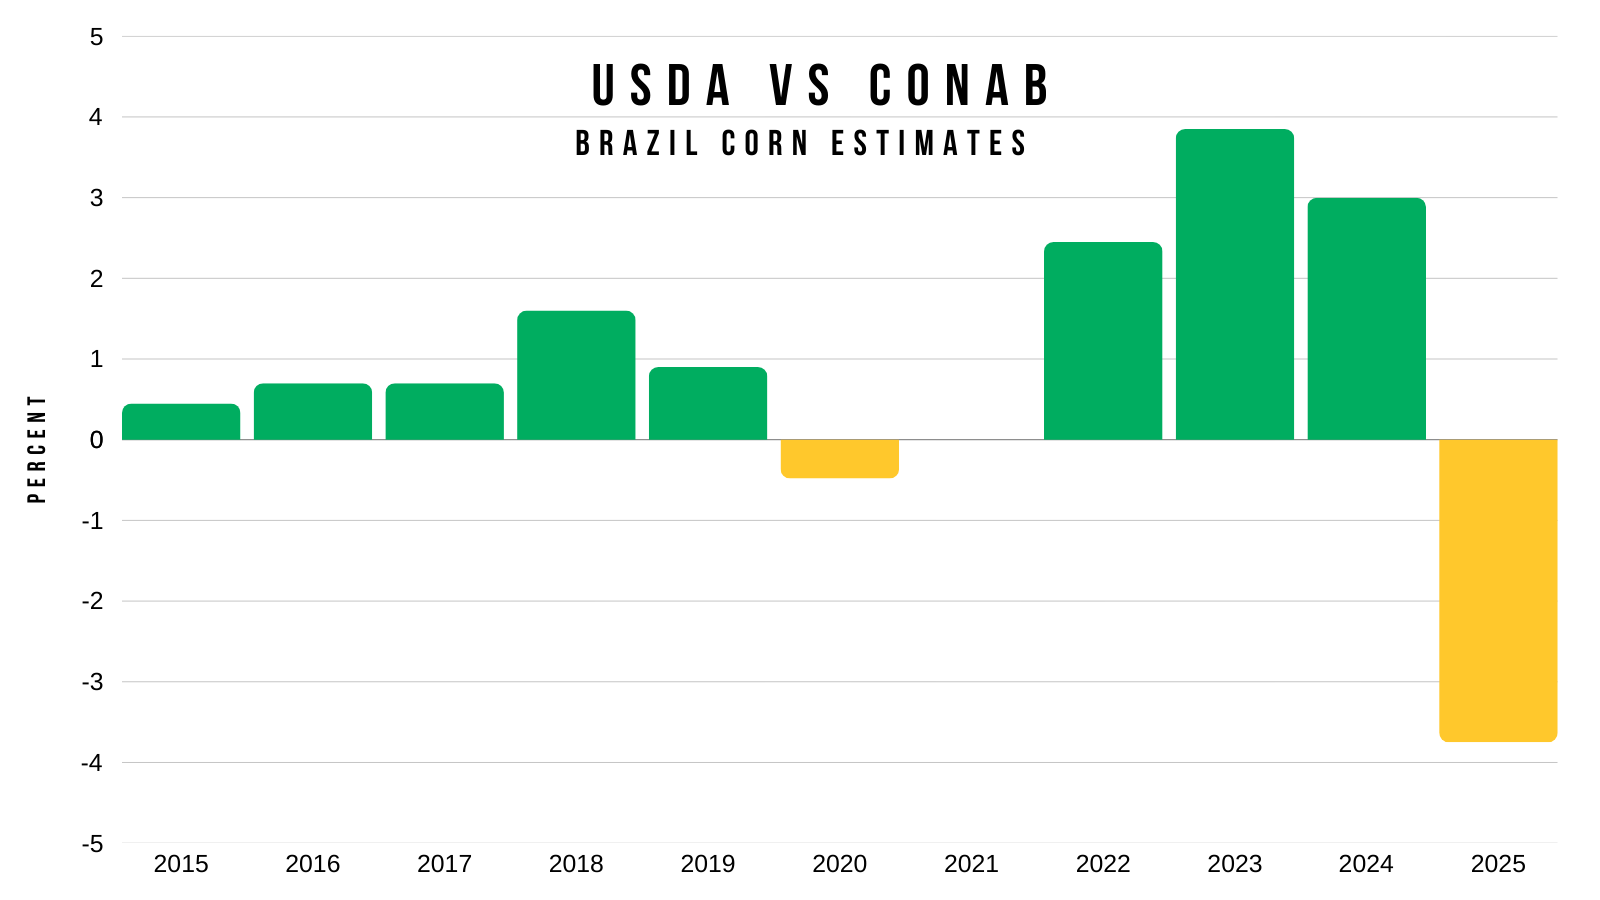
CONAB Report
Outside of that, the only other thing was the CONAB report.
They raised both their Brazil corn yield and acres.
CONAB now sees the crop bigger than the USDA. CONAB's second corn crop is at 137 MMT vs USDA's 132 MMT.
This is basically the first time that the USDA is projecting a smaller crop than CONAB.
Here is a visual of that.
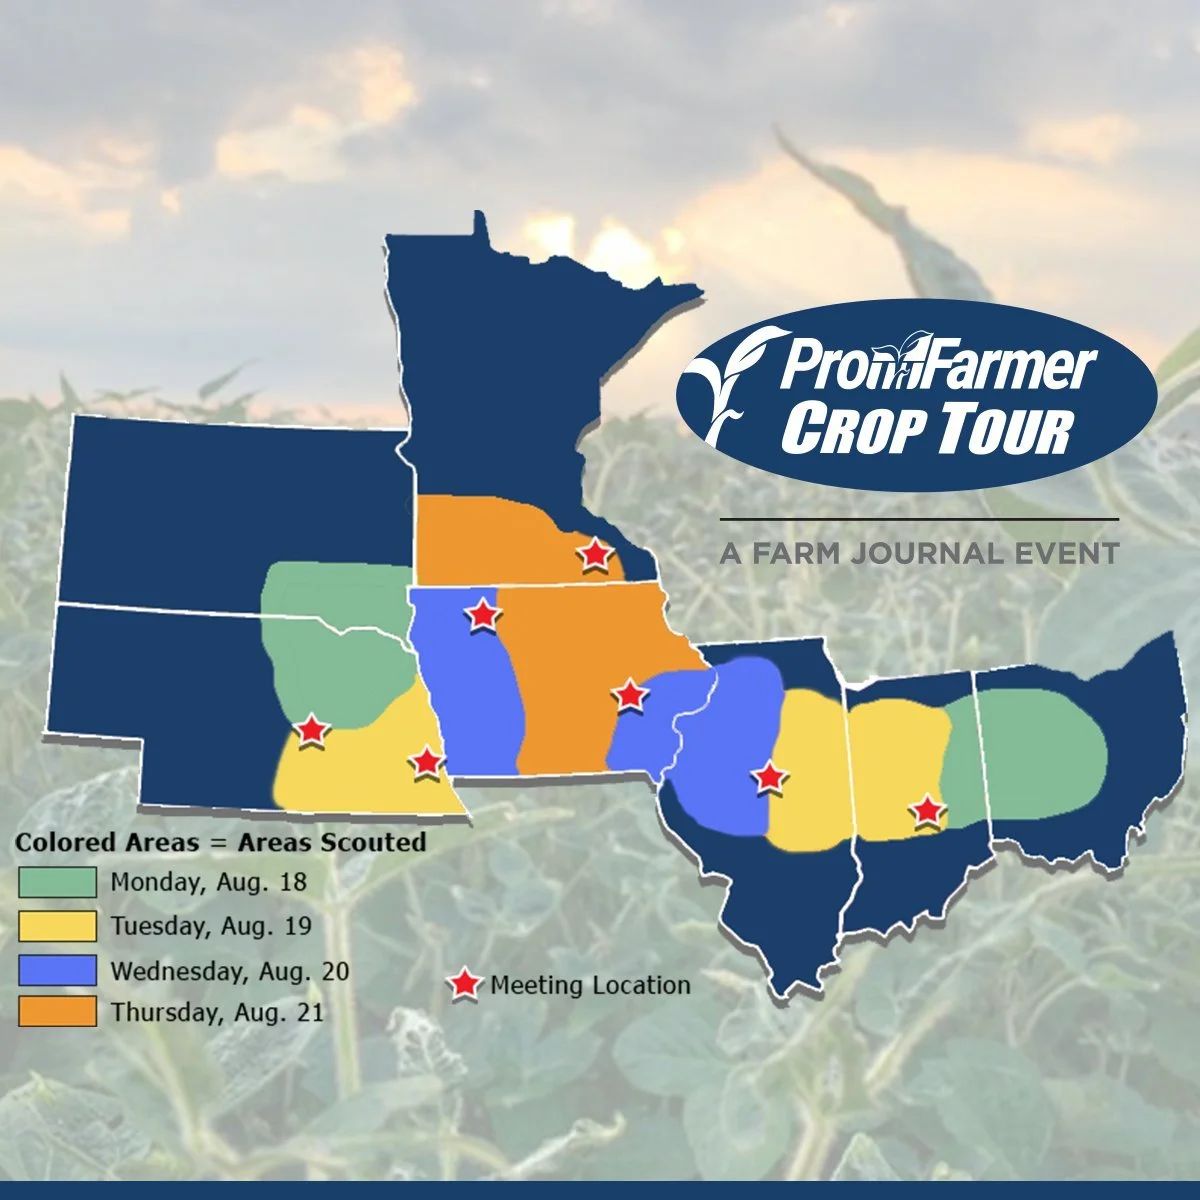
Crop Tours
The Pro Farmer crop tour starts on Monday.
I guess we will find out if there really is any pollination issues or not.
Here is a map of the tour & dates.
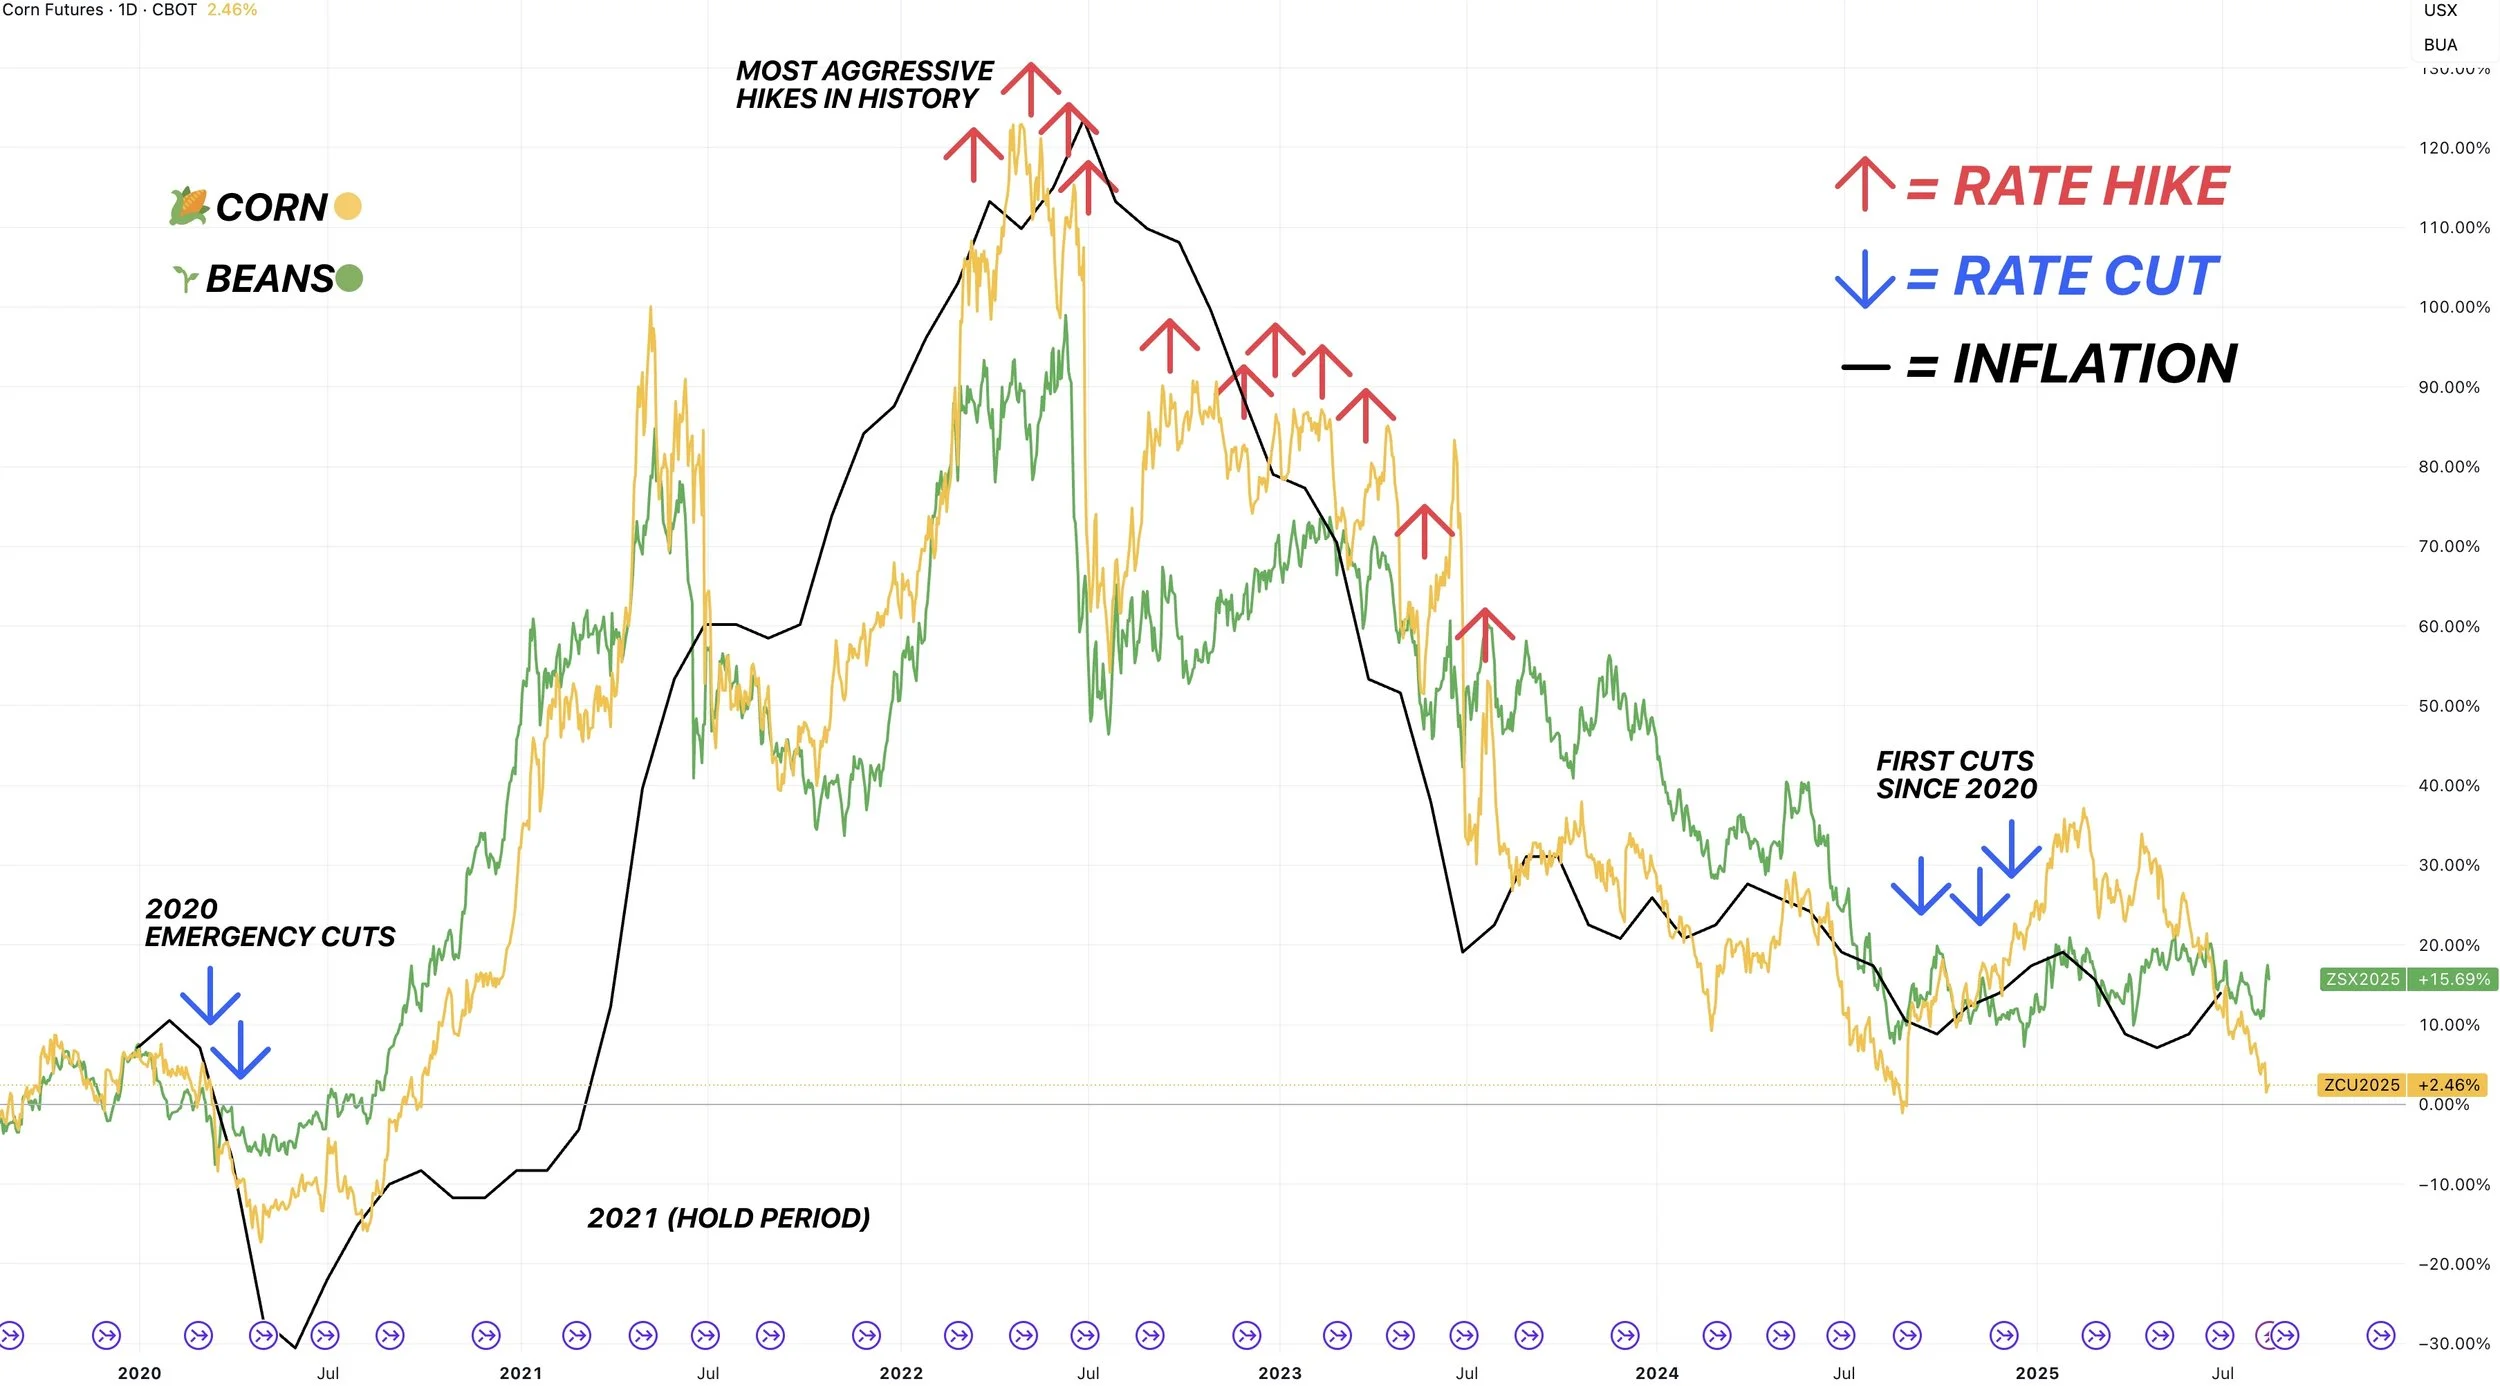
100% Chance of Rate Cuts?
According to the Fed watch tool, there is nearly a 100% chance the feds cut rates in September.
The highest chance since last September, when they cut rates.

This is a long term friendly factor for the grains.
I've shown this chart a thousand times, but look at the correlation between prices when we see rate hikes which lead to less inflation, and rate cuts which lead to higher inflation.
Corn and beans typically follow suite.
Maybe it finally gives the funds a reason to get behind the corn market. Similar to what we saw last year once rates were cut.
Corn
The corn market is holding up decently well considering just how bearish of report we saw two days ago.
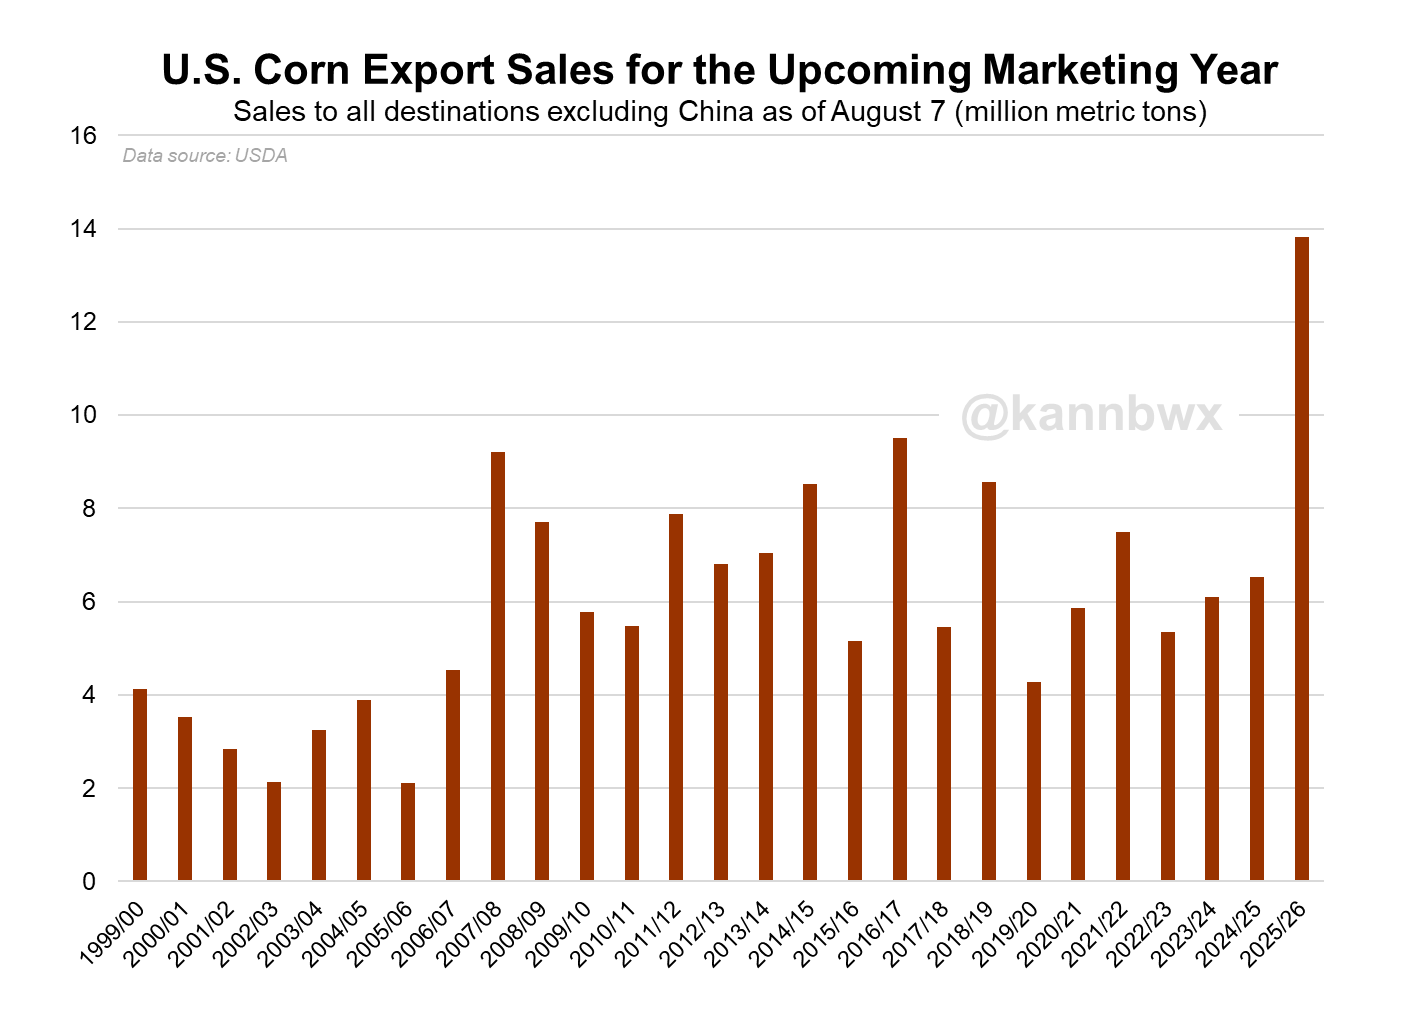
Today we saw a huge week of new crop export sales once again.
Below is new crop corn sales as of August 7th to non-China destinations from Karen Braun.
Very stellar demand.
We are more than double last year's number at this same time frame and nearly 50% higher than the next higher year of 2016.
Like we mentioned Tuesday, the USDA rose supply by a massive +1 billion bushels. To offset this, they raise demand about +500 million bushels.
We are going to need all of that demand.
The only good thing about low prices is that it creates demand. As the market's job is to put prices at a level where these demand numbers are justified.
One could argue that the feed demand numbers and ethanol numbers are a tall task. Especially given the cattle situation.
But exports are the one that seem achievable.
Here is that balance sheet change we showed after the report.

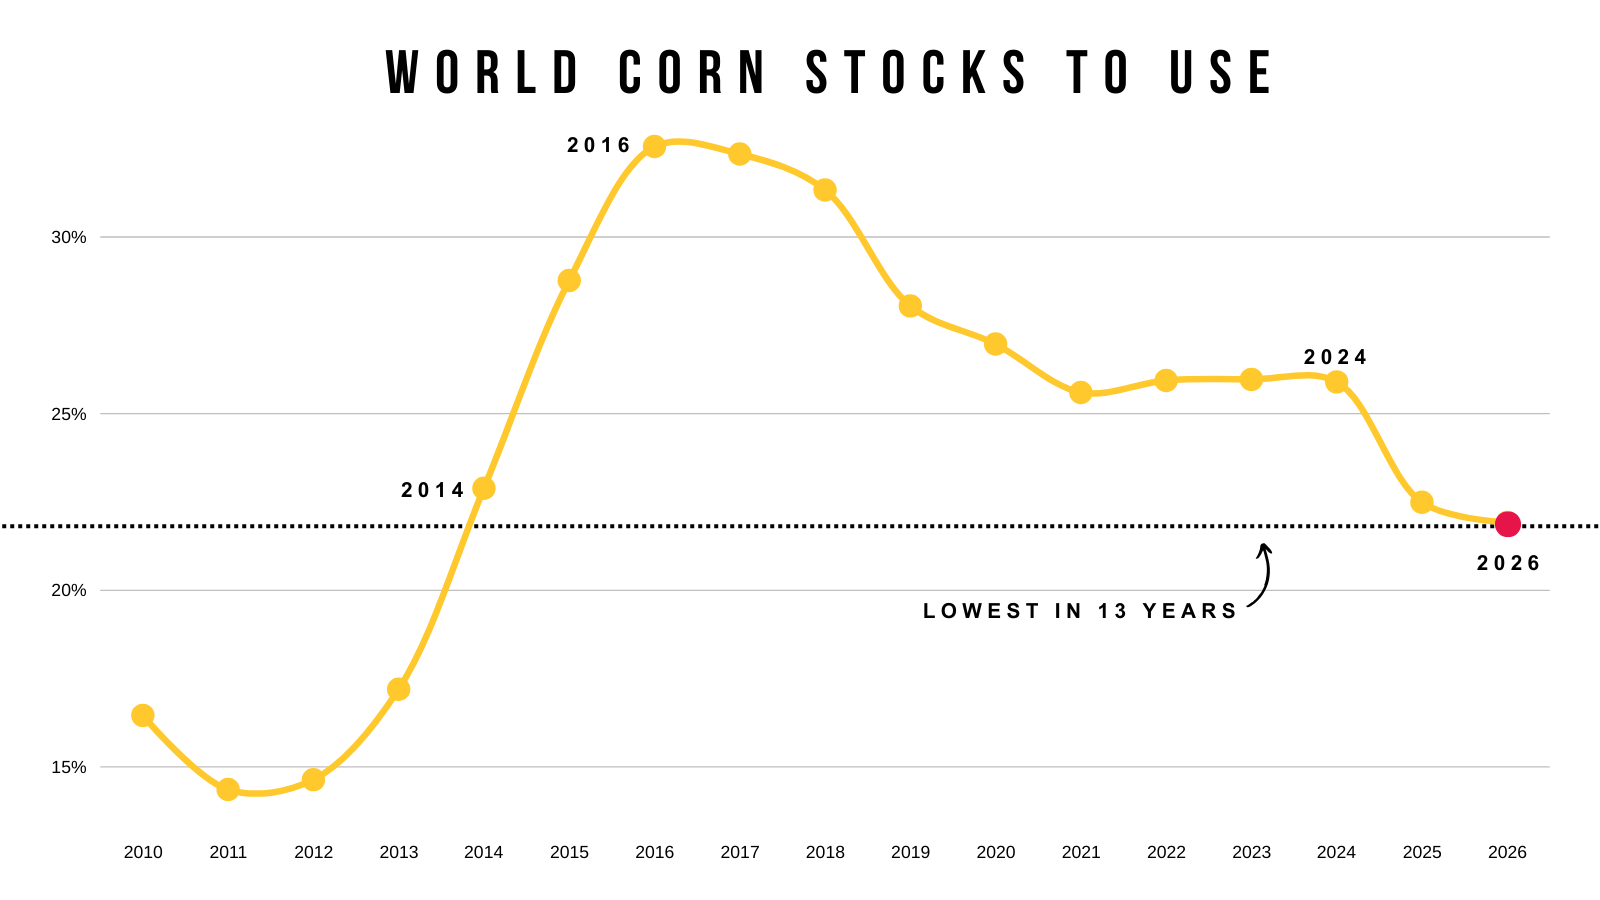
This next visual is why corn exports have been so great.
The world needs corn.
Our world sotcks to use ratio is the tightest since 2013.
This is with the record US crop and record Brazil crop.
It is going to be hard to get this corn market going.
Unless of course the USDA is completely wrong about the crop.
But they are now projecting US corn stocks to use ratio at it's highest levels since 2019/20 and is on par with other bear market years.
The blue dot is what they were projecting before the USDA report.
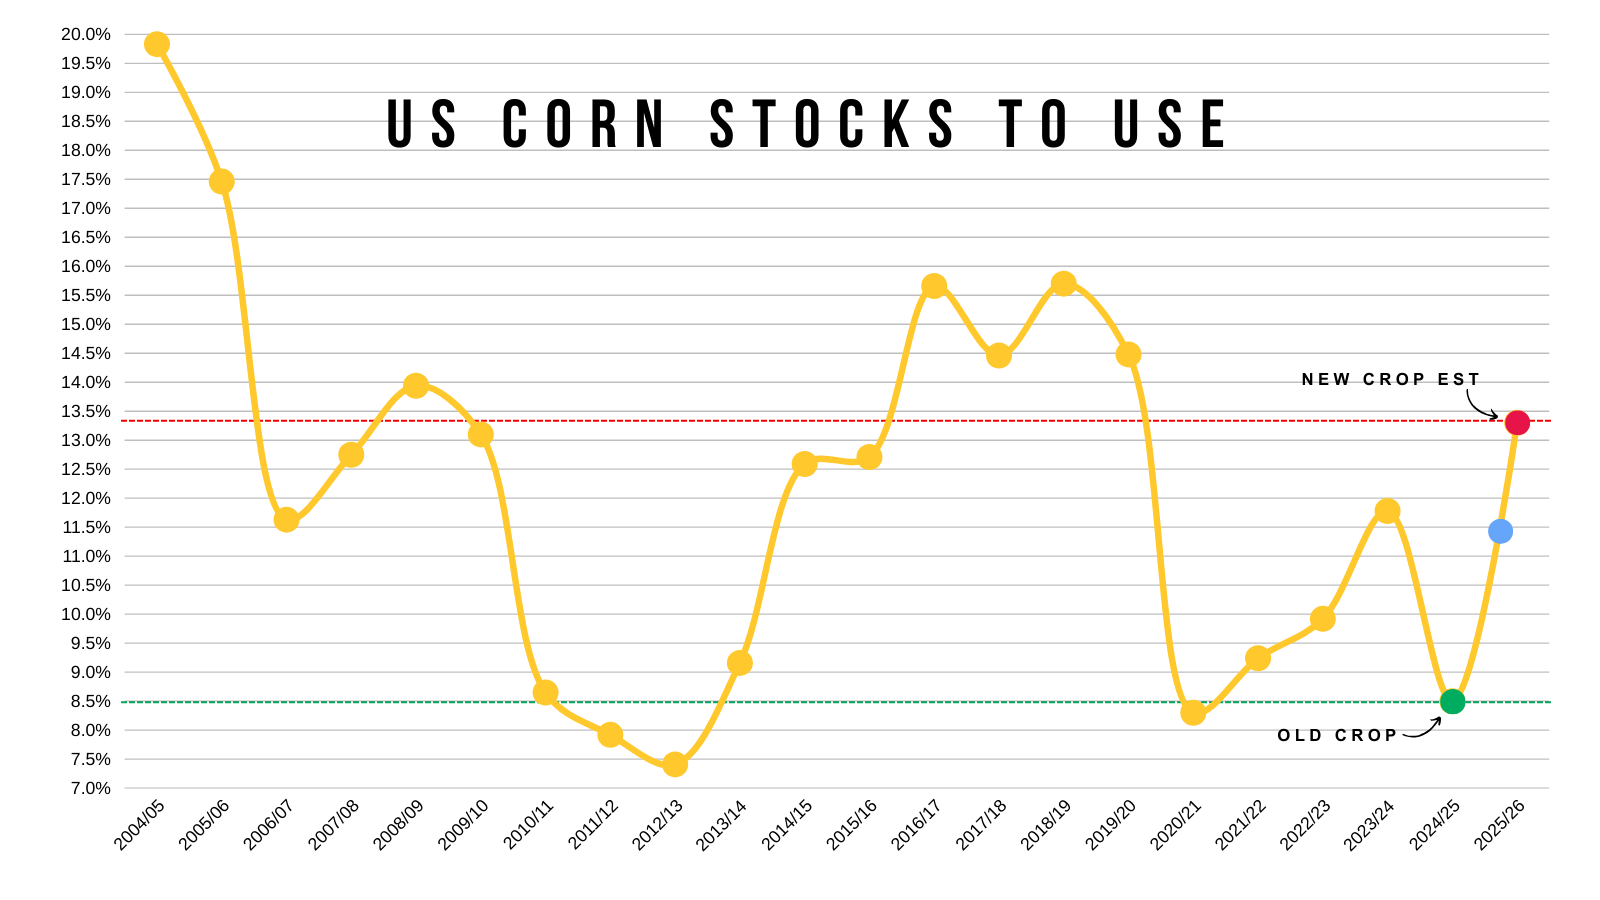
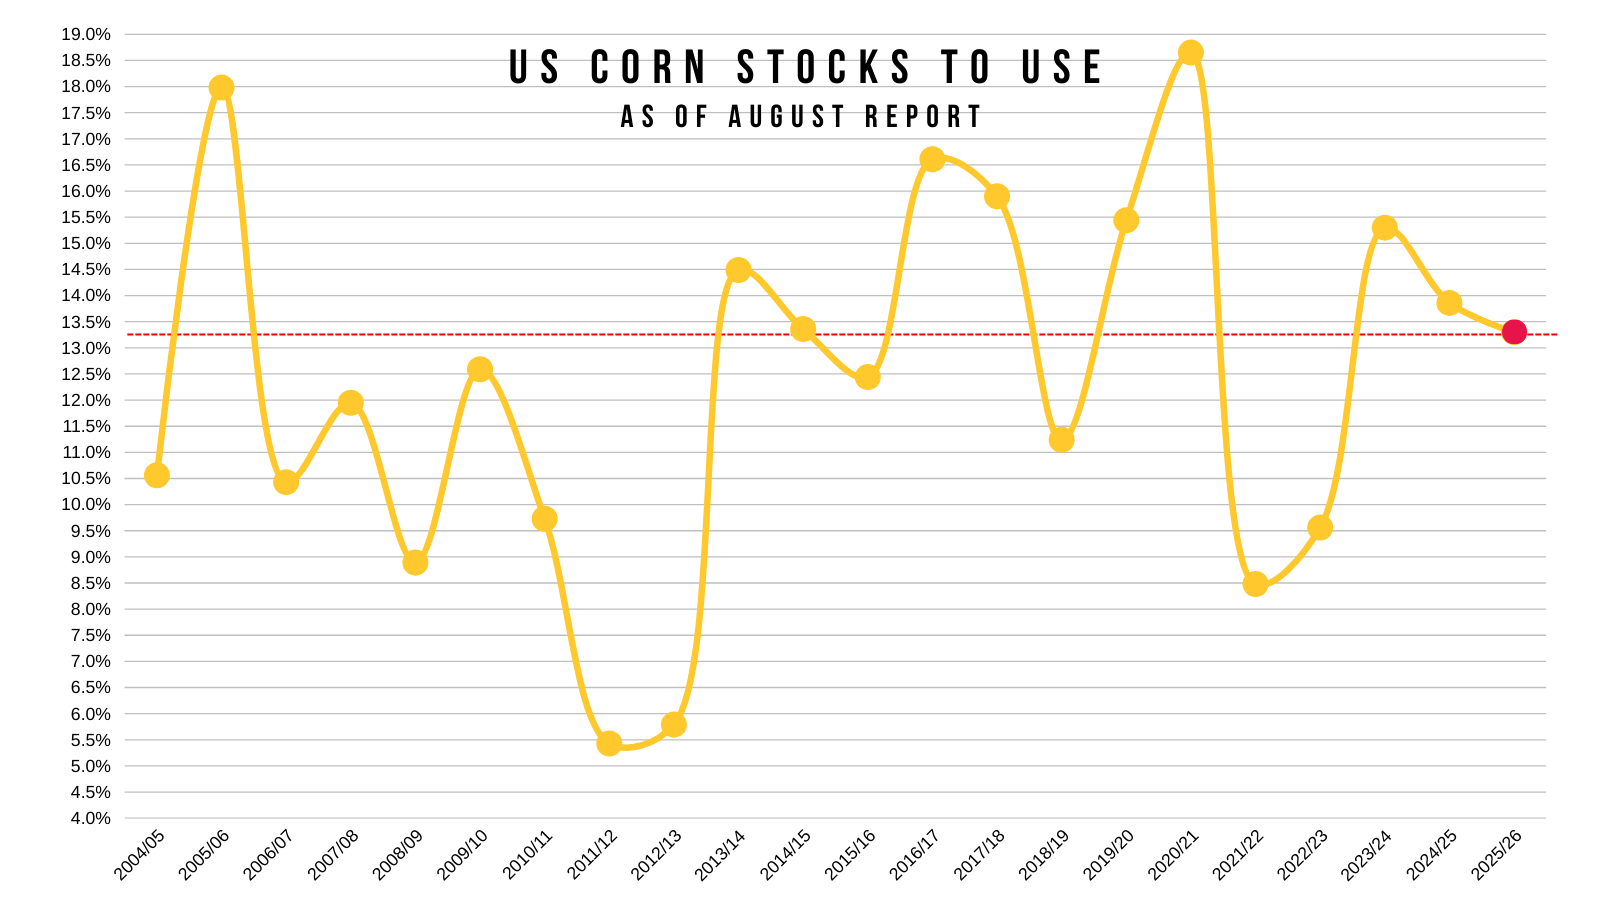
But on the other side of this, this 13.3% stocks to use ratio is the lowest we've seen in the August report in 3 years.
This is with a record yield +10 bushels bigger than anything we have seen before.
But given that the USDA already raised their demand numbers drastically, it might make it harder to cut into that carryout compared to past years.
Last year for example, demand continued to eat into the balance sheet, then at the same time the USDA was 4 bpa too high on yield.
Yield could be too high again, but it's more difficult for demand to do the heavy lifting since it was just raised by half a billion bushels. And on the supply side acres aren’t going anywhere.
If we look at the balance sheet, even if we dropped yield to 184 and left the demand numbers unchanged (demand will be cut if supply gets cut).
It would still give us a 1.7 billion bushel carryout, which isn’t entirely burdensome like the current 2.1 billion, but isn’t considered super bullish either.
That extra billion bushels of supply is a lot to chew through.
184 Yield Scenario
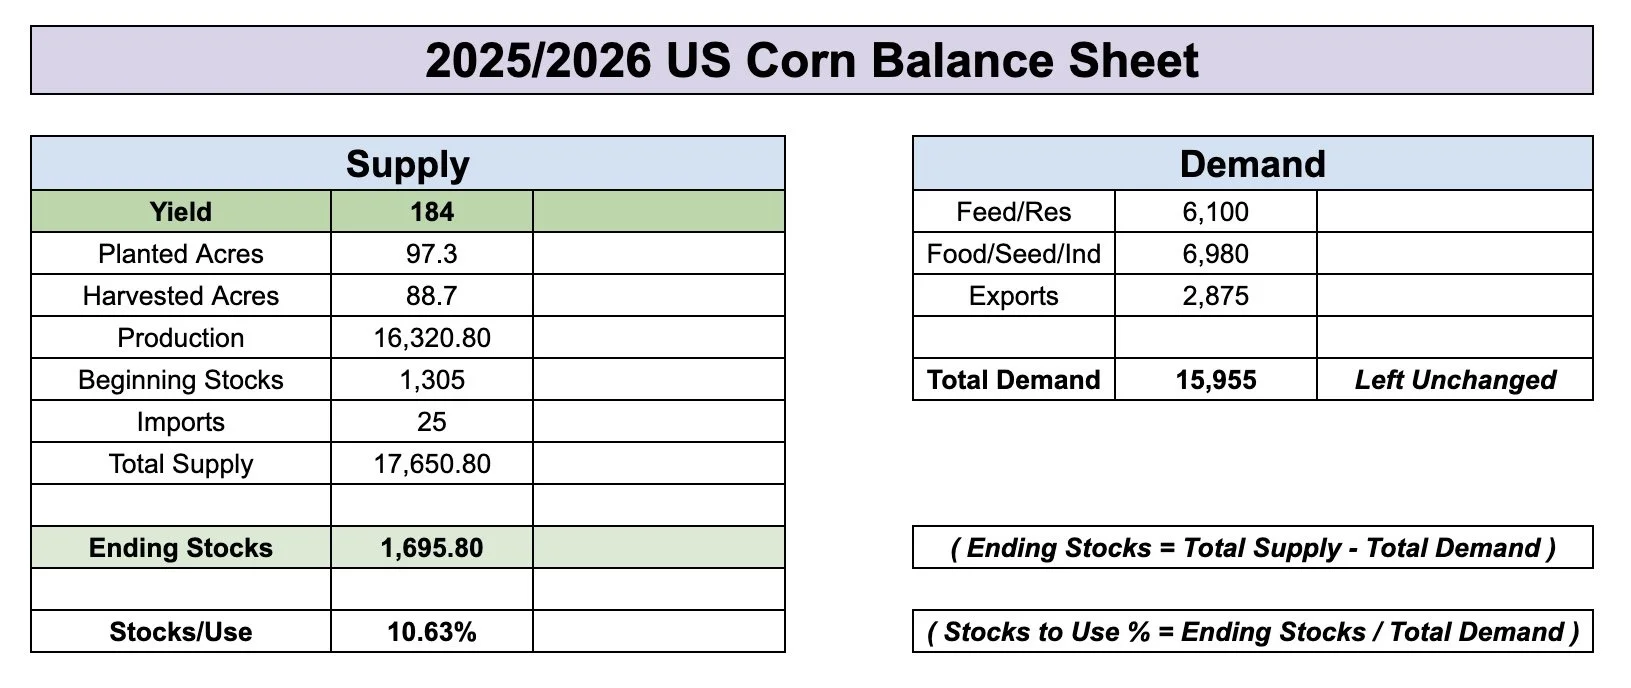
Current Balance Sheet for Comparison

Overall, this report shook things up in a big way.
It makes it that much harder for the corn market to see a big opportunity here.
As originally, most thought demand was understated. But now, the USDA bumped demand so it will be hard for additional demand to eat into that now larger carryout.
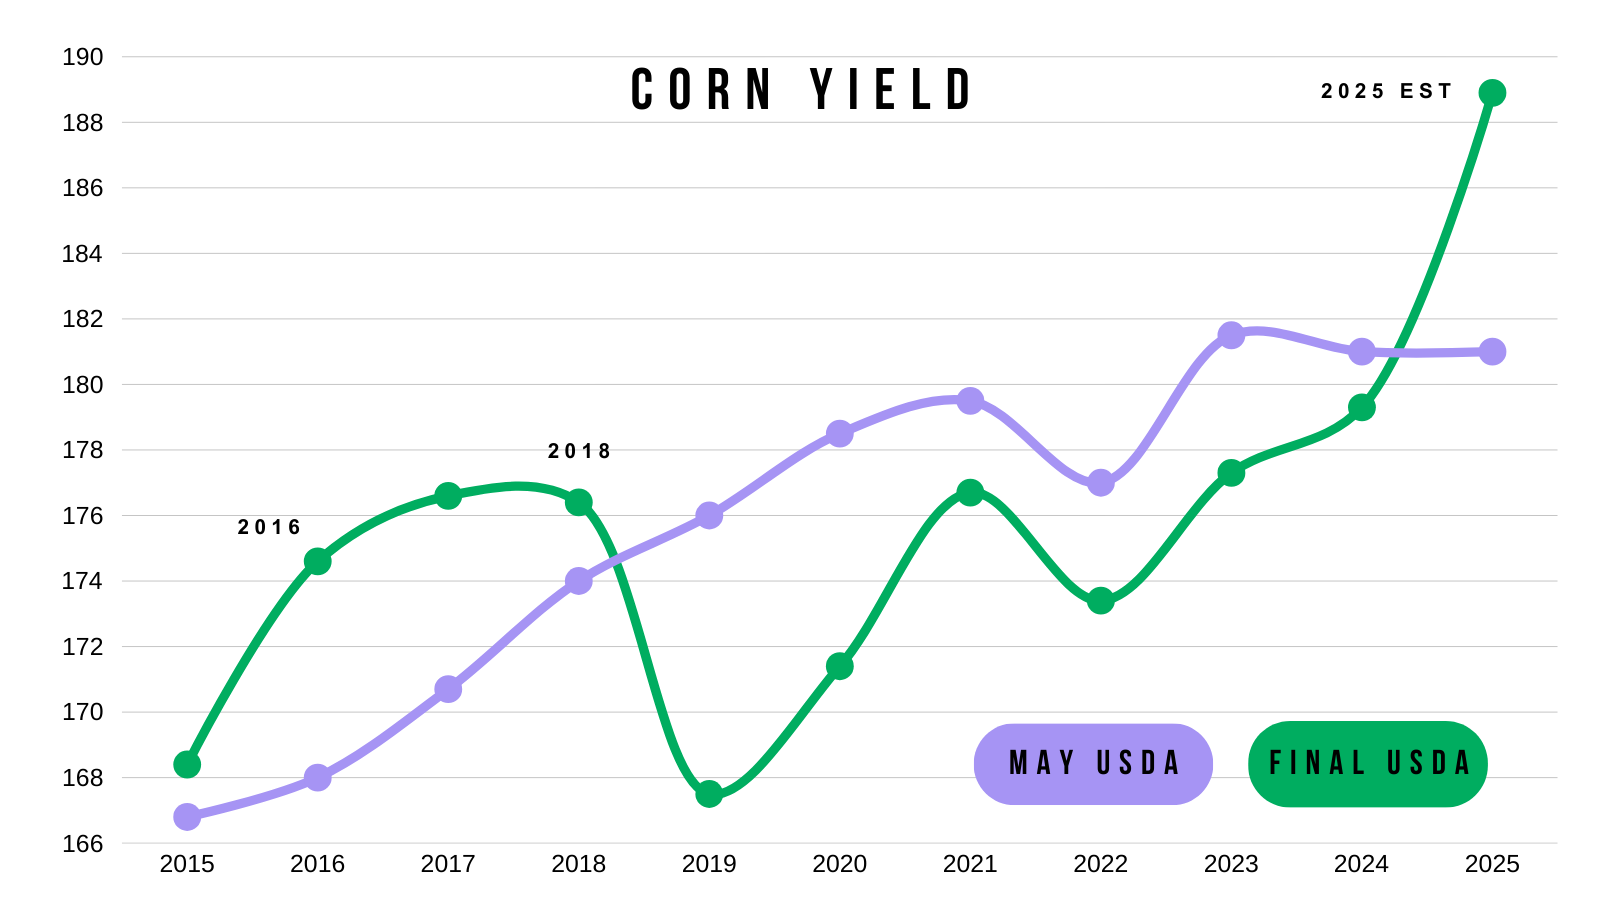
Yield is definitely still up for debate. Last year the USDA had yield at 184 in August only for it to be 179 come January.
Planted acres on the other hand is not something that be debated. Those are not going anywhere. The acre number came out of nowhere and completely shifted the balance sheet for corn.
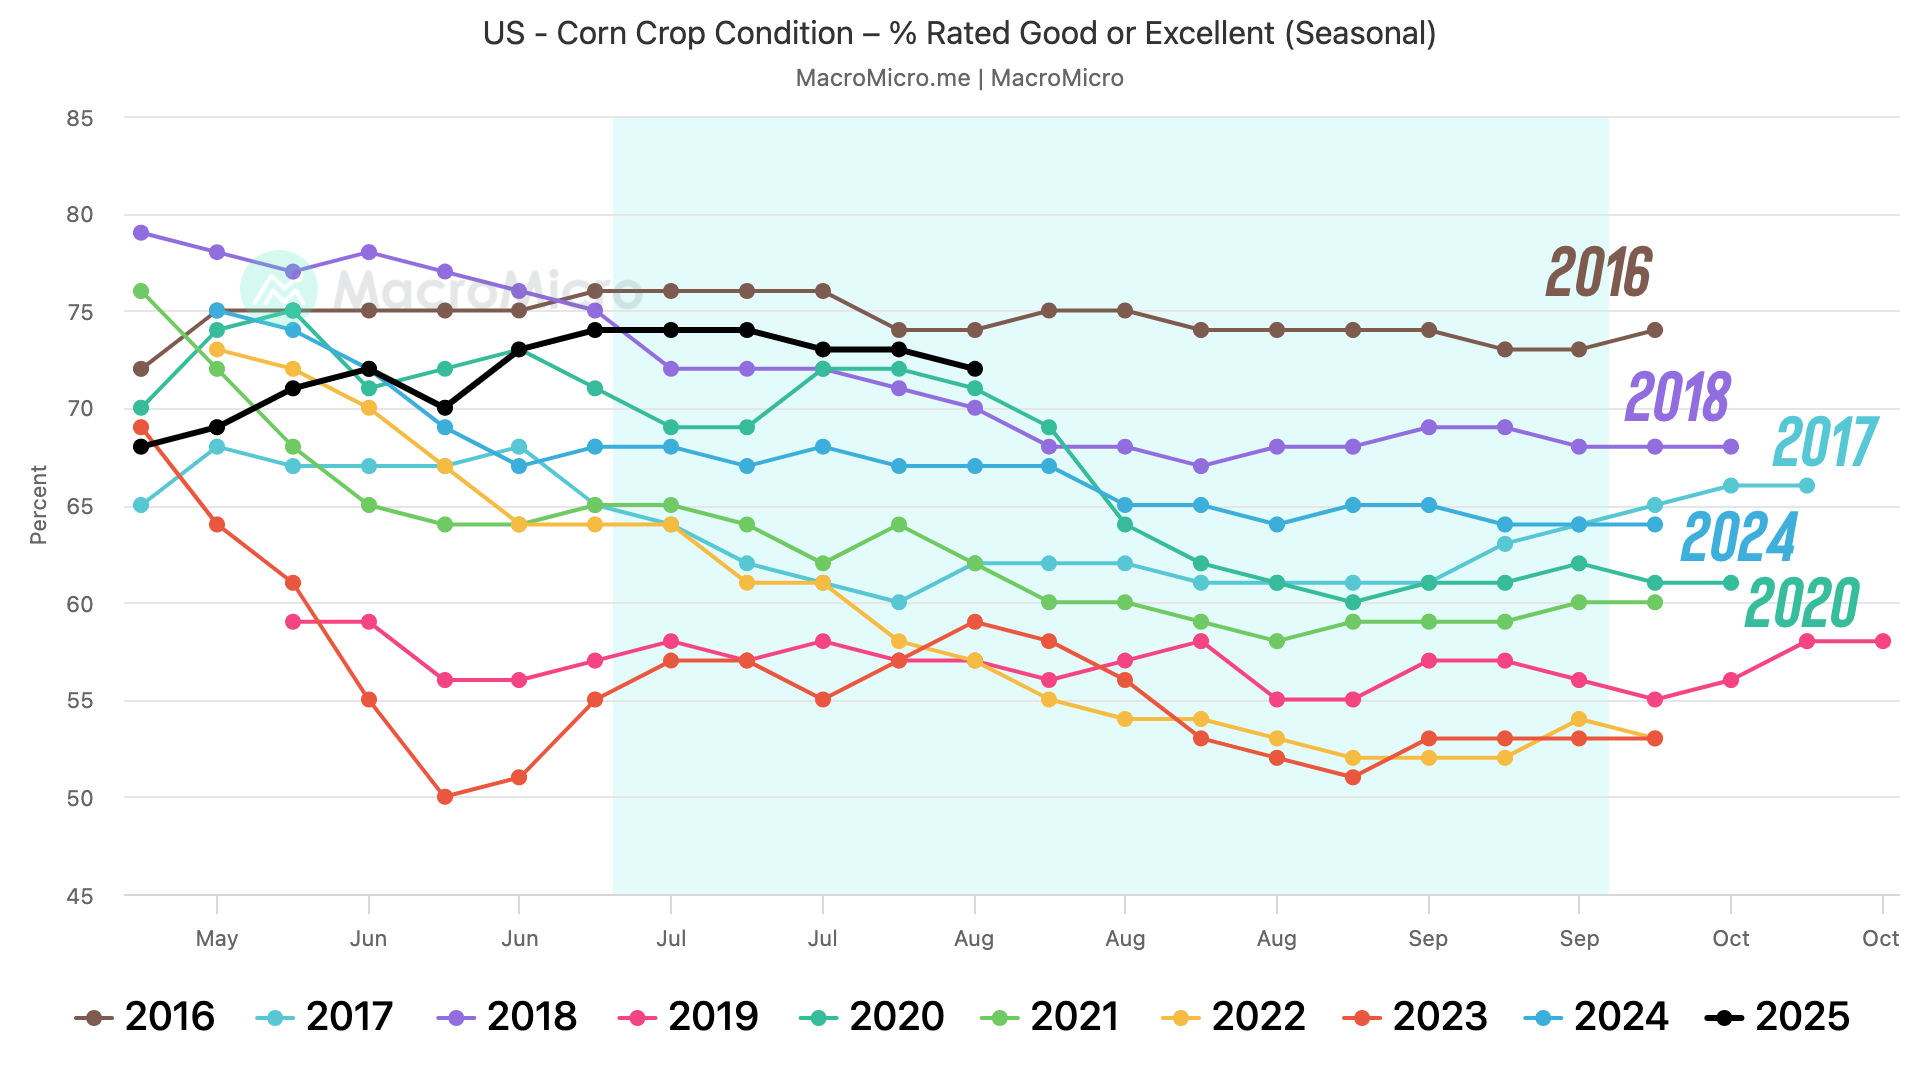
If we look at other year's where crop conditions were this good, it did result in above trendline yield.
Such as 2016 and 2018.
Altough the USDA's recent yield number was mostly just satellite data, so it doesn’t include the pollination issues.
Either way, trendline yield isn’t a shock at all when you compare conditions to years of the past.
Crop Conditions
May vs Final USDA Yield
Currently I'd like to think we don’t venture too far below last year's $3.85. That has to be an area of interest.
Those lows last year were made on August 27th.
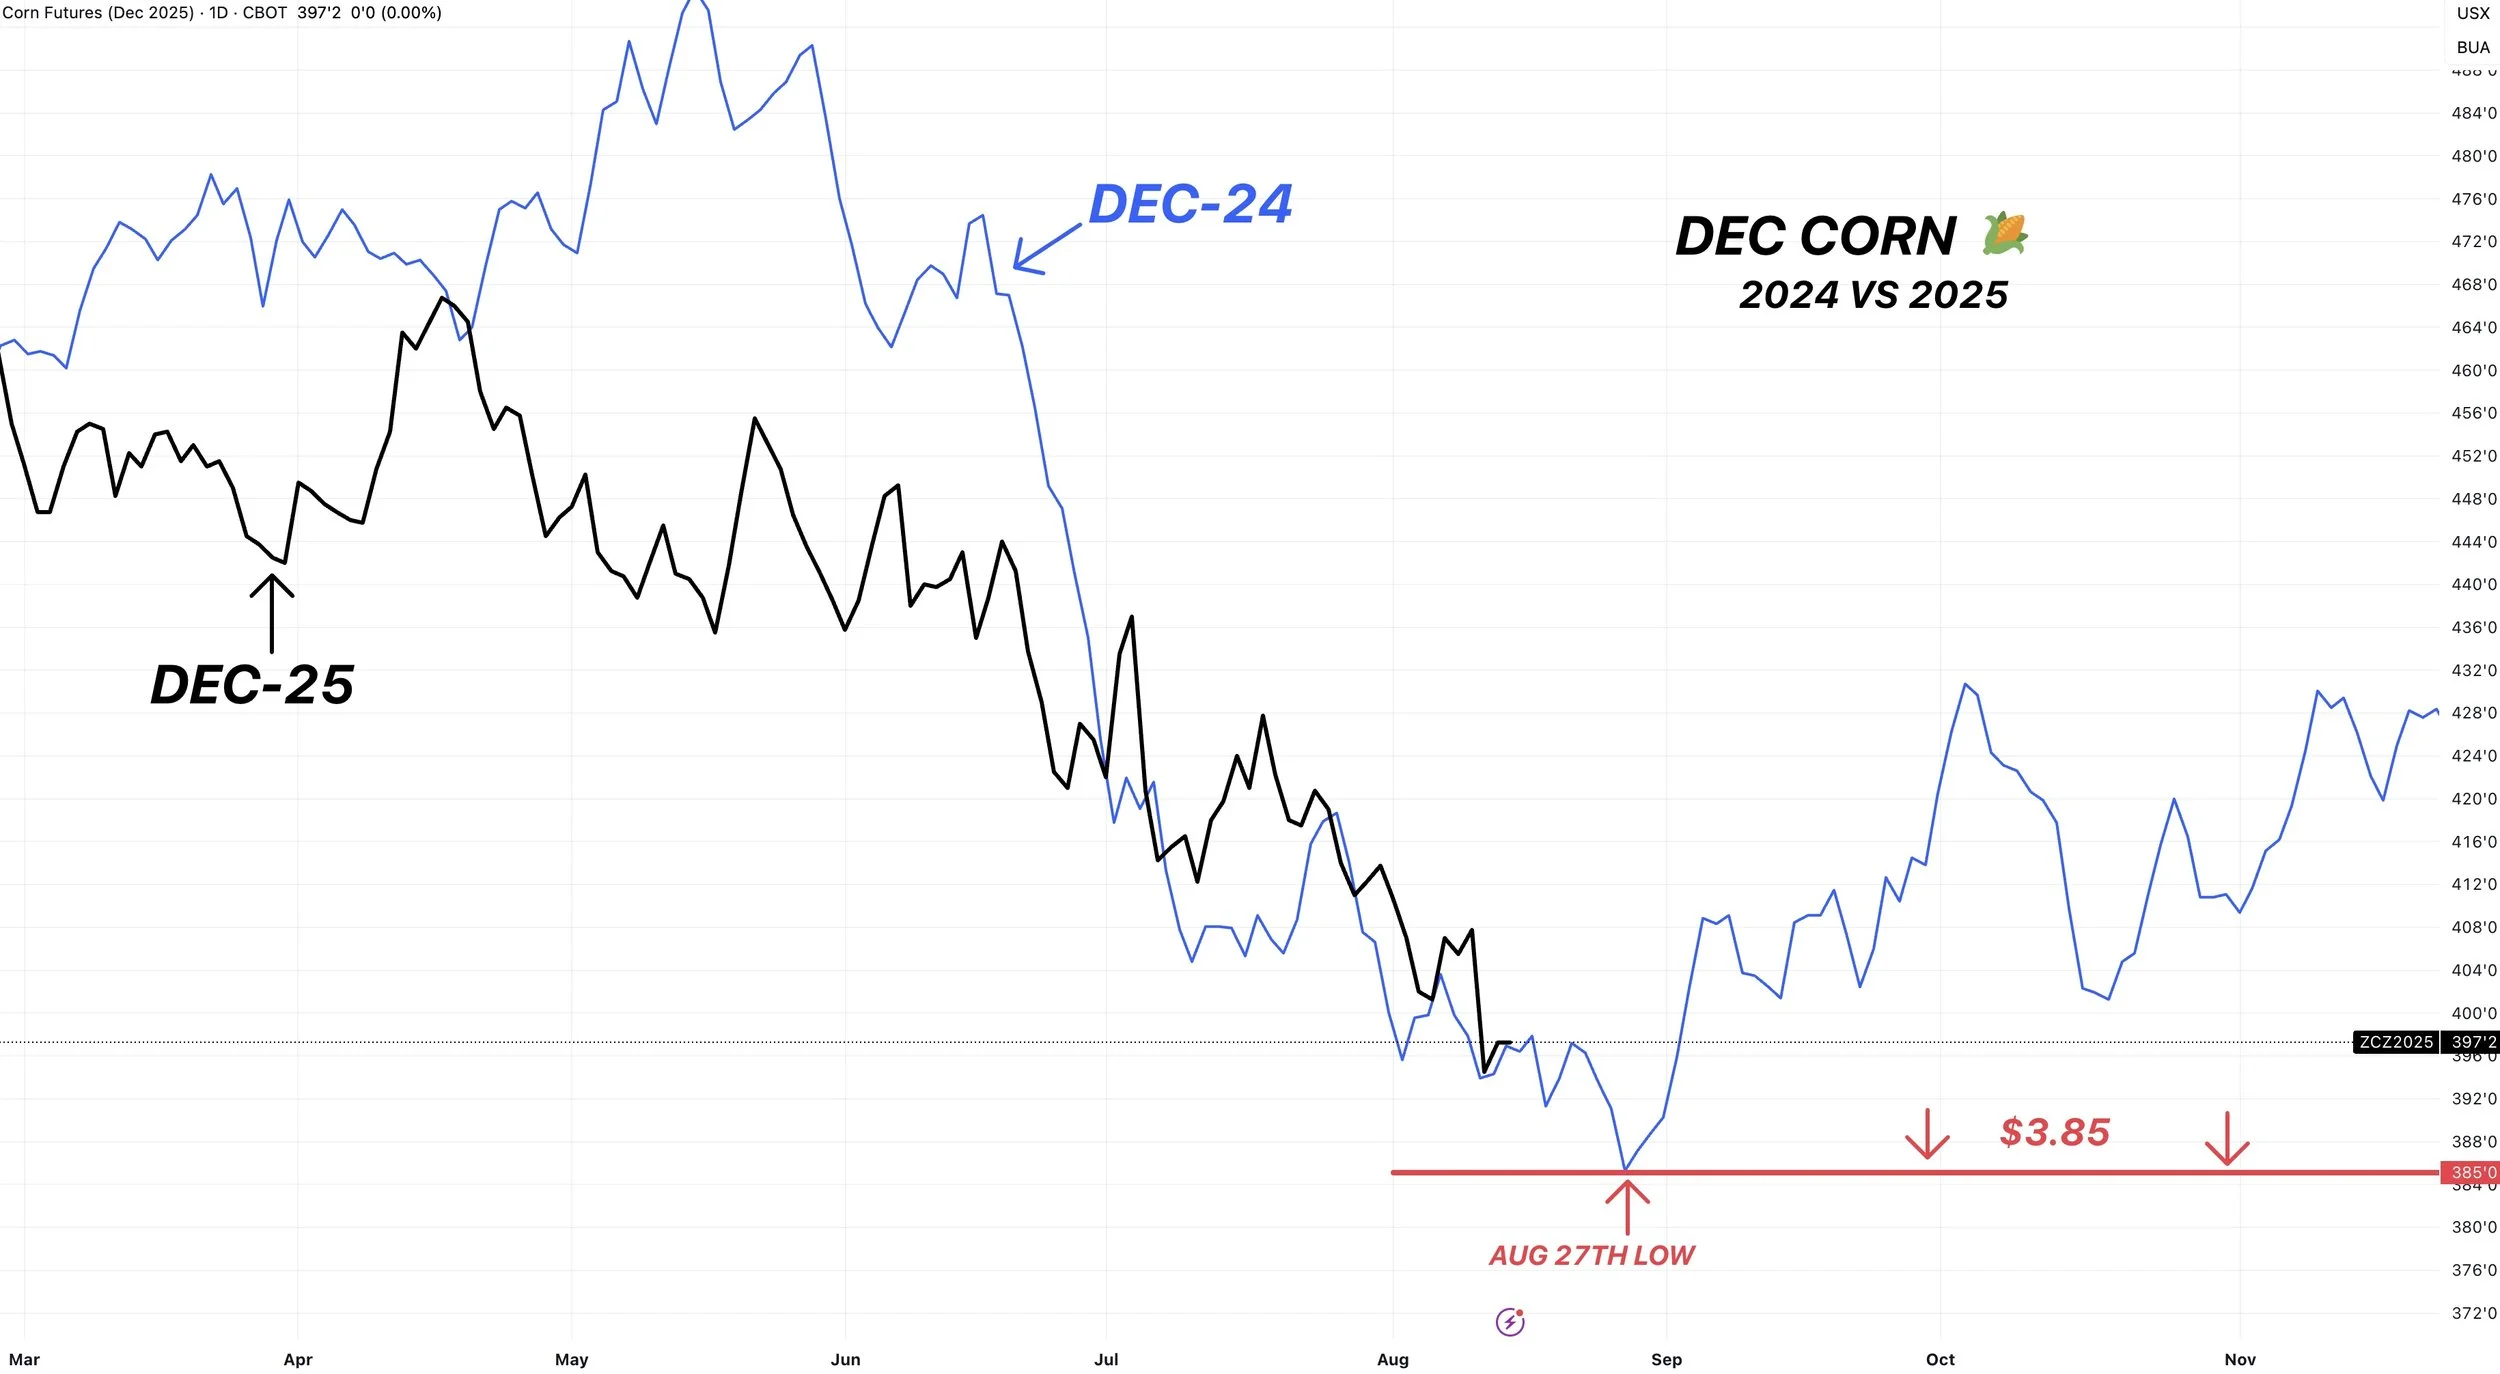
This market has already priced in an immense amount of bearishness.
Do I think we have a reason to rally? Absolutely not. Unless the crop tours shake things up.
But I think we find a floor sometime in the next month.
If prices stay low through October, that would increase the insurance payments etc. It’s interesting we usually rally there.

Technicals:
Dec corn continues to find a little life at this 100% fib extension from the 4th of July sell off.
Next fib level is $3.87 if this level fails.
Which also about lines up with those lows from last year as well.

Soybeans
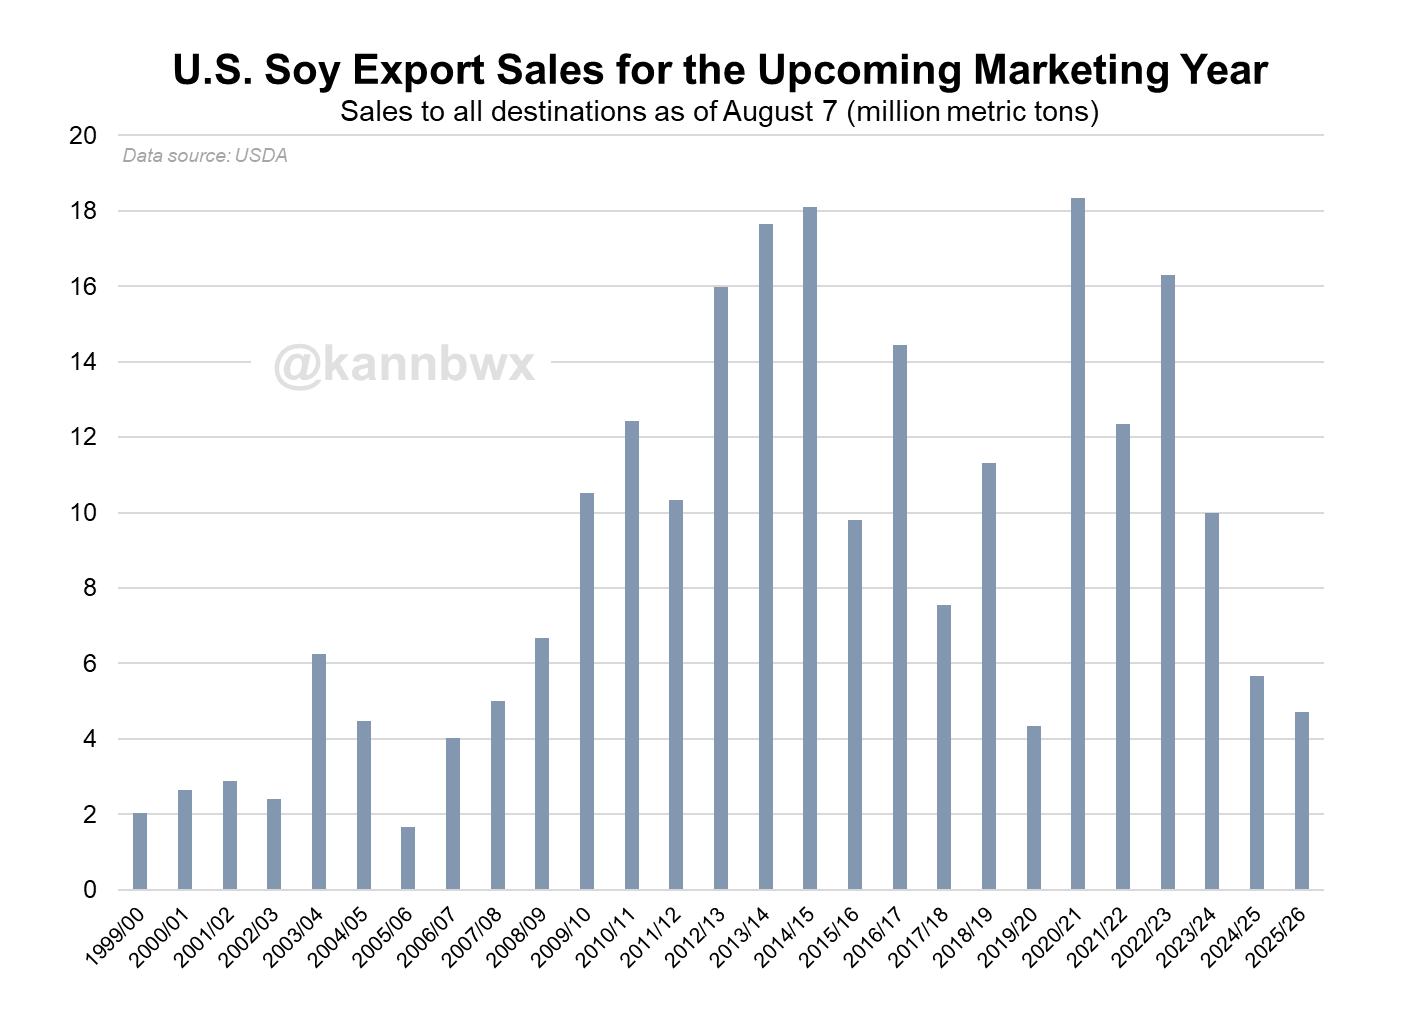
Export sales for soybeans were finally stout. However, we do still lag behind.
This chart from Karen Braun shows exports sitting at their lowest levels since the trade war.
So the market still views this as a big concern.
I'd say the market is more worried about not enough soybean demand rather than the US soybean crop being too big.
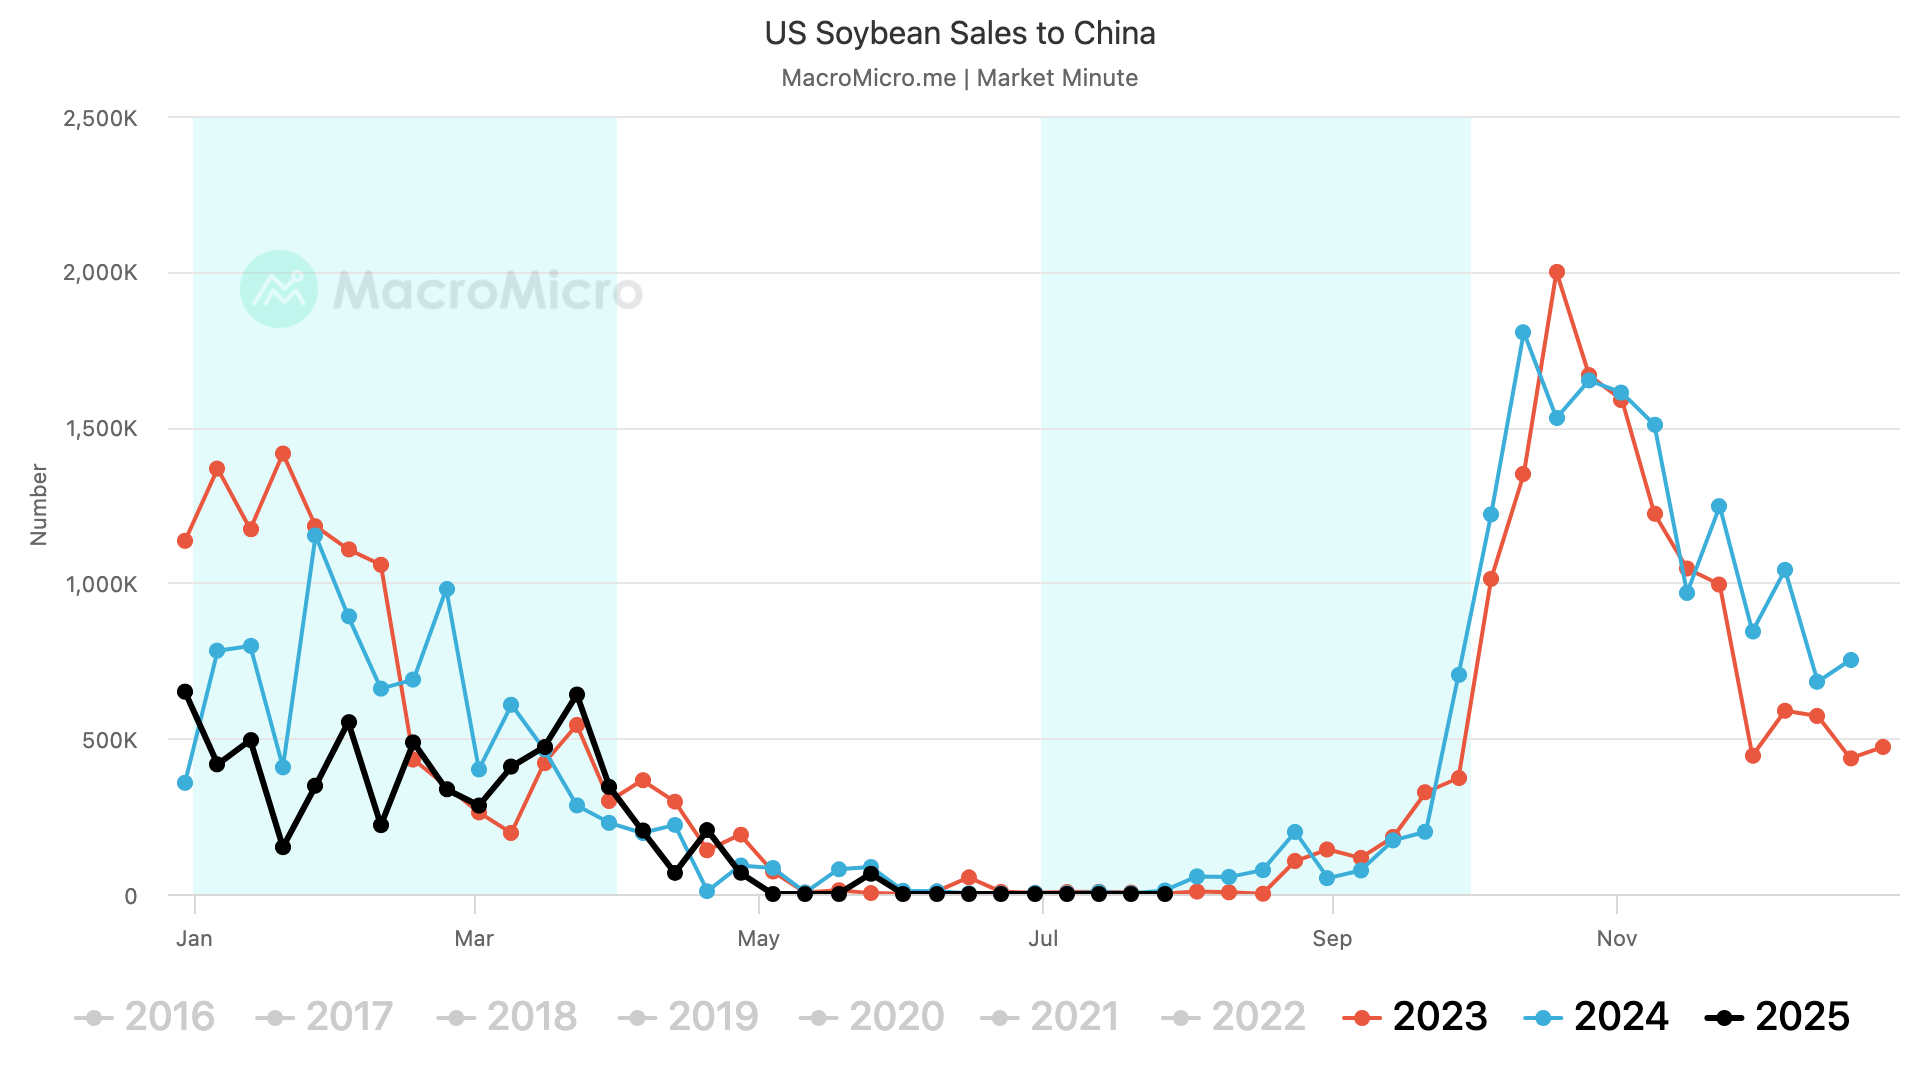
We still have zero sales to China.
Some are bearish on soybeans because of this.
Some are bullish on soybeans because of this.
What if they don’t buy?
But what if they do?
We saw how big of a reaction the market had to one simplye tweet from Trump stating China needs beans. I can only imagine how excited the market would be if they did start to buy.
I think it is still too early to get all doomsday on soybean demand.
If you look at both 2024 and 2023, China hadn’t really bought any soybeans at this time of the year either. Exports turned out better than expected last year.
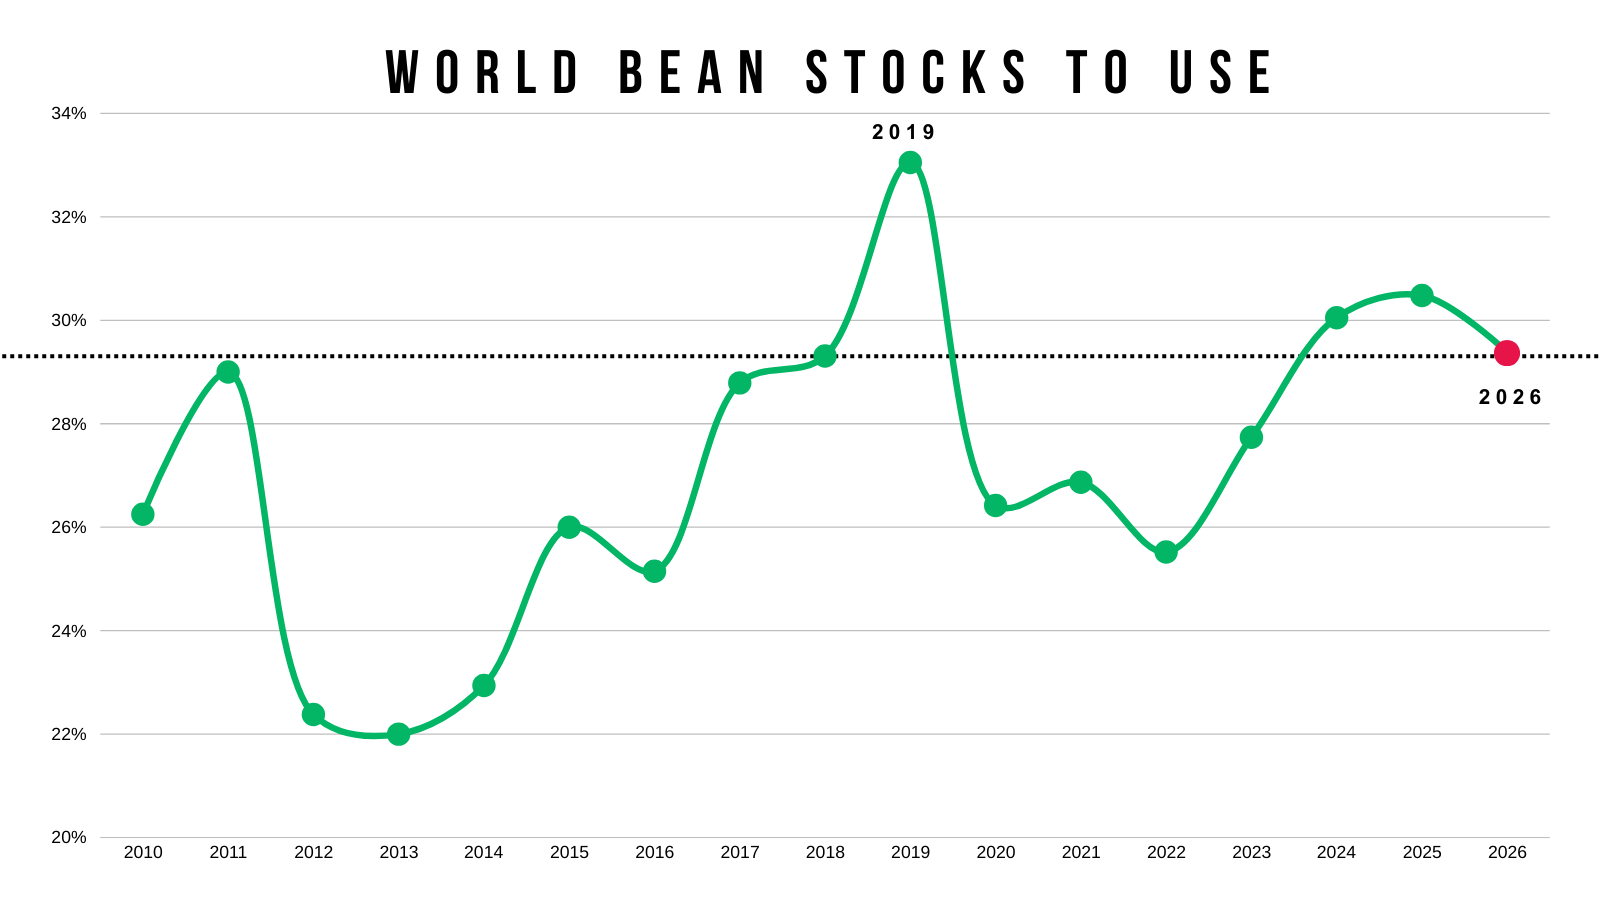
The world situation is different.
Unlike corn, the world isn’t tight on soybeans despite a relatively tight US balance sheet.
It is the tightest in 3 years but is still relativity high, and it's probably part of the reason for the lack of export demand.
There is other places to get soybeans, aka Brazil.
Regardless, this USDA report made things very interesting.
We saw the 2nd largest August acre report decline on record (behind 2019).
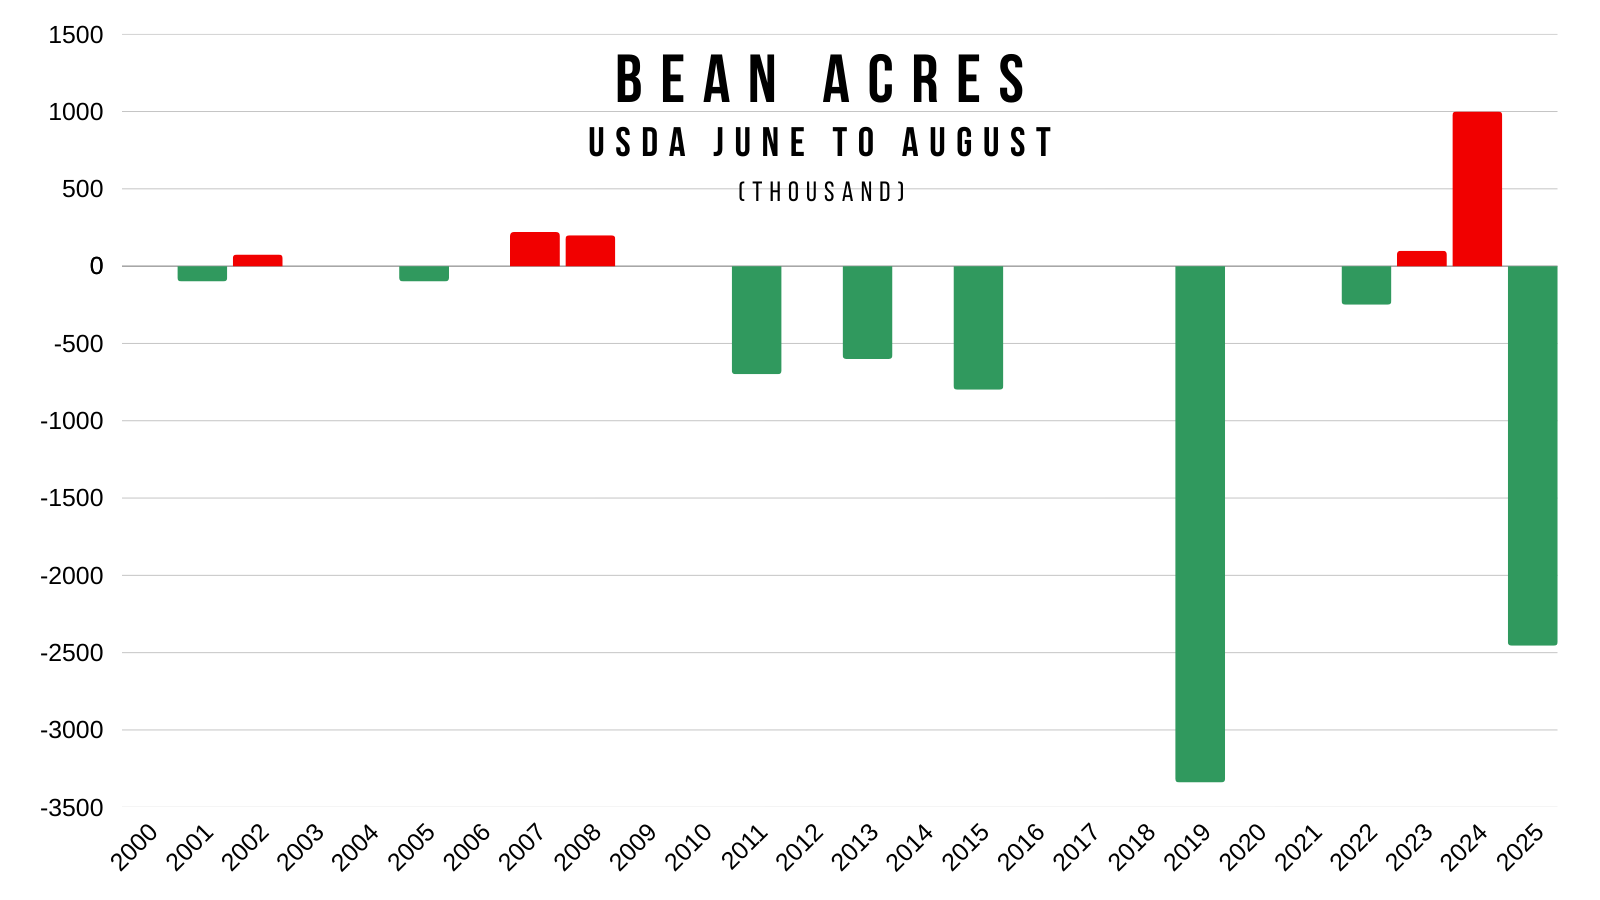
Before this report, soybeans had very little wiggle room on the US balance sheet.
Now?
It's razor thin.
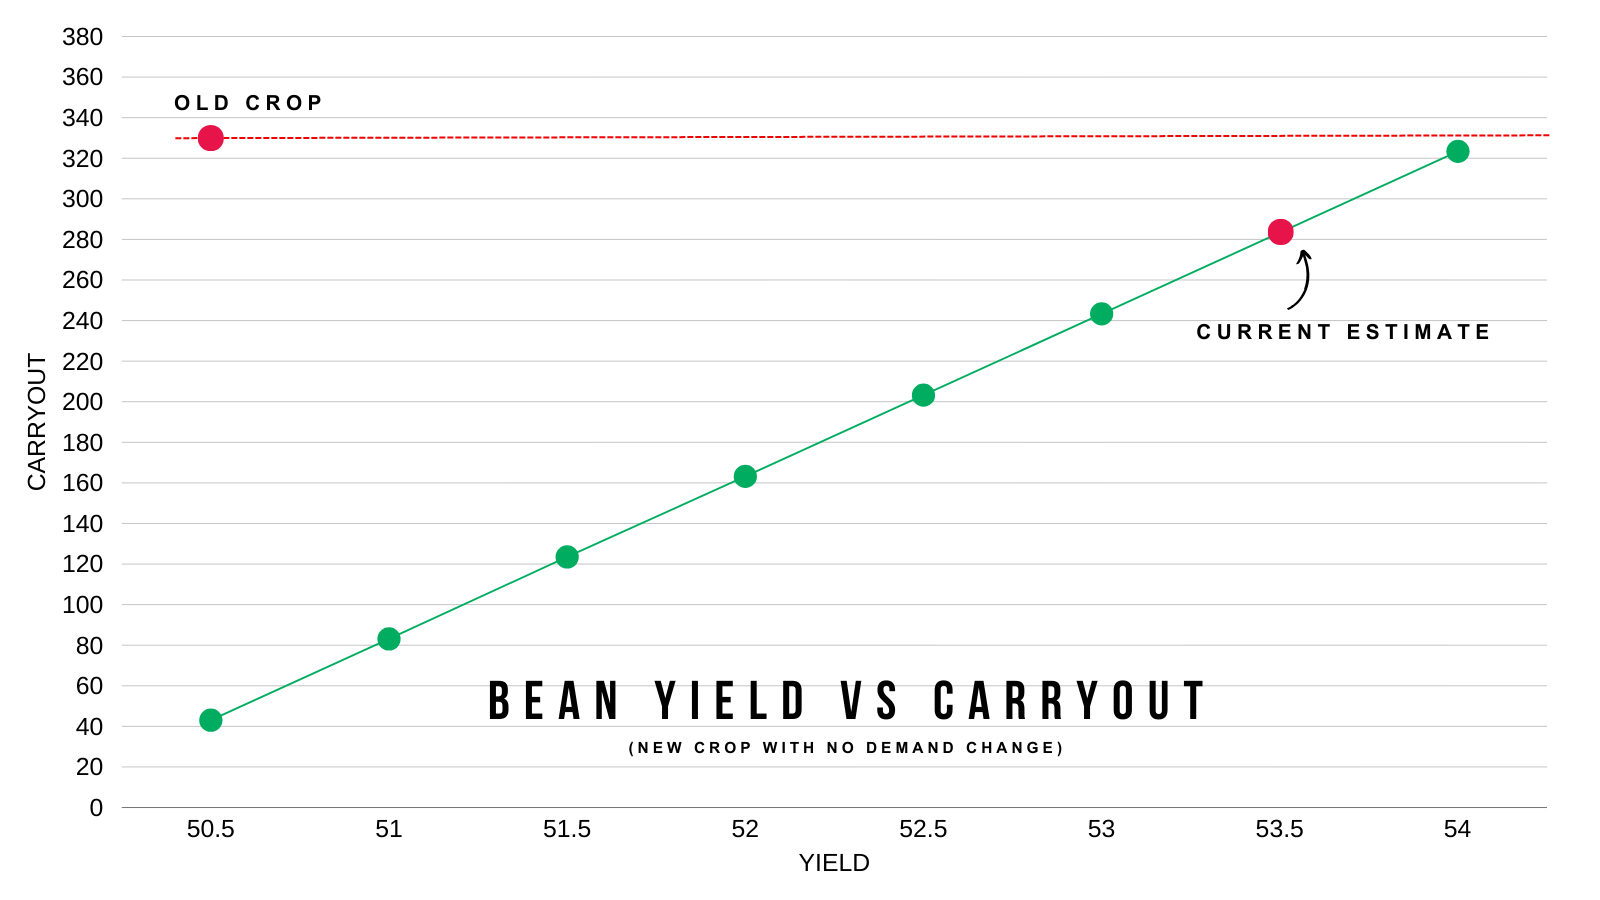
Here is an updated visual on what happens to carryout when yield changes.
As always, it won’t be an actual linear change. If supply gets cut, demand gets cut. The USDA would not allow the balance sheet to get too tight, so they'd ration demand lower.
The exact opposite of what we just saw in the corn market. Supply was raised, so demand was raised.
From this visual, anything below a 52 yield would evaporate the carryout and force the USDA to ration demand.
Even with a 54 yield.. new crop carryout would STILL be tighter than last year if demand stayed.
This is of course if demand from China doesn’t completely get butched. Which is the the biggest risk.
But the balance sheet leaving this little room for error, paves the way for potential opportunities.
The funds had recently jumped aboard the short wagon before the USDA report.
They've sold about 120k contracts since June.
The report might’ve sparked a reason for them to 2nd guess that decision.

This recent rally has also been accompanied by a rally in the meal market.
The funds are holding a MASSIVE meal short position. By far the largest on record.
You always have to wonder what happens if something sparks them to cover that short.

Technicals:
Soybeans are up over +50 cents from last week's buy signal.
Yesterday below the audio I shared that I had a short term target of $10.53 to alert a sell signal.
That target fell short by 4 cents in the overnight session.
I do not mind making a sale here. If you need to make one go for it.
But I am personally being patient and will have my new target for a sell signal once I think this pull back is complete.
If you have to move something soon or at harvest, I like keeping a floor for downside protection.
Call us if you need help or have questions: (605)295-3100

Below the audio yesterday I also mentioned that the indicators were overextended and we should expect a pullback soon.
Pullbacks are healthy. Markets rarely go up in a straight line.
After a +60 cent rally in 3 days, a correction should come as no surprise.

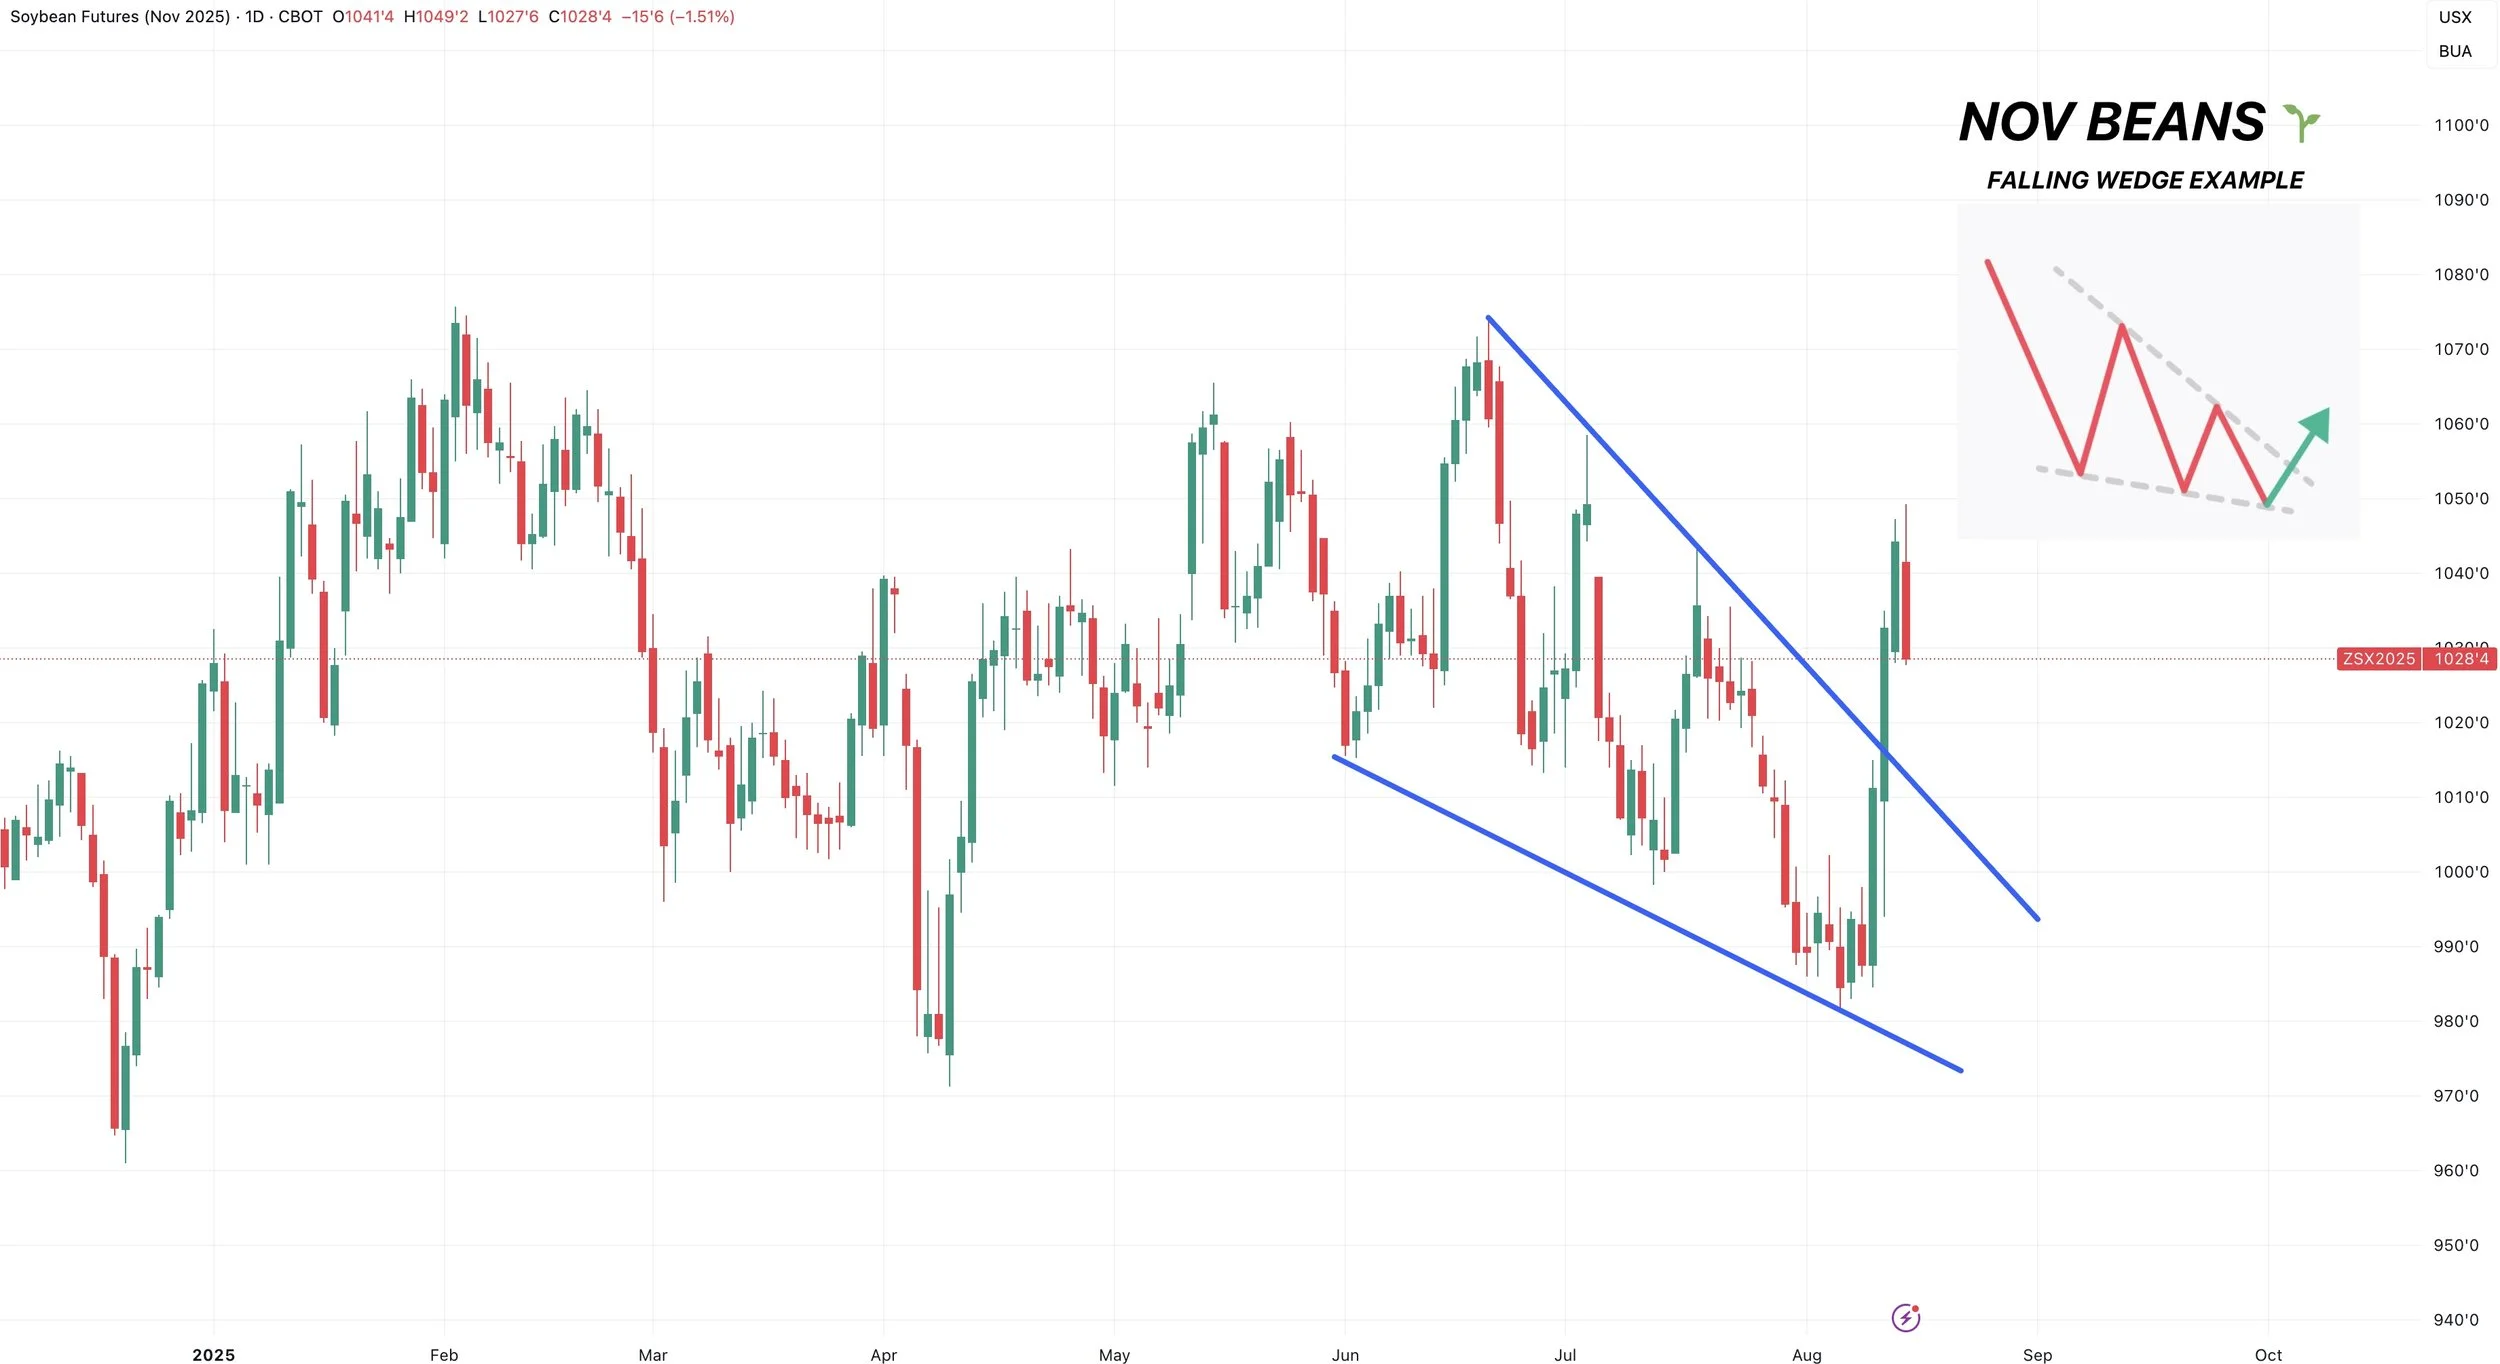
The chart still looks in tact here.
We had a picture perfect falling wedge breakout we talked about last week.
We also posted our first higher high since June.
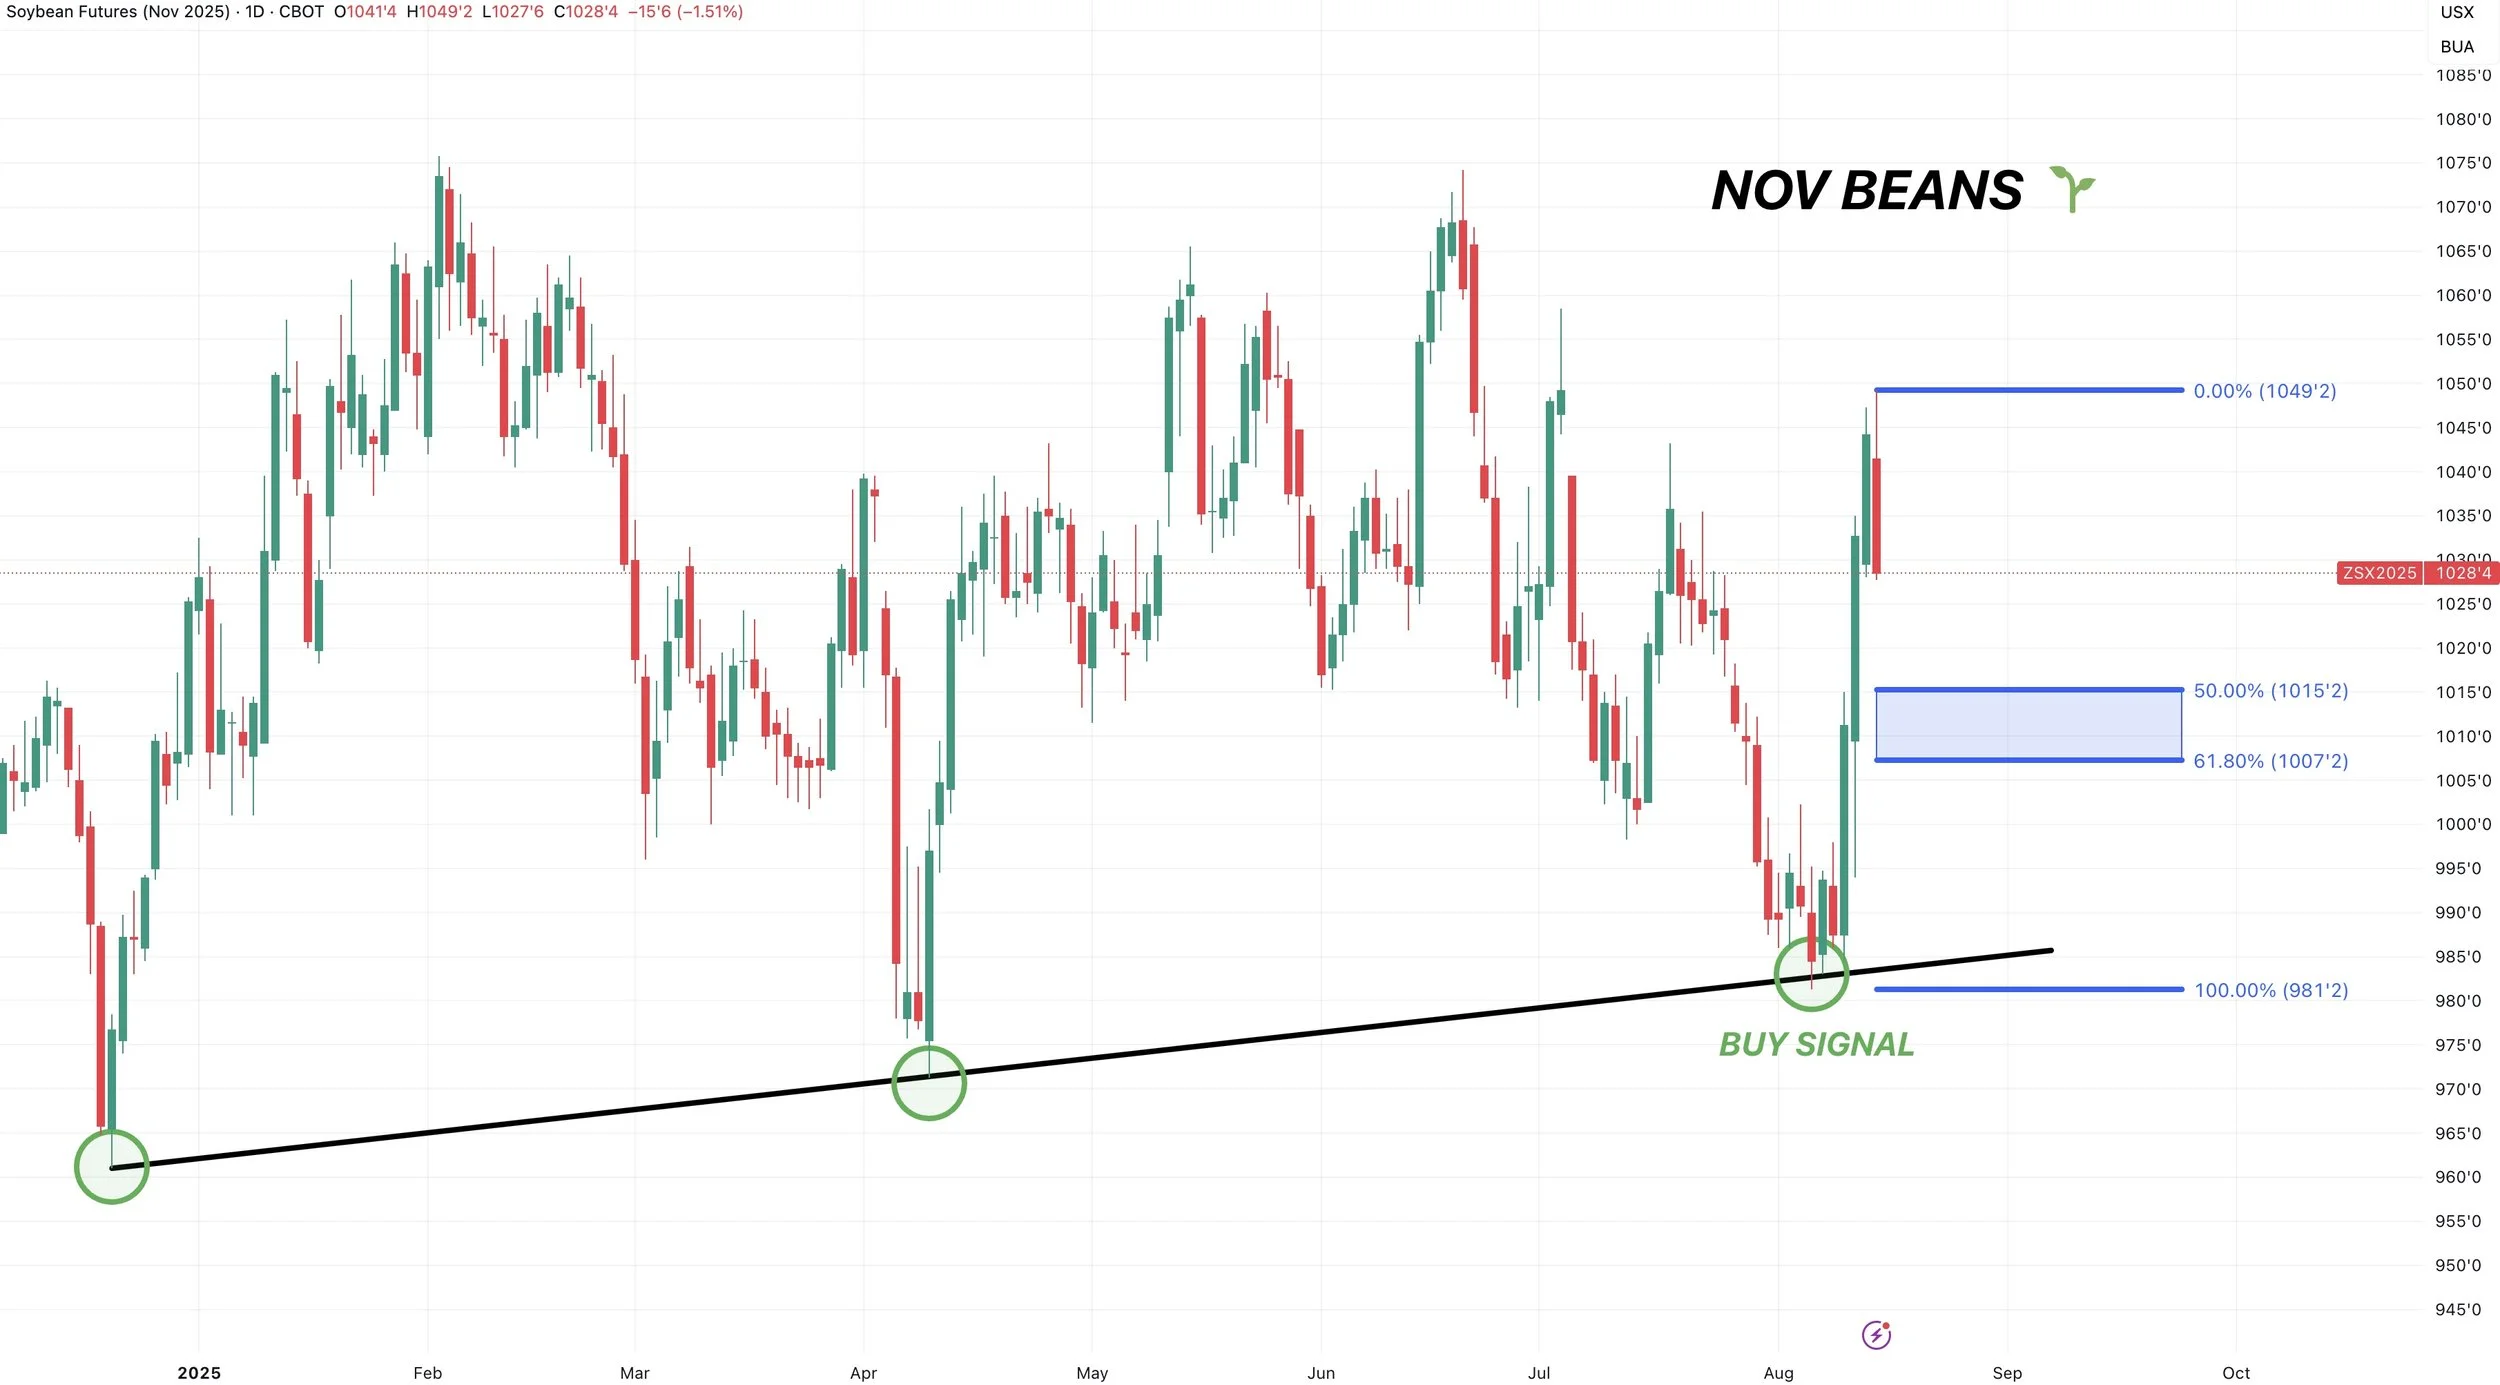
How far could we pull back?
A standard correction would bring us to $10.07 to $10.15
Which gives back 50-61.8% of the recent rally.
That is the level we want to hold to keep our upward bias remaining higher.
I am not concerned unless we break below that level.
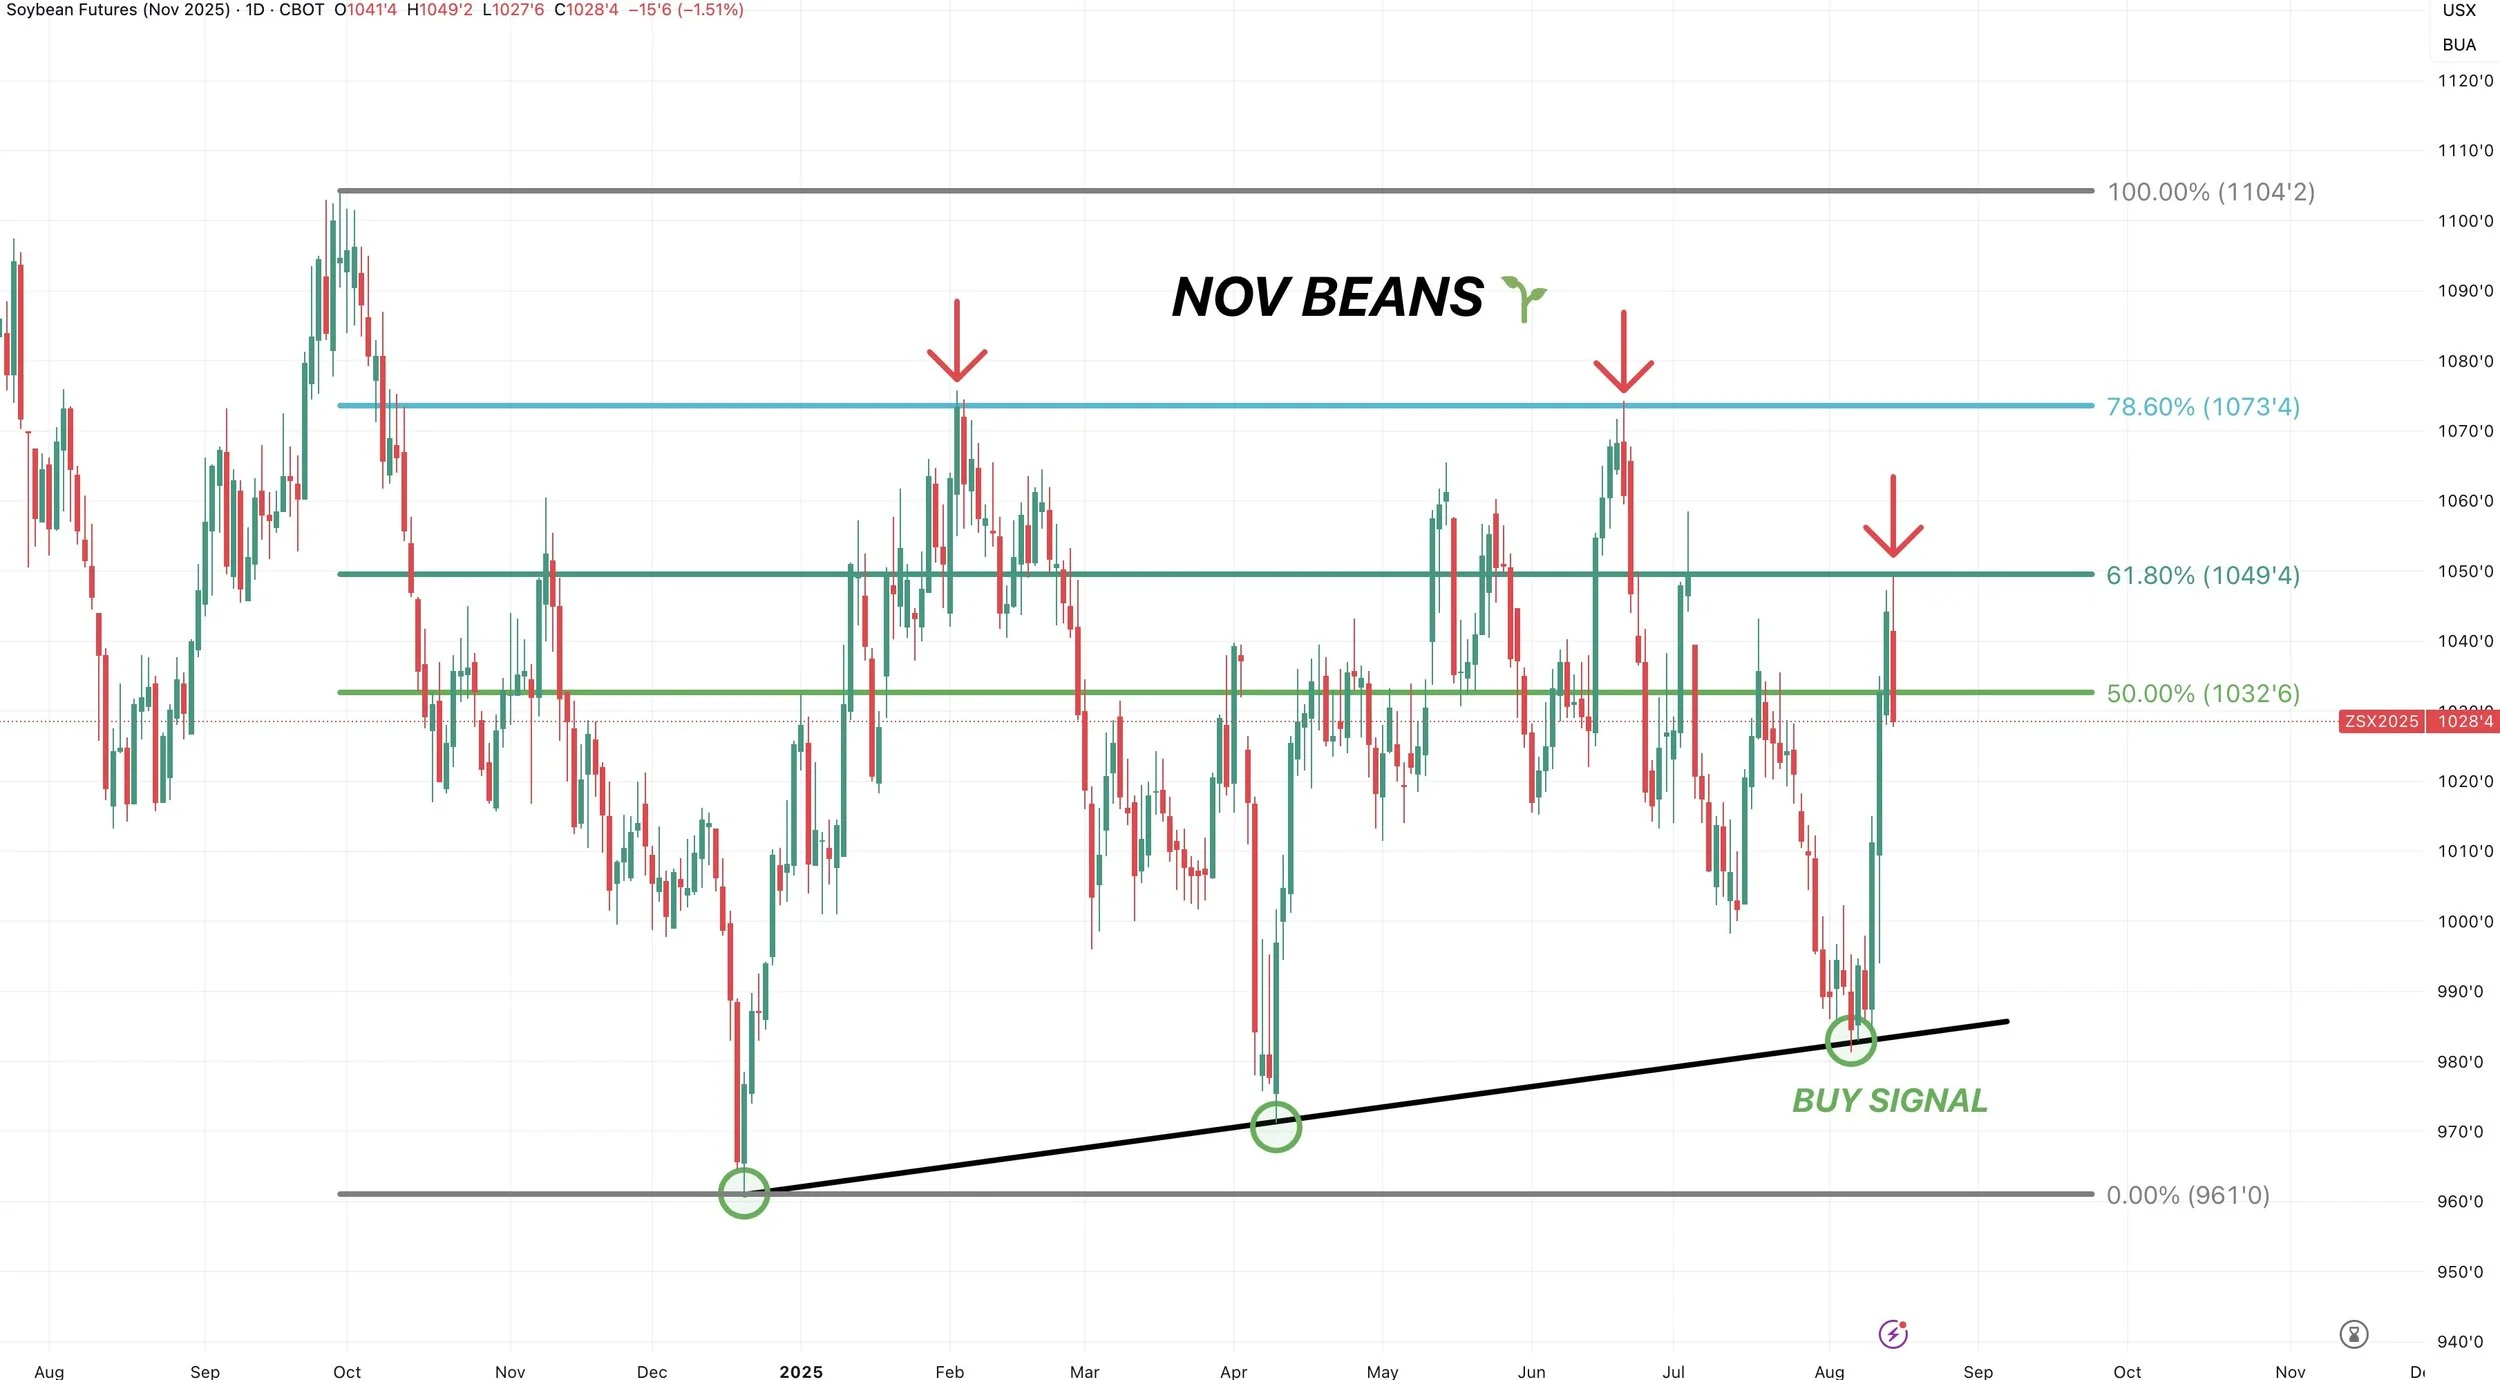
If we look at this chart where we laid out fib retracement levels from the contract lows up to the harvest highs of last year.
Our two major tops in this market this year occured at the 78.6% level at $10.73.
Last night we rejected the 61.8% level at $10.49.
So that is going to be the big level to watch. Close above it and chances are we go to test the $10.70 highs.
Here is a continuous chart.
Every single rally since last harvest we have came up to this green box every few months.
That box is at $10.70
So I like waiting to be aggresive until around the $10.70 level as I think it will come again.
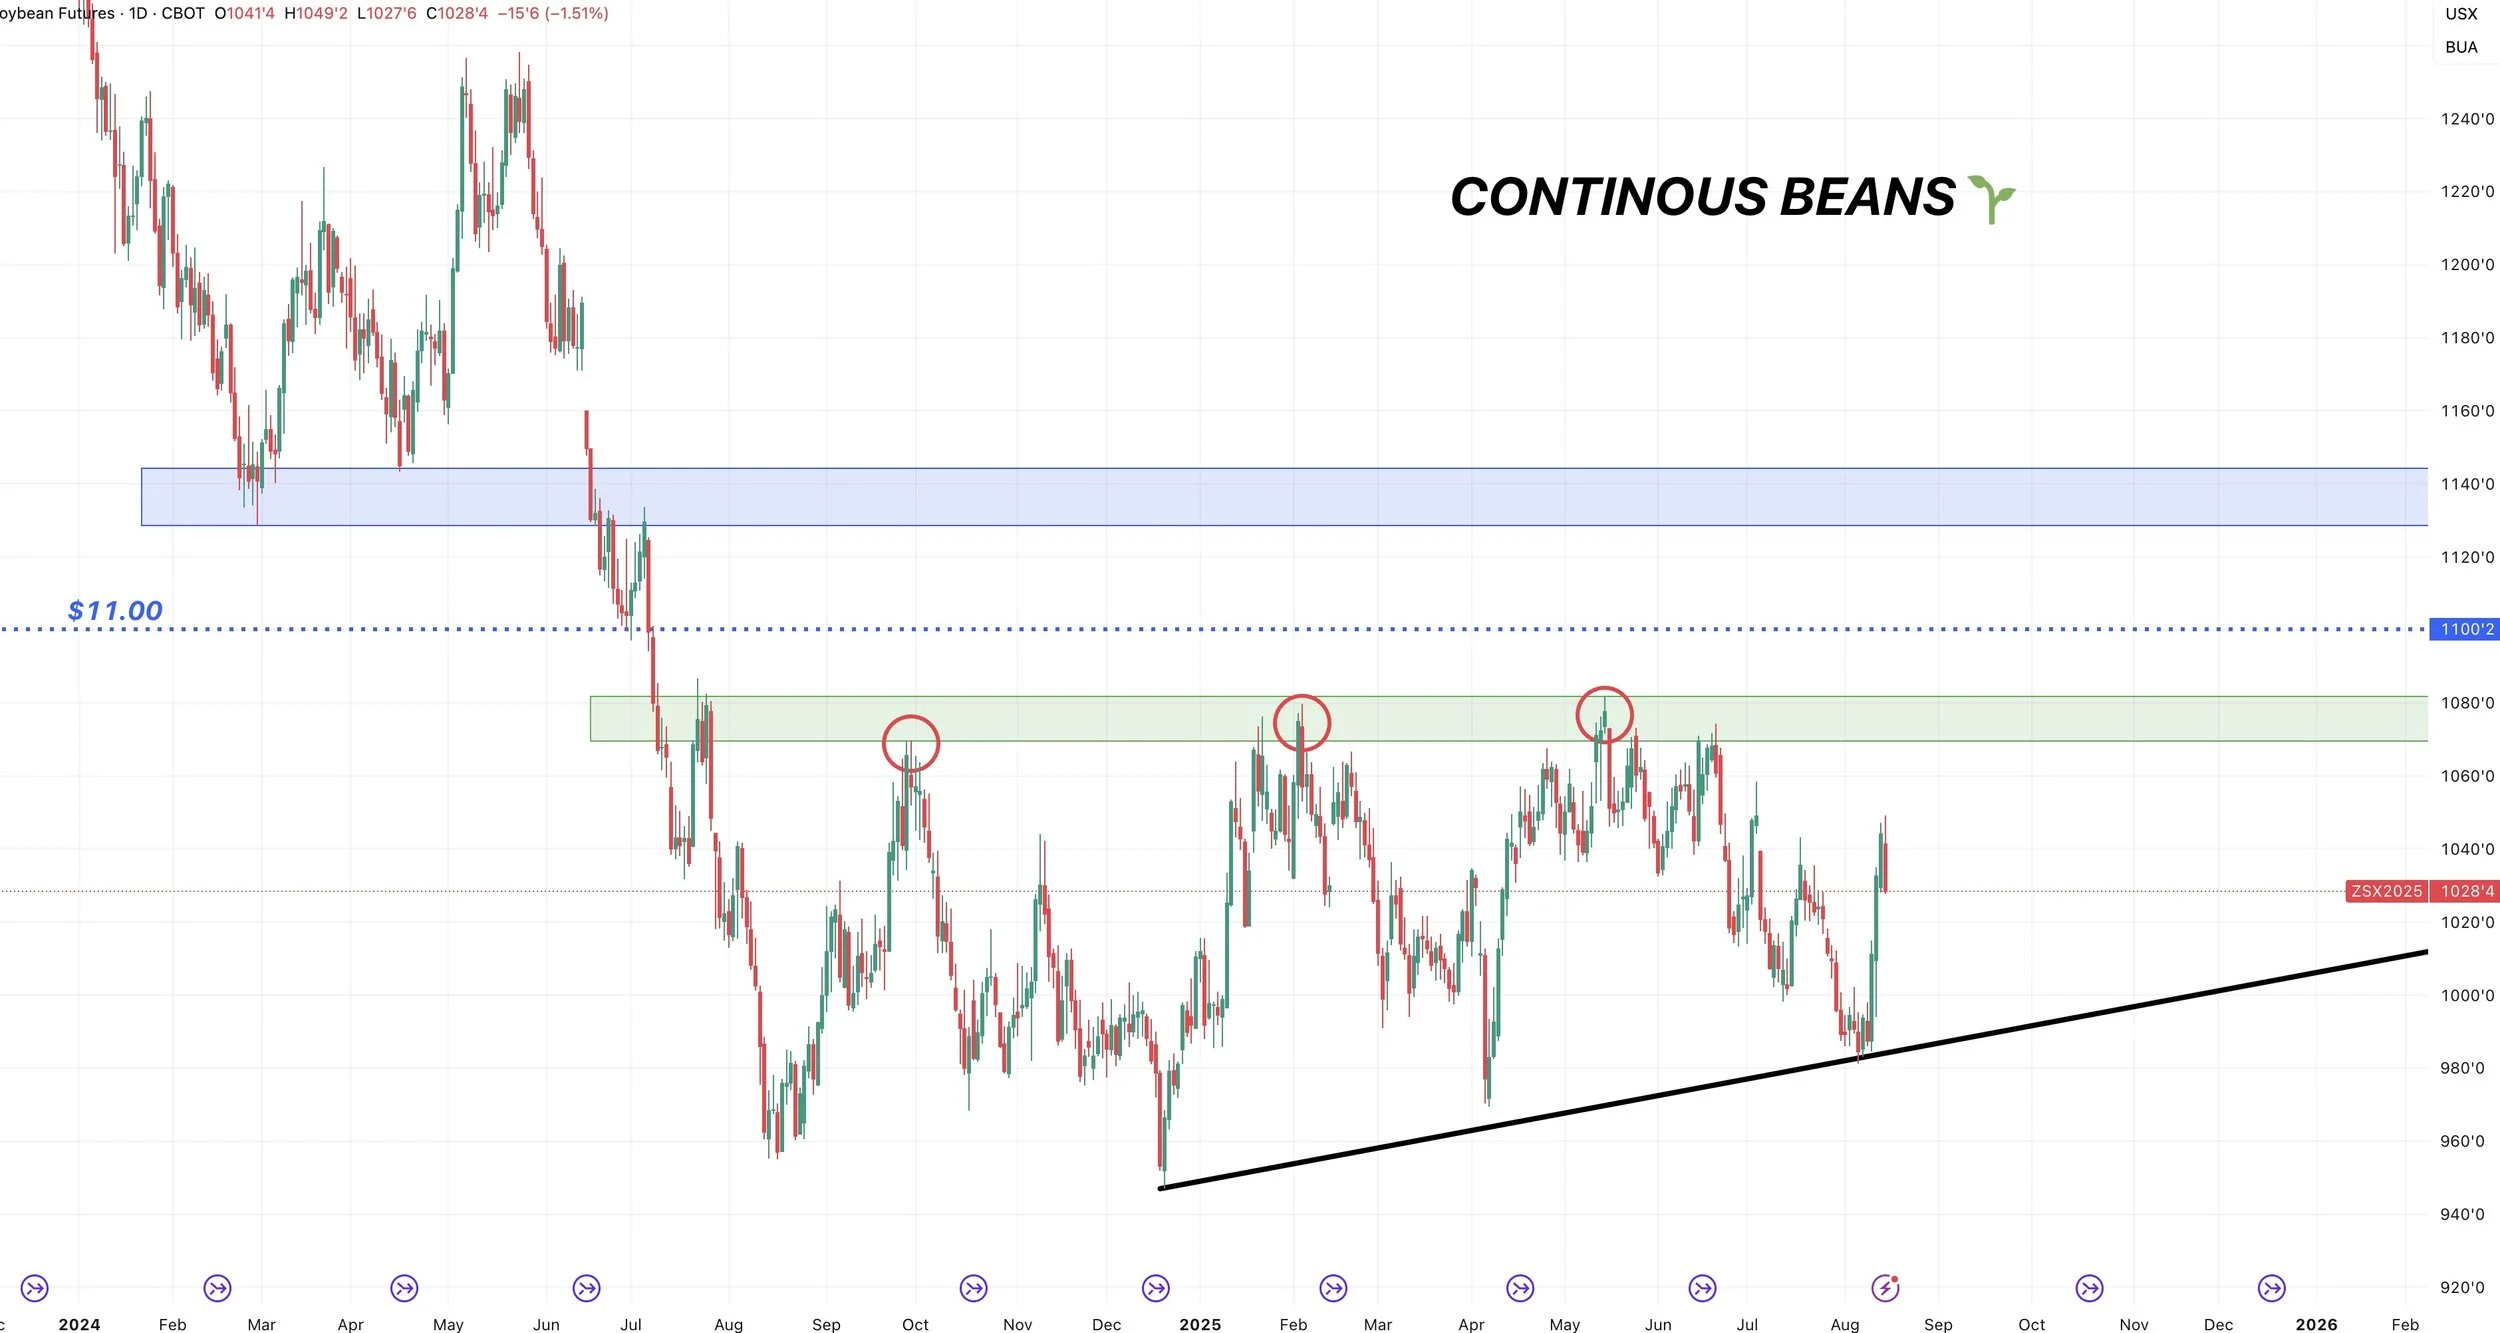
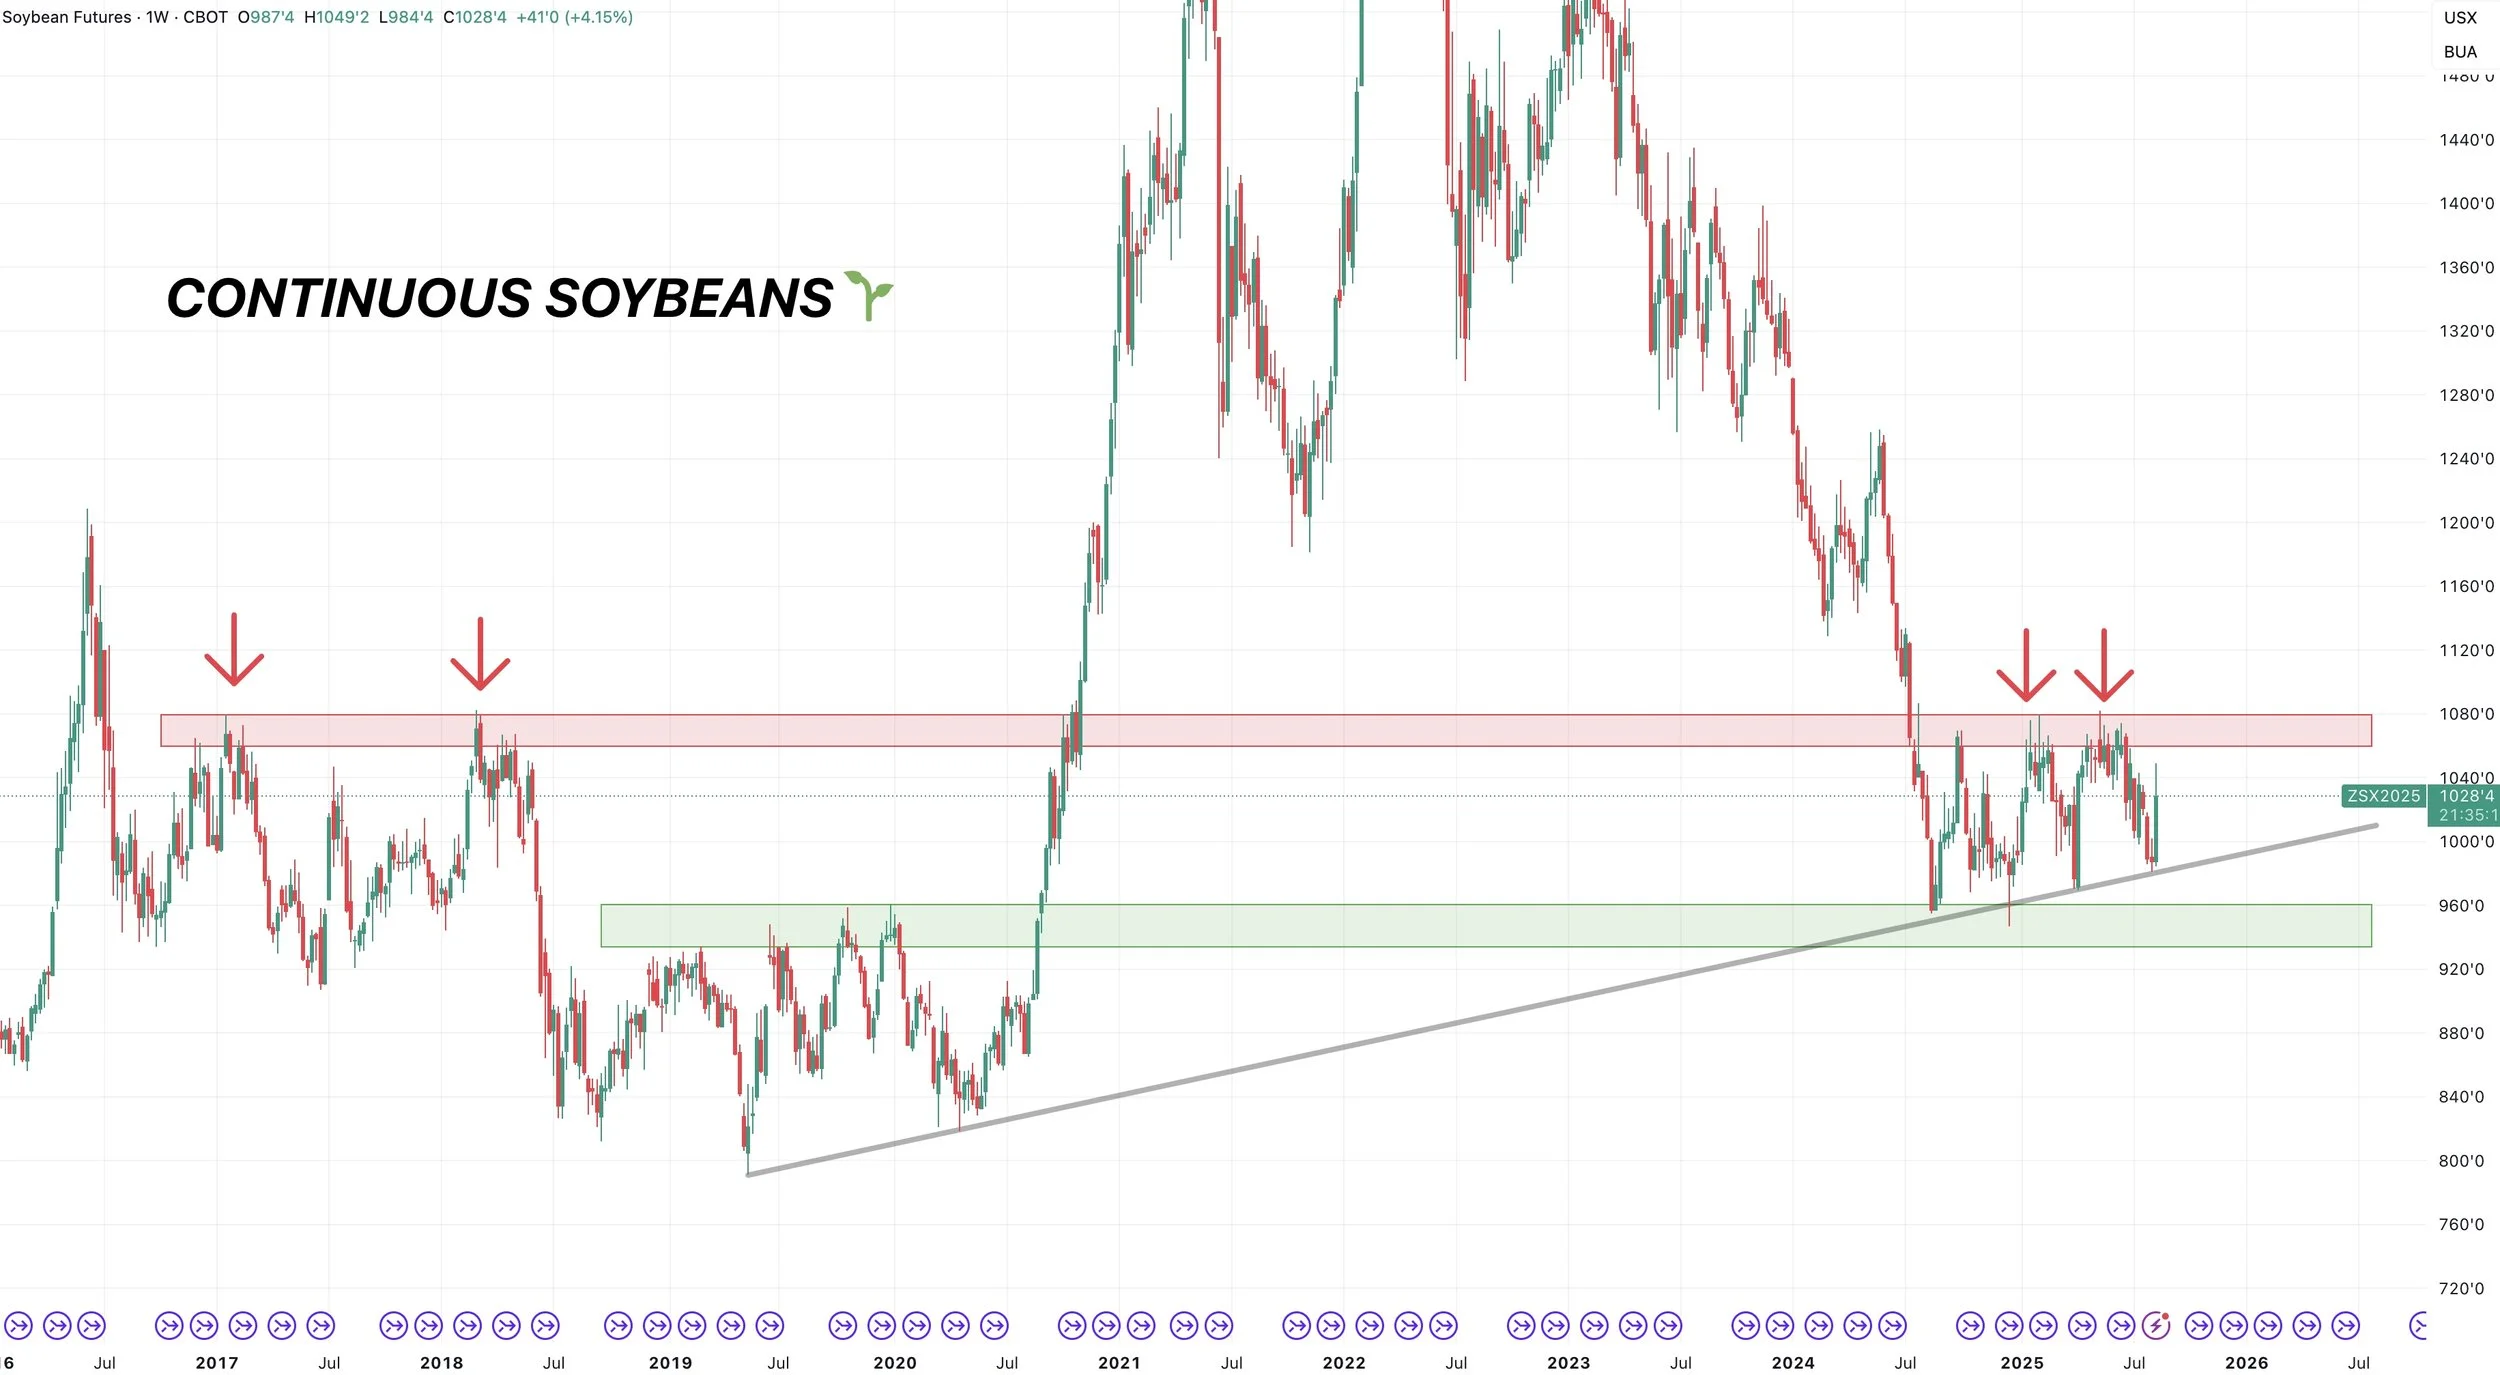
Taking a bigger picture approach, if we ever take out those highs.. there is a ton of room to run on the charts.
We rejected this $10.80 level several times this year.
This was also resistance back in 2017 and 2018.
Wheat
Very little to update on the wheat market.
Export sales continue to great for the wheat market.
New crop sales are at 12-year highs for the date, and up +25% vs last year.
Once again shout out to Karen Braun for the exports chart.
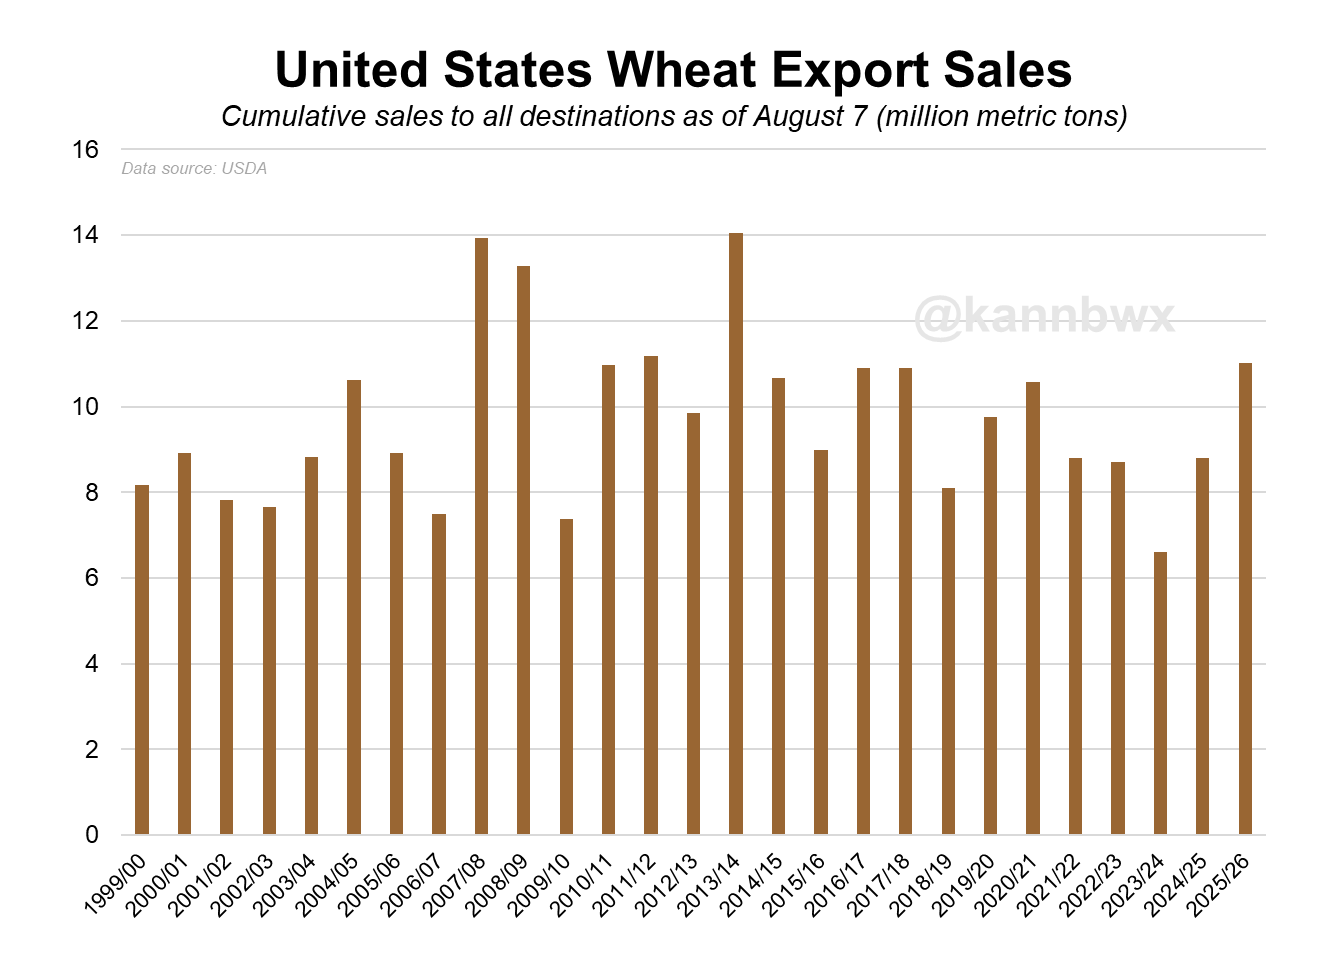
The US situation isn’t bullish by any means.
But if exports continue to outperform, this is one of a few ways to flip the script a little bit on the wheat balance sheet.

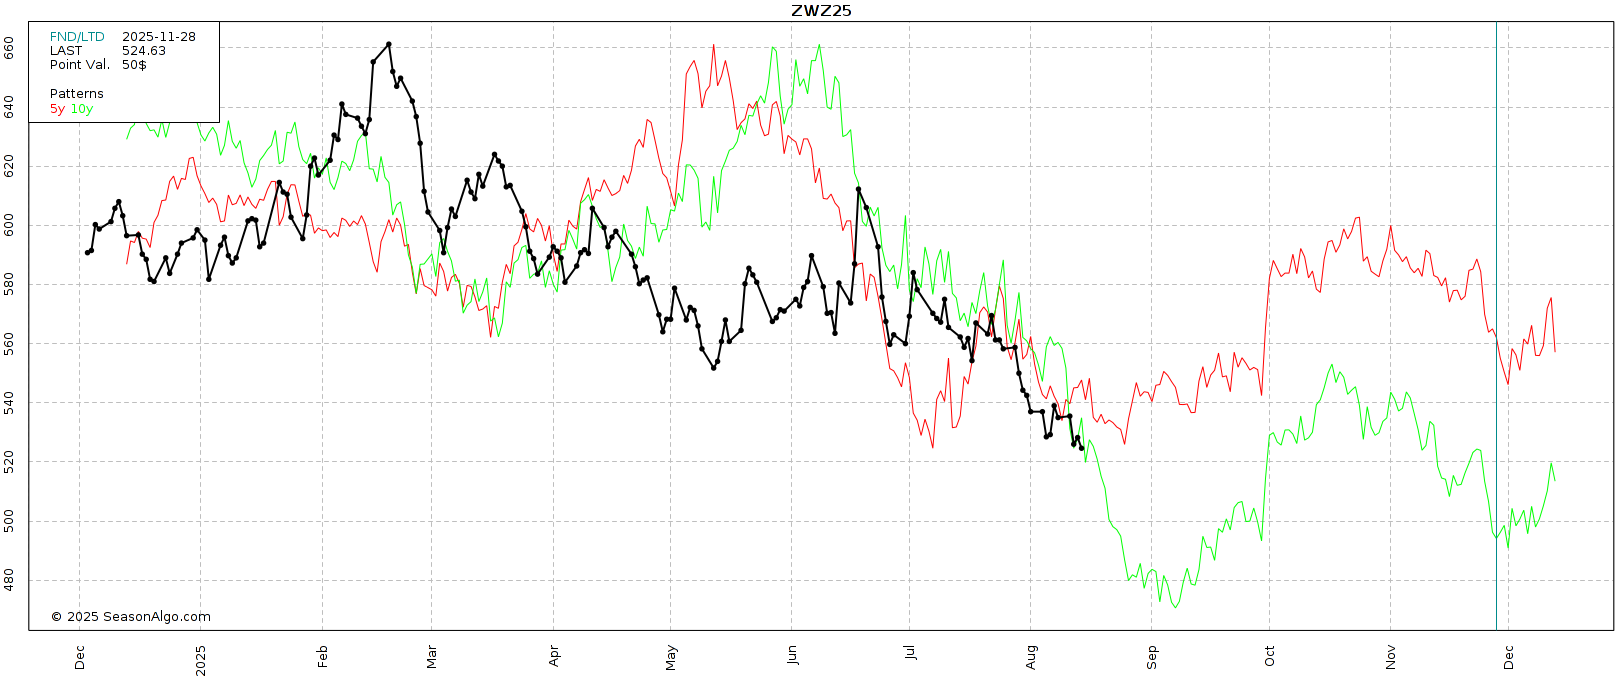
If we look at the wheat seasonal, both the 5 and 10 year saw we find a true bottom within the next 3 weeks.
Technicals:
Sep Chicago still battling this $5.00 pyscological level.
This is also the bottom of the wedge that has marked plenty of lows.
Not interested in selling wheat until closer to the top of the wedge.
We are also showing bullish divergence which is optimistic.

Just like Chicago, KC is sitting in a massive wedge.
Not looking to make sales until the top of the wedge currently.
Also showing bullish divergence.

Cattle
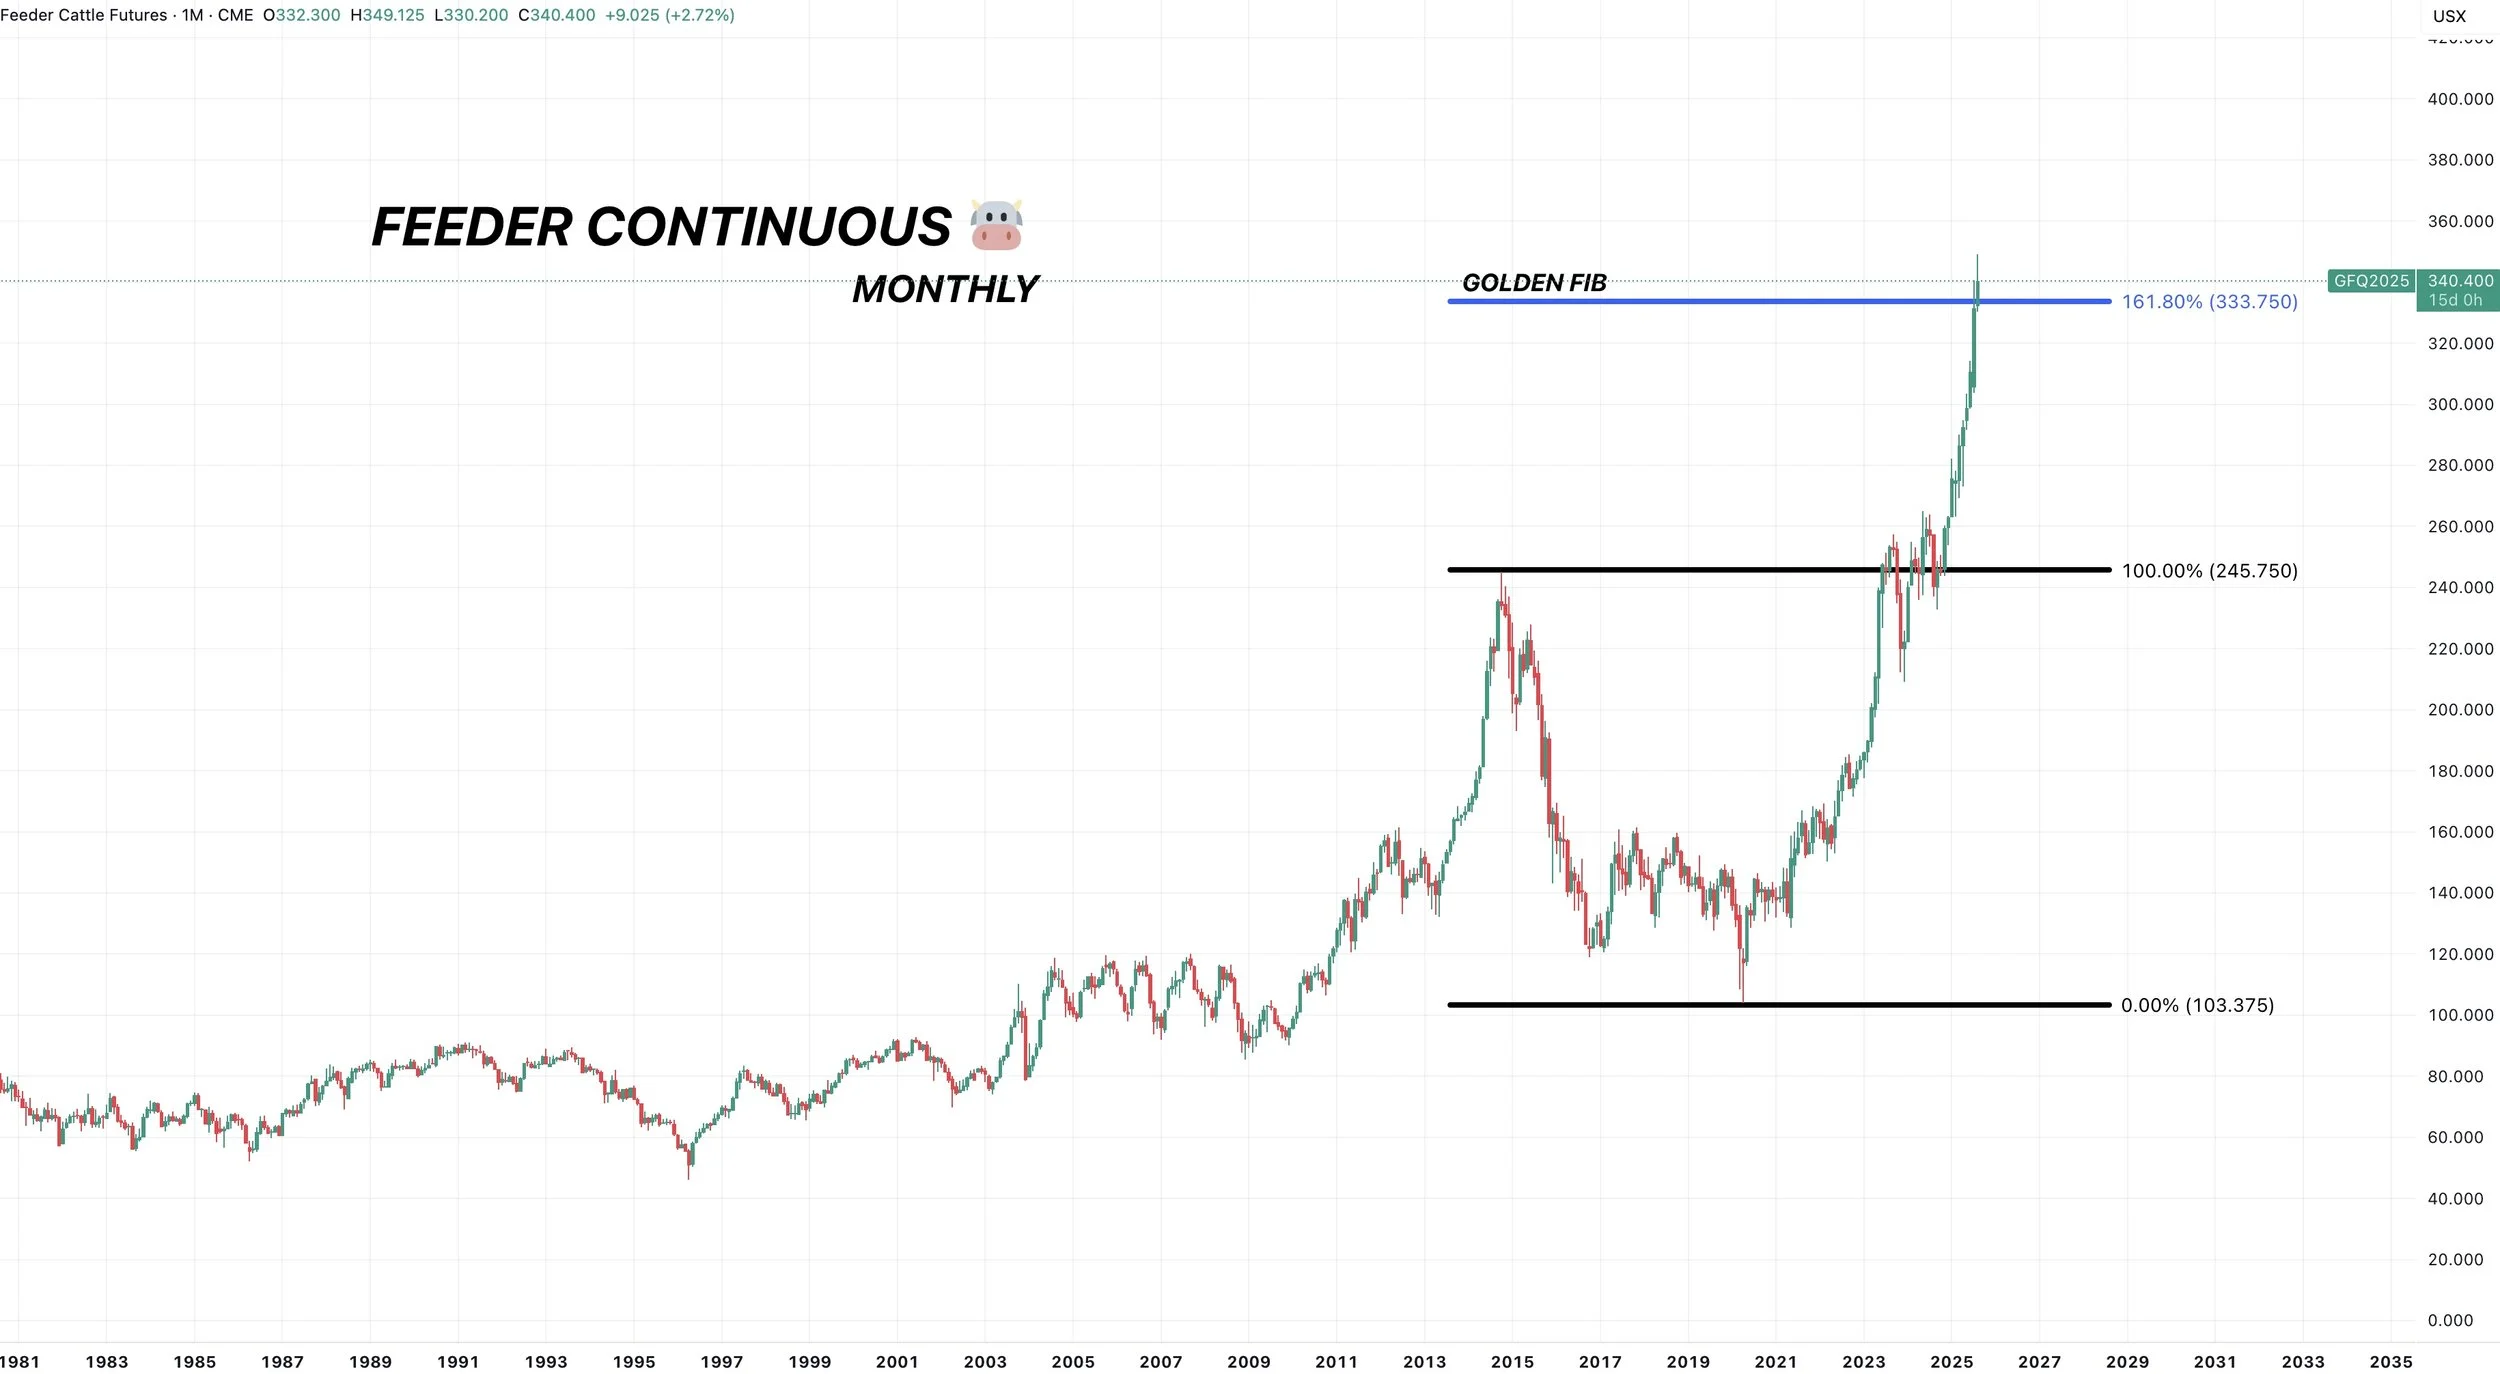
Here is a monthly cattle chart.
This has been one of the greatest bull runs of all-time.
It would be silly to not at least keep some puts under this thing.
So that is still our advice. Keep puts under this and let the bull market ride.
We prefer puts over futures. As futures can get you into an uncomfortable situaiton if we continue to run.
If we take an extremely big picture view, the golden fib extension of the 2014 rally down to the lows in 2020 puts the golden fib at 334. Today we are just above it at 340.
But this would be something you look at when trying to identity a target in a rally of this magnitude.
The hard thing about a bull market is timing a top. It is nearly impossible.
If you look at Sep feeder, we have not had 2 consective days of lower prices since the middle of July.
If we take out this newly formed uptrend, that might be a good indication we are starting a pullback.
If we get a pullback, I am looking for the blue box. Which gives back 50-61.8% of the entire rally since June.

Live cattle is still holding channel support.
Break below probably triggers a leg lower into blue box.

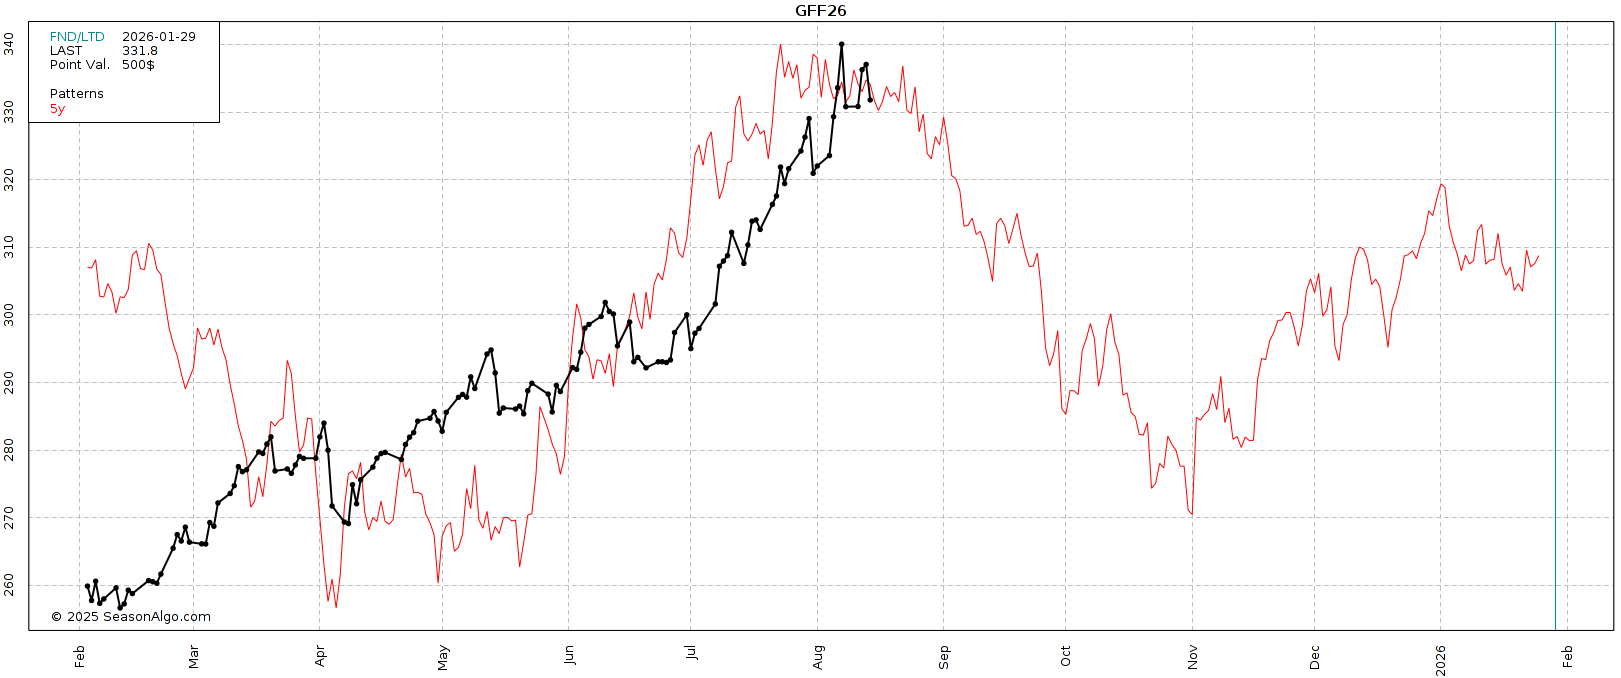
Here is an update on the 5-year seasonal.
Historical odds favor lower but of course doesn’t have to happen.
Just another reason we like protecting a historic rally.
Past Sell or Protection Signals
We recently incorporated these. Here are our past signals.
July 31st: 🐮
Cattle sell signal & hedge alert.
July 10th: 🐮
Cattle sell signal & hedge alert.
CLICK HERE TO VIEW
June 5th: 🐮
Cattle sell signal & hedge alert.
June 2nd: 🌾
MPLS wheat sell signal.
April 10th: 🌽
Old crop corn sell signal.
March 19th: 🐮
Cattle hedge & sell signal.
Feb 18th: 🌽 🌾
Old crop KC wheat & old crop corn signal.
Jan 23rd: 🌽 🌱
Corn & beans old crop sell signal.
CLICK HERE TO VIEW
Jan 15th: 🌽 🌱
Corn & beans hedge alert/sell signal.
Jan 2nd: 🐮
Cattle hedge alert at new all-time highs & target.
Dec 11th: 🌽
Corn sell signal at $4.51 200-day MA
CLICK HERE TO VIEW
Oct 2nd: 🌾
Wheat sell signal at $6.12 target
Sep 30th: 🌽
Corn protection signal at $4.23-26
Sep 27th: 🌱
Soybean sell & protection signal at $10.65
Sep 13th: 🌾
Wheat sell signal at $5.98
May 22nd: 🌾
Wheat sell signal when wheat traded +$7.00
Want to Talk?
Our phones are open 24/7 for you guys if you ever need anything or want to discuss your operation.
Hedge Account
Interested in a hedge account? Use the link below to set up an account or shoot Jeremey a call at (605)295-3100.
Check Out Past Updates
8/13/25
UPCOMING CROP TOURS & NEXT BEAN TARGET
8/12/25
MAJOR USDA SHOCK. HOW DOES THIS CHANGE THINGS?
8/11/25
TRUMP SAYS CHINA NEEDS BEANS. USDA TOMORROW
8/8/25
CALM BEFORE USDA STORM & CATTLE LIMIT DOWN
8/7/25
USDA PREVIEW & MORE DETAILS ON BUY SIGNAL
8/6/25
CORN REVERSAL? RIDING CATTLE RUN BUT BEING DISIPLINED
8/5/25
188 CORN YIELD? AUGUST CATTLE CONCERNS?
8/4/25
NEW CORN LOWS & USDA NEXT WEEK
8/1/25
STOUT DEMAND & WET JULY
7/31/25
WHERE IS CORN & BEAN BOTTOM? WAS THAT CATTLE TOP?
7/31/25
CATTLE HEDGE ALERT & SELL SIGNAL
7/30/25
ANY HOPE LEFT FOR GRAINS?
7/29/25
SEASONAL STRUGGLE CONTINUES
7/28/25
EXTREME BEARISHNESS PRICED INTO GRAINS. CATTLE WARNING SIGNS
7/25/25
NO REASON TO RALLY. NO REASON TO COLLAPSE
7/24/25
CORN DEMAND OVERSTATED? CATTLE CLOSE TO TOP?
7/23/25
JAPAN DEAL NOT ENOUGH
7/22/25
CROP RATINGS MATTER?
7/21/25
RAIN MAKES GRAIN
7/18/25
OVERNIGHT HEAT & ROOM FOR ERROR
7/17/25
POOR CORN EXPORTS MATTER? REWARD BEAN BOUNCE?
7/16/25
ARE CORN & BEANS UNDERVALUED OR NOT?
7/15/25
NEGATIVE NEWS POSITIVE ACTION IN GRAINS
7/14/25
DON’T GIVE GRAIN AWAY
7/11/25
USDA FRIENDLY CORN. MARKET DOESN’T CARE
7/10/25
JULY USDA OUT TOMORROW
7/10/25
CATTLE HEDGE ALERT & SELL SIGNAL
7/9/25
MARKET SEES RECORD CROPS
7/8/25
MONSTER CORN YIELD..?
7/7/25
TRUMP PUMP & DUMP
7/3/25
CORN & BEANS REJECT KEY SPOT. TRUMP SPEAKS IN IOWA
7/2/25
TRADE DEALS? BEANS RALLY AT GOLDEN ZONE
7/1/25
NOW WHAT FOR GRAINS?
6/30/25
BORING USDA. DIDN’T SAY HAVE TO GO LOWER
6/30/25
USDA NUMBERS
6/27/25
ALL EYES ON MONDAY
6/26/25
FIREWORKS OR BLOOD BATH MONDAY?
6/25/25
GRAINS COLLAPSING AHEAD OF JUNE REPORT
6/24/25
CORN CONTINUES SELL OFF. MAJOR USDA REPORT COMING
6/23/25
CORN CAN GO LOWER, BUT NOT FOR FOREVER
6/20/25
WHO SHOULD REWARD THE WHEAT & SOYBEAN RALLY?
6/18/25
COMPLETE CHART BREAKDOWNS
6/17/25
SOYBEANS CONTINUE BREAKOUT. NEARING SELL SIGNAL
6/16/25
CORN HAMMERED. EPA GAME CHANGER IN BEANS?
6/13/25
SOYBEANS RALLY, CHARTS, BALANCE SHEETS & MORE
6/12/25
USDA NON-EVENT. WHAT’S NEXT?
6/11/25
DIVERGENCE & SEASONAL SELL OFF?
6/10/25
BEING PATIENT VS BALANCING YOUR RISK
6/9/25
WHAT IF WE DON’T GET A WEATHER SCARE?
6/5/25
CORN & BEANS HOLDING CRUCIAL SPOTS
6/5/25
CATTLE SELL SIGNAL & HEDGE ALERT
6/4/25
HOW UNKNOWNS IMPACT MARKETING DECISIONS
6/3/25
KEY SPOTS ON THE CHARTS FOR CORN & BEANS
6/2/25
NEW LOWS IN CORN. DE-RISKING MPLS WHEAT
6/2/25
SPRING WHEAT SELL SIGNAL
5/30/25
SEASONAL RALLY STILL IN THE CARDS?
5/29/25
WHAT IS YOUR PLAN IF WE DO NOT RALLY?
5/28/25
ZERO PREMIUM IN THE GRAIN MARKETS
5/27/25
CORN CONDITIONS DISAPPOINT & JUNE OUTLOOK IMPROVES
5/23/25
TARIFFS SPOOK MARKET. GAME PLAN MOVING FORWARD
5/22/25
CHART BREAKDOWNS & TARGETS
5/21/25
RISK TO THE UPSIDE WITH WEATHER?
5/20/25
WHEAT SHORT COVERING & HISTORY OF YIELD CHANGES
5/19/25
ANYONE LEFT TO SELL WHEAT? 181 CORN YIELD POSSIBLE?
5/16/25
FUNDS SHORT CORN. MARKETS WAITING ON WEATHER
5/15/25
BEANS HAMMERED ON RUMOR & WHEAT FINDING LIFE
5/14/25
DECISIONS & POSSIBILITIES IN GRAINS
5/13/25
GRAINS RALLY OFF LOWS
5/12/25
USDA REPORT. HOW THIS CHANGES THINGS
5/9/25
BIGGEST RISKS IN USDA REPORT
5/8/25
USDA MONDAY & HISTORY OF WEATHER RALLIES
5/7/25
NEW 2025 LOWS FOR CORN
5/6/25
WHAT’S A SUMMER RALLY LOOK LIKE?
5/5/25
CORN ERASES ENTIRE APRIL RALLY
5/2/25
SELL INTO UNCERTAINTY. NOT KNOWN FACTORS
5/1/25
THE CASE AGAINST A FEB TOP IN CORN
4/30/25
APPROACHING KEY TIME PERIOD FOR GRAINS
4/29/25
PLANTING & FIRST NOTICE DAY PRESSURE. CORN CLOSE TO BOTTOM?
4/28/25
CAPTURING INVERSE & SEASONAL PREPARATION
4/25/25
HOW OFTEN DOES CORN NOT BREAK APRIL HIGHS?
4/24/25
KNOW WHEN TO SELL. BEANS BREAK 200-DAY FIRST TIME IN 483 DAYS
4/23/25
MONEY FLOW & DROUGHT CARDS
4/22/25
CRUCIAL SPOT FOR CORN & BEANS
4/21/25
NO PLANTING THREAT YET
4/18/25
POTENTIAL OPPORTUNITIES, BASIS CONTRACTS & STRATEGIES
4/16/25
HOW YIELD IMPACTS CARRYOUT. MAJOR SPOT FOR SOYBEANS
4/15/25
TOTAL CHART BREAKDOWNS & TARGETS
4/14/25
TECHNICAL SELLING IN GRAINS
4/11/25
SPECIFIC GRAIN MARKETING DECISIONS
4/10/25
USDA REPORT. HOW THIS IMPACTS CORN
4/9/25
TARIFFS GIVE. TARIFFS TAKE
4/8/25
CORN’S DIVERGING STRENGTH
4/7/25
SOLID PRICE ACTION DESPITE OUTSIDE FEAR
4/4/25
CORN PRICE ACTION SPEAKS VOLUME. ANY HOPE LEFT FOR SOYBEANS?
4/3/25
WHAT IS LEFT FOR CORN BEARS? TRADE WAR: CHARTS HOLDING SUPPORT
4/2/25
SHOULD UNKNOWNS KEEP A FLOOR UNDER GRAIN PRICES?
4/1/25
HOW DO ACRES IMPACT FUTURE OF THE GRAINS?
3/31/25
USDA REPORT: NOW WHAT?
3/28/25
ALL EYES ON USDA
3/27/25
PRE-USDA POSITIONING. DON’T GIVE GRAIN AWAY
3/26/25
HISTORY OF MARCH INTENTIONS. SOYBEANS UNDERVALUED?
3/25/25
6 DAYS UNTIL MAJOR USDA REPORT
3/24/25
HOW TO POSITION YOURSELF BEFORE PLANTING
3/21/25
REASONS TO BE OPTIMISTIC IN GRAINS?
3/20/25
WAS THAT THE BOTTOM IN CORN?
3/19/25
THE PATH HIGHER & THE DOWNSIDE RISKS IN GRAINS
3/18/25
SEASONALS, CATTLE HEDGE, CHARTS & DROUGHT?
3/17/25
WHEAT RALLIES. DON’T GET BACKED INTO A CORNER
3/14/25
MARCH 31ST REPORT THOUGHTS & WHAT’S NEXT FOR GRAINS
3/13/25
EXPLAINING RE-OWNERSHIP VS COURAGE CALLS
3/12/25
TARIFF FEARS. EU, CANADA, & ETHANOL
3/11/25
USDA SNOOZE. RECORD FUND SELLING A CONCERN?
3/10/25
USDA TOMORROW. GETTING COMFORTABLE IN MARKETING
3/7/25
HOW TIGHT IS THE WORLD & US SITUATION?
3/6/25
TARIFFS PUSHED BACK. FUTURE OPPORTUNITIES?
3/5/25
IS GRAINS BIGGEST RISK WEAK CRUDE & DEFLATION?
3/4/25
TRADE WAR BEGINS. 8TH DAY OF PAIN FOR GRAINS
3/3/25
TARIFFS ON TOMORROW. BUY SIGNAL
3/3/25
BUY SIGNAL
2/28/25
WHEN WILL THE BLEEDING STOP?
2/27/25
CORN AT CRITICAL SPOT. USDA ACRE REPORT. WAY TOO EARLY DROUGHT TALK
2/26/25
HISTORY SUGGESTS CORN TOP ISN’T IN? ACRE OUTLOOK TOMORROW
2/25/25
POSITIVE CLOSE. WHAT TO KNOW ABOUT USDA OUTLOOK
2/24/25
USDA OUTLOOK, FIRST NOTICE DAY & BRAZIL
2/21/25
WHAT TO EXPECT MOVING FORWARD IN GRAINS
2/20/25
FIRST NOTICE DAY CONCERNS. MASSIVE CORN ACRES OR NOT?
2/19/25
HOW TIGHT IS THE CORN SITUATION?
2/18/25
MORE DETAILS ON TODAYS SELL SIGNAL
2/18/25
OLD CROP KC WHEAT & CORN SELL SIGNAL
2/14/25
WHEAT BREAKING OUT ON WEATHER RISK. TECHNICALS & FUNDAMENTALS
2/12/25
GLOBAL GRAIN SITUATION, ACRE TALK, CHARTS & MORE
2/11/25
USDA: NOT A BEARISH REPORT. DISAPPOINTING PRICE ACTION
2/10/25
USDA TOMORROW. LONG TERM PATH FOR SUB 10% CORN STOCKS TO USE?
2/7/25
WHY WOULD THE FUNDS EXIT THEIR LONGS?
2/6/25
WHEAT FINALLY CATCHING A BID
2/5/25
COMPLETE THOUGHTS ON MARKETS: BACK & FORTH DISCUSSION
2/4/25
STRONG JANUARY LEAD TO STRONG YEAR? TARIFFS, CHARTS & MORE
2/3/25
TARIFFS PUSHED BACK
1/31/25
TARIFF NEWS ALL OVER THE PLACE. ARE YOU PREPARED FOR POSSIBILITIES?
1/30/25
WHEAT BULL ARGUMENT. TRUMP ADDS TARIFFS
1/29/25
CORN APPROACHES $5.00
1/28/25
TARIFFS, CORN FUNDS, SOUTH AMERICA & MORE
1/27/25
HEALTHY CORRECTION WE TALKED ABOUT & TARIFF NEWS
1/24/25
GRAINS DUE FOR SHORT TERM CORRECTION?
1/23/25
OUR ENTIRE NEW CROP SALES THOUGHTS & OLD CROP SELL SIGNAL
1/22/25
GRAINS TAKE A BREATHER. IS CORN IN A BULL OR BEAR MARKET?
1/21/25
HUGE DAY IN GRAINS. WHAT TO DO WITH OLD CROP VS NEW CROP
Read More
1/20/25
VIDEO CHART UPDATE
1/17/25
TRUMP, CHINA, ARGY & USING THE SPREADS INVERSE
1/16/25
OLD CROP LEADS US LOWER. MARKETING THOUGHTS
1/15/25
SIGNAL & HEDGE ALERT QUESTIONS EXPLAINED. IS $6 CORN EVEN POSSIBLE?
1/14/25
MORE DETAILS ON TODAYS HEDGE ALERT & SELL SIGNAL
1/14/25
CORN & SOYBEANS HEDGE ALERT/SELL SIGNAL
1/13/25
USDA GAME CHANGER OR NOT?
1/10/25
BULLISH USDA FOR CORN & BEANS
1/9/25
USDA OUT TOMORROW
1/8/25
2 DAYS UNTIL USDA. BE PREPARED
1/7/25
THE HISTORY OF THE JAN USDA & MORE
1/6/25
MAJOR USDA REPORT FRIDAY
Read More
1/3/25
UGLY DAY ACROSS THE GRAINS
1/2/25