
CROP CONCERNS & DRY FINISH?
MARKET UPDATE
You can scroll to read the usual update as well. As the written version is the exact same as the video.
Timestamps for video:
Crop Tour: 0:00min
Weather: 3:45min
Corn: 4:20min
Beans: 7:40min
Wheat: 12:45min
Cattle: 13:40min
Want to talk about your situation?
(605)295-3100
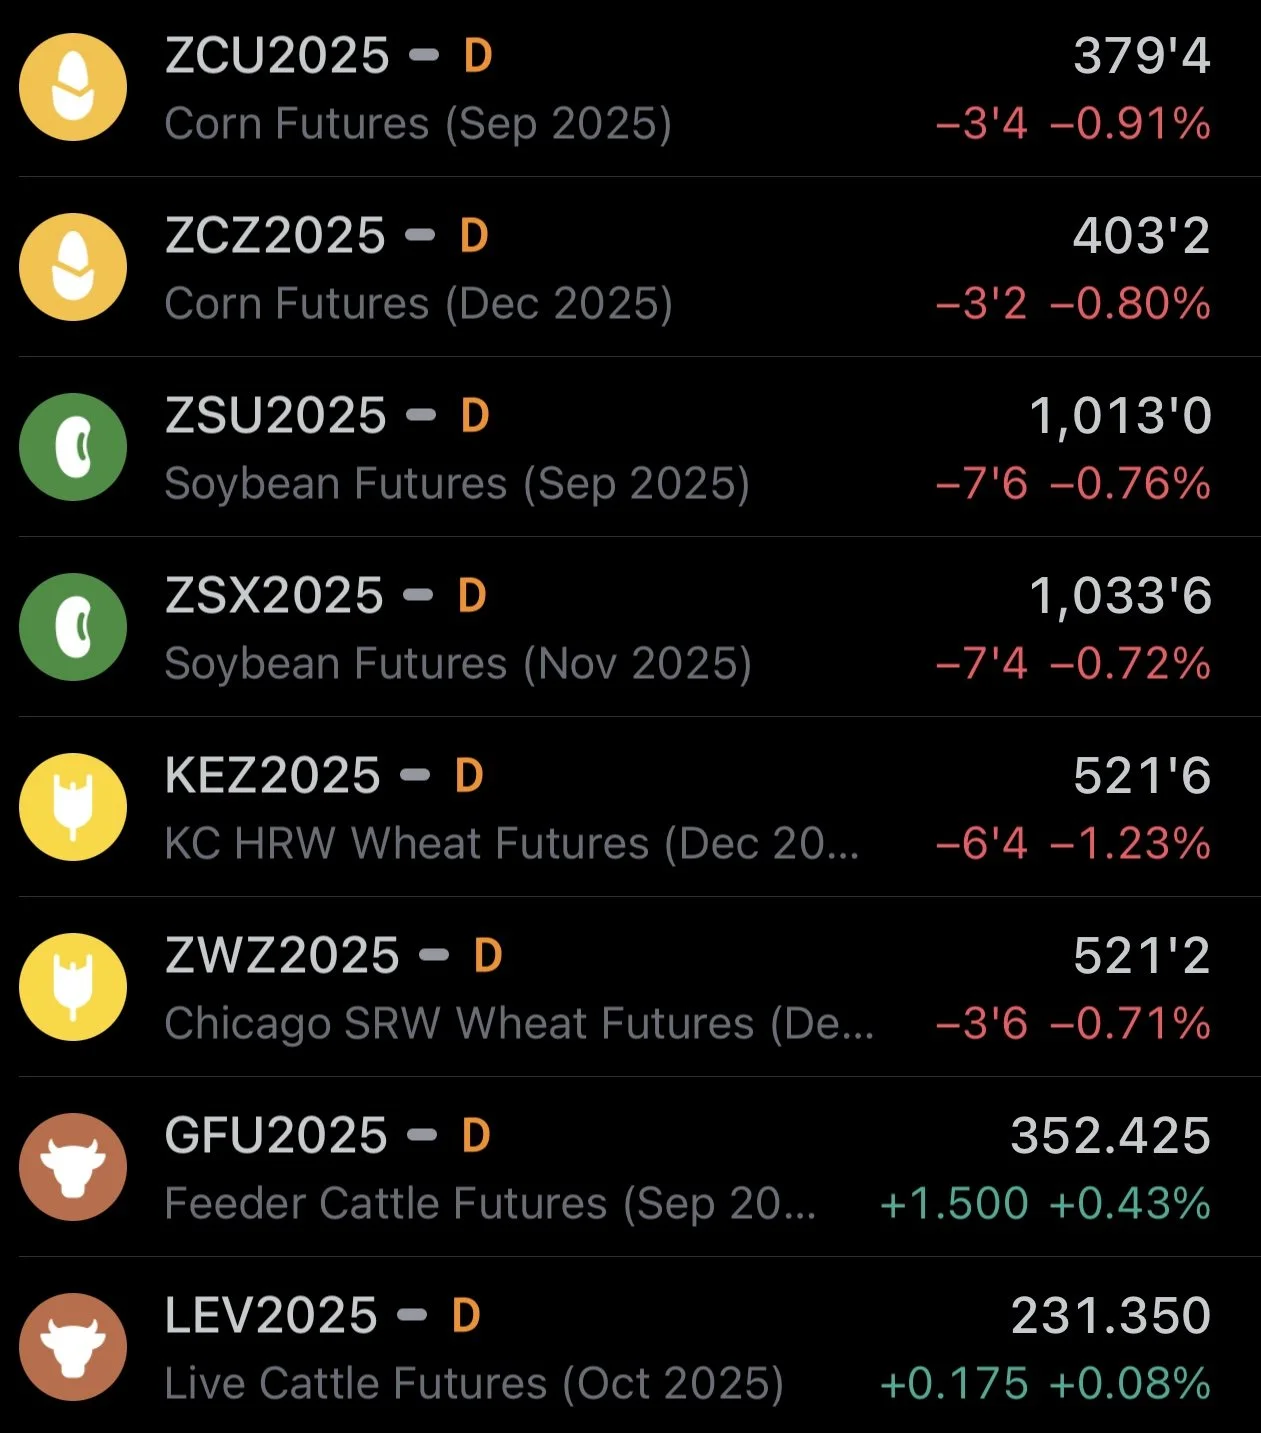
Futures Prices Close
Overview
Grains mostly lower across the board while the cattle market continues it's epic run.
Usually, the crop tours don’t make a major impact on price action.
However, they do give us our first look at boots on the ground and give us some nice insights.
So let's go over the tour this far.
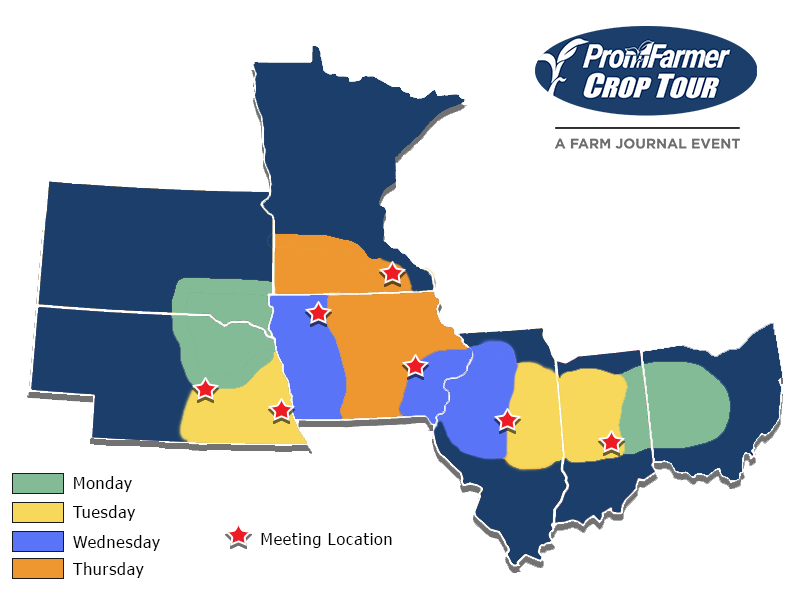
Crop Tours: Day 1
Last night we got the results for Day 1 of the Pro Farmer Crop Tour.
This included Ohio and South Dakota.
Tonight the results will be in for Indiana and Nebraska.
Here is the schedule.
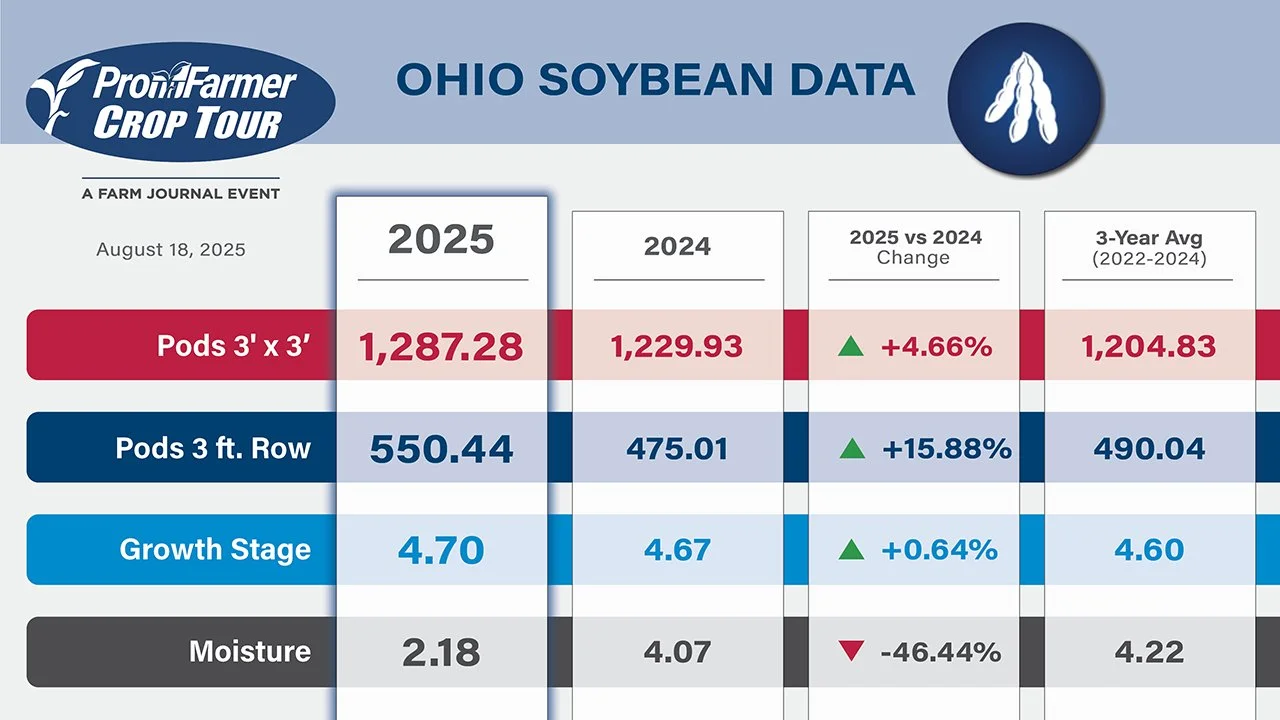
Ohio
Corn (bpa) 🌽
2025 Tour: 185.69
2025 USDA: 196
2024 Tour: 183.29
2024 USDA: 177
Beans (Pod Count) 🌱
2025 Tour: 1,287.28
2025 USDA Yield: 57
2024 Tour: 1,229.93
2024 USDA Yield: 50
Chart from Karen Braun
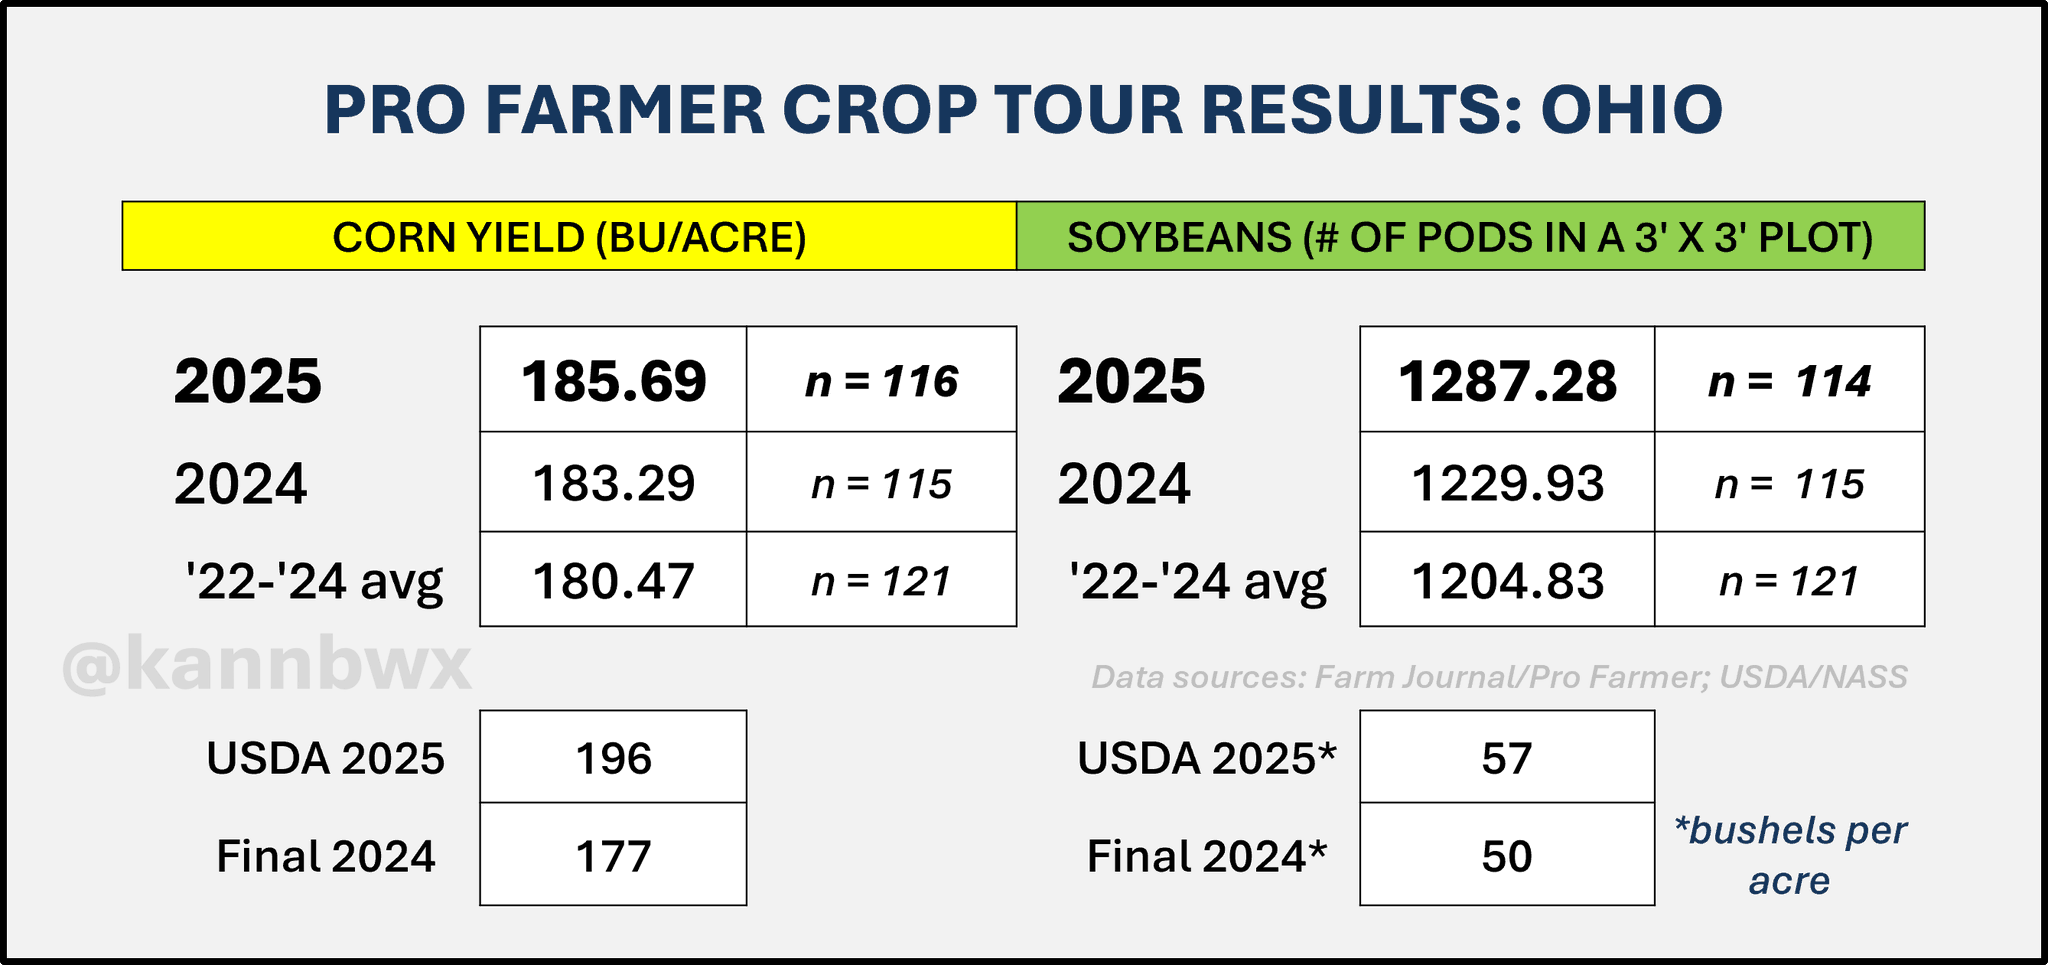
Inital thoughts for Ohio, the USDA might be too high on their corn yield.
The tour came up with 186 vs the USDA's 196. A big difference.
The tour projects yield up just +1.3% vs last year.
(185.69 vs 183.29 last year)
That is not a big increase at all.
On the other hand the USDA projects yield up +10% vs last year.
(196 vs 177 last year)
That is a huge increase.
So definitely some major differences there.

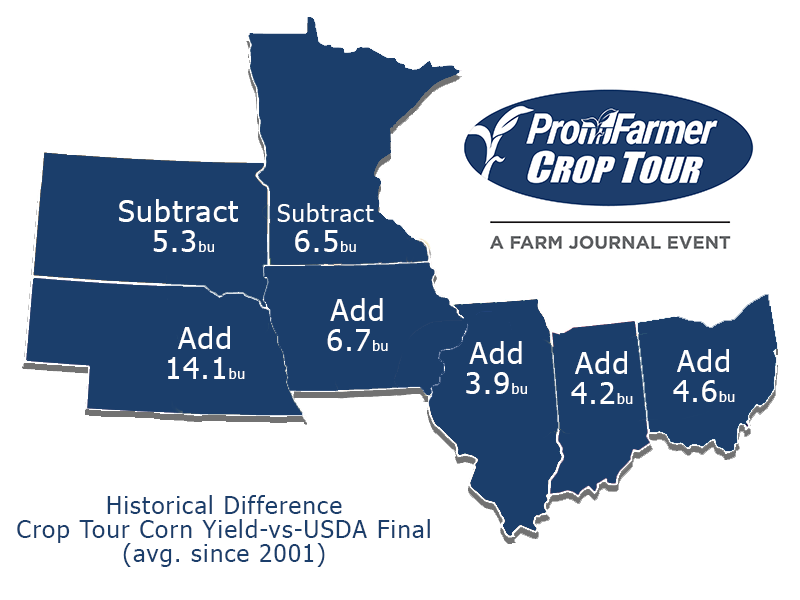
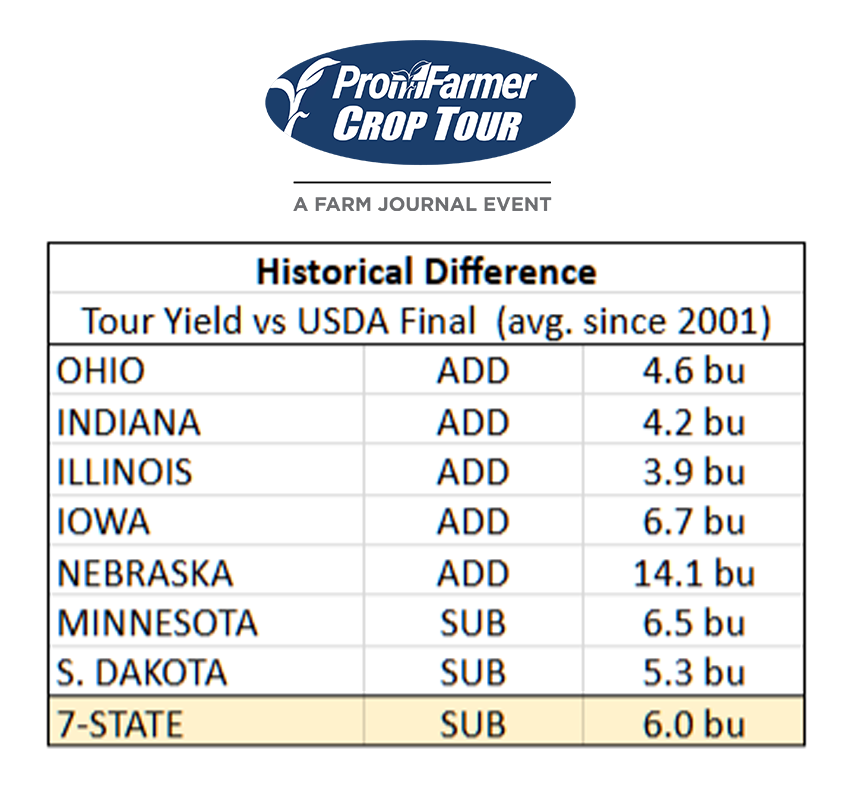
Historically, the crop tour does underestimate Ohio by -4.6 bpa.
If that happened this year, it would put their crop around 190. Which would still be well below the USDA's 196.
Overall it feels like the USDA is too optimistic with their Ohio corn numbers.
Soybeans in Ohio were a lot better than the corn.
Pod counts for soybeans were up +4.6% vs last year
(1,287 vs 1,230 last year)
USDA's yield projection is 57 vs last year's 50.
Which is a +12% increase vs last year.
That does not quite line up with the pod count increase, but it's hard to navigate pod count vs yield.
Why does the tour use pod counts instead of yield? Who knows.
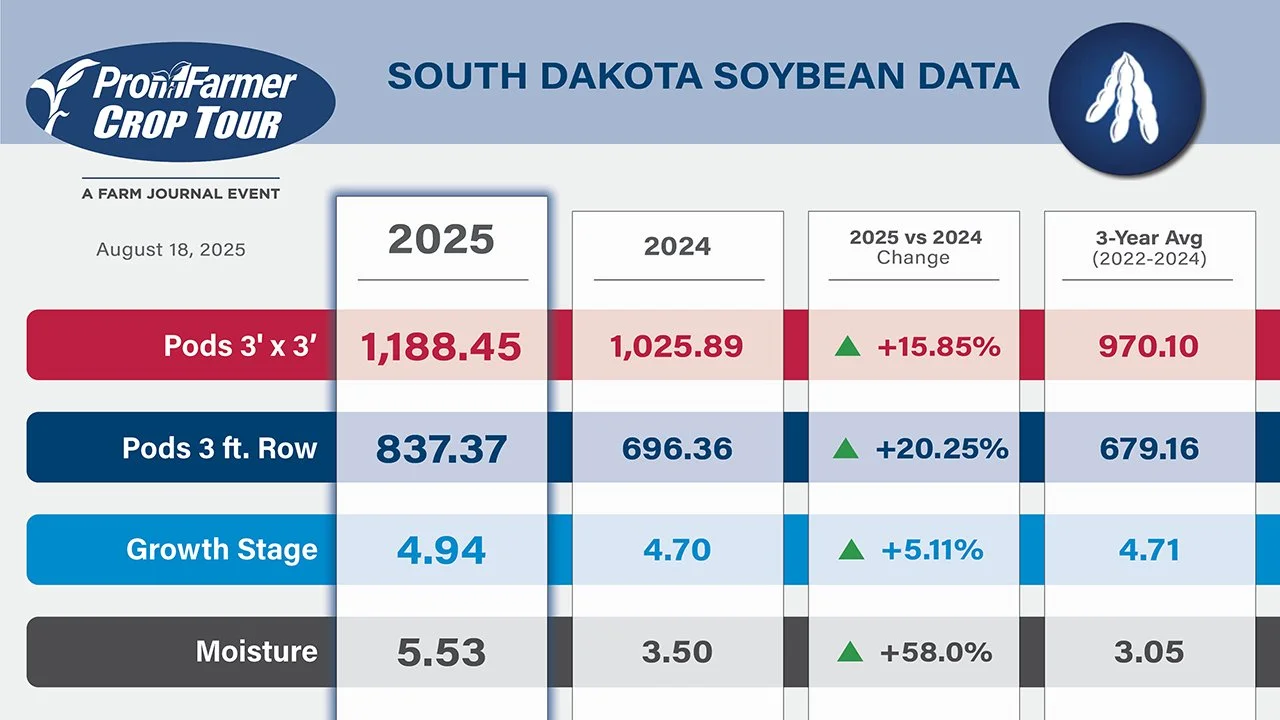
South Dakota
South Dakota on the other hand had a complete opposite tour compared to Ohio.
Corn (bpa) 🌽
2025 Tour: 174.18
2025 USDA: 168
2024 Tour: 156.51
2024 USDA: 164
Beans (Pod Count) 🌱
2025 Tour: 1,118.45
2025 USDA Yield: 47
2024 Tour: 1,025.89
2024 USDA Yield: 43
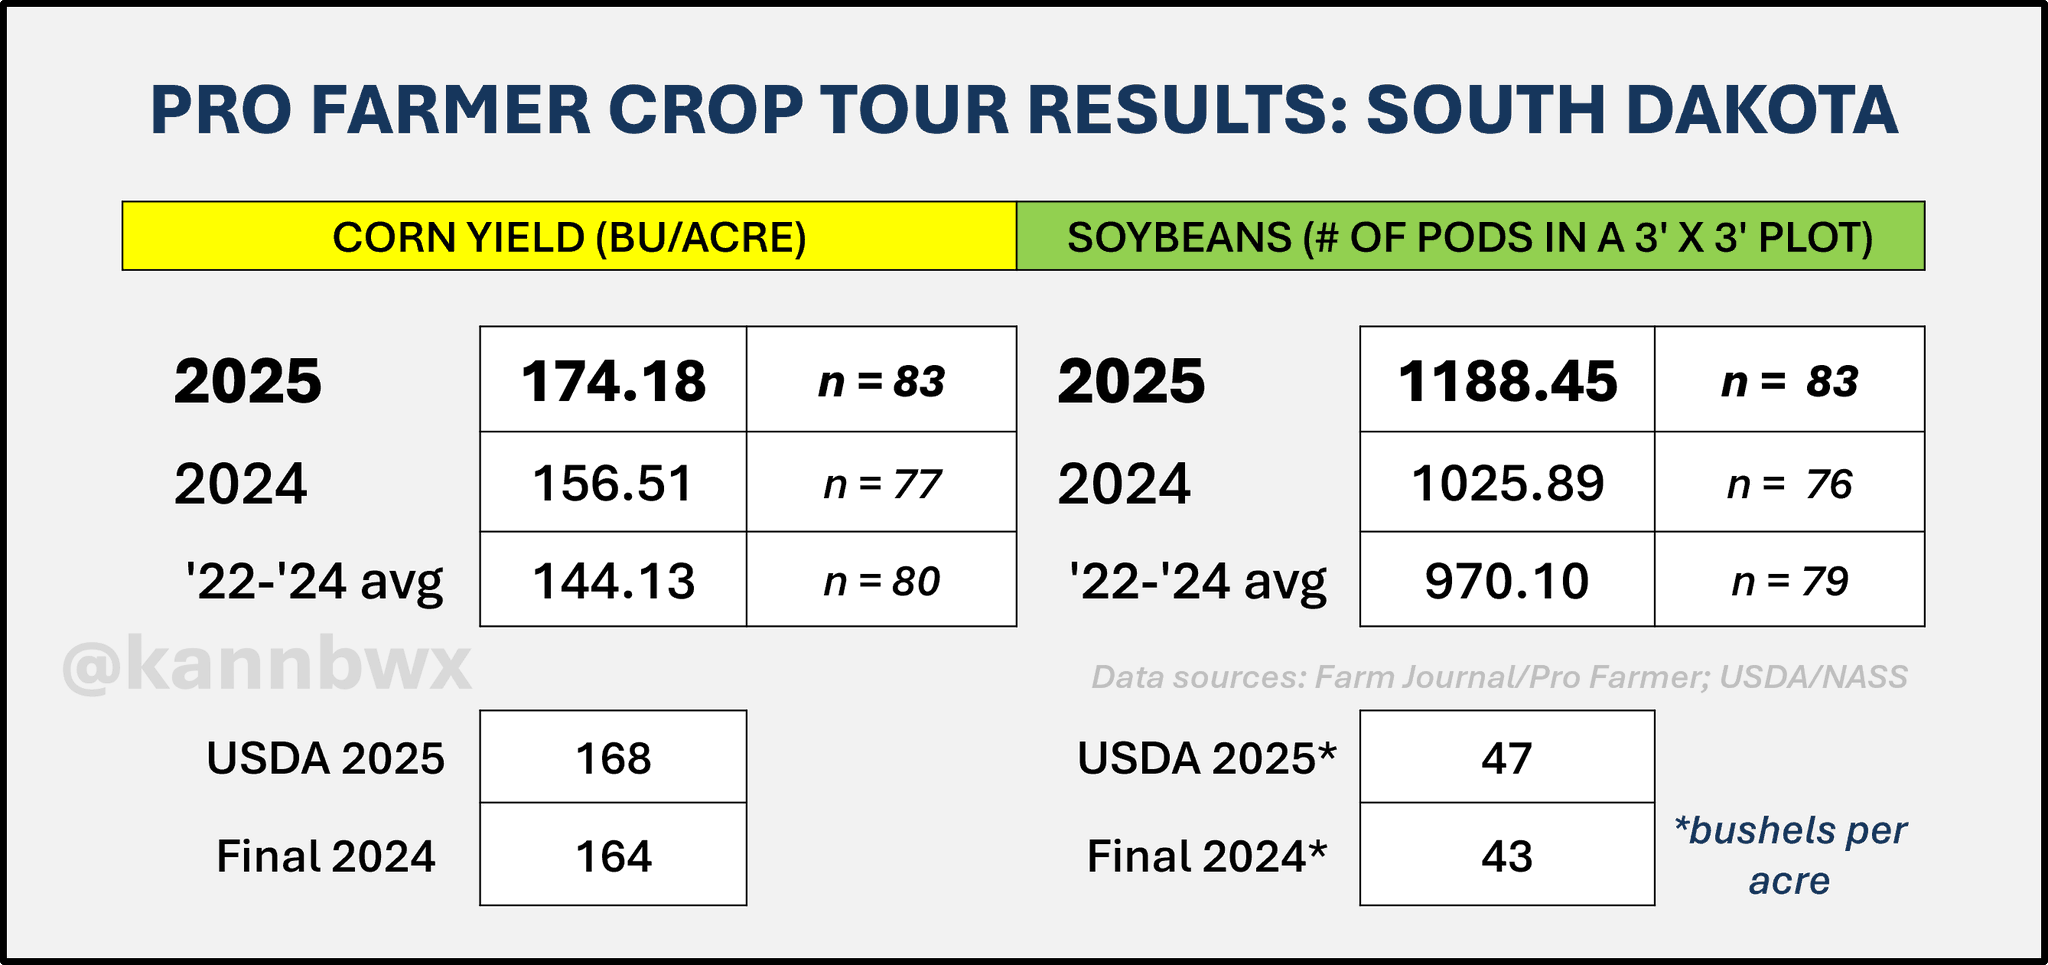
Thoughts for South Dakota are that the the crop looks great.
The tour projects corn yield up +10% vs last year.
(174.18 vs 156.51 last year)
The USDA is only projecting yield to be up +2.4%.
(168 vs 164 last year)
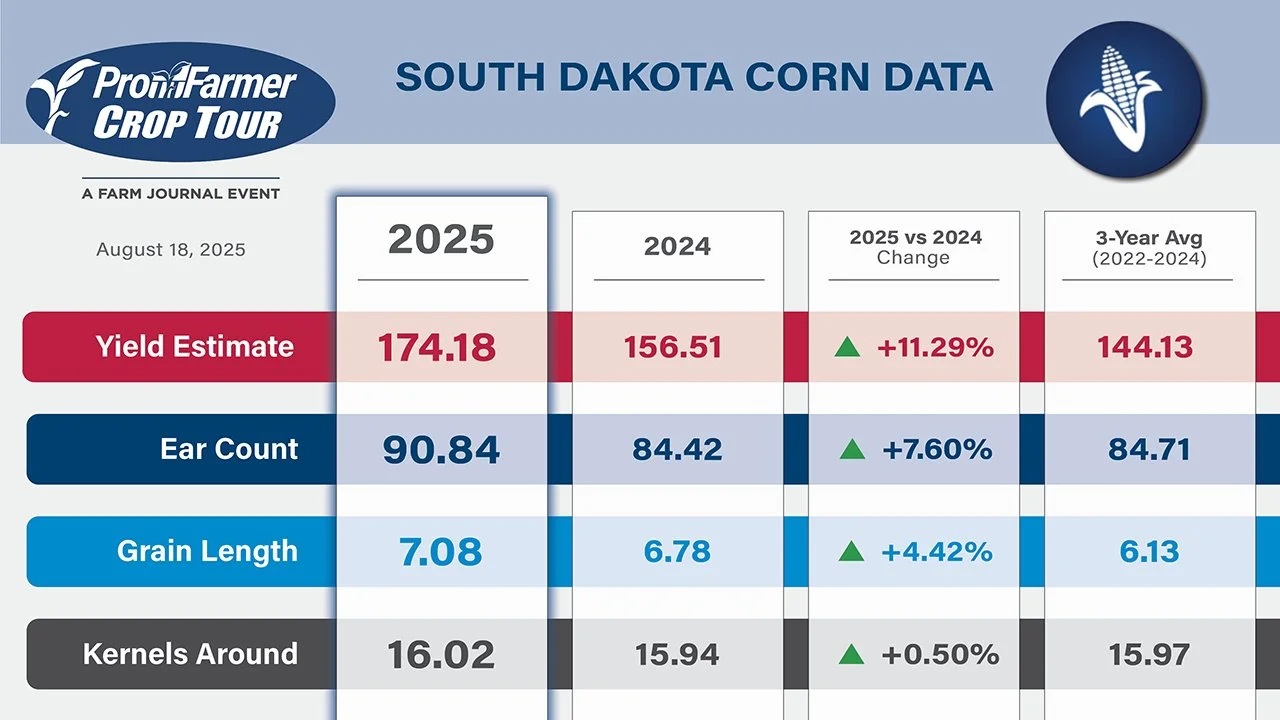
Historically, the tour over estimates the crop for South Dakota by 5.3 bpa.
Which would put the crop at 168.88. Right about in line with the USDA's 168.
So it feels like the USDA is probably right about the South Dakota crops, maybe even slightly light.
The thing about South Dakota is that the tour only included the southeastern part of the state. So if there is issues north or west it wasn’t included here.
Here is a different visual on how Pro Farmer typically compares to the USDA. On average, they are 6 bpa too high vs the USDA.
South Dakota pod counts were up +14% vs last year.
(1,188.45 vs 1,025.89 last year)
The USDA projects yield up about +9%.
(47 vs 43 last year)
So not a major discrepancy.
USDA might be too light, but again this tour only covered part of the state.
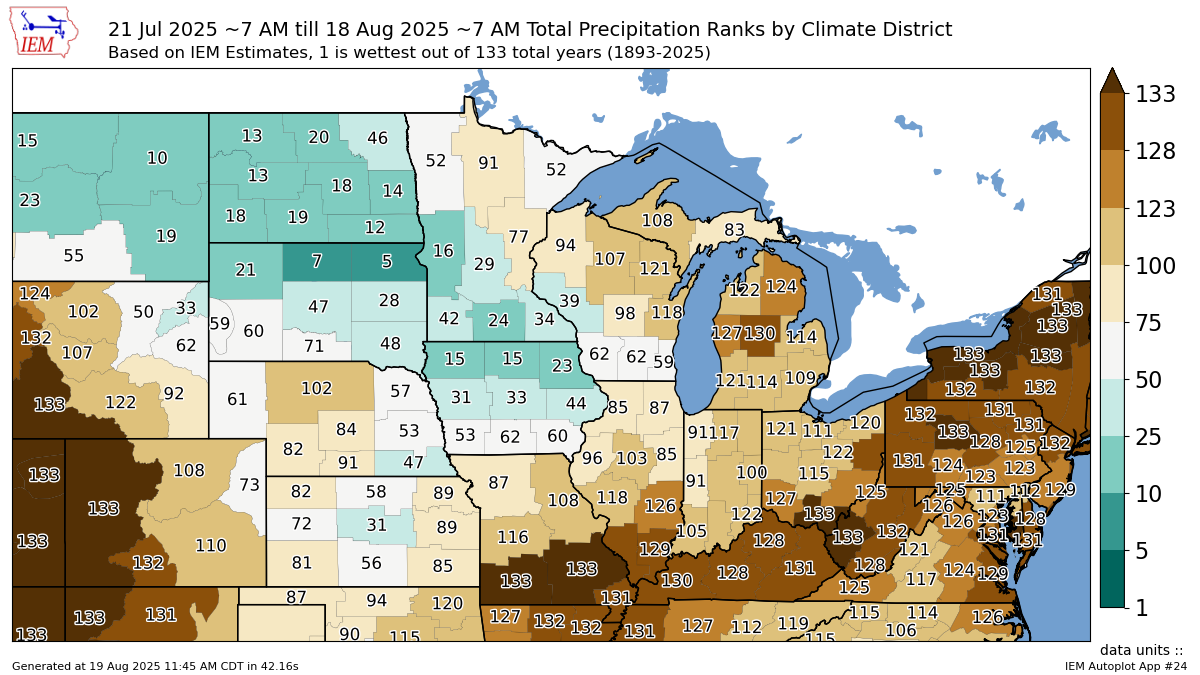
Last 30 Days Precip
If we look at the last 30 days of precip, it has been pretty dry outside of Iowa, South Dakota, and Southern Minnesota.
The southern corn belt just saw one of it's driest stretches on record.
So the USDA being too high on Ohio and some of the eastern/southern corn belt would make sense.
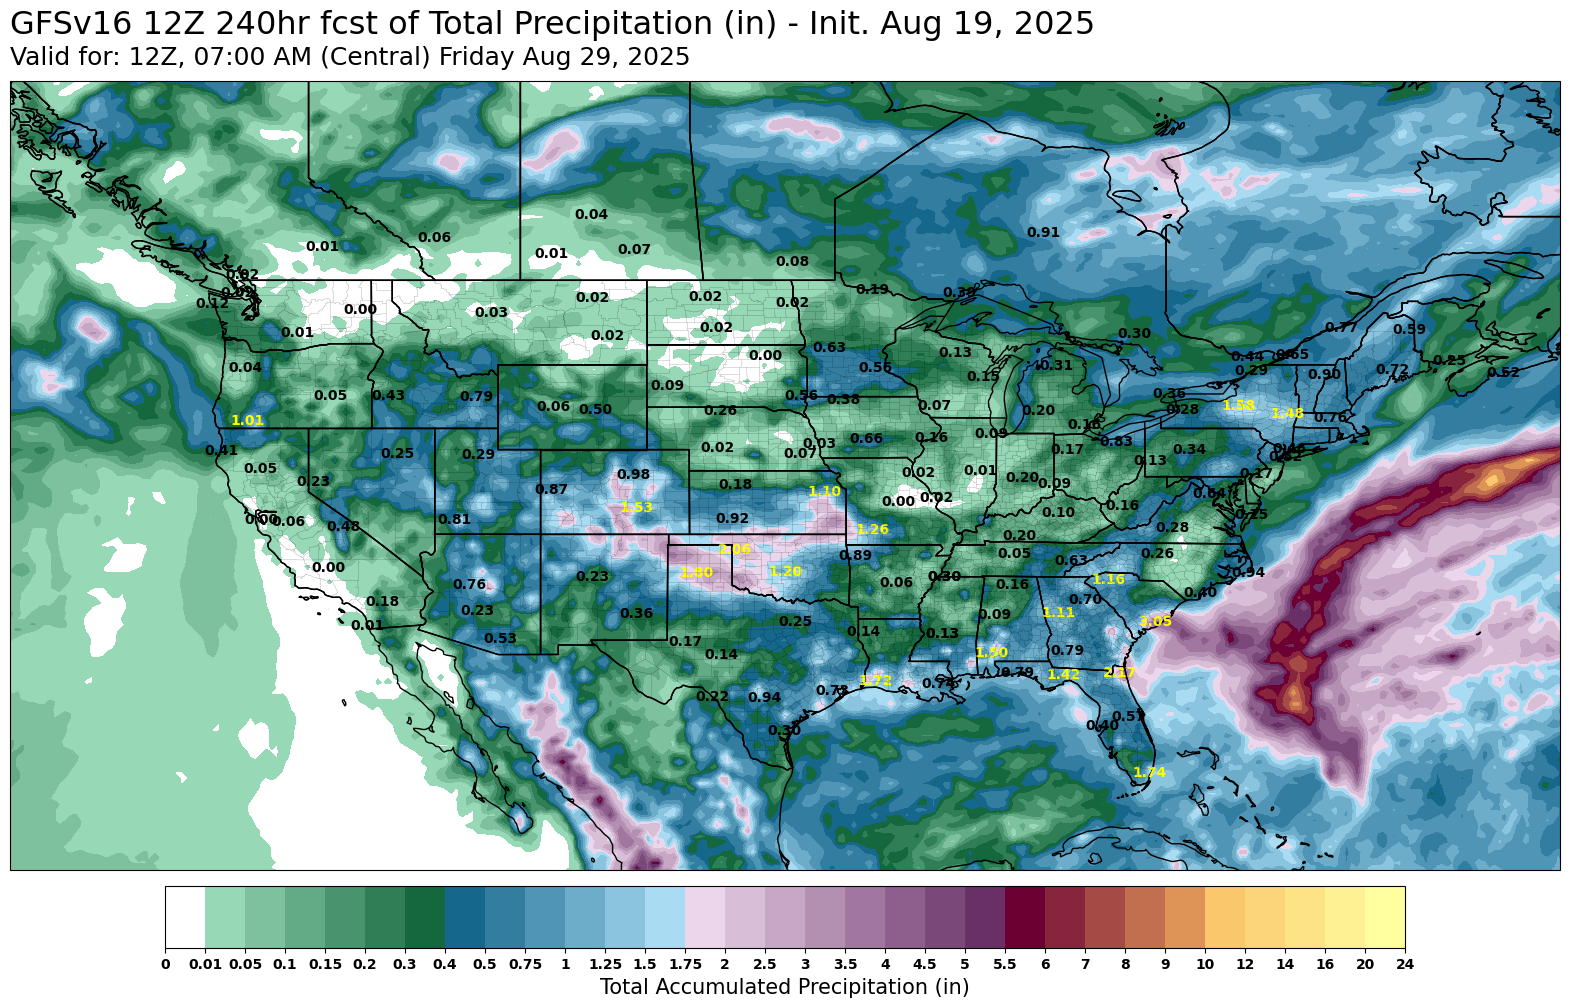
Here is the forecast for the next 10 days.
Nearly the entire corn belt is expected stay really dry.
This crop isn’t completely made yet. Especially soybeans.
Data says that 86% of soybeans will be drier than normal for the next 14 days.
I don’t think that will be adding bushels.
Today's Main Takeaways
Corn
Overall I don’t have a ton to update on corn.
Altough this tour might not have a direct effect on prices this week, it is going to give us some insights as to how much pollination issues this crop has etc.
The recent USDA report shifted things in a big way.
We now have an extra +1 billion bushels of supply to chew on.
Exports are going to have to do the heavy lifting, because the feed and ethanol demand numbers can’t just continue drastically higher and eat into the carryout.
But exports can.
Even with a record US crop.
Even with a massive Brazil crop.
The world still needs corn.
As the global balance sheet is still the tightest in over a decade.
Which makes me think that our export demand isn’t going away.

Yes it sucks right now. This market has sucked for 2 years.
I mean if we look back at corn prices this year, we only spent about 30 days in the top 25% of prices we'd see this year.
We only had a handful of days to hit break even for most. In the dead of winter.
We had sell signals up there but of course we wish we would’ve been aggressive. Hindsight is 2020.

The good thing about a demand driven market is that it can create a rally that lasts. Unlike a supply scare driven due to a summer drought.
Do I think corn has a good chance at seeing a rally here short term? No. Not really.
As fundamentally, it is going to be tough to muster a real opportunity unless the USDA is way off about the size of the crop. Because we have a ton of supply to chew through.
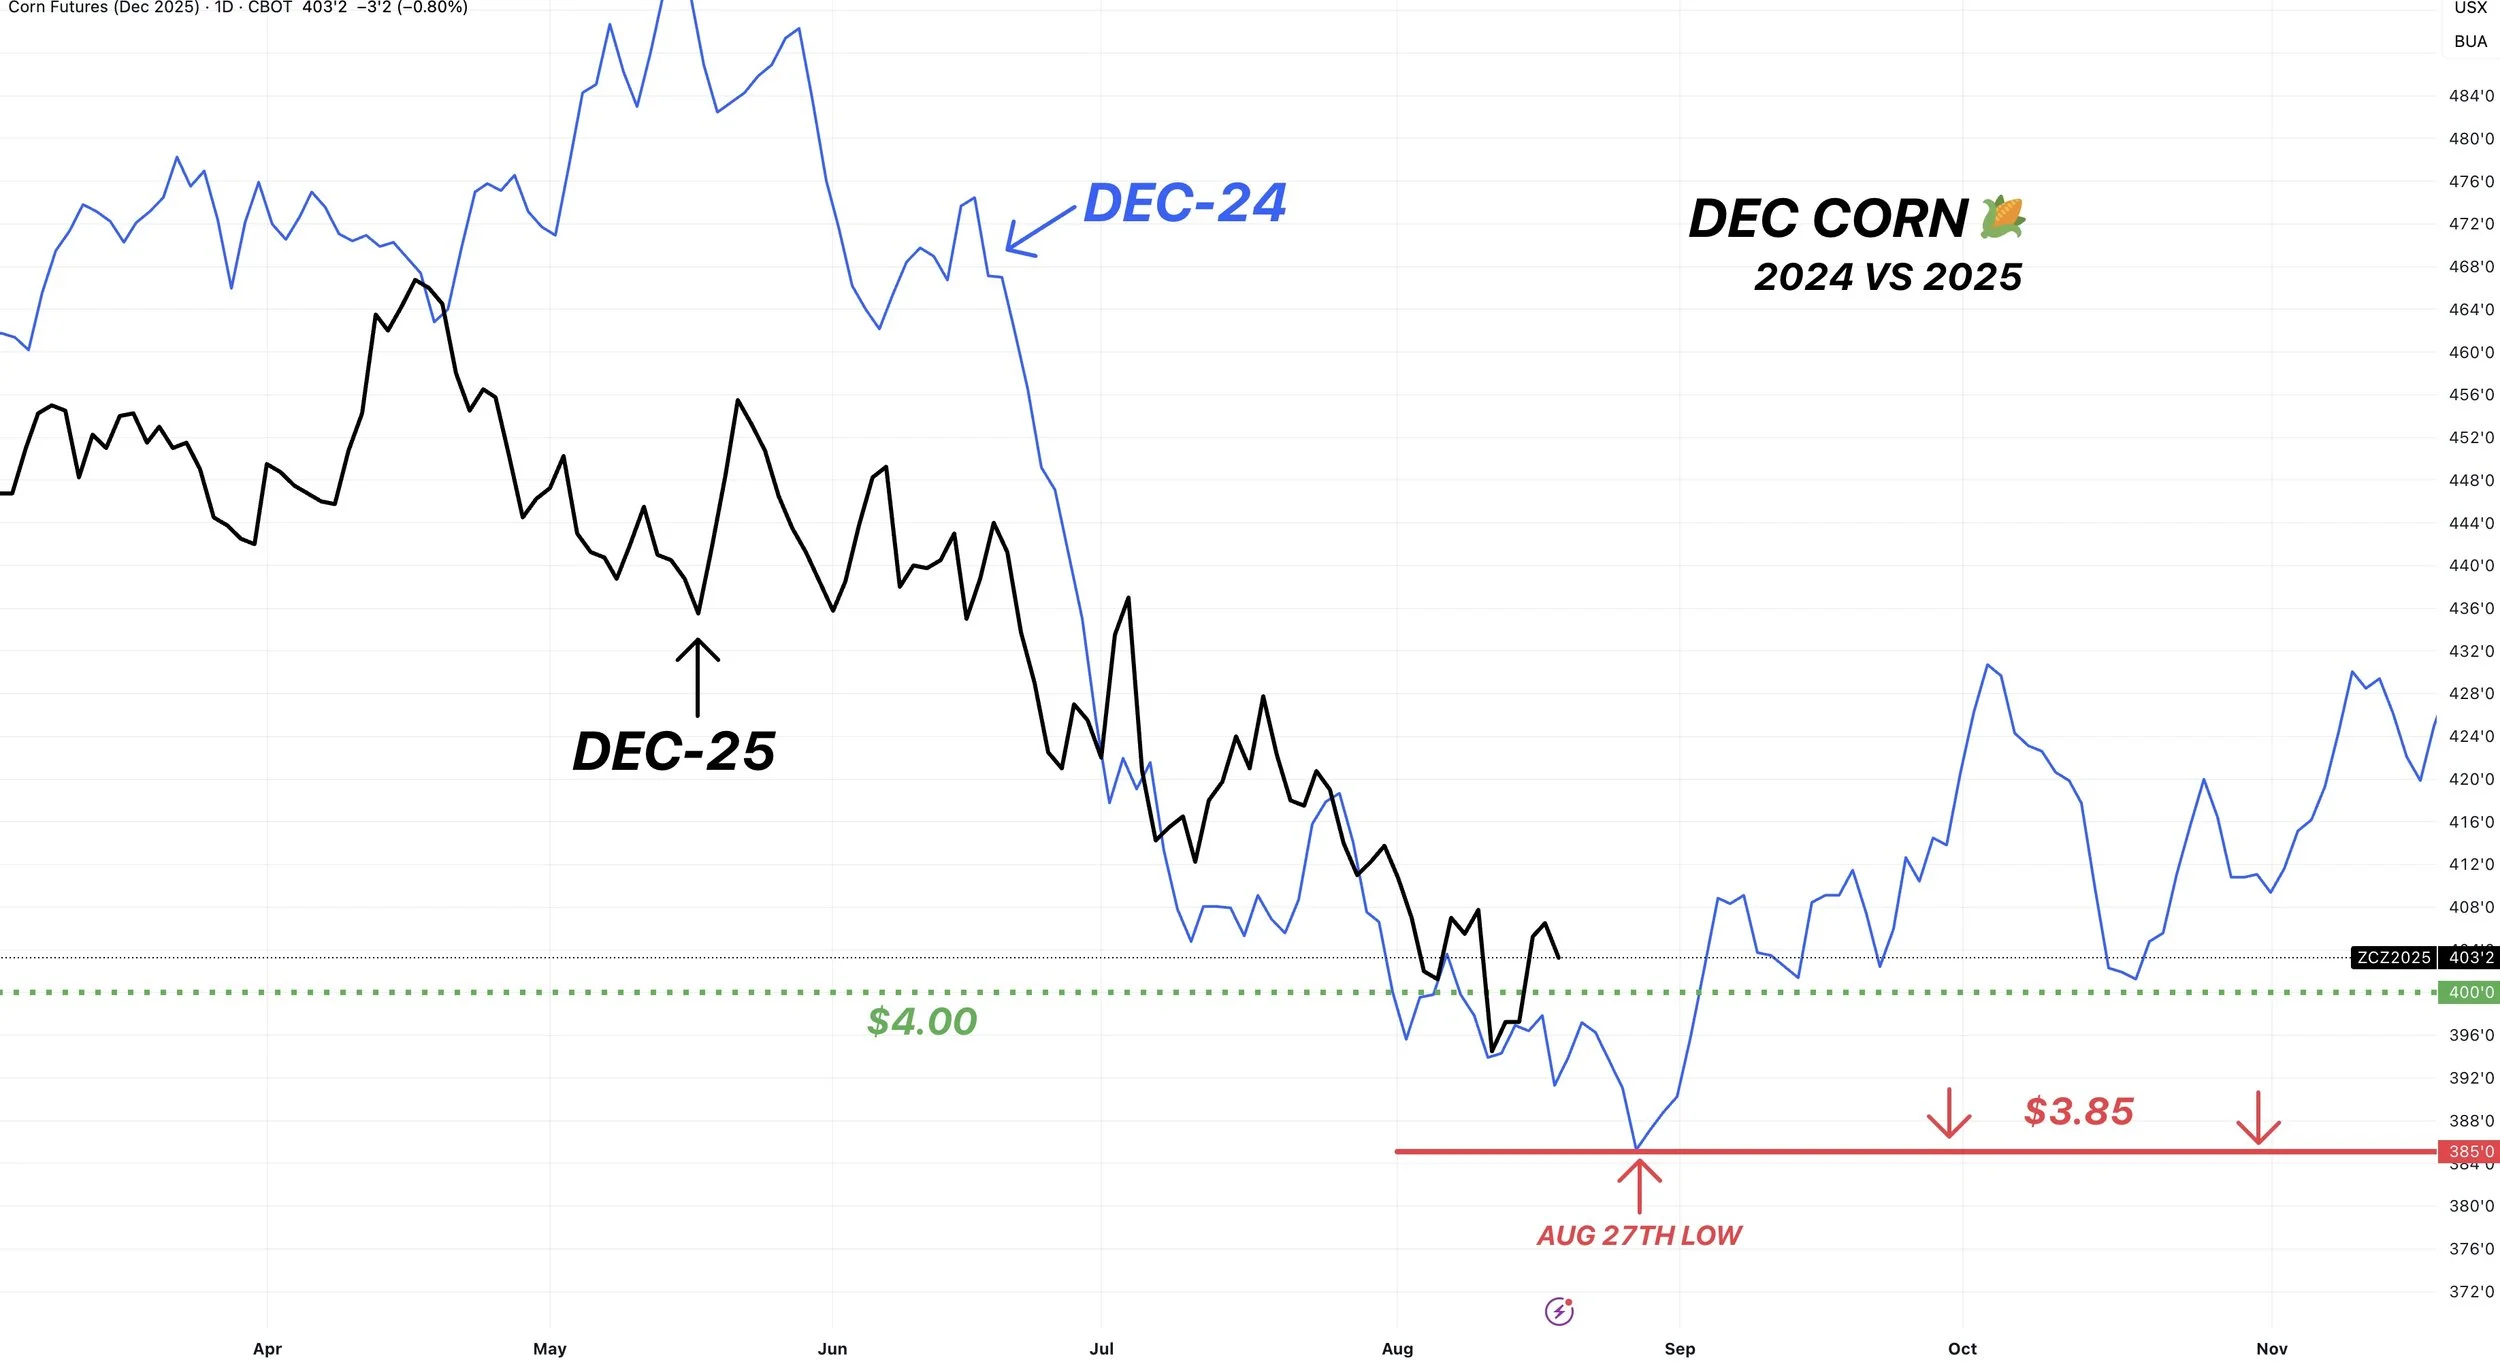
But I also don’t think we need to spend a ton of time below $4.00
Last year we only spend about a month below $4.00 with a balance sheet relatively close to this year.
(Sorry I know I've shown this chart a thousand times)
It doesn’t matter today.
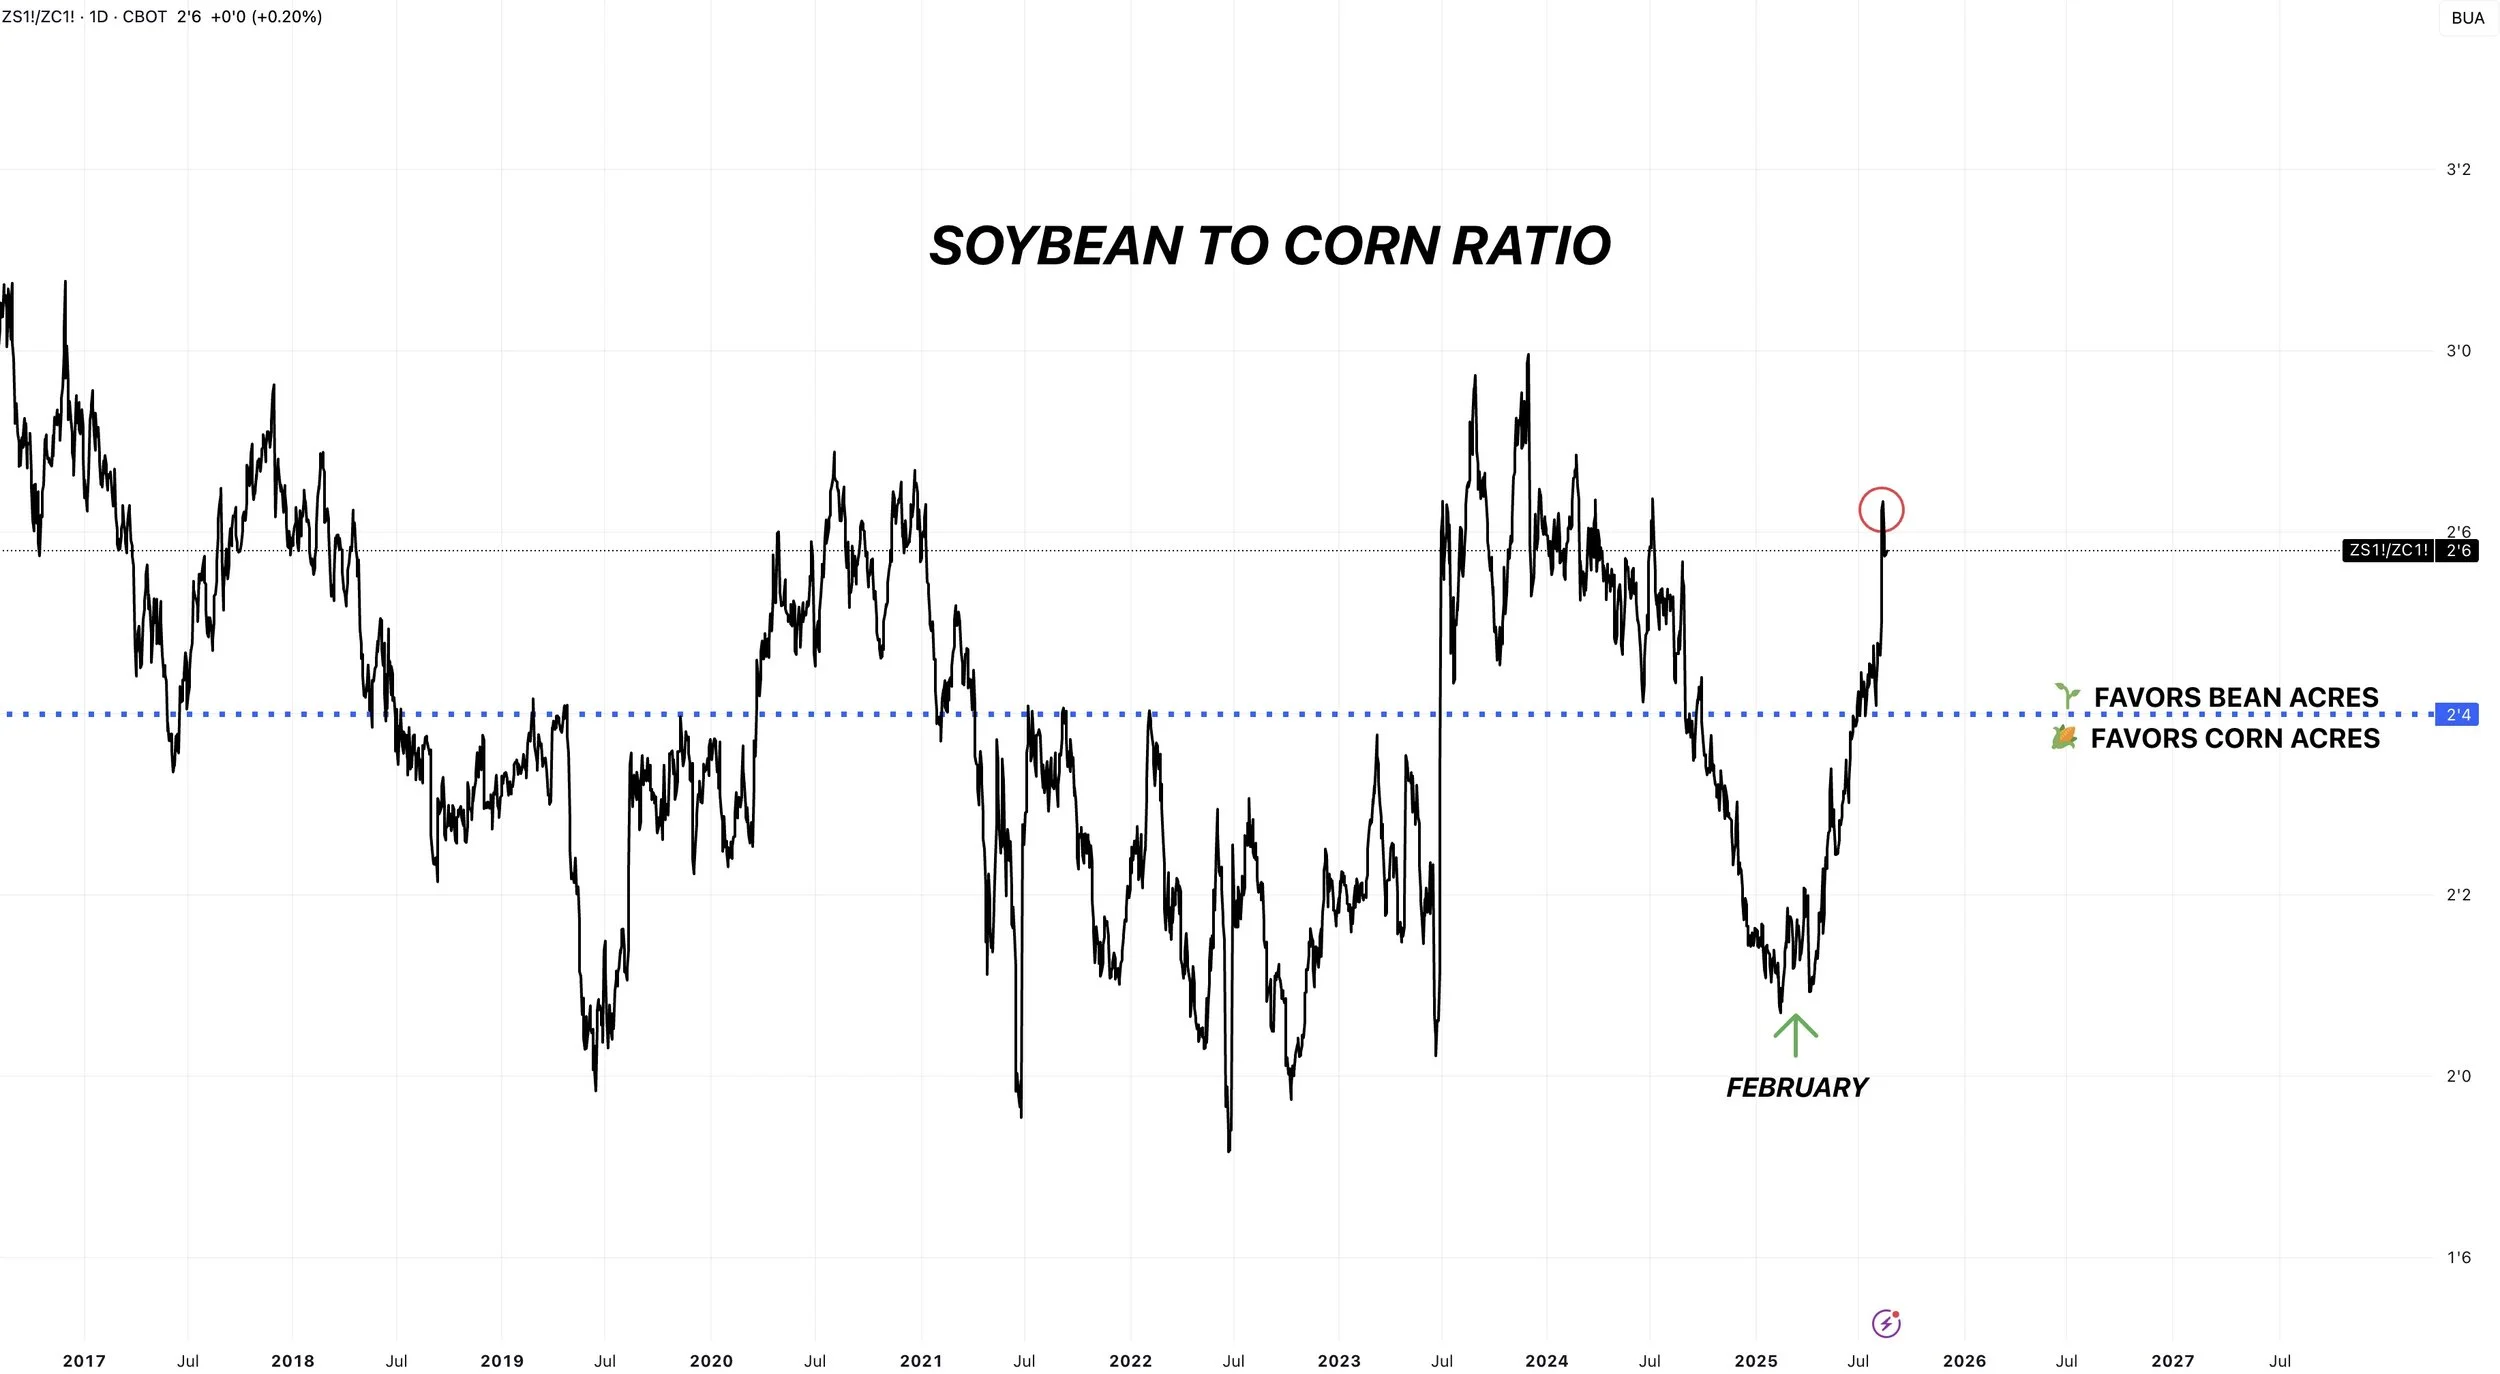
But given just how drastic of shift we've seen in the corn to soybean ratio, we will be looking at much less corn acres next year.
Which could provide opportunities in 2026.
Maybe the bottom is in.
Maybe it's not.
Regardless we aren’t selling corn down here anyways.
I could see us struggling heading into first notice day at the end of the month like we usually do.
That could very well mark our bottom if it's not in.
Whether the bottom is in or takes another few weeks, odds say we will be higher a month from now.
If we stay low though October, insurance payments increase.
It's kind of ironic that we usually rally going into October.
Just look at this 10-year seasonal.

Technicals:
Dec corn sitting at resistance here (green box).
It was old support and new resistance.
We could rally as high as $4.16 and this would still be considered just a technical bounce in a broader correction.
As that is 61.8% of the mid-July highs.
If we break above that, then we could be more confident the bottom is in. But until then, can’t be confident.

Weekly Chart:
All things considered, the corn market has been holding up extremely well.
The USDA just gave us a 189 yield and added +1 billion bushels of supply to the balance sheet.
Yet, today was our first day trading lower since the report. As we nearly erased the entire USDA sell off.
Last week we actually closed higher on the week and left a pretty optimistic dragon fly candle. That with follow up, would look pretty good.

Soybeans
We've went over the fundamentals several times in soybeans, and how friendly of a change the USDA report had.
So today is mostly going to be the charts.
But first, let's look at the funds.
Going into the USDA report, they were getting short soybeans.
That new short position quickly become underwater.
They were big buyers last week and covered half their short position.

On this recent soybean rally, do you know what also rallied?
The meal market.
The funds are holding a MASSIVE record short position in meal.
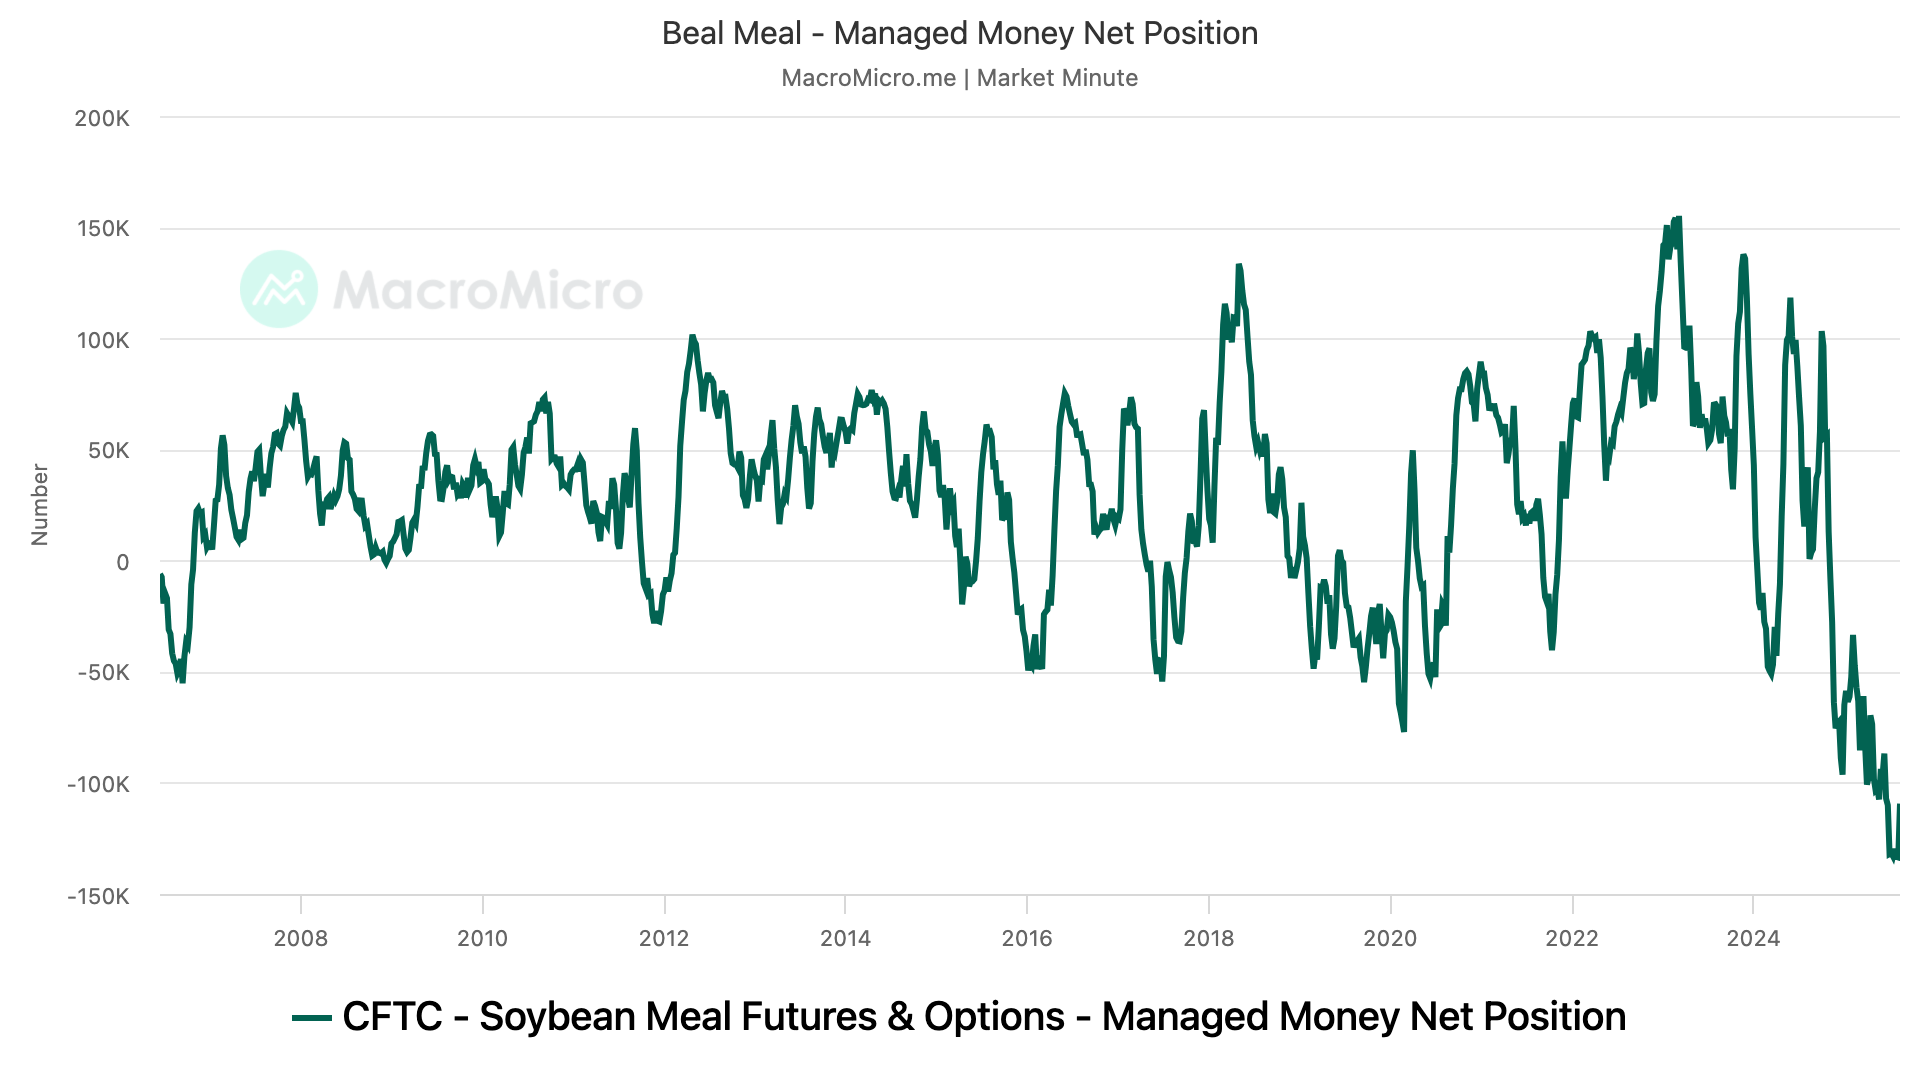
Here is another visual of their meal position and just how large of a short this is.
Like soybeans, they were decent buyers last week.

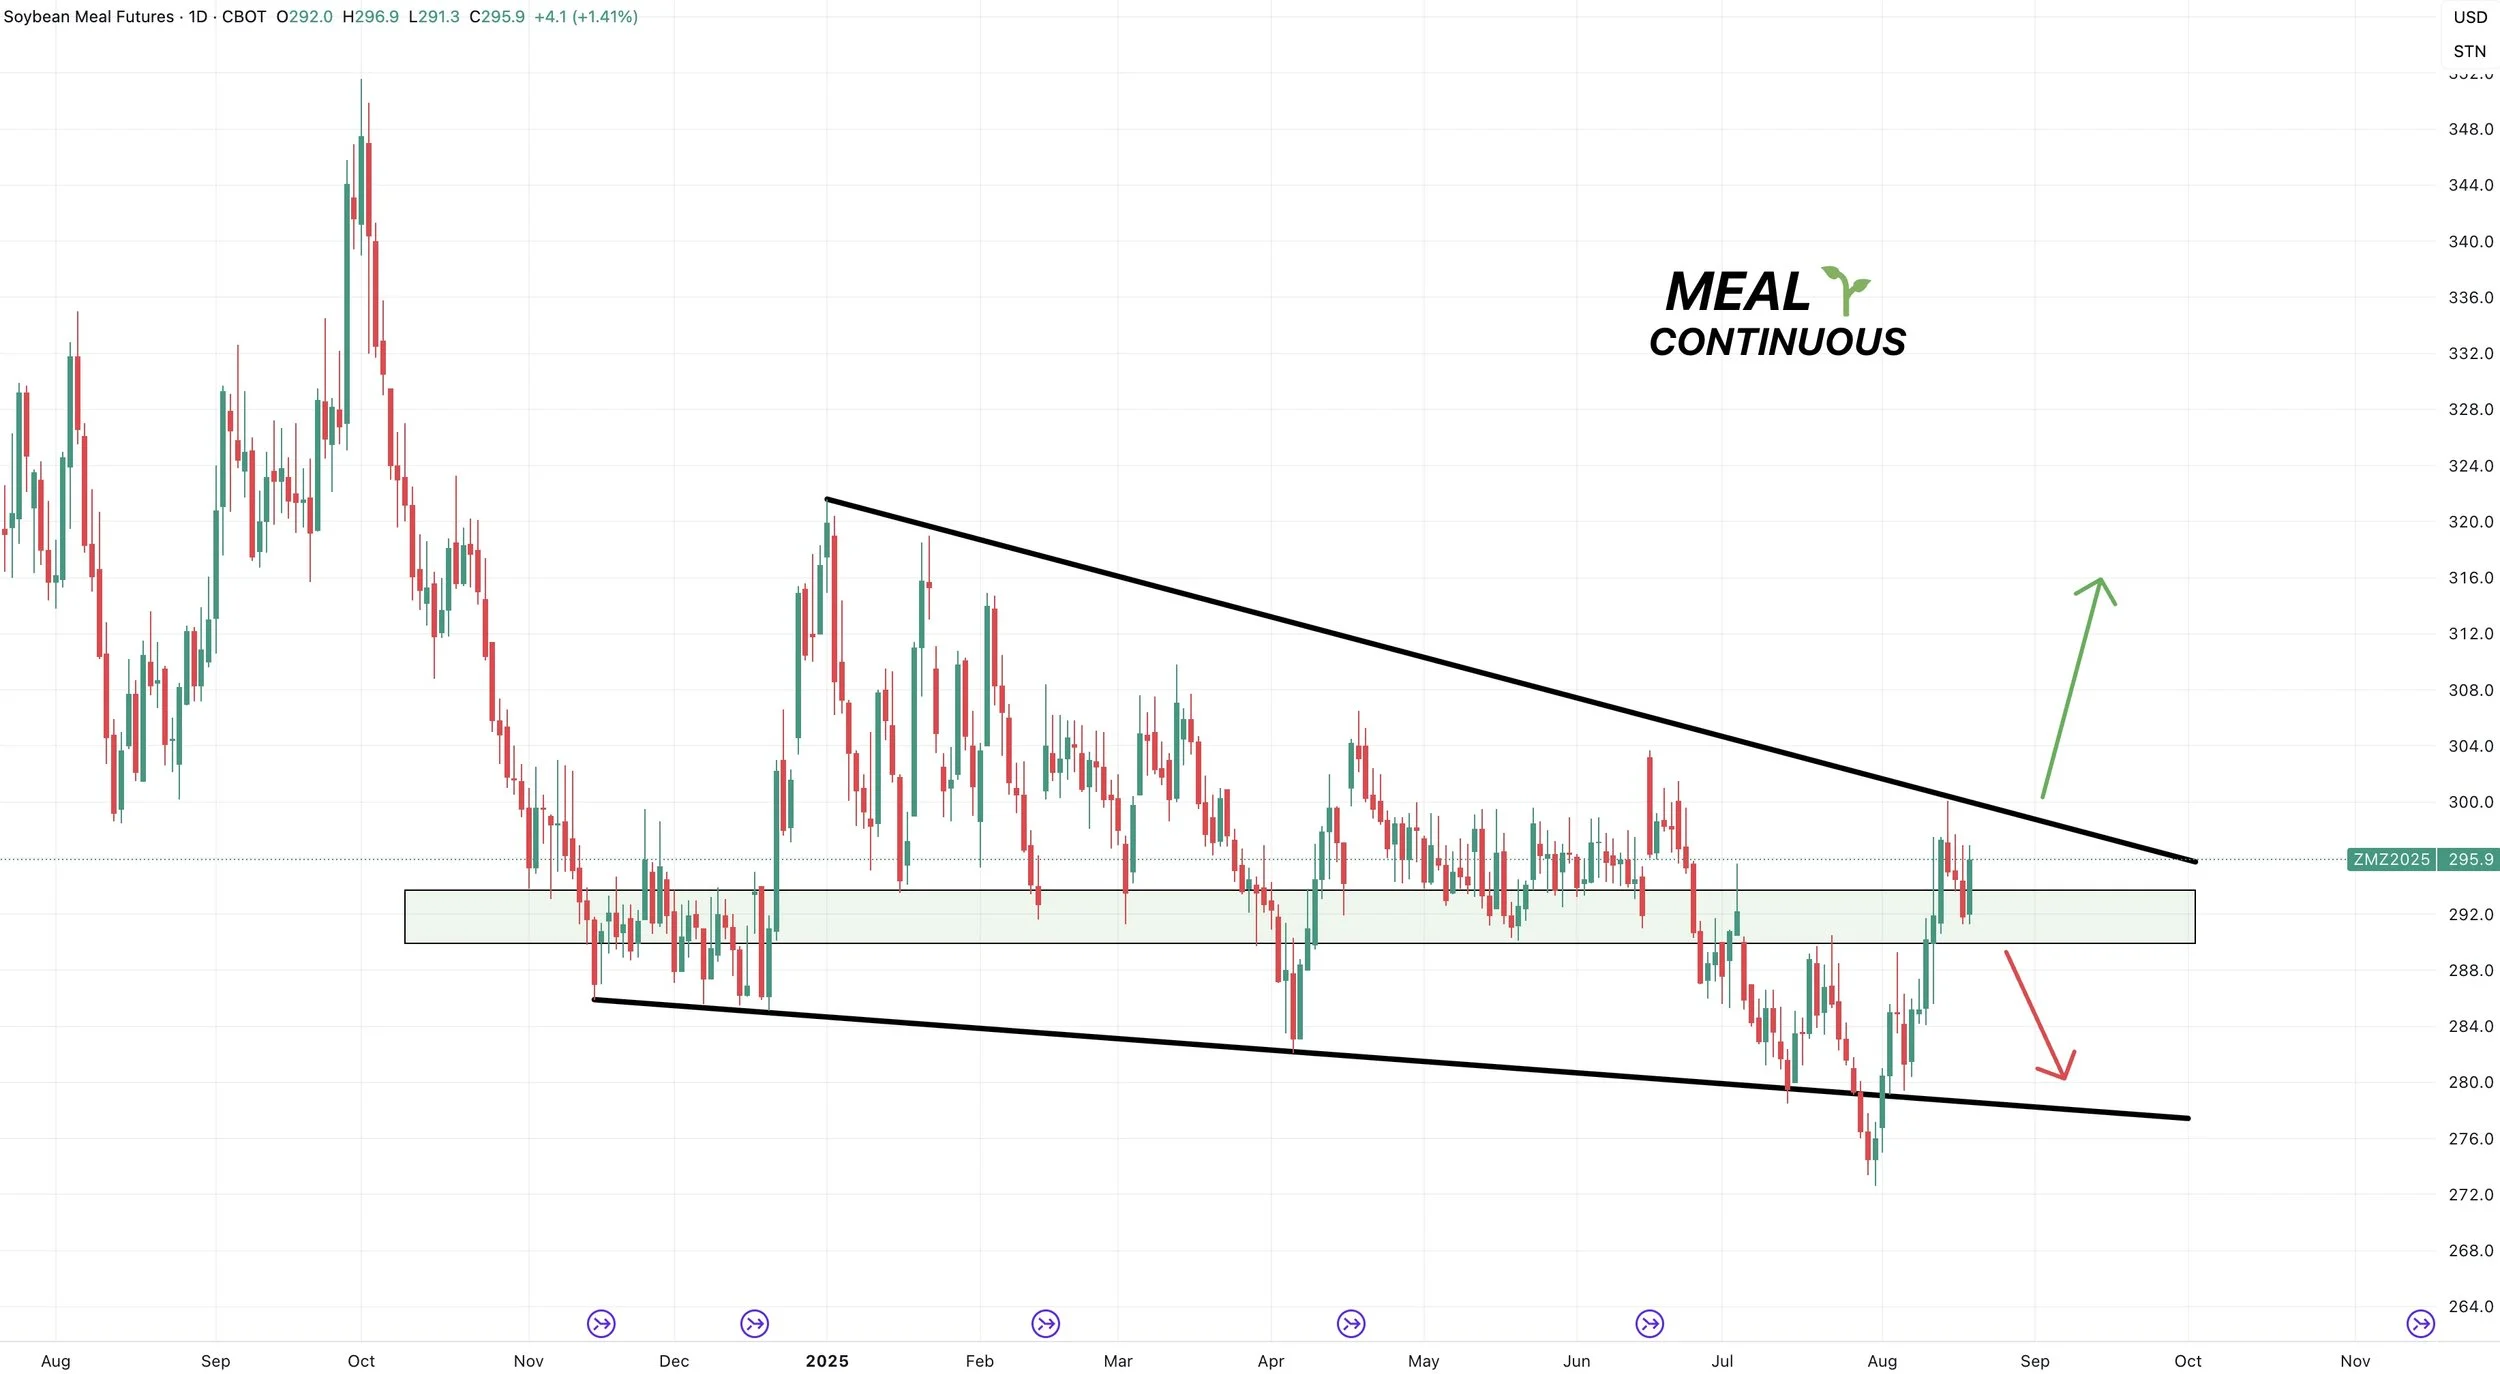
Looking at the meal chart (continuous), if we break that downtrend it might just give the funds a reason to cover.
Which would help support the bean market.
On the other hand, if we fail to hold this green box we might go test the bottom of the support.
So that is the two areas we are watching to see what unfolds.
For Dec meal, we are at a key spot.
Not only if this is this a key support & resisitance area.
We also clawed back 61.8% of the sell off from June.
If we can get a break above this level, it should spark more upside.

Technicals:
I do not mind making some small sales here.
But I am personally waiting to alert a full blown sell signal as $10.30-40 soybeans aren’t all that appealing and I think we could see additional upside.
However, if you know you are going to have to move something soon or at harvest, I do really like keeping a floor for downside protection.
Call us if you need help or have questions: (605)295-3100
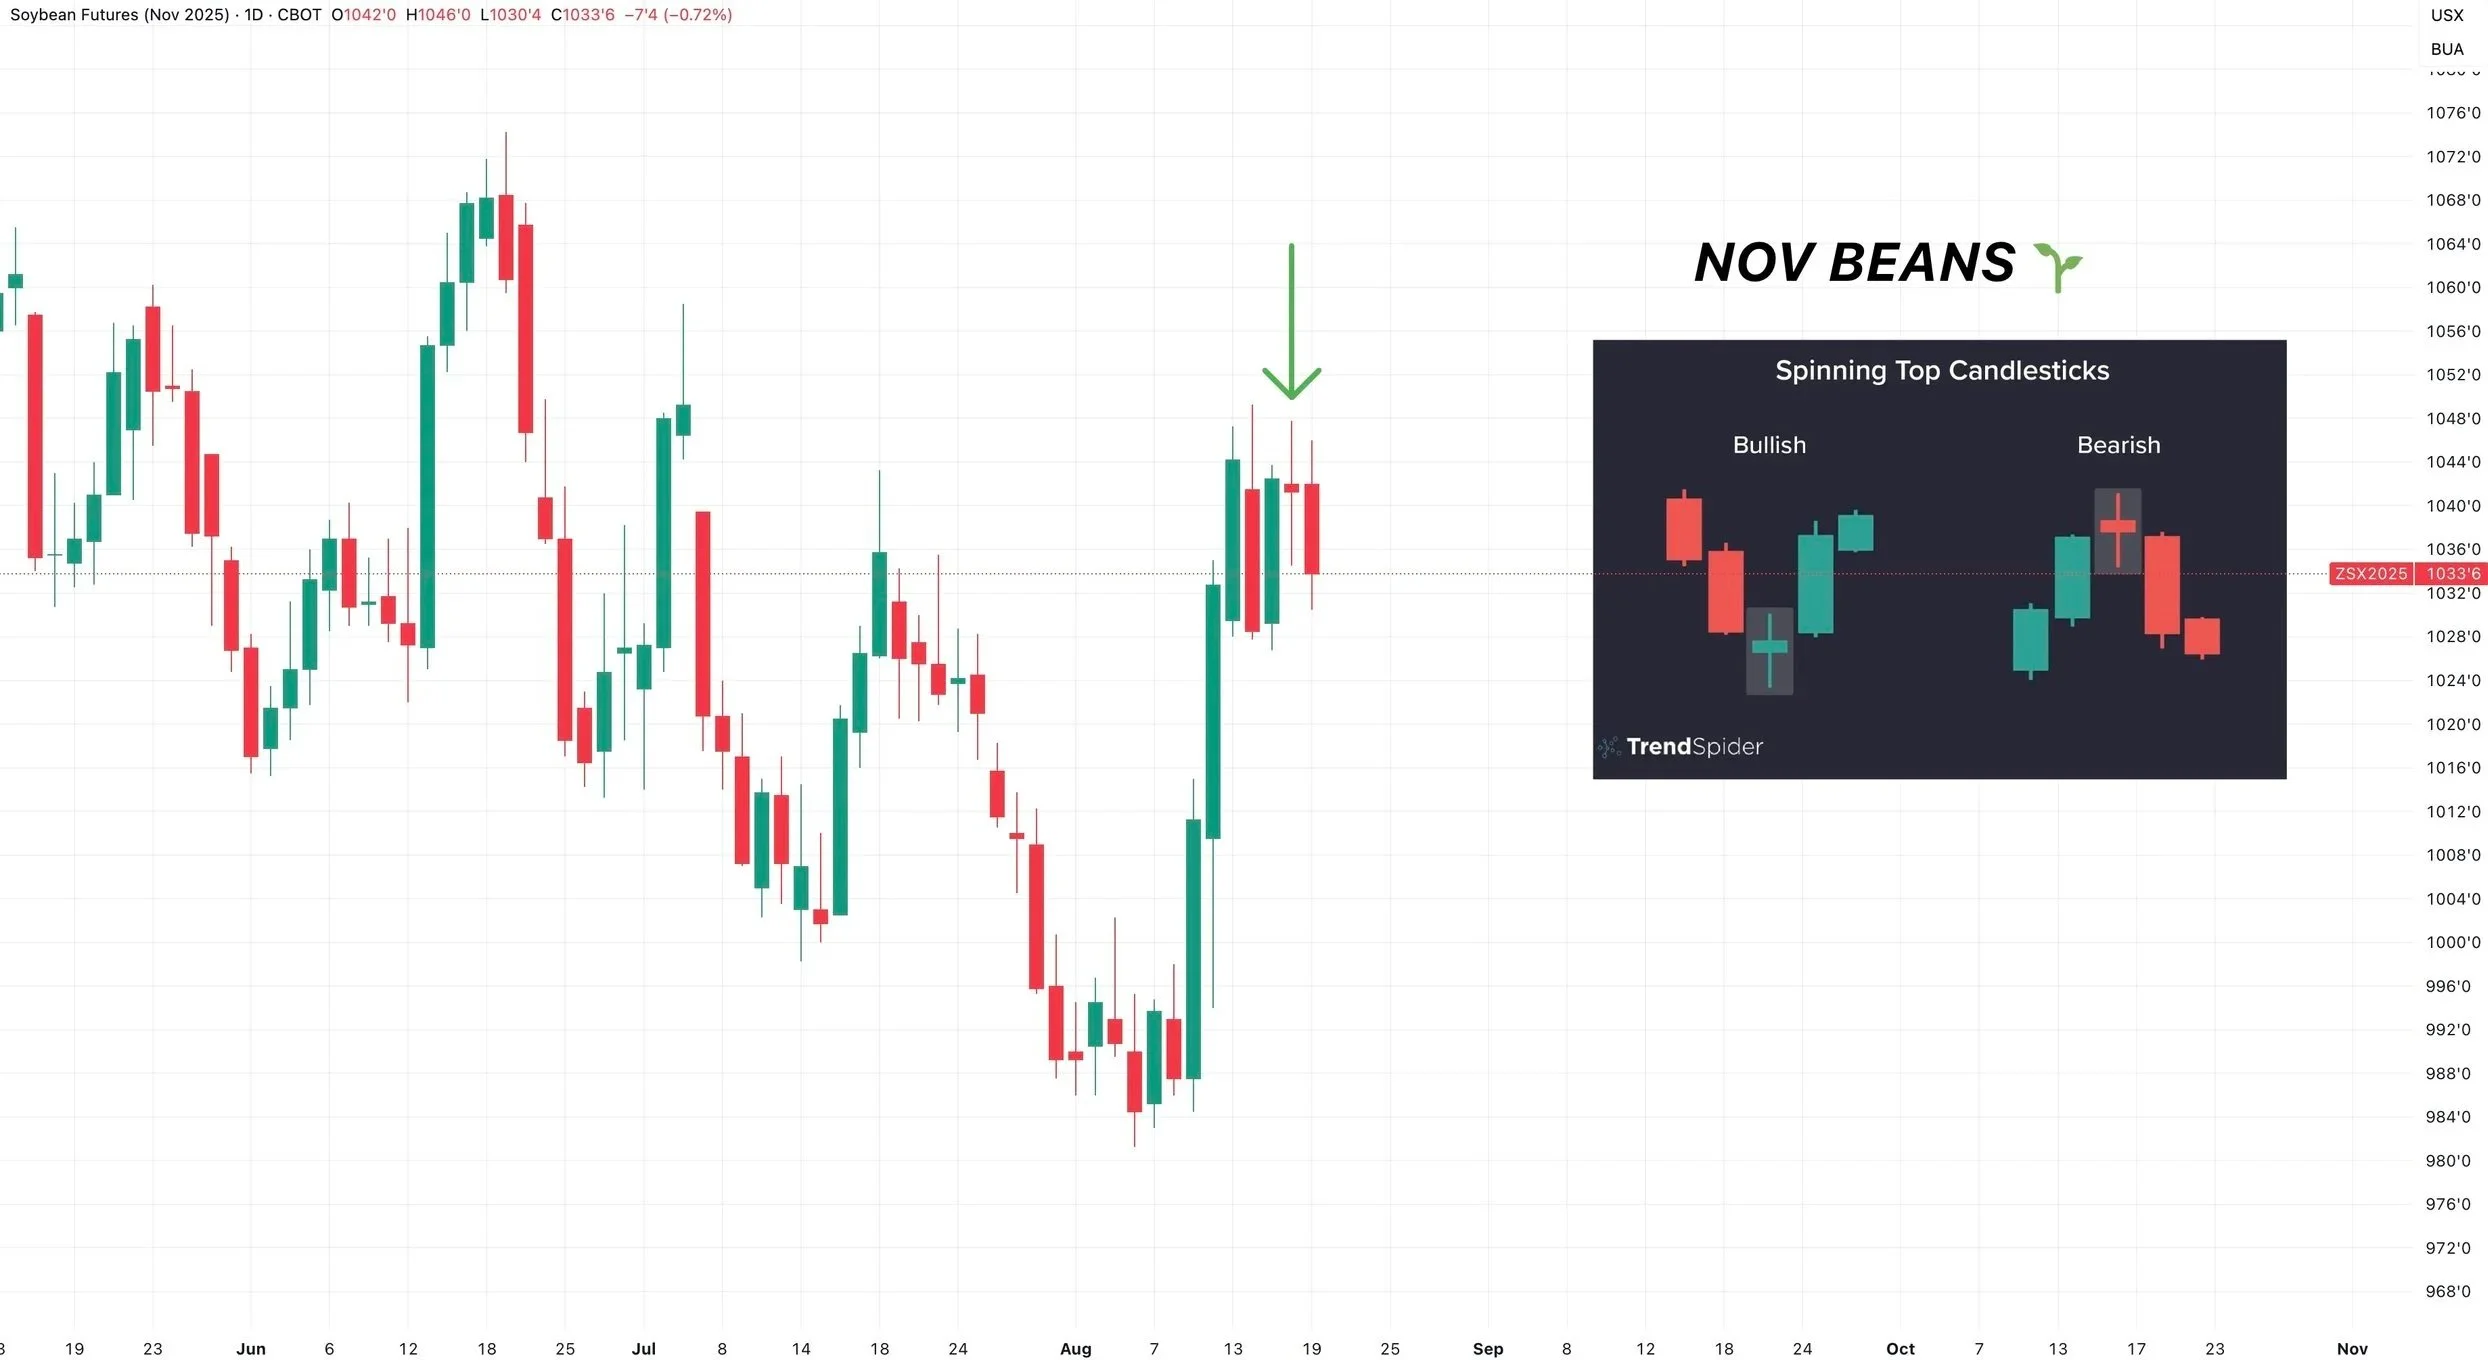
Short term I do see some reasons to be cautious here.
We left a spinning top candle yesterday, and followed it with a red candle today.
It typically leads to a pullback when it happens at the top of a range, and a bounce at the bottom of a range.
After a +60 cent rally, a pullback shouldn’t come as a shock.
The most common pullback pattern is an "ABC" pullback.
We get the intial A wave down.
Then the B wave bounce.
Then the last C wave lower.
Looking at the 4 hour chart. We could very well be seeing this unfold right now. As we got that intial flush and bounce.

Now on the other hand, we have a potential bull flag pattern in place.
Which is bullish if it plays out.
The 38.2% retracement of the pole at $10.23 is usually considered the ideal retracement. Which lines up with the bottom of the flag. If you exceed the 50% level at $10.15, then the set up becomes invalid.
So overall, even though I am cautious here short term, and would not be surprised to see a pullback.
My bias still leans higher, medium, and long term.
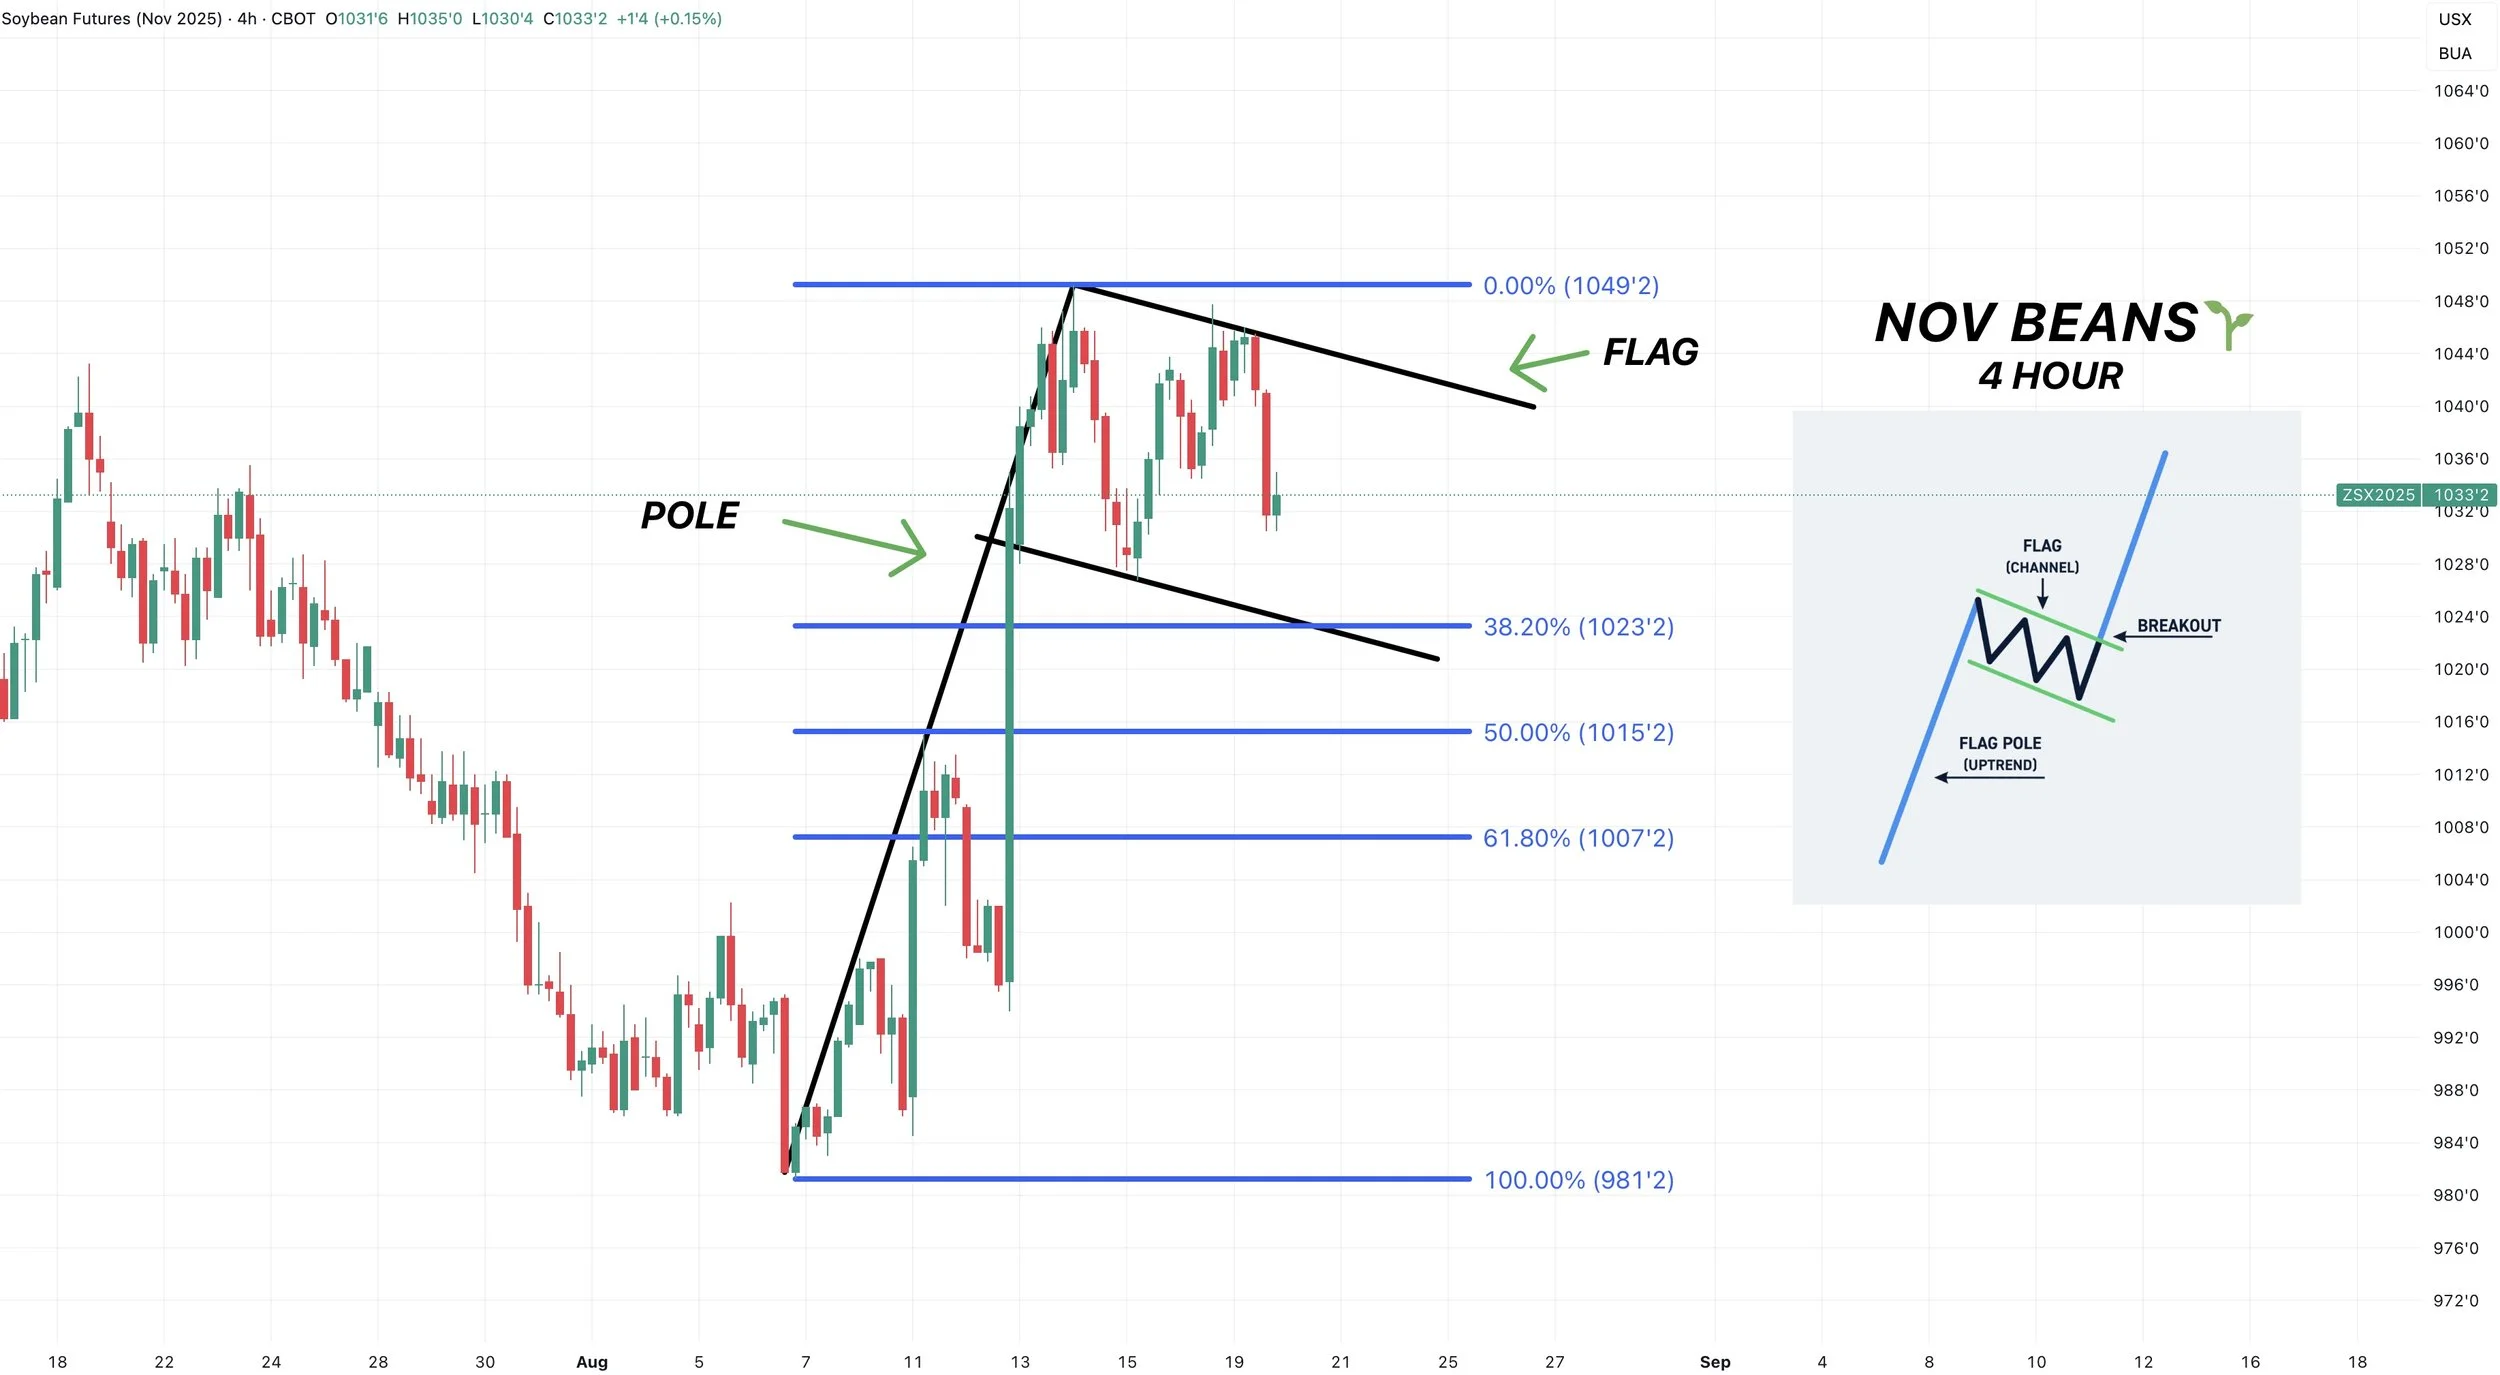
If we do get a pullback, as long as we hold $10.07 to $10.15 I have zero concerns with the chart and my bias remains higher.
This box would be a standard 50-61.8% pullback.
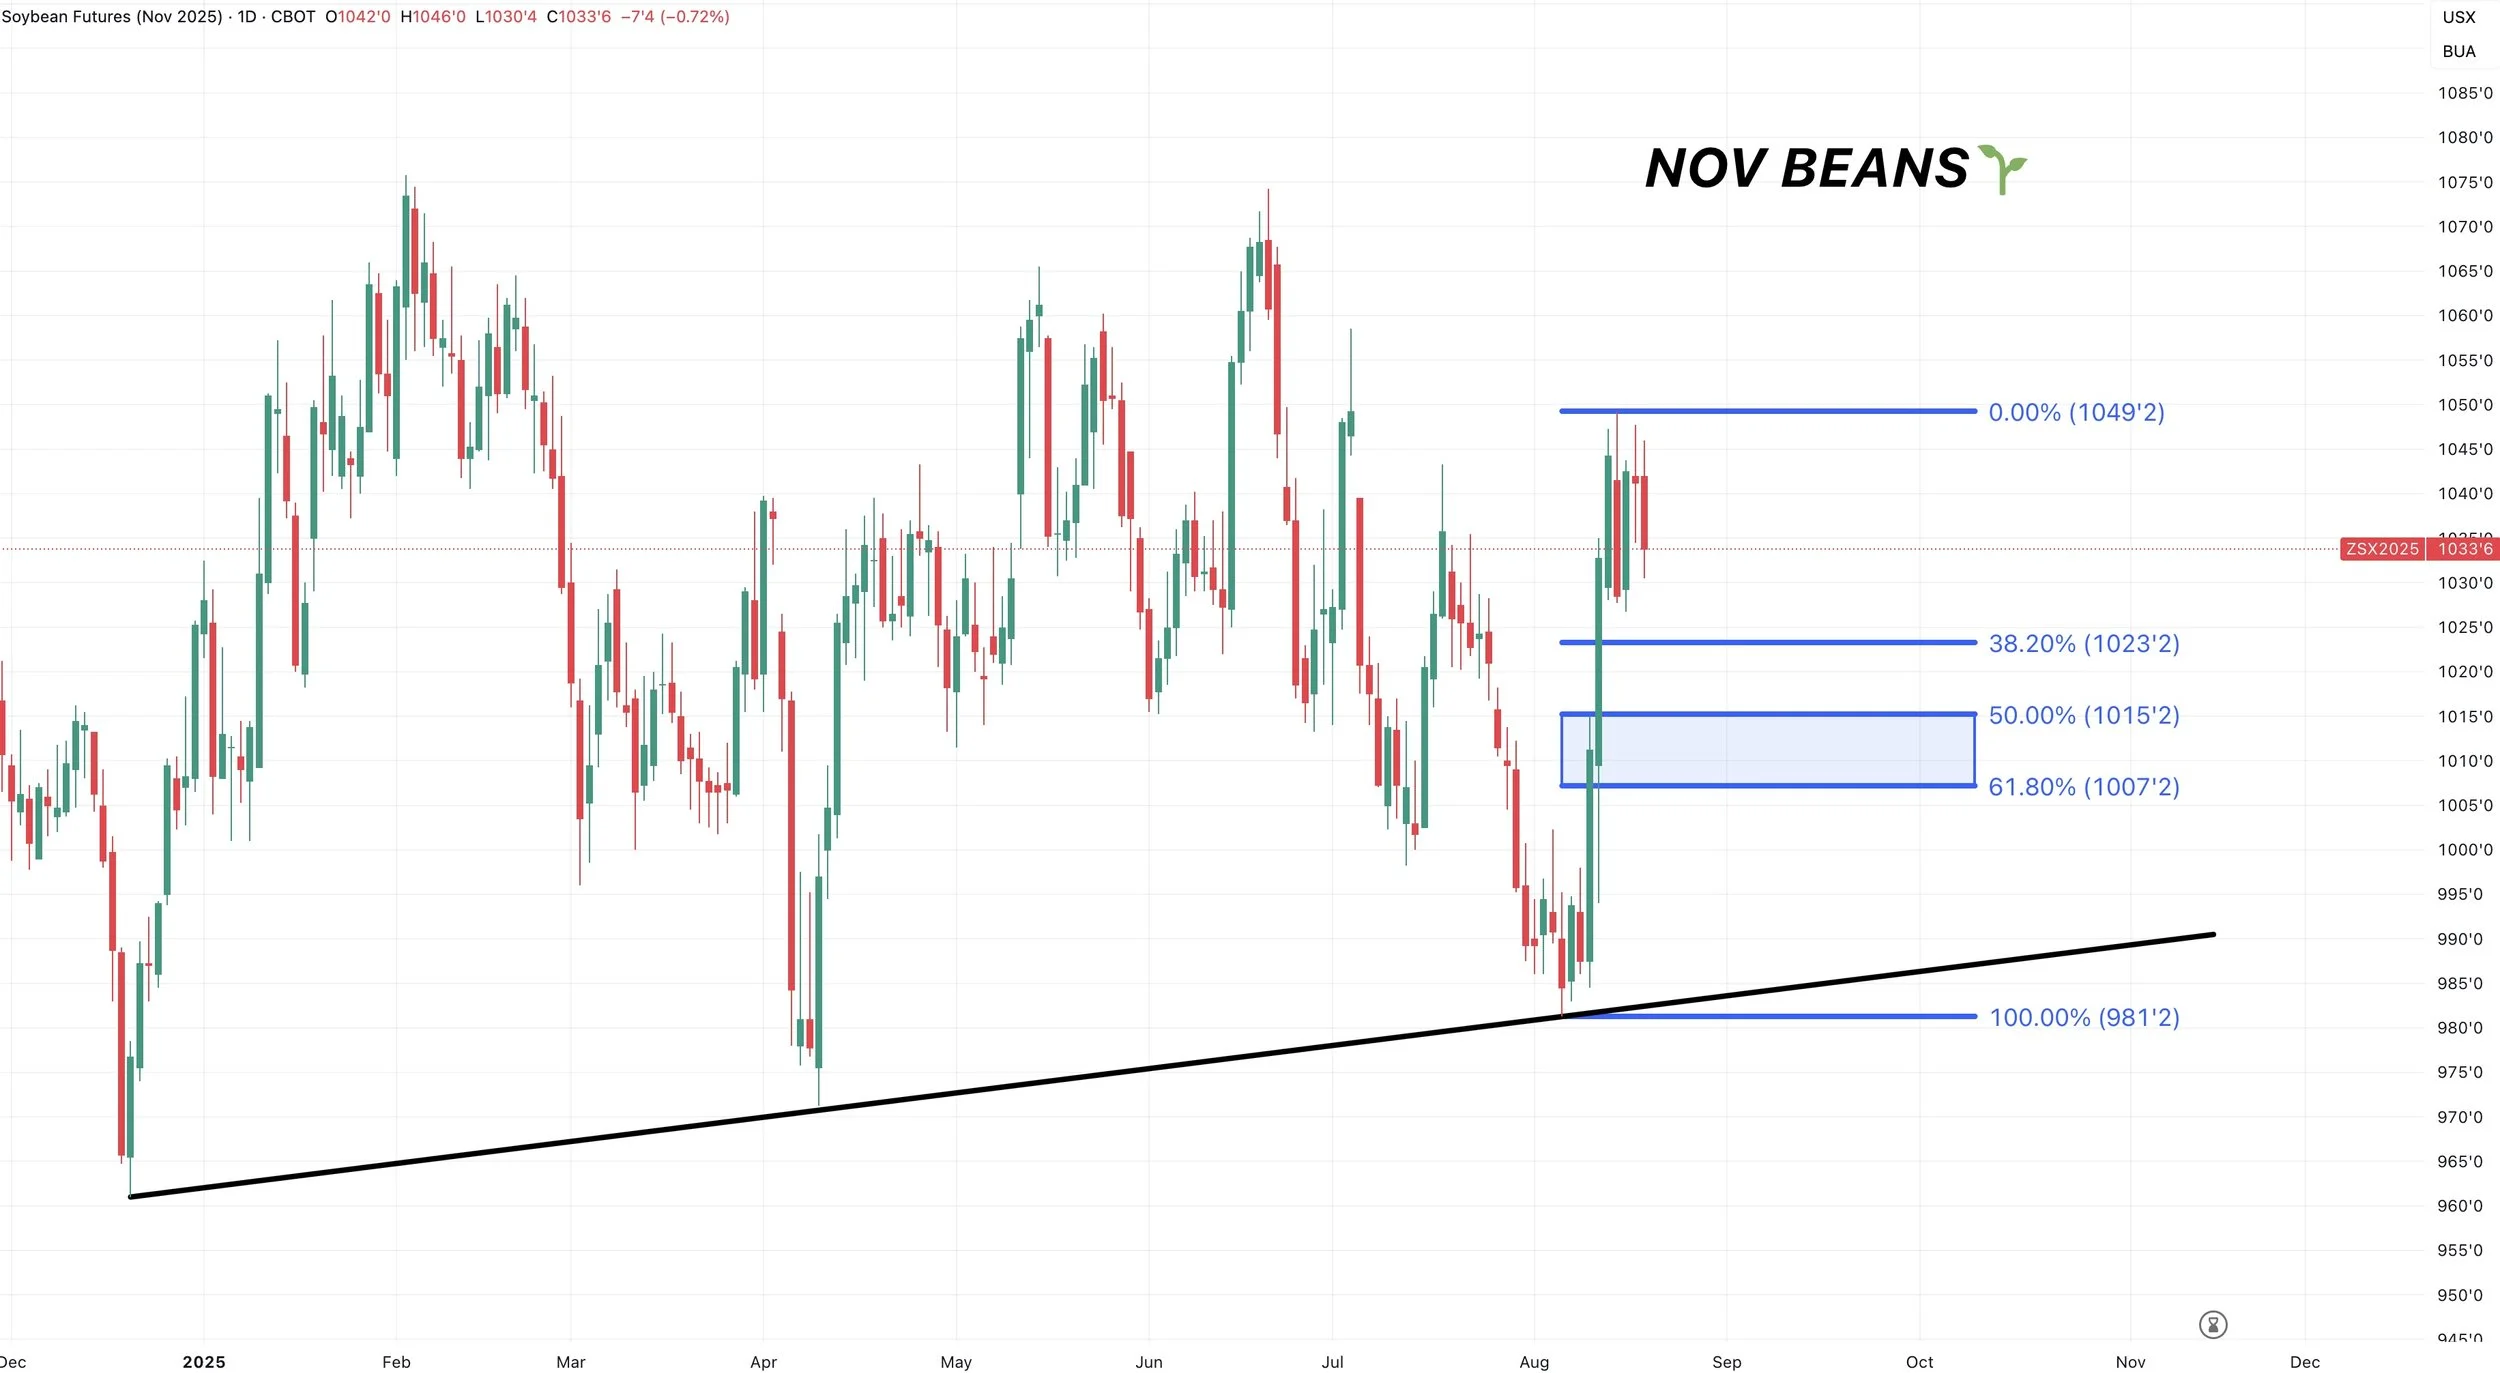
Now the level to watch to the upside is going to be those recent $10.49 highs.
Which is the 61.8% retracement up to the Sep 2024 highs.
If we bust above, I think we have room to run to $10.65 to $10.70.
That is where I will be looking to de-risk.
That is the 78.6% retracement up to the harvest highs last year.
That is exactly where we saw two major tops this year.

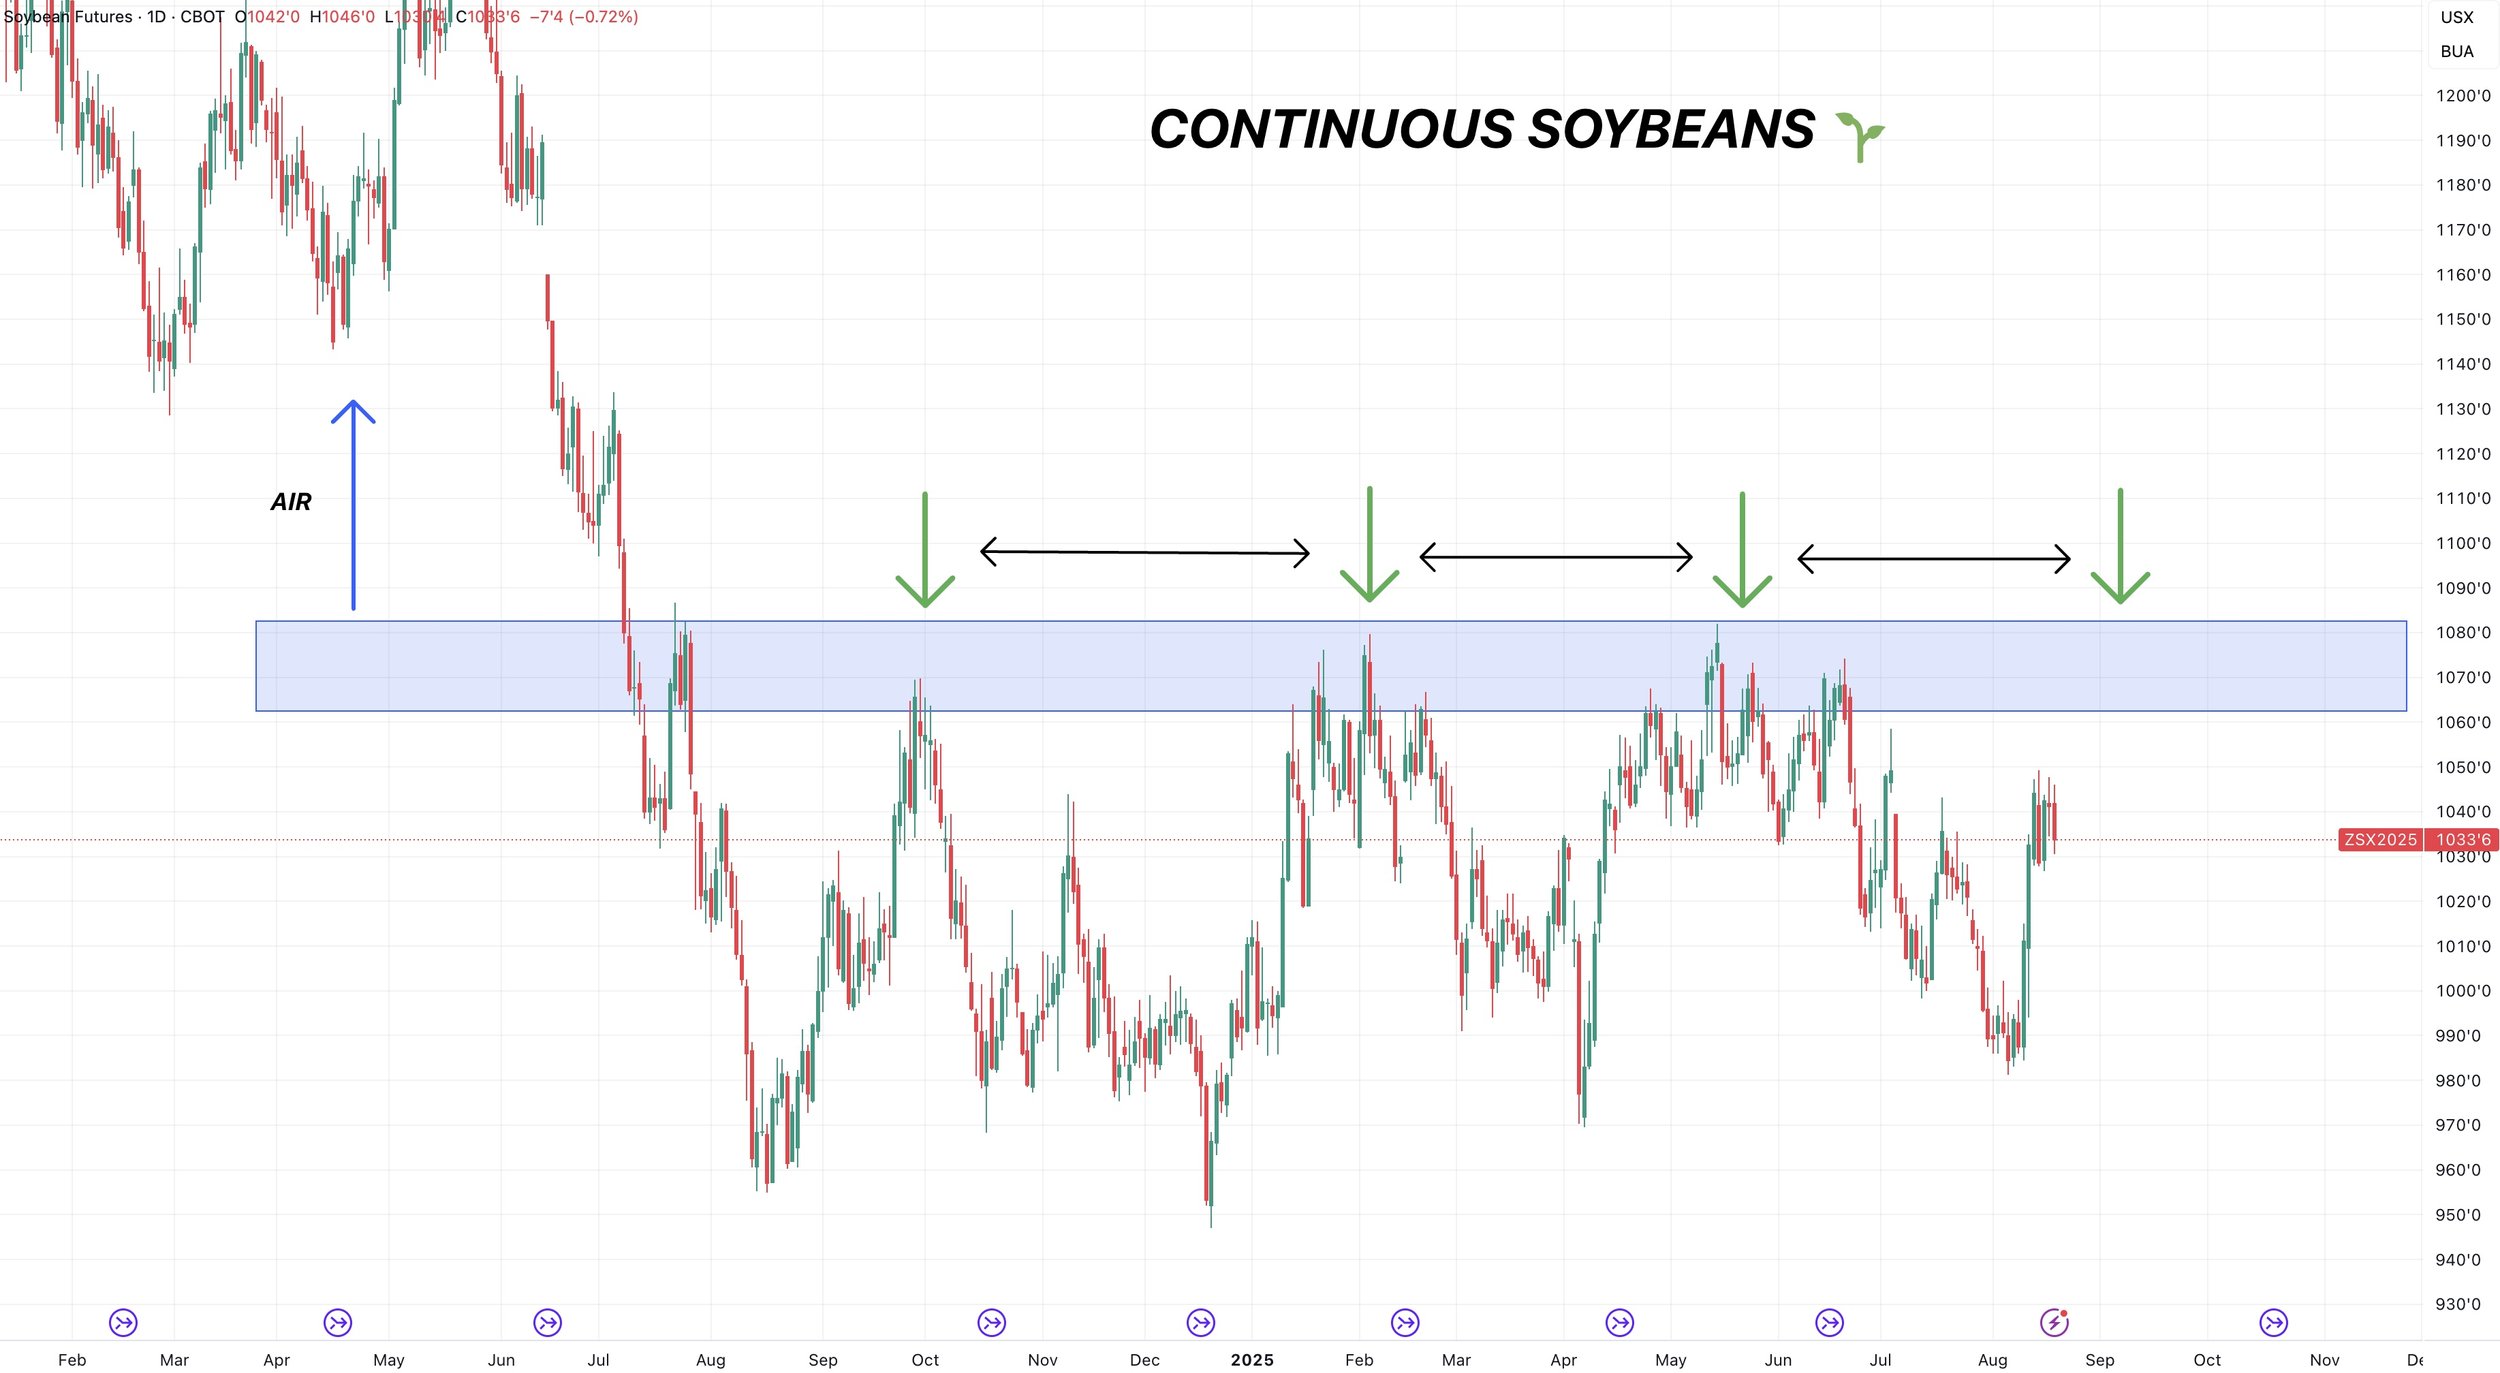
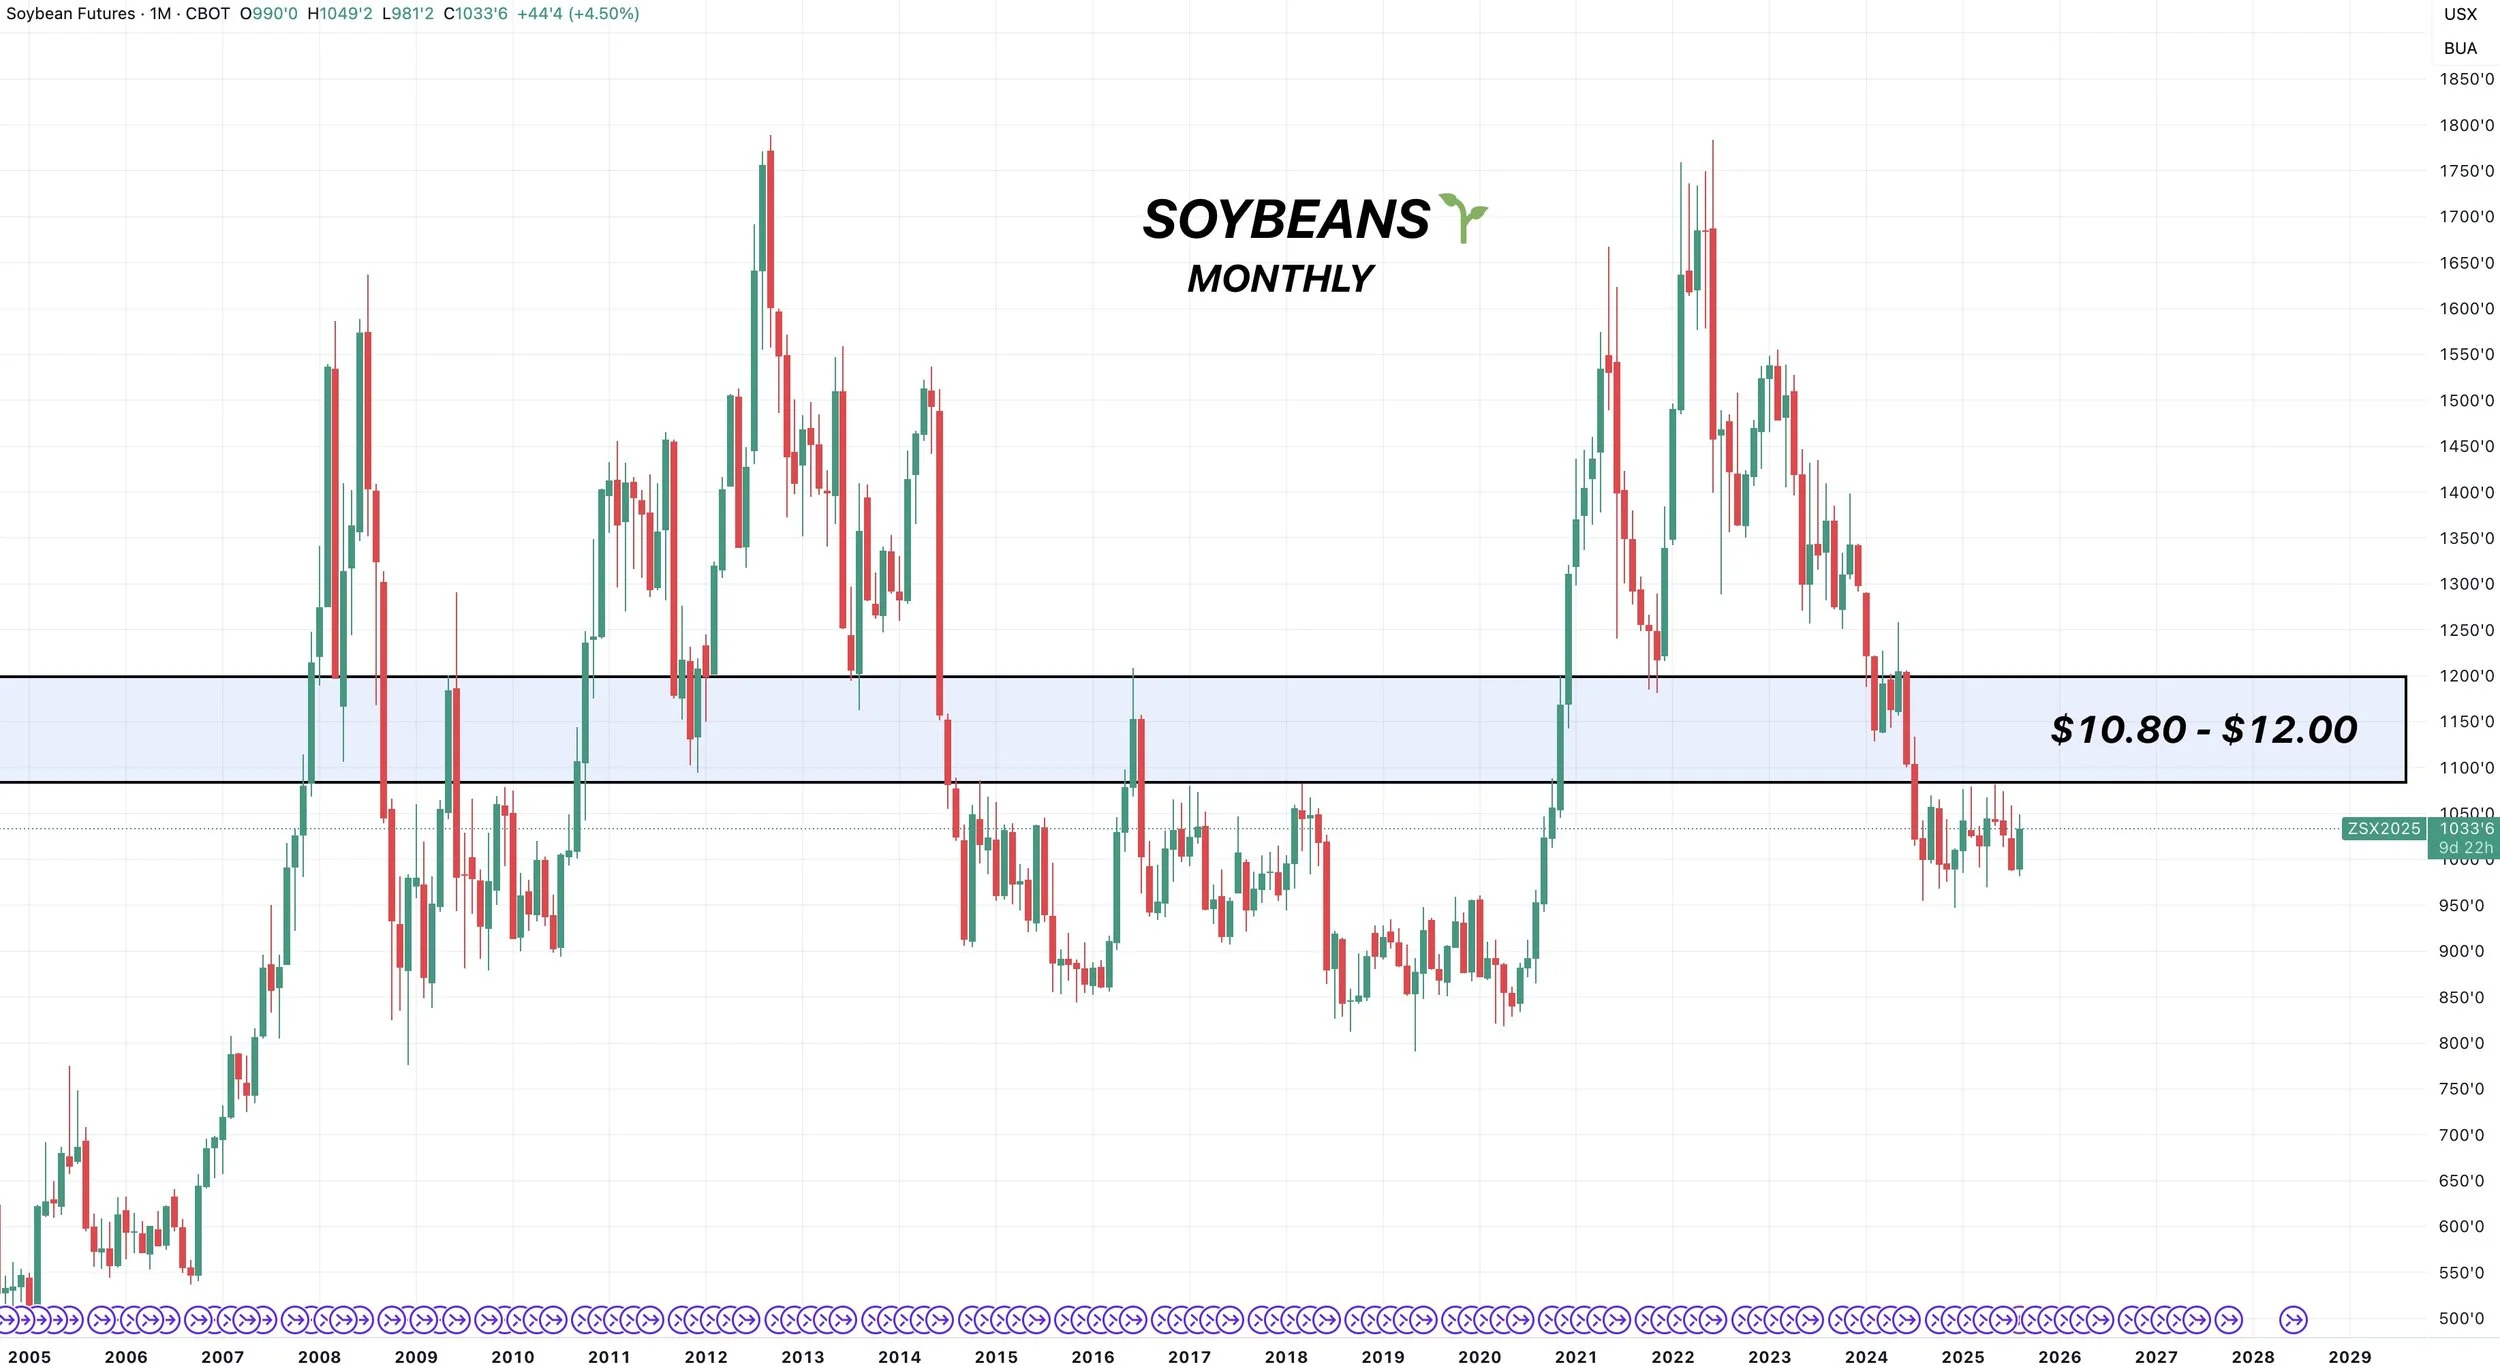
Continuous Chart:
If we look at the continuous chart, every 3 months prices have came up to re-vist this $10.65 to $10.80 area.
This box has marked each major high the past year.
It has been about 3 months since our last major high in the box.
So I would like to think we will get another shot at it.
Now on the other hand.. if we ever take out those $10.80 highs soybeans have an immense amount of upside potential.
Again, it is a BIG IF.
But there is zero resistance past $10.80
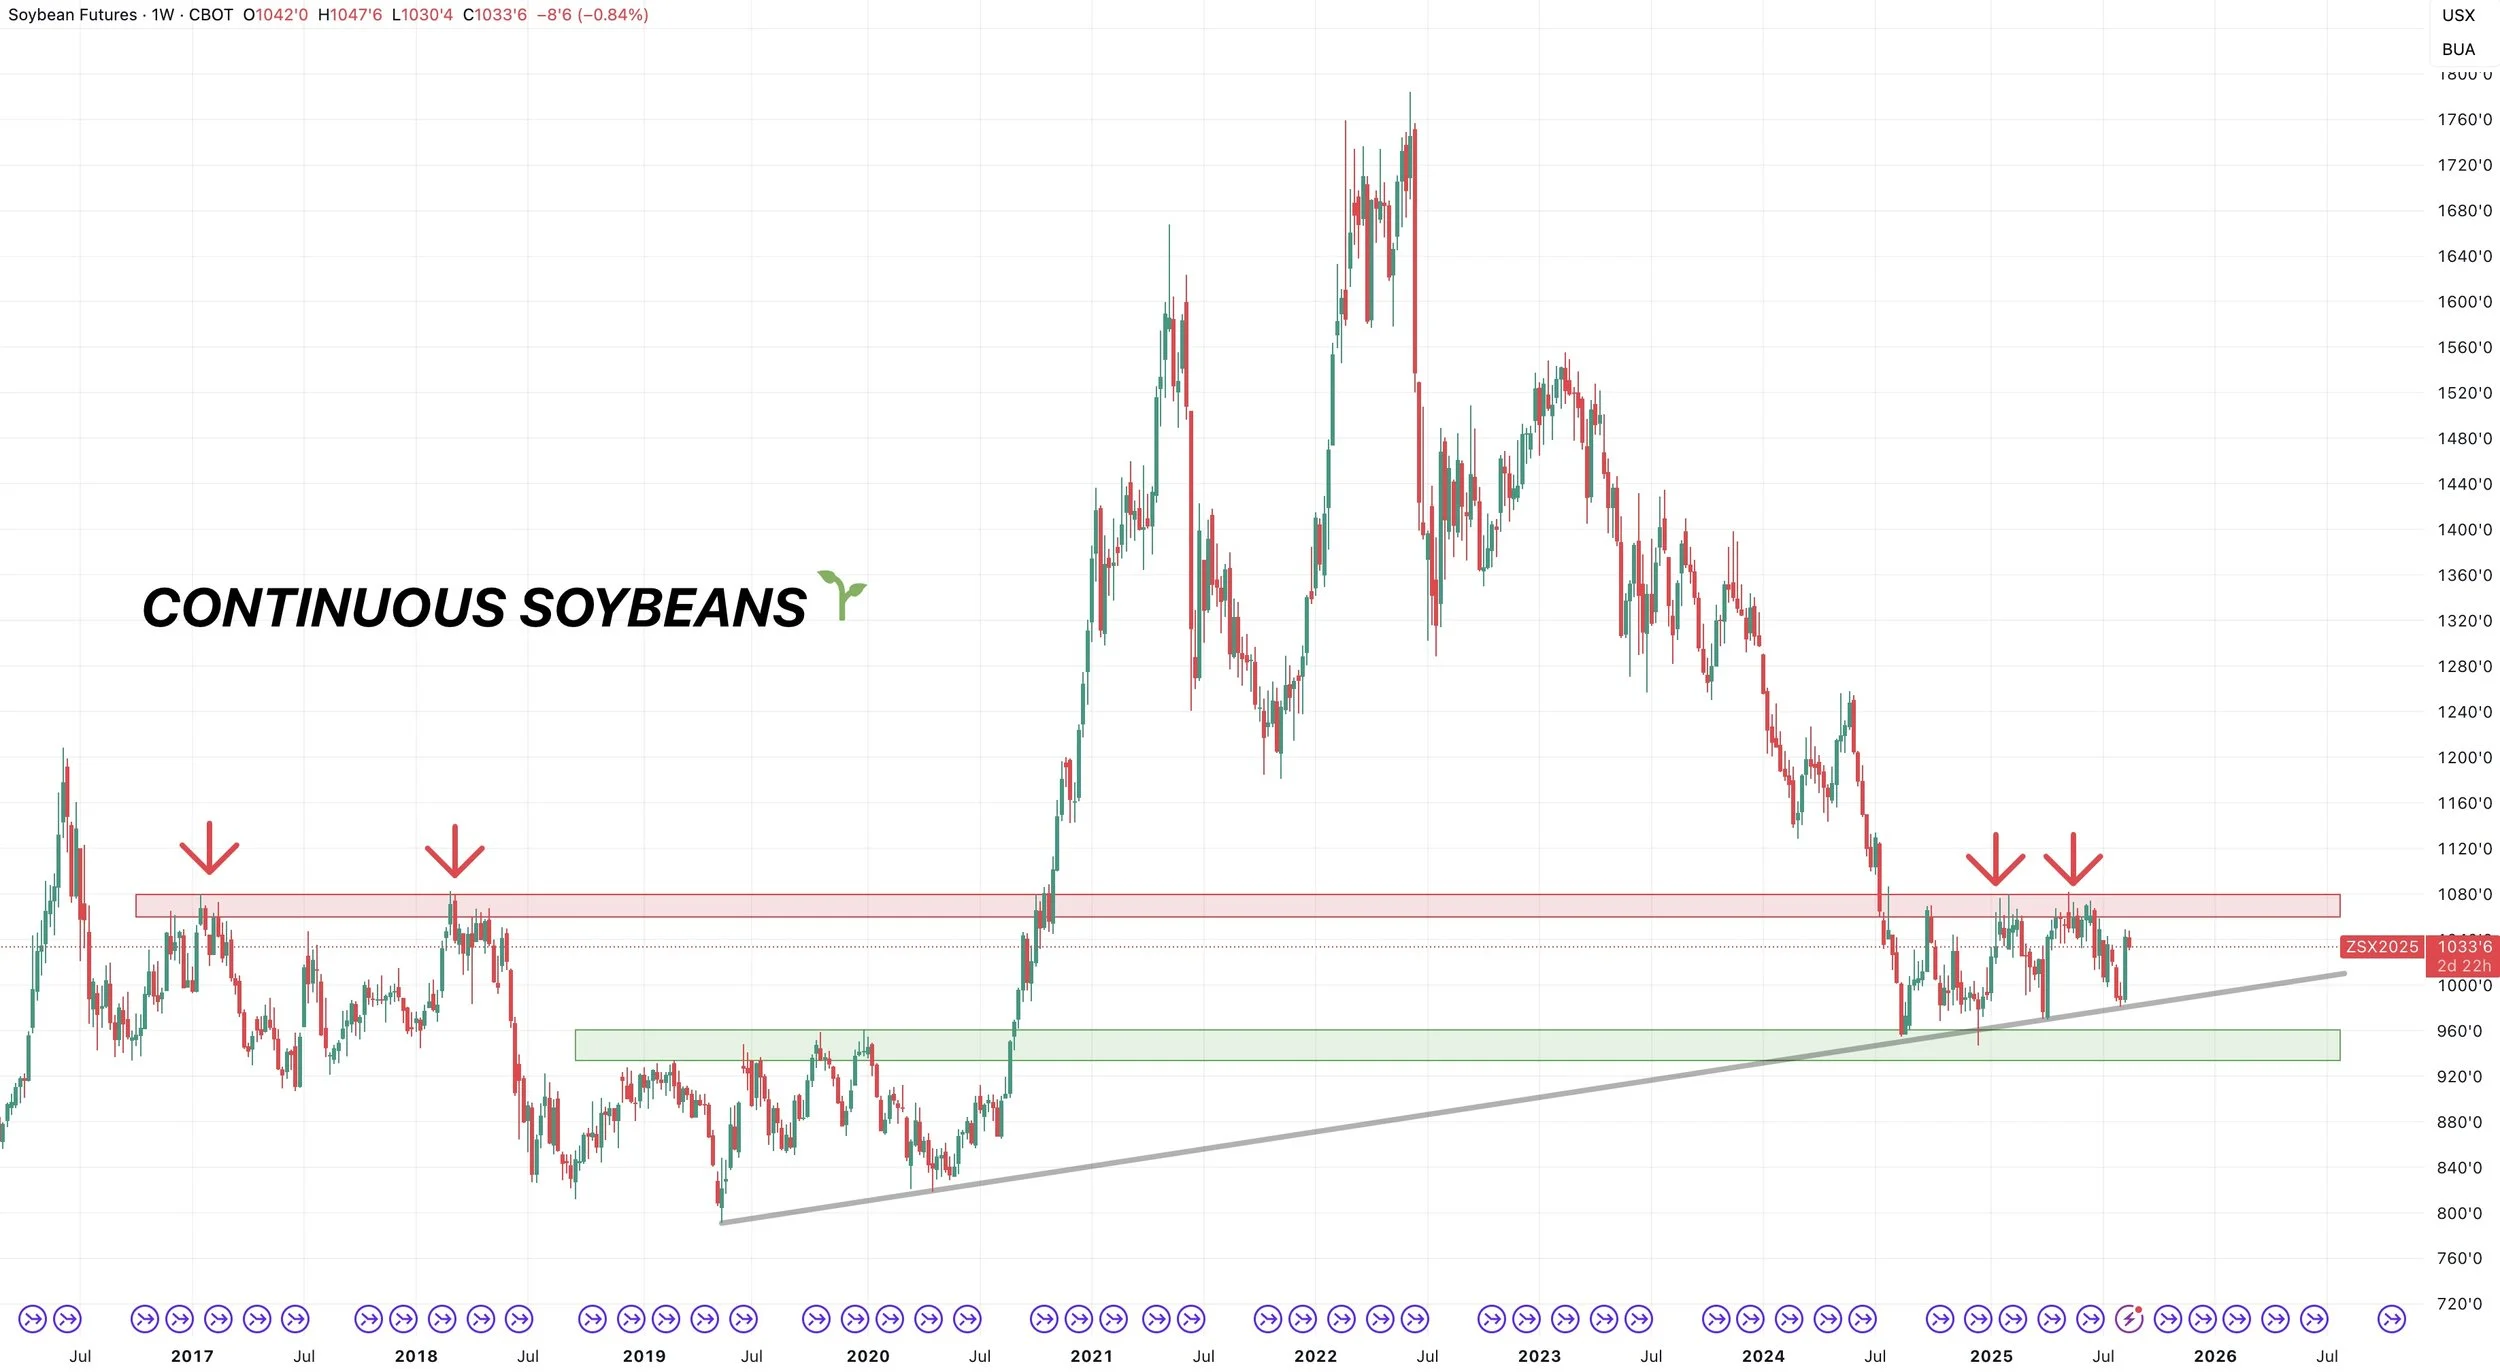
Soybeans do not like spending much time in the $11.00's
They more often than not slice right through, to the upside and downside.
Or sometimes we run up to $12.00 then crash back below $11.00
I am not calling for $12.00 soybeans. I am simply stating that beans do not like trading in the $11.00's and that IF we ever did break $10.80 there is very little resistance.
The only way I see this happening is if we struck a deal with China and or somehow the US crop severely disappointed.
We could go years without seeing $12.00 beans.
Weekly Chart:
Last week was impressive price action.
We completely engulfed the last 5 weeks of price action.
Breaking out of this clear bullish wedge.

Wheat
The wheat market continues to struggle.
As we fractionally posted a fresh round of contract lows yet again today.
But looking at the charts, they aren’t damaged and still look like a good area of value long term.
I think this wheat market has more potential upside than downside here, sitting at mutli-year lows.
Today we are just going to look at the charts as there is very little fresh fundamental news.
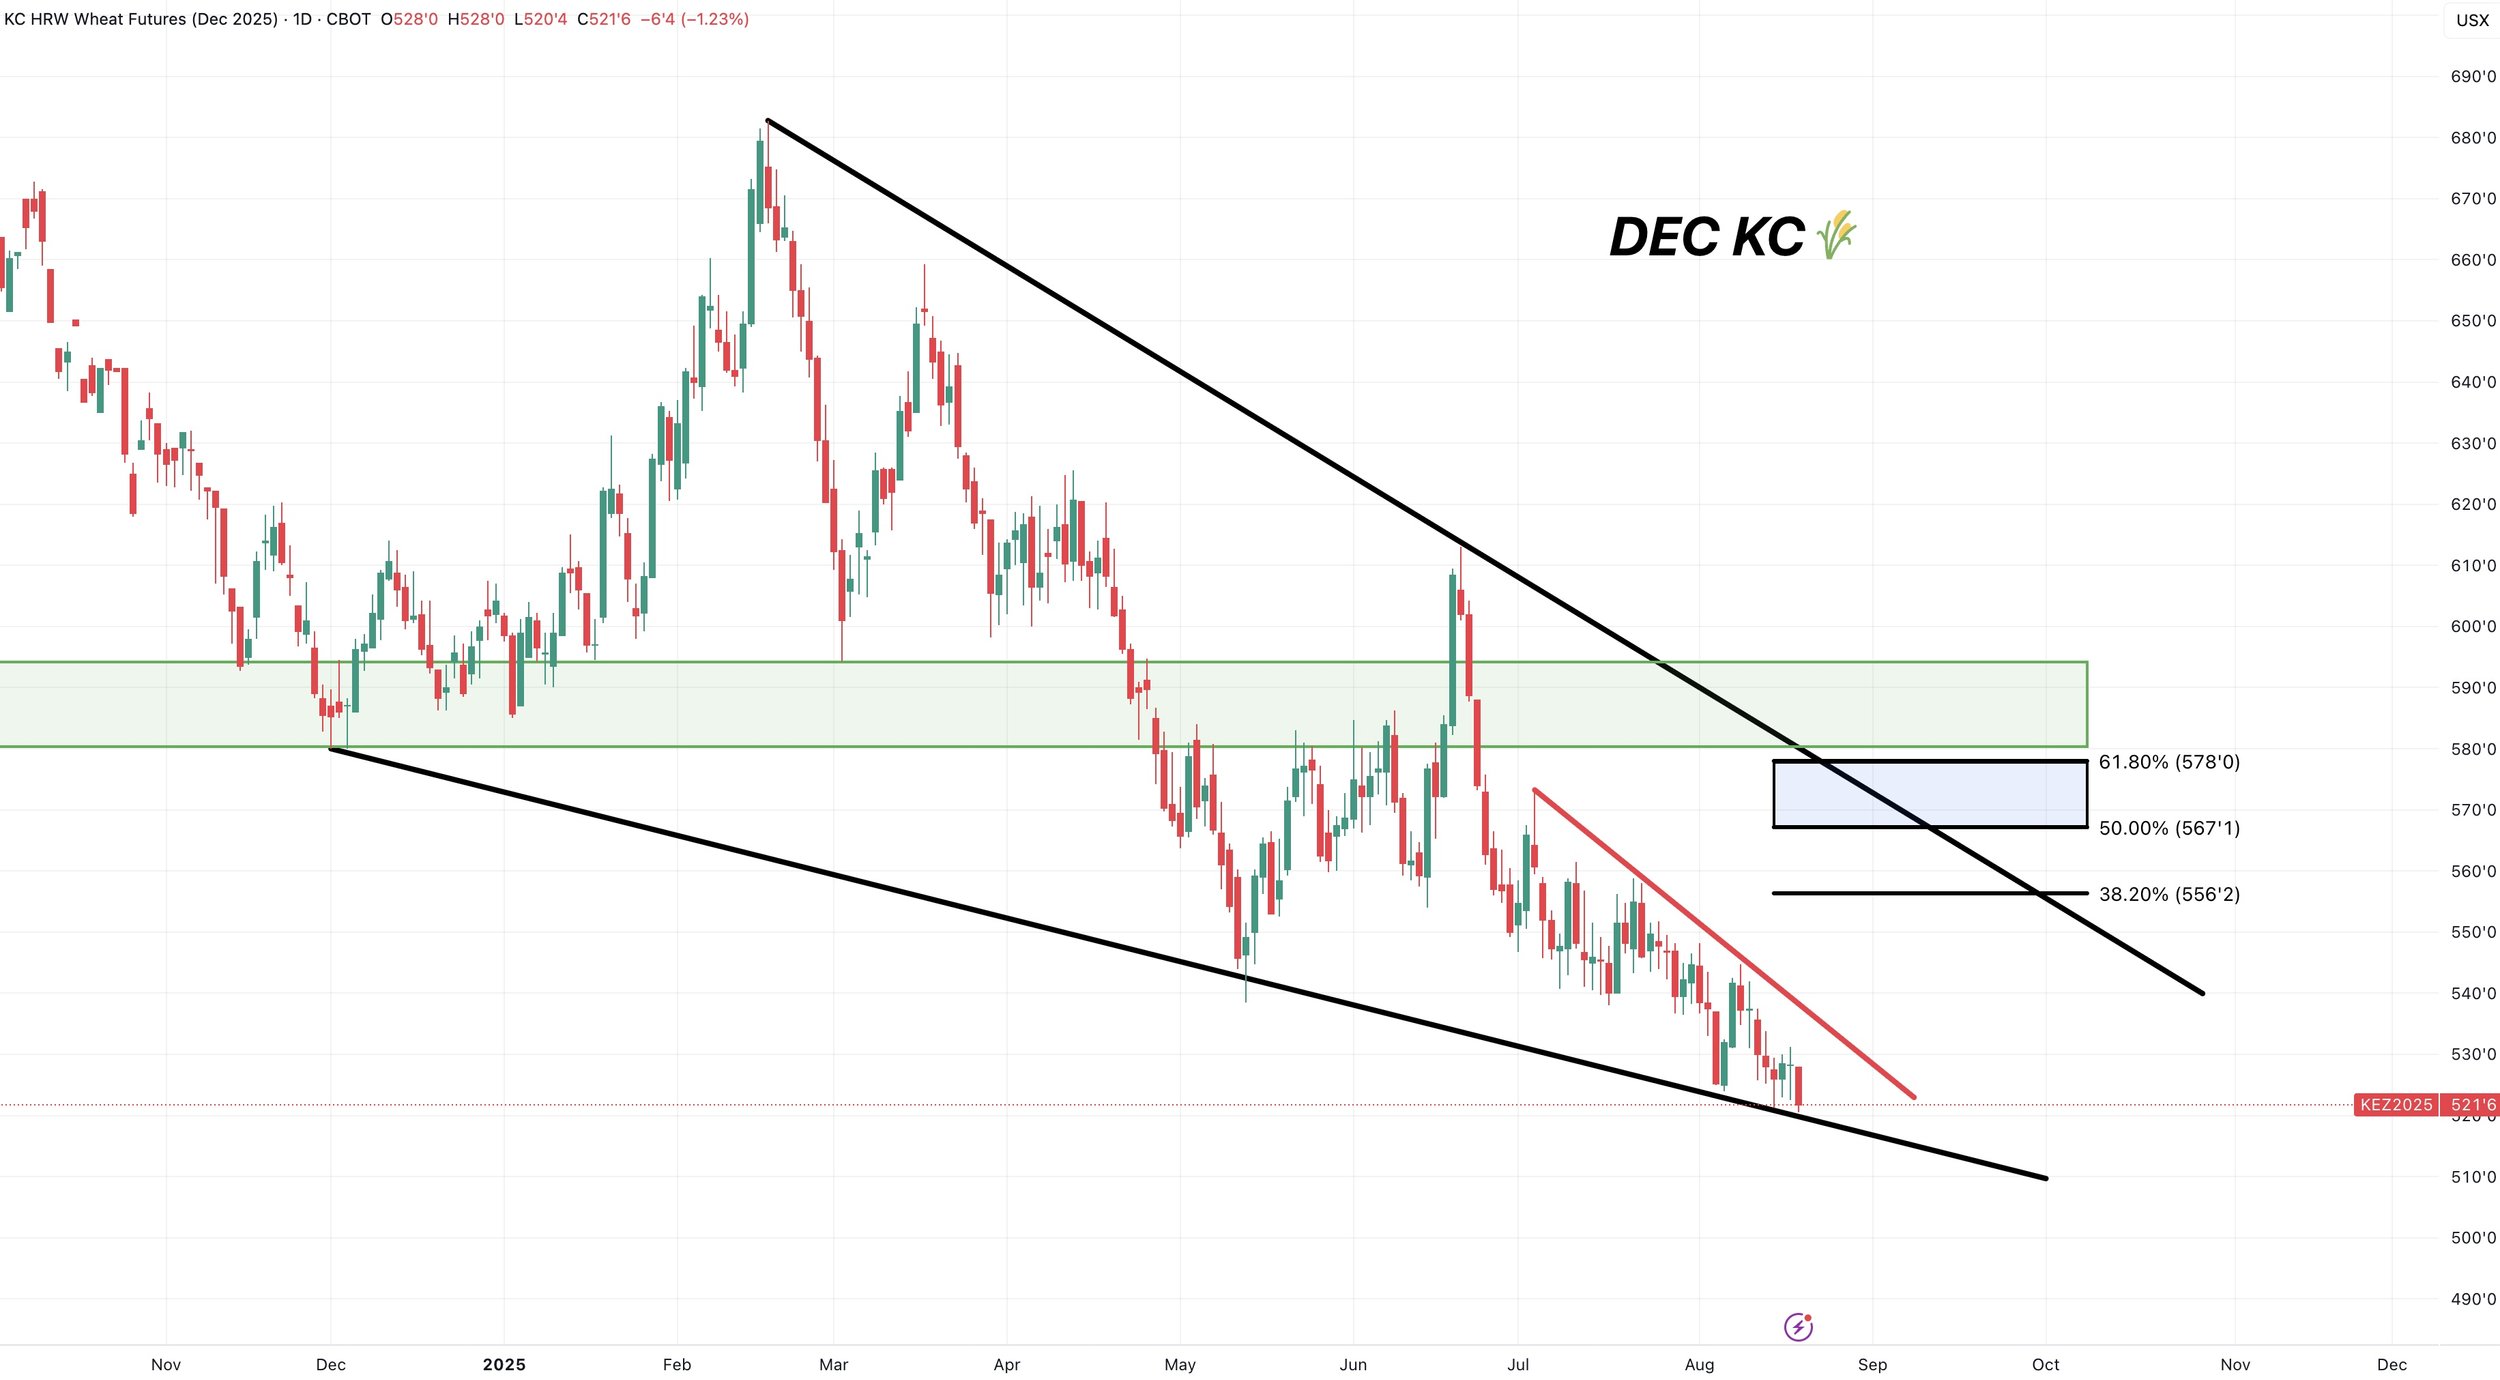
Technicals:
Despite new contract lows, we are still hovering right at the bottom of this massive falling wedge pattern.
I am looking for a test of the top of the wedge.
The top of the wedge also aligns with the golden zone up to those June highs. (50-61.8% of those highs).
(I switched to Dec wheat instead of Sep)*

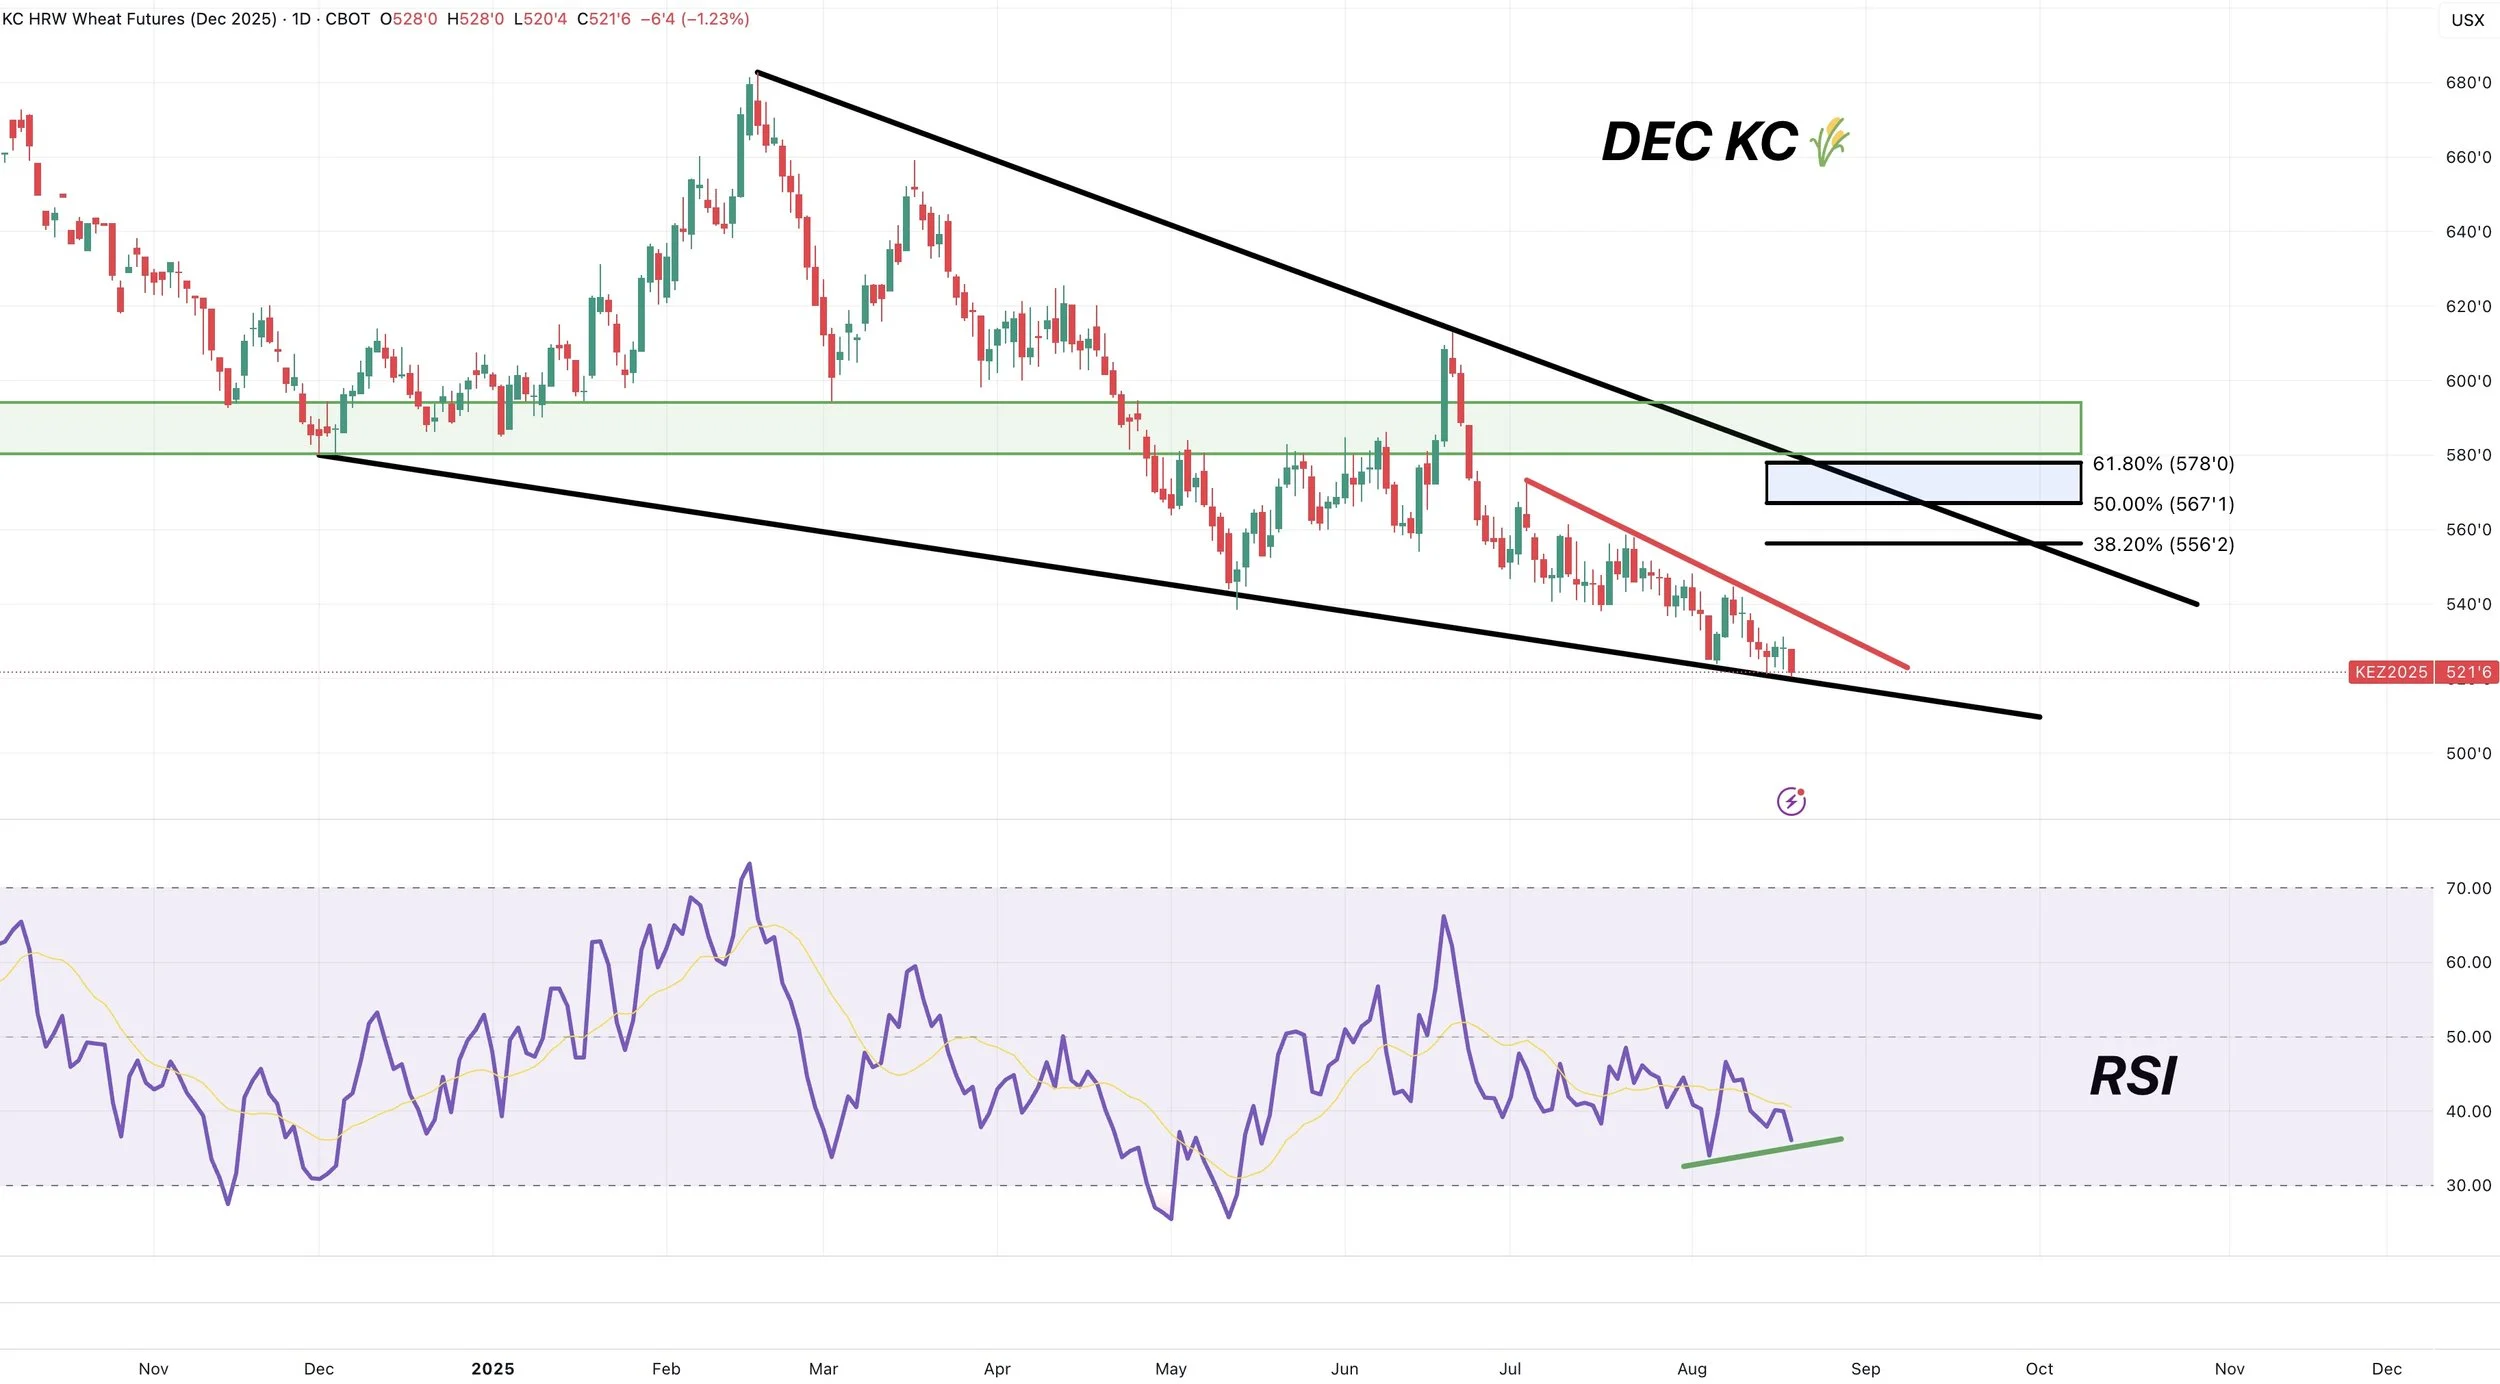
We are also still showing bullish divergence on the RSI.
Prices made a new low.
The RSI did not.
This does not mean a rally is coming. It just means downside momentum is getting weaker.

Nothing new on KC wheat. Simply chilling near the bottom of this giant wedge.
Not looking to de-risk until closer to the top.
KC is also showing bullish divergence.
Cattle
Cattle continues it's historic run.
My next level to watch is 356.625
That is the 261.8% fib extension level from the June rally and pullback.
So I like that as a target to layer into downside protection.
As we have been mentioning, we like puts rather than futures. As with puts you do not get all of the margin calls etc that can come with futures if the market keeps pushing higher.
To the downside, I am simply watching the bottom of this channel.
If we break below, that is going to be out first sign of weakness.

We are also showing very clear bearish divergence.
Prices made new highs, the RSI did not.
Doesn’t mean a correction happens tomorrow. Just a warning sign.

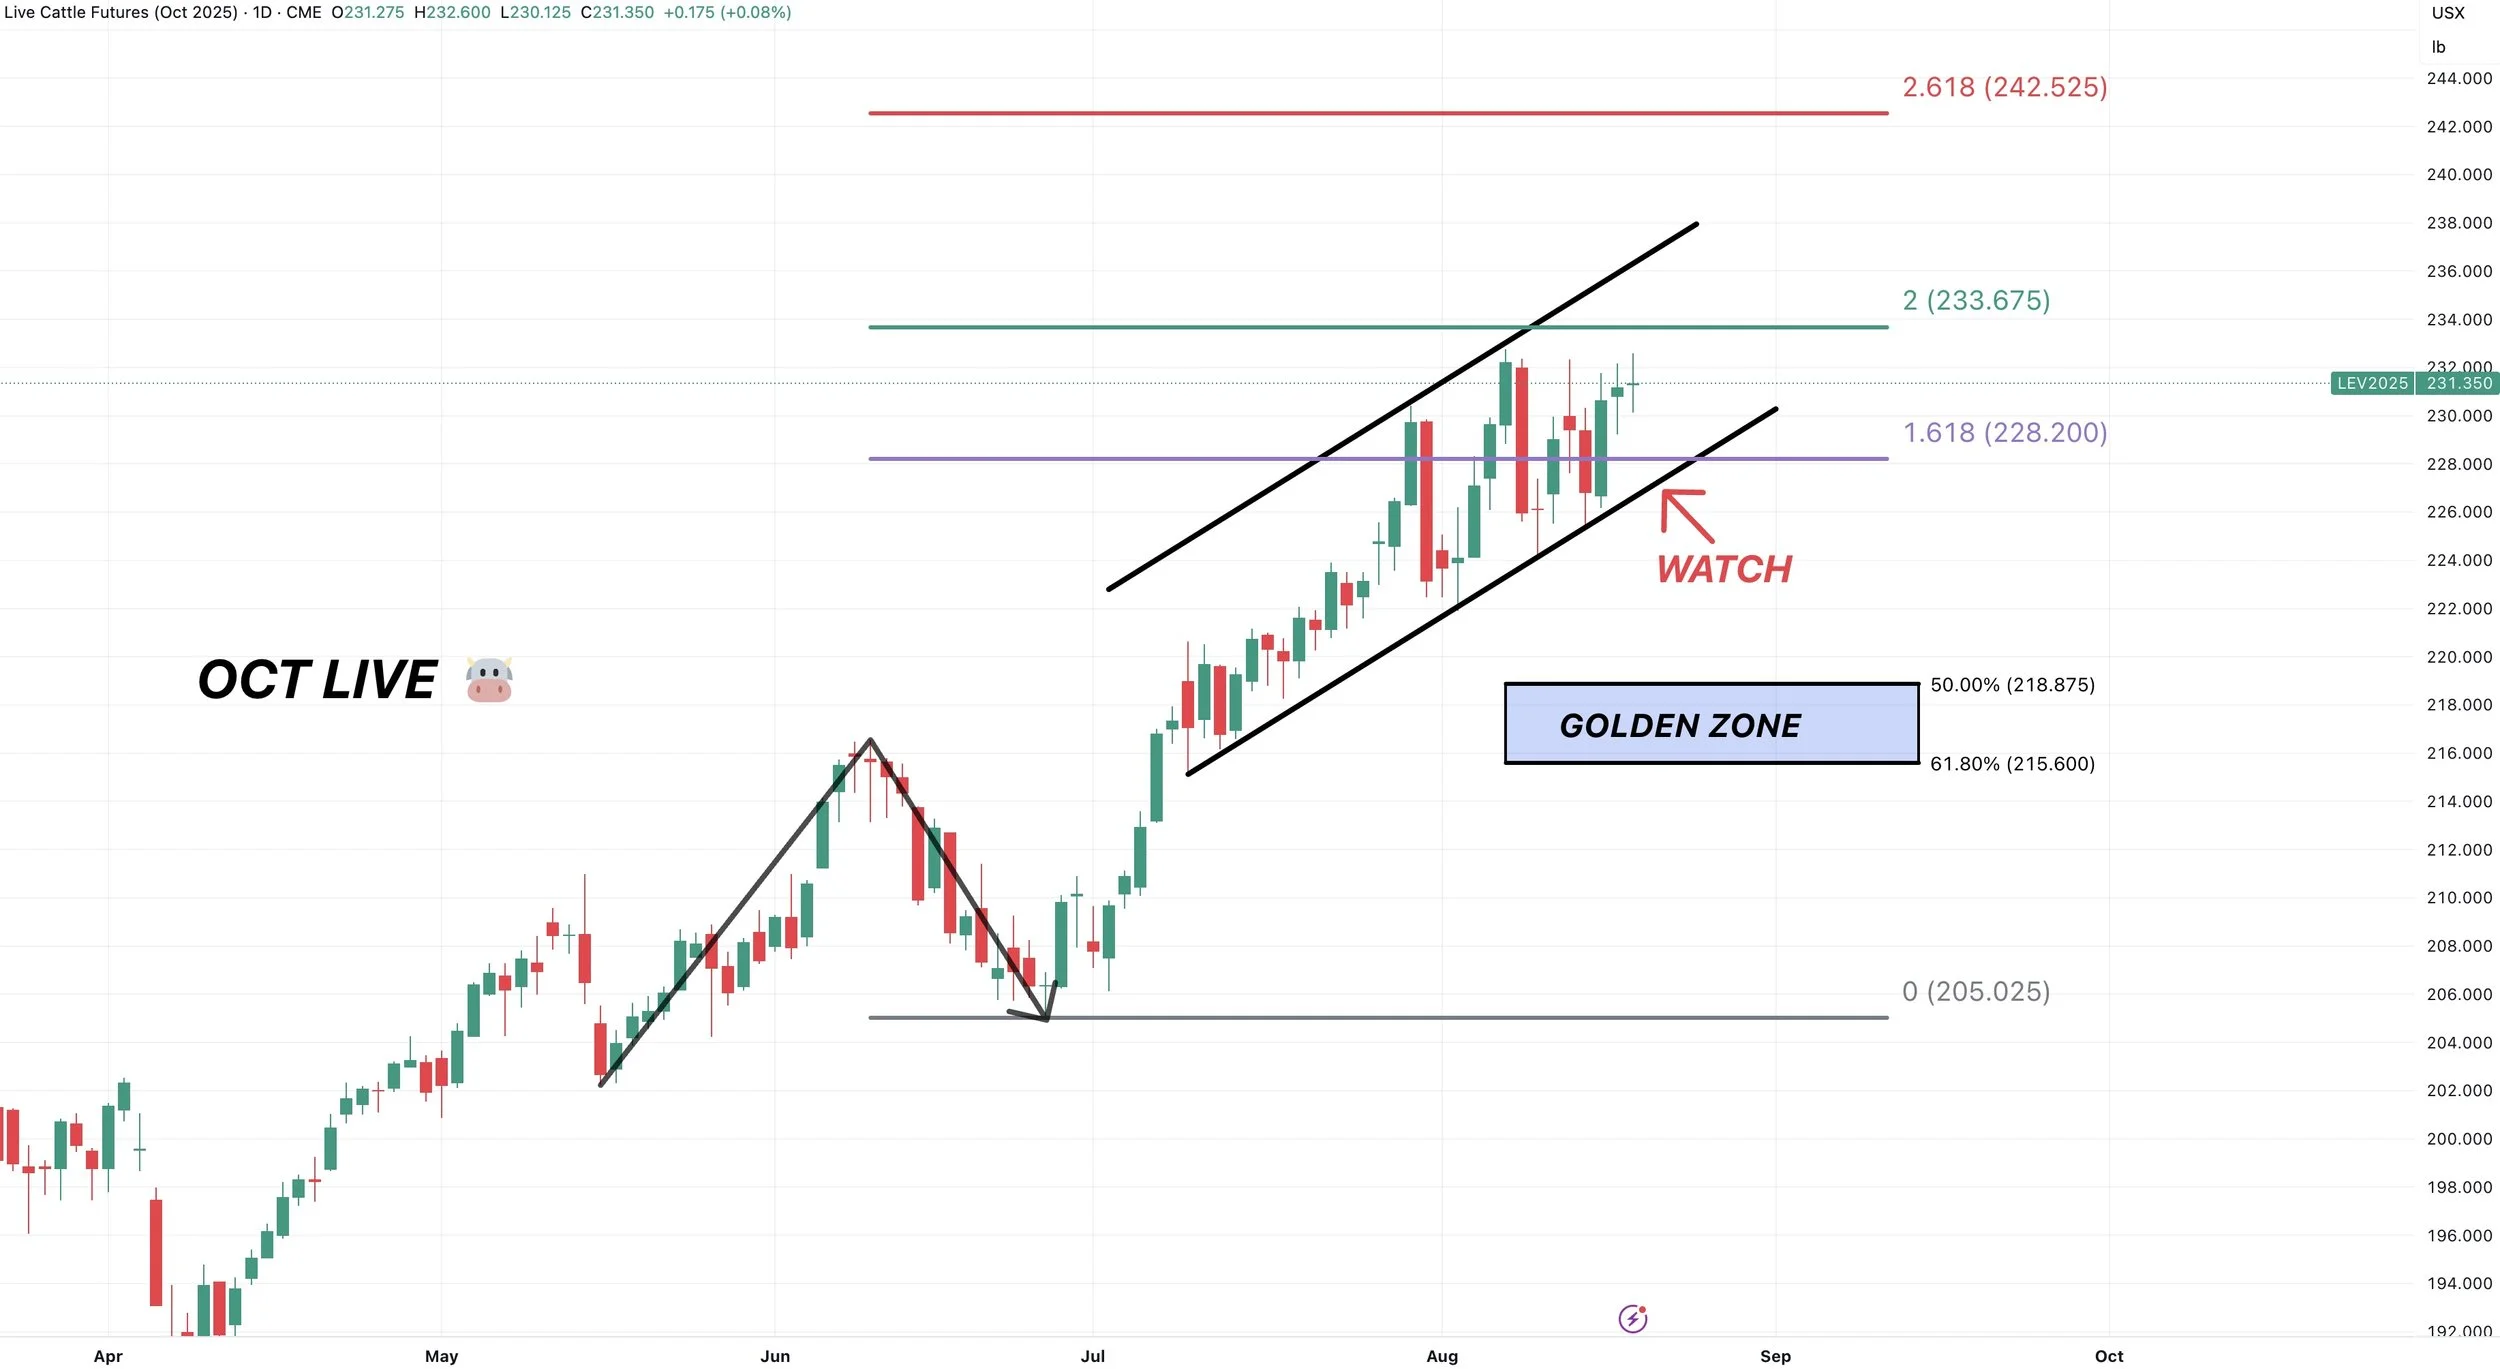
For live cattle, next level is still teh 200% fib extension at 233.765
To the downside just watching the bottom of this channel.
Past Sell or Protection Signals
We recently incorporated these. Here are our past signals.
July 31st: 🐮
Cattle sell signal & hedge alert.
July 10th: 🐮
Cattle sell signal & hedge alert.
CLICK HERE TO VIEW
June 5th: 🐮
Cattle sell signal & hedge alert.
June 2nd: 🌾
MPLS wheat sell signal.
April 10th: 🌽
Old crop corn sell signal.
March 19th: 🐮
Cattle hedge & sell signal.
Feb 18th: 🌽 🌾
Old crop KC wheat & old crop corn signal.
Jan 23rd: 🌽 🌱
Corn & beans old crop sell signal.
CLICK HERE TO VIEW
Jan 15th: 🌽 🌱
Corn & beans hedge alert/sell signal.
Jan 2nd: 🐮
Cattle hedge alert at new all-time highs & target.
Dec 11th: 🌽
Corn sell signal at $4.51 200-day MA
CLICK HERE TO VIEW
Oct 2nd: 🌾
Wheat sell signal at $6.12 target
Sep 30th: 🌽
Corn protection signal at $4.23-26
Sep 27th: 🌱
Soybean sell & protection signal at $10.65
Sep 13th: 🌾
Wheat sell signal at $5.98
May 22nd: 🌾
Wheat sell signal when wheat traded +$7.00
Want to Talk?
Our phones are open 24/7 for you guys if you ever need anything or want to discuss your operation.
Hedge Account
Interested in a hedge account? Use the link below to set up an account or shoot Jeremey a call at (605)295-3100.
Check Out Past Updates
8/18/25
CROP TOURS STARTING
8/15/25
CORN BOUNCING DESPITE MONSTER SUPPLY. WILL CROP TOUR SHOW ISSUES?
8/14/25
HOW TIGHT IS SOYBEAN SITUATION?
8/13/25
UPCOMING CROP TOURS & NEXT BEAN TARGET
8/12/25
MAJOR USDA SHOCK. HOW DOES THIS CHANGE THINGS?
8/11/25
TRUMP SAYS CHINA NEEDS BEANS. USDA TOMORROW
8/8/25
CALM BEFORE USDA STORM & CATTLE LIMIT DOWN
8/7/25
USDA PREVIEW & MORE DETAILS ON BUY SIGNAL
8/6/25
CORN REVERSAL? RIDING CATTLE RUN BUT BEING DISIPLINED
8/5/25
188 CORN YIELD? AUGUST CATTLE CONCERNS?
8/4/25
NEW CORN LOWS & USDA NEXT WEEK
8/1/25
STOUT DEMAND & WET JULY
7/31/25
WHERE IS CORN & BEAN BOTTOM? WAS THAT CATTLE TOP?
7/31/25
CATTLE HEDGE ALERT & SELL SIGNAL
7/30/25
ANY HOPE LEFT FOR GRAINS?
7/29/25
SEASONAL STRUGGLE CONTINUES
7/28/25
EXTREME BEARISHNESS PRICED INTO GRAINS. CATTLE WARNING SIGNS
7/25/25
NO REASON TO RALLY. NO REASON TO COLLAPSE
7/24/25
CORN DEMAND OVERSTATED? CATTLE CLOSE TO TOP?
7/23/25
JAPAN DEAL NOT ENOUGH
7/22/25
CROP RATINGS MATTER?
7/21/25
RAIN MAKES GRAIN
7/18/25
OVERNIGHT HEAT & ROOM FOR ERROR
7/17/25
POOR CORN EXPORTS MATTER? REWARD BEAN BOUNCE?
7/16/25
ARE CORN & BEANS UNDERVALUED OR NOT?
7/15/25
NEGATIVE NEWS POSITIVE ACTION IN GRAINS
7/14/25
DON’T GIVE GRAIN AWAY
7/11/25
USDA FRIENDLY CORN. MARKET DOESN’T CARE
7/10/25
JULY USDA OUT TOMORROW
7/10/25
CATTLE HEDGE ALERT & SELL SIGNAL
7/9/25
MARKET SEES RECORD CROPS
7/8/25
MONSTER CORN YIELD..?
7/7/25
TRUMP PUMP & DUMP
7/3/25
CORN & BEANS REJECT KEY SPOT. TRUMP SPEAKS IN IOWA
7/2/25
TRADE DEALS? BEANS RALLY AT GOLDEN ZONE
7/1/25
NOW WHAT FOR GRAINS?
6/30/25
BORING USDA. DIDN’T SAY HAVE TO GO LOWER
6/30/25
USDA NUMBERS
6/27/25
ALL EYES ON MONDAY
6/26/25
FIREWORKS OR BLOOD BATH MONDAY?
6/25/25
GRAINS COLLAPSING AHEAD OF JUNE REPORT
6/24/25
CORN CONTINUES SELL OFF. MAJOR USDA REPORT COMING
6/23/25
CORN CAN GO LOWER, BUT NOT FOR FOREVER
6/20/25
WHO SHOULD REWARD THE WHEAT & SOYBEAN RALLY?
6/18/25
COMPLETE CHART BREAKDOWNS
6/17/25
SOYBEANS CONTINUE BREAKOUT. NEARING SELL SIGNAL
6/16/25
CORN HAMMERED. EPA GAME CHANGER IN BEANS?
6/13/25
SOYBEANS RALLY, CHARTS, BALANCE SHEETS & MORE
6/12/25
USDA NON-EVENT. WHAT’S NEXT?
6/11/25
DIVERGENCE & SEASONAL SELL OFF?
6/10/25
BEING PATIENT VS BALANCING YOUR RISK
6/9/25
WHAT IF WE DON’T GET A WEATHER SCARE?
6/5/25
CORN & BEANS HOLDING CRUCIAL SPOTS
6/5/25
CATTLE SELL SIGNAL & HEDGE ALERT
6/4/25
HOW UNKNOWNS IMPACT MARKETING DECISIONS
6/3/25
KEY SPOTS ON THE CHARTS FOR CORN & BEANS
6/2/25
NEW LOWS IN CORN. DE-RISKING MPLS WHEAT
6/2/25
SPRING WHEAT SELL SIGNAL
5/30/25
SEASONAL RALLY STILL IN THE CARDS?
5/29/25
WHAT IS YOUR PLAN IF WE DO NOT RALLY?
5/28/25
ZERO PREMIUM IN THE GRAIN MARKETS
5/27/25
CORN CONDITIONS DISAPPOINT & JUNE OUTLOOK IMPROVES
5/23/25
TARIFFS SPOOK MARKET. GAME PLAN MOVING FORWARD
5/22/25
CHART BREAKDOWNS & TARGETS
5/21/25
RISK TO THE UPSIDE WITH WEATHER?
5/20/25
WHEAT SHORT COVERING & HISTORY OF YIELD CHANGES
5/19/25
ANYONE LEFT TO SELL WHEAT? 181 CORN YIELD POSSIBLE?
5/16/25
FUNDS SHORT CORN. MARKETS WAITING ON WEATHER
5/15/25
BEANS HAMMERED ON RUMOR & WHEAT FINDING LIFE
5/14/25
DECISIONS & POSSIBILITIES IN GRAINS
5/13/25
GRAINS RALLY OFF LOWS
5/12/25
USDA REPORT. HOW THIS CHANGES THINGS
5/9/25
BIGGEST RISKS IN USDA REPORT
5/8/25
USDA MONDAY & HISTORY OF WEATHER RALLIES
5/7/25
NEW 2025 LOWS FOR CORN
5/6/25
WHAT’S A SUMMER RALLY LOOK LIKE?
5/5/25
CORN ERASES ENTIRE APRIL RALLY
5/2/25
SELL INTO UNCERTAINTY. NOT KNOWN FACTORS
5/1/25
THE CASE AGAINST A FEB TOP IN CORN
4/30/25
APPROACHING KEY TIME PERIOD FOR GRAINS
4/29/25
PLANTING & FIRST NOTICE DAY PRESSURE. CORN CLOSE TO BOTTOM?
4/28/25
CAPTURING INVERSE & SEASONAL PREPARATION
4/25/25
HOW OFTEN DOES CORN NOT BREAK APRIL HIGHS?
4/24/25
KNOW WHEN TO SELL. BEANS BREAK 200-DAY FIRST TIME IN 483 DAYS
4/23/25
MONEY FLOW & DROUGHT CARDS
4/22/25
CRUCIAL SPOT FOR CORN & BEANS
4/21/25
NO PLANTING THREAT YET
4/18/25
POTENTIAL OPPORTUNITIES, BASIS CONTRACTS & STRATEGIES
4/16/25
HOW YIELD IMPACTS CARRYOUT. MAJOR SPOT FOR SOYBEANS
4/15/25
TOTAL CHART BREAKDOWNS & TARGETS
4/14/25
TECHNICAL SELLING IN GRAINS
4/11/25
SPECIFIC GRAIN MARKETING DECISIONS
4/10/25
USDA REPORT. HOW THIS IMPACTS CORN
4/9/25
TARIFFS GIVE. TARIFFS TAKE
4/8/25
CORN’S DIVERGING STRENGTH
4/7/25
SOLID PRICE ACTION DESPITE OUTSIDE FEAR
4/4/25
CORN PRICE ACTION SPEAKS VOLUME. ANY HOPE LEFT FOR SOYBEANS?
4/3/25
WHAT IS LEFT FOR CORN BEARS? TRADE WAR: CHARTS HOLDING SUPPORT
4/2/25
SHOULD UNKNOWNS KEEP A FLOOR UNDER GRAIN PRICES?
4/1/25
HOW DO ACRES IMPACT FUTURE OF THE GRAINS?
3/31/25
USDA REPORT: NOW WHAT?
3/28/25
ALL EYES ON USDA
3/27/25
PRE-USDA POSITIONING. DON’T GIVE GRAIN AWAY
3/26/25
HISTORY OF MARCH INTENTIONS. SOYBEANS UNDERVALUED?
3/25/25
6 DAYS UNTIL MAJOR USDA REPORT
3/24/25
HOW TO POSITION YOURSELF BEFORE PLANTING
3/21/25
REASONS TO BE OPTIMISTIC IN GRAINS?
3/20/25
WAS THAT THE BOTTOM IN CORN?
3/19/25
THE PATH HIGHER & THE DOWNSIDE RISKS IN GRAINS
3/18/25
SEASONALS, CATTLE HEDGE, CHARTS & DROUGHT?
3/17/25
WHEAT RALLIES. DON’T GET BACKED INTO A CORNER
3/14/25
MARCH 31ST REPORT THOUGHTS & WHAT’S NEXT FOR GRAINS
3/13/25
EXPLAINING RE-OWNERSHIP VS COURAGE CALLS
3/12/25
TARIFF FEARS. EU, CANADA, & ETHANOL
3/11/25
USDA SNOOZE. RECORD FUND SELLING A CONCERN?
3/10/25
USDA TOMORROW. GETTING COMFORTABLE IN MARKETING
3/7/25
HOW TIGHT IS THE WORLD & US SITUATION?
3/6/25
TARIFFS PUSHED BACK. FUTURE OPPORTUNITIES?
3/5/25
IS GRAINS BIGGEST RISK WEAK CRUDE & DEFLATION?
3/4/25
TRADE WAR BEGINS. 8TH DAY OF PAIN FOR GRAINS
3/3/25
TARIFFS ON TOMORROW. BUY SIGNAL
3/3/25
BUY SIGNAL
2/28/25
WHEN WILL THE BLEEDING STOP?
2/27/25
CORN AT CRITICAL SPOT. USDA ACRE REPORT. WAY TOO EARLY DROUGHT TALK
2/26/25
HISTORY SUGGESTS CORN TOP ISN’T IN? ACRE OUTLOOK TOMORROW
2/25/25
POSITIVE CLOSE. WHAT TO KNOW ABOUT USDA OUTLOOK
2/24/25
USDA OUTLOOK, FIRST NOTICE DAY & BRAZIL
2/21/25
WHAT TO EXPECT MOVING FORWARD IN GRAINS
2/20/25
FIRST NOTICE DAY CONCERNS. MASSIVE CORN ACRES OR NOT?
2/19/25
HOW TIGHT IS THE CORN SITUATION?
2/18/25
MORE DETAILS ON TODAYS SELL SIGNAL
2/18/25
OLD CROP KC WHEAT & CORN SELL SIGNAL
2/14/25
WHEAT BREAKING OUT ON WEATHER RISK. TECHNICALS & FUNDAMENTALS
2/12/25
GLOBAL GRAIN SITUATION, ACRE TALK, CHARTS & MORE
2/11/25
USDA: NOT A BEARISH REPORT. DISAPPOINTING PRICE ACTION
2/10/25
USDA TOMORROW. LONG TERM PATH FOR SUB 10% CORN STOCKS TO USE?
2/7/25
WHY WOULD THE FUNDS EXIT THEIR LONGS?
2/6/25
WHEAT FINALLY CATCHING A BID
2/5/25
COMPLETE THOUGHTS ON MARKETS: BACK & FORTH DISCUSSION
2/4/25
STRONG JANUARY LEAD TO STRONG YEAR? TARIFFS, CHARTS & MORE
2/3/25
TARIFFS PUSHED BACK
1/31/25
TARIFF NEWS ALL OVER THE PLACE. ARE YOU PREPARED FOR POSSIBILITIES?
1/30/25
WHEAT BULL ARGUMENT. TRUMP ADDS TARIFFS
1/29/25
CORN APPROACHES $5.00
1/28/25
TARIFFS, CORN FUNDS, SOUTH AMERICA & MORE
1/27/25
HEALTHY CORRECTION WE TALKED ABOUT & TARIFF NEWS
1/24/25
GRAINS DUE FOR SHORT TERM CORRECTION?
1/23/25
OUR ENTIRE NEW CROP SALES THOUGHTS & OLD CROP SELL SIGNAL
1/22/25
GRAINS TAKE A BREATHER. IS CORN IN A BULL OR BEAR MARKET?
1/21/25
HUGE DAY IN GRAINS. WHAT TO DO WITH OLD CROP VS NEW CROP
Read More
1/20/25
VIDEO CHART UPDATE
1/17/25
TRUMP, CHINA, ARGY & USING THE SPREADS INVERSE
1/16/25
OLD CROP LEADS US LOWER. MARKETING THOUGHTS
1/15/25
SIGNAL & HEDGE ALERT QUESTIONS EXPLAINED. IS $6 CORN EVEN POSSIBLE?
1/14/25
MORE DETAILS ON TODAYS HEDGE ALERT & SELL SIGNAL
1/14/25
CORN & SOYBEANS HEDGE ALERT/SELL SIGNAL
1/13/25
USDA GAME CHANGER OR NOT?
1/10/25
BULLISH USDA FOR CORN & BEANS
1/9/25
USDA OUT TOMORROW
1/8/25
2 DAYS UNTIL USDA. BE PREPARED
1/7/25
THE HISTORY OF THE JAN USDA & MORE
1/6/25
MAJOR USDA REPORT FRIDAY
Read More
1/3/25
UGLY DAY ACROSS THE GRAINS
1/2/25