
LEVELS BULLS NEED TO DEFEND & MORE
MARKET UPDATE
You can scroll to read the usual update as well. As the written version is the exact same as the video.
Timestamps for video:
Overview: 0:00min
Dry August: 0:45min
Funds: 2:00min
Corn: 5:00min
Beans: 7:50min
Wheat: 11:00min
Cattle: 13:15min
Want to talk about your situation?
(605)295-3100
Futures Prices Close
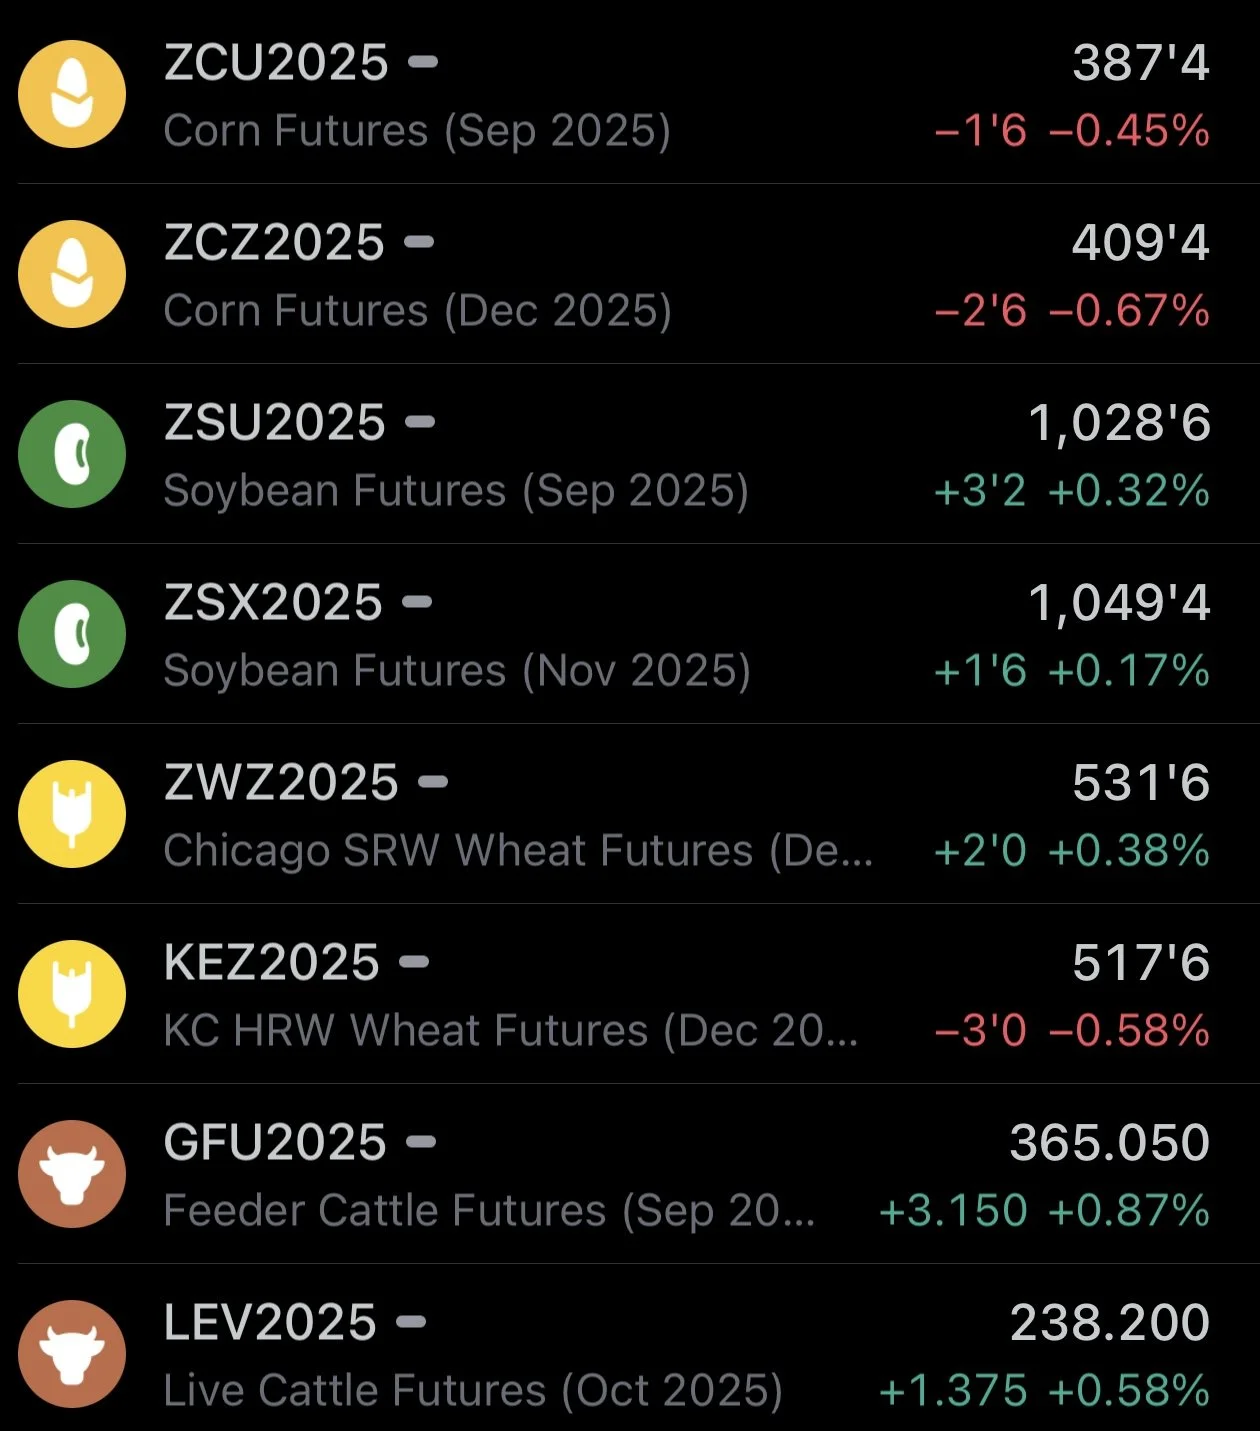
Overview
Grains mixed while the cattle market continues to push higher. Posting fresh all-time highs once again.
Corn is seeing a pullback at key resistance like we talked about last week. We will touch more on this later in the update.
Yesterday we saw amazing export inspections for both corn & wheat. As wheat came in at the highest number we've seen in several years.
On the other hand, traders continue to be concerned about soybean demand given that China has still yet to purchase any new crop beans.
We have first notice day on Friday, which historically can add some weakness heading into it.
Crop conditions yesterday for both corn and soybeans improved this week.
Both are now sitting at their best ratings in 9 years (since 2016).


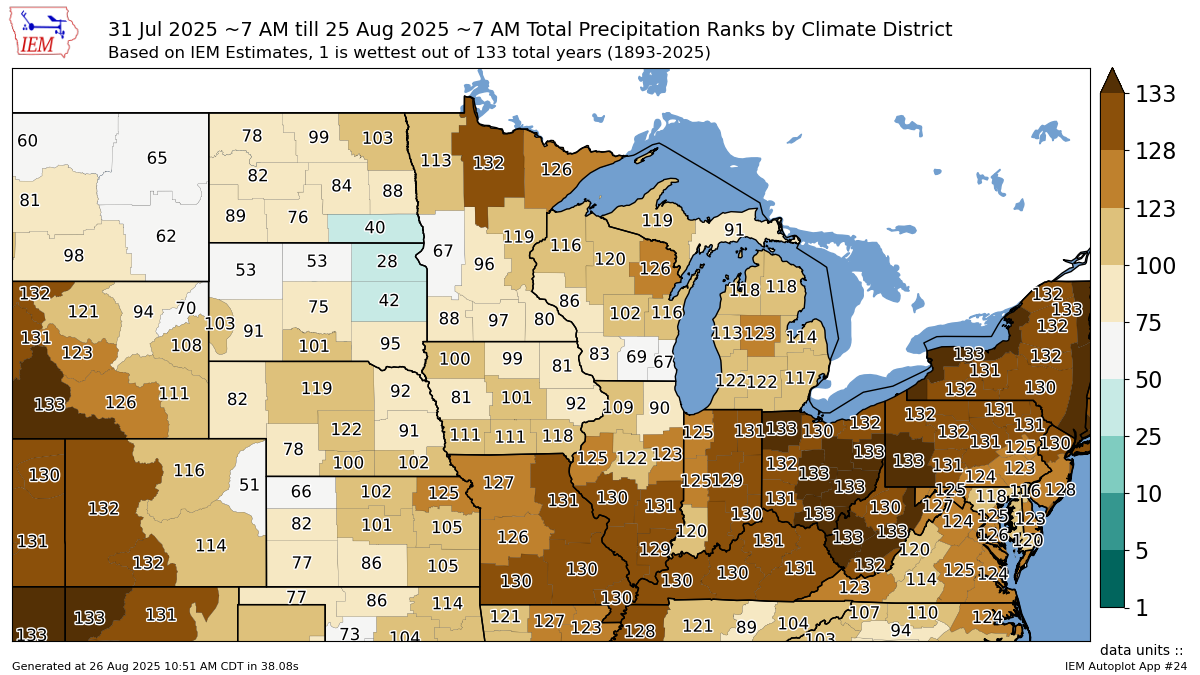
Dry Finish
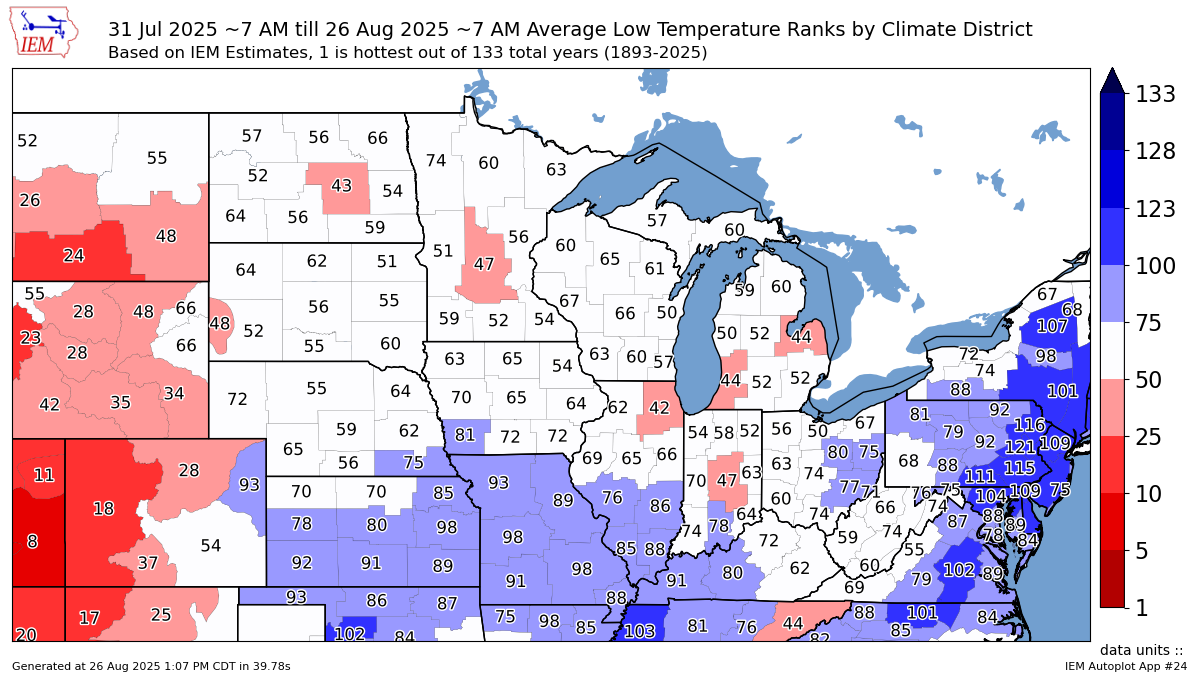
Here is the precip rankings for the month of August.
We have seen one of the driest Augusts on record.
Especially for the eastern corn belt.
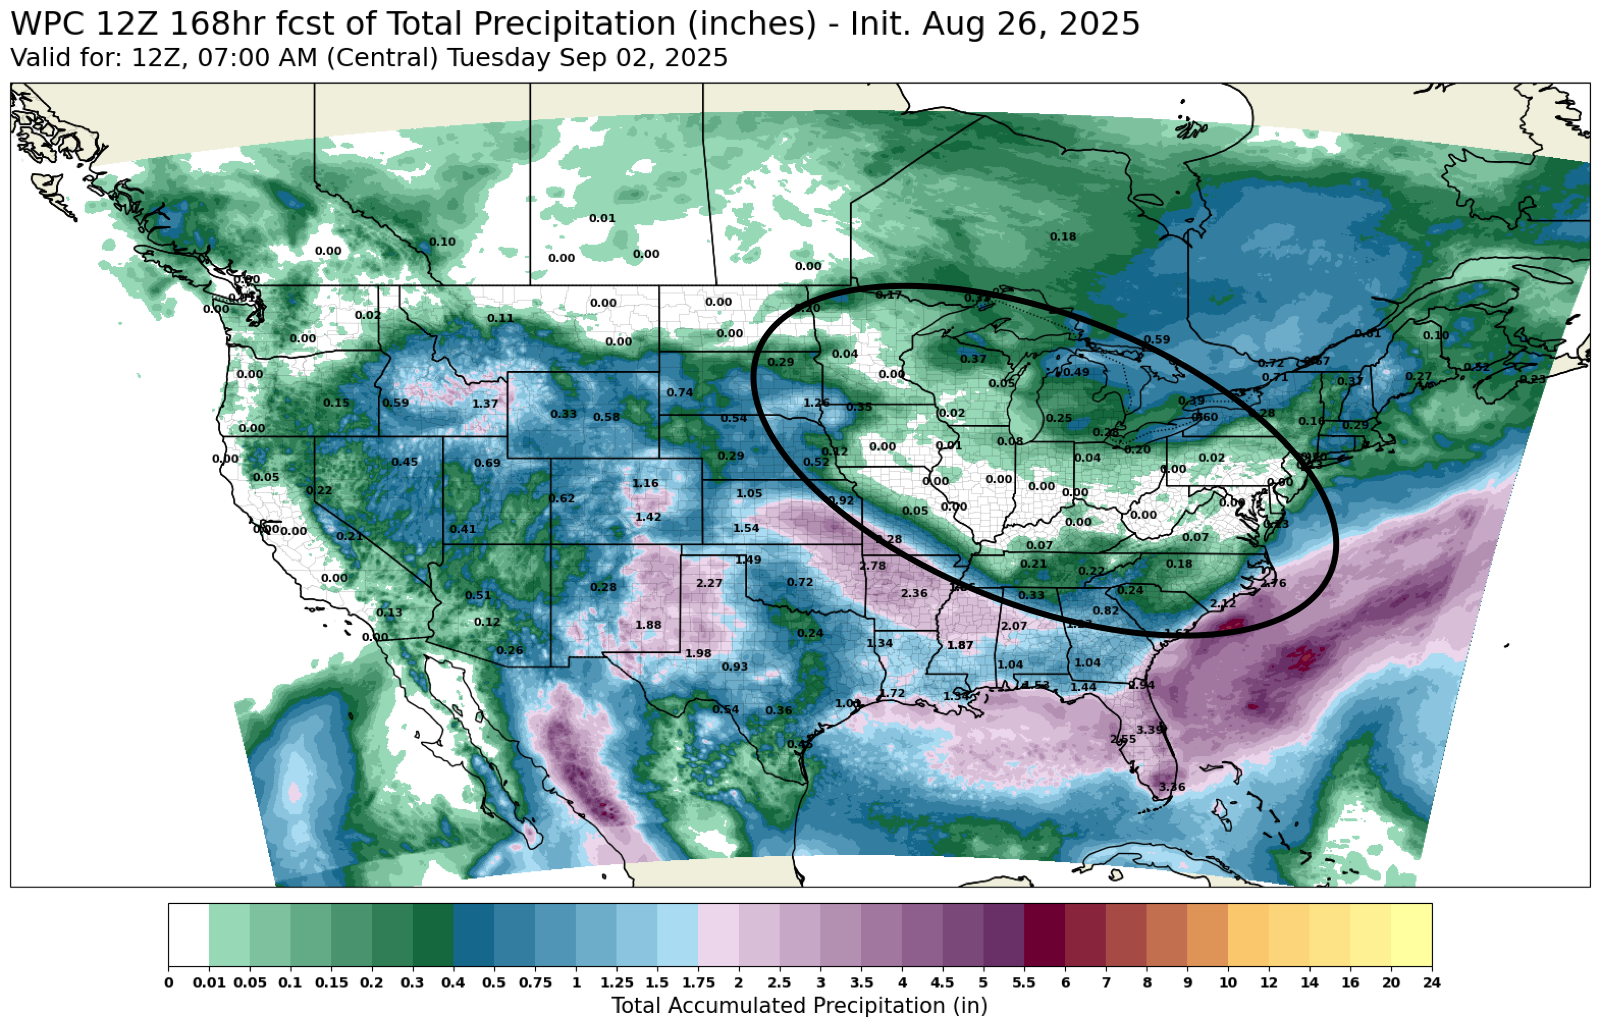
If we look at the forecasts, they remain dry through out the end of the month.
As there is virtually zero rain scheduled through the end of August for most of the corn belt.
I don’t know about you.. but if you couple this with one of the driest Augusts on record, it doesn’t scream "the crop is getting bigger".
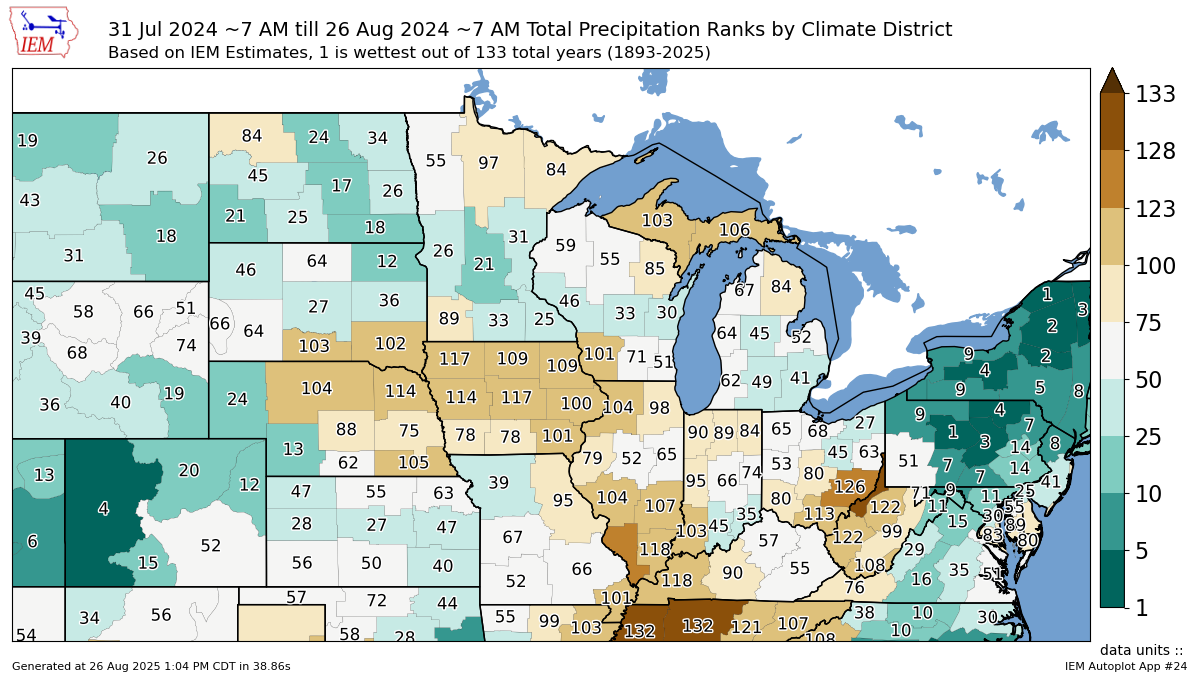
This Year vs Last Year
August weather is the make or break time frame for soybeans.
August weather still matters to the corn crop as well.
We saw how big of an impact a dry finish had last year.
I have no idea if this year will have as big of an impact as last year's dry finish.
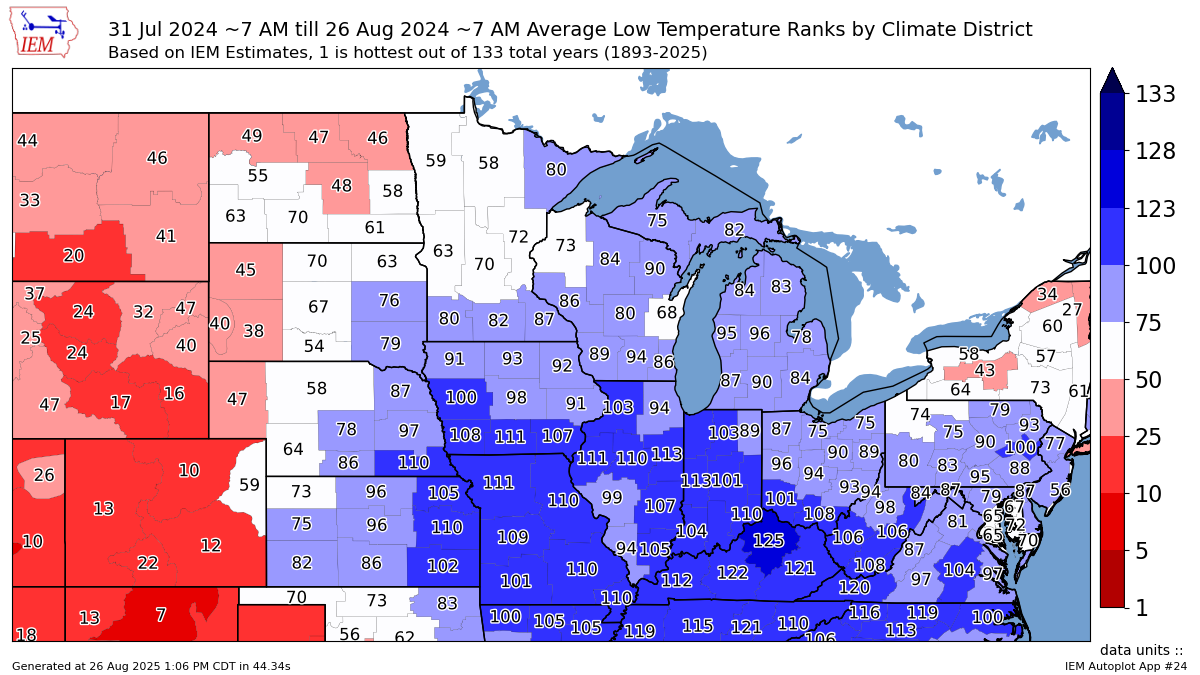
But here is a side by side August precip ranking for last year vs this year.
This year has been far drier up to this point.
2025

2024
Well what about temperature?
Neither this year nor last year featured a hot August.
Here is a side by side August overnight temp ranking.
Last year actually featured some of the coolest August nights on record.
2025
2024
The Funds Update
Corn 🌽
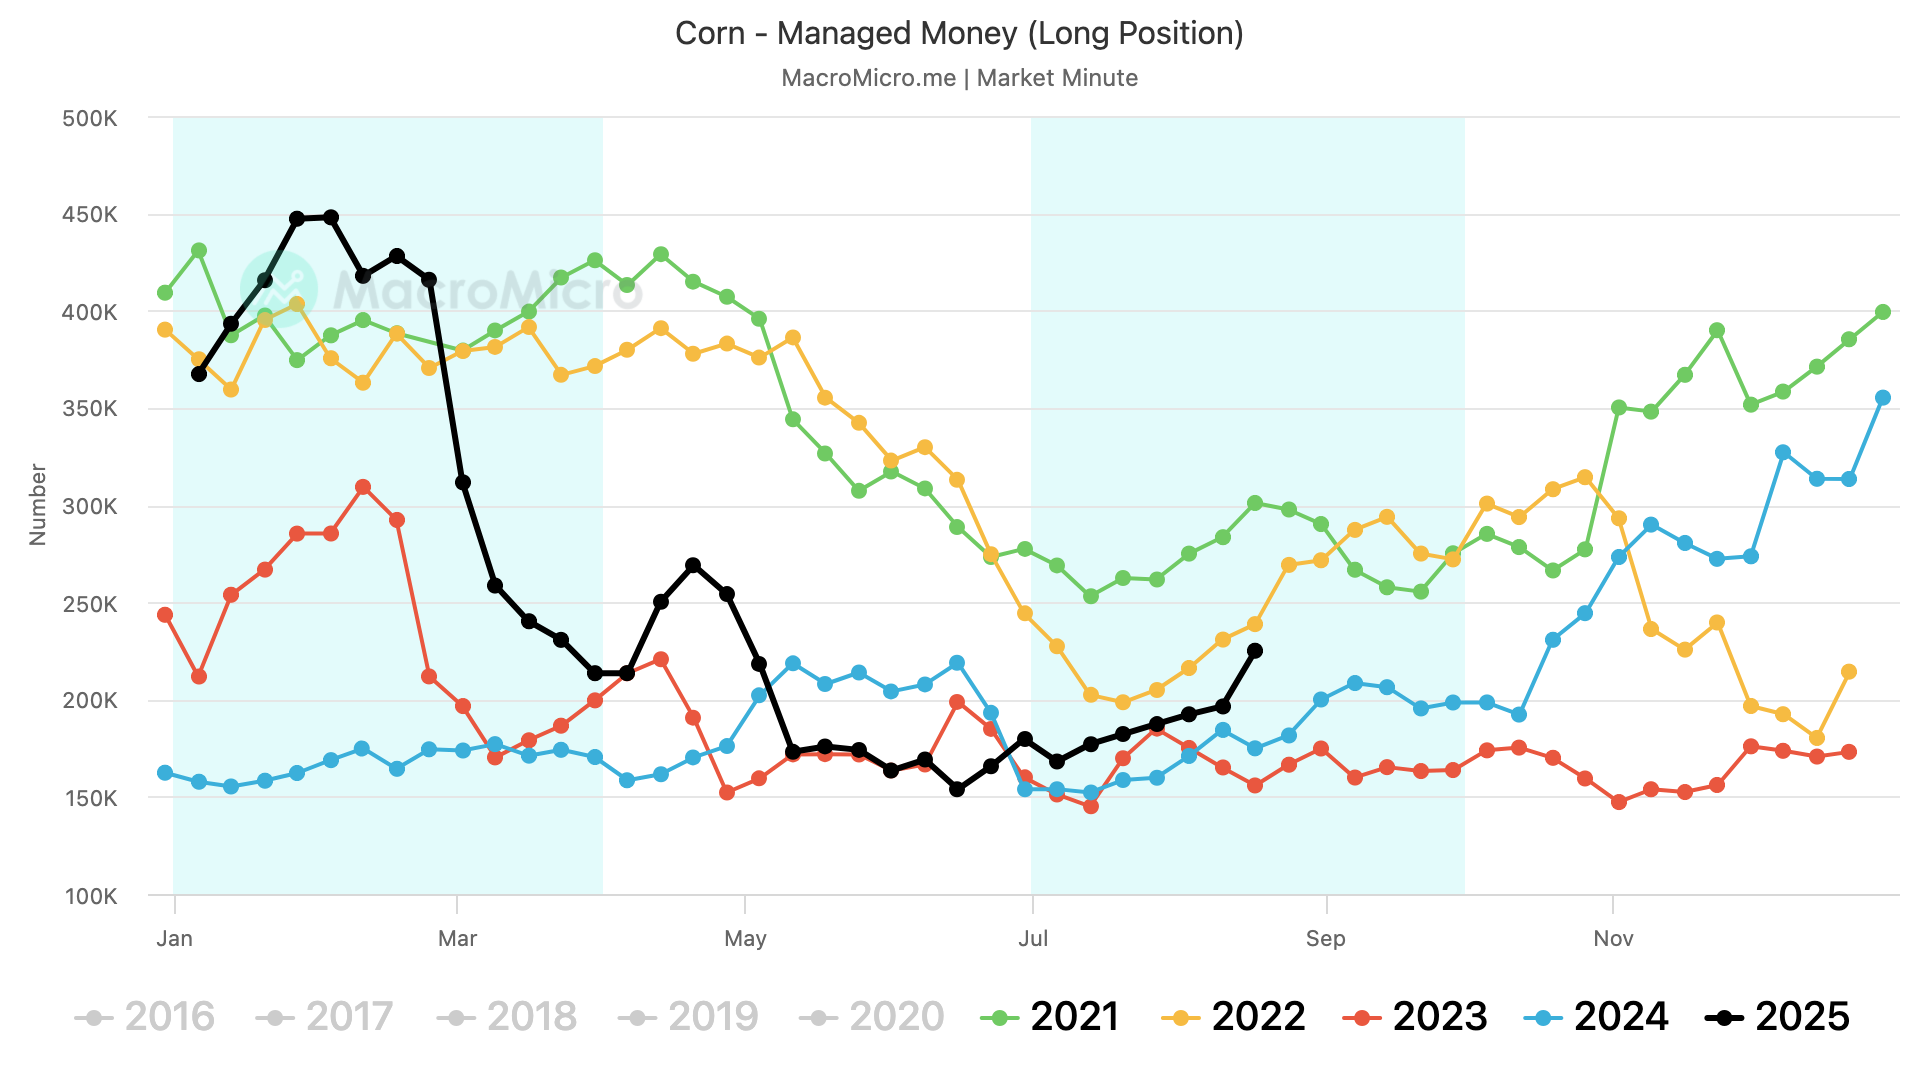
Last week the funds were buyers of corn for the 4th time in 7 weeks.
Now holding their least bearish stance in 3 months.
If you compare this year to last year. Last year we saw the funds start to shift right about where they recently did.

If we look at the actual short & long positions, rather than the total net position.
We can see that this recent move was almost entirely new long positions. Not short covering.
As the short positions are still sitting relatively high. Meanwhile, the long positions have really started to pick up.
The biggest long position for this time of year since 2022. However, it's the 2nd largest short position outside of last year. (for the past 5 years).
Meaning that shorts aren’t letting up yet. But some people are putting bullish bets on corn.

Soybeans 🌱
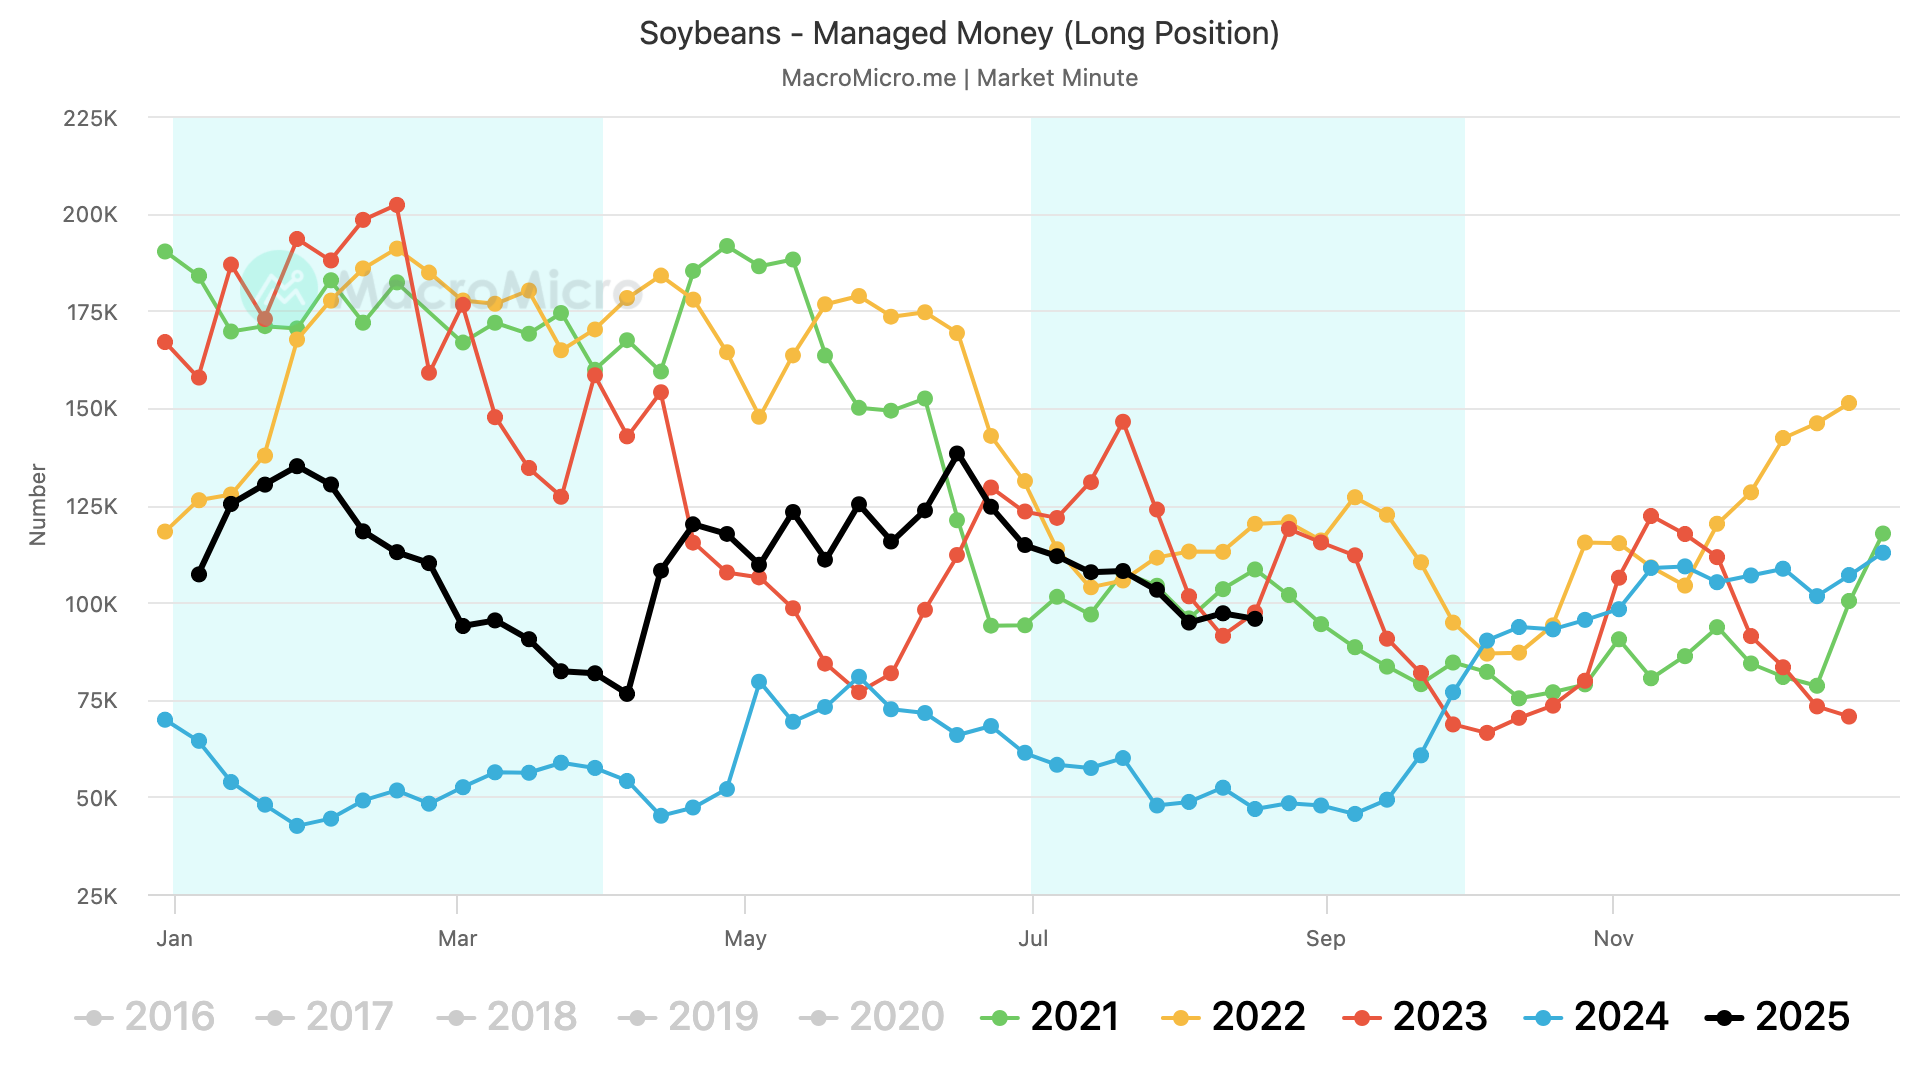
The funds are flat soybeans right now after becoming buyers the last few weeks.

However, unlike corn, the recent move was almost entirely short covering.
If you look at these charts of their short vs long positions.
The long positions barely moved. But the short positions have taken a noise dive.
Meaning that big money no longer wants to be short this market, but hasn’t fully committed to getting behind this market and being long.

Meal 🌱
The funds were big buyers of the meal market the past few weeks.
This comes after holding by far their largest short position on record.
Even after this big recent buying, they still hold their shortest position by a mile.
Surely nothing could go wrong here.


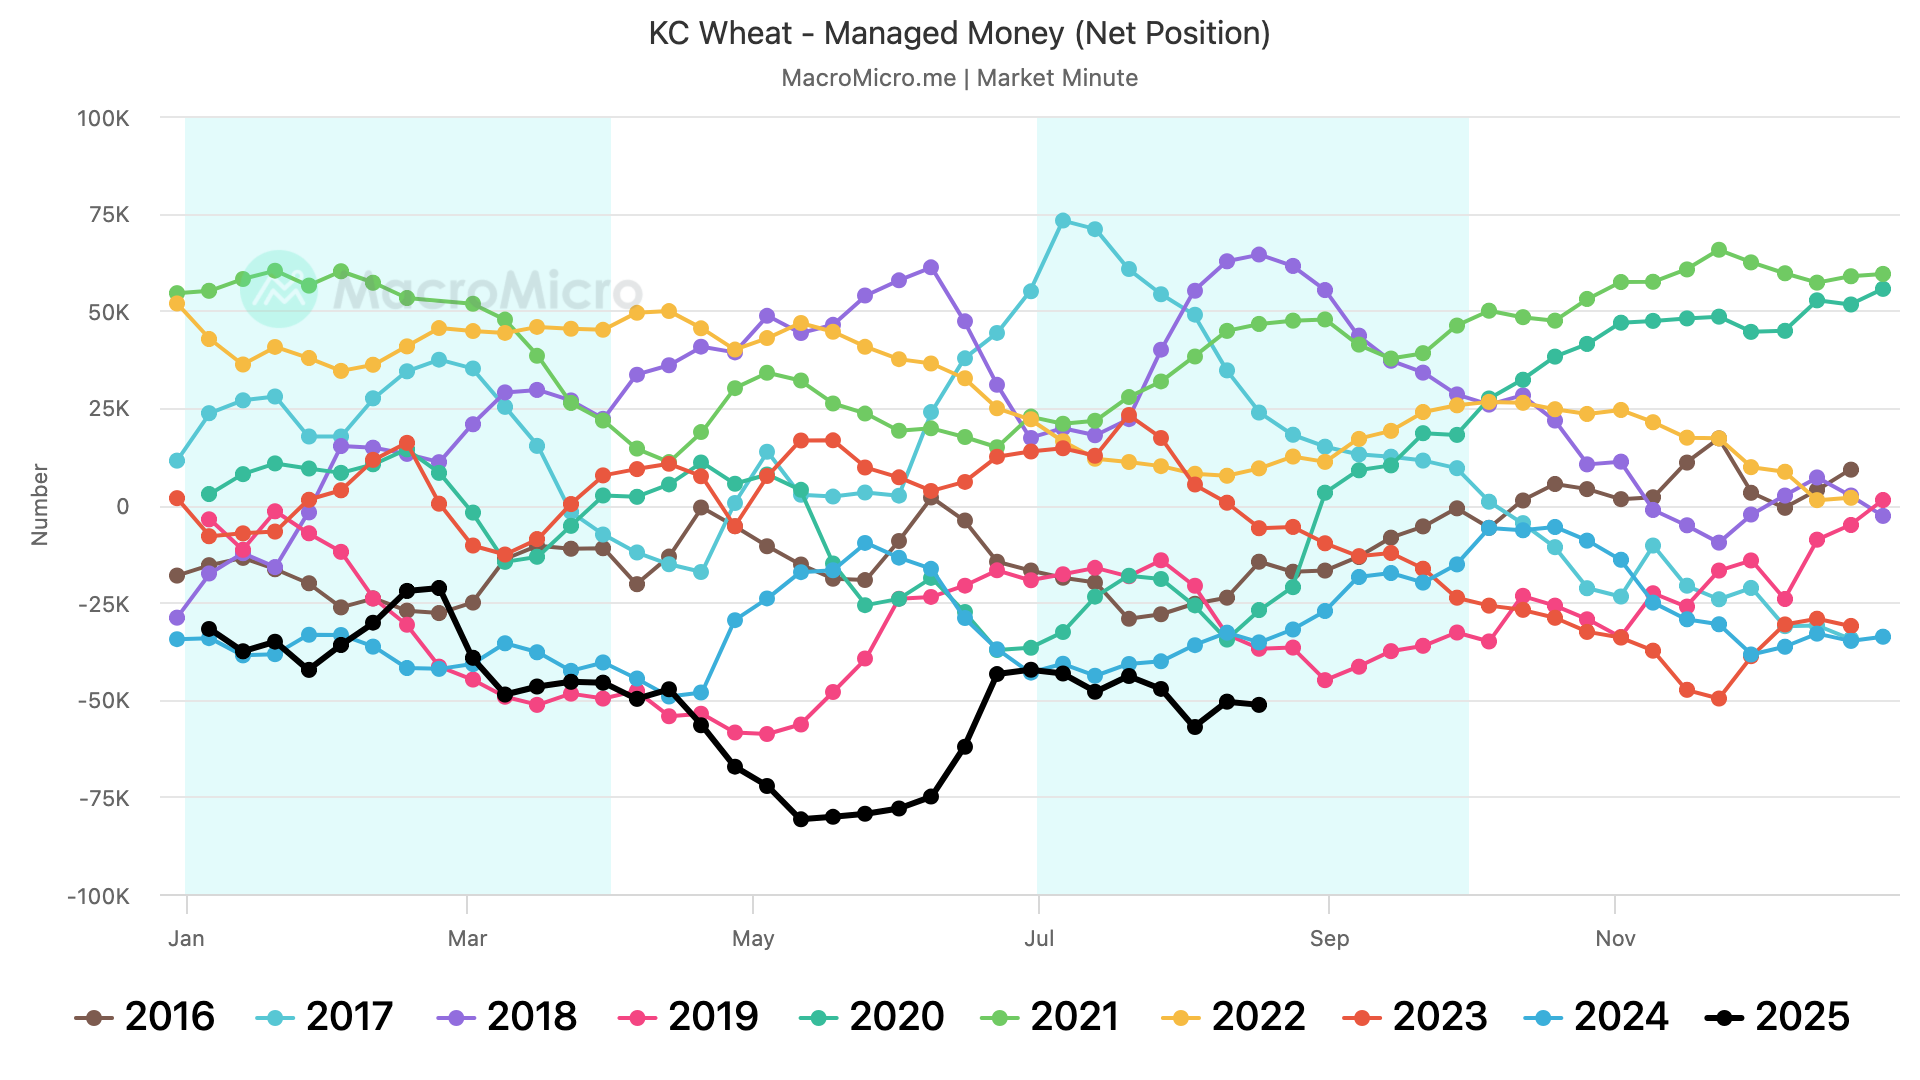
KC Wheat 🌾
The funds don’t have as bearish of a stance as they did back in May and June, but they are still holding one of their shortest positions on record.
Which opens the door for potential short covering.
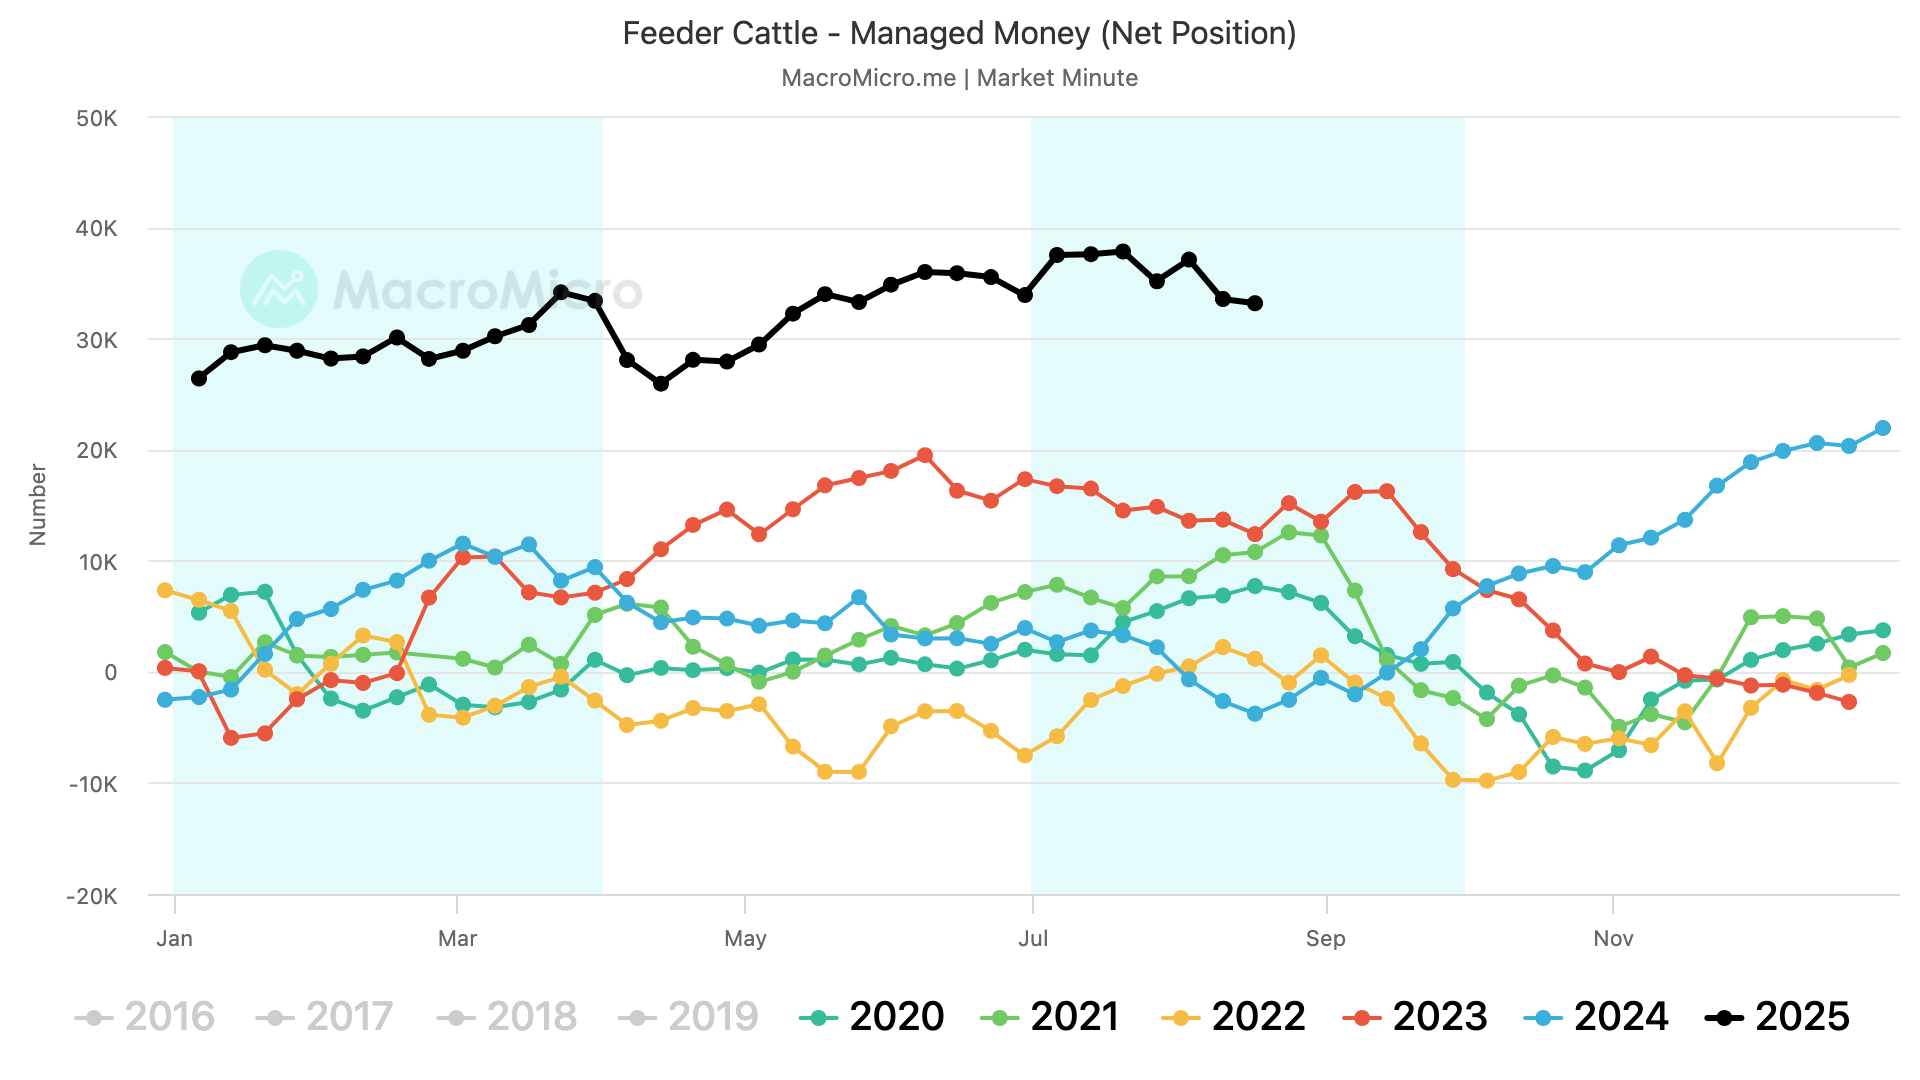
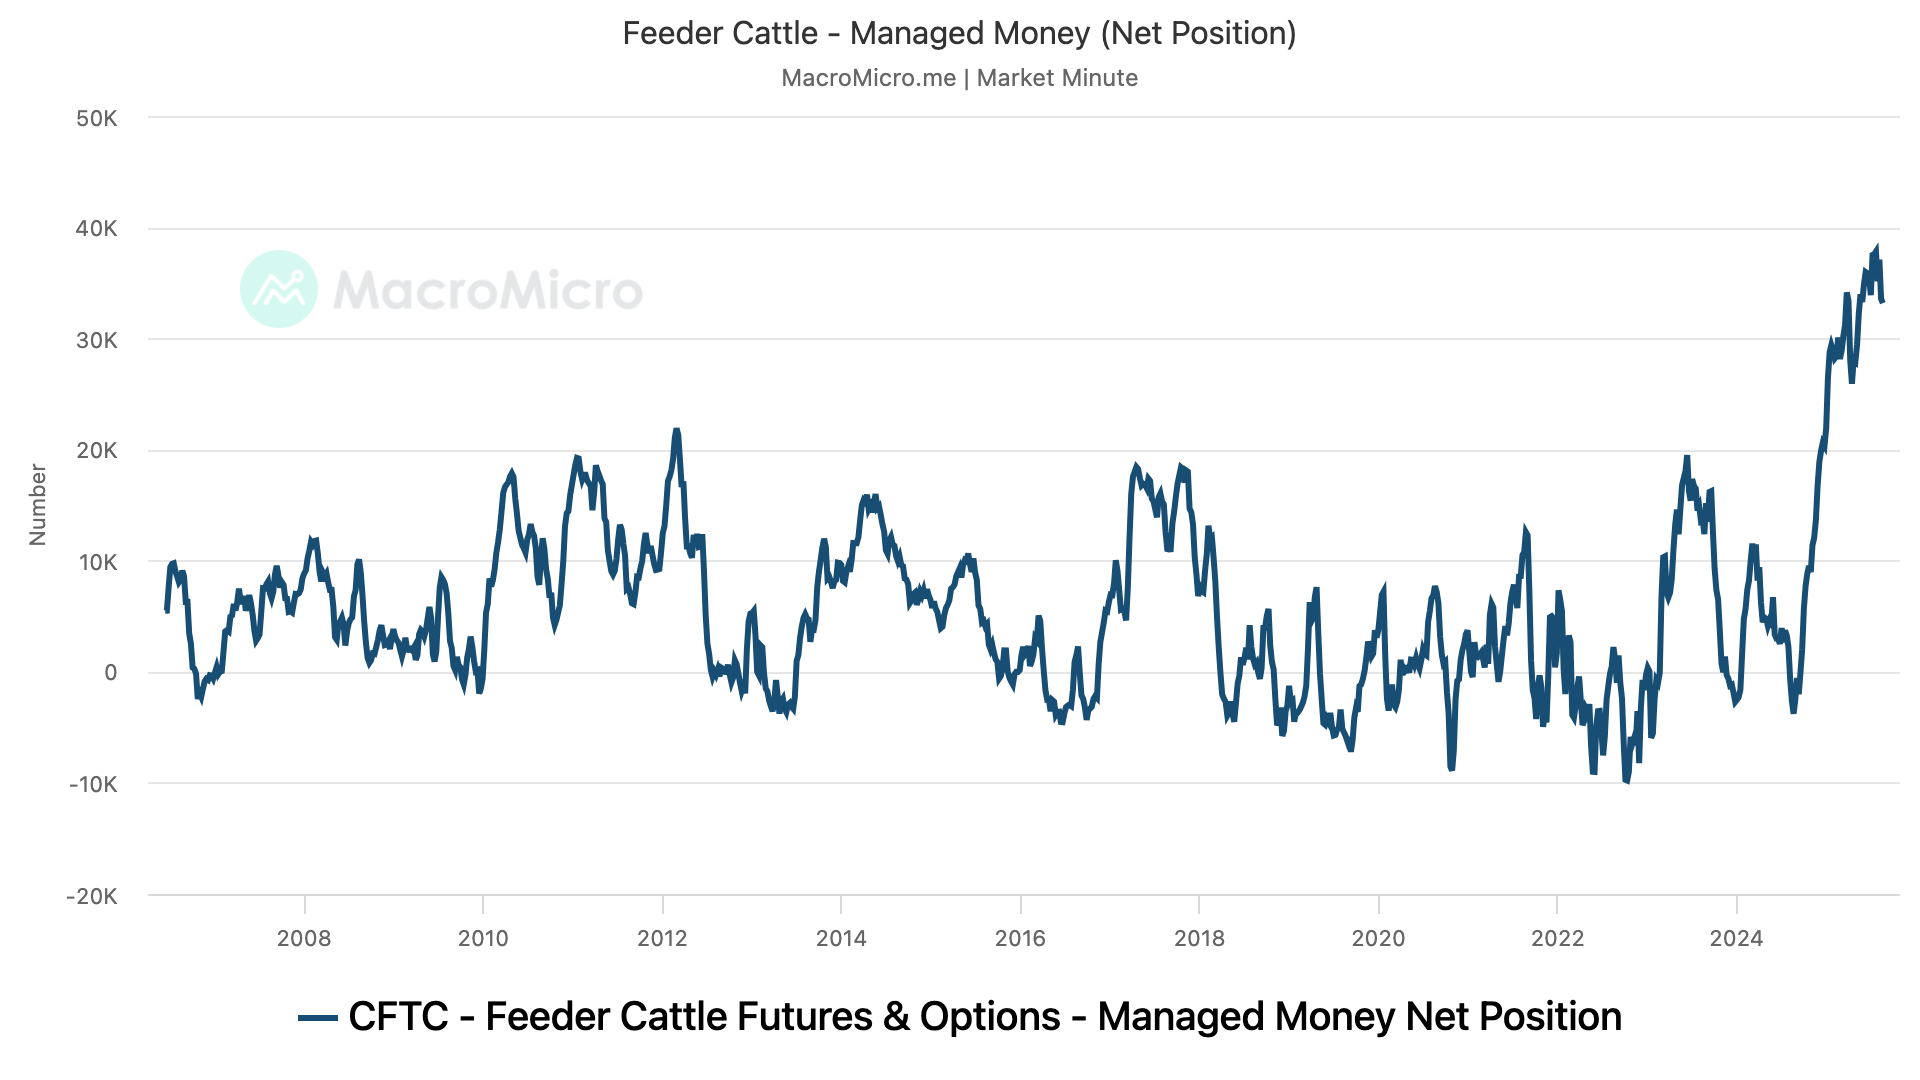
Feeder Cattle 🐮
As you could’ve probably guessed, the funds are holding their largest long position on record. It's not even close.
One of these years is not like the rest.
Them being this long does always offer the risk of them exiting.
Seasonally, they start to lighten up in August and September as grilling season comes to an end.
But the funds are more of trend followers than anything. So it would probably take a real factor to get them to give up this position.
It takes longer for fundamental factors to impact the cattle market than it does the grain market.
Basis
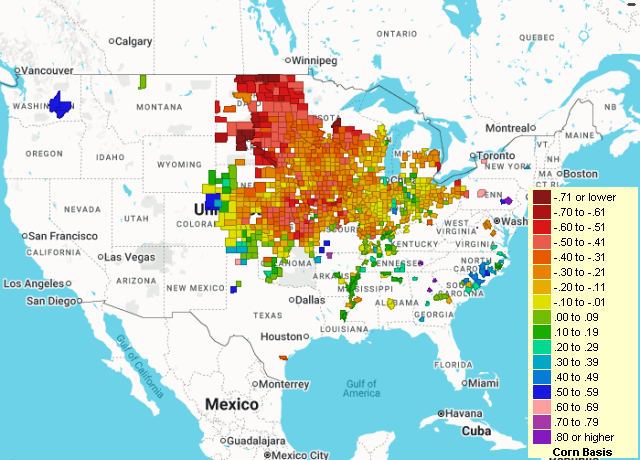
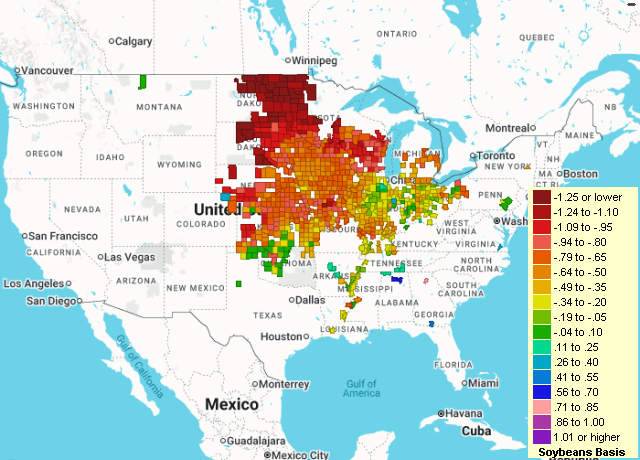
Here are basis maps for both corn & soybeans.
The northern plains are looking at some awful basis like we've talked about in our audio updates.
For corn many areas are looking at -30 to -70 under.
For soybeans some areas as are low as -1.25 under.
Why is this happening up north?
Because the product up there goes to the PNW, which goes to China. Without China in the market, we have too many beans in that area.
If you are in one of these areas, you need a game plan.
Because the elevators are already dumping their bids. So you need to find a way to capture the carry. To capture the carry you need to find a way to store it, roll it out, and wait for basis.
If you want to put together a game plan give us a call: (605)295-3100
Corn Basis
Soybean Basis
Today's Main Takeaways
Corn
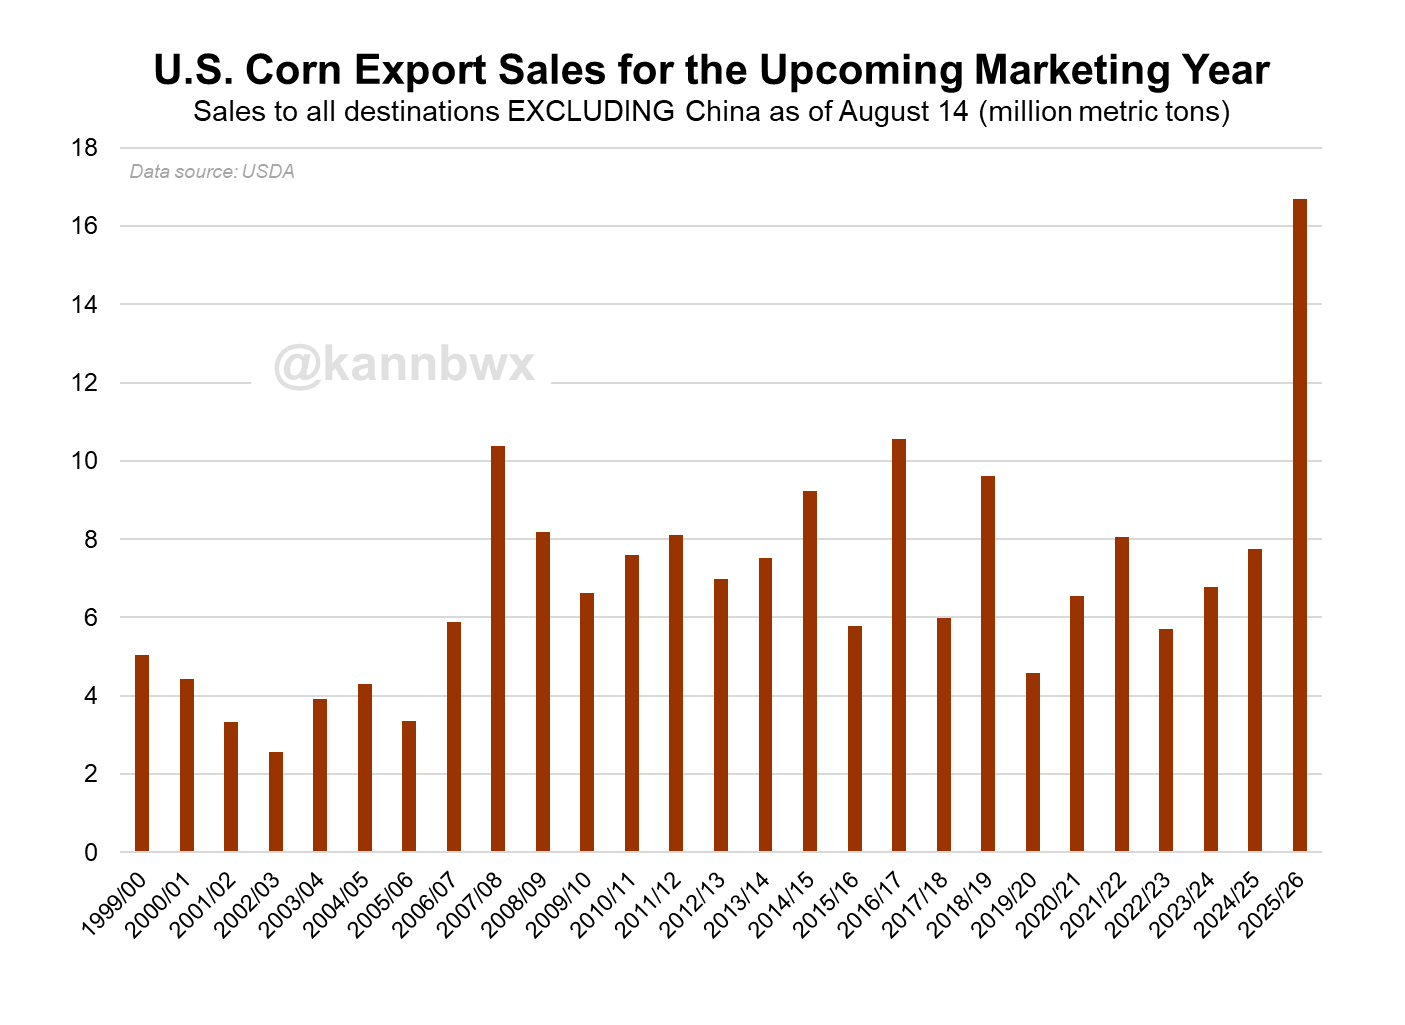
Demand remains the bright spot in the corn market.
I showed this chart last week, but look at this chart from Karen Braun that highlights export sales to all destinations excluding China.
We are +60% higher than any year we have seen before.
Not going to go too deep into corn today.
Do I see a path for a +50 cent rally short term? No.
But do I think we should spend much time below $4 if at all? Also no.
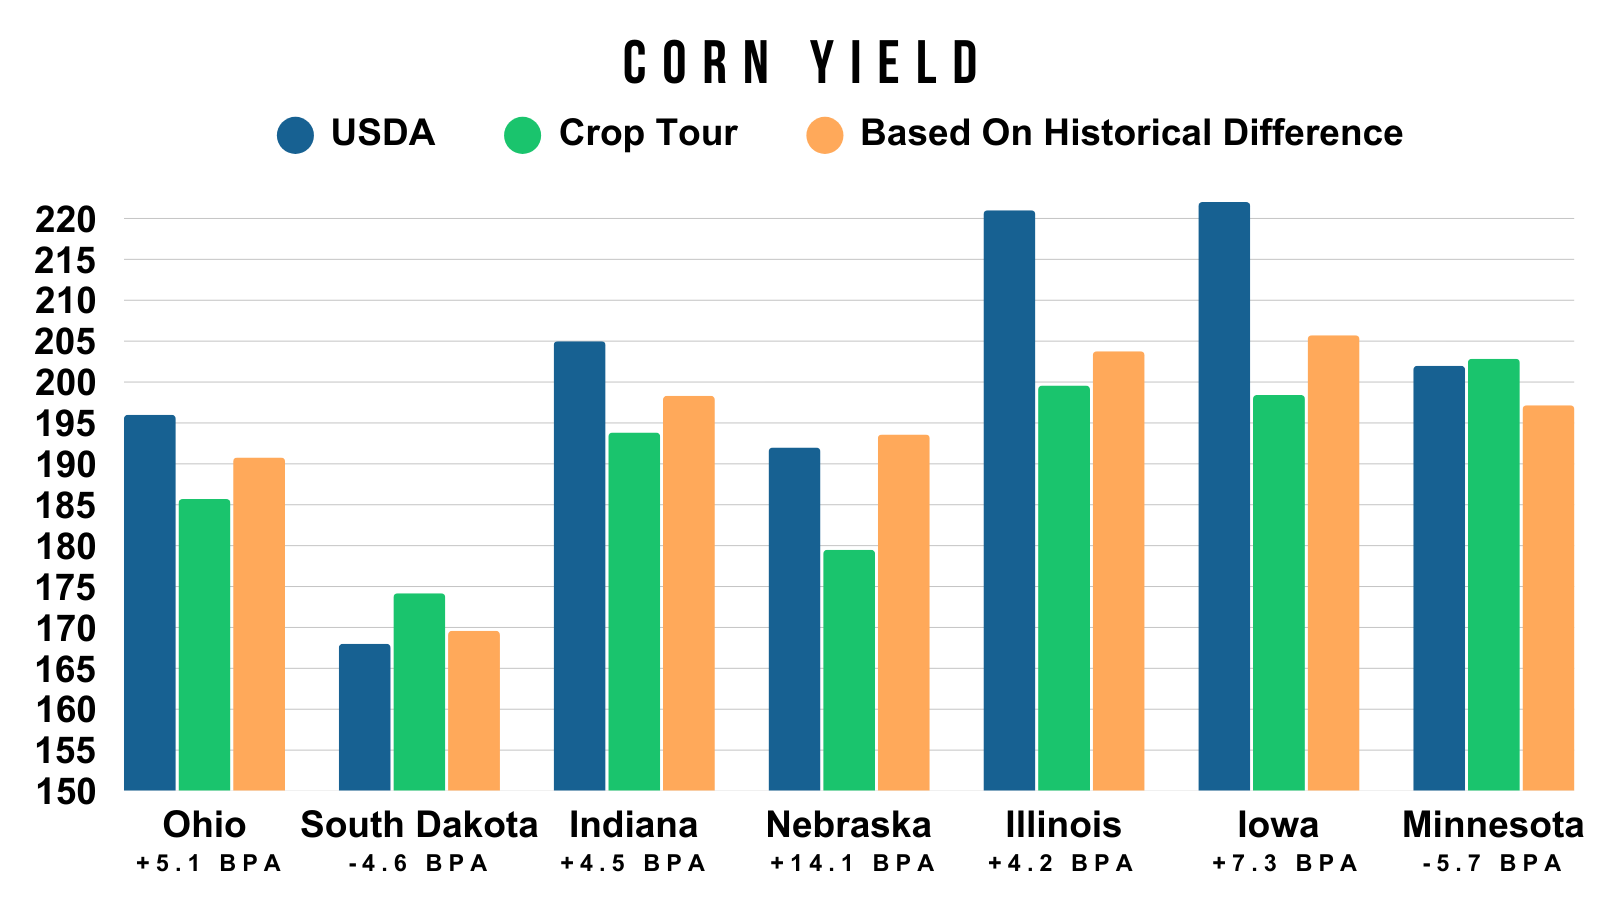
I have a very hard time believing the USDA's 189 yield is accurate at the end of the day.
The crop has been getting smaller. Not bigger.
If we look at how the USDA stacks up to the crop tour vs how much the crop tour historically is off, there are plenty of areas that suggest the USDA might be too high.
You've got Ohio, Indiana, and Illinois that are all questionable and have seen a pretty dry August.
To get a monster national yield, you almost need Illinois to have a bumper crop.
(Based on this data, the USDA could be too high on Iowa as well. But I personally have a hard time thinking Iowa won’t have a monster crop.)
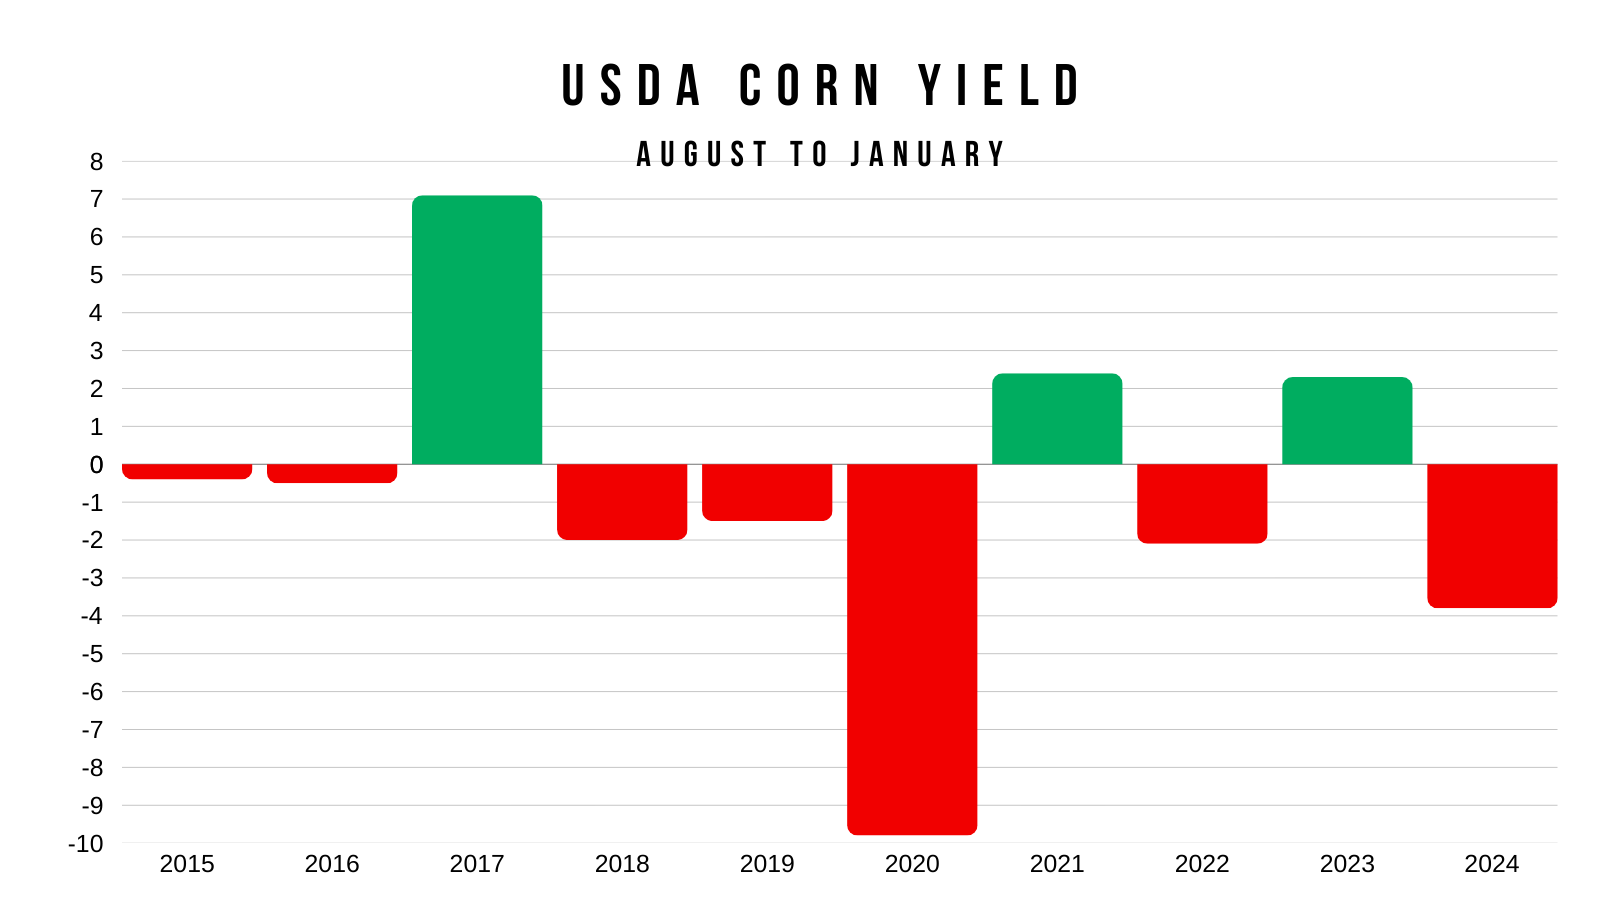
Here is a chart that shows USDA's August yield vs final yield.
Final yield has came in lower than the August number 7 of the last 10 years.
I don’t think this year will be any different.
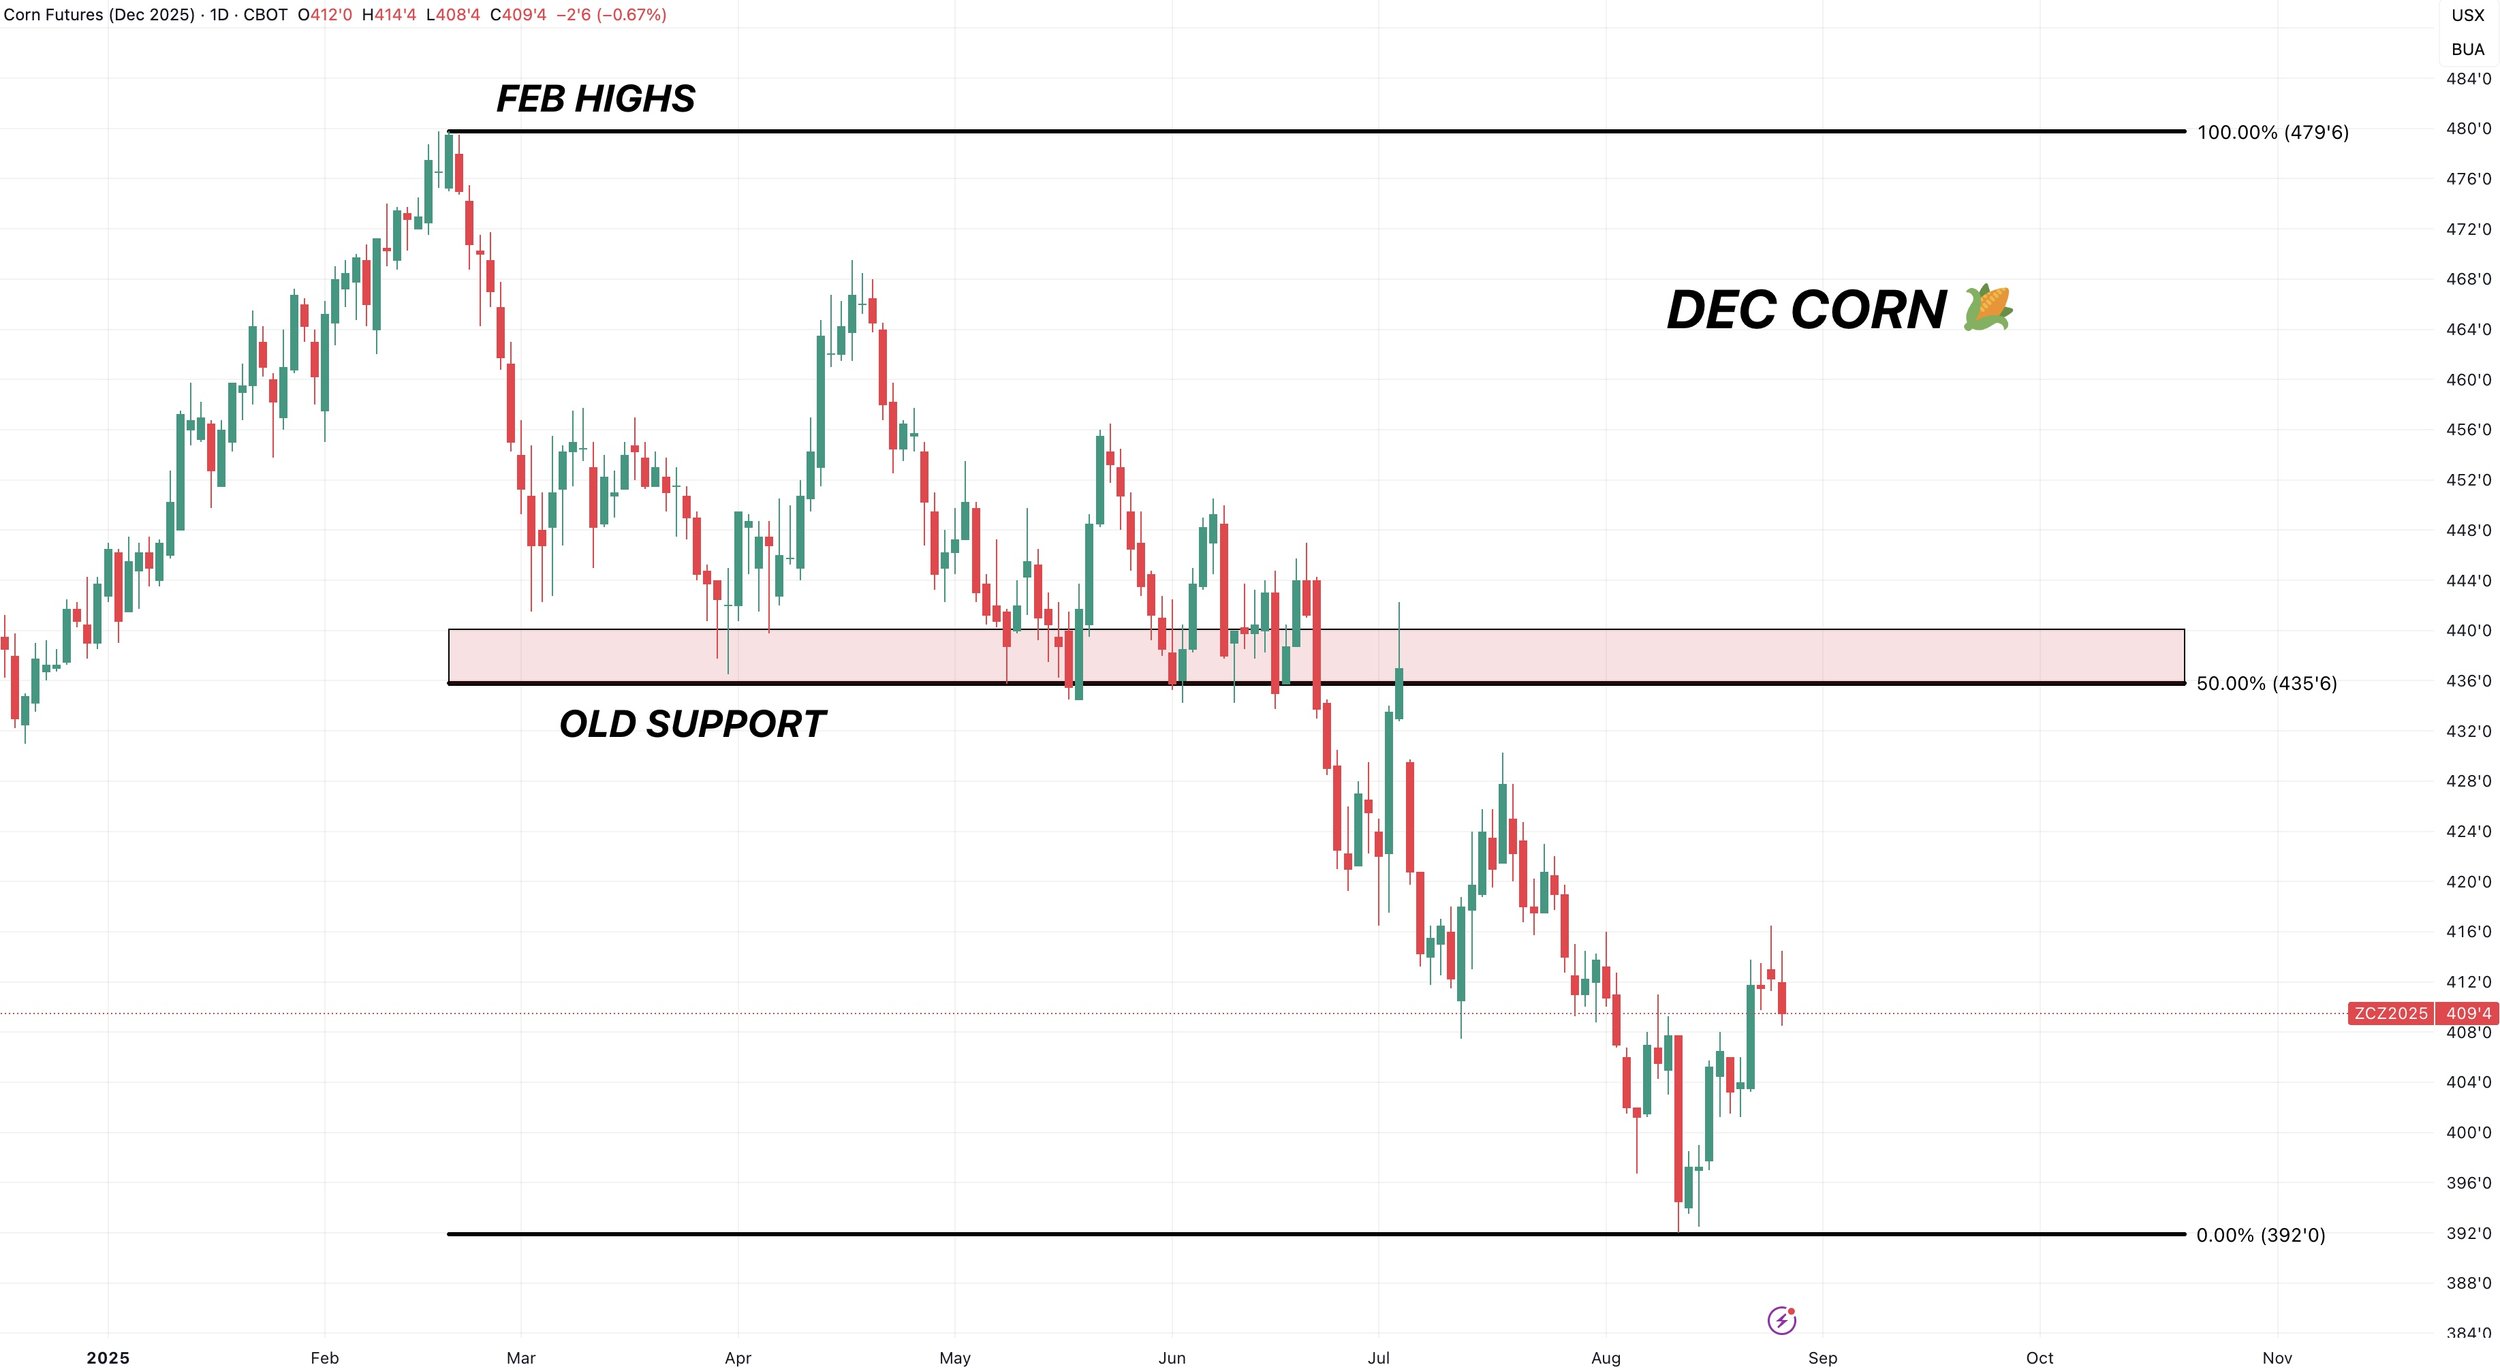
Daily Dec Chart:
Like I've been talking about for a while, this red box was our short term target and spot to exit that buy signal.
As this was the place the market had to make a decision.
We rejected right off that 61.8% retracement up to the mid-July highs.
The most common spot for a market to revert to.
It is now looking like we might be in for a short term correction.
How low?
$4.01 to $4.04 would be a standard correction. So that is the area I am eyeing.
That gives back 50-61.8% of the recent rally.
That is the area we need to hold to keep the bullish structure in place. If we break below that box, the next stop is the contract lows again.
On the other hand, if we break above $4.16 the chart opens wide up.

Now altough I see us getting a short term correction after rejecting that short term target, I still don’t love making corn sales at $4.10 this far below the cost of production despite the +20 cent rally.
However, if we can crawl up to $4.30 to $4.40 then I'd be more inclined to.
$4.35 would give back 50% of the February highs.
It also happens to be old support from May and June.
Soybeans
Last Friday we had a sell signal for soybeans.
If you missed it: CLICK HERE
I think soybeans have all the upside "potential in the world.
The key word there is "potential"
But we were approaching our first upside target and thought it made sense to reward an +80 cent rally, as there are definitely negative risks here as well.
Now why do I think we have potential?
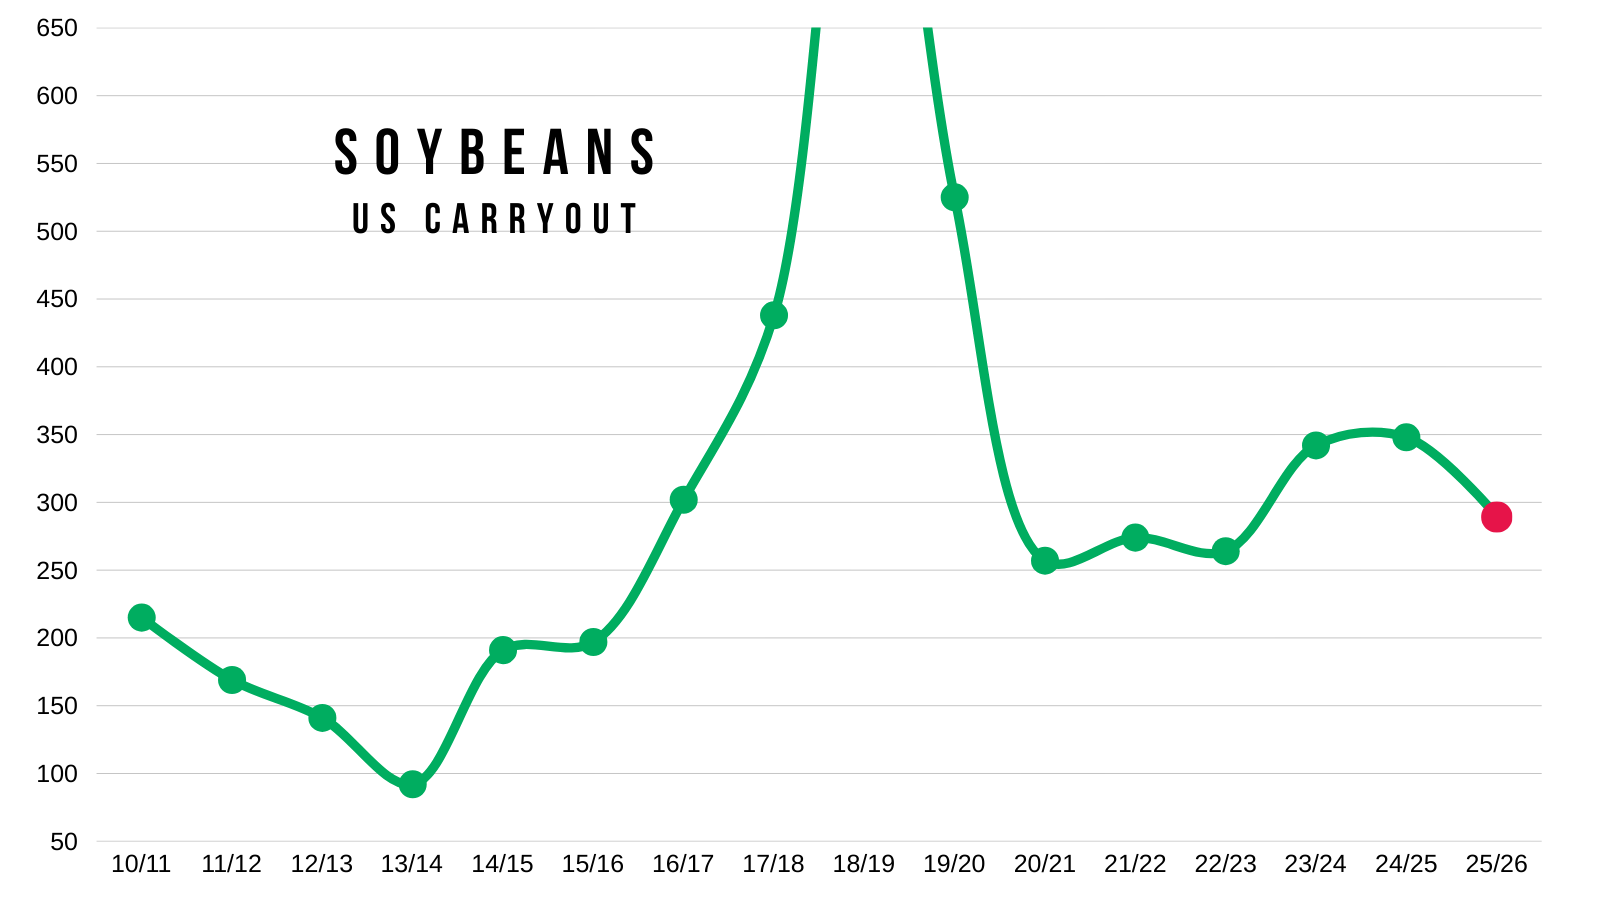
We are still sub $11.00 with a new crop carryout of under 300 million bushels.
That is a 3 year low.
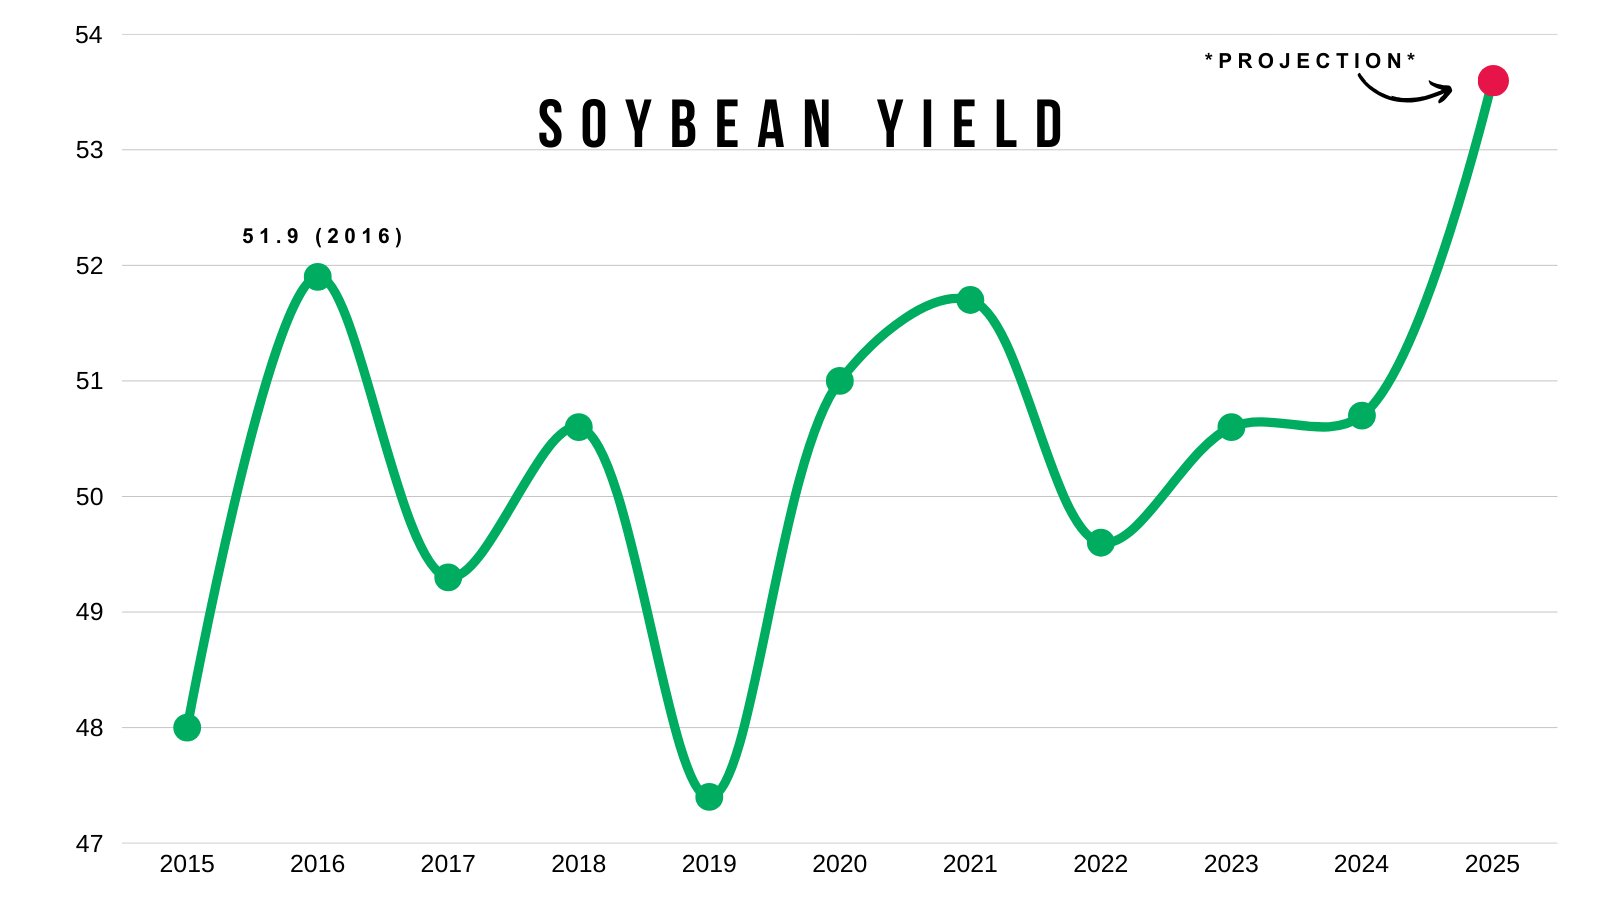
You need a 53.6 bpa yield to acheive this carryout.
We've never seen a yield above 51.9 bpa. Record is 51.9 in 2016.
I've done balance sheet comparisons a thousand times, but here is the current balance sheet vs if yield came in at just 52 bpa.
Which would still be a record yield.
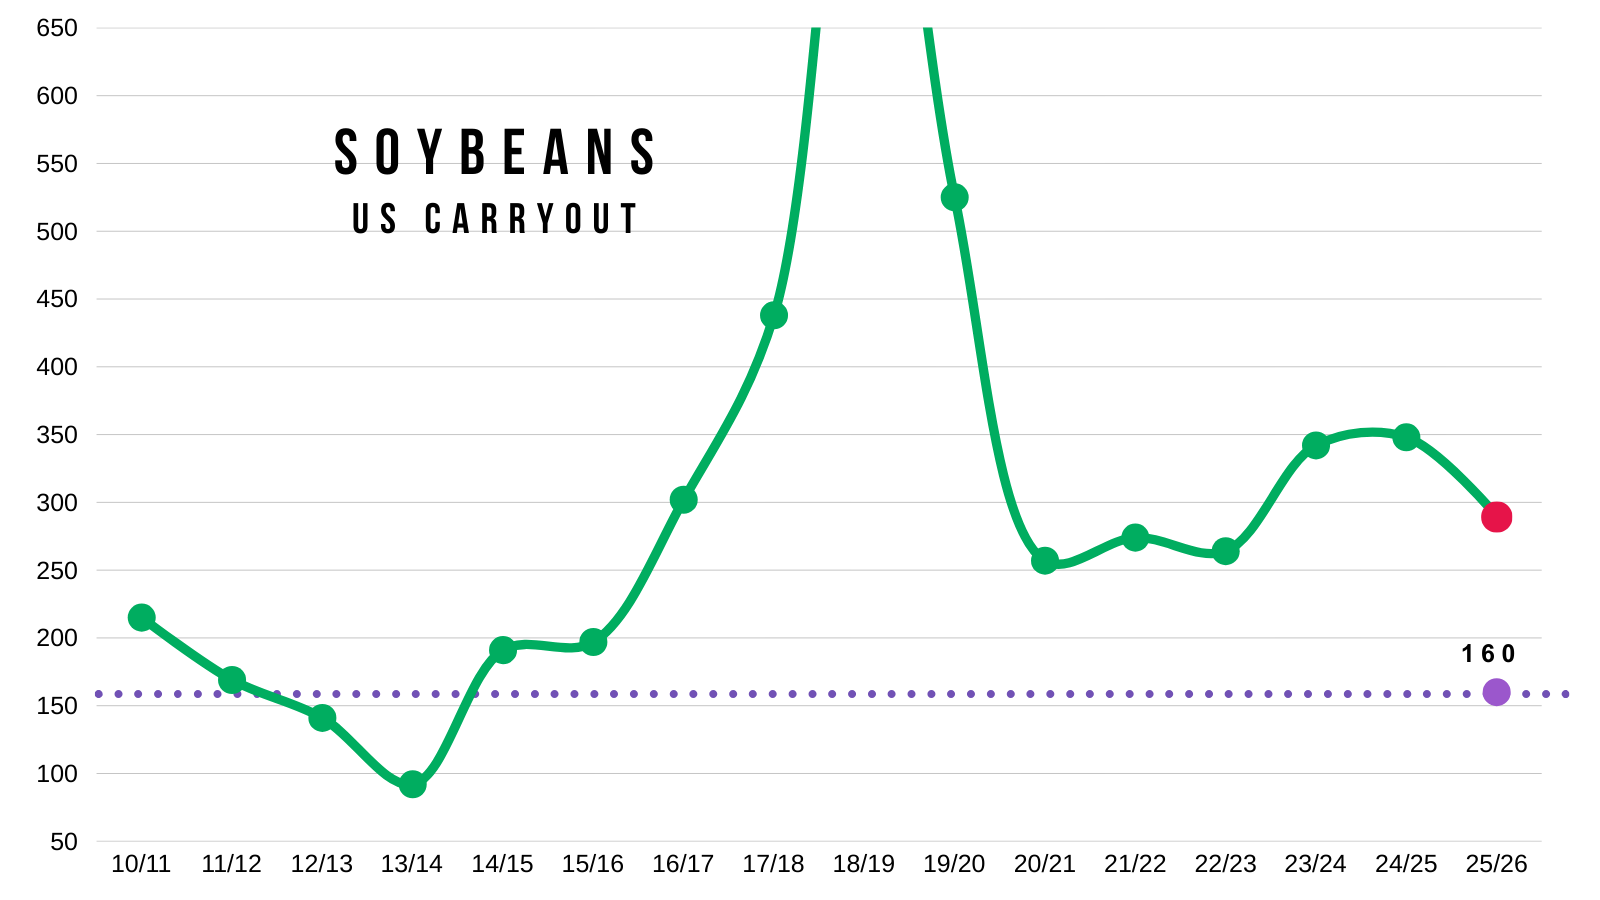
Without changing demand, carryout drops from 290 to 160.
Balance Sheet = 53.6 Yield
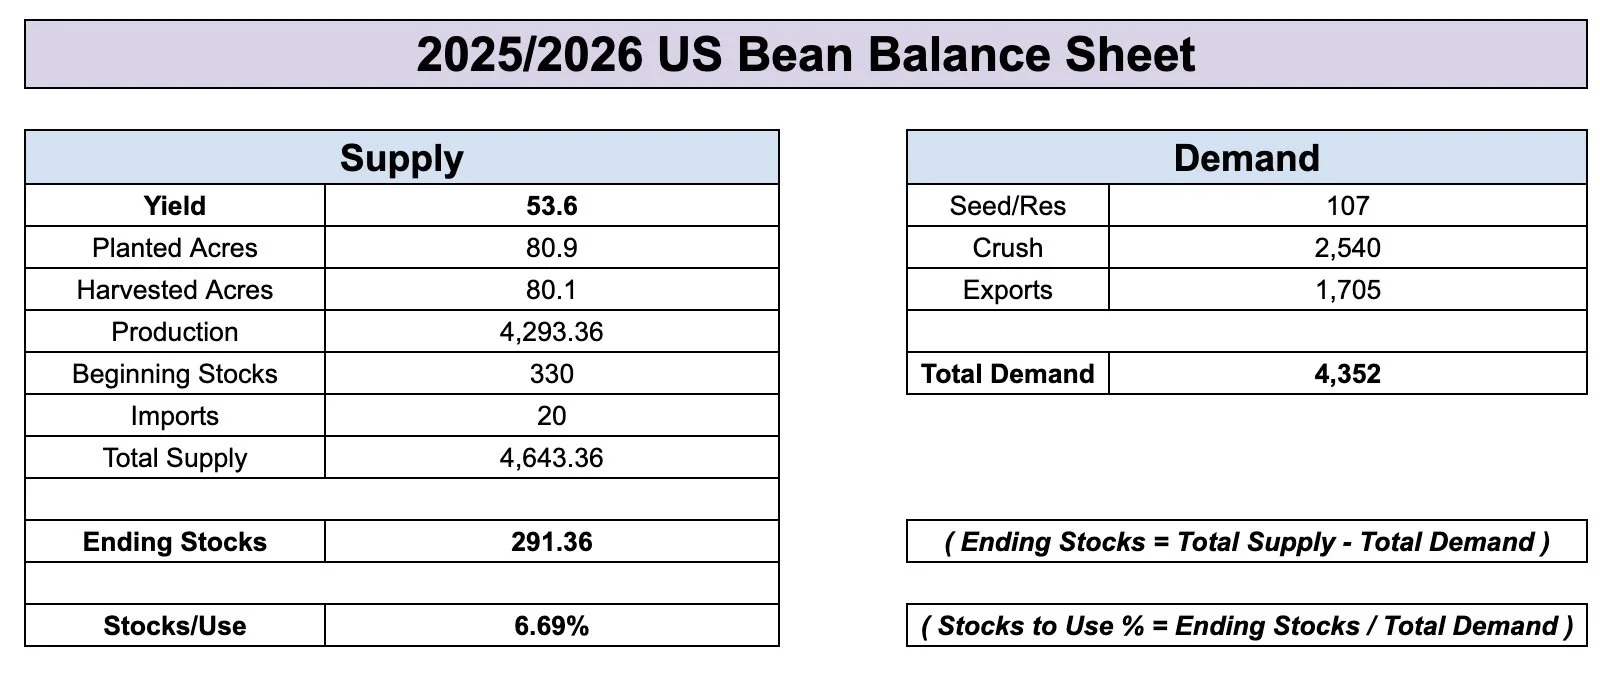
Balance Sheet = 52.0 Yield
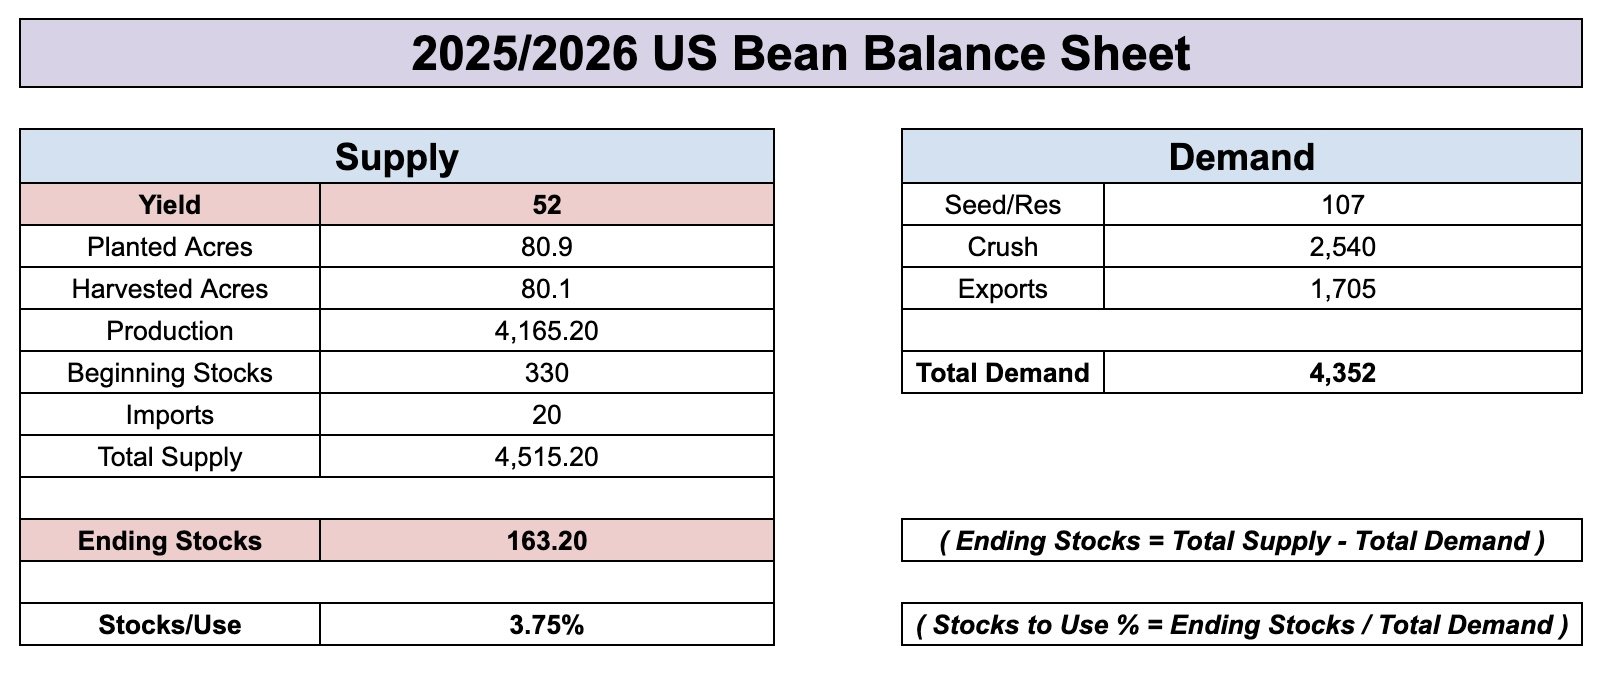
That carryout would be the lowest in over a decade.
Even with a record 52 yield.
However the biggest risk in this market is demand.
You could very easily argue that our export demand is overstated.
Which in turn, could flip that balance sheet right around.
Going from a razor thin margin of error, to a much looser situation.
China still hasn’t bought any beans.
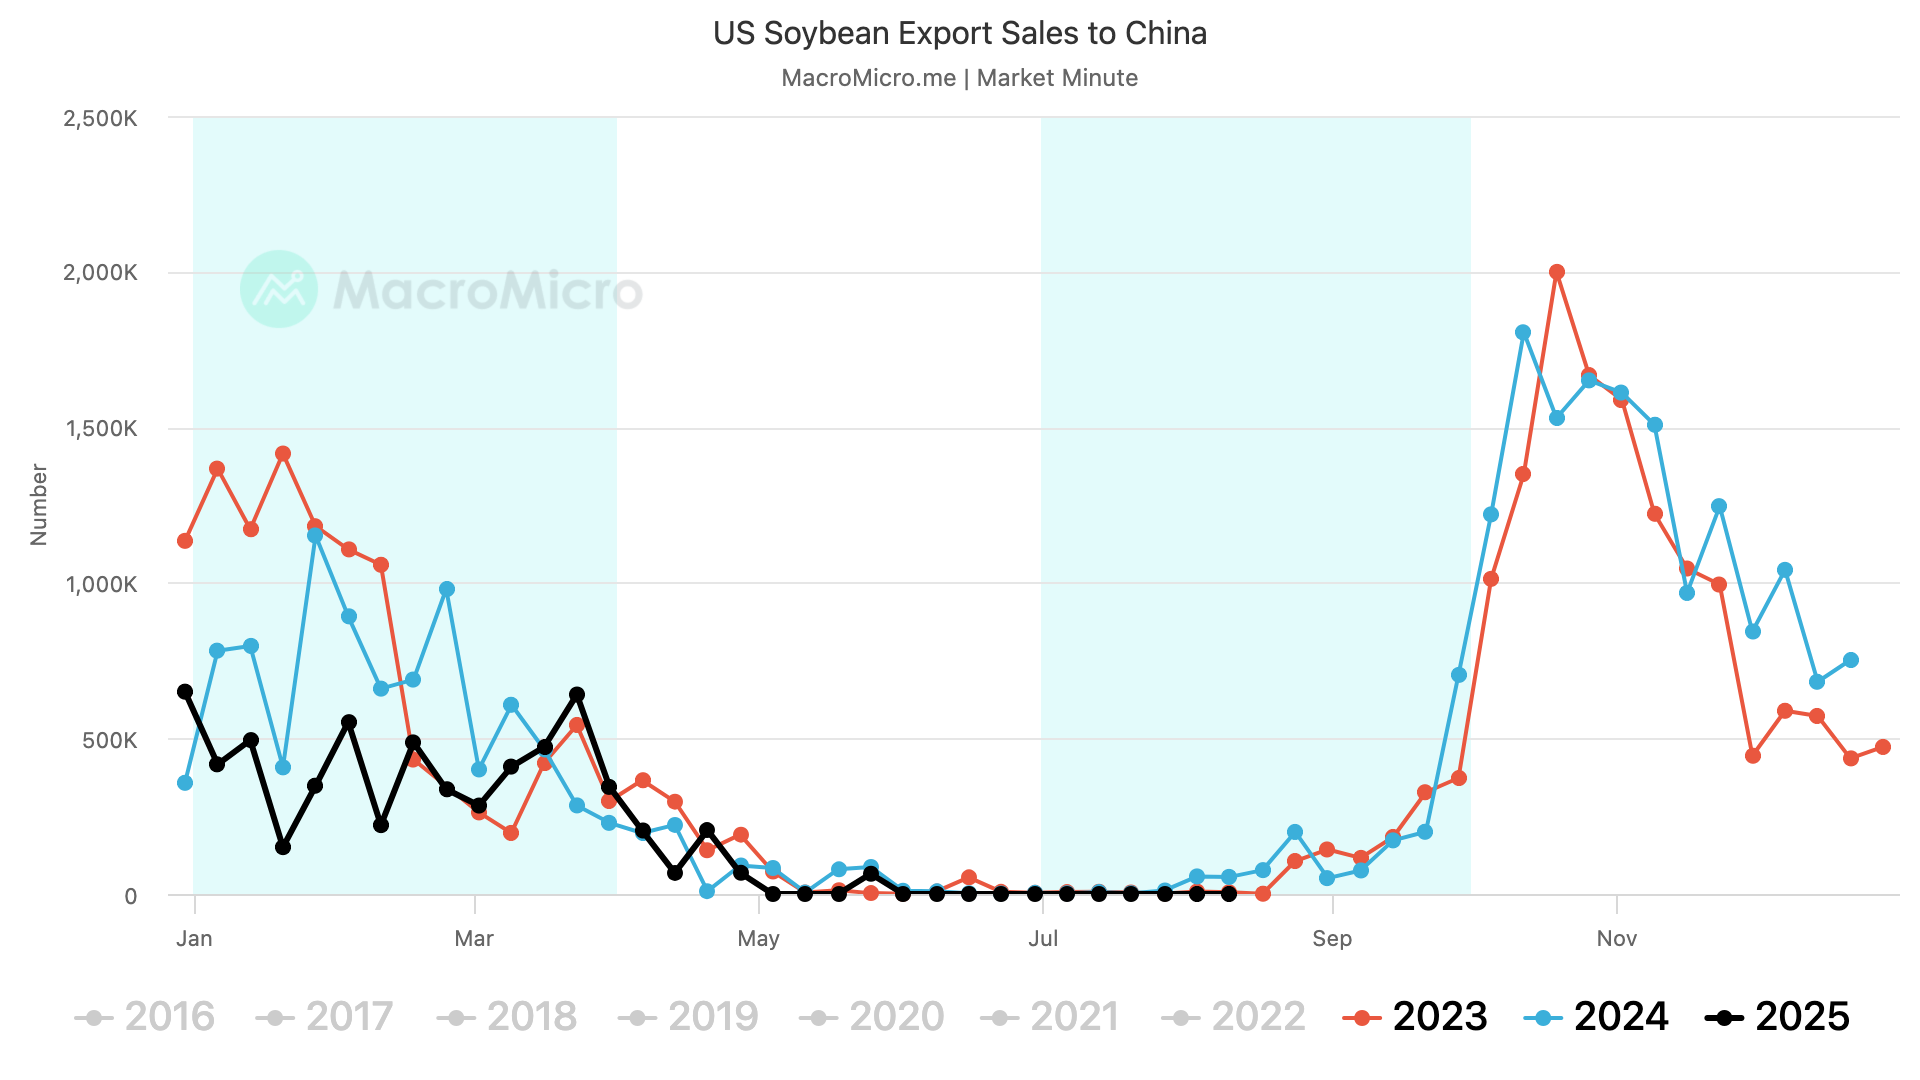
Some are bearish on soybeans because China hasn’t bought beans.
What if they don’t and export demand gets killed?
Some are bullish on soybeans because China hasn’t bought beans.
What if they do and export demand is fine.
Or the last scenario would be, what if we strike a deal? Then our exports go through the roof and the US doesn’t have enough supply to meet the purchases?
It's impossible to know which scenario will play out.
But if China starts buying soybeans or we land a real trade deal, the upside is there.
The possibility for soybeans to be $1.50 higher or $1.50 lower by next year both exist.
Daily Nov Chart:
Nov beans have only closed above Friday's high 4 times this entire year.
Again, another reason why we alerted that sell signal.

Short term, bulls want to hold $10.40
That gives back 61.8% of the recent mini rally.
If we fail there, we could fall all the way down to $10.12 to $10.22. Which would be 50-61.8% of the entire rally since $9.80.
If we fell that far, the bullish structure of this chart would still be in place.
Break below $10.12 and the bias shifts lower. But until then, the bias remains higher.

My next target to alert a sell signal is currently $10.82
As that gives back 50% of the May 2024 highs.
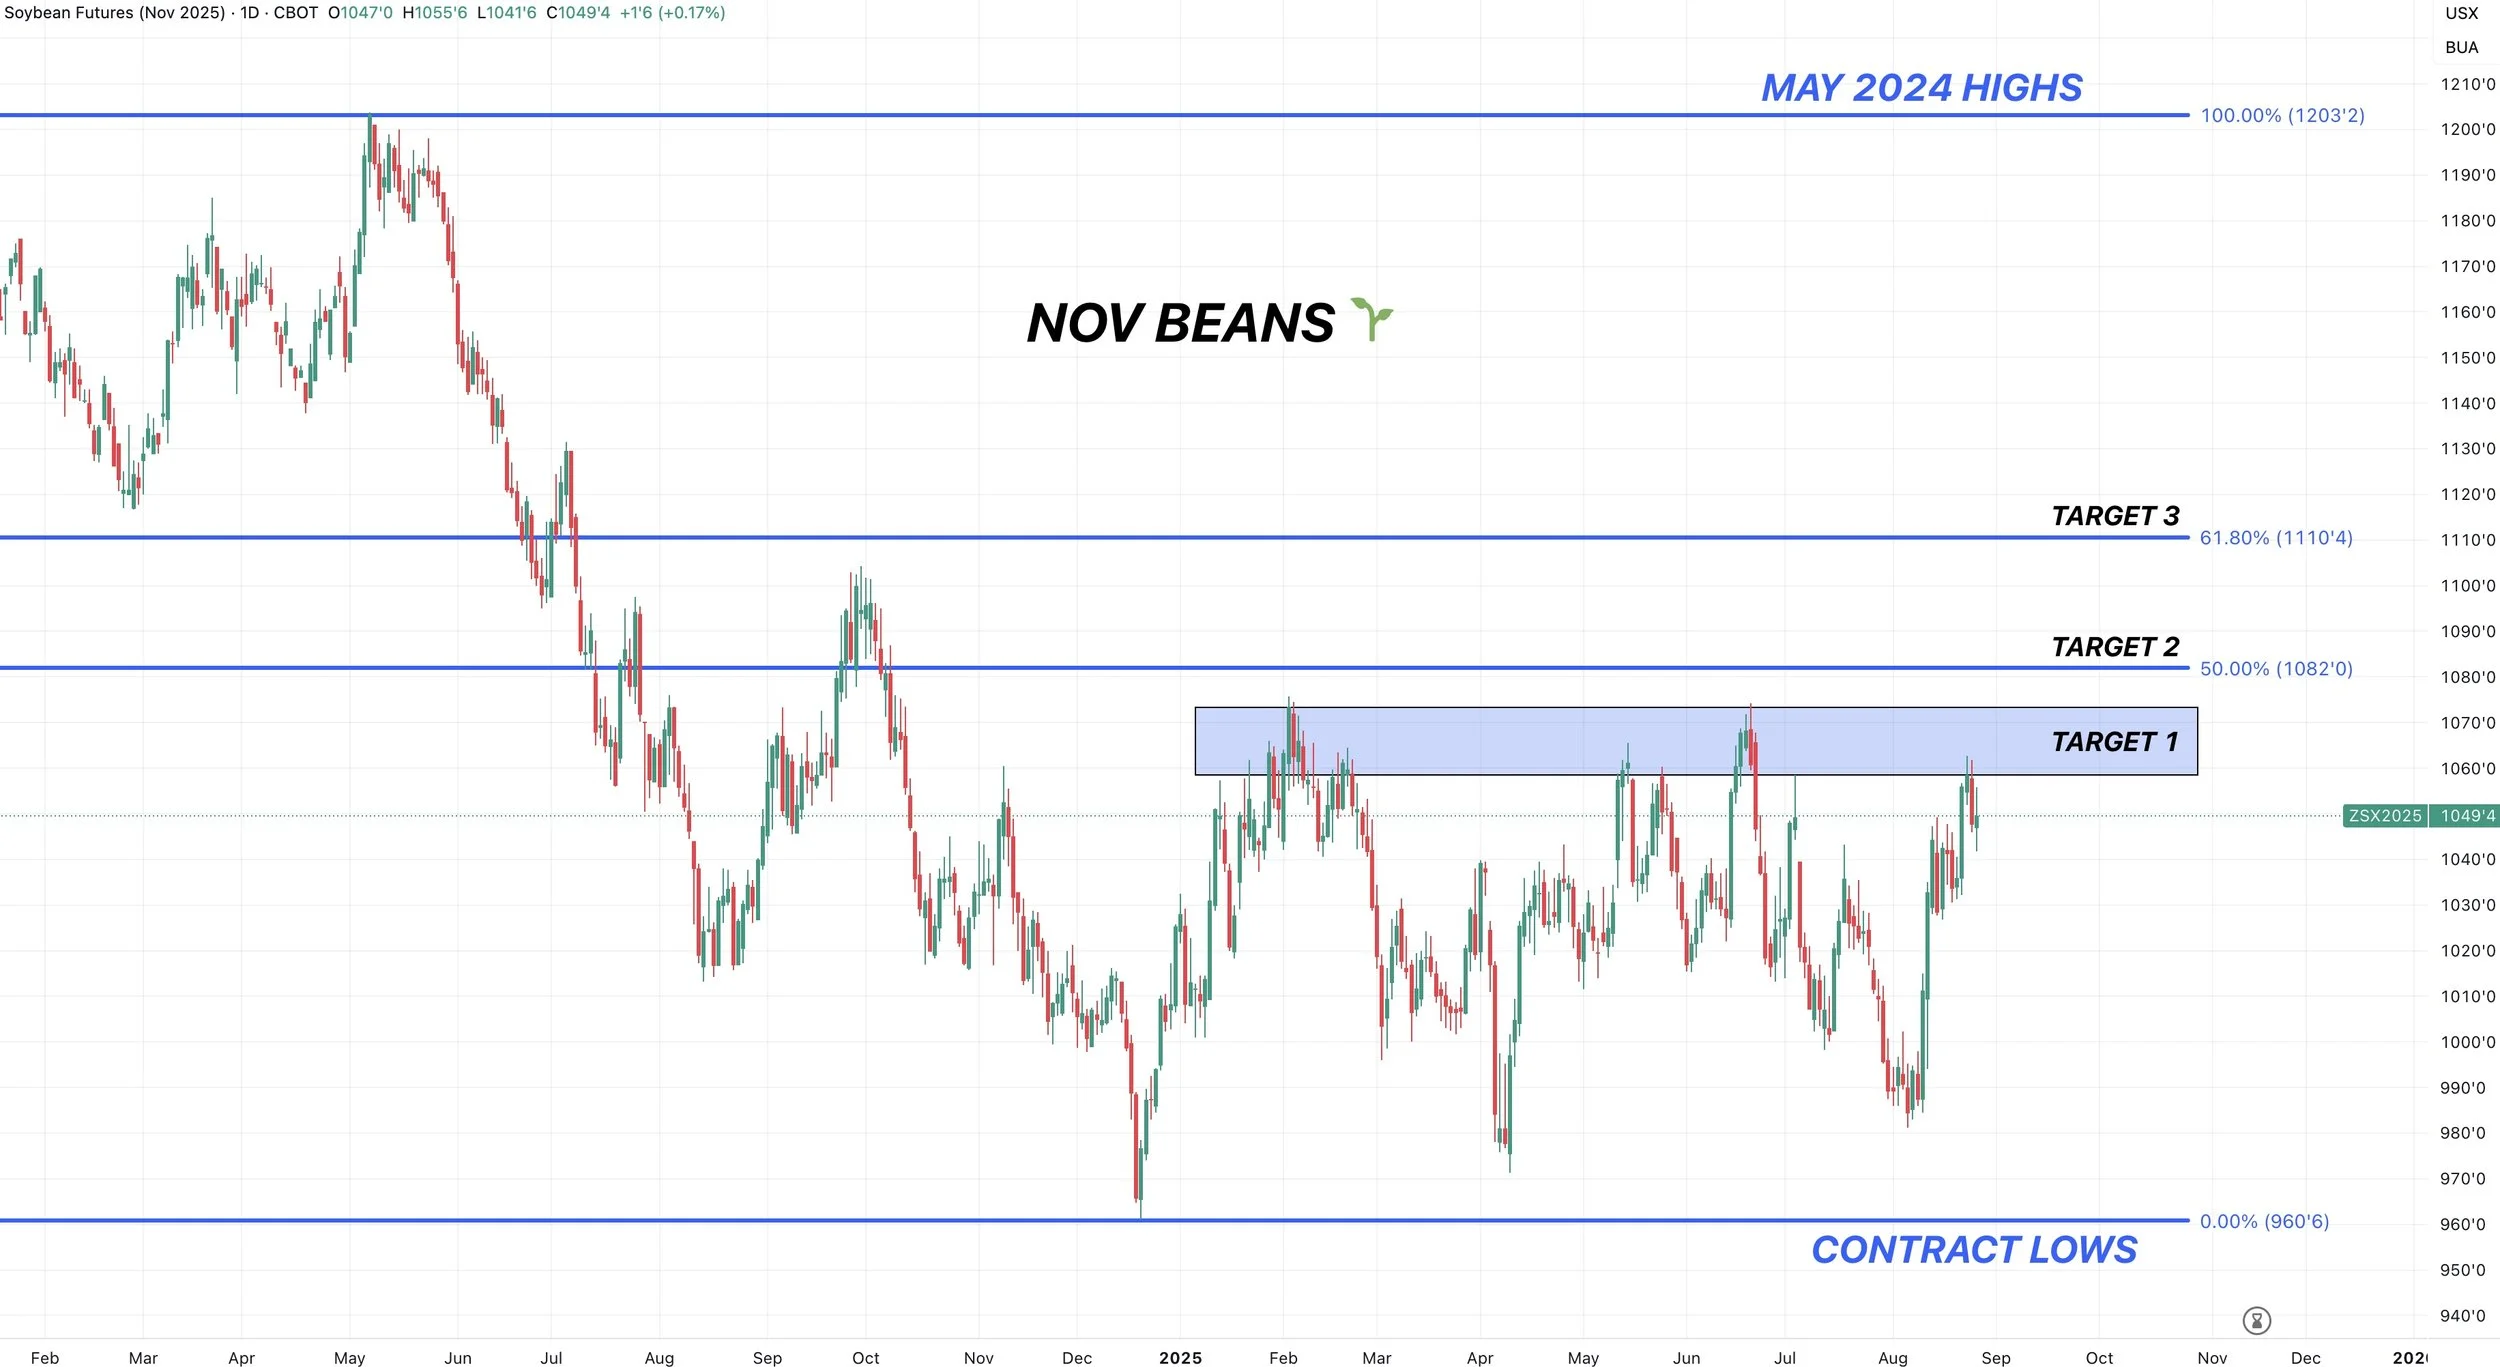
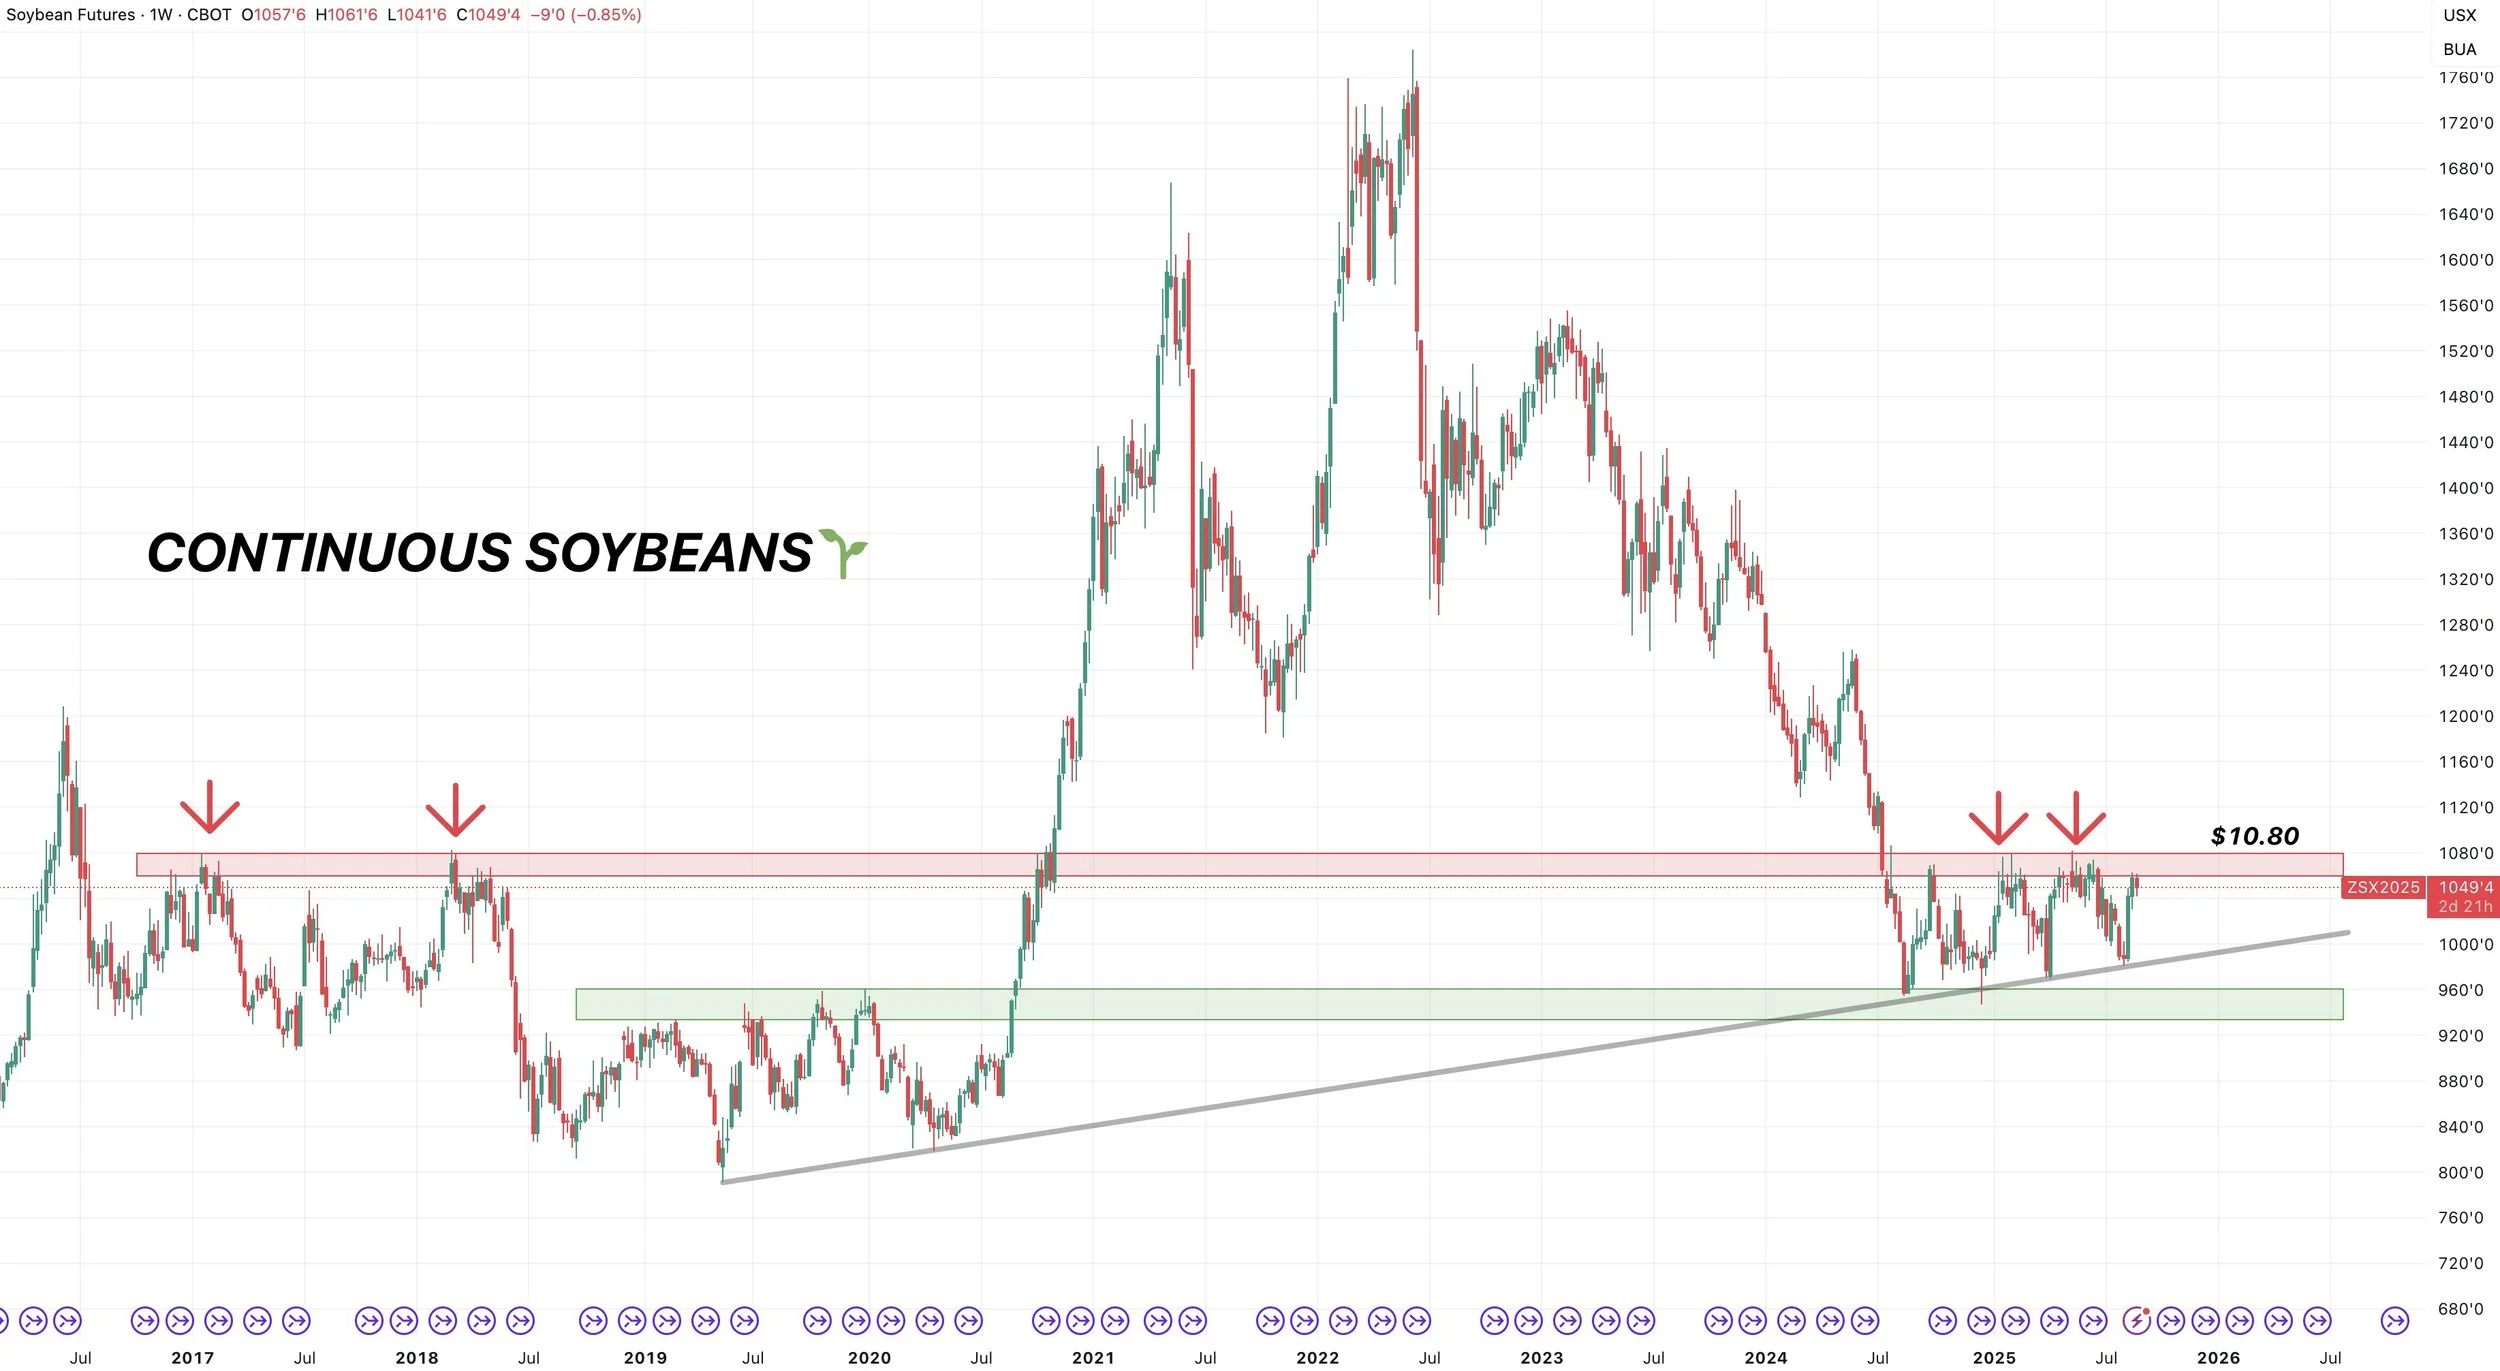
I am not calling for $12.00 soybeans.
But if we take a long-term view of this market on the continuous chart.
If at any point we were to clear the $10.80 level, the upside in this market accelerates. Things could get interesting.
As there is virtually zero resistance above that level.
But until it breaks, it is seen as resistance.
Wheat
The wheat market still lacks news.
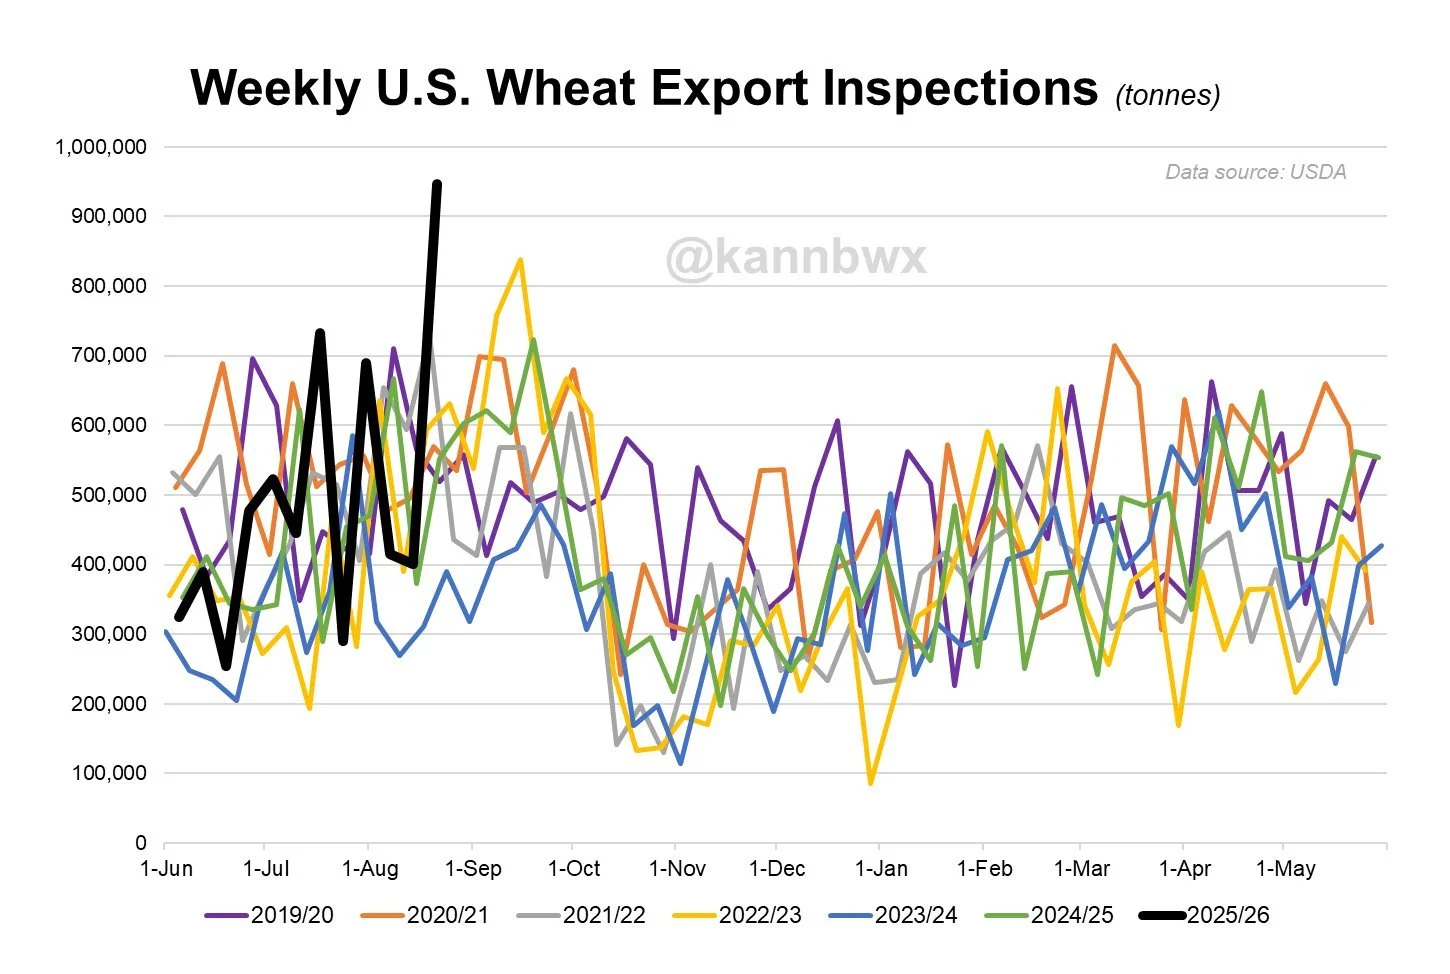
However we did some phenomenal export inspections.
This week's number was the highest in 12 years.
Wheat demand has been impressing lately.
We want to continue to see more of this, as this could create a path for a more friendlier situation here in the US.
Chart from Karen Braun
Because if you look at our US stocks to use ratio, it is far from being considered bullish.
Sitting at it's highest levels since 2020.
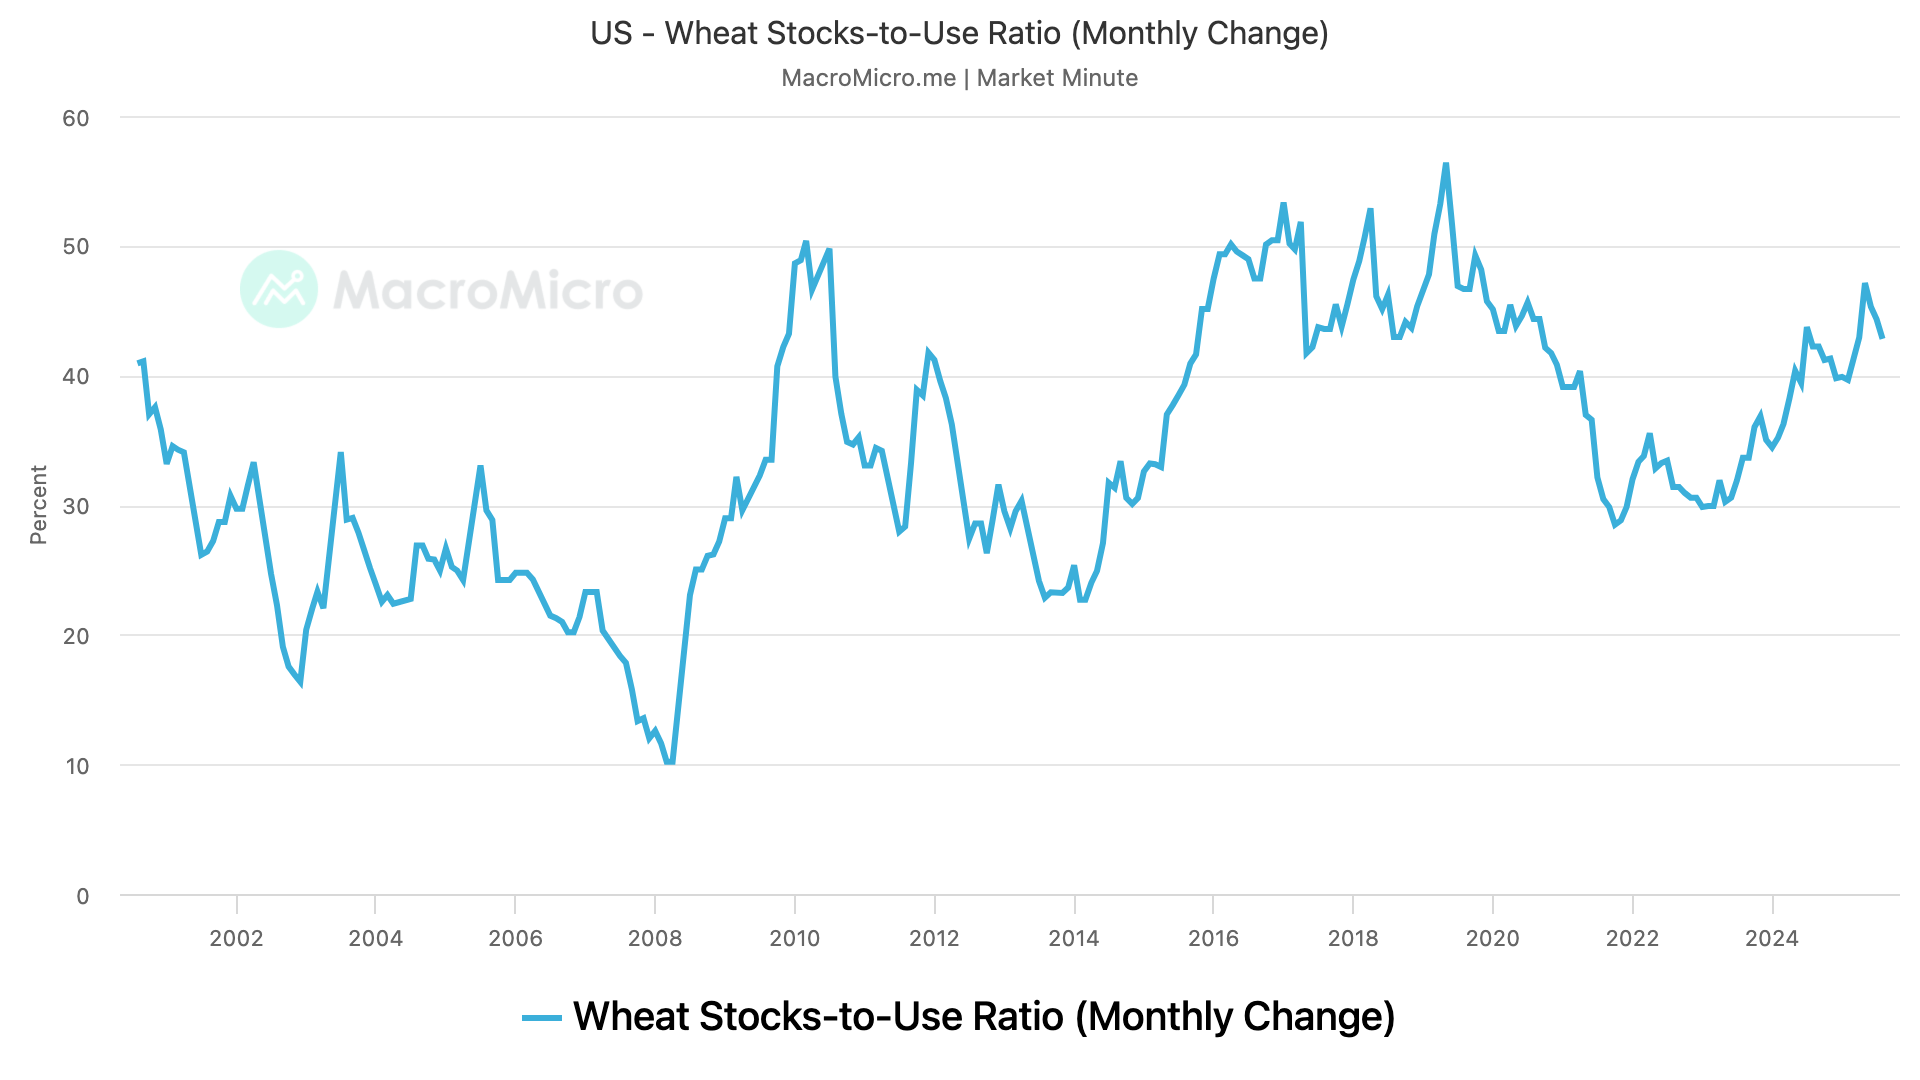
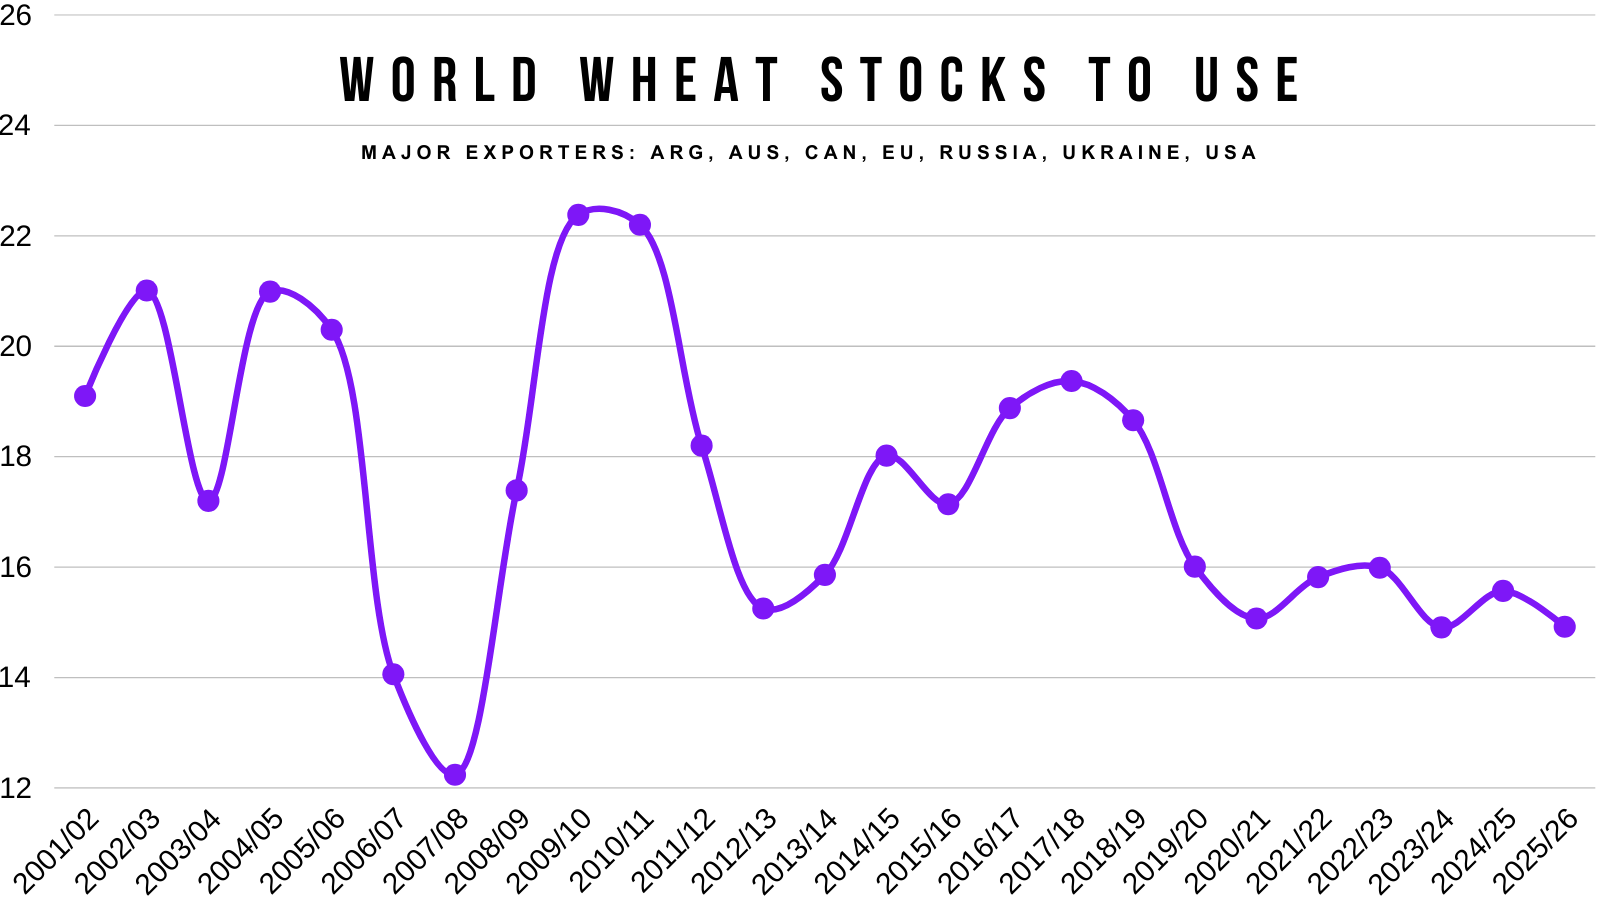
But maybe some of these recent demand has been due to this next chart.
This is the combined stocks to use ratio of the world's leading wheat exporters.
In the recent USDA report, this number dropped back down to some historically low levels.
Meaning that major exporters aren’t sitting on all of this extra wheat relative to past years.
Bottom line I still see more upside than downside in this wheat market.
Last week we issued a buy signal and I still like the wheat market here.
Here was the buy signal if you missed it: CLICK HERE
We remain competitive on exports. Demand has been great lately. The charts are starting to show some signs of life finally.
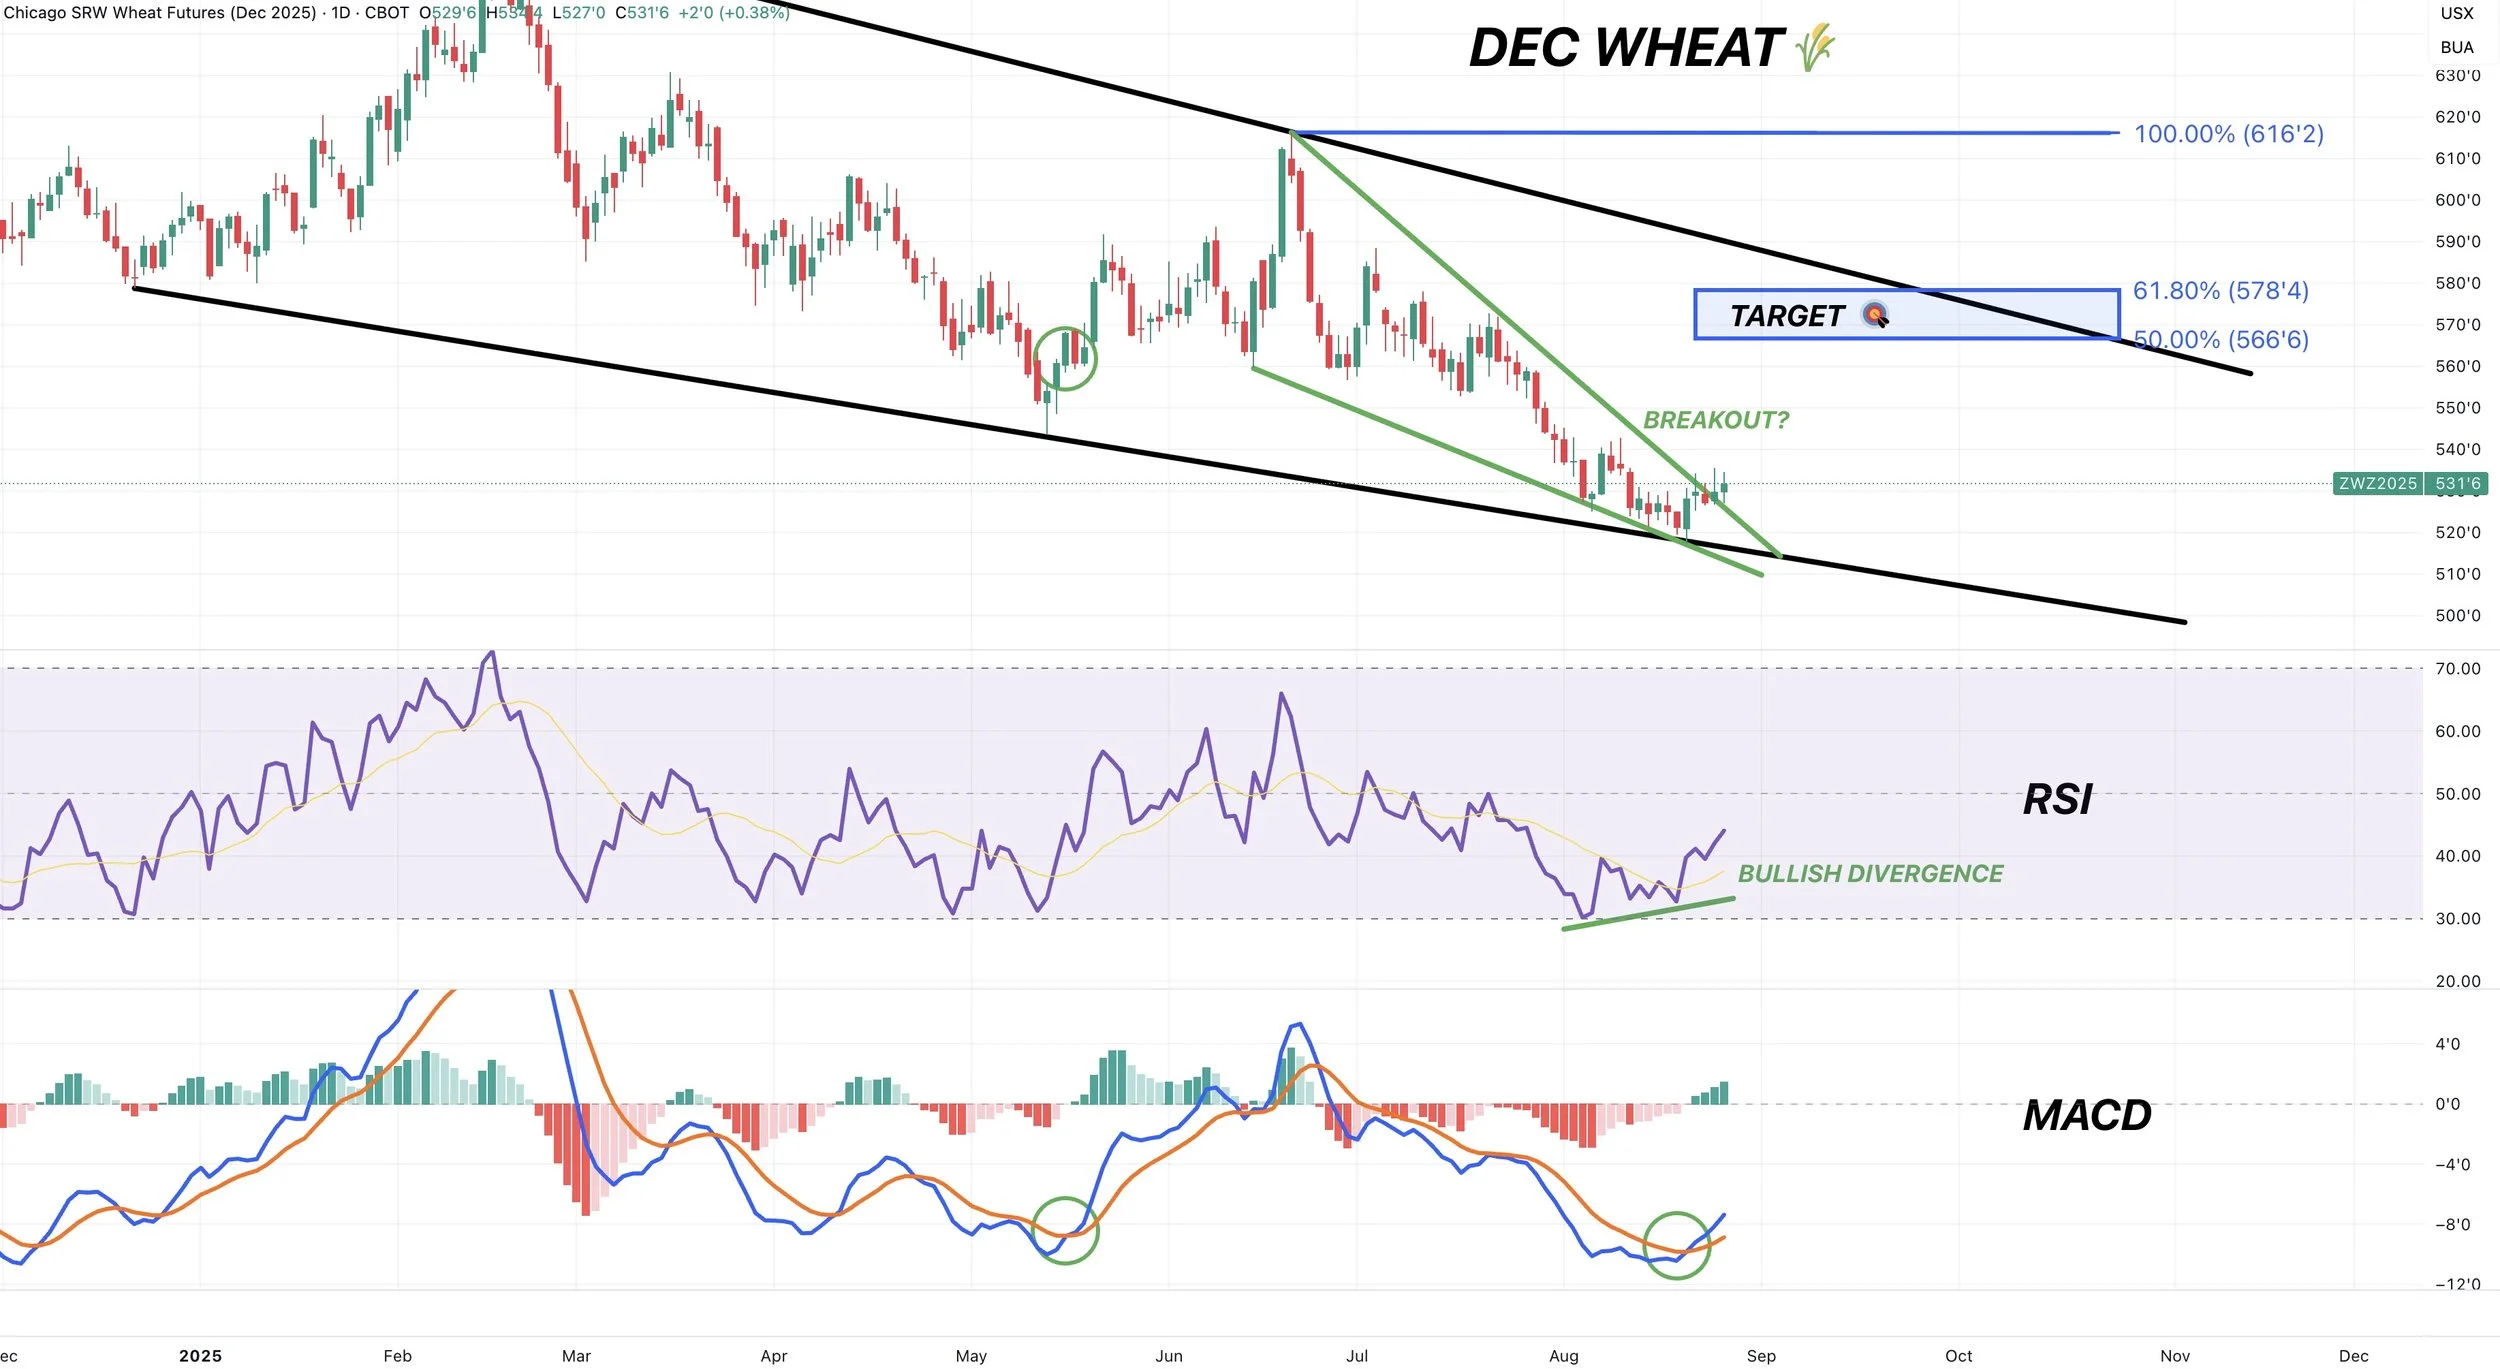
Daily Chicago:
We have two falling wedge patterns taking place.
The big one (in black). We are bouncing right off the bottom of the channel.
The small one (in green). We are breaking out to the upside.
These are seen as bullish patterns.
I would like to think we see the wheat market start to catch a bid here sometime.
Currently I am eyeing the top of the big wedge. Which also gives back 50-61.8% of the June highs.

We were showing clear bullish RSI divergence last week.
Prices made new lows. The RSI did not.
This told us that the downside momentum was getting weaker.
The MACD indicator has officially crossed bullish for the first time since May.
The MACD essentially tells us that momentum is shifting higher.
When it crossed over in May, it led to a nice rally.
Daily KC Wheat:
KC doesn’t look as promising as Chicago.
As we posted new contract lows today.
But the chart still looks decent. We are still sitting in this massive wedge pattern.
We are also sitting in a smaller time frame falling wedge as well. Similar to Chicago.

Cattle
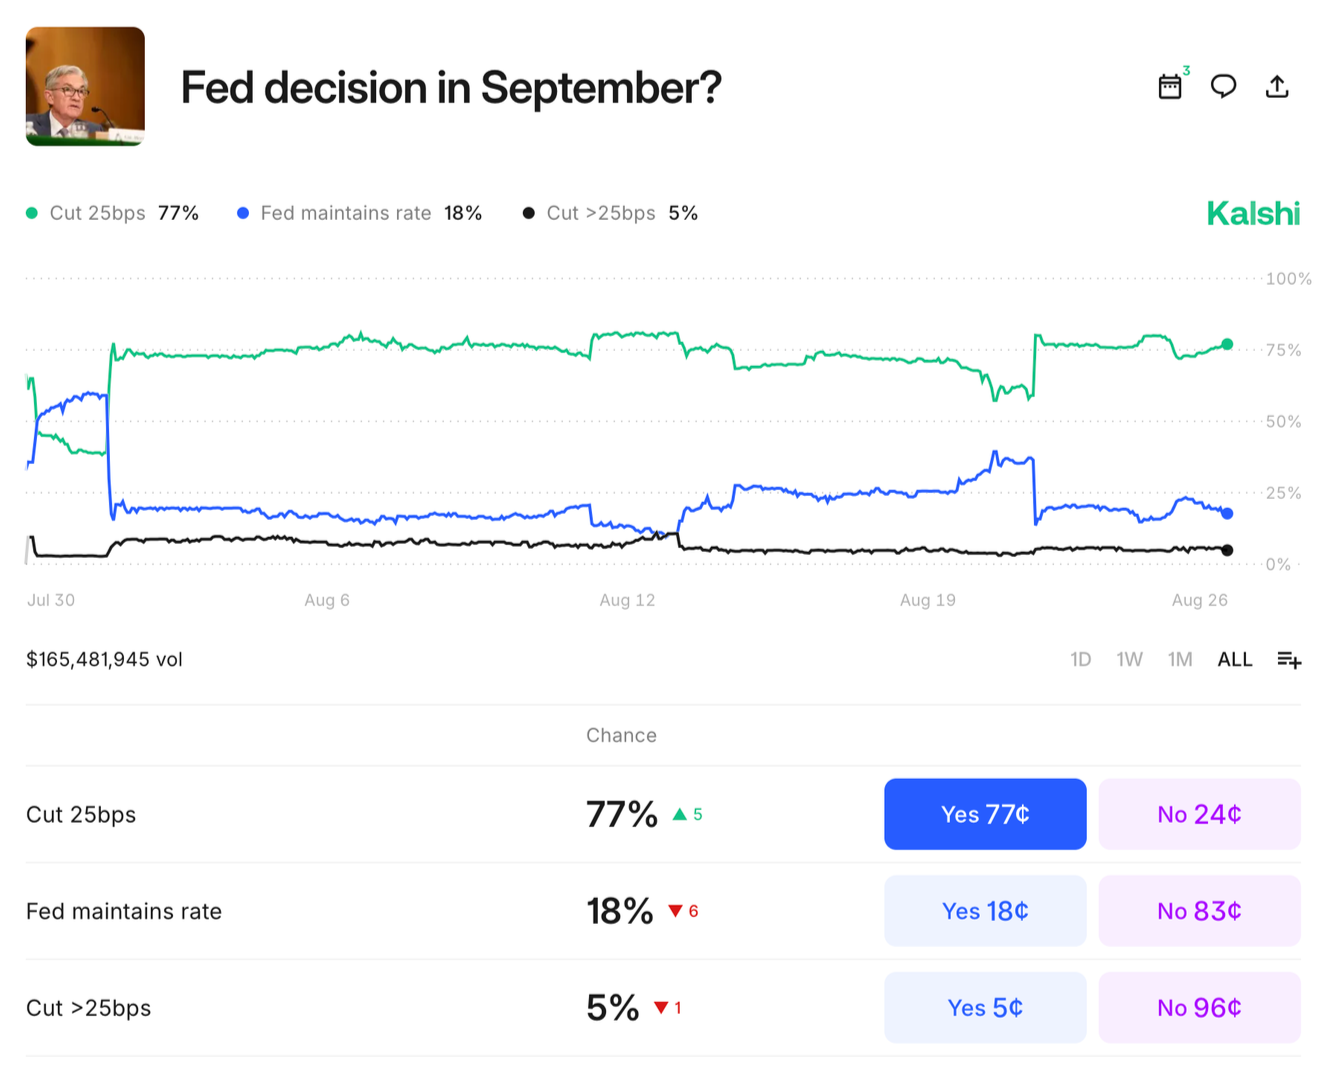
It seems like the cattle market has been closely tighted to the stock market as of recent.
Last week the feds made it pretty clear that we would be seeing rate cuts in September.
As odds for a rate cut are sitting at 82%.
My personal opinion is that the stock market is going to continue rallying until the Sep 17th rate cuts. Because it is going to start pricing in the rate cuts.
Then once we get the rate cuts, we see a correction.
A classic buy the rumor, sell the fact event.
If the stock market and cattle trade are truly correlated, this could also potentially mark a local top in this cattle market as well.
Our advice remains the same.
Keep puts for downside protection.
I prefer to not use futures, as you can run into margin calls.
Puts you only can lose what you put up. You'll be happy you have puts if this market ever corrects.
It makes sense to protect a market at all time highs.
Sep Feeder:
We hit the 200% fib extension from the last pullback.
We are also against the top of this upward channel.
A small pullback here makes sense but I am not going to stand in the way of a moving train.
Big picture, the biggest thing to watch is the simple upward channel.
Until that gives out, the trend remains higher.
Downside target is still the blue box, but with each new high the blue box moves higher.

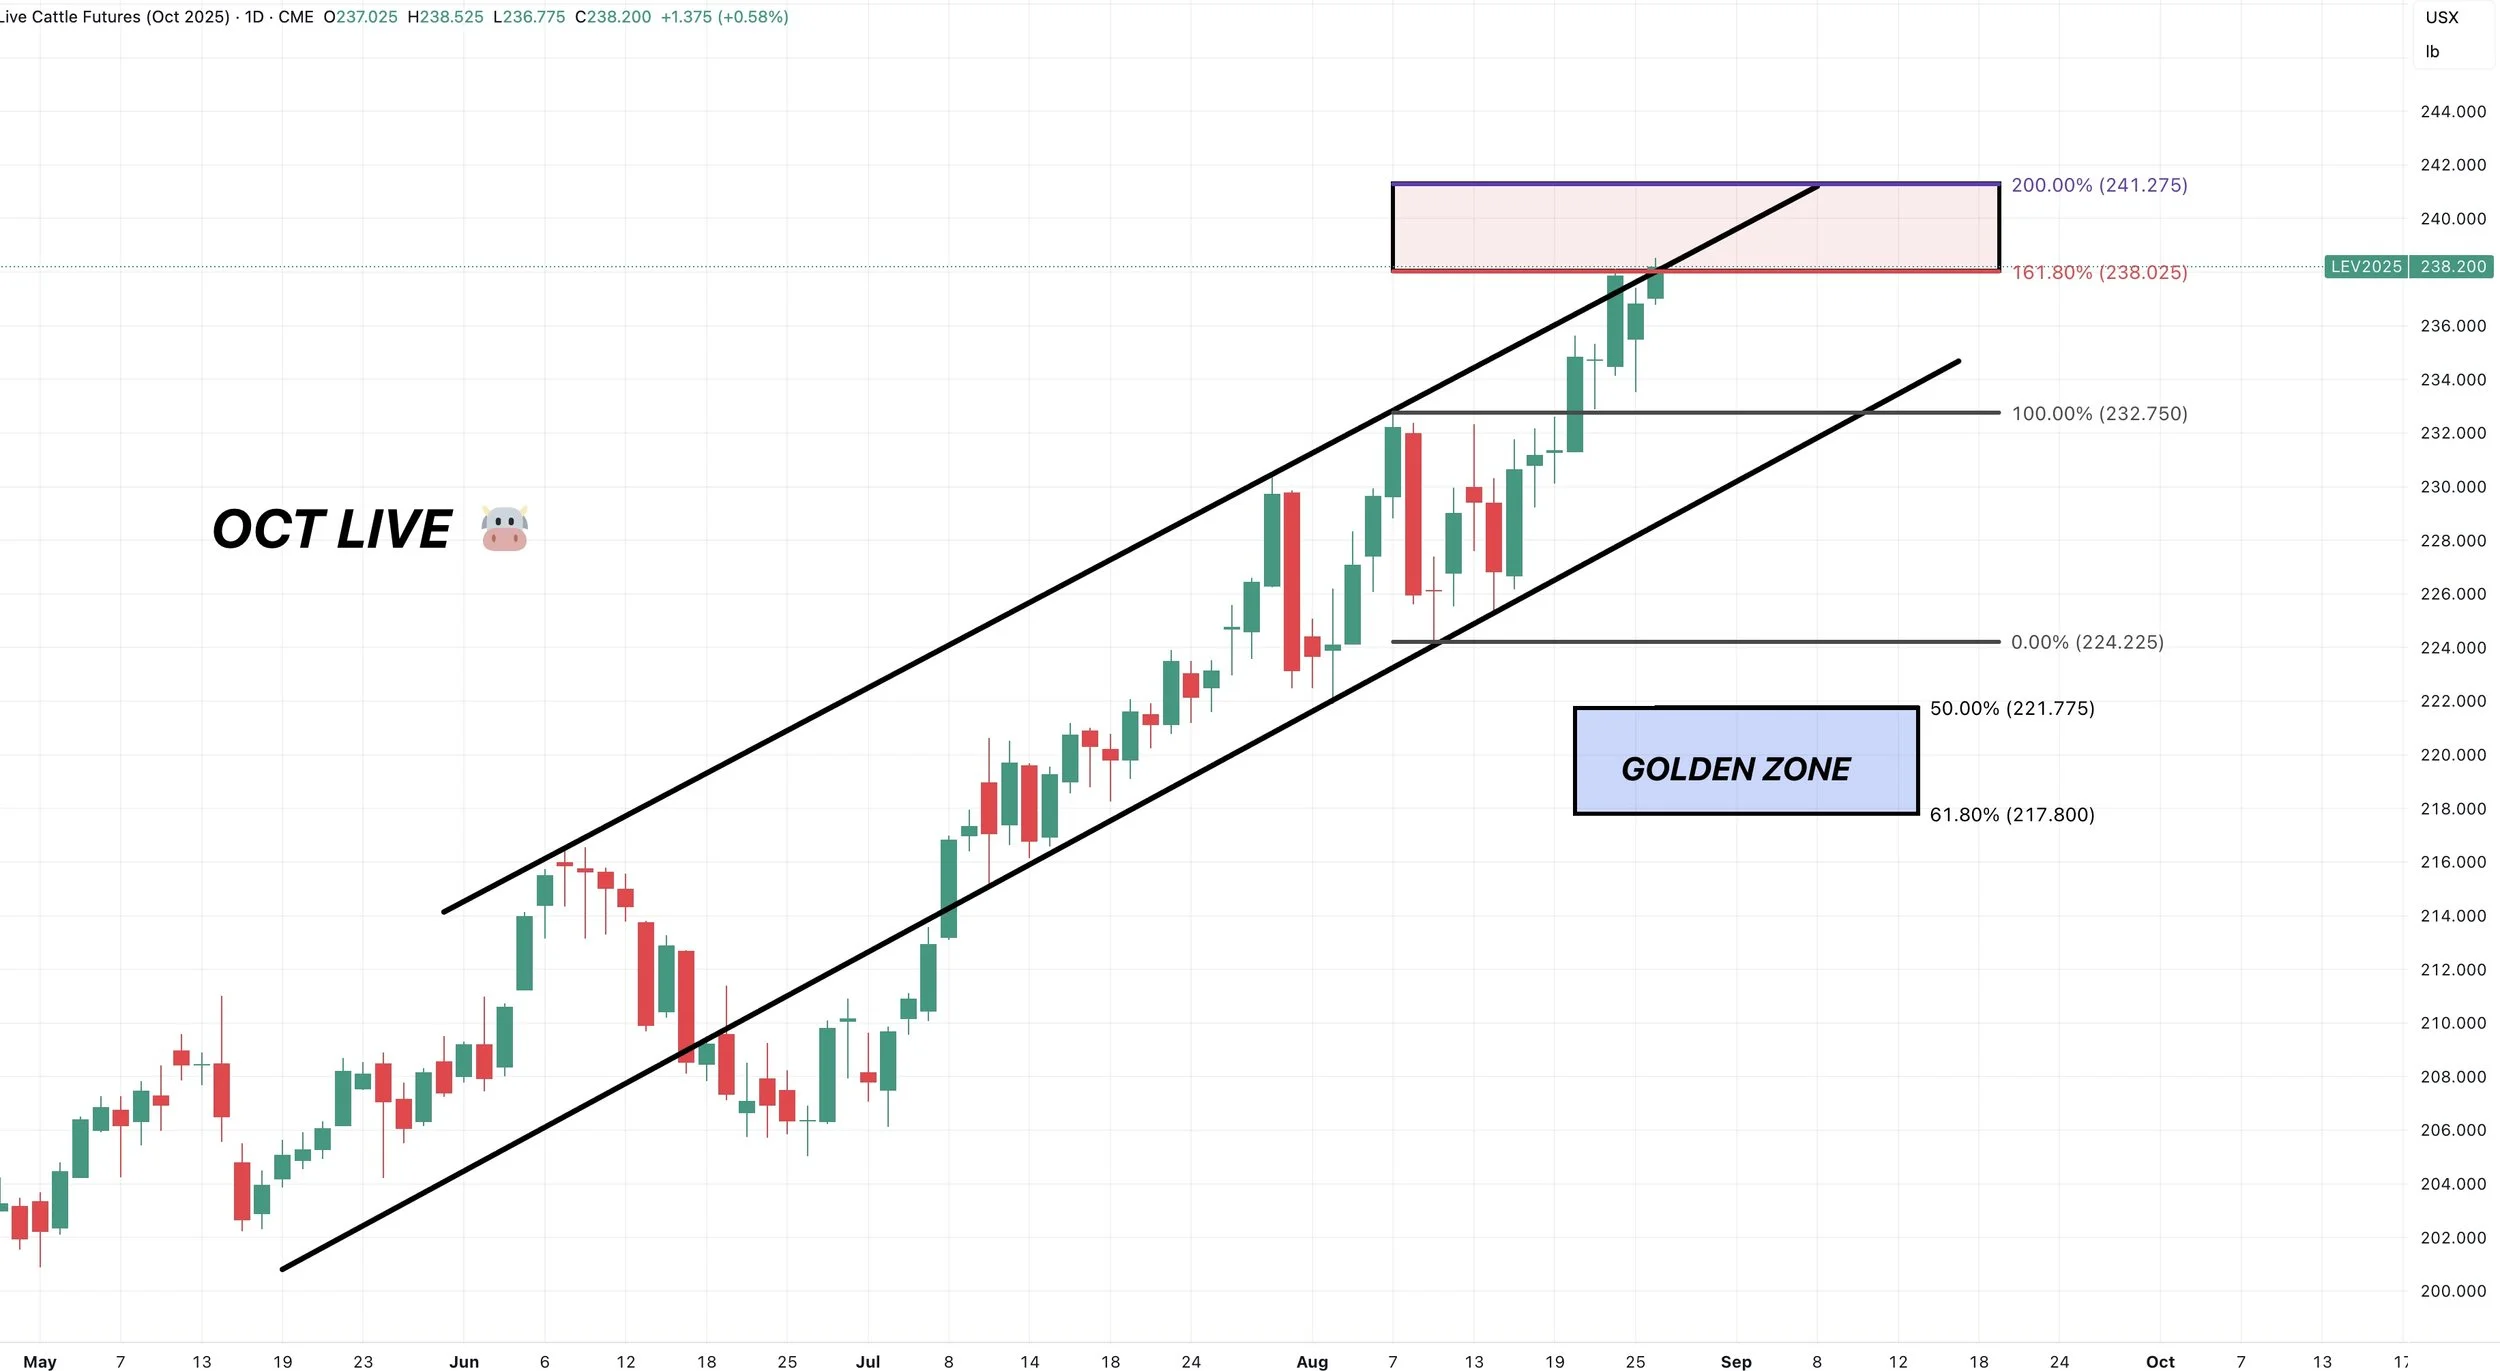
Oct Live:
Oct live is right at the 161.8% fib from the last pullback.
Like feeder, a pullback short term might make sense.
But the trend remains higher until that channel is busted.
Past Sell or Protection Signals
We recently incorporated these. Here are our past signals.
Aug 22nd: 🌱
Soybean sell signal & hedge alert.
July 31st: 🐮
Cattle sell signal & hedge alert.
July 10th: 🐮
Cattle sell signal & hedge alert.
CLICK HERE TO VIEW
June 5th: 🐮
Cattle sell signal & hedge alert.
June 2nd: 🌾
MPLS wheat sell signal.
April 10th: 🌽
Old crop corn sell signal.
March 19th: 🐮
Cattle hedge & sell signal.
Feb 18th: 🌽 🌾
Old crop KC wheat & old crop corn signal.
Jan 23rd: 🌽 🌱
Corn & beans old crop sell signal.
CLICK HERE TO VIEW
Jan 15th: 🌽 🌱
Corn & beans hedge alert/sell signal.
Jan 2nd: 🐮
Cattle hedge alert at new all-time highs & target.
Dec 11th: 🌽
Corn sell signal at $4.51 200-day MA
CLICK HERE TO VIEW
Oct 2nd: 🌾
Wheat sell signal at $6.12 target
Sep 30th: 🌽
Corn protection signal at $4.23-26
Sep 27th: 🌱
Soybean sell & protection signal at $10.65
Sep 13th: 🌾
Wheat sell signal at $5.98
May 22nd: 🌾
Wheat sell signal when wheat traded +$7.00
Want to Talk?
Our phones are open 24/7 for you guys if you ever need anything or want to discuss your operation.
Hedge Account
Interested in a hedge account? Use the link below to set up an account or shoot Jeremey a call at (605)295-3100.
Check Out Past Updates
8/25/25
CORN REJECTS TARGET. CROPS GETTING SMALLER?
8/21/25
SOYBEAN BREAKOUT & USDA VS CROP TOUR
8/20/25
BUY SIGNAL
8/20/25
NAVIGATING BASIS & CATTLE BULL RUN
8/19/25
CROP CONCERNS & DRY FINISH?
8/18/25
CROP TOURS STARTING
8/15/25
CORN BOUNCING DESPITE MONSTER SUPPLY. WILL CROP TOUR SHOW ISSUES?
8/14/25
HOW TIGHT IS SOYBEAN SITUATION?
8/13/25
UPCOMING CROP TOURS & NEXT BEAN TARGET
8/12/25
MAJOR USDA SHOCK. HOW DOES THIS CHANGE THINGS?
8/11/25
TRUMP SAYS CHINA NEEDS BEANS. USDA TOMORROW
8/8/25
CALM BEFORE USDA STORM & CATTLE LIMIT DOWN
8/7/25
USDA PREVIEW & MORE DETAILS ON BUY SIGNAL
8/6/25
CORN REVERSAL? RIDING CATTLE RUN BUT BEING DISIPLINED
8/5/25
188 CORN YIELD? AUGUST CATTLE CONCERNS?
8/4/25
NEW CORN LOWS & USDA NEXT WEEK
8/1/25
STOUT DEMAND & WET JULY
7/31/25
WHERE IS CORN & BEAN BOTTOM? WAS THAT CATTLE TOP?
7/31/25
CATTLE HEDGE ALERT & SELL SIGNAL
7/30/25
ANY HOPE LEFT FOR GRAINS?
7/29/25
SEASONAL STRUGGLE CONTINUES
7/28/25
EXTREME BEARISHNESS PRICED INTO GRAINS. CATTLE WARNING SIGNS
7/25/25
NO REASON TO RALLY. NO REASON TO COLLAPSE
7/24/25
CORN DEMAND OVERSTATED? CATTLE CLOSE TO TOP?
7/23/25
JAPAN DEAL NOT ENOUGH
7/22/25
CROP RATINGS MATTER?
7/21/25
RAIN MAKES GRAIN
7/18/25
OVERNIGHT HEAT & ROOM FOR ERROR
7/17/25
POOR CORN EXPORTS MATTER? REWARD BEAN BOUNCE?
7/16/25
ARE CORN & BEANS UNDERVALUED OR NOT?
7/15/25
NEGATIVE NEWS POSITIVE ACTION IN GRAINS
7/14/25
DON’T GIVE GRAIN AWAY
7/11/25
USDA FRIENDLY CORN. MARKET DOESN’T CARE
7/10/25
JULY USDA OUT TOMORROW
7/10/25
CATTLE HEDGE ALERT & SELL SIGNAL
7/9/25
MARKET SEES RECORD CROPS
7/8/25
MONSTER CORN YIELD..?
7/7/25
TRUMP PUMP & DUMP
7/3/25
CORN & BEANS REJECT KEY SPOT. TRUMP SPEAKS IN IOWA
7/2/25
TRADE DEALS? BEANS RALLY AT GOLDEN ZONE
7/1/25
NOW WHAT FOR GRAINS?
6/30/25
BORING USDA. DIDN’T SAY HAVE TO GO LOWER
6/30/25
USDA NUMBERS
6/27/25
ALL EYES ON MONDAY
6/26/25
FIREWORKS OR BLOOD BATH MONDAY?
6/25/25
GRAINS COLLAPSING AHEAD OF JUNE REPORT
6/24/25
CORN CONTINUES SELL OFF. MAJOR USDA REPORT COMING
6/23/25
CORN CAN GO LOWER, BUT NOT FOR FOREVER
6/20/25
WHO SHOULD REWARD THE WHEAT & SOYBEAN RALLY?
6/18/25
COMPLETE CHART BREAKDOWNS
6/17/25
SOYBEANS CONTINUE BREAKOUT. NEARING SELL SIGNAL
6/16/25
CORN HAMMERED. EPA GAME CHANGER IN BEANS?
6/13/25
SOYBEANS RALLY, CHARTS, BALANCE SHEETS & MORE
6/12/25
USDA NON-EVENT. WHAT’S NEXT?
6/11/25
DIVERGENCE & SEASONAL SELL OFF?
6/10/25
BEING PATIENT VS BALANCING YOUR RISK
6/9/25
WHAT IF WE DON’T GET A WEATHER SCARE?
6/5/25
CORN & BEANS HOLDING CRUCIAL SPOTS
6/5/25
CATTLE SELL SIGNAL & HEDGE ALERT
6/4/25
HOW UNKNOWNS IMPACT MARKETING DECISIONS
6/3/25
KEY SPOTS ON THE CHARTS FOR CORN & BEANS
6/2/25
NEW LOWS IN CORN. DE-RISKING MPLS WHEAT
6/2/25
SPRING WHEAT SELL SIGNAL
5/30/25
SEASONAL RALLY STILL IN THE CARDS?
5/29/25
WHAT IS YOUR PLAN IF WE DO NOT RALLY?
5/28/25
ZERO PREMIUM IN THE GRAIN MARKETS
5/27/25
CORN CONDITIONS DISAPPOINT & JUNE OUTLOOK IMPROVES
5/23/25
TARIFFS SPOOK MARKET. GAME PLAN MOVING FORWARD
5/22/25
CHART BREAKDOWNS & TARGETS
5/21/25
RISK TO THE UPSIDE WITH WEATHER?
5/20/25
WHEAT SHORT COVERING & HISTORY OF YIELD CHANGES
5/19/25
ANYONE LEFT TO SELL WHEAT? 181 CORN YIELD POSSIBLE?
5/16/25
FUNDS SHORT CORN. MARKETS WAITING ON WEATHER
5/15/25
BEANS HAMMERED ON RUMOR & WHEAT FINDING LIFE
5/14/25
DECISIONS & POSSIBILITIES IN GRAINS
5/13/25
GRAINS RALLY OFF LOWS
5/12/25
USDA REPORT. HOW THIS CHANGES THINGS
5/9/25
BIGGEST RISKS IN USDA REPORT
5/8/25
USDA MONDAY & HISTORY OF WEATHER RALLIES
5/7/25
NEW 2025 LOWS FOR CORN
5/6/25
WHAT’S A SUMMER RALLY LOOK LIKE?
5/5/25
CORN ERASES ENTIRE APRIL RALLY
5/2/25
SELL INTO UNCERTAINTY. NOT KNOWN FACTORS
5/1/25
THE CASE AGAINST A FEB TOP IN CORN
4/30/25
APPROACHING KEY TIME PERIOD FOR GRAINS
4/29/25
PLANTING & FIRST NOTICE DAY PRESSURE. CORN CLOSE TO BOTTOM?
4/28/25
CAPTURING INVERSE & SEASONAL PREPARATION
4/25/25
HOW OFTEN DOES CORN NOT BREAK APRIL HIGHS?
4/24/25
KNOW WHEN TO SELL. BEANS BREAK 200-DAY FIRST TIME IN 483 DAYS
4/23/25
MONEY FLOW & DROUGHT CARDS
4/22/25
CRUCIAL SPOT FOR CORN & BEANS
4/21/25
NO PLANTING THREAT YET
4/18/25
POTENTIAL OPPORTUNITIES, BASIS CONTRACTS & STRATEGIES
4/16/25
HOW YIELD IMPACTS CARRYOUT. MAJOR SPOT FOR SOYBEANS
4/15/25
TOTAL CHART BREAKDOWNS & TARGETS
4/14/25
TECHNICAL SELLING IN GRAINS
4/11/25
SPECIFIC GRAIN MARKETING DECISIONS
4/10/25
USDA REPORT. HOW THIS IMPACTS CORN
4/9/25
TARIFFS GIVE. TARIFFS TAKE
4/8/25
CORN’S DIVERGING STRENGTH
4/7/25
SOLID PRICE ACTION DESPITE OUTSIDE FEAR
4/4/25
CORN PRICE ACTION SPEAKS VOLUME. ANY HOPE LEFT FOR SOYBEANS?
4/3/25
WHAT IS LEFT FOR CORN BEARS? TRADE WAR: CHARTS HOLDING SUPPORT
4/2/25
SHOULD UNKNOWNS KEEP A FLOOR UNDER GRAIN PRICES?
4/1/25
HOW DO ACRES IMPACT FUTURE OF THE GRAINS?
3/31/25
USDA REPORT: NOW WHAT?
3/28/25
ALL EYES ON USDA
3/27/25
PRE-USDA POSITIONING. DON’T GIVE GRAIN AWAY
3/26/25
HISTORY OF MARCH INTENTIONS. SOYBEANS UNDERVALUED?
3/25/25
6 DAYS UNTIL MAJOR USDA REPORT
3/24/25
HOW TO POSITION YOURSELF BEFORE PLANTING
3/21/25
REASONS TO BE OPTIMISTIC IN GRAINS?
3/20/25
WAS THAT THE BOTTOM IN CORN?
3/19/25
THE PATH HIGHER & THE DOWNSIDE RISKS IN GRAINS
3/18/25
SEASONALS, CATTLE HEDGE, CHARTS & DROUGHT?
3/17/25
WHEAT RALLIES. DON’T GET BACKED INTO A CORNER
3/14/25
MARCH 31ST REPORT THOUGHTS & WHAT’S NEXT FOR GRAINS
3/13/25
EXPLAINING RE-OWNERSHIP VS COURAGE CALLS
3/12/25
TARIFF FEARS. EU, CANADA, & ETHANOL
3/11/25
USDA SNOOZE. RECORD FUND SELLING A CONCERN?
3/10/25
USDA TOMORROW. GETTING COMFORTABLE IN MARKETING
3/7/25
HOW TIGHT IS THE WORLD & US SITUATION?
3/6/25
TARIFFS PUSHED BACK. FUTURE OPPORTUNITIES?
3/5/25
IS GRAINS BIGGEST RISK WEAK CRUDE & DEFLATION?
3/4/25
TRADE WAR BEGINS. 8TH DAY OF PAIN FOR GRAINS
3/3/25
TARIFFS ON TOMORROW. BUY SIGNAL
3/3/25
BUY SIGNAL
2/28/25
WHEN WILL THE BLEEDING STOP?
2/27/25
CORN AT CRITICAL SPOT. USDA ACRE REPORT. WAY TOO EARLY DROUGHT TALK
2/26/25
HISTORY SUGGESTS CORN TOP ISN’T IN? ACRE OUTLOOK TOMORROW
2/25/25
POSITIVE CLOSE. WHAT TO KNOW ABOUT USDA OUTLOOK
2/24/25
USDA OUTLOOK, FIRST NOTICE DAY & BRAZIL
2/21/25
WHAT TO EXPECT MOVING FORWARD IN GRAINS
2/20/25
FIRST NOTICE DAY CONCERNS. MASSIVE CORN ACRES OR NOT?
2/19/25
HOW TIGHT IS THE CORN SITUATION?
2/18/25
MORE DETAILS ON TODAYS SELL SIGNAL
2/18/25
OLD CROP KC WHEAT & CORN SELL SIGNAL
2/14/25
WHEAT BREAKING OUT ON WEATHER RISK. TECHNICALS & FUNDAMENTALS
2/12/25
GLOBAL GRAIN SITUATION, ACRE TALK, CHARTS & MORE
2/11/25
USDA: NOT A BEARISH REPORT. DISAPPOINTING PRICE ACTION
2/10/25
USDA TOMORROW. LONG TERM PATH FOR SUB 10% CORN STOCKS TO USE?
2/7/25
WHY WOULD THE FUNDS EXIT THEIR LONGS?
2/6/25
WHEAT FINALLY CATCHING A BID
2/5/25
COMPLETE THOUGHTS ON MARKETS: BACK & FORTH DISCUSSION
2/4/25
STRONG JANUARY LEAD TO STRONG YEAR? TARIFFS, CHARTS & MORE
2/3/25
TARIFFS PUSHED BACK
1/31/25
TARIFF NEWS ALL OVER THE PLACE. ARE YOU PREPARED FOR POSSIBILITIES?
1/30/25
WHEAT BULL ARGUMENT. TRUMP ADDS TARIFFS
1/29/25
CORN APPROACHES $5.00
1/28/25
TARIFFS, CORN FUNDS, SOUTH AMERICA & MORE
1/27/25
HEALTHY CORRECTION WE TALKED ABOUT & TARIFF NEWS
1/24/25
GRAINS DUE FOR SHORT TERM CORRECTION?
1/23/25
OUR ENTIRE NEW CROP SALES THOUGHTS & OLD CROP SELL SIGNAL
1/22/25
GRAINS TAKE A BREATHER. IS CORN IN A BULL OR BEAR MARKET?
1/21/25
HUGE DAY IN GRAINS. WHAT TO DO WITH OLD CROP VS NEW CROP
Read More
1/20/25
VIDEO CHART UPDATE
1/17/25
TRUMP, CHINA, ARGY & USING THE SPREADS INVERSE
1/16/25
OLD CROP LEADS US LOWER. MARKETING THOUGHTS
1/15/25
SIGNAL & HEDGE ALERT QUESTIONS EXPLAINED. IS $6 CORN EVEN POSSIBLE?
1/14/25
MORE DETAILS ON TODAYS HEDGE ALERT & SELL SIGNAL
1/14/25
CORN & SOYBEANS HEDGE ALERT/SELL SIGNAL
1/13/25
USDA GAME CHANGER OR NOT?
1/10/25
BULLISH USDA FOR CORN & BEANS
1/9/25
USDA OUT TOMORROW
1/8/25
2 DAYS UNTIL USDA. BE PREPARED
1/7/25
THE HISTORY OF THE JAN USDA & MORE
1/6/25
MAJOR USDA REPORT FRIDAY
Read More
1/3/25