
USDA PREVIEW & MORE DETAILS ON BUY SIGNAL
MARKET UDPATE
You can scroll to read the usual update as well. As the written version is the exact same as the video.
Timestamps for video:
USDA Preview: 0:00min
Great Export Sales: 3:00min
Corn: 4:00min
Beans: 7:30min
Wheat: 10:20min
Cattle: 12:30min
Want to talk about your situation?
(605)295-3100
Don’t miss our next sell signal
Since your trial ended you will not get our next sell signal & will stop getting future updates. Make sure you subscribe if you’d like future access.
Futures Prices Close

Overview
Grains higher across the board which feels like technical buying more than anything.
Early this morning we alerted our very first buy signal since March 4th. It was for corn, soybeans & wheat.
We will get into more details about this, but if you missed it: CLICK HERE
Today we will be mainly going over the technicals, as there isn’t much fresh news fundamentally and we've dove deep on the fundamentals several times.
First, let's go over the upcoming USDA report for next Tuesday.
USDA Estimates
Here is the trade estimates for next week's report:
🌽 Corn: 184.3
🌱 Beans: 52.9

To get these trade estimates Reuters polled 17 analysts.
Here is all of their estimates.
The lowest corn yield was 182.5 from a few analysts.
Highest was 188.100 from StoneX.
The average of all of these is 184.3.
The lowest soybean yield guess was 52.
Highest was 53.6. An interesting thing to note is that this high guess for soybeans is smaller than last year's high guess of 53.9.
Keep in mind acre adjustments are also possible in this report.

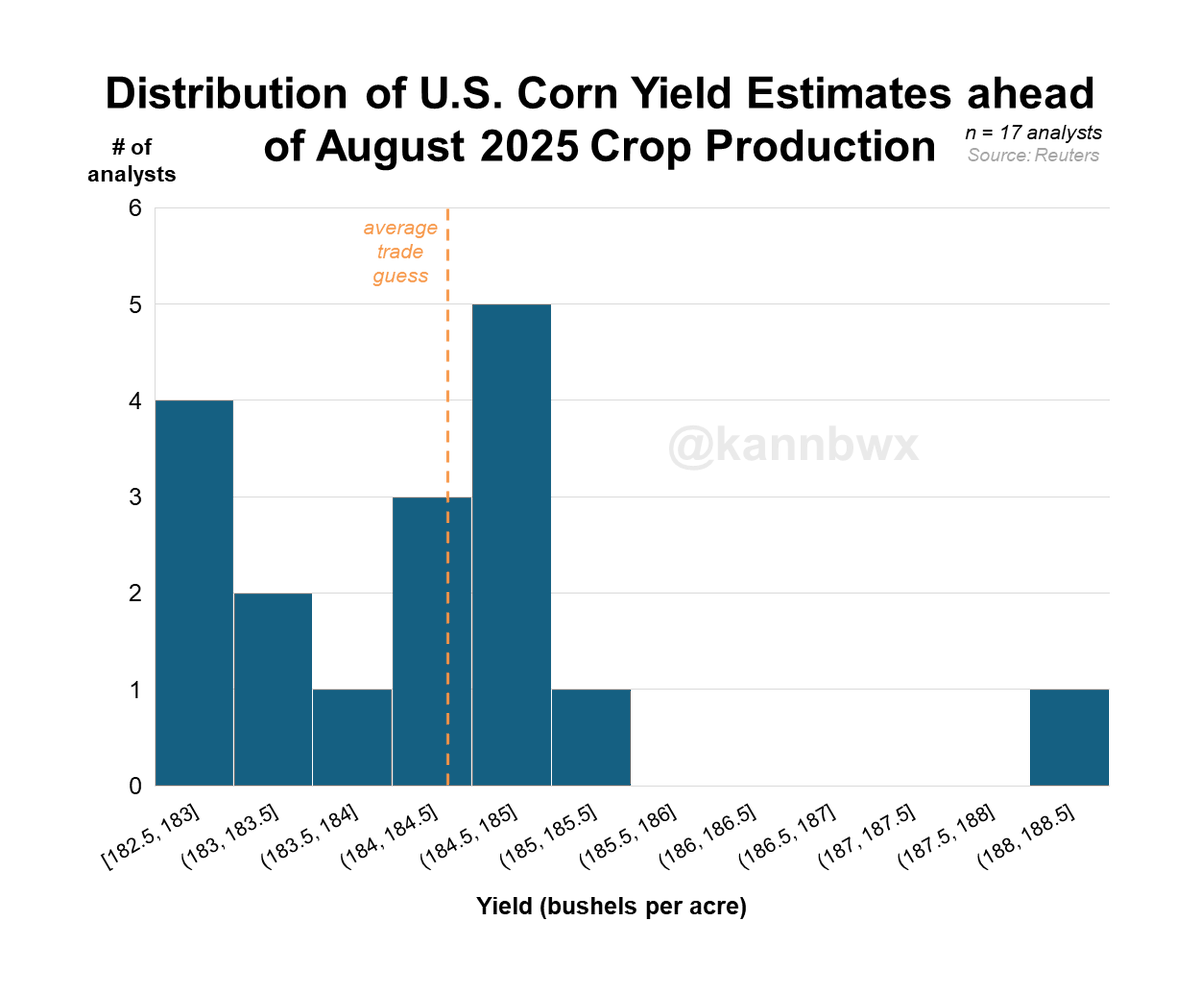
Here is a visual of the analysts corn estimates from Karen Braun.
StoneX is the outlier on the high side. As they were the only analyst that had over 185.5
Most analysts fell around that 184 to 185 range.
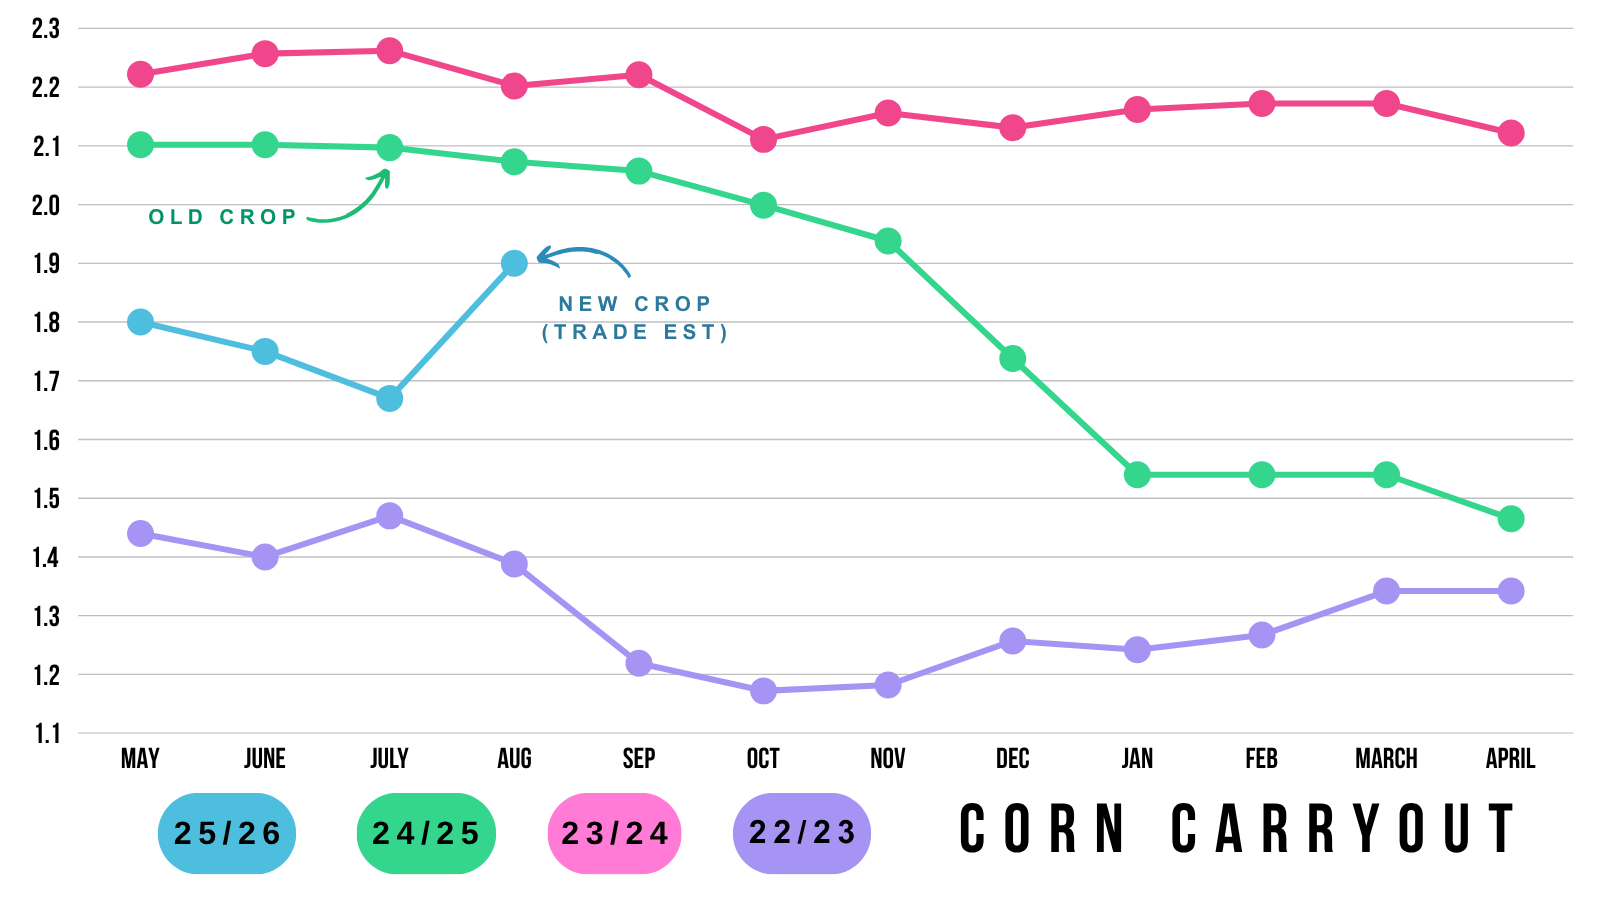
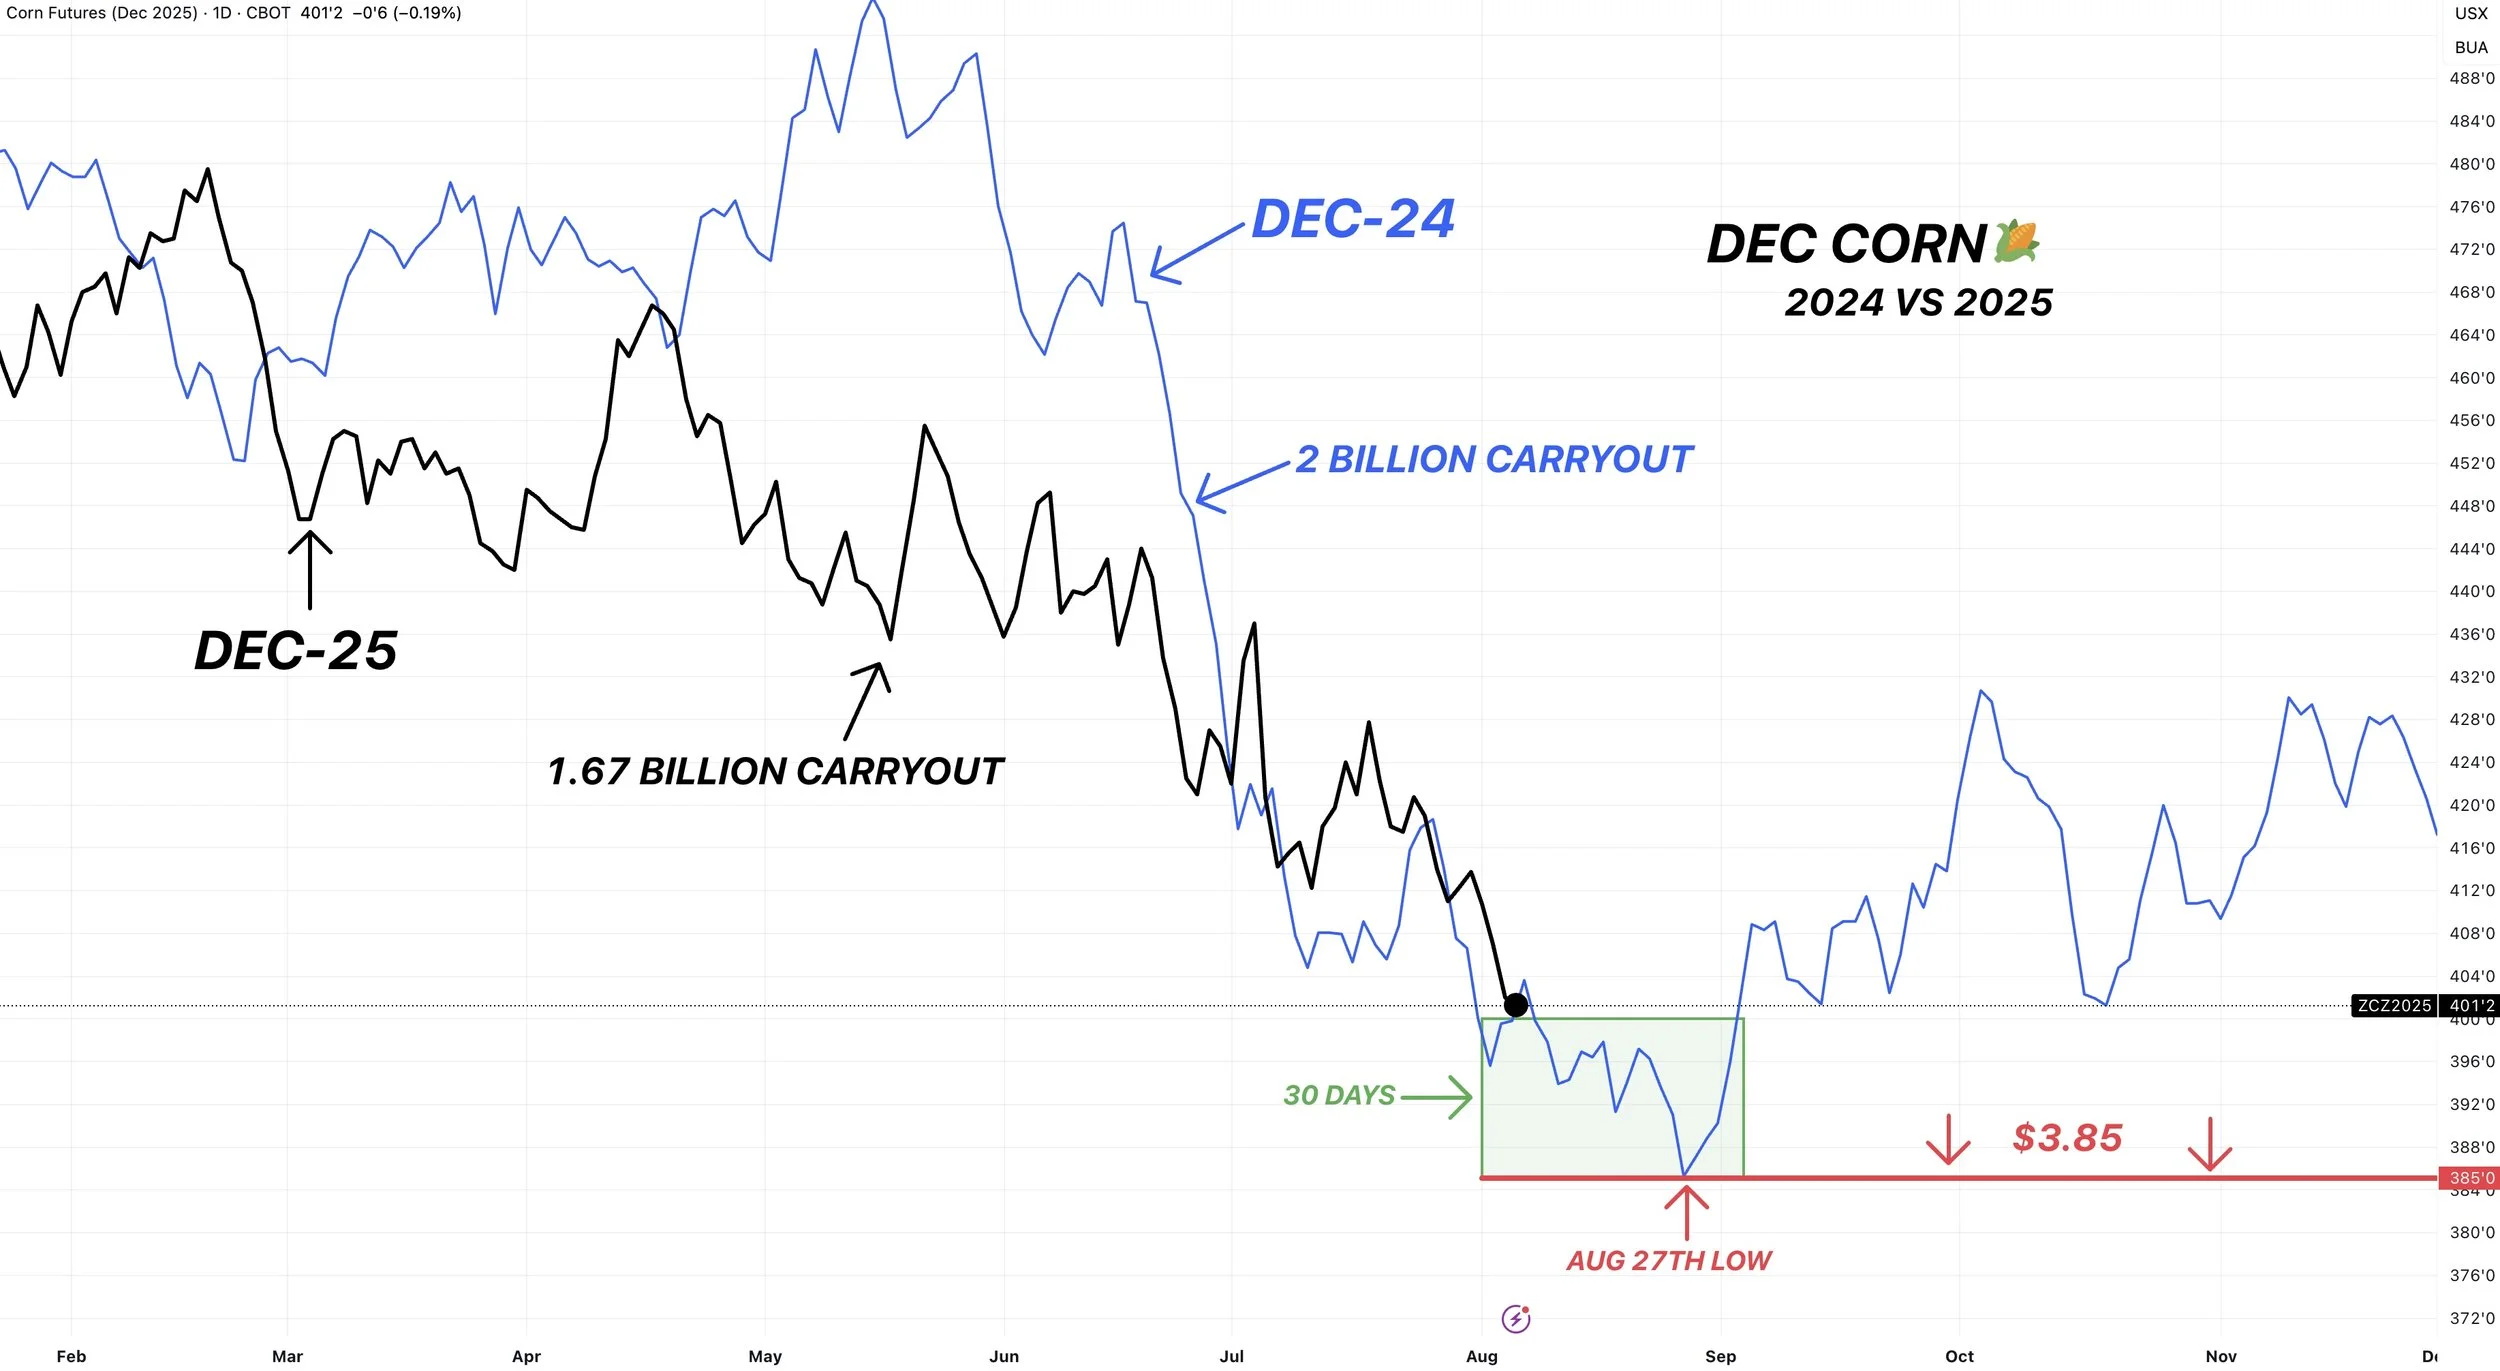
Here is a visual that shows corn carryout for different years, with this year's number using the trade estimates of 1.9 billion bushels.
This is clearly a bearish number. But this is still below last year at this same time.
Our lows in Dec corn last year were $3.85 on August 27th. Last year we spent only 30 days trading below $4.00
Last year we did not see carryout drop below 1.9 billion until December.
Another reason why I don’t think a sustained move below $4.00 would be justified here. Meaning I think it is definitely possible, but I don’t think it lasts extremely long.
Given that this market has likely priced in somewhere in the realm of a 185 yield and we are trading at the same levels as last year, I think it would take a pretty high yield or higher acre number to get a super bearish reaction on this report. (Altough possible). The market knows a big yield is coming and we've been pricing it in.
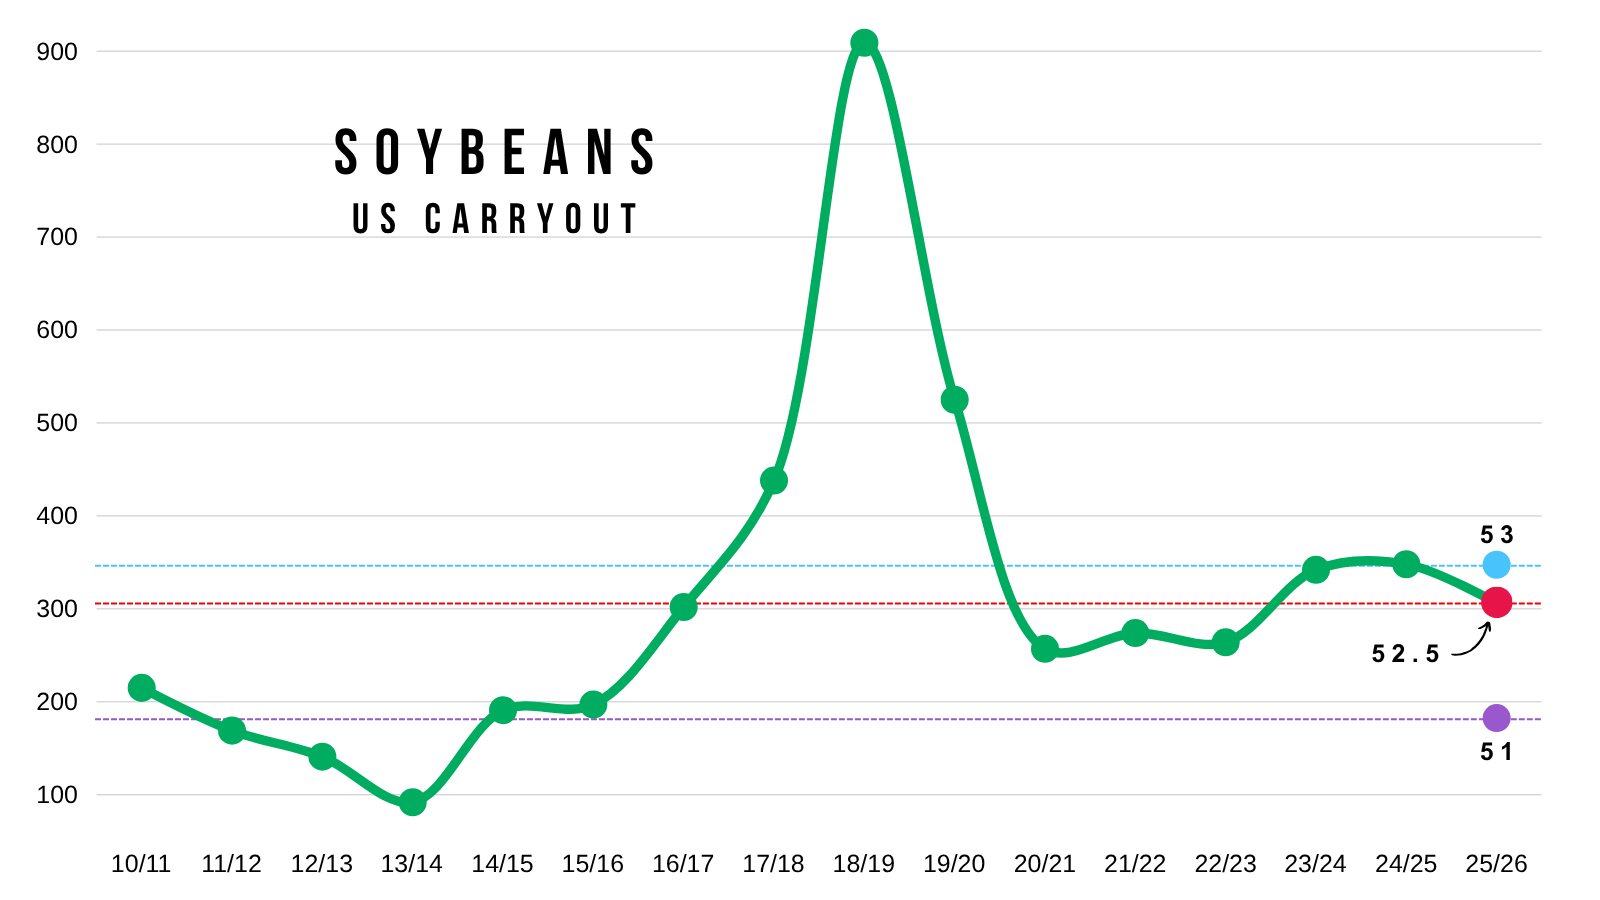
Here is a visual of soybean carryout and it's changes based on how yield changes.
As always, this does not account for demand.
But with that 52.9 bpa yield estimate, it puts new crop carryout right about the same as old crop and the last two years.
Yield is far from being fully determined in soybeans. So there is plenty of room to see this swing substantially higher or lower due to fewer acres allowing for a smaller room for error and bigger swings on carryout.
Huge New Crop Corn Demand
Today we saw massive new crop corn export sales.
They came in well above the trade estimates.
Strong wheat numbers as well.
Chart from Karen Braun
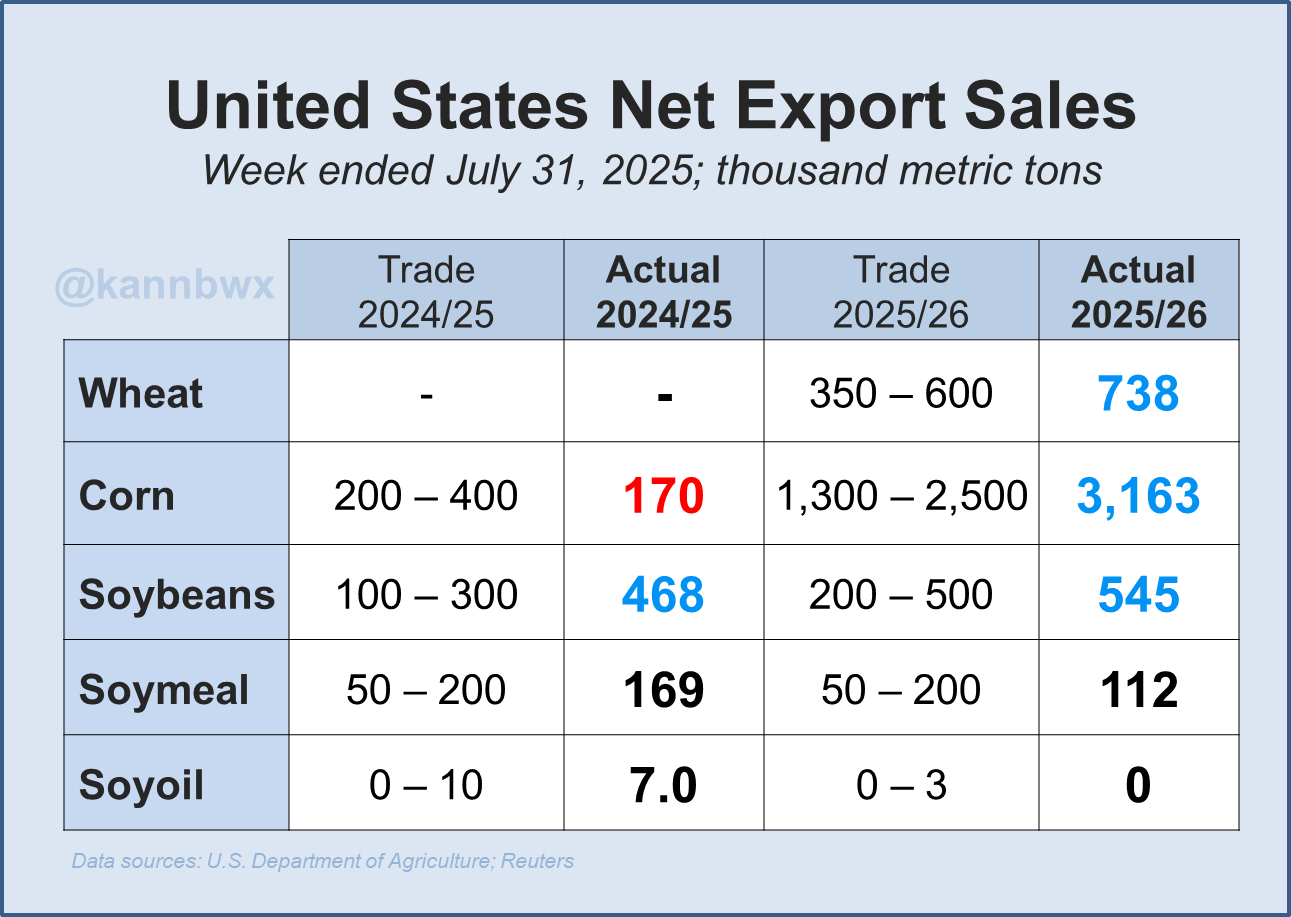
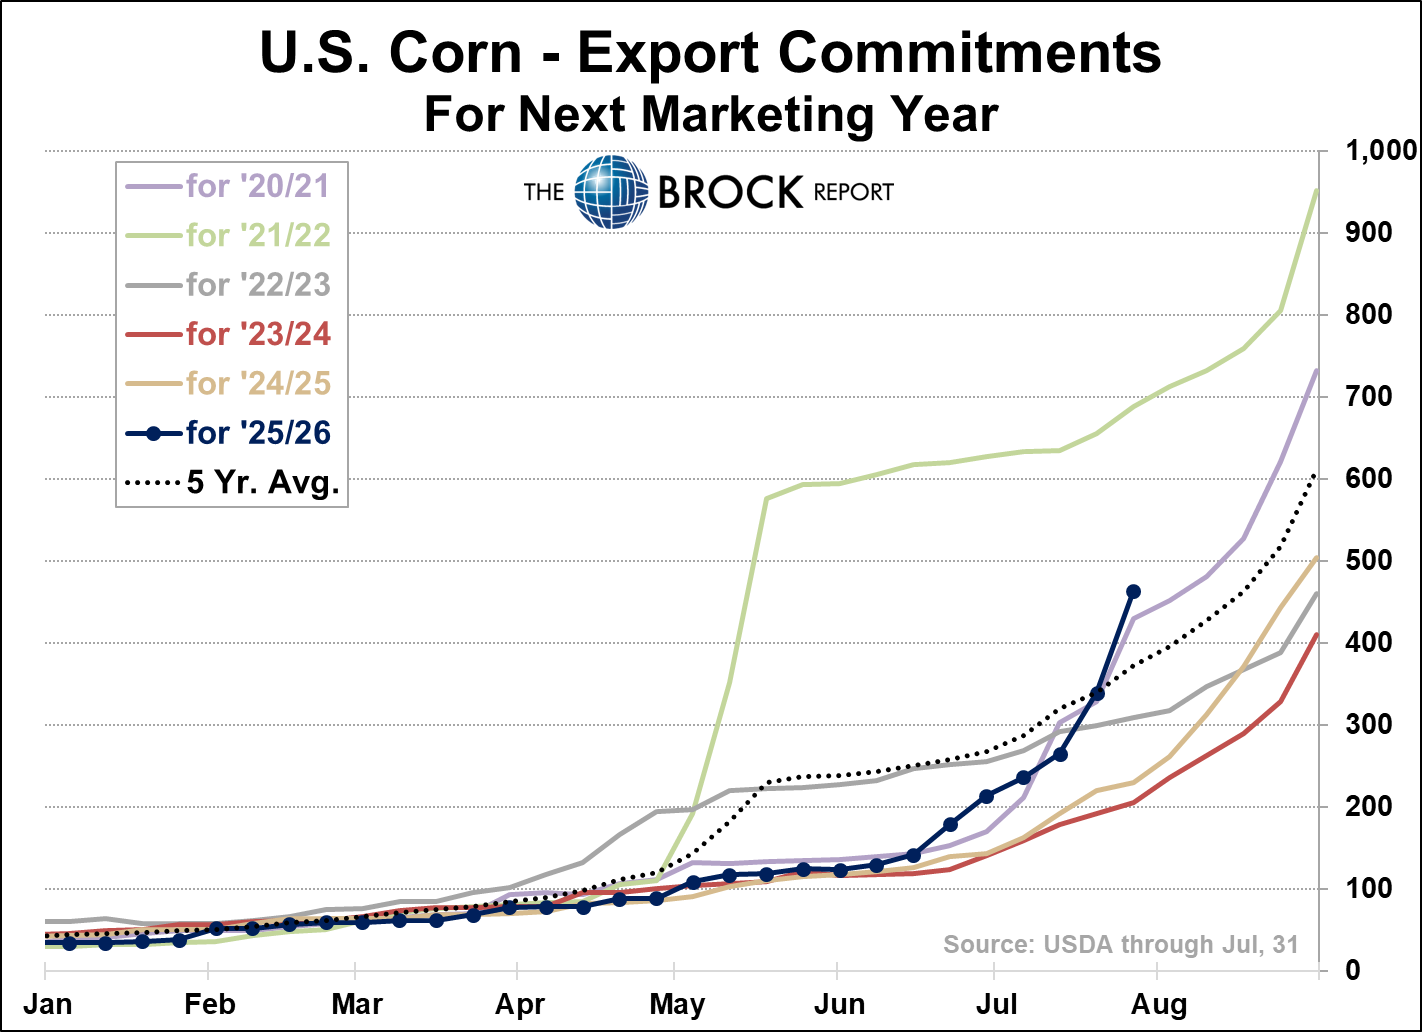
Just look at these export charts from the Brock Report.
New crop corn exports are the best since 2021/22 which was entirely led by record buying from China.
We've seen zero buying from China this year. Which makes this even more impressive.
I don’t know how anyone could argue against this demand.
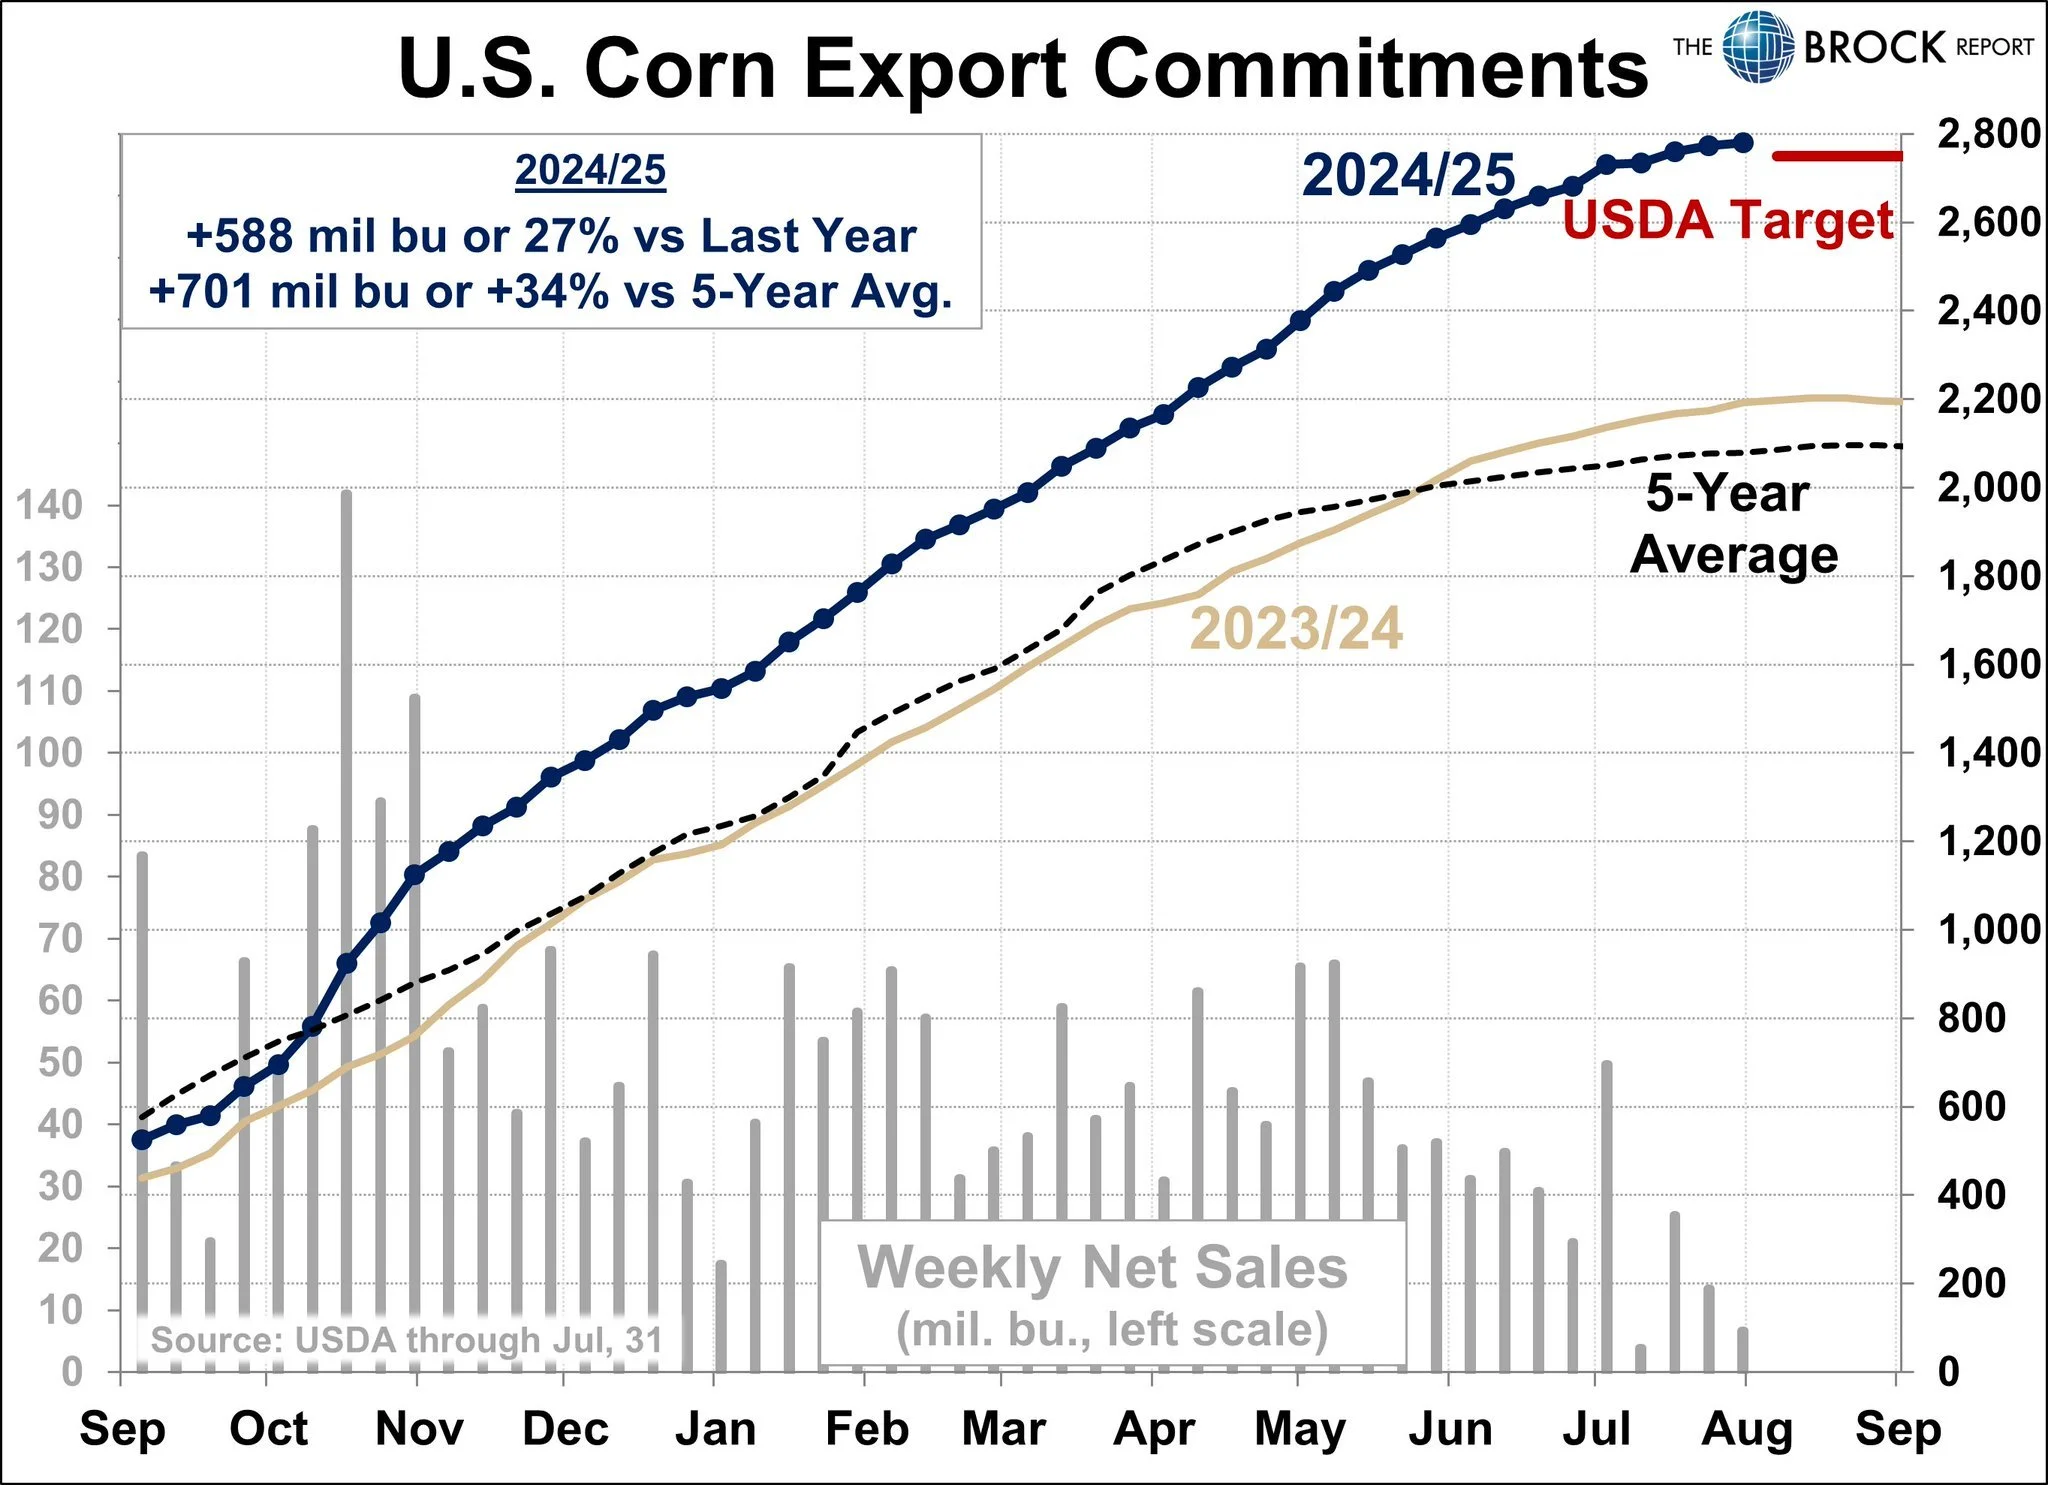
New Crop
Old Crop
For the week, wheat saw their best export sales in a decade.
We've been seeing some nice demand lately from wheat.
Hopefully it continues, as this is one path to a less burdonsome US balance sheet.
Chart from Allendale
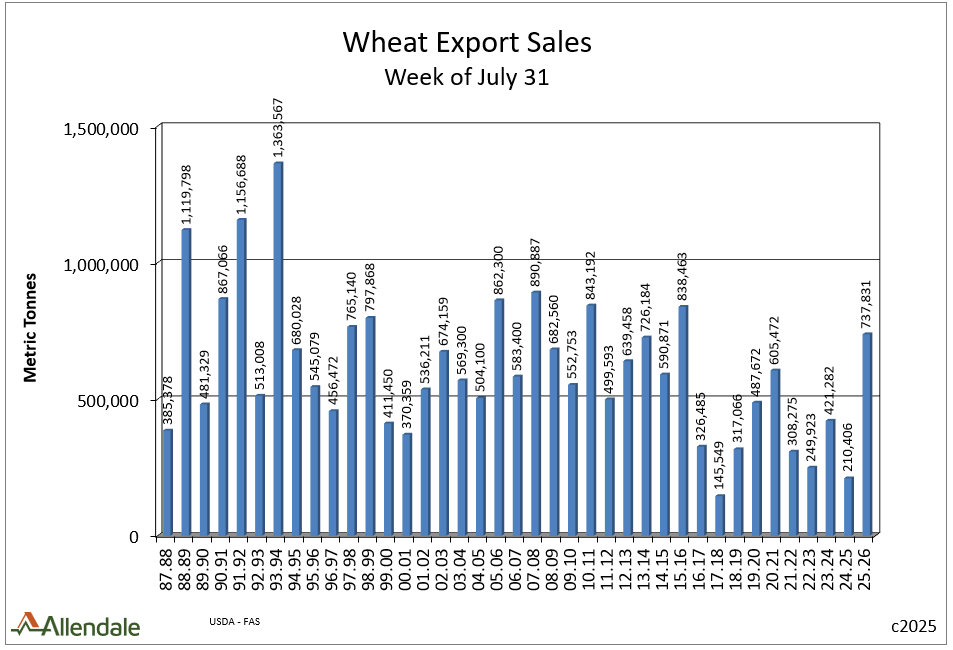
For reference, US wheat stocks to use ratio is the highest since 2020.
Not a bullish number by any means.

Todays Main Takeaways
Corn
Now let's dive into this morning’s buy signal.
First off, this buy signal is NOT me calling a harvest low.
I would love for this to be the harvest low. But it is far too premature to claim it was. I am very skeptical this was the definitive low.
However, I think we are due for a bounce based on several different reasons. I could be wrong, but here is why I could see a bounce:
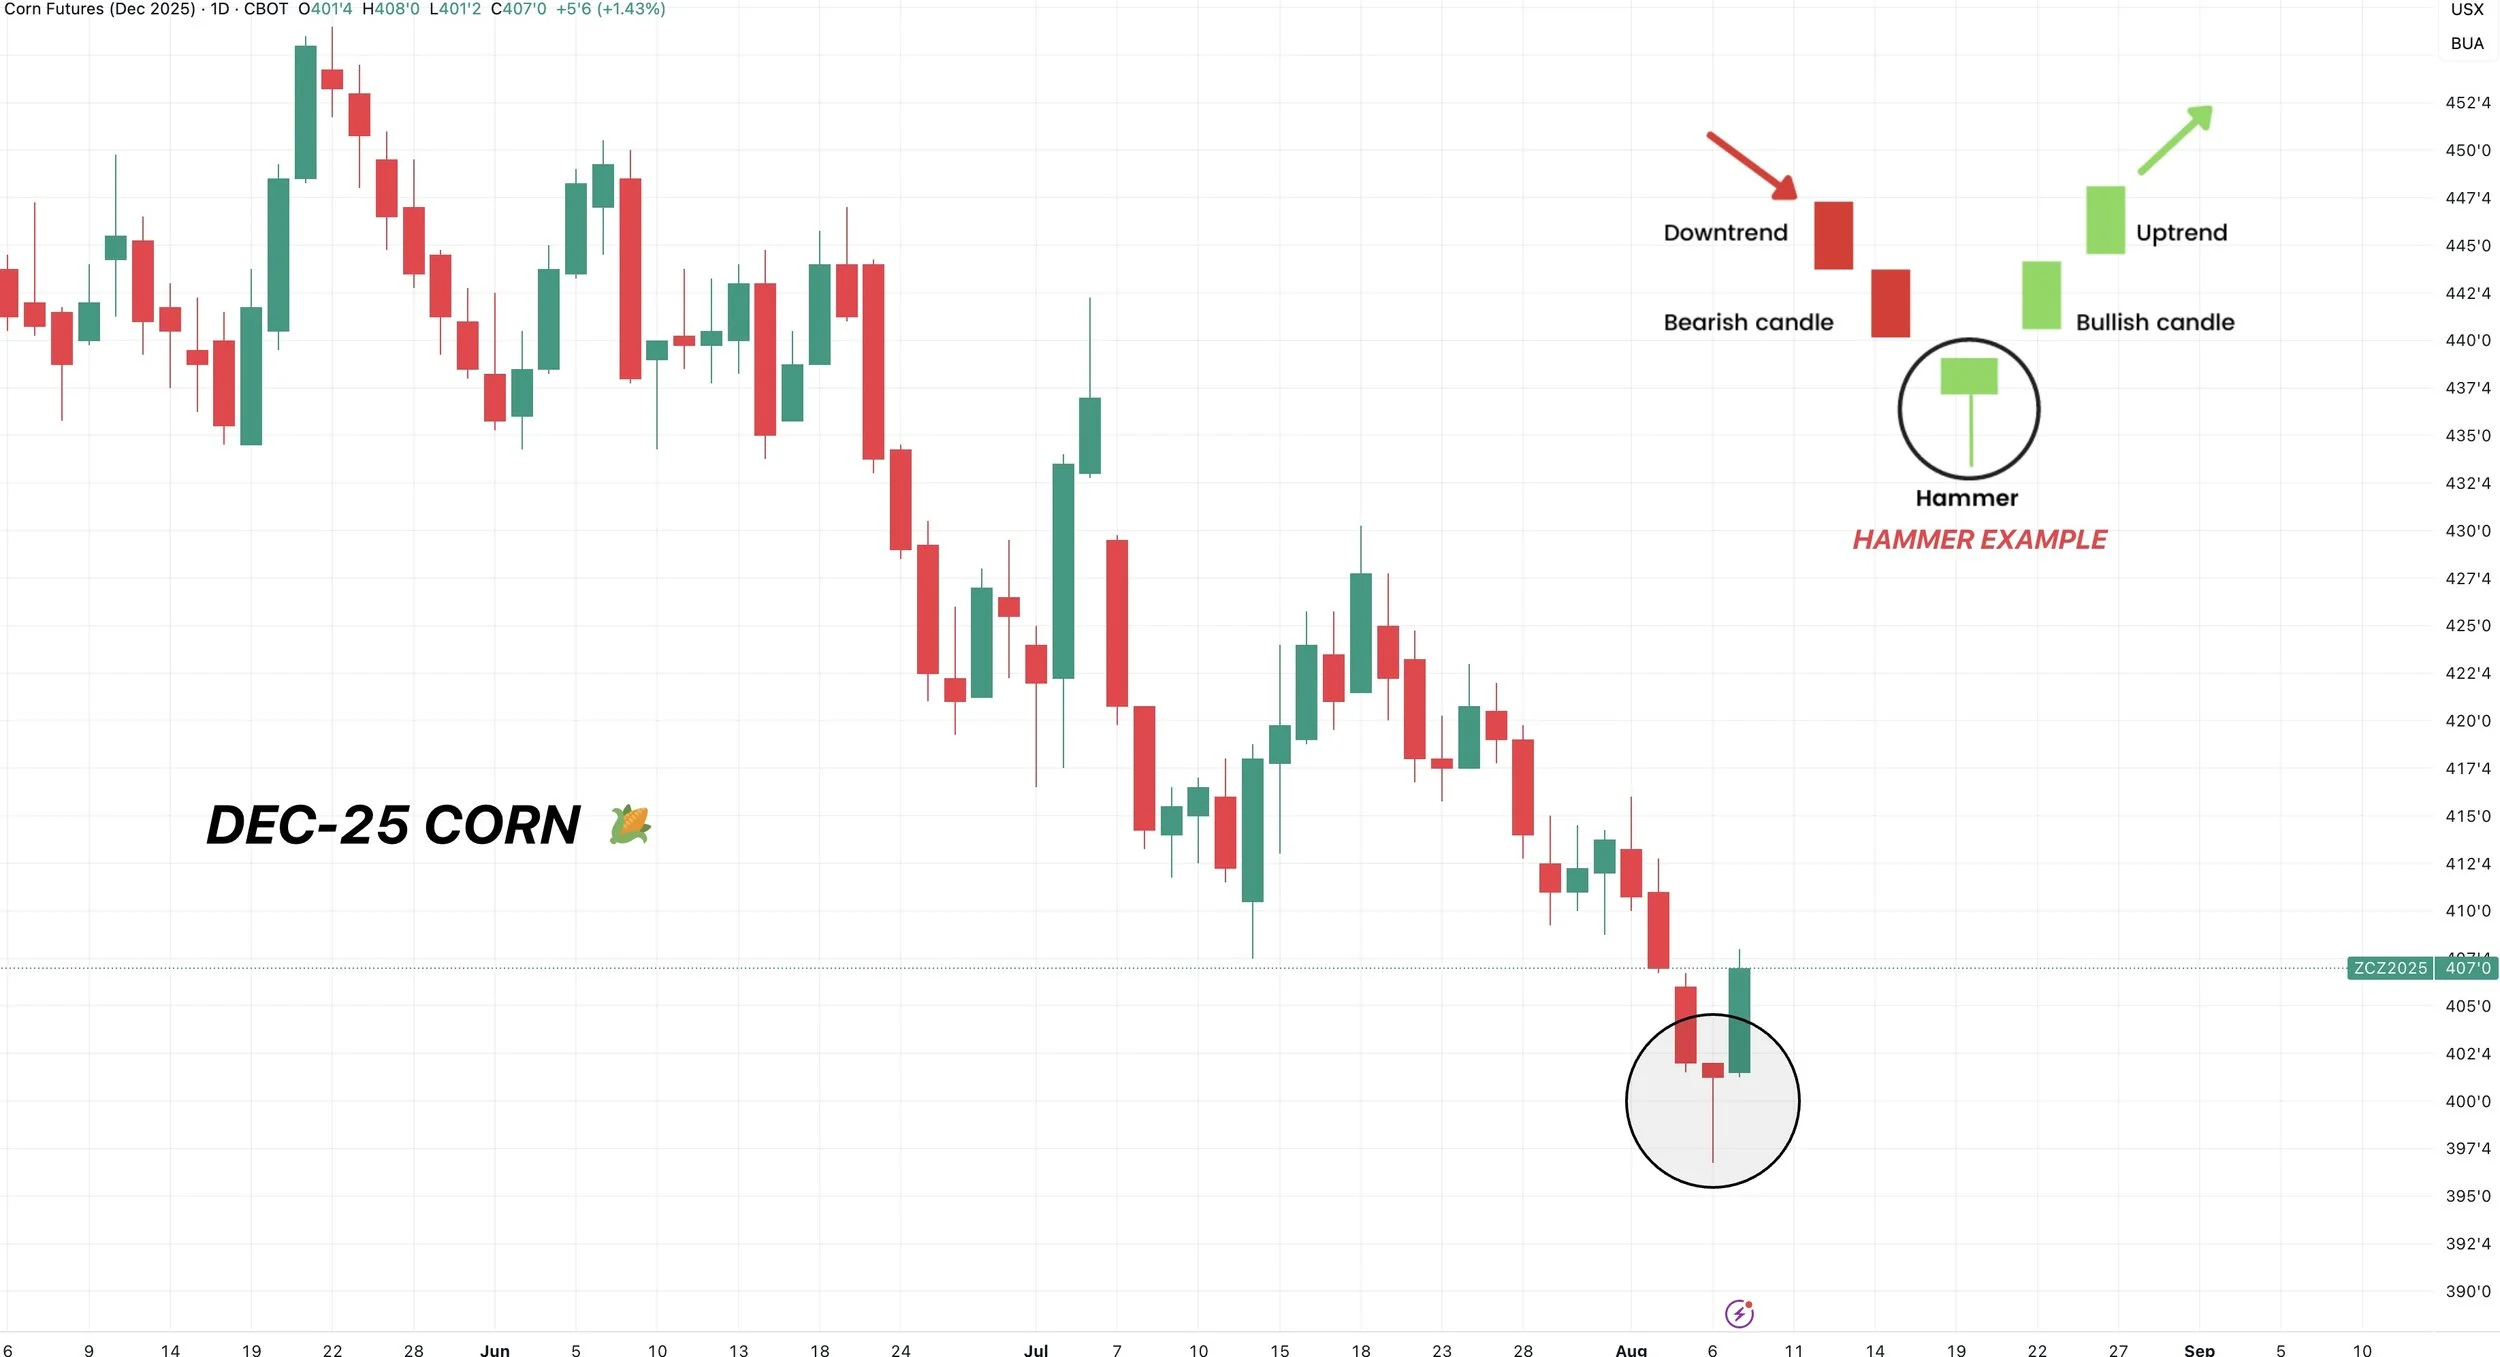
Reason #1
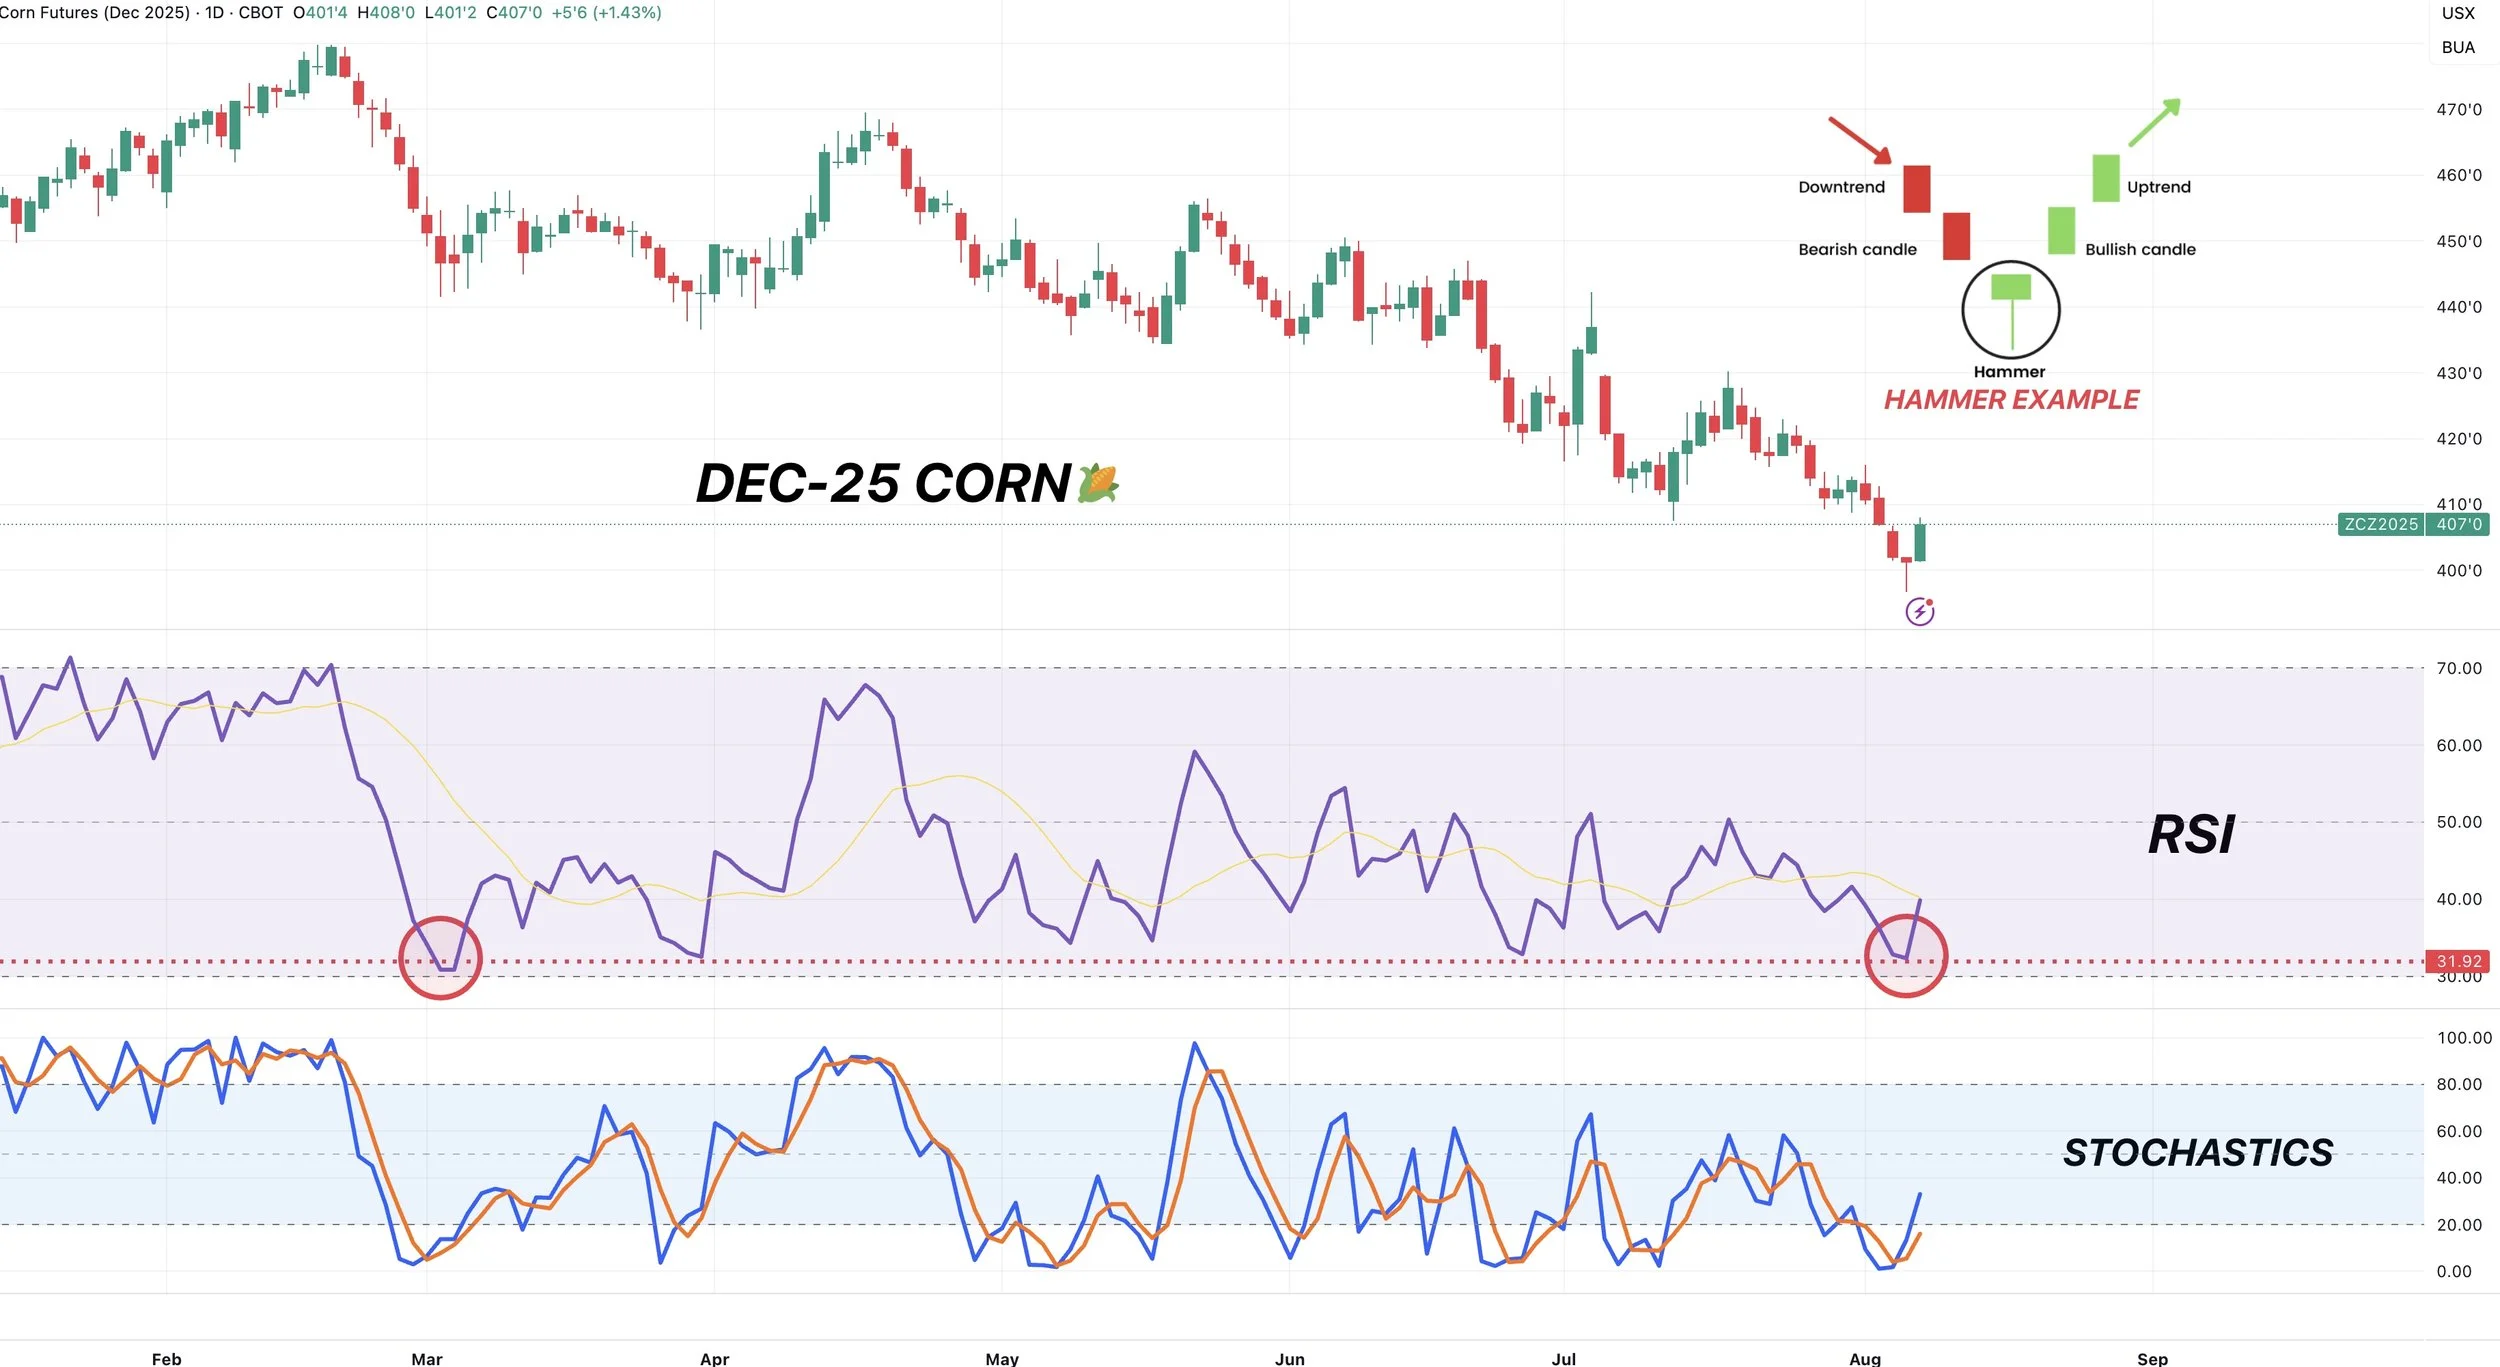
Yesterday Dec corn broke $4.00 and posted new contract lows before rallying into the close and leaving a textbook hammer pattern.
This is often a sign of a reversal.
Basically you take out everyone's stops at $4.00, then reverse us higher.
Reason #2
We had been saying for a while that if Dec corn broke $4.09 our next stop was likely $3.95
Why?
That was the 100% fib extension lower from the 4th of July weekend sell off.
Meaning this rally equaled the exact same size as that one.
We nearly tapped it yesterday before bouncing.

Reason #3
The RSI (relative strength index) for corn was sitting at it's lowest levels since March.
Meaning corn was severely oversold. So I think we are due for a bounce.
The stochastics were also bottomed out and flipping bullish.
Neither are perfect indicators, but they help give us some confidence.
If you follow someone like Roach Ag, how they identify their buy and sell signals is largely by soley using stochastics.
2024 vs 2025
Last year we spent just 30 days below $4.00
Our absolute low was $3.85
Meanwhile our supply and demand situation is tighter this year.
What reason do we have to spend a longer amount of time below $4.00 or take out those $3.85 lows by a wide margin?
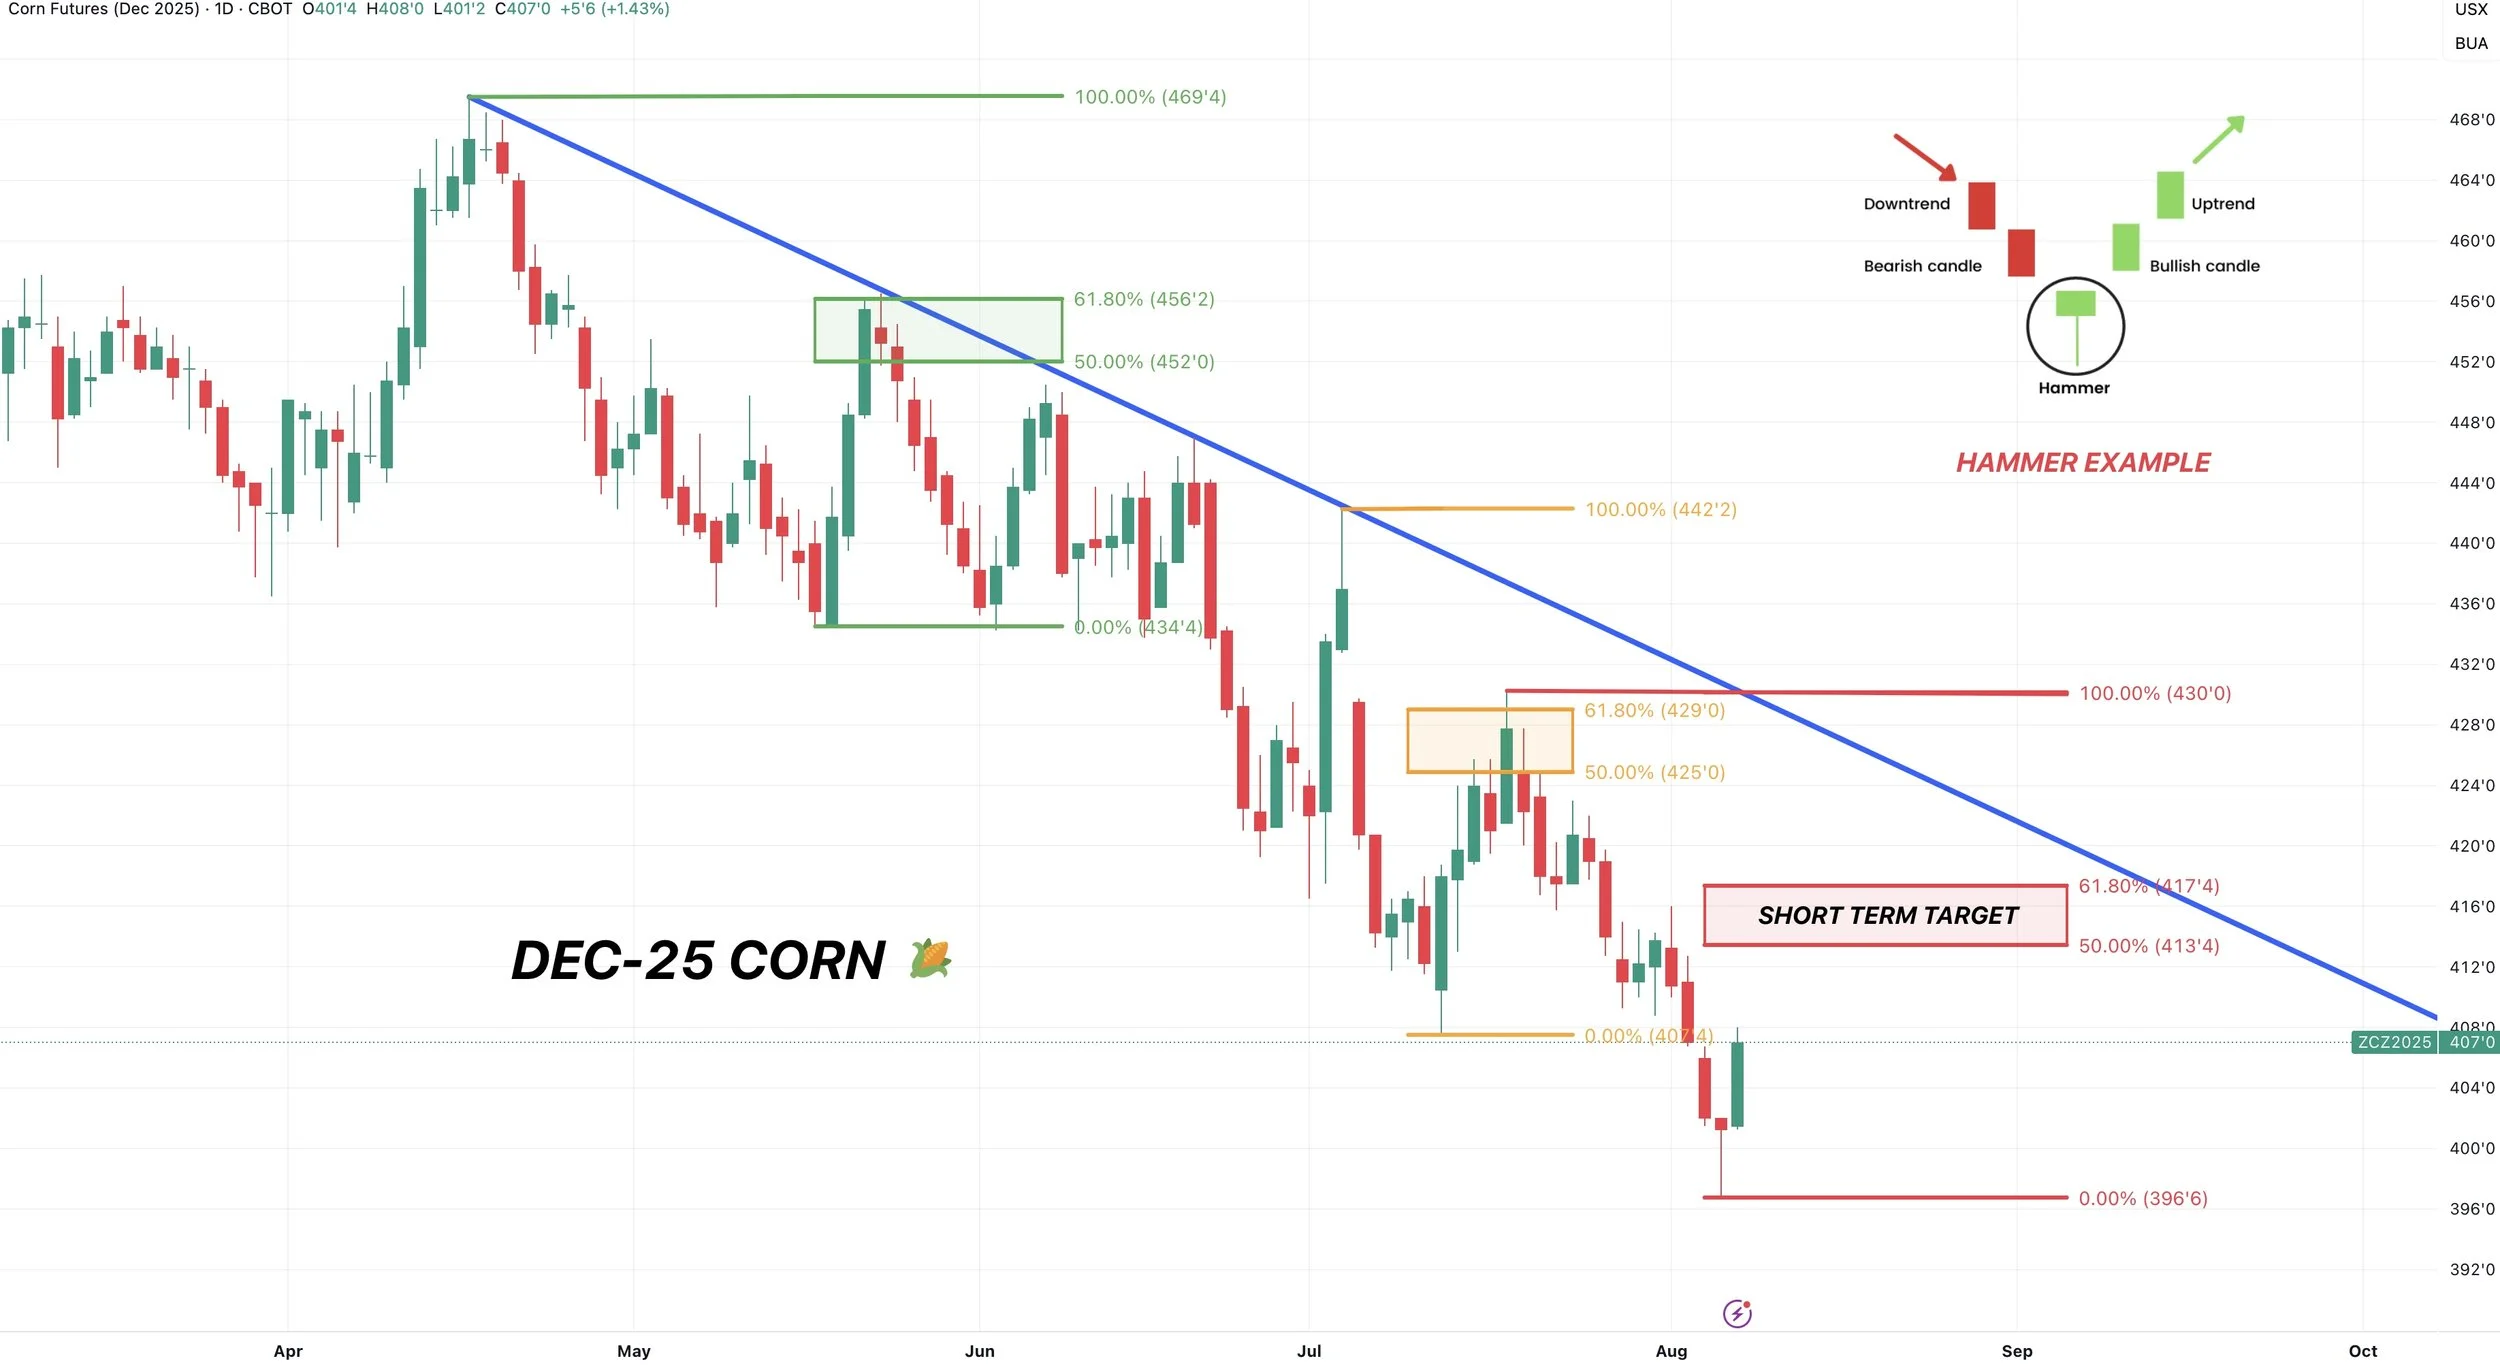
Short Term Target & Power of 61.8%
Our short term target for this bounce is going to be $4.13 to $4.17 (Red box)
So if you followed this buy signal, this is the area I am looking for.
I am not selling cash corn here this far below the cost of production. This is simply my target to exit this buy signal.
Why?
This is the 50-61.8% retracement of the recent sell off.
If we look at previous bounces, you'll notice the 61.8% level is extremely common.
The July bounce? Failed at 61.8% of the June sell off (Orange box)
The May bounce? Failed at 61.8% of the April selll off (Green box)
This level is where the market makes a decision. This is either just a corrective bounce, or something bigger. If we break above it, we'll know if it's something bigger. But until then, this is seen as a corrective bounce.
We could very possibly get this bounce up to that golden zone before coming back down and posting a new low.
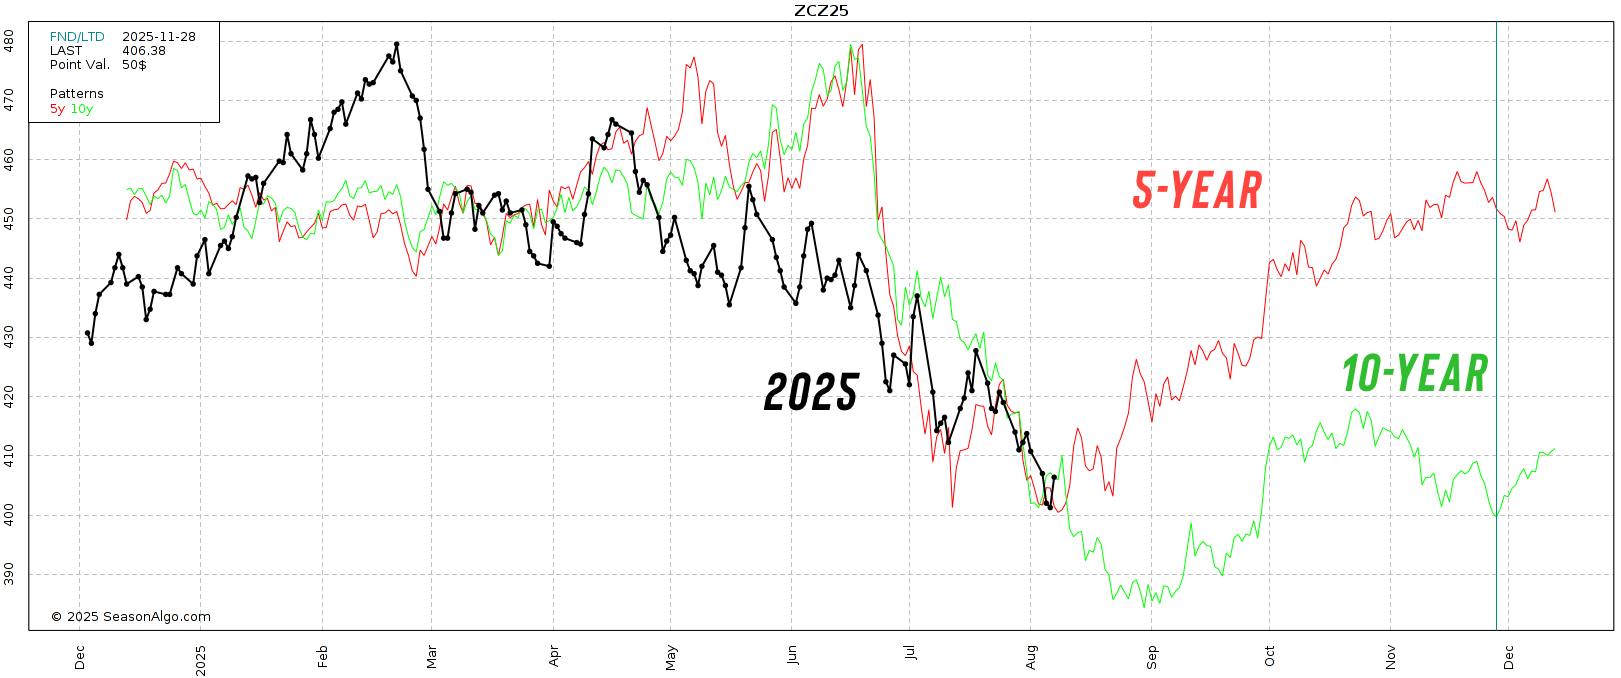
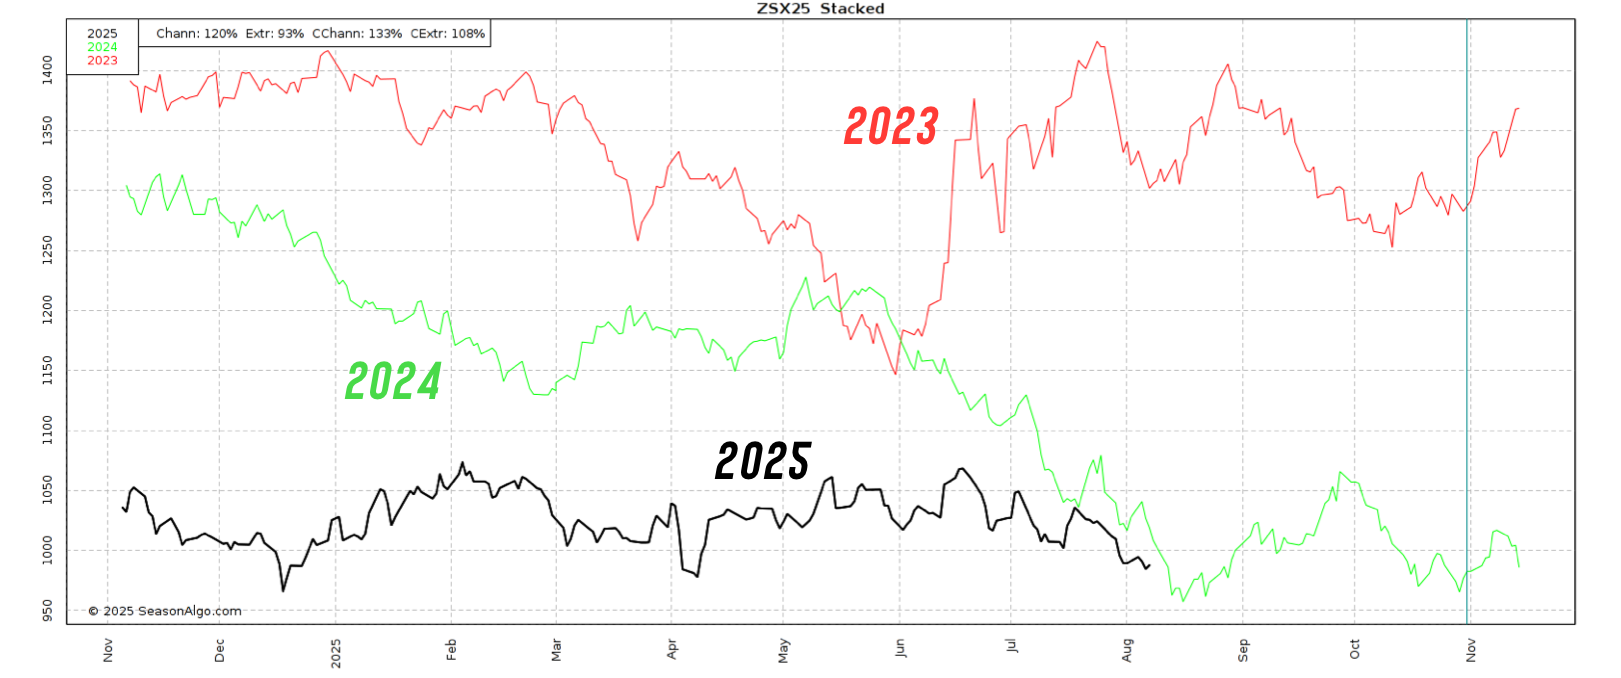
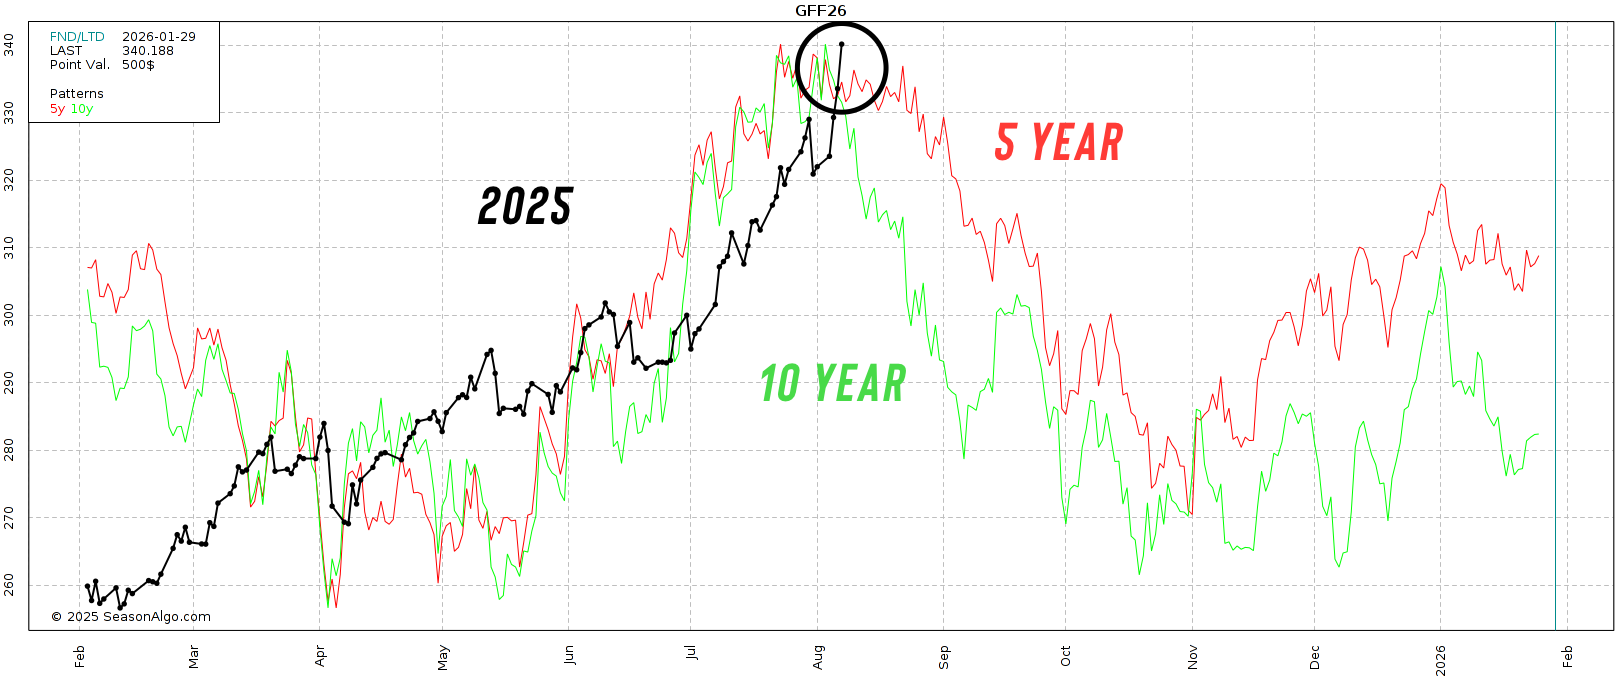
Seasonals:
Although I am very hesitant to call this our true bottom, seasonals do all suggest a bottom within the next 30 days.
The 5 year says we bottom now. But something to be aware of is that 2020 could also skew this data. As that rally was orginally ignited by the derechos.
Soybeans
Just like in corn, I am very hesitant to call this a harvest low.
I think soybeans have the easiest path to a tighter balance sheet, but short term this is the market I am most cautious about. As corn and wheat are already beat up and sitting at contract lows.
However, there are reasons why I could see soybeans getting at least a short term bounce here as well.
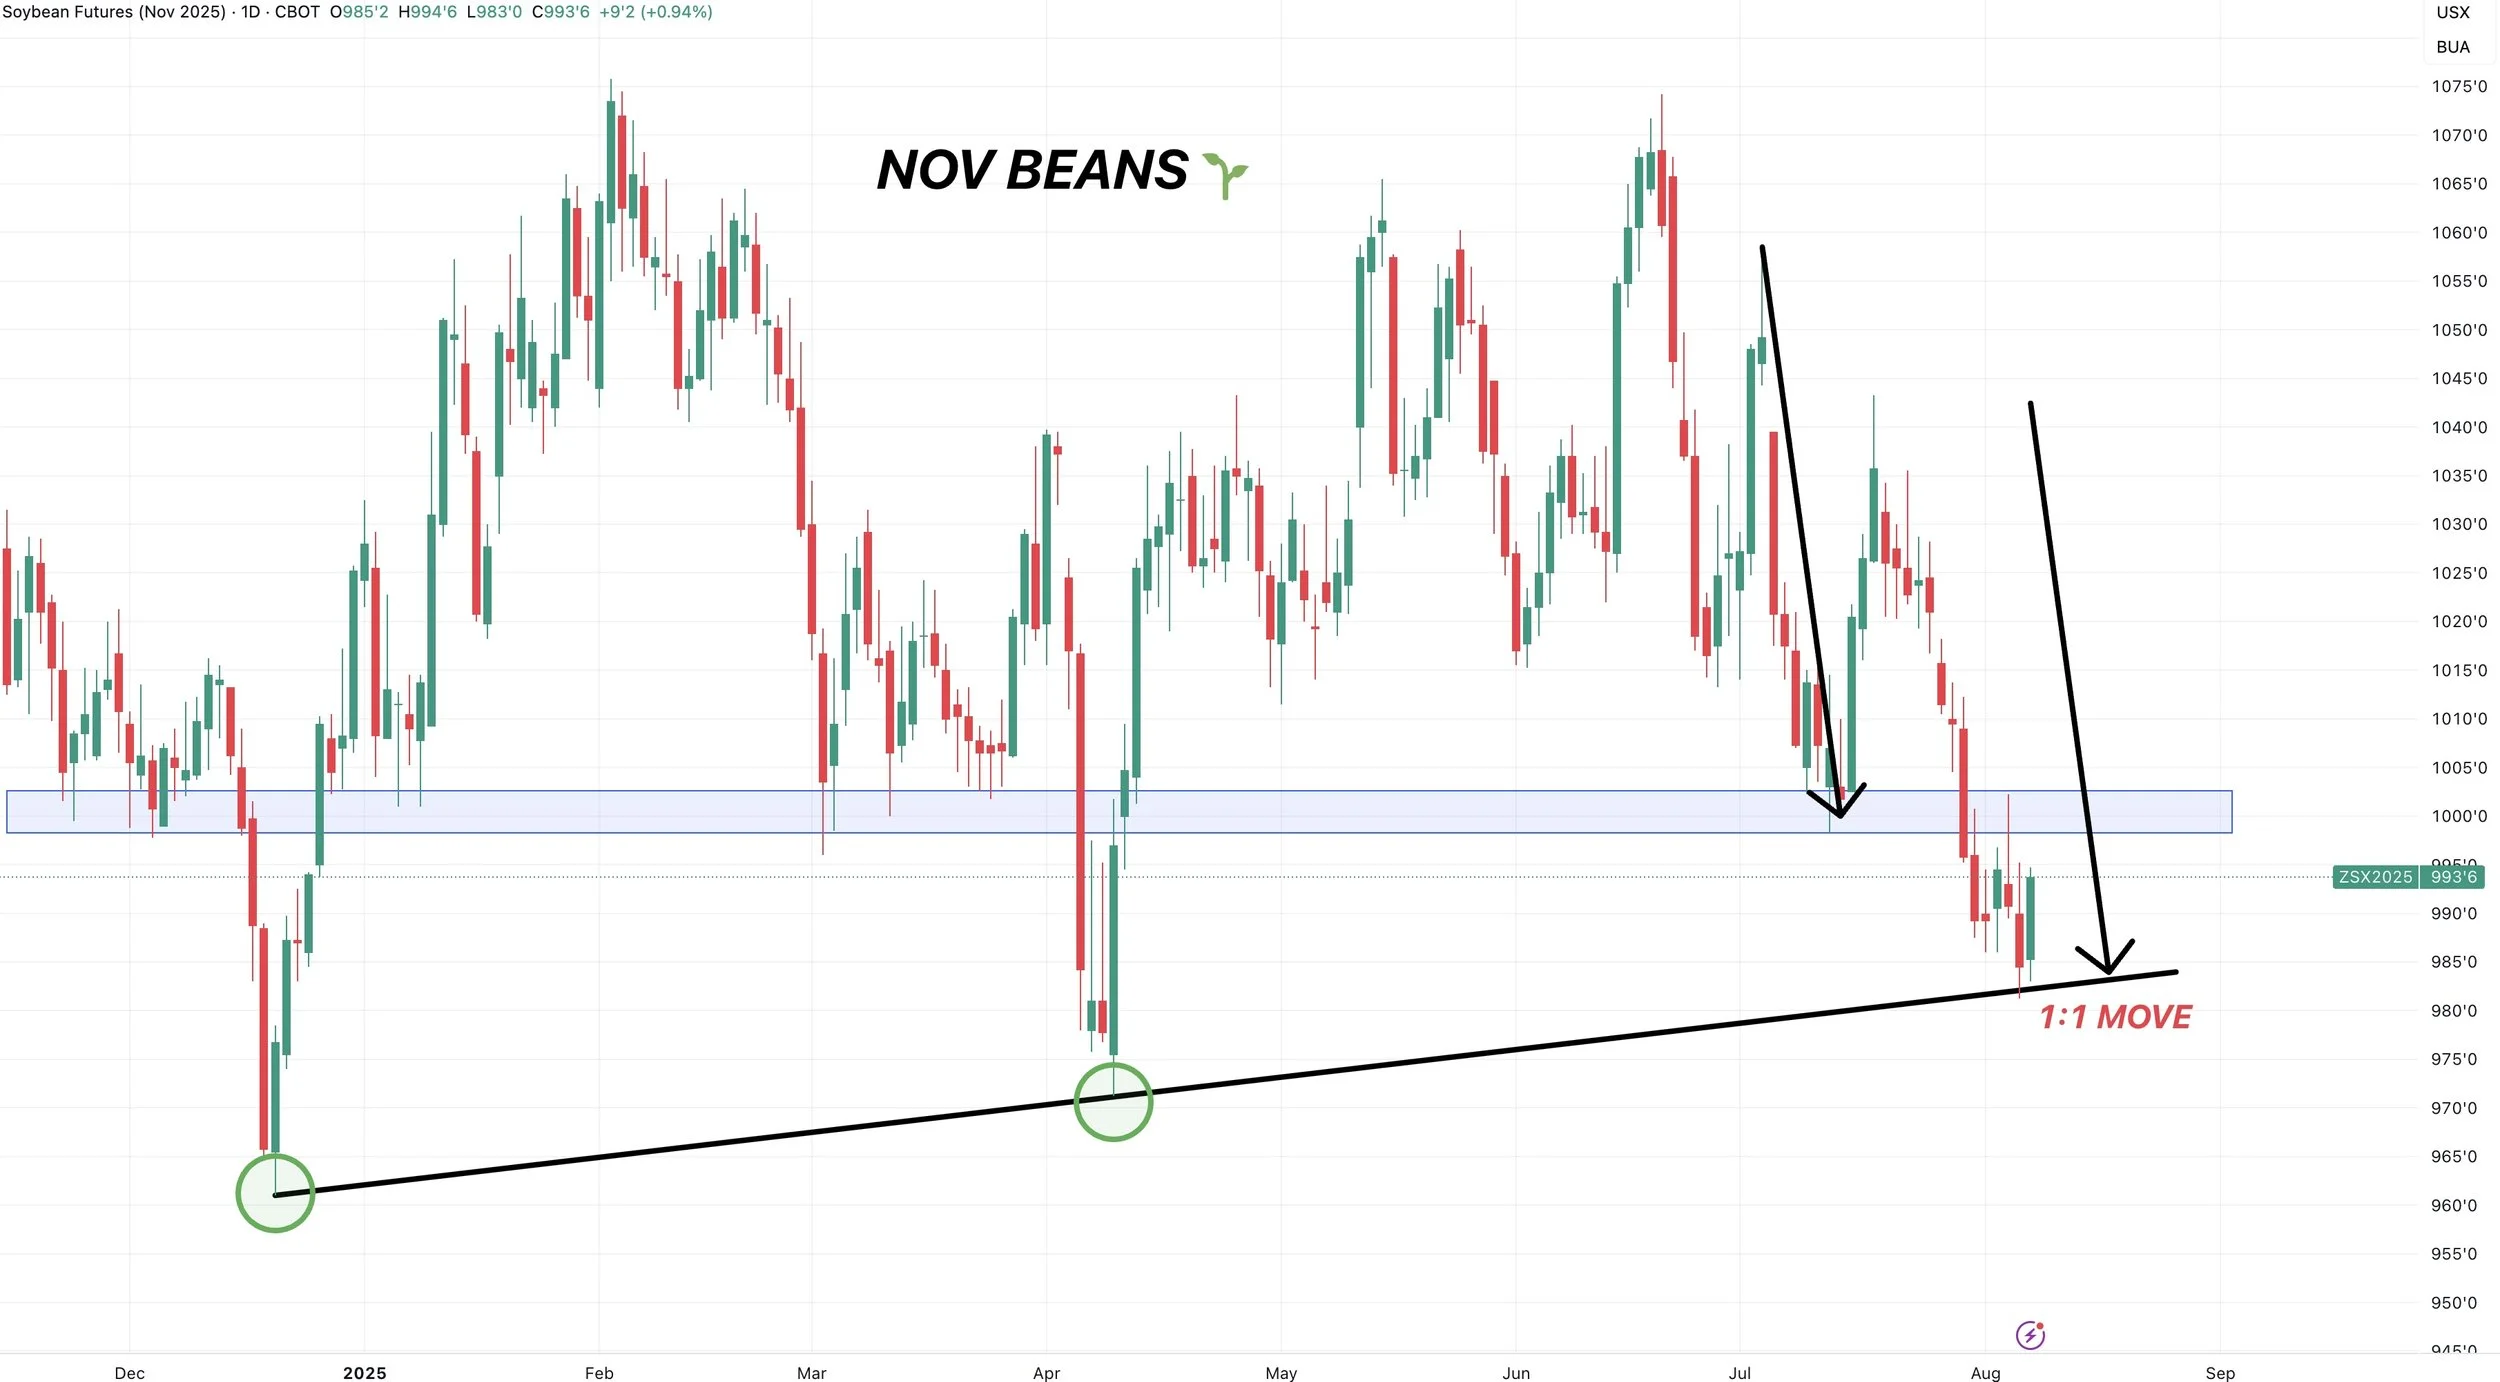
We had talked for weeks that if Nov beans broke below $10.00 our next stop would be $9.80
We finally hit that downside target.
$9.83 was the 100% fib extension lower from the 4th of July weekend sell off (the exact same methodology used in our downside corn target).
This level also perfectly lines up with trendline from our December and April lows. Both times we touched this it resulted in a bounce.
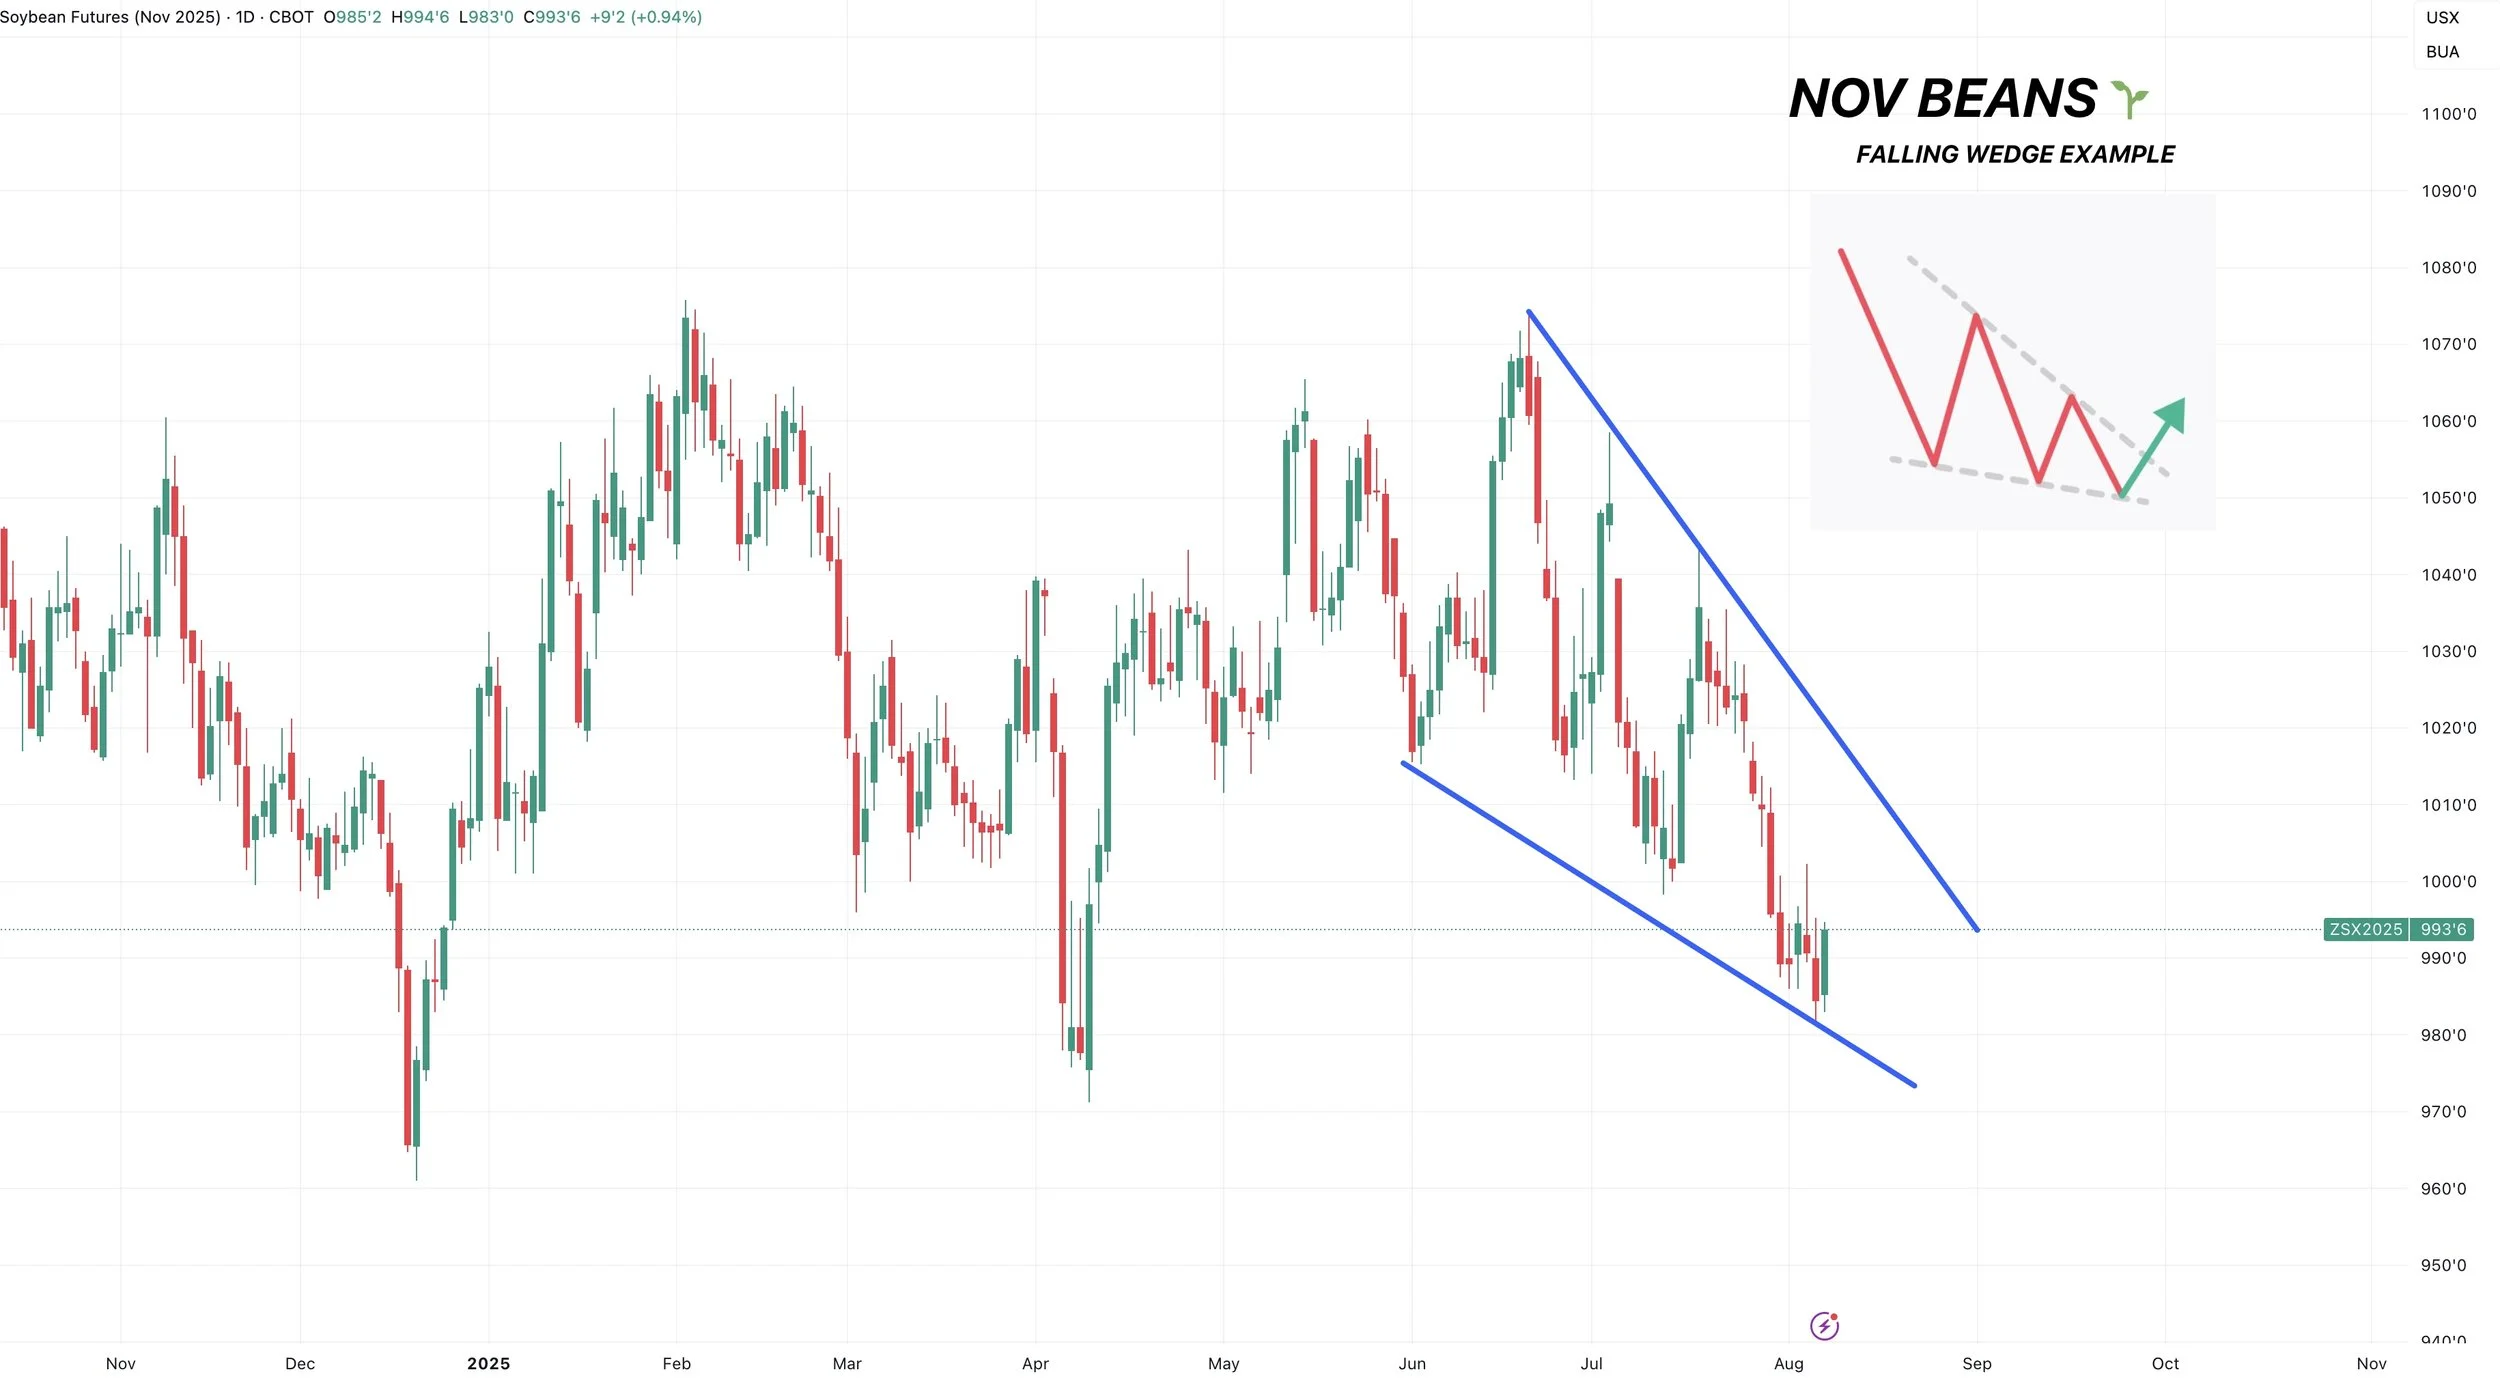
We also have a potential falling wedge pattern in place.
This is often viewed as a bullish pattern. BUT you need an upside breakout for confirmation, as we could just as easily get a downside breakout.
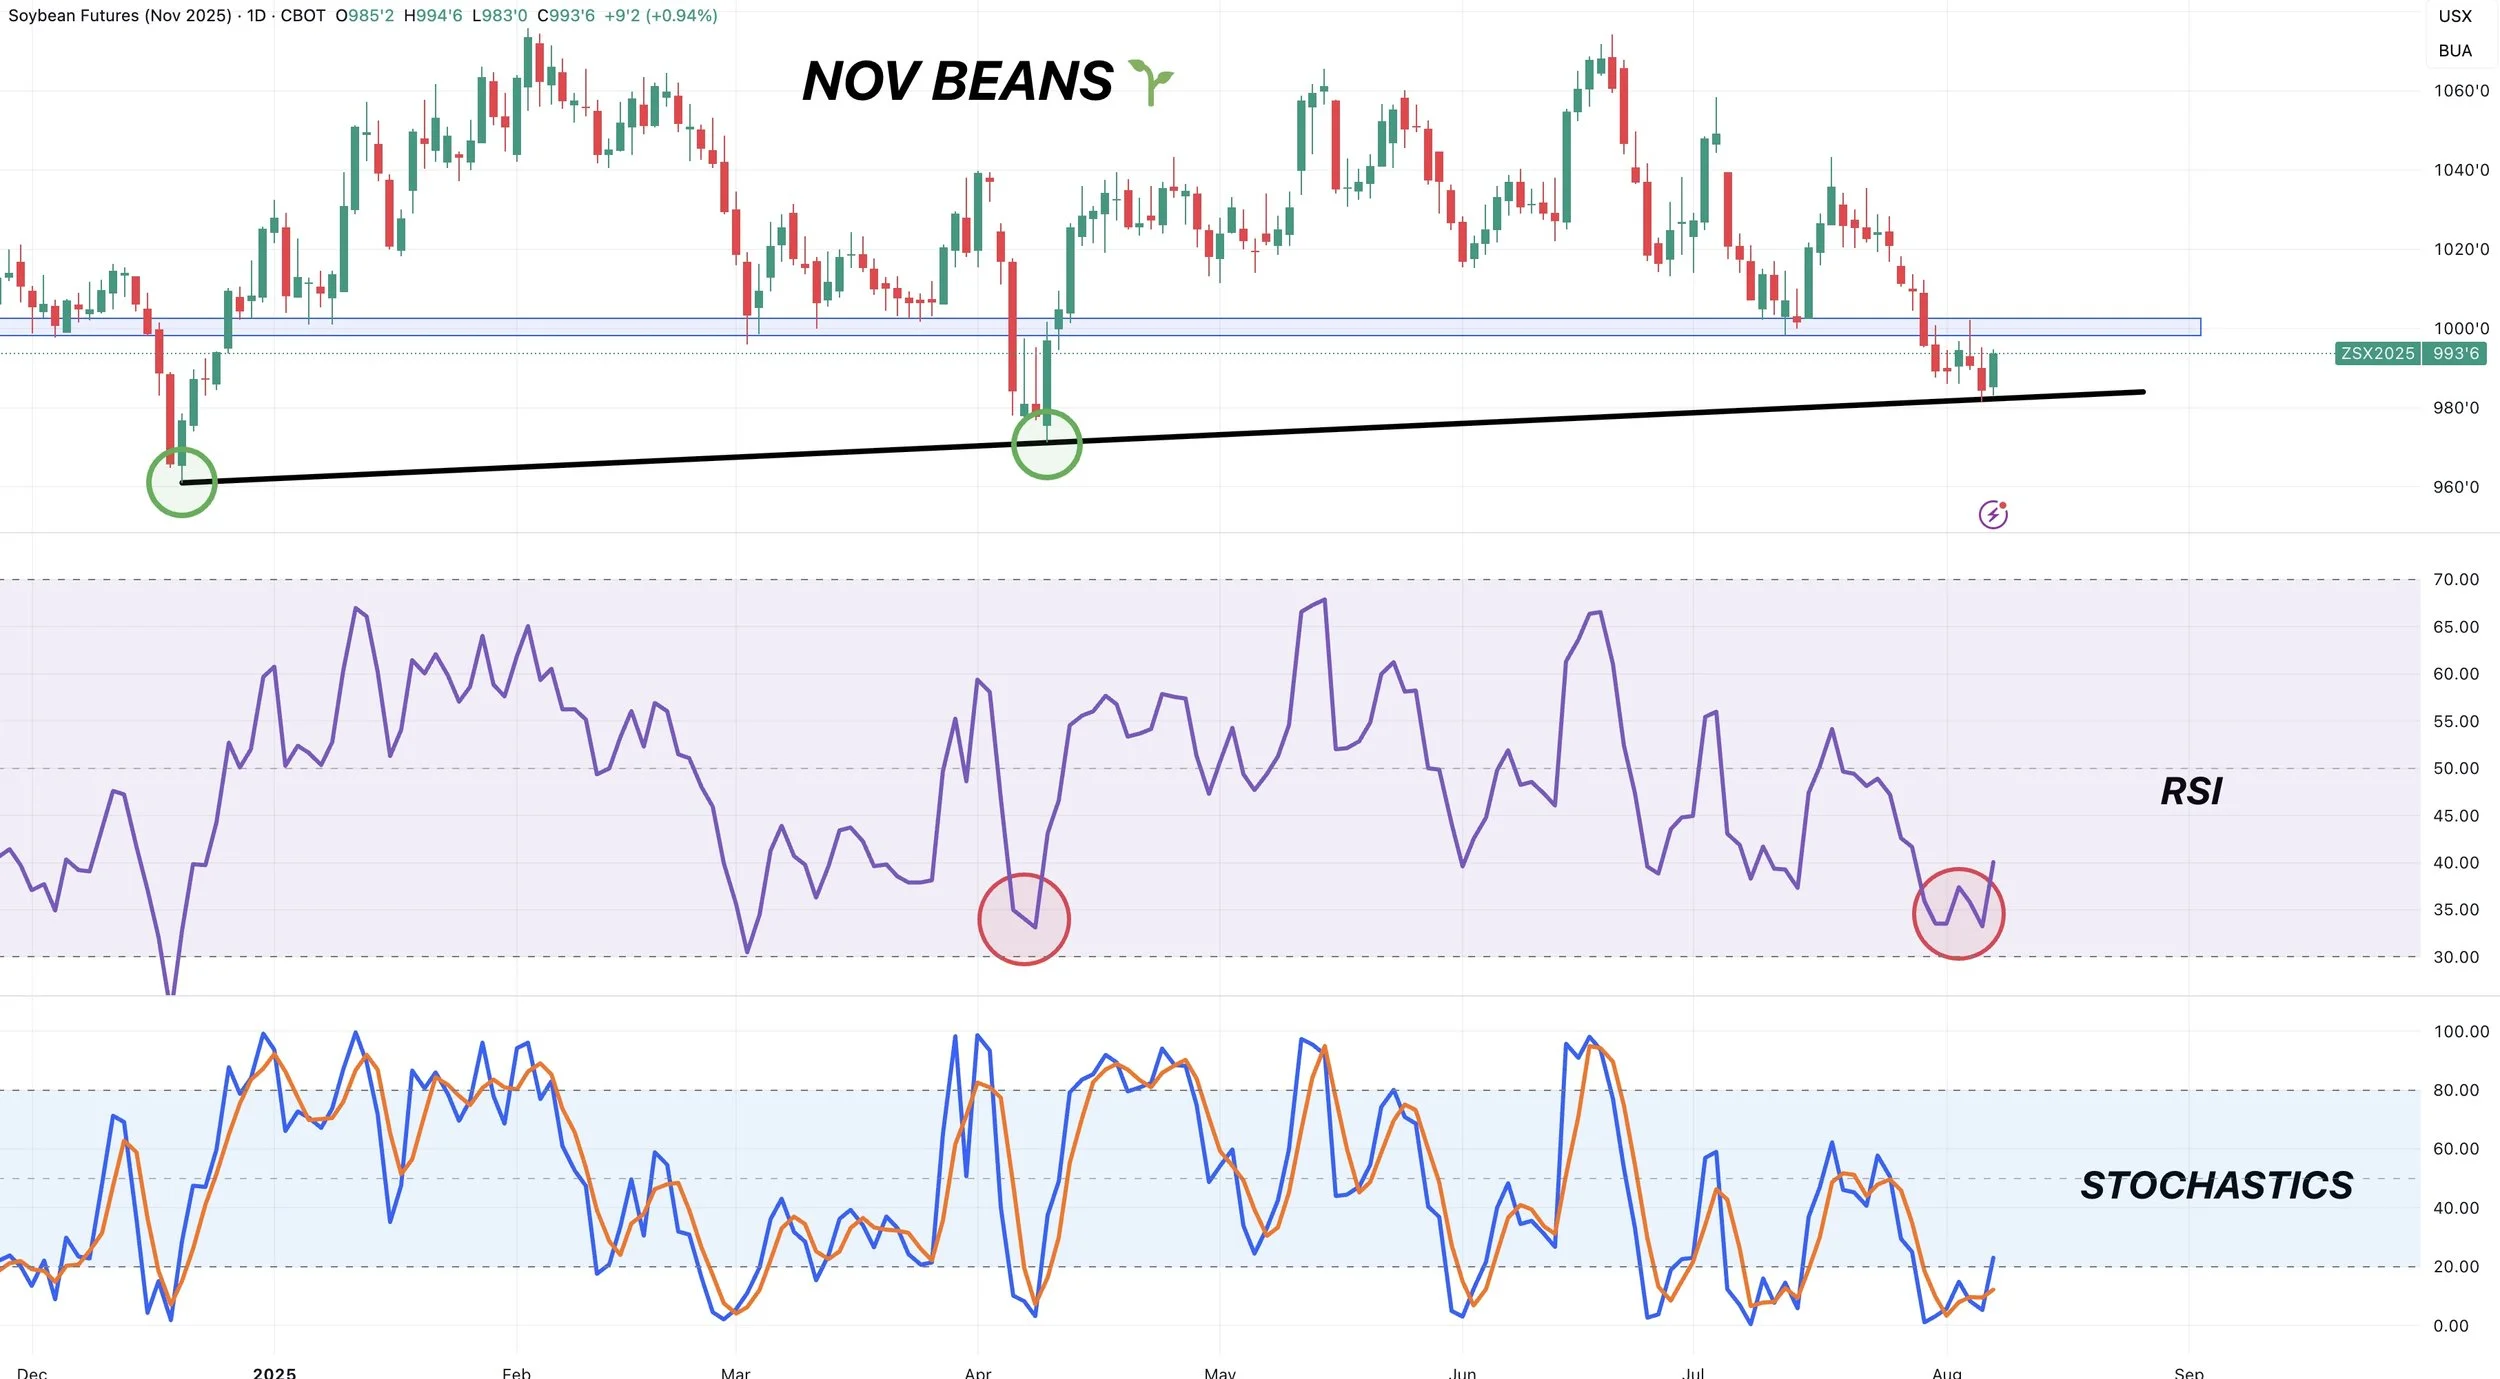
RSI & Stochastics
Along with corn and wheat, soybeans were very oversold as well.
The RSI was at it's lowest levels since the April trade war fear sell off.
The stochastics were bottomed out and now shifting higher which marked past lows.
As always, indicators are far from perfect. But they help analyze a market.
Short Term Target & Power of 61.8%
Our target is going to be $10.12 to $10.19
Again we are not making cash sales here. This is simply the target to exit the buy signal.
This is the 50-61.8% retracements of the recent sell off.
If you look at the last 2 bounces, they both rejected right off the 61.8% level of the prior sell off (Green and blue boxes).

2024 vs 2025
Sorry, I know I've shown this chart countless times.
Our absolute floor last year was $9.60
We are sitting at $9.90 today with a carryout that is substantially tighter than it was at this same time last year.
Sure we could go lower, perhaps even as low as $9.60 But I think this is a good area of value.
Unless demand gets butchered, what reason do we have to take out last year's lows?
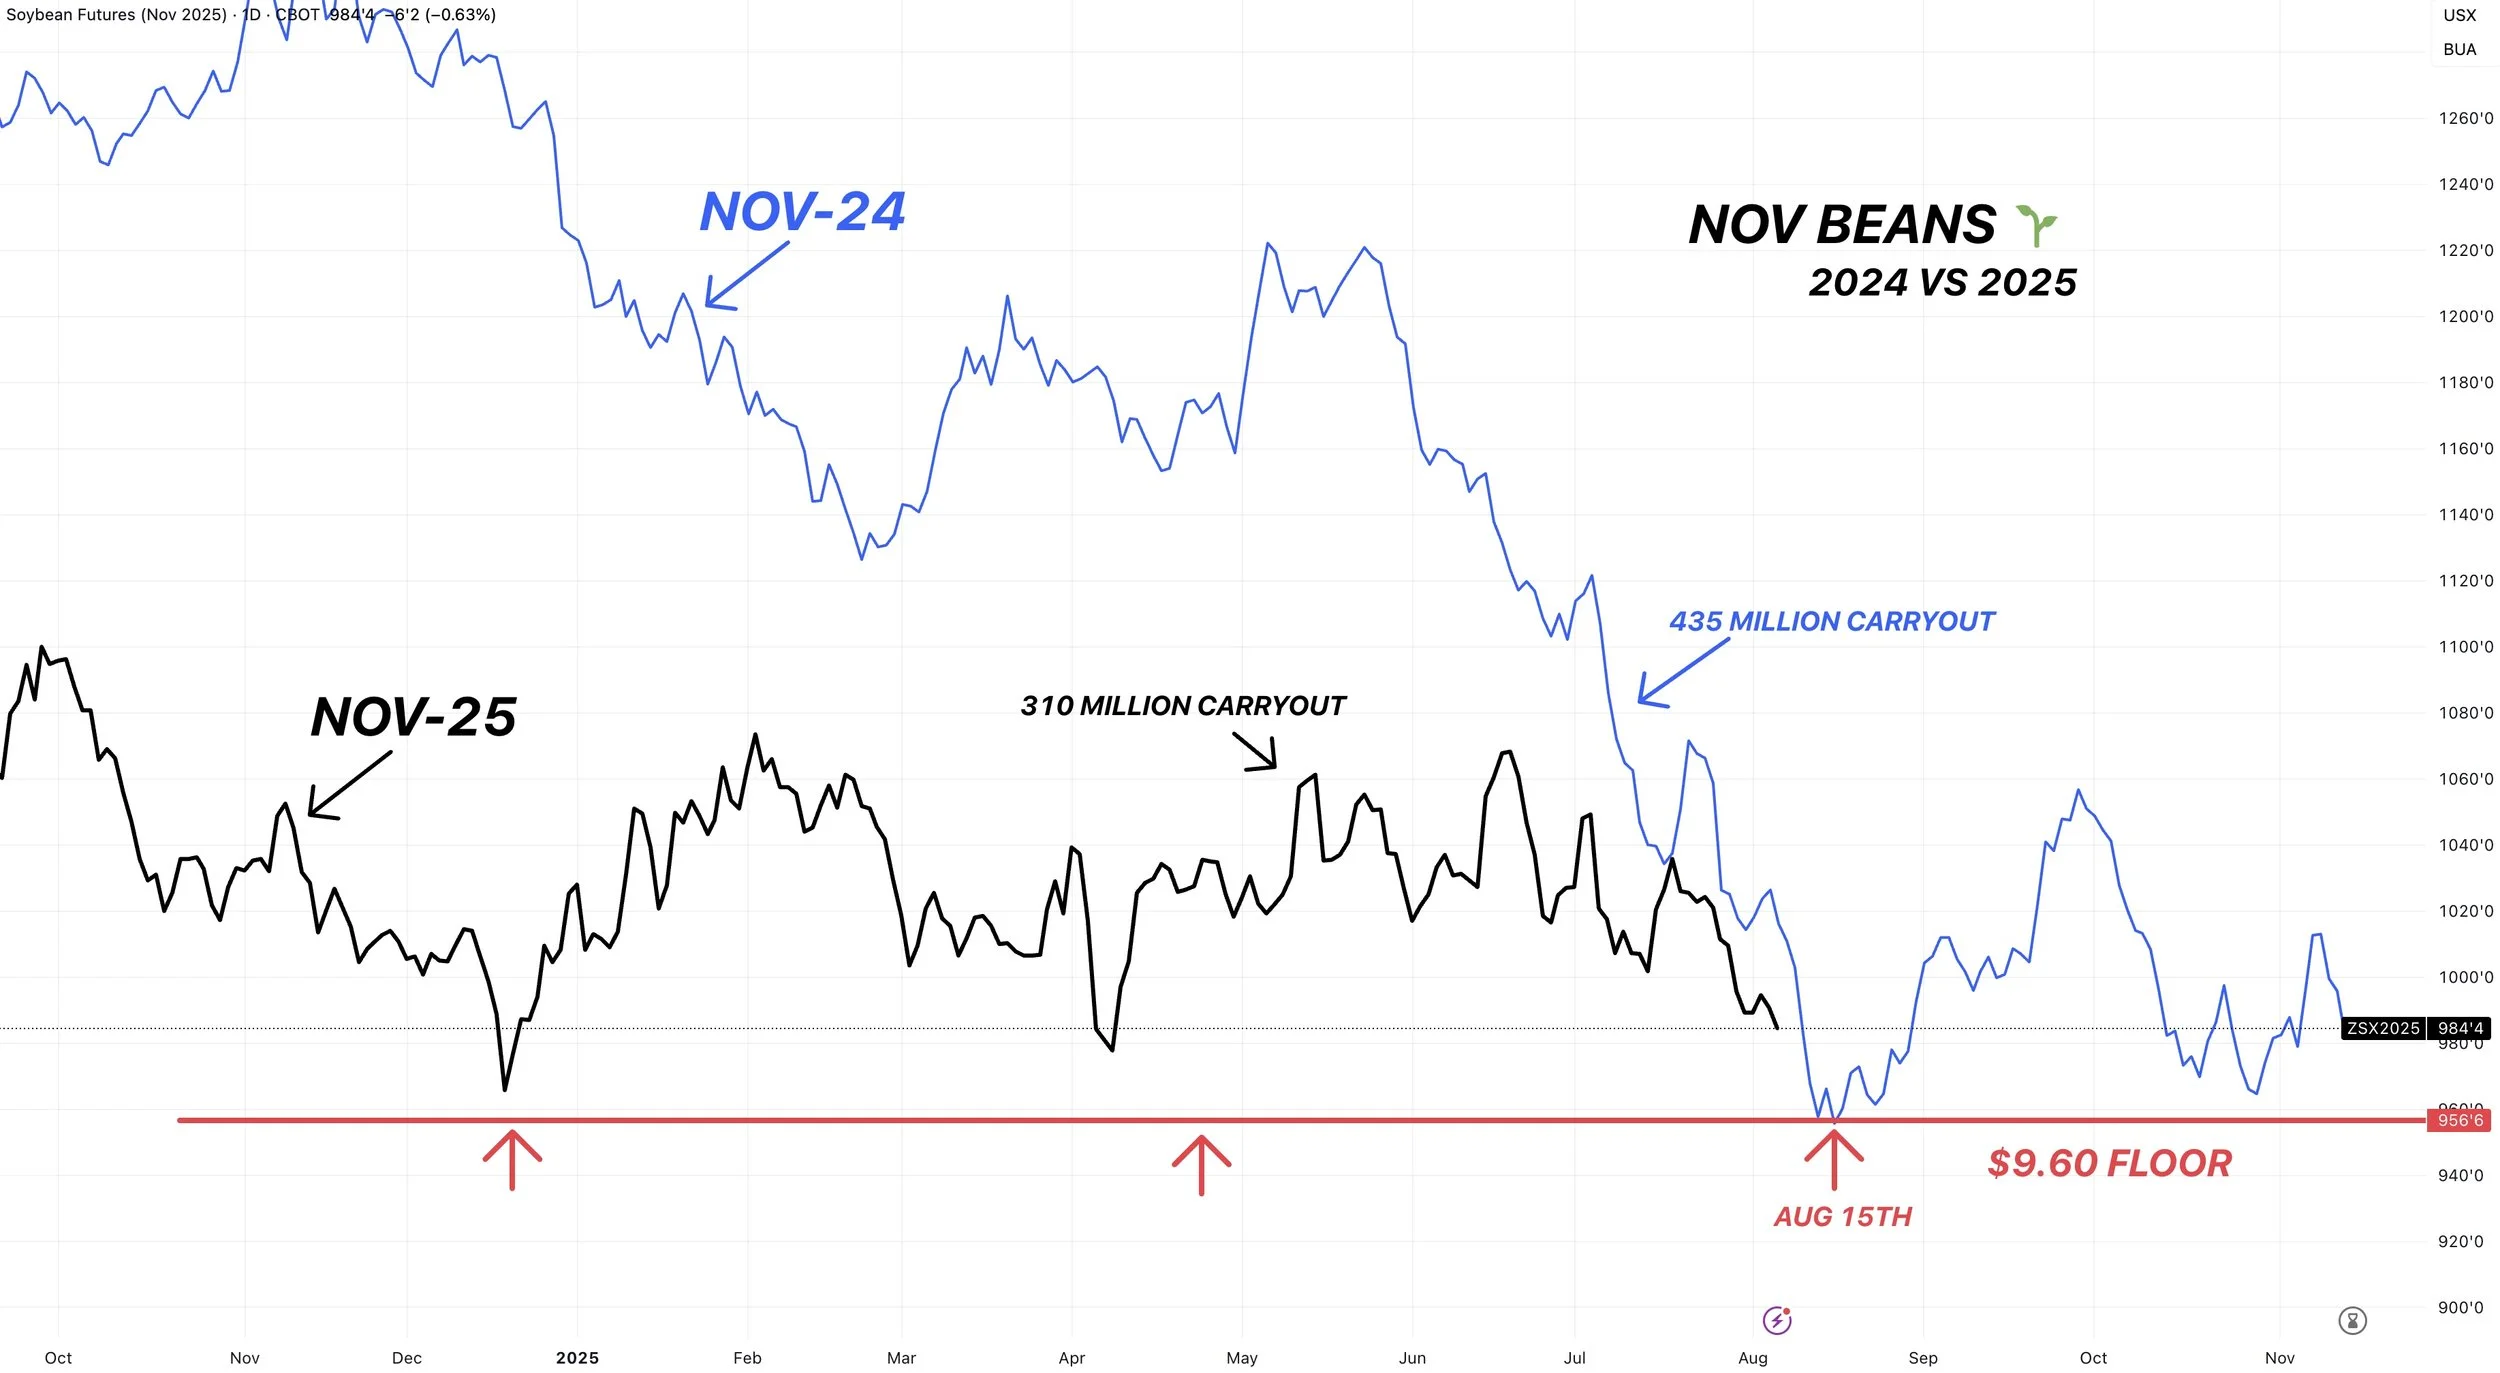
August Seasonal:
The last 2 years we found our bottom in the middle of August.
So I would like to think we start to find those harvest lows relatively soon. But that does not mean we couldn’t get a leg lower before hand.
Wheat
In my personal opinion, wheat is the one that feels like it has the most "upside potential" of the grains here. Partially because it is the one who has been beat up the worst.
Let's dive into the charts and why I could see a bounce.
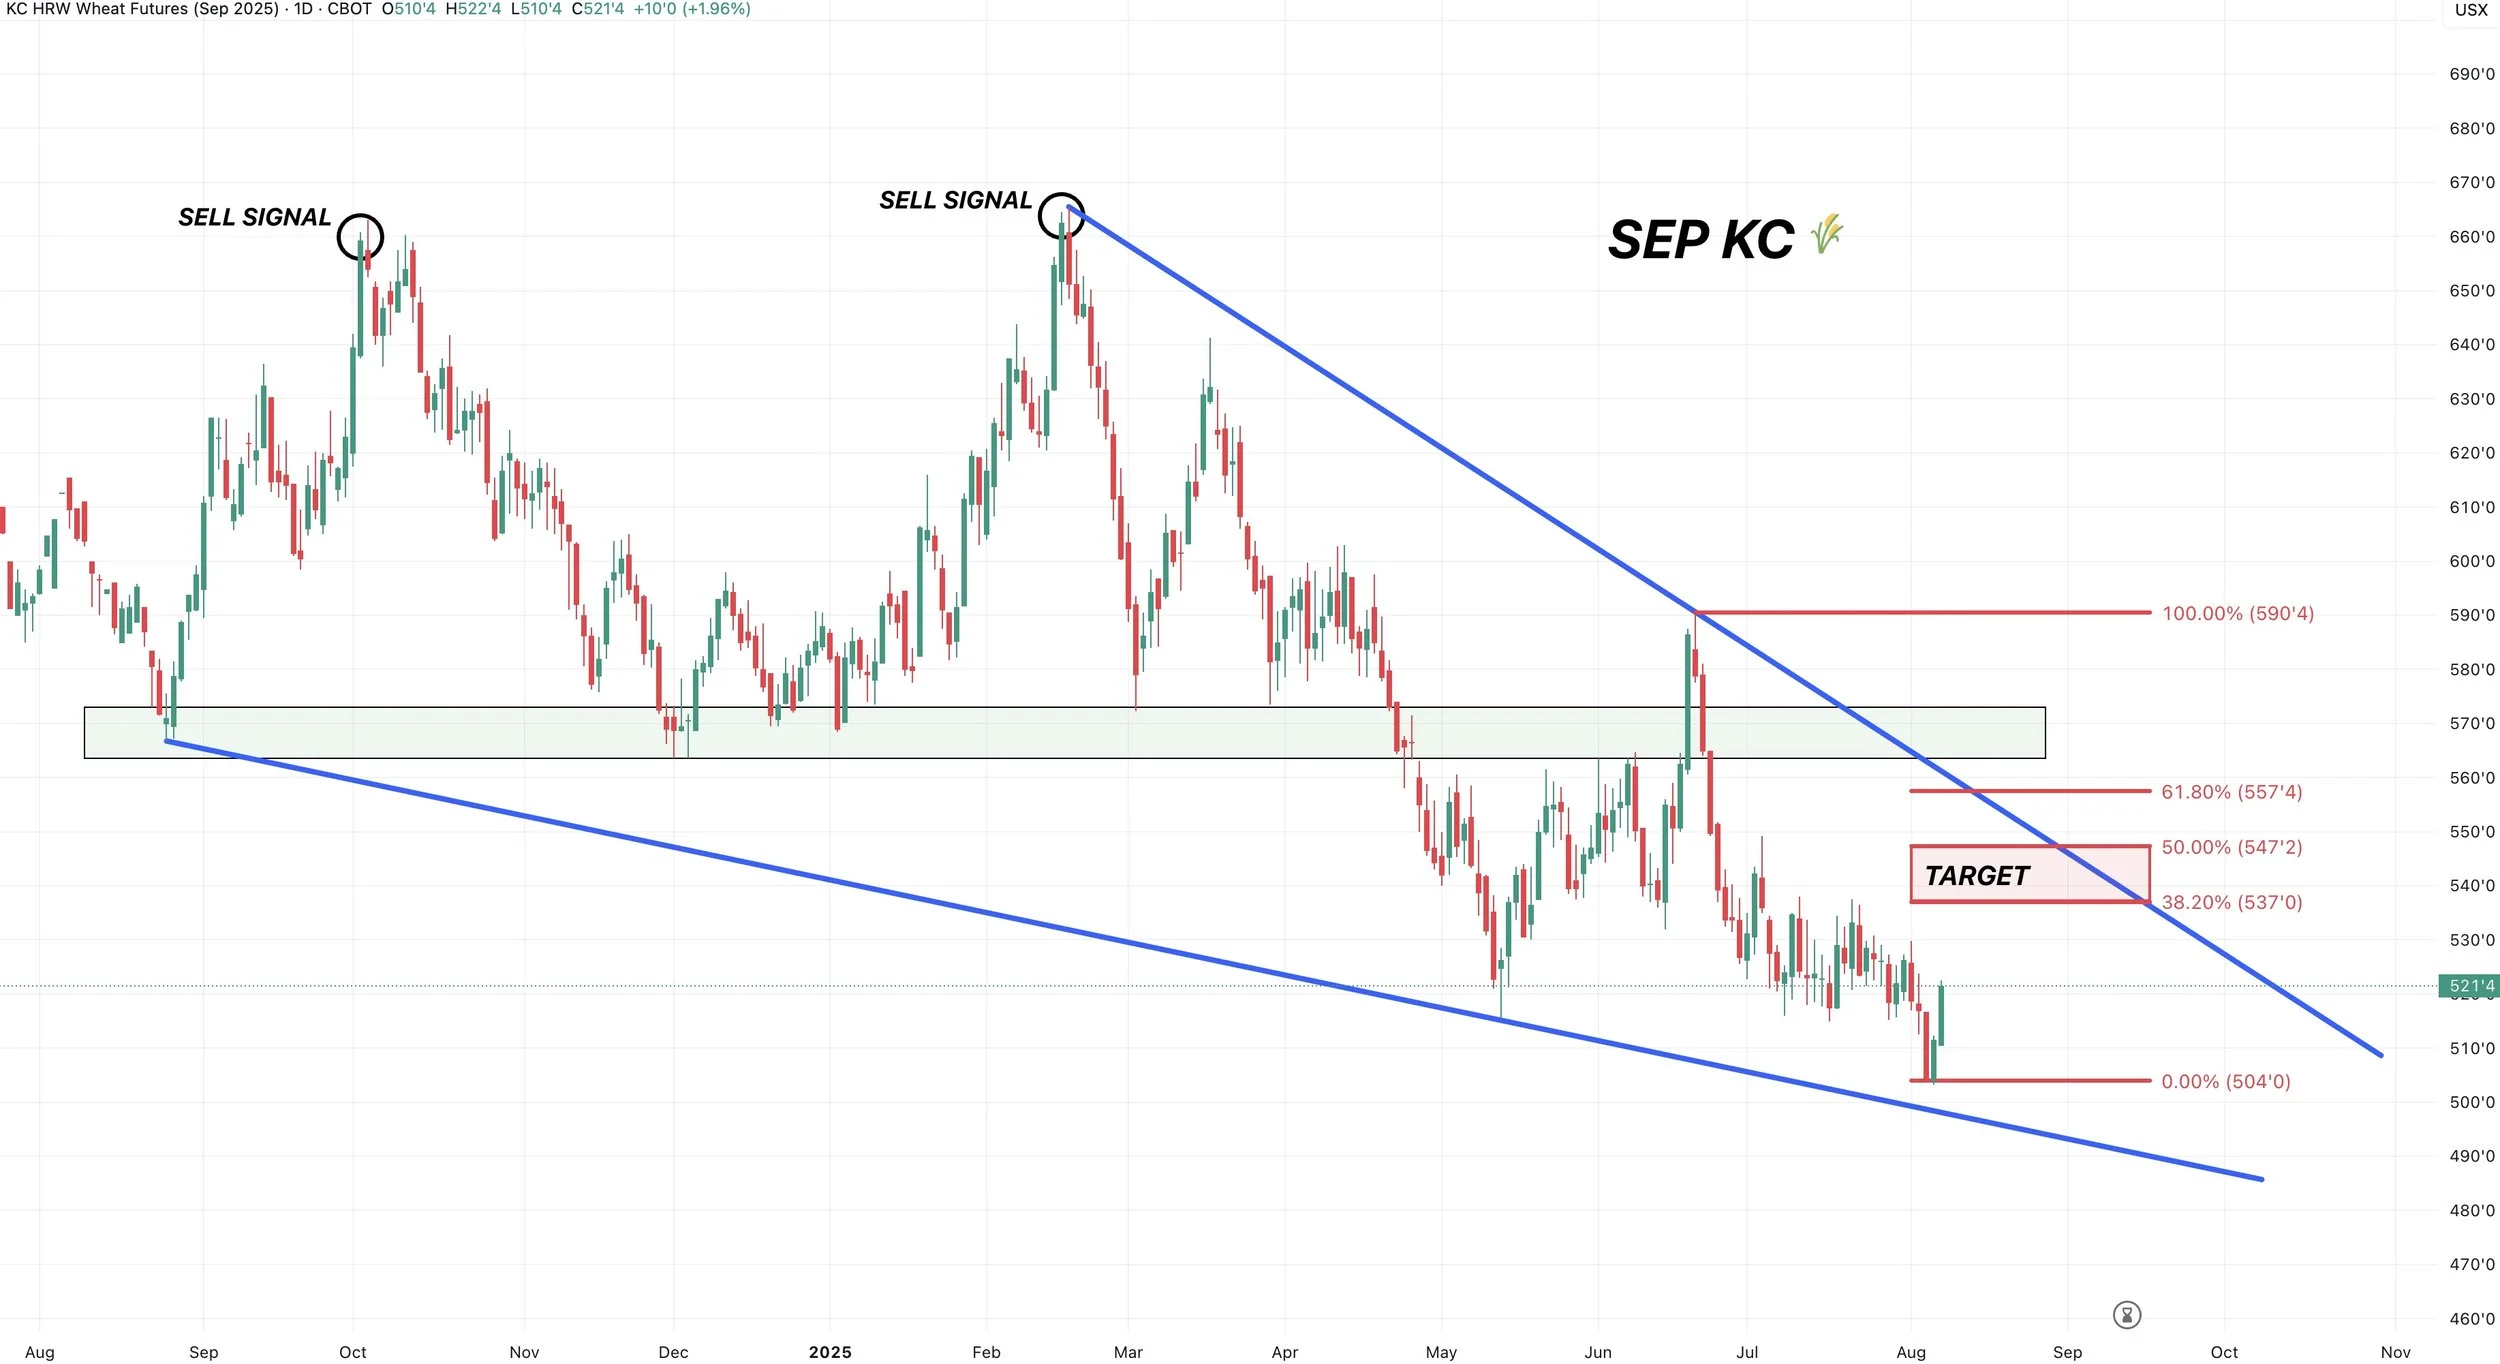
Sep KC Wheat
We are sitting in a massive falling wedge pattern.
This is seen as a bullish pattern.
Our target is going to be 38.2% to 50% of this recent sell off. ($5.37 to $5.47)
That lines up with a test of the top of the wedge.
Break above the wedge and you probably see higher prices, but for now it is seen as resistance and our target to exit this buy alert.
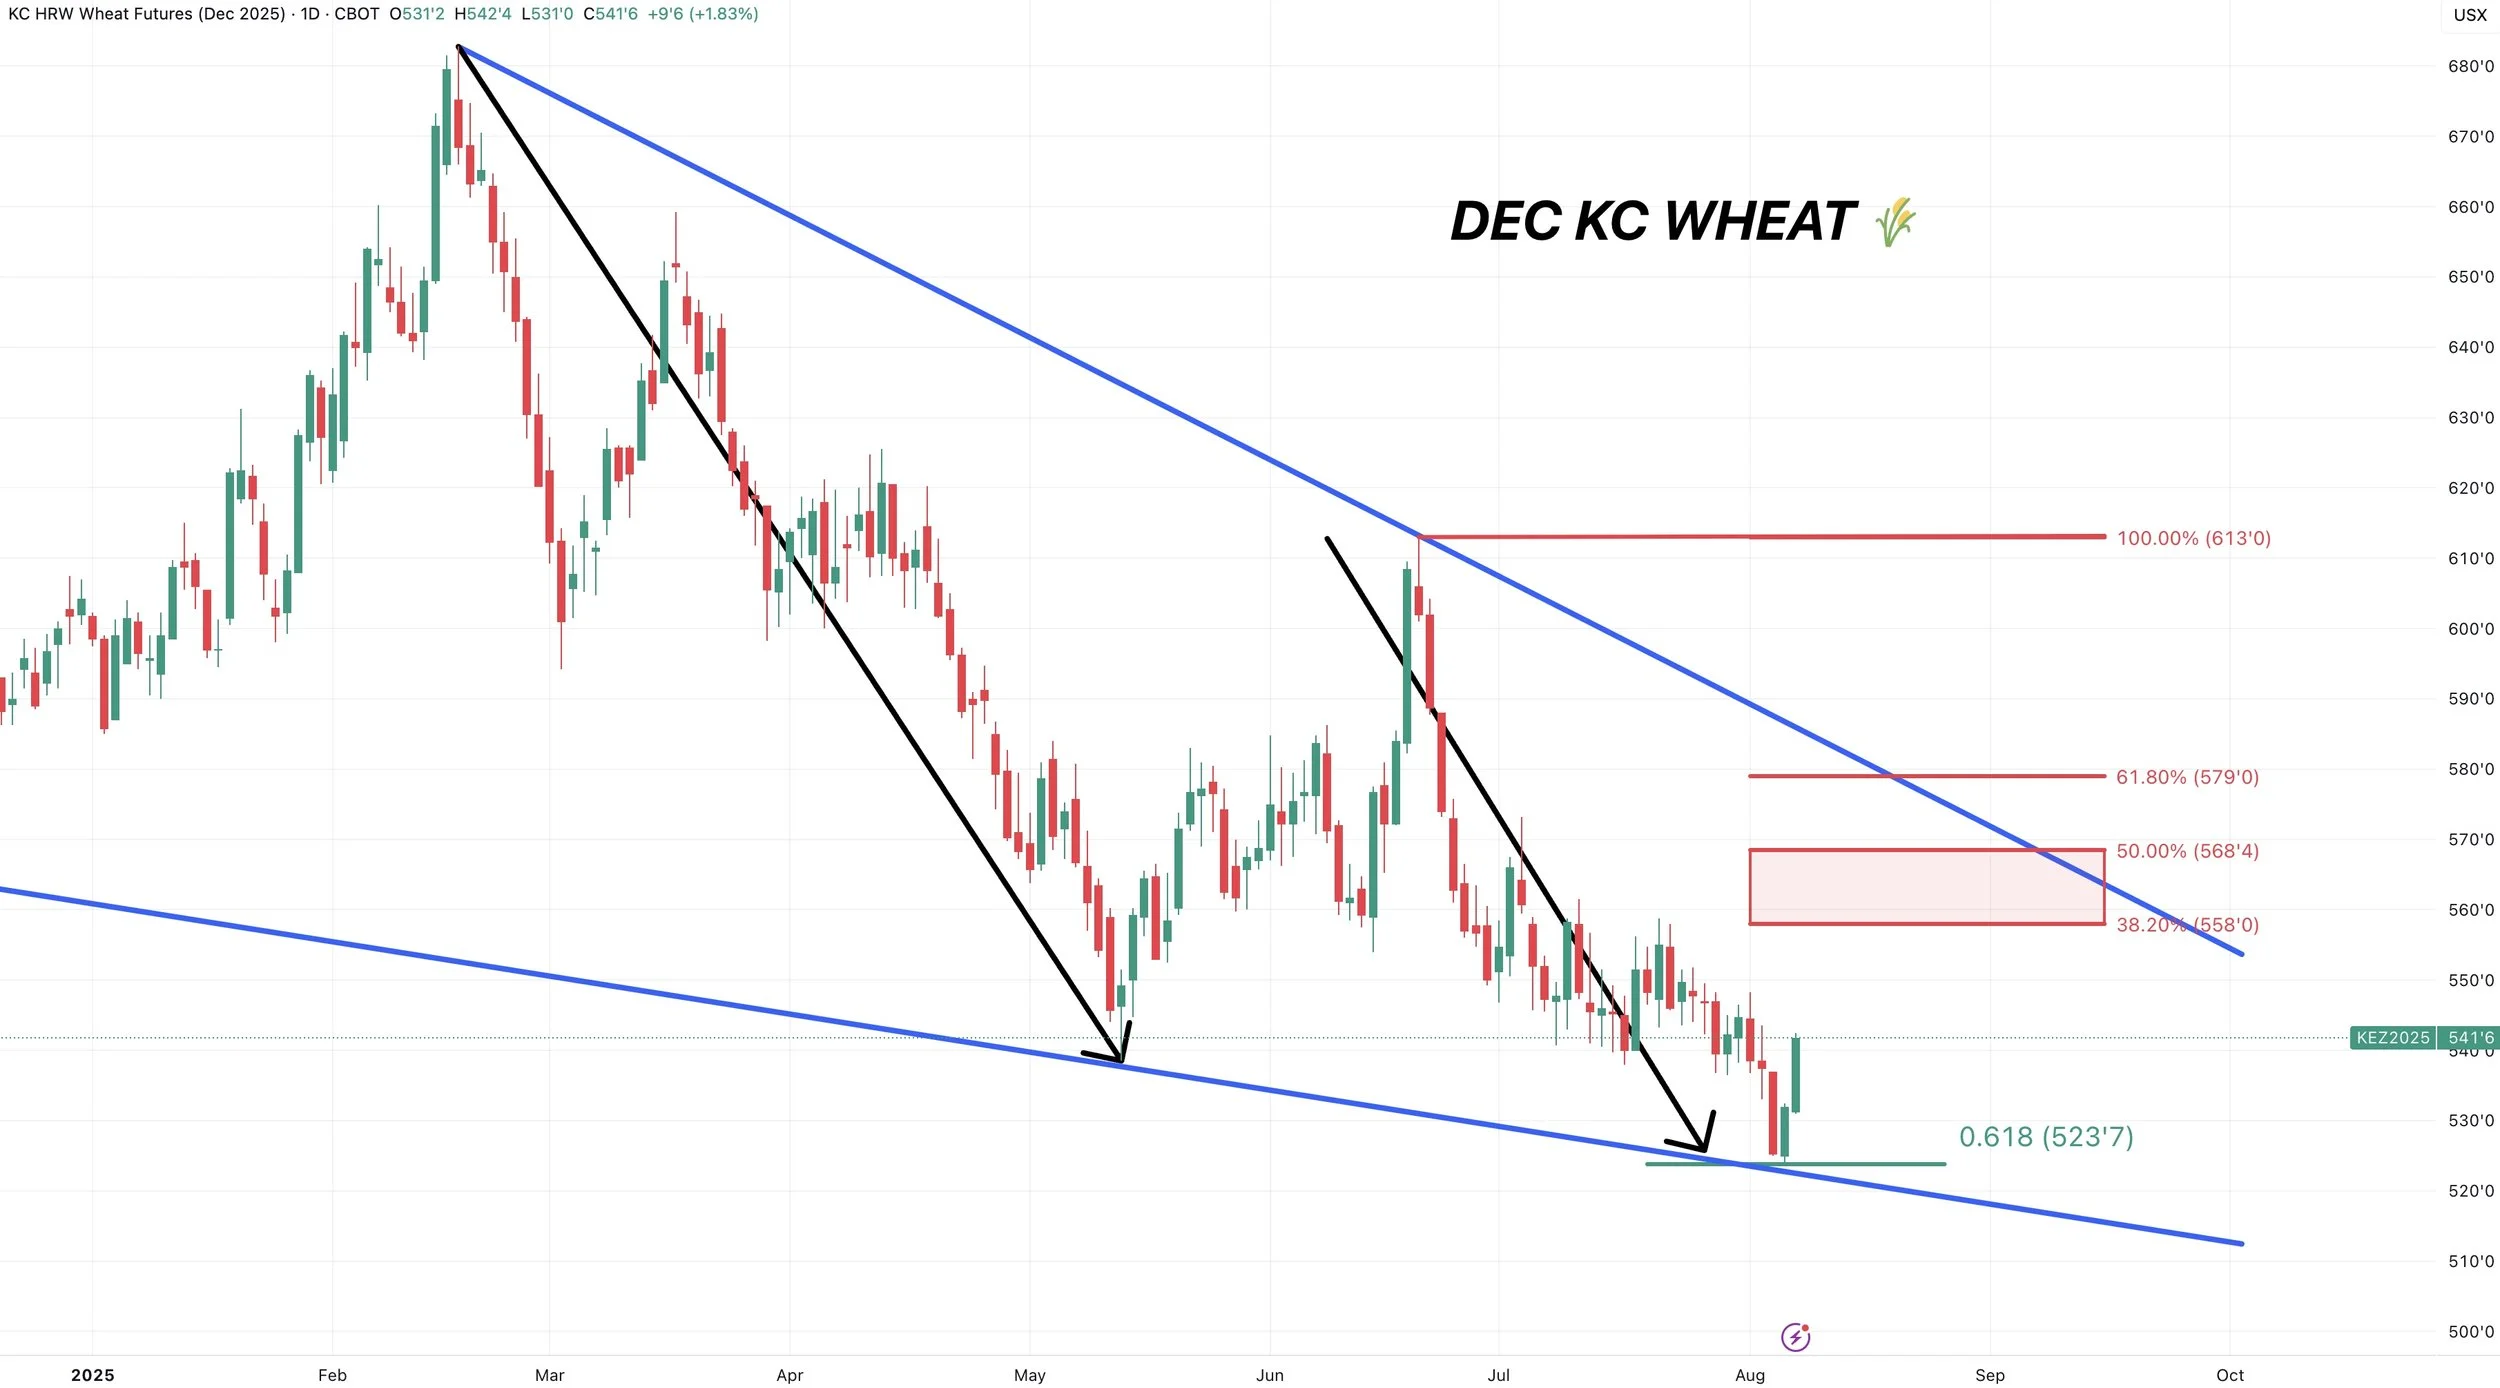
Dec KC Wheat
Dec KC wheat bounced right at the 61.8% fib extension lower from the Feb highs.
This means that this most recent sell off from the June highs, equals 61.8% of the size of the sell off in February. (I marked this with the arrows)
A very common spot for a market to bounce.
Again our targets here are 38.2% to 50% of the sell off from June. ($5.58 to $5.68)
Which lines up with another test of the top of this wedge.
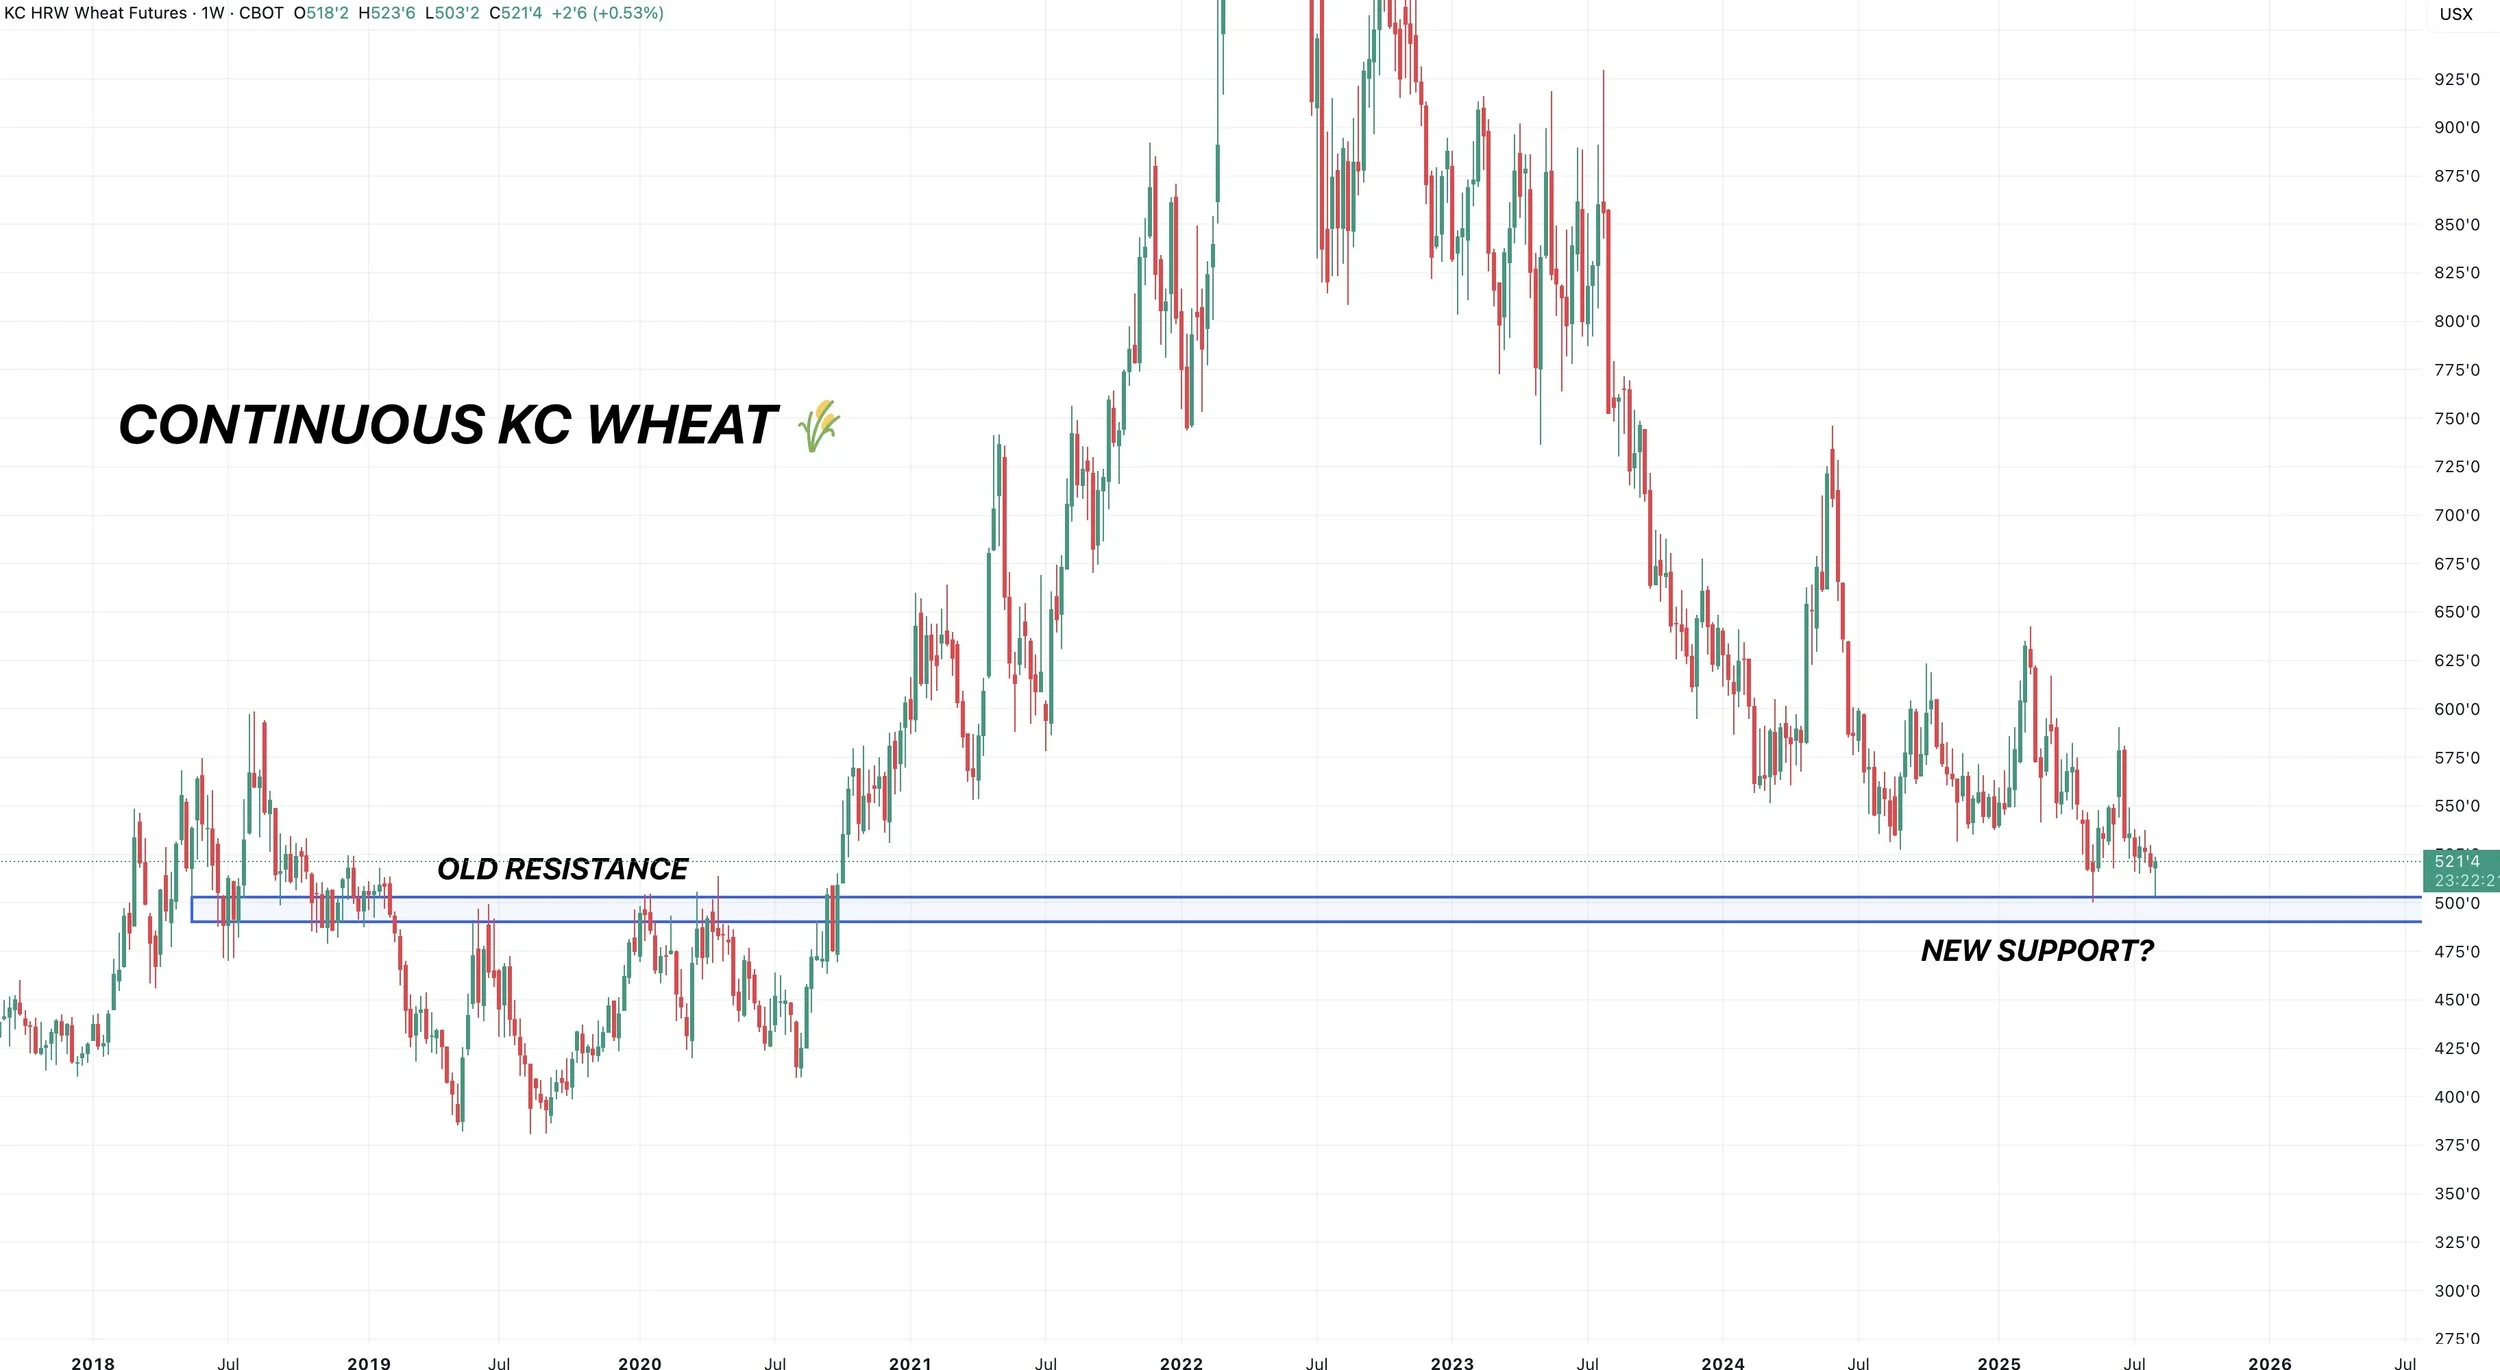
Continuous KC Wheat
We are right at this support from last year on the continuous chart.
This was our resistance back in 2019-2020.
Old resistance is now support.
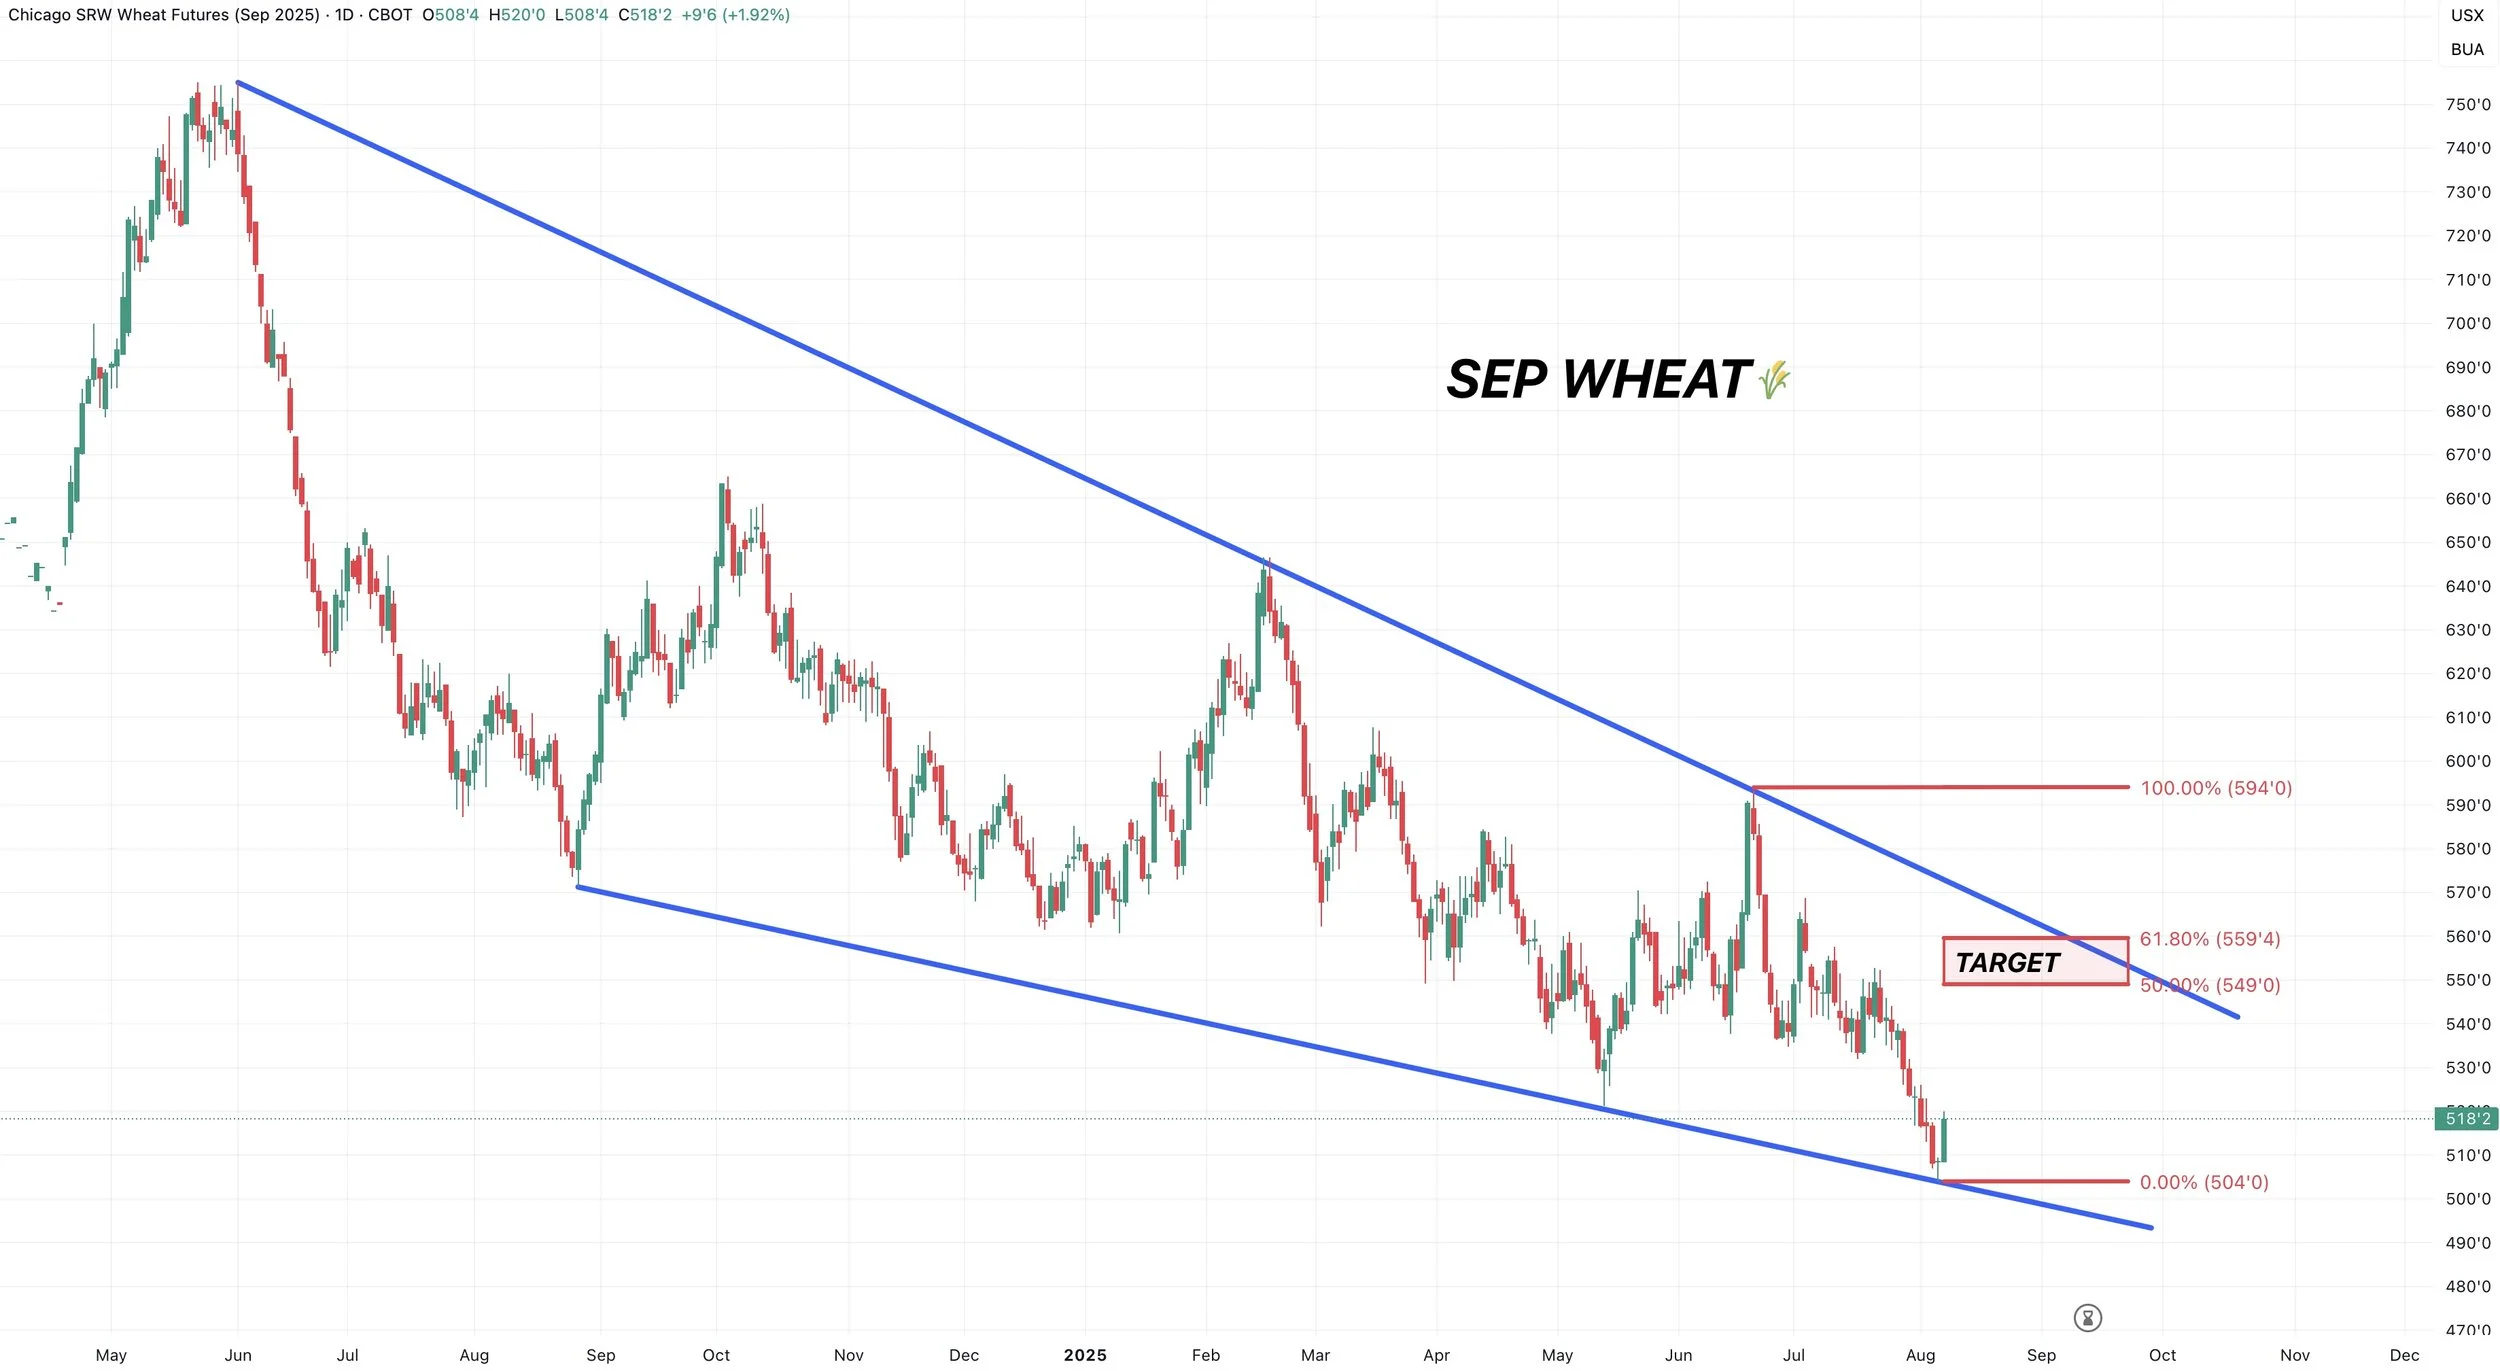
Sep Chicago Wheat
We had a perfect bounce off the bottom of this wedge.
Upside target is 50-61.8% of the recent sell off.
This lines up with the top of the wedge as well.
Continuous Chicago Wheat
Continuous Chicago was also at it's last line of support.
As we have held this support box on several occasions.

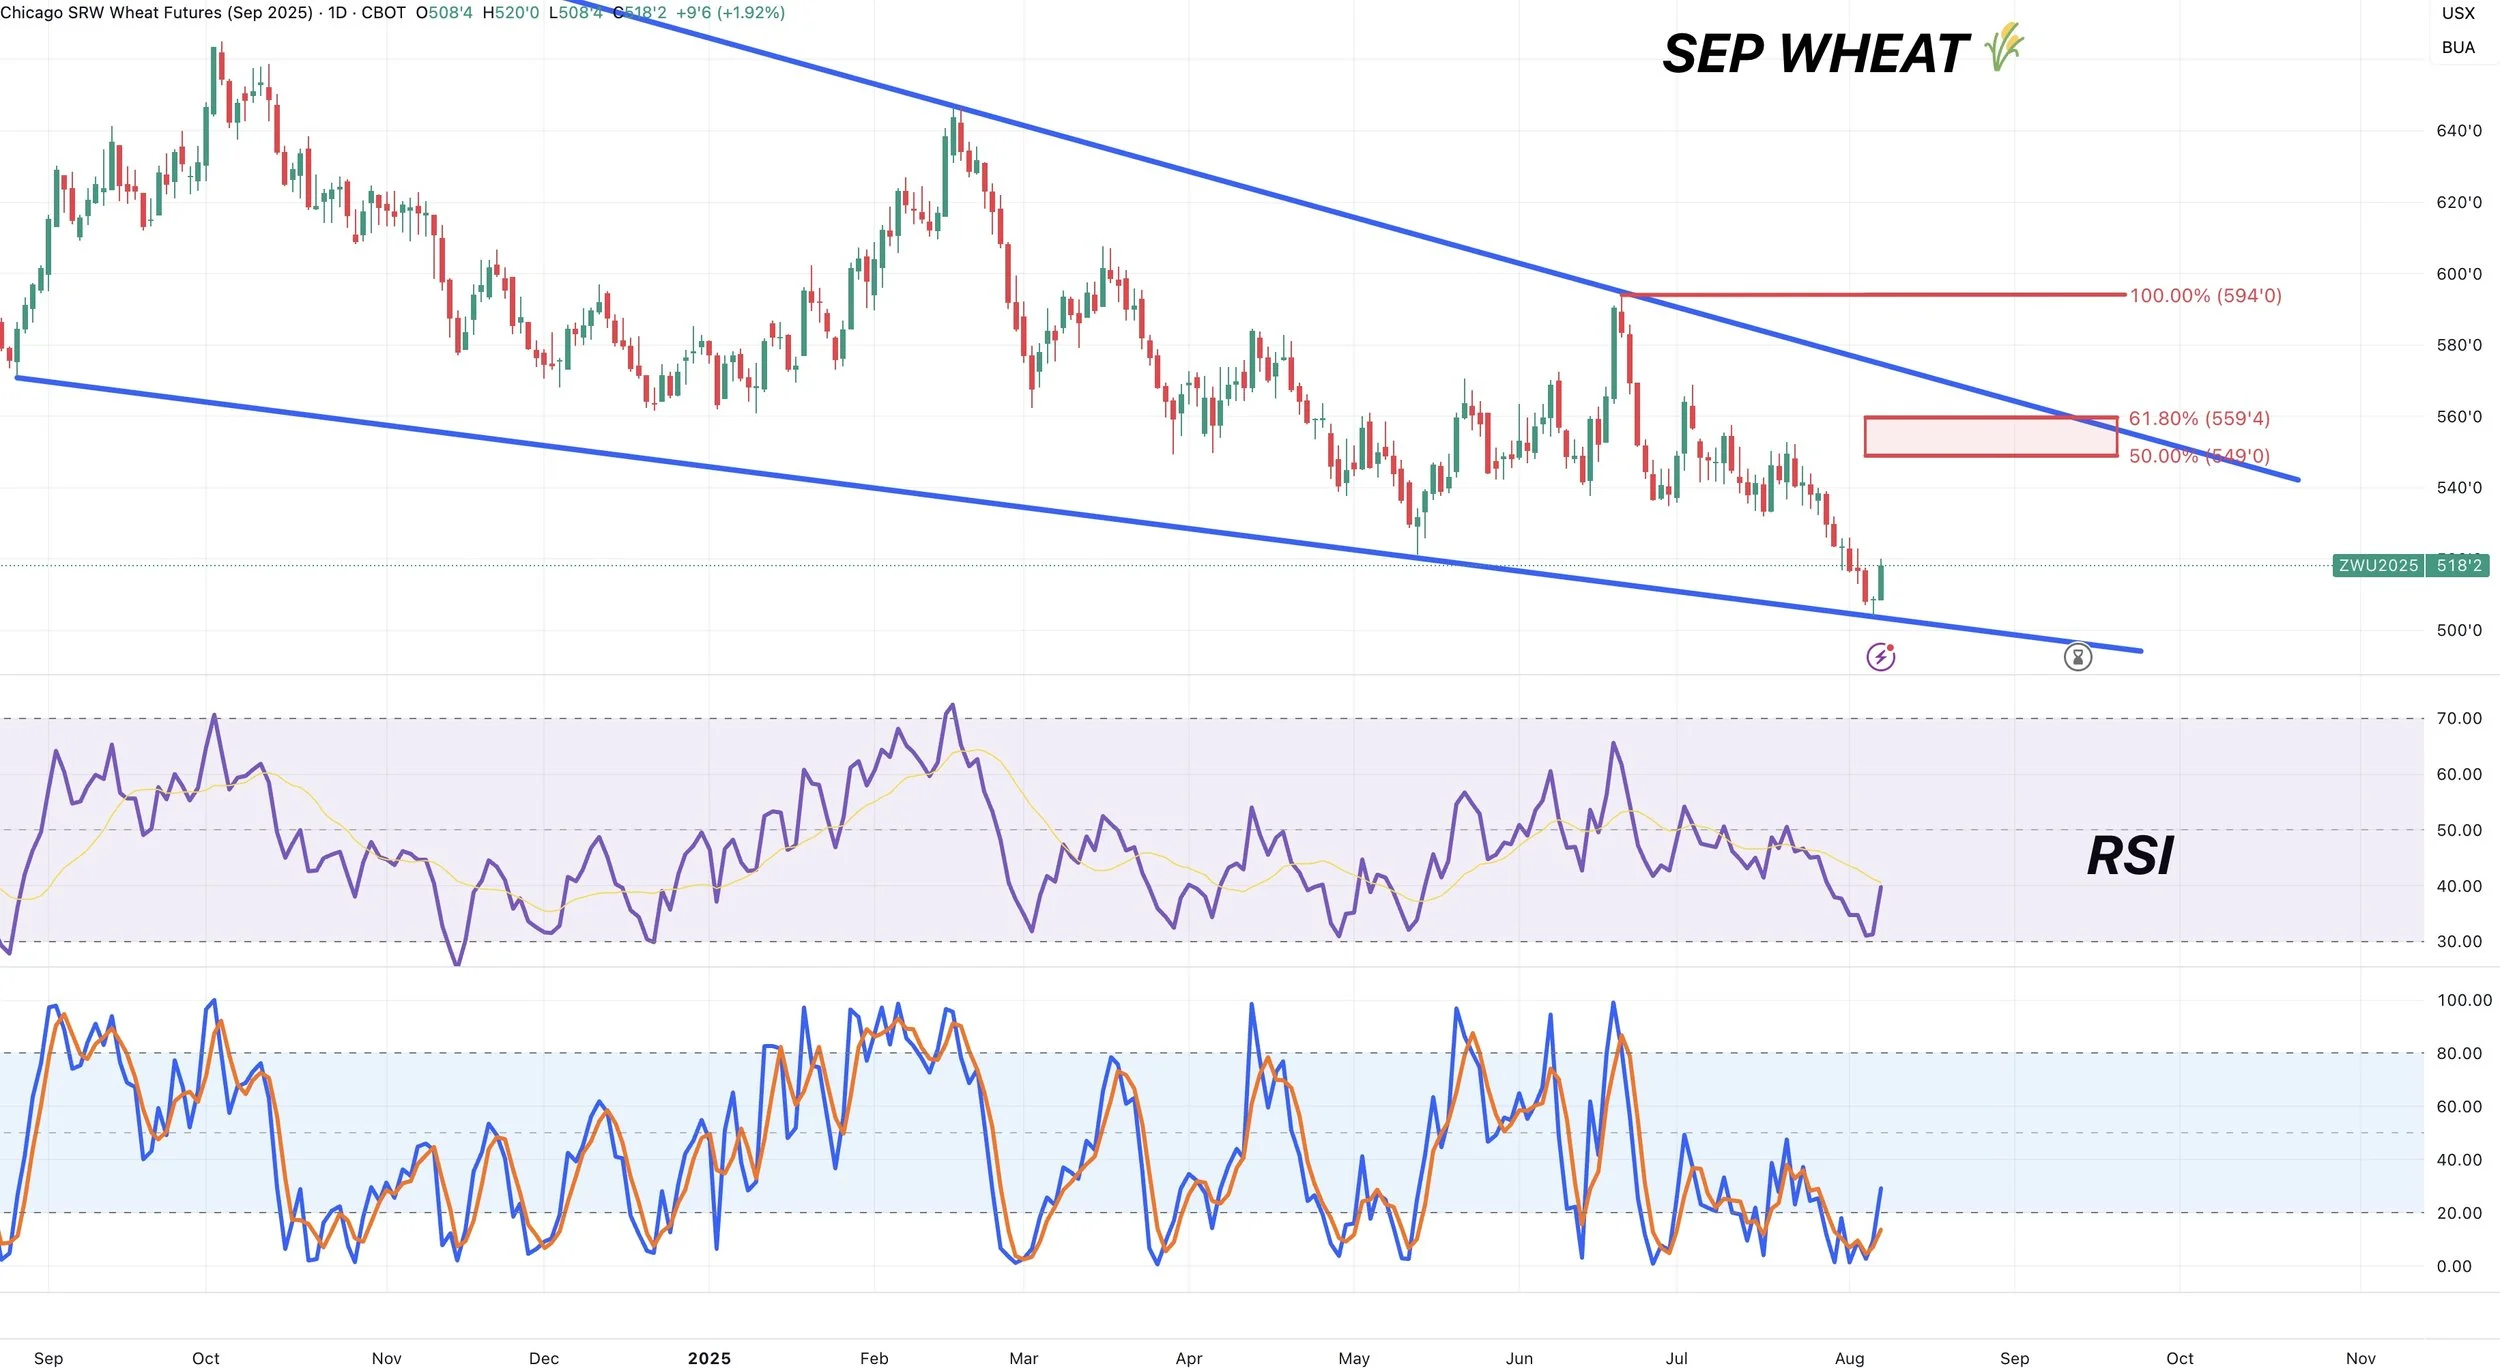
Sep Chicago Wheat Indicators
The RSI was severely undersold.
The stochastics were also bottomed out and flipping bullish.
Cattle
The cattle market continues to soar.
However, we are still cautious here and recommend puts for downside protection.
It is very hard to call a top in a bull market, all you can do is be prepared and manage your risk for all scenarios.
We prefer puts over futures, as if this market keeps running using futures is how you get yourself into an uncomfortable situation and run into margin calls.
We want to simply put in floors and allow the bull market to run.
I am not calling a top in this market. I just want to manage our risk.
Let's look at the charts.
Sep Feeder
We blew past my target box. Which was the 161.8% to 200% fib extension from the June rally.
The next fib is all the way up to the 261.8% fib at 356.
So that is the next target.
We are still showing slight bearish divergence, however the cattle market has ignored this several times. But something to be aware of.

Oct Live
Approaching that 200% fib extension from the June rally.
Also showing bearish RSI divergence.
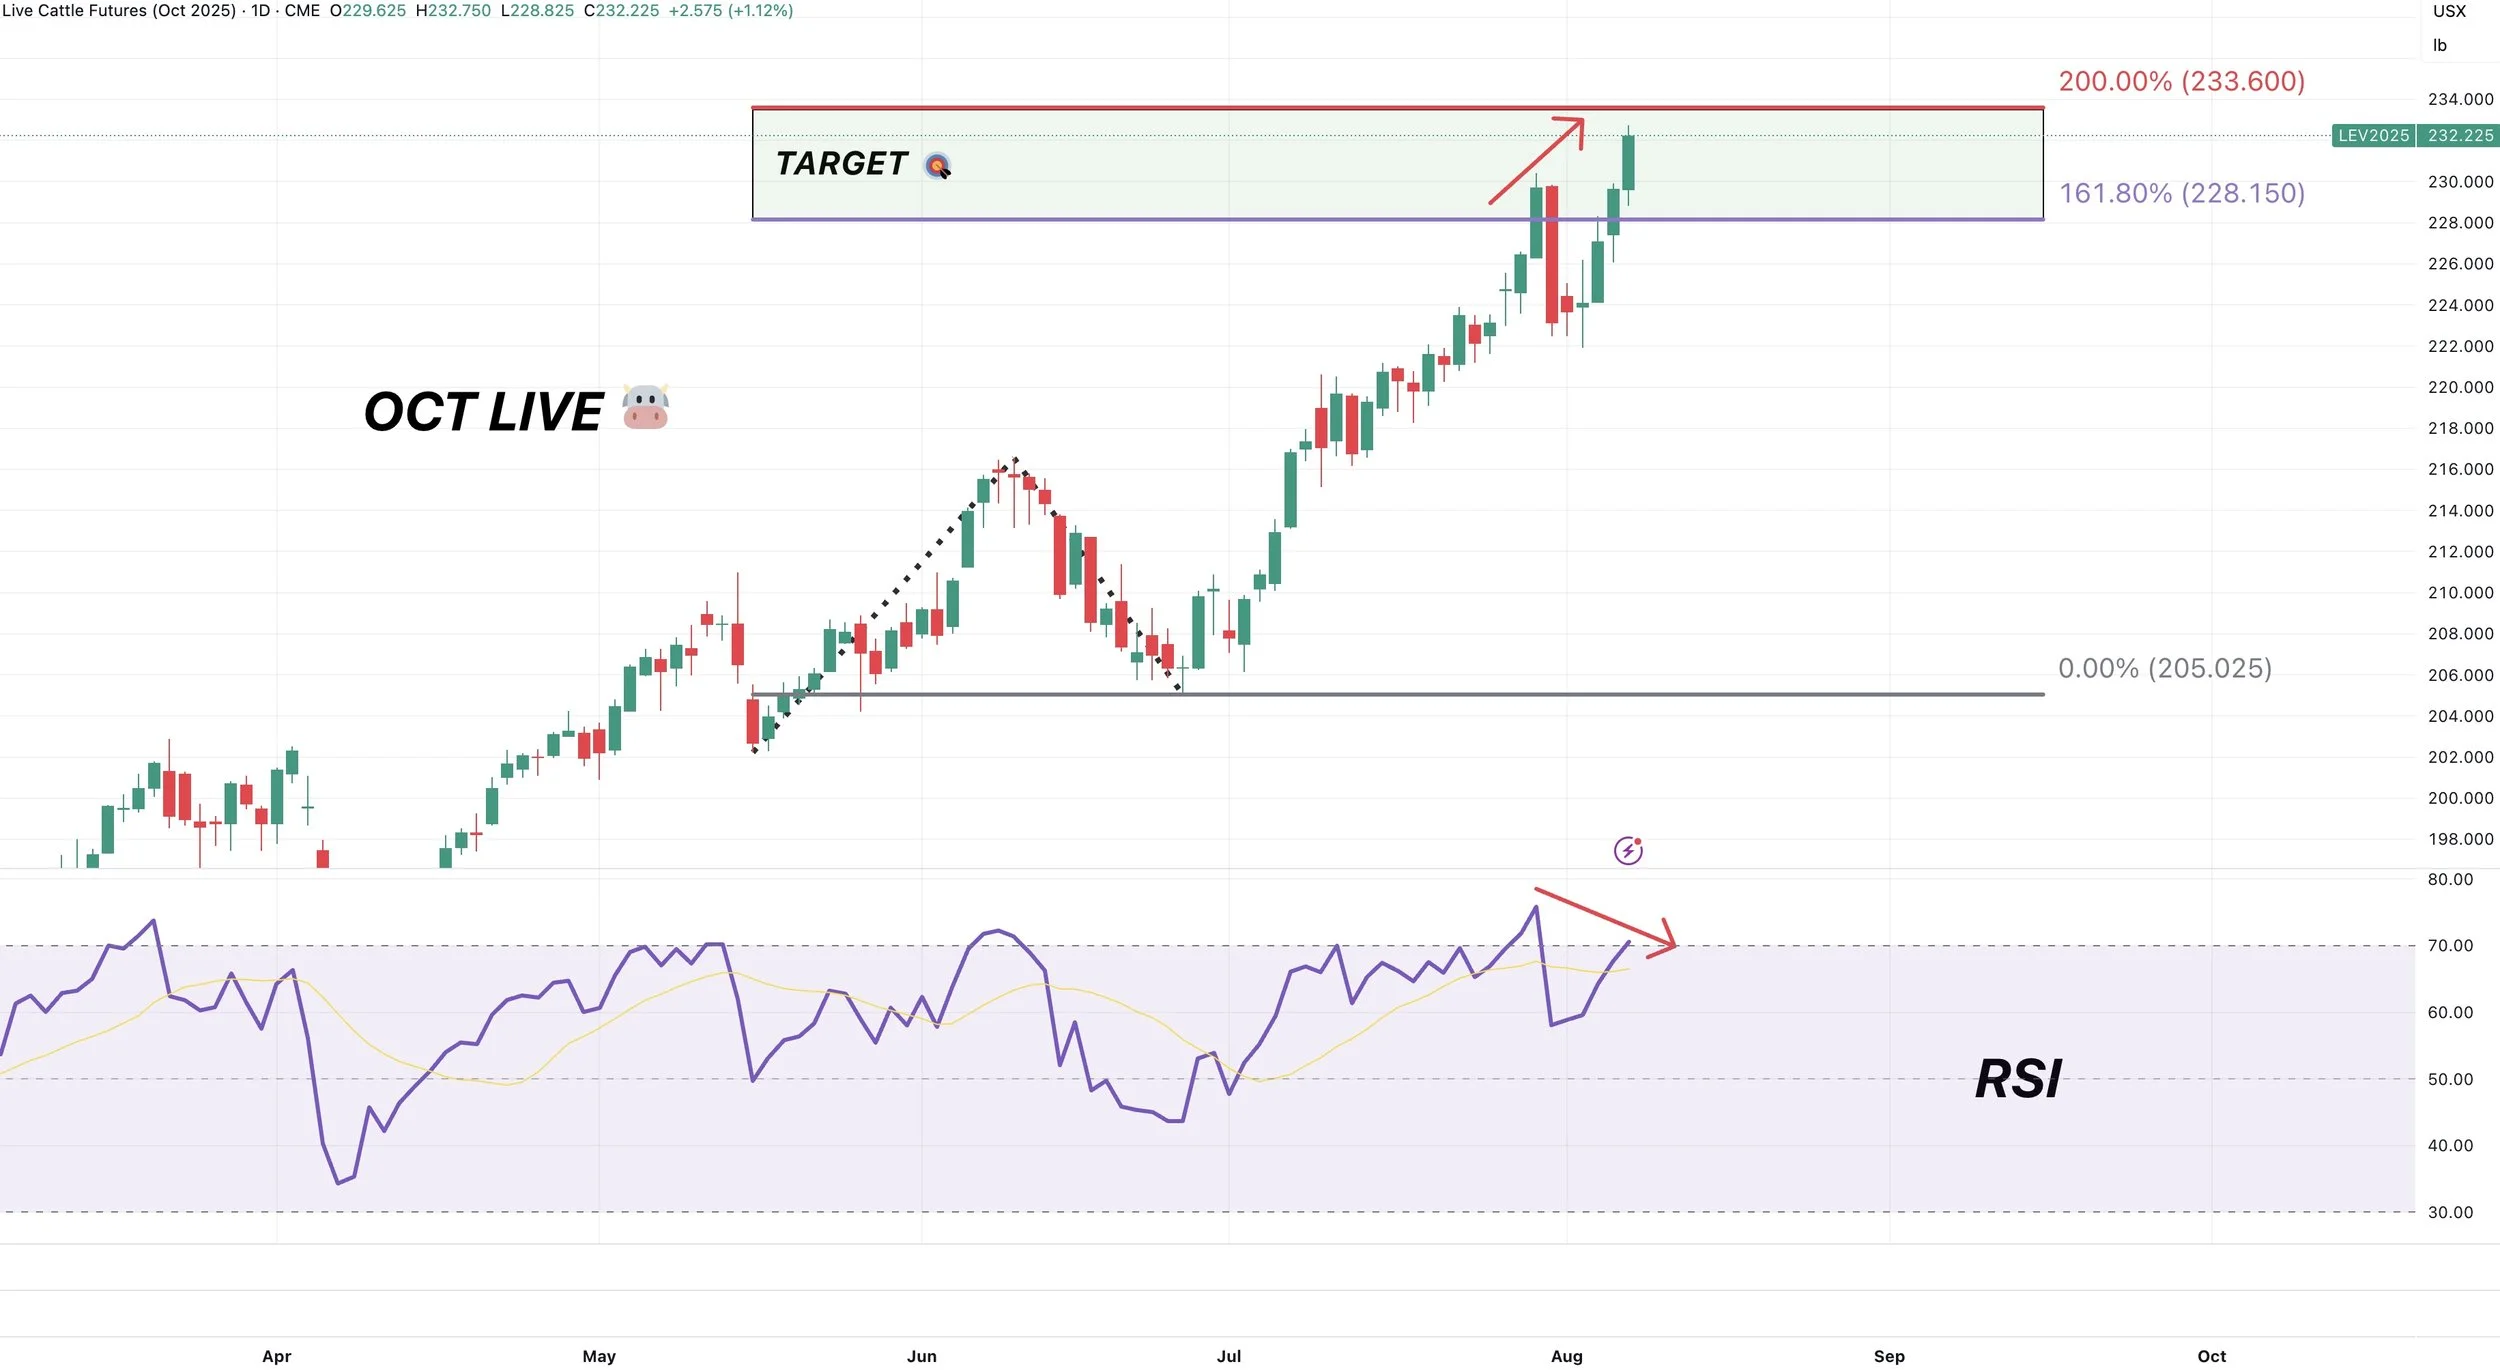
Another reason why I like managing risk up here is the seasonal data.
If you went short cattle on August 1st and held it through September 5th it was a winning trade 9 of the last 10 years.
The only year is was not was 2023.
(Marked as 2024 on the chart as this data uses the Jan-25 contract)

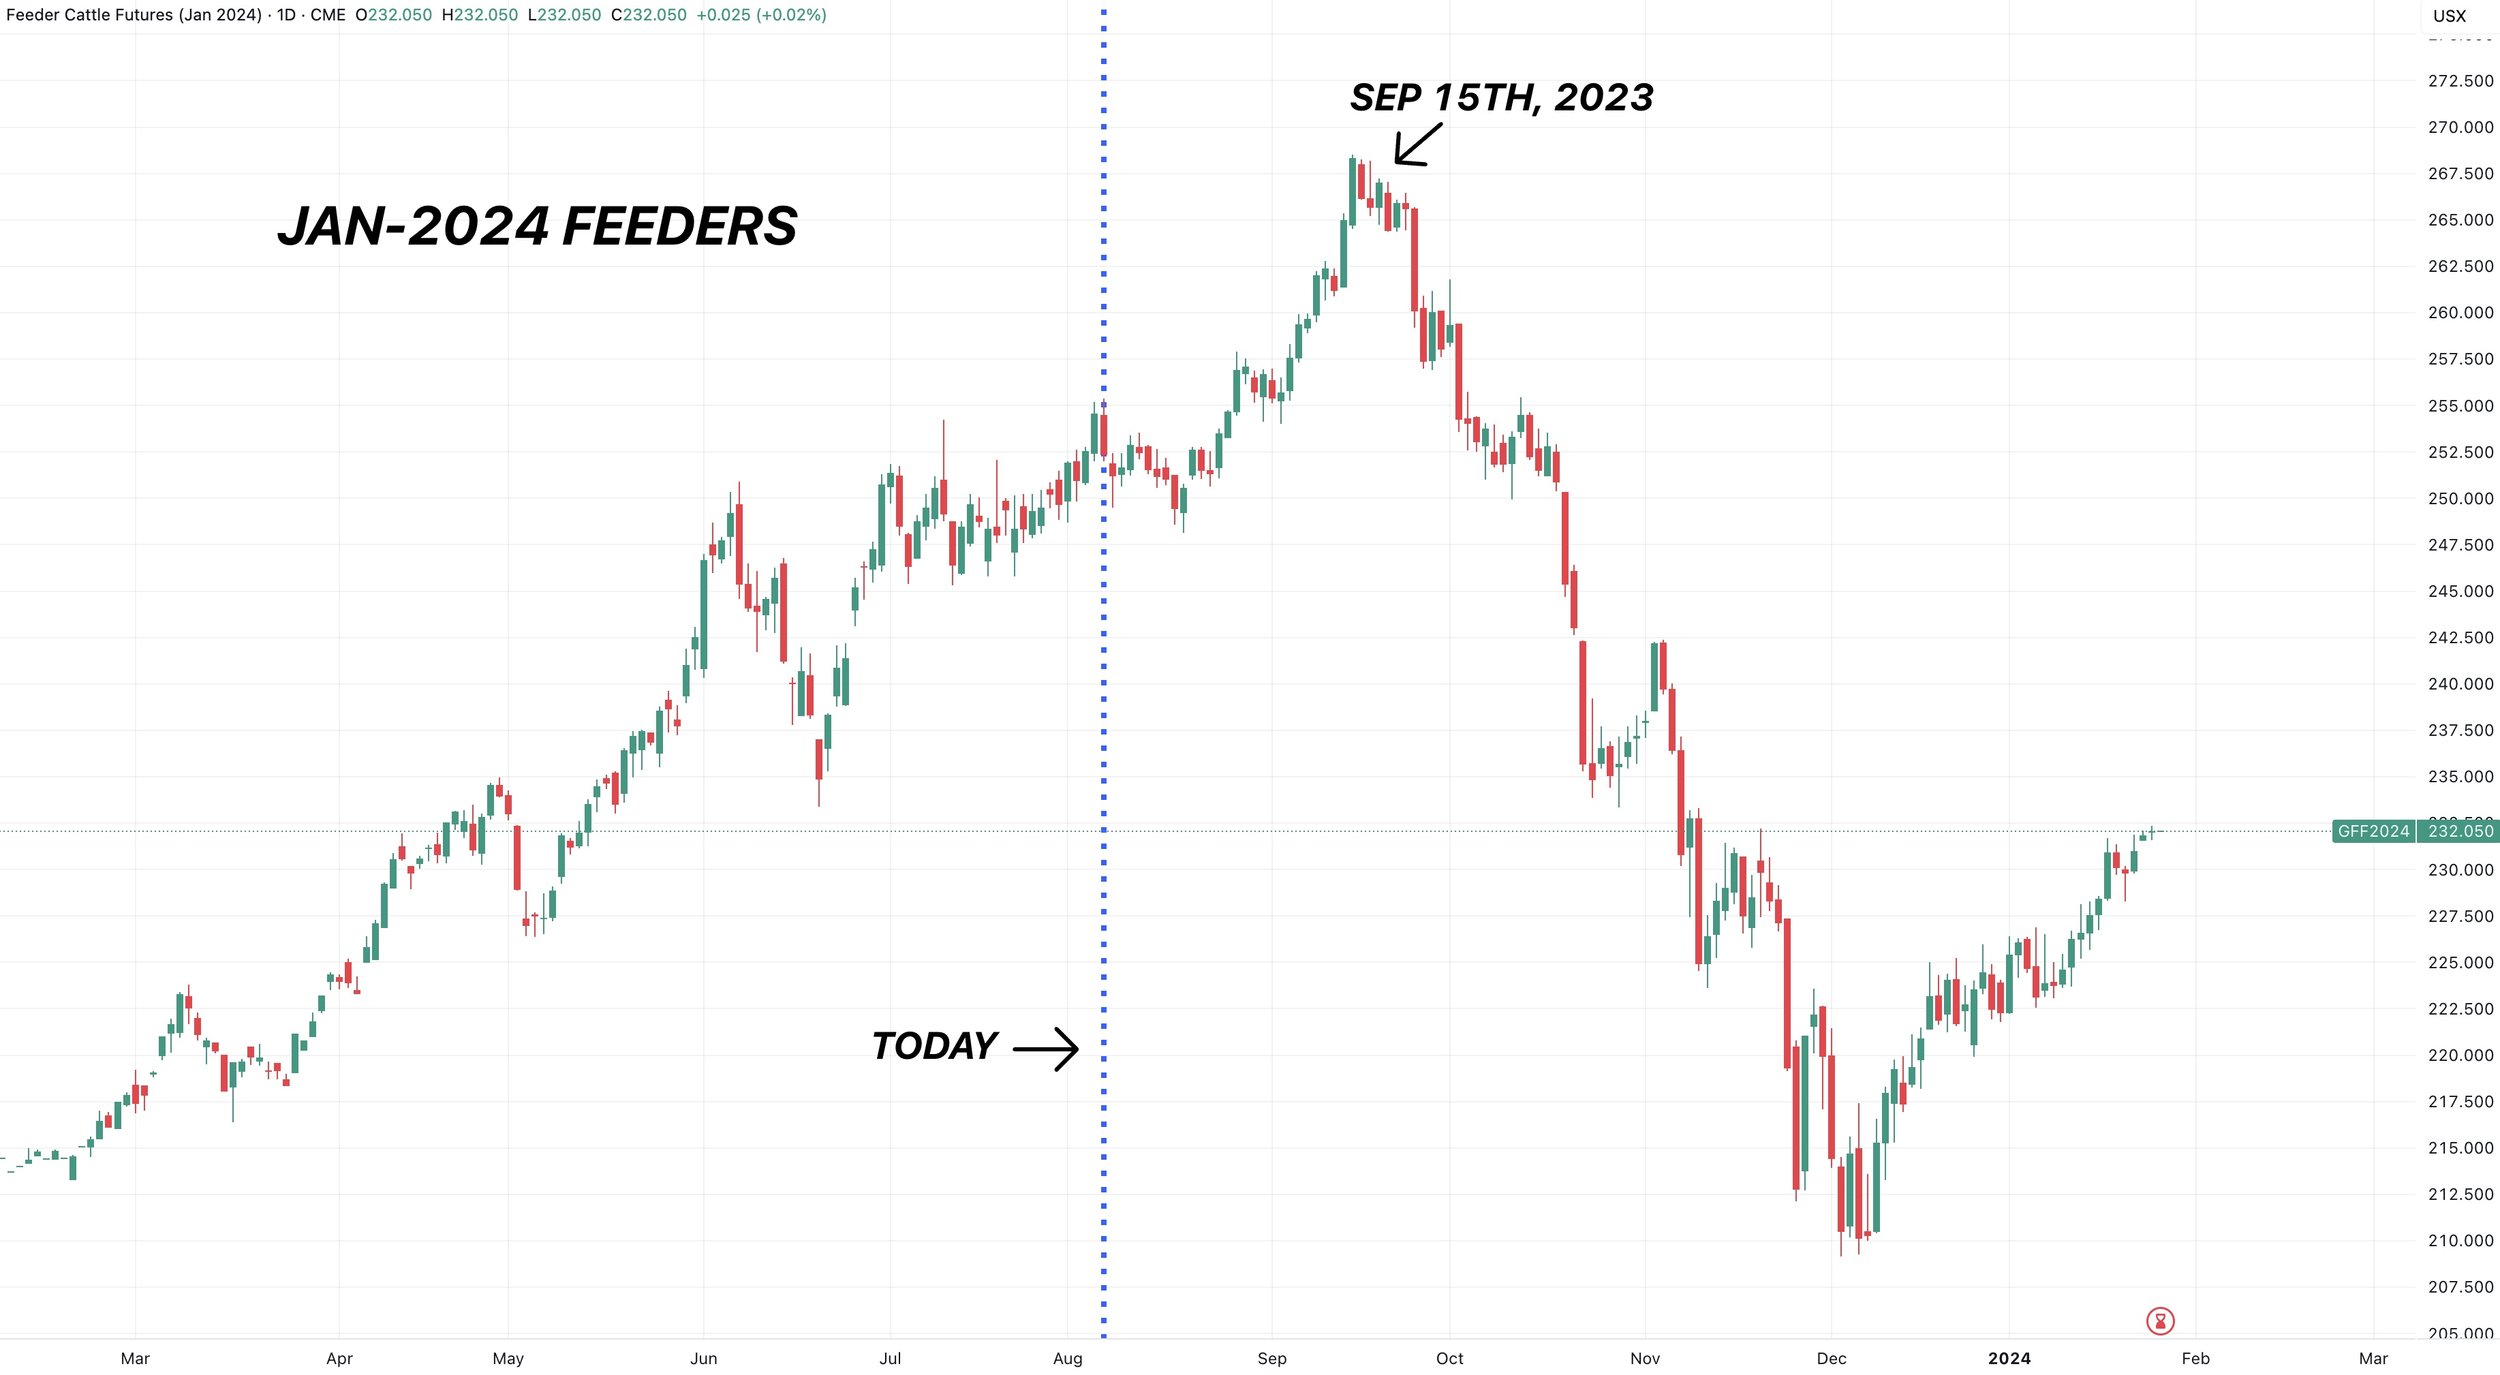
Here is the chart from 2023 and the only year we did not trade lower after August 1st.
We topped on September 15th. So it is possible we just continue to run without a major correction.
A nasty sell-off did eventually follow.
Lastly here is the updated seasonal pattern.
Typically we start to correct soon.
This does not mean we have to do the same thing this year. Just something to be aware of.
Past Sell or Protection Signals
We recently incorporated these. Here are our past signals.
July 31st: 🐮
Cattle sell signal & hedge alert.
July 10th: 🐮
Cattle sell signal & hedge alert.
CLICK HERE TO VIEW
June 5th: 🐮
Cattle sell signal & hedge alert.
June 2nd: 🌾
MPLS wheat sell signal.
April 10th: 🌽
Old crop corn sell signal.
March 19th: 🐮
Cattle hedge & sell signal.
Feb 18th: 🌽 🌾
Old crop KC wheat & old crop corn signal.
Jan 23rd: 🌽 🌱
Corn & beans old crop sell signal.
CLICK HERE TO VIEW
Jan 15th: 🌽 🌱
Corn & beans hedge alert/sell signal.
Jan 2nd: 🐮
Cattle hedge alert at new all-time highs & target.
Dec 11th: 🌽
Corn sell signal at $4.51 200-day MA
CLICK HERE TO VIEW
Oct 2nd: 🌾
Wheat sell signal at $6.12 target
Sep 30th: 🌽
Corn protection signal at $4.23-26
Sep 27th: 🌱
Soybean sell & protection signal at $10.65
Sep 13th: 🌾
Wheat sell signal at $5.98
May 22nd: 🌾
Wheat sell signal when wheat traded +$7.00
Want to Talk?
Our phones are open 24/7 for you guys if you ever need anything or want to discuss your operation.
Hedge Account
Interested in a hedge account? Use the link below to set up an account or shoot Jeremey a call at (605)295-3100.
Check Out Past Updates
8/6/25
CORN REVERSAL? RIDING CATTLE RUN BUT BEING DISIPLINED
8/5/25
188 CORN YIELD? AUGUST CATTLE CONCERNS?
8/4/25
NEW CORN LOWS & USDA NEXT WEEK
8/1/25
STOUT DEMAND & WET JULY
7/31/25
WHERE IS CORN & BEAN BOTTOM? WAS THAT CATTLE TOP?
7/31/25
CATTLE HEDGE ALERT & SELL SIGNAL
7/30/25
ANY HOPE LEFT FOR GRAINS?
7/29/25
SEASONAL STRUGGLE CONTINUES
7/28/25
EXTREME BEARISHNESS PRICED INTO GRAINS. CATTLE WARNING SIGNS
7/25/25
NO REASON TO RALLY. NO REASON TO COLLAPSE
7/24/25
CORN DEMAND OVERSTATED? CATTLE CLOSE TO TOP?
7/23/25
JAPAN DEAL NOT ENOUGH
7/22/25
CROP RATINGS MATTER?
7/21/25
RAIN MAKES GRAIN
7/18/25
OVERNIGHT HEAT & ROOM FOR ERROR
7/17/25
POOR CORN EXPORTS MATTER? REWARD BEAN BOUNCE?
7/16/25
ARE CORN & BEANS UNDERVALUED OR NOT?
7/15/25
NEGATIVE NEWS POSITIVE ACTION IN GRAINS
7/14/25
DON’T GIVE GRAIN AWAY
7/11/25
USDA FRIENDLY CORN. MARKET DOESN’T CARE
7/10/25
JULY USDA OUT TOMORROW
7/10/25
CATTLE HEDGE ALERT & SELL SIGNAL
7/9/25
MARKET SEES RECORD CROPS
7/8/25
MONSTER CORN YIELD..?
7/7/25
TRUMP PUMP & DUMP
7/3/25
CORN & BEANS REJECT KEY SPOT. TRUMP SPEAKS IN IOWA
7/2/25
TRADE DEALS? BEANS RALLY AT GOLDEN ZONE
7/1/25
NOW WHAT FOR GRAINS?
6/30/25
BORING USDA. DIDN’T SAY HAVE TO GO LOWER
6/30/25
USDA NUMBERS
6/27/25
ALL EYES ON MONDAY
6/26/25
FIREWORKS OR BLOOD BATH MONDAY?
6/25/25
GRAINS COLLAPSING AHEAD OF JUNE REPORT
6/24/25
CORN CONTINUES SELL OFF. MAJOR USDA REPORT COMING
6/23/25
CORN CAN GO LOWER, BUT NOT FOR FOREVER
6/20/25
WHO SHOULD REWARD THE WHEAT & SOYBEAN RALLY?
6/18/25
COMPLETE CHART BREAKDOWNS
6/17/25
SOYBEANS CONTINUE BREAKOUT. NEARING SELL SIGNAL
6/16/25
CORN HAMMERED. EPA GAME CHANGER IN BEANS?
6/13/25
SOYBEANS RALLY, CHARTS, BALANCE SHEETS & MORE
6/12/25
USDA NON-EVENT. WHAT’S NEXT?
6/11/25
DIVERGENCE & SEASONAL SELL OFF?
6/10/25
BEING PATIENT VS BALANCING YOUR RISK
6/9/25
WHAT IF WE DON’T GET A WEATHER SCARE?
6/5/25
CORN & BEANS HOLDING CRUCIAL SPOTS
6/5/25
CATTLE SELL SIGNAL & HEDGE ALERT
6/4/25
HOW UNKNOWNS IMPACT MARKETING DECISIONS
6/3/25
KEY SPOTS ON THE CHARTS FOR CORN & BEANS
6/2/25
NEW LOWS IN CORN. DE-RISKING MPLS WHEAT
6/2/25
SPRING WHEAT SELL SIGNAL
5/30/25
SEASONAL RALLY STILL IN THE CARDS?
5/29/25
WHAT IS YOUR PLAN IF WE DO NOT RALLY?
5/28/25
ZERO PREMIUM IN THE GRAIN MARKETS
5/27/25
CORN CONDITIONS DISAPPOINT & JUNE OUTLOOK IMPROVES
5/23/25
TARIFFS SPOOK MARKET. GAME PLAN MOVING FORWARD
5/22/25
CHART BREAKDOWNS & TARGETS
5/21/25
RISK TO THE UPSIDE WITH WEATHER?
5/20/25
WHEAT SHORT COVERING & HISTORY OF YIELD CHANGES
5/19/25
ANYONE LEFT TO SELL WHEAT? 181 CORN YIELD POSSIBLE?
5/16/25
FUNDS SHORT CORN. MARKETS WAITING ON WEATHER
5/15/25
BEANS HAMMERED ON RUMOR & WHEAT FINDING LIFE
5/14/25
DECISIONS & POSSIBILITIES IN GRAINS
5/13/25
GRAINS RALLY OFF LOWS
5/12/25
USDA REPORT. HOW THIS CHANGES THINGS
5/9/25
BIGGEST RISKS IN USDA REPORT
5/8/25
USDA MONDAY & HISTORY OF WEATHER RALLIES
5/7/25
NEW 2025 LOWS FOR CORN
5/6/25
WHAT’S A SUMMER RALLY LOOK LIKE?
5/5/25
CORN ERASES ENTIRE APRIL RALLY
5/2/25
SELL INTO UNCERTAINTY. NOT KNOWN FACTORS
5/1/25
THE CASE AGAINST A FEB TOP IN CORN
4/30/25
APPROACHING KEY TIME PERIOD FOR GRAINS
4/29/25
PLANTING & FIRST NOTICE DAY PRESSURE. CORN CLOSE TO BOTTOM?
4/28/25
CAPTURING INVERSE & SEASONAL PREPARATION
4/25/25
HOW OFTEN DOES CORN NOT BREAK APRIL HIGHS?
4/24/25
KNOW WHEN TO SELL. BEANS BREAK 200-DAY FIRST TIME IN 483 DAYS
4/23/25
MONEY FLOW & DROUGHT CARDS
4/22/25
CRUCIAL SPOT FOR CORN & BEANS
4/21/25
NO PLANTING THREAT YET
4/18/25
POTENTIAL OPPORTUNITIES, BASIS CONTRACTS & STRATEGIES
4/16/25
HOW YIELD IMPACTS CARRYOUT. MAJOR SPOT FOR SOYBEANS
4/15/25
TOTAL CHART BREAKDOWNS & TARGETS
4/14/25
TECHNICAL SELLING IN GRAINS
4/11/25
SPECIFIC GRAIN MARKETING DECISIONS
4/10/25
USDA REPORT. HOW THIS IMPACTS CORN
4/9/25
TARIFFS GIVE. TARIFFS TAKE
4/8/25
CORN’S DIVERGING STRENGTH
4/7/25
SOLID PRICE ACTION DESPITE OUTSIDE FEAR
4/4/25
CORN PRICE ACTION SPEAKS VOLUME. ANY HOPE LEFT FOR SOYBEANS?
4/3/25
WHAT IS LEFT FOR CORN BEARS? TRADE WAR: CHARTS HOLDING SUPPORT
4/2/25
SHOULD UNKNOWNS KEEP A FLOOR UNDER GRAIN PRICES?
4/1/25
HOW DO ACRES IMPACT FUTURE OF THE GRAINS?
3/31/25
USDA REPORT: NOW WHAT?
3/28/25
ALL EYES ON USDA
3/27/25
PRE-USDA POSITIONING. DON’T GIVE GRAIN AWAY
3/26/25
HISTORY OF MARCH INTENTIONS. SOYBEANS UNDERVALUED?
3/25/25
6 DAYS UNTIL MAJOR USDA REPORT
3/24/25
HOW TO POSITION YOURSELF BEFORE PLANTING
3/21/25
REASONS TO BE OPTIMISTIC IN GRAINS?
3/20/25
WAS THAT THE BOTTOM IN CORN?
3/19/25
THE PATH HIGHER & THE DOWNSIDE RISKS IN GRAINS
3/18/25
SEASONALS, CATTLE HEDGE, CHARTS & DROUGHT?
3/17/25
WHEAT RALLIES. DON’T GET BACKED INTO A CORNER
3/14/25
MARCH 31ST REPORT THOUGHTS & WHAT’S NEXT FOR GRAINS
3/13/25
EXPLAINING RE-OWNERSHIP VS COURAGE CALLS
3/12/25
TARIFF FEARS. EU, CANADA, & ETHANOL
3/11/25
USDA SNOOZE. RECORD FUND SELLING A CONCERN?
3/10/25
USDA TOMORROW. GETTING COMFORTABLE IN MARKETING
3/7/25
HOW TIGHT IS THE WORLD & US SITUATION?
3/6/25
TARIFFS PUSHED BACK. FUTURE OPPORTUNITIES?
3/5/25
IS GRAINS BIGGEST RISK WEAK CRUDE & DEFLATION?
3/4/25
TRADE WAR BEGINS. 8TH DAY OF PAIN FOR GRAINS
3/3/25
TARIFFS ON TOMORROW. BUY SIGNAL
3/3/25
BUY SIGNAL
2/28/25
WHEN WILL THE BLEEDING STOP?
2/27/25
CORN AT CRITICAL SPOT. USDA ACRE REPORT. WAY TOO EARLY DROUGHT TALK
2/26/25
HISTORY SUGGESTS CORN TOP ISN’T IN? ACRE OUTLOOK TOMORROW
2/25/25
POSITIVE CLOSE. WHAT TO KNOW ABOUT USDA OUTLOOK
2/24/25
USDA OUTLOOK, FIRST NOTICE DAY & BRAZIL
2/21/25
WHAT TO EXPECT MOVING FORWARD IN GRAINS
2/20/25
FIRST NOTICE DAY CONCERNS. MASSIVE CORN ACRES OR NOT?
2/19/25
HOW TIGHT IS THE CORN SITUATION?
2/18/25
MORE DETAILS ON TODAYS SELL SIGNAL
2/18/25
OLD CROP KC WHEAT & CORN SELL SIGNAL
2/14/25
WHEAT BREAKING OUT ON WEATHER RISK. TECHNICALS & FUNDAMENTALS
2/12/25
GLOBAL GRAIN SITUATION, ACRE TALK, CHARTS & MORE
2/11/25
USDA: NOT A BEARISH REPORT. DISAPPOINTING PRICE ACTION
2/10/25
USDA TOMORROW. LONG TERM PATH FOR SUB 10% CORN STOCKS TO USE?
2/7/25
WHY WOULD THE FUNDS EXIT THEIR LONGS?
2/6/25
WHEAT FINALLY CATCHING A BID
2/5/25
COMPLETE THOUGHTS ON MARKETS: BACK & FORTH DISCUSSION
2/4/25
STRONG JANUARY LEAD TO STRONG YEAR? TARIFFS, CHARTS & MORE
2/3/25
TARIFFS PUSHED BACK
1/31/25
TARIFF NEWS ALL OVER THE PLACE. ARE YOU PREPARED FOR POSSIBILITIES?
1/30/25
WHEAT BULL ARGUMENT. TRUMP ADDS TARIFFS
1/29/25
CORN APPROACHES $5.00
1/28/25
TARIFFS, CORN FUNDS, SOUTH AMERICA & MORE
1/27/25
HEALTHY CORRECTION WE TALKED ABOUT & TARIFF NEWS
1/24/25
GRAINS DUE FOR SHORT TERM CORRECTION?
1/23/25
OUR ENTIRE NEW CROP SALES THOUGHTS & OLD CROP SELL SIGNAL
1/22/25
GRAINS TAKE A BREATHER. IS CORN IN A BULL OR BEAR MARKET?
1/21/25
HUGE DAY IN GRAINS. WHAT TO DO WITH OLD CROP VS NEW CROP
Read More
1/20/25
VIDEO CHART UPDATE
1/17/25
TRUMP, CHINA, ARGY & USING THE SPREADS INVERSE
1/16/25
OLD CROP LEADS US LOWER. MARKETING THOUGHTS
1/15/25
SIGNAL & HEDGE ALERT QUESTIONS EXPLAINED. IS $6 CORN EVEN POSSIBLE?
1/14/25
MORE DETAILS ON TODAYS HEDGE ALERT & SELL SIGNAL
1/14/25
CORN & SOYBEANS HEDGE ALERT/SELL SIGNAL
1/13/25
USDA GAME CHANGER OR NOT?
1/10/25
BULLISH USDA FOR CORN & BEANS
1/9/25
USDA OUT TOMORROW
1/8/25
2 DAYS UNTIL USDA. BE PREPARED
1/7/25
THE HISTORY OF THE JAN USDA & MORE
1/6/25
MAJOR USDA REPORT FRIDAY
Read More
1/3/25
UGLY DAY ACROSS THE GRAINS
1/2/25