
CROP RATINGS MATTER?
MARKET UPDATE
You can scroll to read the usual update as well. As the written version is the exact same as the video.
Timestamps for video:
Crop Ratings vs Past Years: 0:00min
Weather & Overnight Heat: 2:45min
Corn: 4:00min
Beans: 7:30min
Wheat: 9:50min
Cattle: 12:00min
Our summer sale ends soon
Since your trial ended you will NOT get our next signal or future updates
Take advantage of our sale so you don’t miss the next opportunity
Want to talk about your situation?
(605)295-3100
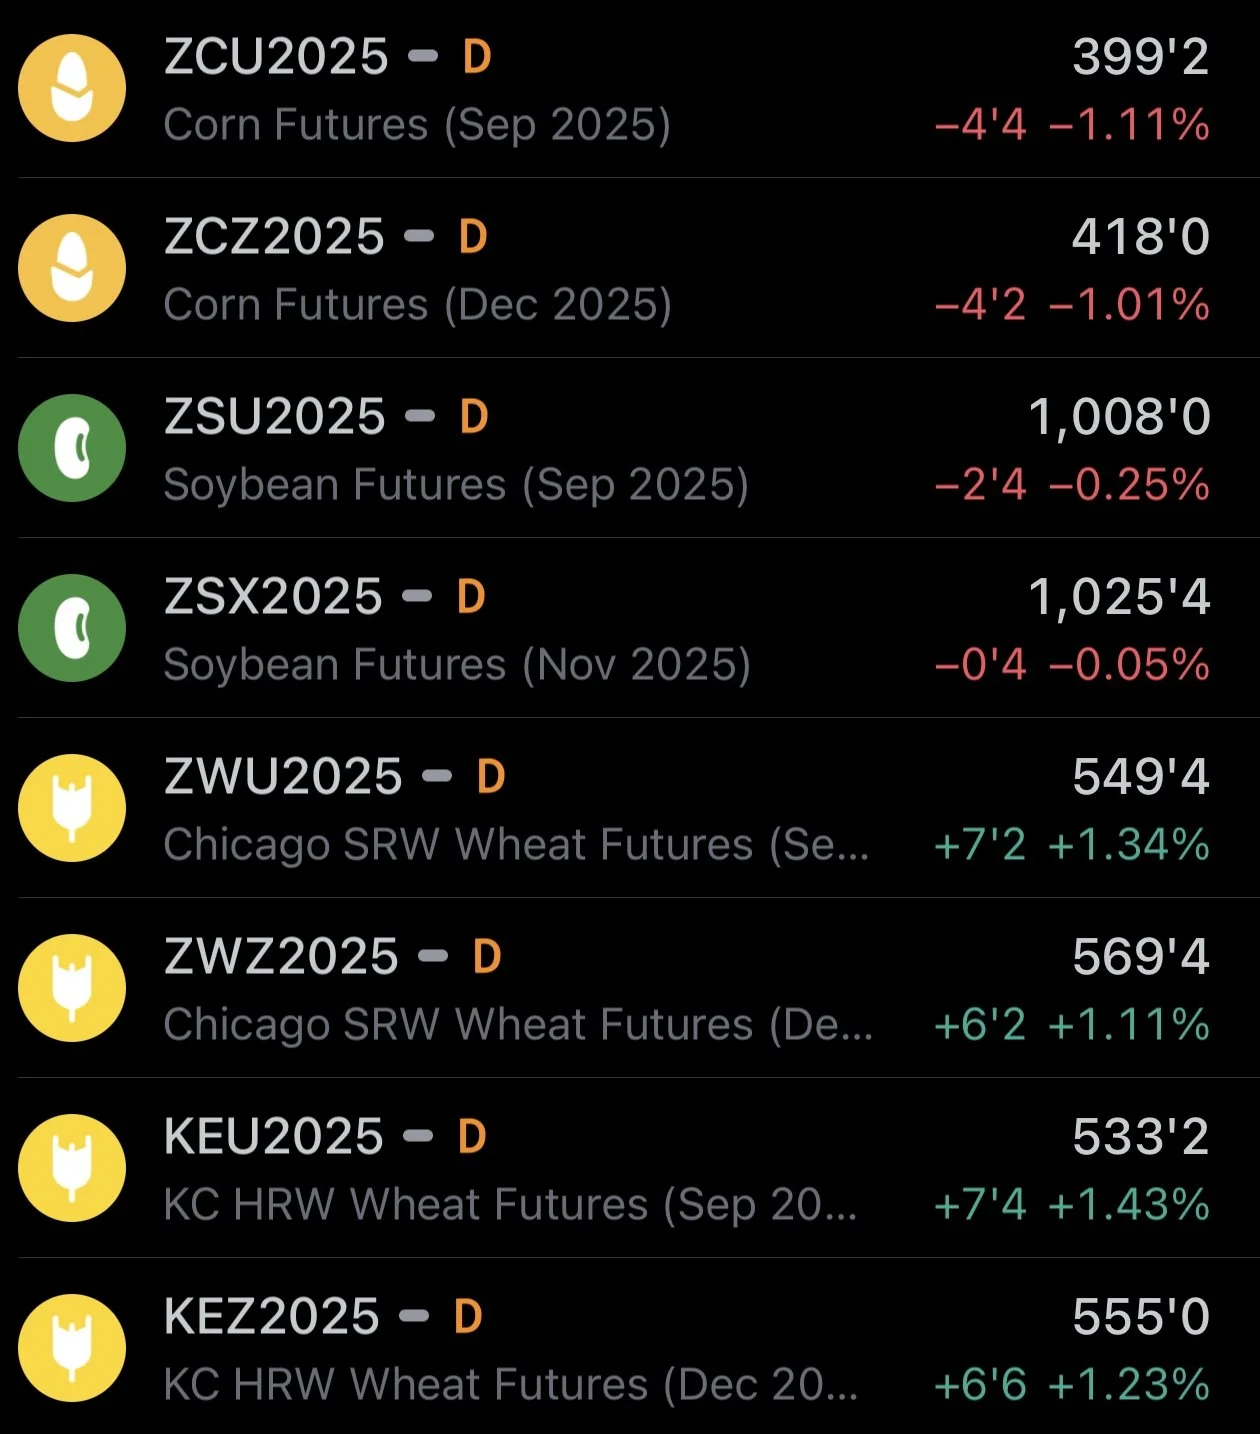
Futures Prices Close
Overview
Grains mixed with wheat leading the way higher today.
Yesterday we had crop conditions. Corn was unchanged while soybeans surprised low.
Soybeans dropped from 70% to 68% G/E, while the trade was expecting ratings to jump +1% to 71%.
So it was kind of disappointing soybeans couldn’t capitalize on the news and trade higher today.
Let's look at crop conditions..
Crop Ratings vs Past Years
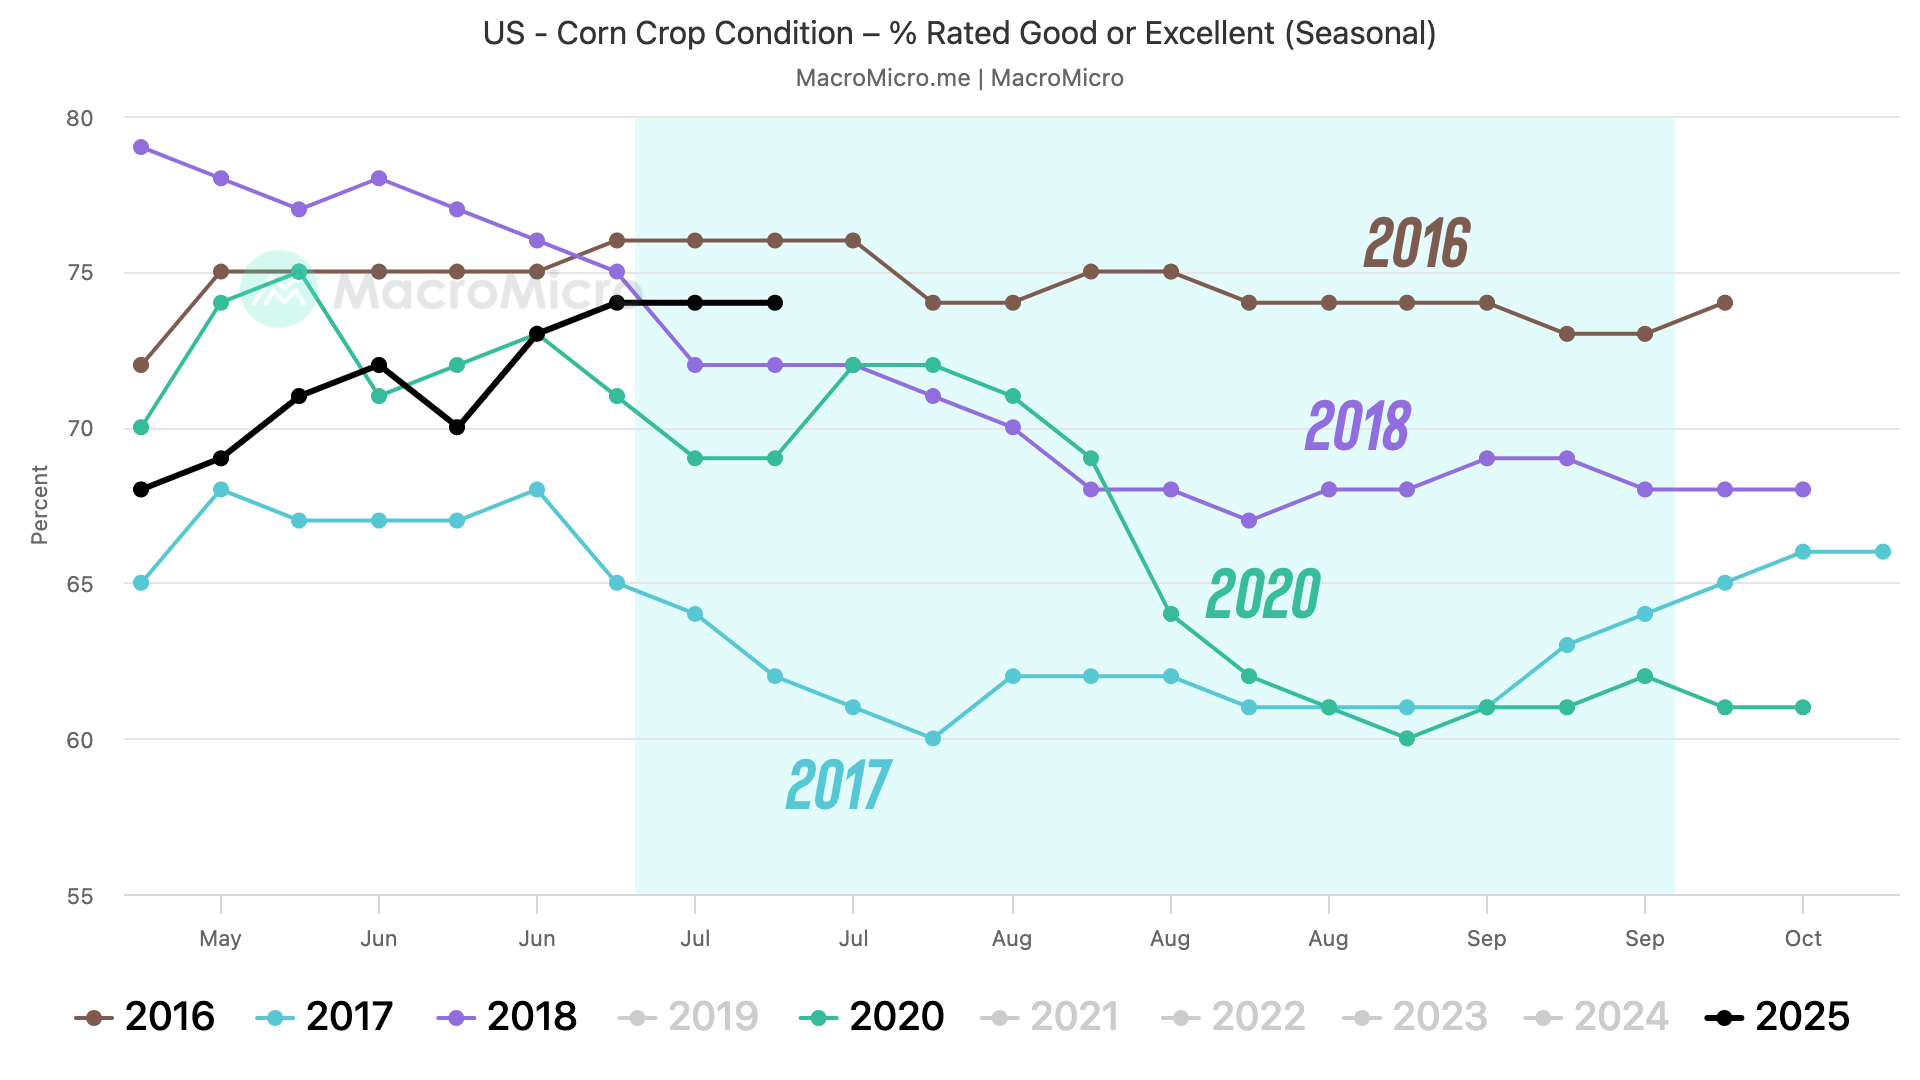
Corn is rated 74% G/E.
That is the 2nd best of the last decade.
Only behind 2016 and just ahead of 2018.
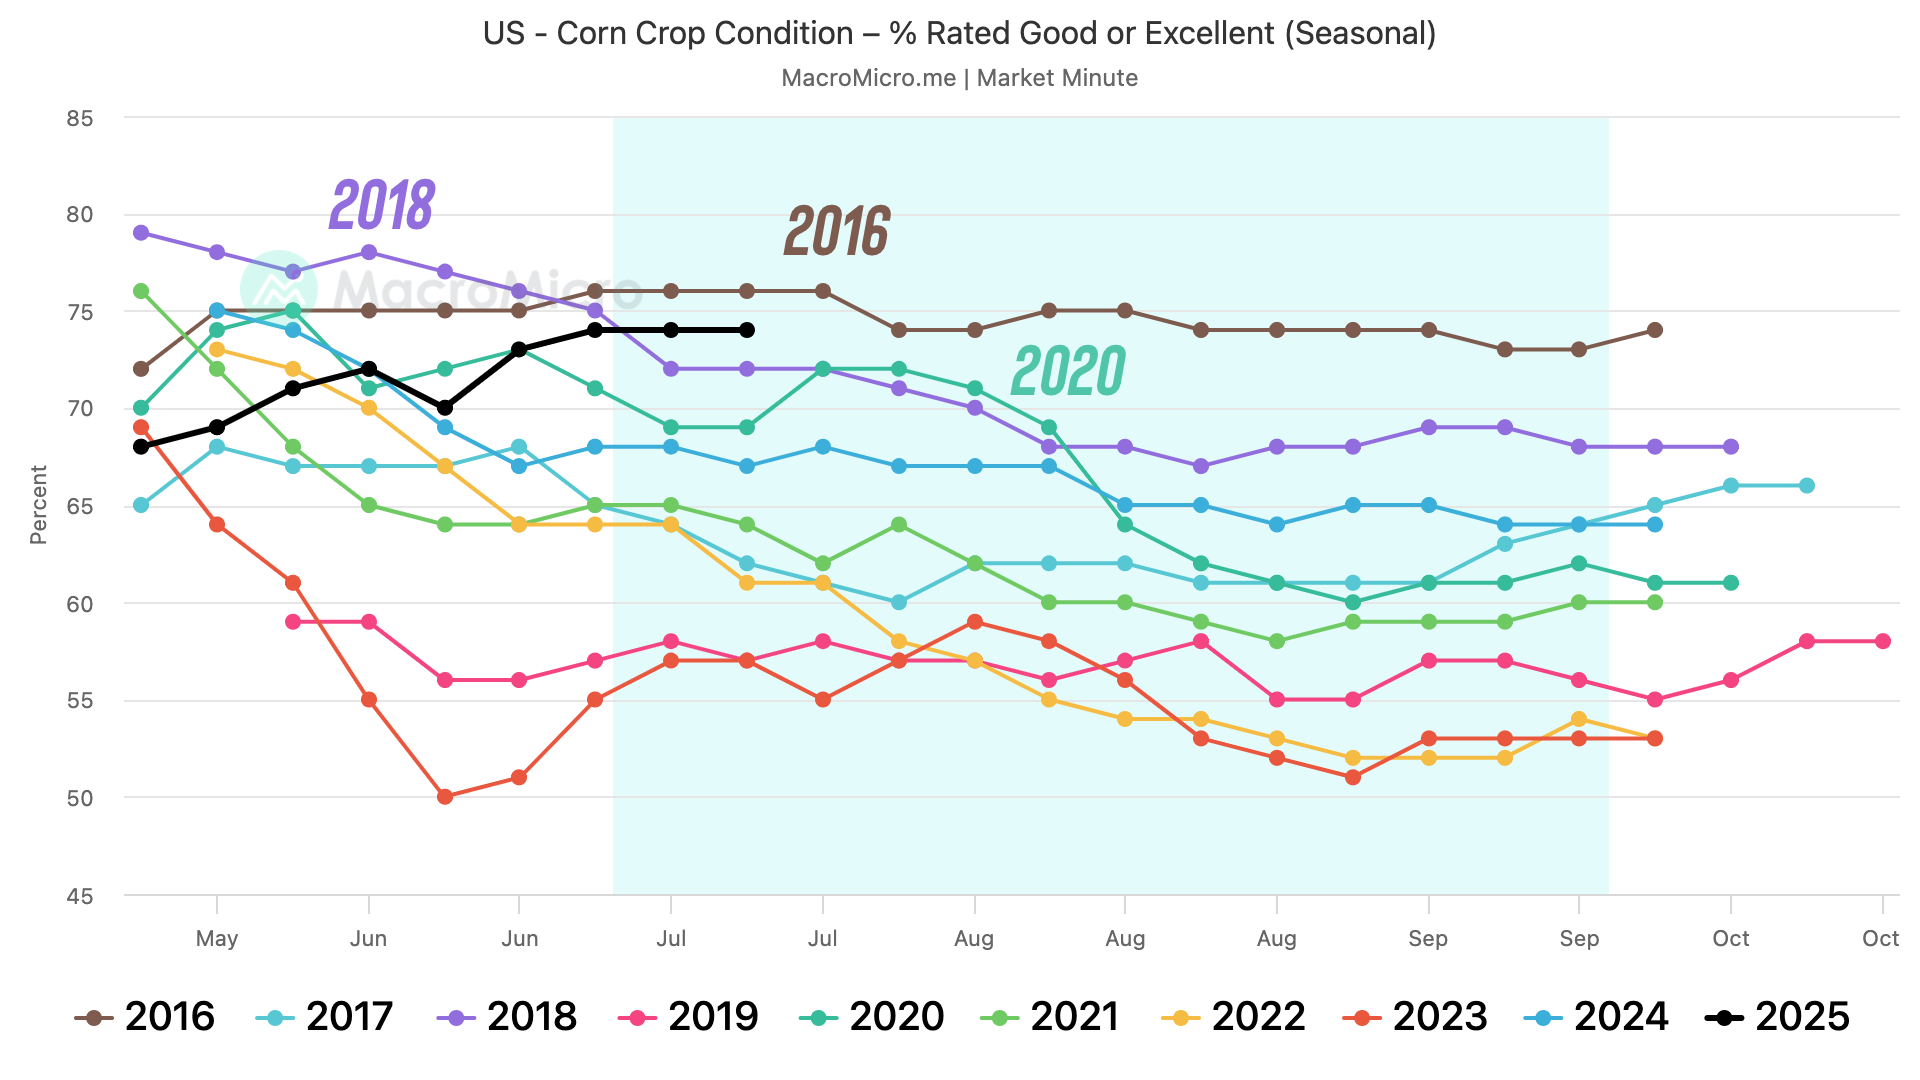
Here is a simple view of the years where ratings were corn rated better than 68% at this date in the year.
2016, 2018, 2020, and this year.
Let's look at what happened those years.
2016 and 2018 we were well above trendline yield.
2020 we were below.
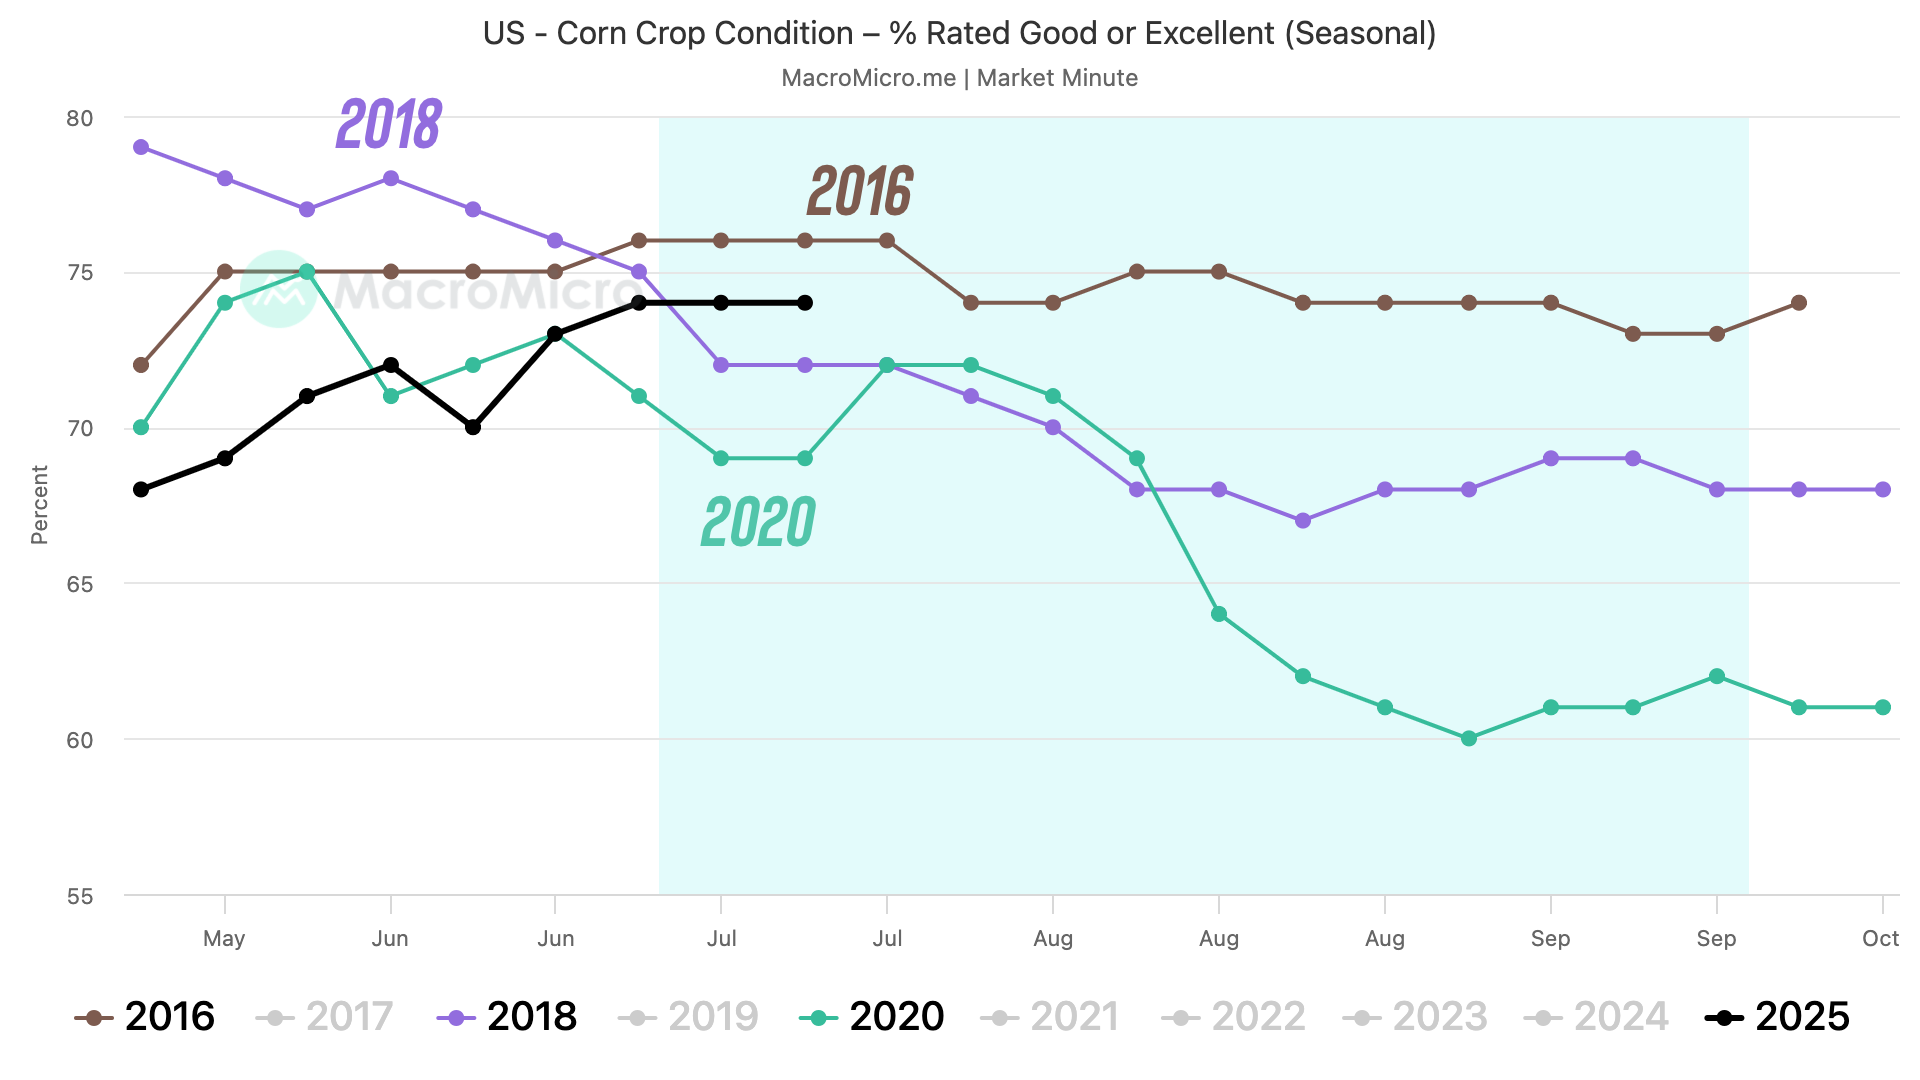
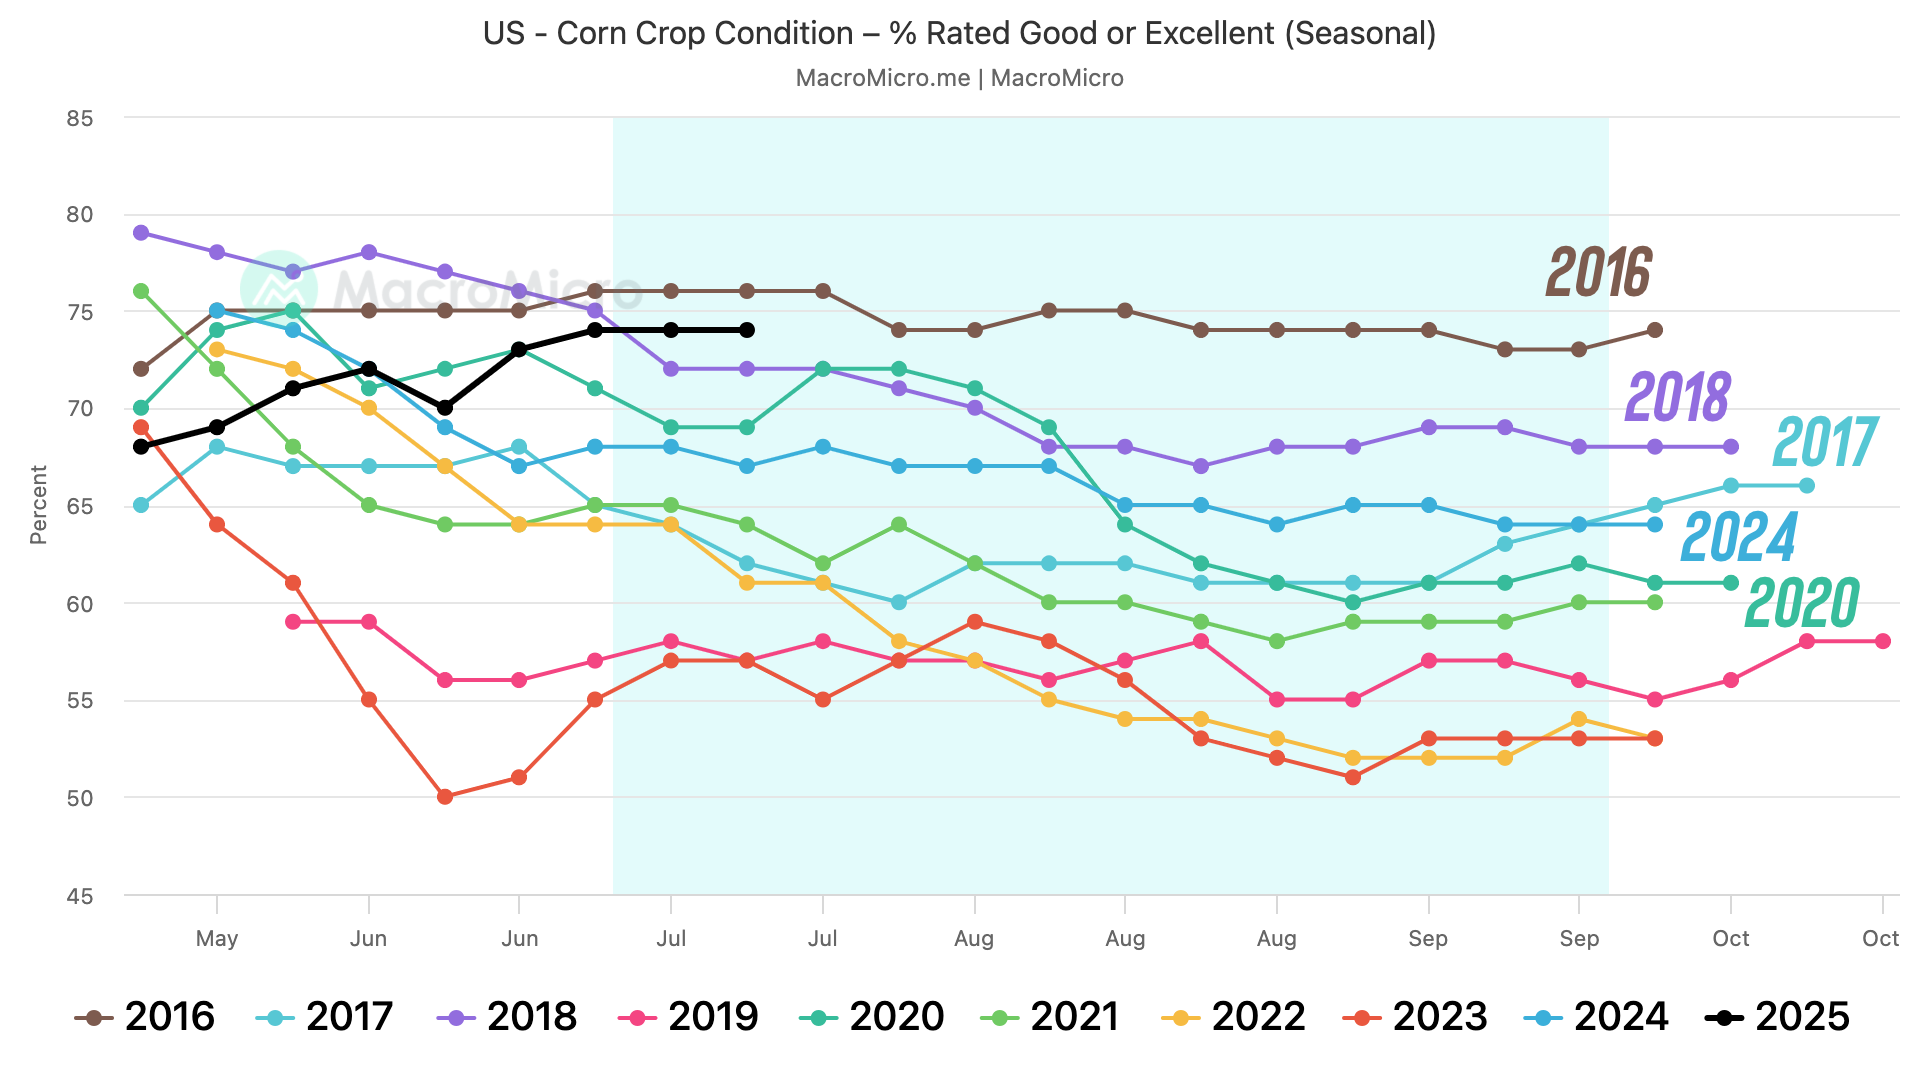
But crop ratings do come with their flaws.
We hit above trend yield in 2016, 2017, and 2018 for 3 years in a row.
What above 2017?
Crop ratings weren’t impressive at all at this point in the year, but had a spike around harvest.
Meanwhile 2020 for example had high crop ratings in July, but fell going into harvest.
So what crop ratings look like come harvest do usually correlate to how yield looks.
Let's look at final crop ratings instead.
Here is another view that includes every year for the past decade.
Final crop ratings ranked:
#1 - 2016
#2 - 2018
#3 - 2017
#4 - 2024
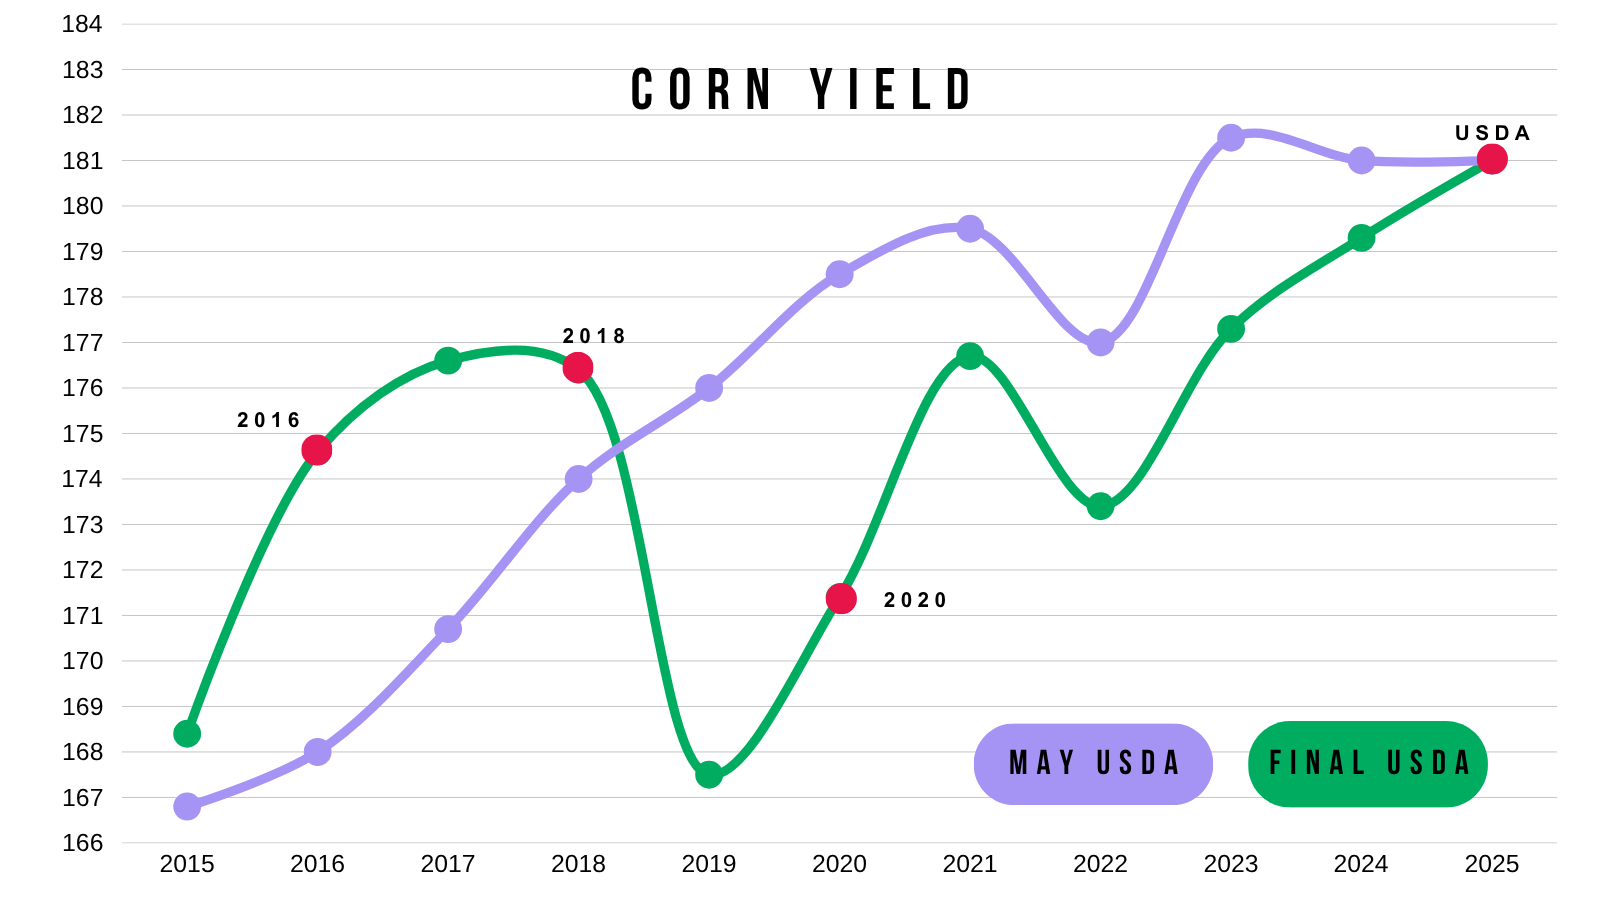
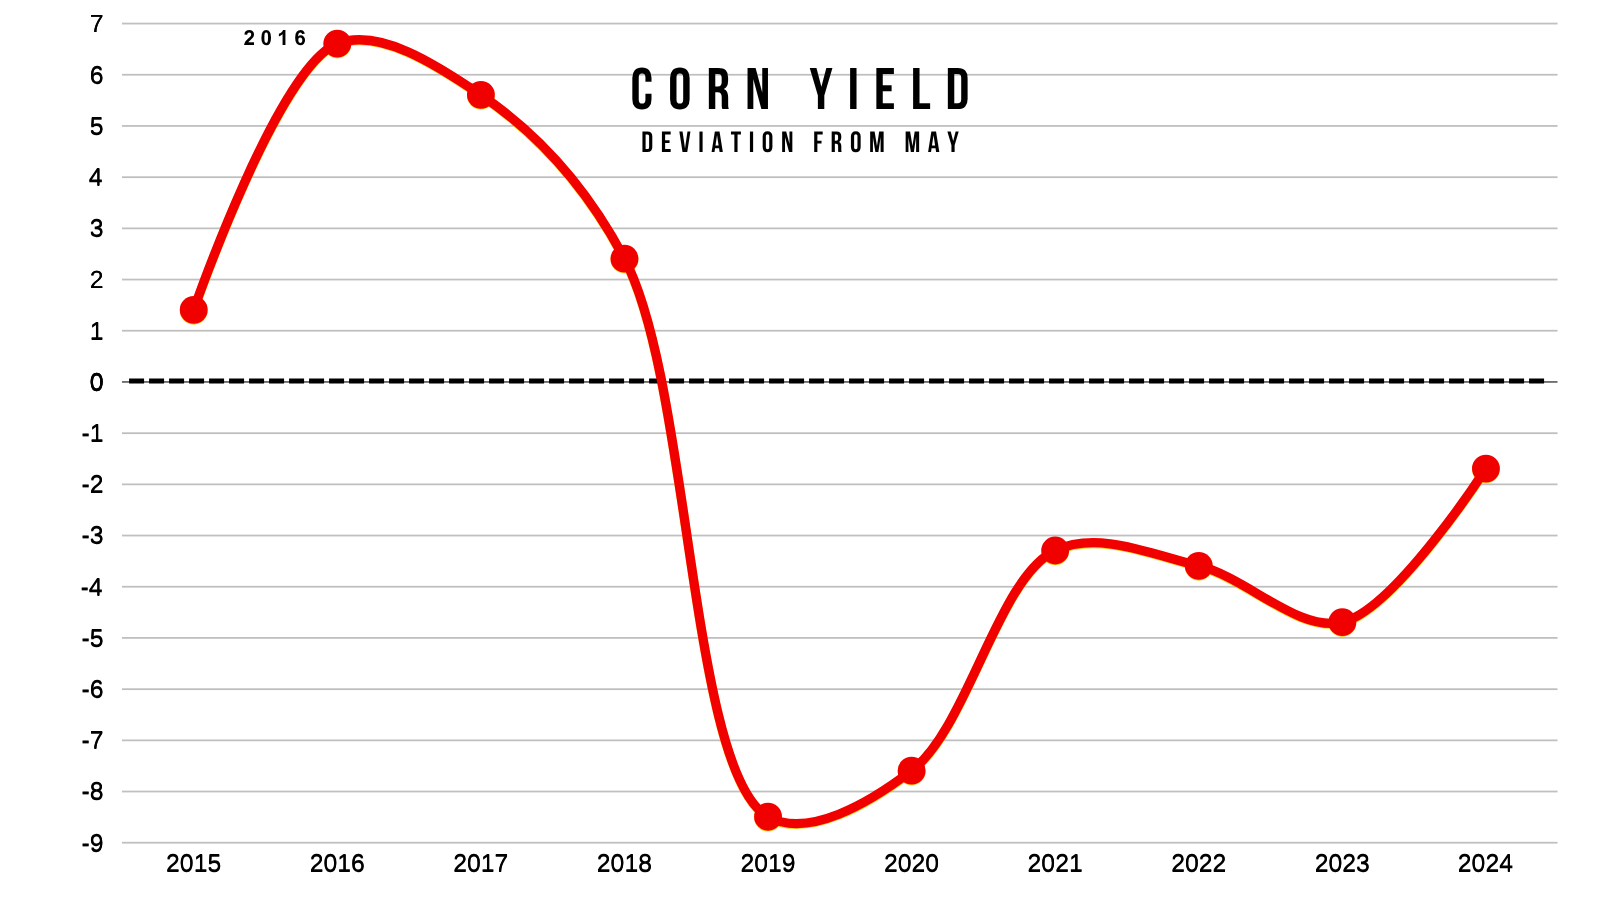
2016 was also the year we had the highest deviation above starting May yield. As we surpassed it by nearly +7 bpa.
2017 and 2018 were also above trend.
2024 was our closest to trend since 2018.
So you can make the argument that based on current crop conditions we are looking at an above trendline yield crop. But there is plenty of time left for things to change.
Now let's look at soybeans.
Soybeans are tied for their 4th best ratings of the last decade.
Behind 2016, 2018, and 2020.
Exactly the same as last year.
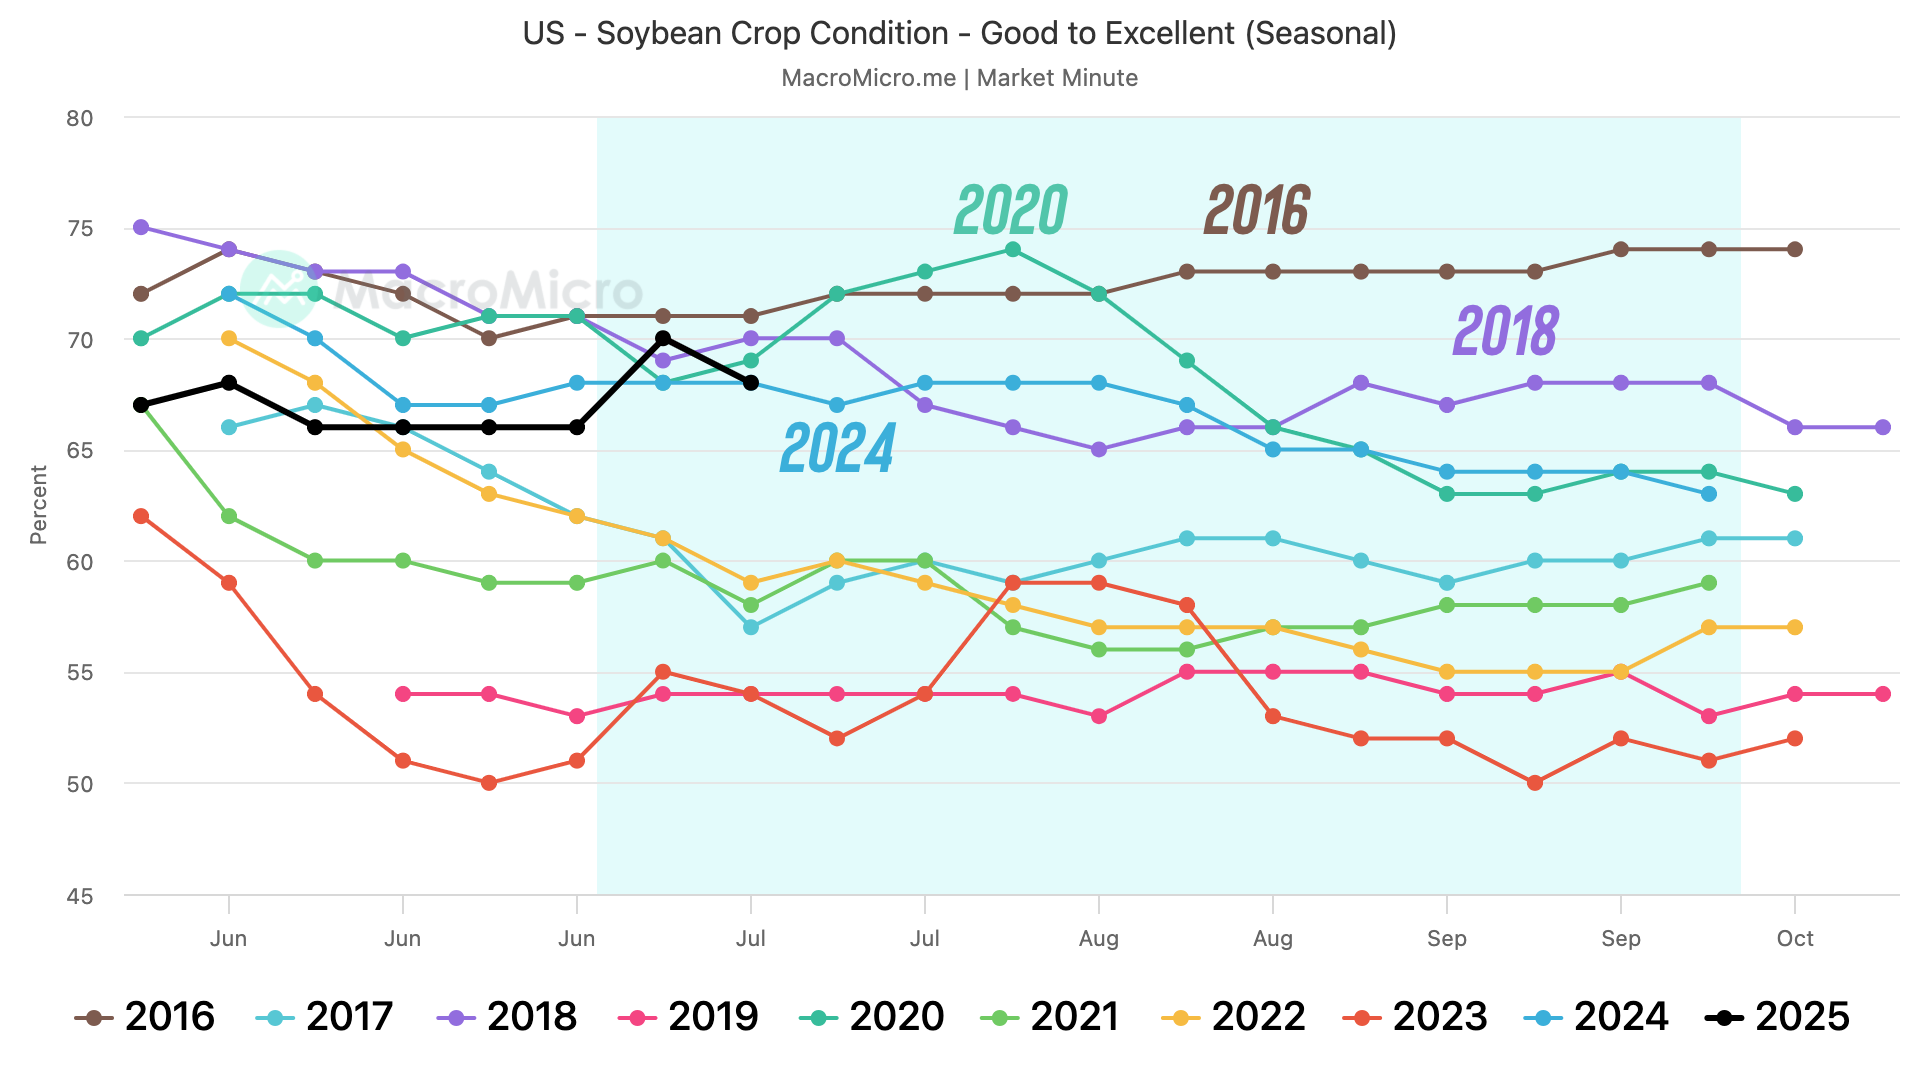
Here is a simple view of those years.
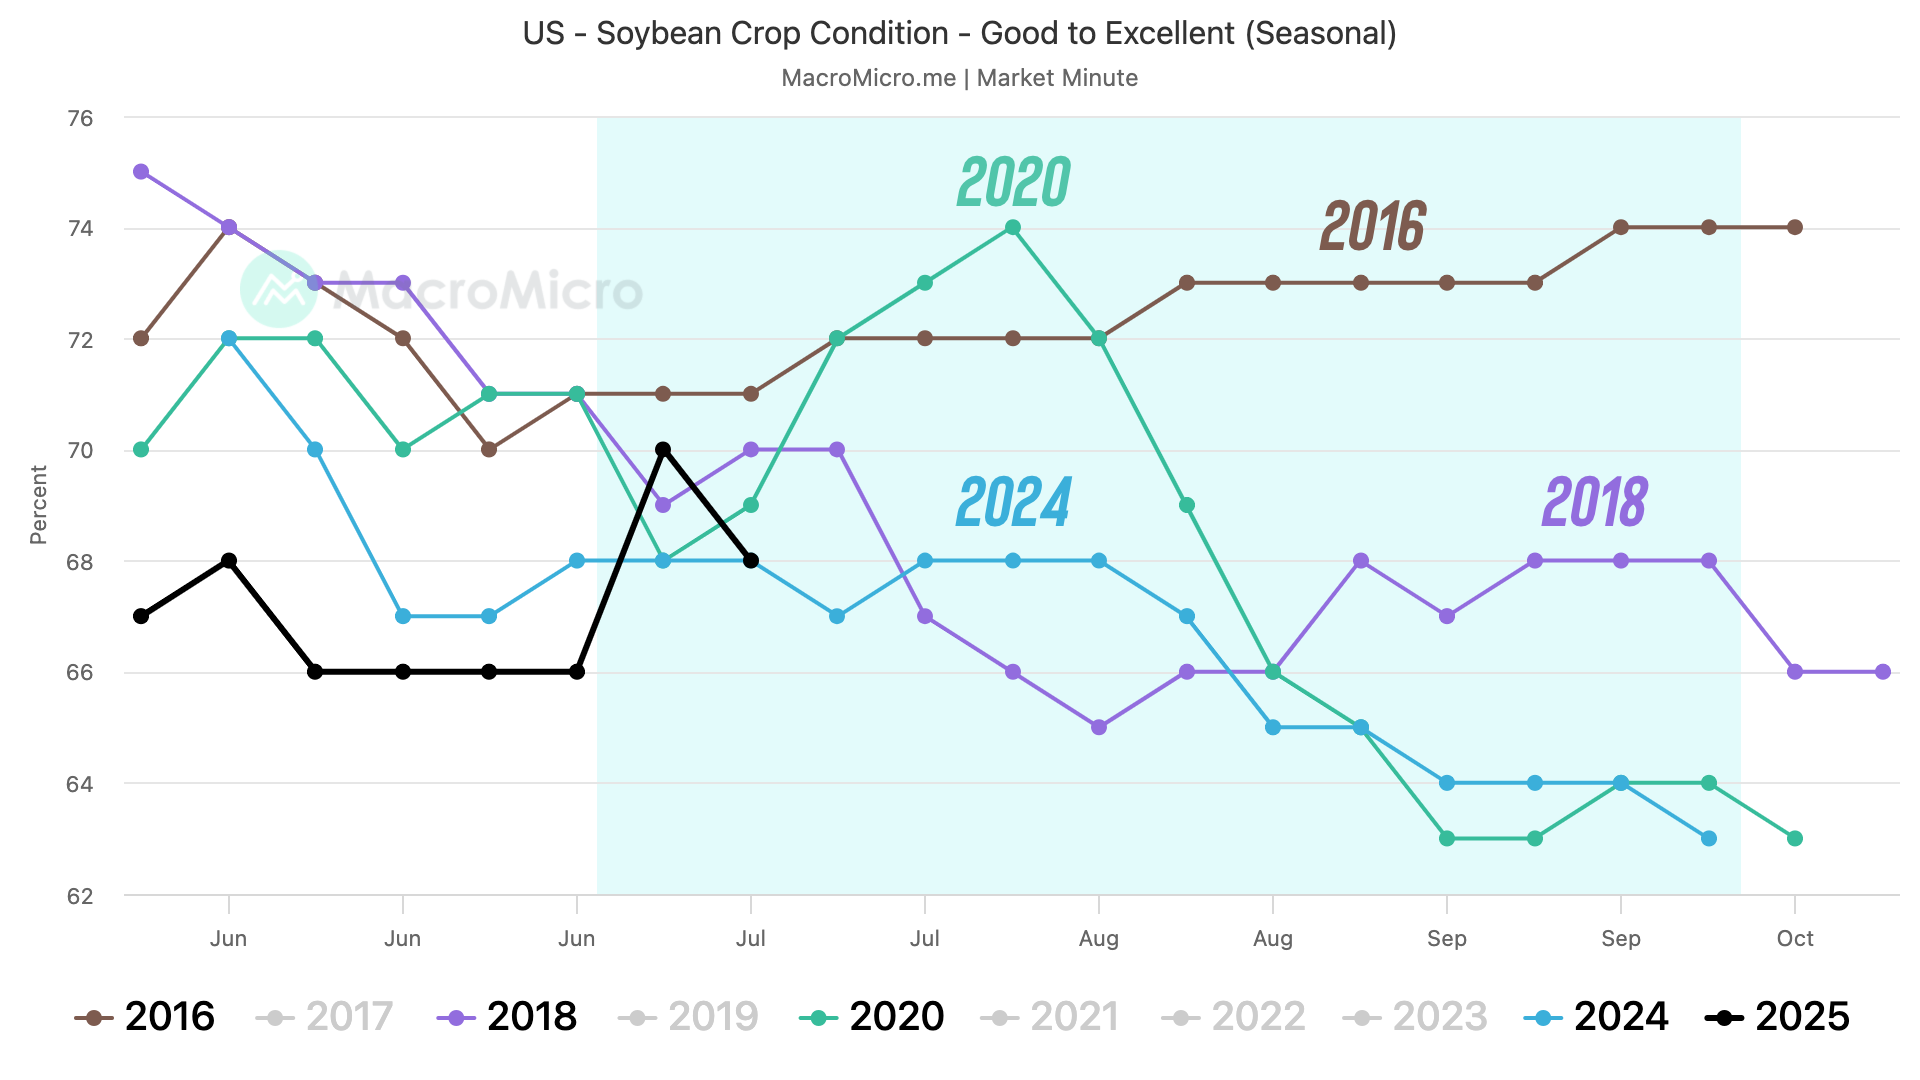
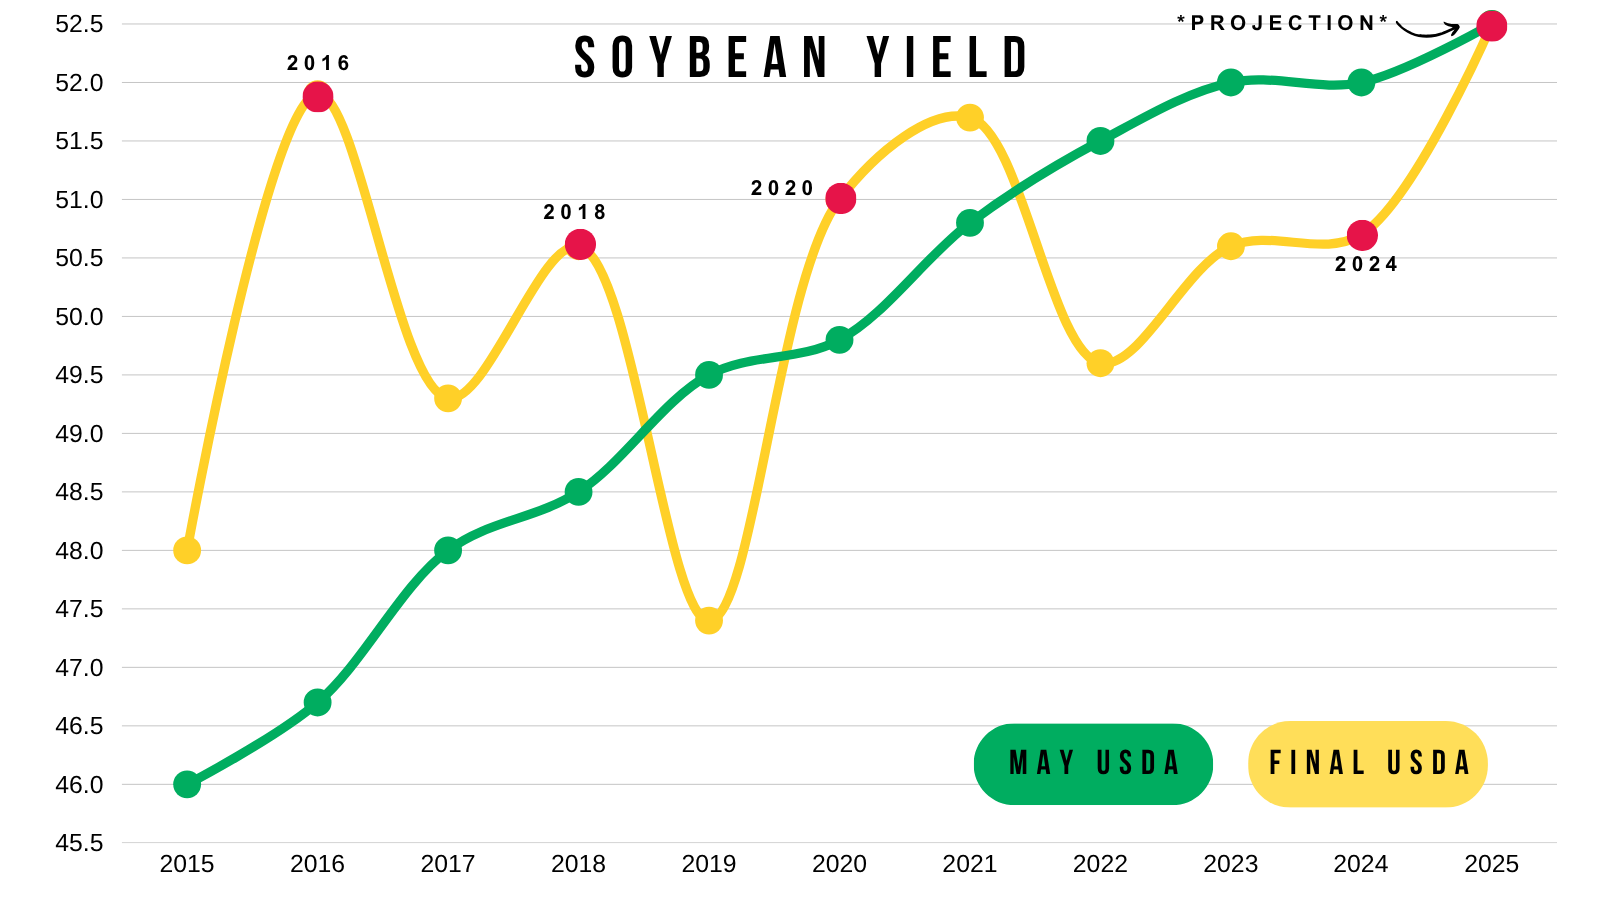
Here is how yield performed.
In 3 of those years, we hit above trendline.
The only year we did not was last year.
So again, you could make the argument that ratings do correlate to yield. But it is far to early to even be guessing what soybean yield.
Overnight Heat & Rain
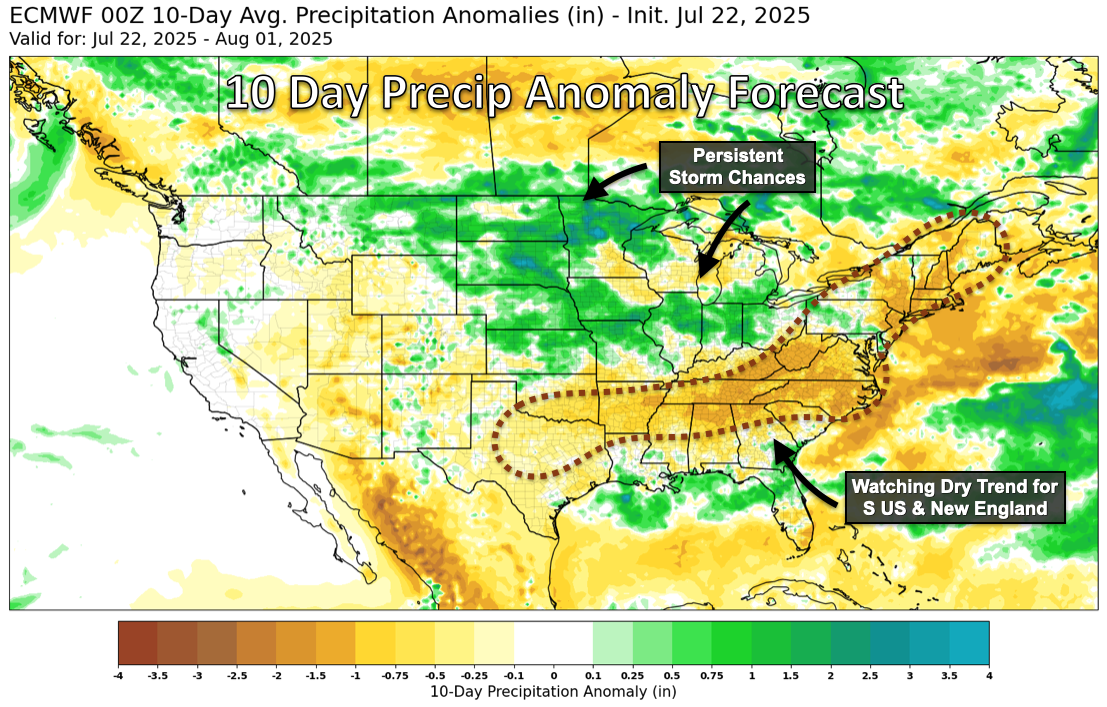
We've seen a ton of rain.
Which is why the market isn’t concerned and hasn’t put in any weather premium and we continue to trend lower.
We have more rain on the way.
Here is the precip anomoly for the next 10 days from Eric Snodgrass.
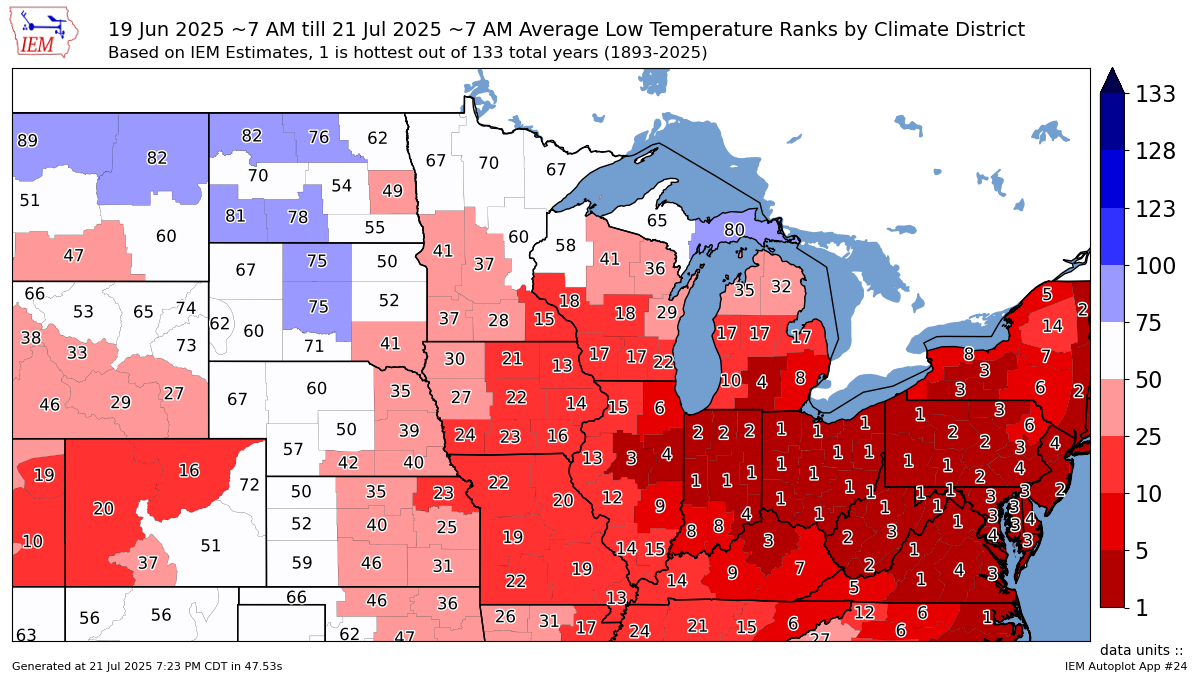
However, we are still looking at hot overnight temps.
Here is the low temps for next Monday.
Most of the corn belt is looking at lows of 70-75 degrees.
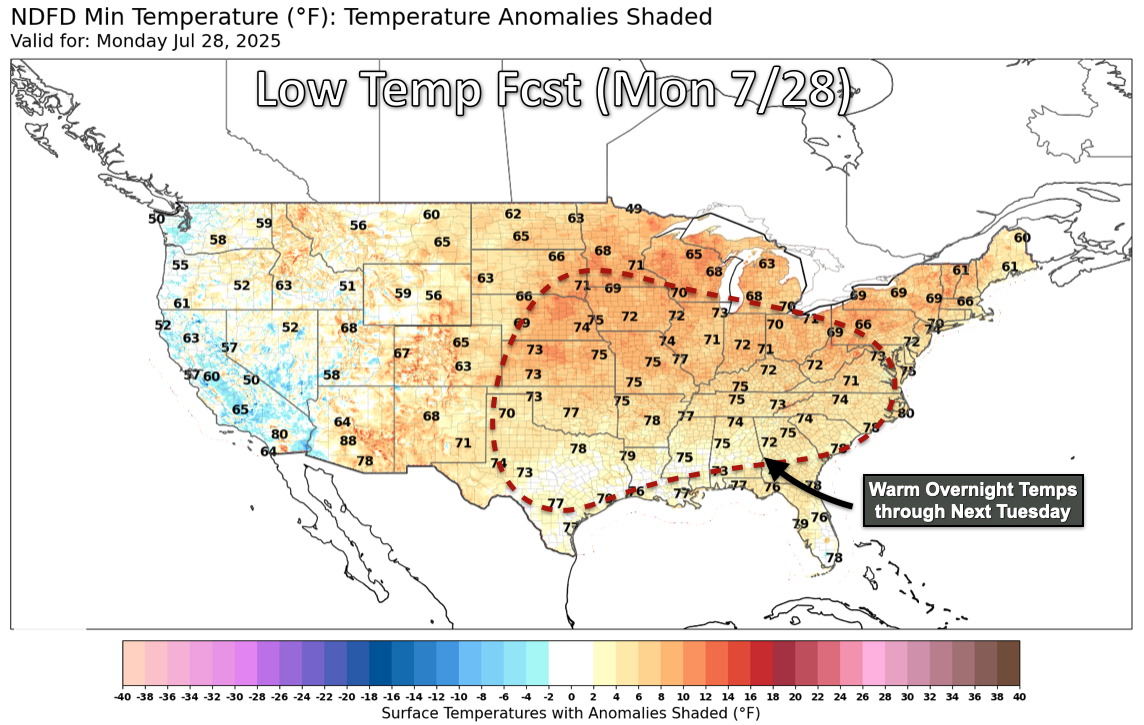
If we look at the past 30 days, a good chunk of the corn belt has been experiencing hot nights.
This is the low temp rankings for the past 133 years.
1 = Hottest
133 = Coolest
The abundance of rain is going to offset some of this heat stress, but when you get hot days and rain it create humidity. Basically a greenhouse effect.
Humidity is what causes those hot nights and doesn’t give the crops a chance to recover overnight.
I'm just saying that the market has already priced in a +185 crop and this overnight heat is starting to limit that potential. This heat is giving us a better chance of losing yield than gaining it moving forward.
Even with the ample rain, this heat could very welll trim a little bit of yield off the top end.
The market isn’t concerned about this, but it is definitely something to keep on your radar.
Todays Main Takeaways
Corn
Funds & Rate Cuts:
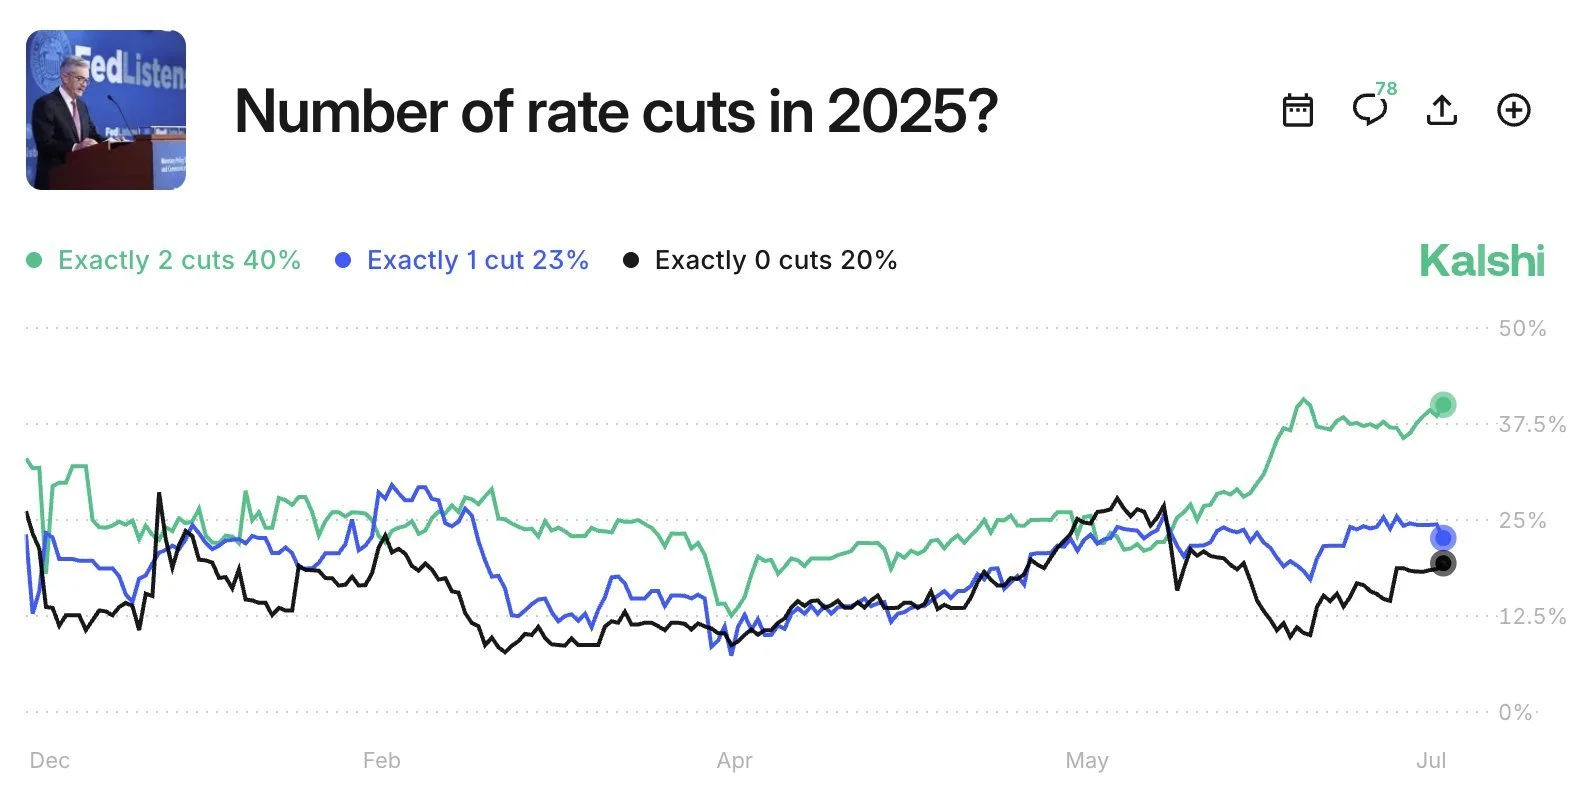
Remember this chart I've been showing about how the funds might not get behind this corn market until the feds decide to cut interest rates?

Goldman Sachs just announced they are expecting rate cuts in September.
The prediction markets now see an 80% chance of rate cuts this year, and a 40% chance of 2 rate cuts.
So perhaps this can be a leading factor to help the funds want to be long commodities as an inflation play.
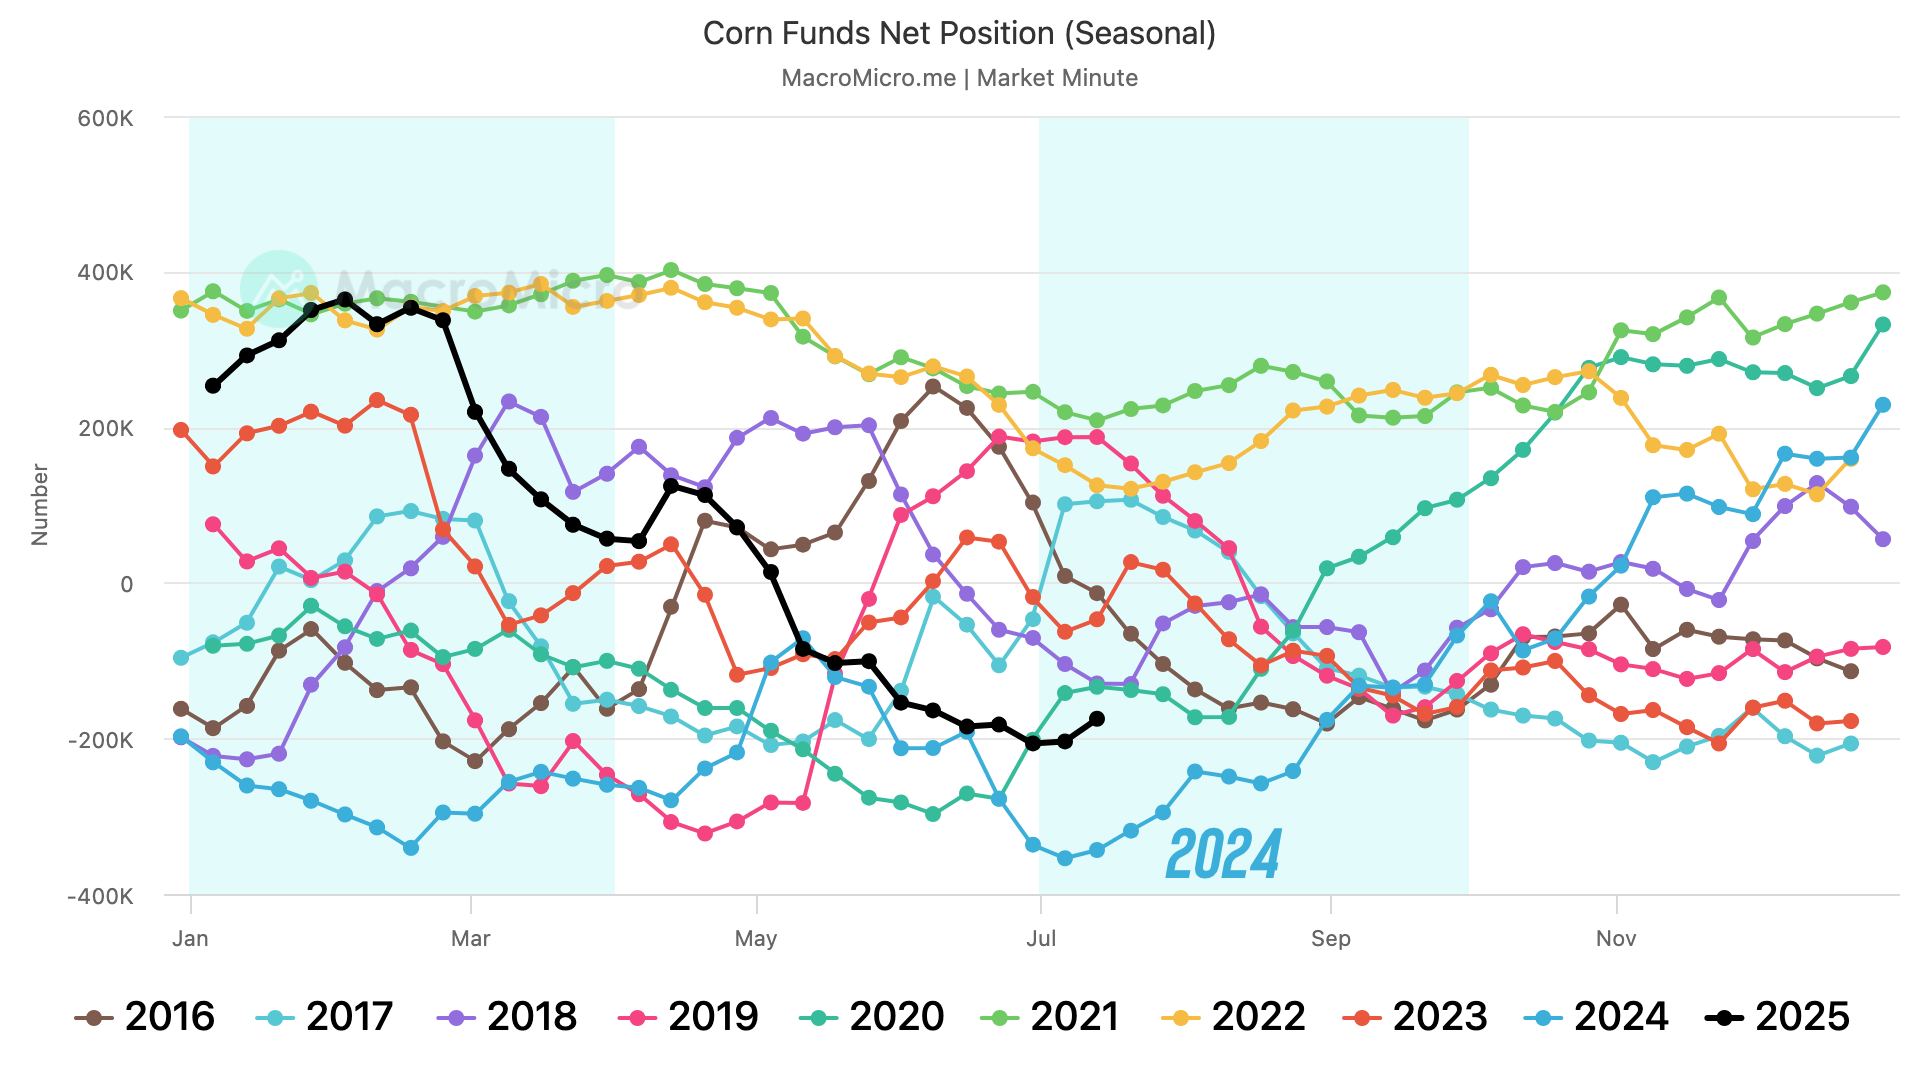
The funds have now bought corn for 2 weeks in a row for the first time since February.
Last year it was this exact same week they threw in the towel on their corn short.
Coincidentally..? The feds cut interest rates in September last year.
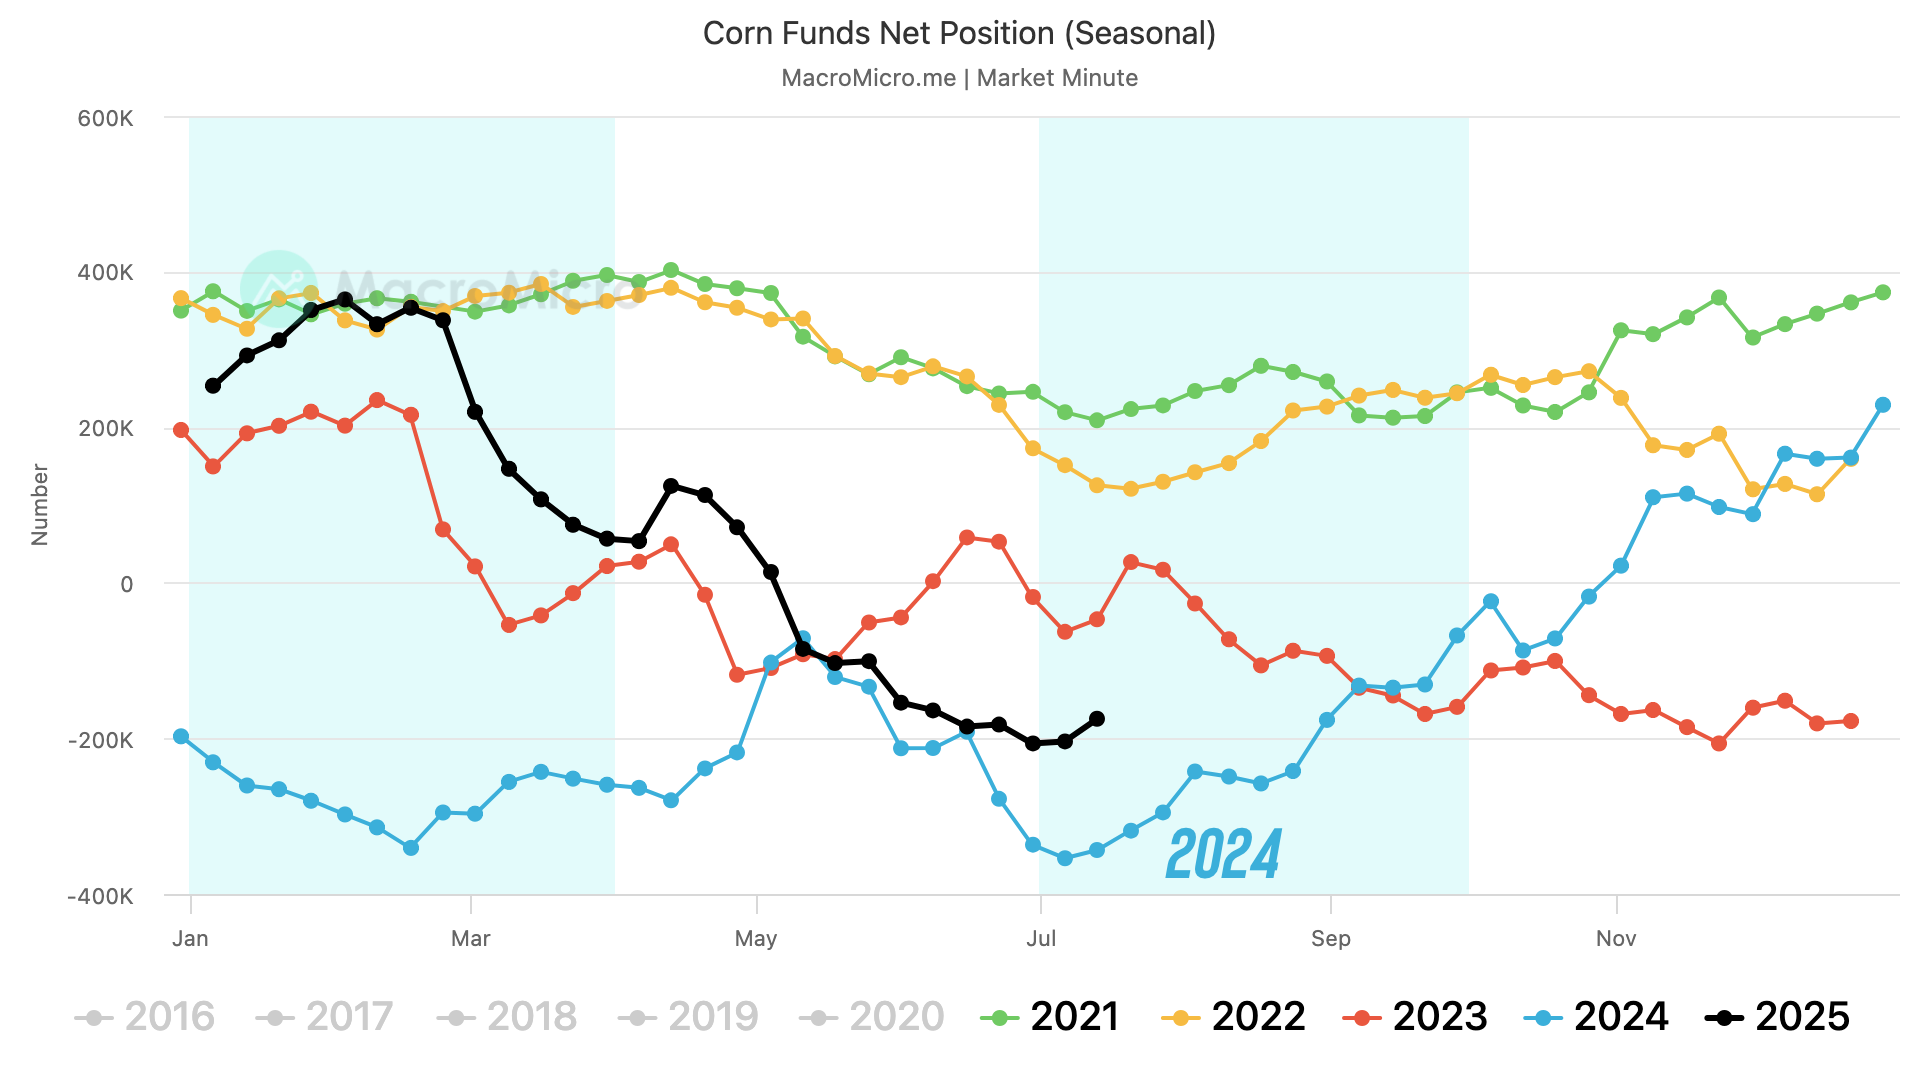
The funds are holding their 2nd largest short position for this time of year in the past decade.
Only behind last year’s record short.
Overall, I'm not expecting some major rally out of nowhere.
Weather is too wet despite the heat. The problems from this overnight heat might show up later, but it's not a concern for the trade today.
However, just because I don’t see a major tomorrow doesn’t mean we have to completely fall apart.
The market has already priced in a +185 yield.
Our absolute floor last year in Dec-24 corn was $3.85
That was with a +2 billion bushel carryout.
So I don’t see how a move drastically below $4.00 would be justified here with a carryout at 1.67 billion today for Dec-25.

If we look at this next chart, that solidifies that argument.
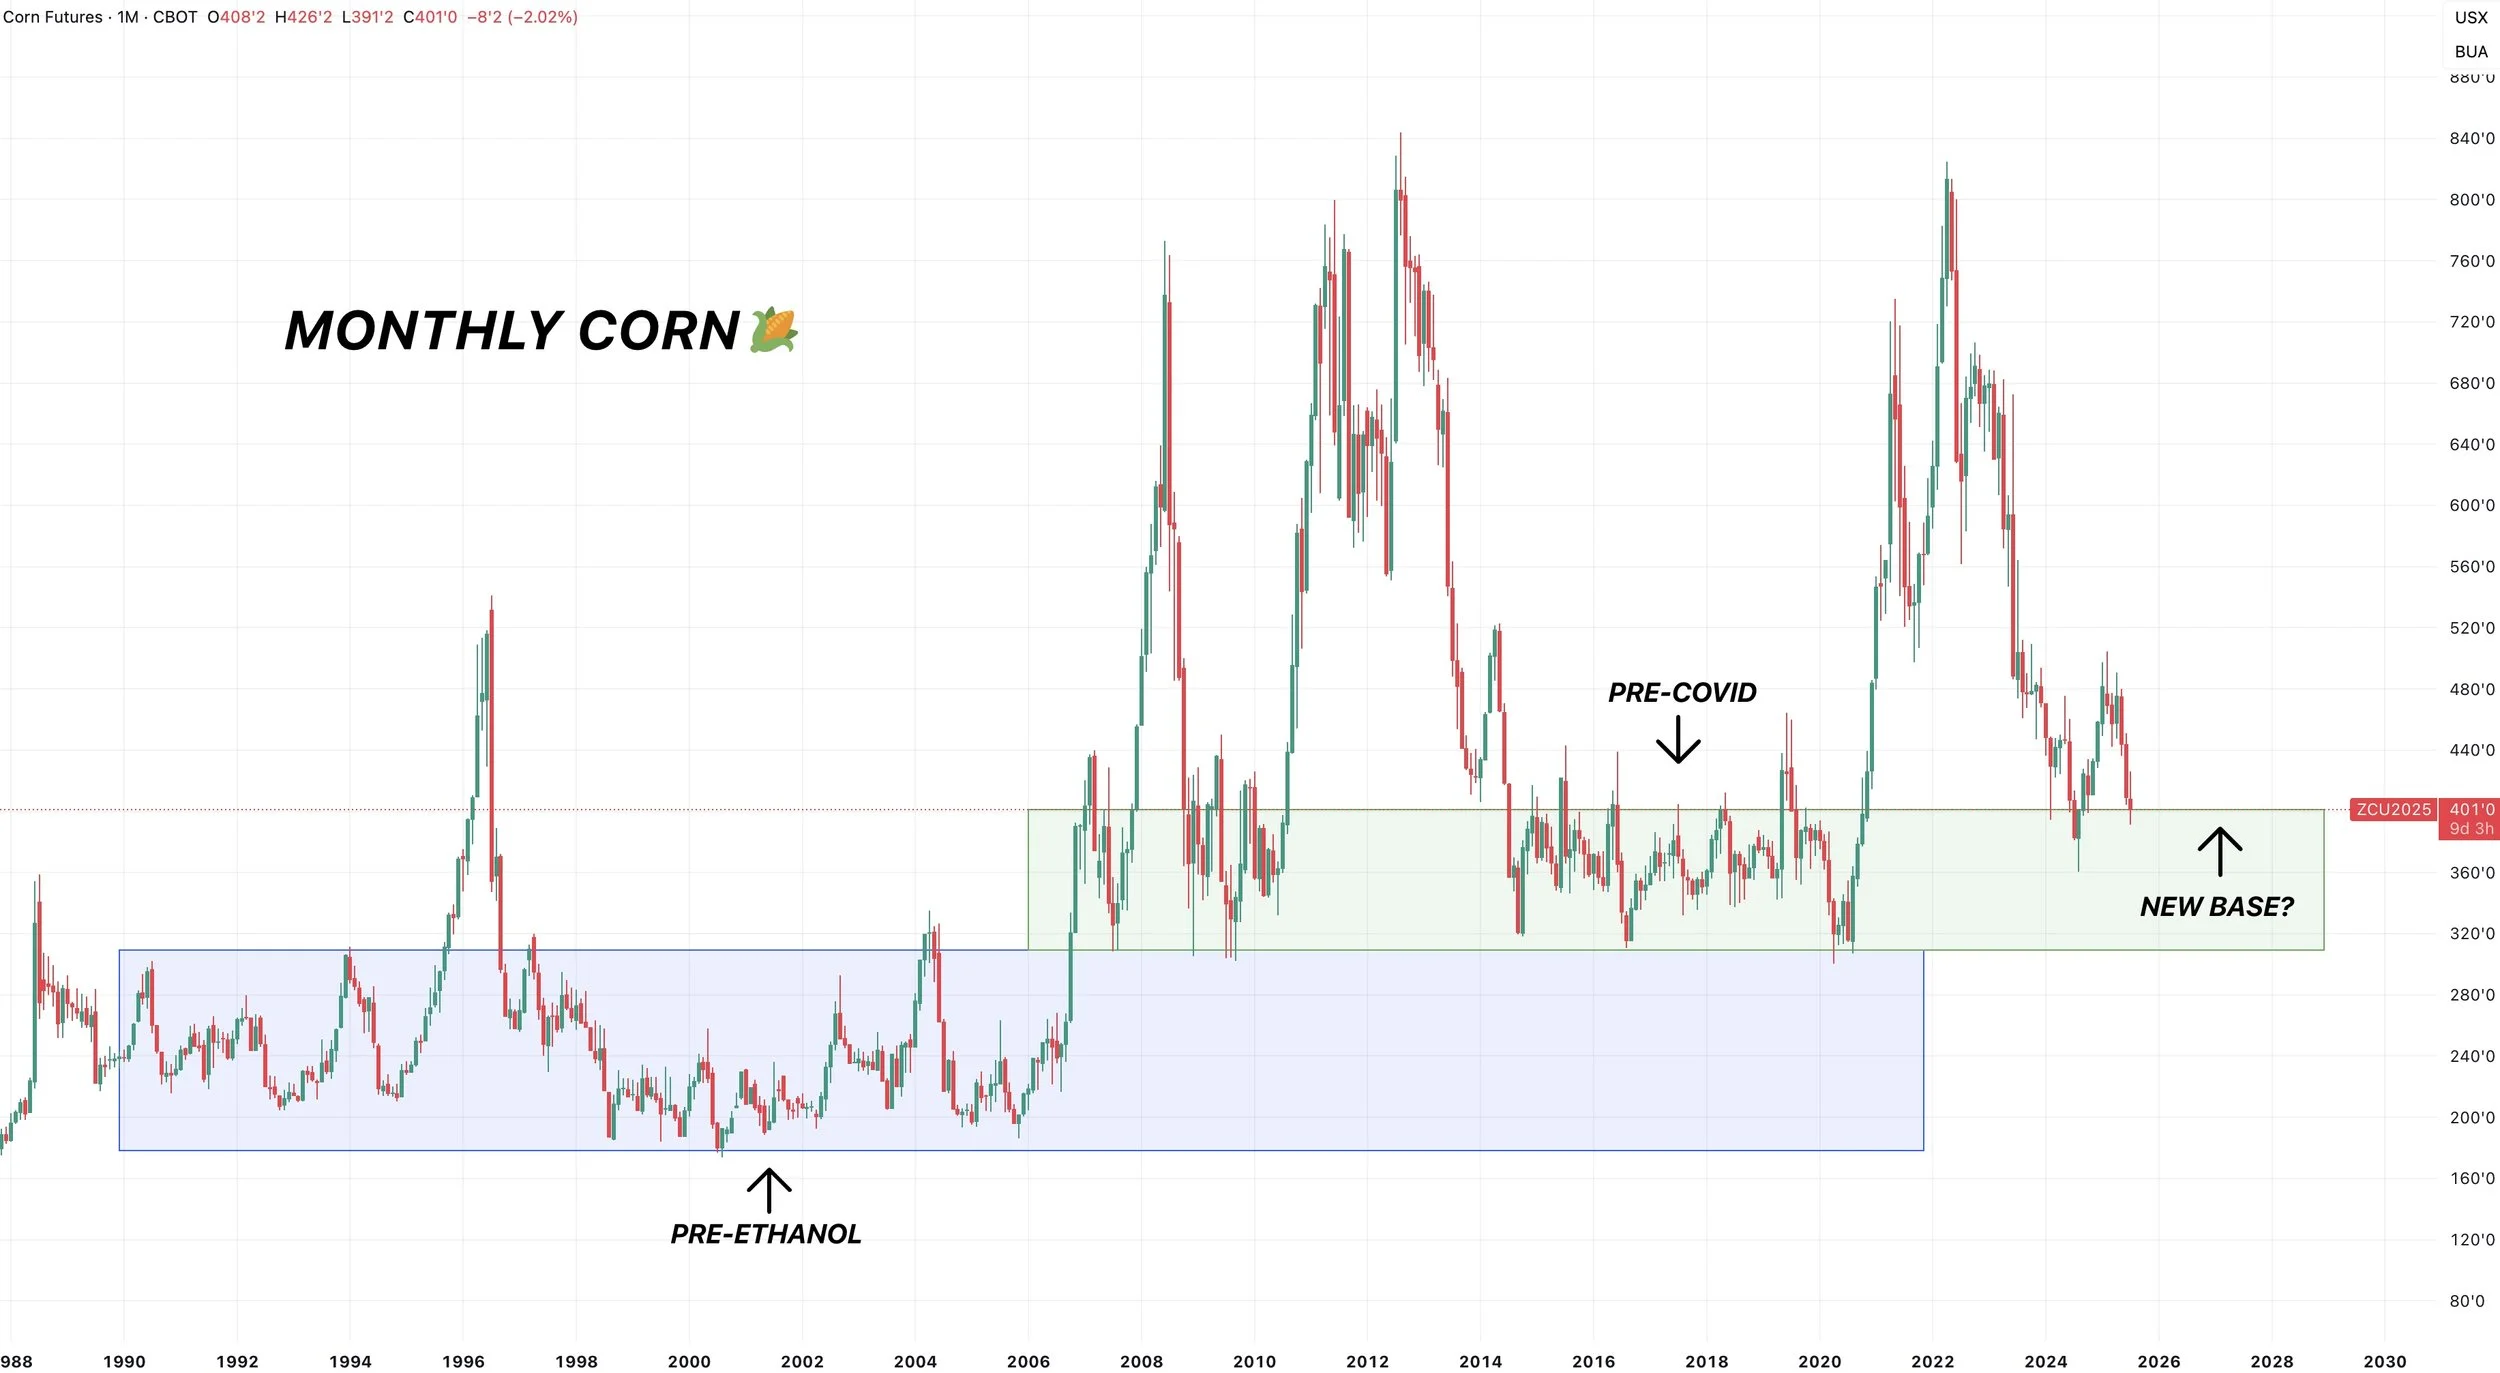
I think there is a good chance we have long term found about our cheapest prices we will see in corn between $3.60 to $4.00
The days of $3.00 lows and $4.00 highs are behind us, unlike what we saw from 2015 to 2020.
Look at our "pre-ethanol range".
Then look at our "pre-covid" lows.
Before covid prices consolidated at our highs from the pre-ethanol era. A classic case of old resistance becoming new support.
If you look at our pre-covid highs, that is exactly where we bounced last fall and are currently hovering above.
Again, resistance from pre-covid is now support.
We probably won’t see a major upside move until after we post those harvest lows.
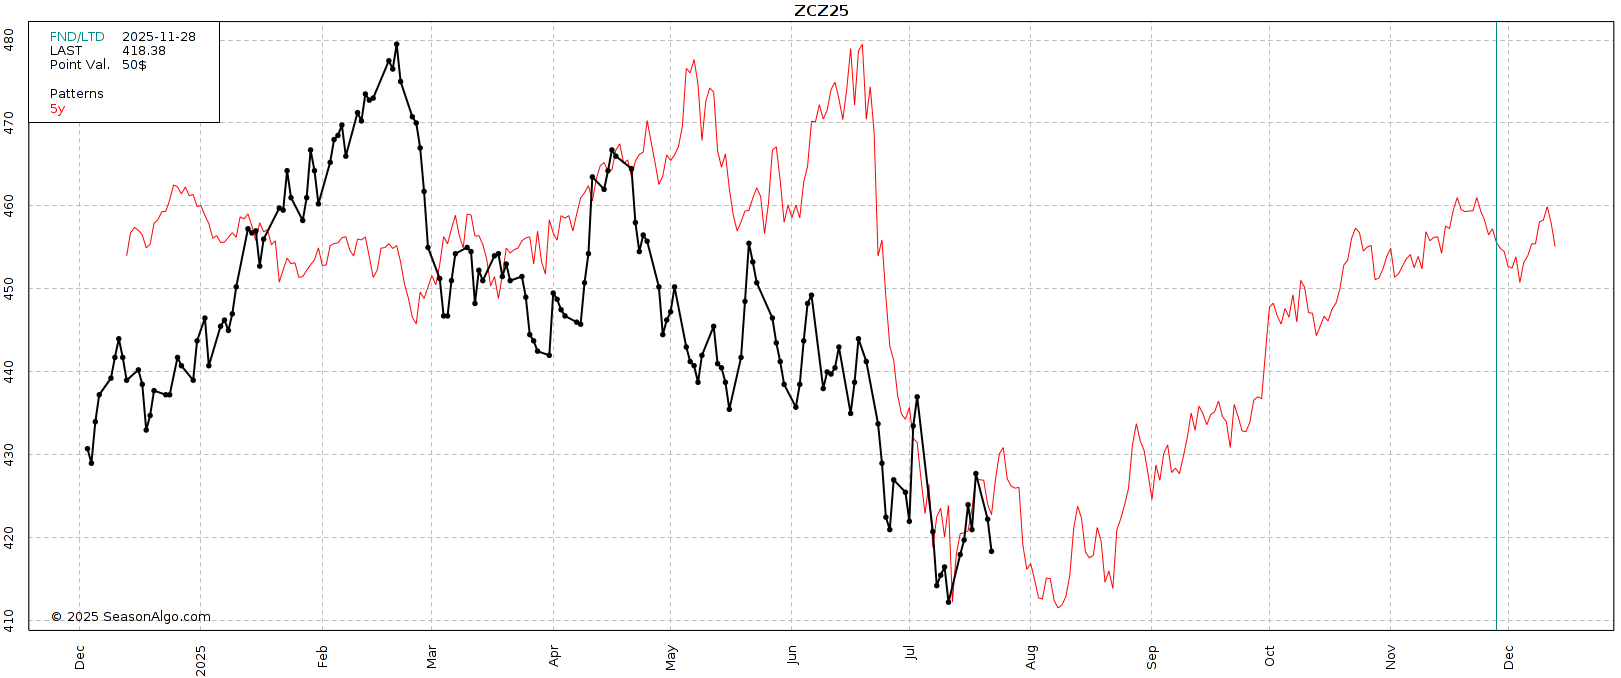
So far corn is following this 5 year seasonal pretty close.
We posted that July low, then got the little July rally, now looking to post that secondary low as head into harvest.
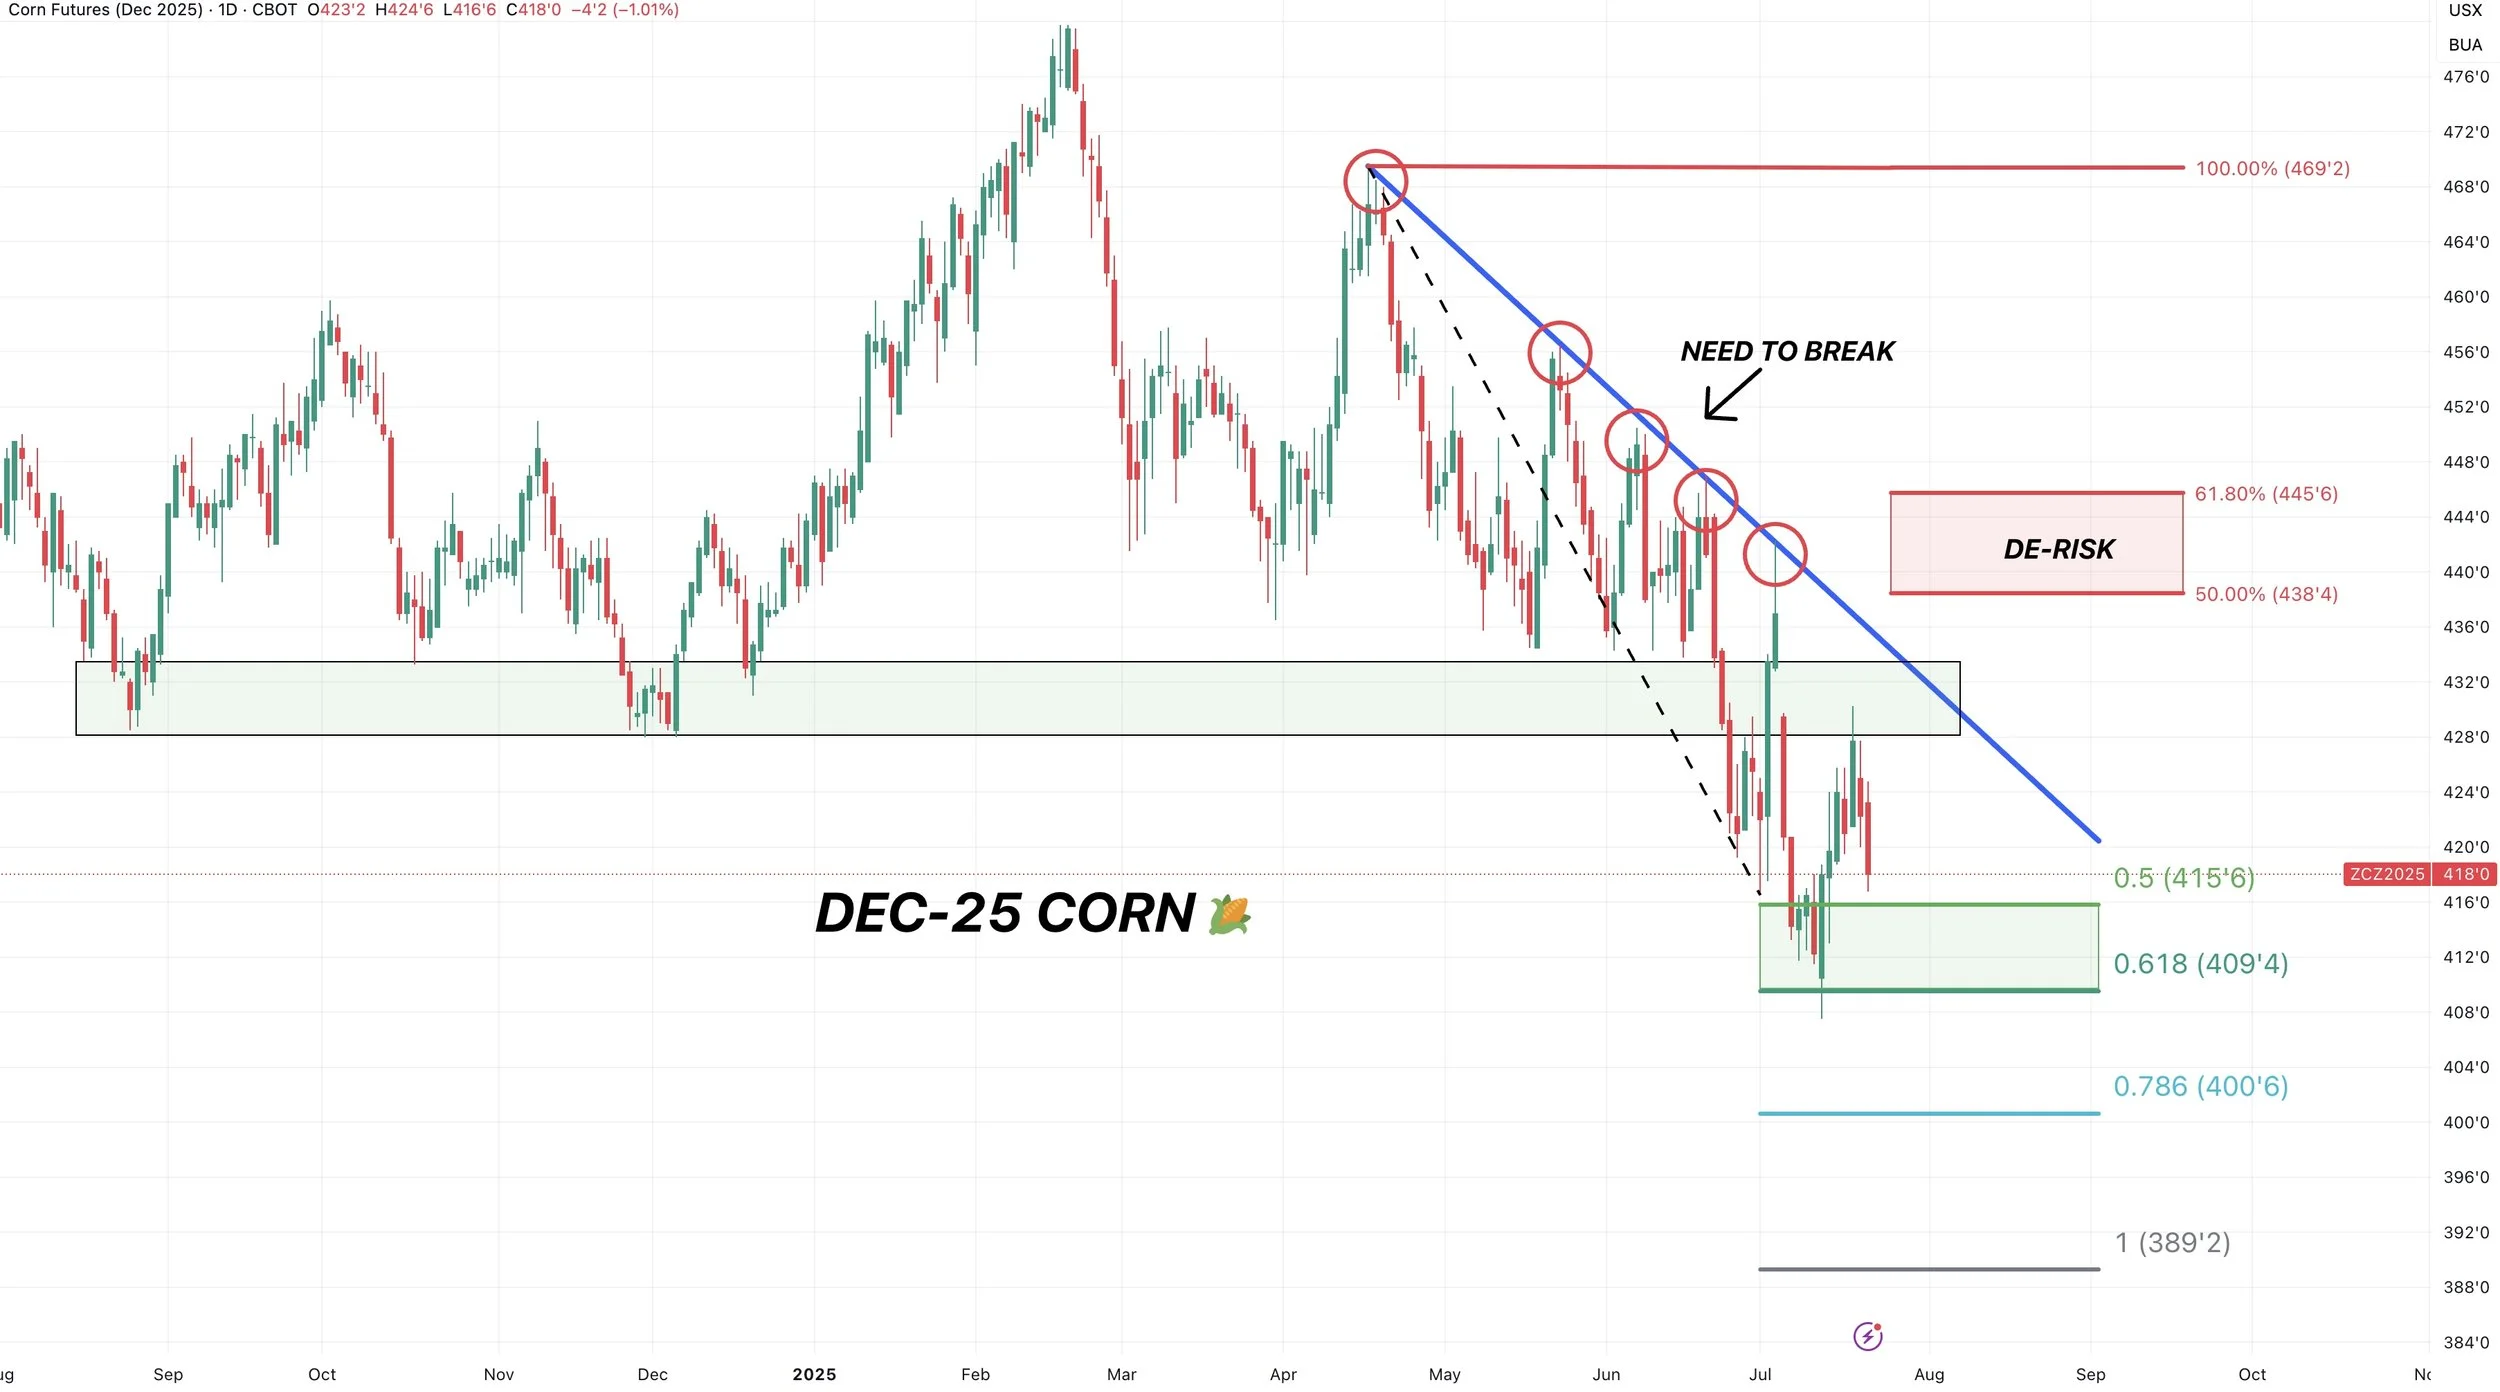
Technicals:
We bounced in that golden fib extension box.
We then came up and rejected that old support from August and December. (Old support is new resistance).
We need to hold $4.09 or we probably fall to $4.00, as that is the next fib extension lower.
To get excited we need to break that downtrend.
For me to want to de-risk I still need to see $4.38 to $4.45. That gives back 50-61.8% of the April highs. Targets don’t have to hit, they are there to let you know to de-risk if they hit.
Soybeans
Fundamentals:
I've went over countless times about how the US soybean crop has zero room for error, and how a slight miss to yield could make the US bean balance sheet razor thin. So we'll save that for another day.
The biggest unknown besides yield is going to be China.
Do we get a deal or not?
This is the biggest potential negative risk out there for soybeans. That we don’t come to a deal and China doesn’t buy any soybeans.
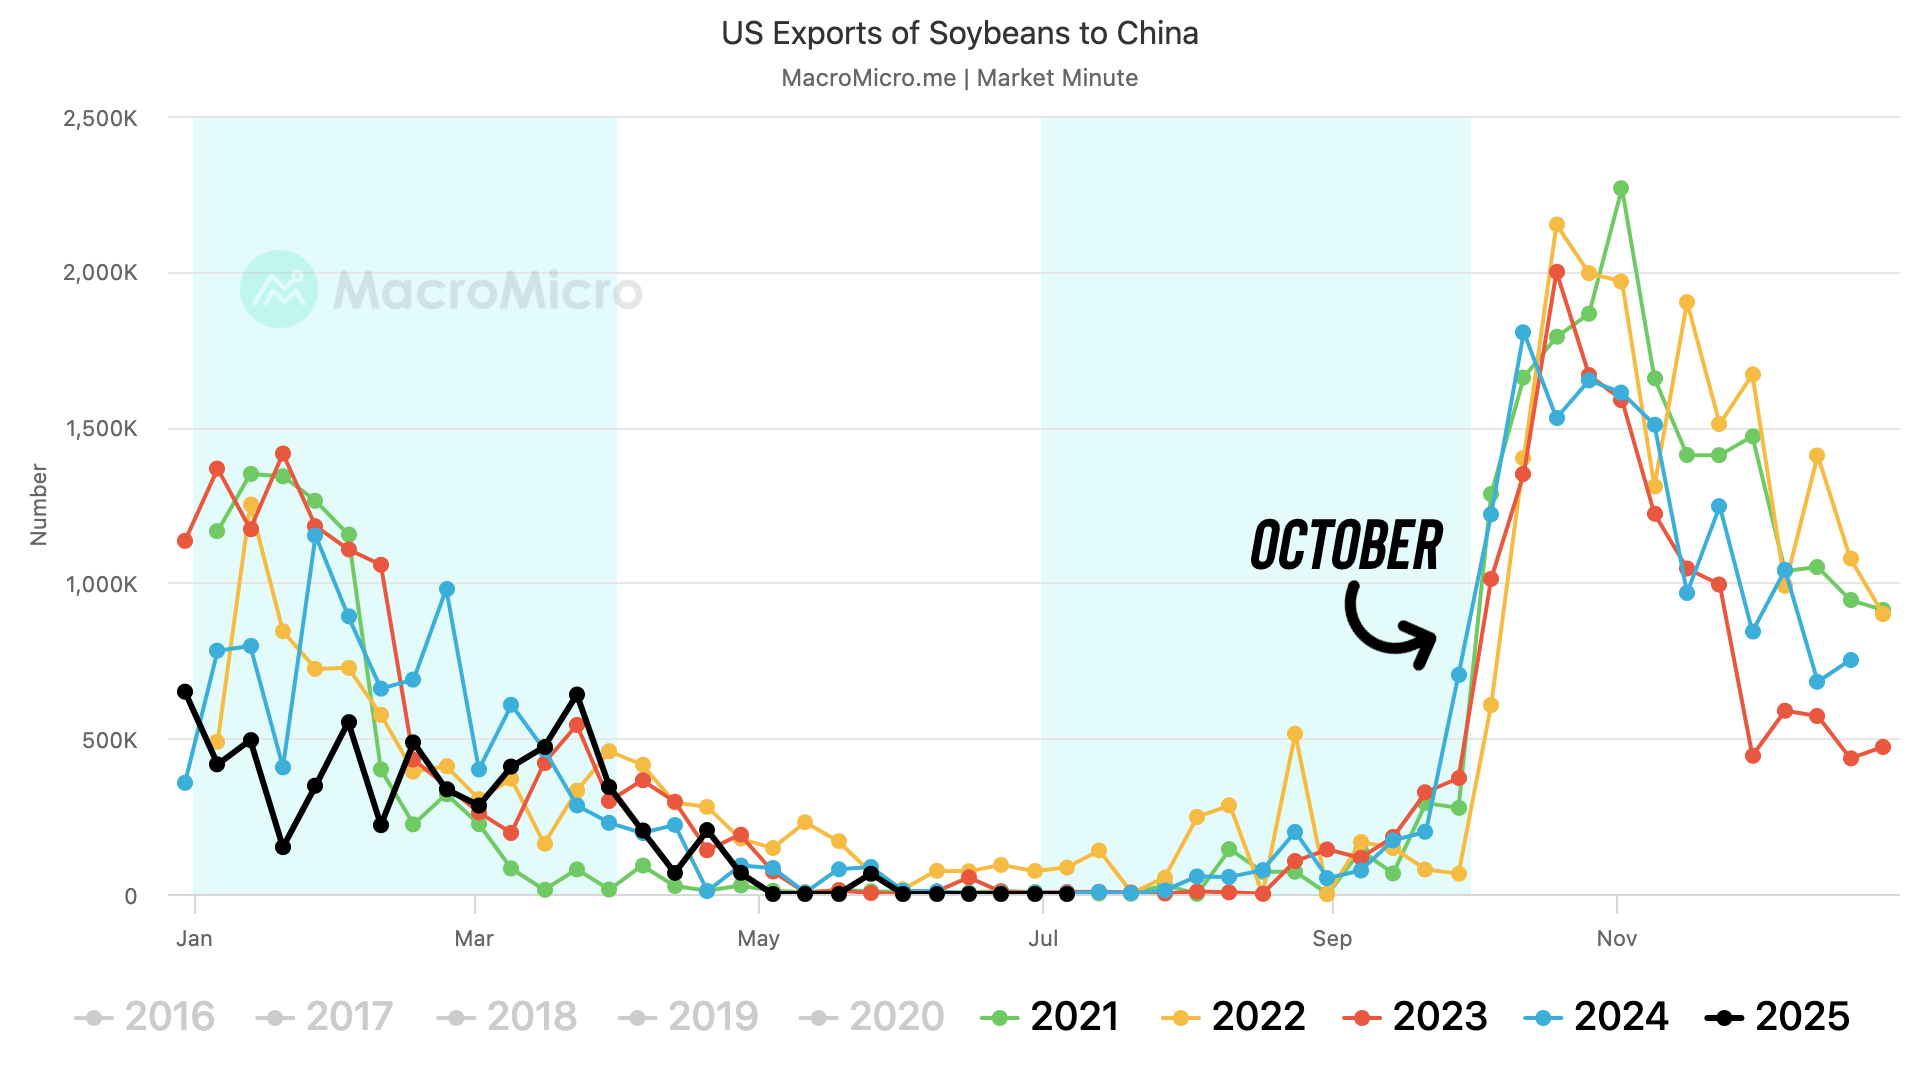
It might not matter today because seasonally China doesn’t buy beans anyway, but we absolutely need a deal made by October.
That is when China buys a ton soybeans. So the clock is slowly ticking for a deal to be made.
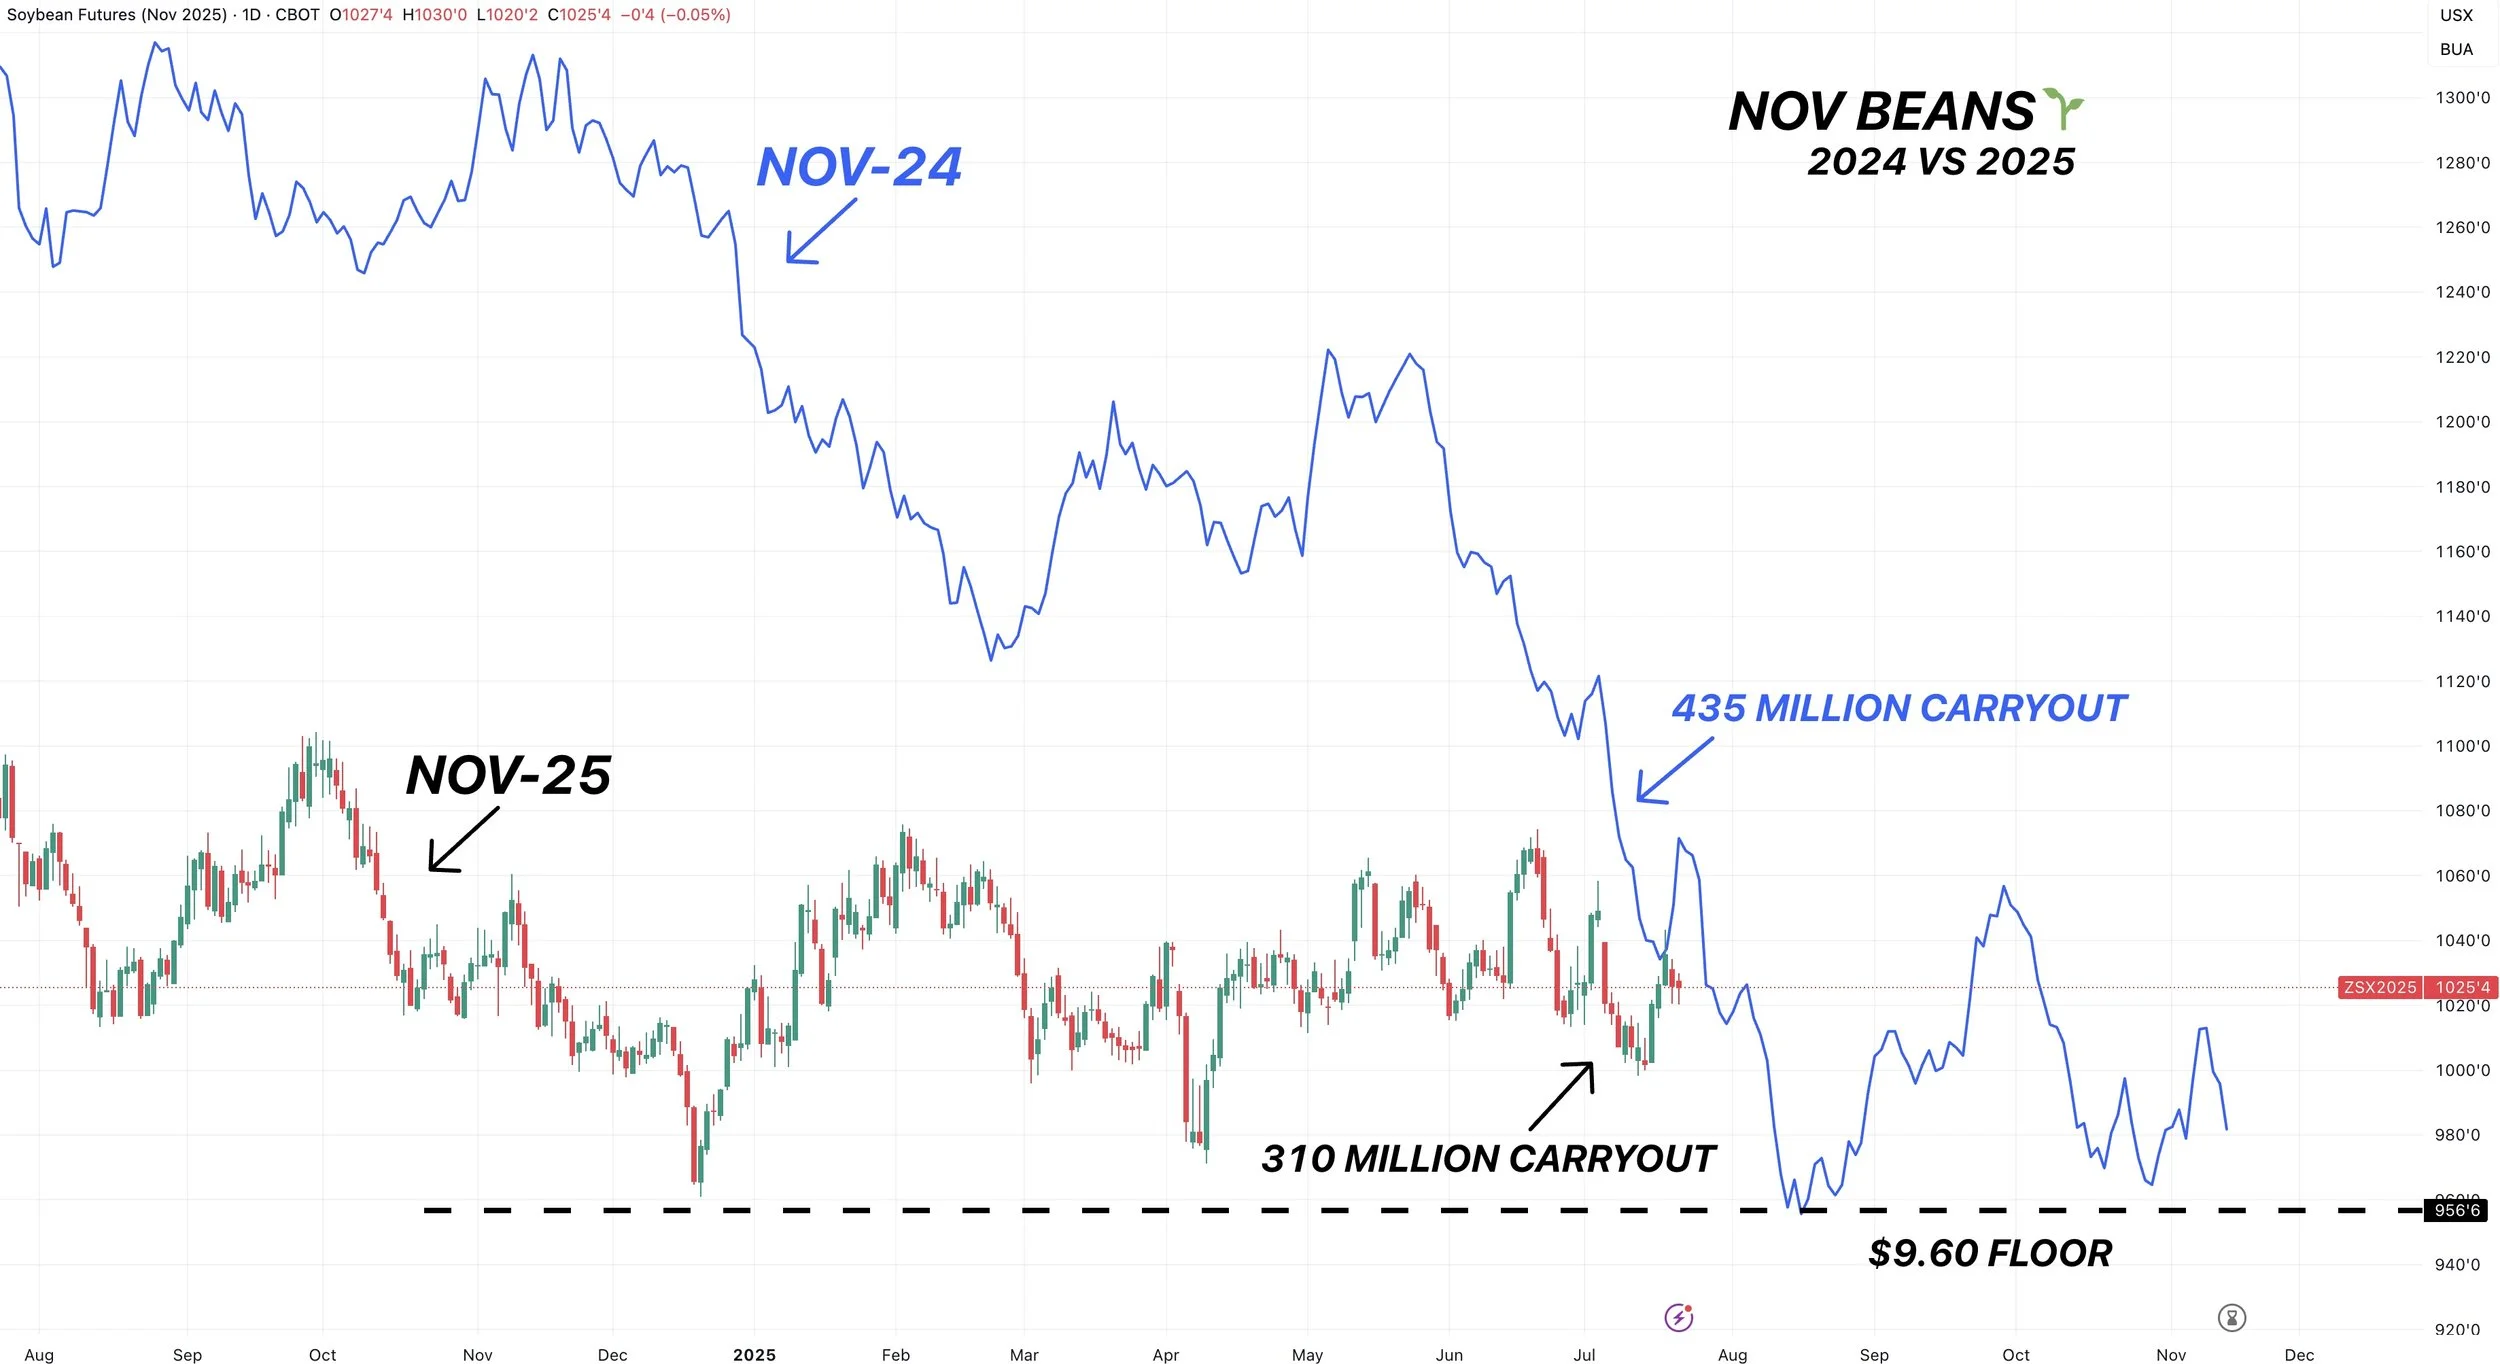
Let's look at a big picture chart.
Our lows last year? $9.60
Our highs during the trade war? $9.60
Another example of where old resistance is becoming our new support.
So I do not think soybeans below the $9.60 lows of last year and at trade war levels would be justified.
We've been trapped between $9.60 and $10.75 for nearly a year now.
$10.75 was our resistance during the 6 year long bear market.
If we ever get a sustained move above $10.75 that will be the first indication that this bear market might be over.

Another reason why soybeans sub $9.60 wouldn’t be justified is the fact that our absolute lows last year were $9.60
Yet compared to last year our carryout is significantly tighter.
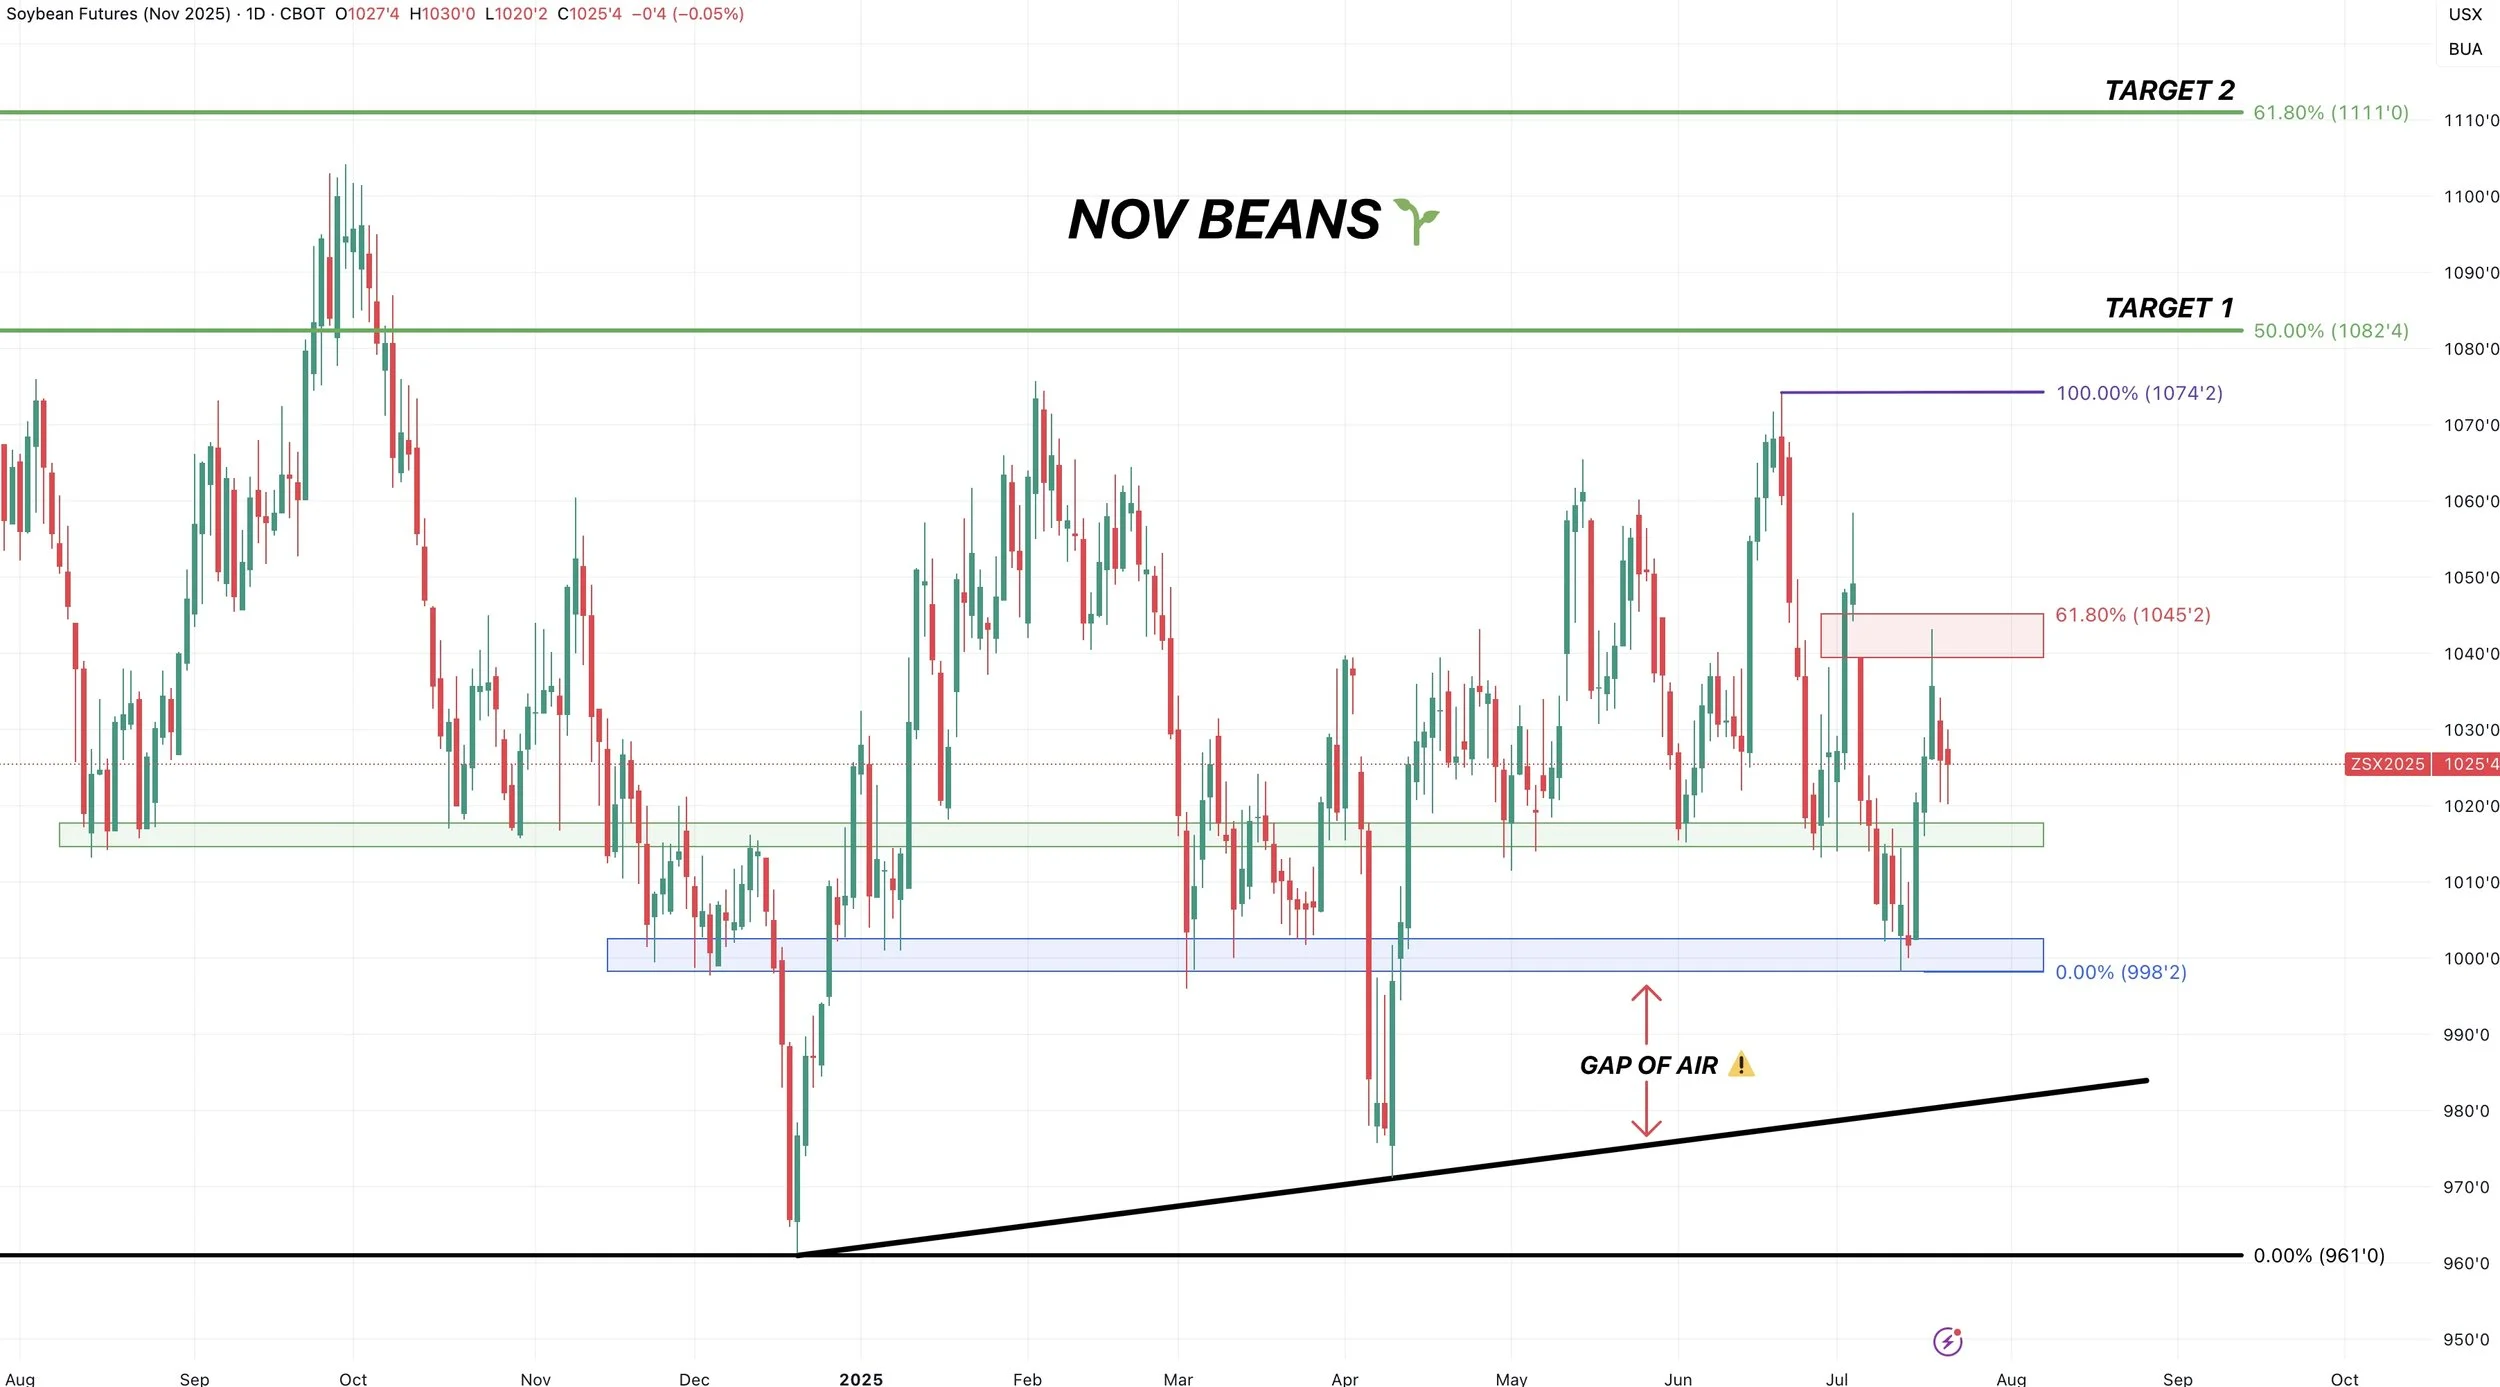
Technicals:
Last week we talked about how if we got up to this red box there was a decent chance we could reject it.
Why?
This red box was 61.8% of the June highs. The most common retracement level.
It was also that gap we left from the 4th of July. We missed the complete gap fill by 1 cent. But gaps act as magents.
To the upside, if we break above that 61.8% level and the gap odds are we then go higher.
To the downside, we have a few support levels.
If the green box fails, we drop to the blue box. If the blue box fails, we drop all the way down to that black trendline.
So that blue box is what bulls really want to hold, as there is a gap of air beneath it.
One friendly thing I see in Nov beans is a potential bull flag.
Here is the 4 hour chart.
The implied move for this would take you back up near those June highs.
Need a breakout for confirmation.

Wheat
Fundamentals:
The biggest news surrounding the wheat market was export inspections yesterday.
We saw massive numbers which was friendly.
It was the largest for the week since 2008 and the largest of any week since September 2022.
If this continues it could be a path to a less bearish US balance sheet in wheat, but would take more weeks like this one.
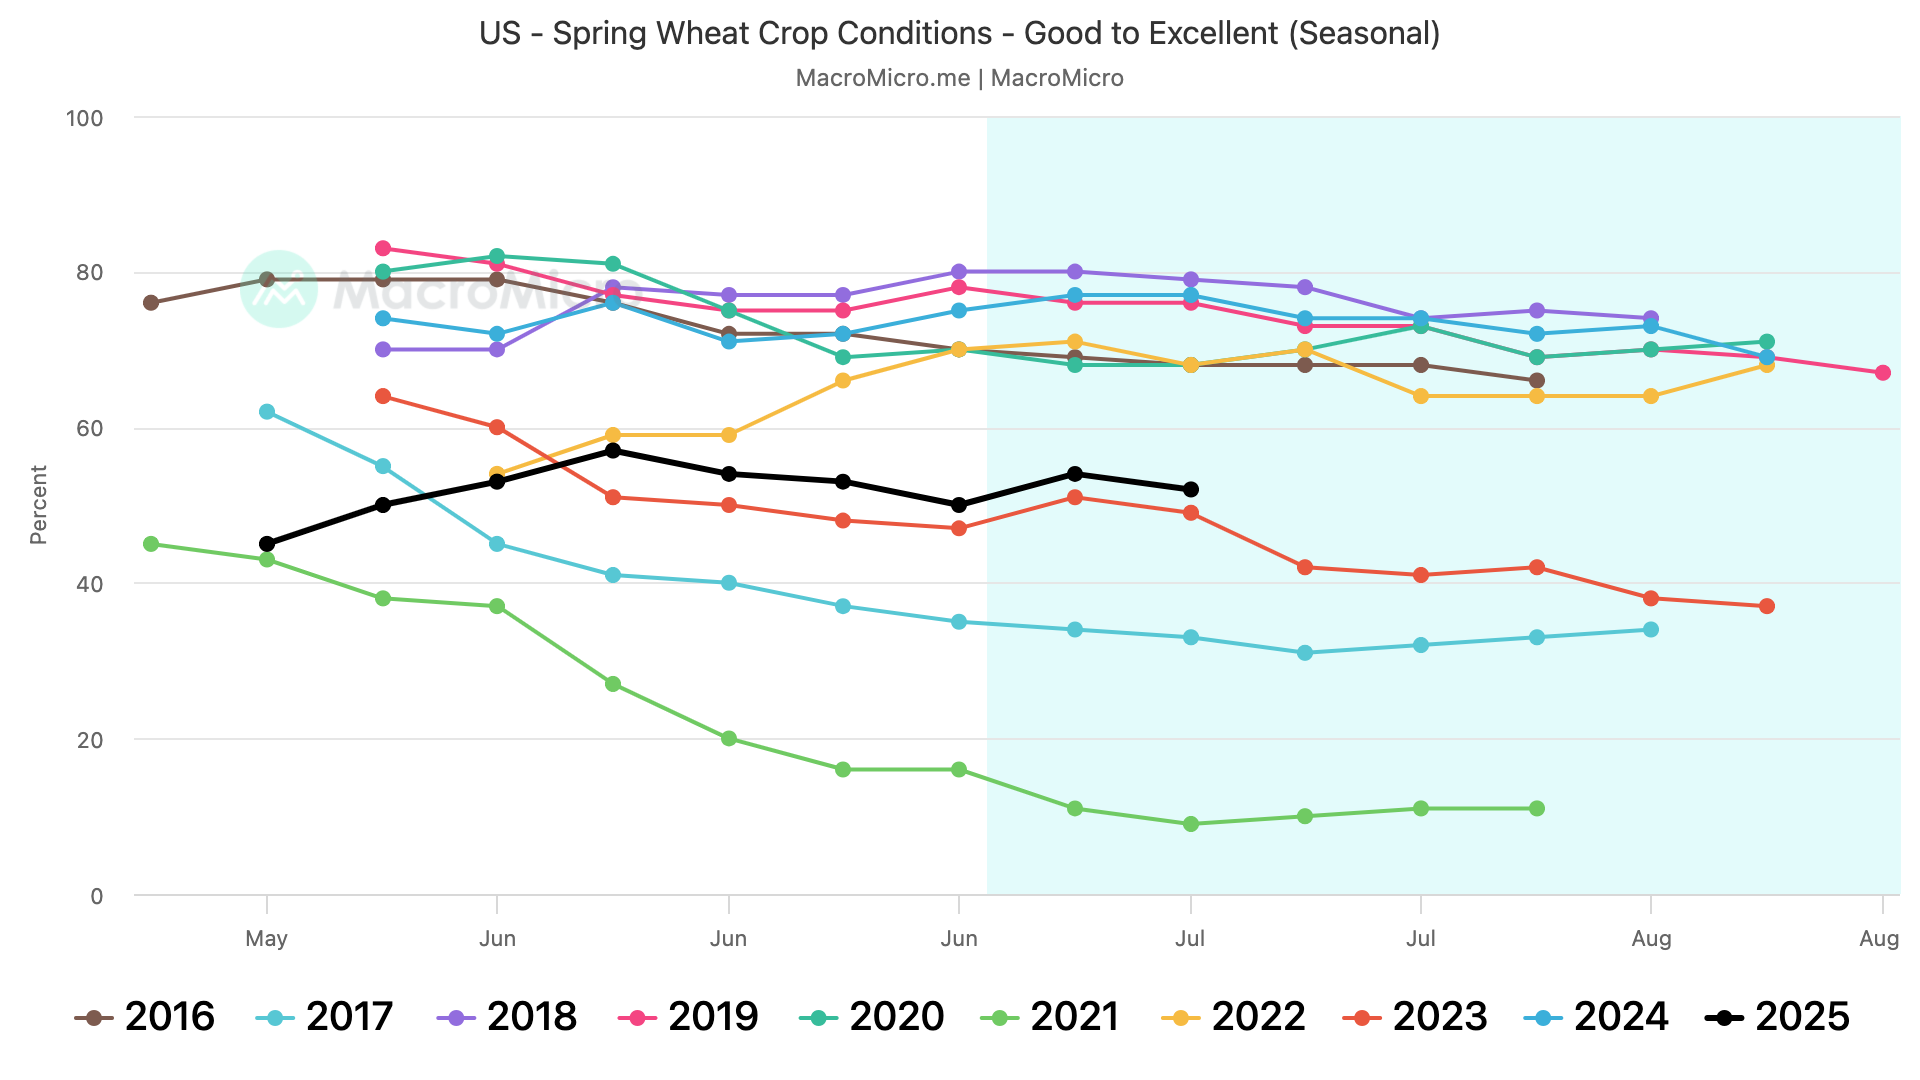
Chart from Karen Braun

Spring wheat ratings are the 4th worst of the past decade and were lowered last week.
(Better than 2023, 2021, and 2017)
There isn’t a huge issue but something to keep your eye on.
Here is the funds KC wheat position.
They are still holding one of their shortest positions of all time, but now that winter wheat harvest is wrapping up they shouldn’t have much of a reason to continue pounding the shorts.

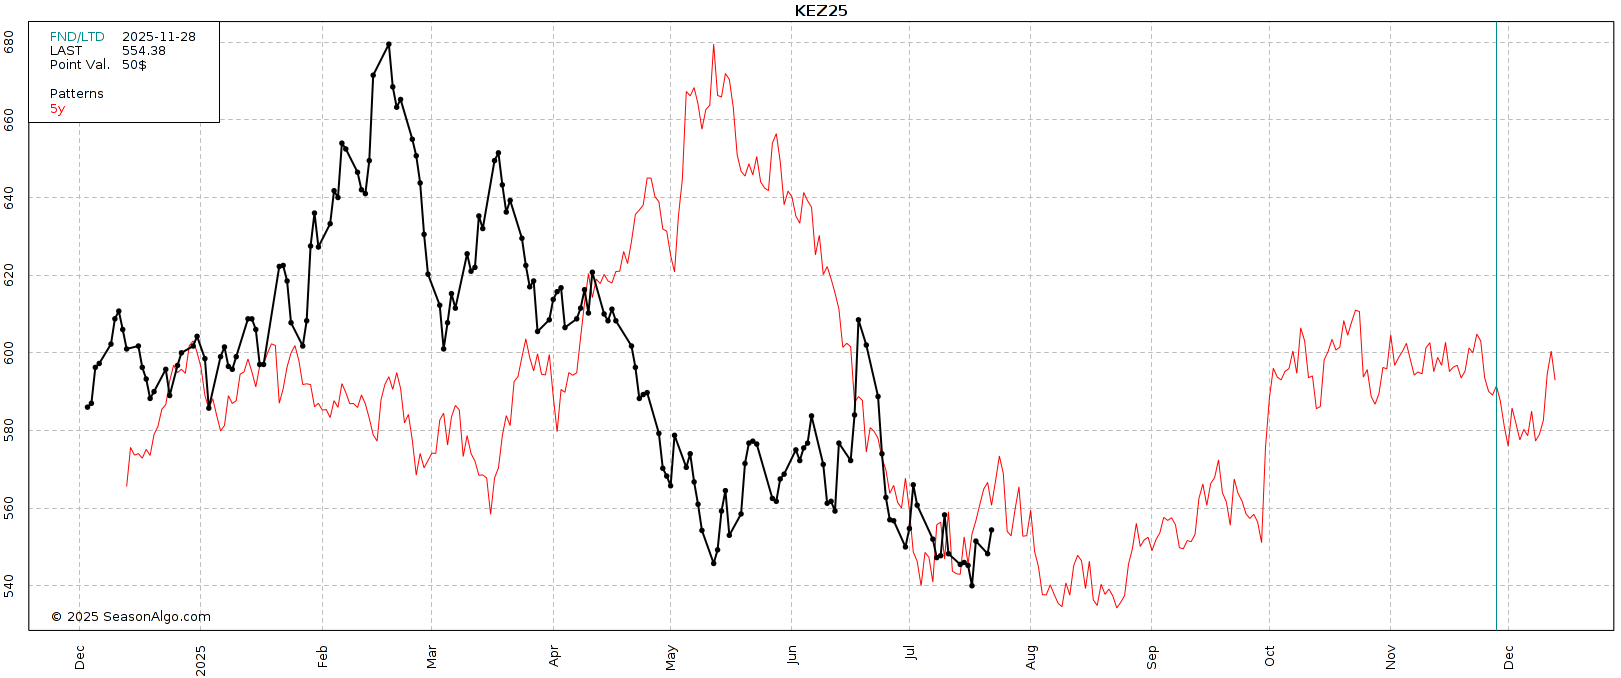
Seasonally we carve out some meaningful lows over the next month or so.
Here is KC wheat's 5 year seasonal.
Technicals:
Today Sep wheat posted a bullish engulfing candle.
Where we engulfed all of yesterday’s price action. Positive sign.
Still eyeing $5.83 to $5.98 to de-risk.
(Scroll to check out Dec wheat)

Here is a 4 hour chart of Dec wheat.
We broke out of this wedge (bullish).
We now have resistance at $5.72. Which is the 23.6% retracement level up the February highs.
Resistance #2 is $5.89 which is the next fib level up to those Feb highs. Which is 38.2%.
Our target to de-risk is $6.04 to $6.18. Which is the 50-61.8% levels.
If you notice, we tend to respect these fib levels.
As we rejected the 38.2% level several times. The one time we broke above it, it resulted in a spike to nearly the 61.8% level. So if we break that 38.2% level I think it would indicate higher prices ahead.

Cattle
Seasonal:
Here is a seasonal pattern to consider in cattle.
Every seasonal says we top out soon.
It feels like this market is a train that can’t be stopped, but this is something we have to be aware of as we seasonally head lower into August.

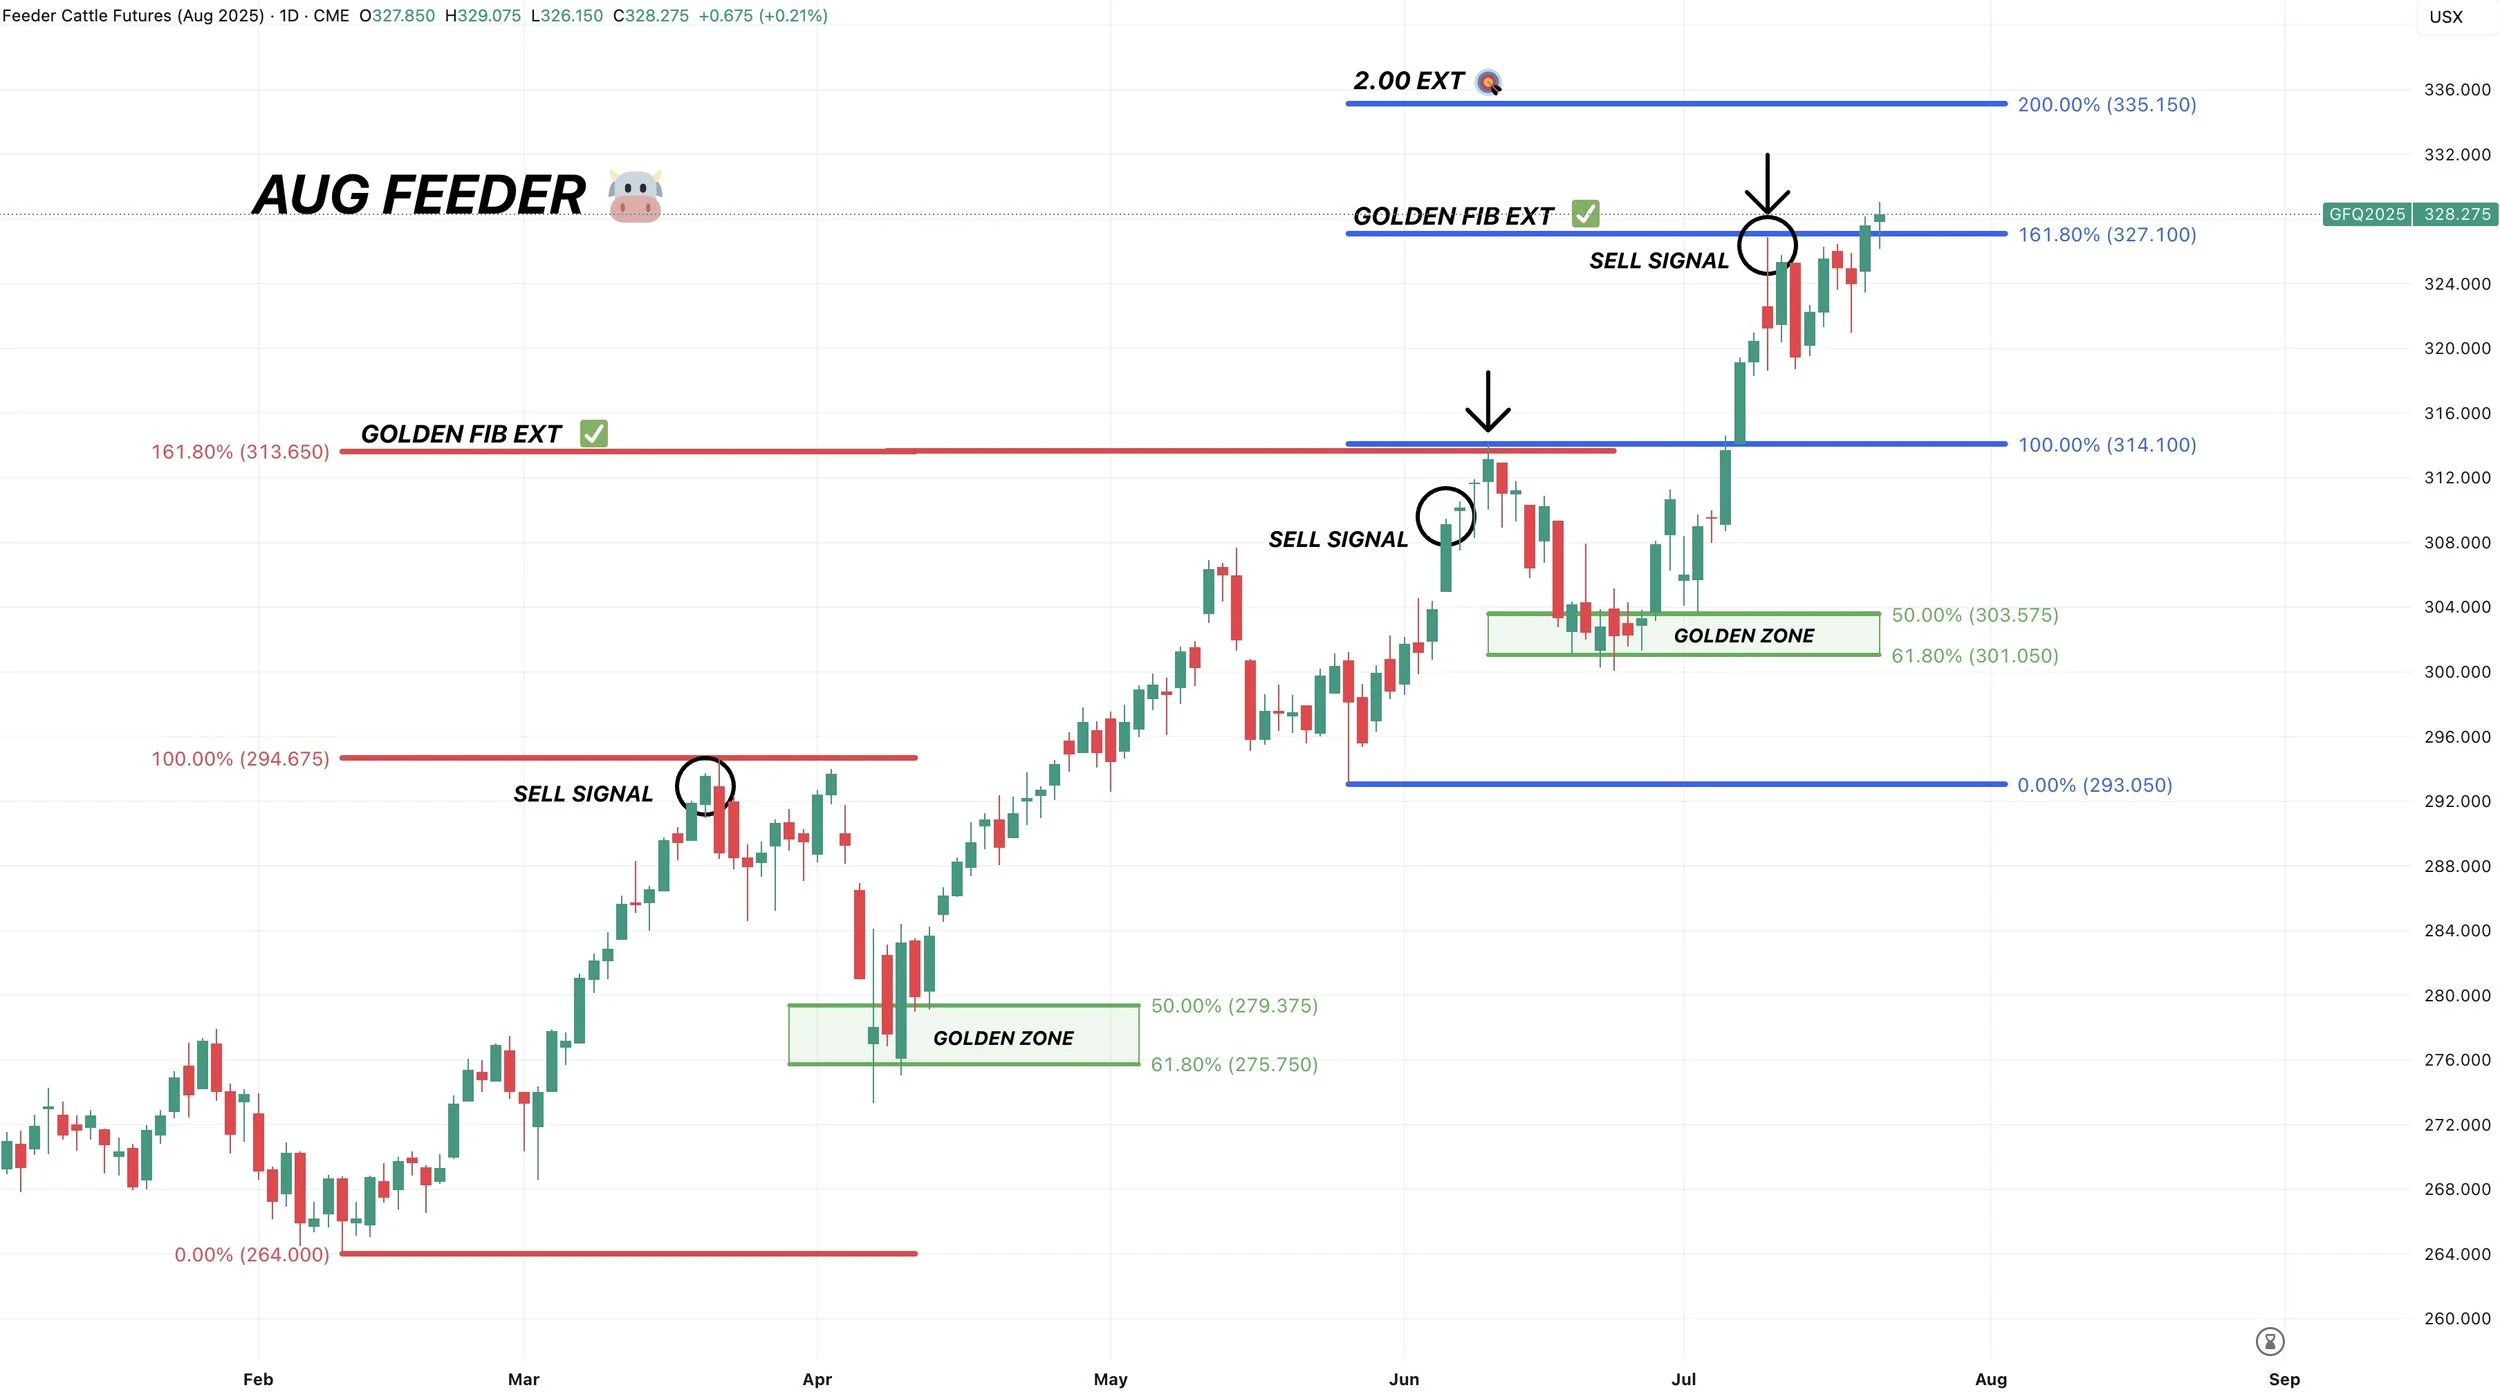
Technicals:
Feeder cattle is now above that golden fib from the June rally. (Target equals 161.8% of the June rally)
Our next target is going to be the 200% fib. Which sits at 335.
The golden fib for August live cattle still sits at 229. Which is our target.

Past Sell or Protection Signals
We recently incorporated these. Here are our past signals.
July 10th: 🐮
Cattle sell signal & hedge alert.
CLICK HERE TO VIEW
June 5th: 🐮
Cattle sell signal & hedge alert.
June 2nd: 🌾
MPLS wheat sell signal.
April 10th: 🌽
Old crop corn sell signal.
March 19th: 🐮
Cattle hedge & sell signal.
Feb 18th: 🌽 🌾
Old crop KC wheat & old crop corn signal.
Jan 23rd: 🌽 🌱
Corn & beans old crop sell signal.
CLICK HERE TO VIEW
Jan 15th: 🌽 🌱
Corn & beans hedge alert/sell signal.
Jan 2nd: 🐮
Cattle hedge alert at new all-time highs & target.
Dec 11th: 🌽
Corn sell signal at $4.51 200-day MA
CLICK HERE TO VIEW
Oct 2nd: 🌾
Wheat sell signal at $6.12 target
Sep 30th: 🌽
Corn protection signal at $4.23-26
Sep 27th: 🌱
Soybean sell & protection signal at $10.65
Sep 13th: 🌾
Wheat sell signal at $5.98
May 22nd: 🌾
Wheat sell signal when wheat traded +$7.00
Want to Talk?
Our phones are open 24/7 for you guys if you ever need anything or want to discuss your operation.
Hedge Account
Interested in a hedge account? Use the link below to set up an account or shoot Jeremey a call at (605)295-3100.
Check Out Past Updates
7/21/25
RAIN MAKES GRAIN
7/18/25
OVERNIGHT HEAT & ROOM FOR ERROR
7/17/25
POOR CORN EXPORTS MATTER? REWARD BEAN BOUNCE?
7/16/25
ARE CORN & BEANS UNDERVALUED OR NOT?
7/15/25
NEGATIVE NEWS POSITIVE ACTION IN GRAINS
7/14/25
DON’T GIVE GRAIN AWAY
7/11/25
USDA FRIENDLY CORN. MARKET DOESN’T CARE
7/10/25
JULY USDA OUT TOMORROW
7/10/25
CATTLE HEDGE ALERT & SELL SIGNAL
7/9/25
MARKET SEES RECORD CROPS
7/8/25
MONSTER CORN YIELD..?
7/7/25
TRUMP PUMP & DUMP
7/3/25
CORN & BEANS REJECT KEY SPOT. TRUMP SPEAKS IN IOWA
7/2/25
TRADE DEALS? BEANS RALLY AT GOLDEN ZONE
7/1/25
NOW WHAT FOR GRAINS?
6/30/25
BORING USDA. DIDN’T SAY HAVE TO GO LOWER
6/30/25
USDA NUMBERS
6/27/25
ALL EYES ON MONDAY
6/26/25
FIREWORKS OR BLOOD BATH MONDAY?
6/25/25
GRAINS COLLAPSING AHEAD OF JUNE REPORT
6/24/25
CORN CONTINUES SELL OFF. MAJOR USDA REPORT COMING
6/23/25
CORN CAN GO LOWER, BUT NOT FOR FOREVER
6/20/25
WHO SHOULD REWARD THE WHEAT & SOYBEAN RALLY?
6/18/25
COMPLETE CHART BREAKDOWNS
6/17/25
SOYBEANS CONTINUE BREAKOUT. NEARING SELL SIGNAL
6/16/25
CORN HAMMERED. EPA GAME CHANGER IN BEANS?
6/13/25
SOYBEANS RALLY, CHARTS, BALANCE SHEETS & MORE
6/12/25
USDA NON-EVENT. WHAT’S NEXT?
6/11/25
DIVERGENCE & SEASONAL SELL OFF?
6/10/25
BEING PATIENT VS BALANCING YOUR RISK
6/9/25
WHAT IF WE DON’T GET A WEATHER SCARE?
6/5/25
CORN & BEANS HOLDING CRUCIAL SPOTS
6/5/25
CATTLE SELL SIGNAL & HEDGE ALERT
6/4/25
HOW UNKNOWNS IMPACT MARKETING DECISIONS
6/3/25
KEY SPOTS ON THE CHARTS FOR CORN & BEANS
6/2/25
NEW LOWS IN CORN. DE-RISKING MPLS WHEAT
6/2/25
SPRING WHEAT SELL SIGNAL
5/30/25
SEASONAL RALLY STILL IN THE CARDS?
5/29/25
WHAT IS YOUR PLAN IF WE DO NOT RALLY?
5/28/25
ZERO PREMIUM IN THE GRAIN MARKETS
5/27/25
CORN CONDITIONS DISAPPOINT & JUNE OUTLOOK IMPROVES
5/23/25
TARIFFS SPOOK MARKET. GAME PLAN MOVING FORWARD
5/22/25
CHART BREAKDOWNS & TARGETS
5/21/25
RISK TO THE UPSIDE WITH WEATHER?
5/20/25
WHEAT SHORT COVERING & HISTORY OF YIELD CHANGES
5/19/25
ANYONE LEFT TO SELL WHEAT? 181 CORN YIELD POSSIBLE?
5/16/25
FUNDS SHORT CORN. MARKETS WAITING ON WEATHER
5/15/25
BEANS HAMMERED ON RUMOR & WHEAT FINDING LIFE
5/14/25
DECISIONS & POSSIBILITIES IN GRAINS
5/13/25
GRAINS RALLY OFF LOWS
5/12/25
USDA REPORT. HOW THIS CHANGES THINGS
5/9/25
BIGGEST RISKS IN USDA REPORT
5/8/25
USDA MONDAY & HISTORY OF WEATHER RALLIES
5/7/25
NEW 2025 LOWS FOR CORN
5/6/25
WHAT’S A SUMMER RALLY LOOK LIKE?
5/5/25
CORN ERASES ENTIRE APRIL RALLY
5/2/25
SELL INTO UNCERTAINTY. NOT KNOWN FACTORS
5/1/25
THE CASE AGAINST A FEB TOP IN CORN
4/30/25
APPROACHING KEY TIME PERIOD FOR GRAINS
4/29/25
PLANTING & FIRST NOTICE DAY PRESSURE. CORN CLOSE TO BOTTOM?
4/28/25
CAPTURING INVERSE & SEASONAL PREPARATION
4/25/25
HOW OFTEN DOES CORN NOT BREAK APRIL HIGHS?
4/24/25
KNOW WHEN TO SELL. BEANS BREAK 200-DAY FIRST TIME IN 483 DAYS
4/23/25
MONEY FLOW & DROUGHT CARDS
4/22/25
CRUCIAL SPOT FOR CORN & BEANS
4/21/25
NO PLANTING THREAT YET
4/18/25
POTENTIAL OPPORTUNITIES, BASIS CONTRACTS & STRATEGIES
4/16/25
HOW YIELD IMPACTS CARRYOUT. MAJOR SPOT FOR SOYBEANS
4/15/25
TOTAL CHART BREAKDOWNS & TARGETS
4/14/25
TECHNICAL SELLING IN GRAINS
4/11/25
SPECIFIC GRAIN MARKETING DECISIONS
4/10/25
USDA REPORT. HOW THIS IMPACTS CORN
4/9/25
TARIFFS GIVE. TARIFFS TAKE
4/8/25
CORN’S DIVERGING STRENGTH
4/7/25
SOLID PRICE ACTION DESPITE OUTSIDE FEAR
4/4/25
CORN PRICE ACTION SPEAKS VOLUME. ANY HOPE LEFT FOR SOYBEANS?
4/3/25
WHAT IS LEFT FOR CORN BEARS? TRADE WAR: CHARTS HOLDING SUPPORT
4/2/25
SHOULD UNKNOWNS KEEP A FLOOR UNDER GRAIN PRICES?
4/1/25
HOW DO ACRES IMPACT FUTURE OF THE GRAINS?
3/31/25
USDA REPORT: NOW WHAT?
3/28/25
ALL EYES ON USDA
3/27/25
PRE-USDA POSITIONING. DON’T GIVE GRAIN AWAY
3/26/25
HISTORY OF MARCH INTENTIONS. SOYBEANS UNDERVALUED?
3/25/25
6 DAYS UNTIL MAJOR USDA REPORT
3/24/25
HOW TO POSITION YOURSELF BEFORE PLANTING
3/21/25
REASONS TO BE OPTIMISTIC IN GRAINS?
3/20/25
WAS THAT THE BOTTOM IN CORN?
3/19/25
THE PATH HIGHER & THE DOWNSIDE RISKS IN GRAINS
3/18/25
SEASONALS, CATTLE HEDGE, CHARTS & DROUGHT?
3/17/25
WHEAT RALLIES. DON’T GET BACKED INTO A CORNER
3/14/25
MARCH 31ST REPORT THOUGHTS & WHAT’S NEXT FOR GRAINS
3/13/25
EXPLAINING RE-OWNERSHIP VS COURAGE CALLS
3/12/25
TARIFF FEARS. EU, CANADA, & ETHANOL
3/11/25
USDA SNOOZE. RECORD FUND SELLING A CONCERN?
3/10/25
USDA TOMORROW. GETTING COMFORTABLE IN MARKETING
3/7/25
HOW TIGHT IS THE WORLD & US SITUATION?
3/6/25
TARIFFS PUSHED BACK. FUTURE OPPORTUNITIES?
3/5/25
IS GRAINS BIGGEST RISK WEAK CRUDE & DEFLATION?
3/4/25
TRADE WAR BEGINS. 8TH DAY OF PAIN FOR GRAINS
3/3/25
TARIFFS ON TOMORROW. BUY SIGNAL
3/3/25
BUY SIGNAL
2/28/25
WHEN WILL THE BLEEDING STOP?
2/27/25
CORN AT CRITICAL SPOT. USDA ACRE REPORT. WAY TOO EARLY DROUGHT TALK
2/26/25
HISTORY SUGGESTS CORN TOP ISN’T IN? ACRE OUTLOOK TOMORROW
2/25/25
POSITIVE CLOSE. WHAT TO KNOW ABOUT USDA OUTLOOK
2/24/25
USDA OUTLOOK, FIRST NOTICE DAY & BRAZIL
2/21/25
WHAT TO EXPECT MOVING FORWARD IN GRAINS
2/20/25
FIRST NOTICE DAY CONCERNS. MASSIVE CORN ACRES OR NOT?
2/19/25
HOW TIGHT IS THE CORN SITUATION?
2/18/25
MORE DETAILS ON TODAYS SELL SIGNAL
2/18/25
OLD CROP KC WHEAT & CORN SELL SIGNAL
2/14/25
WHEAT BREAKING OUT ON WEATHER RISK. TECHNICALS & FUNDAMENTALS
2/12/25
GLOBAL GRAIN SITUATION, ACRE TALK, CHARTS & MORE
2/11/25
USDA: NOT A BEARISH REPORT. DISAPPOINTING PRICE ACTION
2/10/25
USDA TOMORROW. LONG TERM PATH FOR SUB 10% CORN STOCKS TO USE?
2/7/25
WHY WOULD THE FUNDS EXIT THEIR LONGS?
2/6/25
WHEAT FINALLY CATCHING A BID
2/5/25
COMPLETE THOUGHTS ON MARKETS: BACK & FORTH DISCUSSION
2/4/25
STRONG JANUARY LEAD TO STRONG YEAR? TARIFFS, CHARTS & MORE
2/3/25
TARIFFS PUSHED BACK
1/31/25
TARIFF NEWS ALL OVER THE PLACE. ARE YOU PREPARED FOR POSSIBILITIES?
1/30/25
WHEAT BULL ARGUMENT. TRUMP ADDS TARIFFS
1/29/25
CORN APPROACHES $5.00
1/28/25
TARIFFS, CORN FUNDS, SOUTH AMERICA & MORE
1/27/25
HEALTHY CORRECTION WE TALKED ABOUT & TARIFF NEWS
1/24/25
GRAINS DUE FOR SHORT TERM CORRECTION?
1/23/25
OUR ENTIRE NEW CROP SALES THOUGHTS & OLD CROP SELL SIGNAL
1/22/25
GRAINS TAKE A BREATHER. IS CORN IN A BULL OR BEAR MARKET?
1/21/25
HUGE DAY IN GRAINS. WHAT TO DO WITH OLD CROP VS NEW CROP
Read More
1/20/25
VIDEO CHART UPDATE
1/17/25
TRUMP, CHINA, ARGY & USING THE SPREADS INVERSE
1/16/25
OLD CROP LEADS US LOWER. MARKETING THOUGHTS
1/15/25
SIGNAL & HEDGE ALERT QUESTIONS EXPLAINED. IS $6 CORN EVEN POSSIBLE?
1/14/25
MORE DETAILS ON TODAYS HEDGE ALERT & SELL SIGNAL
1/14/25
CORN & SOYBEANS HEDGE ALERT/SELL SIGNAL
1/13/25
USDA GAME CHANGER OR NOT?
1/10/25
BULLISH USDA FOR CORN & BEANS
1/9/25
USDA OUT TOMORROW
1/8/25
2 DAYS UNTIL USDA. BE PREPARED
1/7/25
THE HISTORY OF THE JAN USDA & MORE
1/6/25
MAJOR USDA REPORT FRIDAY
Read More
1/3/25
UGLY DAY ACROSS THE GRAINS
1/2/25