
OVERNIGHT HEAT & ROOM FOR ERROR
MARKET UPDATE
You can scroll to read the usual update as well. As the written version is the exact same as the video.
Timestamps for video:
Weather: 0:00min
Inflation Play: 1:50min
Corn: 3:30min
Beans: 7:30min
Wheat: 10:00min
Cattle: 10:45min
Want to talk about your situation?
(605)295-3100
Futures Prices Close

Overview
Grains higher across the board with some short covering ahead of the weekend.
Biofuel optimism rallied soybean oil to 2 year highs early in the day which supported beans, but then oil reversed lower and resulted in beans falling off their early highs. Closing -8 cents off their highs.

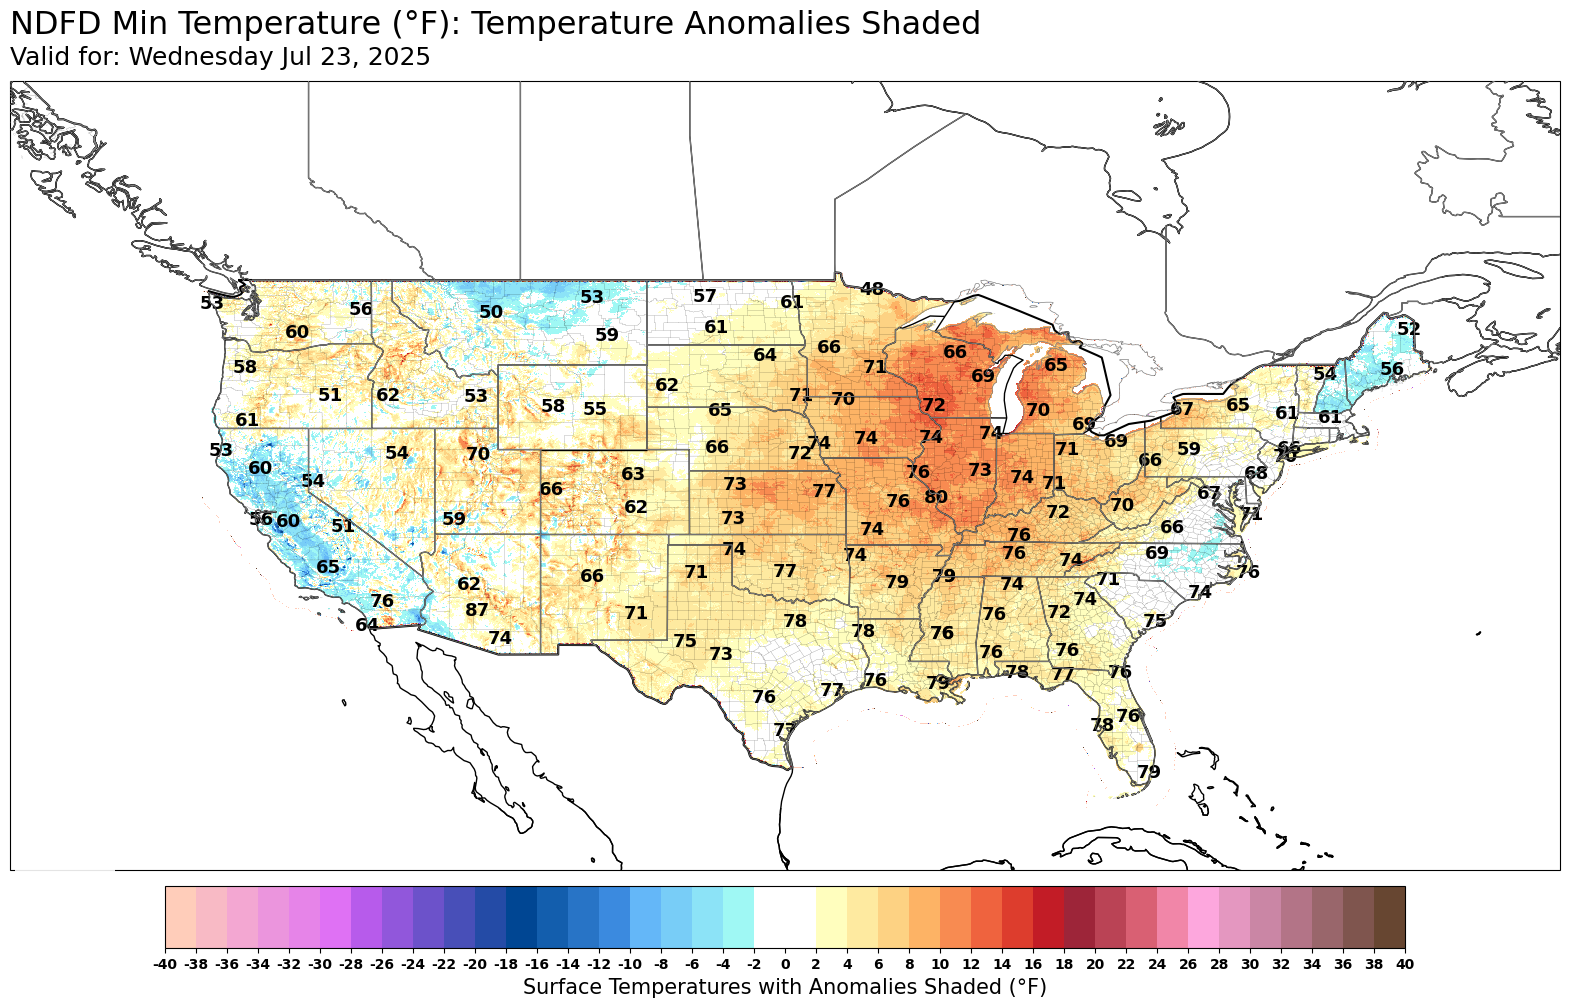
The main headline was heat.
Overnight heat to be specific.
Here is next Wednesday's max temps vs minimum temps.
Overnight heat is more damaging to yield. So the market is taking note and giving us a reason to go a little higher here.
Typical rule of thumb is that sustained overnight temps of 70-75 degrees can impact yield.
Max Temps

Min Temps
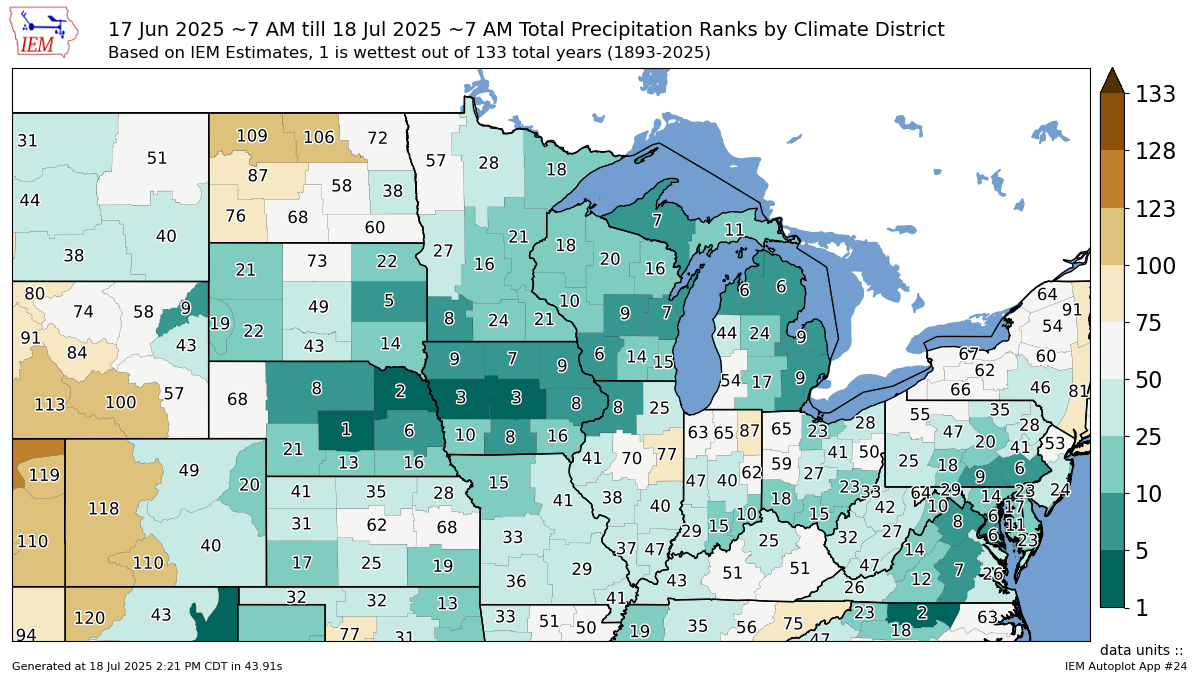
If we look at precipitation, here is the next 10 days.
Extremely wet.
Some would say some areas might be getting too much rain.
Moisture isn’t a concern. The market's only concern is that overnight heat.
Past 30 Days
Here is how the past 30 days stack up vs history.
First precip. It's been incredibly wet for most. Especially Iowa and surrounding areas.
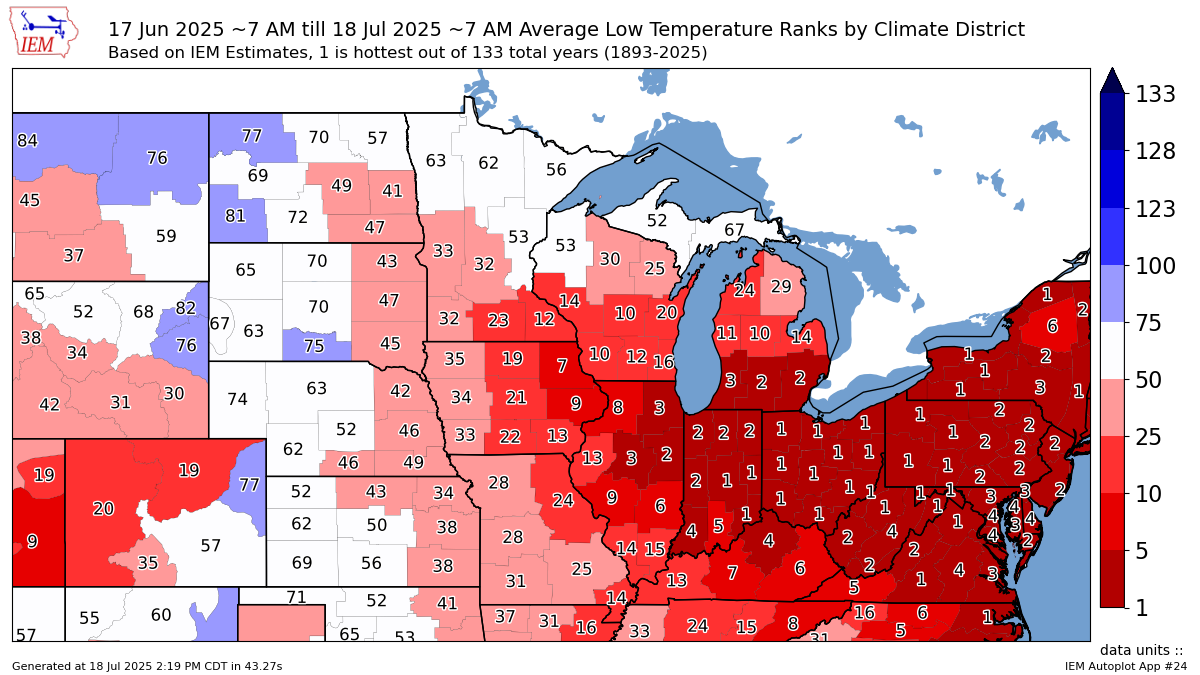
Now here is overnight heat ranks for the past 30 days.
It has been incredibly hot overnight for most of the corn belt.
I'm not an agronomist.
Rain makes grain. But it's hard to think this type of overnight heat screams massive unheard of yields.
Could Grains Be An Inflation Play?
I've talked about this for several weeks now.
But I'm still standing behind this thought process.
I also added soybeans to this chart to give you guys a good visual.
Why isn’t corn higher if old crop carryout is the 3rd tightest on record?
Aside from the perception of a big crop coming. As silly as it may seem, the simple answer very well could be interest rates and inflation.
Just look at this chart that shows corn & soybean prices, the feds decisions on rate hikes & rate cuts, and the inflation rate.
When we see rate cuts, it leads to higher inflation. Which supports higher prices for commodities and grains and increases demand.
This happened back in 2020. (Altough yes we had all of that Chinese demand etc).
We saw our very first rate cuts since 2020 last fall and inflation started rising. What happened? Corn posted it's longest and largest rally of the entire bear market.
When we see rate hikes, it leads to less inflation and less demand and supports lower prices for commodities and grains.
Is it a coincidence that when the feds raised rates at the most aggressive pace in history back in 2021-2022 it marked the highs of the bull market and start of the bear market as inflation cooled?
This isn’t a factor that is going to make grains rally tomorrow.
But Trump is set on cutting rates further, and if that happens I don’t see why grains couldn’t follow inflation higher.
I don’t think the funds truly get behind this market until the feds start to cut rates again. Which "could" happen this fall.
The funds push this market around and they follow dumb stuff like this.

Todays Main Takeaways
Corn
Fundamentals:
I showed this chart on Wednesday, but this is again what I wanted to lead off.
If you compare this year vs last year, corn is the same price.
Yet... carryout is down -330 million bushels in comparison.
Dec-25 in July = 1.67 billion
Dec-24 in July = +2.00 billion
Why is this?
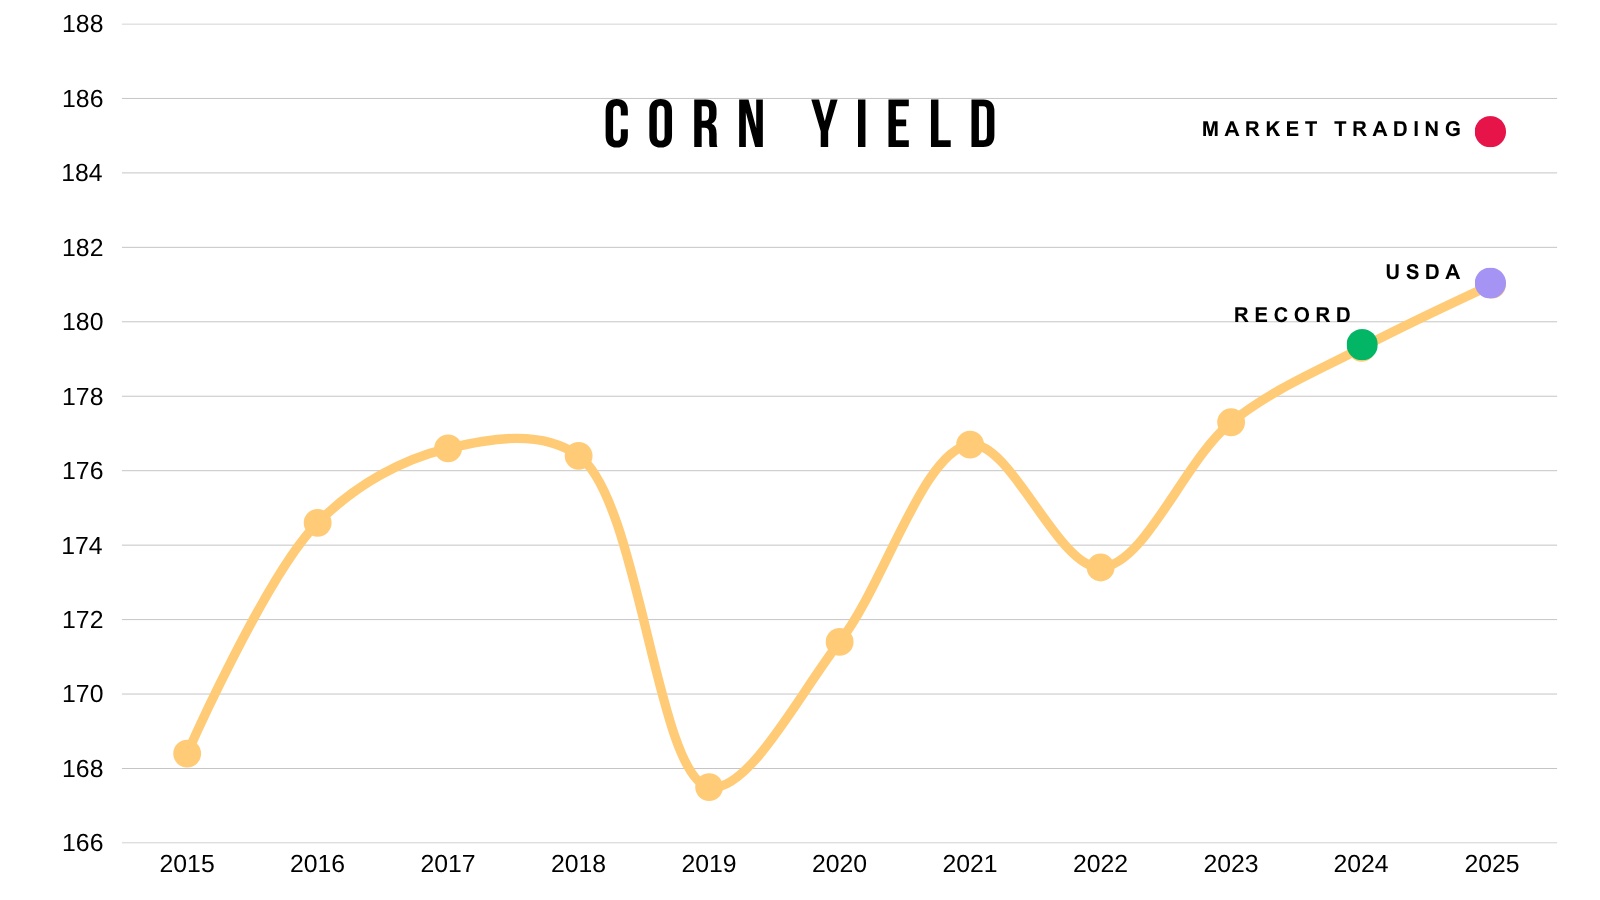
The market is pricing in a yield far above trendline. With a carryout closer to 2 billion than the current 1.67 estimates.

Now let's look at balance sheet scenarios.
(With no changes to demand).
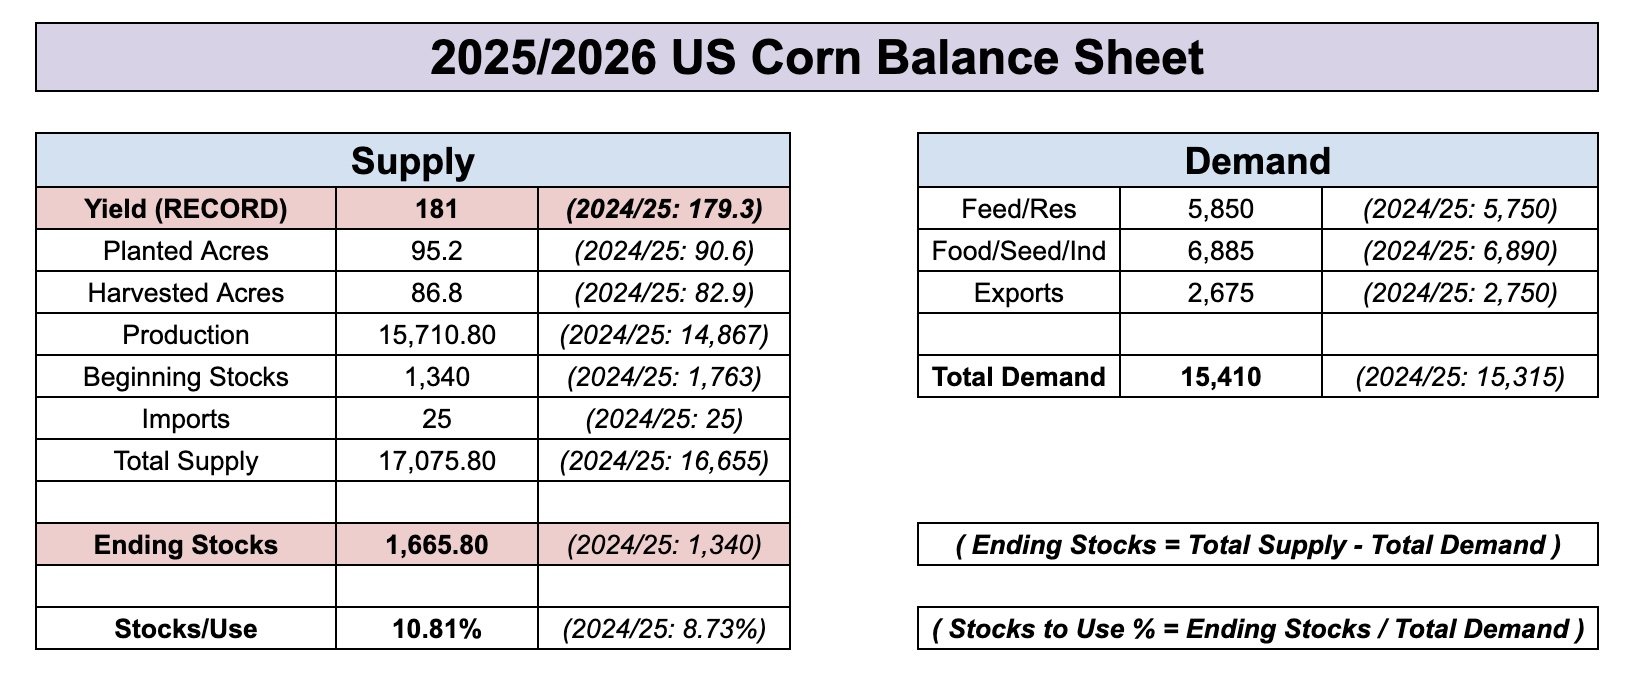
Here is the current balance sheet.
Yield = 181
Carryout = 1.67 billion
Now here is if yield was 183.
Carryout = 1.84 billion
That still doesn’t give us 2 billion.
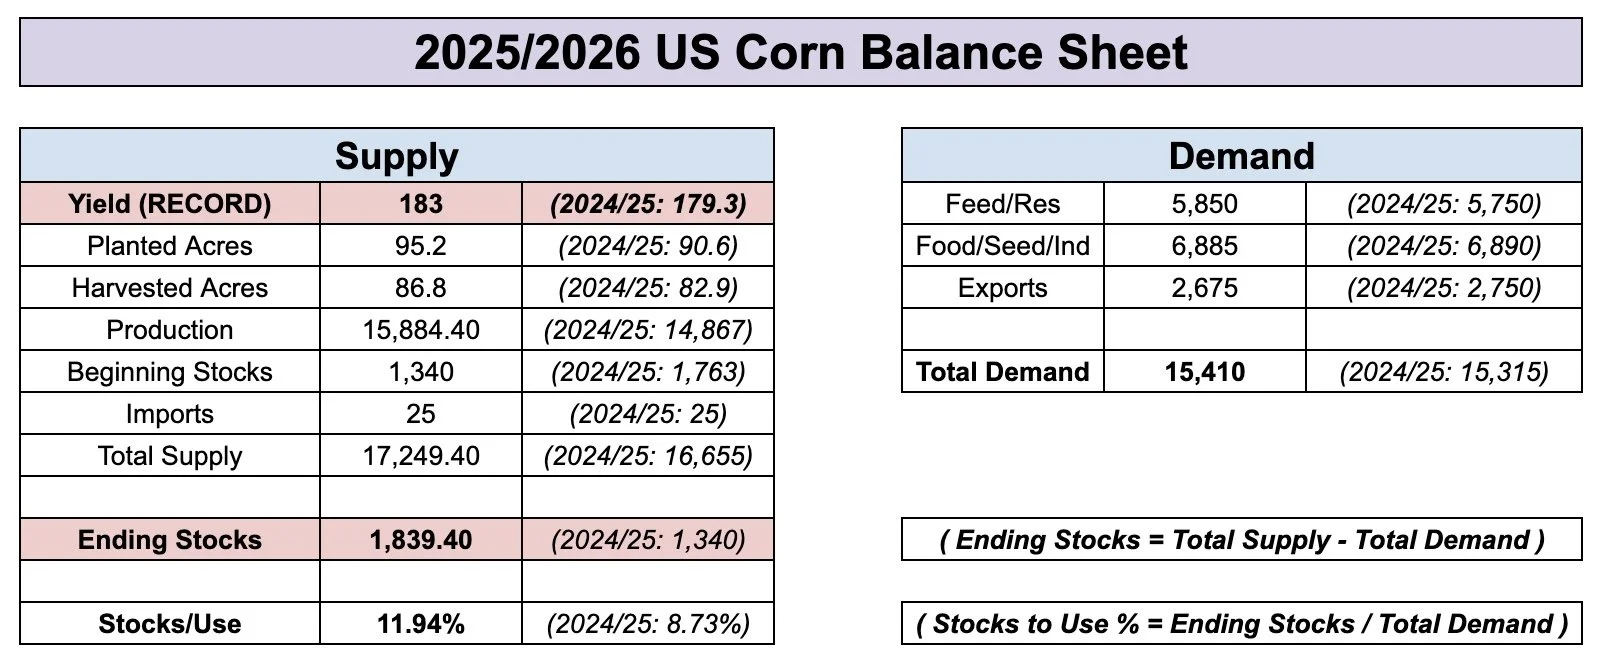
Here is a 185 yield.
Carryout = 2.00 billion
Which means that the market is at the very least probably pricing in a 185 yield.
If this happened, the USDA would offset some of the increased production by increasing demand.
So it would take over a 185 yield to hit a 2 billion bushel carryout.

It seems like no one thinks a yield below 181 is possible right now.
But this is how a yield of 179.3 (the same as last year) could impact the balance sheet.
Demand would offset some of this, but we get a carryout around 1.5 billion and a stocks to use around 10% which is considered bullish.
There is plenty of growing season left. Where yield actually comes in at will have a major impact on the balance sheet.

Seasonals:
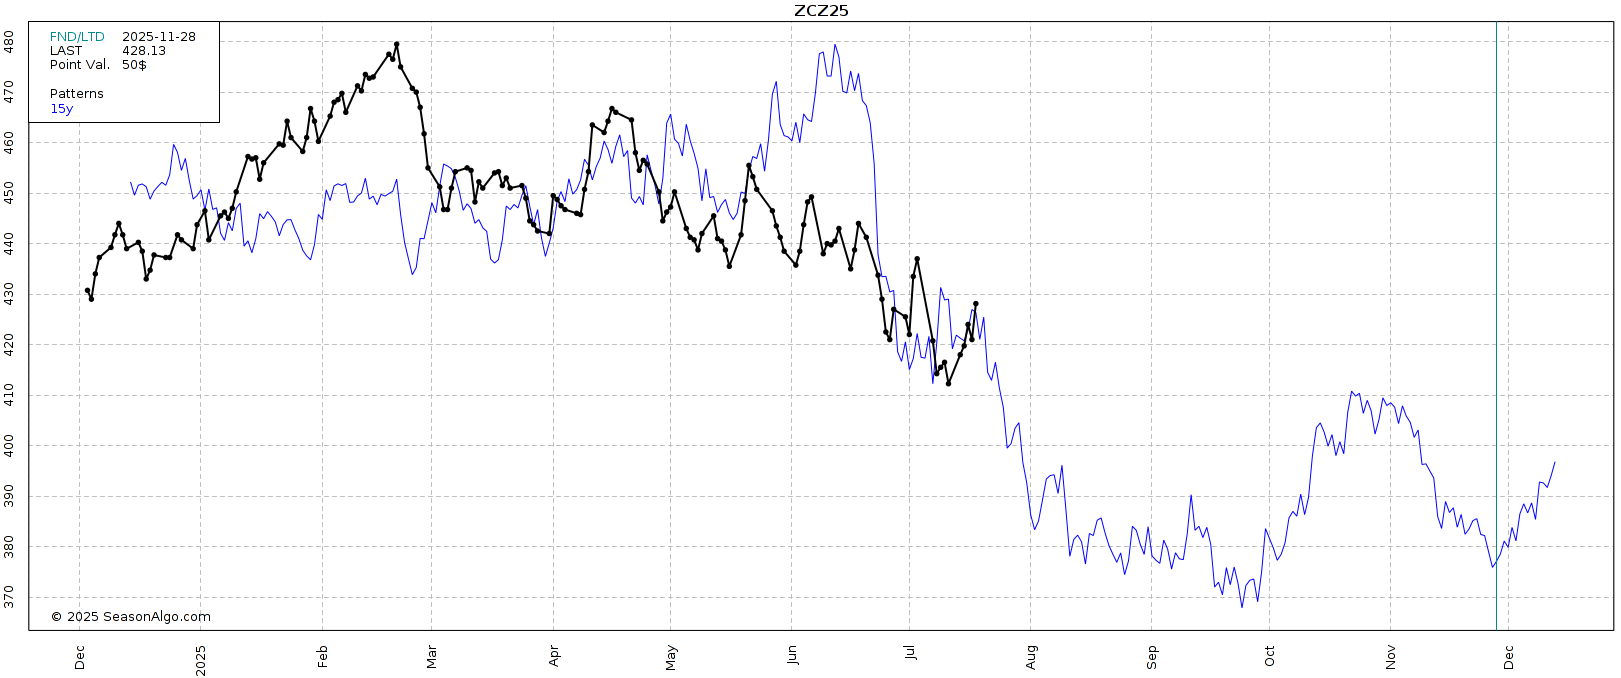
Here is the 15 year seasonal.
Usually, we continue to fall apart going into September.
Now you might think this is scary.. but let's keep going.
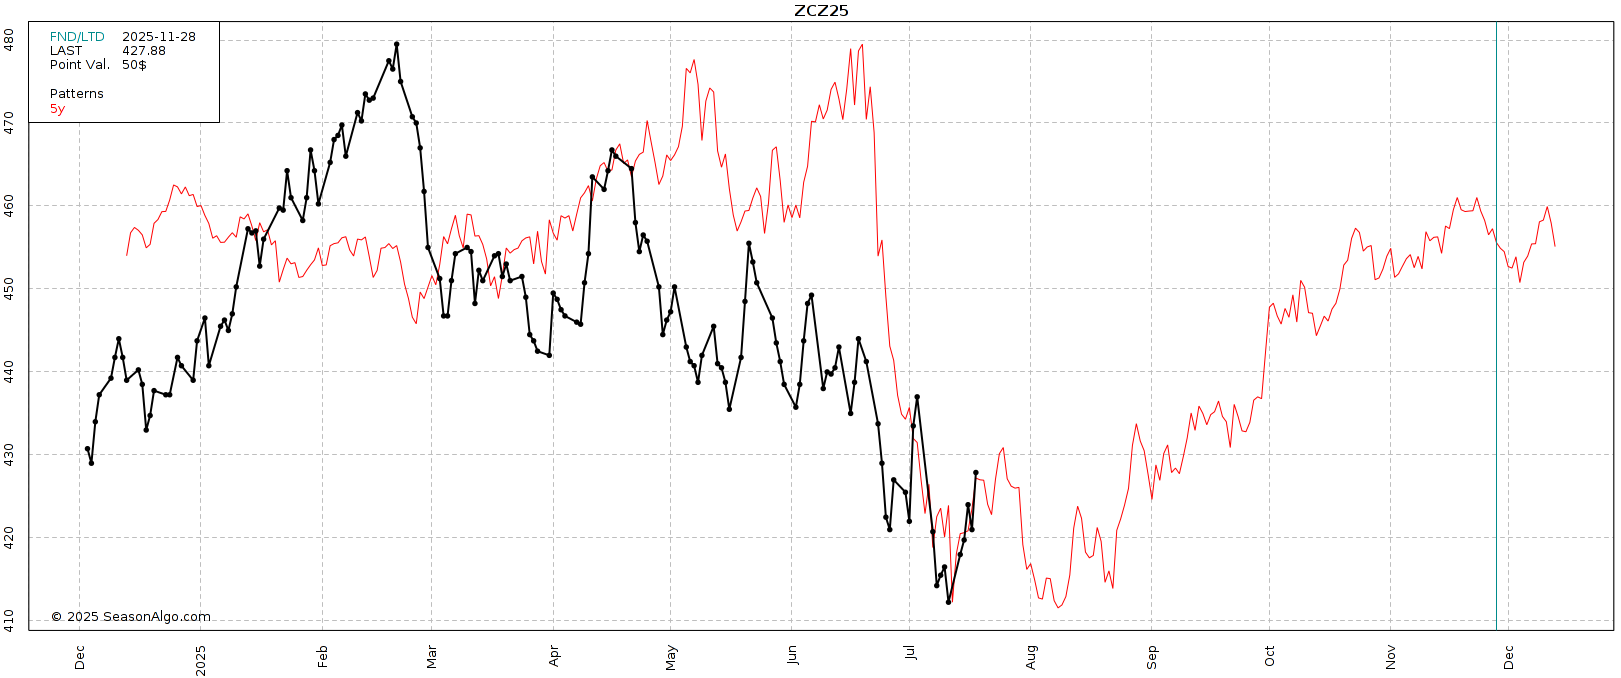
Now here is the 5 year seasonal.
In this one, we found a first bottom right where we just did.
We then give back this rally going into August before finding a secondary bottom.
We do not take out the July lows by much in this seasonal.
In recent years, we have been finding a bottom sooner and sooner.
Personally I think we see a similar path to this, this year. As the trade has already priced in a monster yield.
The only way I see the 15 year seasonal playing out is if weather remains perfect and yield actually winds up being +185.
This is the exact same week last year the funds started to cover their shorts, when we had all of the talk about huge yields.
The funds have now bought corn for the 2nd straight week in a row after selling the last 19 of 20 weeks.
Similarly, all we are seeing is talk of yield +6 bushels above trendline line, I think we have already priced in a pretty bearish scenario.
The market is also constantly evolving and is completely different from 15 years ago. Which leads me to trusting nearer term seasonals rather than how the market acted 15 years ago.
Final Thoughts:
Yes we have a big crop on the way. But what if the market got a little ahead of itself here pricing in a crop +6 bushels higher than anything we have seen before?
What happens if yield is actually just at 181 and not 185? If that is the case, we are probably underpriced here moving here moving forward.
185 is possible, but it would take a lot of areas such as Illinois to have a record crop. Iowa is going to have a mosnter crop from the looks of it. But I’m not so sure everywhere will.
Technicals:
Dec corn bounced right where we talked about we possibly could in that golden fib extension box.
But I'm still skeptical of this rally.
We've seen this time and time again where we get a solid 2-3 day rally then give it all back.
You can’t get excited until we break this downtrend we've rejected off of countless times.
Upside target to de-risk is $4.38 to $4.45.
We need to hold $4.09 or next stop is $4.00

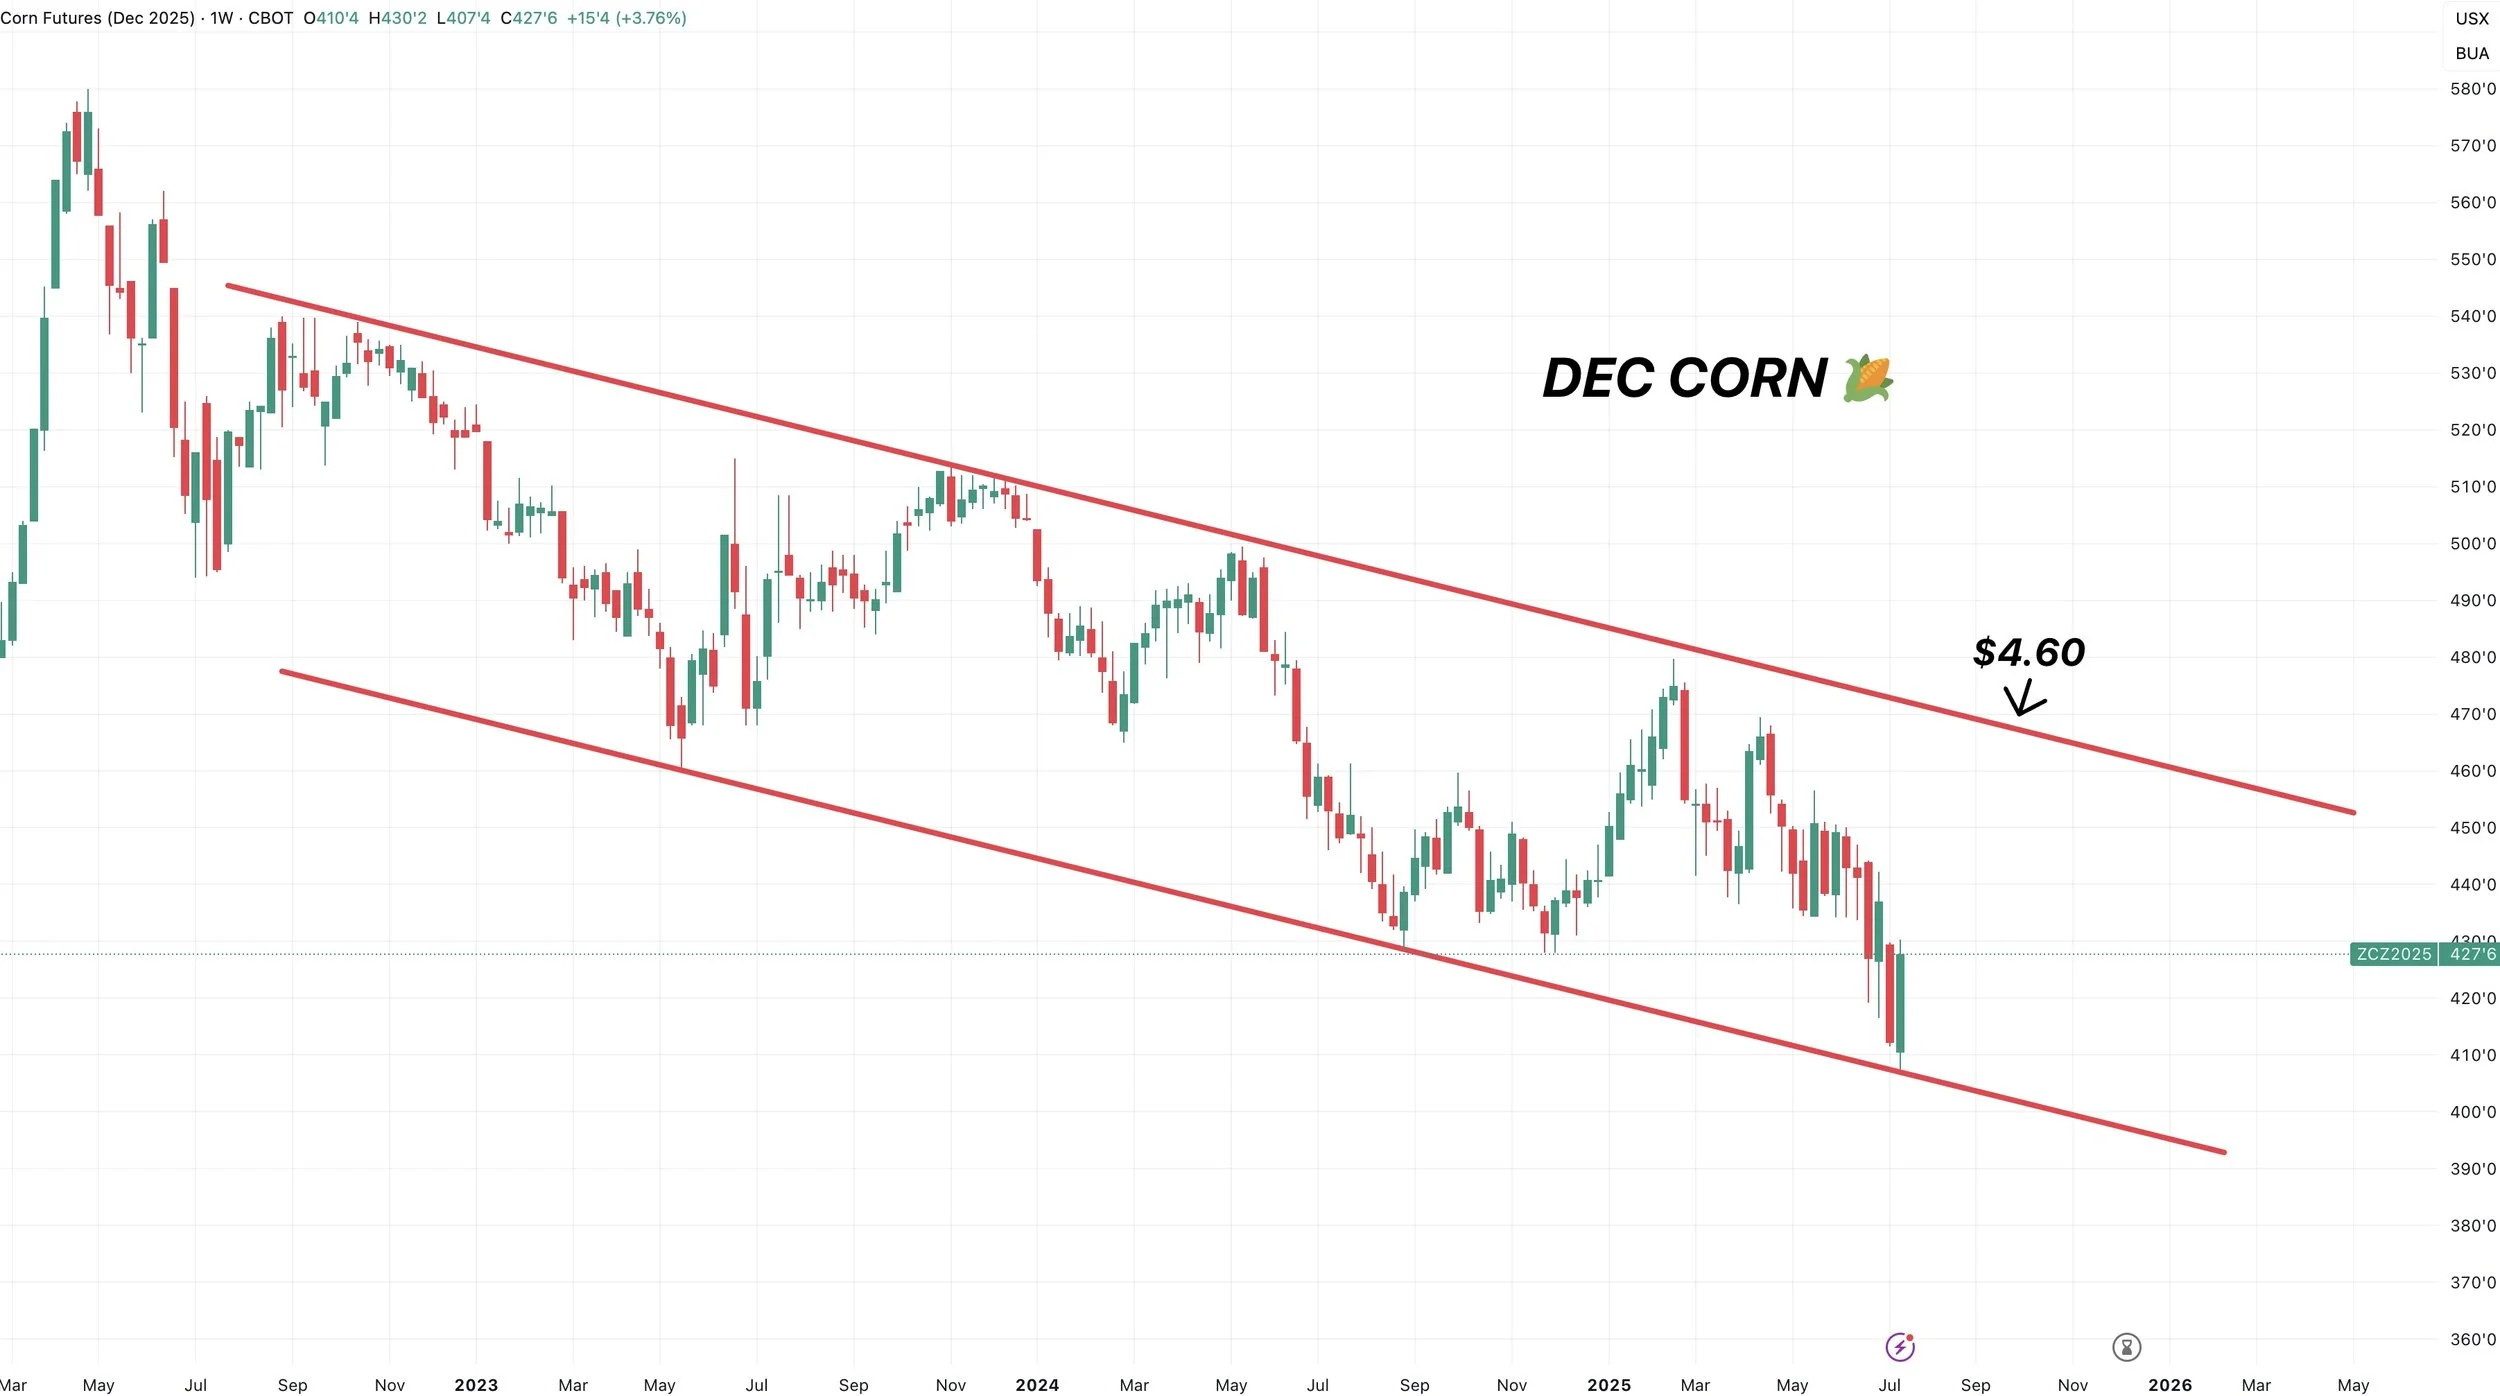
Here is a weekly chart.
We've been stuck in a massive downward channel for a few years.
We bounced off the bottom of the channel this week.
Top of the channel is around $4.60. So that is going to be a bigger picture target.
Soybeans
Fundamentals:
Like corn, I showed this Wednesday but wanted to again start with this.
Compared to last year, new crop beans are about the same price.
Yet.. carryout is down nearly -30% (435 vs 310 million)

Not only that.. but there is zero room for error in production. At all.
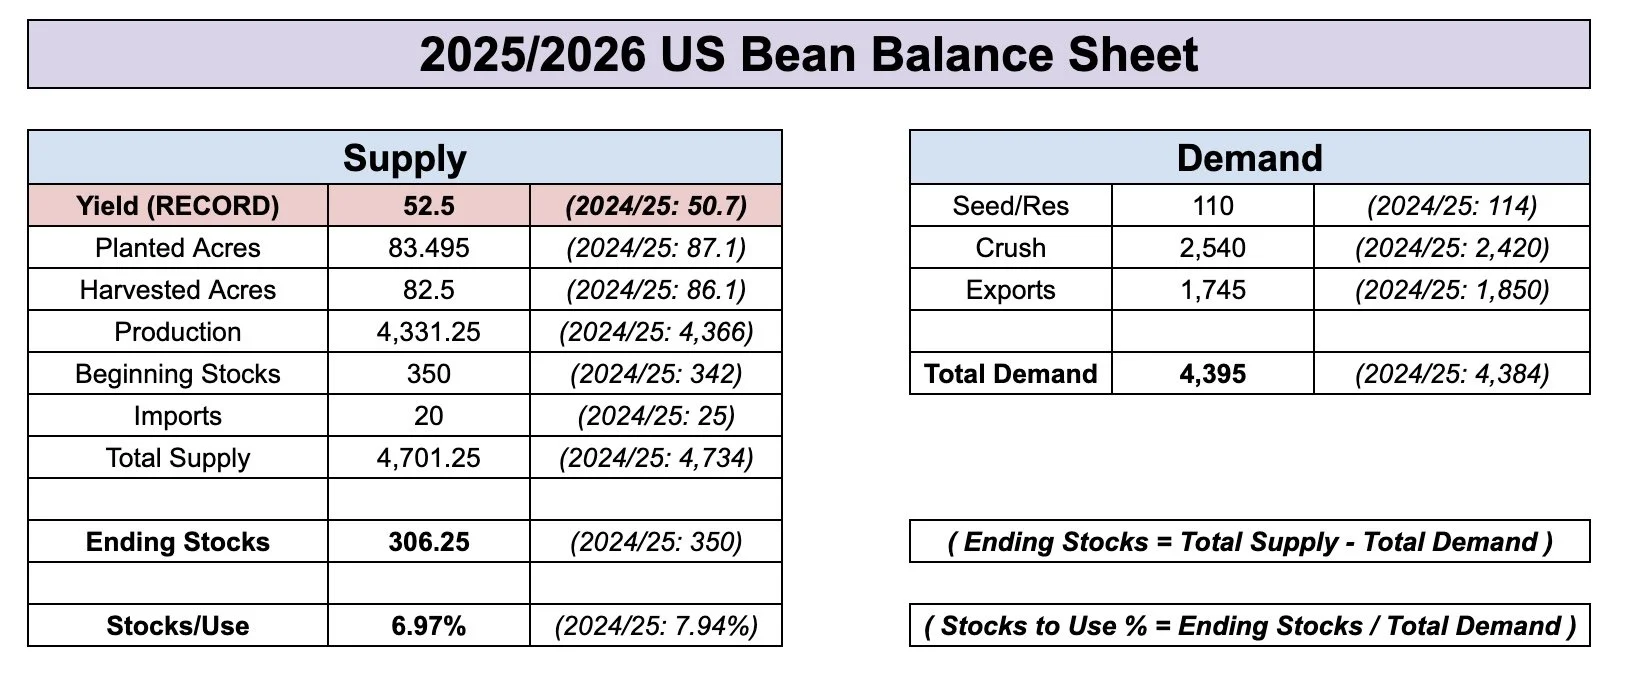
Here is the current balance sheet.
Yield = 52.5
Carryout = 310
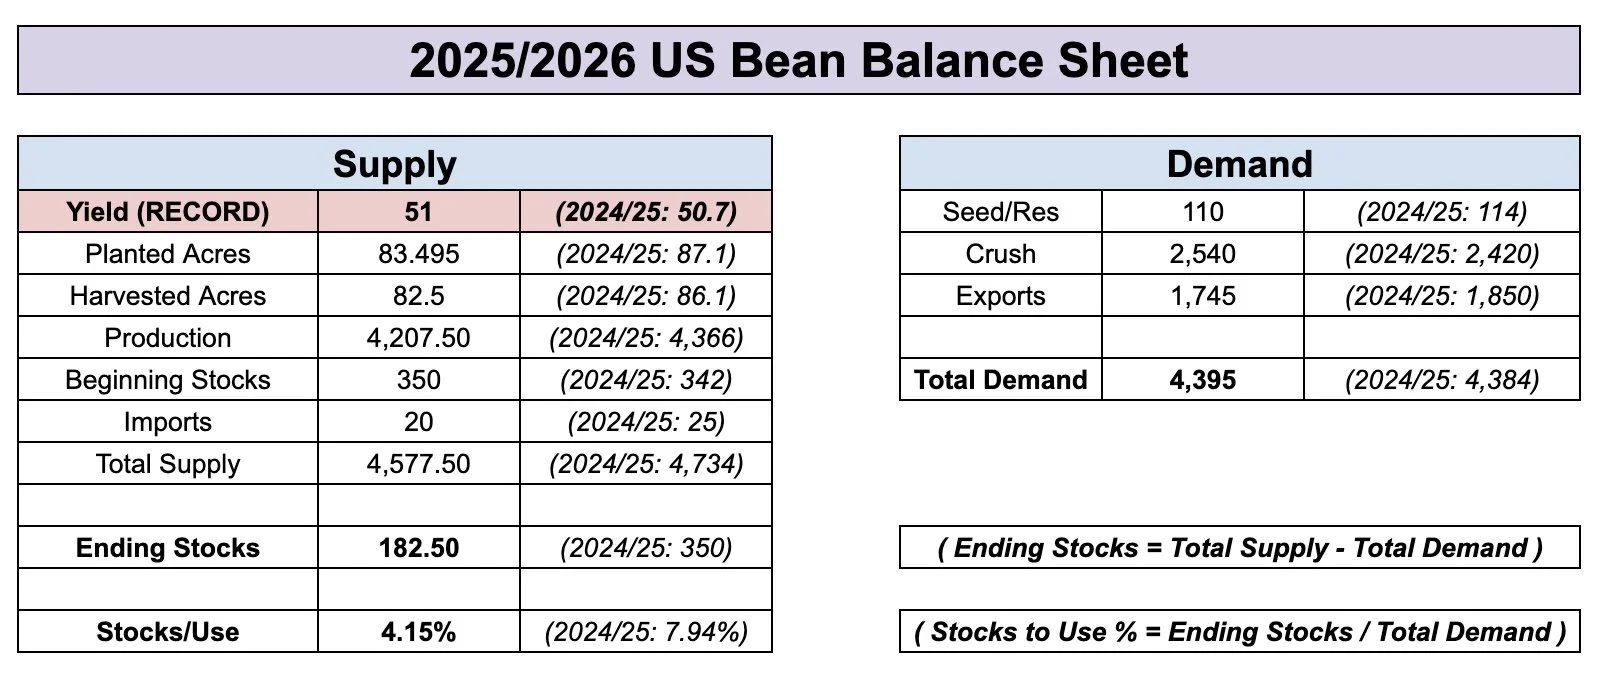
Shave yield down to 51?
Carryout drops to 180 million (without any changes to demand of course).
What if yield isn’t a record? That is something we have to ask. Because there is zero room for error.
Even if yield came in at 53 our new crop carryout would still be lower than last year.
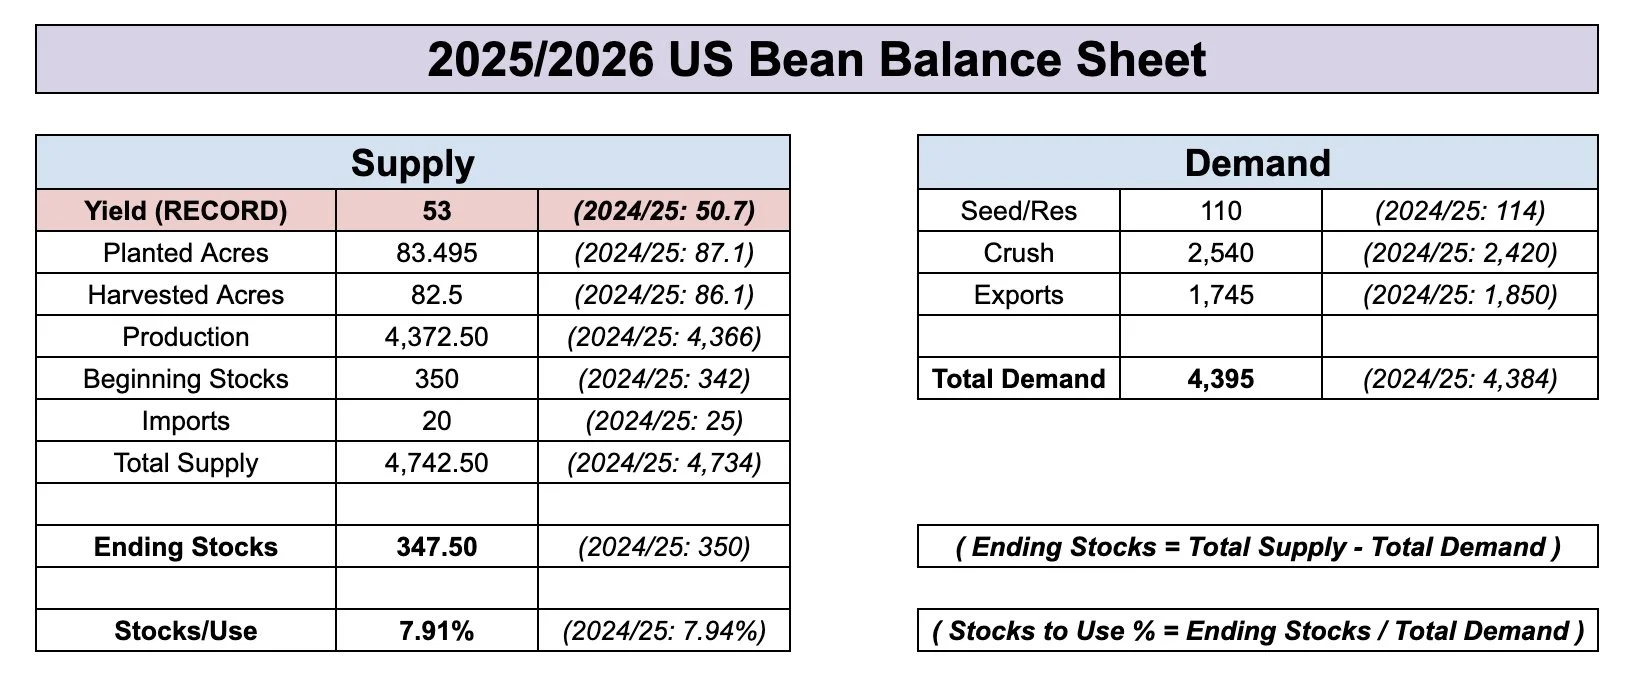
You just can’t justify sending beans straight into the ground when you have a balance sheet with this little room for error.
Fundamentally beans shouldn’t be below $10.
It is way too early to start saying we are going to have this record crop we have never seen in soybeans.
We always talk about the great demand in corn, but soybeans have already surpassed the USDA's export estiamtes as well. With 7 weeks to go.
We have the RVO story. Which could lead to more demand.
We have the potential to strike a deal with China. Which could lead to more demand. (Although there is always risk of tension there).
Given the unknown potential I just can’t get overly bearish soybeans.
Last year our absolute floor was $9.60. With a carryout +30% higher at the time.
Technicals:
If you checked out the charts below yesterday’s audio you would’ve seen this chart.
Here is Nov beans.
We almost closed that gap at $10.44 (fell short by 1 cent). Gaps act as magents.
Now we are at a decision point in the market where we will know if this is simply a correctional bounce or something bigger.
Not only was this the gap. This was also the 61.8% retracement level up to the June highs. Which is the most common level for prices to revert to.
We are at a key spot here. A rejection makes sense. As we hit the golden retracement. But if we do decide to take out $10.45 our next stop would be those June highs.
To the downside, that blue box is our new must hold spot. Break below $10 and we have a gap of air to that black line.
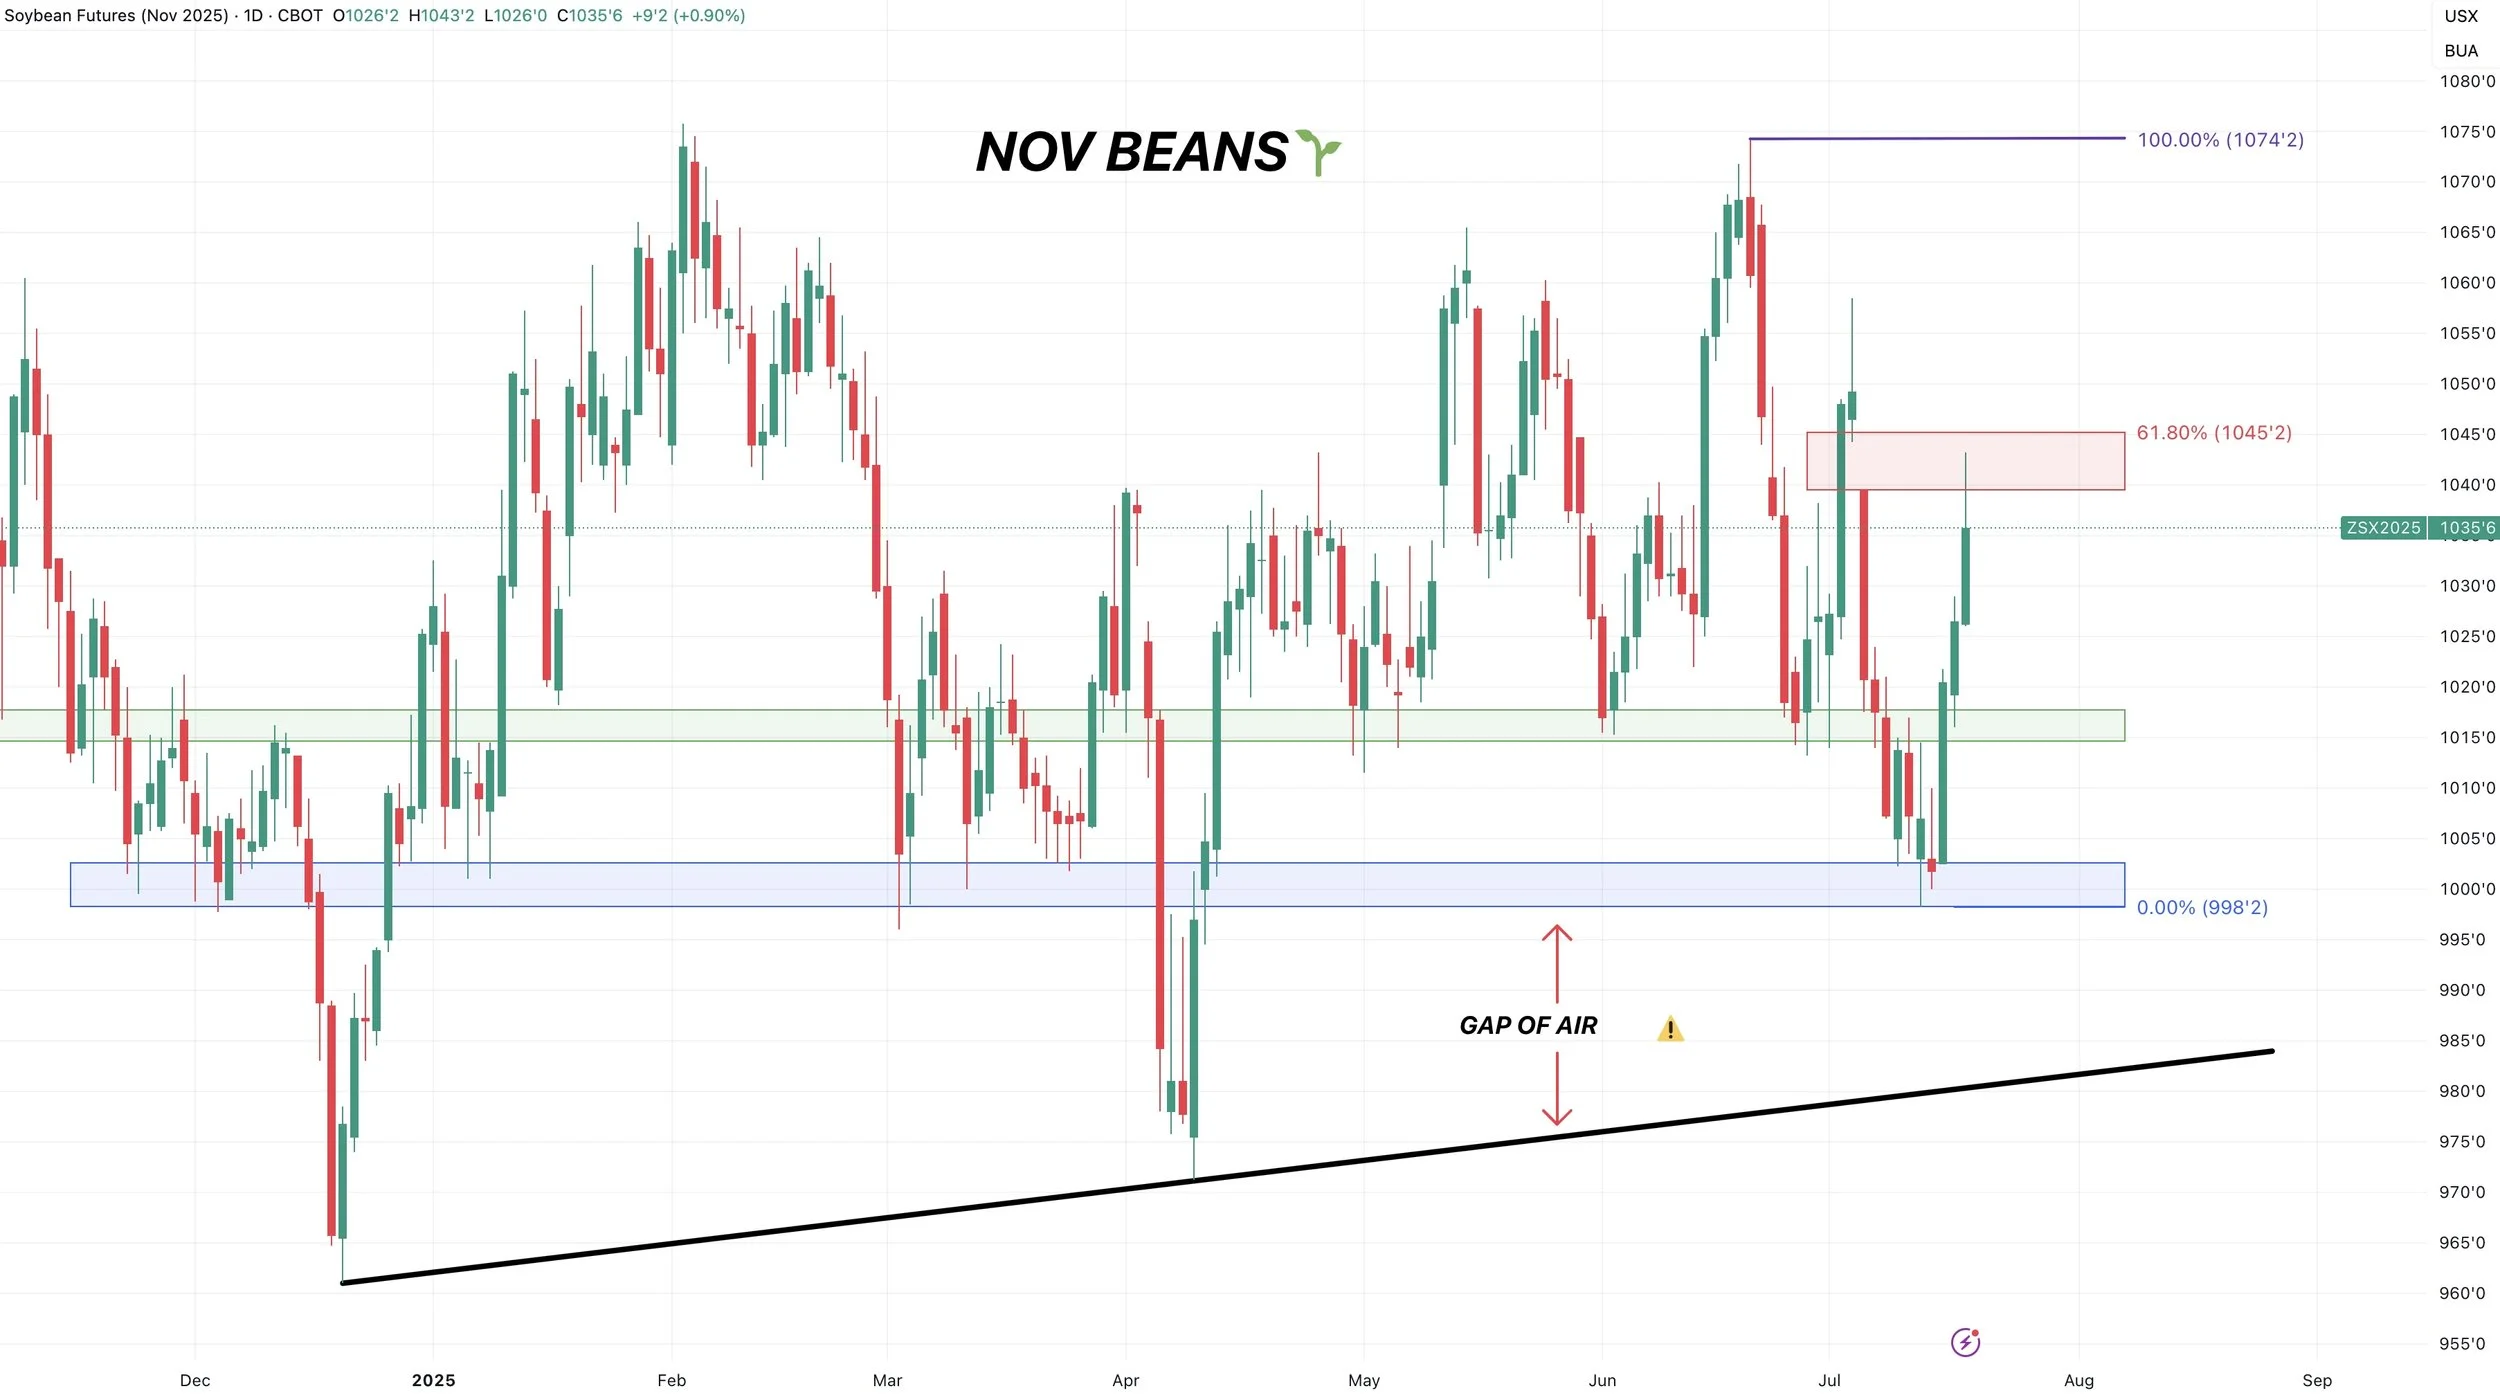
Given that we are +35 cents off the lows and since we hit the golden retracement, if you need to take risk off the table for whatever reason this isn’t a bad spot to do.
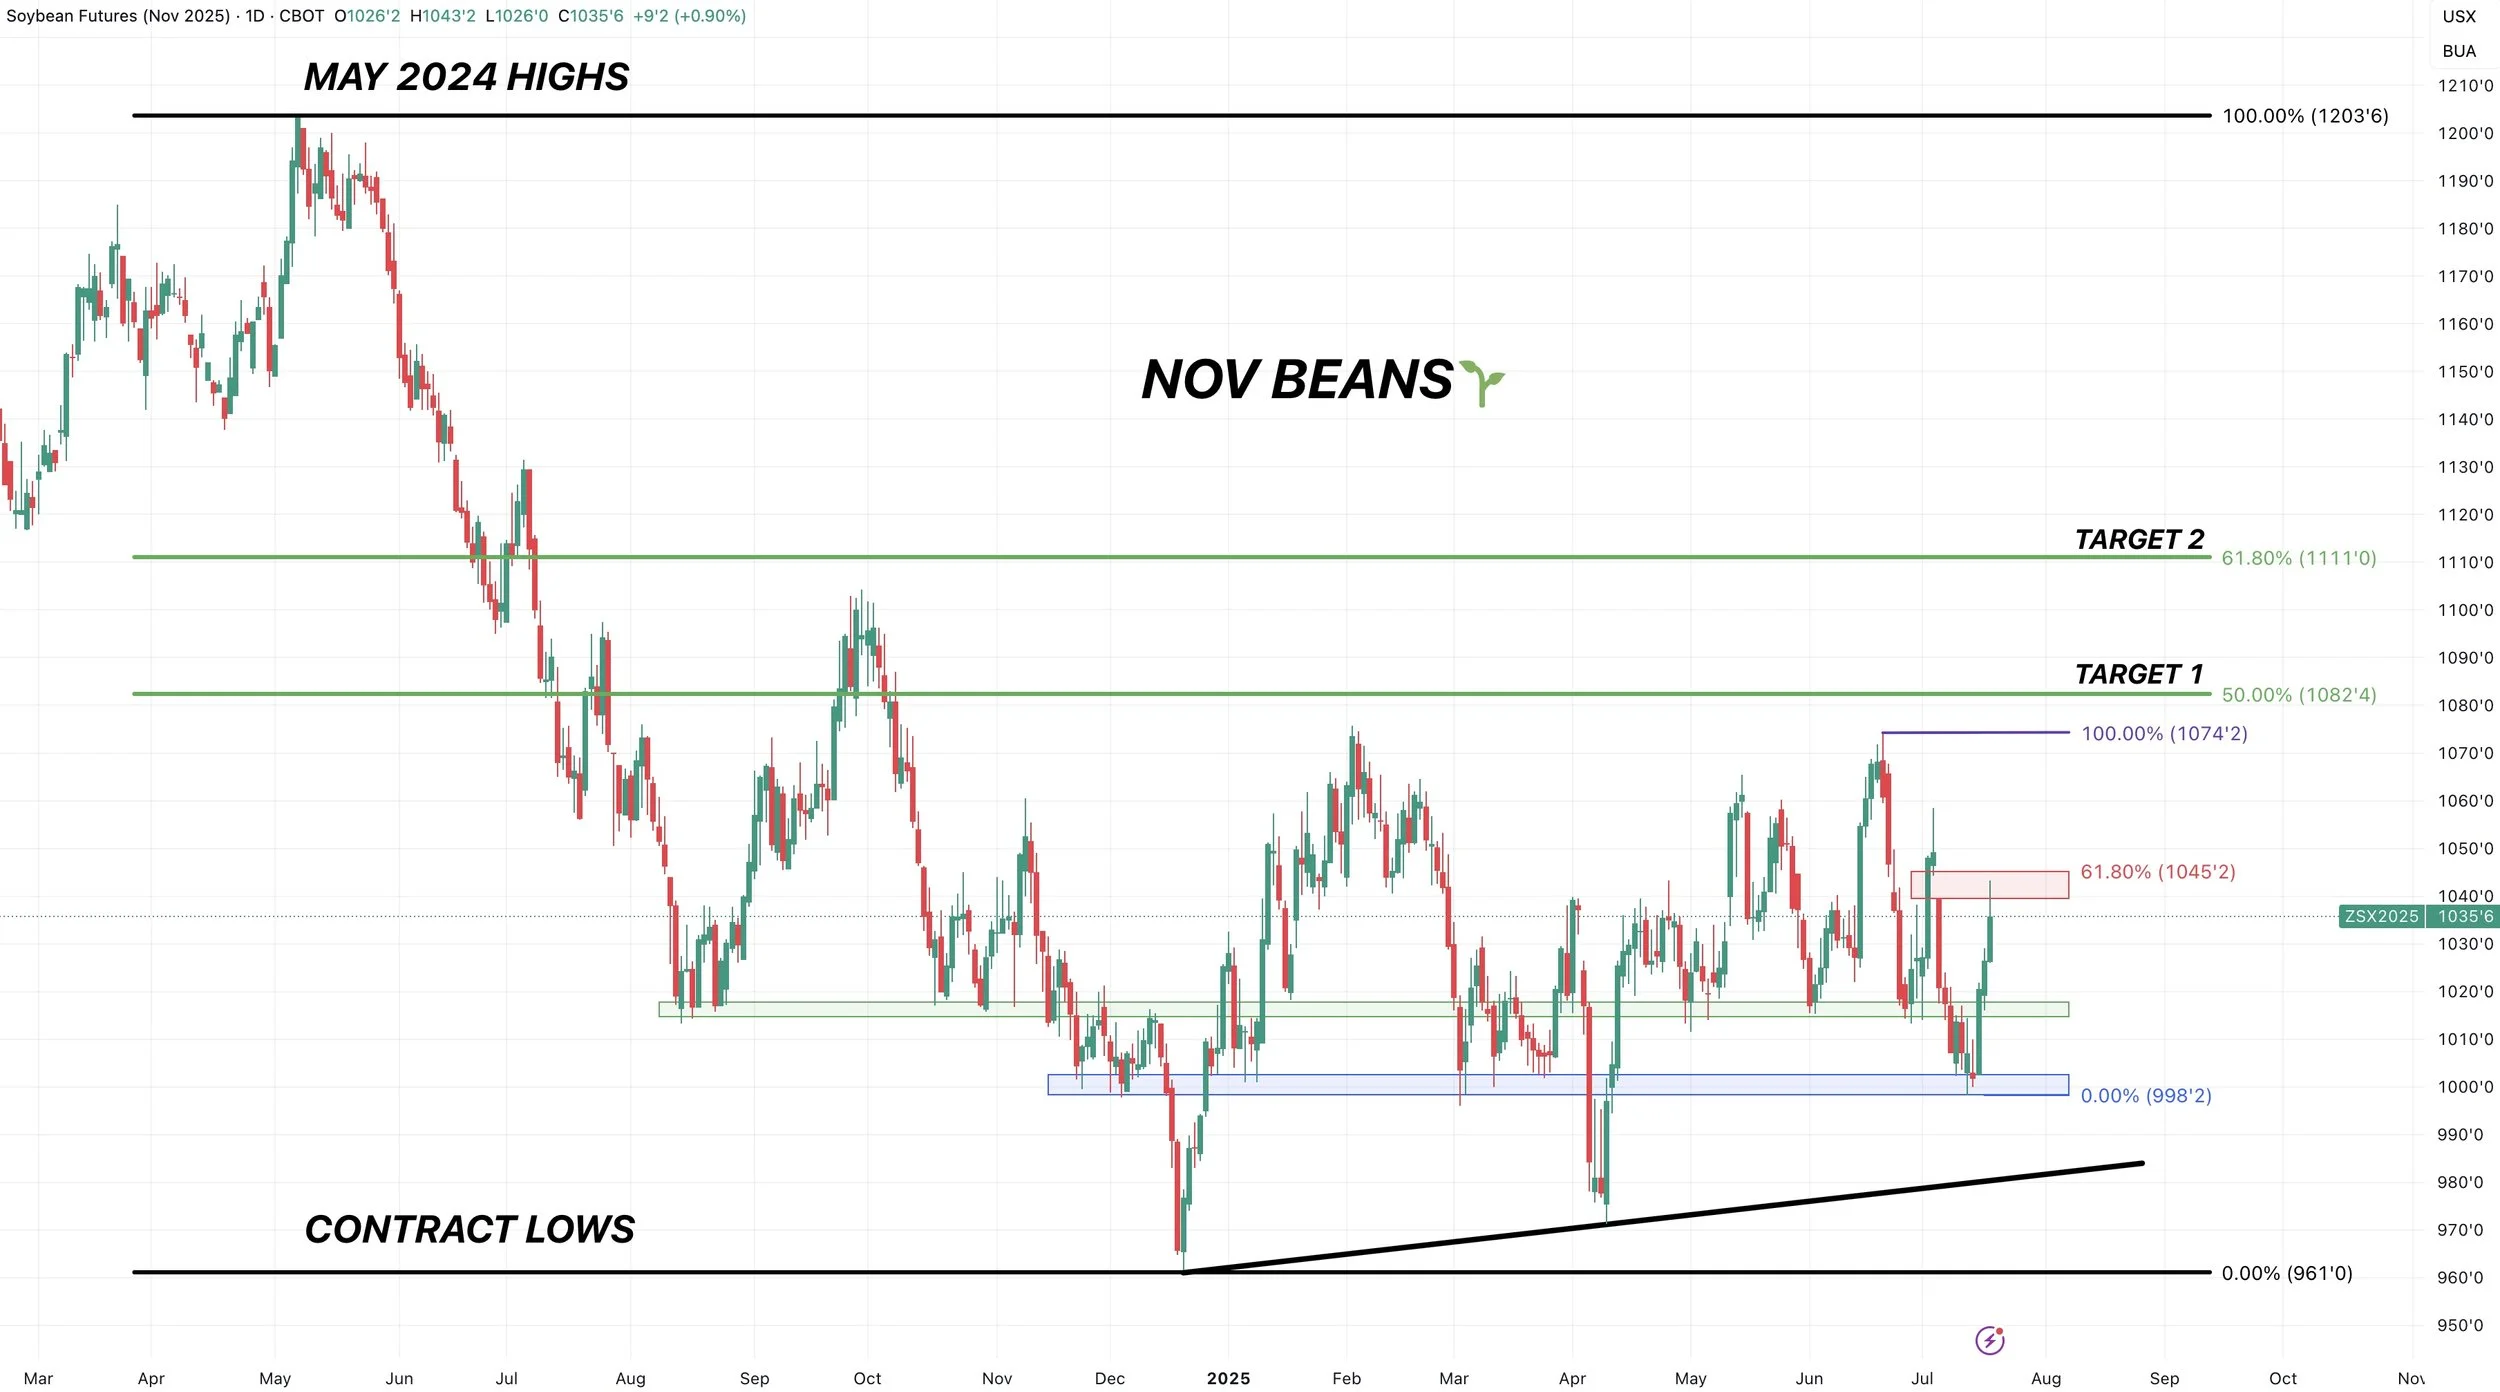
Personally, I am still eyeing $10.82. That has been my target for months now and still is.
That gives us back exactly 50% of the highs from May 2024.
Wheat
Fundamentals:
We should start seeing less harvest pressure here now that winter wheat harvest is out of the way.
Which means I think we have a decent shot at carving out some meaningful lows soon. But to get this market excited and see a real opportunity it might take some sort of supply scare or an outside factor.
The market thinks the US and world have plenty of wheat to go around for now.
Seasonals:
Here is the 5-year seasonal for KC wheat.
Typically we start to carve out some lows here but that doesn’t mean we get some sort of massive opportunity.

Technicals:
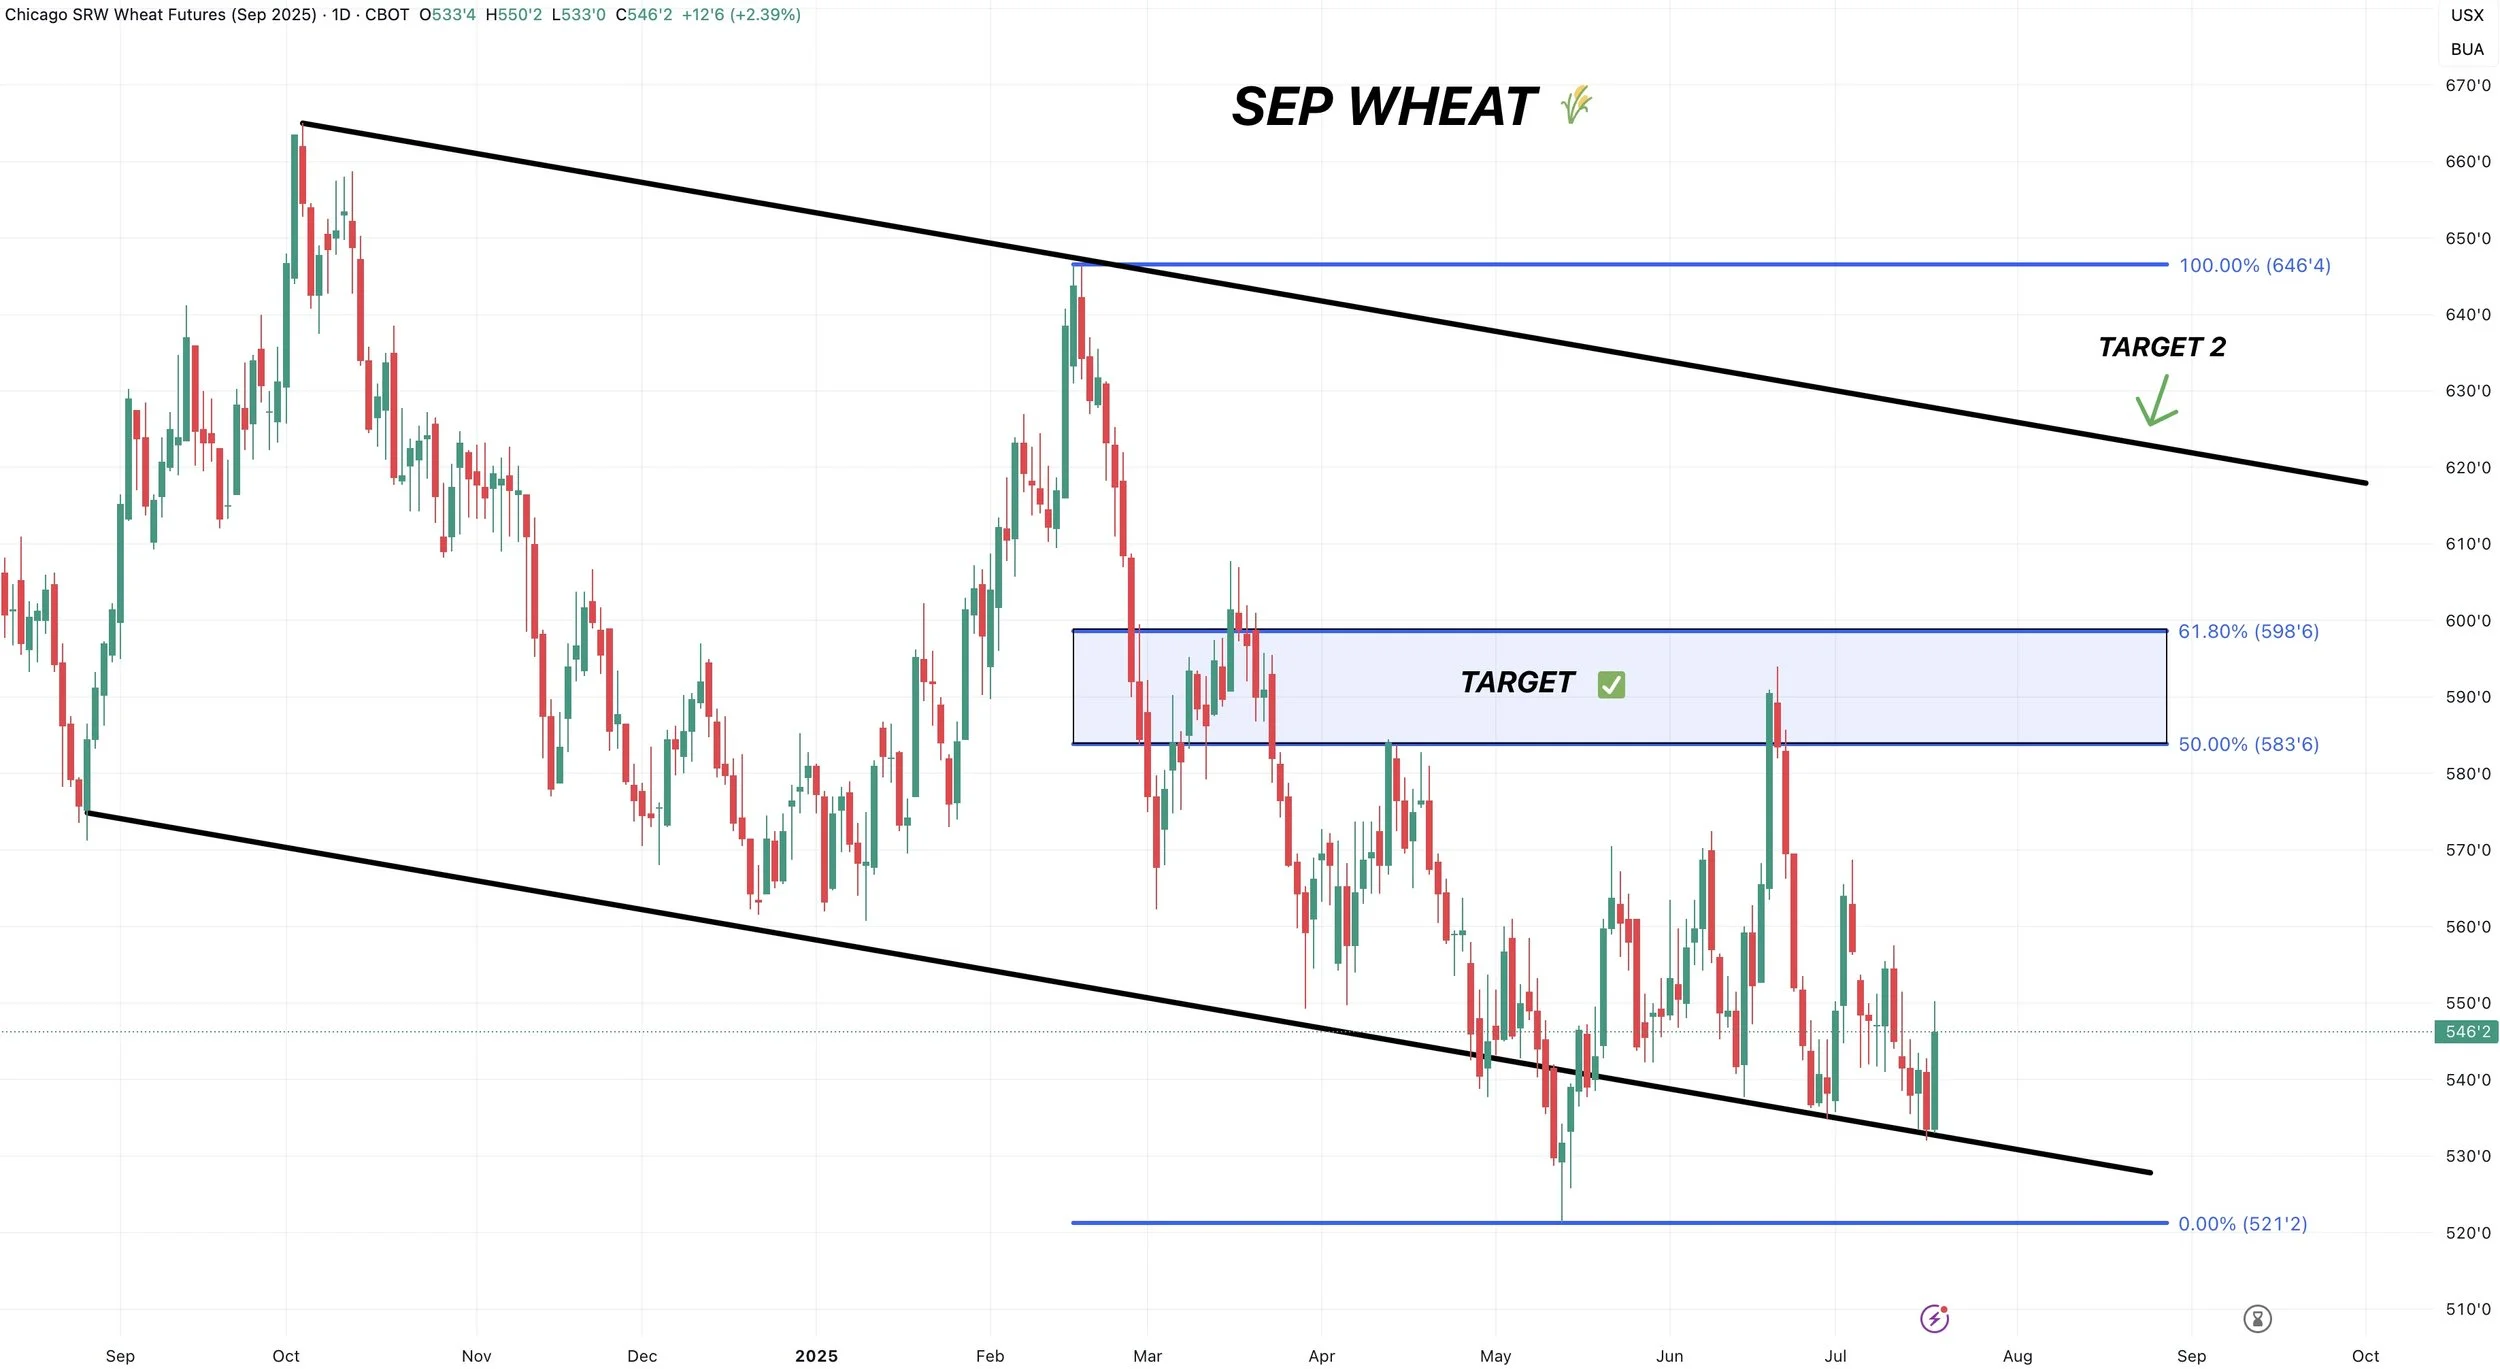
Chicago wheat bouncing right off the bottom of that channel.
Next target is still the blue box.
KC bouncing right off contract lows again.
Anything between here and that green box is simply a giant range of noise.

Cattle
Technicals:
Cattle still struggling to break this golden fib extension target.
In case you missed it, this target was simply 161.8% of the size of the June rally.
It's a common spot for the market to pause.
The June rally also failed at the 161.8% level of the March rally. (marked with red lines).
So I still like taking risk off the table here after alerting our sell signal last week when it hit.
A drop to the golden zone of 313 to 310 would not be surprising. That gives back 50-61.8% of the rally. Both the April and June sell offs bounced there before continuing the rally.
If this rally continues, our next target is around 343. That is the 161.8% level of this current July rally.

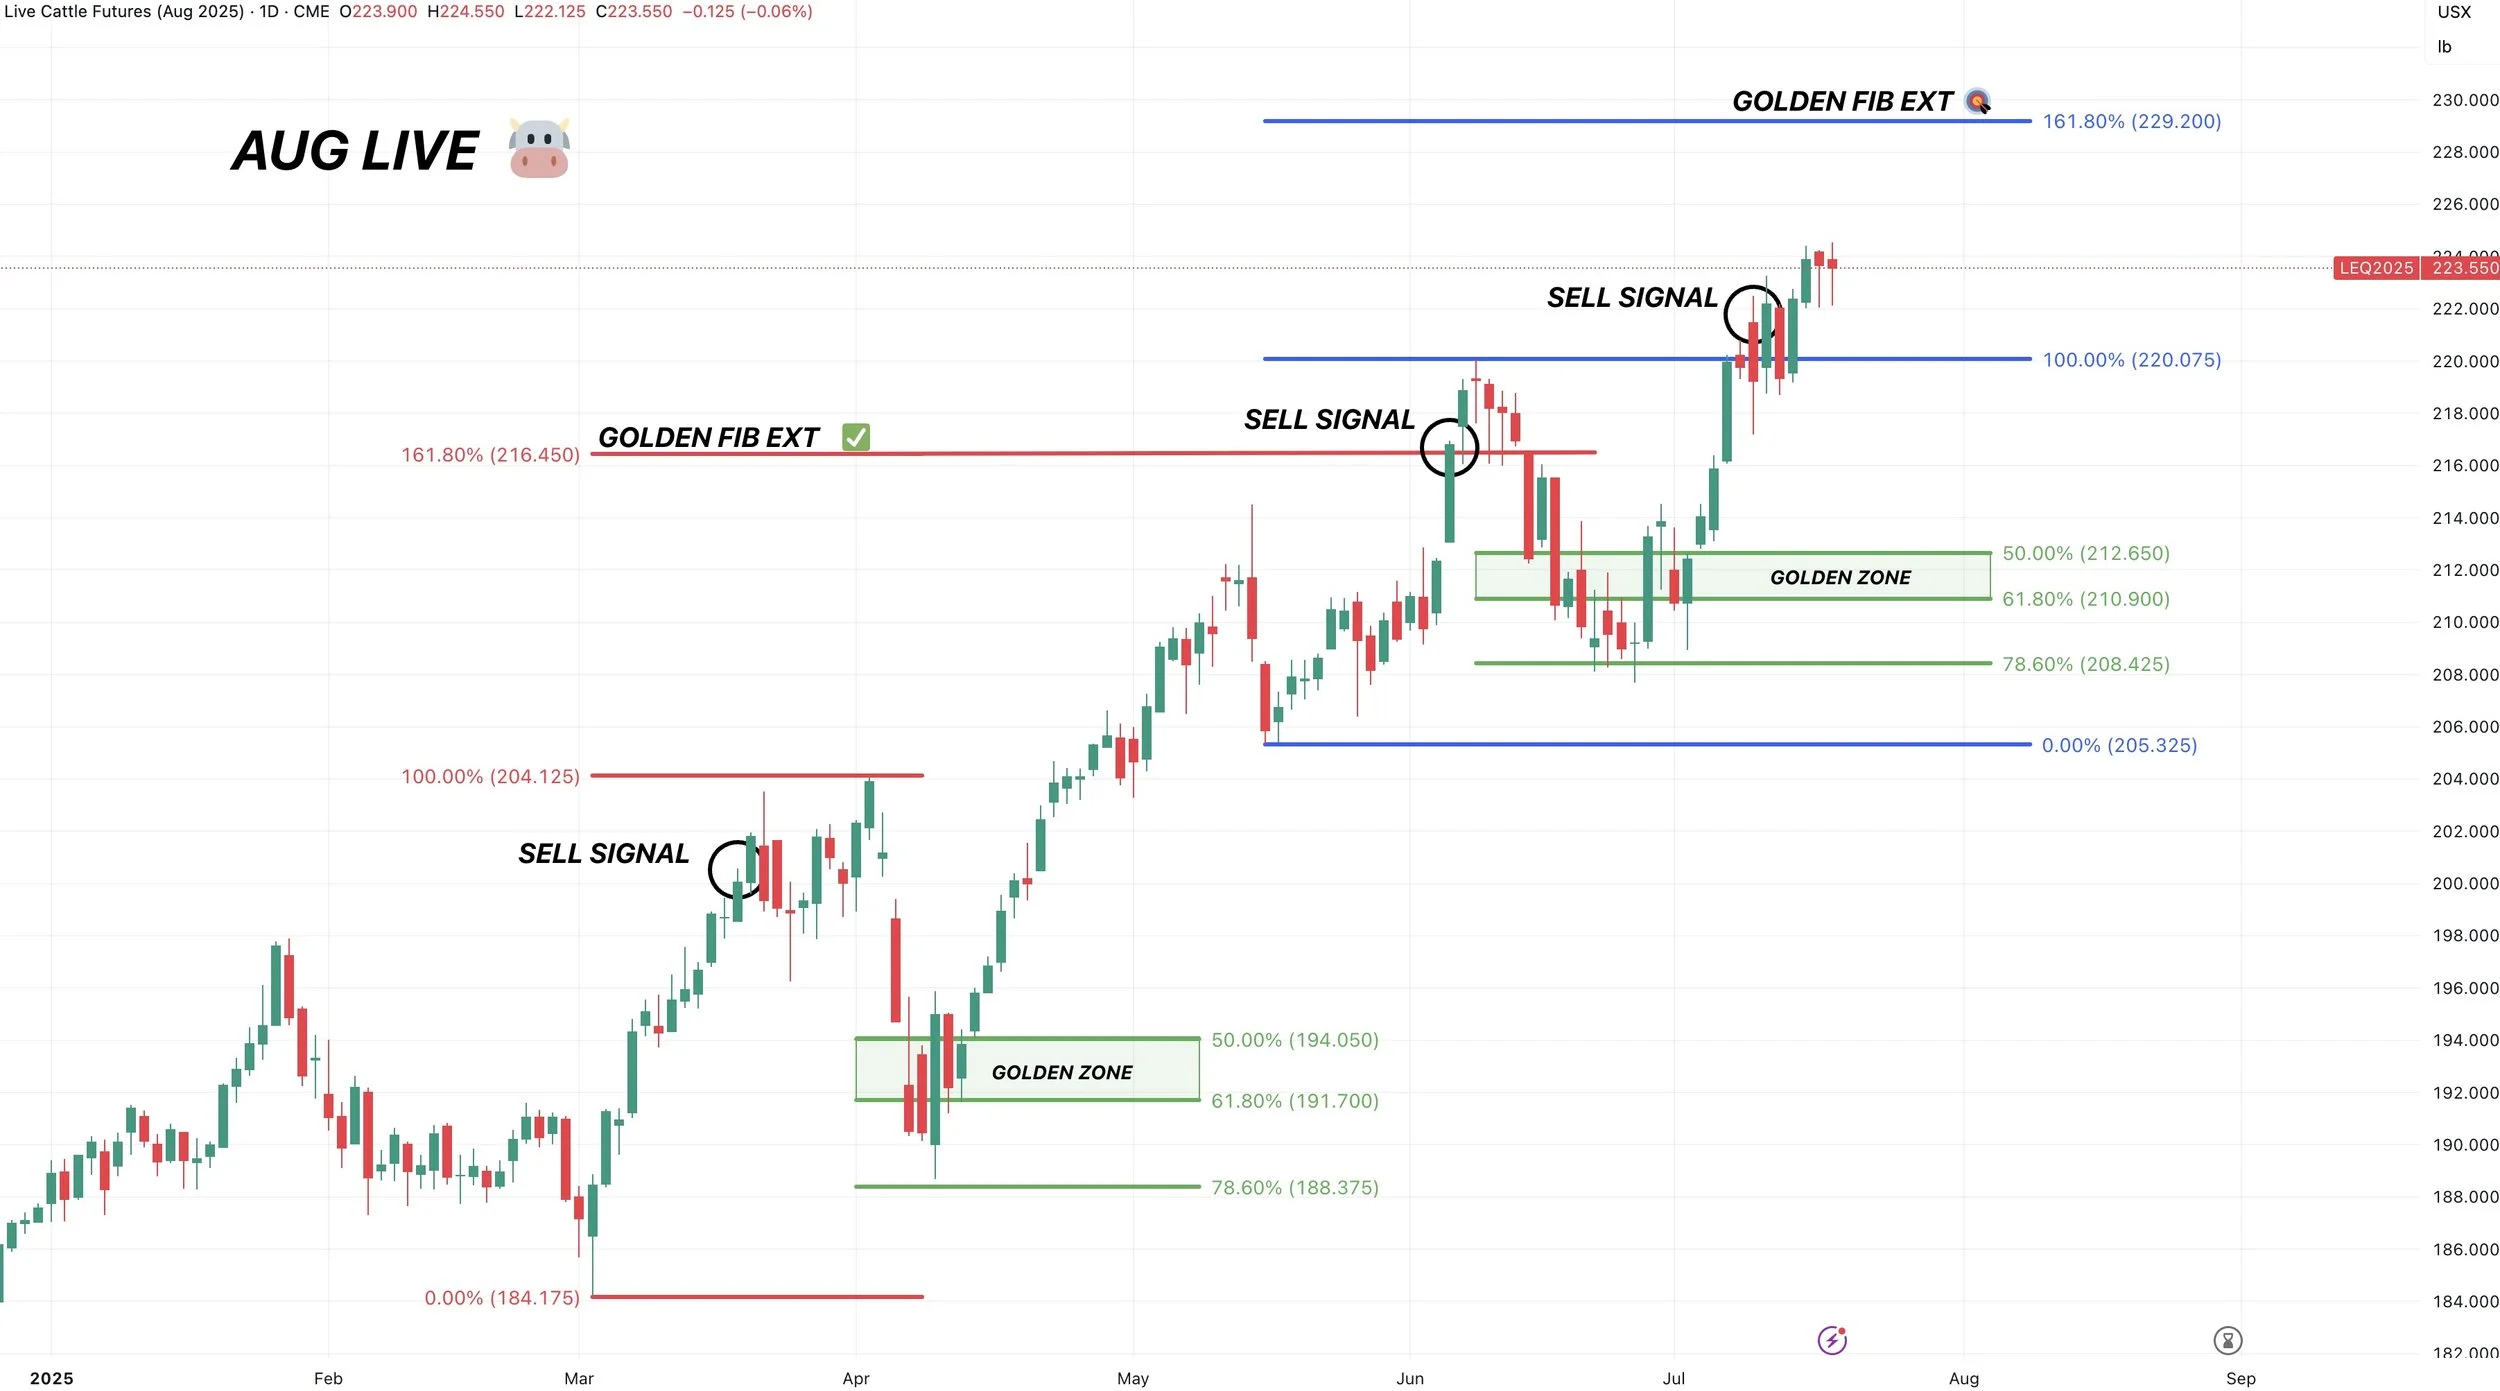
Live cattle never hit the golden fib target like feeder.
But we still alerted a sell signal since the target was hit in feeder.
Like taking risk off here as well.
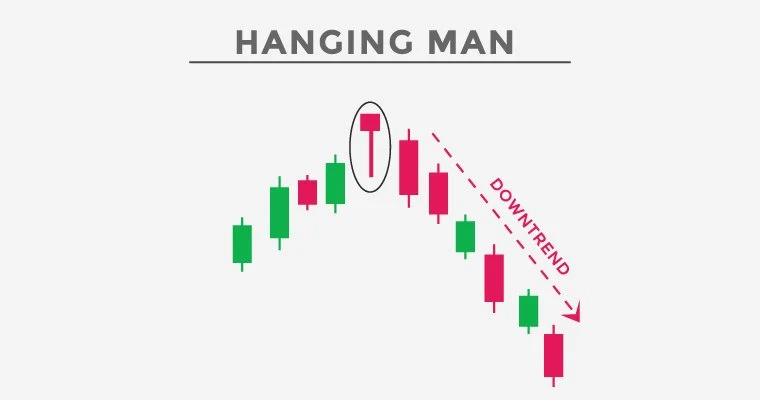
The past 2 days we posted a hanging man pattern which is known as bearish. It happens when you are in an uptrend then get a candle that closes well off the lows. (Example of this below).
If the rally continues, next target would be the golden fib at 229.
Seasonal:
Here is the 10 year seasonal for feeder cattle.
I used the Jan contract for visualization purposes.
But this is another reason why I like rewarding this cattle rally.
Could this market keep running? Absolutely. It feels like a train that can’t be stopped.
But when it feels like we can’t go lower is usually when we do. I'm just cautious here.

Past Sell or Protection Signals
We recently incorporated these. Here are our past signals.
July 10th: 🐮
Cattle sell signal & hedge alert.
CLICK HERE TO VIEW
June 5th: 🐮
Cattle sell signal & hedge alert.
June 2nd: 🌾
MPLS wheat sell signal.
April 10th: 🌽
Old crop corn sell signal.
March 19th: 🐮
Cattle hedge & sell signal.
Feb 18th: 🌽 🌾
Old crop KC wheat & old crop corn signal.
Jan 23rd: 🌽 🌱
Corn & beans old crop sell signal.
CLICK HERE TO VIEW
Jan 15th: 🌽 🌱
Corn & beans hedge alert/sell signal.
Jan 2nd: 🐮
Cattle hedge alert at new all-time highs & target.
Dec 11th: 🌽
Corn sell signal at $4.51 200-day MA
CLICK HERE TO VIEW
Oct 2nd: 🌾
Wheat sell signal at $6.12 target
Sep 30th: 🌽
Corn protection signal at $4.23-26
Sep 27th: 🌱
Soybean sell & protection signal at $10.65
Sep 13th: 🌾
Wheat sell signal at $5.98
May 22nd: 🌾
Wheat sell signal when wheat traded +$7.00
Want to Talk?
Our phones are open 24/7 for you guys if you ever need anything or want to discuss your operation.
Hedge Account
Interested in a hedge account? Use the link below to set up an account or shoot Jeremey a call at (605)295-3100.
Check Out Past Updates
7/17/25
POOR CORN EXPORTS MATTER? REWARD BEAN BOUNCE?
7/16/25
ARE CORN & BEANS UNDERVALUED OR NOT?
7/15/25
NEGATIVE NEWS POSITIVE ACTION IN GRAINS
7/14/25
DON’T GIVE GRAIN AWAY
7/11/25
USDA FRIENDLY CORN. MARKET DOESN’T CARE
7/10/25
JULY USDA OUT TOMORROW
7/10/25
CATTLE HEDGE ALERT & SELL SIGNAL
7/9/25
MARKET SEES RECORD CROPS
7/8/25
MONSTER CORN YIELD..?
7/7/25
TRUMP PUMP & DUMP
7/3/25
CORN & BEANS REJECT KEY SPOT. TRUMP SPEAKS IN IOWA
7/2/25
TRADE DEALS? BEANS RALLY AT GOLDEN ZONE
7/1/25
NOW WHAT FOR GRAINS?
6/30/25
BORING USDA. DIDN’T SAY HAVE TO GO LOWER
6/30/25
USDA NUMBERS
6/27/25
ALL EYES ON MONDAY
6/26/25
FIREWORKS OR BLOOD BATH MONDAY?
6/25/25
GRAINS COLLAPSING AHEAD OF JUNE REPORT
6/24/25
CORN CONTINUES SELL OFF. MAJOR USDA REPORT COMING
6/23/25
CORN CAN GO LOWER, BUT NOT FOR FOREVER
6/20/25
WHO SHOULD REWARD THE WHEAT & SOYBEAN RALLY?
6/18/25
COMPLETE CHART BREAKDOWNS
6/17/25
SOYBEANS CONTINUE BREAKOUT. NEARING SELL SIGNAL
6/16/25
CORN HAMMERED. EPA GAME CHANGER IN BEANS?
6/13/25
SOYBEANS RALLY, CHARTS, BALANCE SHEETS & MORE
6/12/25
USDA NON-EVENT. WHAT’S NEXT?
6/11/25
DIVERGENCE & SEASONAL SELL OFF?
6/10/25
BEING PATIENT VS BALANCING YOUR RISK
6/9/25
WHAT IF WE DON’T GET A WEATHER SCARE?
6/5/25
CORN & BEANS HOLDING CRUCIAL SPOTS
6/5/25
CATTLE SELL SIGNAL & HEDGE ALERT
6/4/25
HOW UNKNOWNS IMPACT MARKETING DECISIONS
6/3/25
KEY SPOTS ON THE CHARTS FOR CORN & BEANS
6/2/25
NEW LOWS IN CORN. DE-RISKING MPLS WHEAT
6/2/25
SPRING WHEAT SELL SIGNAL
5/30/25
SEASONAL RALLY STILL IN THE CARDS?
5/29/25
WHAT IS YOUR PLAN IF WE DO NOT RALLY?
5/28/25
ZERO PREMIUM IN THE GRAIN MARKETS
5/27/25
CORN CONDITIONS DISAPPOINT & JUNE OUTLOOK IMPROVES
5/23/25
TARIFFS SPOOK MARKET. GAME PLAN MOVING FORWARD
5/22/25
CHART BREAKDOWNS & TARGETS
5/21/25
RISK TO THE UPSIDE WITH WEATHER?
5/20/25
WHEAT SHORT COVERING & HISTORY OF YIELD CHANGES
5/19/25
ANYONE LEFT TO SELL WHEAT? 181 CORN YIELD POSSIBLE?
5/16/25
FUNDS SHORT CORN. MARKETS WAITING ON WEATHER
5/15/25
BEANS HAMMERED ON RUMOR & WHEAT FINDING LIFE
5/14/25
DECISIONS & POSSIBILITIES IN GRAINS
5/13/25
GRAINS RALLY OFF LOWS
5/12/25
USDA REPORT. HOW THIS CHANGES THINGS
5/9/25
BIGGEST RISKS IN USDA REPORT
5/8/25
USDA MONDAY & HISTORY OF WEATHER RALLIES
5/7/25
NEW 2025 LOWS FOR CORN
5/6/25
WHAT’S A SUMMER RALLY LOOK LIKE?
5/5/25
CORN ERASES ENTIRE APRIL RALLY
5/2/25
SELL INTO UNCERTAINTY. NOT KNOWN FACTORS
5/1/25
THE CASE AGAINST A FEB TOP IN CORN
4/30/25
APPROACHING KEY TIME PERIOD FOR GRAINS
4/29/25
PLANTING & FIRST NOTICE DAY PRESSURE. CORN CLOSE TO BOTTOM?
4/28/25
CAPTURING INVERSE & SEASONAL PREPARATION
4/25/25
HOW OFTEN DOES CORN NOT BREAK APRIL HIGHS?
4/24/25
KNOW WHEN TO SELL. BEANS BREAK 200-DAY FIRST TIME IN 483 DAYS
4/23/25
MONEY FLOW & DROUGHT CARDS
4/22/25
CRUCIAL SPOT FOR CORN & BEANS
4/21/25
NO PLANTING THREAT YET
4/18/25
POTENTIAL OPPORTUNITIES, BASIS CONTRACTS & STRATEGIES
4/16/25
HOW YIELD IMPACTS CARRYOUT. MAJOR SPOT FOR SOYBEANS
4/15/25
TOTAL CHART BREAKDOWNS & TARGETS
4/14/25
TECHNICAL SELLING IN GRAINS
4/11/25
SPECIFIC GRAIN MARKETING DECISIONS
4/10/25
USDA REPORT. HOW THIS IMPACTS CORN
4/9/25
TARIFFS GIVE. TARIFFS TAKE
4/8/25
CORN’S DIVERGING STRENGTH
4/7/25
SOLID PRICE ACTION DESPITE OUTSIDE FEAR
4/4/25
CORN PRICE ACTION SPEAKS VOLUME. ANY HOPE LEFT FOR SOYBEANS?
4/3/25
WHAT IS LEFT FOR CORN BEARS? TRADE WAR: CHARTS HOLDING SUPPORT
4/2/25
SHOULD UNKNOWNS KEEP A FLOOR UNDER GRAIN PRICES?
4/1/25
HOW DO ACRES IMPACT FUTURE OF THE GRAINS?
3/31/25
USDA REPORT: NOW WHAT?
3/28/25
ALL EYES ON USDA
3/27/25
PRE-USDA POSITIONING. DON’T GIVE GRAIN AWAY
3/26/25
HISTORY OF MARCH INTENTIONS. SOYBEANS UNDERVALUED?
3/25/25
6 DAYS UNTIL MAJOR USDA REPORT
3/24/25
HOW TO POSITION YOURSELF BEFORE PLANTING
3/21/25
REASONS TO BE OPTIMISTIC IN GRAINS?
3/20/25
WAS THAT THE BOTTOM IN CORN?
3/19/25
THE PATH HIGHER & THE DOWNSIDE RISKS IN GRAINS
3/18/25
SEASONALS, CATTLE HEDGE, CHARTS & DROUGHT?
3/17/25
WHEAT RALLIES. DON’T GET BACKED INTO A CORNER
3/14/25
MARCH 31ST REPORT THOUGHTS & WHAT’S NEXT FOR GRAINS
3/13/25
EXPLAINING RE-OWNERSHIP VS COURAGE CALLS
3/12/25
TARIFF FEARS. EU, CANADA, & ETHANOL
3/11/25
USDA SNOOZE. RECORD FUND SELLING A CONCERN?
3/10/25
USDA TOMORROW. GETTING COMFORTABLE IN MARKETING
3/7/25
HOW TIGHT IS THE WORLD & US SITUATION?
3/6/25
TARIFFS PUSHED BACK. FUTURE OPPORTUNITIES?
3/5/25
IS GRAINS BIGGEST RISK WEAK CRUDE & DEFLATION?
3/4/25
TRADE WAR BEGINS. 8TH DAY OF PAIN FOR GRAINS
3/3/25
TARIFFS ON TOMORROW. BUY SIGNAL
3/3/25
BUY SIGNAL
2/28/25
WHEN WILL THE BLEEDING STOP?
2/27/25
CORN AT CRITICAL SPOT. USDA ACRE REPORT. WAY TOO EARLY DROUGHT TALK
2/26/25
HISTORY SUGGESTS CORN TOP ISN’T IN? ACRE OUTLOOK TOMORROW
2/25/25
POSITIVE CLOSE. WHAT TO KNOW ABOUT USDA OUTLOOK
2/24/25
USDA OUTLOOK, FIRST NOTICE DAY & BRAZIL
2/21/25
WHAT TO EXPECT MOVING FORWARD IN GRAINS
2/20/25
FIRST NOTICE DAY CONCERNS. MASSIVE CORN ACRES OR NOT?
2/19/25
HOW TIGHT IS THE CORN SITUATION?
2/18/25
MORE DETAILS ON TODAYS SELL SIGNAL
2/18/25
OLD CROP KC WHEAT & CORN SELL SIGNAL
2/14/25
WHEAT BREAKING OUT ON WEATHER RISK. TECHNICALS & FUNDAMENTALS
2/12/25
GLOBAL GRAIN SITUATION, ACRE TALK, CHARTS & MORE
2/11/25
USDA: NOT A BEARISH REPORT. DISAPPOINTING PRICE ACTION
2/10/25
USDA TOMORROW. LONG TERM PATH FOR SUB 10% CORN STOCKS TO USE?
2/7/25
WHY WOULD THE FUNDS EXIT THEIR LONGS?
2/6/25
WHEAT FINALLY CATCHING A BID
2/5/25
COMPLETE THOUGHTS ON MARKETS: BACK & FORTH DISCUSSION
2/4/25
STRONG JANUARY LEAD TO STRONG YEAR? TARIFFS, CHARTS & MORE
2/3/25
TARIFFS PUSHED BACK
1/31/25
TARIFF NEWS ALL OVER THE PLACE. ARE YOU PREPARED FOR POSSIBILITIES?
1/30/25
WHEAT BULL ARGUMENT. TRUMP ADDS TARIFFS
1/29/25
CORN APPROACHES $5.00
1/28/25
TARIFFS, CORN FUNDS, SOUTH AMERICA & MORE
1/27/25
HEALTHY CORRECTION WE TALKED ABOUT & TARIFF NEWS
1/24/25
GRAINS DUE FOR SHORT TERM CORRECTION?
1/23/25
OUR ENTIRE NEW CROP SALES THOUGHTS & OLD CROP SELL SIGNAL
1/22/25
GRAINS TAKE A BREATHER. IS CORN IN A BULL OR BEAR MARKET?
1/21/25
HUGE DAY IN GRAINS. WHAT TO DO WITH OLD CROP VS NEW CROP
Read More
1/20/25
VIDEO CHART UPDATE
1/17/25
TRUMP, CHINA, ARGY & USING THE SPREADS INVERSE
1/16/25
OLD CROP LEADS US LOWER. MARKETING THOUGHTS
1/15/25
SIGNAL & HEDGE ALERT QUESTIONS EXPLAINED. IS $6 CORN EVEN POSSIBLE?
1/14/25
MORE DETAILS ON TODAYS HEDGE ALERT & SELL SIGNAL
1/14/25
CORN & SOYBEANS HEDGE ALERT/SELL SIGNAL
1/13/25
USDA GAME CHANGER OR NOT?
1/10/25
BULLISH USDA FOR CORN & BEANS
1/9/25
USDA OUT TOMORROW
1/8/25
2 DAYS UNTIL USDA. BE PREPARED
1/7/25
THE HISTORY OF THE JAN USDA & MORE
1/6/25
MAJOR USDA REPORT FRIDAY
Read More
1/3/25
UGLY DAY ACROSS THE GRAINS
1/2/25