
MONSTER CORN YIELD..?
MARKET UPDATE
You can scroll to read the usual update as well. As the written version is the exact same as the video.
Timestamps for video:
Yield Talk: 0:00min
Cattle Targets: 5:20min
Corn: 7:00min
Crucial Spot Beans: 10:15min
Wheat: 12:00min
Miss our 4th of July sale?
Take advantage of the offer before your trial ends. Don’t miss out on our next sell signal or future updates
Want to talk about your situation?
(605)295-3100
Futures Prices Close
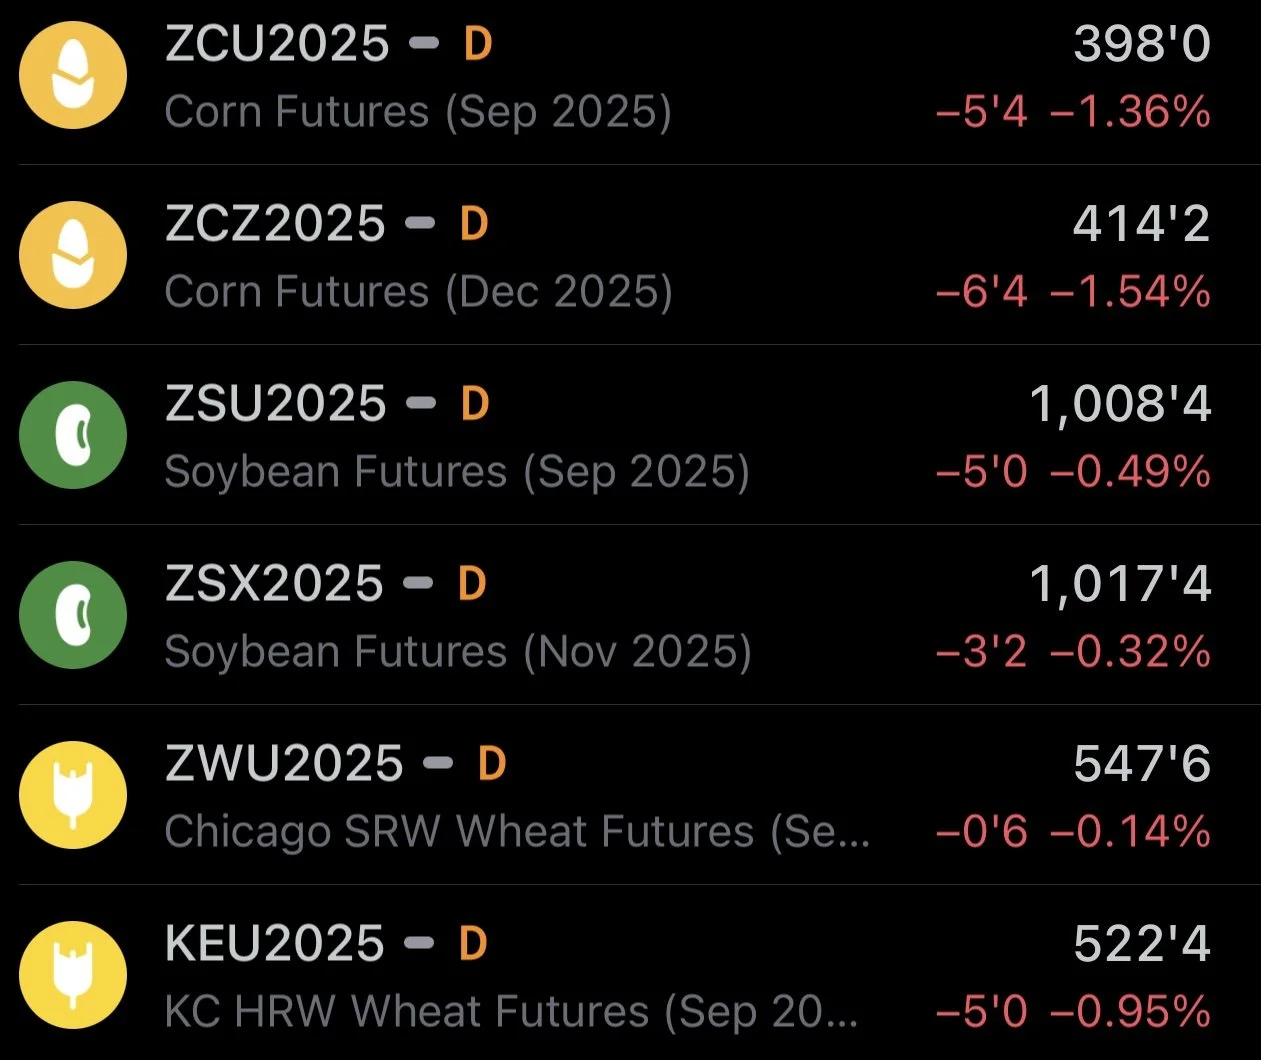
Overview
Grains lower again following the absolute blood bath yesterday.
Why the sell off?
It was exactly what I feared and spoke about on Thursday.
We had a Trump pump and dump. The market got all excited about the potential for Trump to announce a trade deal in Iowa when he spoke because he said "farmers will be happy with what I have to say".
His speech provided nothing. No talk about a trade deal or China. In result, we gave back the entire rally.
Not only that, but weather has been pretty ideal and the forecasts remain favorable for the crop.
The market is pricing in a record crop and will continue to do so until proven wrong.
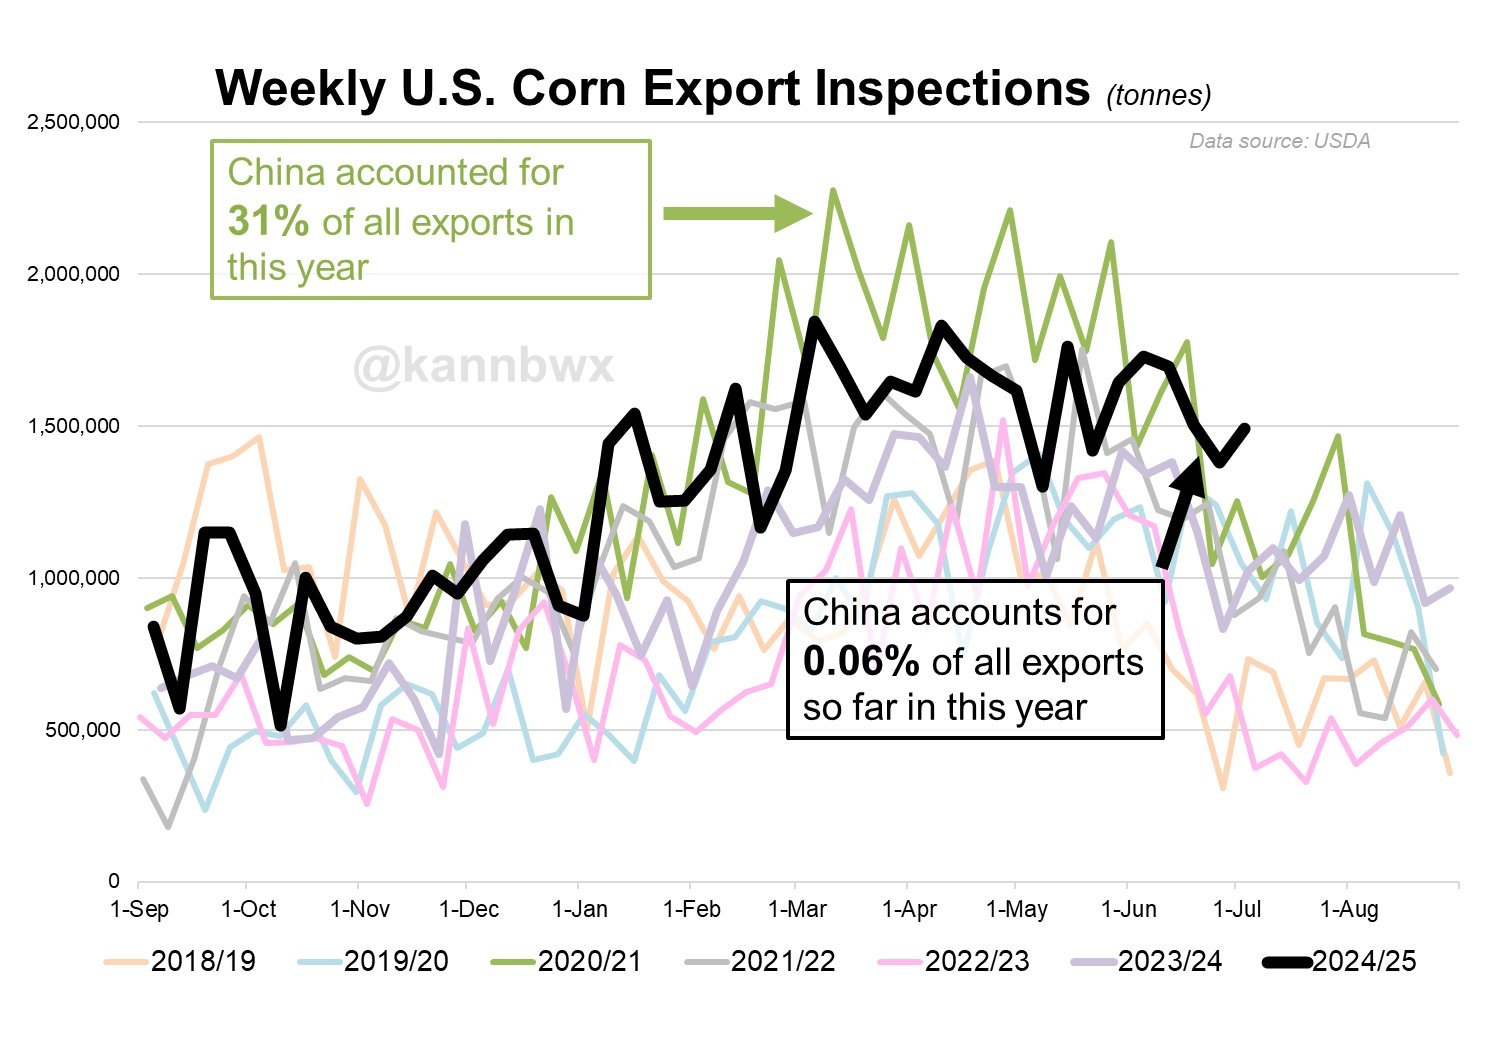
Demand has been great.
This chart of corn export inspections is from Karen Braun. Look at the black line. It has been phenomenal.
All of this is without any Chinese demand at all.
But.. the market doesn’t care. A futures market is forward looking. All it cares about is the perception that we have a massive crop on the crop on the way.
Chart from Karen Braun
187 Corn Yield..?
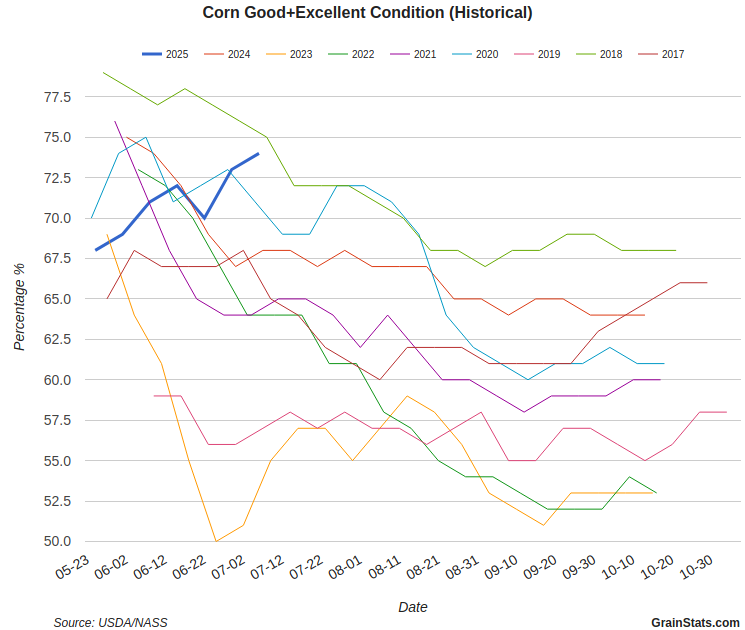
Yesterday we got crop conditions.
Corn was rated 74% G/E. Which is the best since 2018.
Chart from GrainStats
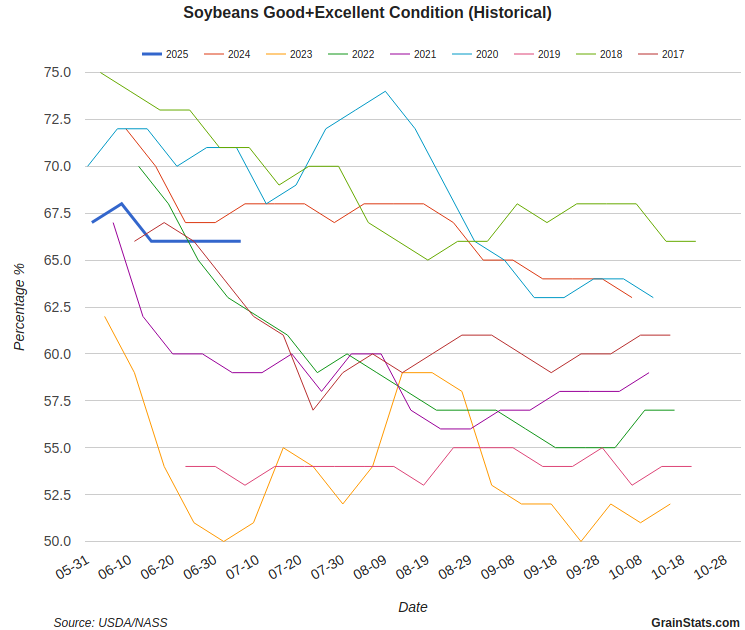
Soybeans ratings aren’t as amazing as corn, but are the 2nd best since 2020.
Chart from GrainStats
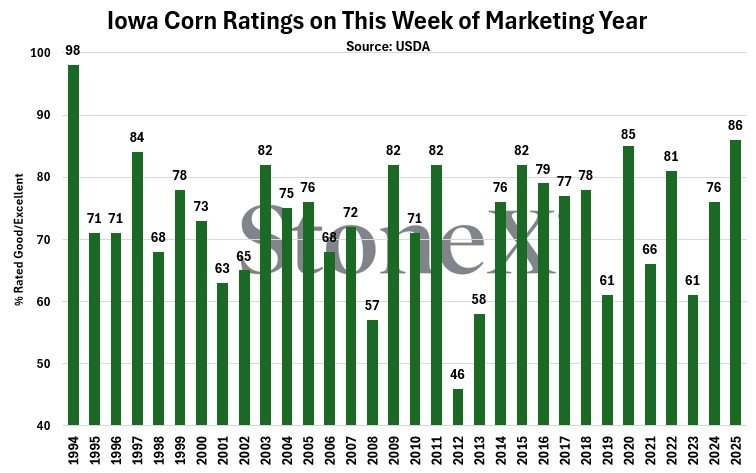
Iowa's corn ratings for this week were the best all-time at 86% G/E.
Chart from StoneX
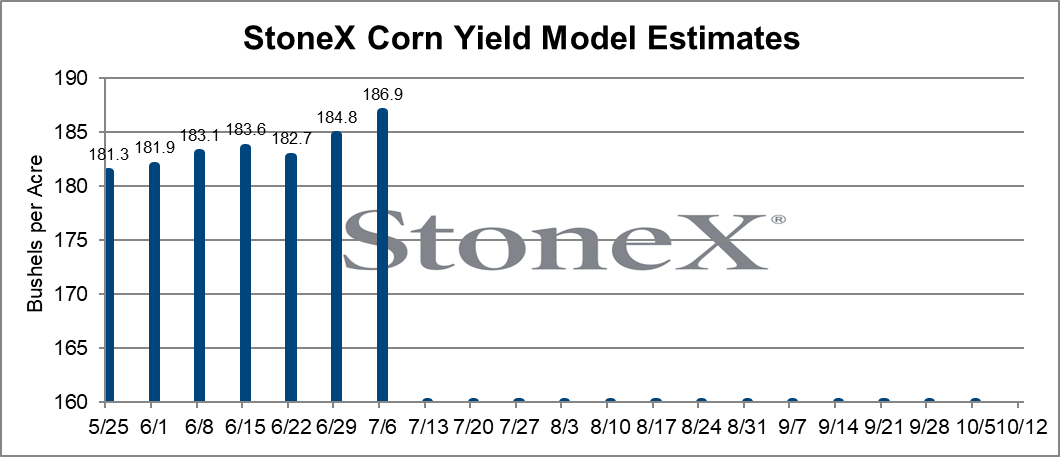
Yesterday StoneX released their yield estimate for corn based on their models.
They had 186.9 bpa.
A whopping 6 bpa over trendline..
This is why the corn market is struggling despite great demand and despite old crop having one of the tightest balance sheets of all-time.
The market is pricing in a crop above trendline.
Because even with a tight old crop situation and even with amazing demand, the market isn’t worried about running out of corn before harvest.
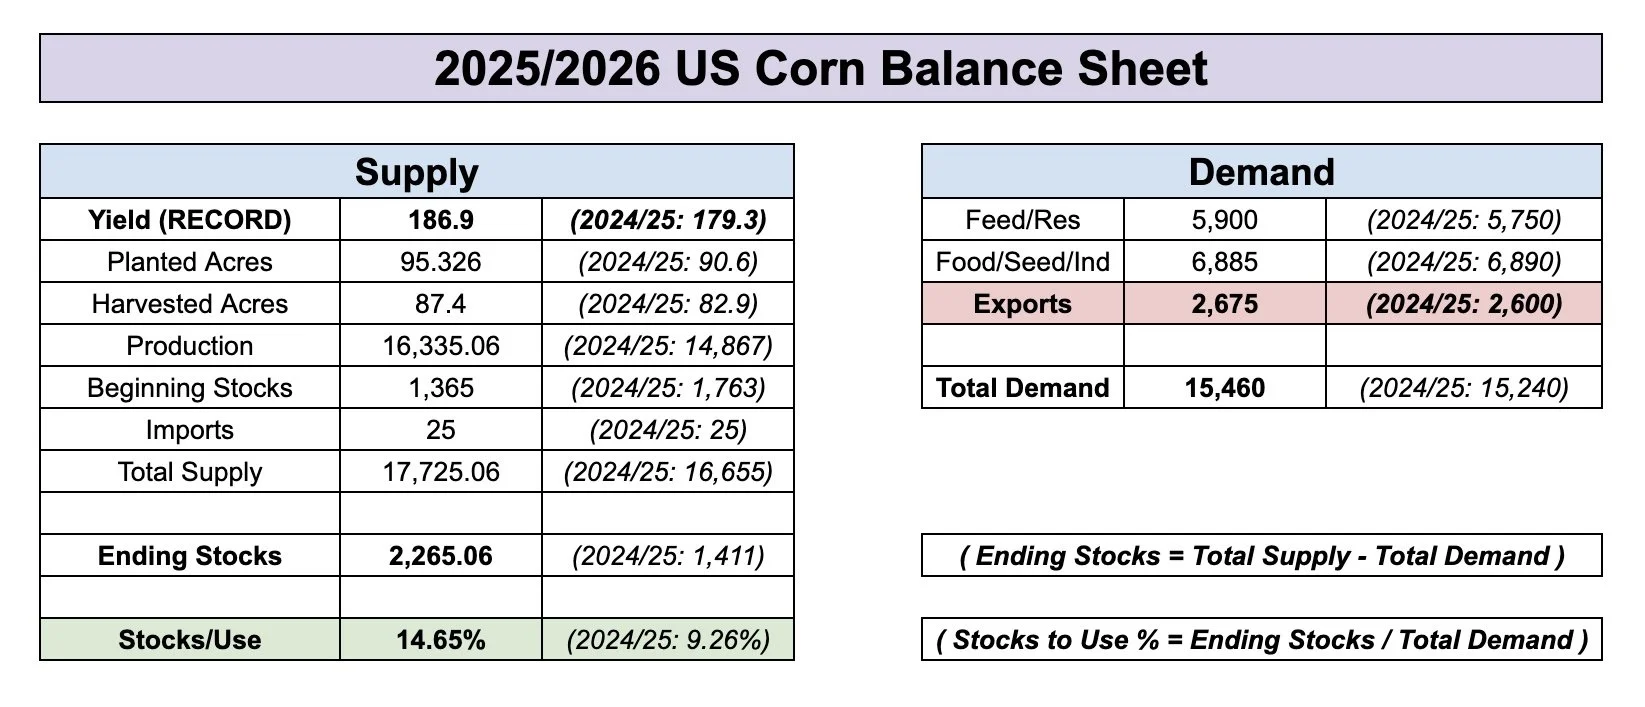
When you plug a 186.9 bpa yield into the balance sheet, the new crop corn situation becomes extremely bearish.
Based on the current demand numbers, it would spit out a 2.27 billion bushel carryout. Which is a massive +23% increase from the current 1.75 billion projection.
Current Balance Sheet: 186.9 Yield
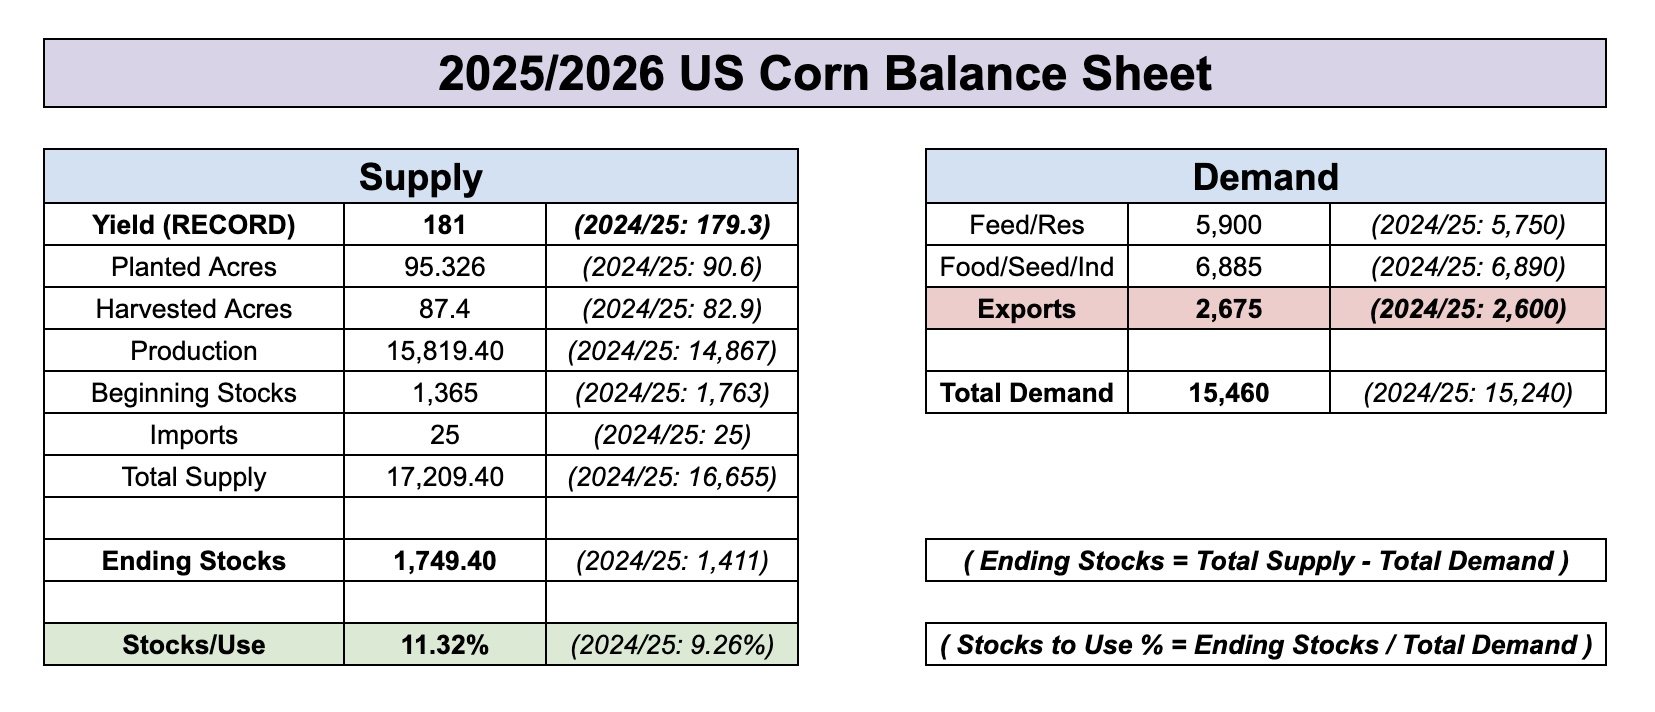
Current Balance Sheet: 181 Yield
However, it is awfully early to start plugging in a yield +6 bpa above trendline.
For starters, we have never even seen 180 bpa.
What makes you think we will see 185-187 bpa this year?
Then we also have the argument that to see a yield remotely that high, Illinois would have to have a record crop.
How do you get a number that high without Illinois having a record crop?
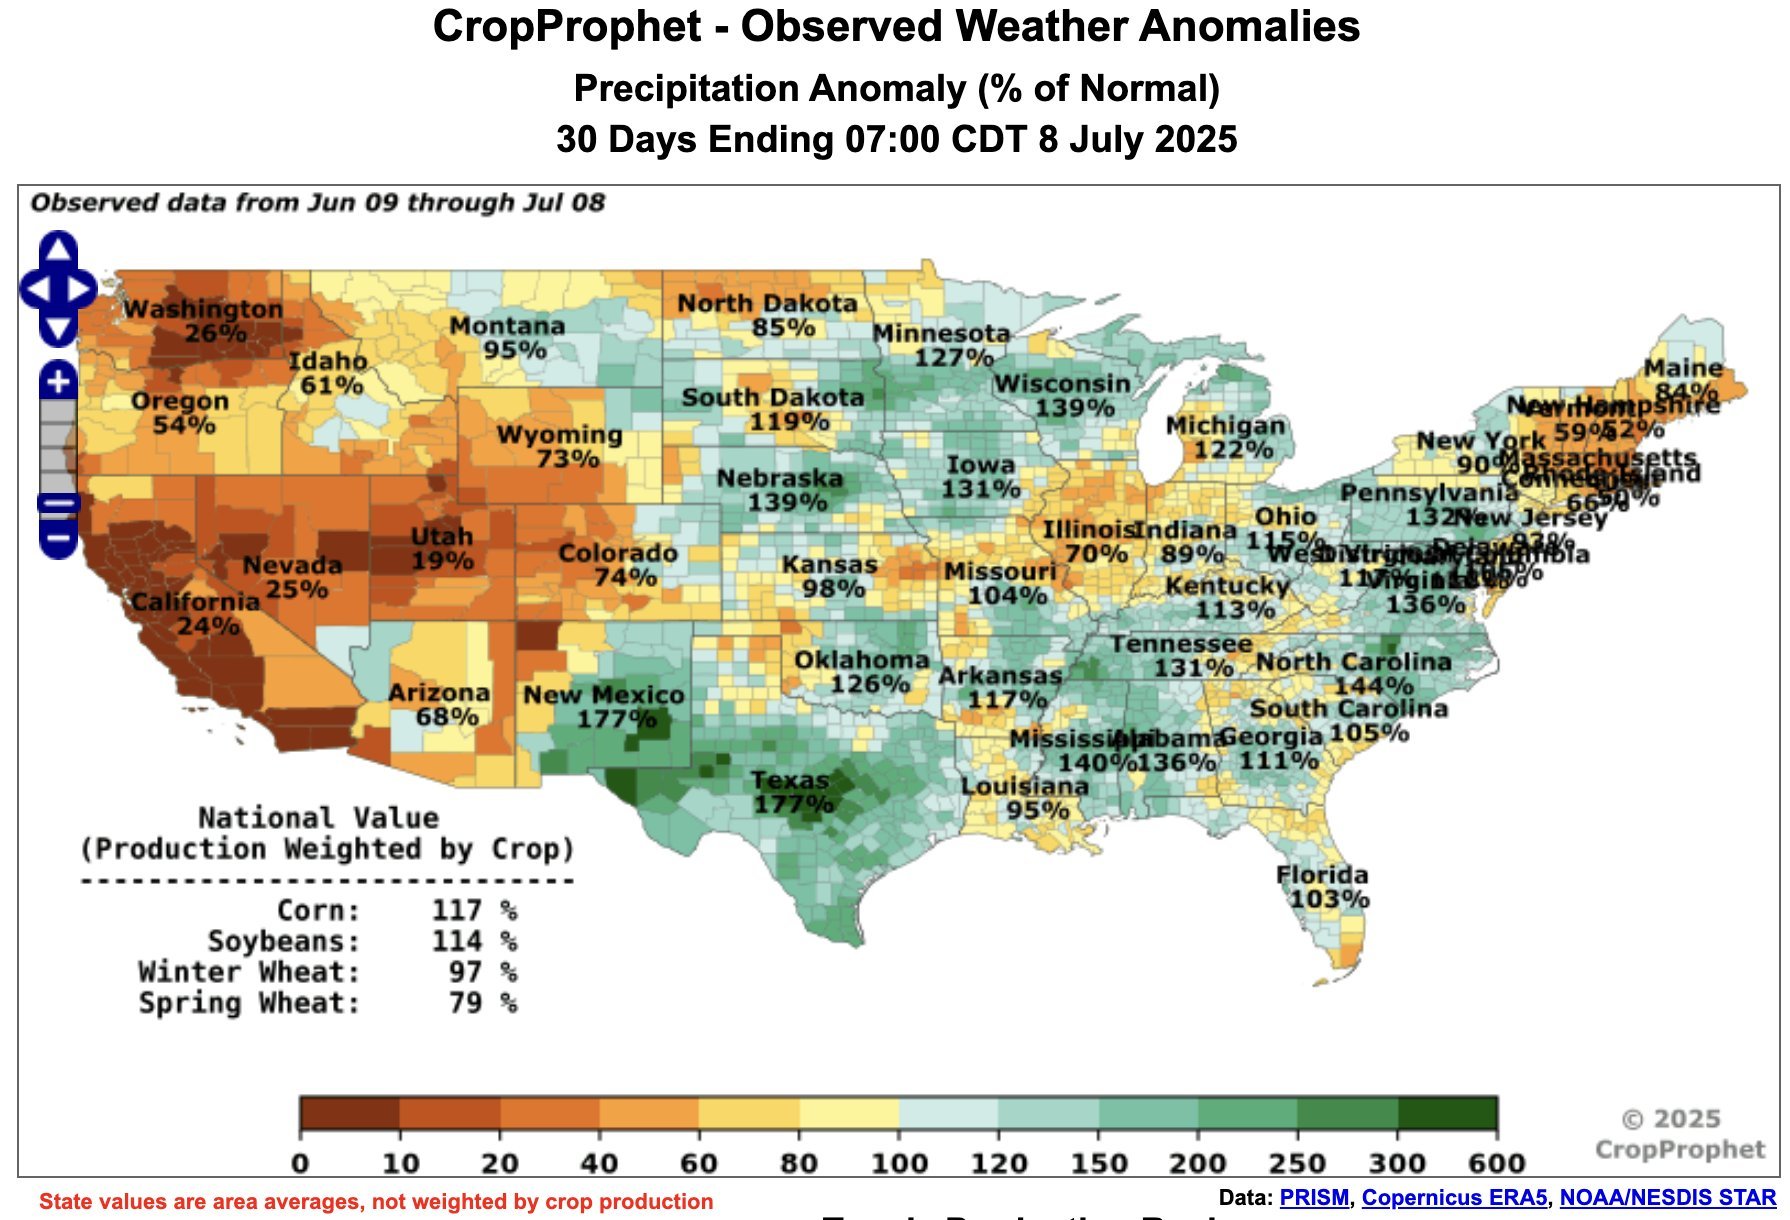
Here is the past 30 days of precip from Crop Prophet.
Most of the corn belt has seen great rain. But Illinois is the outlier.
Crop ratings with 2-3 months of weather left don’t mean a whole lot.
You could argue that in 2-3 weeks we could have a worst case secnario of a 178 yield or so if weather remains solid. But to say yield is +185 this early is nonsense.
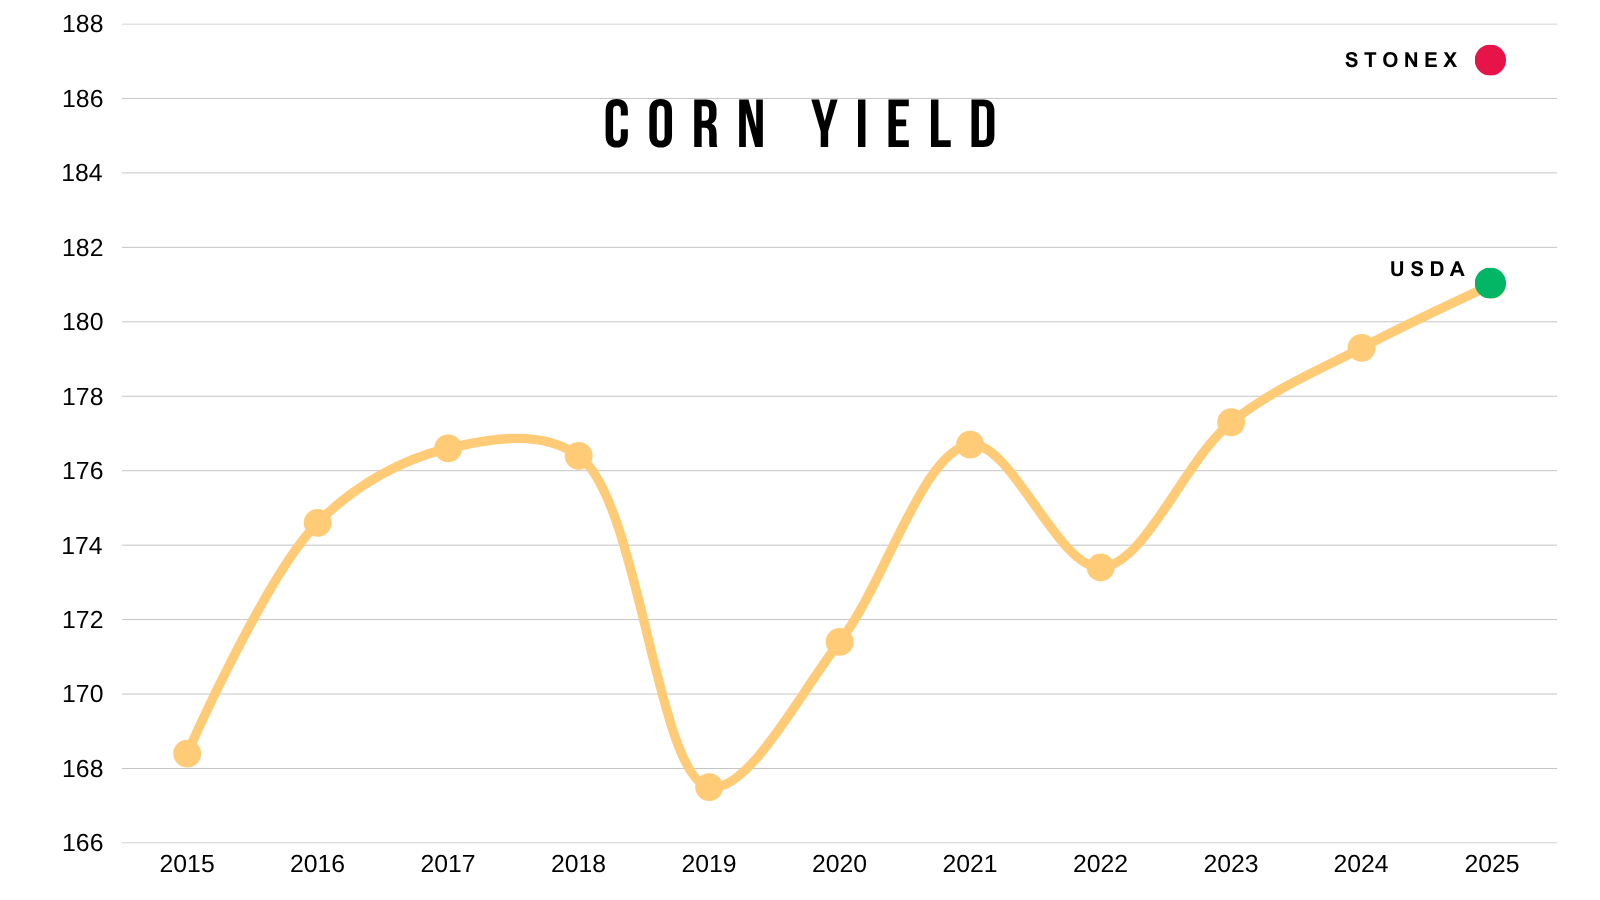
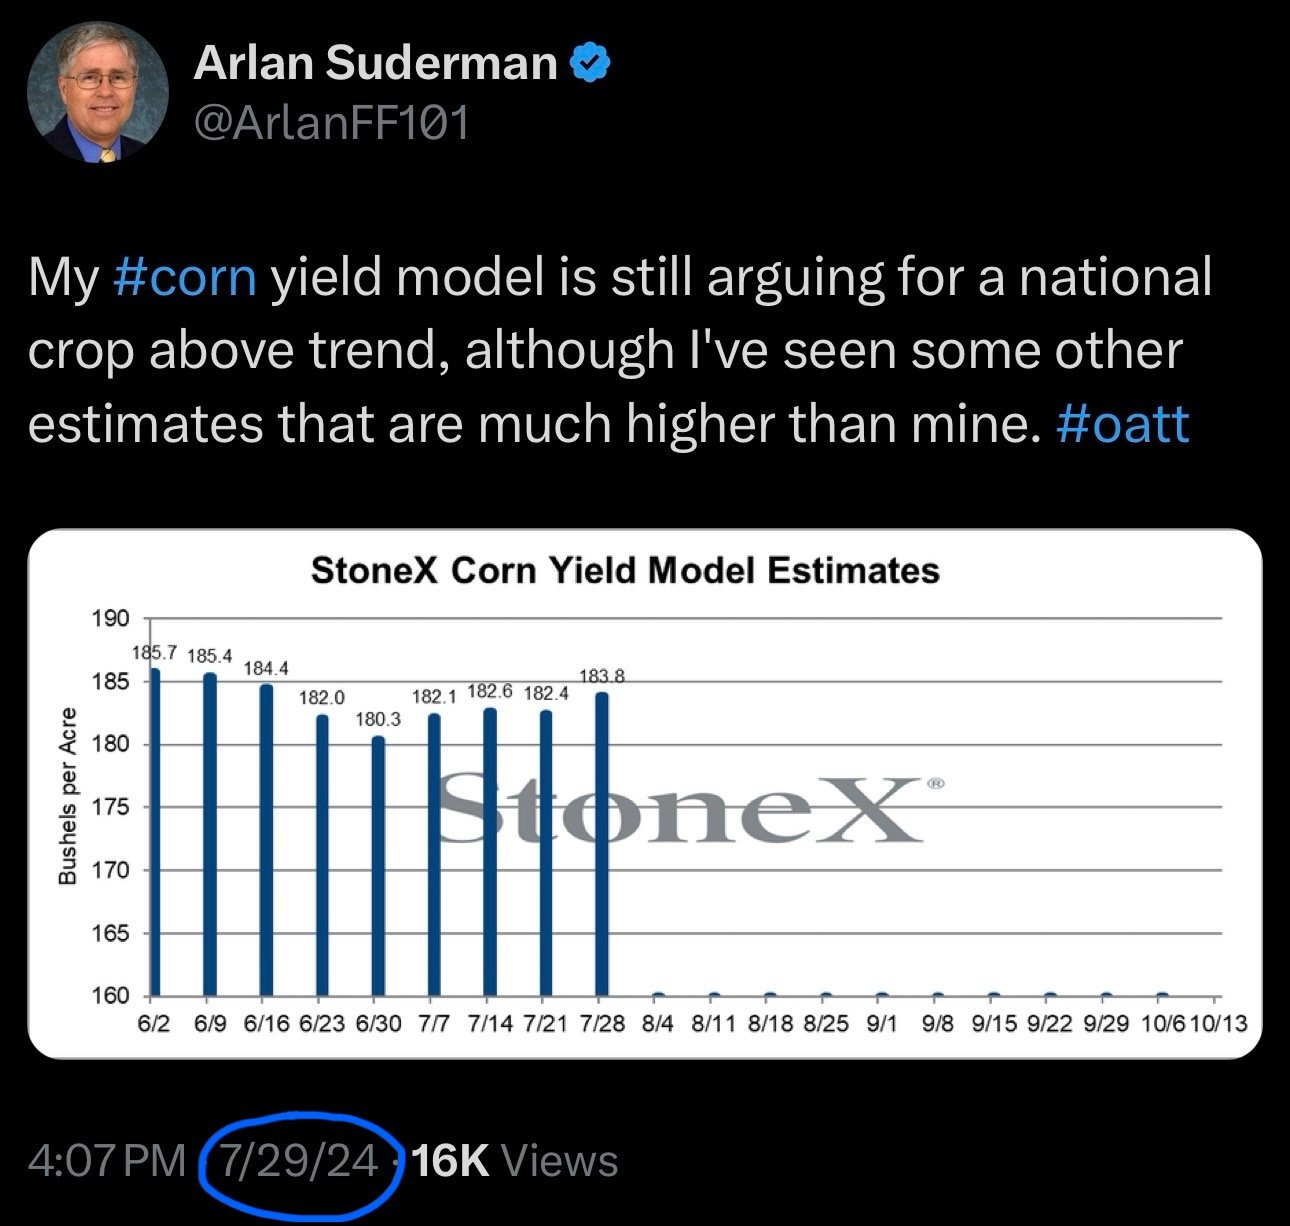
Let's look at StoneX's past estimates.
Last June they were calling for nearly 186 bpa.
Last July they were calling for 184 bpa.
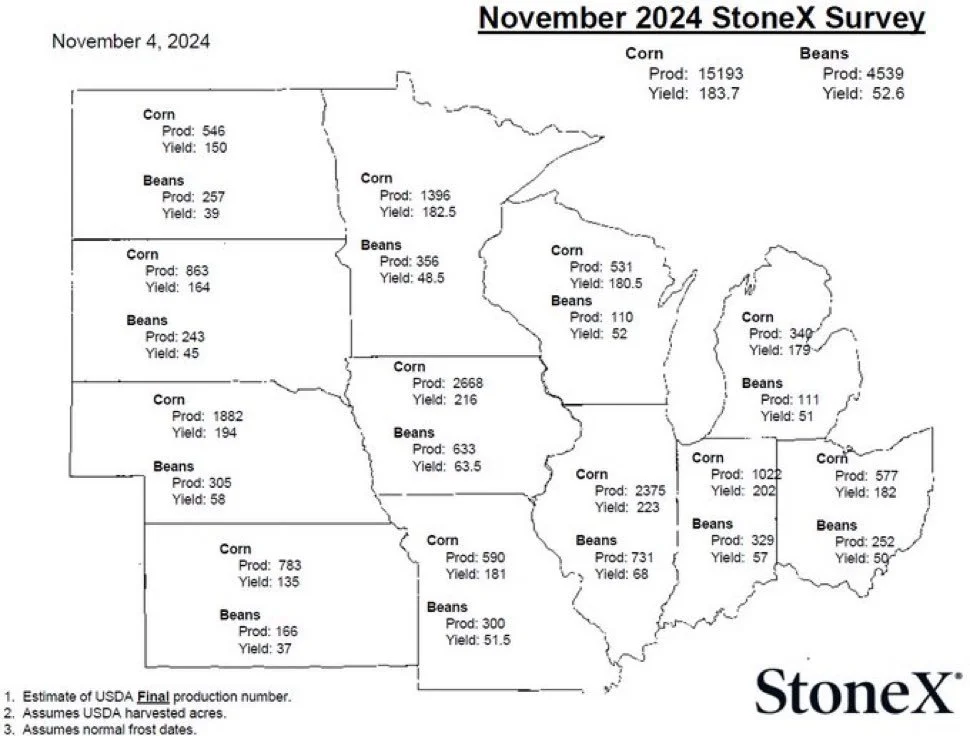
Even in November they were calling for nearly 184 corn and 52.6 beans.
Final yield was 179 and 50.7...
Here is a chart showing how yield has changed from the starting point in May to the final yield.
We haven’t finished higher than the starting point since 2018.
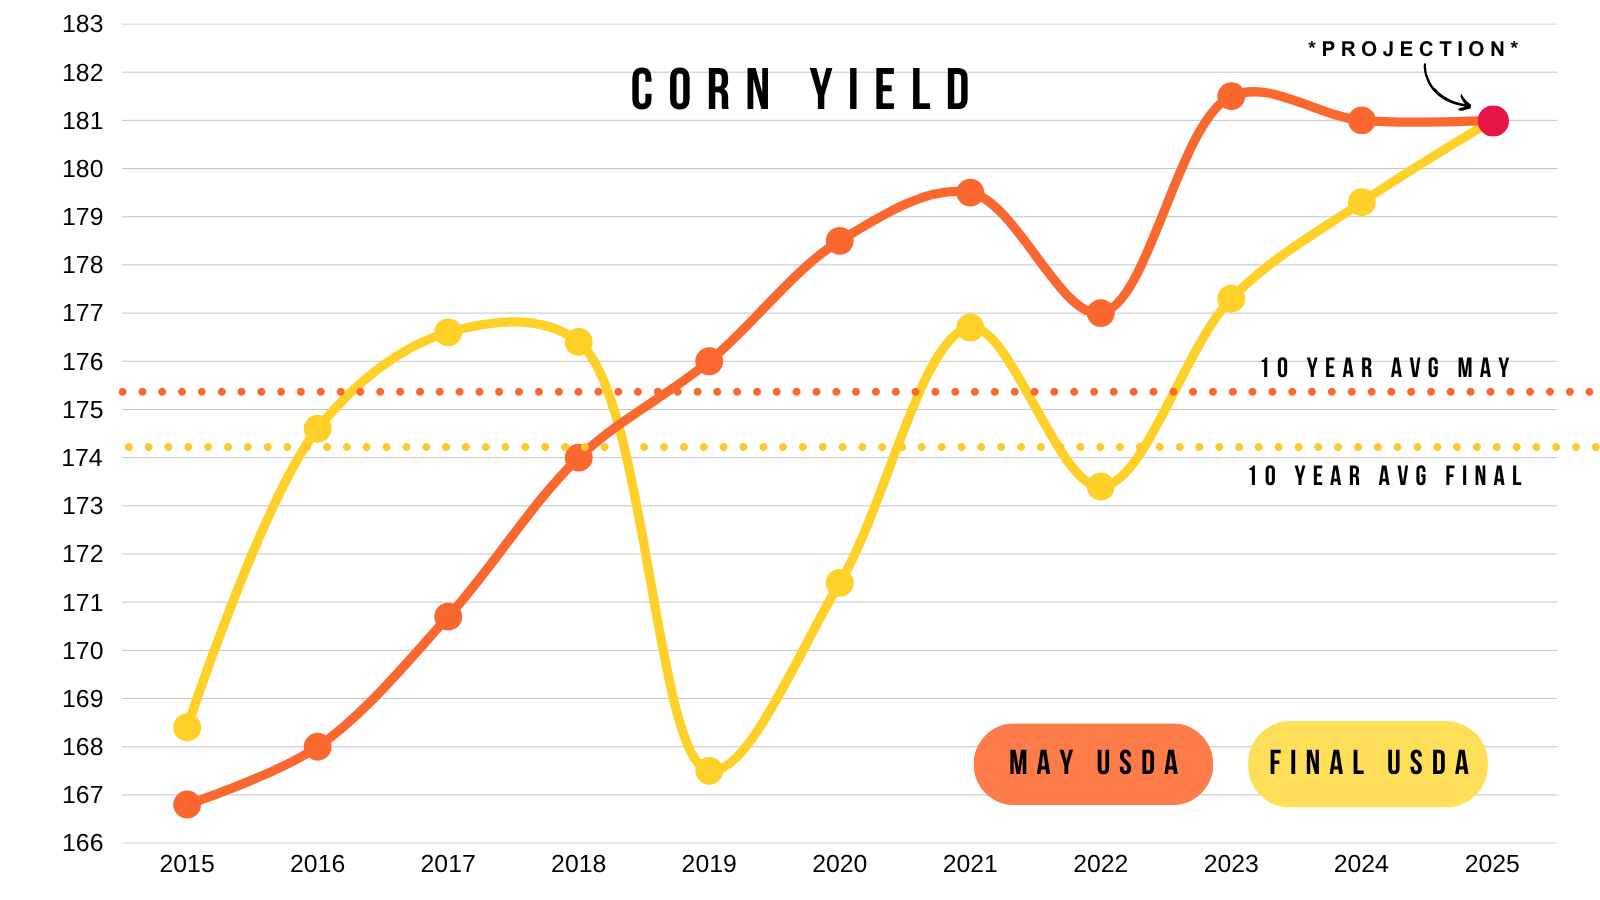
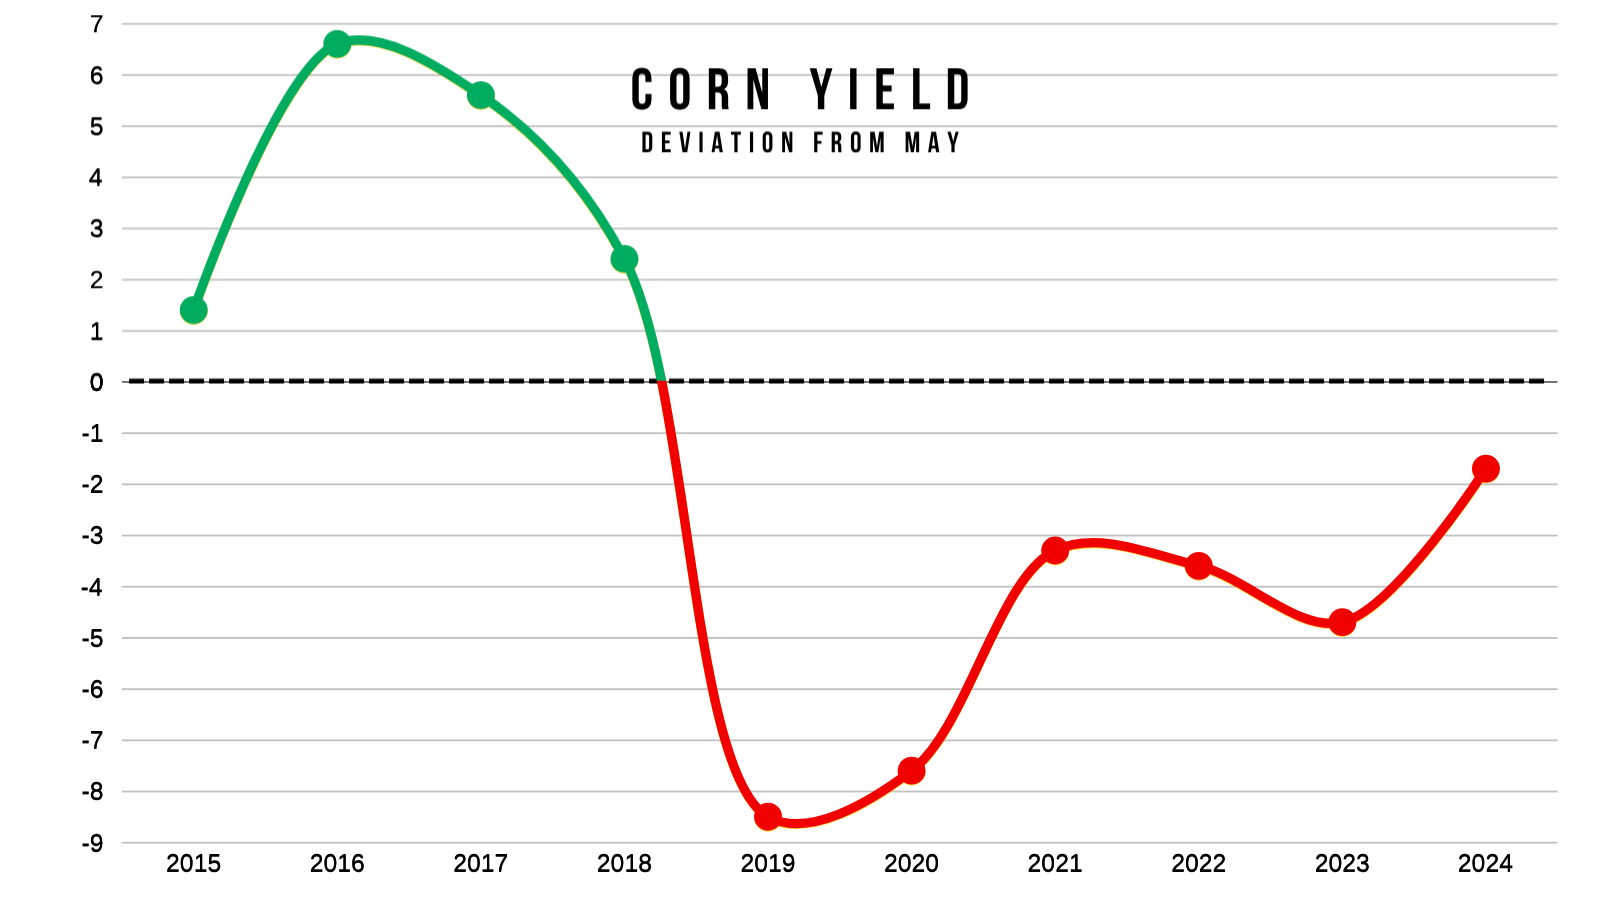
Here is another visual of that.
We haven’t came close to trend since 2018, but last year that gap was the smallest since then.
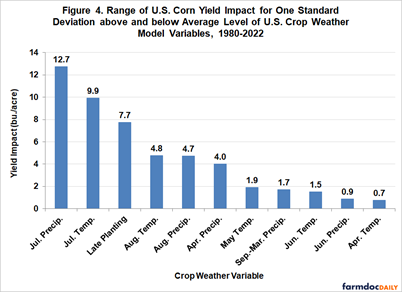
Here is a chart that ranks each months precip & temps on how it impacts corn yield.
July by far has the greatest impact on yield, followed by August.
Historically, it is probably too late to get a weather scare rally. As that usually happens in June.
But that does not mean this crop is made at all.
Take last year for example. We got zero weather rally. Yet.. the dryness in August clearly impacted corn yields even though it was not realized until later.
We could definitely see trendline yield. But to say we are going to be well above trendline this early is hard to agree with.
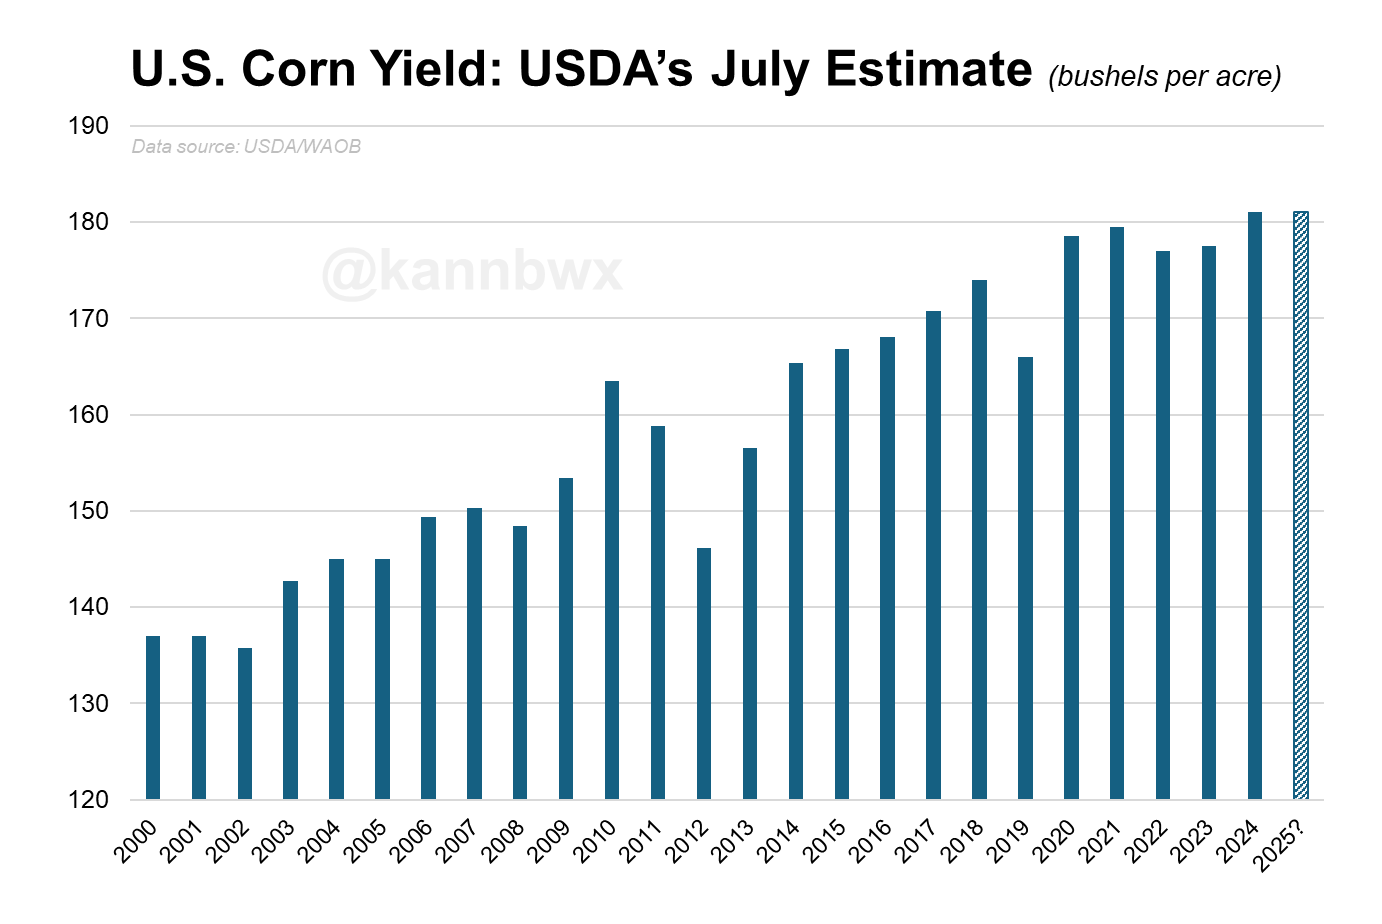
We have the USDA report out on Friday.
Will they raise yield?
It is highly doubtful they touch yield.
The last time the USDA raised yield in July was all the way back in 2003.
The USDA has never.. not once.. raised soybean yield in July.
Chart from Karen Braun
Next Cattle Targets
I have not had a cattle update in a while, really since our sell signal back at the June highs.
I wanted to share my next targets.
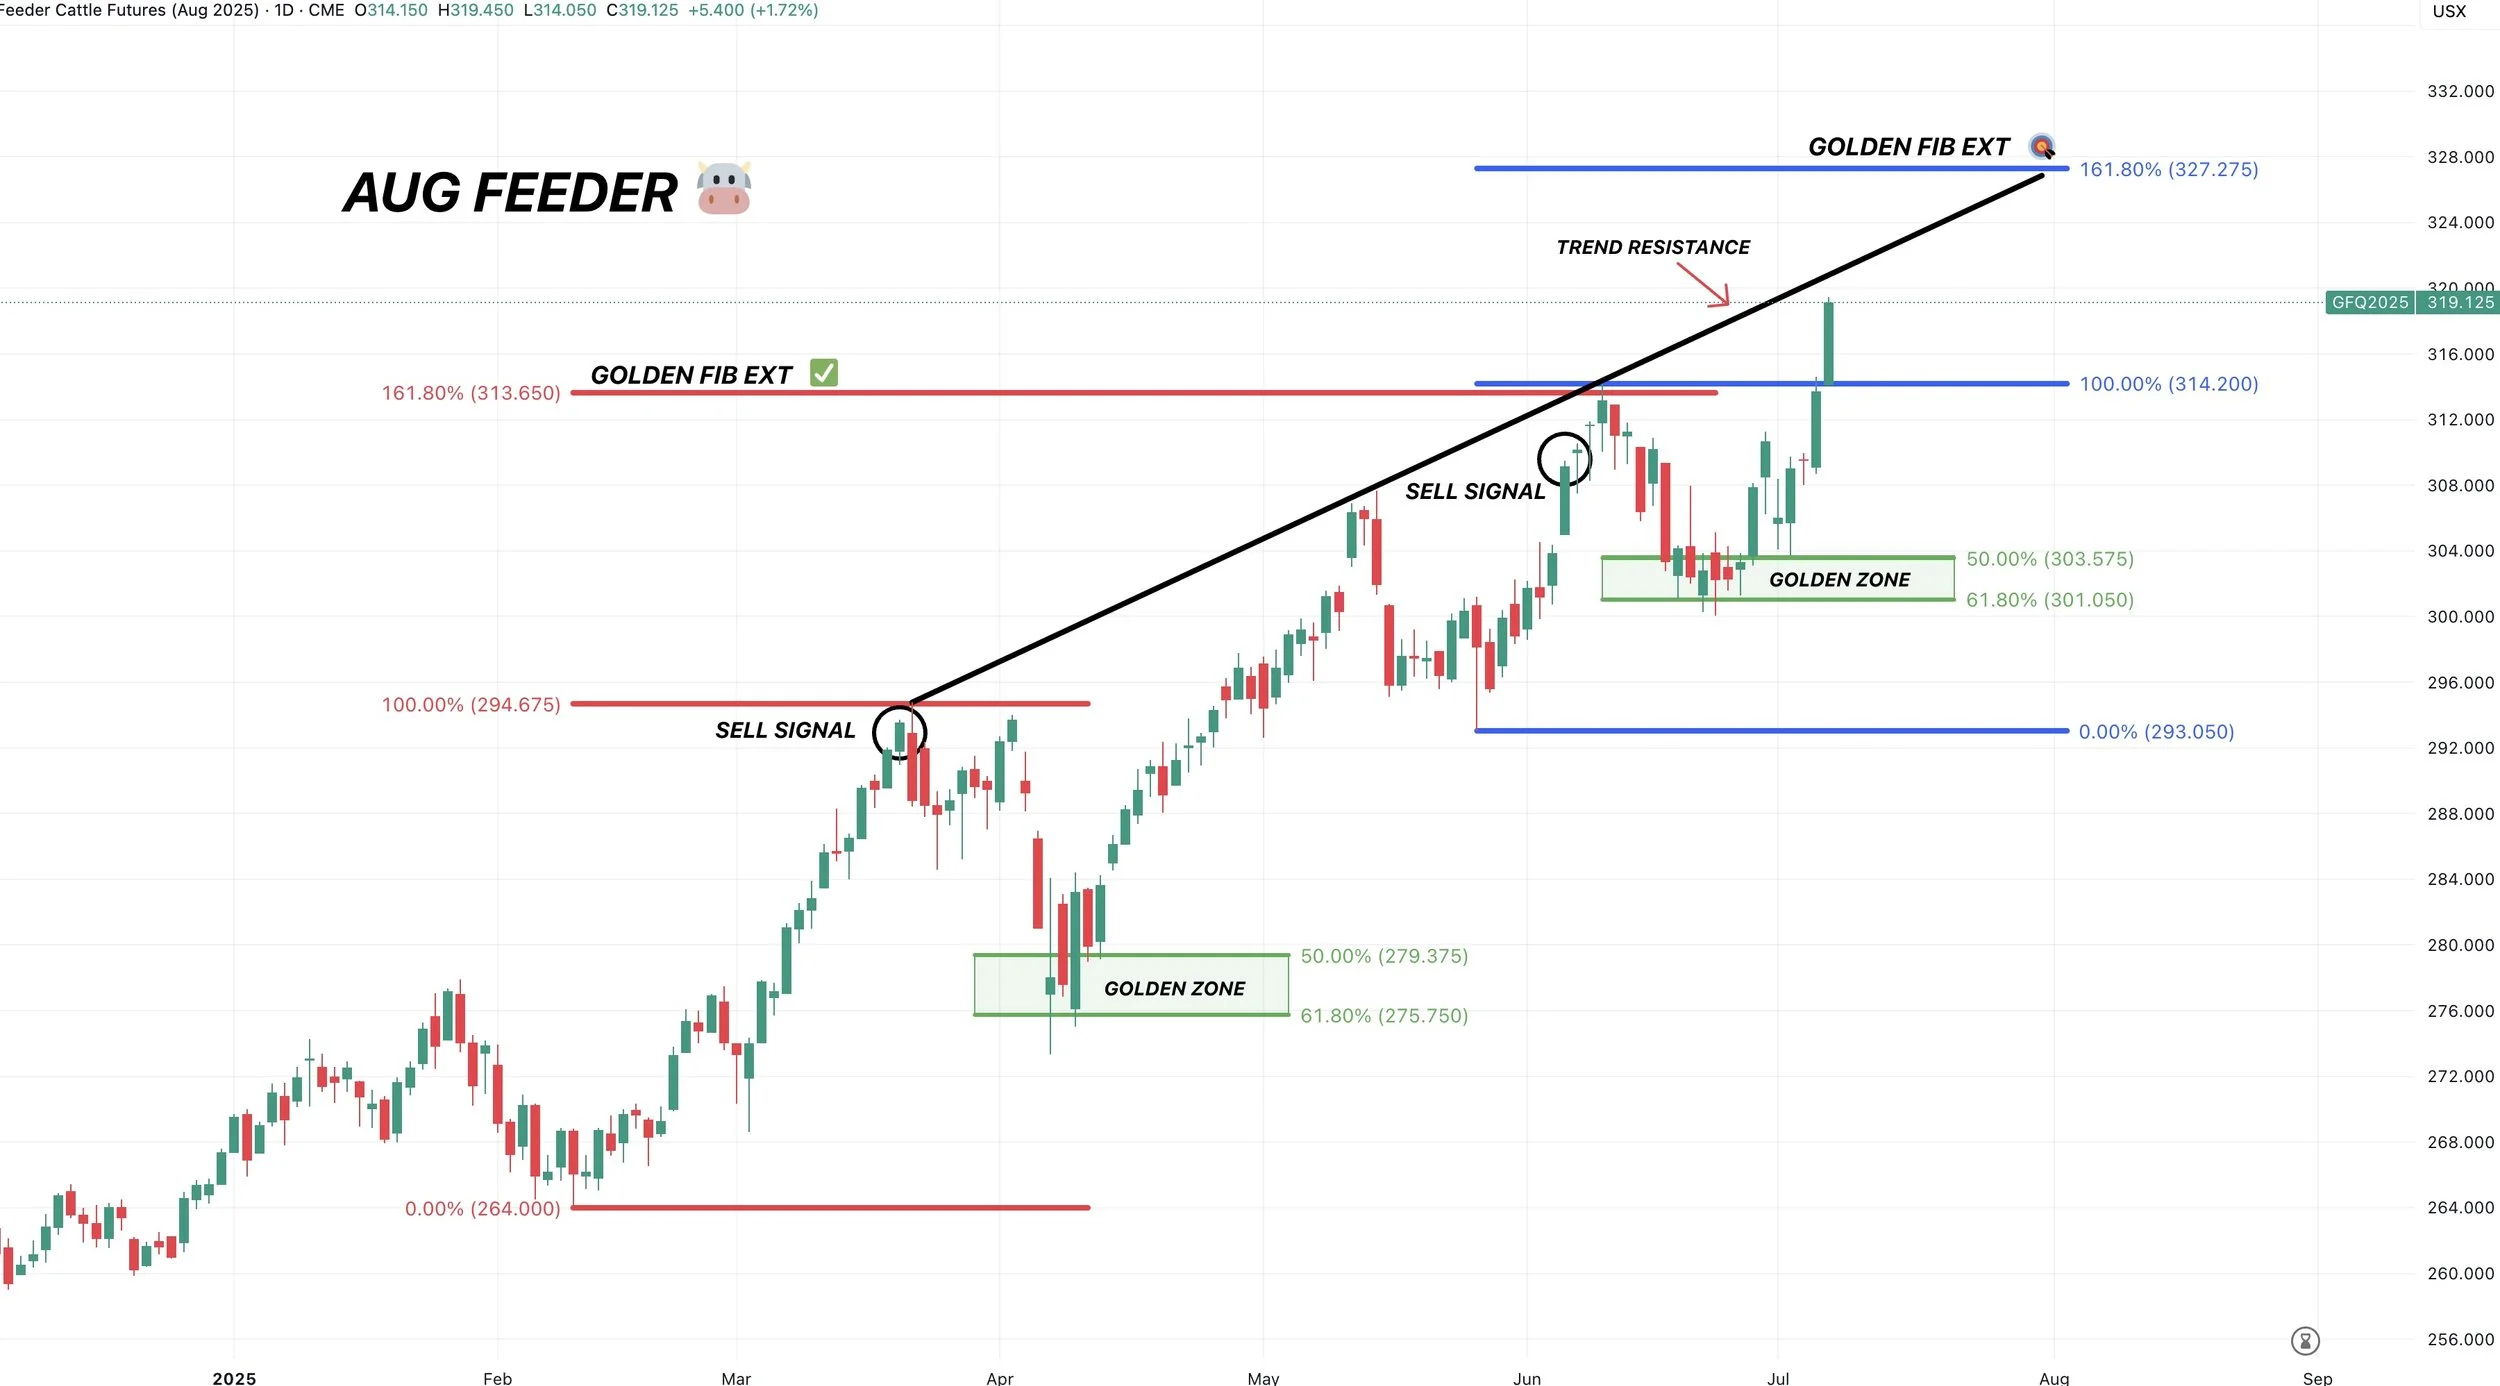
We've had 2 sell signals this year.
March 19th and June 5th.
In June, we exactly topped out at the golden fib extension target from the Feb to March rally (meaning this target equaled 161.8% of that rally).
We then came down and bounced right out of the golden zone retracement of the May to June rally (gave back 61.8% of that rally).
So our next target is going to be 161.8% of the May to June rally. Which is known as the golden fib extension.
That target comes in at 327 on Aug Feeder.
If you are someone who took advantage of our last sell signal, that is the next target.
If you are someone who did not take advantage of our last sell signal, it would probably make sense to take advantage right now of this rally. In case the next target does not hit.
As we are running into some trendline resistance here which has marked the last 3 highs.
Aug live cattle looks a little different.
We have not broken above those June highs yet.
Again, if you took advantage of our last sell signal, our next target is going to be 229. Which is the golden fib extension of the May to June rally.
If you did not take advantage of our last sell signal, now is a great time to de-risk in case it does not hit.

Todays Main Takeaways
Corn
Fundamentals:
We went over a bunch of corn fundamentals already.
But essentially, the market is simply looking at the potential for a massive crop. Thus we head lower until the market is convinced otherwise.
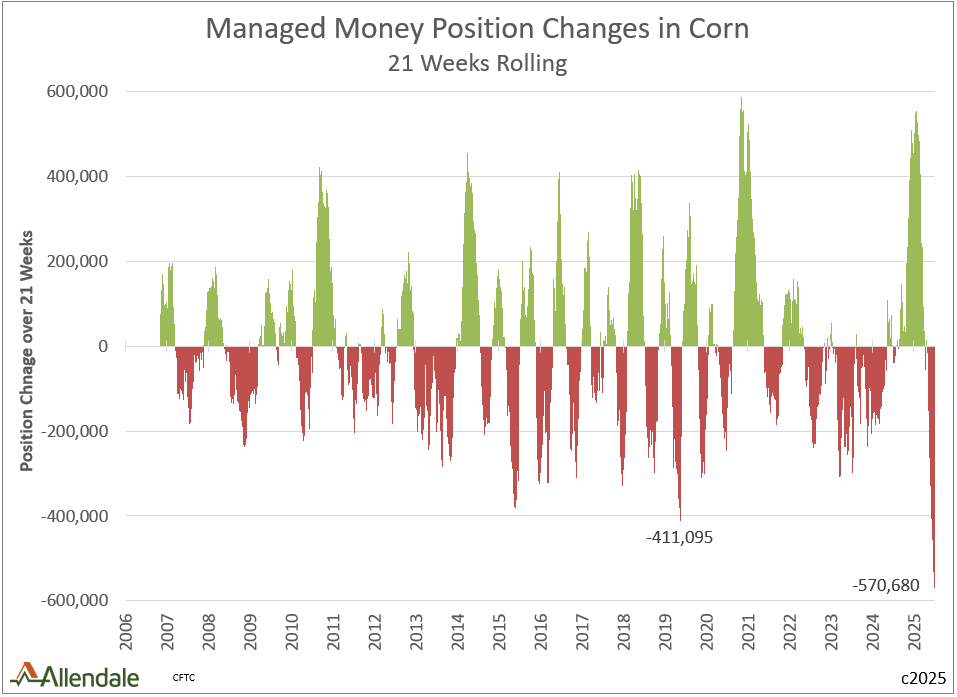
The funds need a reason to stop selling. The past 21 weeks, the funds have sold their largest amount of corn ever.
Chart from Allendale
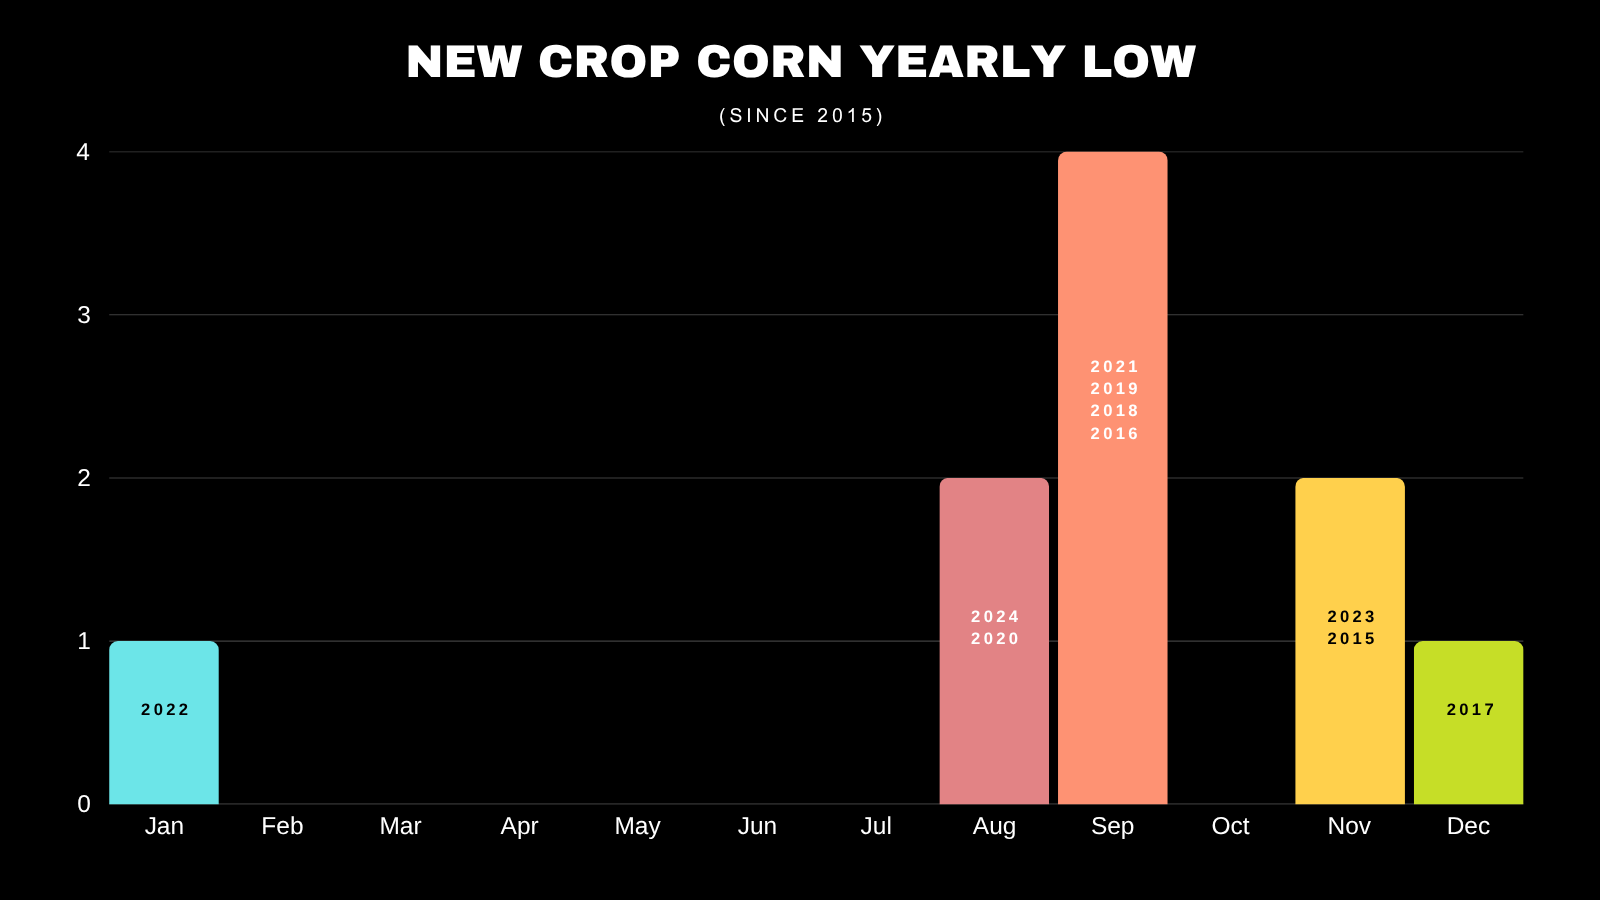
I shared this recently, but this is a month by month breakdown of when corn posted it's lowest prices for the year.
The market rarely finds it's cheapest levels in July. Doesn’t mean it "can’t" happen. But odds favor we don’t truly turn around for a month or so.
Here is the last decade.
6 of 10 years the lows were August to September. Never in July.
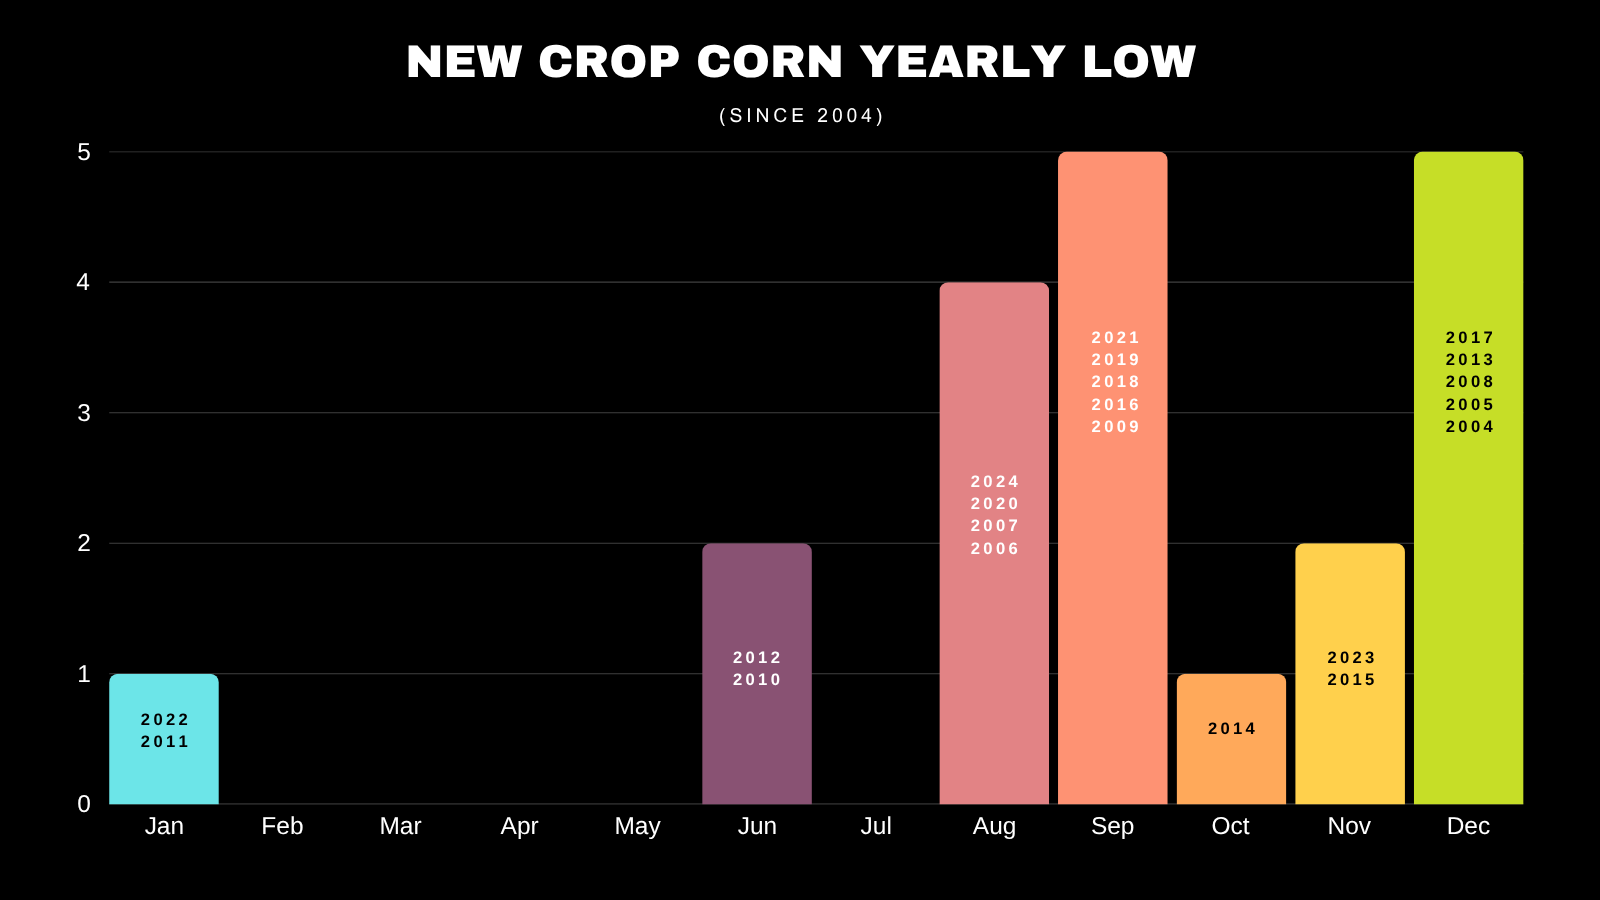
Here is the past 20 years.
Again, usually harvest time. With the exception to years where prices fell the entire year.
Just because we will probably be lower a month from now doesn’t mean we have to go "drastically" lower.
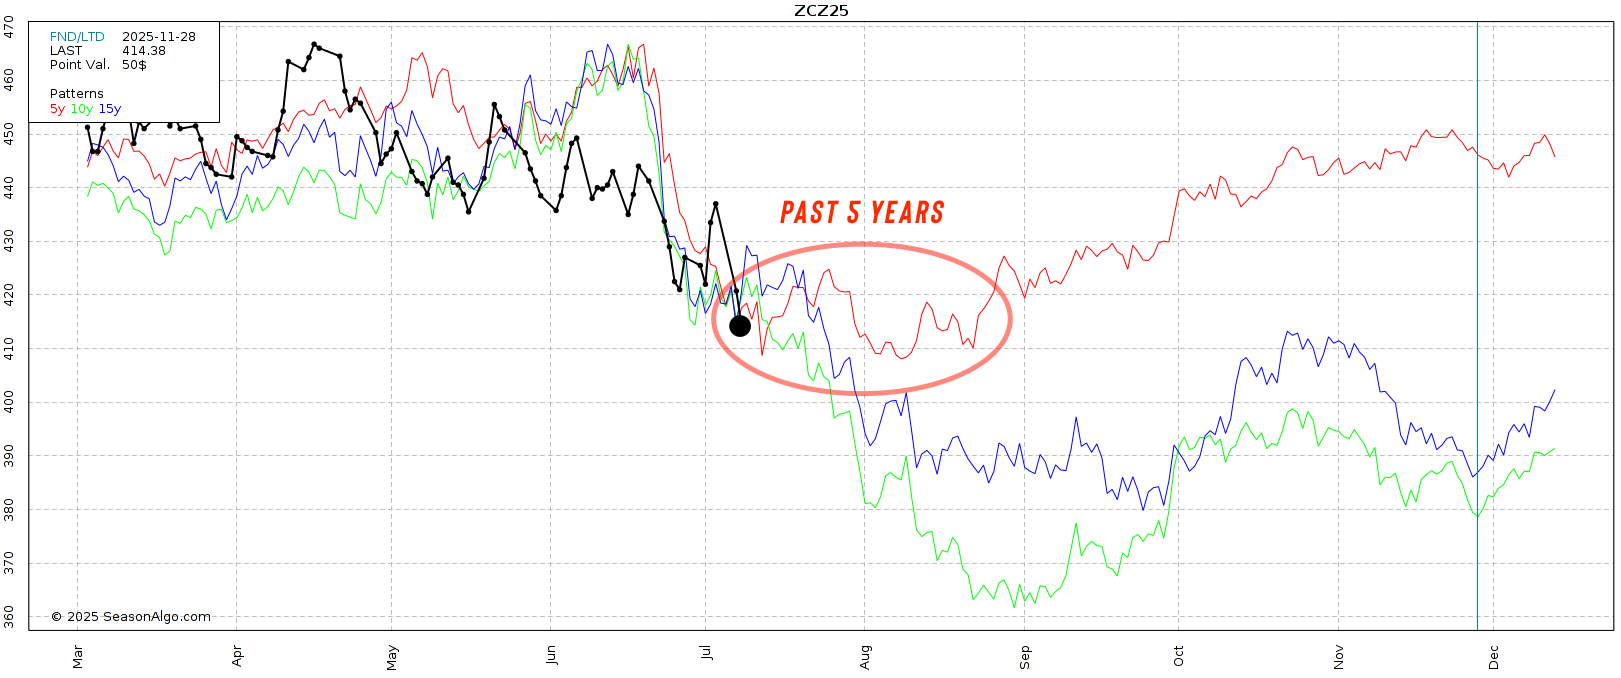
If we look at this seasonal, in recent years the corn market has been bottoming sooner and sooner compared to over the course of the last decade or two.
Matter of fact, in the 5 year seasonal our harvest lows don’t go tremendously lower than our July lows.
In this seasonal, we fall hard into July then somewhat find some footing before hovering sideways to slightly lower until going higher in August.
Where as in the 10 and 15 year seasonals, we fall apart until September.
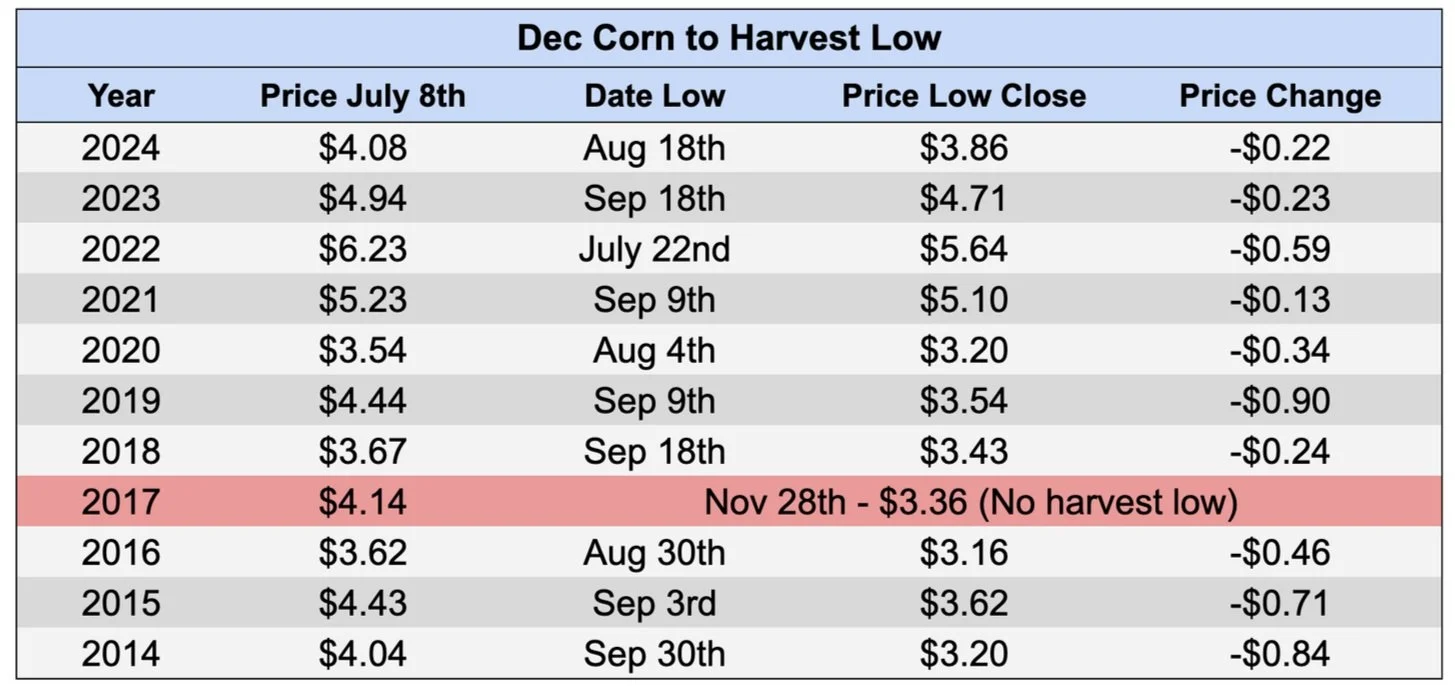
How much do we usually fall from now until our harvest lows?
That is a fickle question because all years are different.
However, over the past decade every year we have taken out our lows from July 8th (which is today).
Most harvest lows again came in August to September.
Some years suffered bigger losses than others.
However, in the past 4 years, 3 of them saw less than a -25 cent loss. (2022 we were coming off record high prices).
Technicals:
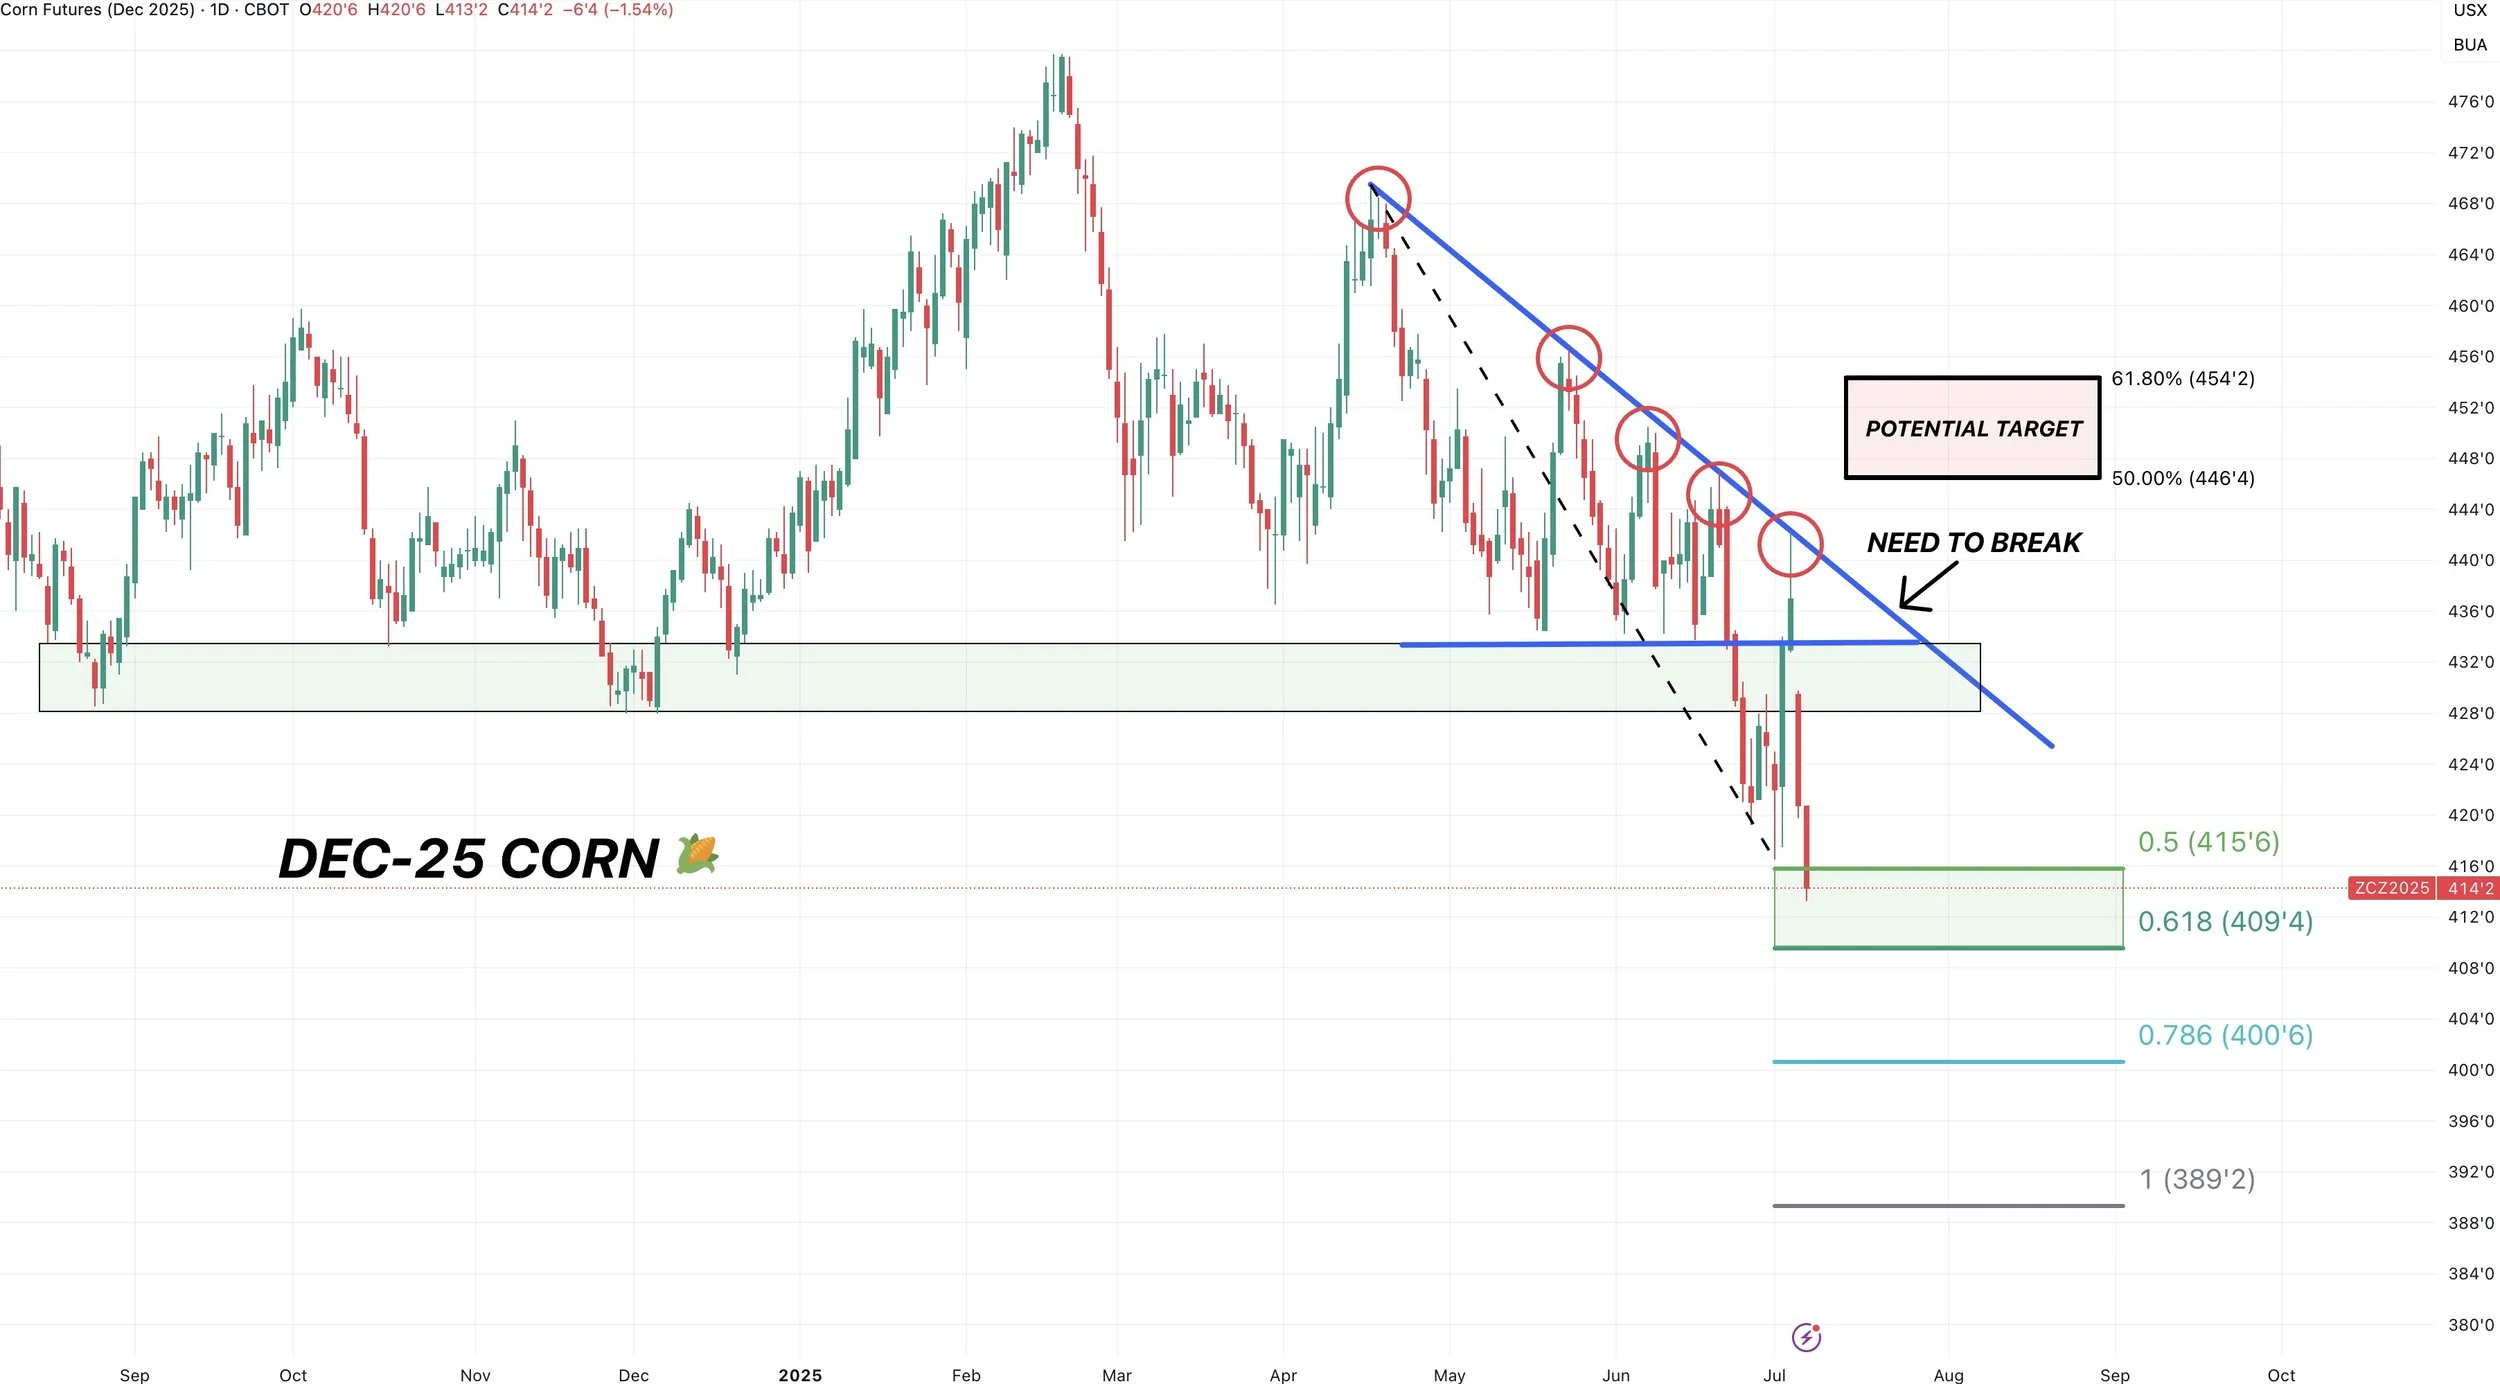
Like I mentioned last week, Dec corn perfectly rejected this downward trend line for the 5th straight time.
That is what you need to break above to get excited about this market.
Until that happens, the trend is clearly lower.
The downside fib extension targets are $4.09, $4.00, and $3.89
This is calculated by measuring the entire sell off since April, and projecting what this new sell off from the highs last week might be. (I drew a dotted line of the sell off)
Each fib is a support level. If you break one, you likely visit the next.
We broke the 50% fib (meaning this was 50% of the size of the April sell off). Next stop could be $4.09 which is 61.8%.
The 50-61.8% levels are the most common spot for a market to find some footing.
Soybeans
Fundamentals:
We've gone over several times about how yield can impact the soybean market and make the soybean situation tight fast if yield even fractionally slips.
So we're going to keep the soybean section short today and simply focus on the charts because that is the biggest thing moving forward here short term.
Soybeans still have plenty of growing season left with very little wiggle room on the balance sheets.
Technicals:
Like we talked about last week, we failed to break above a very key spot. Which was the 61.8% retracement up to the June highs (red box). As a result, we headed lower and erased the entire rally.
We are not back right at a major point in this market. Once again facing this golden zone retracement down to the April lows.
$10.10 is a MUST hold level.
1) It gives back 61.8% of the entire April to June rally
2) It was old key support countless times since harvest
3) There is no support beneath us
We have only ventured below this support twice. Both times resulted in a flush lower. So if we fail this level, it could create a cascade lower. As there is a big gap of air down to the April lows.

Sep beans are in the exact same scenario.
We have bounced at this level countless times.
In the past 2 weeks alone we have tested here 5 times.
There is a good 30-40 cent gap lower if this level fails.
If we are going to bounce, this would be the spot to do so. If not, we could be in for some pain short term.

Wheat
Fundamentals:
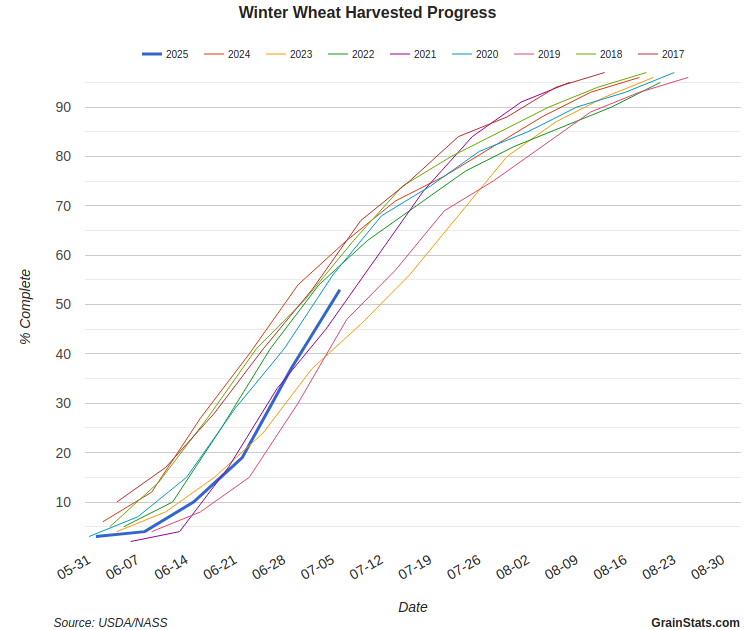
Not a ton on wheat today. Winter wheat harvest is progressing without any issues.
As it came in at 53% harvested vs the 49% estimates and 54% 5-year avg.
Typically, you will start to see harvest pressure light up once we cross 2/3rd of the way complete.
So historically speaking, we should start to see less harvest pressure here in a few weeks.
Then we should be able to start to carve out some meaningful lows.
Chart from GrainStats
Once harvest pressure is out of the way, it would make sense for the funds to start lightening up that massive short position.
Which should help the wheat market find some footing and progress higher.

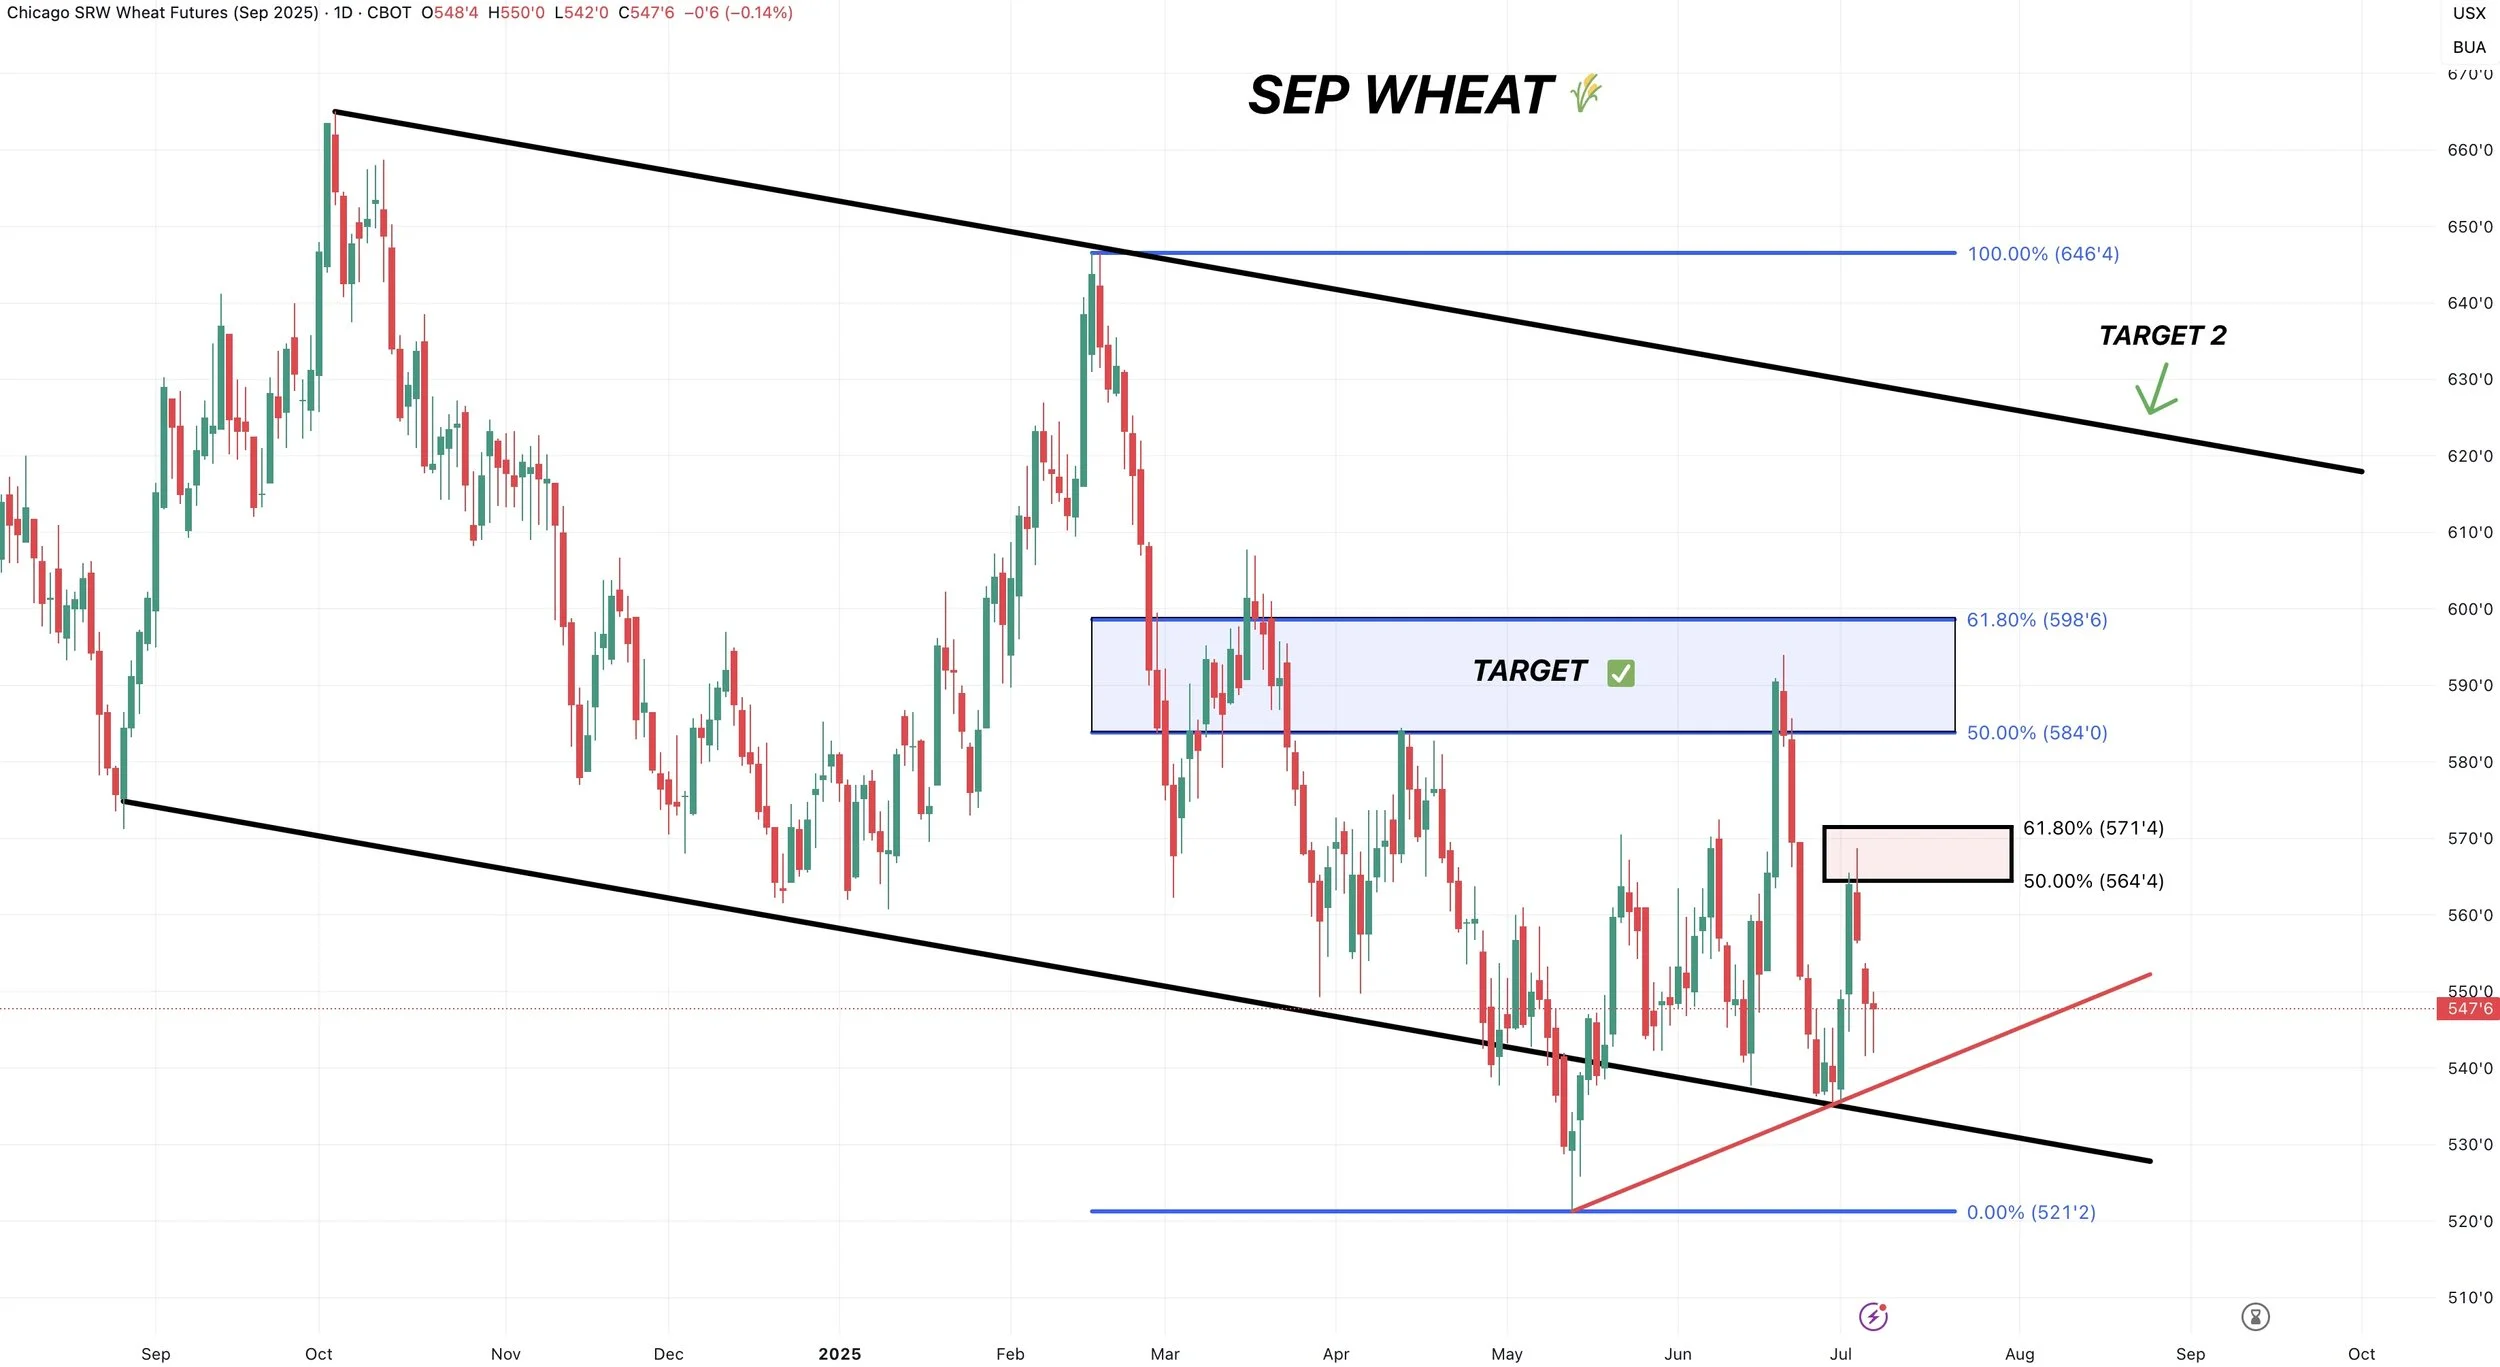
Technicals:
Chicago wheat reclaimed 50% of the June highs before rejecting.
We do still have a newly formed upward trend short term. Ideally we hold that.
Next target is still that blue box like the last target. Which claws back 50-61.8% of the Feb highs.
Big picture, we are still trapped in a massive downward channel.
KC trying to cling onto contract lows.
Resistance is going to be the green box.
Target to de-risk is still the blue box, but that box drops lower if we post contract lows because the retracement levels change.

Past Sell or Protection Signals
We recently incorporated these. Here are our past signals.
June 5th: 🐮
Cattle sell signal & hedge alert.
June 2nd: 🌾
MPLS wheat sell signal.
April 10th: 🌽
Old crop corn sell signal.
March 19th: 🐮
Cattle hedge & sell signal.
Feb 18th: 🌽 🌾
Old crop KC wheat & old crop corn signal.
Jan 23rd: 🌽 🌱
Corn & beans old crop sell signal.
CLICK HERE TO VIEW
Jan 15th: 🌽 🌱
Corn & beans hedge alert/sell signal.
Jan 2nd: 🐮
Cattle hedge alert at new all-time highs & target.
Dec 11th: 🌽
Corn sell signal at $4.51 200-day MA
CLICK HERE TO VIEW
Oct 2nd: 🌾
Wheat sell signal at $6.12 target
Sep 30th: 🌽
Corn protection signal at $4.23-26
Sep 27th: 🌱
Soybean sell & protection signal at $10.65
Sep 13th: 🌾
Wheat sell signal at $5.98
May 22nd: 🌾
Wheat sell signal when wheat traded +$7.00
Want to Talk?
Our phones are open 24/7 for you guys if you ever need anything or want to discuss your operation.
Hedge Account
Interested in a hedge account? Use the link below to set up an account or shoot Jeremey a call at (605)295-3100.
Check Out Past Updates
7/7/25
TRUMP PUMP & DUMP
7/3/25
CORN & BEANS REJECT KEY SPOT. TRUMP SPEAKS IN IOWA
7/2/25
TRADE DEALS? BEANS RALLY AT GOLDEN ZONE
7/1/25
NOW WHAT FOR GRAINS?
6/30/25
BORING USDA. DIDN’T SAY HAVE TO GO LOWER
6/30/25
USDA NUMBERS
6/27/25
ALL EYES ON MONDAY
6/26/25
FIREWORKS OR BLOOD BATH MONDAY?
6/25/25
GRAINS COLLAPSING AHEAD OF JUNE REPORT
6/24/25
CORN CONTINUES SELL OFF. MAJOR USDA REPORT COMING
6/23/25
CORN CAN GO LOWER, BUT NOT FOR FOREVER
6/20/25
WHO SHOULD REWARD THE WHEAT & SOYBEAN RALLY?
6/18/25
COMPLETE CHART BREAKDOWNS
6/17/25
SOYBEANS CONTINUE BREAKOUT. NEARING SELL SIGNAL
6/16/25
CORN HAMMERED. EPA GAME CHANGER IN BEANS?
6/13/25
SOYBEANS RALLY, CHARTS, BALANCE SHEETS & MORE
6/12/25
USDA NON-EVENT. WHAT’S NEXT?
6/11/25
DIVERGENCE & SEASONAL SELL OFF?
6/10/25
BEING PATIENT VS BALANCING YOUR RISK
6/9/25
WHAT IF WE DON’T GET A WEATHER SCARE?
6/5/25
CORN & BEANS HOLDING CRUCIAL SPOTS
6/5/25
CATTLE SELL SIGNAL & HEDGE ALERT
6/4/25
HOW UNKNOWNS IMPACT MARKETING DECISIONS
6/3/25
KEY SPOTS ON THE CHARTS FOR CORN & BEANS
6/2/25
NEW LOWS IN CORN. DE-RISKING MPLS WHEAT
6/2/25
SPRING WHEAT SELL SIGNAL
5/30/25
SEASONAL RALLY STILL IN THE CARDS?
5/29/25
WHAT IS YOUR PLAN IF WE DO NOT RALLY?
5/28/25
ZERO PREMIUM IN THE GRAIN MARKETS
5/27/25
CORN CONDITIONS DISAPPOINT & JUNE OUTLOOK IMPROVES
5/23/25
TARIFFS SPOOK MARKET. GAME PLAN MOVING FORWARD
5/22/25
CHART BREAKDOWNS & TARGETS
5/21/25
RISK TO THE UPSIDE WITH WEATHER?
5/20/25
WHEAT SHORT COVERING & HISTORY OF YIELD CHANGES
5/19/25
ANYONE LEFT TO SELL WHEAT? 181 CORN YIELD POSSIBLE?
5/16/25
FUNDS SHORT CORN. MARKETS WAITING ON WEATHER
5/15/25
BEANS HAMMERED ON RUMOR & WHEAT FINDING LIFE
5/14/25
DECISIONS & POSSIBILITIES IN GRAINS
5/13/25
GRAINS RALLY OFF LOWS
5/12/25
USDA REPORT. HOW THIS CHANGES THINGS
5/9/25
BIGGEST RISKS IN USDA REPORT
5/8/25
USDA MONDAY & HISTORY OF WEATHER RALLIES
5/7/25
NEW 2025 LOWS FOR CORN
5/6/25
WHAT’S A SUMMER RALLY LOOK LIKE?
5/5/25
CORN ERASES ENTIRE APRIL RALLY
5/2/25
SELL INTO UNCERTAINTY. NOT KNOWN FACTORS
5/1/25
THE CASE AGAINST A FEB TOP IN CORN
4/30/25
APPROACHING KEY TIME PERIOD FOR GRAINS
4/29/25
PLANTING & FIRST NOTICE DAY PRESSURE. CORN CLOSE TO BOTTOM?
4/28/25
CAPTURING INVERSE & SEASONAL PREPARATION
4/25/25
HOW OFTEN DOES CORN NOT BREAK APRIL HIGHS?
4/24/25
KNOW WHEN TO SELL. BEANS BREAK 200-DAY FIRST TIME IN 483 DAYS
4/23/25
MONEY FLOW & DROUGHT CARDS
4/22/25
CRUCIAL SPOT FOR CORN & BEANS
4/21/25
NO PLANTING THREAT YET
4/18/25
POTENTIAL OPPORTUNITIES, BASIS CONTRACTS & STRATEGIES
4/16/25
HOW YIELD IMPACTS CARRYOUT. MAJOR SPOT FOR SOYBEANS
4/15/25
TOTAL CHART BREAKDOWNS & TARGETS
4/14/25
TECHNICAL SELLING IN GRAINS
4/11/25
SPECIFIC GRAIN MARKETING DECISIONS
4/10/25
USDA REPORT. HOW THIS IMPACTS CORN
4/9/25
TARIFFS GIVE. TARIFFS TAKE
4/8/25
CORN’S DIVERGING STRENGTH
4/7/25
SOLID PRICE ACTION DESPITE OUTSIDE FEAR
4/4/25
CORN PRICE ACTION SPEAKS VOLUME. ANY HOPE LEFT FOR SOYBEANS?
4/3/25
WHAT IS LEFT FOR CORN BEARS? TRADE WAR: CHARTS HOLDING SUPPORT
4/2/25
SHOULD UNKNOWNS KEEP A FLOOR UNDER GRAIN PRICES?
4/1/25
HOW DO ACRES IMPACT FUTURE OF THE GRAINS?
3/31/25
USDA REPORT: NOW WHAT?
3/28/25
ALL EYES ON USDA
3/27/25
PRE-USDA POSITIONING. DON’T GIVE GRAIN AWAY
3/26/25
HISTORY OF MARCH INTENTIONS. SOYBEANS UNDERVALUED?
3/25/25
6 DAYS UNTIL MAJOR USDA REPORT
3/24/25
HOW TO POSITION YOURSELF BEFORE PLANTING
3/21/25
REASONS TO BE OPTIMISTIC IN GRAINS?
3/20/25
WAS THAT THE BOTTOM IN CORN?
3/19/25
THE PATH HIGHER & THE DOWNSIDE RISKS IN GRAINS
3/18/25
SEASONALS, CATTLE HEDGE, CHARTS & DROUGHT?
3/17/25
WHEAT RALLIES. DON’T GET BACKED INTO A CORNER
3/14/25
MARCH 31ST REPORT THOUGHTS & WHAT’S NEXT FOR GRAINS
3/13/25
EXPLAINING RE-OWNERSHIP VS COURAGE CALLS
3/12/25
TARIFF FEARS. EU, CANADA, & ETHANOL
3/11/25
USDA SNOOZE. RECORD FUND SELLING A CONCERN?
3/10/25
USDA TOMORROW. GETTING COMFORTABLE IN MARKETING
3/7/25
HOW TIGHT IS THE WORLD & US SITUATION?
3/6/25
TARIFFS PUSHED BACK. FUTURE OPPORTUNITIES?
3/5/25
IS GRAINS BIGGEST RISK WEAK CRUDE & DEFLATION?
3/4/25
TRADE WAR BEGINS. 8TH DAY OF PAIN FOR GRAINS
3/3/25
TARIFFS ON TOMORROW. BUY SIGNAL
3/3/25
BUY SIGNAL
2/28/25
WHEN WILL THE BLEEDING STOP?
2/27/25
CORN AT CRITICAL SPOT. USDA ACRE REPORT. WAY TOO EARLY DROUGHT TALK
2/26/25
HISTORY SUGGESTS CORN TOP ISN’T IN? ACRE OUTLOOK TOMORROW
2/25/25
POSITIVE CLOSE. WHAT TO KNOW ABOUT USDA OUTLOOK
2/24/25
USDA OUTLOOK, FIRST NOTICE DAY & BRAZIL
2/21/25
WHAT TO EXPECT MOVING FORWARD IN GRAINS
2/20/25
FIRST NOTICE DAY CONCERNS. MASSIVE CORN ACRES OR NOT?
2/19/25
HOW TIGHT IS THE CORN SITUATION?
2/18/25
MORE DETAILS ON TODAYS SELL SIGNAL
2/18/25
OLD CROP KC WHEAT & CORN SELL SIGNAL
2/14/25
WHEAT BREAKING OUT ON WEATHER RISK. TECHNICALS & FUNDAMENTALS
2/12/25
GLOBAL GRAIN SITUATION, ACRE TALK, CHARTS & MORE
2/11/25
USDA: NOT A BEARISH REPORT. DISAPPOINTING PRICE ACTION
2/10/25
USDA TOMORROW. LONG TERM PATH FOR SUB 10% CORN STOCKS TO USE?
2/7/25
WHY WOULD THE FUNDS EXIT THEIR LONGS?
2/6/25
WHEAT FINALLY CATCHING A BID
2/5/25
COMPLETE THOUGHTS ON MARKETS: BACK & FORTH DISCUSSION
2/4/25
STRONG JANUARY LEAD TO STRONG YEAR? TARIFFS, CHARTS & MORE
2/3/25
TARIFFS PUSHED BACK
1/31/25
TARIFF NEWS ALL OVER THE PLACE. ARE YOU PREPARED FOR POSSIBILITIES?
1/30/25
WHEAT BULL ARGUMENT. TRUMP ADDS TARIFFS
1/29/25
CORN APPROACHES $5.00
1/28/25
TARIFFS, CORN FUNDS, SOUTH AMERICA & MORE
1/27/25
HEALTHY CORRECTION WE TALKED ABOUT & TARIFF NEWS
1/24/25
GRAINS DUE FOR SHORT TERM CORRECTION?
1/23/25
OUR ENTIRE NEW CROP SALES THOUGHTS & OLD CROP SELL SIGNAL
1/22/25
GRAINS TAKE A BREATHER. IS CORN IN A BULL OR BEAR MARKET?
1/21/25
HUGE DAY IN GRAINS. WHAT TO DO WITH OLD CROP VS NEW CROP
Read More
1/20/25
VIDEO CHART UPDATE
1/17/25
TRUMP, CHINA, ARGY & USING THE SPREADS INVERSE
1/16/25
OLD CROP LEADS US LOWER. MARKETING THOUGHTS
1/15/25
SIGNAL & HEDGE ALERT QUESTIONS EXPLAINED. IS $6 CORN EVEN POSSIBLE?
1/14/25
MORE DETAILS ON TODAYS HEDGE ALERT & SELL SIGNAL
1/14/25
CORN & SOYBEANS HEDGE ALERT/SELL SIGNAL
1/13/25
USDA GAME CHANGER OR NOT?
1/10/25
BULLISH USDA FOR CORN & BEANS
1/9/25
USDA OUT TOMORROW
1/8/25
2 DAYS UNTIL USDA. BE PREPARED
1/7/25
THE HISTORY OF THE JAN USDA & MORE
1/6/25
MAJOR USDA REPORT FRIDAY
Read More
1/3/25
UGLY DAY ACROSS THE GRAINS
1/2/25