
CORN & BEANS HOLDING CRUCIAL SPOTS
MARKET UPDATE
You can scroll to read the usual update as well. As the written version is the exact same as the video.
Timestamps for video:
Overview: 0:00min
Cattle: 4:00min
Corn: 4:50min
Beans: 10:35min
Wheat: 13:30min
Want to talk about your situation?
(605)295-3100
Futures Prices Close
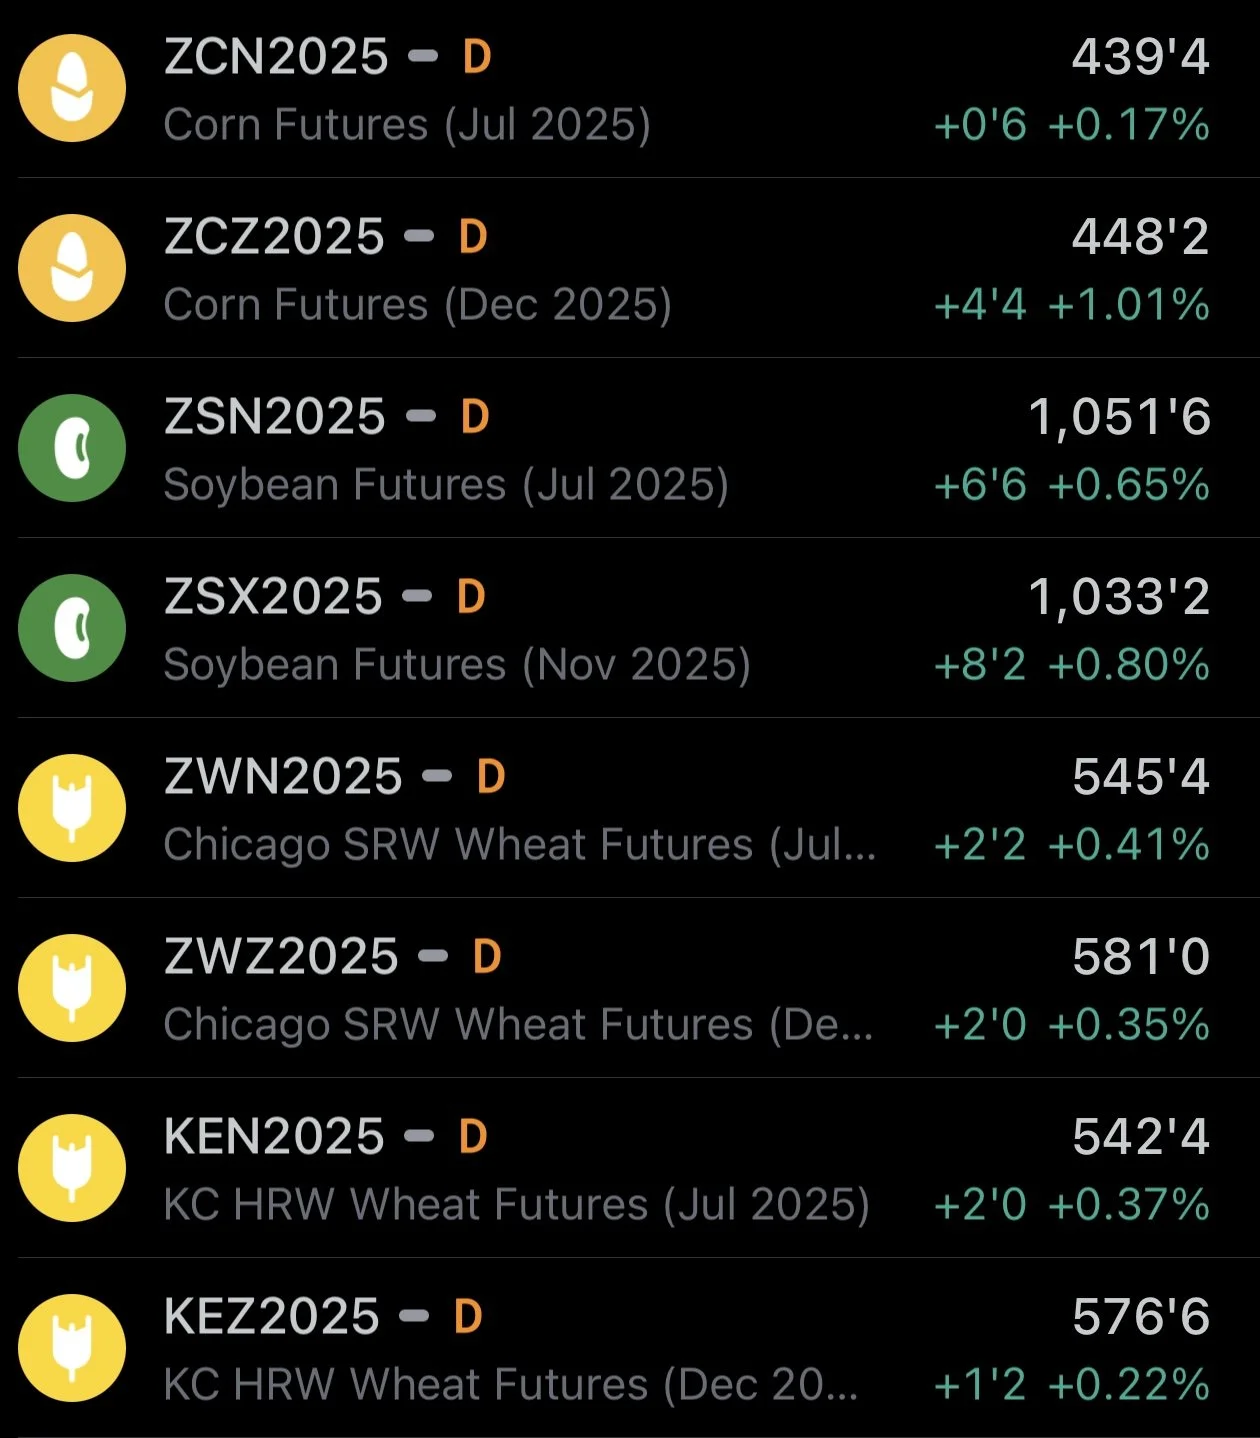
Overview
Grains higher across the board as soybeans lead the way.
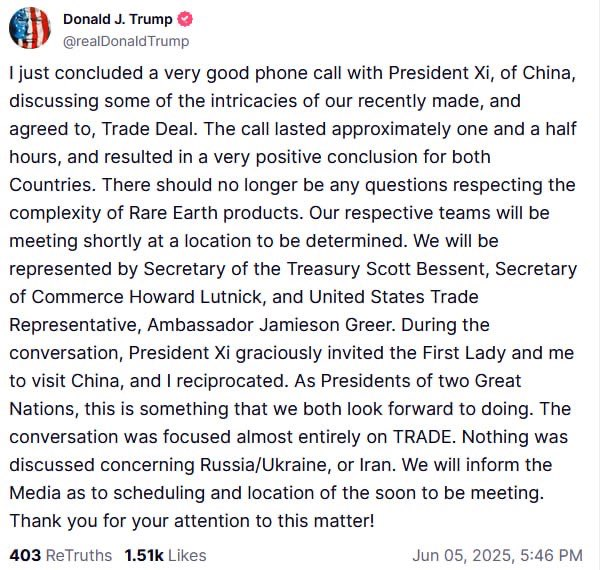
Soybeans found technical strength along with some optimism surrounding the whole China trade war situation.
As Trump and China had a call today and he claims it went well.
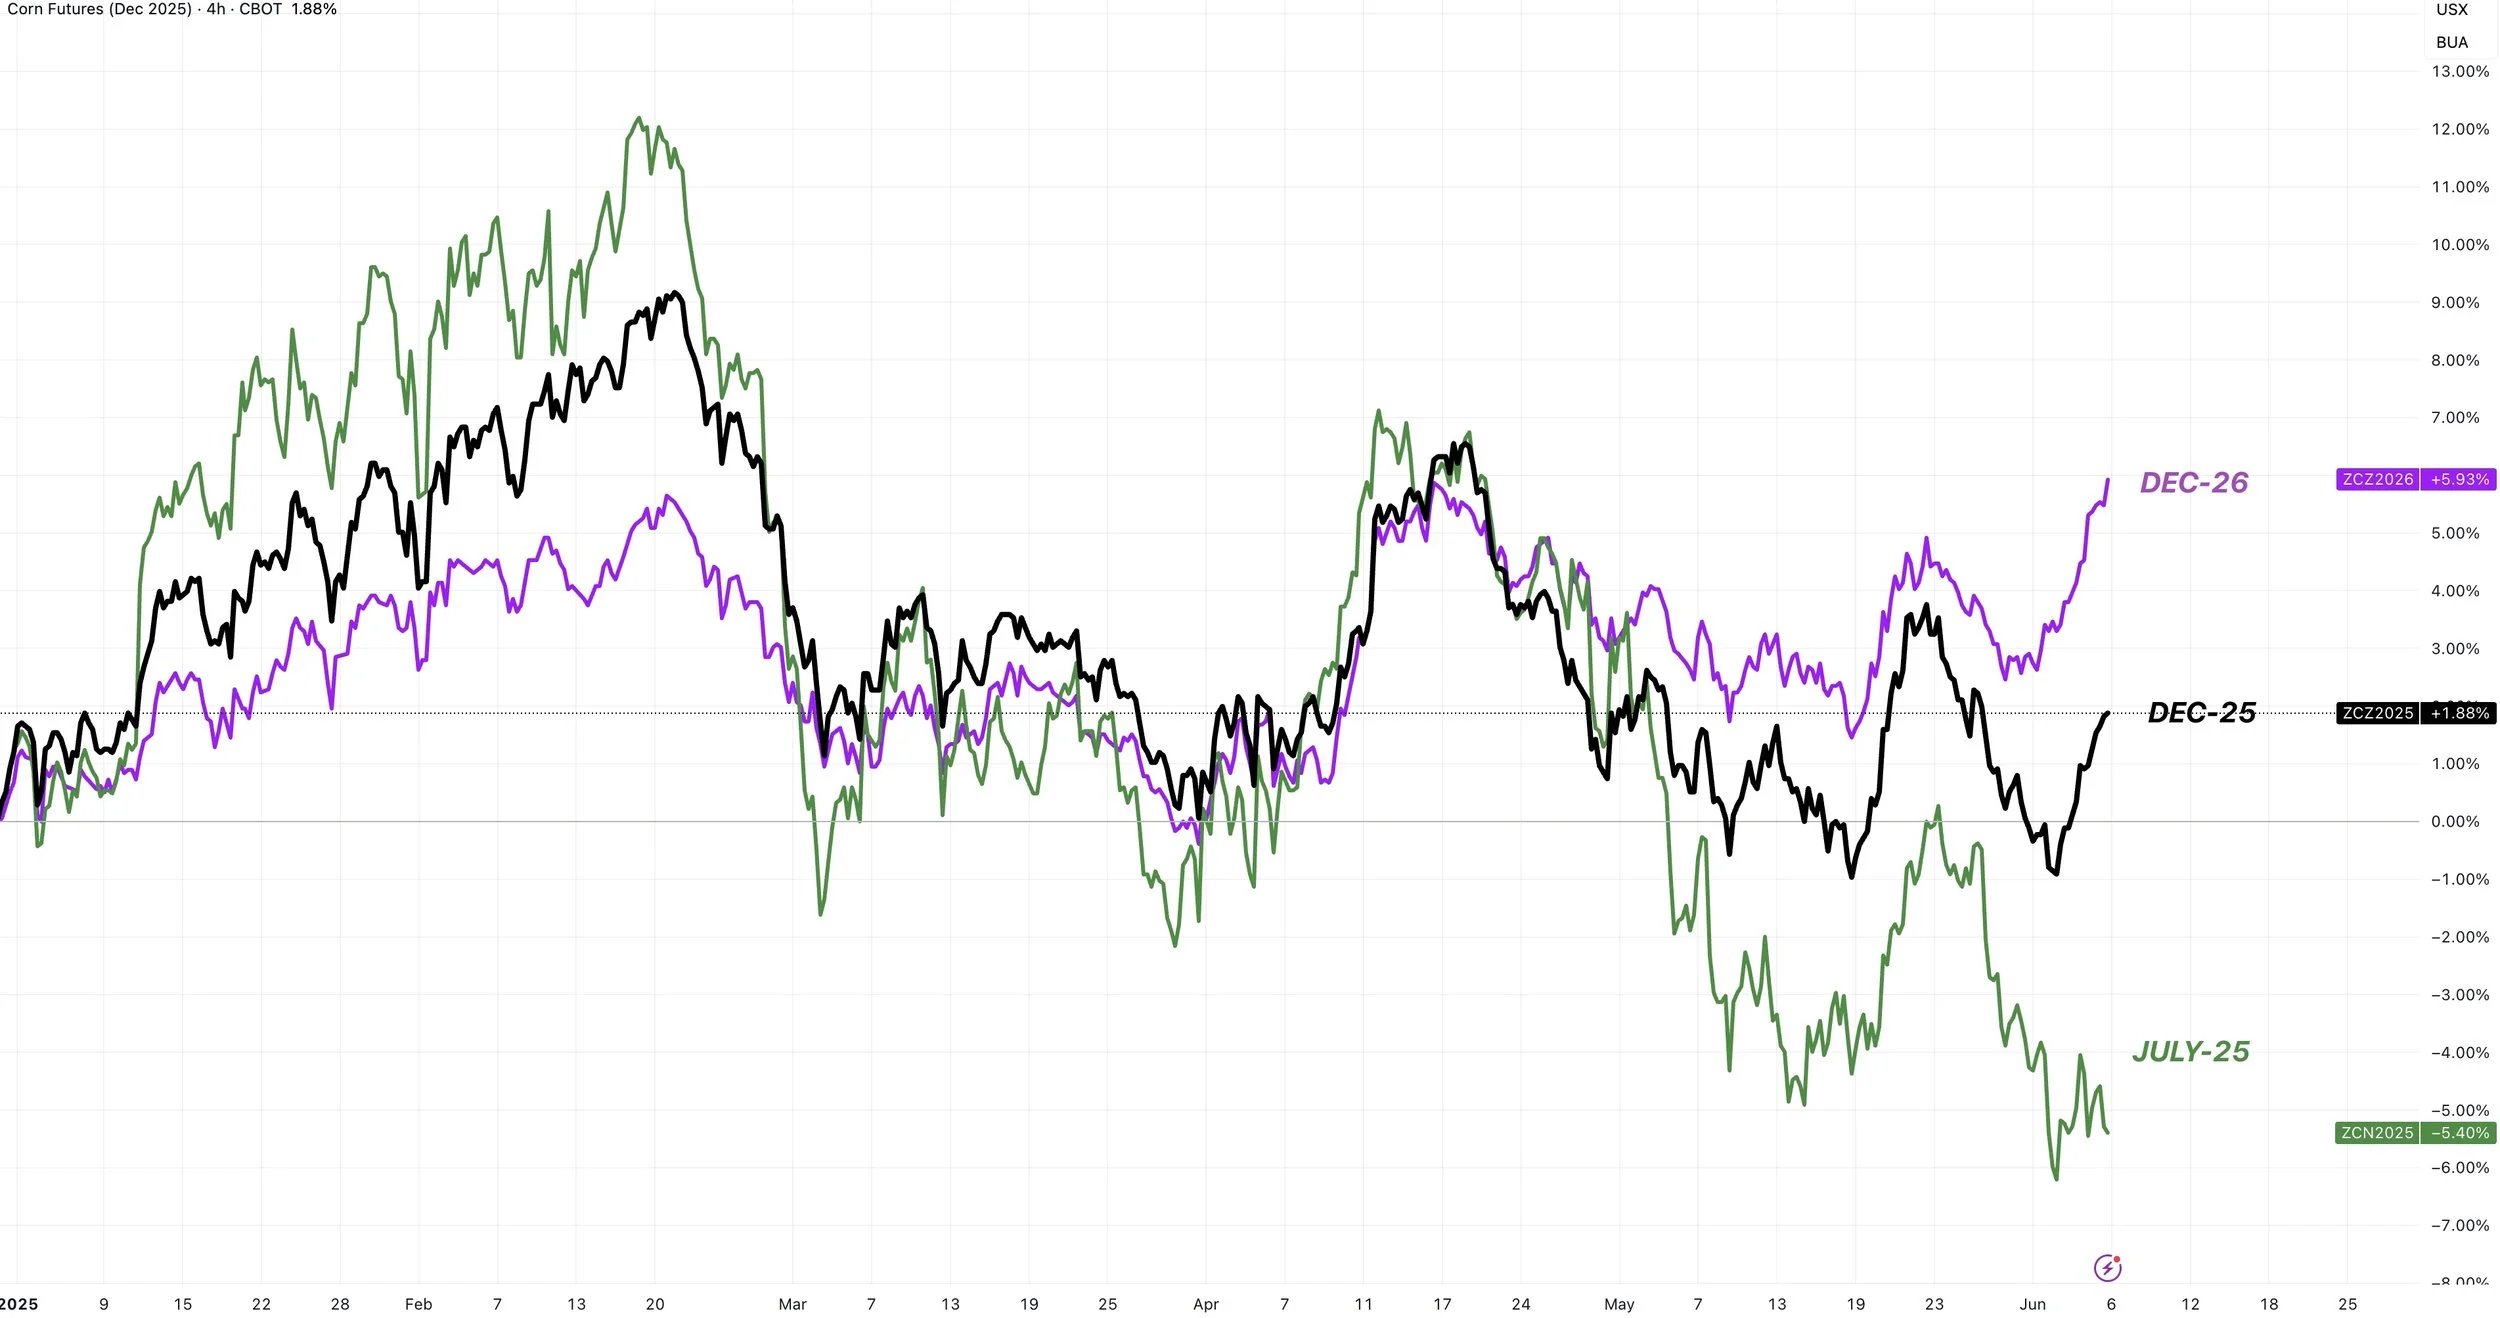
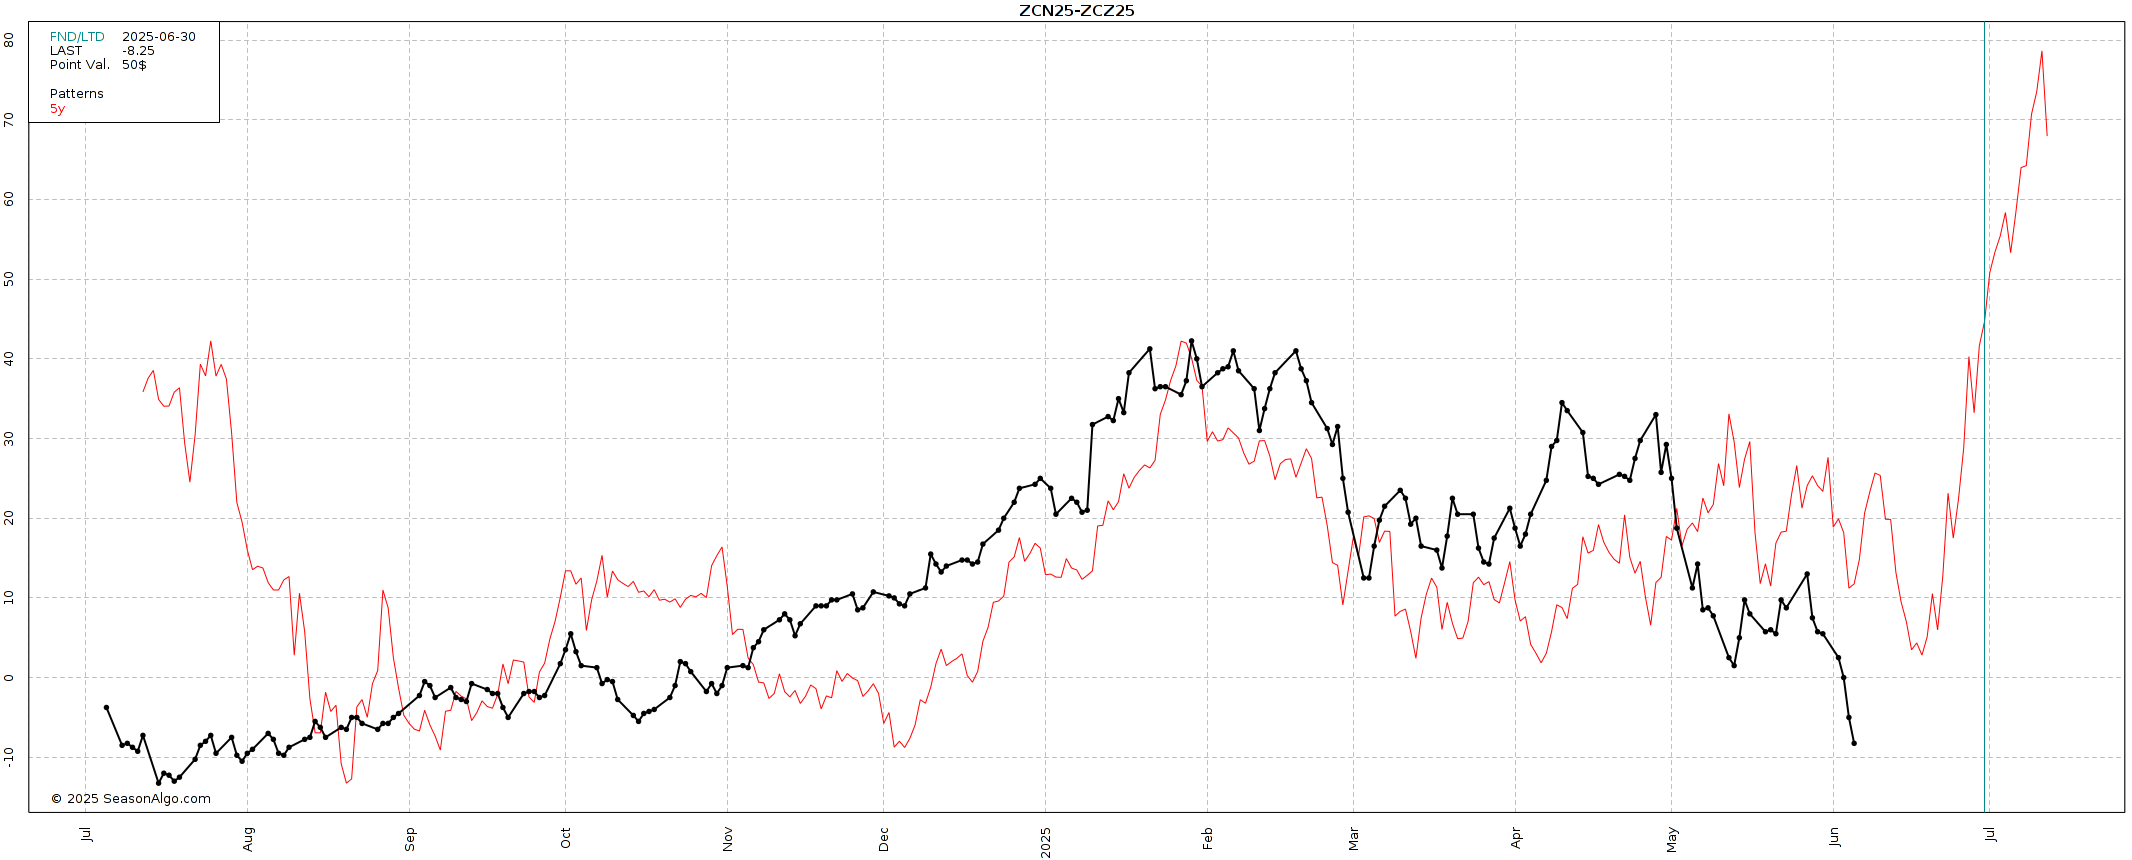
Corn Spreads
Dec-25 corn is up +10 cents in 2 days. Meanwhile July-25 corn is still right near the lows.
Dec-25 corn is now trading at an +9 cent premiuim to July-25 corn as the spreads continue to fall apart.
Typically this is not seen as a bullish sign.
It means people are not willing to pay a premiuim for corn right now.
It could have been the market had a sentiment shift. We went from trading "old crop is tight" to "we have all of these new crop corn acres coming".
It's not entirely about fundamentals. It's largely money flow.
For starters, the funds almost always buy or sell the nearby contract because that is where the liquidity is at. So when they sell, it pressures July corn.
It is head scratching because the old crop situation is the tightest in years. But prices and spreads don’t reflect that.
Is our old crop carryout bigger than the USDA pegs it at? Or will we eventually see things reverse and see upside in old crop corn? Hard to say.
Here is a chart that shows July-25, Dec-25, and Dec-26 corn's year to date performance.
July corn is down big on the year now. Meanwhile Dec-25 and Dec-26 corn are both higher on the year.
Our old crop stocks to use is below 10%.
Normally you'd think this would lead to a massive inverse, but it hasn't.
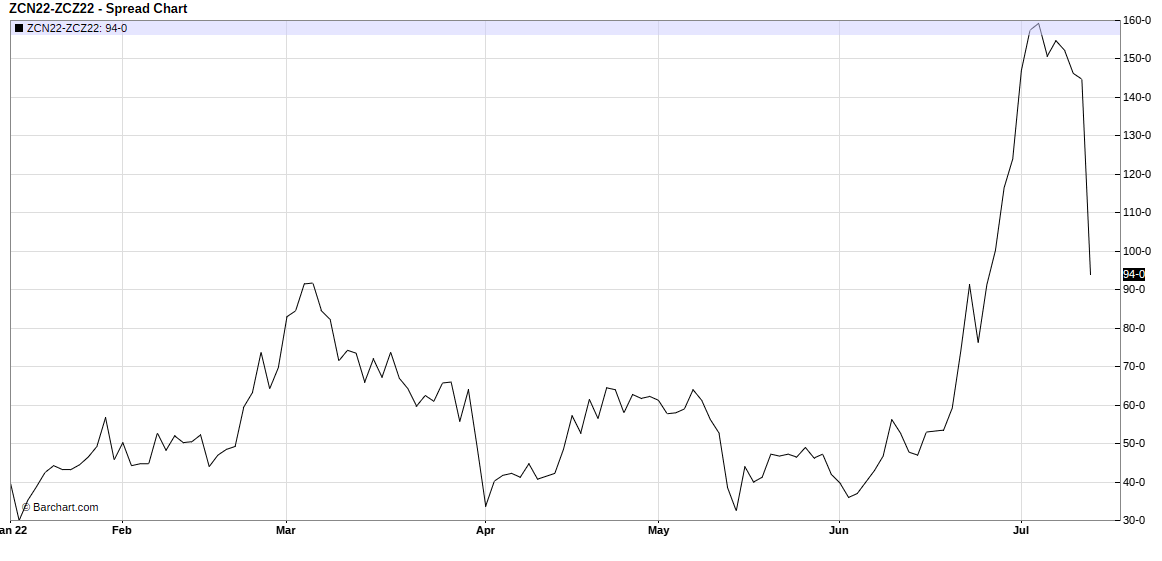
The last time we saw a stocks to use ratio below 10% during the summer was back in 2022.
This is what happened in 2022. The spread was already at an inverse but went substantially higher towards the middle of June.
If you look at the 5-year seasonal, we usually go higher pretty soon here in a few weeks.
There are several catalysts that could lead to this.
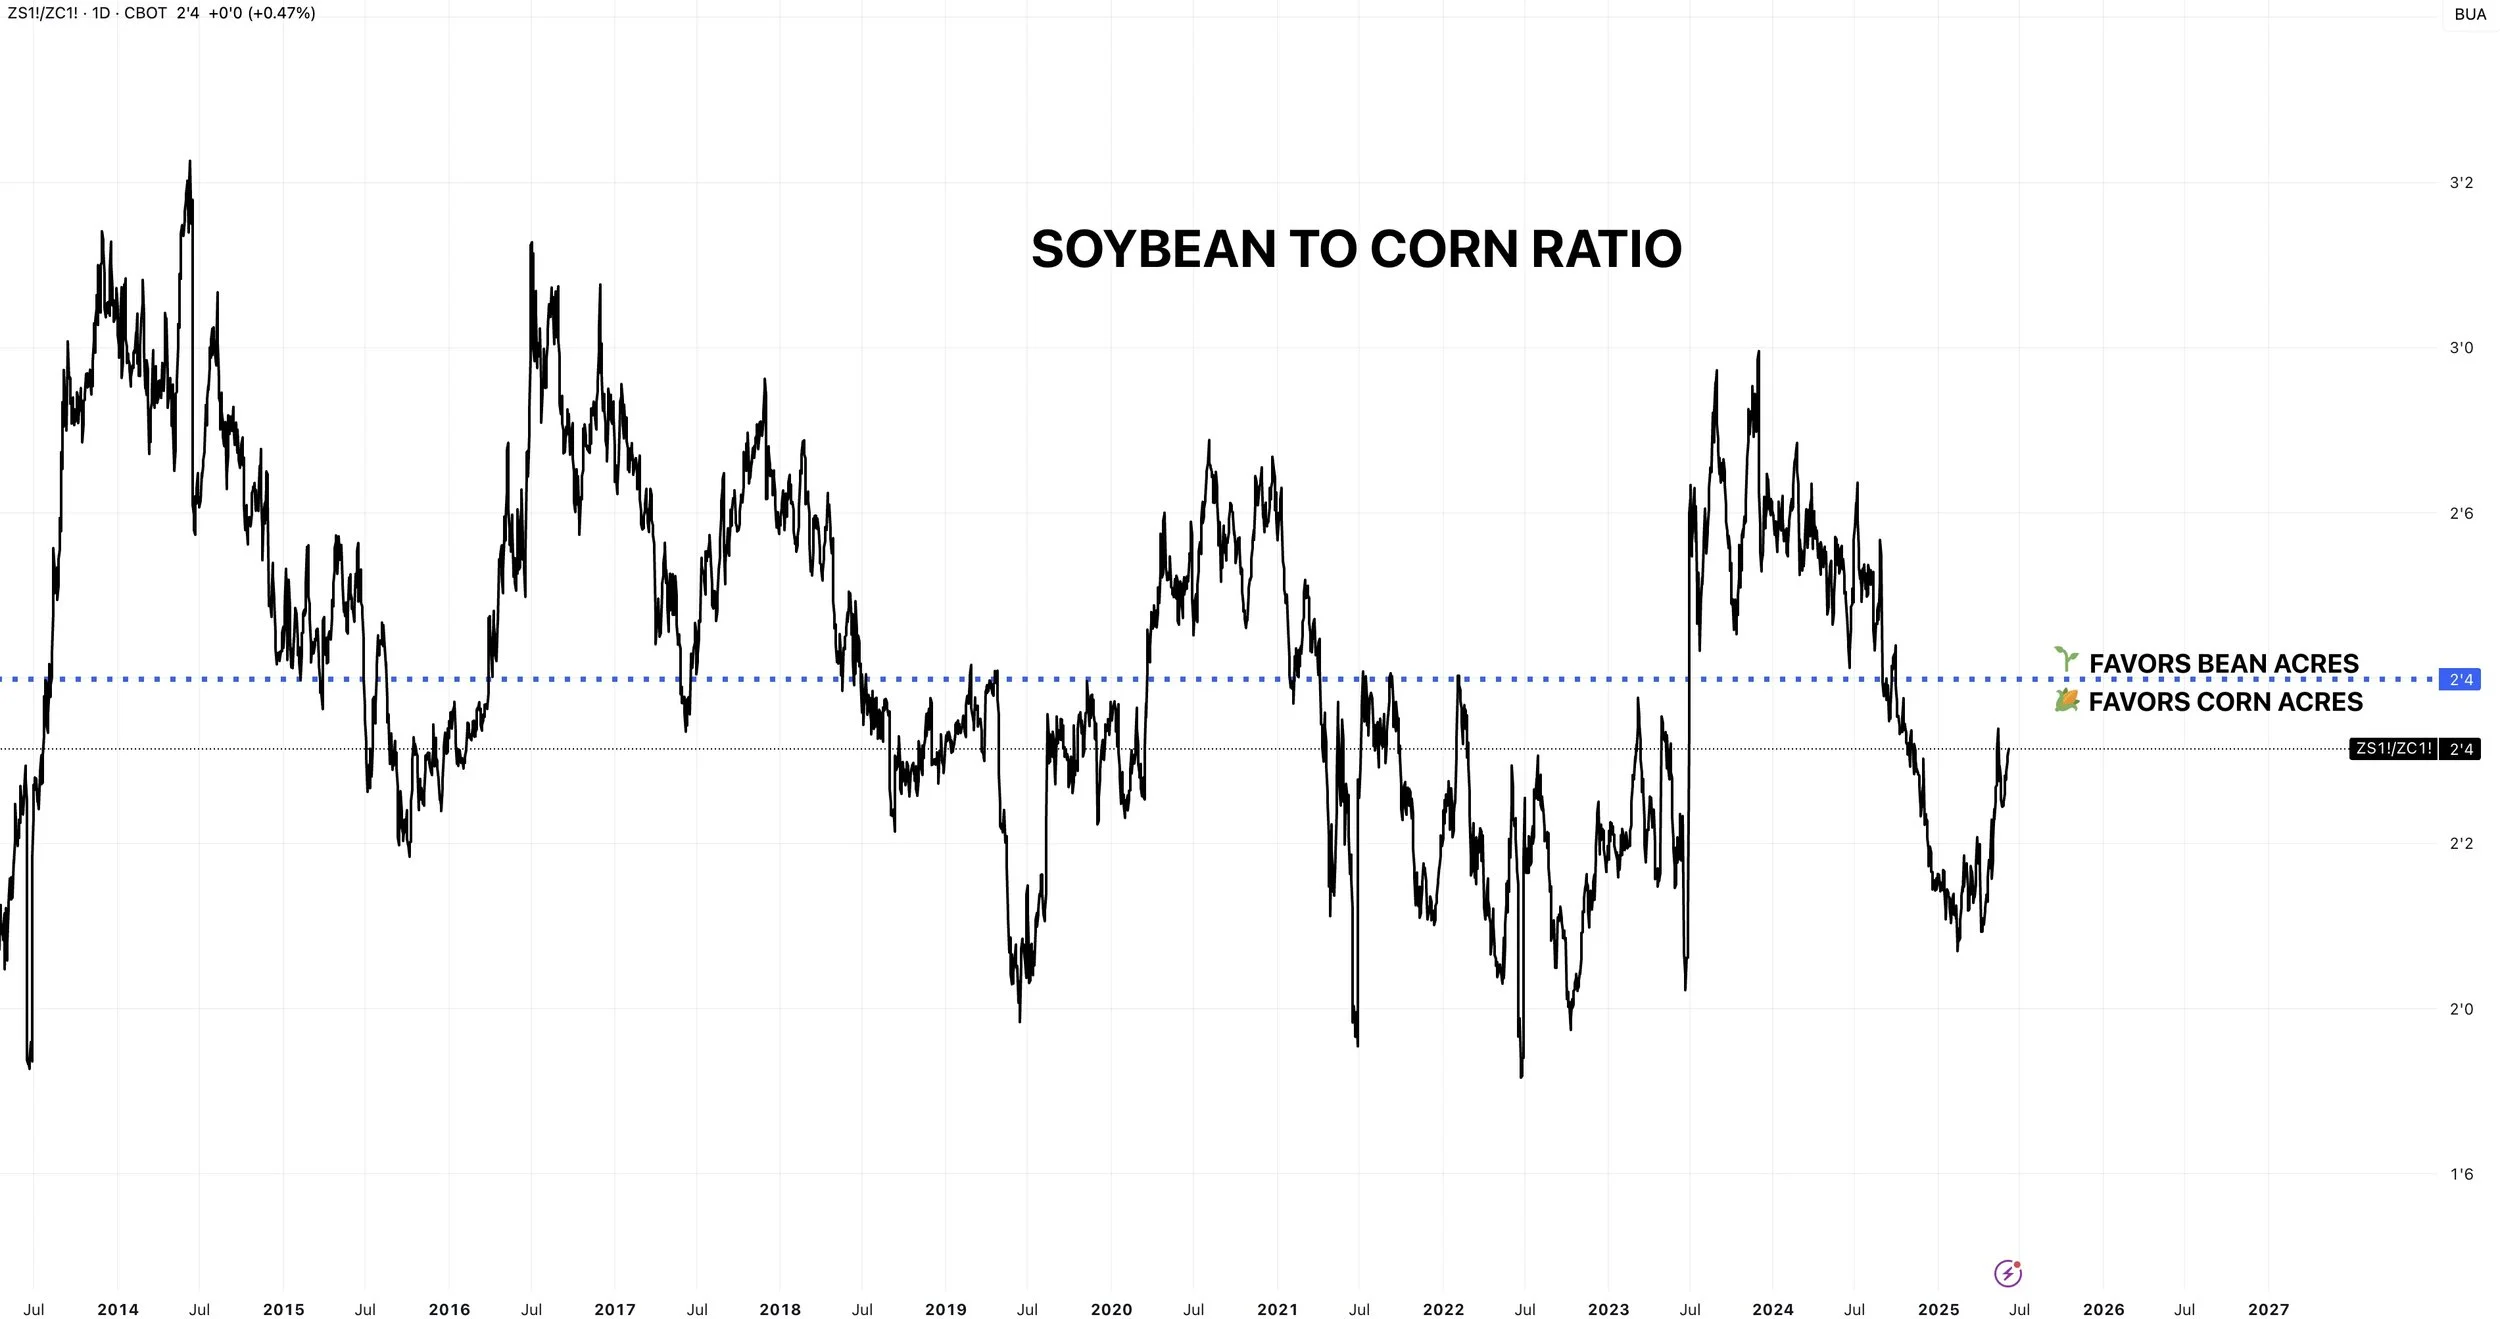
Corn to Soybean Ratio
This chart is the reason we had all of these extra corn acres this year.
Because corn were overvalued compared to beans.
Now that we got the acres, soybeans are starting to gain on corn.
It is the market balancing itself out.
Now that we have these corn acres, we will naturally probably see less corn acres next year because the acres this year should lead to corn becoming more undervalued compared to other grains.
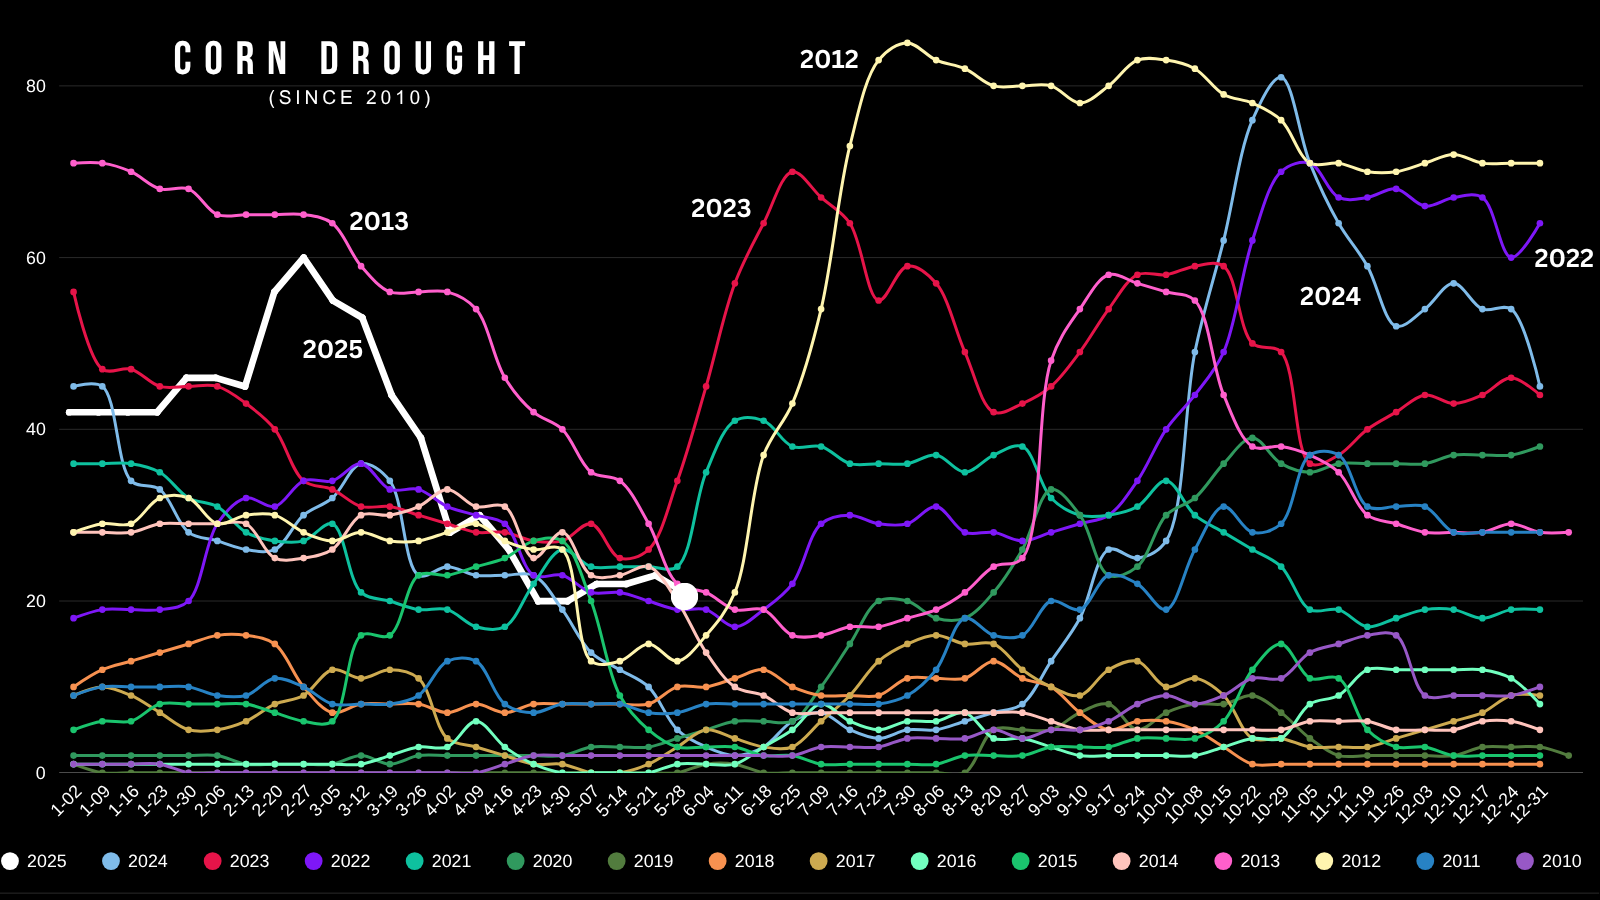
Corn Areas in Drought
Corn areas in drought are only at 21%.
Down substantially from 60% back in March.
If we look at seasonality, areas in drought usually fall throughout spring.
Then if we do start to see this pick back up, it happens right about now.
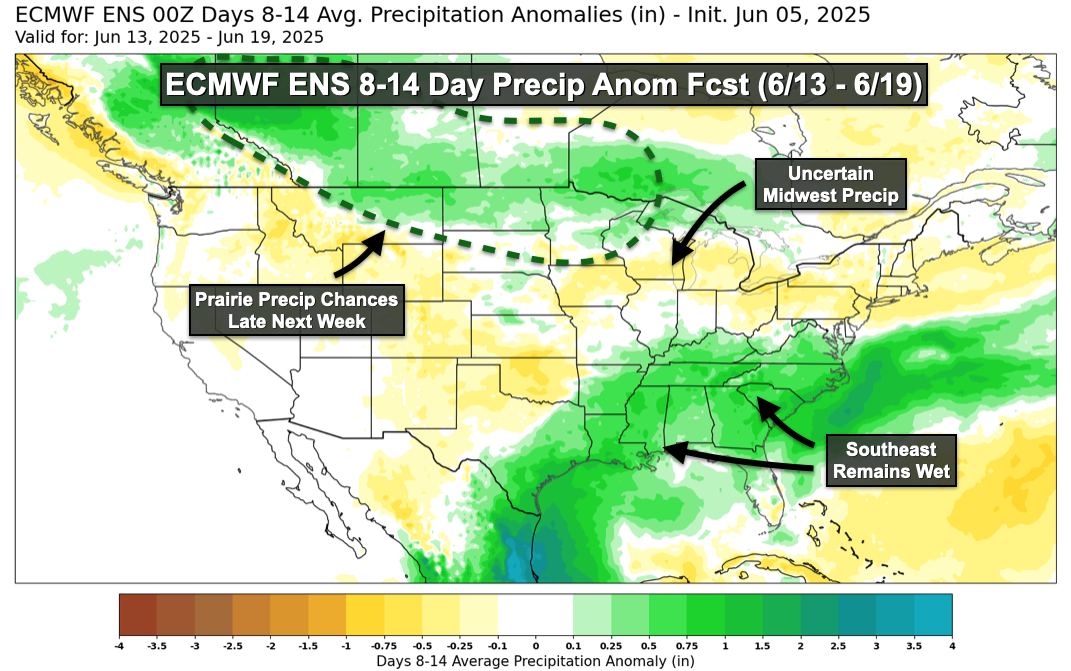
Weather
Here is the next week from Eric Snodgrass.
Suppose to be dry across Iowa, northern Illinois, and the western corn belt.
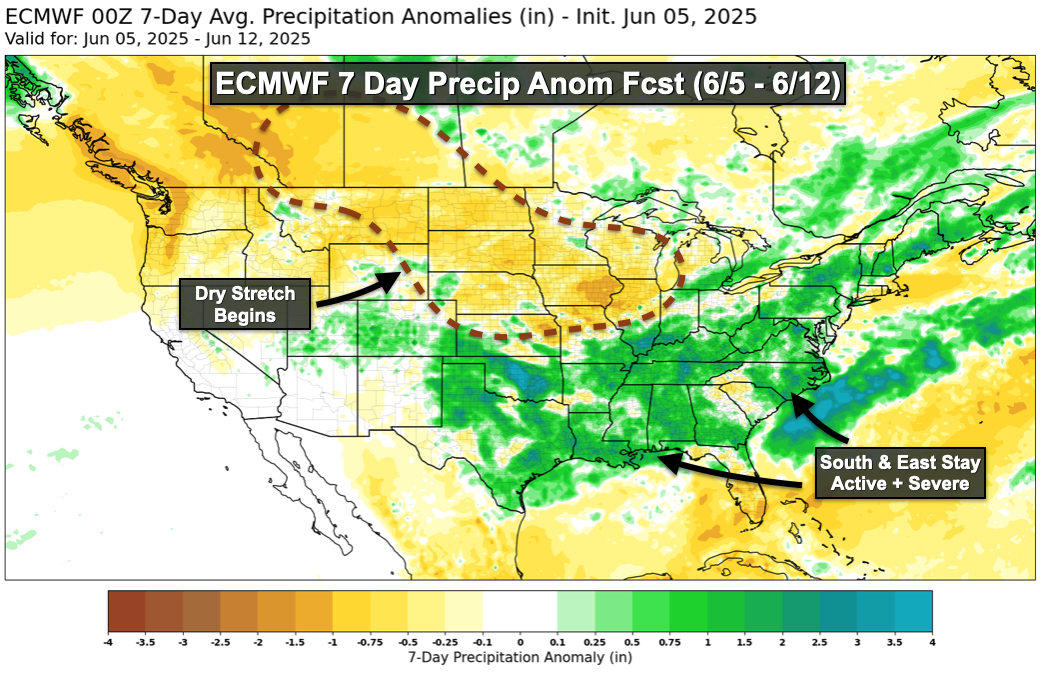
The 8-14 day outlook also leans dry for Iowa and some of those same areas, but with more rain up north.
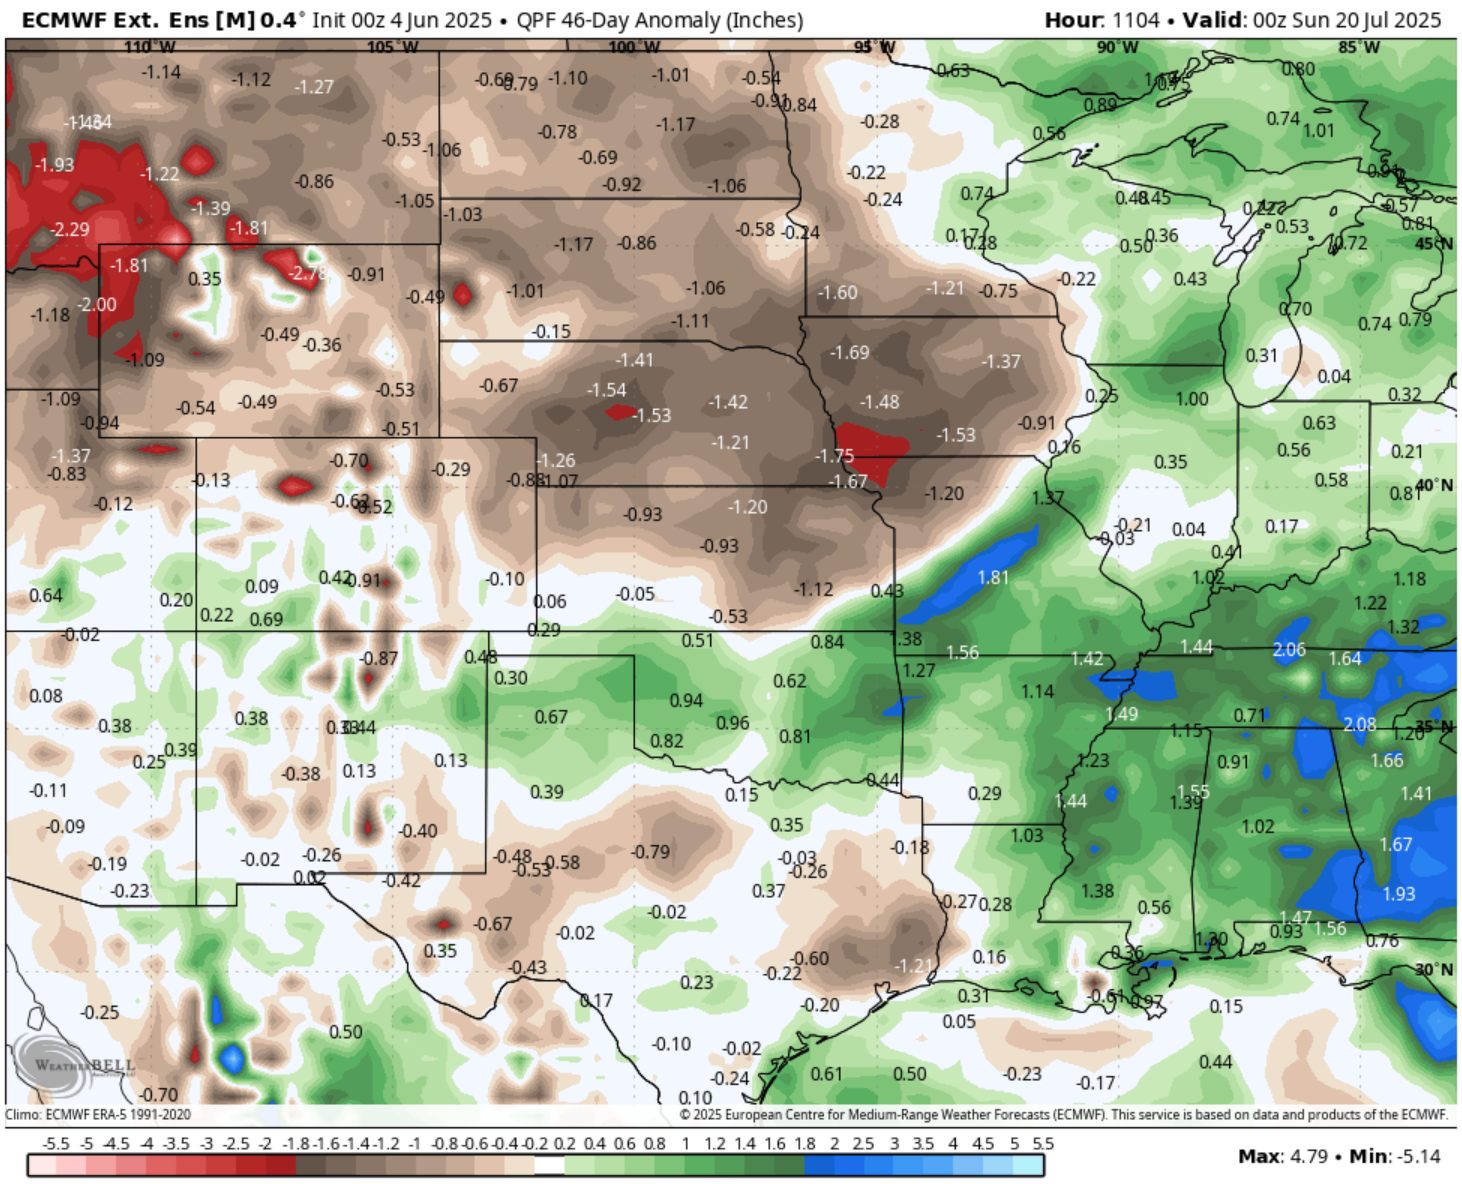
Here is the precip anomaly through July 20th.
Iowa and the rest of the western corn belt still looking dry while the eastern corn belt remains wet.
So I don’t think we've seen the last of a "dry scare".
Not saying we will have a crazy drought, but think we should see some weather premium at some point if these forecasts hold true.
This market has zero weather premium built into it.
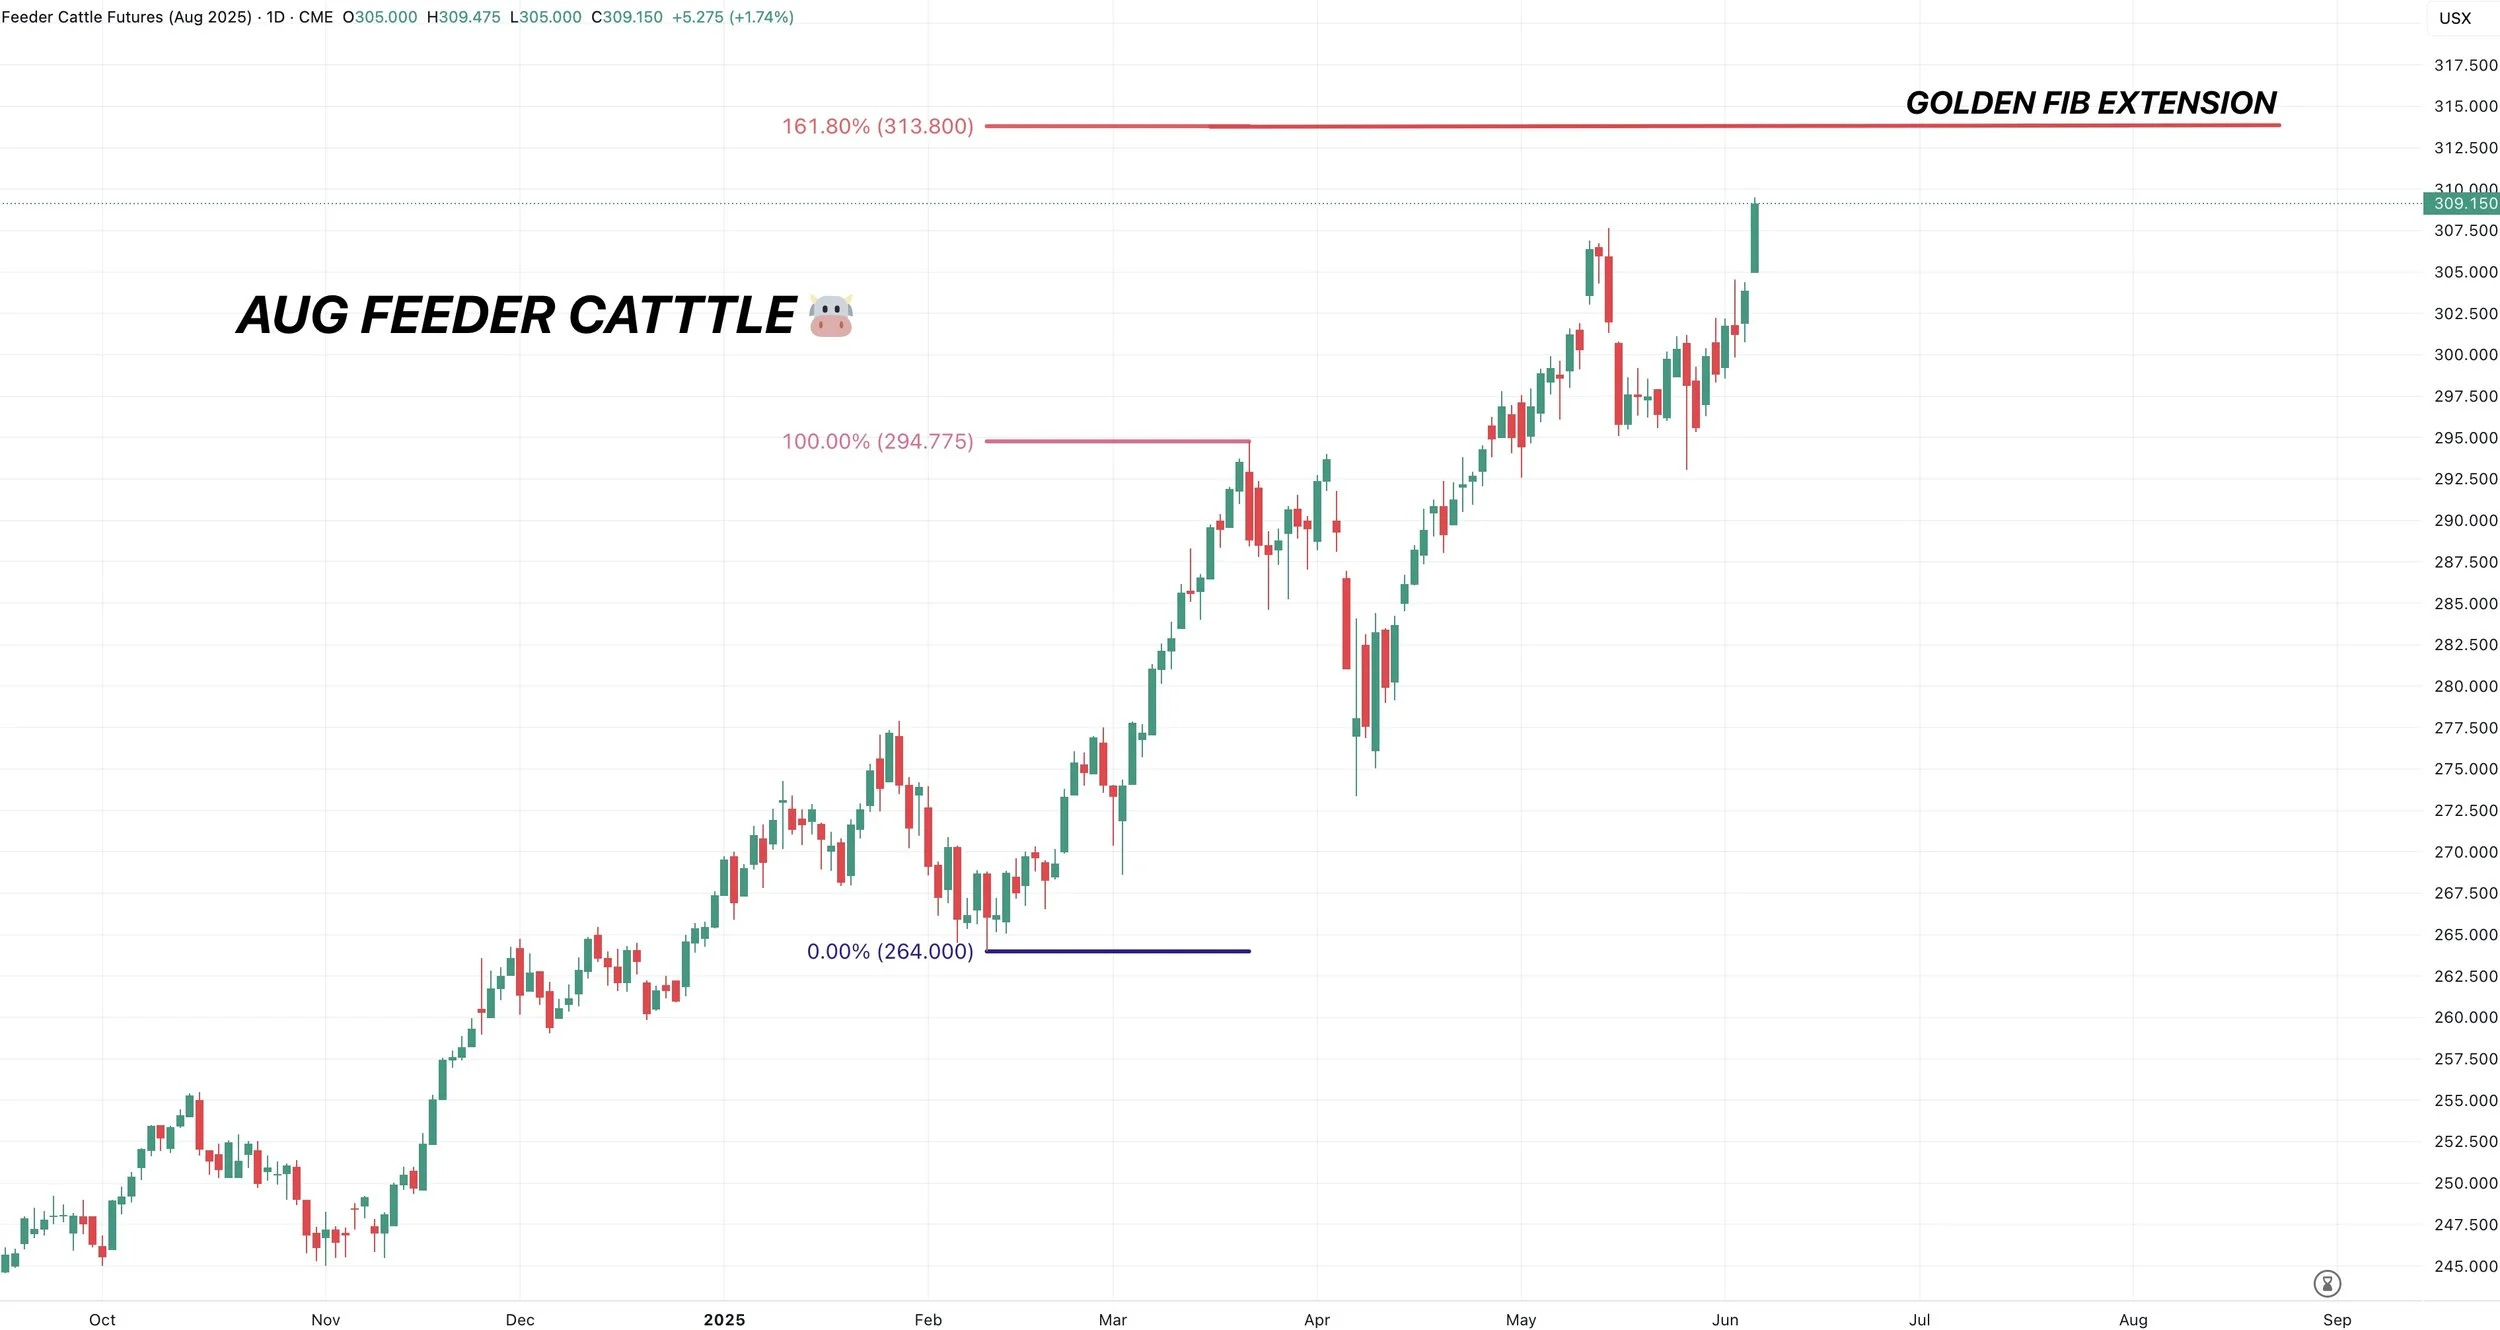
Cattle Sell Signal & Hedge Alert
Early today we did a alert a signal for cattle.
If you missed it here it was: CLICK HERE
This is because August live cattle hit our target.
That target was the gollden fib extension of the March rally.
Meaning we achieved 161.8% of that rally. Which is a common spot for a 2nd move to stall out.
We recommended either selling futures, purchasing a put, or LRP.
If you have questions or want to talk specifics reach out anytime.
Lauren: (979)587-9252
Jeremey: (605)295-3100

August feeders didn’t hit the golden fib extension target like live cattle, but we did post new highs. So if you are someone who felt like you missed the boat after we recently sold off, here is another chance.
We could of course keep running, but it feels like a great spot to manage your risk.
Todays Main Takeaways
Corn
Fundamentals:
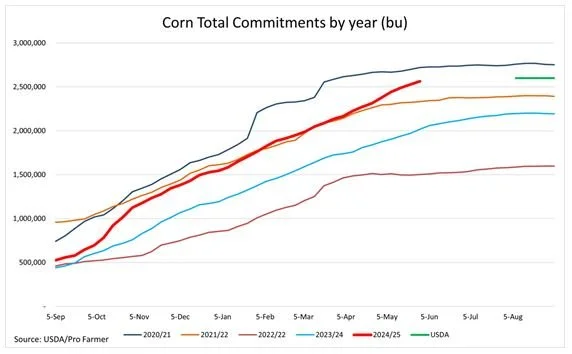
Corn exports continue to be phenomenal.
We have already reached the USDA's predicted exports.
We still have 3 months left in the marketing year.
Chart from Pro Farmer
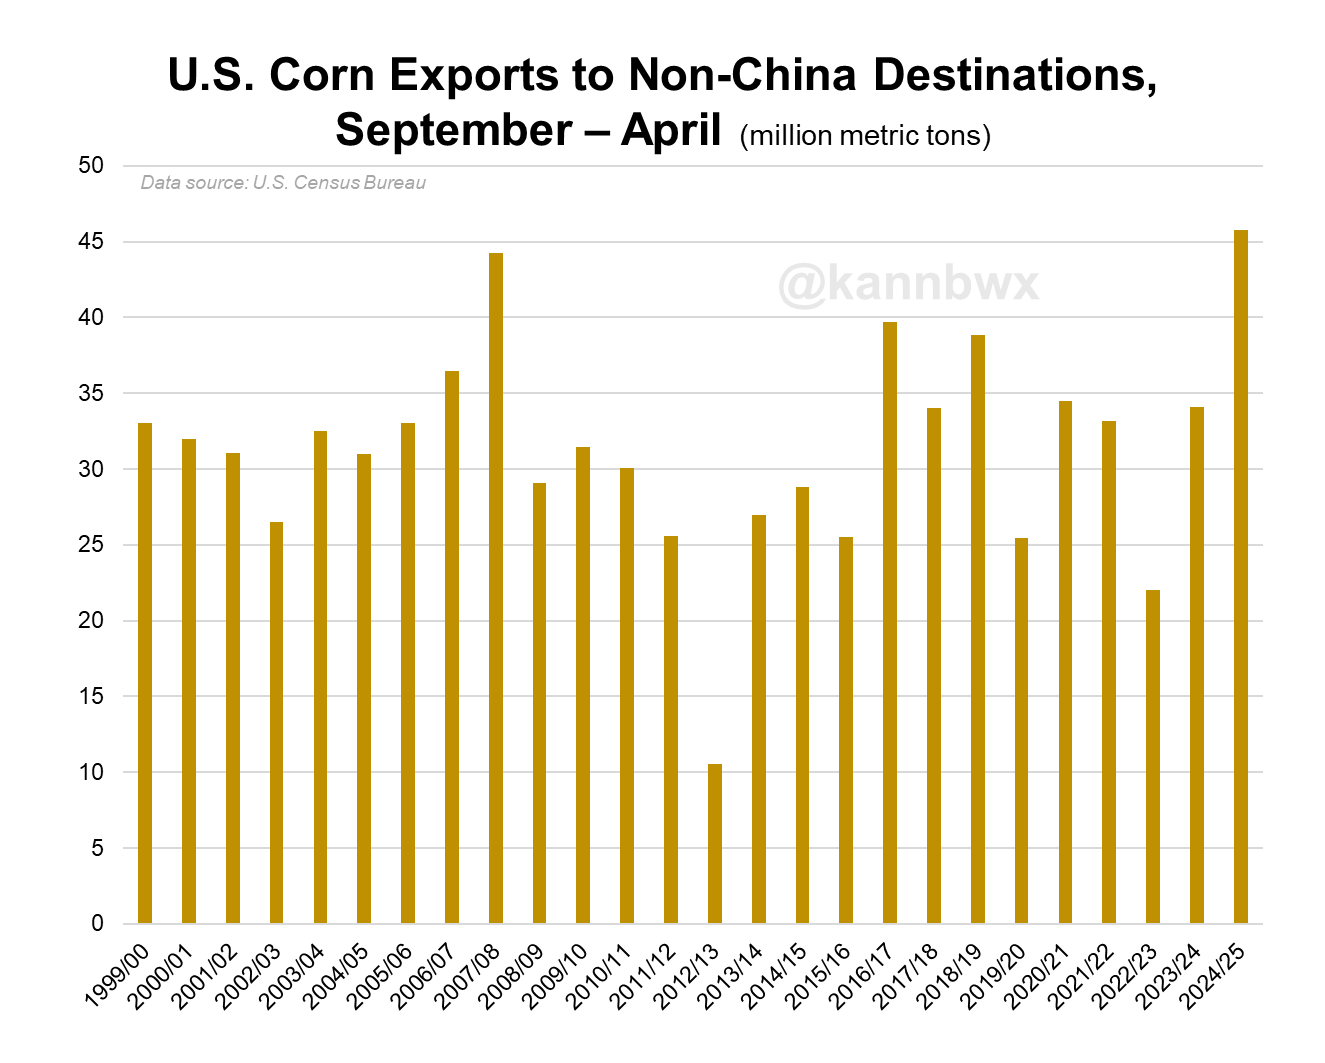
When you look at exports to countries other than China, we have exported a record amount.
Chart from Karen Braun
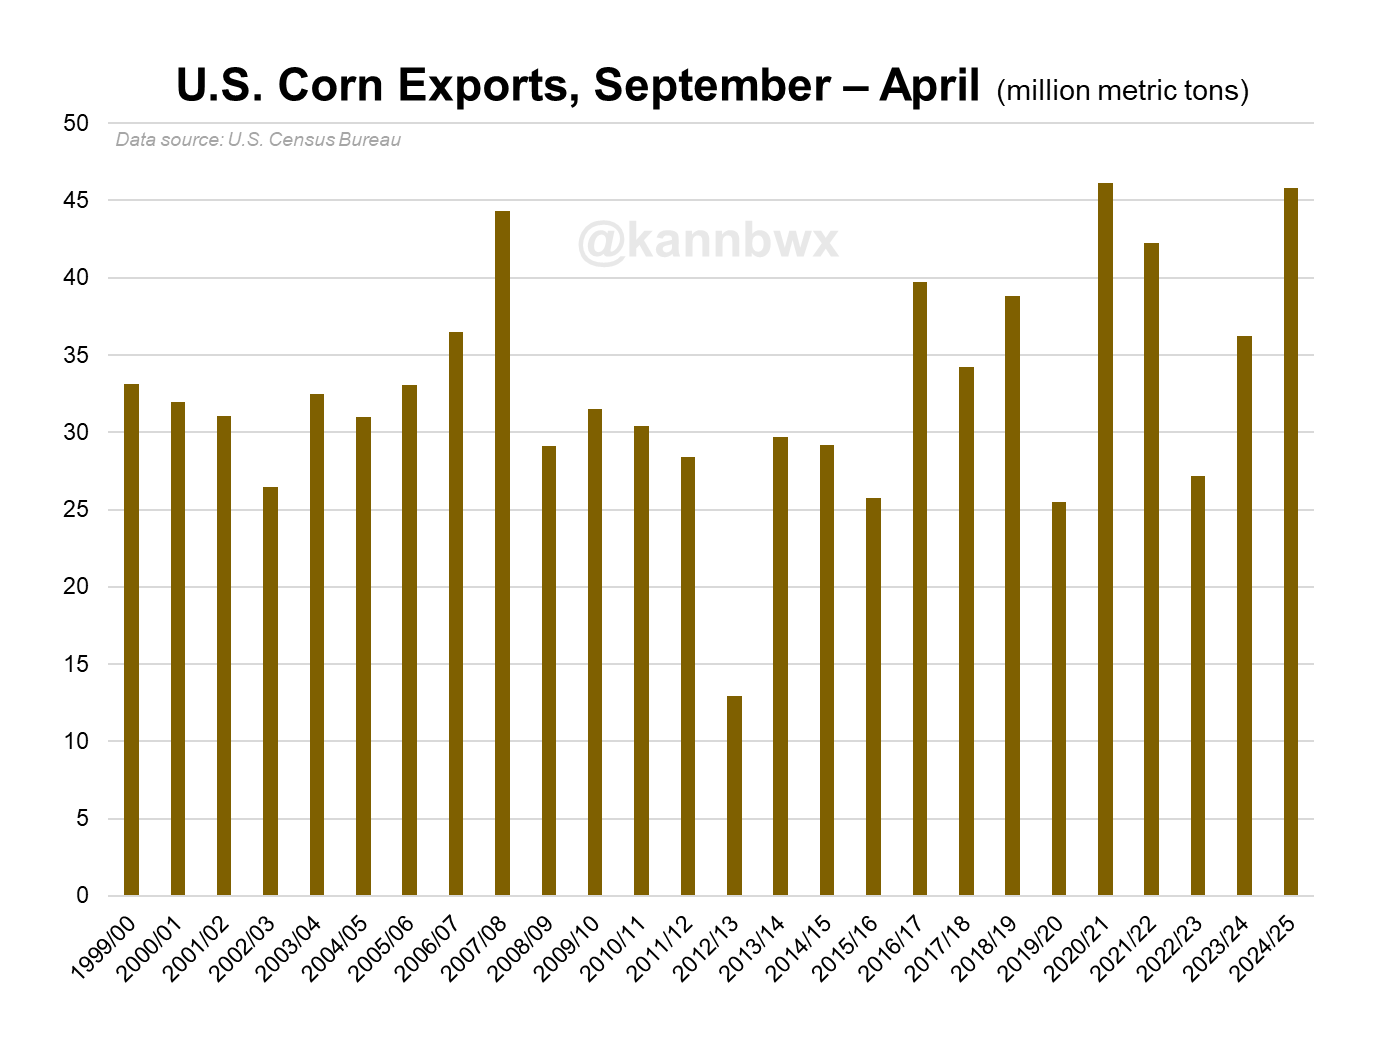
China hasn’t been a big corn buyer, but even if you look at exports including China we have exported the 2nd most corn ever.
Just fractionally behind 2020/21, which was led almost entirely by China purchases.
Chart from Karen Braun
The point is, why would demand not continue to be strong?
If the dollar keeps falling (which most expect it will) that helps add even more fuel to the fire.
Let's say we don’t get some giant rally, well then corn prices remain cheap. Which would suck, but this would also create that much more demand.
We already have the cheapest corn in the world.
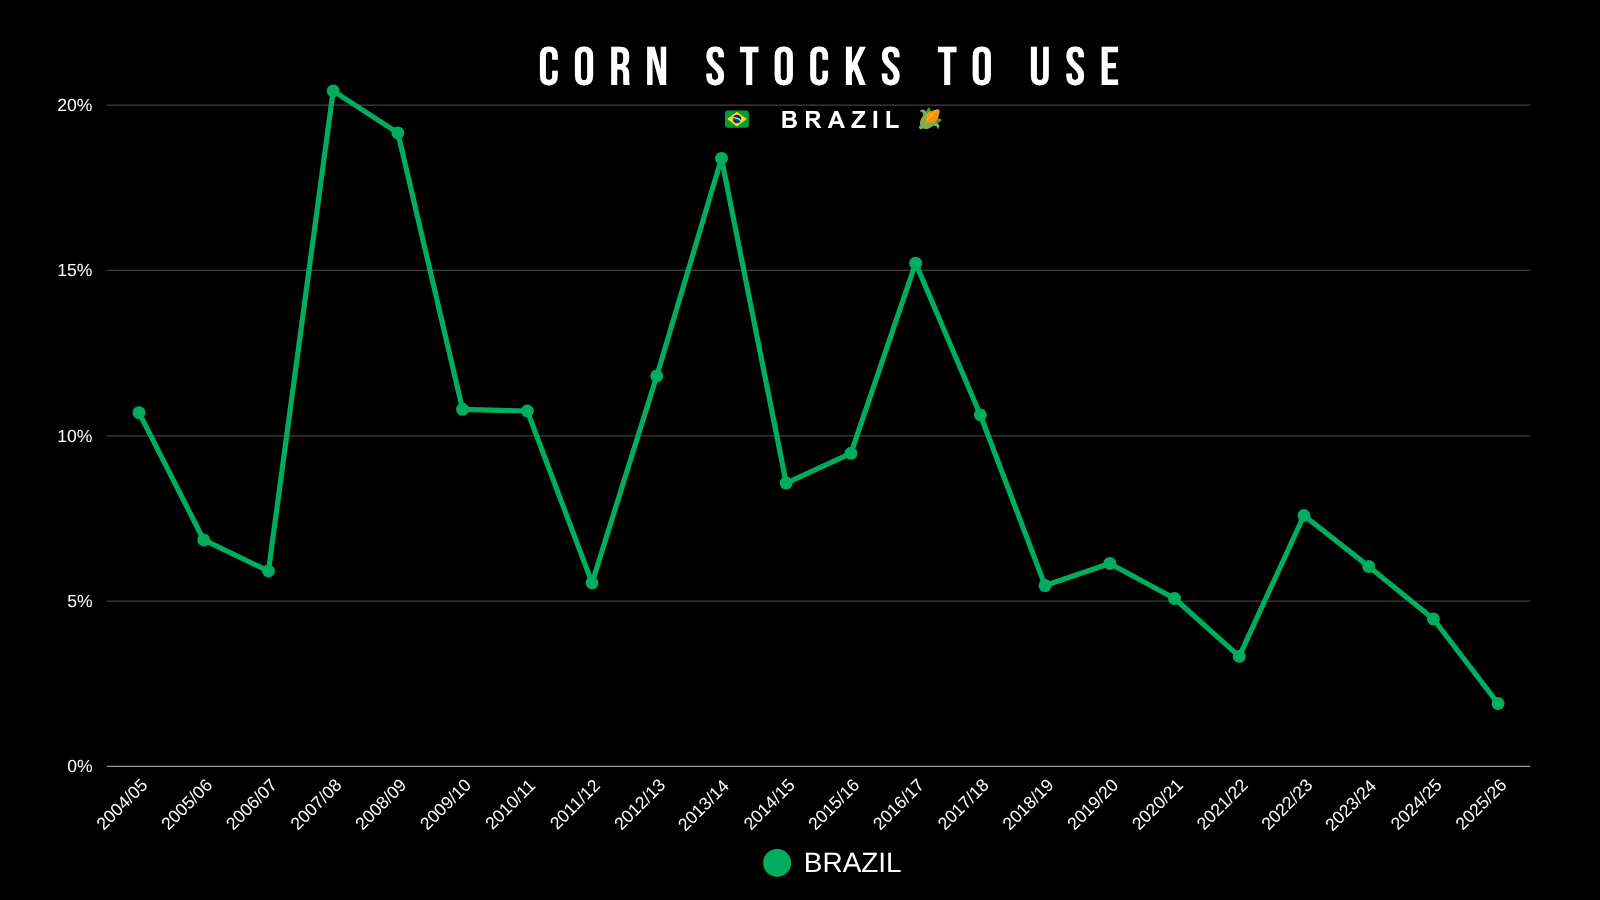
I showed this chart earlier this week, but this is Brazil's stocks to use ratio.
The big crop in Brazil has been one of the reasons corn has struggled.
But even with their big crop, Brazil's stocks to use ratio is sitting at an all-time low.
Meaning they don’t have all of this extra corn on hand and the world is still going to need to come to the US for their corn needs.
Short term, it is going to come down to weather.
We dry out, we rally. We don’t dry out, we don’t rally. It is that simple.
But taking a bigger picture view, demand doesn’t appear like it should be going anywhere which is a positive thing for corn.
Technicals:
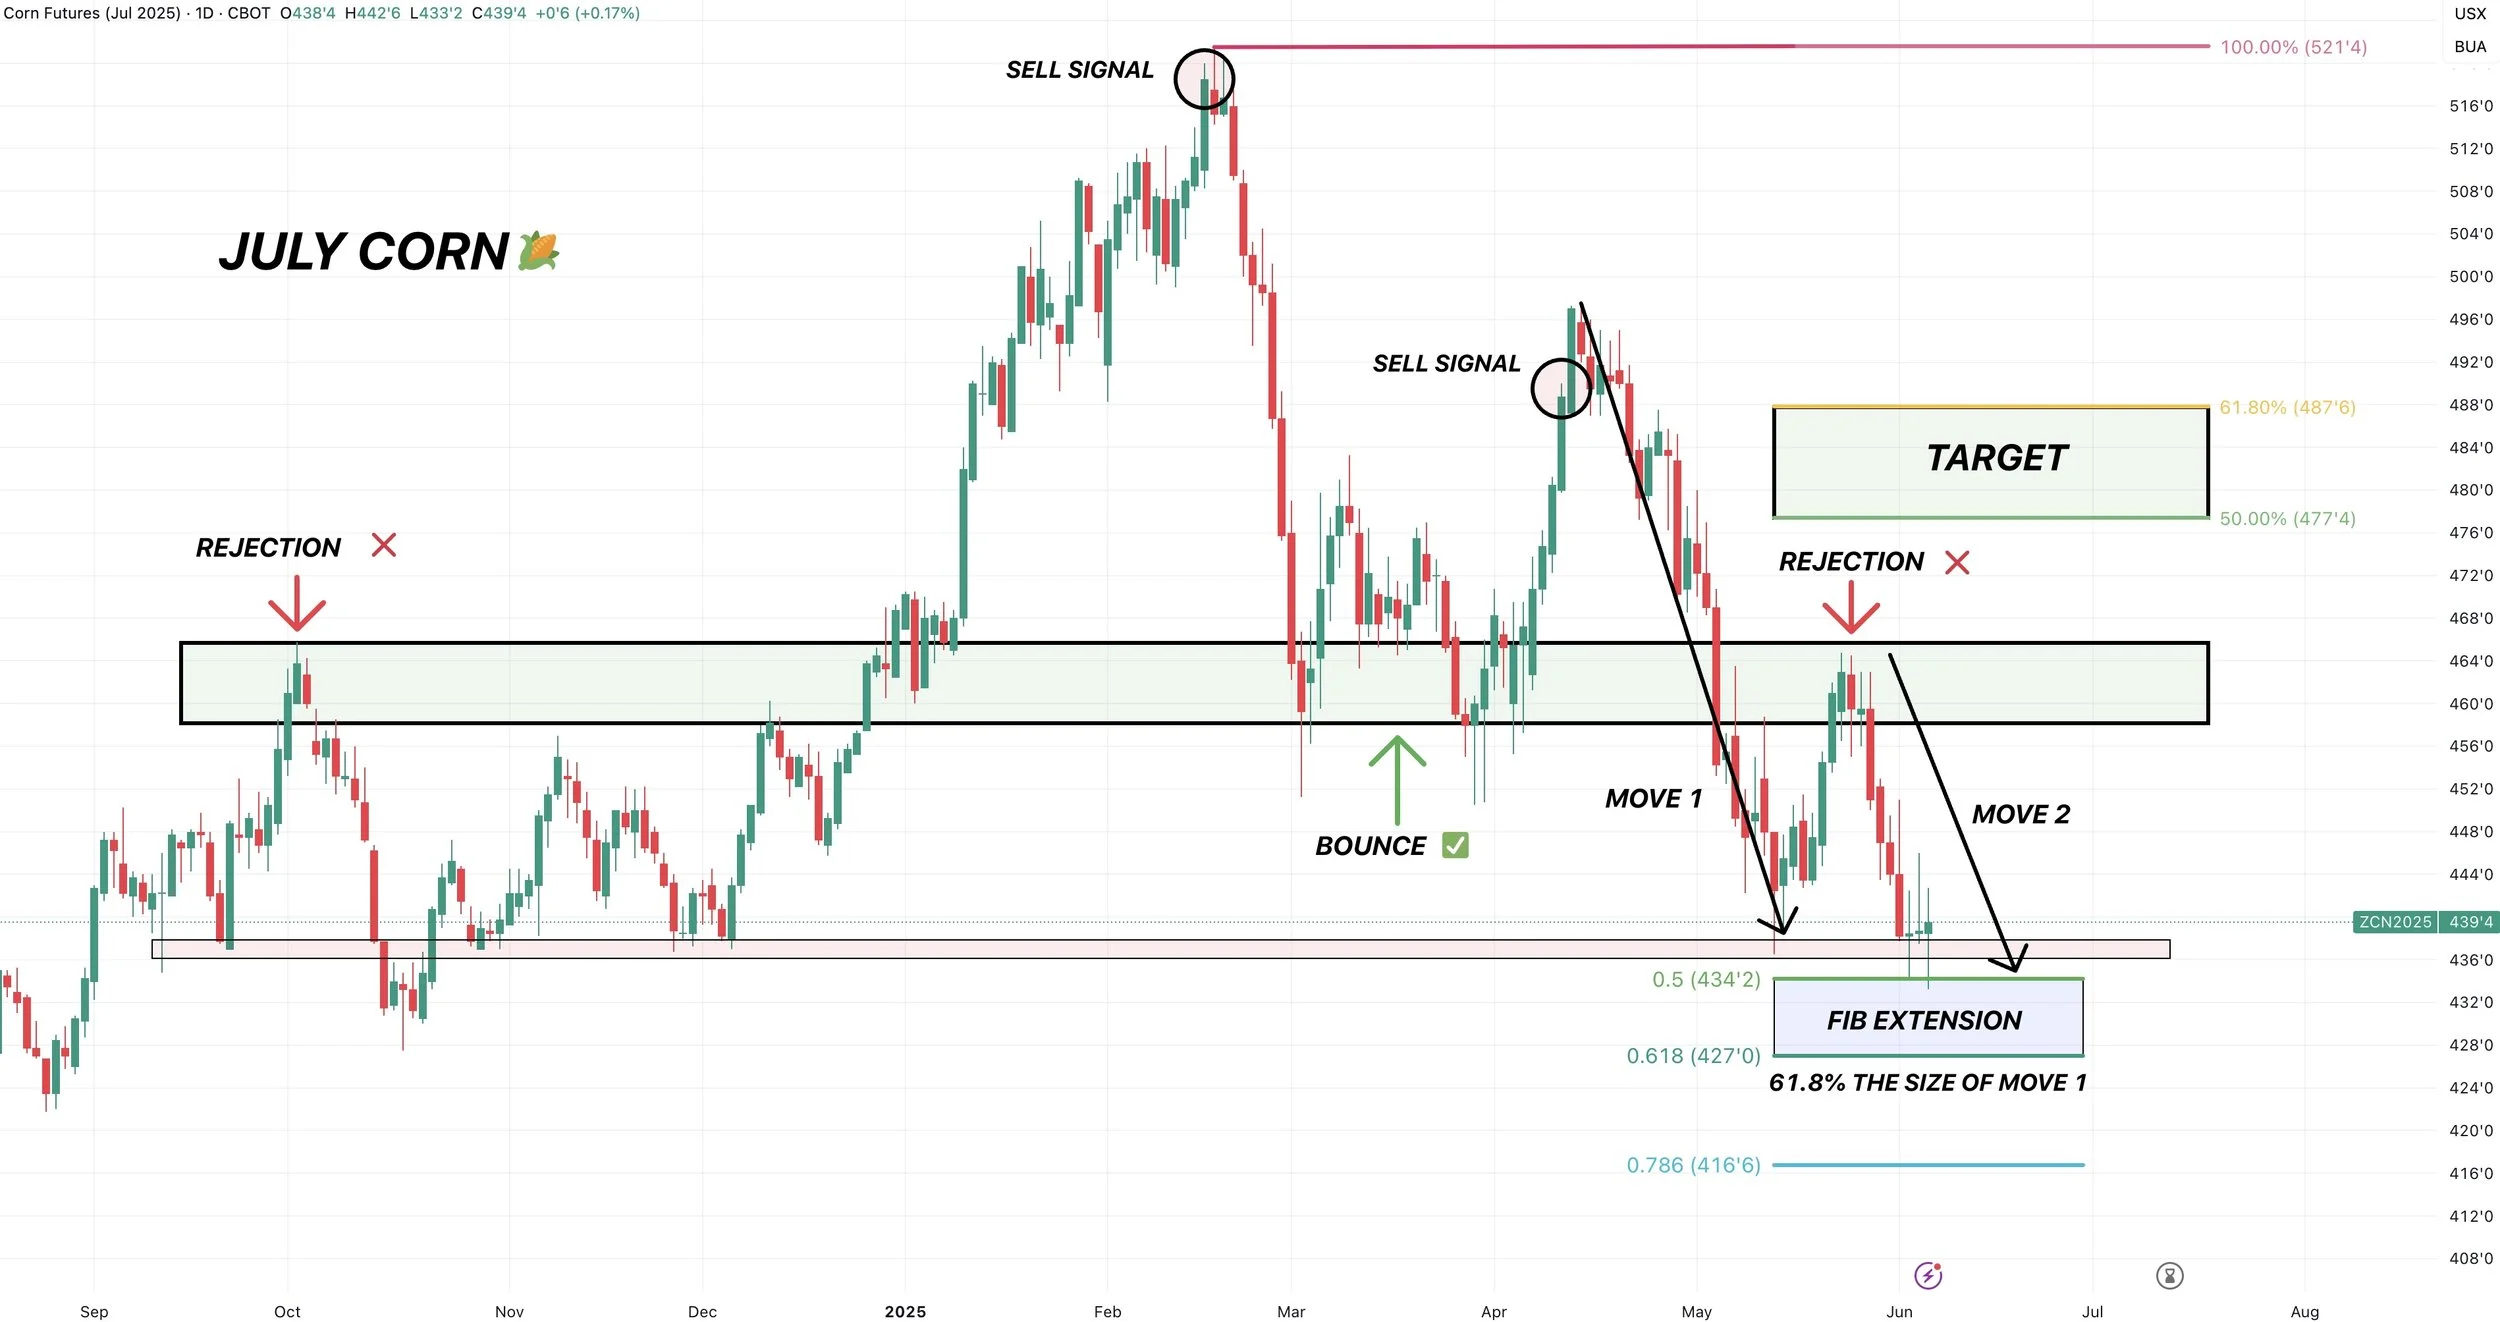
Fib Extension - July
Despite prices not moving higher, it is friendly to see July corn finding support exactly where we need to.
I broke down this downside target earlier this week, but I will try to explain the importance of $4.34 to $4.27 again.
Normally when finding a bottom, we like to use retracement levels. Since corn posted new lows, you cannot use retracements. As there is no low to retrace to.
Instead, we have to use a fib extension. Which measures the sell off we saw in April, then calculates where we should find support on this sell off.
This blue box is the 50% to 61.8% fib extension.
Meaning it equals 50% to 61.8% of the size of the April sell off.
Move 1 was the April sell off.
Move 2 is this sell off.
The April sell off (move 1) was -60 cents.
Which means this move off the recent May highs (move 2) should be -30 to -37 cents (Which is 50-61.8% of 60 cents).
That is why finding a bottom here makes sense. As 50% to 61.8% is the most common level.
If we fail to hold this box, we will be looking at $4.17. Which is the next fib extension level at 78.6%. That would be contract lows.
RSI Divergence - July
This is another reason I think corn "could" find a bottom here.
We have a bullish divergence on the RSI.
We have seen an RSI divergence in corn just 4 times since harvest.
August (Bullish): Marked harvest lows
February (Bearish: Led to that blood bath
March (Bullish): Led to the April rally
Now (Bullish)
An RSI divergence happens when the RSI does NOT follow price action.
Bullish = prices make new lows + RSI does not
Bearish = prices make new highs + RSI does not (Happened in February)
When you see divergence, all it means is that momentum is getting weaker.
This does not mean we have to go higher. It simply suggests downward pressure is getting weaker.

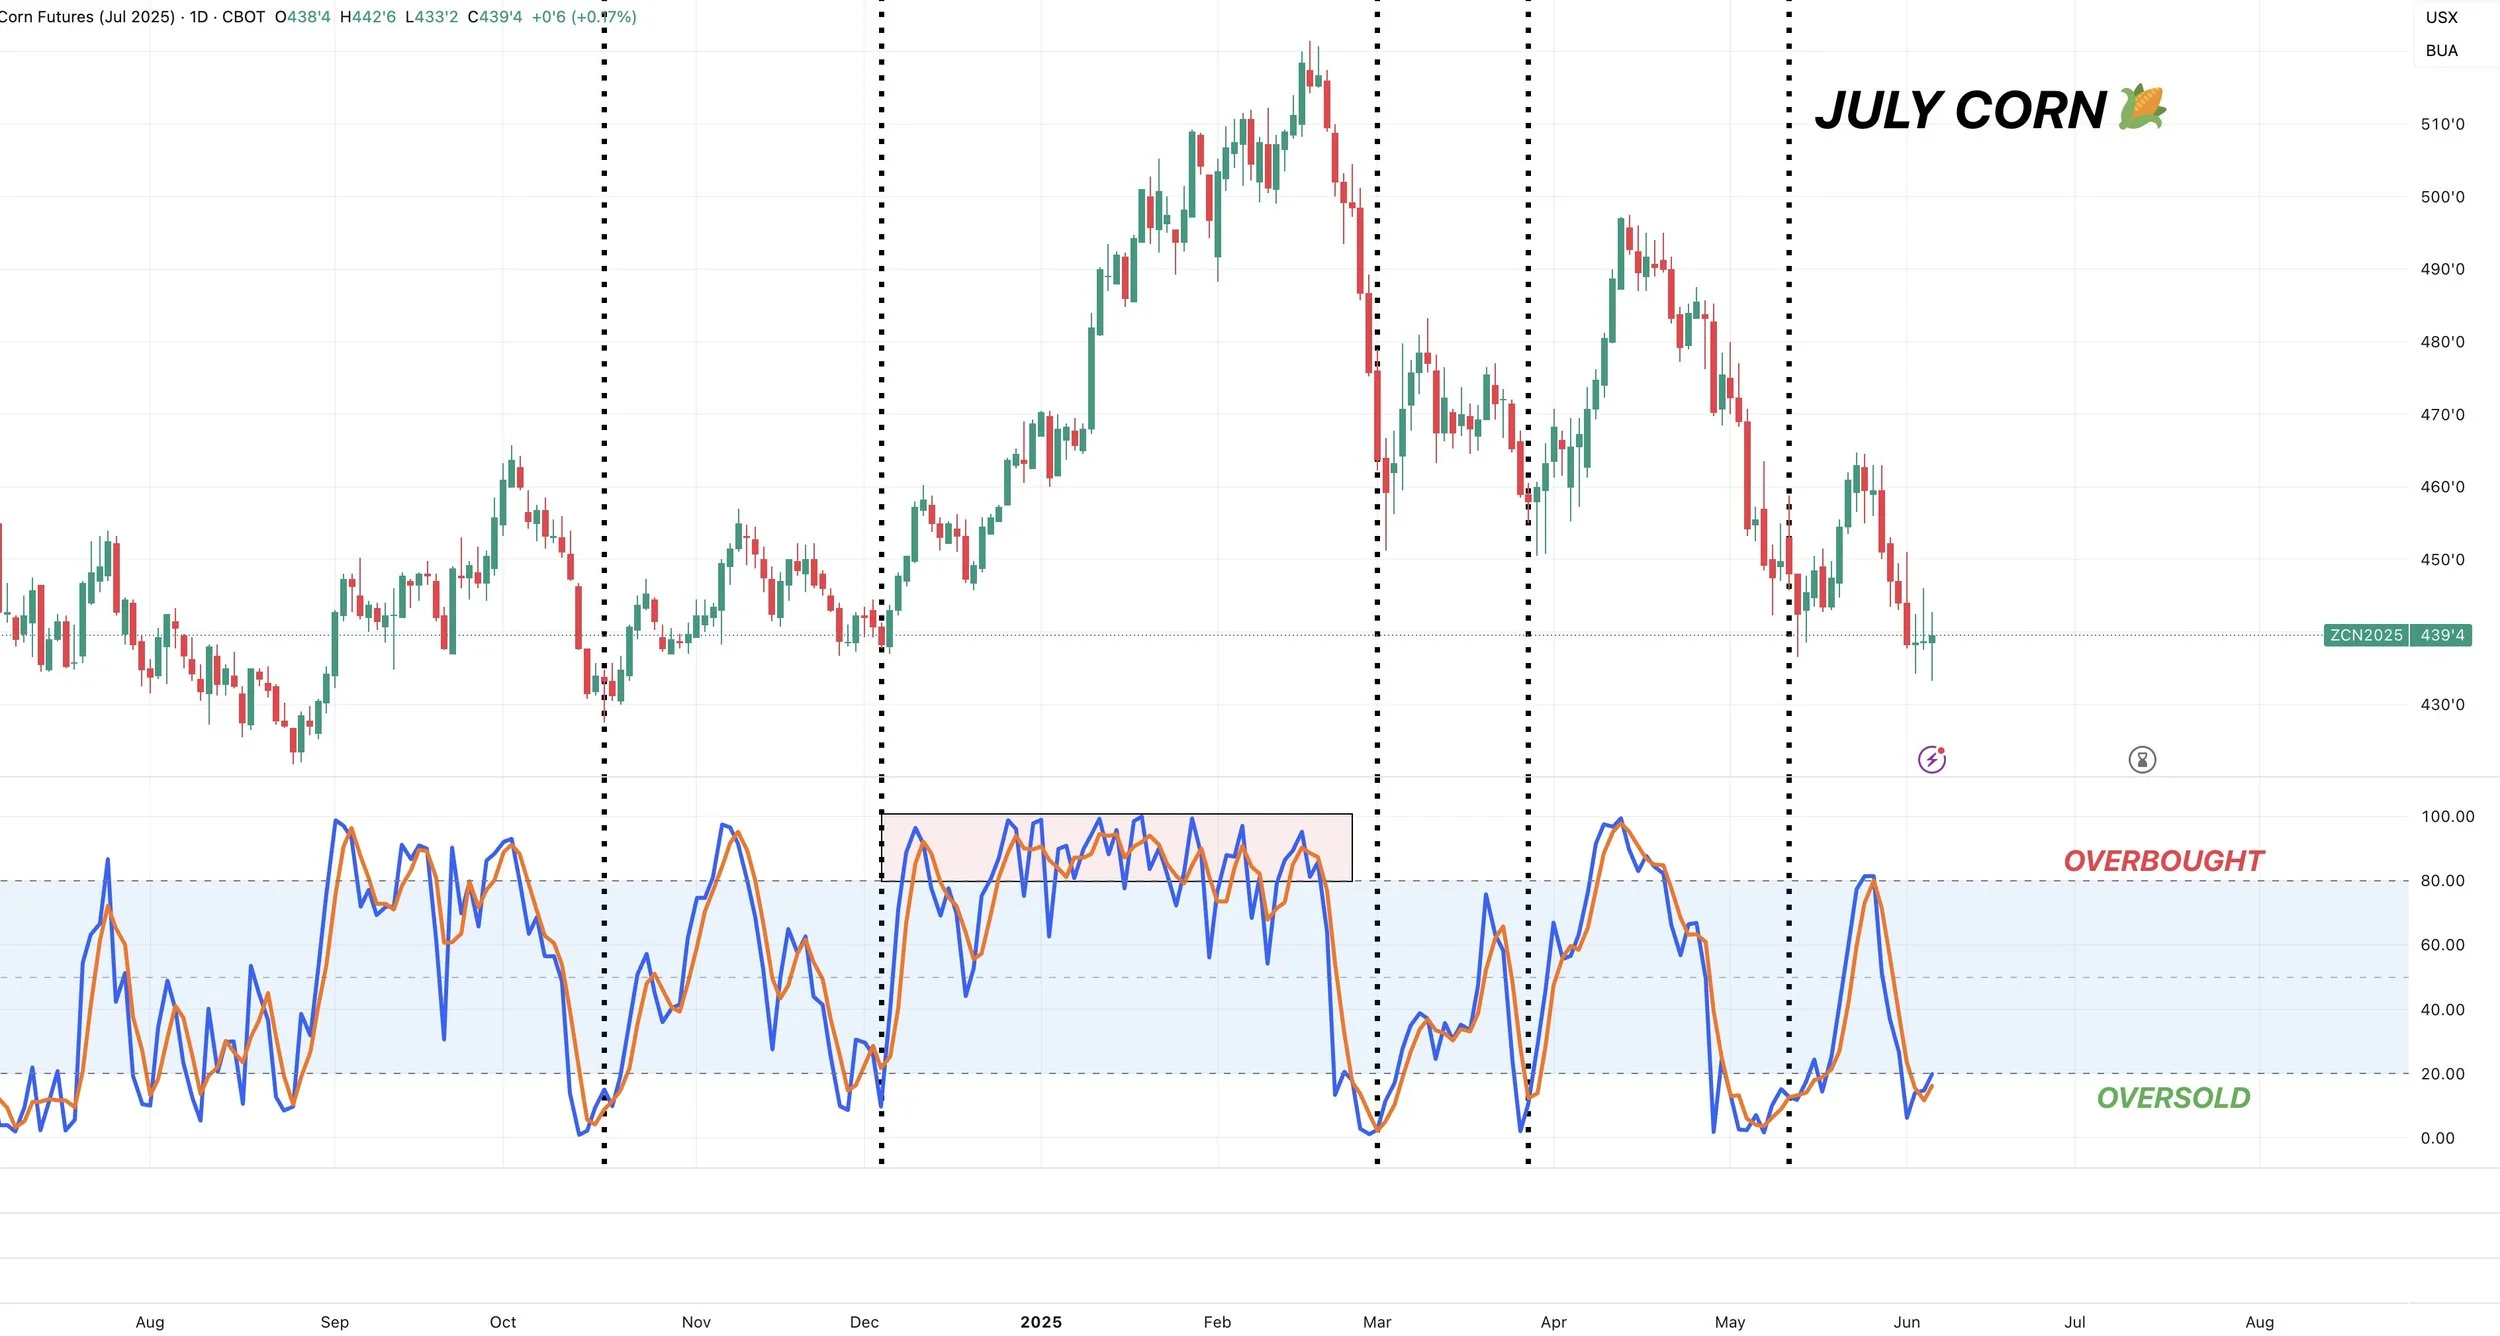
Stochastics - July
Stochastics (on the bottom of the chart) help show whether a market is oversold or overbought.
It is not a perfect indicator, but has came close to marking plenty of lows in the past (marked with vertical lines).
The reason it isn’t perfect is because they can remain elevated or stay lower for an extended period of time if you get into a really bullish or bearish market. For example back in December they remained overbought for 2 months which I highlighted with the red box.
When the indicator is below the blue box but starts turning higher, it can be a sign a bounce is coming.
If any of you follow Roach Ag, this is one of their biggest tools they use for finding buy or sell signals.
Fib Extension - Dec
Dec corn bounced perfectly at the golden fib extension we've been talking about.
Again, this fib extension box = 50% to 61.8% of the size of the April sell off.
That is exactly what we want to see.
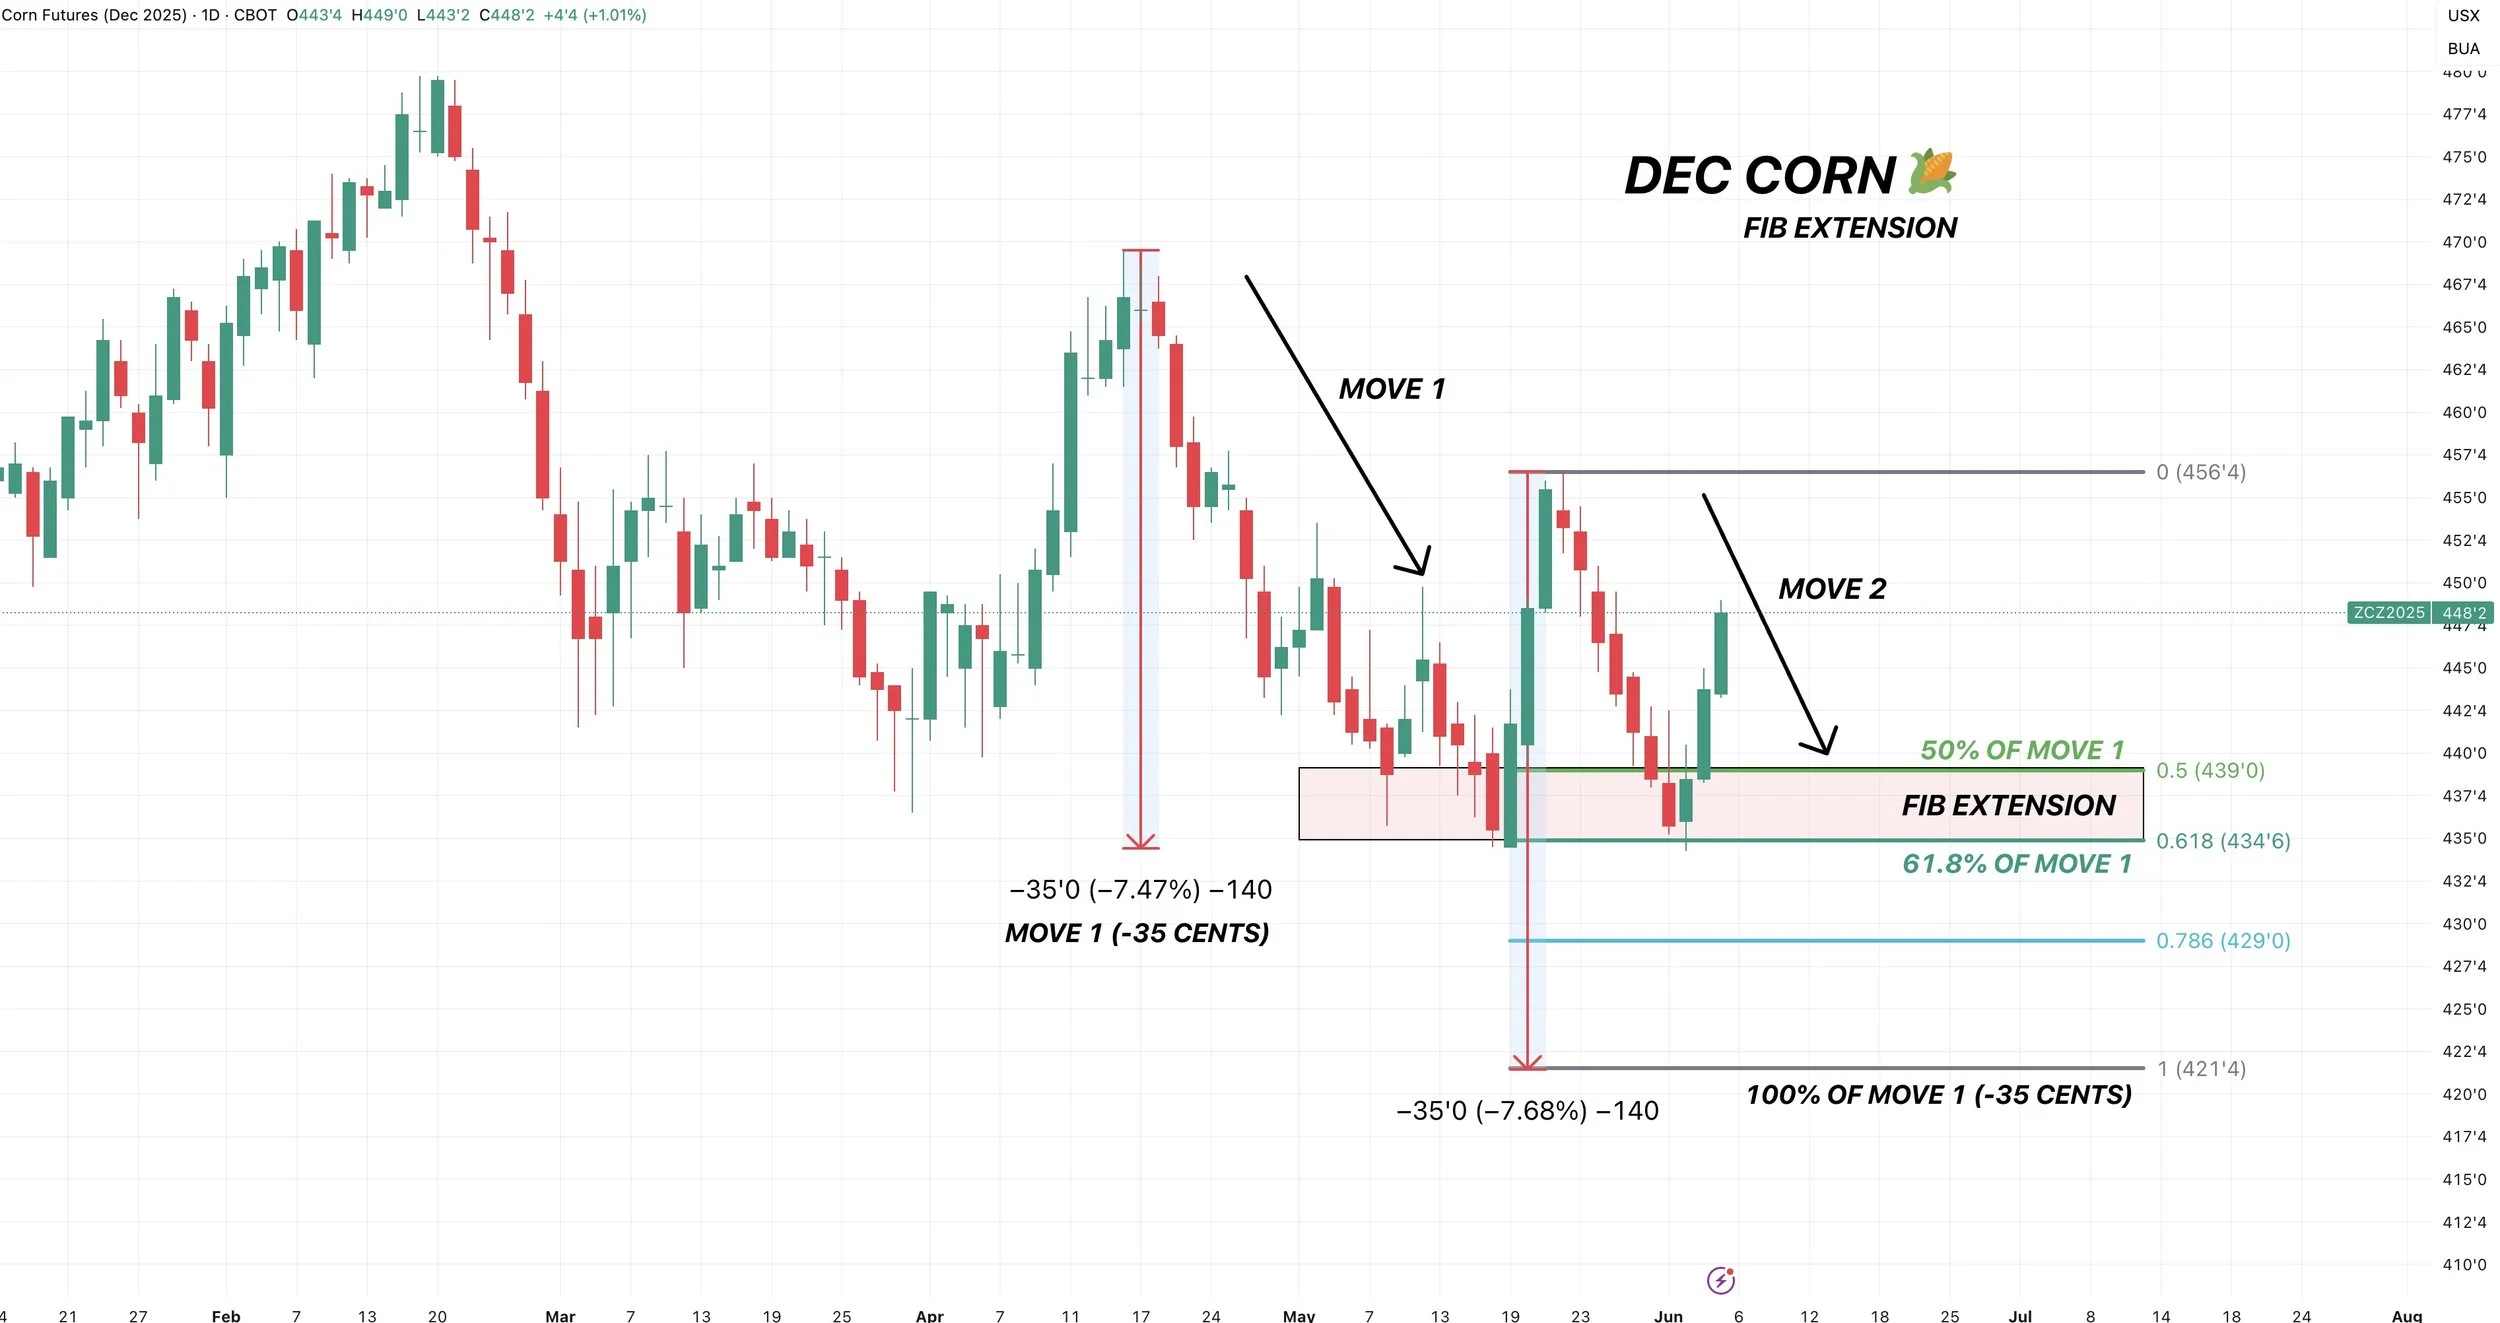
First target is still $4.60 but am looking to get more aggressive if we crawl into $4.70 to $4.80
Those levels look far away on the chart, but that is because Dec corn has traded in a tiny 30 cent range for months.
So an extra +20 cents of upside here to $4.70 doesn’t feel that far fetched.

Soybeans
Fundamentals:
Not going to go over a ton of fundamentals in soybeans today as we have dove into why I think soybeans could have a possible story several times.
I know I probably sound like I am beating a dead horse, but new crop US soybean carryout is down -15% vs last year and projected to be at 3 year lows.
That number is IF we raise a record 52.5 bushel per acre yield.
Any hiccup in production could eat into the carryout fast.
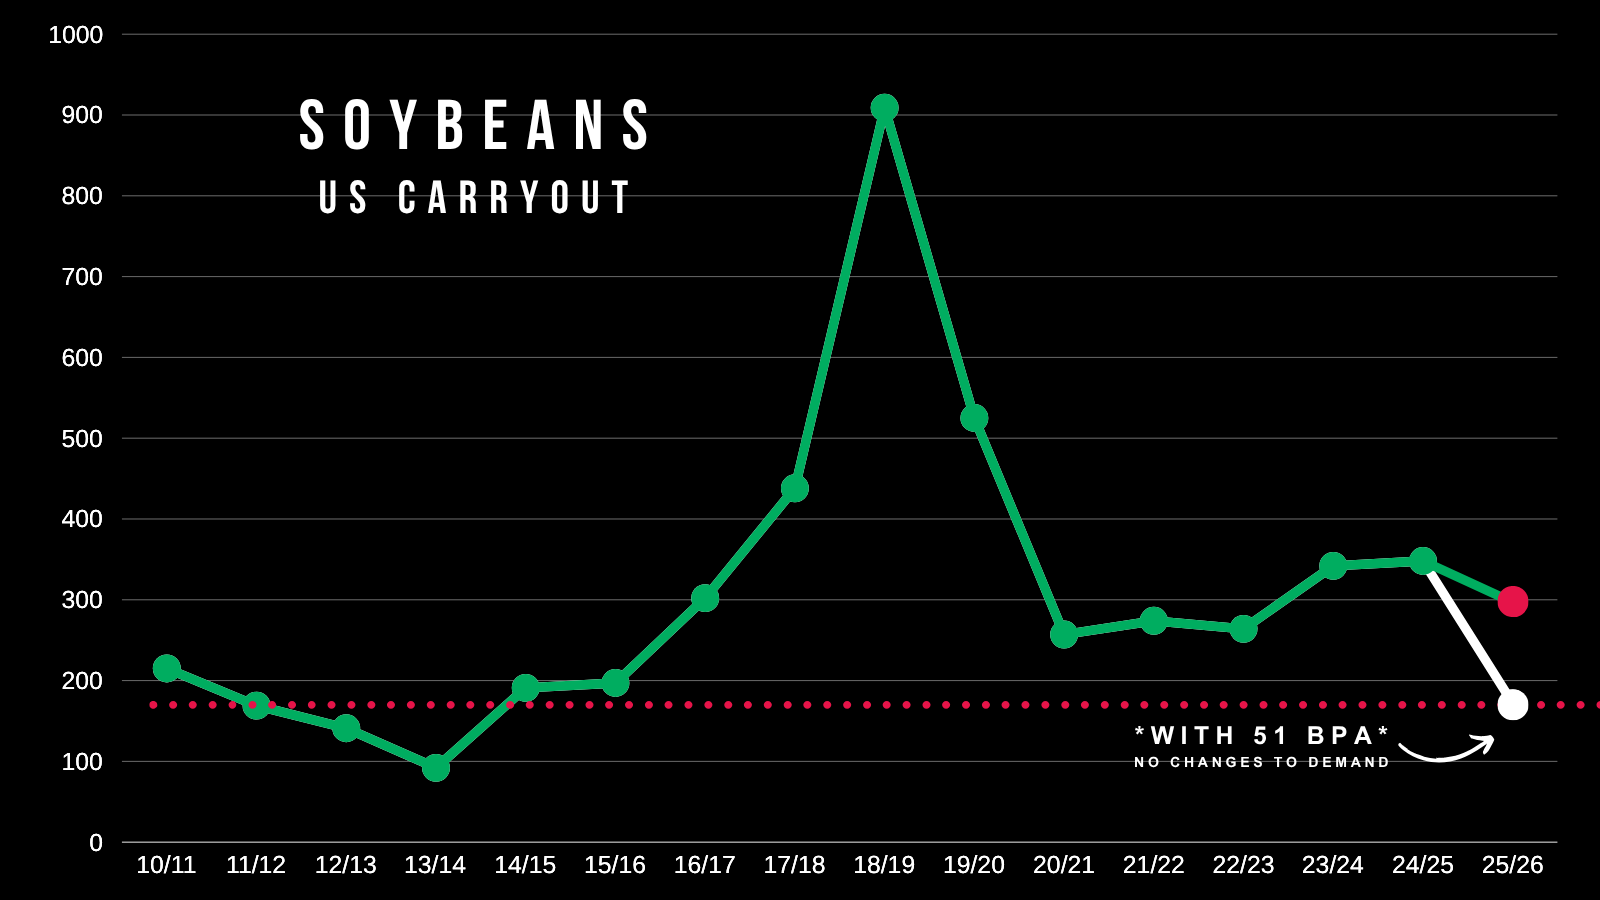
Even if we did manage to raise a record yield, even if we just simply compare soybeans to this point last year it feels like they could be undervalued.
Last year around this time soybeans were trading in the realm of $12.00 while our new crop carryout was 445 million bushels.
Today our new crop carryout is below 300 million bushels.
Yes we have to take into account the monster Brazil crop. But that alone makes me think soybeans are undervalued to some extent.
The trade war only becomes an issue if we don't find a resolution until harvest.
But during growing season, a trade war doesn't really matter because China doesn't buy much soybeans until harvest anyways.

Technicals:
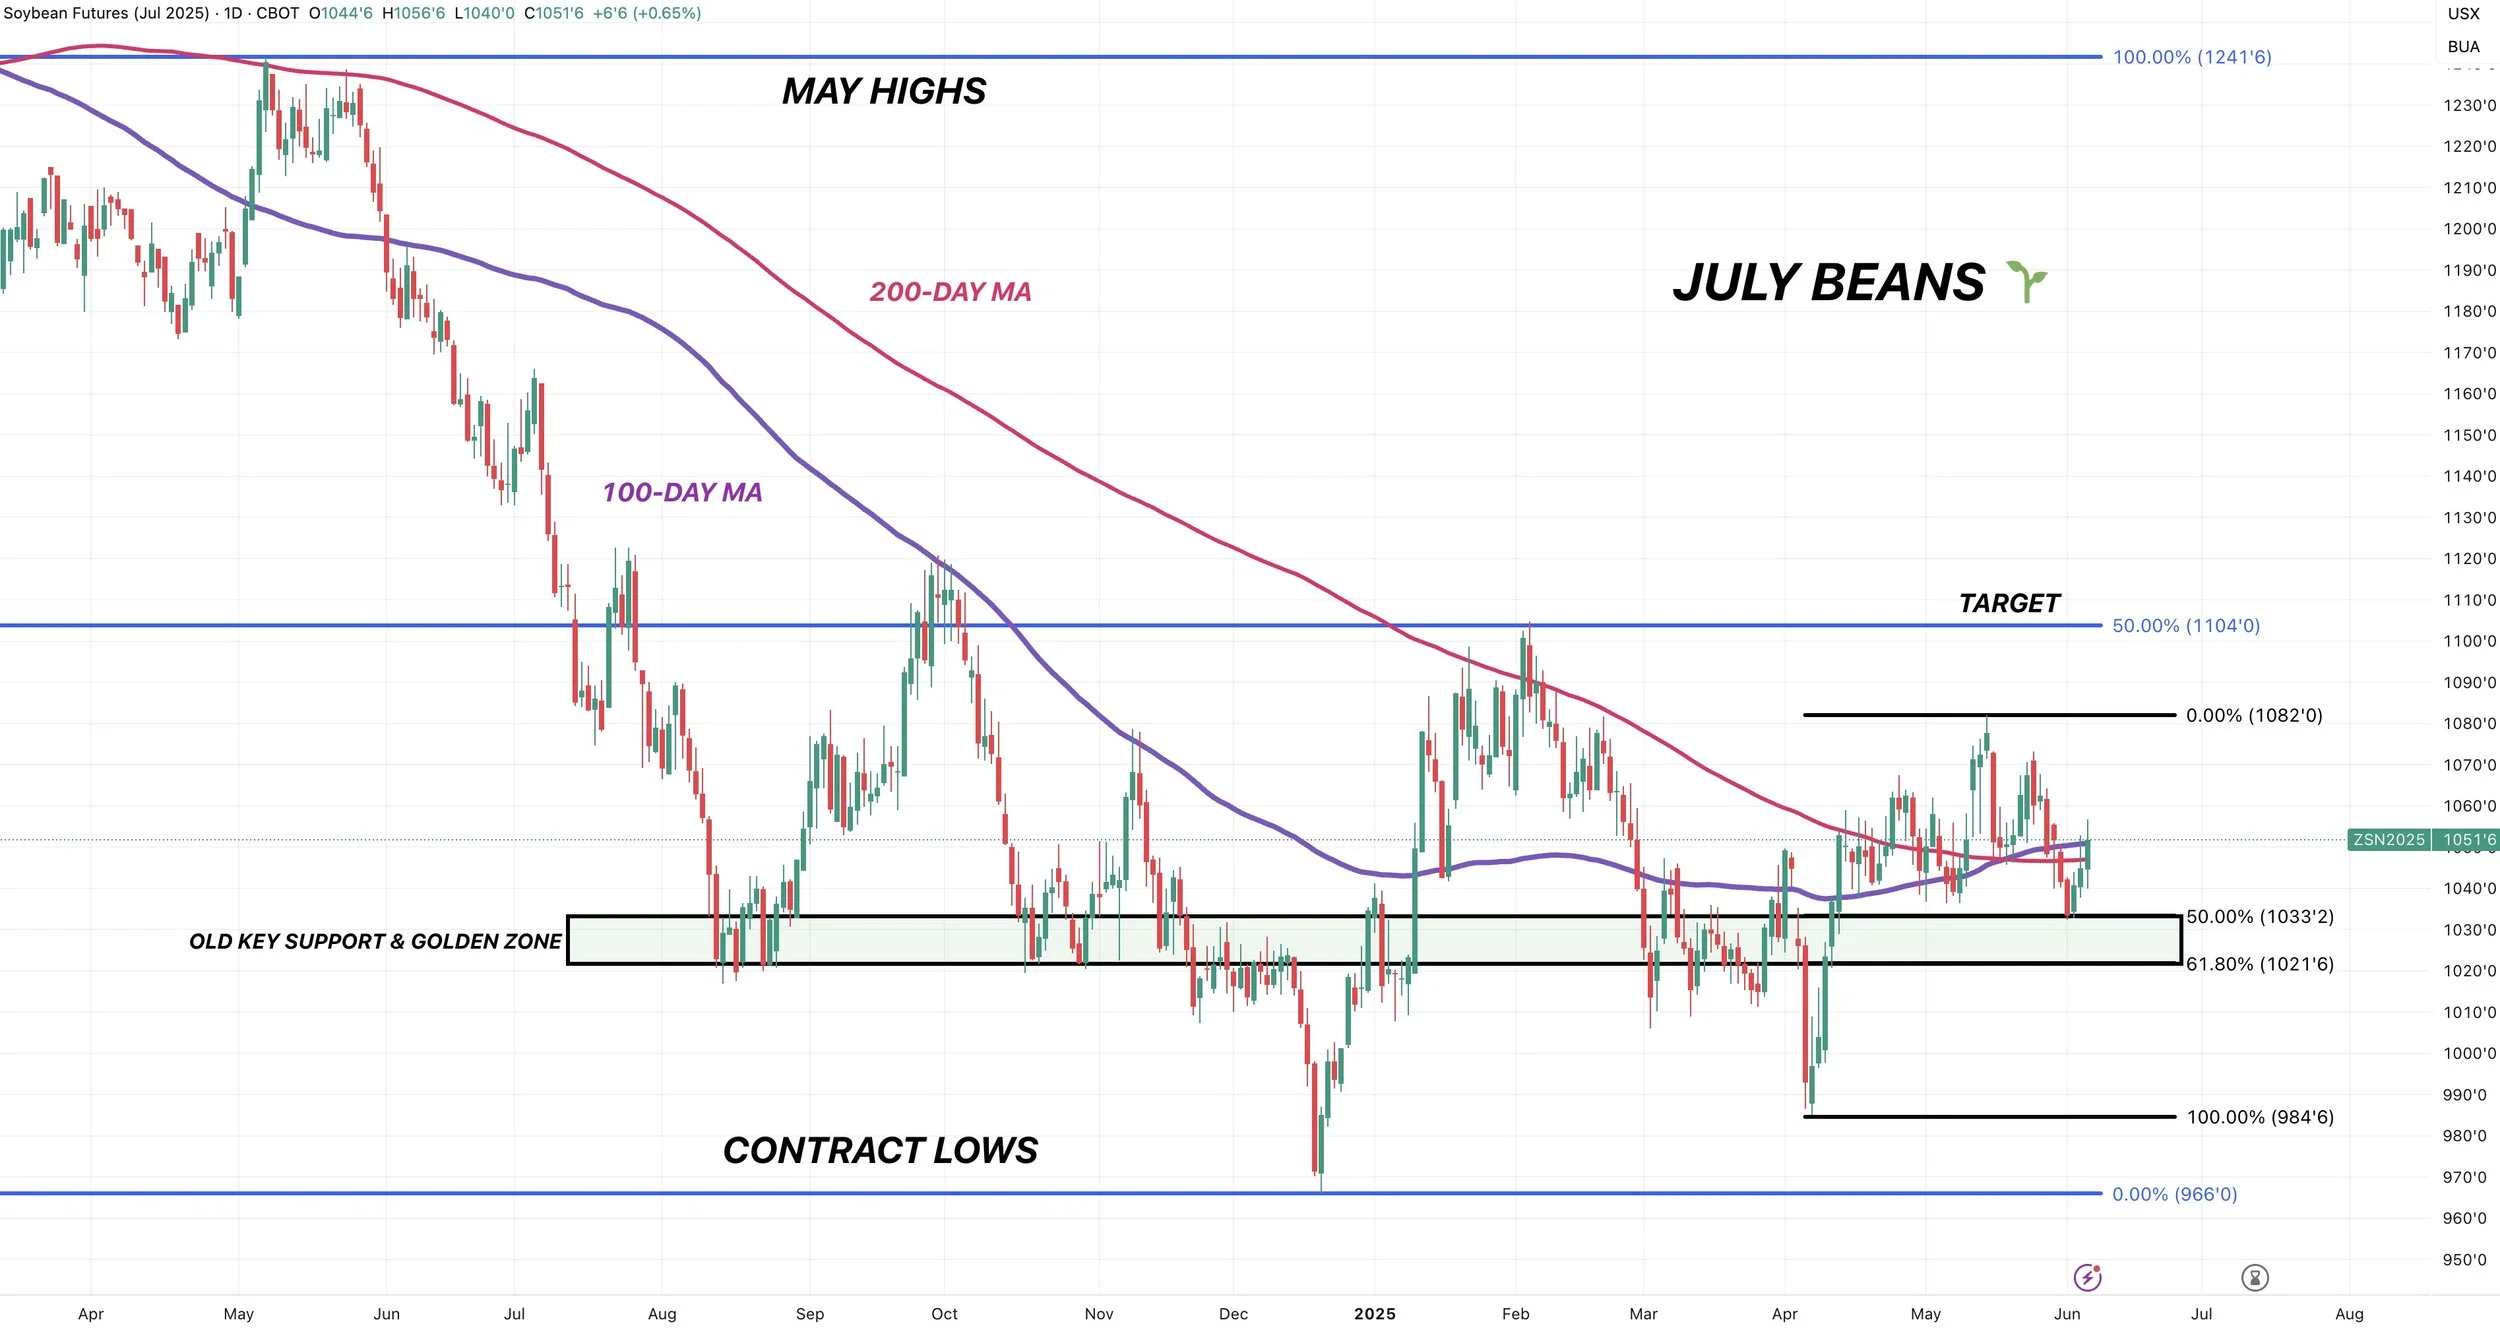
Golden Zone & Key Support - July
We found support exactly where should.
I have been saying for weeks do not be shocked if we fell to this box.
Why?
This box is the 50% to 61.8% retracement from the May highs to the trade war fear lows.
This level is important because it is seen as a make or break spot in the market.
This is where the market makes a decision.
It is the "golden zone" for a reason.
Prices usually either bounce here or fall apart. This is the most common spot for a correction to end before continuing higher.
When you hold this level and bounce, it usually signals we have more upside.
Not only is this level the golden zone. It has been key support countless times harvest.
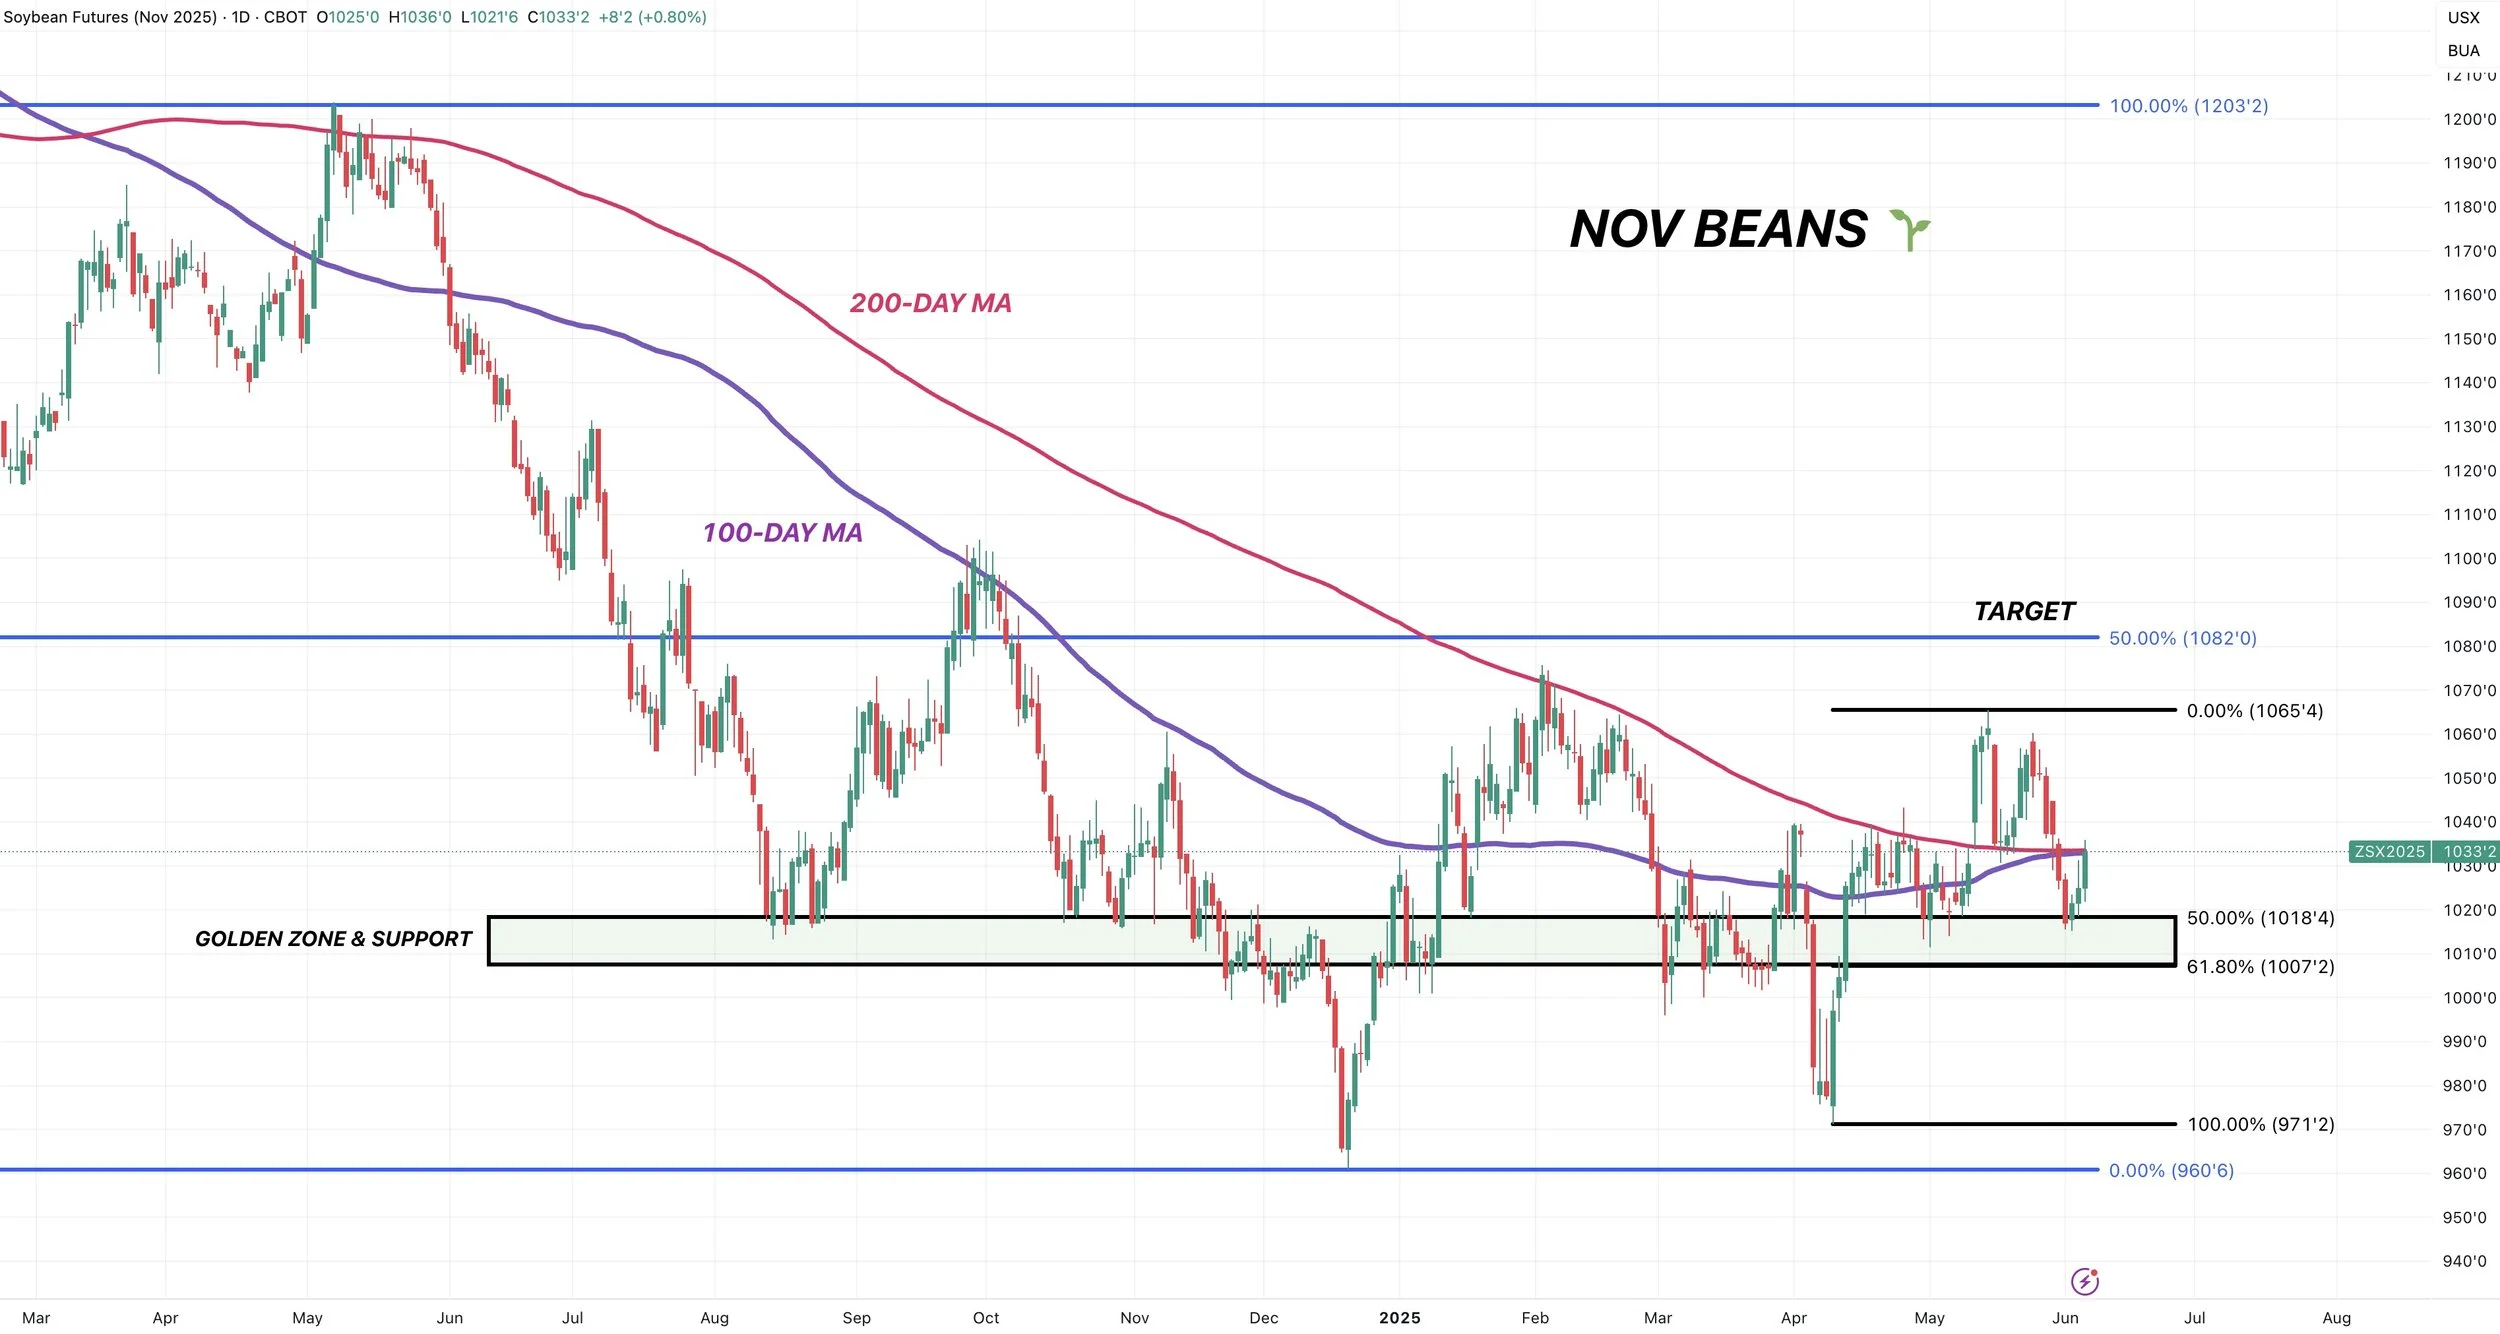
Golden Zone & Key Support - Nov
Bouncing exactly where we should here as well.
Right at the 50% retracment down to the April lows.
Key spot to hold moving forward.
Upside target is still $10.80 area. Which gives us back 50% of the May 2024 highs.
Update on Golden Cross - July & Nov
Even with the recent sell off, soybeans are inching closer to posting a golden cross.
Which has not happened since 2023.
This is when the 50-day MA (blue) crosses above the 200-day MA (pink).
It is a textbook indication that long term momentum could be shifting higher.
It is not a short term indictor, it is a long term one.

Since July beans do not have as much time as Nov beans, here is the 50 and 200-day for Nov beans.
Not as close to crossing over as July but still close.

Wheat
Fundamentals:
Not a ton of fresh things to go over on the wheat market.
Normally we don't rally going into winter wheat harvest. We usually sell off.
You can see that based on the seasonal below.
At the same time, we didn’t rally into May this year like normally do.

One of the biggest things wheat has going for it is the fact that the funds are record short.
Here is their winter wheat position.

At some point the funds will have to cover. But the question is when?
Normally, you'd think they would wait until after harvest because after harvest there really isn’t a major reason to keep hammering things from the short side.
Which is why I think wheat could catch a bid post harvest.
But maybe they decide to cover due to a breakout on the charts and we actually rally going into harvest, kind of like how we sold off going into a seasonal time frame where we usually rally.
Because we do have a potential bullish pattern setting up in July KC wheat.
Regardless, they should have to cover at some point whether it happens now or post-winter wheat harvest. We're going to be prepared if we get an opportunity.
Technicals:
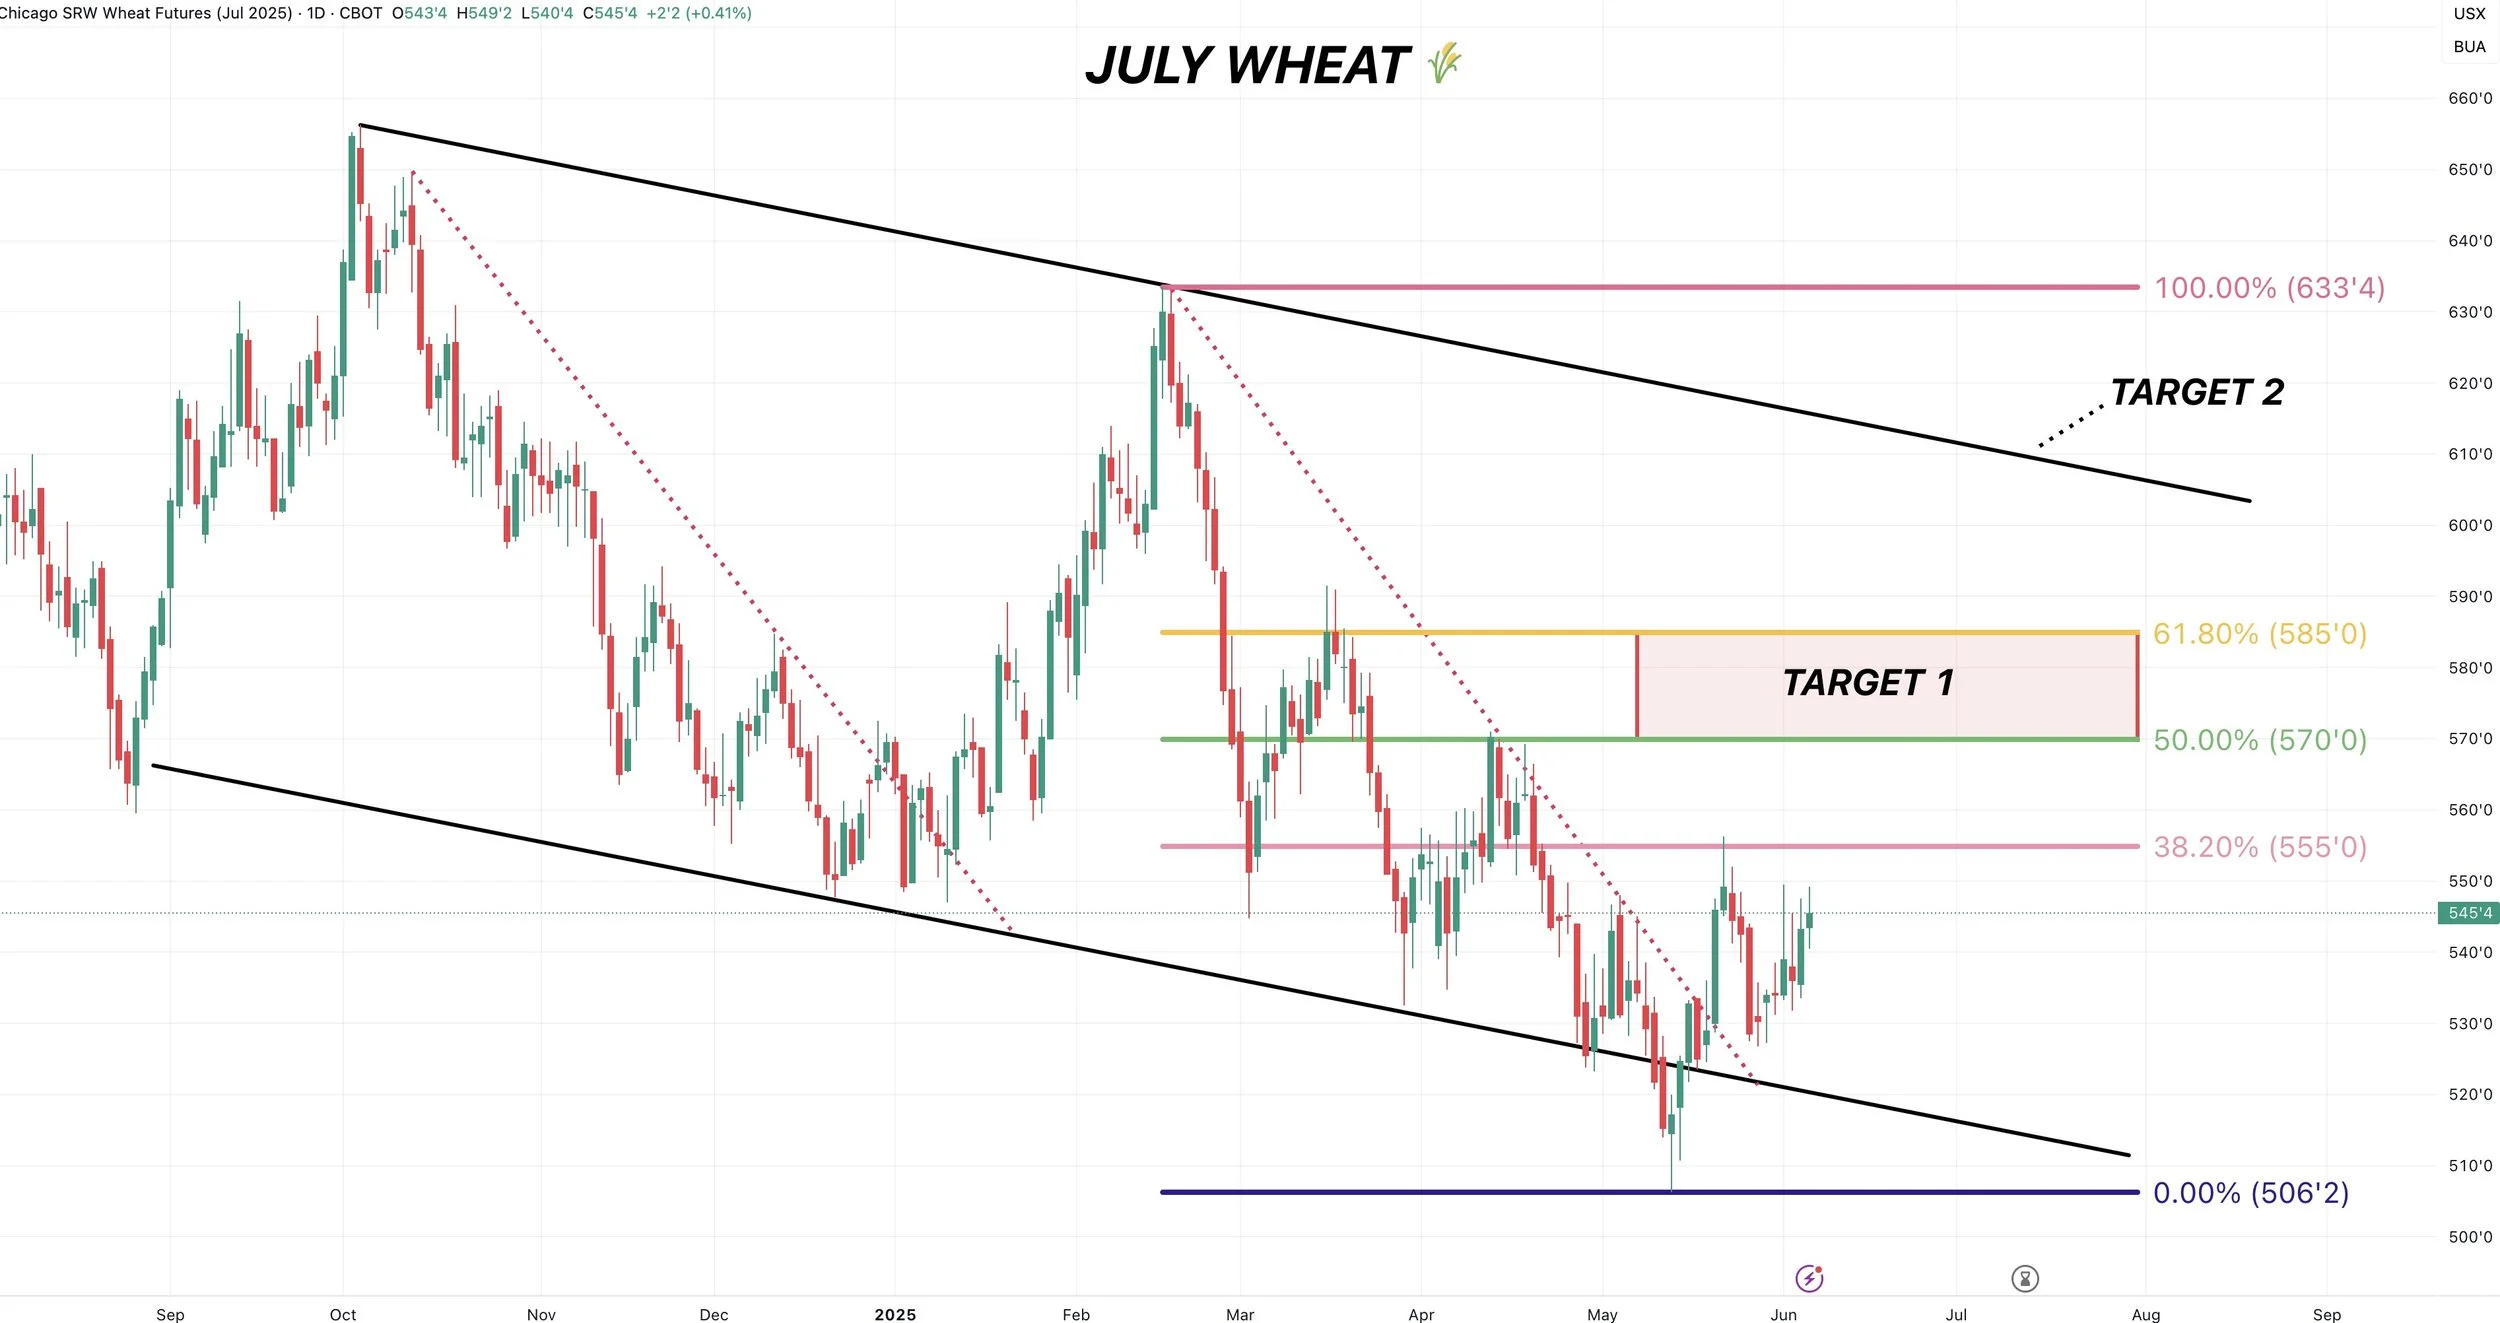
For July Chicago, I am still looking for $5.70 to $5.85 to de-risk.
If we clear $5.55 it should give us the green light to go higher.
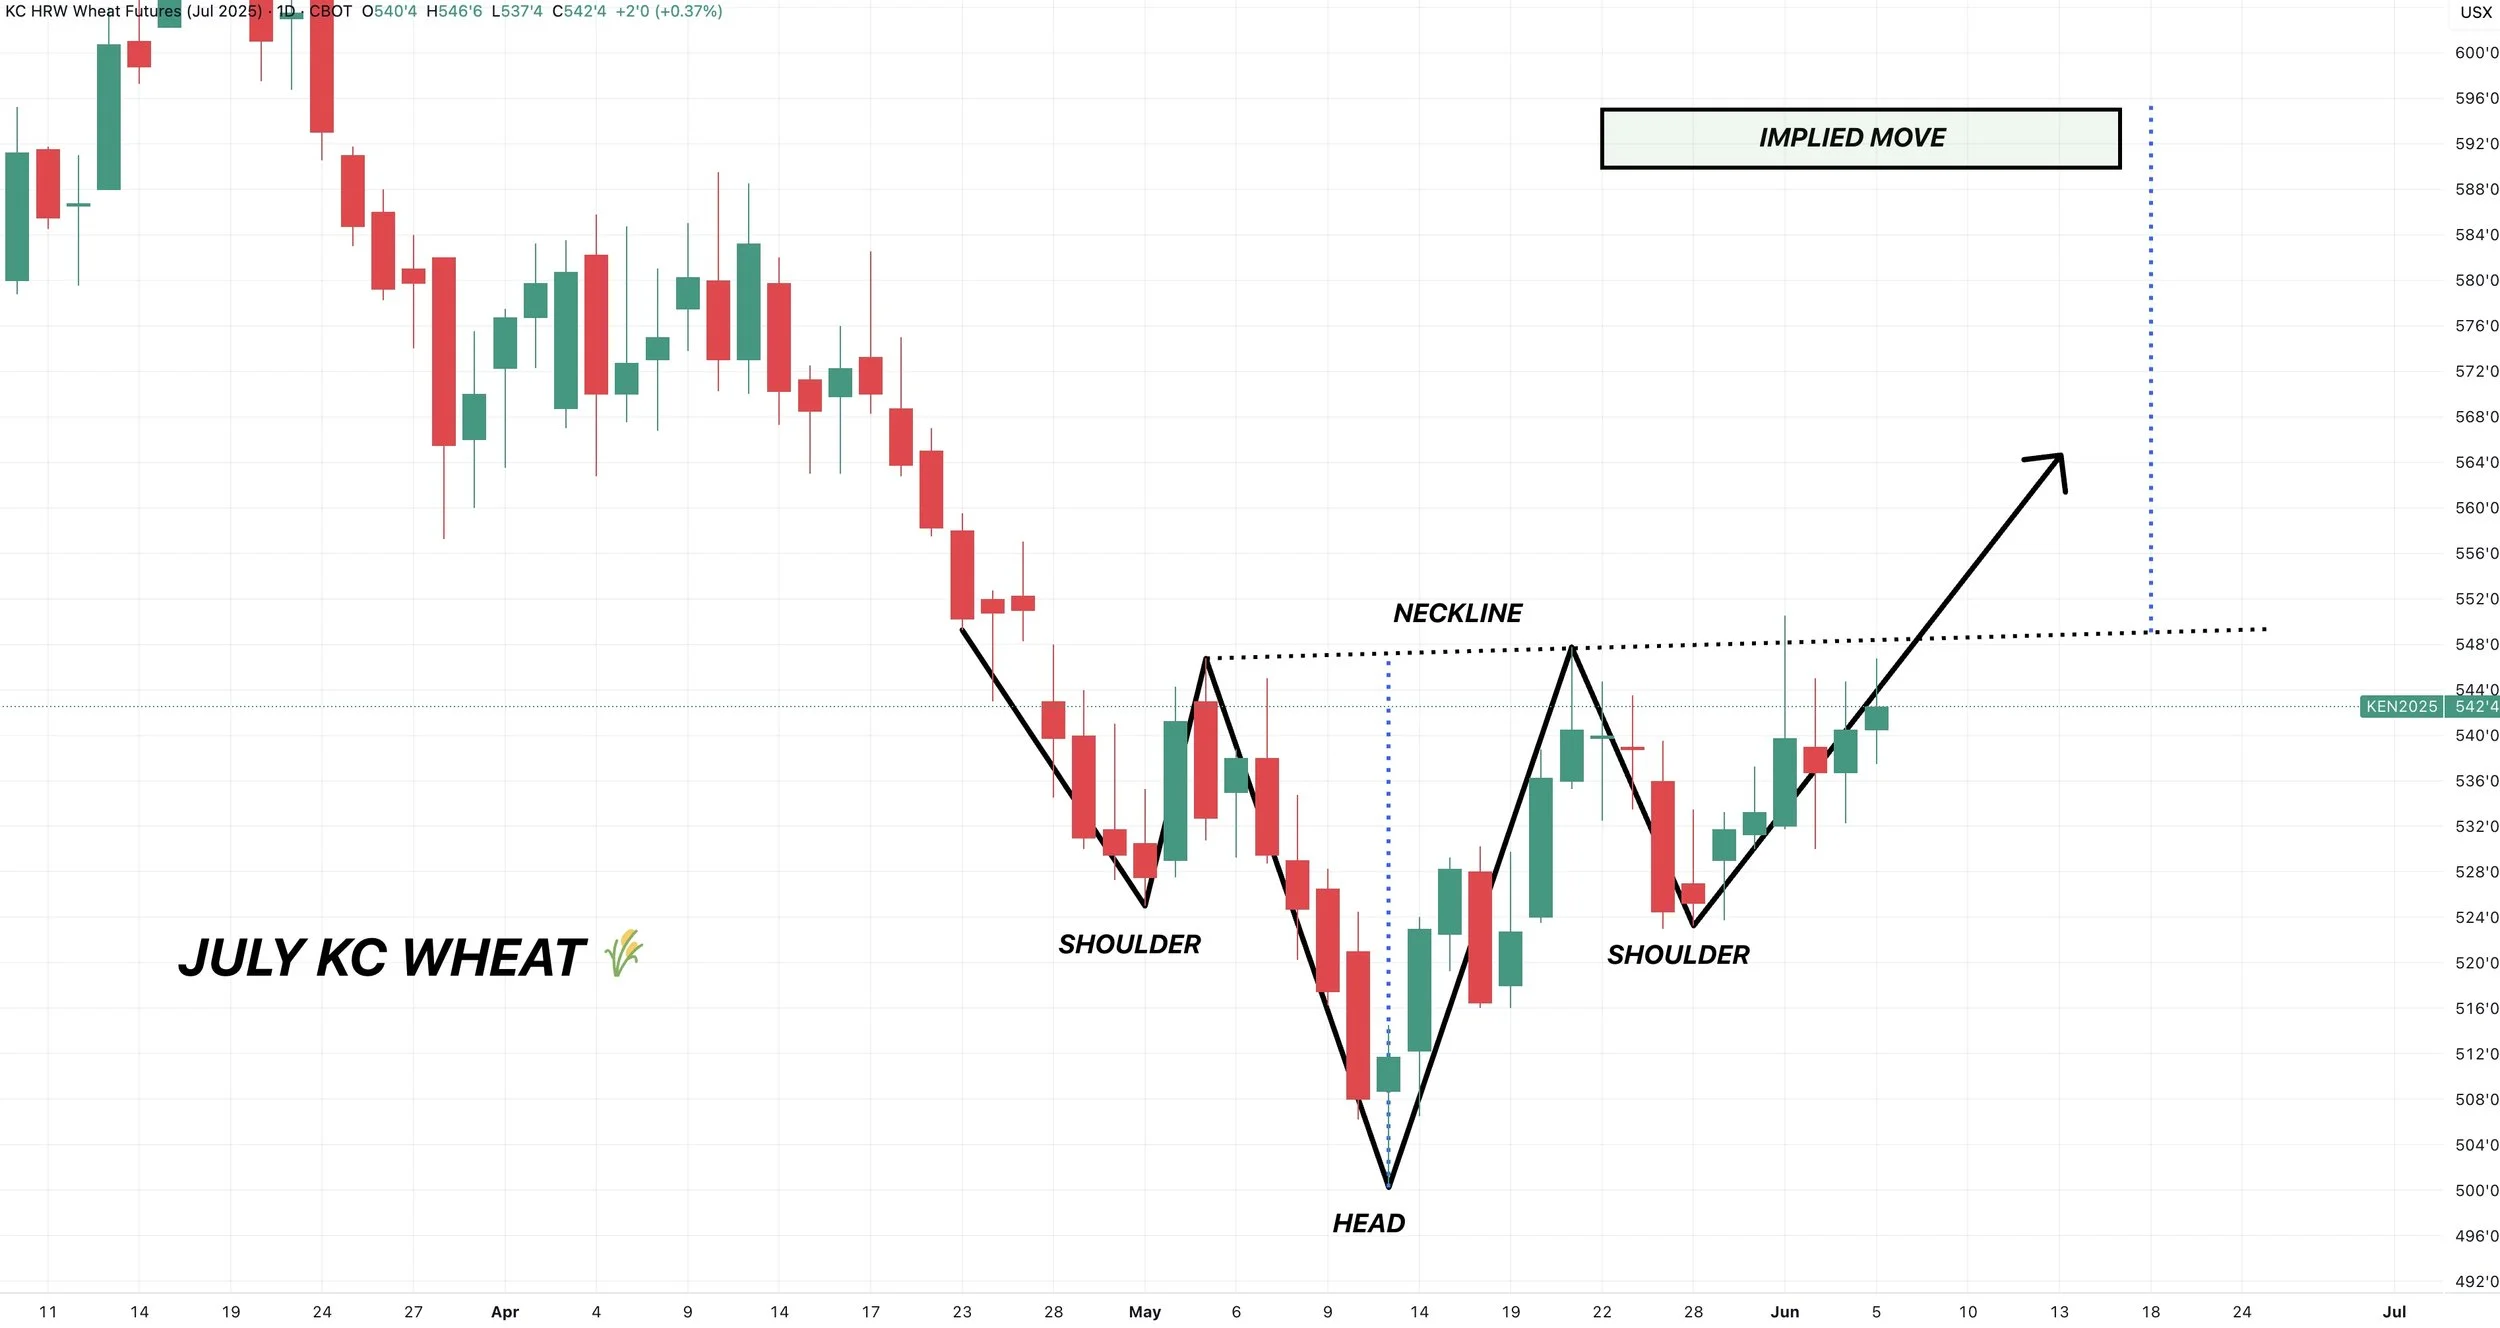
The interesting thing with July KC is this potential inverse head & shoudlers pattern.
We need to break above the neckline for confirmation, but the implied move is $5.95
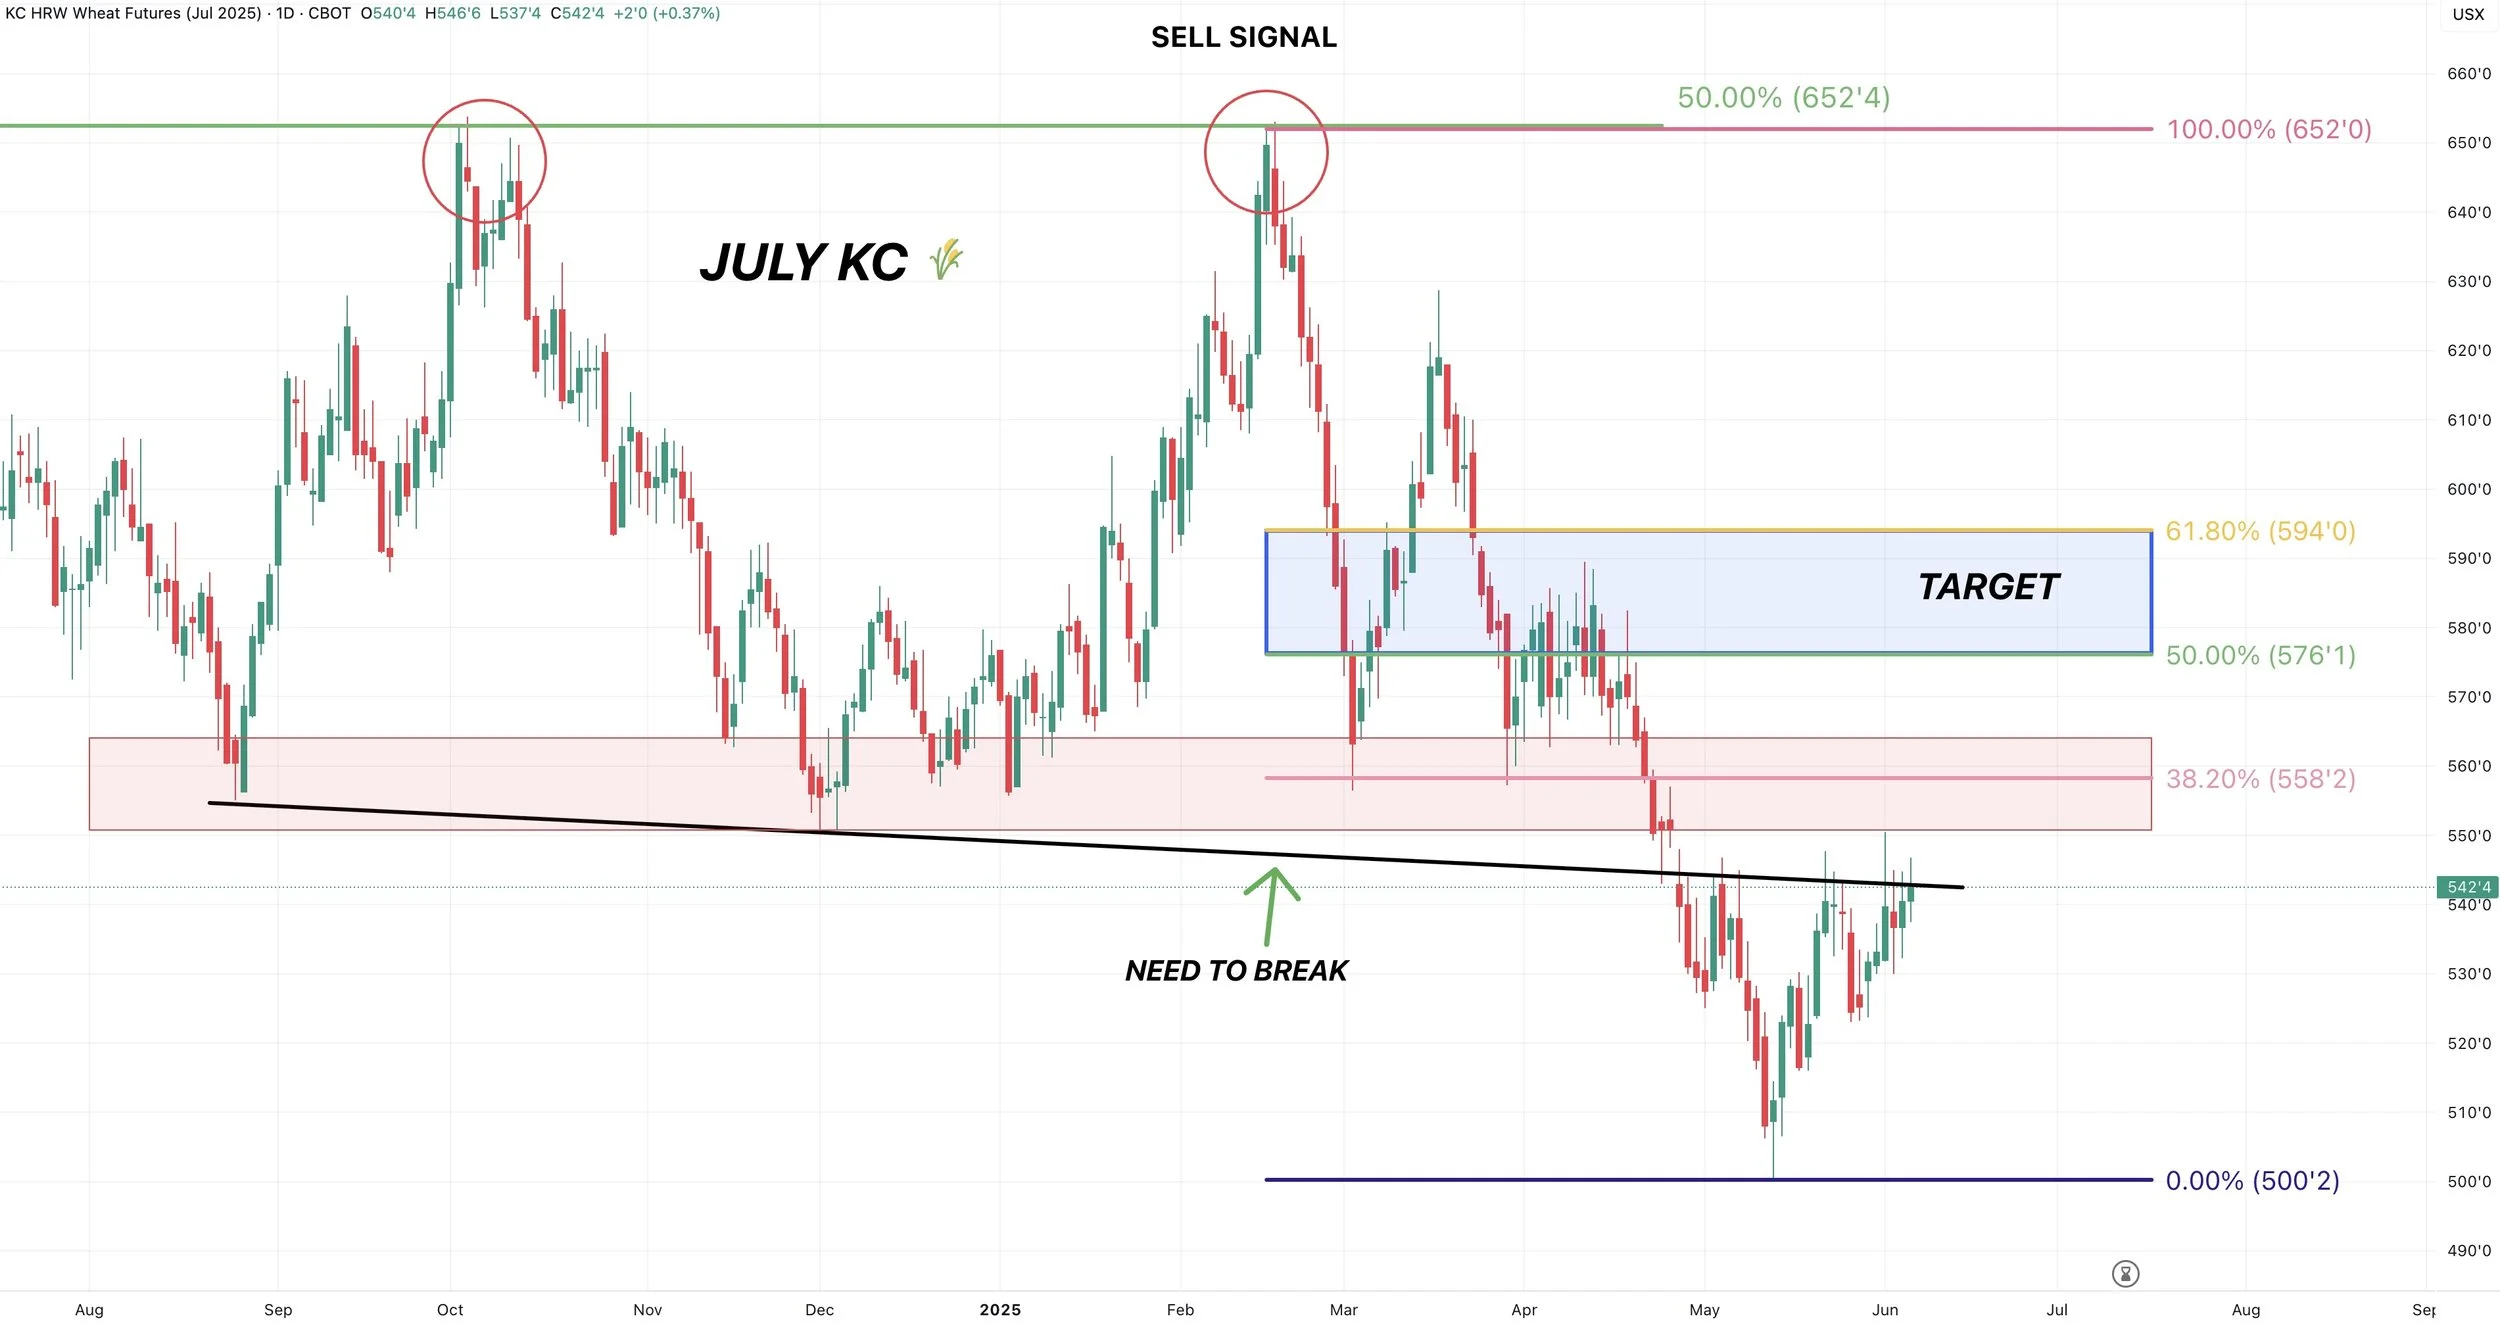
$5.95 also happens to exactly be the 61.8% retracement up to those February highs (shown in the next chart).
Next target is $5.75 to $5.95
Like I mentioned, that $5.95 level reclaims 61.8% of the Feb highs and interestingly enough happens to be the implied move of the inverse head & shoulders pattern.
The biggest thing to watch here is if we can bust above this old trendline support. It was old support. It is now resistance.
We rejected it on the recent rally. Now testing it again. A break above should trigger more upside.
Past Sell or Protection Signals
We recently incorporated these. Here are our past signals.
June 5th: 🐮
Cattle sell signal & hedge alert.
June 2nd: 🌾
MPLS wheat sell signal.
April 10th: 🌽
Old crop corn sell signal.
March 19th: 🐮
Cattle hedge & sell signal.
Feb 18th: 🌽 🌾
Old crop KC wheat & old crop corn signal.
Jan 23rd: 🌽 🌱
Corn & beans old crop sell signal.
CLICK HERE TO VIEW
Jan 15th: 🌽 🌱
Corn & beans hedge alert/sell signal.
Jan 2nd: 🐮
Cattle hedge alert at new all-time highs & target.
Dec 11th: 🌽
Corn sell signal at $4.51 200-day MA
CLICK HERE TO VIEW
Oct 2nd: 🌾
Wheat sell signal at $6.12 target
Sep 30th: 🌽
Corn protection signal at $4.23-26
Sep 27th: 🌱
Soybean sell & protection signal at $10.65
Sep 13th: 🌾
Wheat sell signal at $5.98
May 22nd: 🌾
Wheat sell signal when wheat traded +$7.00
Want to Talk?
Our phones are open 24/7 for you guys if you ever need anything or want to discuss your operation.
Hedge Account
Interested in a hedge account? Use the link below to set up an account or shoot Jeremey a call at (605)295-3100.
Check Out Past Updates
6/5/25
CATTLE SELL SIGNAL & HEDGE ALERT
6/4/25
HOW UNKNOWNS IMPACT MARKETING DECISIONS
6/3/25
KEY SPOTS ON THE CHARTS FOR CORN & BEANS
6/2/25
NEW LOWS IN CORN. DE-RISKING MPLS WHEAT
6/2/25
SPRING WHEAT SELL SIGNAL
5/30/25
SEASONAL RALLY STILL IN THE CARDS?
5/29/25
WHAT IS YOUR PLAN IF WE DO NOT RALLY?
5/28/25
ZERO PREMIUM IN THE GRAIN MARKETS
5/27/25
CORN CONDITIONS DISAPPOINT & JUNE OUTLOOK IMPROVES
5/23/25
TARIFFS SPOOK MARKET. GAME PLAN MOVING FORWARD
5/22/25
CHART BREAKDOWNS & TARGETS
5/21/25
RISK TO THE UPSIDE WITH WEATHER?
5/20/25
WHEAT SHORT COVERING & HISTORY OF YIELD CHANGES
5/19/25
ANYONE LEFT TO SELL WHEAT? 181 CORN YIELD POSSIBLE?
5/16/25
FUNDS SHORT CORN. MARKETS WAITING ON WEATHER
5/15/25
BEANS HAMMERED ON RUMOR & WHEAT FINDING LIFE
5/14/25
DECISIONS & POSSIBILITIES IN GRAINS
5/13/25
GRAINS RALLY OFF LOWS
5/12/25
USDA REPORT. HOW THIS CHANGES THINGS
5/9/25
BIGGEST RISKS IN USDA REPORT
5/8/25
USDA MONDAY & HISTORY OF WEATHER RALLIES
5/7/25
NEW 2025 LOWS FOR CORN
5/6/25
WHAT’S A SUMMER RALLY LOOK LIKE?
5/5/25
CORN ERASES ENTIRE APRIL RALLY
5/2/25
SELL INTO UNCERTAINTY. NOT KNOWN FACTORS
5/1/25
THE CASE AGAINST A FEB TOP IN CORN
4/30/25
APPROACHING KEY TIME PERIOD FOR GRAINS
4/29/25
PLANTING & FIRST NOTICE DAY PRESSURE. CORN CLOSE TO BOTTOM?
4/28/25
CAPTURING INVERSE & SEASONAL PREPARATION
4/25/25
HOW OFTEN DOES CORN NOT BREAK APRIL HIGHS?
4/24/25
KNOW WHEN TO SELL. BEANS BREAK 200-DAY FIRST TIME IN 483 DAYS
4/23/25
MONEY FLOW & DROUGHT CARDS
4/22/25
CRUCIAL SPOT FOR CORN & BEANS
4/21/25
NO PLANTING THREAT YET
4/18/25
POTENTIAL OPPORTUNITIES, BASIS CONTRACTS & STRATEGIES
4/16/25
HOW YIELD IMPACTS CARRYOUT. MAJOR SPOT FOR SOYBEANS
4/15/25
TOTAL CHART BREAKDOWNS & TARGETS
4/14/25
TECHNICAL SELLING IN GRAINS
4/11/25
SPECIFIC GRAIN MARKETING DECISIONS
4/10/25
USDA REPORT. HOW THIS IMPACTS CORN
4/9/25
TARIFFS GIVE. TARIFFS TAKE
4/8/25
CORN’S DIVERGING STRENGTH
4/7/25
SOLID PRICE ACTION DESPITE OUTSIDE FEAR
4/4/25
CORN PRICE ACTION SPEAKS VOLUME. ANY HOPE LEFT FOR SOYBEANS?
4/3/25
WHAT IS LEFT FOR CORN BEARS? TRADE WAR: CHARTS HOLDING SUPPORT
4/2/25
SHOULD UNKNOWNS KEEP A FLOOR UNDER GRAIN PRICES?
4/1/25
HOW DO ACRES IMPACT FUTURE OF THE GRAINS?
3/31/25
USDA REPORT: NOW WHAT?
3/28/25
ALL EYES ON USDA
3/27/25
PRE-USDA POSITIONING. DON’T GIVE GRAIN AWAY
3/26/25
HISTORY OF MARCH INTENTIONS. SOYBEANS UNDERVALUED?
3/25/25
6 DAYS UNTIL MAJOR USDA REPORT
3/24/25
HOW TO POSITION YOURSELF BEFORE PLANTING
3/21/25
REASONS TO BE OPTIMISTIC IN GRAINS?
3/20/25
WAS THAT THE BOTTOM IN CORN?
3/19/25
THE PATH HIGHER & THE DOWNSIDE RISKS IN GRAINS
3/18/25
SEASONALS, CATTLE HEDGE, CHARTS & DROUGHT?
3/17/25
WHEAT RALLIES. DON’T GET BACKED INTO A CORNER
3/14/25
MARCH 31ST REPORT THOUGHTS & WHAT’S NEXT FOR GRAINS
3/13/25
EXPLAINING RE-OWNERSHIP VS COURAGE CALLS
3/12/25
TARIFF FEARS. EU, CANADA, & ETHANOL
3/11/25
USDA SNOOZE. RECORD FUND SELLING A CONCERN?
3/10/25
USDA TOMORROW. GETTING COMFORTABLE IN MARKETING
3/7/25
HOW TIGHT IS THE WORLD & US SITUATION?
3/6/25
TARIFFS PUSHED BACK. FUTURE OPPORTUNITIES?
3/5/25
IS GRAINS BIGGEST RISK WEAK CRUDE & DEFLATION?
3/4/25
TRADE WAR BEGINS. 8TH DAY OF PAIN FOR GRAINS
3/3/25
TARIFFS ON TOMORROW. BUY SIGNAL
3/3/25
BUY SIGNAL
2/28/25
WHEN WILL THE BLEEDING STOP?
2/27/25
CORN AT CRITICAL SPOT. USDA ACRE REPORT. WAY TOO EARLY DROUGHT TALK
2/26/25
HISTORY SUGGESTS CORN TOP ISN’T IN? ACRE OUTLOOK TOMORROW
2/25/25
POSITIVE CLOSE. WHAT TO KNOW ABOUT USDA OUTLOOK
2/24/25
USDA OUTLOOK, FIRST NOTICE DAY & BRAZIL
2/21/25
WHAT TO EXPECT MOVING FORWARD IN GRAINS
2/20/25
FIRST NOTICE DAY CONCERNS. MASSIVE CORN ACRES OR NOT?
2/19/25
HOW TIGHT IS THE CORN SITUATION?
2/18/25
MORE DETAILS ON TODAYS SELL SIGNAL
2/18/25
OLD CROP KC WHEAT & CORN SELL SIGNAL
2/14/25
WHEAT BREAKING OUT ON WEATHER RISK. TECHNICALS & FUNDAMENTALS
2/12/25
GLOBAL GRAIN SITUATION, ACRE TALK, CHARTS & MORE
2/11/25
USDA: NOT A BEARISH REPORT. DISAPPOINTING PRICE ACTION
2/10/25
USDA TOMORROW. LONG TERM PATH FOR SUB 10% CORN STOCKS TO USE?
2/7/25
WHY WOULD THE FUNDS EXIT THEIR LONGS?
2/6/25
WHEAT FINALLY CATCHING A BID
2/5/25
COMPLETE THOUGHTS ON MARKETS: BACK & FORTH DISCUSSION
2/4/25
STRONG JANUARY LEAD TO STRONG YEAR? TARIFFS, CHARTS & MORE
2/3/25
TARIFFS PUSHED BACK
1/31/25
TARIFF NEWS ALL OVER THE PLACE. ARE YOU PREPARED FOR POSSIBILITIES?
1/30/25
WHEAT BULL ARGUMENT. TRUMP ADDS TARIFFS
1/29/25
CORN APPROACHES $5.00
1/28/25
TARIFFS, CORN FUNDS, SOUTH AMERICA & MORE
1/27/25
HEALTHY CORRECTION WE TALKED ABOUT & TARIFF NEWS
1/24/25
GRAINS DUE FOR SHORT TERM CORRECTION?
1/23/25
OUR ENTIRE NEW CROP SALES THOUGHTS & OLD CROP SELL SIGNAL
1/22/25
GRAINS TAKE A BREATHER. IS CORN IN A BULL OR BEAR MARKET?
1/21/25
HUGE DAY IN GRAINS. WHAT TO DO WITH OLD CROP VS NEW CROP
Read More
1/20/25
VIDEO CHART UPDATE
1/17/25
TRUMP, CHINA, ARGY & USING THE SPREADS INVERSE
1/16/25
OLD CROP LEADS US LOWER. MARKETING THOUGHTS
1/15/25
SIGNAL & HEDGE ALERT QUESTIONS EXPLAINED. IS $6 CORN EVEN POSSIBLE?
1/14/25
MORE DETAILS ON TODAYS HEDGE ALERT & SELL SIGNAL
1/14/25
CORN & SOYBEANS HEDGE ALERT/SELL SIGNAL
1/13/25
USDA GAME CHANGER OR NOT?
1/10/25
BULLISH USDA FOR CORN & BEANS
1/9/25
USDA OUT TOMORROW
1/8/25
2 DAYS UNTIL USDA. BE PREPARED
1/7/25
THE HISTORY OF THE JAN USDA & MORE
1/6/25
MAJOR USDA REPORT FRIDAY
Read More
1/3/25
UGLY DAY ACROSS THE GRAINS
1/2/25