
ARE CORN & BEANS UNDERVALUED OR NOT?
MARKET UPDATE
You can scroll to read the usual update as well. As the written version is the exact same as the video.
Timestamps for video:
Overview: 0:00min
Inflation & Rate Cut Impact: 1:20min
Corn: 3:10min
Beans: 7:20min
Wheat: 9:20min
Cattle: 10:15min
Want to talk about your situation?
(605)295-3100
Before your free trial ends
Don’t miss our next signal & future updates. Here is extended access to our most recent sale:
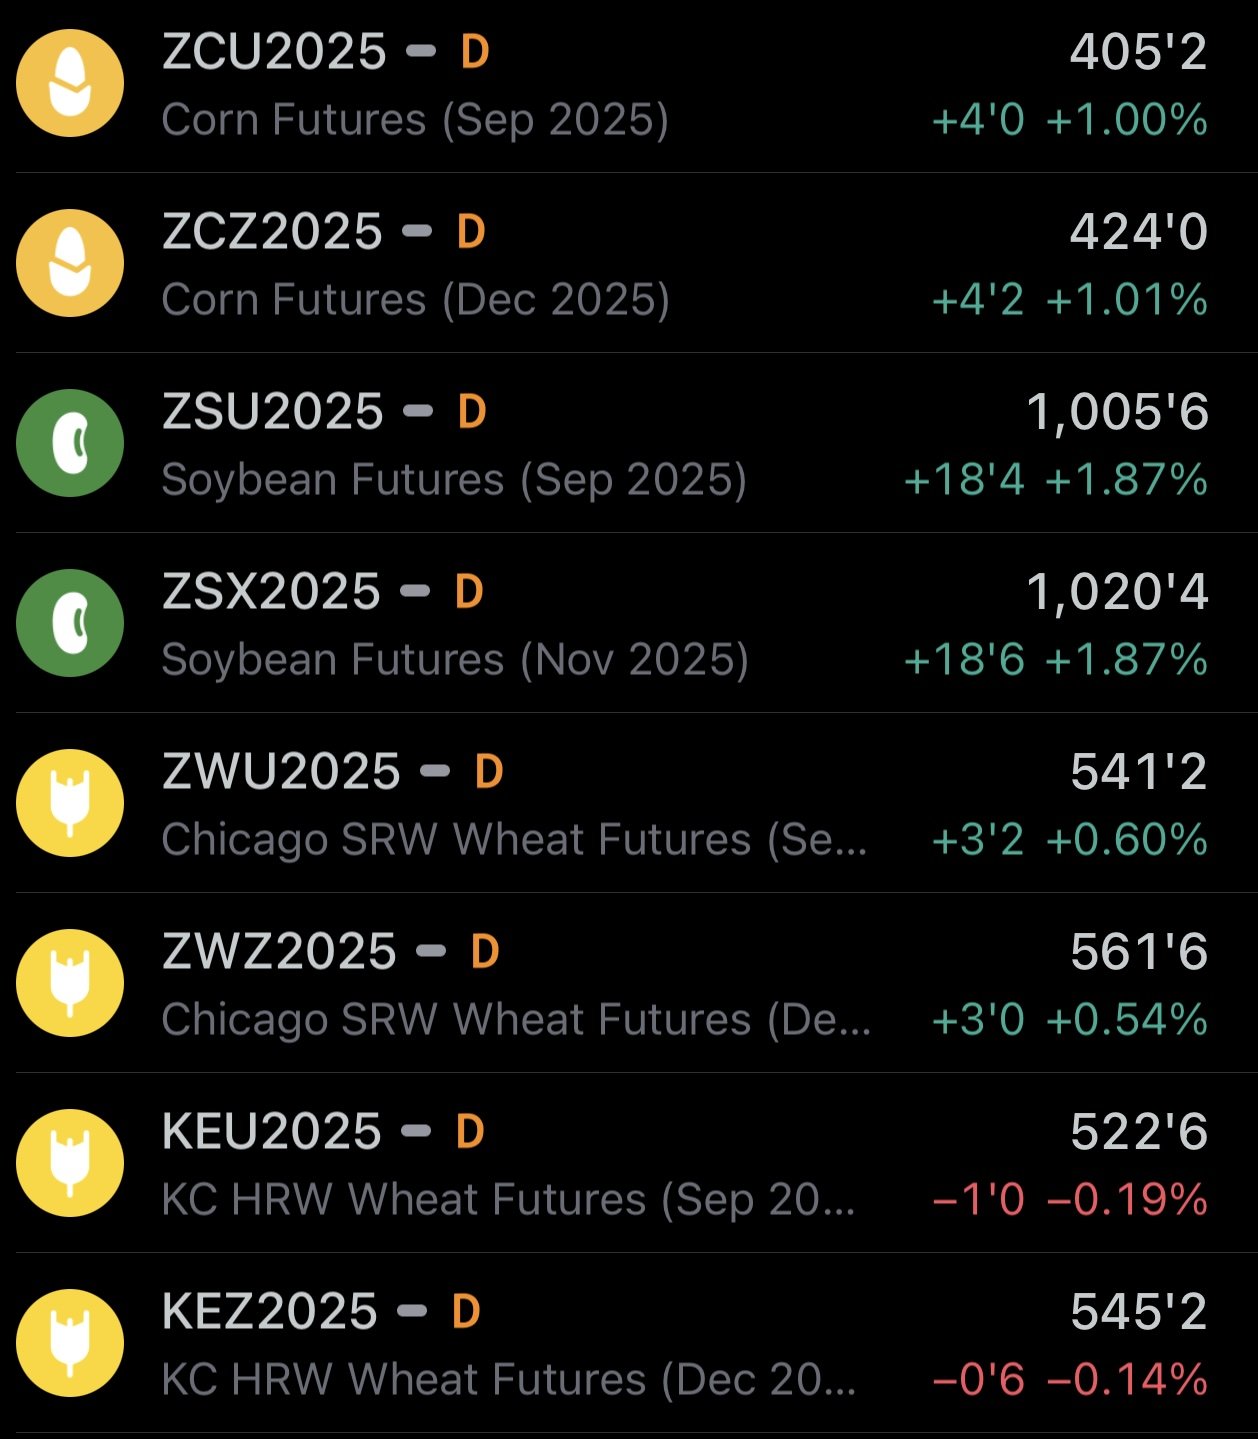
Futures Prices Close
Overview
Grains mostly higher led by a nice rally in soybeans, with some talk of upcoming heat in the forecasts and some headlines of "overtight tassel wrap" affecting some corn pollination.
The past few days we have seen some bearish headlines.. yet prices have traded higher.
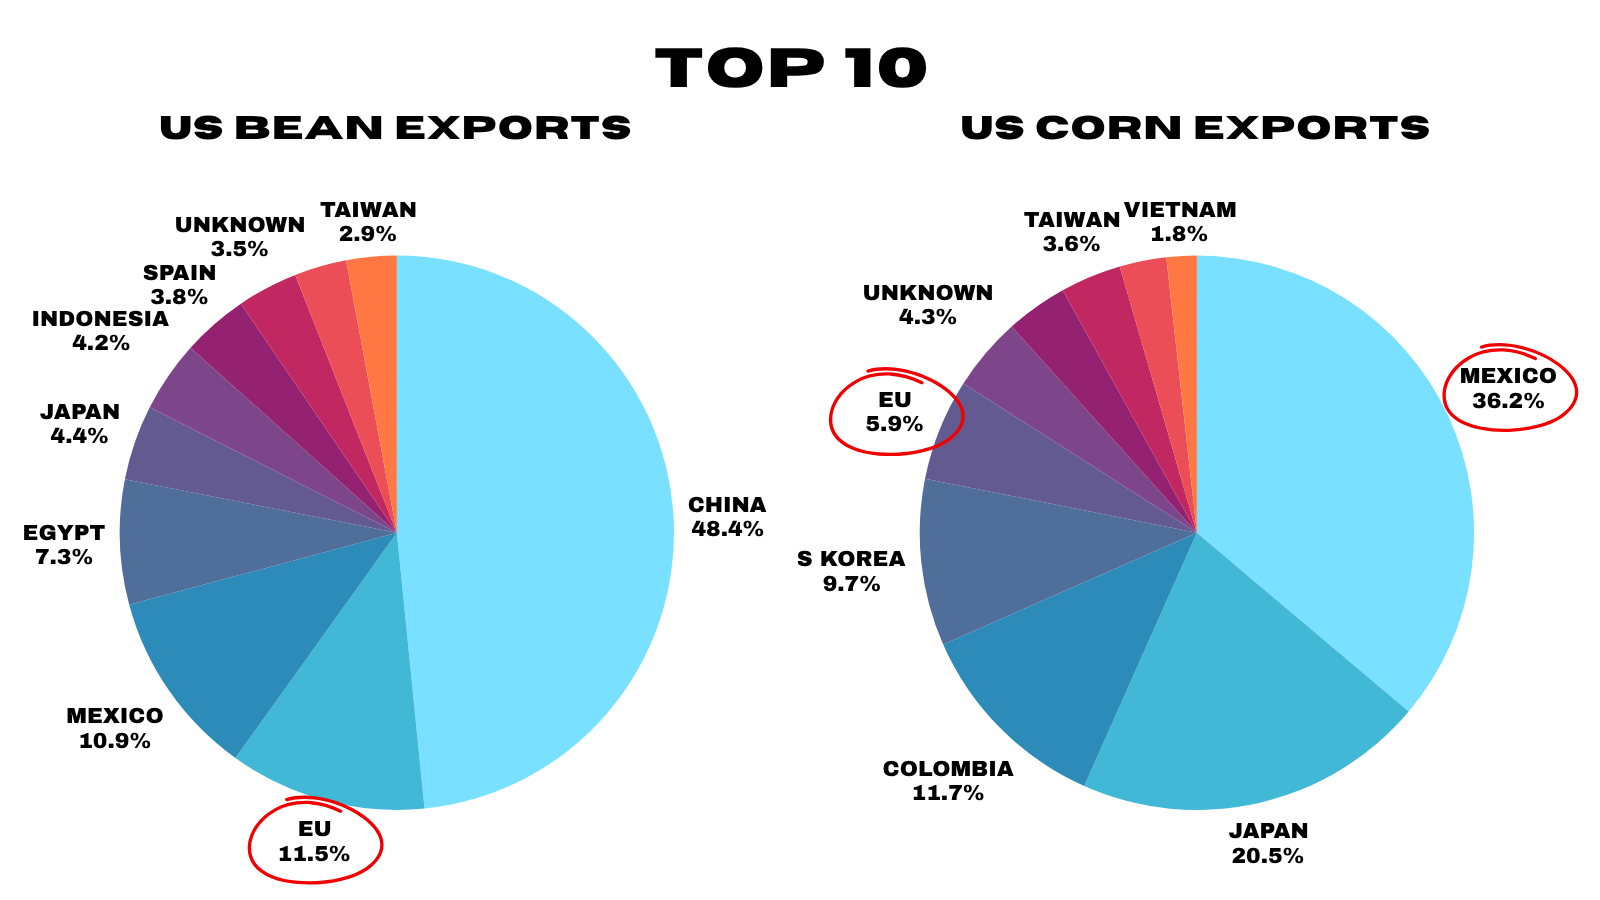
Over the weekend, it was announced that Trump would be tariffing both Mexico and the EU by 30%.
Mexico is of course our largest corn buyer.
The EU is a top 5 US corn buyer and the 2nd largest buyer of soybeans only behind China.
Monday crop conditions came in. Soybeans saw the largest weekly jump since August of 2023.
As soybean ratings are now rated the 2nd highest in 10 years at 70% G/E, up from 66% last week.

Despite these clearly bearish events... soybeans rallied today and didn’t sell off yesterday like most would have expected seeing crop ratings jump that much.
This is a very positive sign. When we get bearish news but a bullish reaction.
Sometimes it can signal "who is left to sell?".
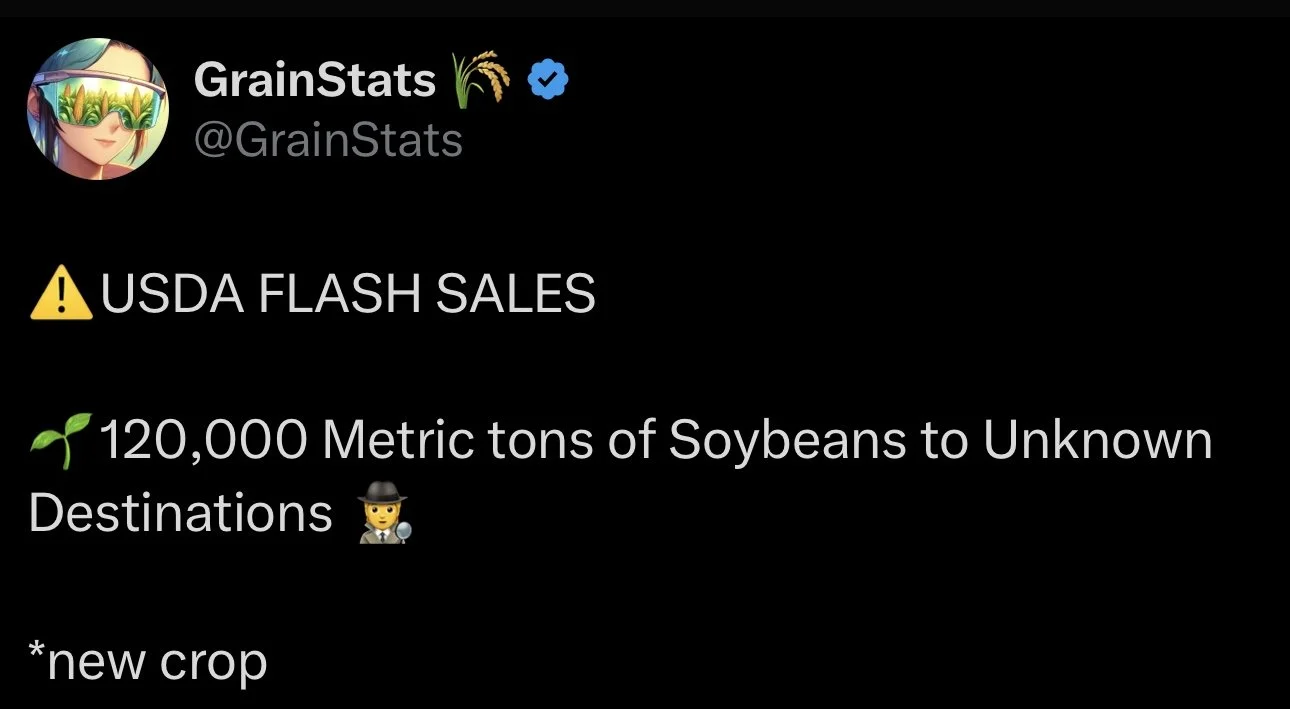
We also saw flash sales of soybeans to unknown this morning.
When unknown is buying soybeans, it is almost always China.
(If unknown is buying corn, it usually isn’t China)
Here is one of the reasons the grains "maybe" were higher today.
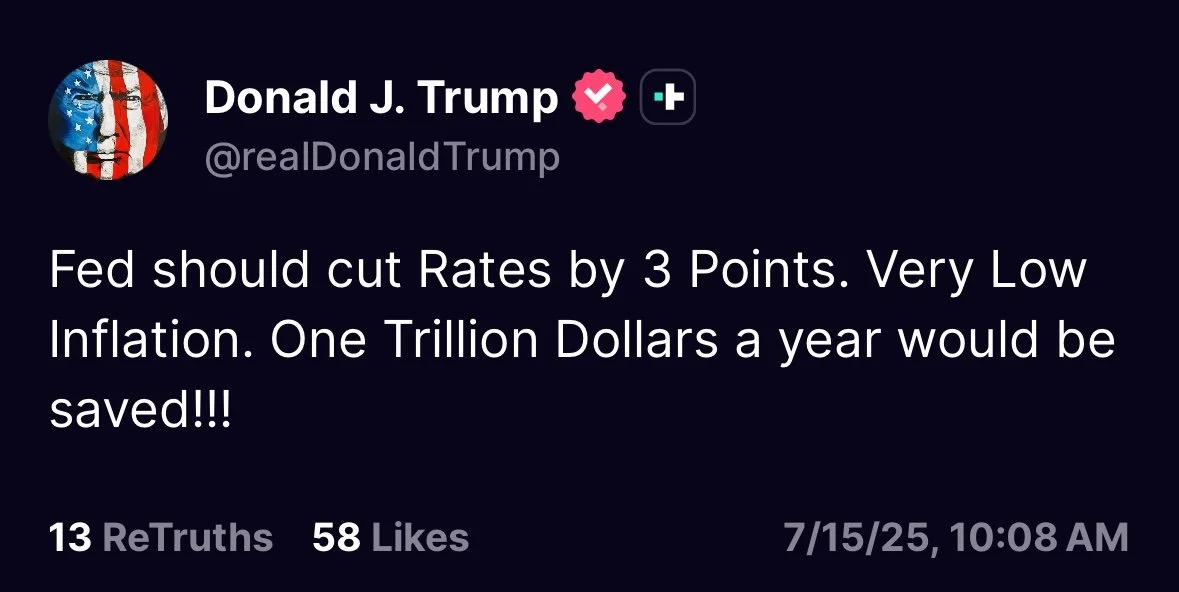
This is complete speculative guessing.. but this morning Trump announced he was planning on firing Powell.
Afterwards, commodities rallied.
Why?
Because this signals for potential rate cuts.
Lower rates are usually friendly for commodities.
Lower rates stimulate the economy, weaken the US dollar, and make commodities cheaper globally. This can fuel inflation, which drives commodity prices.
On the other hand, raising rates slows the economy, which helps reduce inflation.
Basically:
Lower Inflation (rate hikes): usually tied to cheaper commodties and slower demand.
Higher Inflation (rate cuts): usually tied to expensive commodities and stronger demand.
Trump said he wants the Feds to cut rates by 300 basis points.. the largest rate cut we have ever seen was 100 basis points in 2020.
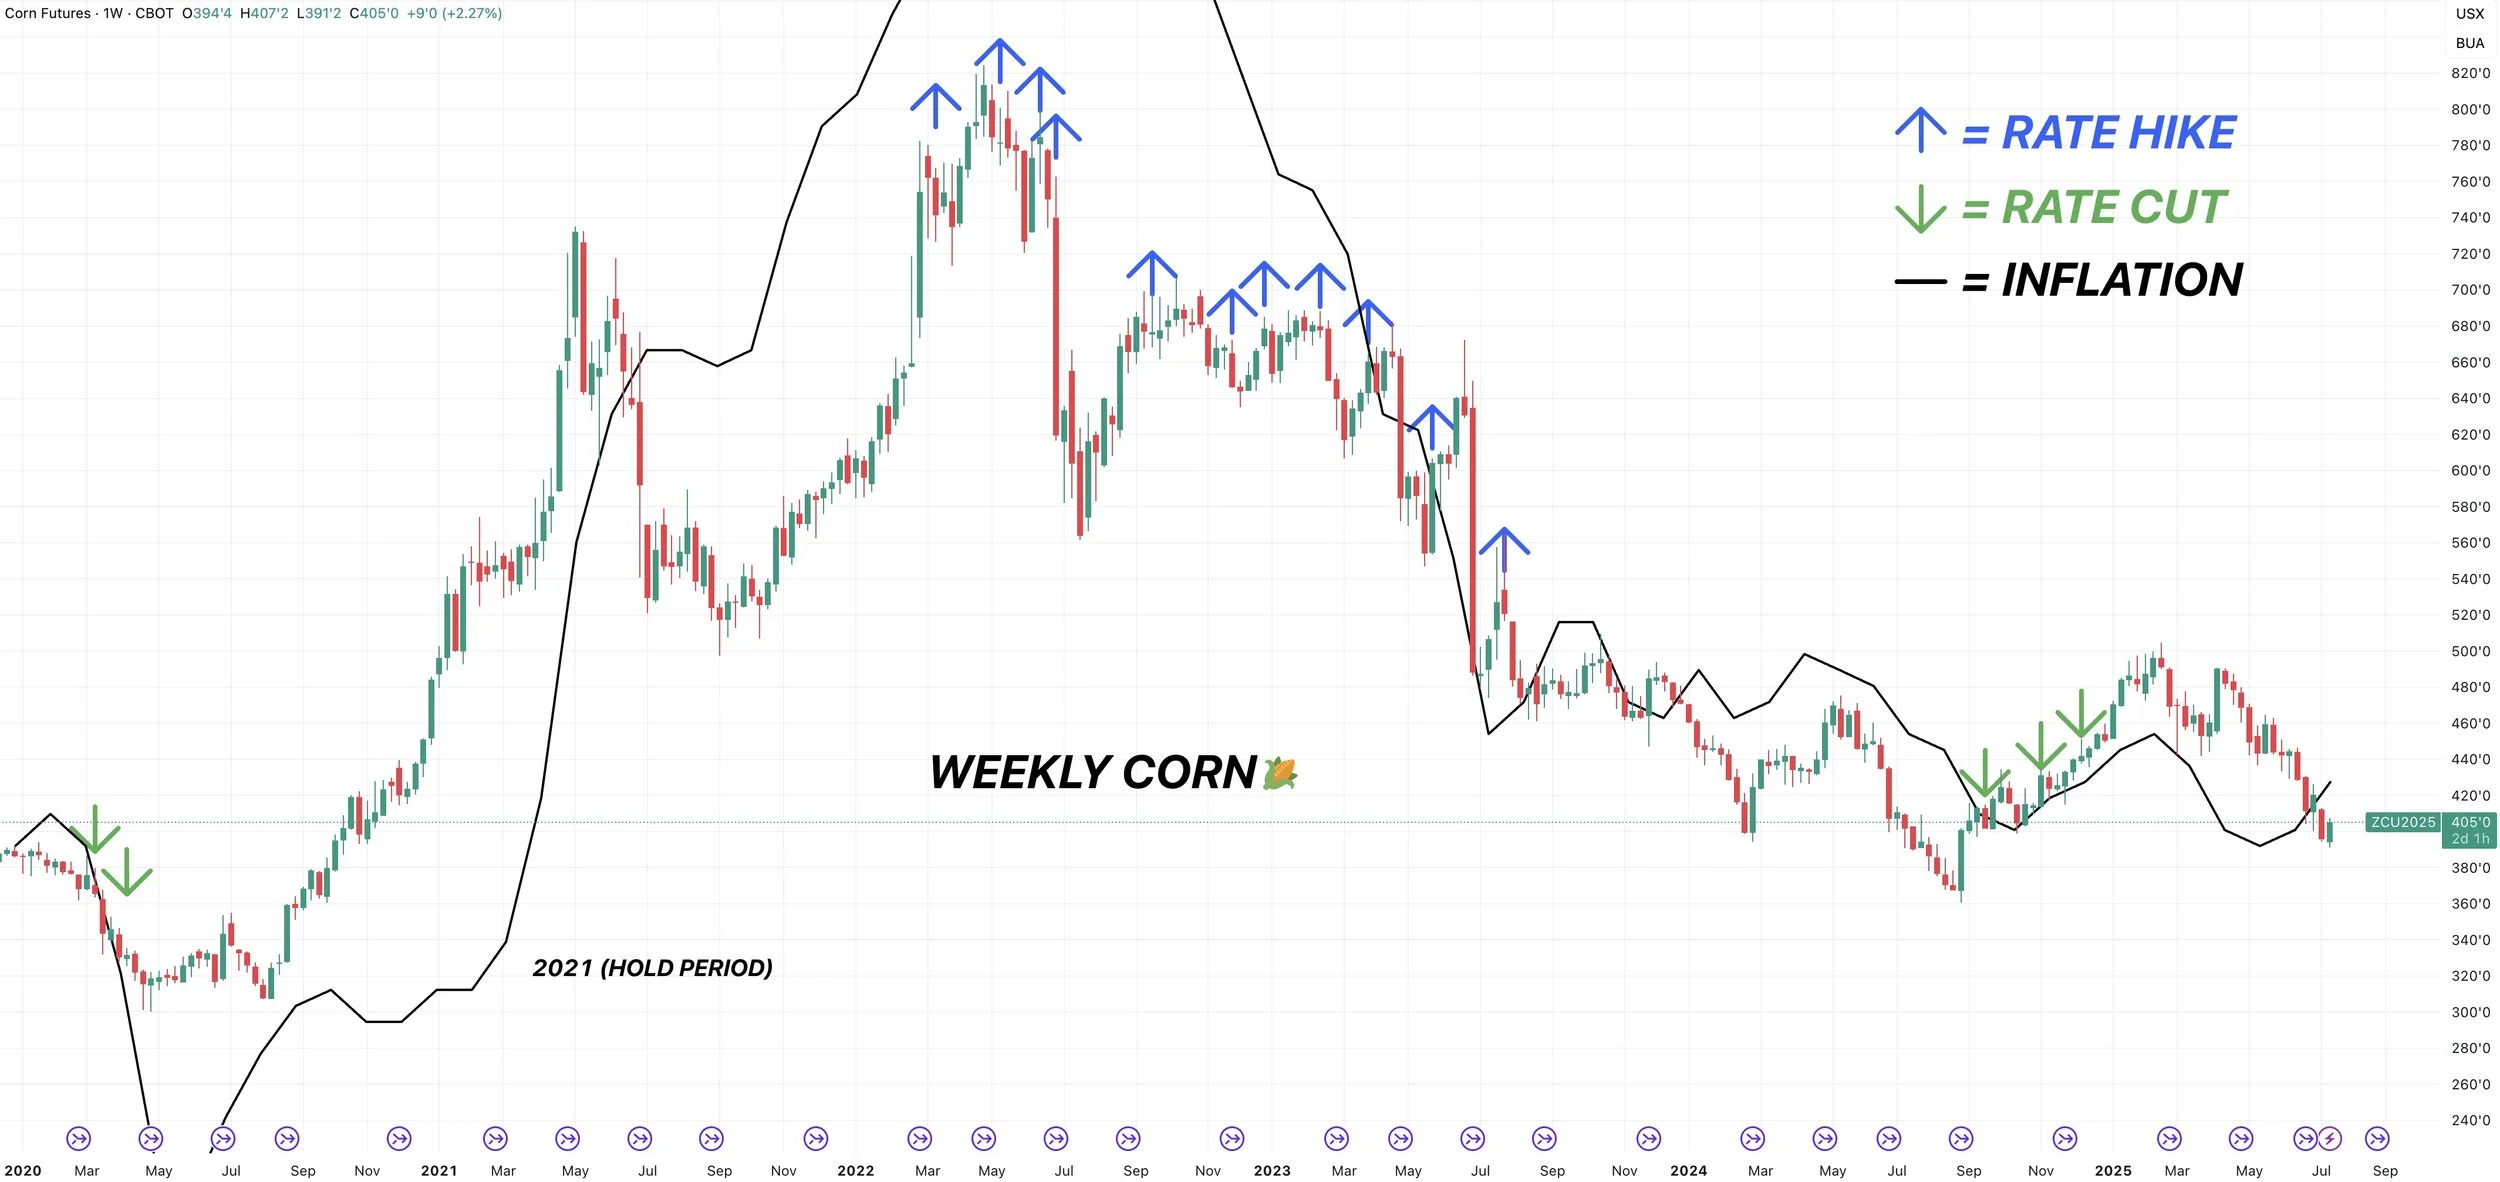
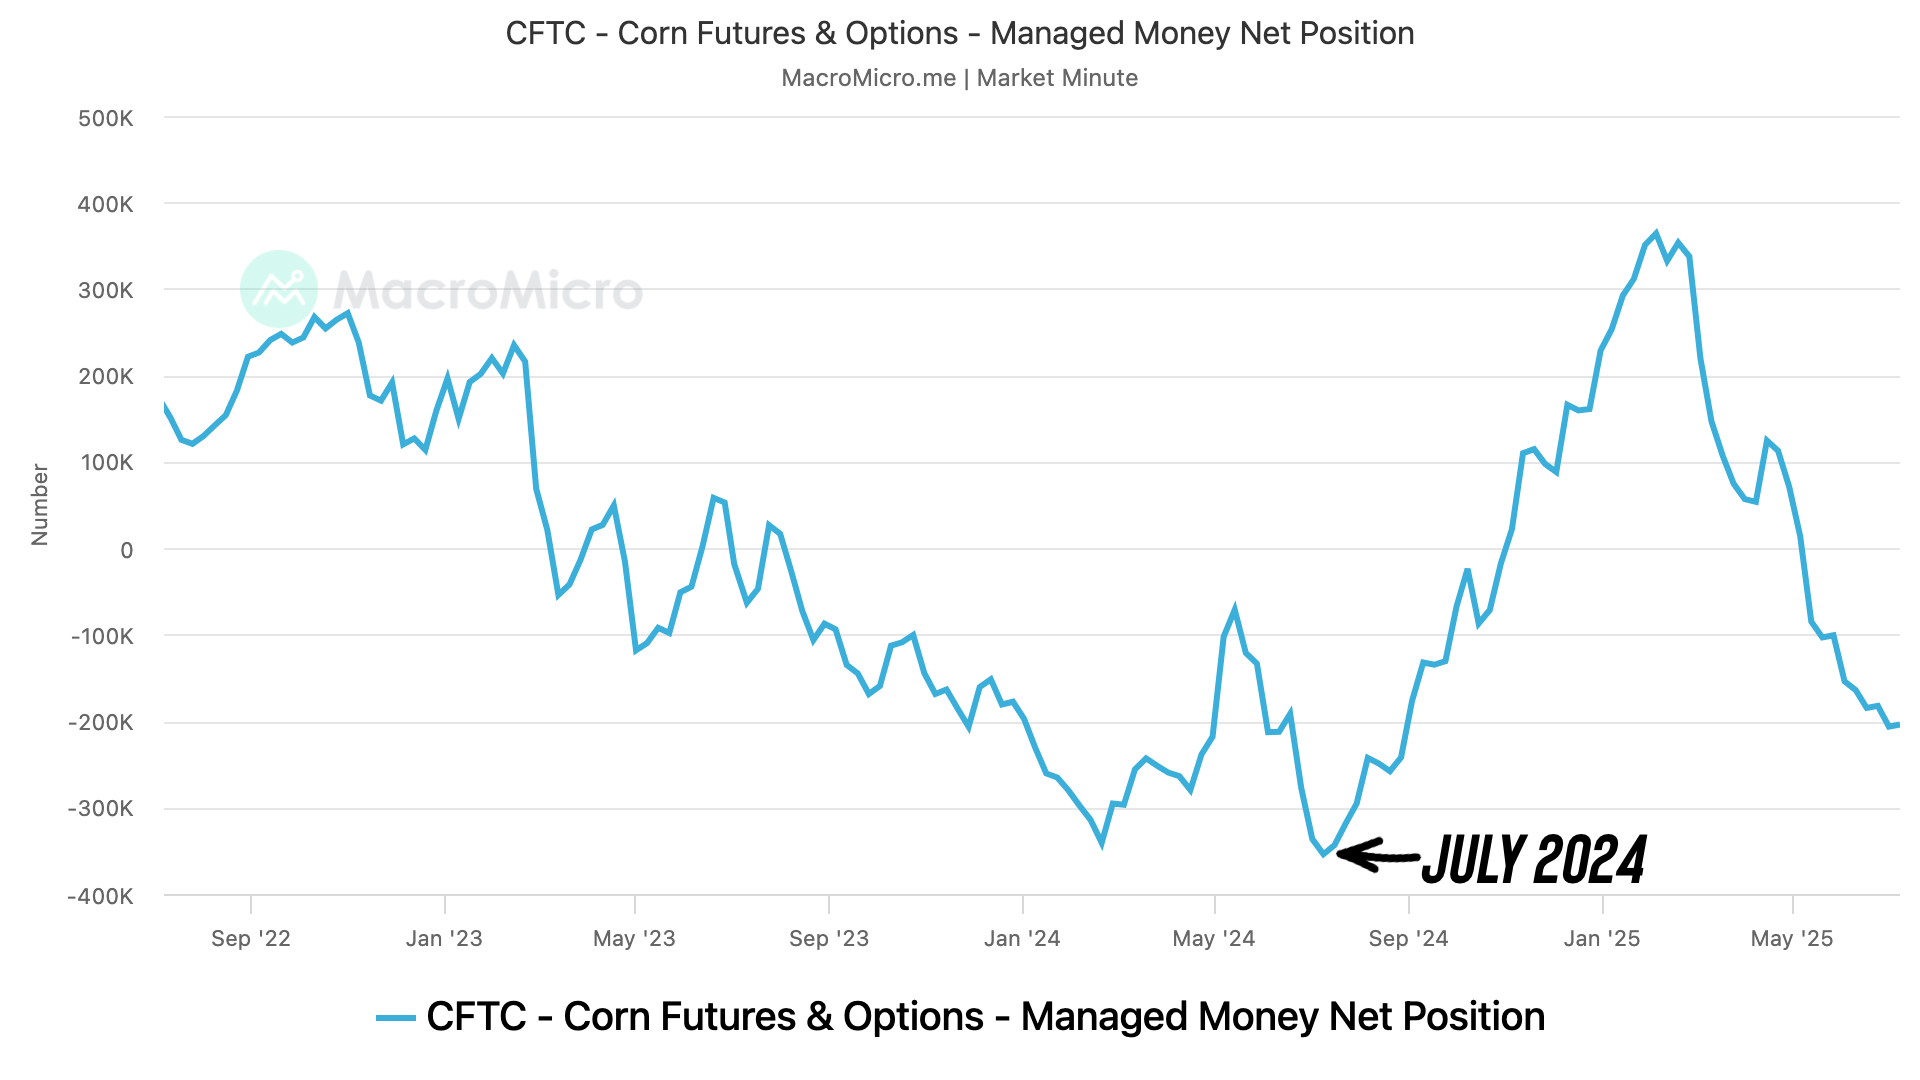
I've touched on this several times the past few weeks. But this chart provides even more evidence to this arguement.
The funds are driving this market.
Maybe it isn’t about the balance sheet. Maybe it's simply about interest rates.
This chart shows the last time the feds raised and cut rates.
Rate hikes in 2022 marked the top of the bull market and start of the bear market.
Our first rate cuts since 2020 marked our harvest lows last year and led to our most sizeable rally since this bear market started (on a continuous chart of corn).
I even overlayed inflation rates with the black line.
Higher inflation usually leads to higher grains. Lower inflation usually leads to lower grains.
So perhaps the funds don’t truly get behind this market until we see more evidence that we are going to get rate cuts. Because rate cuts lead to more inflation long term.
It won’t happen right away, but I think once inflation goes higher, grains could very well follow suite long term.
Todays Main Takeaways
Corn
Fundamentals:
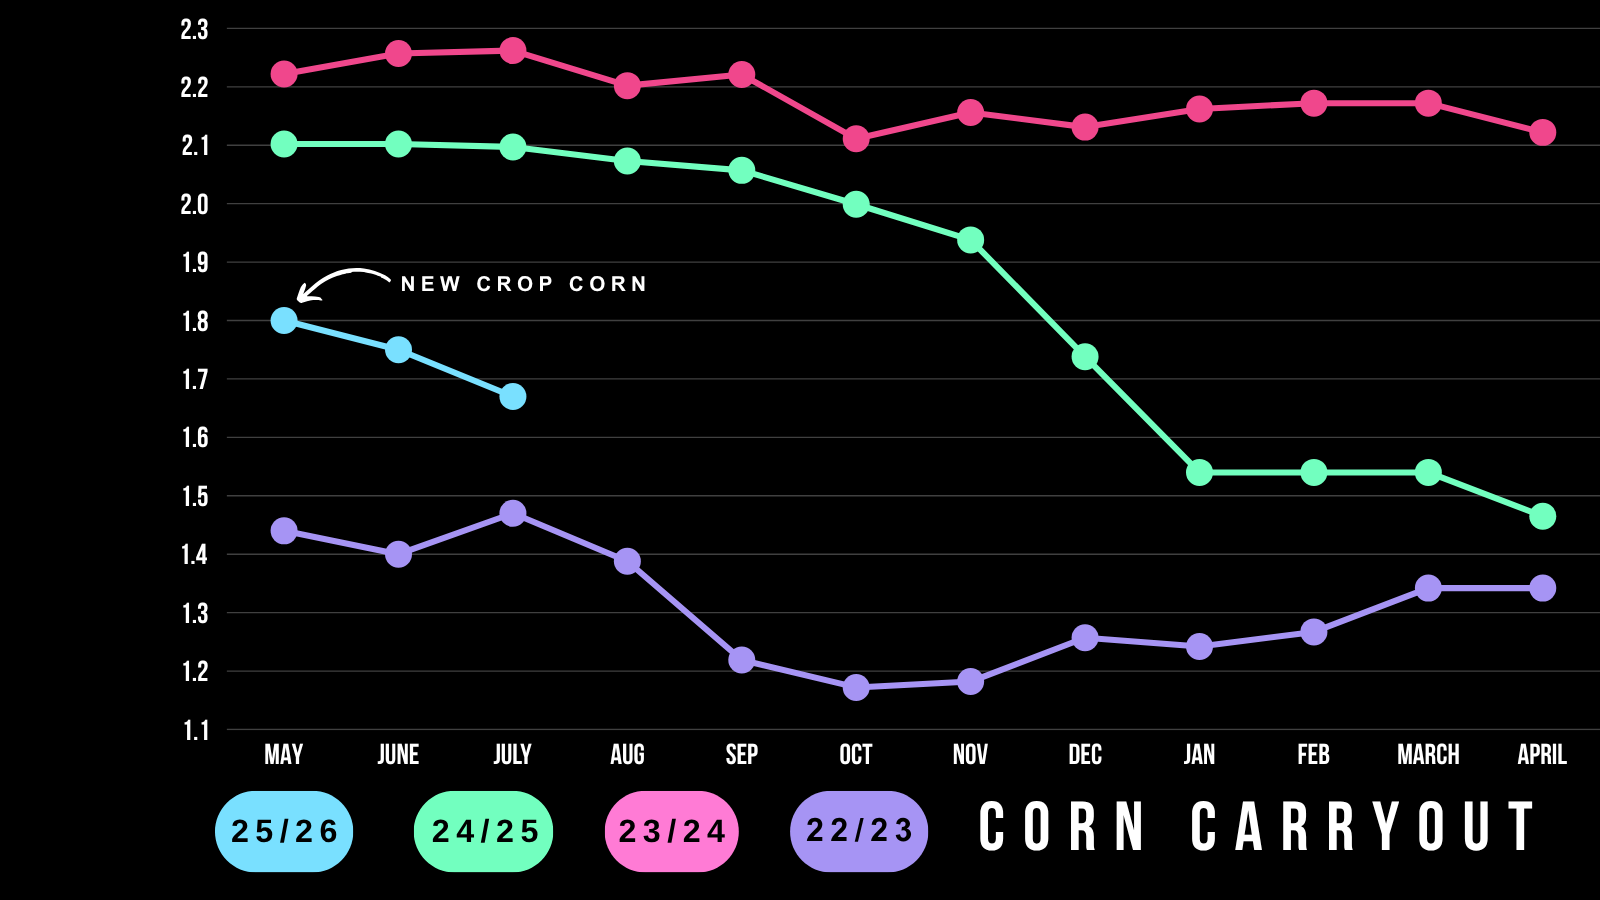
At this point in the year, new crop corn has the tightest carryout since 2022.
Let's compare Dec-24 vs Dec-25 corn.
Dec-24 corn was about the same price as Dec-25 corn is today.
The difference between the two?
Dec-24 corn had a projected carryout of 2 billion bushels at the time.
The current projections for Dec-25 corn are 1.67 billion bushels.
A -16% decrease (330 million bushels). Yet prices are the same.
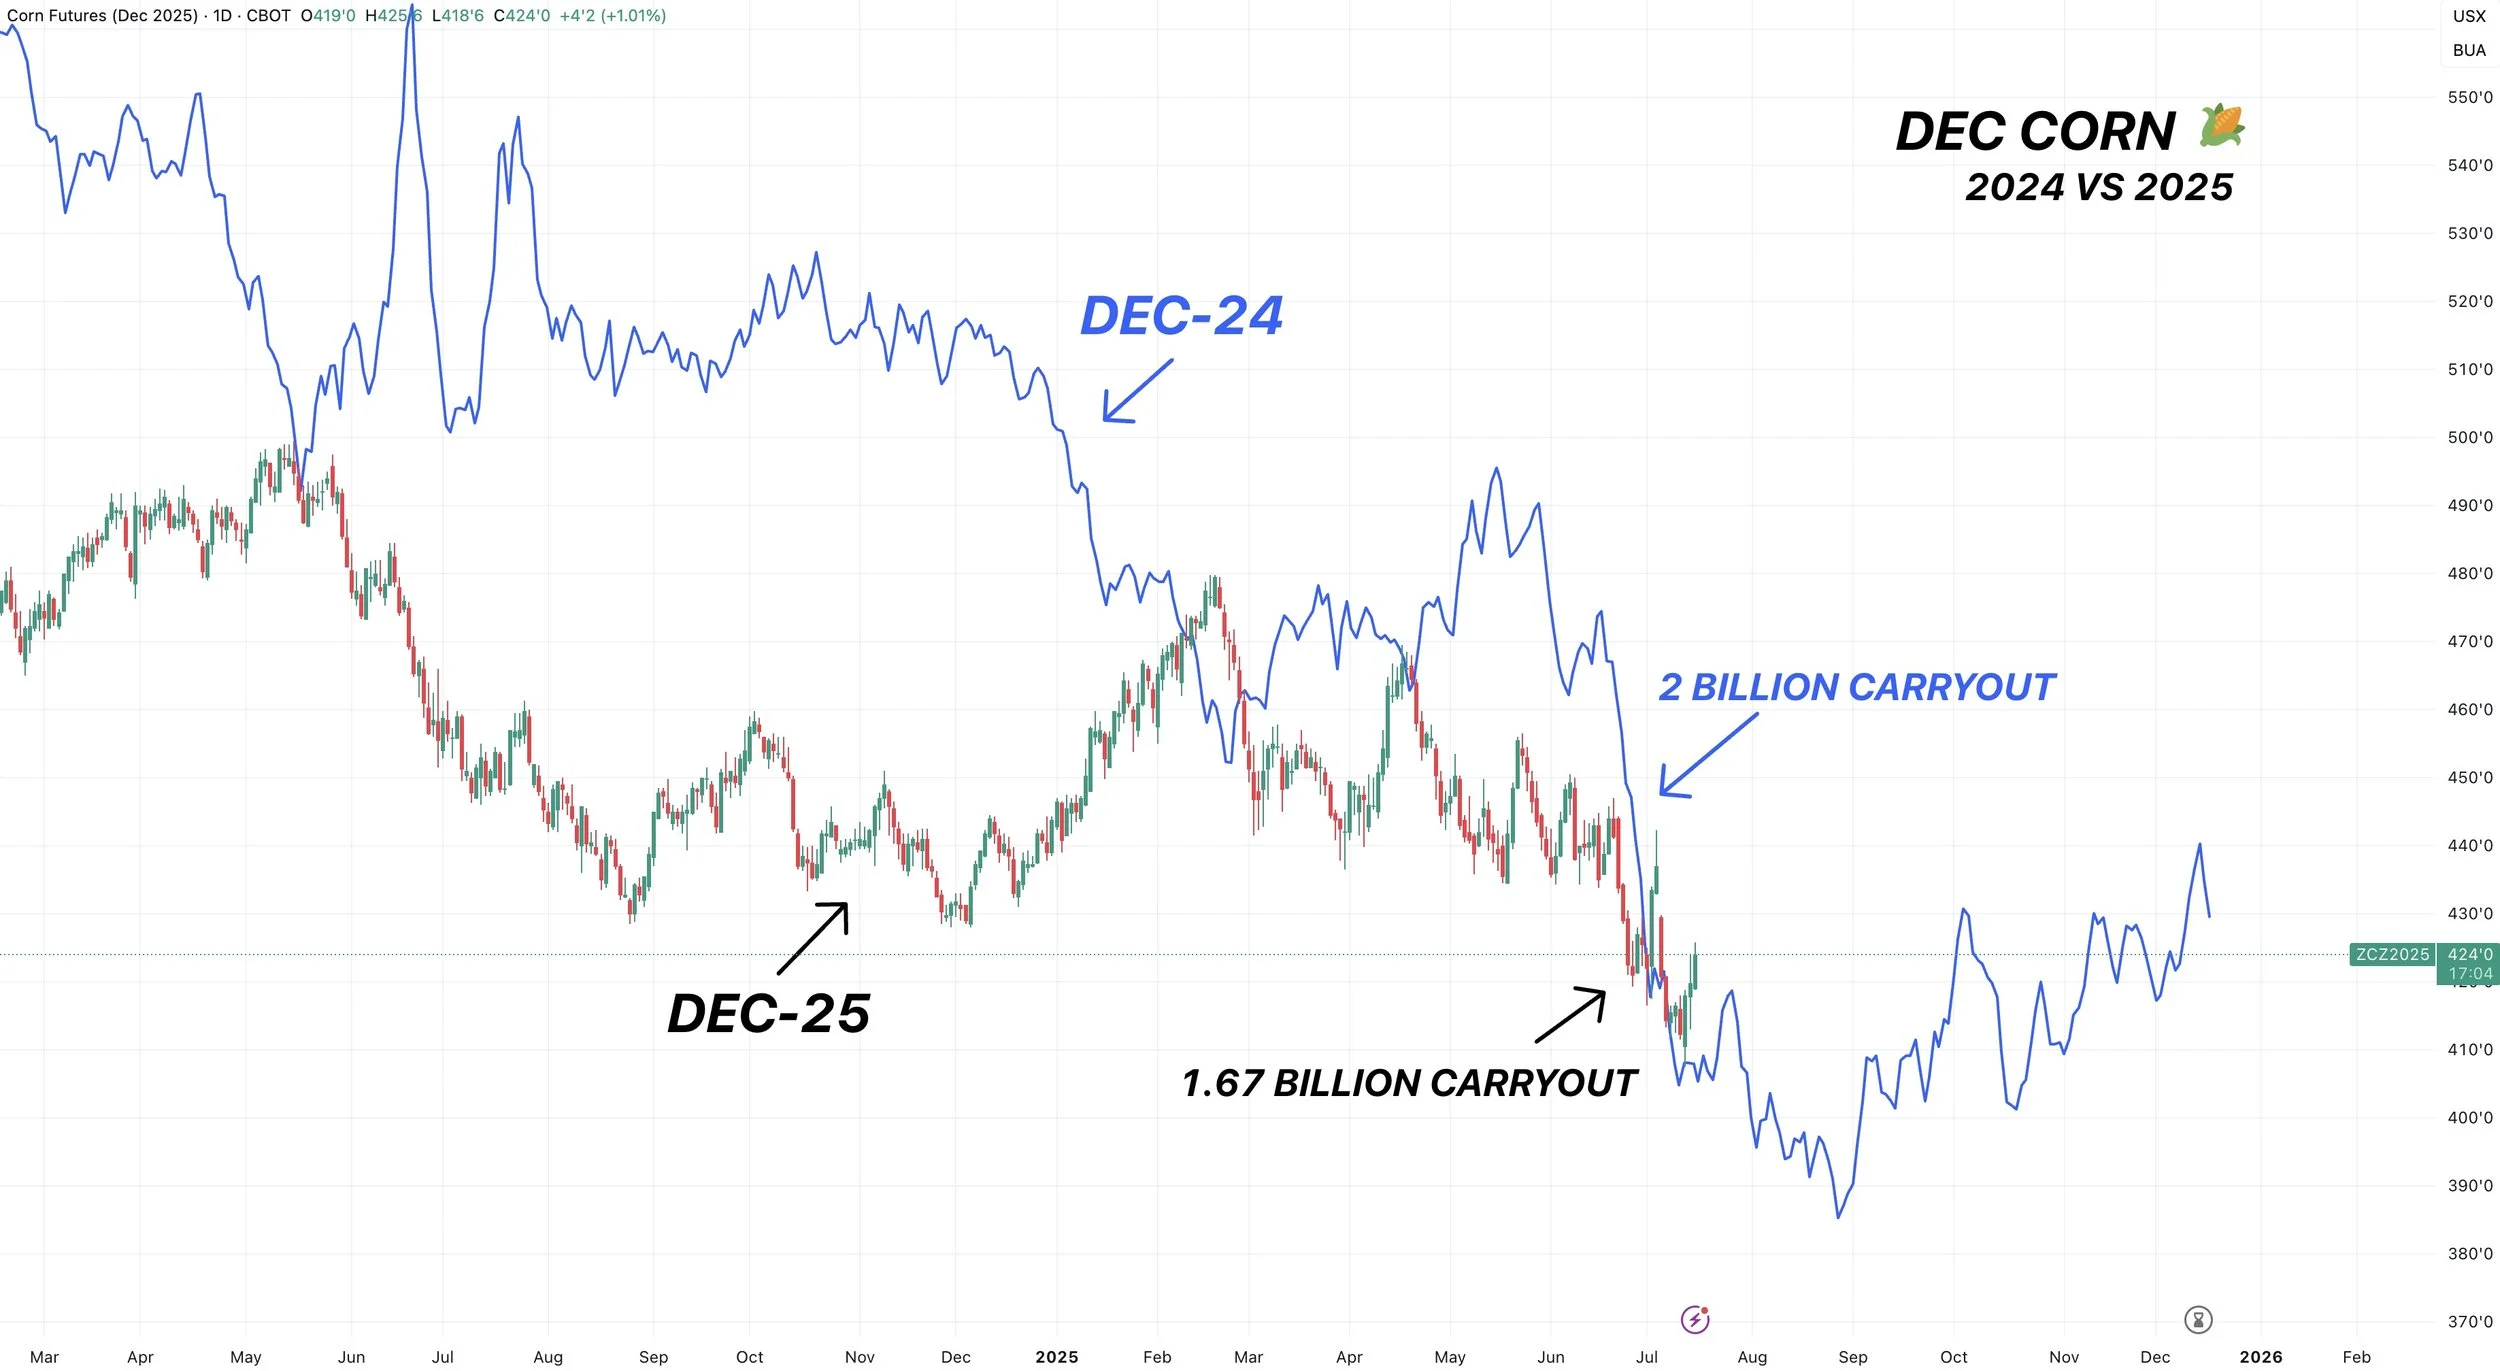
It is probably fair to say that the trade is currently pricing in somewhere around a 2 billion bushel carryout despite what the balance sheets say.
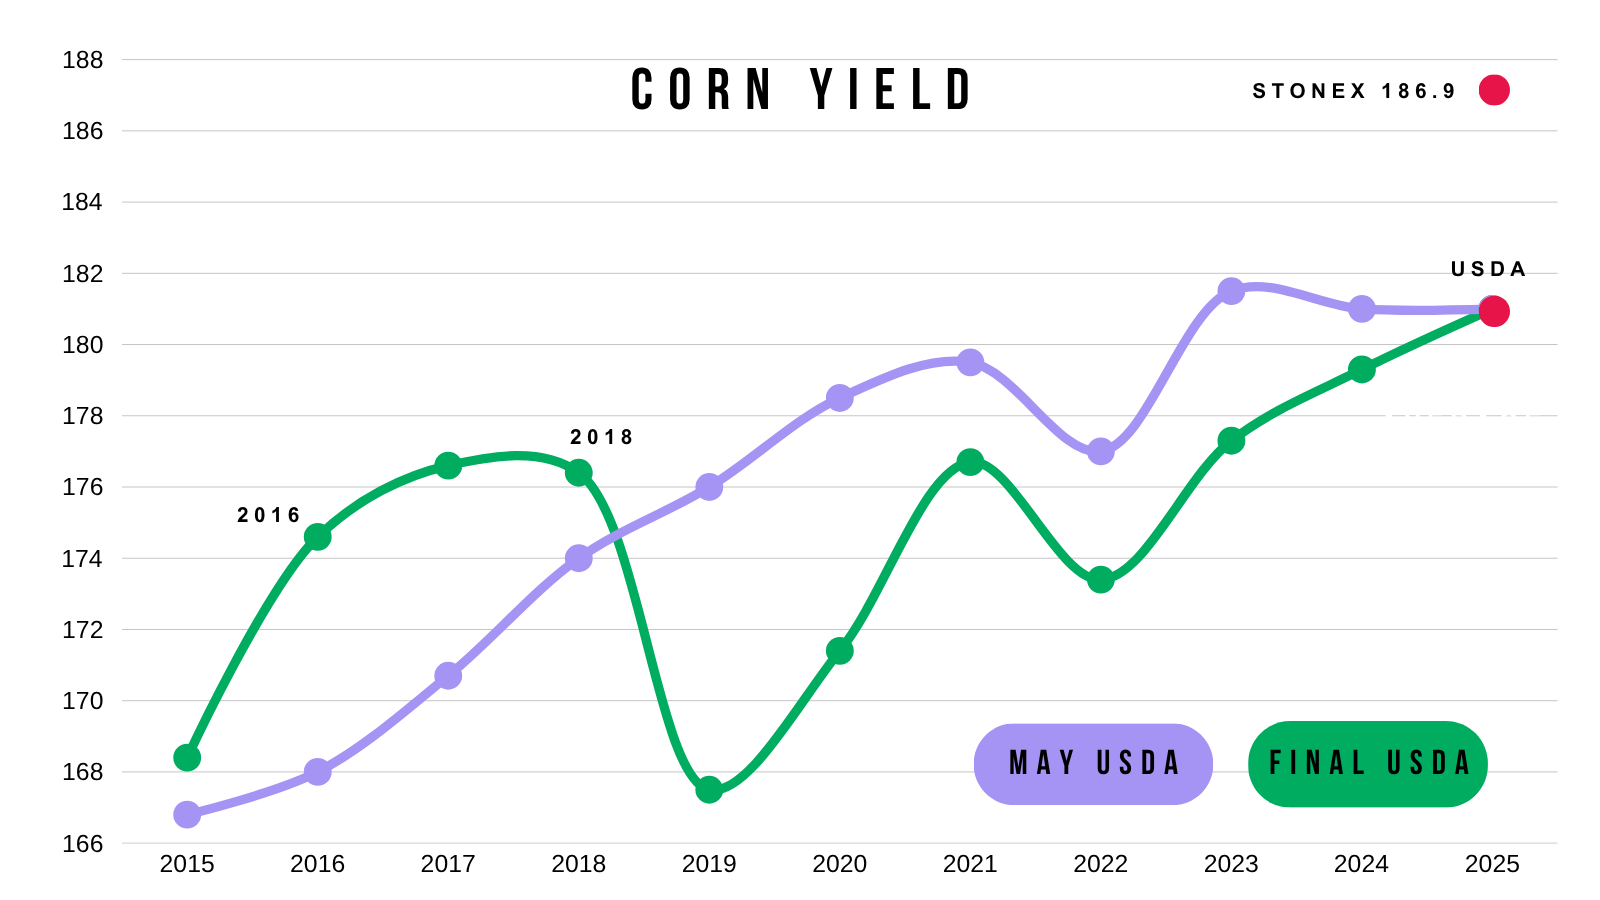
How do we see a 2 billion bushel carryout?
Let's look at this simple chart of how yield affects carryout with zero changes made to demand.
To get a carryout of 2 billion, we would need to see a yield of 185 bpa.
But.. that is also without any changes to demand. If yield did come in that high demand would naturally increase which would offset some of the carryout increase from supply.
So realistically yield would have to be bigger than 185 to get carryout above 2 billion bushels. Possible but seems pretty optimistic.
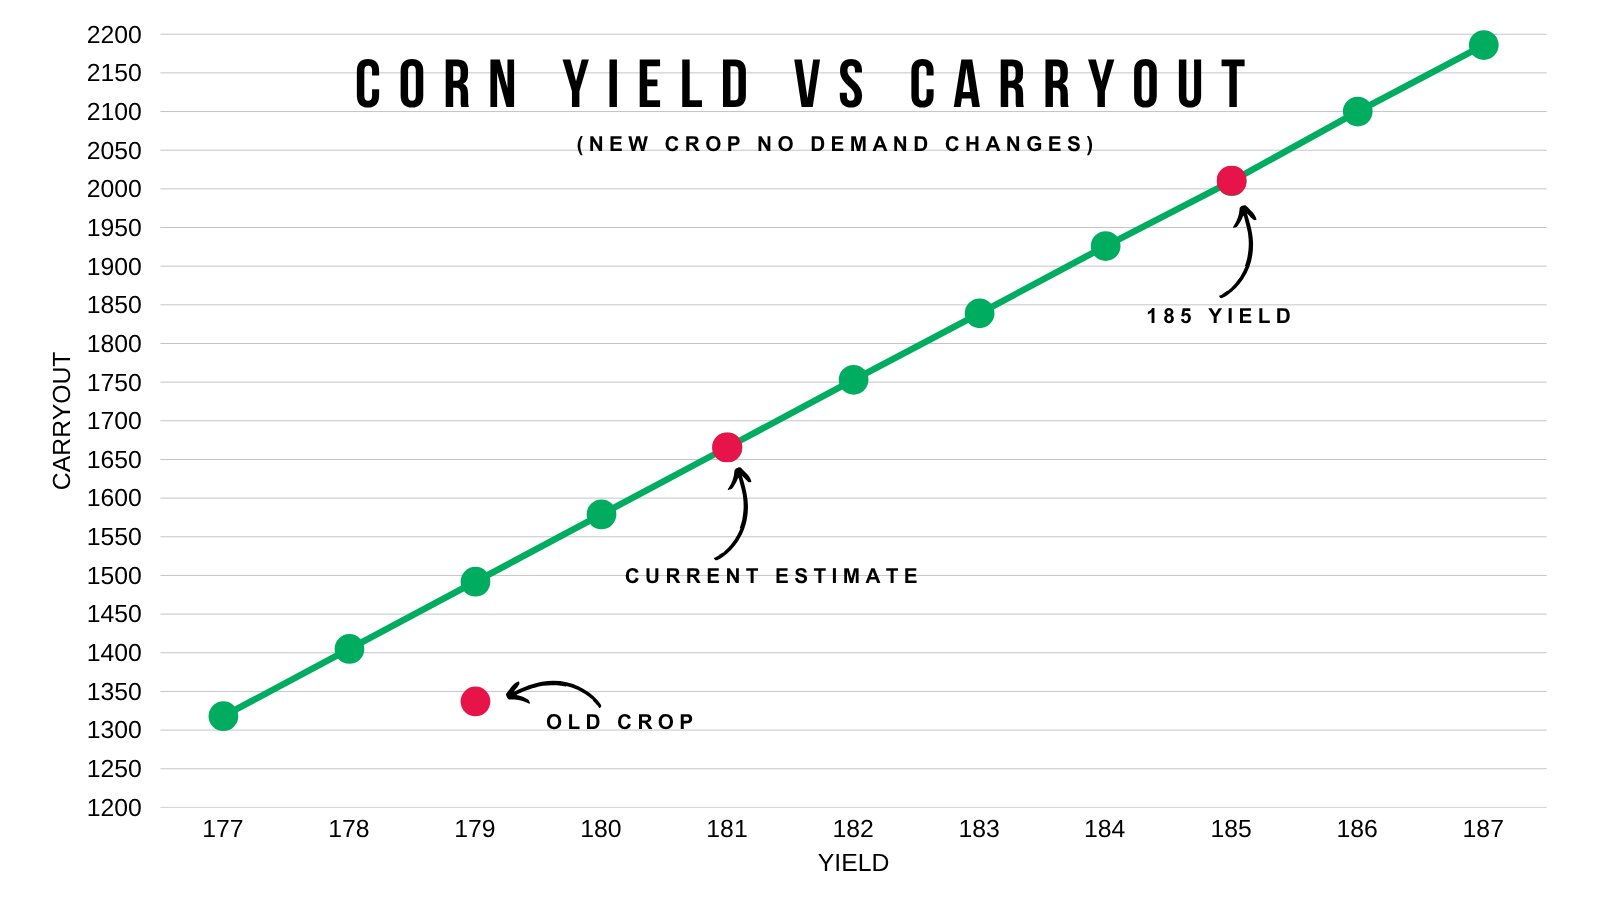
Based on this, we could assume the trade is currently pricing in a yield of over 185 bpa.
But what happens if yield is trendline at 181..? Or even below trendline..?
If either of those scenarios happened, it is safe to say corn is undervalued here.
The only scenario where corn is not undervalued is if yield truly is +185 bpa.
Bears would argue we currently have the 2nd best crop conditions in recent memory.
1st is 2016 then 3rd is 2018.

Both of these years did in fact result in above trendline yield.
With 2018 being the last time we've hit trendline.
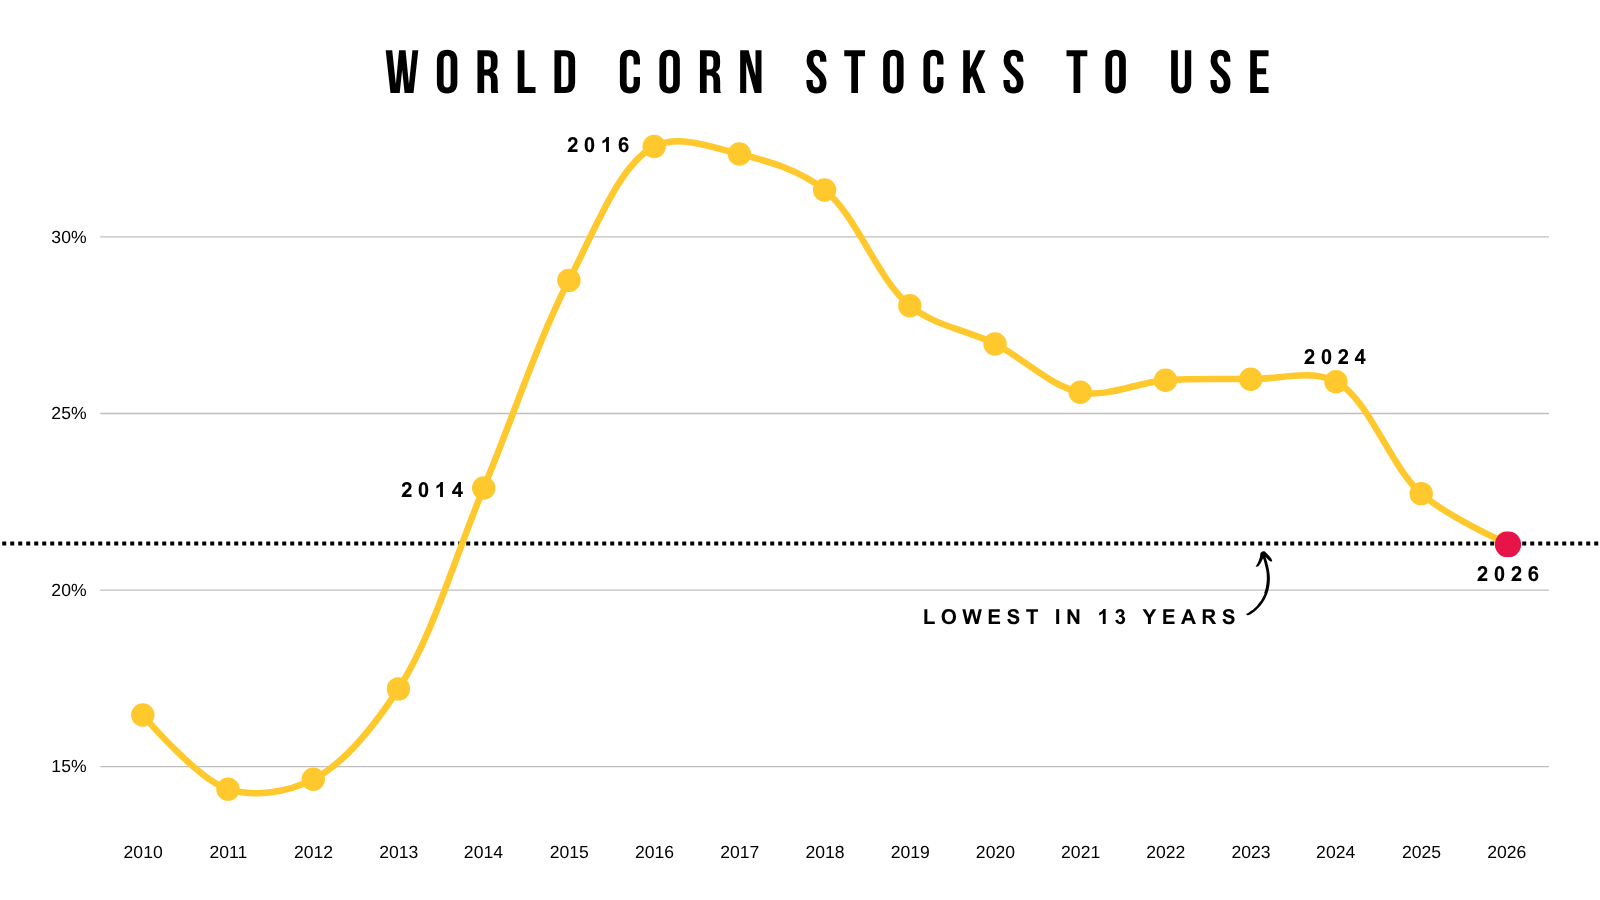
The World Situation
The US has a record crop.
Brazil has a record crop.
Yet.. our world corn situation is the tightest in 13 years.
Despite Brazil having a big crop, they are also domestically using more corn than ever.
Where is the rest of the world going to go for corn?
It doesn’t seem like demand isn’t going away for corn.
The Funds
Last week the funds actually bought corn.
If you look back at last year, it was this same exact week that the funds stopped shorting the corn market.
Technicals:
Dec corn bounced right at that golden fib extension. Meaning that green box equals 50-61.8% of the size of the sell off since April (Sell off since April marked with dotted line).
As we have been mentioning, this is a common spot for a market to stop bleeding.
However, even with the recent mini rally we still remain in a clear downtrend. You can’t get too excited until we break that downtrend. As we've rejected it 5 straight times in a row.
If you are looking for a spot to de-risk, $4.38 would give back 50% of the April highs. $4.45 would give back 61.8% of the April highs.

Looking a little bigger picture, Dec corn is in a massive downward channel.
We hit the bottom of the channel on Monday and bounced.
The top of the channel comes in around $4.60 or so.
The channel marked our May 2024 highs and Feb highs from earlier this year.

Soybeans
Fundamentals:
Like corn, let's go over Nov-24 vs Nov-25 soybeans.
Currently soybeans are cheaper than they were last year.
At this time last year, new crop carryout was 435 million.
Currently it is 310 million.
So despite carryout being down -29%(135 million bushels) prices are actually cheaper.
Our floor last year with a carryout significantly larger was $9.60.
So unless yield is well above trend I don’t see the arguement for soybeans to go below that $9.60 floor from last year.
What happens if yield isn’t massive?
What happens if we spark a deal with China?
Purely based on fundamentals here in the US, it looks like soybeans could very well be undervalued with plenty of unknowns still at play.

There is still a ton of growing season left in this bean market.
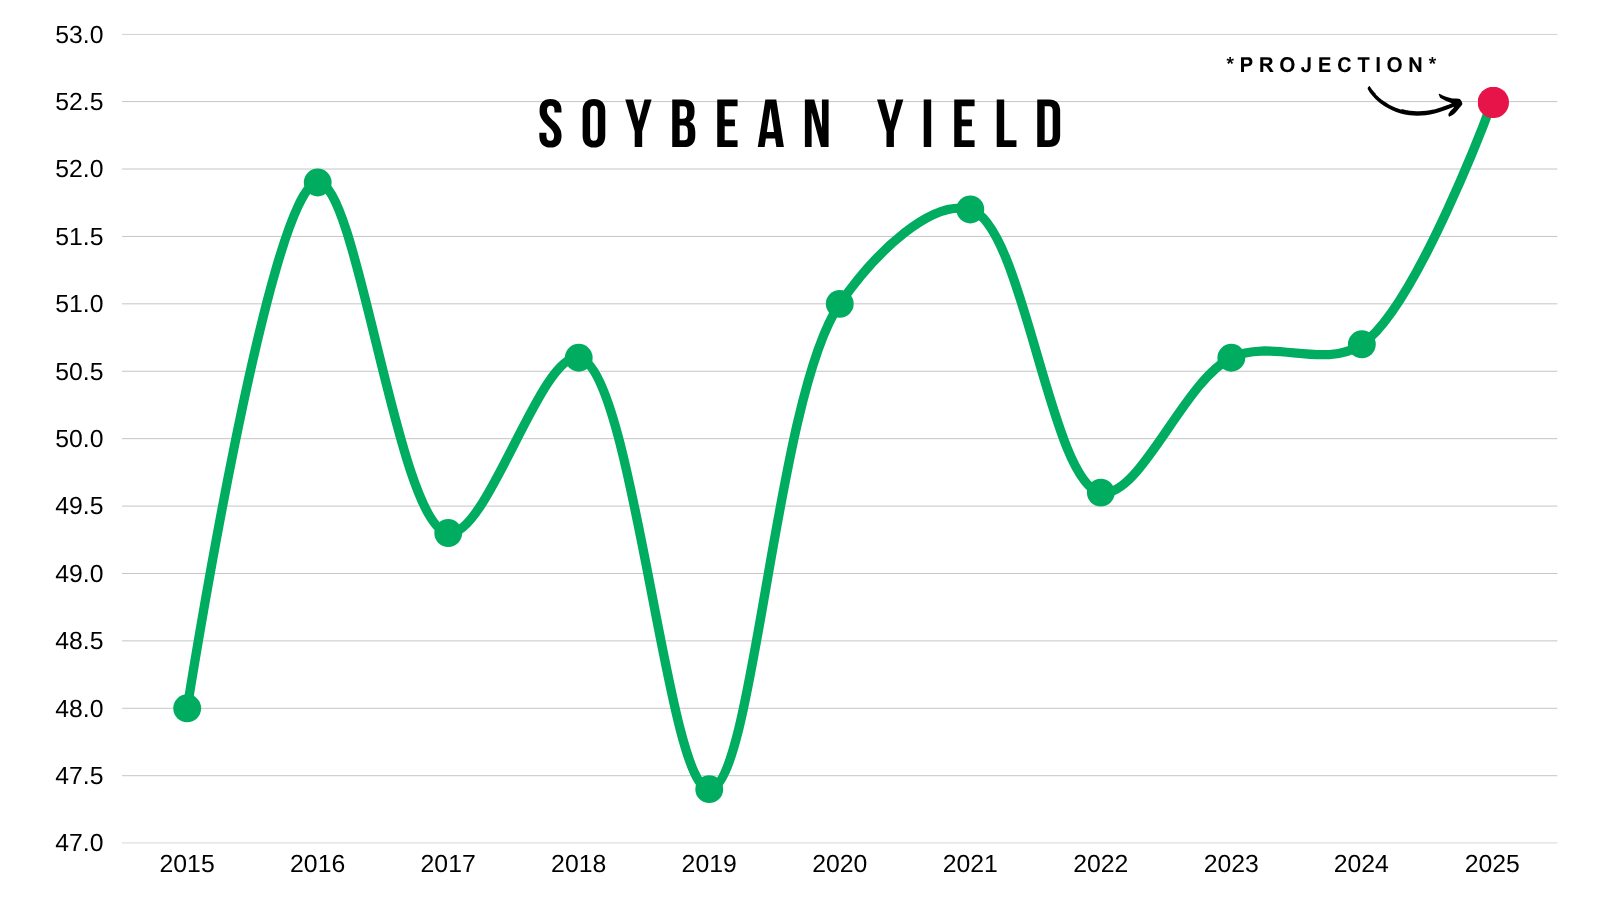
Even if we raise a 52.5 bpa yield, our carryout would still be the lowest in 3 years.
Yet prices are also the lowest they've been in 3 years.
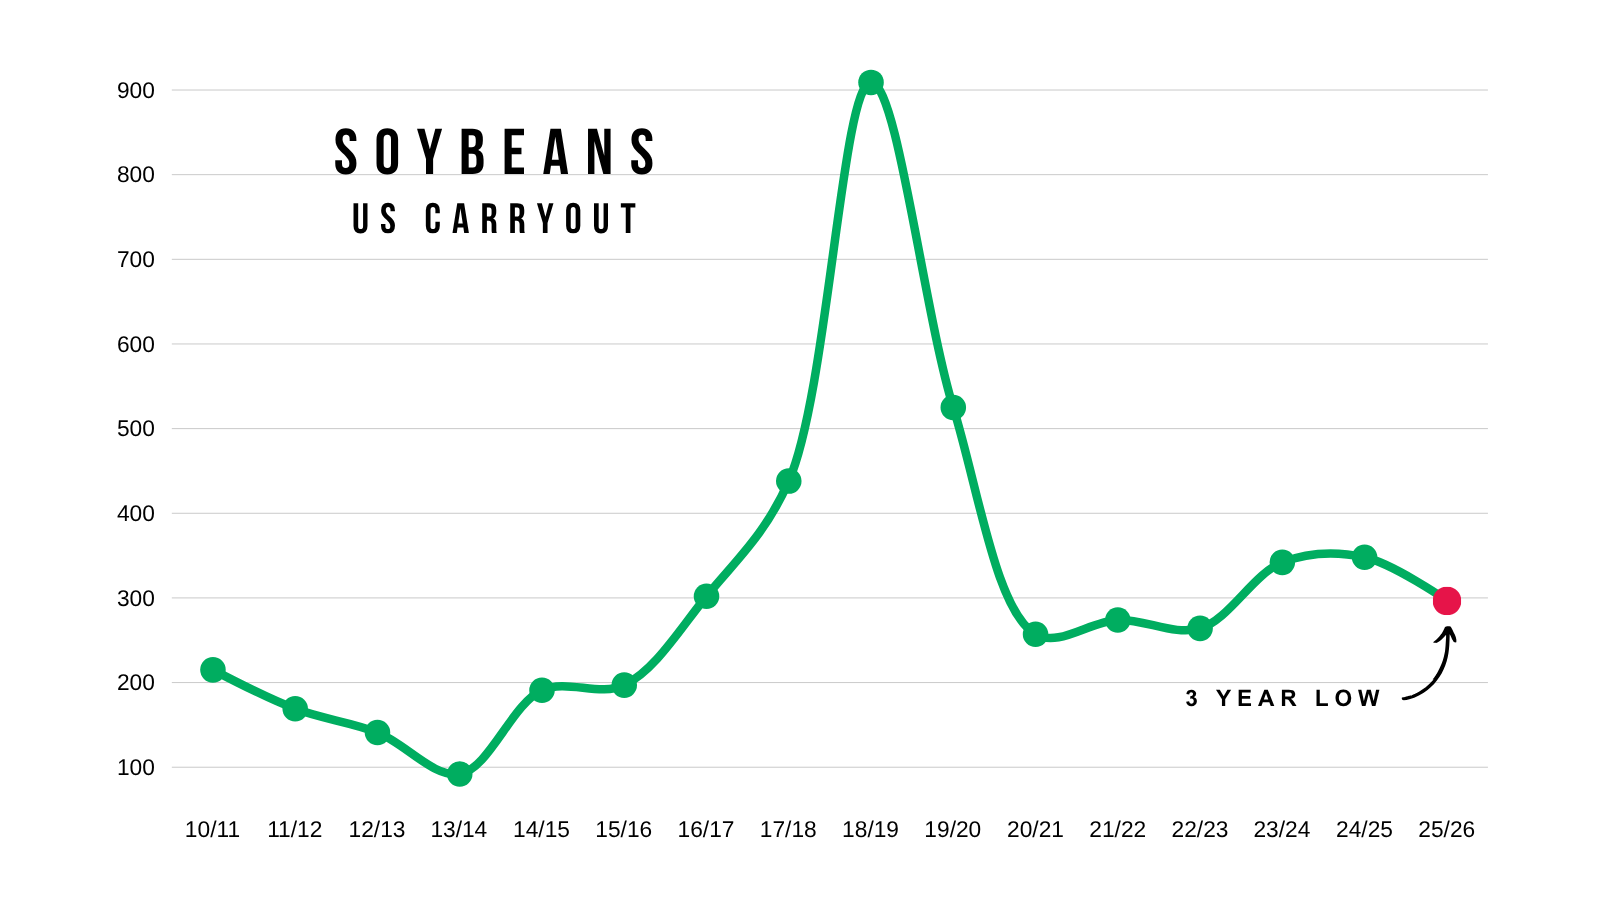
That is if we raise trendline.
We have never hit 52 bpa.
Feels like we are undervalued unless we see a monster yield.
Technicals:
Great action in Nov beans today.
We bounced right where we needed to hold.
That dotted line was support on a few other occasions and our last support until $9.93
That is still the big spot we want to hold now. As our next support if $10.00 gives out is $9.93 (which gives back 78.6% of the entire rally since April). Then the April lows of $9.71
$10.36 to $10.45 is going to be our next decision point in this market if we crawl up there. That gives back 50-61.8% of this sell off.
A break or rejection there will tell us if this is simply a correctional bounce or something more.

Wheat
Fundamentals:
Really nothing to add on wheat today.
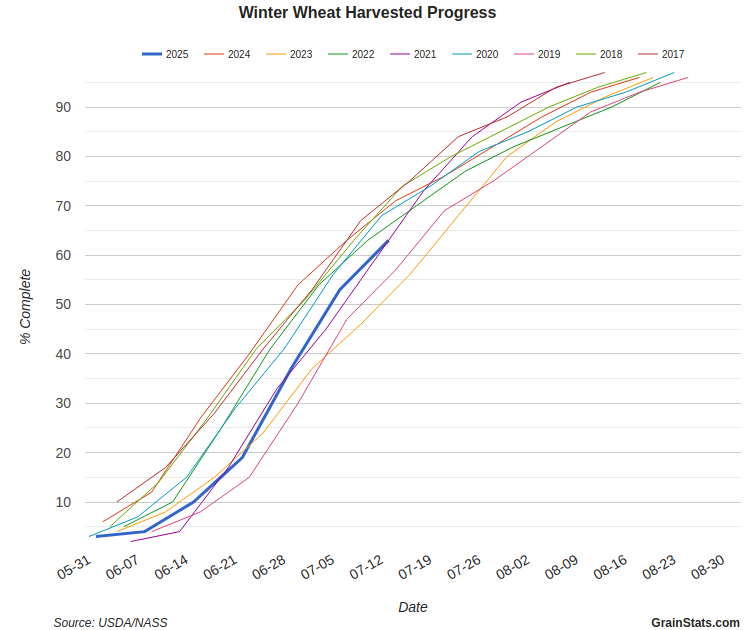
Winter wheat is now +65% harvested.
That is typically when you will start to see less and less harvest pressure.
So I think it's finally time for the wheat market to hopefully find some footing here moving forward.
Outside of that really nothing new fundamentally.
Simply playing a waiting game in the wheat market.
Chart from GrainStats
Technicals:
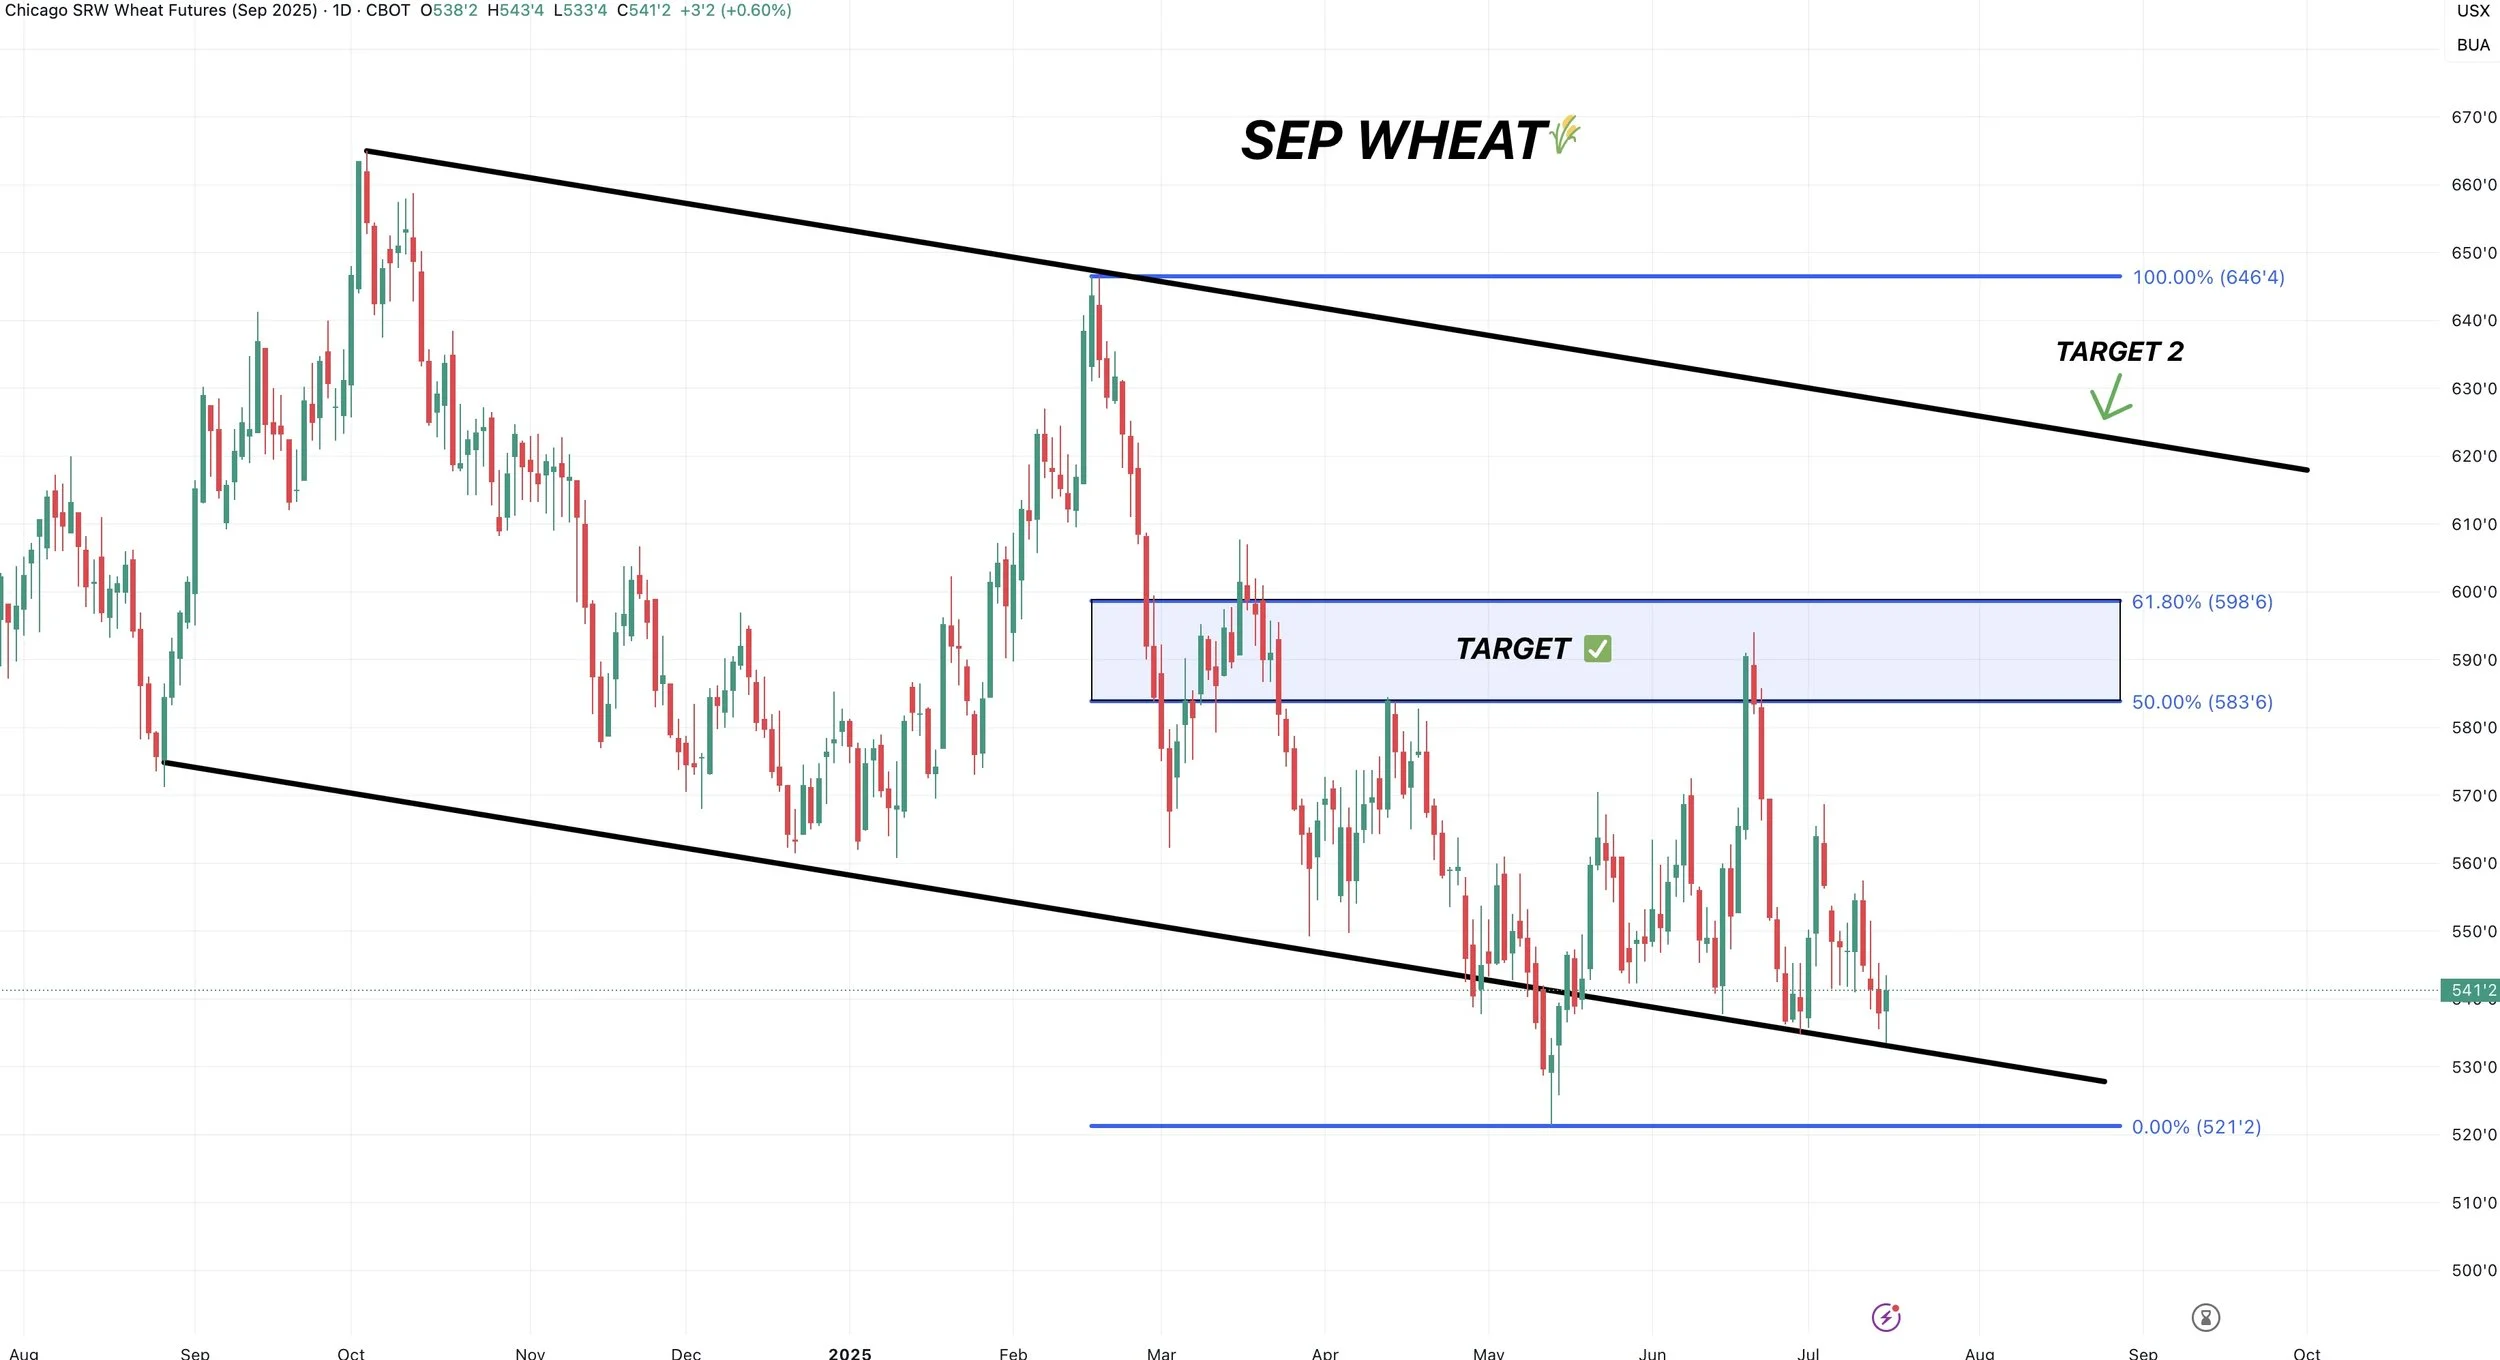
Chicago wheat still finding life at the bottom of this channel.
Not looking to de-risk unless we crawl into that blue box. Which gives back 50-61.8% of the Feb highs.
KC wheat held contract lows.
Anything between here and that green box is simply noise.
Break below contract lows, we probably spark a leg lower.
Green box is resistance. Break above the green box, we probably spark a leg higher.

Cattle
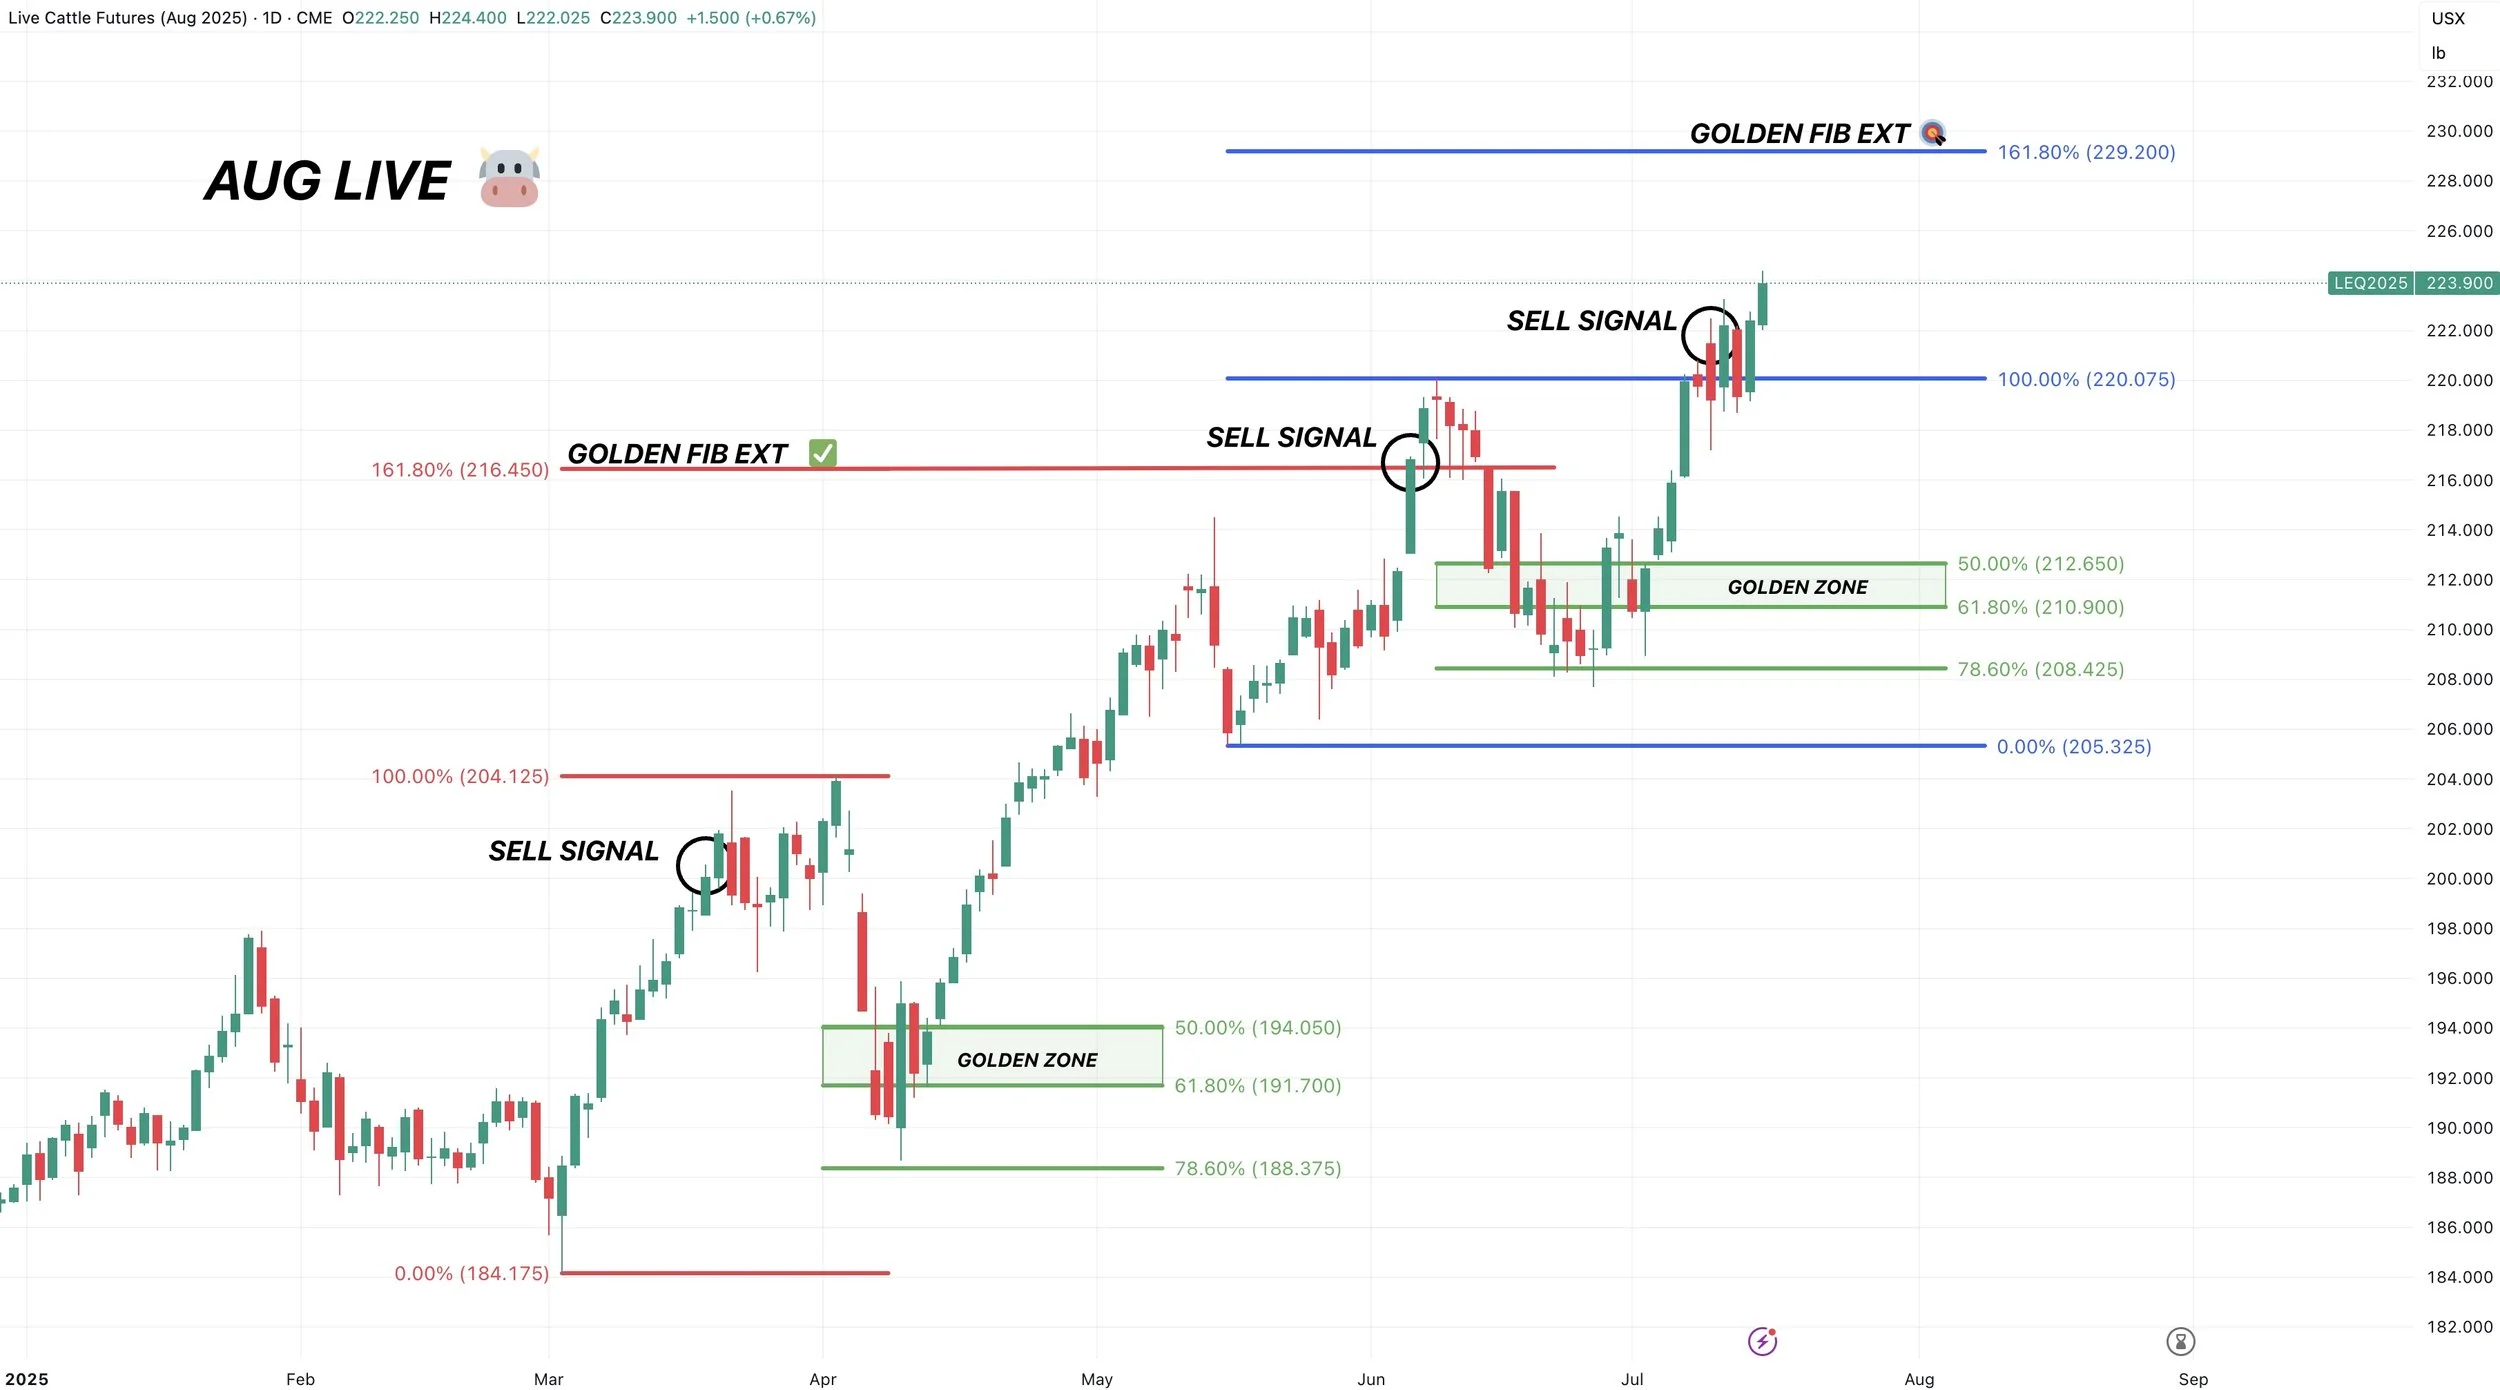
Last week we had a sell signal.
I still like protecting cattle here as we hit the golden fib from the June rally on feeder cattle (blue lines).
Meaning we hit 161.8% of the June rally.
That is exactly where we topped out in June. We hit 161.8% of the March rally. (marked with red lines).
If this is the local top, bulls want to hold the golden zone (green box). Which gives back 50-61.8% of this rally.

We did not hit the golden fib target in live cattle like we did feeder.
But when we hit a target it one, it is a green like to de-risk in both.
Next target if we keep running is the golden fib from the June rally. Again that equals 161.8% of the June rally.
Past Sell or Protection Signals
We recently incorporated these. Here are our past signals.
July 10th: 🐮
Cattle sell signal & hedge alert.
CLICK HERE TO VIEW
June 5th: 🐮
Cattle sell signal & hedge alert.
June 2nd: 🌾
MPLS wheat sell signal.
April 10th: 🌽
Old crop corn sell signal.
March 19th: 🐮
Cattle hedge & sell signal.
Feb 18th: 🌽 🌾
Old crop KC wheat & old crop corn signal.
Jan 23rd: 🌽 🌱
Corn & beans old crop sell signal.
CLICK HERE TO VIEW
Jan 15th: 🌽 🌱
Corn & beans hedge alert/sell signal.
Jan 2nd: 🐮
Cattle hedge alert at new all-time highs & target.
Dec 11th: 🌽
Corn sell signal at $4.51 200-day MA
CLICK HERE TO VIEW
Oct 2nd: 🌾
Wheat sell signal at $6.12 target
Sep 30th: 🌽
Corn protection signal at $4.23-26
Sep 27th: 🌱
Soybean sell & protection signal at $10.65
Sep 13th: 🌾
Wheat sell signal at $5.98
May 22nd: 🌾
Wheat sell signal when wheat traded +$7.00
Want to Talk?
Our phones are open 24/7 for you guys if you ever need anything or want to discuss your operation.
Hedge Account
Interested in a hedge account? Use the link below to set up an account or shoot Jeremey a call at (605)295-3100.
Check Out Past Updates
7/15/25
NEGATIVE NEWS POSITIVE ACTION IN GRAINS
7/14/25
DON’T GIVE GRAIN AWAY
7/11/25
USDA FRIENDLY CORN. MARKET DOESN’T CARE
7/10/25
JULY USDA OUT TOMORROW
7/10/25
CATTLE HEDGE ALERT & SELL SIGNAL
7/9/25
MARKET SEES RECORD CROPS
7/8/25
MONSTER CORN YIELD..?
7/7/25
TRUMP PUMP & DUMP
7/3/25
CORN & BEANS REJECT KEY SPOT. TRUMP SPEAKS IN IOWA
7/2/25
TRADE DEALS? BEANS RALLY AT GOLDEN ZONE
7/1/25
NOW WHAT FOR GRAINS?
6/30/25
BORING USDA. DIDN’T SAY HAVE TO GO LOWER
6/30/25
USDA NUMBERS
6/27/25
ALL EYES ON MONDAY
6/26/25
FIREWORKS OR BLOOD BATH MONDAY?
6/25/25
GRAINS COLLAPSING AHEAD OF JUNE REPORT
6/24/25
CORN CONTINUES SELL OFF. MAJOR USDA REPORT COMING
6/23/25
CORN CAN GO LOWER, BUT NOT FOR FOREVER
6/20/25
WHO SHOULD REWARD THE WHEAT & SOYBEAN RALLY?
6/18/25
COMPLETE CHART BREAKDOWNS
6/17/25
SOYBEANS CONTINUE BREAKOUT. NEARING SELL SIGNAL
6/16/25
CORN HAMMERED. EPA GAME CHANGER IN BEANS?
6/13/25
SOYBEANS RALLY, CHARTS, BALANCE SHEETS & MORE
6/12/25
USDA NON-EVENT. WHAT’S NEXT?
6/11/25
DIVERGENCE & SEASONAL SELL OFF?
6/10/25
BEING PATIENT VS BALANCING YOUR RISK
6/9/25
WHAT IF WE DON’T GET A WEATHER SCARE?
6/5/25
CORN & BEANS HOLDING CRUCIAL SPOTS
6/5/25
CATTLE SELL SIGNAL & HEDGE ALERT
6/4/25
HOW UNKNOWNS IMPACT MARKETING DECISIONS
6/3/25
KEY SPOTS ON THE CHARTS FOR CORN & BEANS
6/2/25
NEW LOWS IN CORN. DE-RISKING MPLS WHEAT
6/2/25
SPRING WHEAT SELL SIGNAL
5/30/25
SEASONAL RALLY STILL IN THE CARDS?
5/29/25
WHAT IS YOUR PLAN IF WE DO NOT RALLY?
5/28/25
ZERO PREMIUM IN THE GRAIN MARKETS
5/27/25
CORN CONDITIONS DISAPPOINT & JUNE OUTLOOK IMPROVES
5/23/25
TARIFFS SPOOK MARKET. GAME PLAN MOVING FORWARD
5/22/25
CHART BREAKDOWNS & TARGETS
5/21/25
RISK TO THE UPSIDE WITH WEATHER?
5/20/25
WHEAT SHORT COVERING & HISTORY OF YIELD CHANGES
5/19/25
ANYONE LEFT TO SELL WHEAT? 181 CORN YIELD POSSIBLE?
5/16/25
FUNDS SHORT CORN. MARKETS WAITING ON WEATHER
5/15/25
BEANS HAMMERED ON RUMOR & WHEAT FINDING LIFE
5/14/25
DECISIONS & POSSIBILITIES IN GRAINS
5/13/25
GRAINS RALLY OFF LOWS
5/12/25
USDA REPORT. HOW THIS CHANGES THINGS
5/9/25
BIGGEST RISKS IN USDA REPORT
5/8/25
USDA MONDAY & HISTORY OF WEATHER RALLIES
5/7/25
NEW 2025 LOWS FOR CORN
5/6/25
WHAT’S A SUMMER RALLY LOOK LIKE?
5/5/25
CORN ERASES ENTIRE APRIL RALLY
5/2/25
SELL INTO UNCERTAINTY. NOT KNOWN FACTORS
5/1/25
THE CASE AGAINST A FEB TOP IN CORN
4/30/25
APPROACHING KEY TIME PERIOD FOR GRAINS
4/29/25
PLANTING & FIRST NOTICE DAY PRESSURE. CORN CLOSE TO BOTTOM?
4/28/25
CAPTURING INVERSE & SEASONAL PREPARATION
4/25/25
HOW OFTEN DOES CORN NOT BREAK APRIL HIGHS?
4/24/25
KNOW WHEN TO SELL. BEANS BREAK 200-DAY FIRST TIME IN 483 DAYS
4/23/25
MONEY FLOW & DROUGHT CARDS
4/22/25
CRUCIAL SPOT FOR CORN & BEANS
4/21/25
NO PLANTING THREAT YET
4/18/25
POTENTIAL OPPORTUNITIES, BASIS CONTRACTS & STRATEGIES
4/16/25
HOW YIELD IMPACTS CARRYOUT. MAJOR SPOT FOR SOYBEANS
4/15/25
TOTAL CHART BREAKDOWNS & TARGETS
4/14/25
TECHNICAL SELLING IN GRAINS
4/11/25
SPECIFIC GRAIN MARKETING DECISIONS
4/10/25
USDA REPORT. HOW THIS IMPACTS CORN
4/9/25
TARIFFS GIVE. TARIFFS TAKE
4/8/25
CORN’S DIVERGING STRENGTH
4/7/25
SOLID PRICE ACTION DESPITE OUTSIDE FEAR
4/4/25
CORN PRICE ACTION SPEAKS VOLUME. ANY HOPE LEFT FOR SOYBEANS?
4/3/25
WHAT IS LEFT FOR CORN BEARS? TRADE WAR: CHARTS HOLDING SUPPORT
4/2/25
SHOULD UNKNOWNS KEEP A FLOOR UNDER GRAIN PRICES?
4/1/25
HOW DO ACRES IMPACT FUTURE OF THE GRAINS?
3/31/25
USDA REPORT: NOW WHAT?
3/28/25
ALL EYES ON USDA
3/27/25
PRE-USDA POSITIONING. DON’T GIVE GRAIN AWAY
3/26/25
HISTORY OF MARCH INTENTIONS. SOYBEANS UNDERVALUED?
3/25/25
6 DAYS UNTIL MAJOR USDA REPORT
3/24/25
HOW TO POSITION YOURSELF BEFORE PLANTING
3/21/25
REASONS TO BE OPTIMISTIC IN GRAINS?
3/20/25
WAS THAT THE BOTTOM IN CORN?
3/19/25
THE PATH HIGHER & THE DOWNSIDE RISKS IN GRAINS
3/18/25
SEASONALS, CATTLE HEDGE, CHARTS & DROUGHT?
3/17/25
WHEAT RALLIES. DON’T GET BACKED INTO A CORNER
3/14/25
MARCH 31ST REPORT THOUGHTS & WHAT’S NEXT FOR GRAINS
3/13/25
EXPLAINING RE-OWNERSHIP VS COURAGE CALLS
3/12/25
TARIFF FEARS. EU, CANADA, & ETHANOL
3/11/25
USDA SNOOZE. RECORD FUND SELLING A CONCERN?
3/10/25
USDA TOMORROW. GETTING COMFORTABLE IN MARKETING
3/7/25
HOW TIGHT IS THE WORLD & US SITUATION?
3/6/25
TARIFFS PUSHED BACK. FUTURE OPPORTUNITIES?
3/5/25
IS GRAINS BIGGEST RISK WEAK CRUDE & DEFLATION?
3/4/25
TRADE WAR BEGINS. 8TH DAY OF PAIN FOR GRAINS
3/3/25
TARIFFS ON TOMORROW. BUY SIGNAL
3/3/25
BUY SIGNAL
2/28/25
WHEN WILL THE BLEEDING STOP?
2/27/25
CORN AT CRITICAL SPOT. USDA ACRE REPORT. WAY TOO EARLY DROUGHT TALK
2/26/25
HISTORY SUGGESTS CORN TOP ISN’T IN? ACRE OUTLOOK TOMORROW
2/25/25
POSITIVE CLOSE. WHAT TO KNOW ABOUT USDA OUTLOOK
2/24/25
USDA OUTLOOK, FIRST NOTICE DAY & BRAZIL
2/21/25
WHAT TO EXPECT MOVING FORWARD IN GRAINS
2/20/25
FIRST NOTICE DAY CONCERNS. MASSIVE CORN ACRES OR NOT?
2/19/25
HOW TIGHT IS THE CORN SITUATION?
2/18/25
MORE DETAILS ON TODAYS SELL SIGNAL
2/18/25
OLD CROP KC WHEAT & CORN SELL SIGNAL
2/14/25
WHEAT BREAKING OUT ON WEATHER RISK. TECHNICALS & FUNDAMENTALS
2/12/25
GLOBAL GRAIN SITUATION, ACRE TALK, CHARTS & MORE
2/11/25
USDA: NOT A BEARISH REPORT. DISAPPOINTING PRICE ACTION
2/10/25
USDA TOMORROW. LONG TERM PATH FOR SUB 10% CORN STOCKS TO USE?
2/7/25
WHY WOULD THE FUNDS EXIT THEIR LONGS?
2/6/25
WHEAT FINALLY CATCHING A BID
2/5/25
COMPLETE THOUGHTS ON MARKETS: BACK & FORTH DISCUSSION
2/4/25
STRONG JANUARY LEAD TO STRONG YEAR? TARIFFS, CHARTS & MORE
2/3/25
TARIFFS PUSHED BACK
1/31/25
TARIFF NEWS ALL OVER THE PLACE. ARE YOU PREPARED FOR POSSIBILITIES?
1/30/25
WHEAT BULL ARGUMENT. TRUMP ADDS TARIFFS
1/29/25
CORN APPROACHES $5.00
1/28/25
TARIFFS, CORN FUNDS, SOUTH AMERICA & MORE
1/27/25
HEALTHY CORRECTION WE TALKED ABOUT & TARIFF NEWS
1/24/25
GRAINS DUE FOR SHORT TERM CORRECTION?
1/23/25
OUR ENTIRE NEW CROP SALES THOUGHTS & OLD CROP SELL SIGNAL
1/22/25
GRAINS TAKE A BREATHER. IS CORN IN A BULL OR BEAR MARKET?
1/21/25
HUGE DAY IN GRAINS. WHAT TO DO WITH OLD CROP VS NEW CROP
Read More
1/20/25
VIDEO CHART UPDATE
1/17/25
TRUMP, CHINA, ARGY & USING THE SPREADS INVERSE
1/16/25
OLD CROP LEADS US LOWER. MARKETING THOUGHTS
1/15/25
SIGNAL & HEDGE ALERT QUESTIONS EXPLAINED. IS $6 CORN EVEN POSSIBLE?
1/14/25
MORE DETAILS ON TODAYS HEDGE ALERT & SELL SIGNAL
1/14/25
CORN & SOYBEANS HEDGE ALERT/SELL SIGNAL
1/13/25
USDA GAME CHANGER OR NOT?
1/10/25
BULLISH USDA FOR CORN & BEANS
1/9/25
USDA OUT TOMORROW
1/8/25
2 DAYS UNTIL USDA. BE PREPARED
1/7/25
THE HISTORY OF THE JAN USDA & MORE
1/6/25
MAJOR USDA REPORT FRIDAY
Read More
1/3/25
UGLY DAY ACROSS THE GRAINS
1/2/25