
WHERE IS CORN & BEAN BOTTOM? WAS THAT CATTLE TOP?
MARKET UPDATE
You can scroll to read the usual update as well. As the written version is the exact same as the video.
Timestamps for video:
Cattle Signal: 0:00min
Corn: 2:55min
Beans: 7:00min
Wheat: 10:00min
Summer sale ends soon
Want to talk about your situation?
(605)295-3100
Futures Prices Close

Overview
Soybeans continue to struggle with non-threatening weather and concerns surrounding demand.
While the corn & wheat market traded slightly higher after the wheat market posted fresh contract lows earlier in the day.
The cattle market saw a blood bath today following the recent rally.
Cattle Signal - Why?
This morning we alerted a hedge alert & sell signal for cattle. Why?
There are a few reasons why I am being cautious here in the cattle market.
(Link to this mornings alert: CLICK HERE)
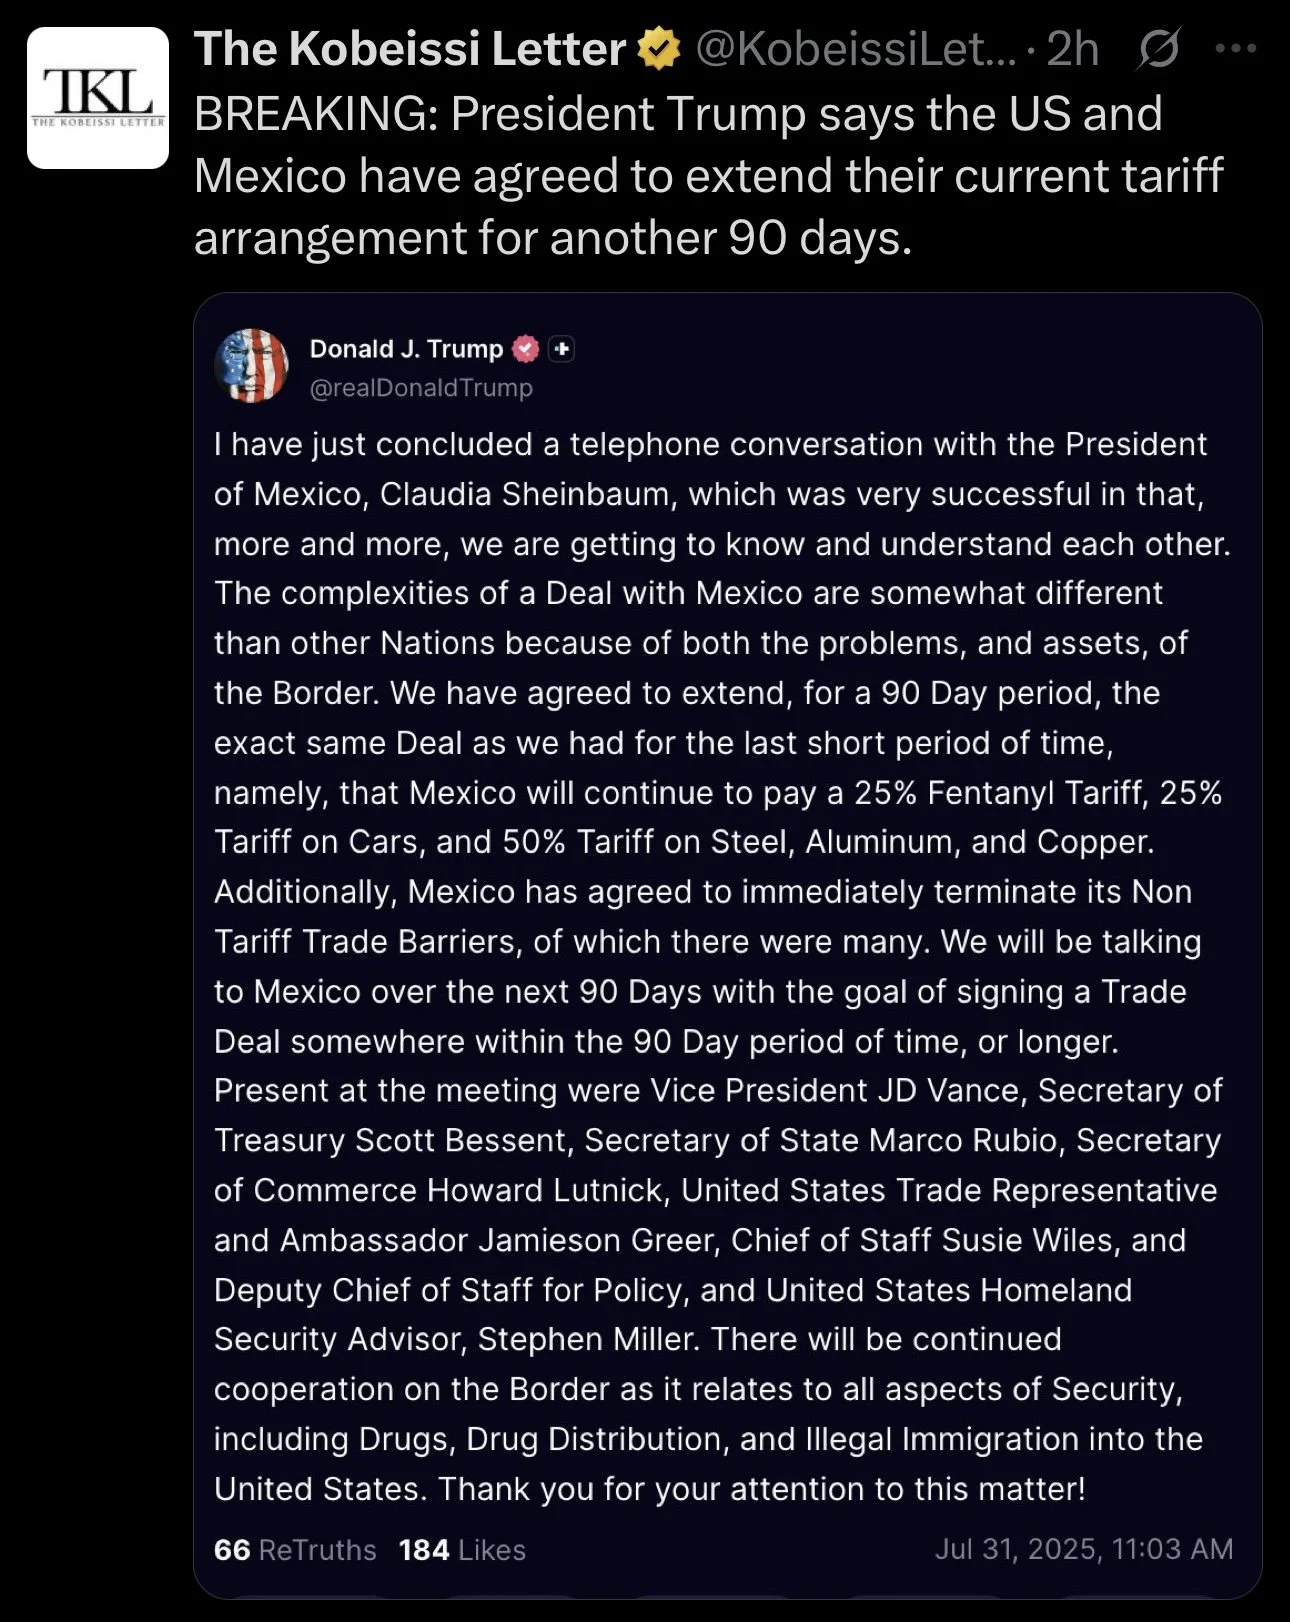
1) Tariff headlines
President Trump says the US and Mexico agreed to extend their tariff arrangement for another 90 days.
Does this mean we could open the border back up to the live cattle imports too?
Who knows. But it's a risk.
2) Targets & Charts
Today's lower action could easily just simply be end of month profit taking. We had one of the largest monthly rallies ever. So traders taking profit at the end of the month makes sense.
But we did hit big spots on the charts and left key reversals lower. So I think it makes sense to de-risk here.
Sep Feeder Chart 🐮
For targets we used a fib extension.
Meaning we took the May lows, up to the June highs, then back down to June lows. Then projected the next move off that June low.
The most common fib level is the 161.8% level. Meaning this rally equals 161.8% of the size of the June rally when you take it off those June lows.
(So the blue dotted lines mark where we measured, the red dotted line is the 161.8% move off those June lows)
Hopefully that makes sense.
We hit the 161.8% which was our first target. The 2nd target was the 200% which we did not quiet hit.
We also closed below yesterday’s lows after posting contract highs today. That is known as a key reversal lower.
Something that could indicate a potential top in a market where you are simply throwing darts into the ocean trying to time the top.
We've seen this happen several times though. Usually a reversal is confirmed if you follow it up the next day.
If this was truly the top, a standard correction would be 50-61.8% of this entire rally (Green box at 315-320).

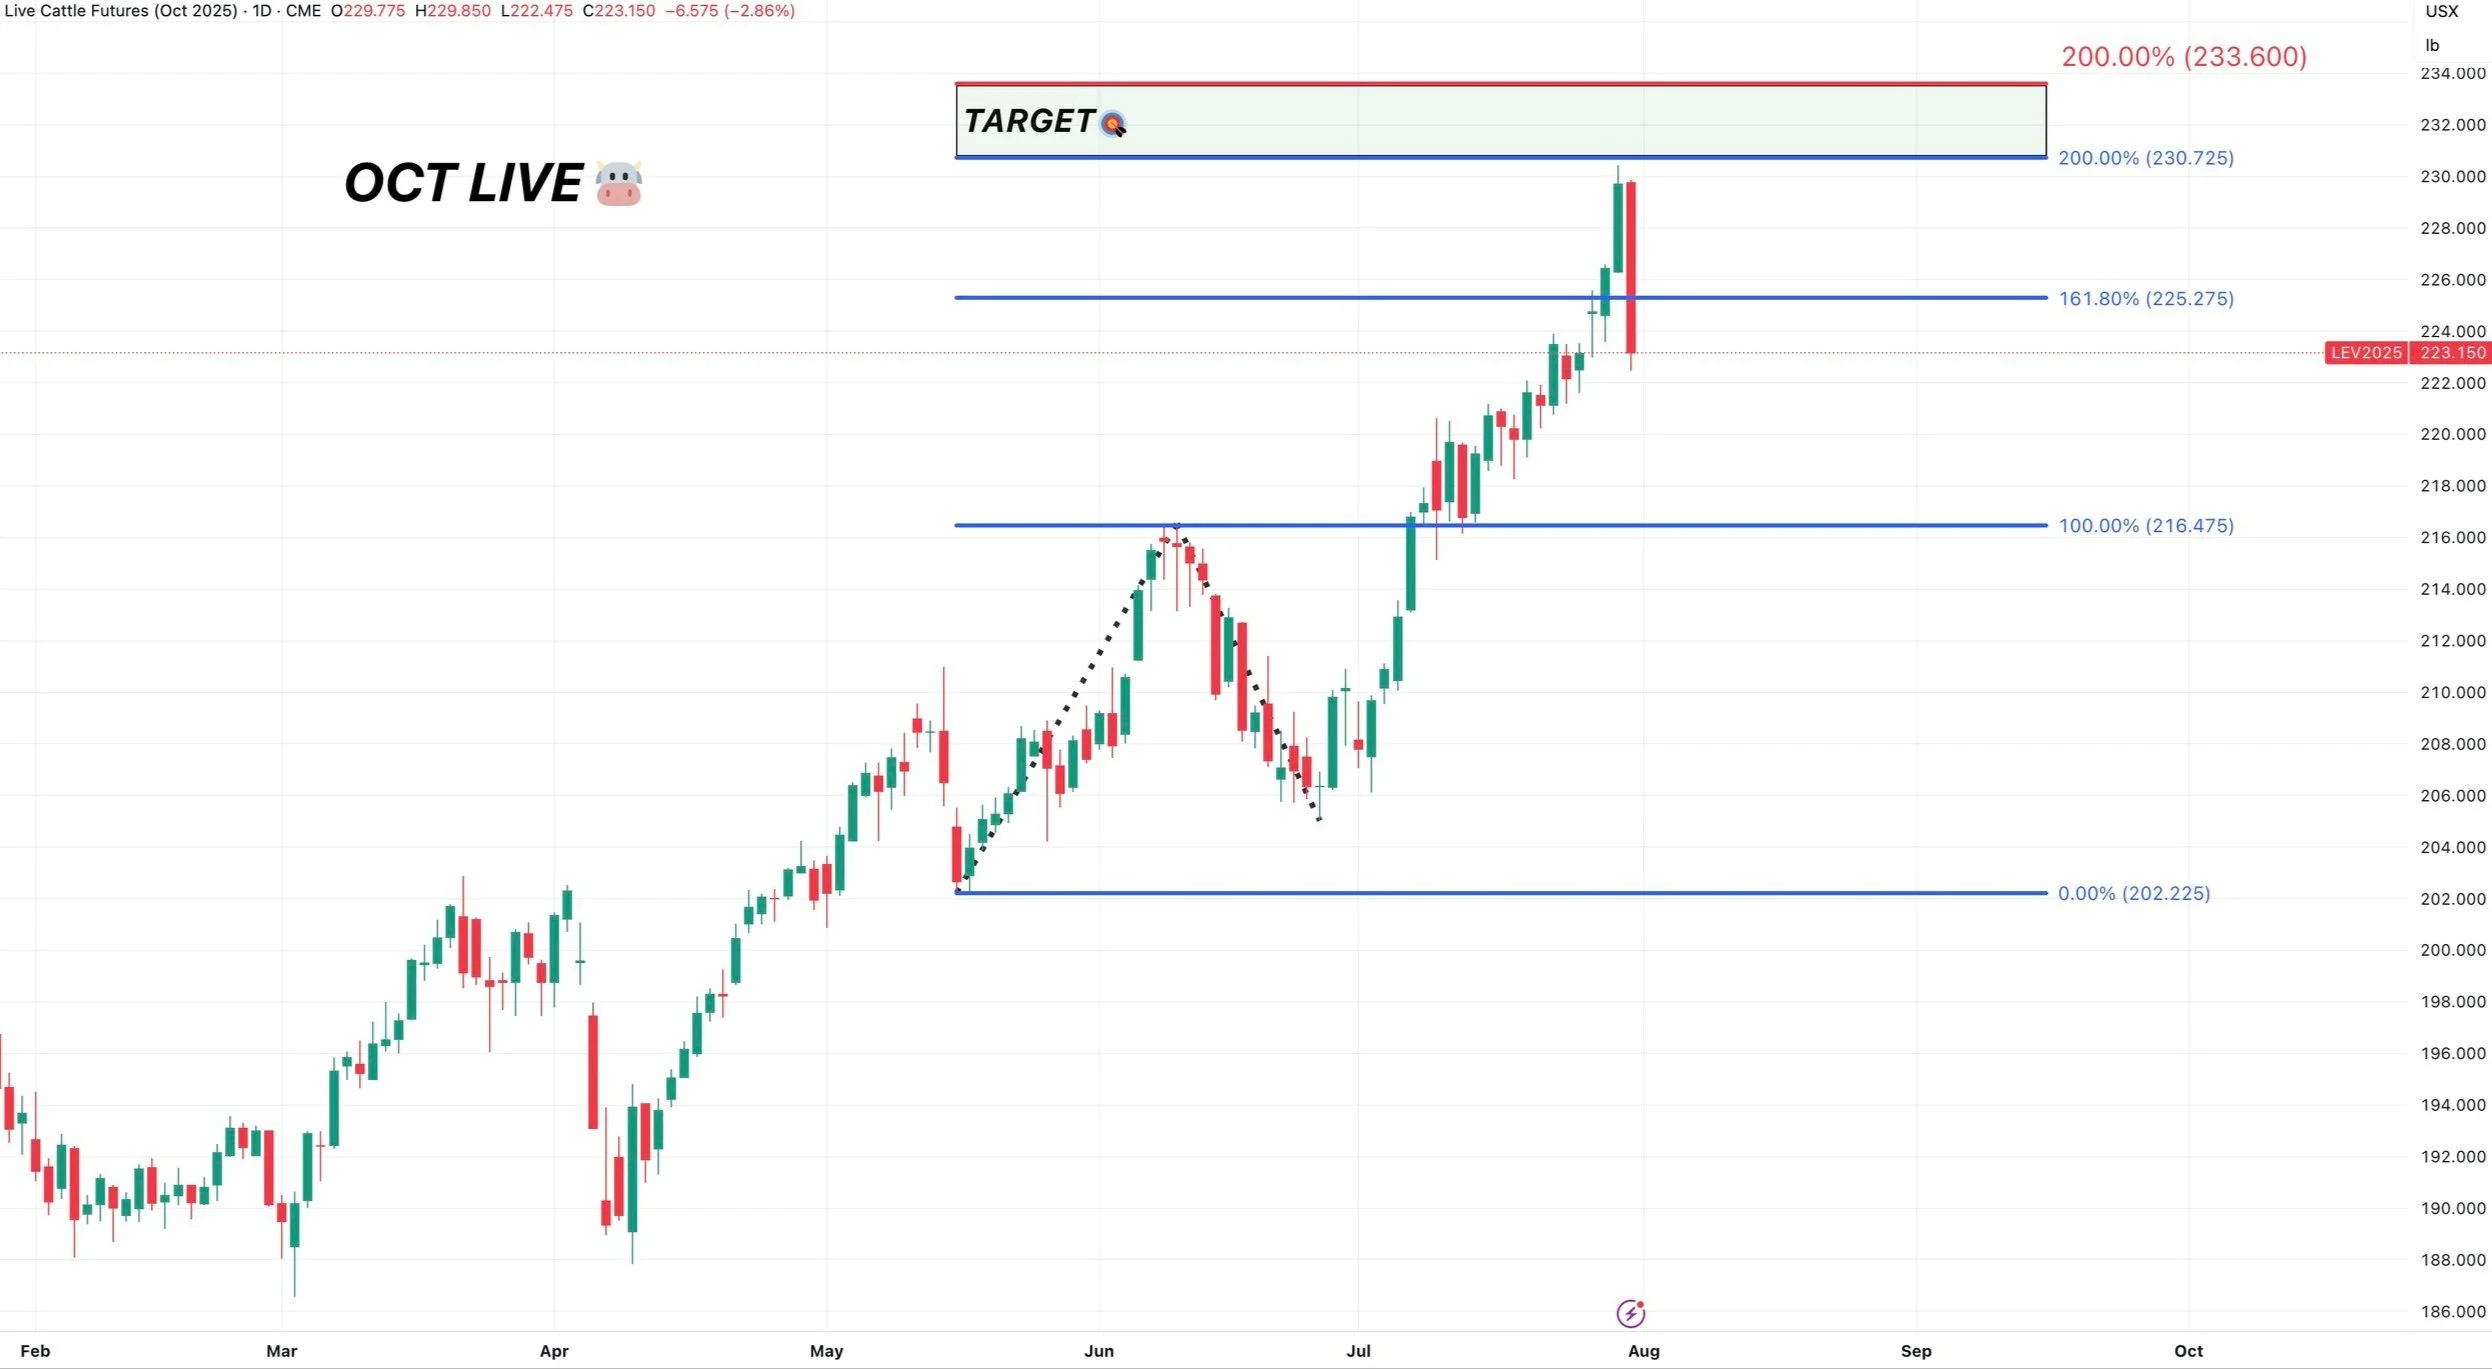
Oct Live 🐮
We almost exactly tapped that target box.
The blue line was the 200% retracement of the June rally.
Meaning this was simply 200% of that June rally.
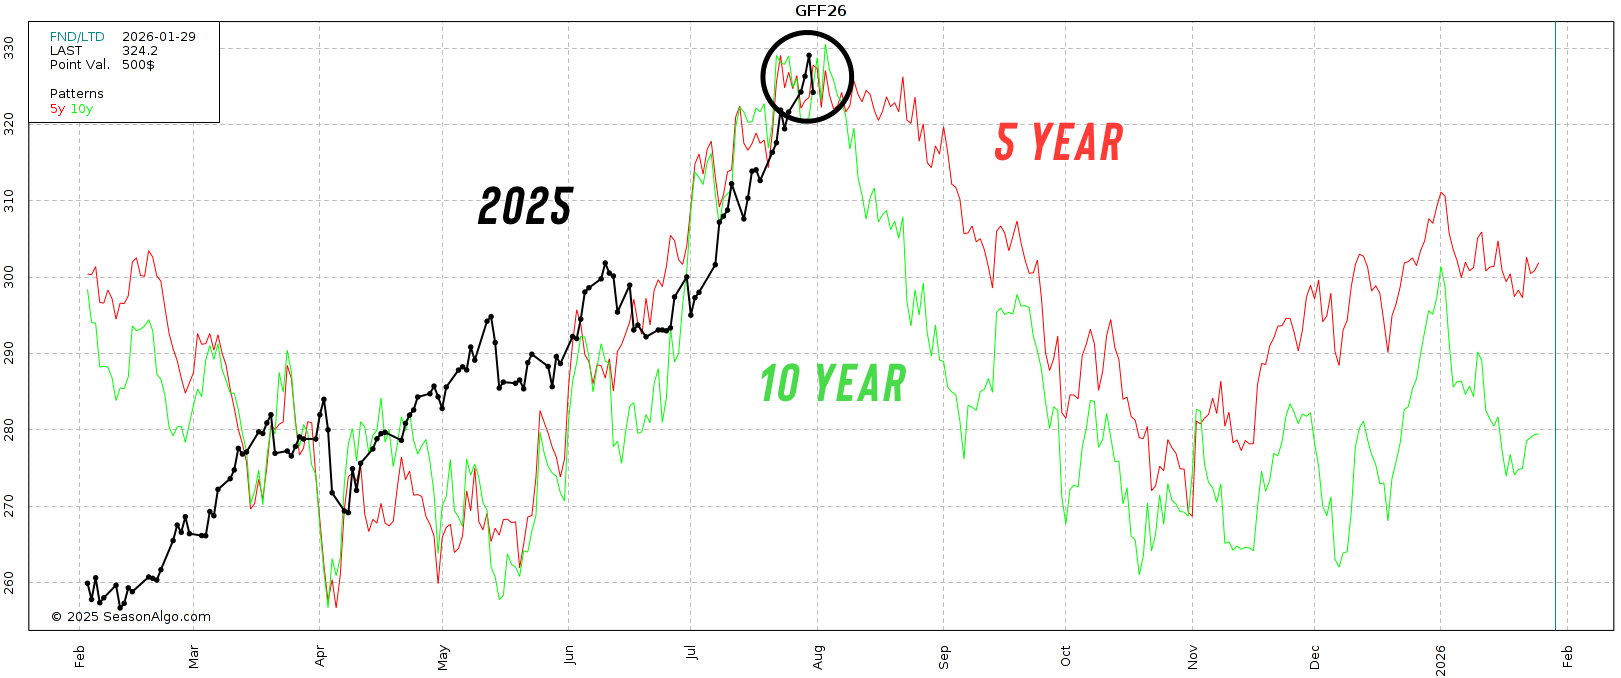
3) Seasonals
Seasonally we start to head lower from here as well.
If this happens, it doesn’t mean the bull run is over or anything like that.
We could simply get a correction before finding a bottom in the fall, then make all-time highs later again.
But seasonally, we get a decent correction as we approach the latter part of grilling season.
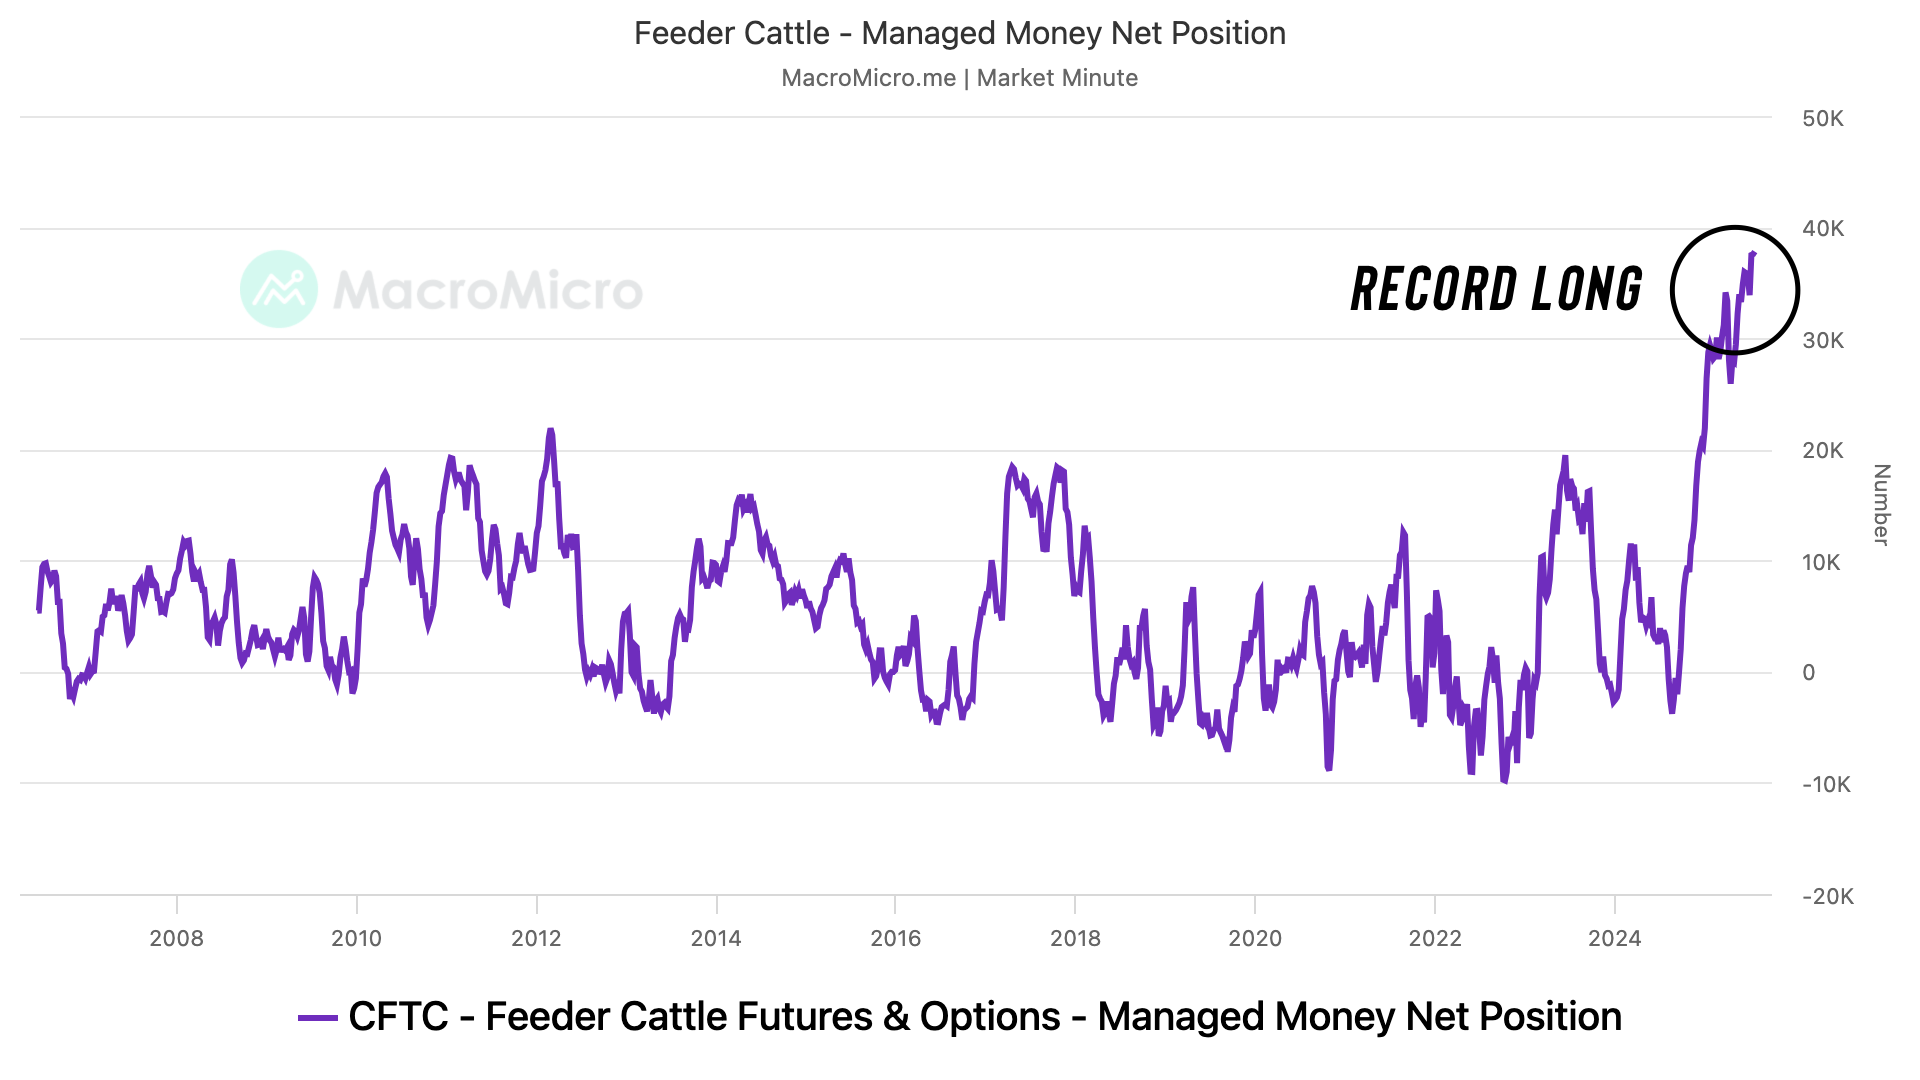
4) Record Long Funds
The funds are record long.
Do I think they just puke out this entire position without a fight? Absolutely not.
But there is definitely risk they take some profit here.
Todays Main Takeaways
Corn
We have zero reason to rally majorly here until closer to harvest or until we get a bullish catalyst.
At the same time, a significant sustained move below $4 would not be justified.
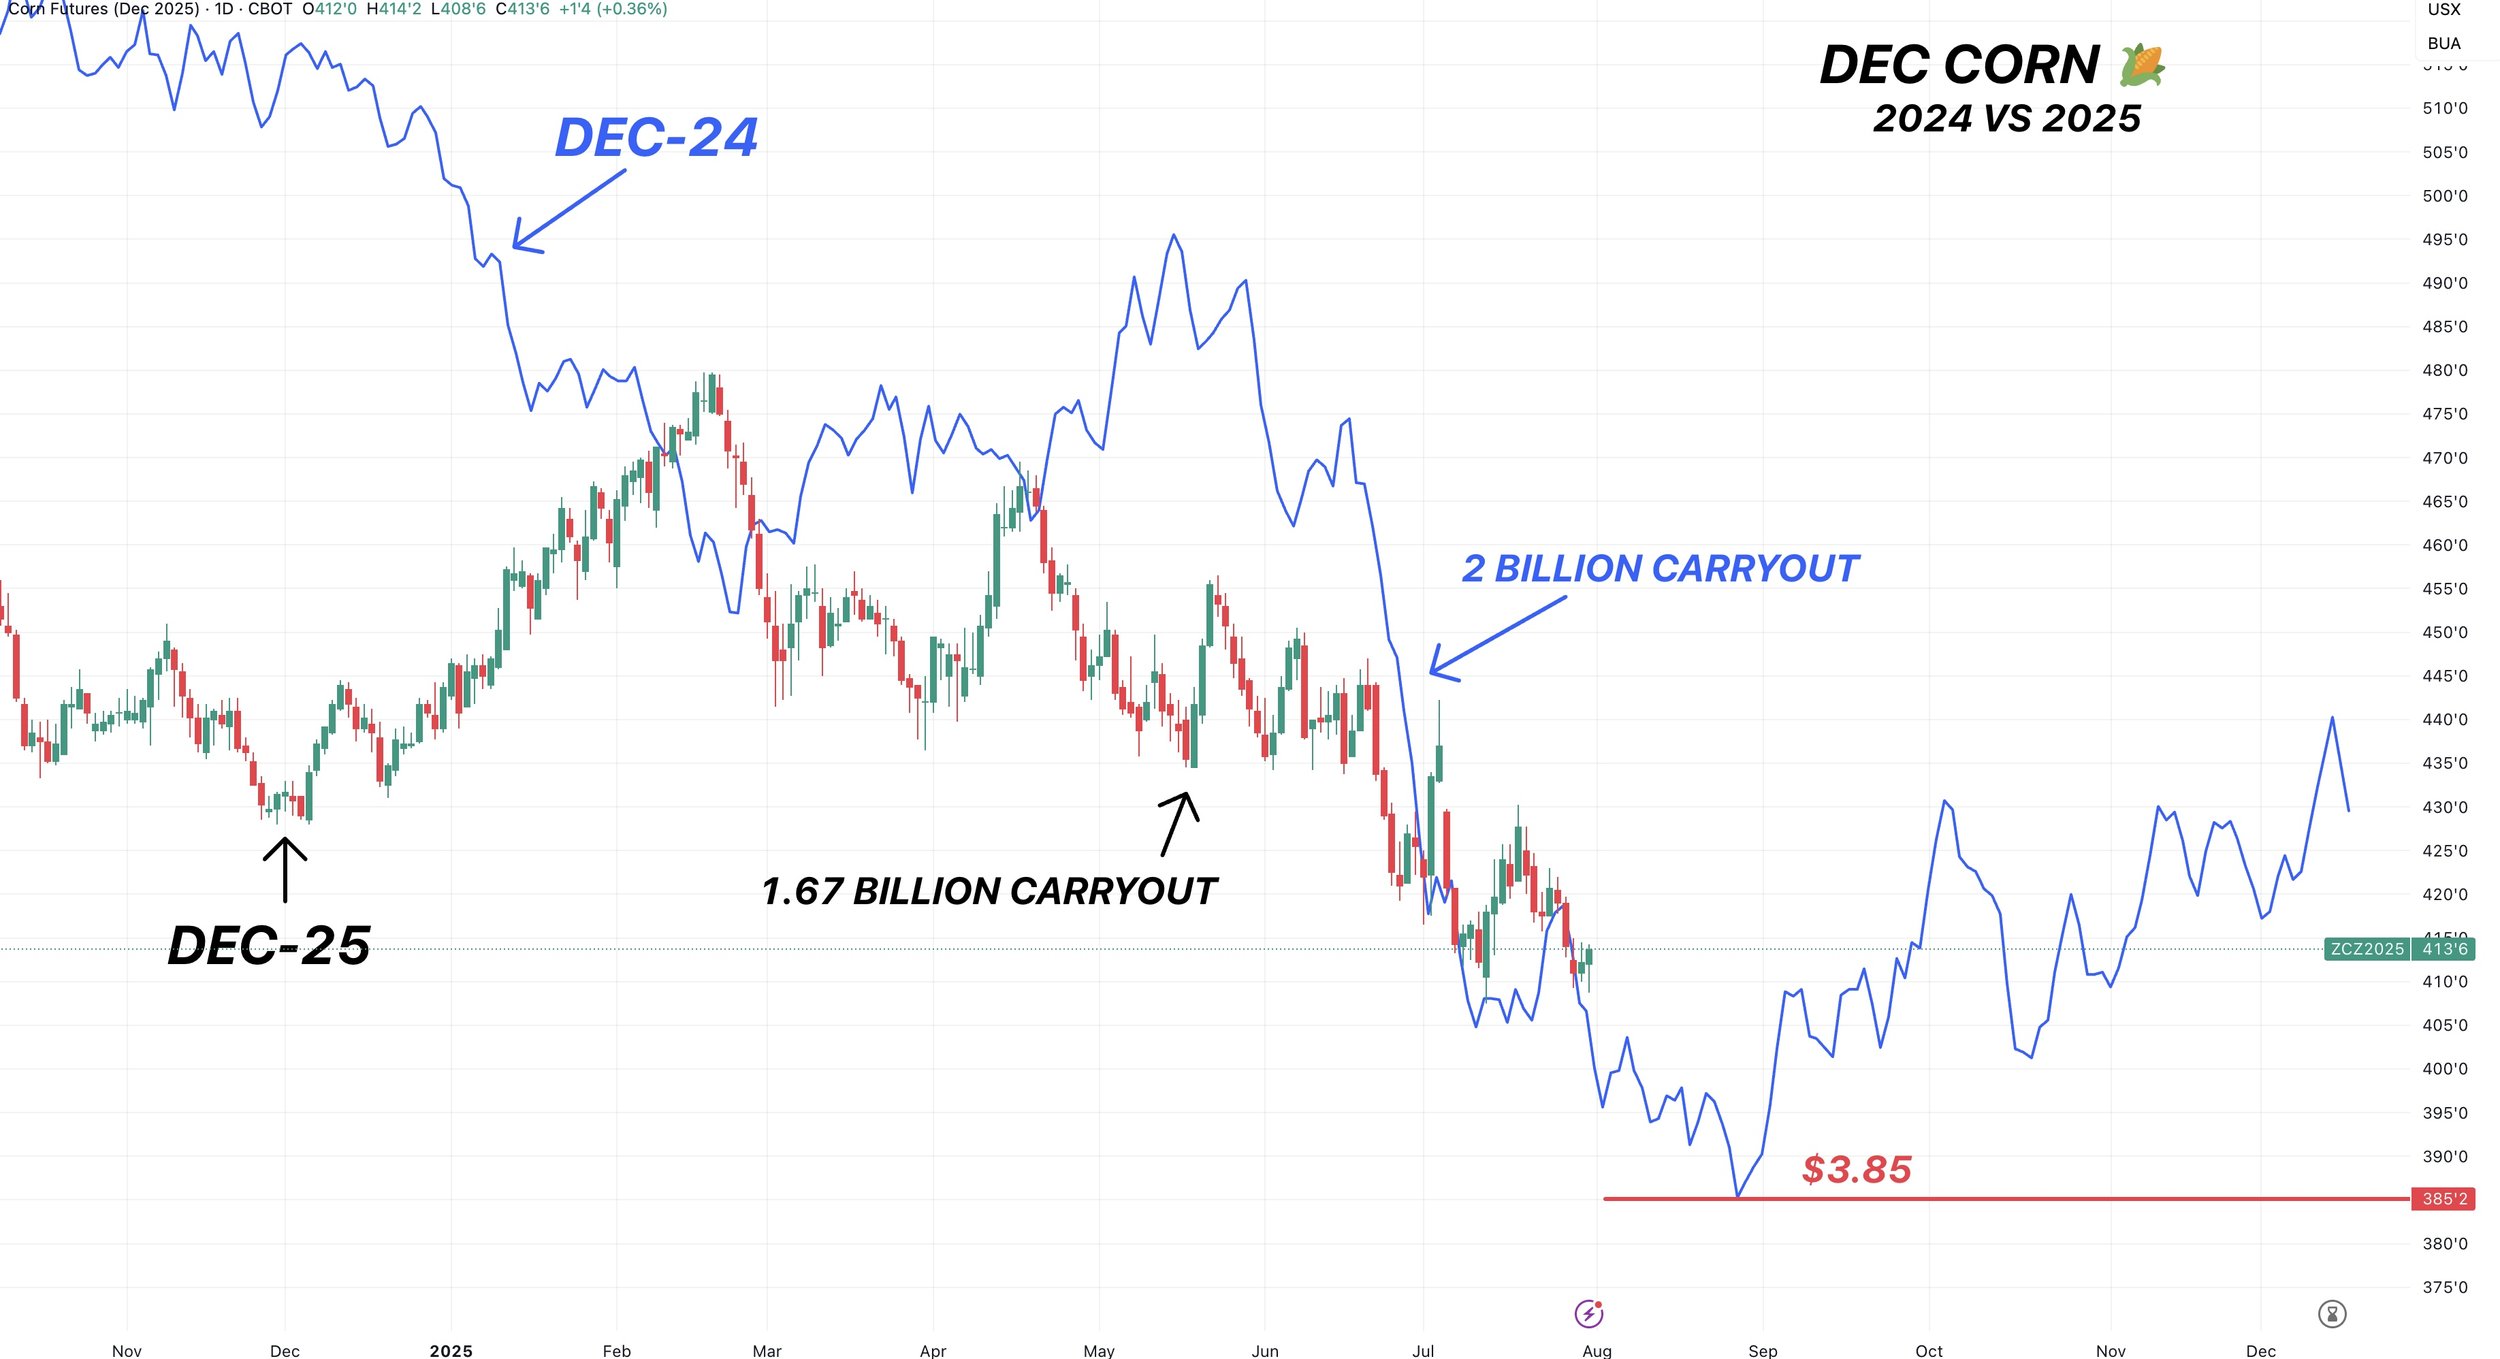
I am going to continue to show this chart as I think it's the best argument as to why corn shouldn’t stay below $4 for long if it happens.
Our carryout is -17% tighter than it was last year at this time.
Our absolute lows last year in Dec-24 corn were $3.85 and we only spent about a month below $4.00
With the market already pricing in a +185 yield and a carryout similar to last year at this time, I'd assume our absolute floor this year is probably also right about there. Maybe a little higher.
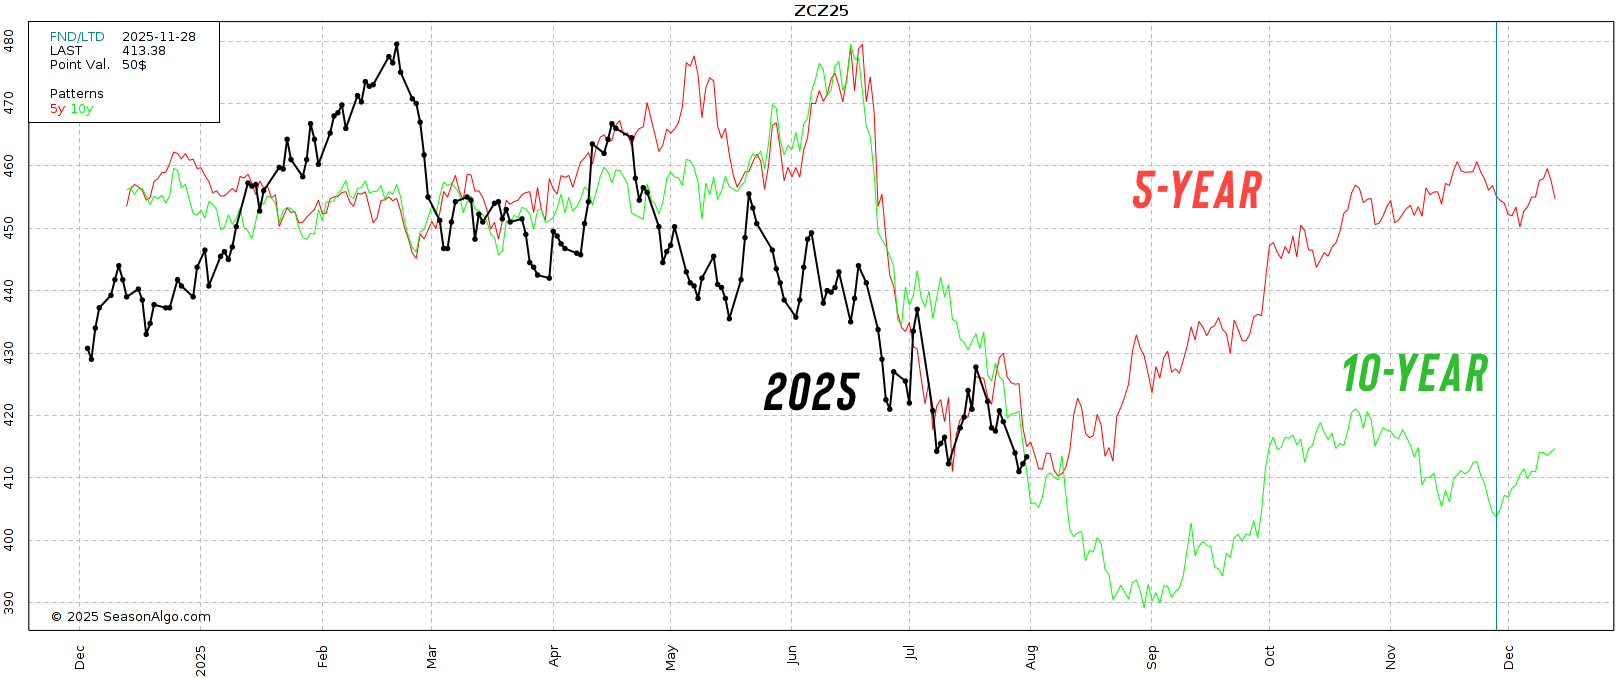
Seasonals:
Here is the 5 and 10 year seasonals.
The 5 year says the lows are pretty much in.
The 10 year says we find lows at $3.90 towards the end of August.
Too Much Rain?:
Yield is up in the air. So we aren’t going to spend much time there today. I'm not an agronomist.
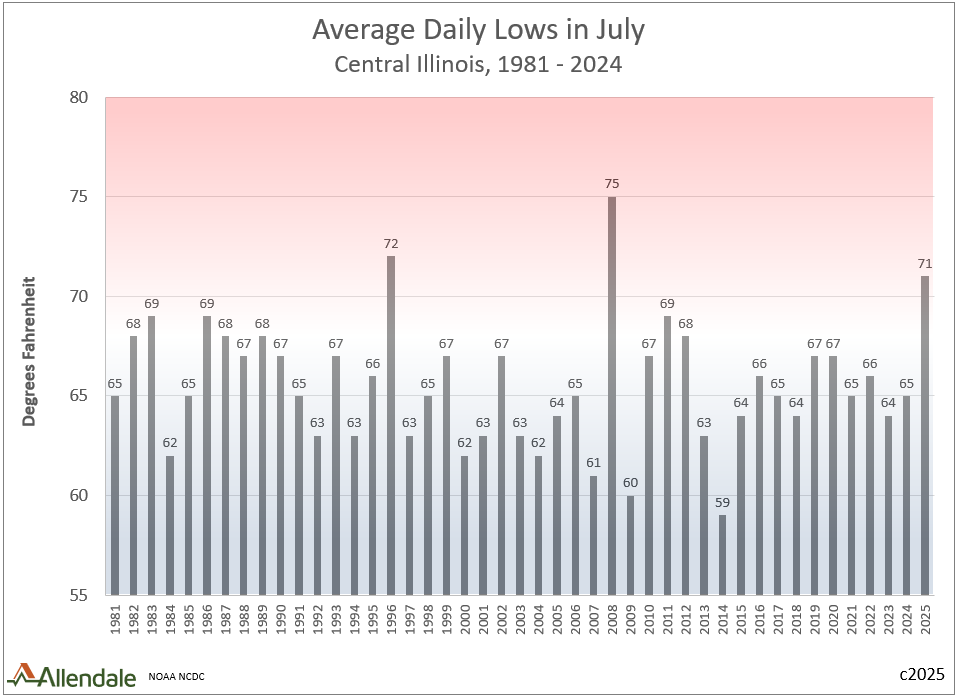
We've went over night temps and how we've seen the warmest nights on record.
I mean just look at this chart that shows the average daily lows for central Illinois in July.
Chart from Allendale
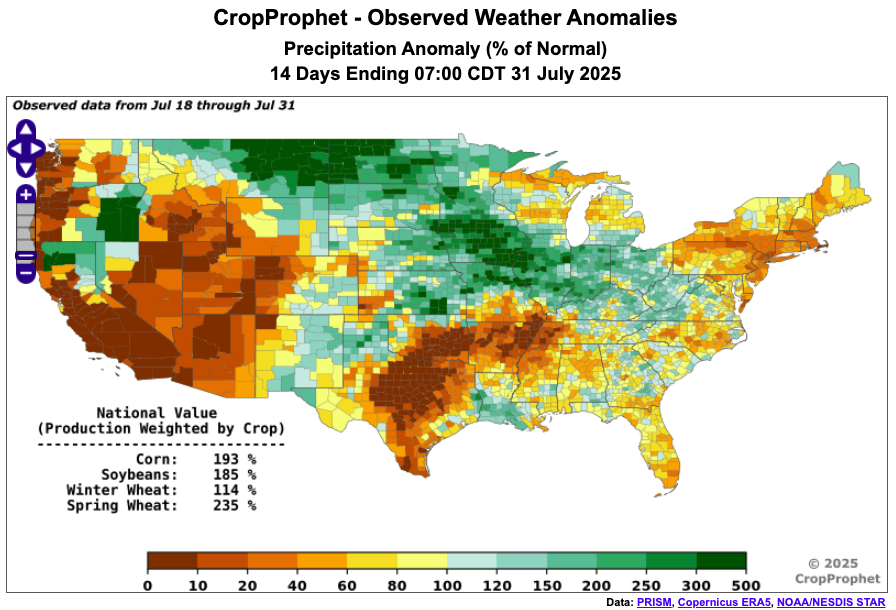
But we've also had an insane amount of rain. Some say we've seen too much.
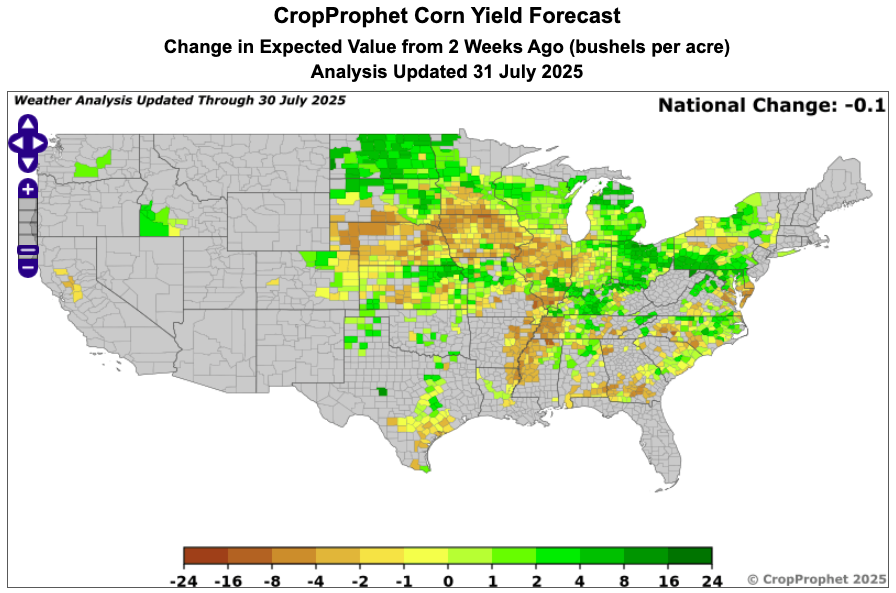
Here is two maps from Crop Prophet.
The first is the last 14 days of rain.
The 2nd is expected change in yield the past 14 days.
Rain makes grain, but they think too much rain and humidity (aka hot nights) has made a slight negative impact.
Des Moines Iowa has received around 10 inches of rain month to date. Normal rain for this date period is 3.6 inches.
Too much of anything can’t be great for production.
Amazing Export Demand:
New crop exports are better than they were last year at this time.
They are the best since 2021.
Chart from Allendale
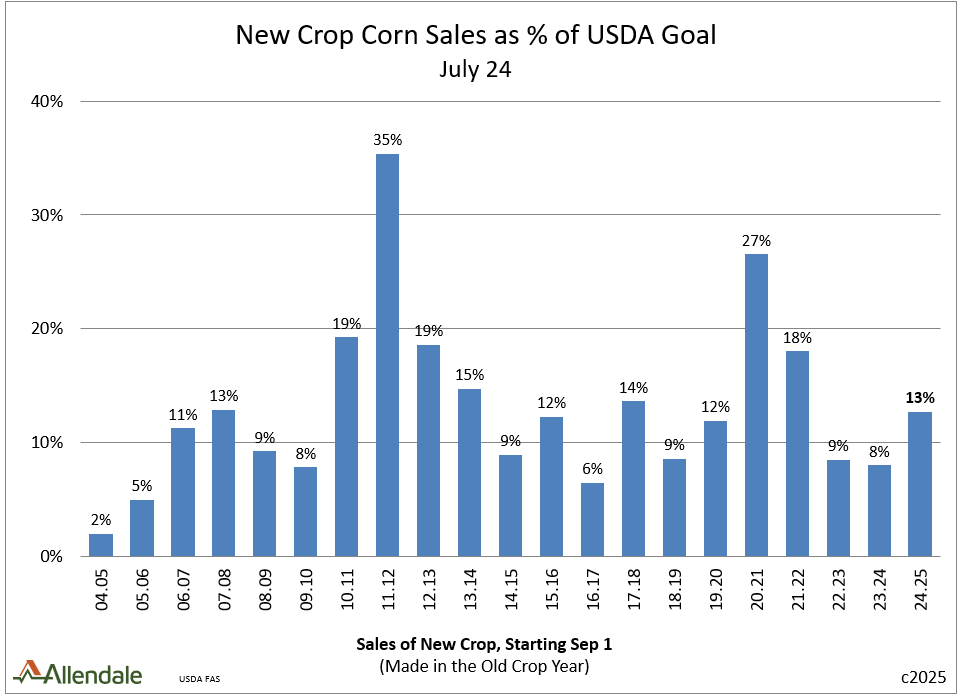
Here is another year by year visual from the Brock Report.
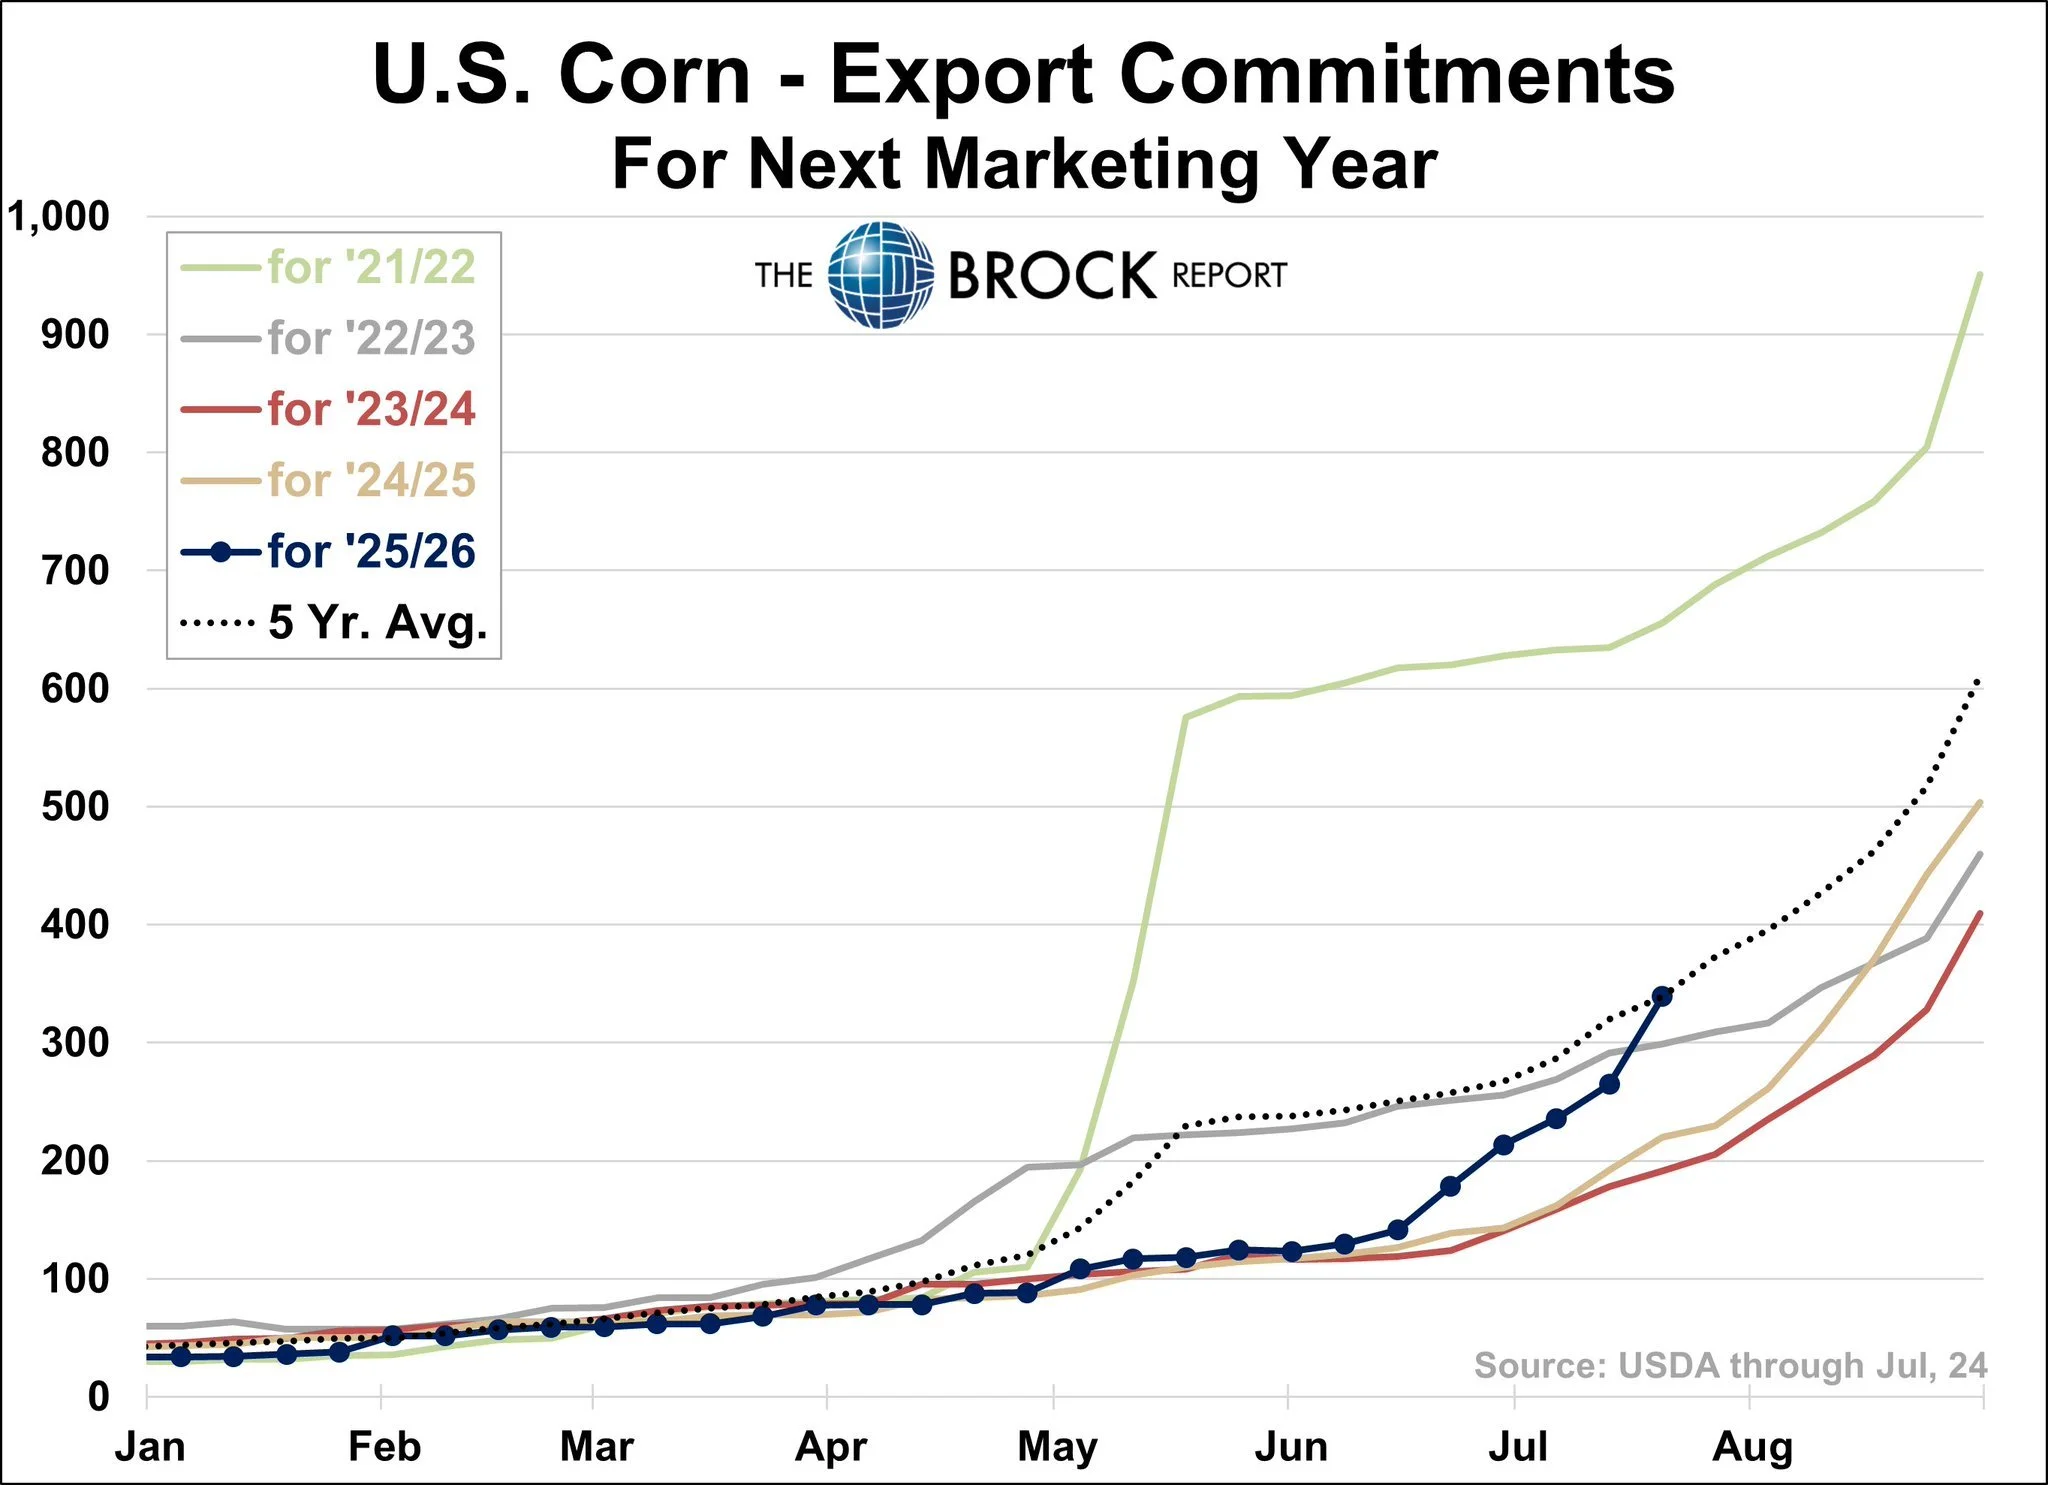
But if you remember, exports in 2021 were entirely led by China.
This year we have not sold a single bushel to China.
That is how impressive export demand has been.

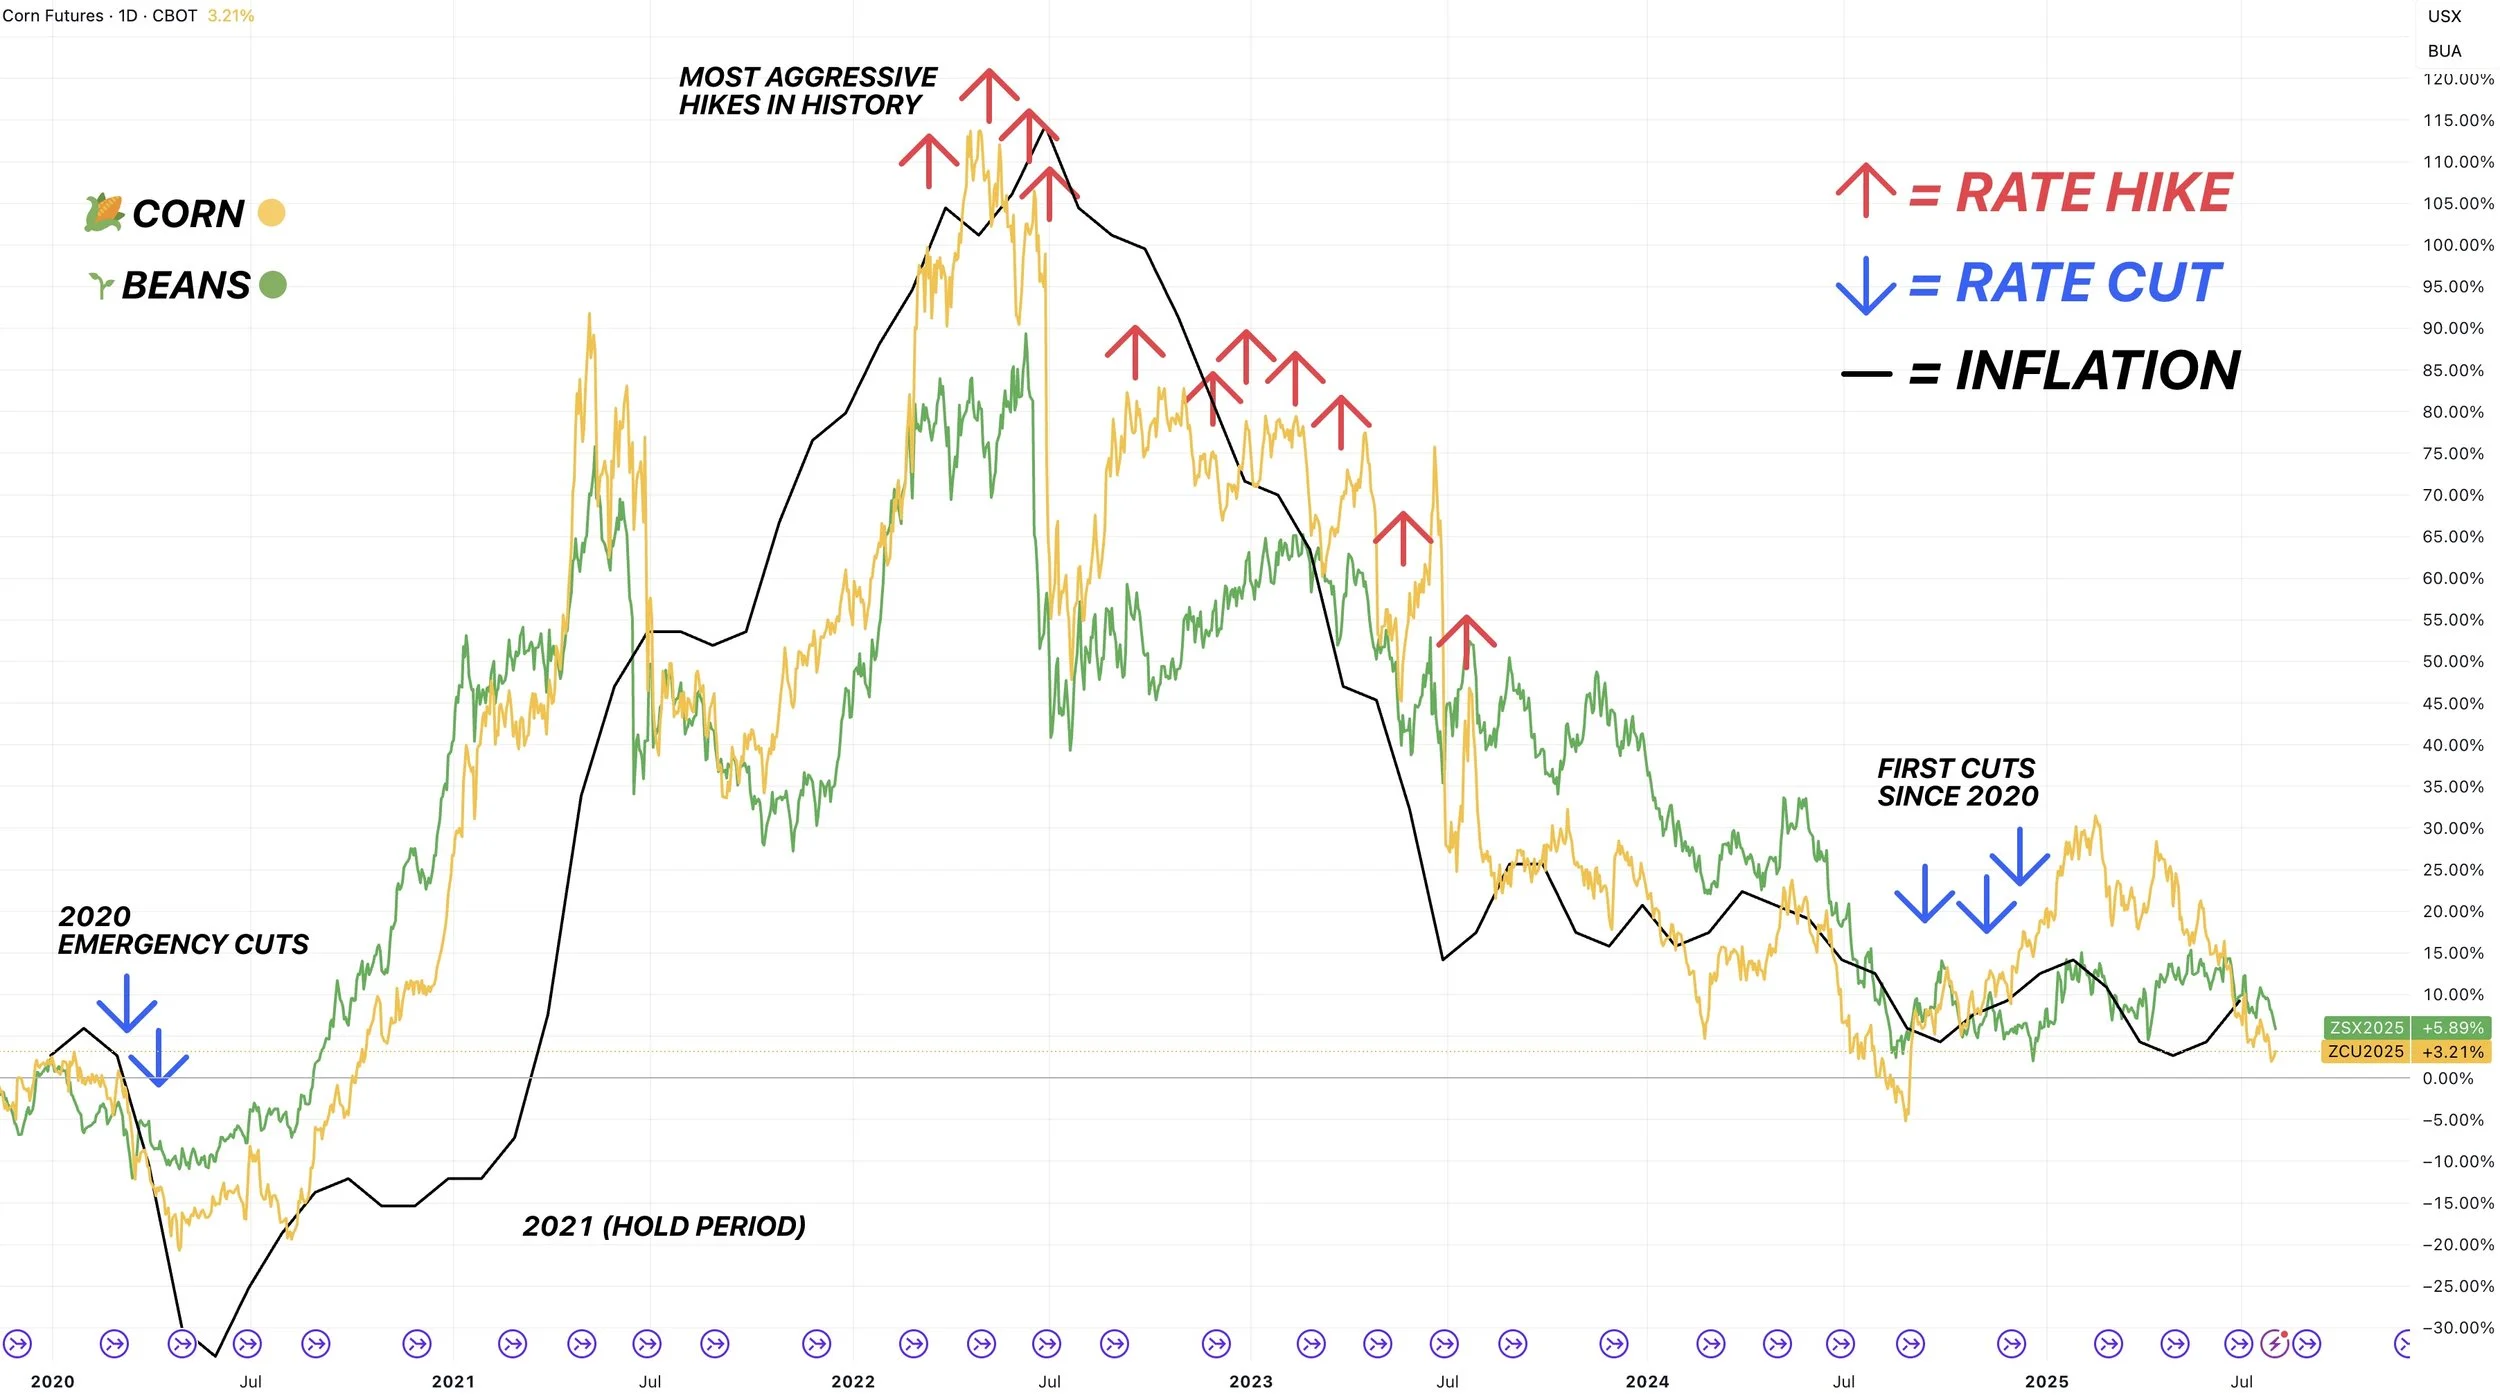
Feds & Interest Rates:
Yesterday the Feds left interest rates unchanged as expected.
Yesterday there was a 60% chance for rate cuts in September.
Today there is a 40% chance for cuts in September.
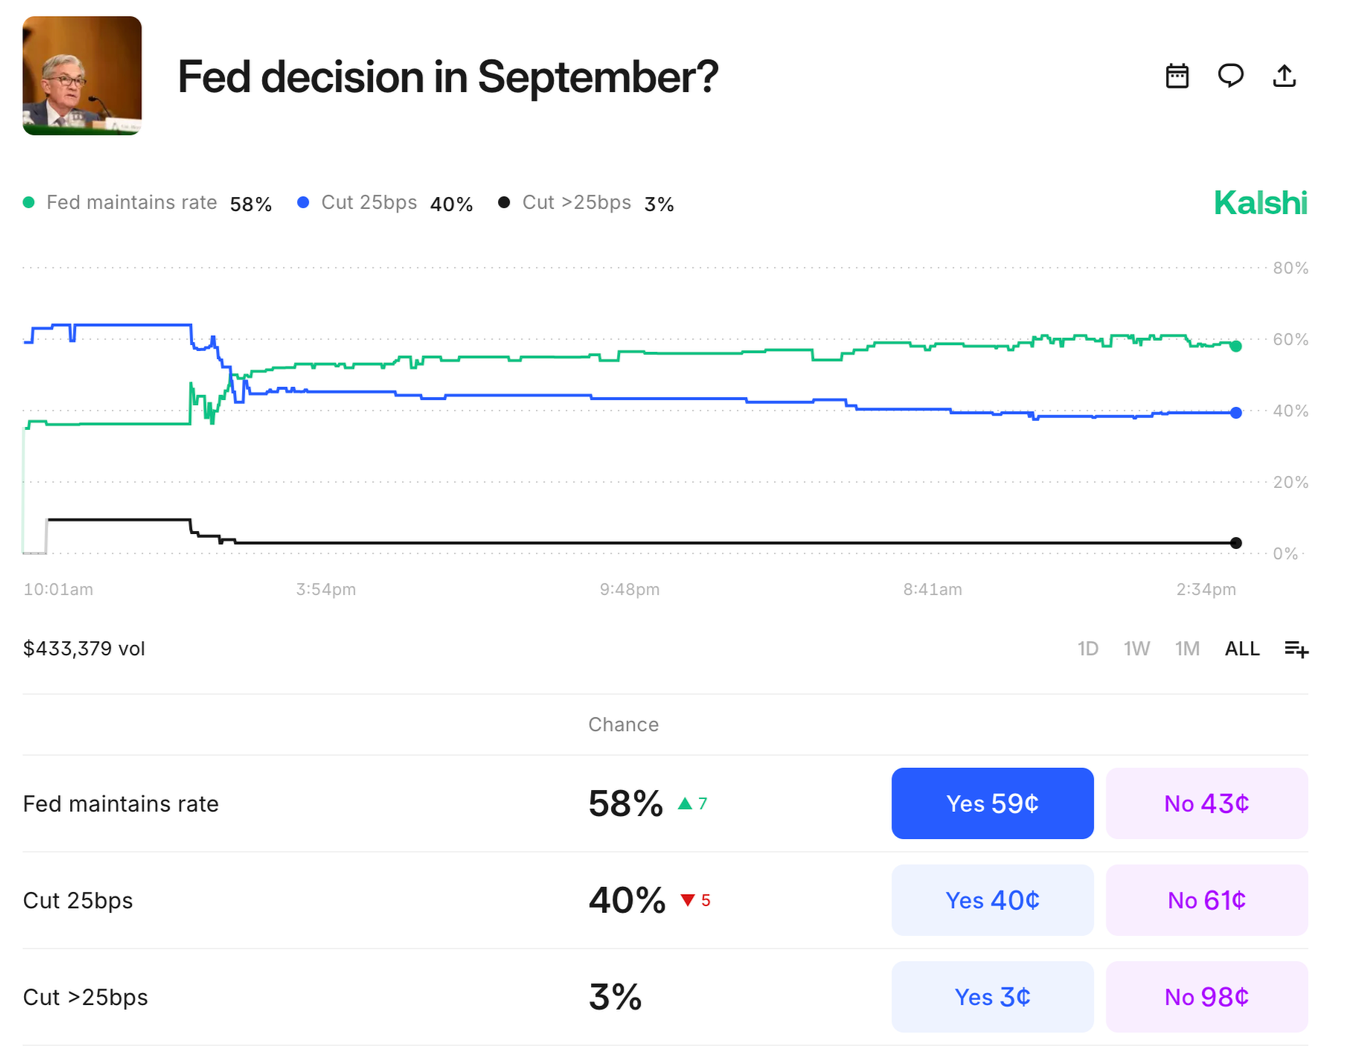
However, Trump flat out said that the feds will cut rates in September.
If they do cut rates in September, I think we see a similar thing happen like last year.
Where the funds wait until they are confident rates are going to be cut, then they can get behind this corn market.
Why?
Lower rates & higher inflation (rate cuts) supports higher priced commodities.
If you want to lower inflation (aka rate hikes) you need cheaper commodities.
I've shown this chart a thousand times, but it speaks for itself.
Technicals:
We continue to hold this golden fib box. This is a big spot.
(This box equals 50-61.8% of the size of the sell off we saw after the 4th of July weekend)
This is where the market makes a decision. We either get a bounce or we go to the 1 to 1 move at $3.95.
(Meaning this sell off would equal 100% of the size of the 4th of July one).
If we do not hold here, our next stop is probably $3.95.
If we do go to $3.95, my pure speculative thought process is that would be our harvest lows sometime here in the next month. Our lows last year were $3.85 on August 26th.

Soybeans
Fundamentals:
Soybeans continue to struggle as weather doesn’t look threatening and traders continue to worry about demand to China.
Again, China accounts for a massive portion of total US bean demand. Without them we would swim in beans.

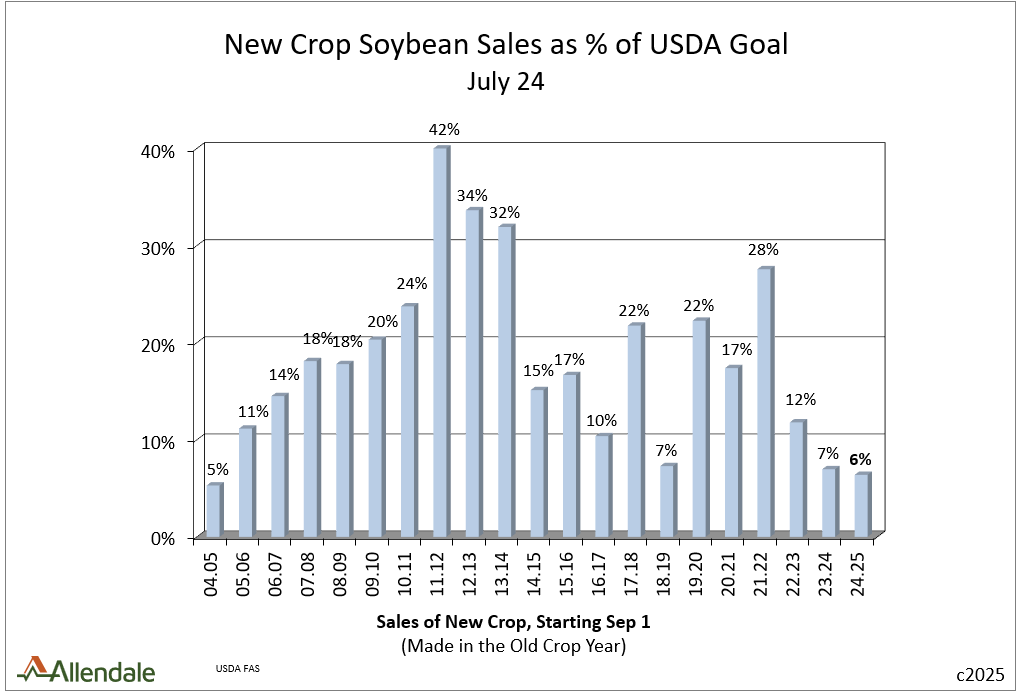
If we look at the current book of new crop soybean sales, I can see the concern.
They are the lowest in 20 years for this time of year.
Chart from Allendale
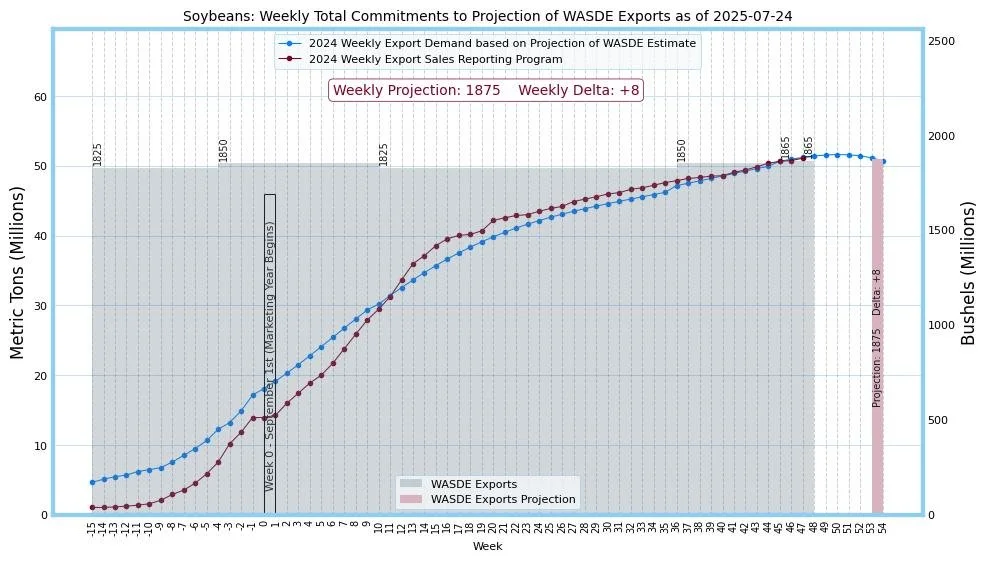
However, we are just behind last year.
Last year people had the same exact concern.
We started really slow. Yet we exceeded the USDA's projections.
But this is a different story than year, because who knows how the China & Trump situation will play out.
*(Here is old crop exports vs USDA projections)
Chart from Robert McClure on X
Here is a good thought from Angie Setzer that pretty much sums it up.
Last year everyone was screaming soybeans were going to $8.00 and that we had no demand.

Room for Error:
As long as we don’t kill demand, I think there will still be an opportunity in soybeans at some point.
It might take longer than any of us woud like.
But the US soybean balance sheet still doesn’t have any room for error.
Even with a 53 bpa yield, our carryout is still tighter than last year (if demand remains unchanged from here).
Of course there is always the risk for 53-54 bpa, but at the same time we still have never seen 52 bpa.
*(Below is how yield impacts carryout with no demand changes & past soybean yield)


August Seasonal:
Something to note is that seasonally August is usually where soybeans struggle.
If we look at this seasonal from the last two years, both years fell into the early part of August before carving out lows in the middle of August.
How low could we go?
If demand gets killed from China, a lot lower.
If not, our lows last year in Nov-24 were $9.60 on August 14th.
Our lows for Nov-25 back in December were also $9.60
As long as demand doesn’t disappear, what argument would there be for soybeans to take out Nov-24's lows?
Our carryout is -30% tighter than it was last year.

I showed this the other day, but it lines up with the thought process from the last chart.
Our resistance during the trade was $9.60
That is where we bounced last August.
Old resistance is new supoort.
Barring a full blown trade war, I'd like to think we found our long term floor at $9.60

Technicals:
I have been mentioning that is Nov beans failed to hold $10.00 we had a gap of air lower.
Well.. how low?
The black trendline comes in right around $9.80
If you were to take the 1 to 1 move we saw after the 4th of July weekend (marked with the arrow) that brings you right to $9.83 as well.
So that is the spot I am looking for. Hopefully we can find life there.

Wheat
Fundamentals:
There is still very little to update surrounding the wheat market as we battle contract lows and are in the time of year where there isn’t much news for bulls or bears to chew on.
I don’t think there is a reason for us to continuing falling apart drastically. But given there isn’t much new on the fundamentals let's look at the charts.
Technicals:
KC wheat continues to hold contract lows, as it has tested this level on 5 seprate occasions.
Meanwhille, Chicago wheat just posted a fresh low today.
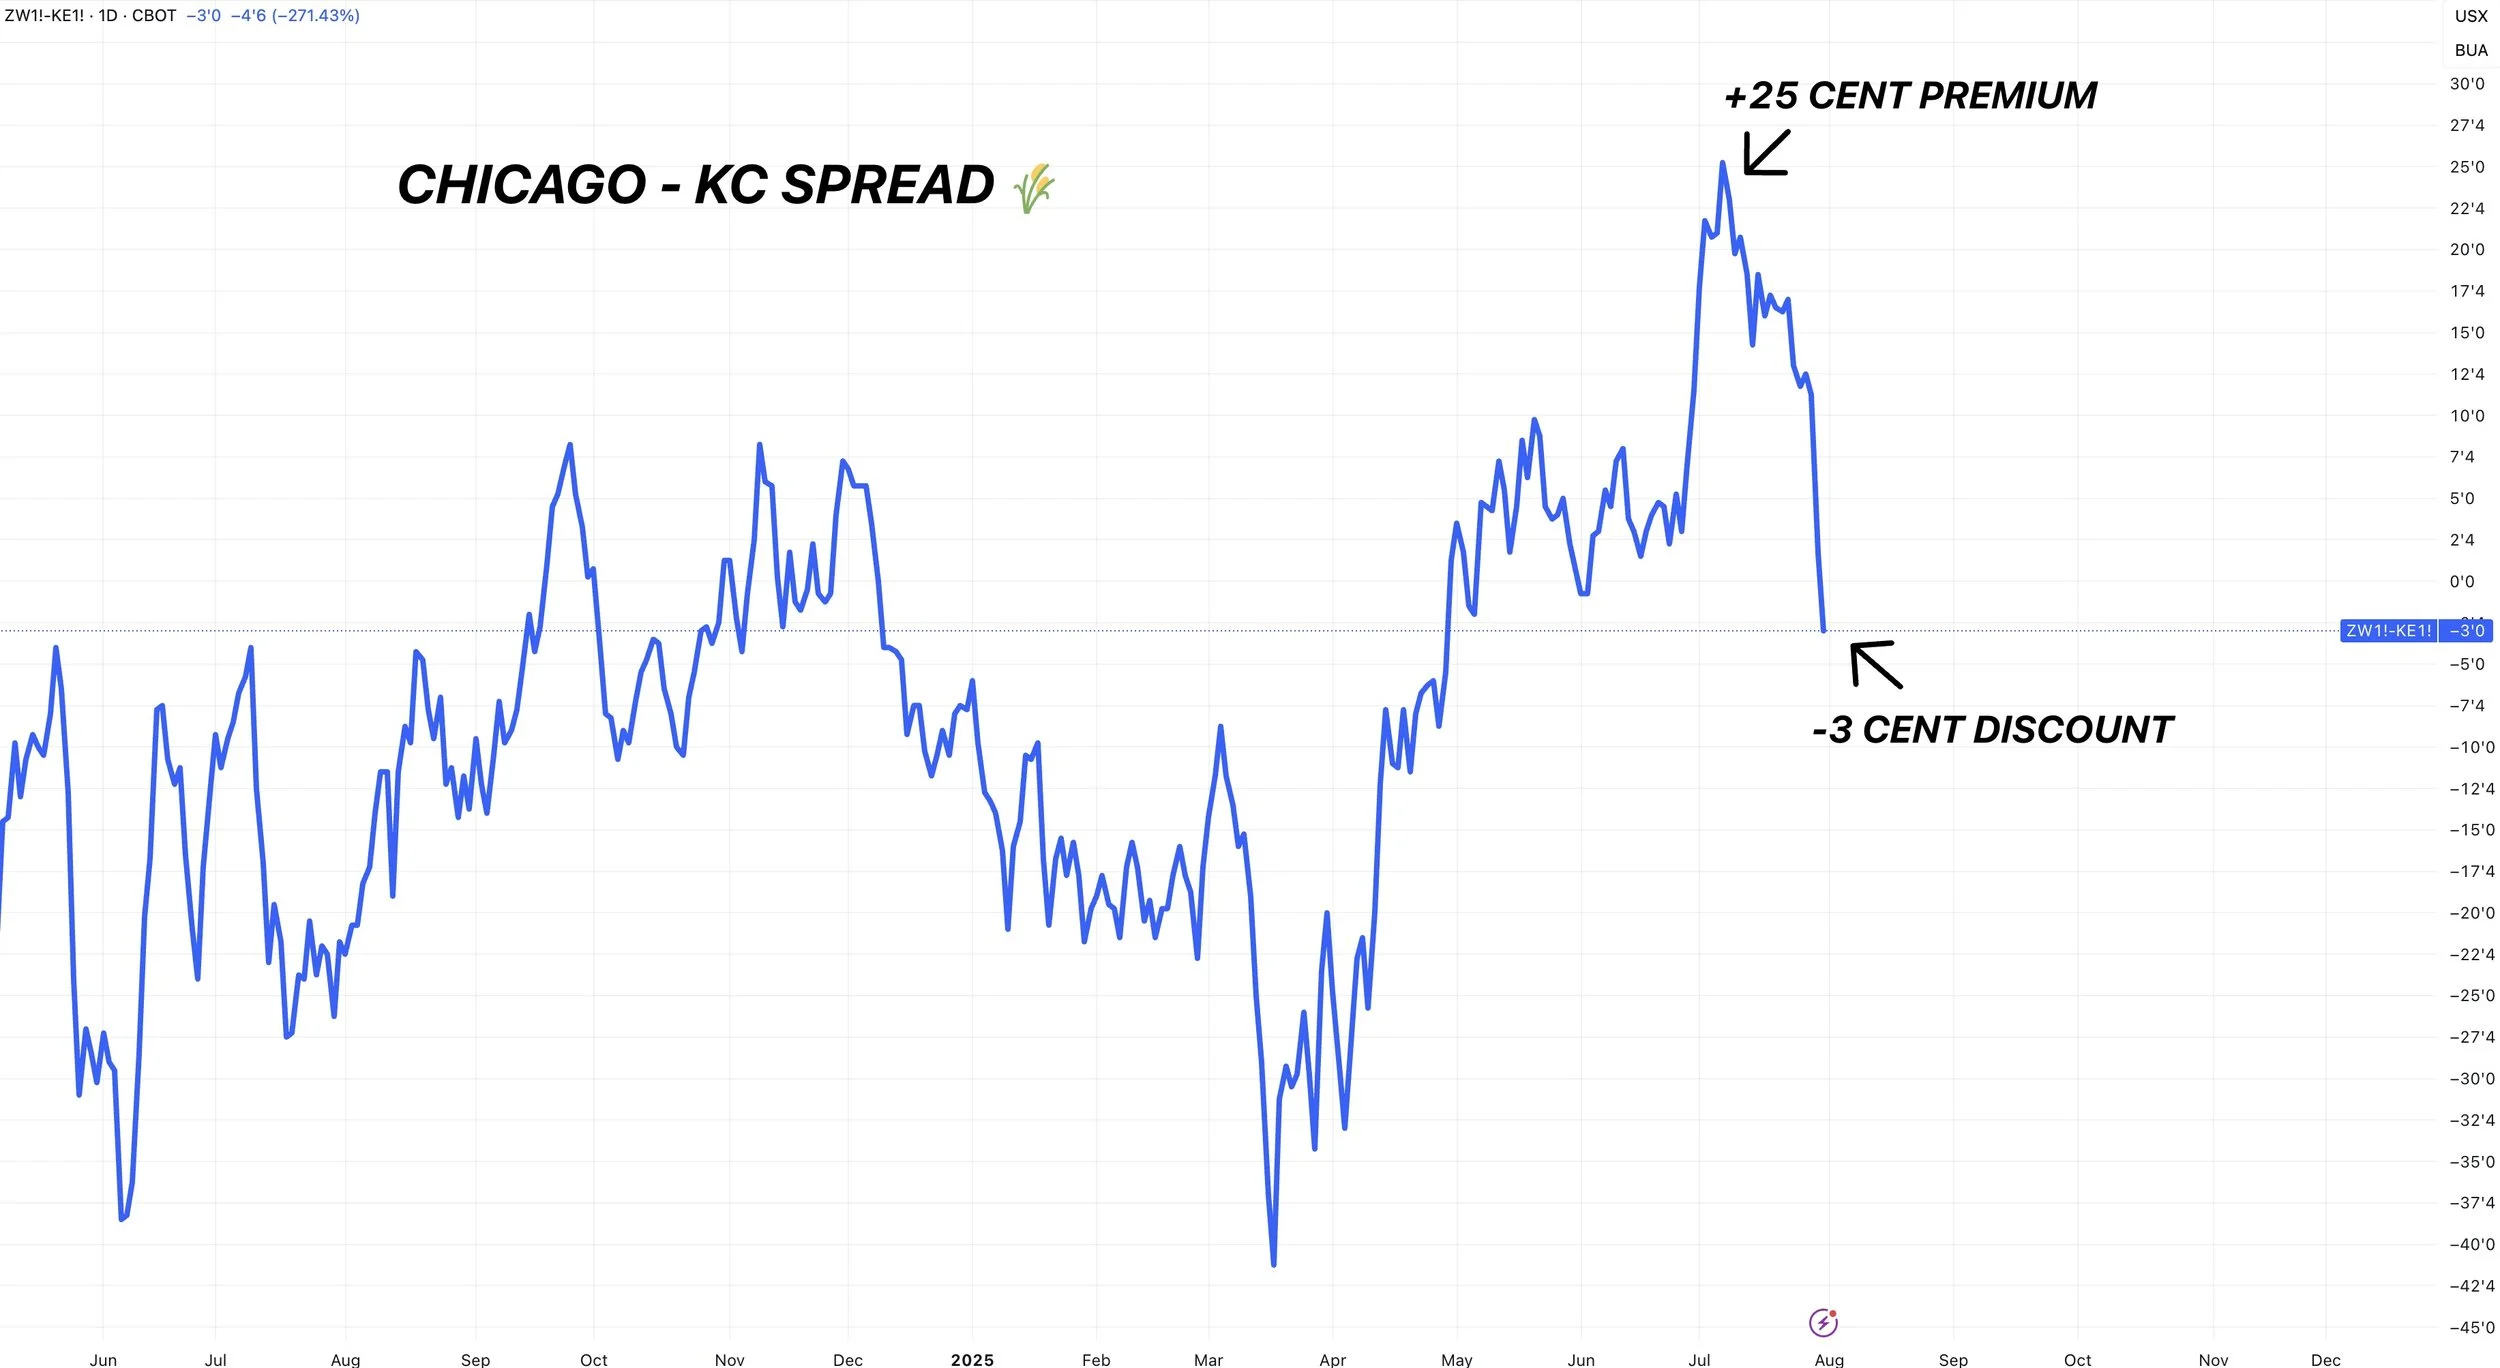
What does this mean? It could be as simple as this is a potential bear trap in Chicago wheat.
Chicago wheat was at a +25 premium to KC. It is now at a -3 cent discount.
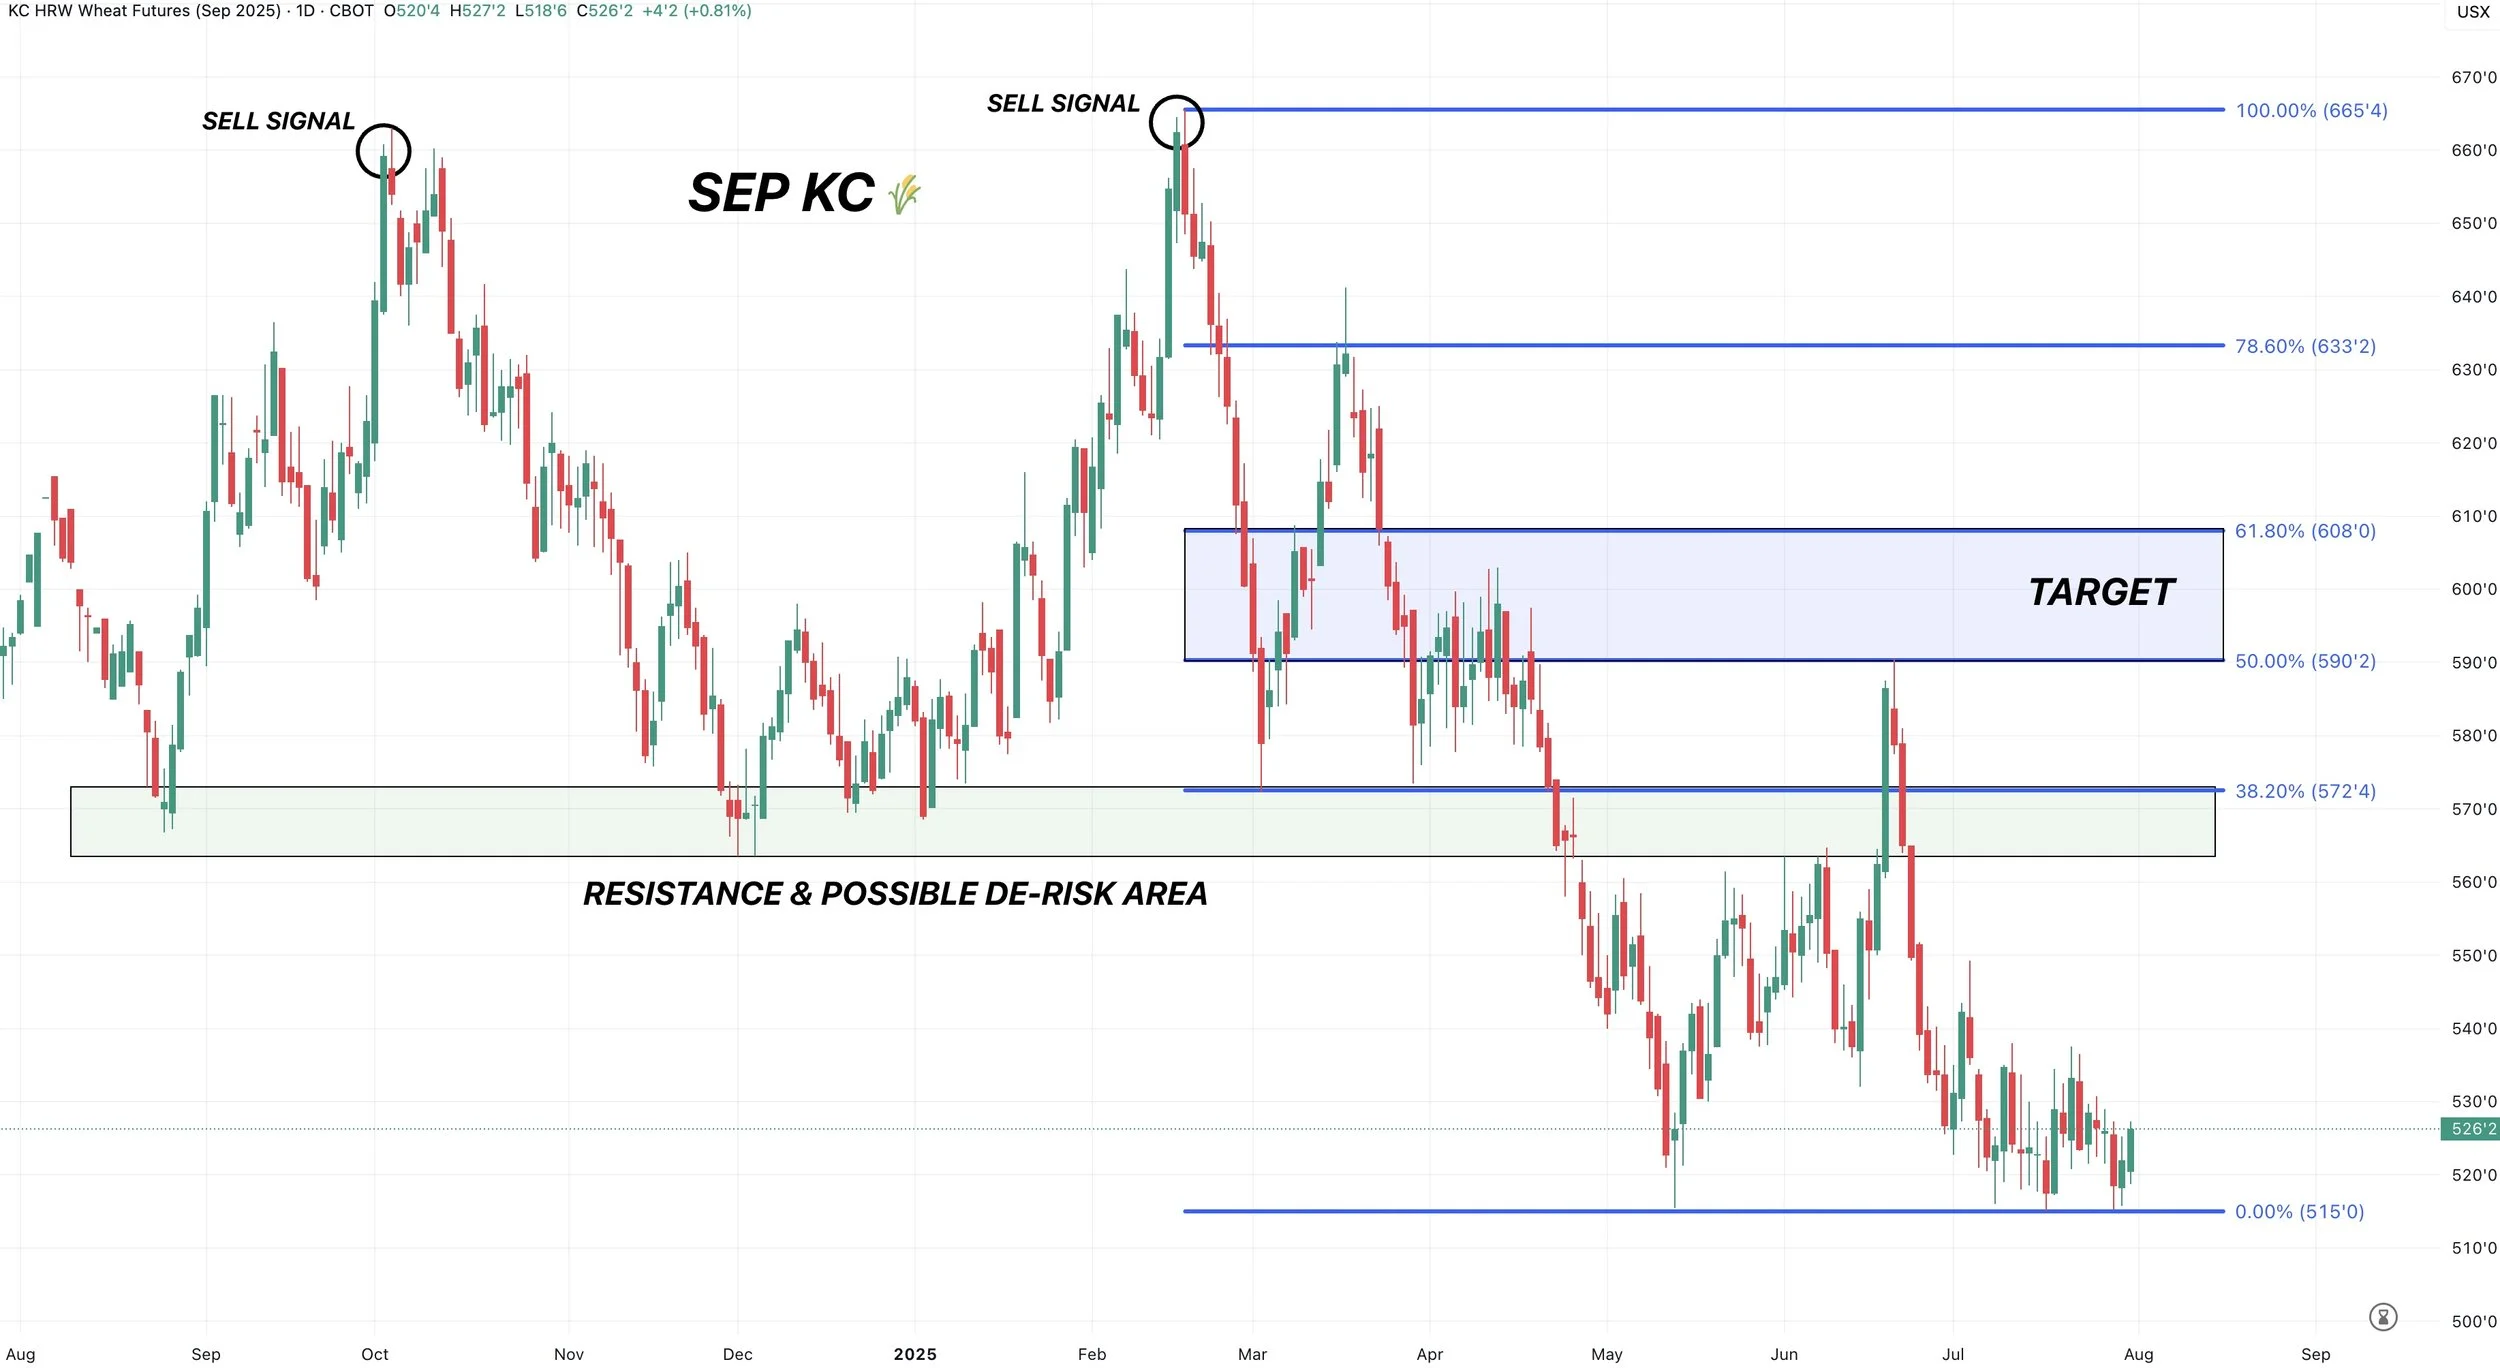
If we look here at KC wheat.
We continue to bounce right off those contract lows. Seems like good support.
Bulls want to hold here.
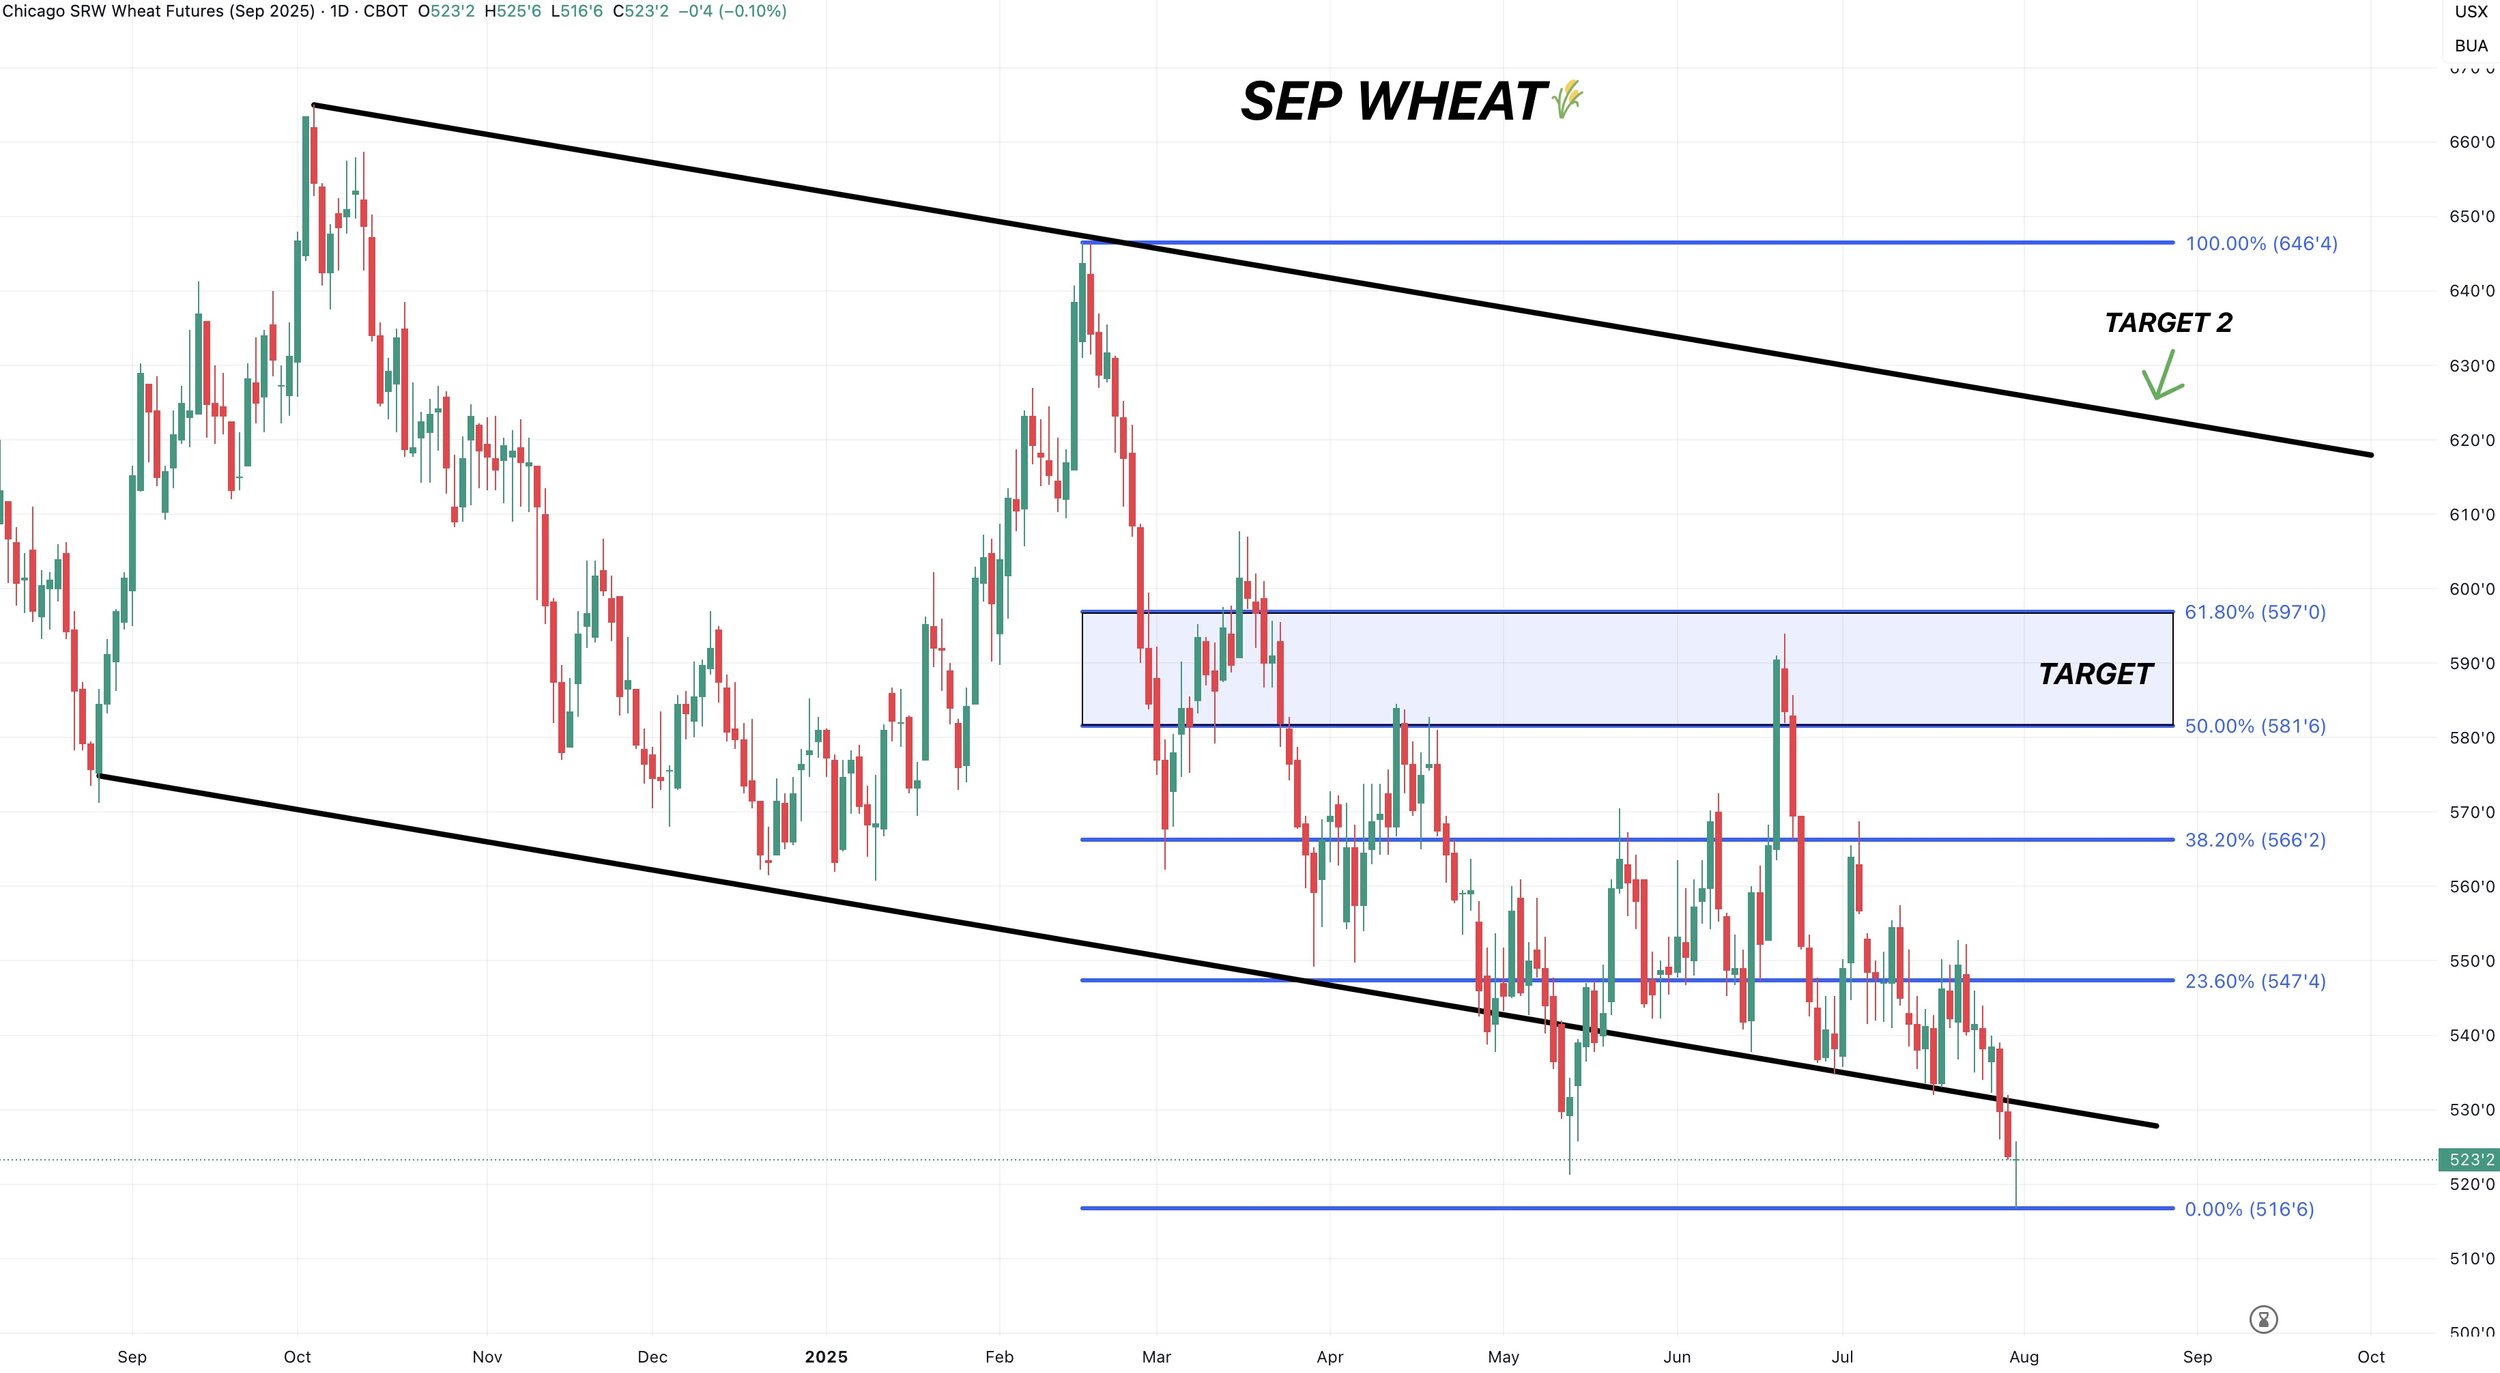
If we look at Chicago wheat, it doesn’t look too pretty.
As we posted new contract lows today.
However, like we mentioned, KC wheat continuing to hold the support has all of the makings for a possible bear trap in Chicago here.
Regardless, I don’t have any interest selling wheat here anyways.
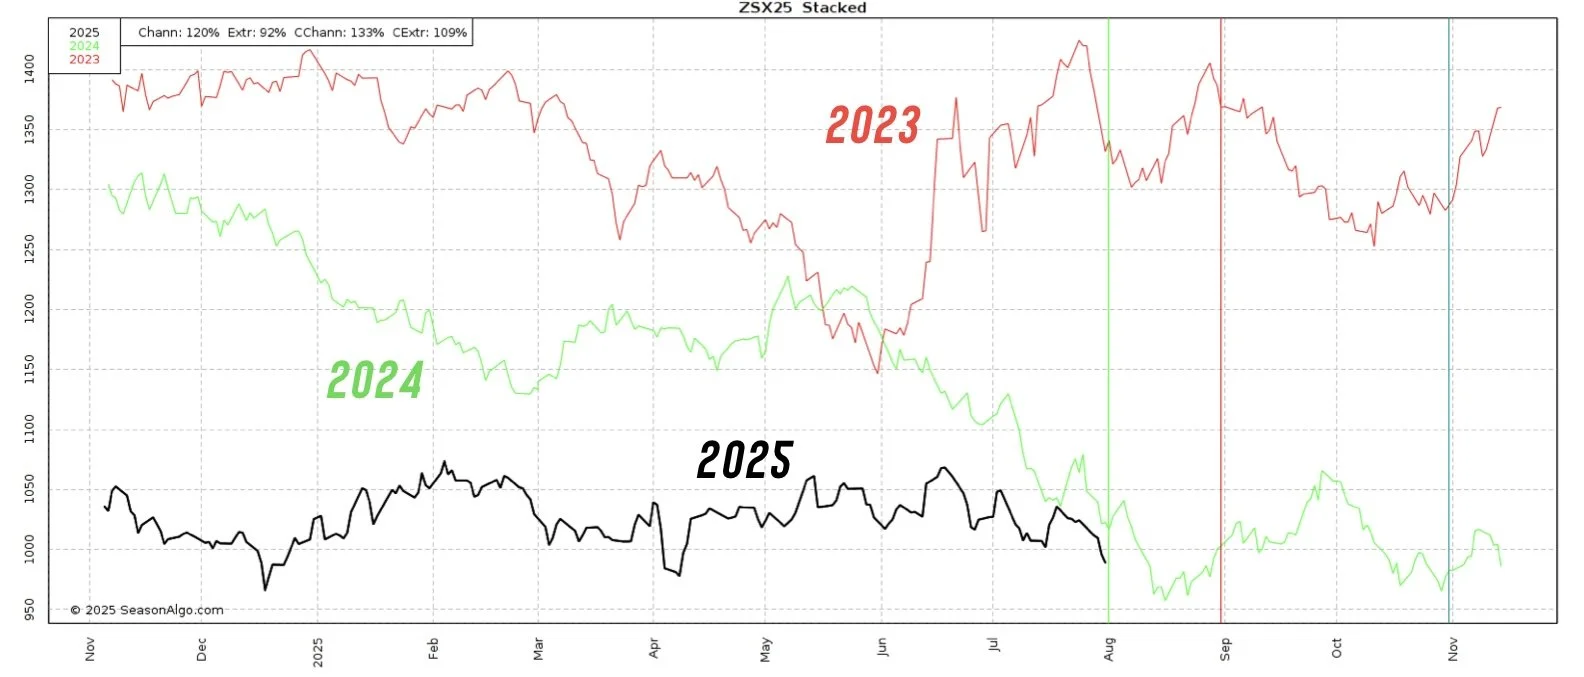
Here is another reason why I think wheat finds a bottom relatively soon.
We are right at this 17-month long support on the continuous contract.
We have bounced here every single time since 2023.

Past Sell or Protection Signals
We recently incorporated these. Here are our past signals.
July 31st: 🐮
Cattle sell signal & hedge alert.
July 10th: 🐮
Cattle sell signal & hedge alert.
CLICK HERE TO VIEW
June 5th: 🐮
Cattle sell signal & hedge alert.
June 2nd: 🌾
MPLS wheat sell signal.
April 10th: 🌽
Old crop corn sell signal.
March 19th: 🐮
Cattle hedge & sell signal.
Feb 18th: 🌽 🌾
Old crop KC wheat & old crop corn signal.
Jan 23rd: 🌽 🌱
Corn & beans old crop sell signal.
CLICK HERE TO VIEW
Jan 15th: 🌽 🌱
Corn & beans hedge alert/sell signal.
Jan 2nd: 🐮
Cattle hedge alert at new all-time highs & target.
Dec 11th: 🌽
Corn sell signal at $4.51 200-day MA
CLICK HERE TO VIEW
Oct 2nd: 🌾
Wheat sell signal at $6.12 target
Sep 30th: 🌽
Corn protection signal at $4.23-26
Sep 27th: 🌱
Soybean sell & protection signal at $10.65
Sep 13th: 🌾
Wheat sell signal at $5.98
May 22nd: 🌾
Wheat sell signal when wheat traded +$7.00
Want to Talk?
Our phones are open 24/7 for you guys if you ever need anything or want to discuss your operation.
Hedge Account
Interested in a hedge account? Use the link below to set up an account or shoot Jeremey a call at (605)295-3100.
Check Out Past Updates
7/31/25
CATTLE HEDGE ALERT & SELL SIGNAL
7/30/25
ANY HOPE LEFT FOR GRAINS?
7/29/25
SEASONAL STRUGGLE CONTINUES
7/28/25
EXTREME BEARISHNESS PRICED INTO GRAINS. CATTLE WARNING SIGNS
7/25/25
NO REASON TO RALLY. NO REASON TO COLLAPSE
7/24/25
CORN DEMAND OVERSTATED? CATTLE CLOSE TO TOP?
7/23/25
JAPAN DEAL NOT ENOUGH
7/22/25
CROP RATINGS MATTER?
7/21/25
RAIN MAKES GRAIN
7/18/25
OVERNIGHT HEAT & ROOM FOR ERROR
7/17/25
POOR CORN EXPORTS MATTER? REWARD BEAN BOUNCE?
7/16/25
ARE CORN & BEANS UNDERVALUED OR NOT?
7/15/25
NEGATIVE NEWS POSITIVE ACTION IN GRAINS
7/14/25
DON’T GIVE GRAIN AWAY
7/11/25
USDA FRIENDLY CORN. MARKET DOESN’T CARE
7/10/25
JULY USDA OUT TOMORROW
7/10/25
CATTLE HEDGE ALERT & SELL SIGNAL
7/9/25
MARKET SEES RECORD CROPS
7/8/25
MONSTER CORN YIELD..?
7/7/25
TRUMP PUMP & DUMP
7/3/25
CORN & BEANS REJECT KEY SPOT. TRUMP SPEAKS IN IOWA
7/2/25
TRADE DEALS? BEANS RALLY AT GOLDEN ZONE
7/1/25
NOW WHAT FOR GRAINS?
6/30/25
BORING USDA. DIDN’T SAY HAVE TO GO LOWER
6/30/25
USDA NUMBERS
6/27/25
ALL EYES ON MONDAY
6/26/25
FIREWORKS OR BLOOD BATH MONDAY?
6/25/25
GRAINS COLLAPSING AHEAD OF JUNE REPORT
6/24/25
CORN CONTINUES SELL OFF. MAJOR USDA REPORT COMING
6/23/25
CORN CAN GO LOWER, BUT NOT FOR FOREVER
6/20/25
WHO SHOULD REWARD THE WHEAT & SOYBEAN RALLY?
6/18/25
COMPLETE CHART BREAKDOWNS
6/17/25
SOYBEANS CONTINUE BREAKOUT. NEARING SELL SIGNAL
6/16/25
CORN HAMMERED. EPA GAME CHANGER IN BEANS?
6/13/25
SOYBEANS RALLY, CHARTS, BALANCE SHEETS & MORE
6/12/25
USDA NON-EVENT. WHAT’S NEXT?
6/11/25
DIVERGENCE & SEASONAL SELL OFF?
6/10/25
BEING PATIENT VS BALANCING YOUR RISK
6/9/25
WHAT IF WE DON’T GET A WEATHER SCARE?
6/5/25
CORN & BEANS HOLDING CRUCIAL SPOTS
6/5/25
CATTLE SELL SIGNAL & HEDGE ALERT
6/4/25
HOW UNKNOWNS IMPACT MARKETING DECISIONS
6/3/25
KEY SPOTS ON THE CHARTS FOR CORN & BEANS
6/2/25
NEW LOWS IN CORN. DE-RISKING MPLS WHEAT
6/2/25
SPRING WHEAT SELL SIGNAL
5/30/25
SEASONAL RALLY STILL IN THE CARDS?
5/29/25
WHAT IS YOUR PLAN IF WE DO NOT RALLY?
5/28/25
ZERO PREMIUM IN THE GRAIN MARKETS
5/27/25
CORN CONDITIONS DISAPPOINT & JUNE OUTLOOK IMPROVES
5/23/25
TARIFFS SPOOK MARKET. GAME PLAN MOVING FORWARD
5/22/25
CHART BREAKDOWNS & TARGETS
5/21/25
RISK TO THE UPSIDE WITH WEATHER?
5/20/25
WHEAT SHORT COVERING & HISTORY OF YIELD CHANGES
5/19/25
ANYONE LEFT TO SELL WHEAT? 181 CORN YIELD POSSIBLE?
5/16/25
FUNDS SHORT CORN. MARKETS WAITING ON WEATHER
5/15/25
BEANS HAMMERED ON RUMOR & WHEAT FINDING LIFE
5/14/25
DECISIONS & POSSIBILITIES IN GRAINS
5/13/25
GRAINS RALLY OFF LOWS
5/12/25
USDA REPORT. HOW THIS CHANGES THINGS
5/9/25
BIGGEST RISKS IN USDA REPORT
5/8/25
USDA MONDAY & HISTORY OF WEATHER RALLIES
5/7/25
NEW 2025 LOWS FOR CORN
5/6/25
WHAT’S A SUMMER RALLY LOOK LIKE?
5/5/25
CORN ERASES ENTIRE APRIL RALLY
5/2/25
SELL INTO UNCERTAINTY. NOT KNOWN FACTORS
5/1/25
THE CASE AGAINST A FEB TOP IN CORN
4/30/25
APPROACHING KEY TIME PERIOD FOR GRAINS
4/29/25
PLANTING & FIRST NOTICE DAY PRESSURE. CORN CLOSE TO BOTTOM?
4/28/25
CAPTURING INVERSE & SEASONAL PREPARATION
4/25/25
HOW OFTEN DOES CORN NOT BREAK APRIL HIGHS?
4/24/25
KNOW WHEN TO SELL. BEANS BREAK 200-DAY FIRST TIME IN 483 DAYS
4/23/25
MONEY FLOW & DROUGHT CARDS
4/22/25
CRUCIAL SPOT FOR CORN & BEANS
4/21/25
NO PLANTING THREAT YET
4/18/25
POTENTIAL OPPORTUNITIES, BASIS CONTRACTS & STRATEGIES
4/16/25
HOW YIELD IMPACTS CARRYOUT. MAJOR SPOT FOR SOYBEANS
4/15/25
TOTAL CHART BREAKDOWNS & TARGETS
4/14/25
TECHNICAL SELLING IN GRAINS
4/11/25
SPECIFIC GRAIN MARKETING DECISIONS
4/10/25
USDA REPORT. HOW THIS IMPACTS CORN
4/9/25
TARIFFS GIVE. TARIFFS TAKE
4/8/25
CORN’S DIVERGING STRENGTH
4/7/25
SOLID PRICE ACTION DESPITE OUTSIDE FEAR
4/4/25
CORN PRICE ACTION SPEAKS VOLUME. ANY HOPE LEFT FOR SOYBEANS?
4/3/25
WHAT IS LEFT FOR CORN BEARS? TRADE WAR: CHARTS HOLDING SUPPORT
4/2/25
SHOULD UNKNOWNS KEEP A FLOOR UNDER GRAIN PRICES?
4/1/25
HOW DO ACRES IMPACT FUTURE OF THE GRAINS?
3/31/25
USDA REPORT: NOW WHAT?
3/28/25
ALL EYES ON USDA
3/27/25
PRE-USDA POSITIONING. DON’T GIVE GRAIN AWAY
3/26/25
HISTORY OF MARCH INTENTIONS. SOYBEANS UNDERVALUED?
3/25/25
6 DAYS UNTIL MAJOR USDA REPORT
3/24/25
HOW TO POSITION YOURSELF BEFORE PLANTING
3/21/25
REASONS TO BE OPTIMISTIC IN GRAINS?
3/20/25
WAS THAT THE BOTTOM IN CORN?
3/19/25
THE PATH HIGHER & THE DOWNSIDE RISKS IN GRAINS
3/18/25
SEASONALS, CATTLE HEDGE, CHARTS & DROUGHT?
3/17/25
WHEAT RALLIES. DON’T GET BACKED INTO A CORNER
3/14/25
MARCH 31ST REPORT THOUGHTS & WHAT’S NEXT FOR GRAINS
3/13/25
EXPLAINING RE-OWNERSHIP VS COURAGE CALLS
3/12/25
TARIFF FEARS. EU, CANADA, & ETHANOL
3/11/25
USDA SNOOZE. RECORD FUND SELLING A CONCERN?
3/10/25
USDA TOMORROW. GETTING COMFORTABLE IN MARKETING
3/7/25
HOW TIGHT IS THE WORLD & US SITUATION?
3/6/25
TARIFFS PUSHED BACK. FUTURE OPPORTUNITIES?
3/5/25
IS GRAINS BIGGEST RISK WEAK CRUDE & DEFLATION?
3/4/25
TRADE WAR BEGINS. 8TH DAY OF PAIN FOR GRAINS
3/3/25
TARIFFS ON TOMORROW. BUY SIGNAL
3/3/25
BUY SIGNAL
2/28/25
WHEN WILL THE BLEEDING STOP?
2/27/25
CORN AT CRITICAL SPOT. USDA ACRE REPORT. WAY TOO EARLY DROUGHT TALK
2/26/25
HISTORY SUGGESTS CORN TOP ISN’T IN? ACRE OUTLOOK TOMORROW
2/25/25
POSITIVE CLOSE. WHAT TO KNOW ABOUT USDA OUTLOOK
2/24/25
USDA OUTLOOK, FIRST NOTICE DAY & BRAZIL
2/21/25
WHAT TO EXPECT MOVING FORWARD IN GRAINS
2/20/25
FIRST NOTICE DAY CONCERNS. MASSIVE CORN ACRES OR NOT?
2/19/25
HOW TIGHT IS THE CORN SITUATION?
2/18/25
MORE DETAILS ON TODAYS SELL SIGNAL
2/18/25
OLD CROP KC WHEAT & CORN SELL SIGNAL
2/14/25
WHEAT BREAKING OUT ON WEATHER RISK. TECHNICALS & FUNDAMENTALS
2/12/25
GLOBAL GRAIN SITUATION, ACRE TALK, CHARTS & MORE
2/11/25
USDA: NOT A BEARISH REPORT. DISAPPOINTING PRICE ACTION
2/10/25
USDA TOMORROW. LONG TERM PATH FOR SUB 10% CORN STOCKS TO USE?
2/7/25
WHY WOULD THE FUNDS EXIT THEIR LONGS?
2/6/25
WHEAT FINALLY CATCHING A BID
2/5/25
COMPLETE THOUGHTS ON MARKETS: BACK & FORTH DISCUSSION
2/4/25
STRONG JANUARY LEAD TO STRONG YEAR? TARIFFS, CHARTS & MORE
2/3/25
TARIFFS PUSHED BACK
1/31/25
TARIFF NEWS ALL OVER THE PLACE. ARE YOU PREPARED FOR POSSIBILITIES?
1/30/25
WHEAT BULL ARGUMENT. TRUMP ADDS TARIFFS
1/29/25
CORN APPROACHES $5.00
1/28/25
TARIFFS, CORN FUNDS, SOUTH AMERICA & MORE
1/27/25
HEALTHY CORRECTION WE TALKED ABOUT & TARIFF NEWS
1/24/25
GRAINS DUE FOR SHORT TERM CORRECTION?
1/23/25
OUR ENTIRE NEW CROP SALES THOUGHTS & OLD CROP SELL SIGNAL
1/22/25
GRAINS TAKE A BREATHER. IS CORN IN A BULL OR BEAR MARKET?
1/21/25
HUGE DAY IN GRAINS. WHAT TO DO WITH OLD CROP VS NEW CROP
Read More
1/20/25
VIDEO CHART UPDATE
1/17/25
TRUMP, CHINA, ARGY & USING THE SPREADS INVERSE
1/16/25
OLD CROP LEADS US LOWER. MARKETING THOUGHTS
1/15/25
SIGNAL & HEDGE ALERT QUESTIONS EXPLAINED. IS $6 CORN EVEN POSSIBLE?
1/14/25
MORE DETAILS ON TODAYS HEDGE ALERT & SELL SIGNAL
1/14/25
CORN & SOYBEANS HEDGE ALERT/SELL SIGNAL
1/13/25
USDA GAME CHANGER OR NOT?
1/10/25
BULLISH USDA FOR CORN & BEANS
1/9/25
USDA OUT TOMORROW
1/8/25
2 DAYS UNTIL USDA. BE PREPARED
1/7/25
THE HISTORY OF THE JAN USDA & MORE
1/6/25
MAJOR USDA REPORT FRIDAY
Read More
1/3/25
UGLY DAY ACROSS THE GRAINS
1/2/25