
NOW WHAT FOR GRAINS?
MARKET UPDATE
You can scroll to read the usual update as well. As the written version is the exact same as the video.
Timestamps for video:
Overview: 0:00min
Corn: 2:10min
Beans: 10:25min
Wheat: 13:10min
Want to talk about your situation?
(605)295-3100
Your Free Trial Has Ended
Make sure you subscribe if you would like to keep getting every daily update
You will not get our next sell signal
Our 4th of July sale ends in 4 days
Futures Prices Close
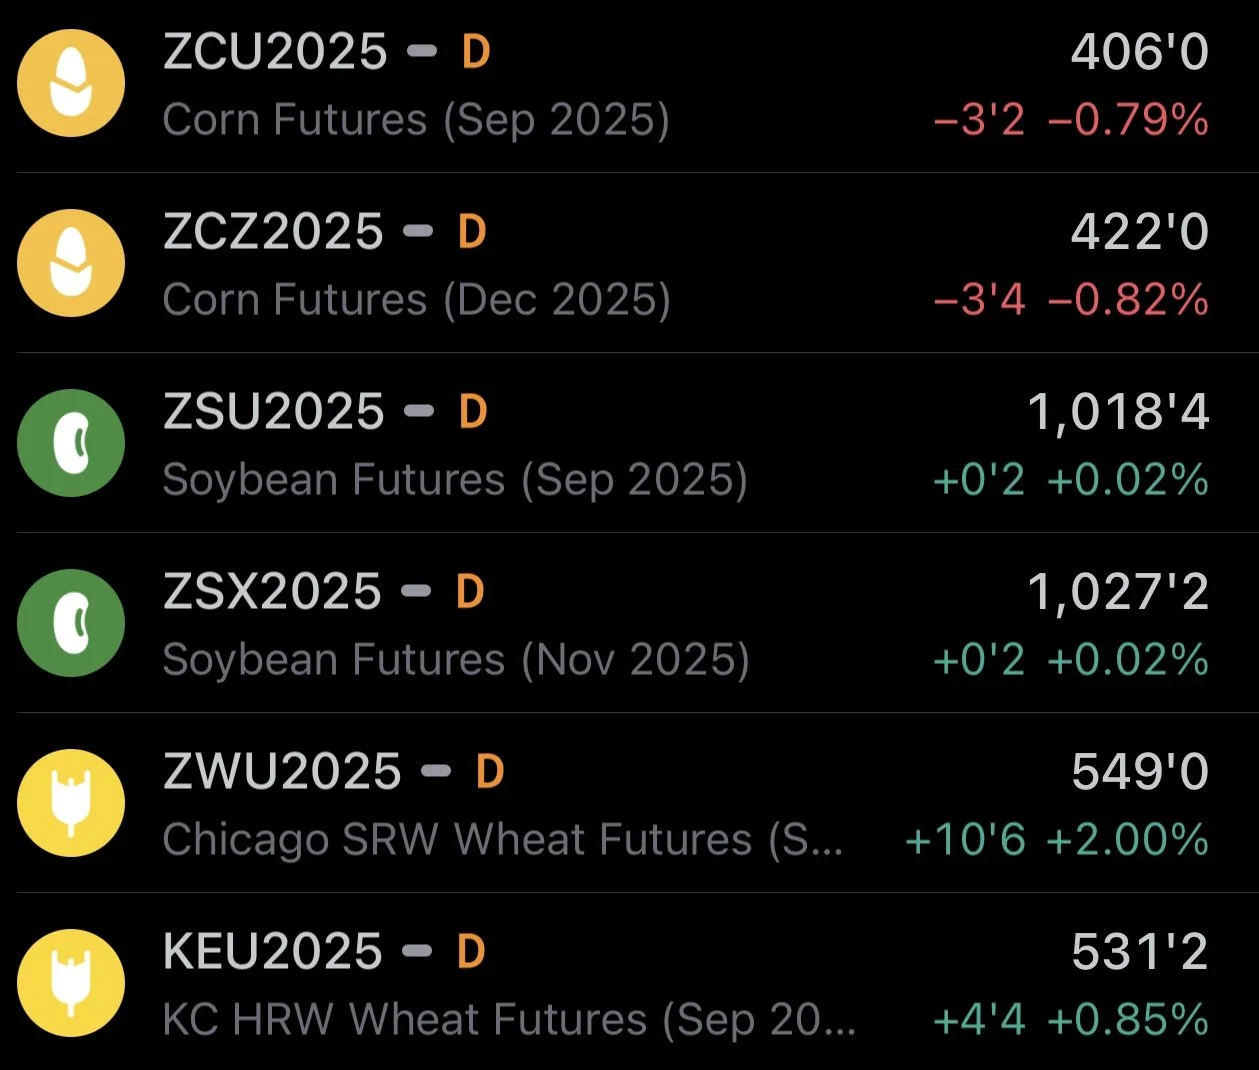
Overview
Grains mixed with corn lower once again, beans unchanged, and the wheat market higher.
Despite the weak action we did see corn bounce +6 and beans +13 off the overnight lows. So decent price action all things considered.
Why was corn lower today if yesterday’s USDA report was neutral?
Yes, there was plenty of fear that the USDA would show 97 million acres of corn or a bunch of extra bushels. But they didn’t. Yet corn traded lower again today. Why?
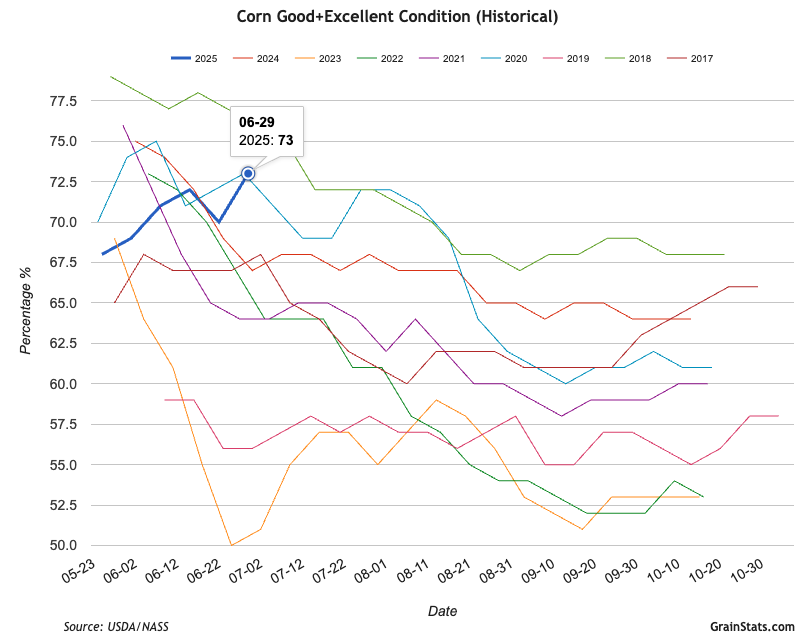
Simple Answer: Crop Conditions
Yesterday corn ratings jumped +3% G/E to 73%.
This is the highest since 2020 and the 3rd best in a decade.
Onlly 4% of this crop rated poor.
Iowa corn is rated 85% G/E (far ahead of 72% 5-yr avg)
Up to this point weather has been ideal. Conditions are great. The market is expecting a perfect crop. Thus, we go lower.
Lower prices today had nothing to do with the report.
Soybean and wheat crop conditions were a non-event.
Chart from GrainStats
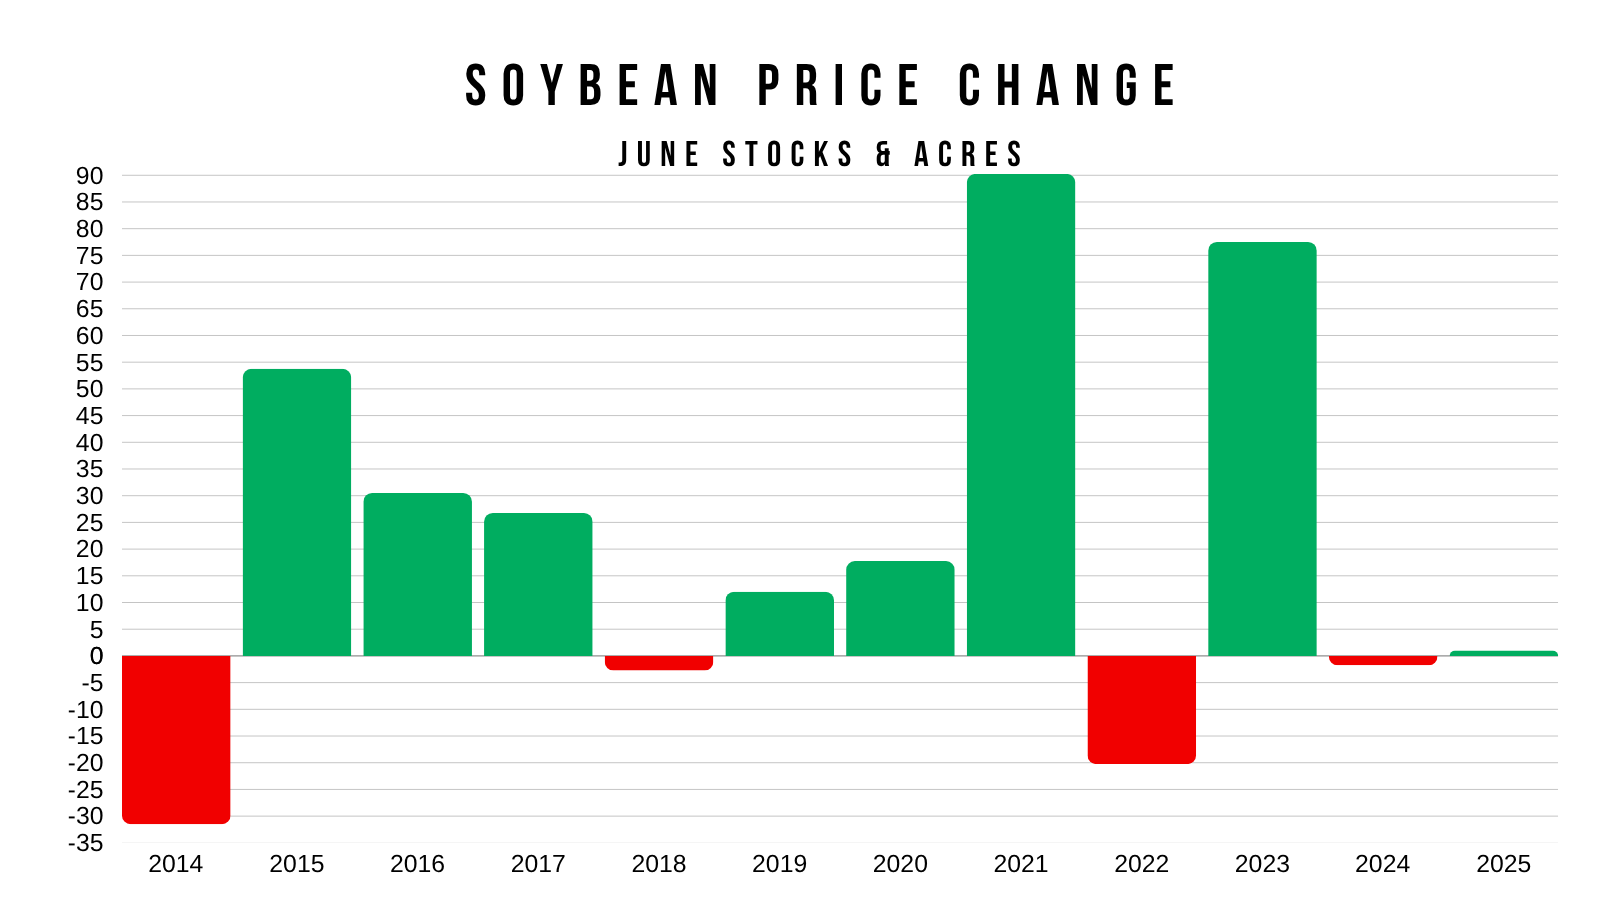
How boring of a report was yesterday?
This report was statistically one of the most boring reports of all time for June stocks and acres.
Average Price Moves for this Report:
Corn: +/- 20 cents
Beans: +/- 33 cents
Wheat: +/- 20 cents
Yesterday's Price Action:
Corn: -2 cents
Beans: +1 cent
Wheat: -2 1/2 cents
This is the first time in over a decade the corn market had less than a 5 cent move.
This was the 3rd time soybeans had less than a 10 cent move.
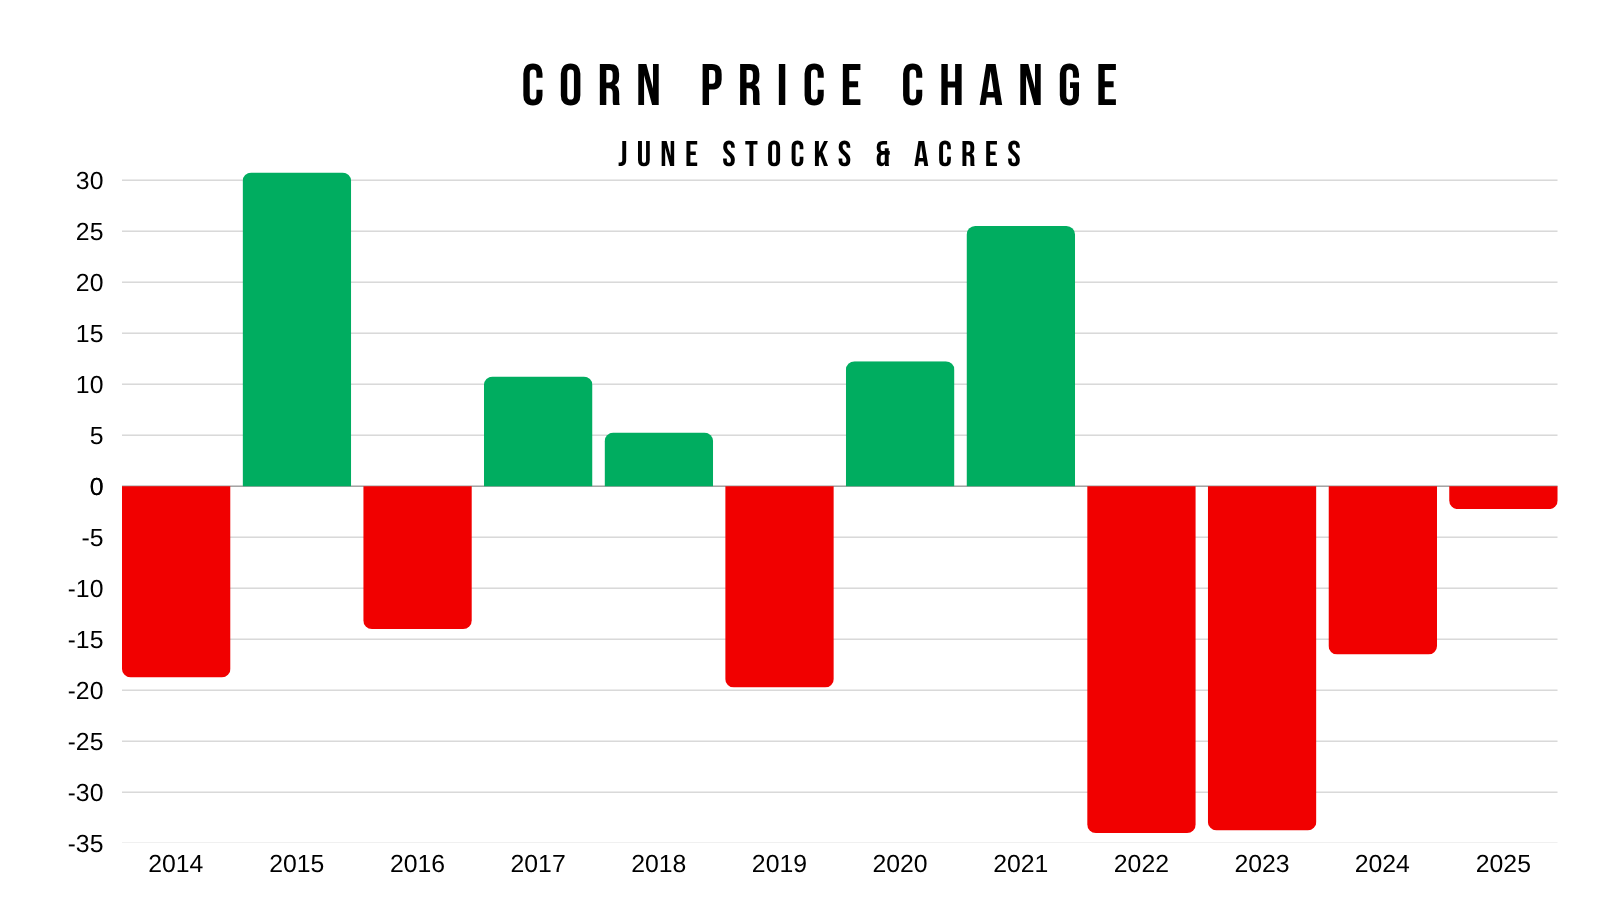
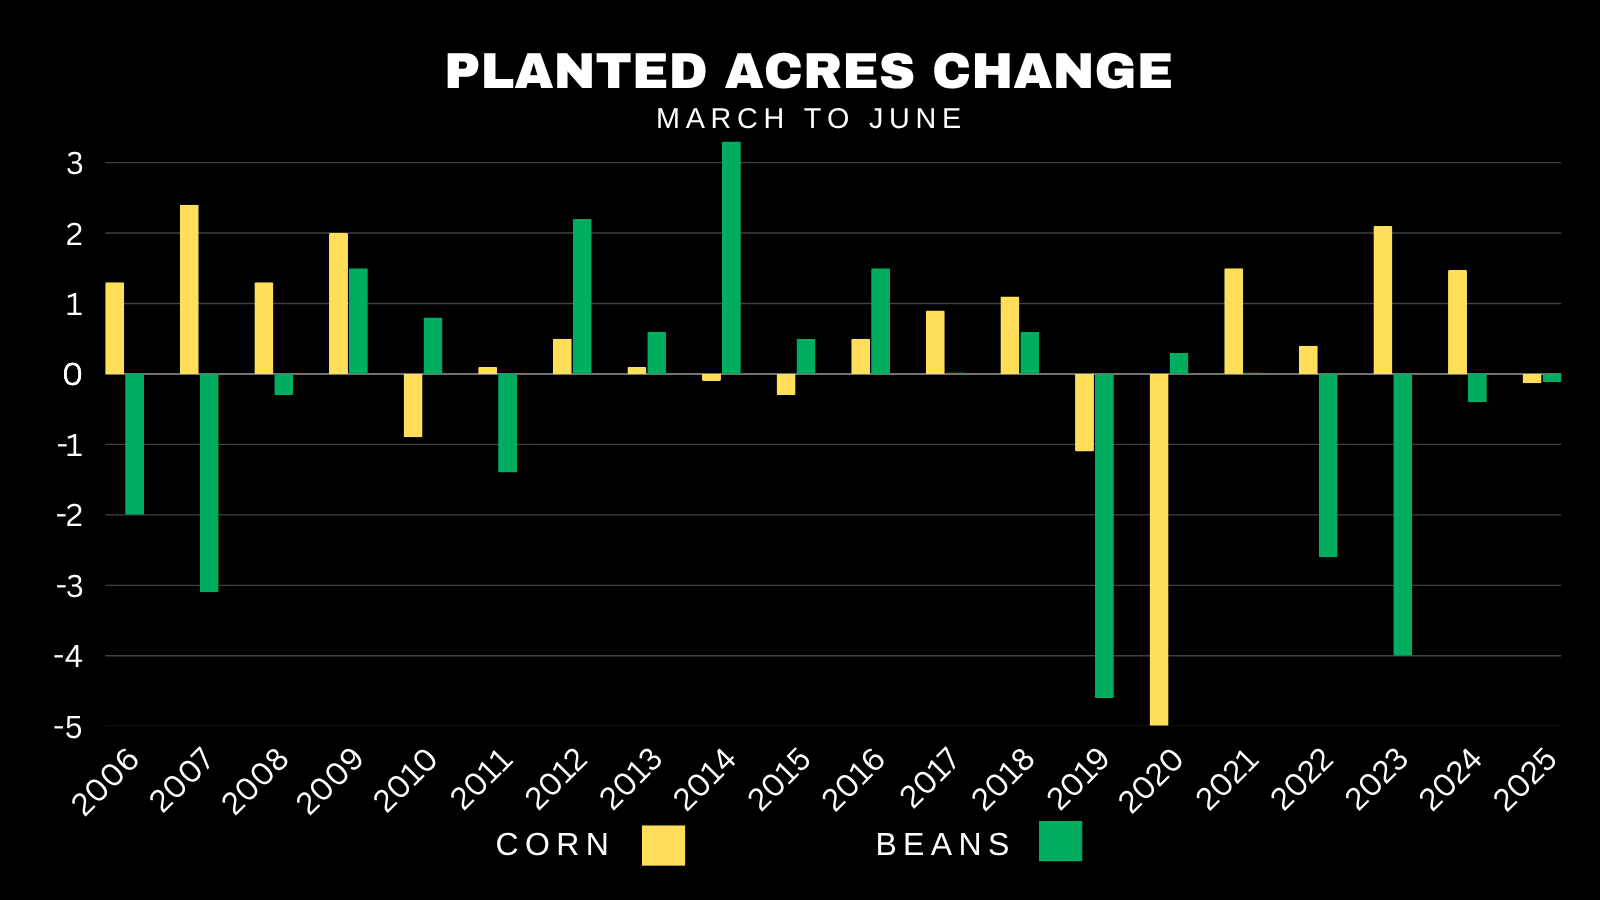
We did not see big changes in acres.
We had the smallest acre change in corn since 2014.
The smallest in beans since 2021.
But for the first time since 2019 both corn & bean acres fell from the March intentions to the June report. Which is just the 2nd time it has ever happened.
Corn Funds & Interest Rates
Altough non threatening weather has been a driver on this corn sell off, some think that the funds continue to pound this market due to interest rates.
Why is this?
High interest rates means it costs more to store corn. It makes borrowing more costly, and encourages big money to bet against corn.
We saw this exact same scenario pan out last year.
The funds were big sellers until interest rates were lowered.
The Feds cut rates in Sep, Nov, and Dec. Meanwhile the corn market rallied as the funds starting getting long.
Perhaps we see this happen again this year. The funds continue to sell until the feds lower rates.
The next meeting where the feds can do this is July 30th, then Sep 17th.
Maybe the funds short trade isn’t about carryout at all.. if it was.. corn should be higher. Maybe it's about interest rates.
Here is a chart of the feds rate decisions since 2020 overlayed on top of corn prices.
Rate hikes marked the bull market highs start of the bear market.
Rate cuts last fall marked the lows.

Todays Main Takeaways
Corn
Fundamentals:
We sold off extremely hard going into this report.
Most expected a big uptick in acres. Acres actually slightly fell.
Most expected the USDA to find a bunch of extra bushels on the stocks to explain why July corn has completely collapsed despite having one of the tightest balance sheets of all time. That didn’t happen, as stocks came in exactly as expected.
Now on one hand you could argue that the funds didn’t get that extra reason to continue selling. As it was a sign of relief that this report wasn’t bearish like most thought it'd be.
So we debunked those fear rumors.
On the other, you could argue the funds still don’t have a reason to buy. Not unless weather scares them into doing so.
This report really changed nothing aside from remove that bearish surprise.
The forecasts for the next week are dry. But that's not enough.
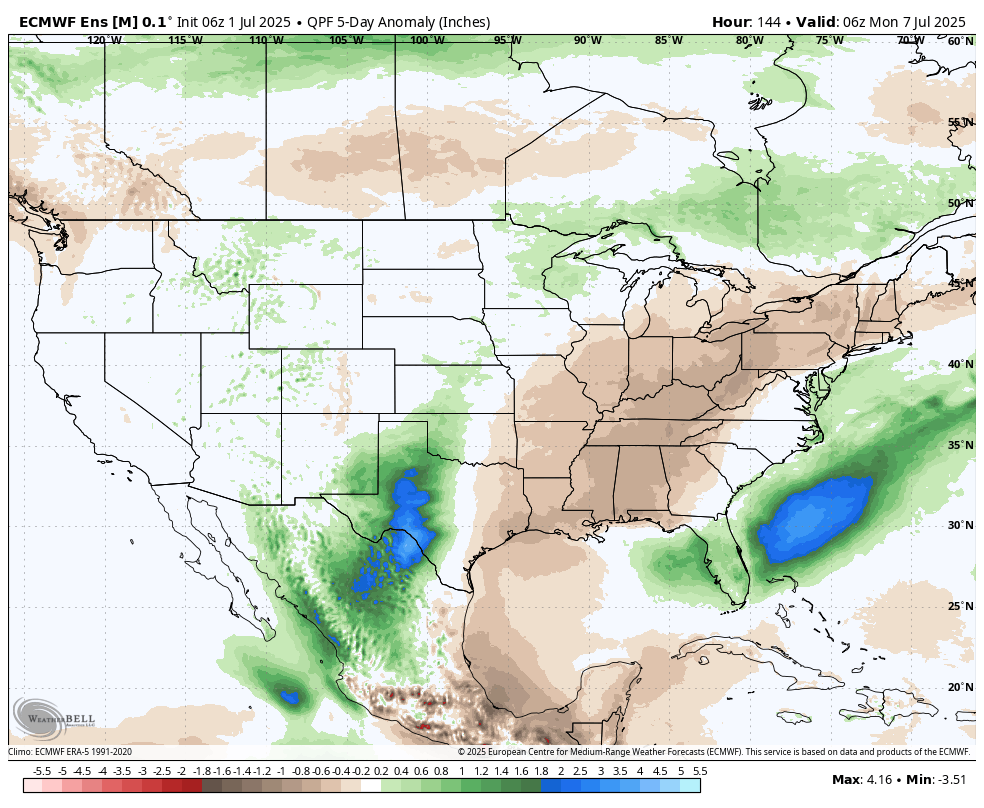
The next 30 days are in the air. The Euro calls for dry. The GFS calls for wet.
If the Euro is right, maybe we still some sort of weather scare opportunity.
If the GFS is right, maybe we don’t.
Regardless, these long term forecasts have been awful at being accurate anyways.
30-Day Euro
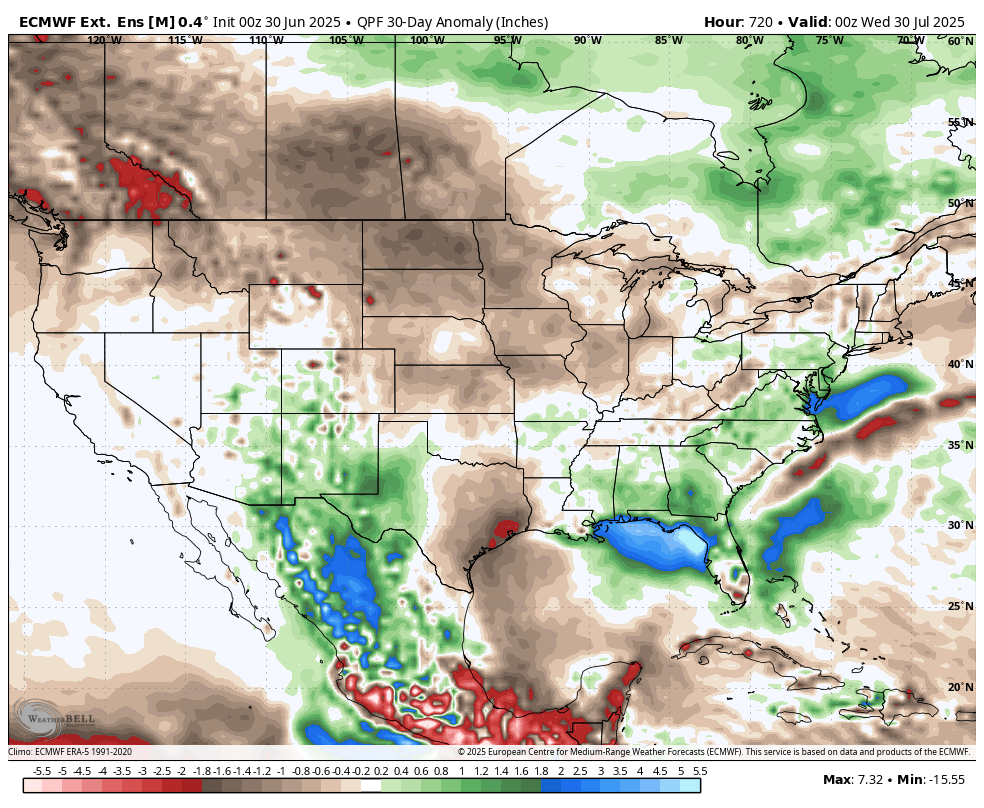
30-Day GFS

The weather is all that matters. So far, it has been pretty ideal. There is zero threats to production. As a result, the funds continue to sell this thing.
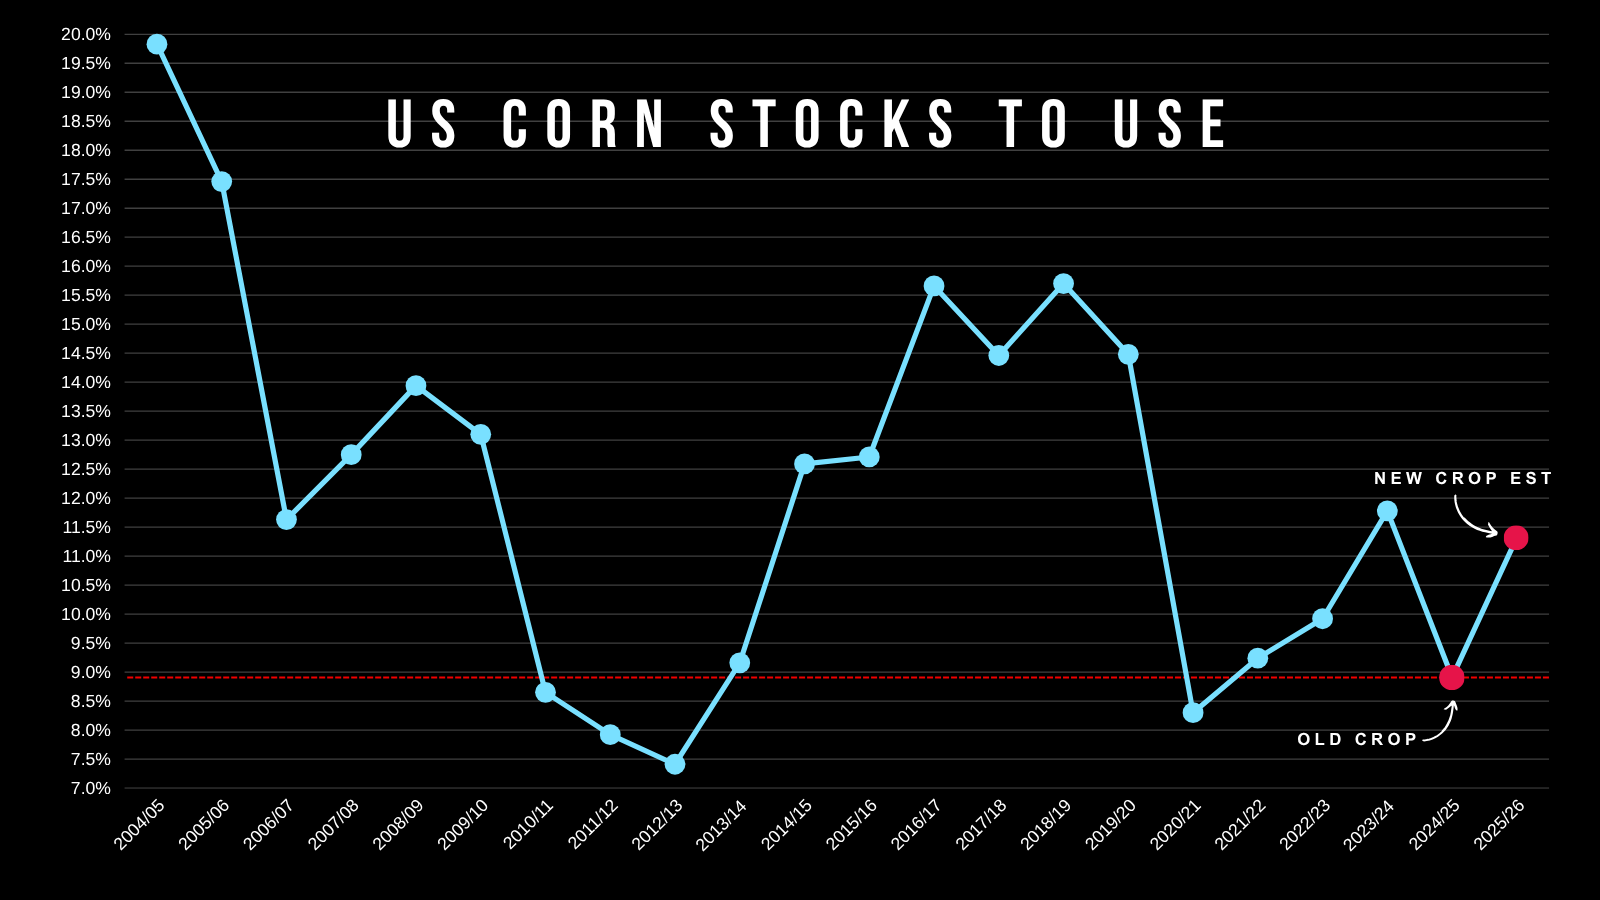
Our stocks to use ratio for corn is below 9%. Last time this happened we saw $7 corn.
But the market doesn’t care. It thinks we have a record crop on the way. And unless we see a production scare, the market is going to continue to think that.
The market's attitude is "we have a trendline yield until proven wrong".
Although old crop is one of the tightest ever, new crop isn’t exactly ultra bullish.
If weather remains favorable, we will continue lower until harvest. It is that simple.
But all it would take for a 20-40 cent opportunity in this market is 1-2 weeks of dry weather where traders start plugging in the yield numbers into their balance sheets.
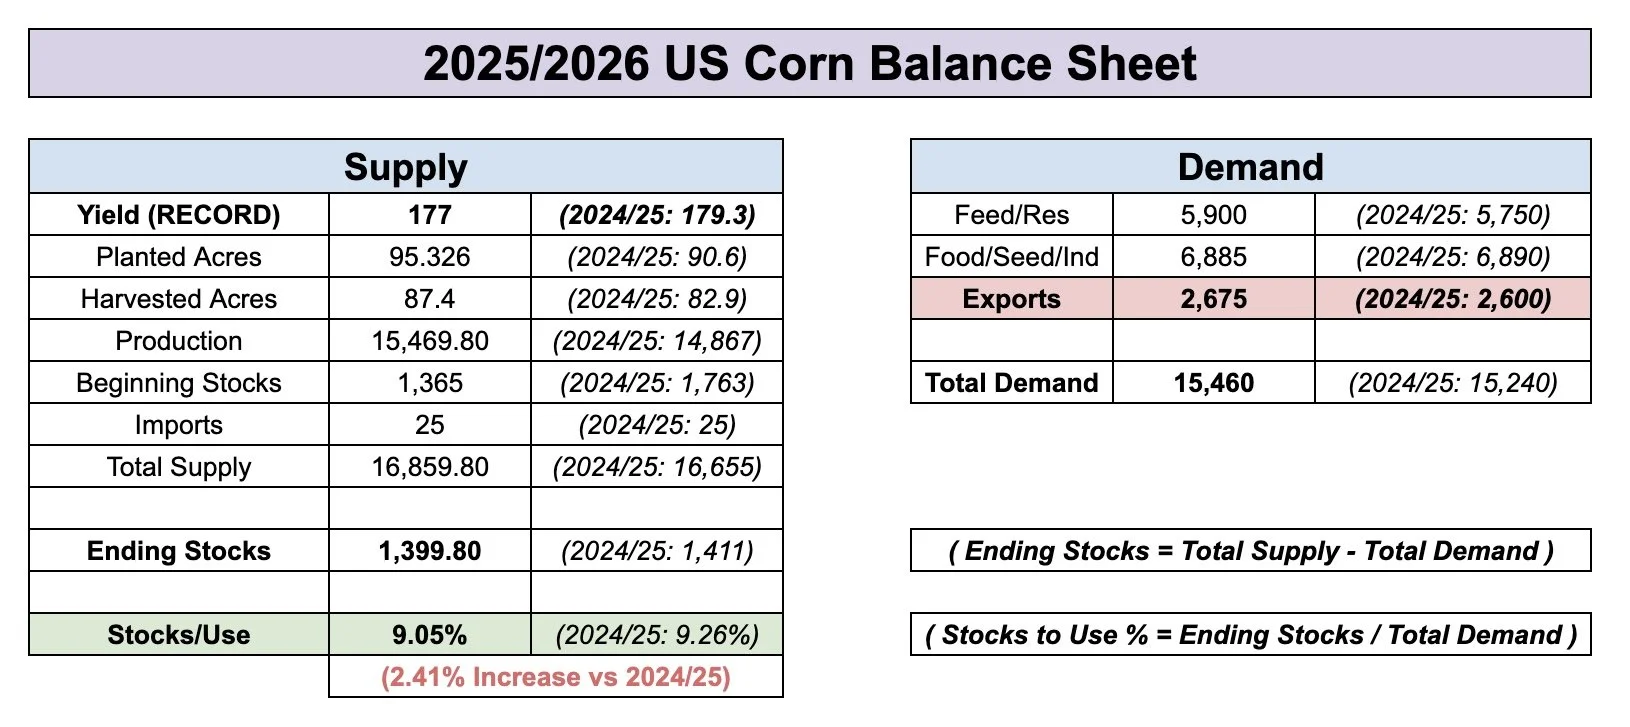
Because if you plug a 177 yield into the balance sheet without changing the demand numbers, it spits out a 1.4 billion bu carryout and 9% stocks to use ratio for new crop corn. Which would be bullish.
I am not predicting a 177 yield. I am just showing you how it changes the balance sheet and why it wouldn’t take much for a small rally IF it dried out for a few weeks.
New Crop - 177 Yield
New Crop - 181 Yield
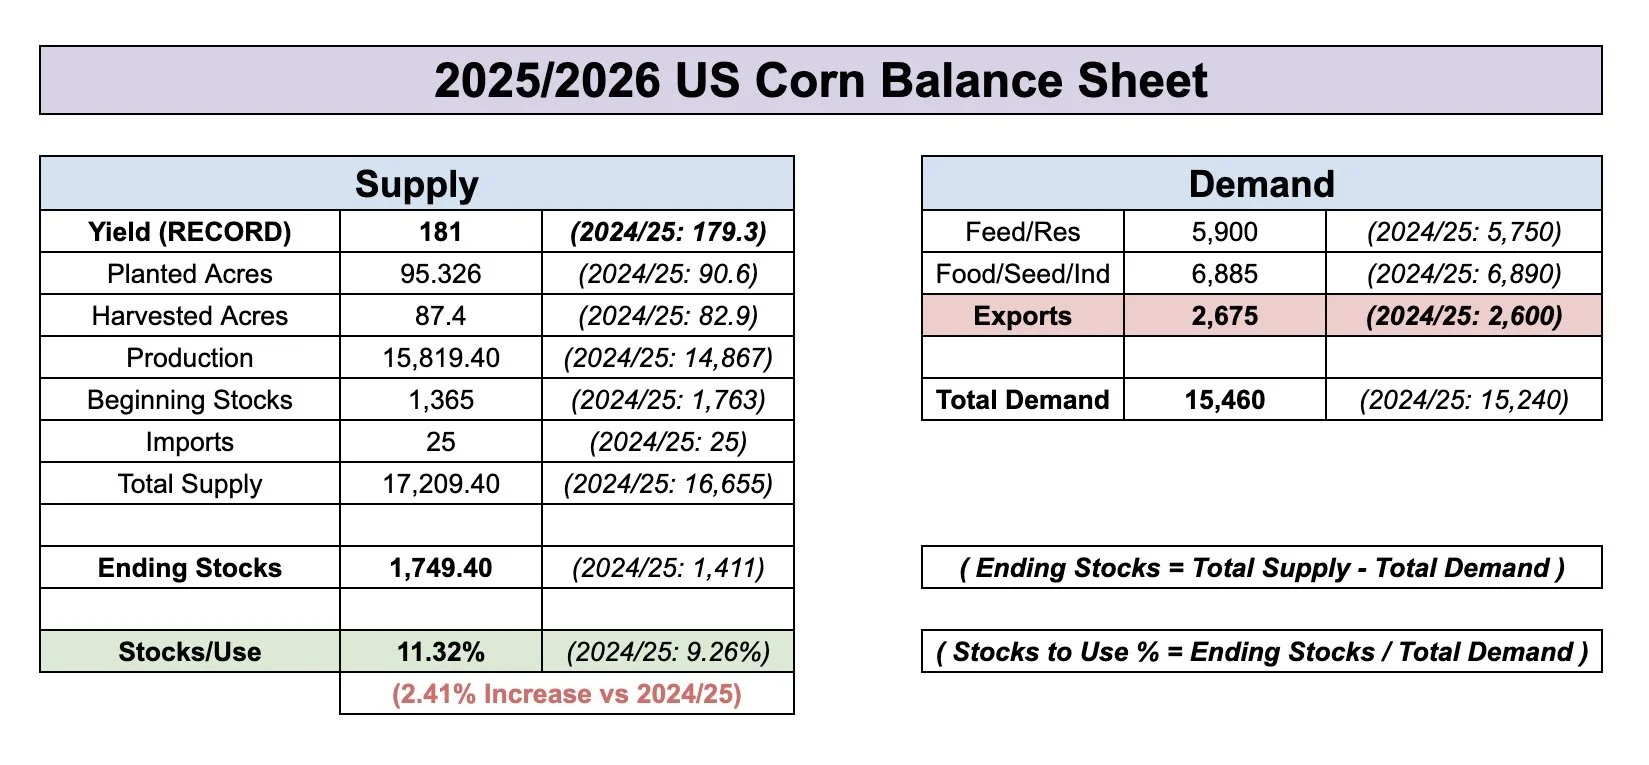
181 yield doesn’t seem probable, but it is possible.
However, we haven’t seen final yield come in higher than the starting May yield since 2018.

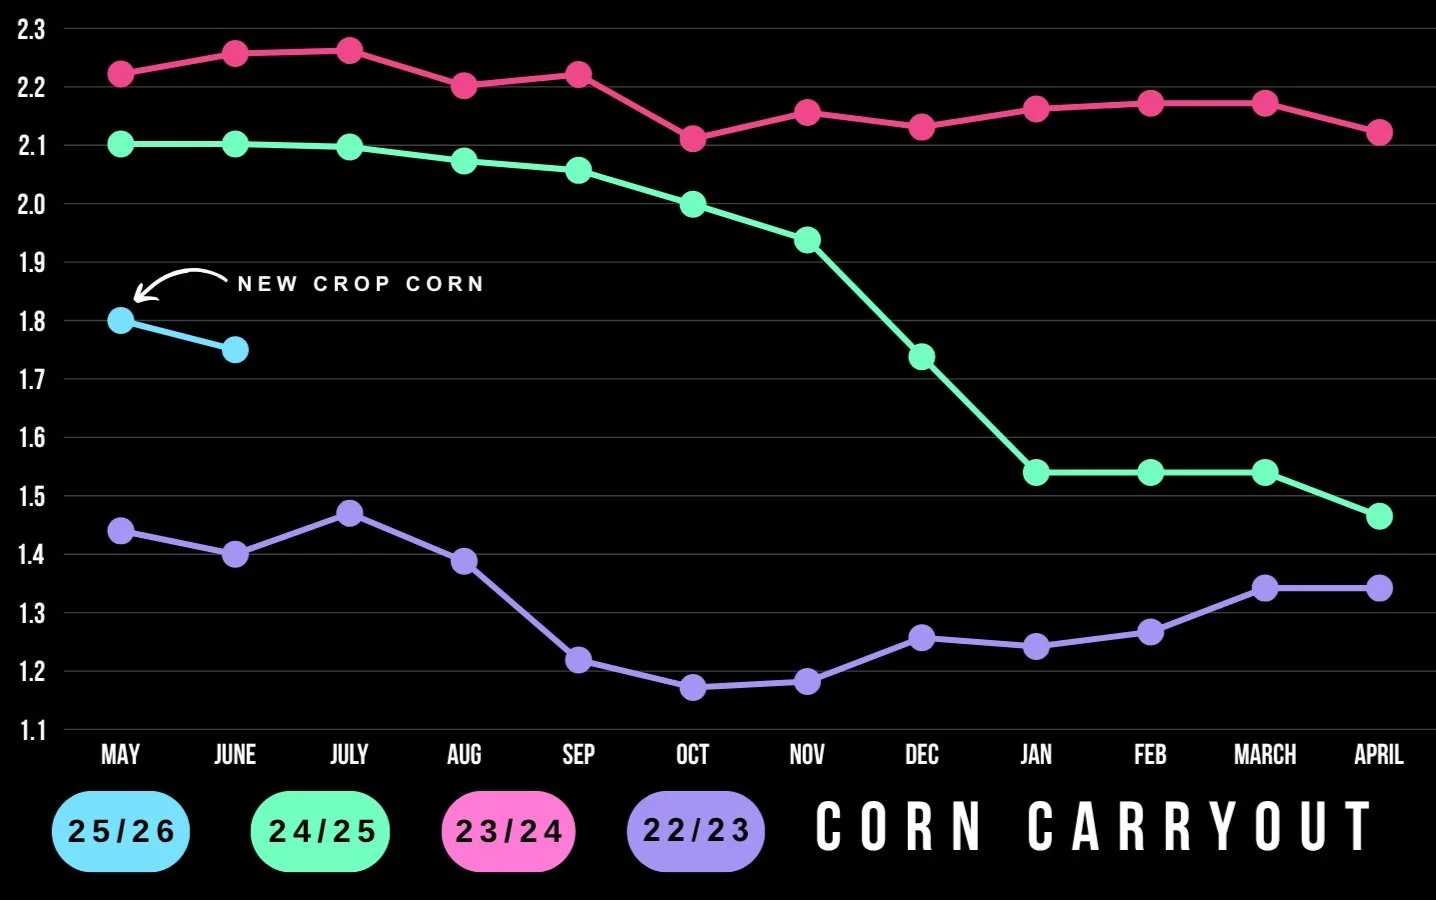
Here is a visual of corn carryout over the last few years.
For this time period, new crop carryout is the lowest in 3 years.
Here is Dec corn's price on July 1st vs carryout:
Today: $4.22 (1.75 billion)
2024: $4.20 (2.10 billion)
2023: $4.93 (2.25 billion)
So carryout is tighter, yet prices are on par or cheaper than years prior.
This doesn’t matter to the market today and does NOT mean corn has to go higher today. Today weather is all that really matters. But long term, this is something to be optimistic about.
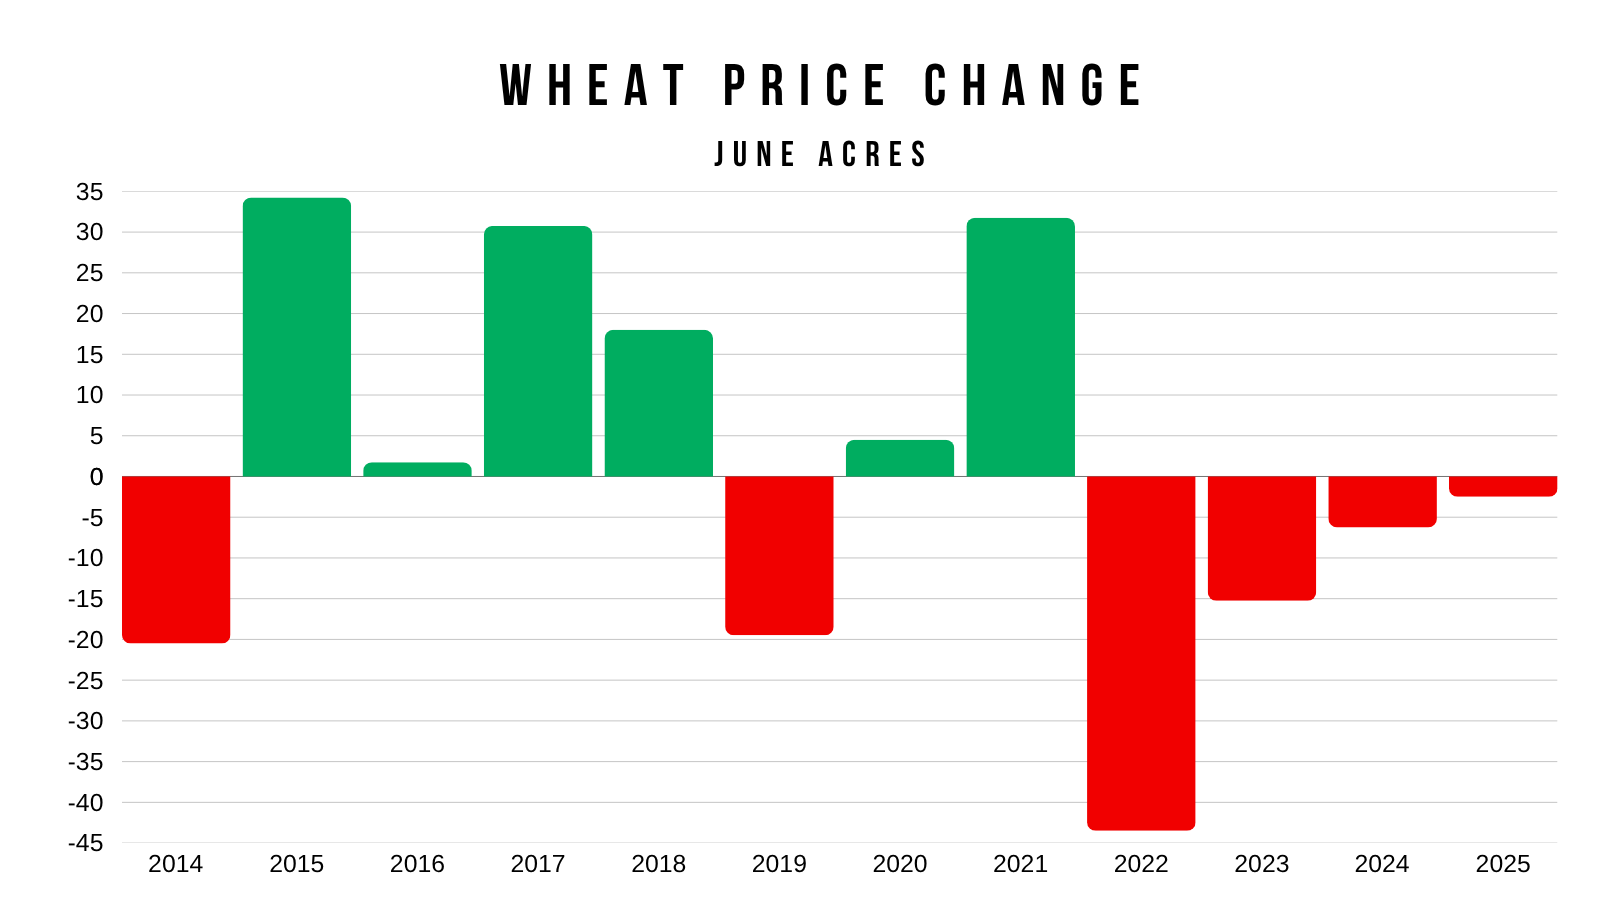
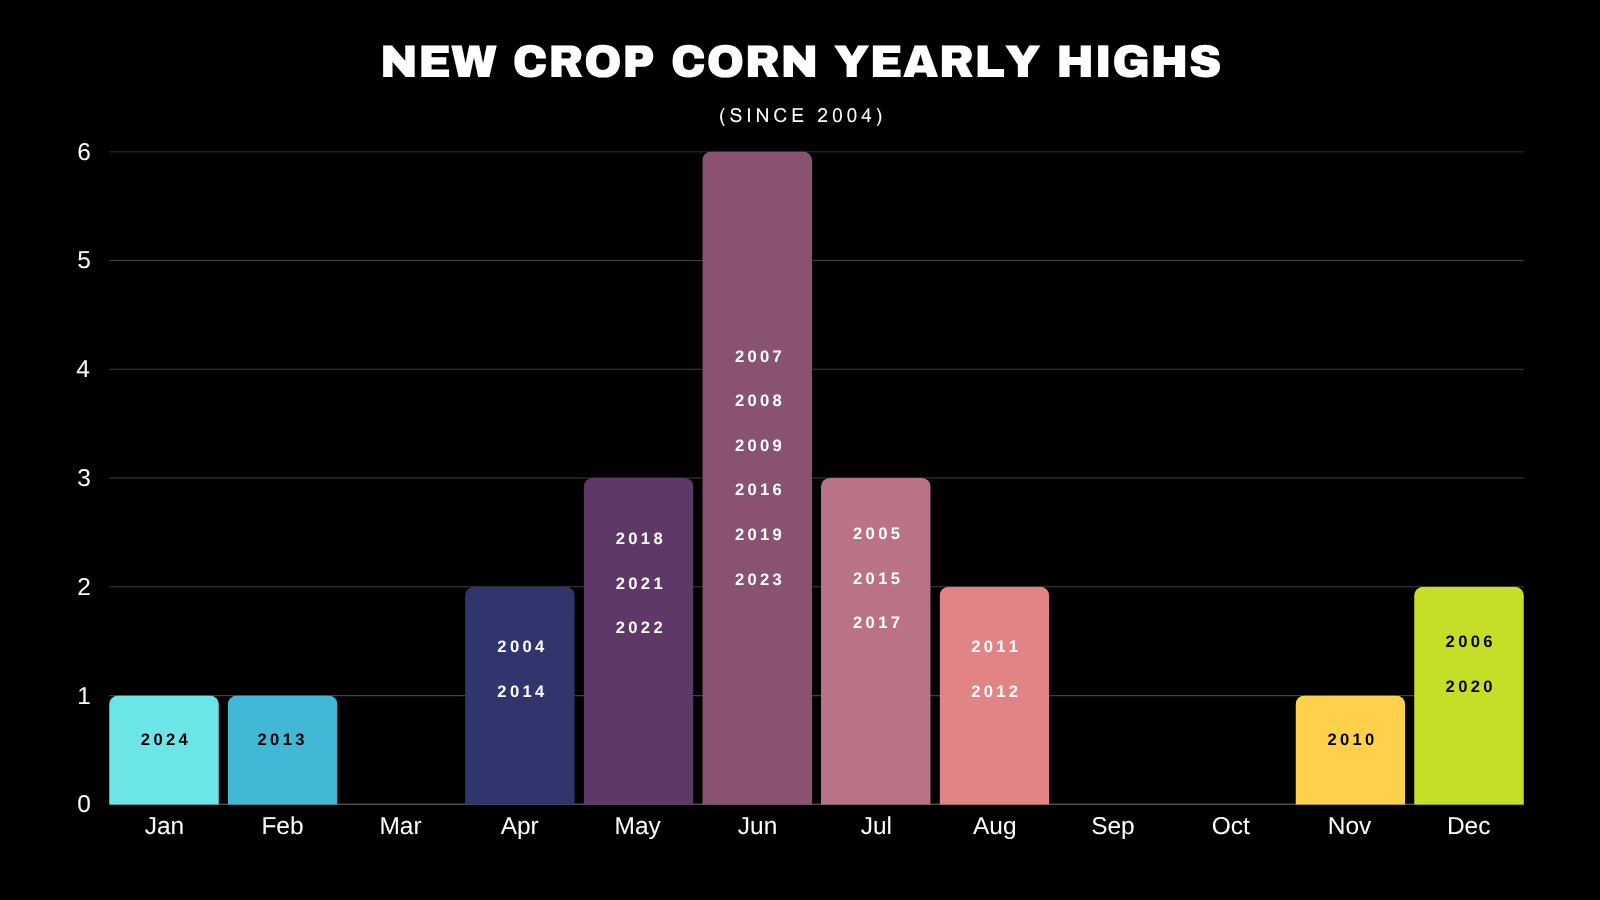
Seasonal Highs & Lows:
How rare was the price action we saw this year?
Over the past 20 years we have only posted our yearly highs before twice.
2013 and 2024 last year.
If the yearly high is February this year, it would be just the 2nd time it has ever happened.
But there has to be some added context that makes this year even more unique.
In 2013, we were coming off record high prices in 2012. So prices were already on a downfall.
In 2024, we made our highs the first day of the year and fell pretty much the entire year.
This is the first year ever, where prices rallied and posted their highs before April. That is how rare this year was.
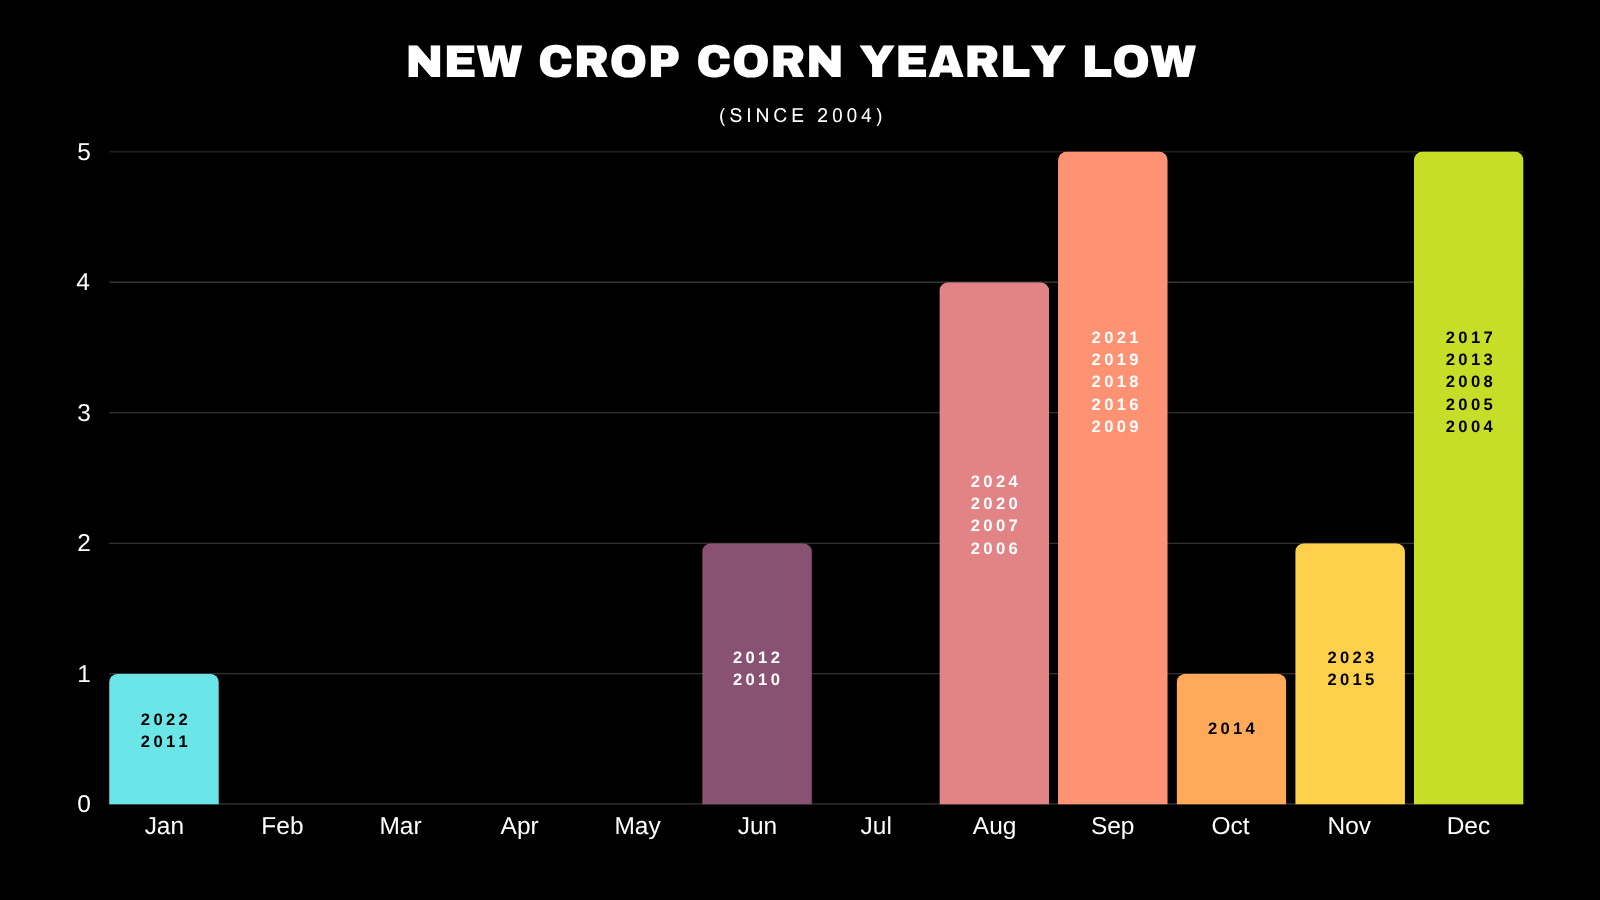
I showed this last week. But prices very rarely see their low lowest prices of the year in July. In fact, it hasn’t happened in at least 20 years.
Typically we find the low for the year in Aug or Sep.
Or there is always the chance prices fall the entire year and into December. Last time that happened was 2017.
Odds favor we haven’t seen our lowest prices for the year yet.
That doesn’t mean we couldn’t still get some little rally in July, then make a new low aat harvest. Just means we probably haven’t seen our lowest prices we will see this year.
Technicals:
Decent price action in corn today closing well off the lows after posting new contract lows.
I'd like to see us break above this green box ($4.30 level) to spark some upside.
Really need to break the blue downward trend that we have rejected off of on 4 separate occasions to say that maybe we've put in a bottom for now.
To the upside, looking to de-risk at $4.48 to $4.55 if we ever crawl up there. That gives back 50-61.8% of the Feb highs.
To the downside, our risk is still going to be $4.00
That is the implied downside move from the descending triangle pattern we broke out of. Need a break above the blue downward trend to completely negate the implied move.

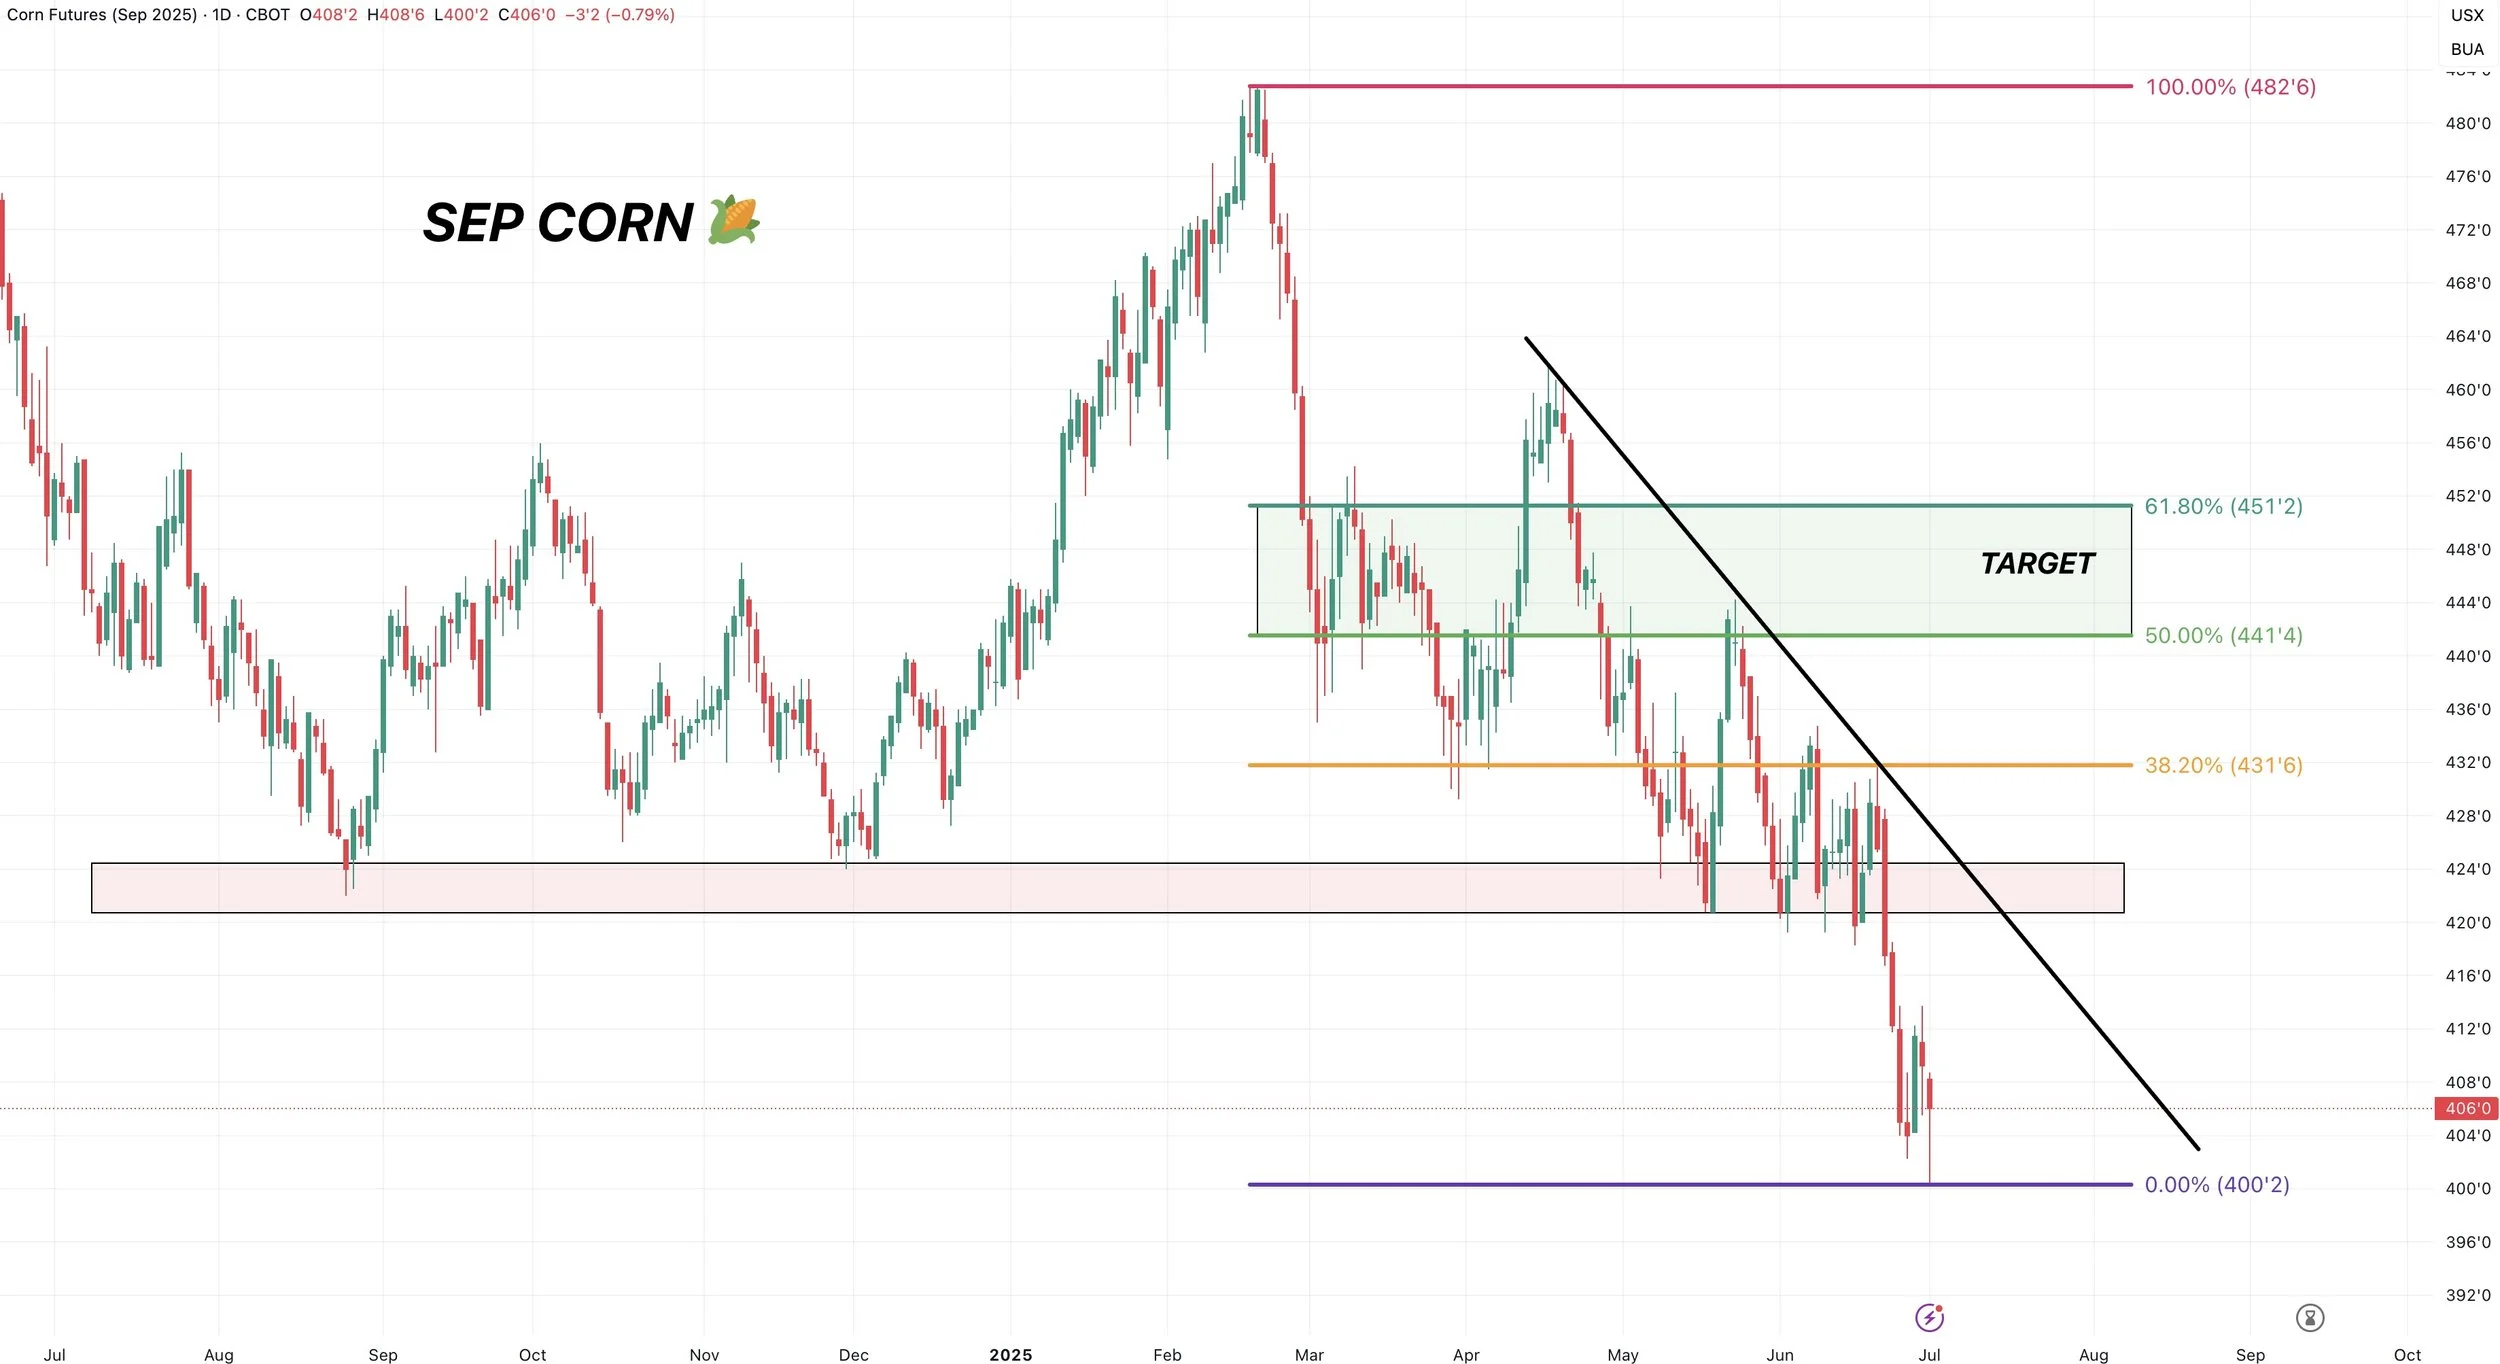
Sep corn also closed well off the lows. Will have to see if this was our temporary bottom or not.
Need back above the red box to spark more upside.
That was our old support several times.
It is now resistance.
As for targets, we alerted many sell signals close to the early year highs. But if you are someone who is still sitting on a bunch of old crop, I am eyeing $4.40 to $4.50 if we were to get some rally. Which is 50-61.8% of the Feb highs.
A more conservative target would be $4.32 which is the 38.2% retracement instead.
Soybeans
Fundamentals:
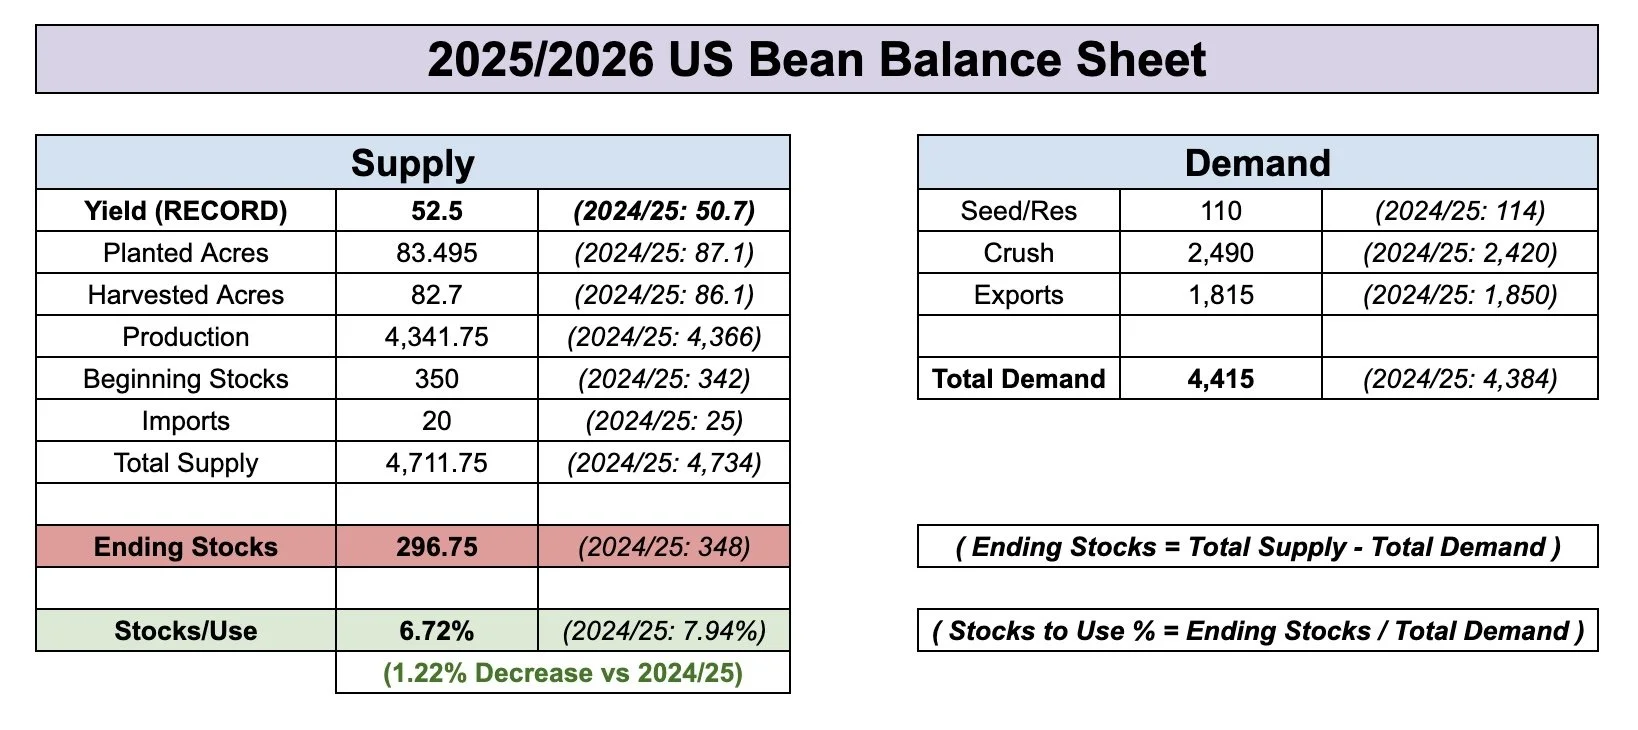
Soybean acres are the 3rd smallest of the last decade.
Only behind 2019 and 2020.

New crop carryout is at 3 year lows.. if we raise a 52.5 bpa yield.

I have shown this several times the past few months.
This is how carryout "could" change if yield even just fell from 52.5 to 51 bpa.
Without changing demand, carryout would be down a whopping -50% vs last year.
To fix this? The USDA would have to ration demand lower.
To justify rationing demand? Prices have to go higher.
That is why soybeans still have a story.
It is July 1st. Soybeans still have a few months of growing season left despite being off to a fantastic start.
Could we have perfect weather? Of course. But there is not much wiggle room on the balance sheet if we do not.
New Crop - 51 Yield
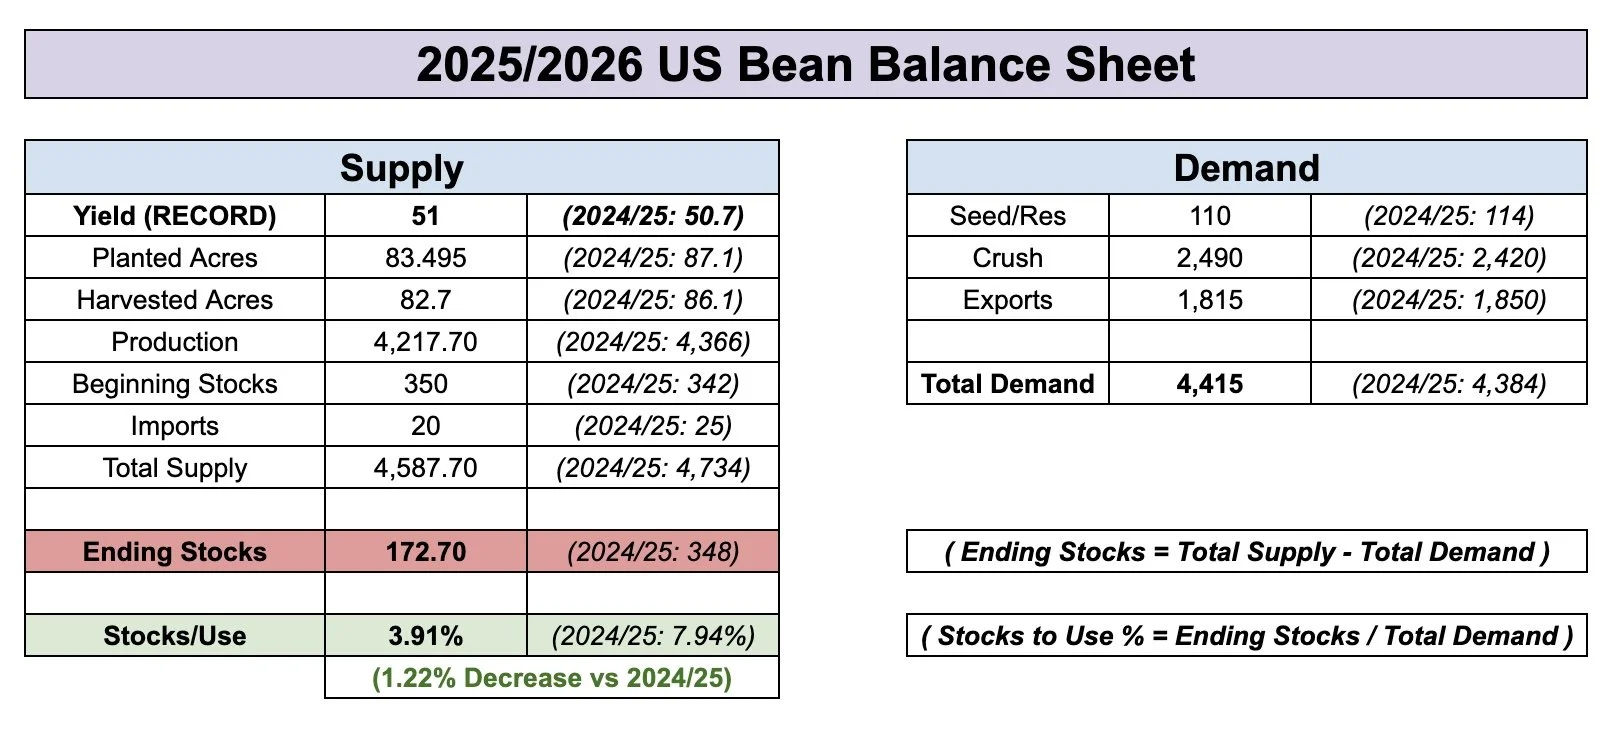
New Crop - 52.5 Yield
Seasonal Bean Highs:
Corn has a very clear tendency to top out in June.
Soybeans on the other hand offer a wider variation.
But what we do know is that soybeans have never posted their yearly in February.
The current high this year is February.
Doesn’t mean it can’t happen again (look at what happened in corn), but odds favor an opportunity in soybeans.

Technicals:
Nov soybeans continue to find like in this golden zone. Exactly where we need to.
I've been talking about this for a while.
This green box gives back 50-61.8% of the entire rally off the April lows. (Known as the golden zone).
The market makes a decision in this level. Either bounce and rally. Or fall apart. Because this box is still a standard correction level and the most common spot for a market to retrace to before heading higher.
Must hold spot.
As a spec I am buyer here (Not financial advice).
As a producer, if you made sales near the highs this is a good spot to consider re-owning but not for everyone. Call us if you have questions about re-ownership strategies (605)295-3100.
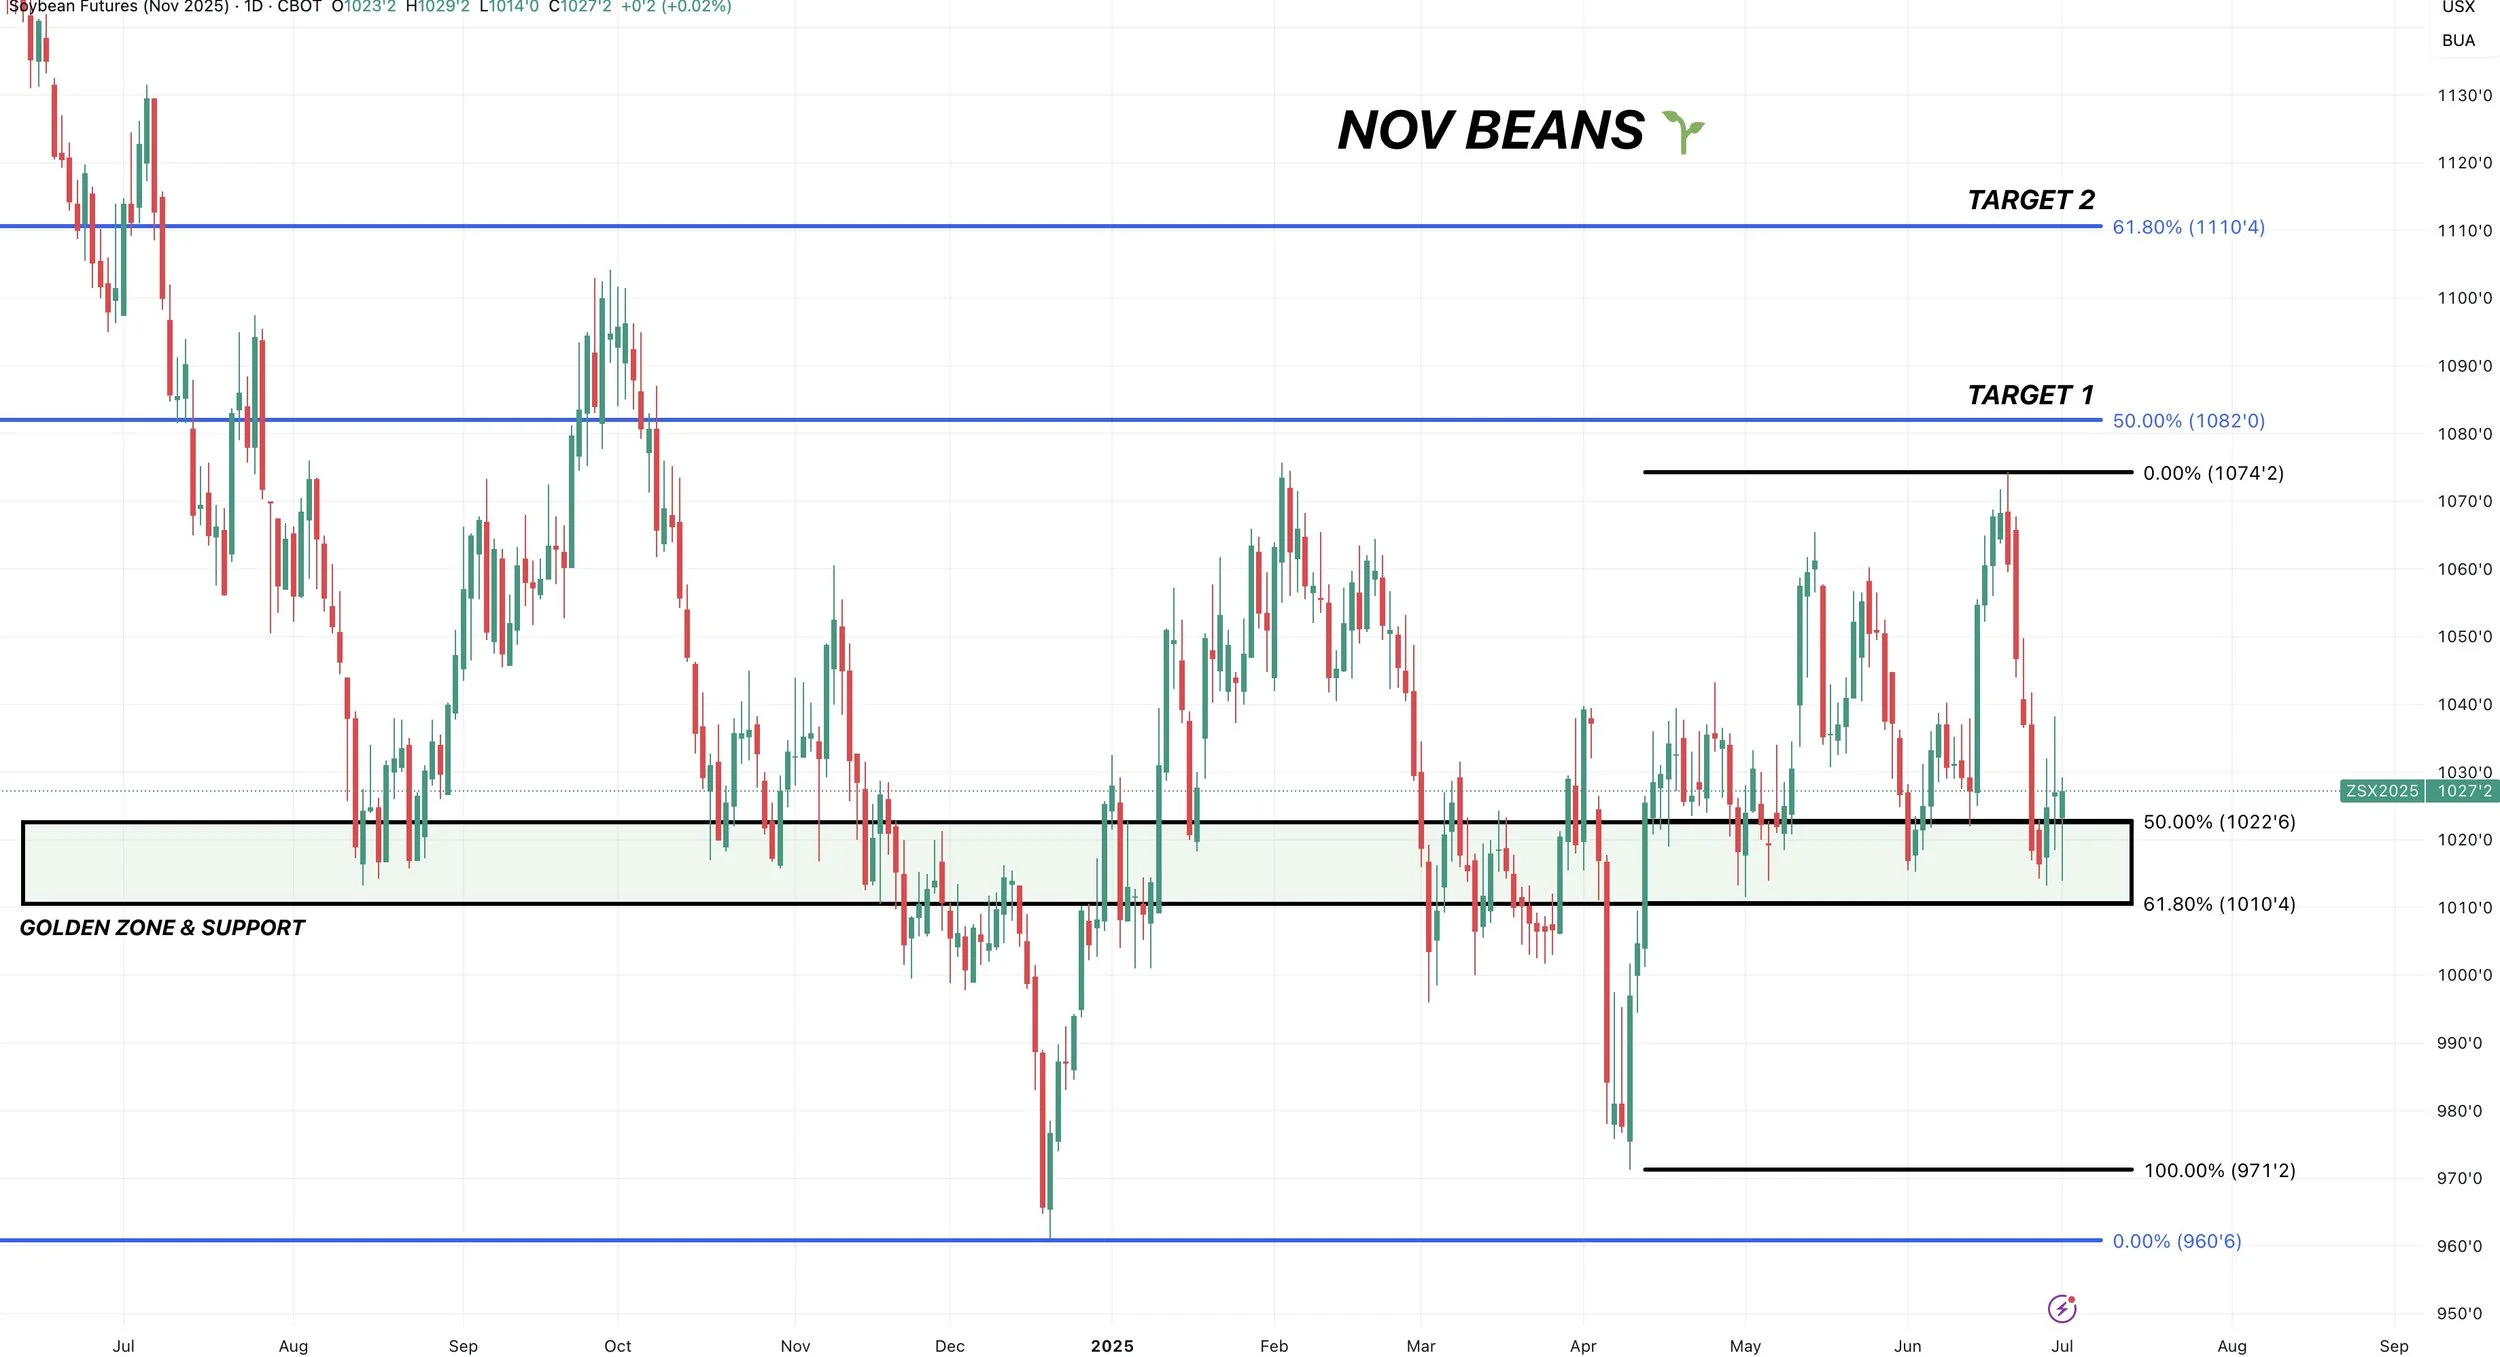
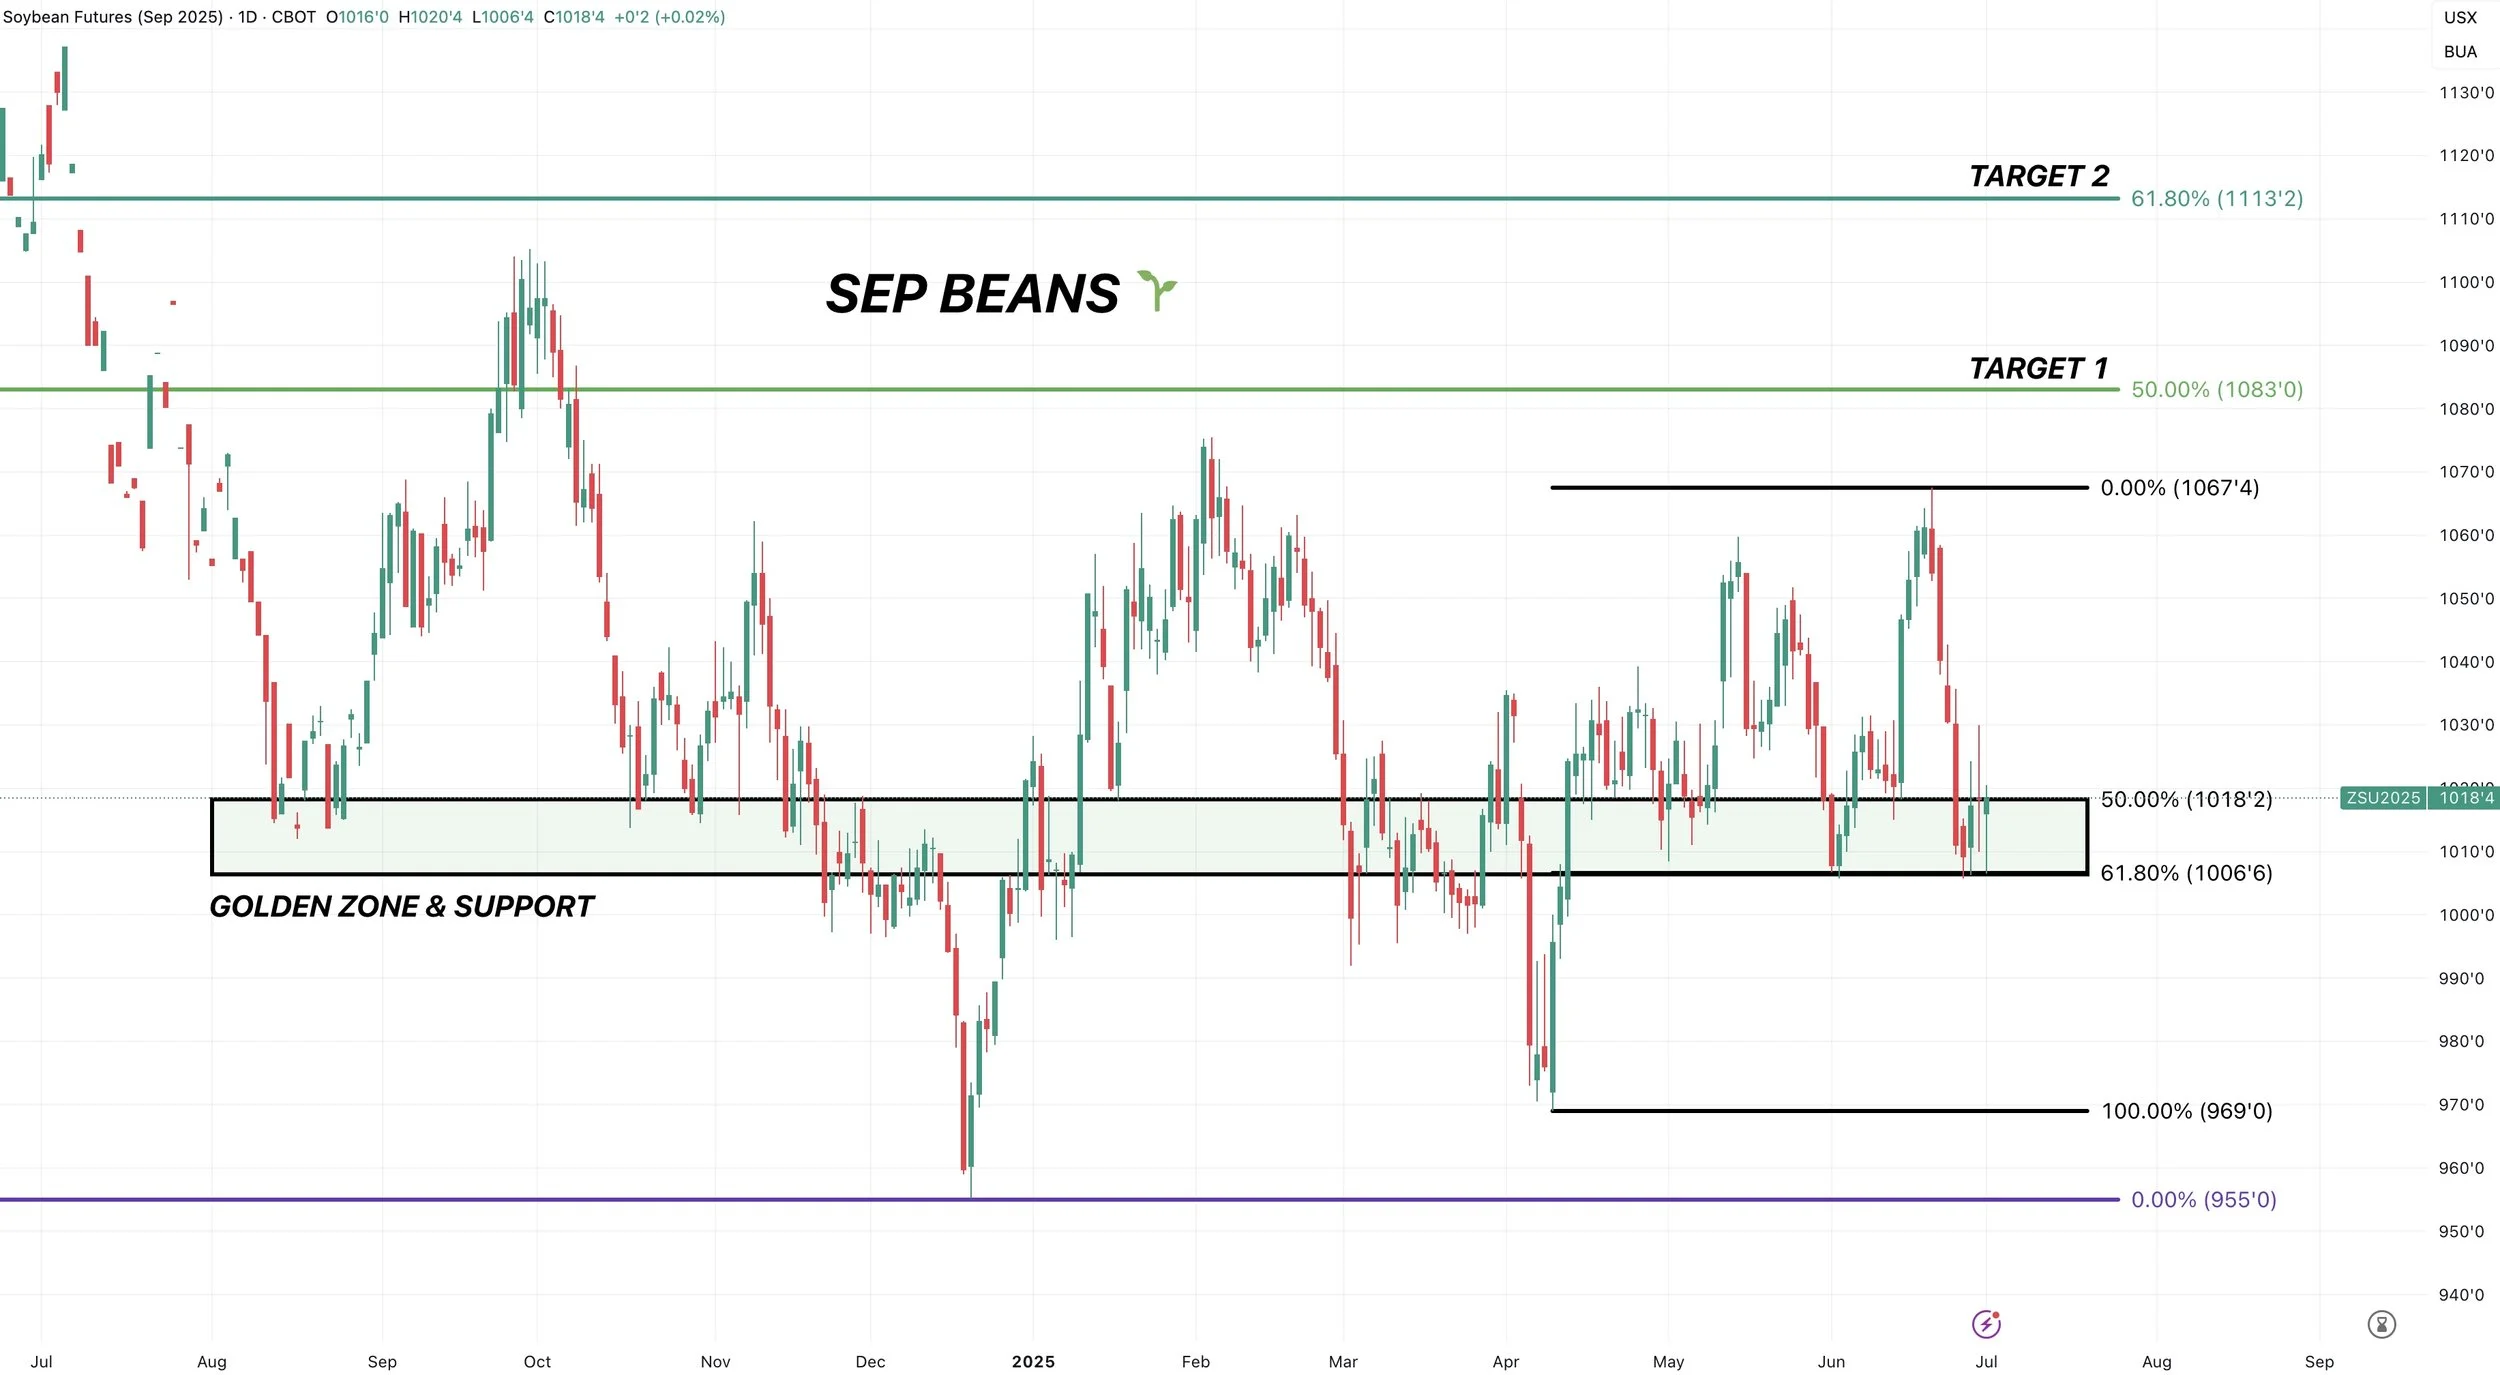
(We switched from July to Sep beans)
Sep beans also bouncing right at the 61.8% retracement.
Must hold spot.
I like our chances or heading higher. But if we don’t, there is very little support beneath here.
I did really like the price action today.
We were down -12 cents. Bounced exactly off that 61.8% level. Rallied back and closed higher. Leaving a nice reversal type candle.
Wheat
Fundamentals:
We are at the time of year where there just simply isn’t a whole lot to talk about in the wheat market.
In the USDA report they dropped winter wheat harvested acres but wasn’t a game changer by anyways.
Spring wheat acres were slightly higher but still the lowest in 55 years.
We continue to see some harvest pressure which is of course affecting KC wheat more so than Chicago & MPLS.
Winter wheat harvest should be well over 50% complete by next week.
The funds are still incredibly short this market, but don’t have much of a reason to cover until harvest is out the way.
We did see some reports out of Russia that claimed their top wheat producing region of Rostov's yield is down -44% vs last year.
The wheat market has potential. Wheat's time to shine will come again, just might take longer than any of us would like.
Technicals:
Chicago bouncing right at the bottom of the channel right where we need to.
First target is going to be right where the last one was. $5.84 to $5.99
2nd target is going to be the top of the channel if we ever get that type of breakout.
Again, targets don’t have to hit. Simply there to let you know to de-risk if they do.

Would like KC to hold contract lows to prevent catching a falling knife.
First target is still going to be where the last one was $5.90 to $6.08
But if you are someone who did not take advantage near the last target, the more conservative target would be that green box.
That was old support.
It is new resistance.

Past Sell or Protection Signals
We recently incorporated these. Here are our past signals.
June 5th: 🐮
Cattle sell signal & hedge alert.
June 2nd: 🌾
MPLS wheat sell signal.
April 10th: 🌽
Old crop corn sell signal.
March 19th: 🐮
Cattle hedge & sell signal.
Feb 18th: 🌽 🌾
Old crop KC wheat & old crop corn signal.
Jan 23rd: 🌽 🌱
Corn & beans old crop sell signal.
CLICK HERE TO VIEW
Jan 15th: 🌽 🌱
Corn & beans hedge alert/sell signal.
Jan 2nd: 🐮
Cattle hedge alert at new all-time highs & target.
Dec 11th: 🌽
Corn sell signal at $4.51 200-day MA
CLICK HERE TO VIEW
Oct 2nd: 🌾
Wheat sell signal at $6.12 target
Sep 30th: 🌽
Corn protection signal at $4.23-26
Sep 27th: 🌱
Soybean sell & protection signal at $10.65
Sep 13th: 🌾
Wheat sell signal at $5.98
May 22nd: 🌾
Wheat sell signal when wheat traded +$7.00
Want to Talk?
Our phones are open 24/7 for you guys if you ever need anything or want to discuss your operation.
Hedge Account
Interested in a hedge account? Use the link below to set up an account or shoot Jeremey a call at (605)295-3100.
Check Out Past Updates
6/30/25
BORING USDA. DIDN’T SAY HAVE TO GO LOWER
6/30/25
USDA NUMBERS
6/27/25
ALL EYES ON MONDAY
6/26/25
FIREWORKS OR BLOOD BATH MONDAY?
6/25/25
GRAINS COLLAPSING AHEAD OF JUNE REPORT
6/24/25
CORN CONTINUES SELL OFF. MAJOR USDA REPORT COMING
6/23/25
CORN CAN GO LOWER, BUT NOT FOR FOREVER
6/20/25
WHO SHOULD REWARD THE WHEAT & SOYBEAN RALLY?
6/18/25
COMPLETE CHART BREAKDOWNS
6/17/25
SOYBEANS CONTINUE BREAKOUT. NEARING SELL SIGNAL
6/16/25
CORN HAMMERED. EPA GAME CHANGER IN BEANS?
6/13/25
SOYBEANS RALLY, CHARTS, BALANCE SHEETS & MORE
6/12/25
USDA NON-EVENT. WHAT’S NEXT?
6/11/25
DIVERGENCE & SEASONAL SELL OFF?
6/10/25
BEING PATIENT VS BALANCING YOUR RISK
6/9/25
WHAT IF WE DON’T GET A WEATHER SCARE?
6/5/25
CORN & BEANS HOLDING CRUCIAL SPOTS
6/5/25
CATTLE SELL SIGNAL & HEDGE ALERT
6/4/25
HOW UNKNOWNS IMPACT MARKETING DECISIONS
6/3/25
KEY SPOTS ON THE CHARTS FOR CORN & BEANS
6/2/25
NEW LOWS IN CORN. DE-RISKING MPLS WHEAT
6/2/25
SPRING WHEAT SELL SIGNAL
5/30/25
SEASONAL RALLY STILL IN THE CARDS?
5/29/25
WHAT IS YOUR PLAN IF WE DO NOT RALLY?
5/28/25
ZERO PREMIUM IN THE GRAIN MARKETS
5/27/25
CORN CONDITIONS DISAPPOINT & JUNE OUTLOOK IMPROVES
5/23/25
TARIFFS SPOOK MARKET. GAME PLAN MOVING FORWARD
5/22/25
CHART BREAKDOWNS & TARGETS
5/21/25
RISK TO THE UPSIDE WITH WEATHER?
5/20/25
WHEAT SHORT COVERING & HISTORY OF YIELD CHANGES
5/19/25
ANYONE LEFT TO SELL WHEAT? 181 CORN YIELD POSSIBLE?
5/16/25
FUNDS SHORT CORN. MARKETS WAITING ON WEATHER
5/15/25
BEANS HAMMERED ON RUMOR & WHEAT FINDING LIFE
5/14/25
DECISIONS & POSSIBILITIES IN GRAINS
5/13/25
GRAINS RALLY OFF LOWS
5/12/25
USDA REPORT. HOW THIS CHANGES THINGS
5/9/25
BIGGEST RISKS IN USDA REPORT
5/8/25
USDA MONDAY & HISTORY OF WEATHER RALLIES
5/7/25
NEW 2025 LOWS FOR CORN
5/6/25
WHAT’S A SUMMER RALLY LOOK LIKE?
5/5/25
CORN ERASES ENTIRE APRIL RALLY
5/2/25
SELL INTO UNCERTAINTY. NOT KNOWN FACTORS
5/1/25
THE CASE AGAINST A FEB TOP IN CORN
4/30/25
APPROACHING KEY TIME PERIOD FOR GRAINS
4/29/25
PLANTING & FIRST NOTICE DAY PRESSURE. CORN CLOSE TO BOTTOM?
4/28/25
CAPTURING INVERSE & SEASONAL PREPARATION
4/25/25
HOW OFTEN DOES CORN NOT BREAK APRIL HIGHS?
4/24/25
KNOW WHEN TO SELL. BEANS BREAK 200-DAY FIRST TIME IN 483 DAYS
4/23/25
MONEY FLOW & DROUGHT CARDS
4/22/25
CRUCIAL SPOT FOR CORN & BEANS
4/21/25
NO PLANTING THREAT YET
4/18/25
POTENTIAL OPPORTUNITIES, BASIS CONTRACTS & STRATEGIES
4/16/25
HOW YIELD IMPACTS CARRYOUT. MAJOR SPOT FOR SOYBEANS
4/15/25
TOTAL CHART BREAKDOWNS & TARGETS
4/14/25
TECHNICAL SELLING IN GRAINS
4/11/25
SPECIFIC GRAIN MARKETING DECISIONS
4/10/25
USDA REPORT. HOW THIS IMPACTS CORN
4/9/25
TARIFFS GIVE. TARIFFS TAKE
4/8/25
CORN’S DIVERGING STRENGTH
4/7/25
SOLID PRICE ACTION DESPITE OUTSIDE FEAR
4/4/25
CORN PRICE ACTION SPEAKS VOLUME. ANY HOPE LEFT FOR SOYBEANS?
4/3/25
WHAT IS LEFT FOR CORN BEARS? TRADE WAR: CHARTS HOLDING SUPPORT
4/2/25
SHOULD UNKNOWNS KEEP A FLOOR UNDER GRAIN PRICES?
4/1/25
HOW DO ACRES IMPACT FUTURE OF THE GRAINS?
3/31/25
USDA REPORT: NOW WHAT?
3/28/25
ALL EYES ON USDA
3/27/25
PRE-USDA POSITIONING. DON’T GIVE GRAIN AWAY
3/26/25
HISTORY OF MARCH INTENTIONS. SOYBEANS UNDERVALUED?
3/25/25
6 DAYS UNTIL MAJOR USDA REPORT
3/24/25
HOW TO POSITION YOURSELF BEFORE PLANTING
3/21/25
REASONS TO BE OPTIMISTIC IN GRAINS?
3/20/25
WAS THAT THE BOTTOM IN CORN?
3/19/25
THE PATH HIGHER & THE DOWNSIDE RISKS IN GRAINS
3/18/25
SEASONALS, CATTLE HEDGE, CHARTS & DROUGHT?
3/17/25
WHEAT RALLIES. DON’T GET BACKED INTO A CORNER
3/14/25
MARCH 31ST REPORT THOUGHTS & WHAT’S NEXT FOR GRAINS
3/13/25
EXPLAINING RE-OWNERSHIP VS COURAGE CALLS
3/12/25
TARIFF FEARS. EU, CANADA, & ETHANOL
3/11/25
USDA SNOOZE. RECORD FUND SELLING A CONCERN?
3/10/25
USDA TOMORROW. GETTING COMFORTABLE IN MARKETING
3/7/25
HOW TIGHT IS THE WORLD & US SITUATION?
3/6/25
TARIFFS PUSHED BACK. FUTURE OPPORTUNITIES?
3/5/25
IS GRAINS BIGGEST RISK WEAK CRUDE & DEFLATION?
3/4/25
TRADE WAR BEGINS. 8TH DAY OF PAIN FOR GRAINS
3/3/25
TARIFFS ON TOMORROW. BUY SIGNAL
3/3/25
BUY SIGNAL
2/28/25
WHEN WILL THE BLEEDING STOP?
2/27/25
CORN AT CRITICAL SPOT. USDA ACRE REPORT. WAY TOO EARLY DROUGHT TALK
2/26/25
HISTORY SUGGESTS CORN TOP ISN’T IN? ACRE OUTLOOK TOMORROW
2/25/25
POSITIVE CLOSE. WHAT TO KNOW ABOUT USDA OUTLOOK
2/24/25
USDA OUTLOOK, FIRST NOTICE DAY & BRAZIL
2/21/25
WHAT TO EXPECT MOVING FORWARD IN GRAINS
2/20/25
FIRST NOTICE DAY CONCERNS. MASSIVE CORN ACRES OR NOT?
2/19/25
HOW TIGHT IS THE CORN SITUATION?
2/18/25
MORE DETAILS ON TODAYS SELL SIGNAL
2/18/25
OLD CROP KC WHEAT & CORN SELL SIGNAL
2/14/25
WHEAT BREAKING OUT ON WEATHER RISK. TECHNICALS & FUNDAMENTALS
2/12/25
GLOBAL GRAIN SITUATION, ACRE TALK, CHARTS & MORE
2/11/25
USDA: NOT A BEARISH REPORT. DISAPPOINTING PRICE ACTION
2/10/25
USDA TOMORROW. LONG TERM PATH FOR SUB 10% CORN STOCKS TO USE?
2/7/25
WHY WOULD THE FUNDS EXIT THEIR LONGS?
2/6/25
WHEAT FINALLY CATCHING A BID
2/5/25
COMPLETE THOUGHTS ON MARKETS: BACK & FORTH DISCUSSION
2/4/25
STRONG JANUARY LEAD TO STRONG YEAR? TARIFFS, CHARTS & MORE
2/3/25
TARIFFS PUSHED BACK
1/31/25
TARIFF NEWS ALL OVER THE PLACE. ARE YOU PREPARED FOR POSSIBILITIES?
1/30/25
WHEAT BULL ARGUMENT. TRUMP ADDS TARIFFS
1/29/25
CORN APPROACHES $5.00
1/28/25
TARIFFS, CORN FUNDS, SOUTH AMERICA & MORE
1/27/25
HEALTHY CORRECTION WE TALKED ABOUT & TARIFF NEWS
1/24/25
GRAINS DUE FOR SHORT TERM CORRECTION?
1/23/25
OUR ENTIRE NEW CROP SALES THOUGHTS & OLD CROP SELL SIGNAL
1/22/25
GRAINS TAKE A BREATHER. IS CORN IN A BULL OR BEAR MARKET?
1/21/25
HUGE DAY IN GRAINS. WHAT TO DO WITH OLD CROP VS NEW CROP
Read More
1/20/25
VIDEO CHART UPDATE
1/17/25
TRUMP, CHINA, ARGY & USING THE SPREADS INVERSE
1/16/25
OLD CROP LEADS US LOWER. MARKETING THOUGHTS
1/15/25
SIGNAL & HEDGE ALERT QUESTIONS EXPLAINED. IS $6 CORN EVEN POSSIBLE?
1/14/25
MORE DETAILS ON TODAYS HEDGE ALERT & SELL SIGNAL
1/14/25
CORN & SOYBEANS HEDGE ALERT/SELL SIGNAL
1/13/25
USDA GAME CHANGER OR NOT?
1/10/25
BULLISH USDA FOR CORN & BEANS
1/9/25
USDA OUT TOMORROW
1/8/25
2 DAYS UNTIL USDA. BE PREPARED
1/7/25
THE HISTORY OF THE JAN USDA & MORE
1/6/25
MAJOR USDA REPORT FRIDAY
Read More
1/3/25
UGLY DAY ACROSS THE GRAINS
1/2/25