
WEATHER & CHINA RALLY GRAINS
AUDIO COMMENTARY
Massive day for grains
Weather and China spark some life
Too much rain in some spots
Forecasts calling for hot and dry
Tariffs dropped makes us more competitive
More details on soybean signal
How to utilize floors & protect rallies
Funds still short corn & wheat
Some guys getting robbed on basis
Puts are one of the best tools right now
Euro crop continues to get worse
Realize the risks & the bullish cards
Be prepared to do something
Soybean & corn charts below*
Want to talk?
Office: (806)484-1214
Your free trial has ended
Don’t miss future updates or signals
Here is our 4th of July sale in case you missed it
CHARTS
Aug Soybeans 🌱
Soybeans up around 75 cents since last week.
We were trapped in a tight range at that volume shelf we had been talking about for a while. With prices coiling and waiting for a direction.
Today we got the breakout and sliced right through the volume gap to the upside. Like we had talked about last week, prices tend to move through volume gaps fast because there is no resistance.
We have now rallied right into an area of high volume. The same range we were trapped in for weeks back in the spring.
This same level claws back 61.8% of the entire sell off. The most common retracement level.
Prices do not have to stop here. We’re in a weather market. But taking a pure technical approach, this would be a potential area where prices could stall. Given the volume and retracement level. Hence today’s alert.
If we take out this range and area of high volume, it opens the door to challenge the highs.

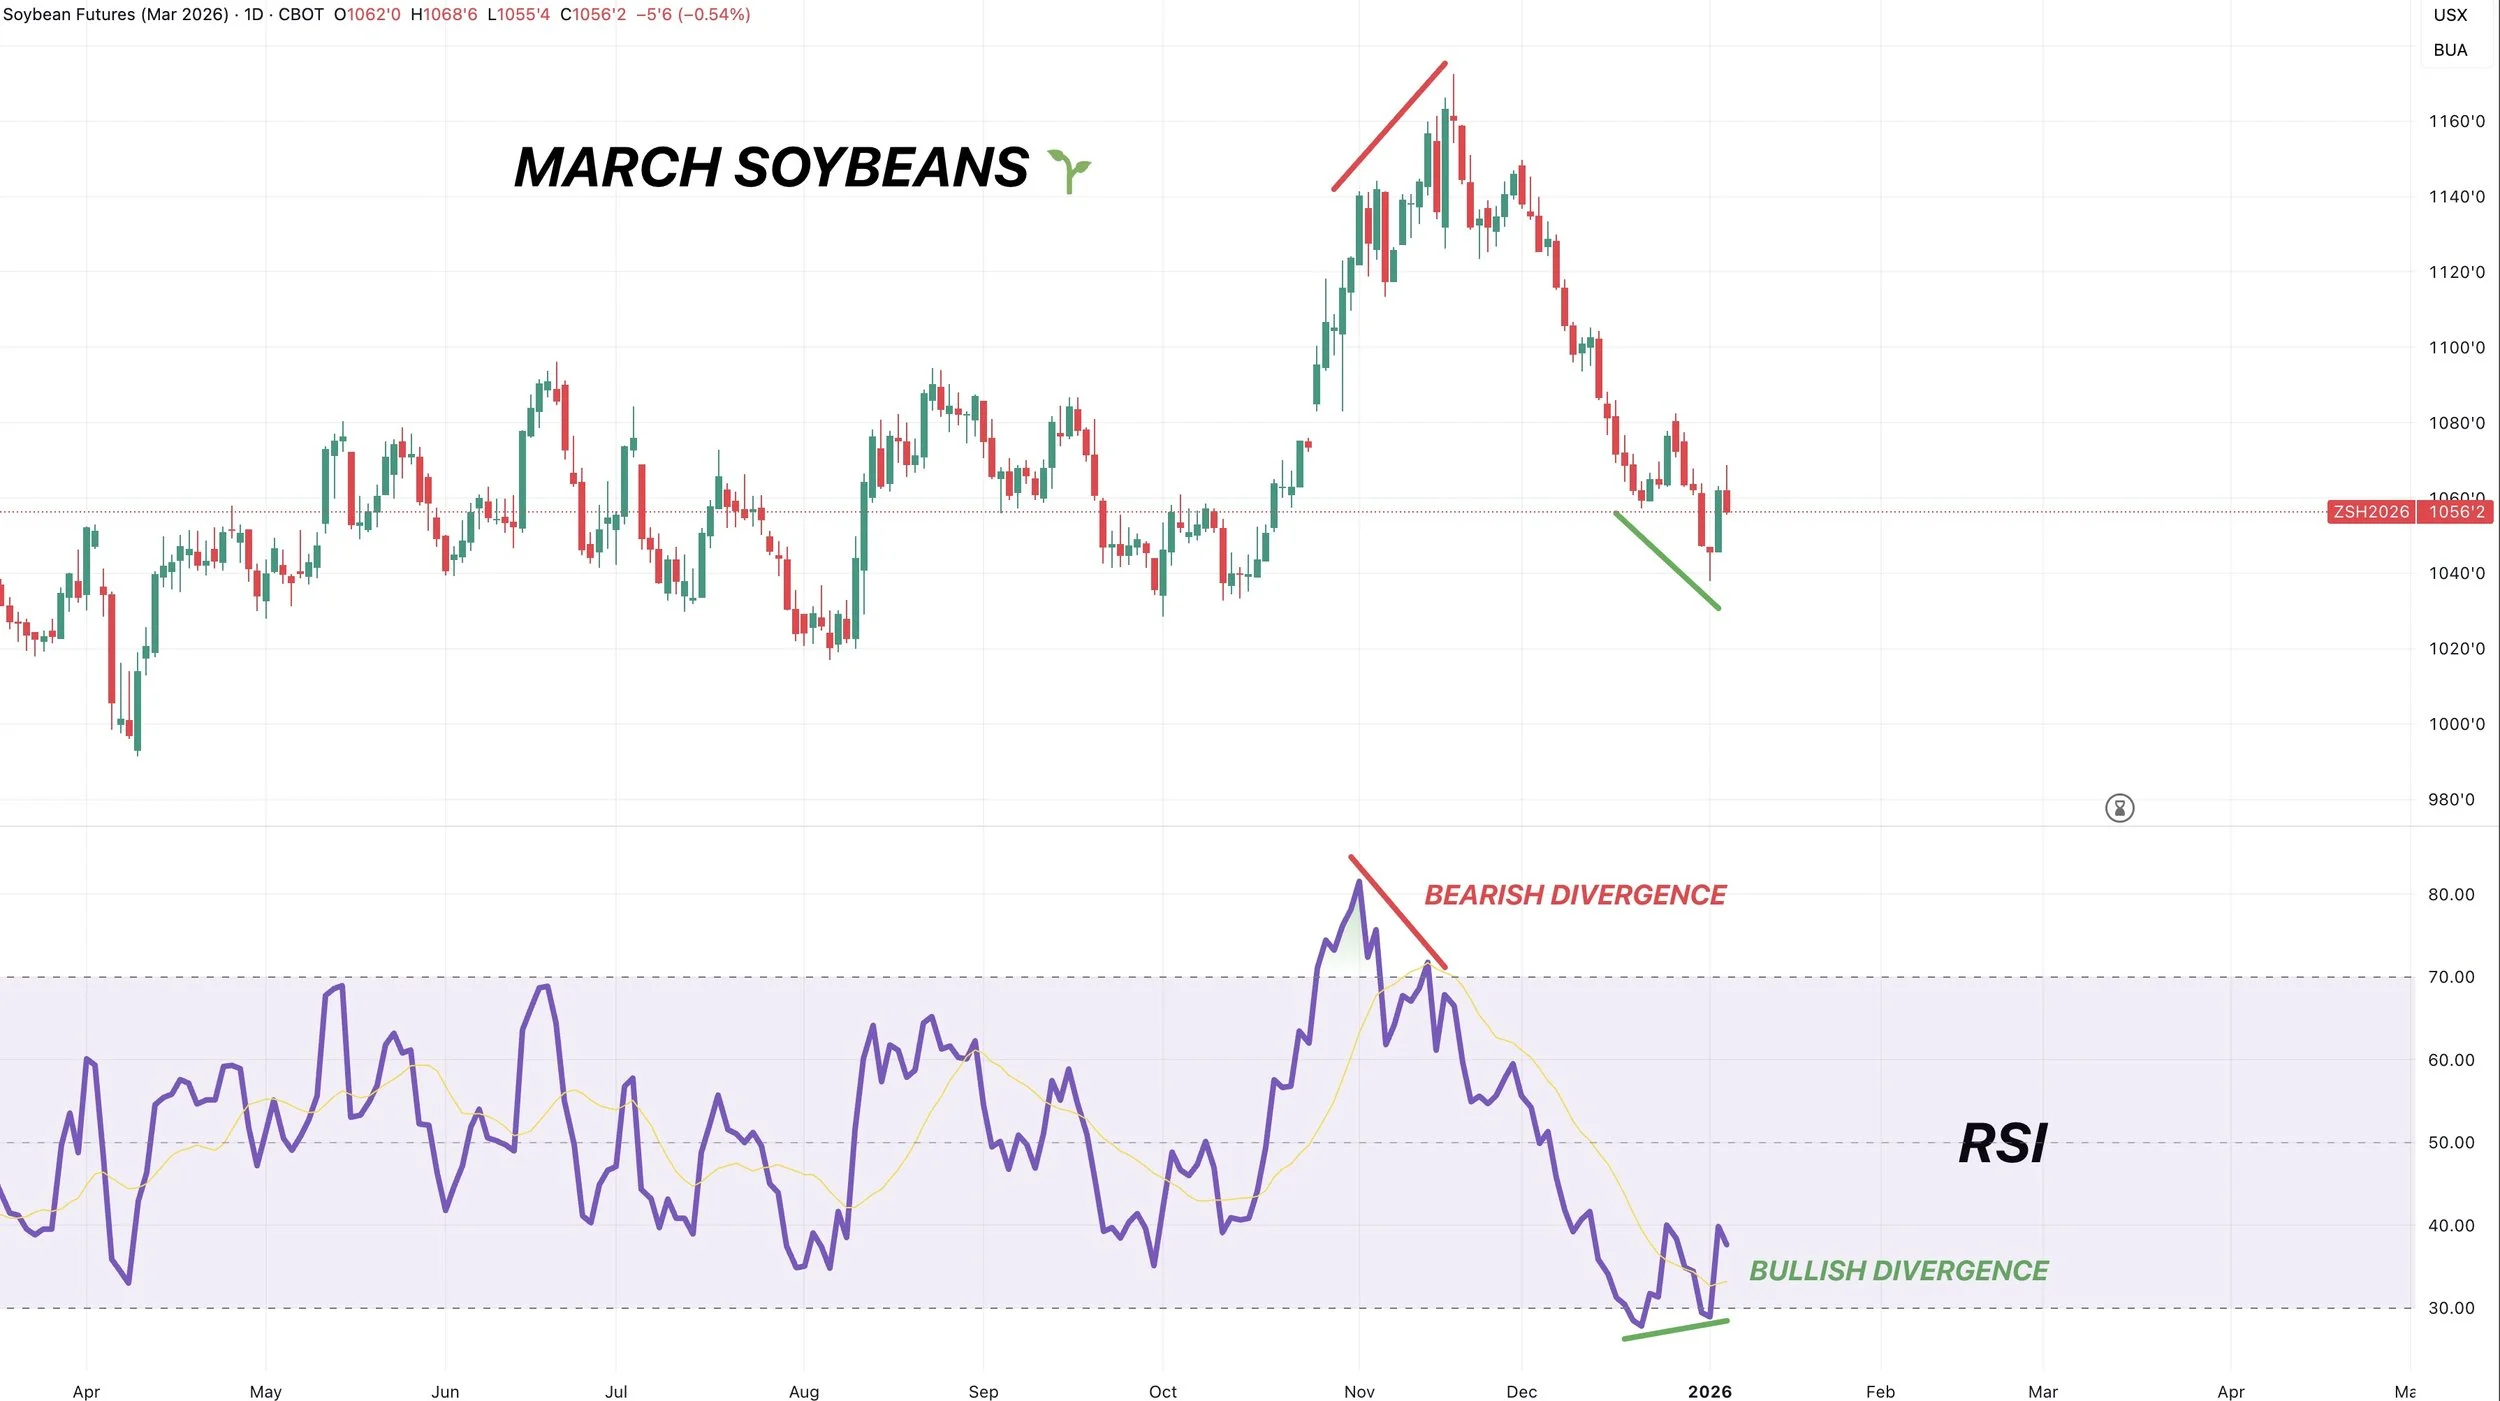
Like we talked about last week, the indicators were suggesting some friendly signs.
As we had bullish divergence on the RSI. (No current divergence right now).
Meanwhile the MACD crossed bullish. Each of the last three times this happened, a rally followed.

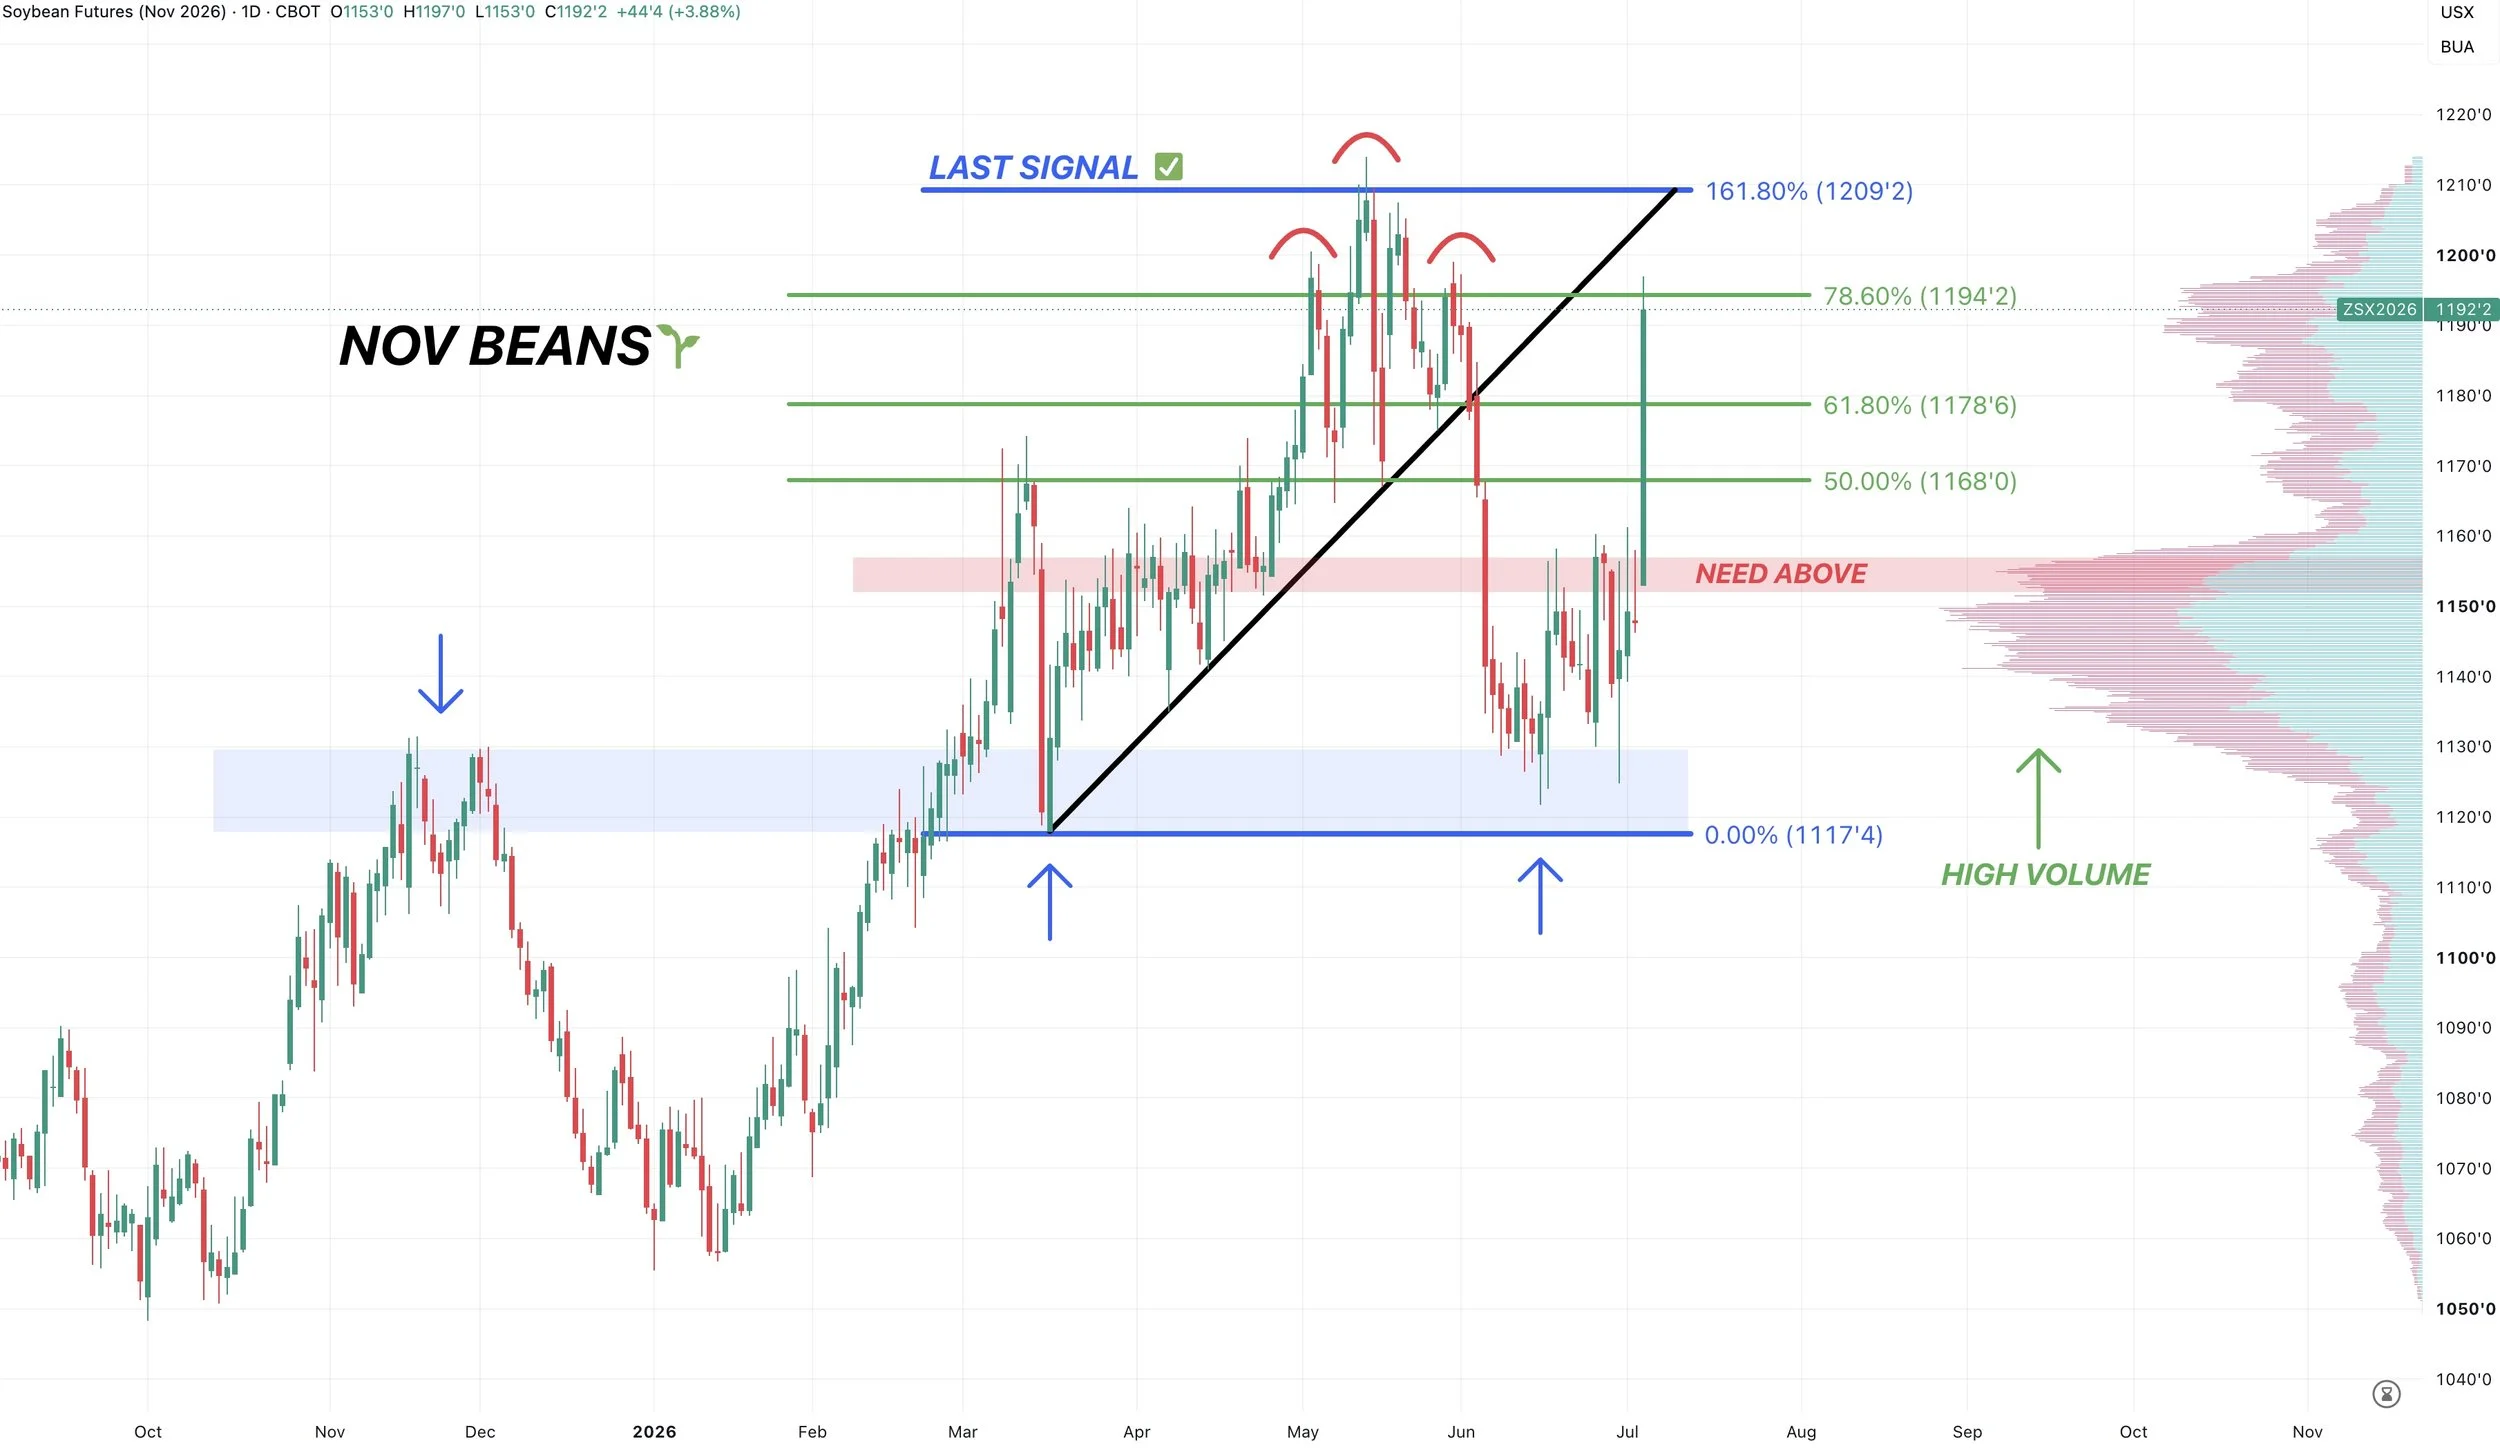
Nov Soybeans 🌱
We broke that area of massive volume, which left very little resistance to the upside.
We’ve now clawed back 78.6% of the entire sell off.
Also sitting at the next area of high volume.
(Last signal was at $12.09: Click Here to View)
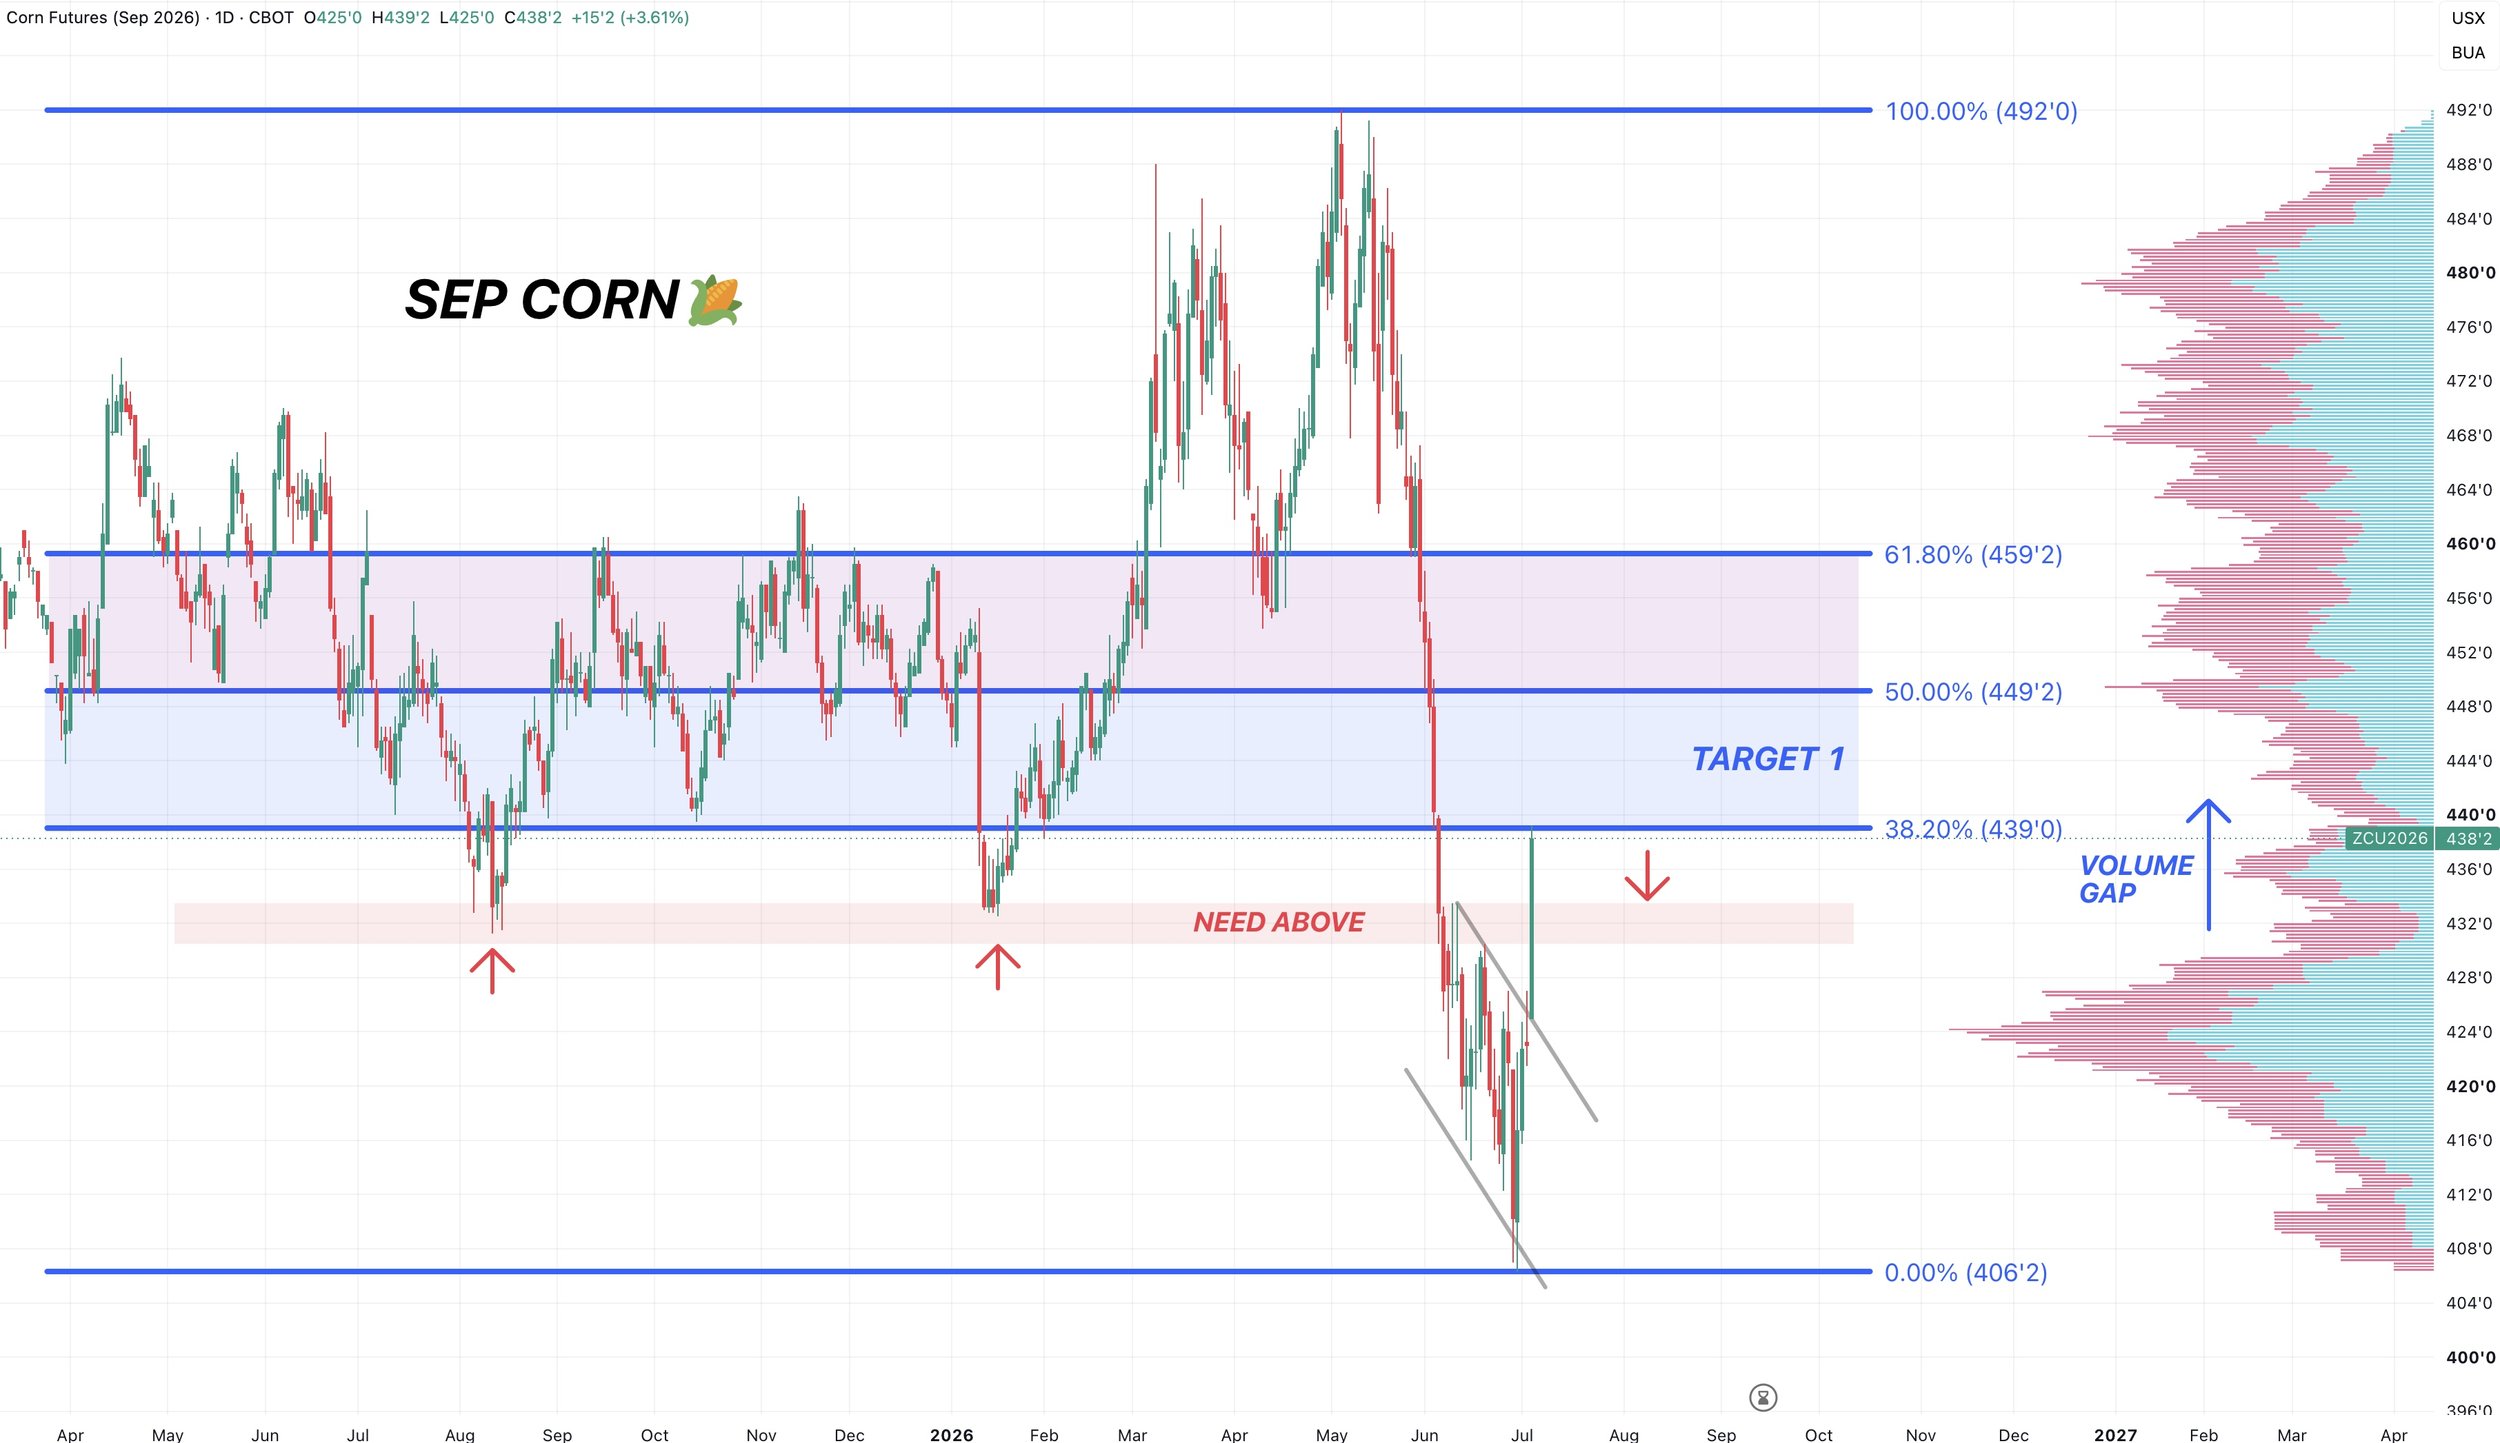
Sep Corn 🌽
We finally broke through some resistance.
We’ve clawed back 38.2% of the sell off. Which is the first retracement level.
If we can manage to break above this fib level, we want to reward a move towards $4.49 which is the 50% level and 10 cents away.
That is also the next area of major volume if we break above this current level. It was also previous support from last fall.
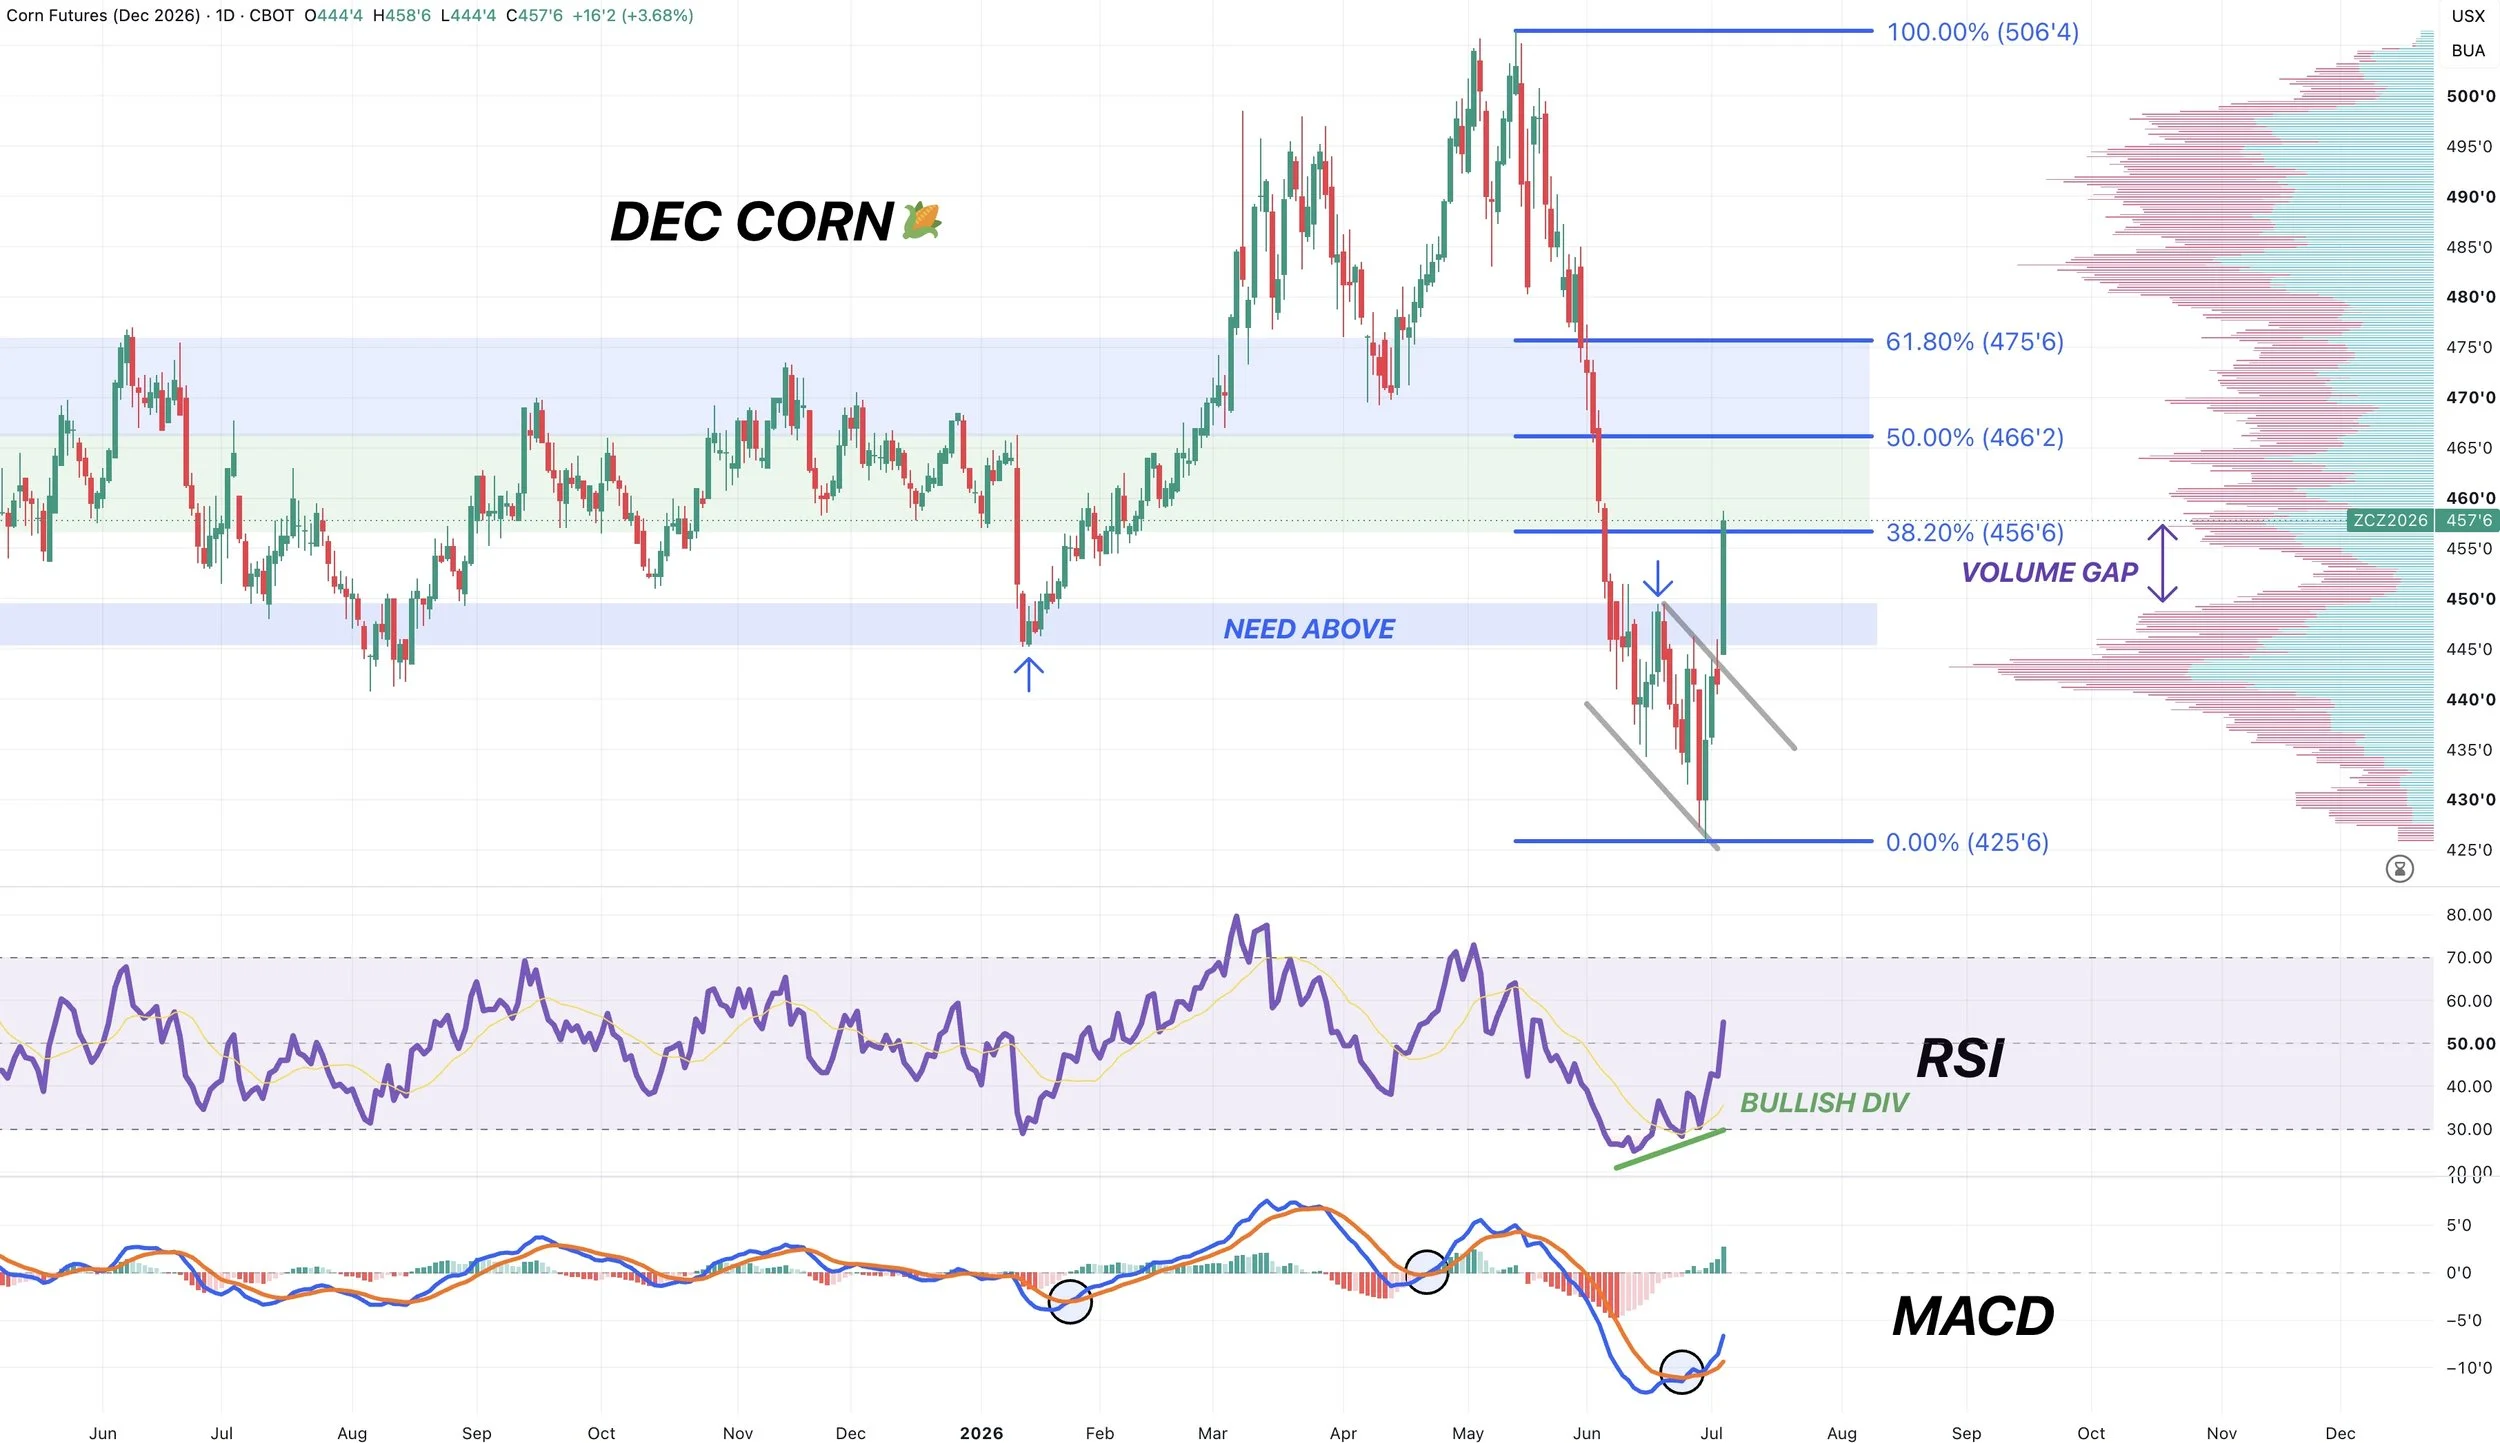
Dec Corn 🌽
Similar set up here.
We’ve clawed back 38.2% of the entire sell-off.
If we can break above this level, we want to look to defend a move towards $4.65, which reclaims 50% of the entire sell-off. That same area has also provided resistance in the past.

Like in soybeans, the indicators had been giving some positive signs last week that we talked about.
As we had bullish divergence on the RSI. This happens when prices make new lows, but the RSI does not. Currently, there is no divergence. As prices broke higher, so did the RSI.
Along with the MACD crossing bullish for the first time since April.
Want to Talk?
Our phones are open 24/7 for you guys if you ever need anything or want to discuss your operation.
Jeremey & Office: (806)484-1214
Sebastian: (605)280-1186
Email: sfrost@dailymarketminute.com
Hedge Account
Interested in a hedge account? Use the link below to set up an account or give us a call.
SOYBEAN SELL SIGNAL & HEDGE ALERT
NEW CROP & OLD CROP BEANS
Get every signal & daily update
We feel like this is a good spot to play some catch up in soybeans. Whether that’s some downside protection or an incremental sale.
Soybeans are around +70 cents off the recent lows from last week.
Since this is a weather market, the rally doesn’t have to stop here. So there are a couple ways to play it:
Put protection
A sell stop (a sell stop is an order to sell if the market drops to X level. If the rally continues, you can raise the stop higher)
Incremental sale
If you have courage calls right now, it should make it easier to make a sale now
If you have questions, feel free to reach out.
Office: (806)484-1214
Charts & Reason for Signal
Aug Beans 🌱
We broke that resistance and ran right through that volume gap we had been talking about.
We are now testing an area of high volume after running through the area of low volume.
We’ve also clawed back 61% of the sell off. A common retracement level for rallies to pause.
This same area is that old range we were trapped in for several weeks back in the spring.
Again, since this is a weather market, we could continue to rally. But looking at the charts, this would be a possible area where we could struggle.

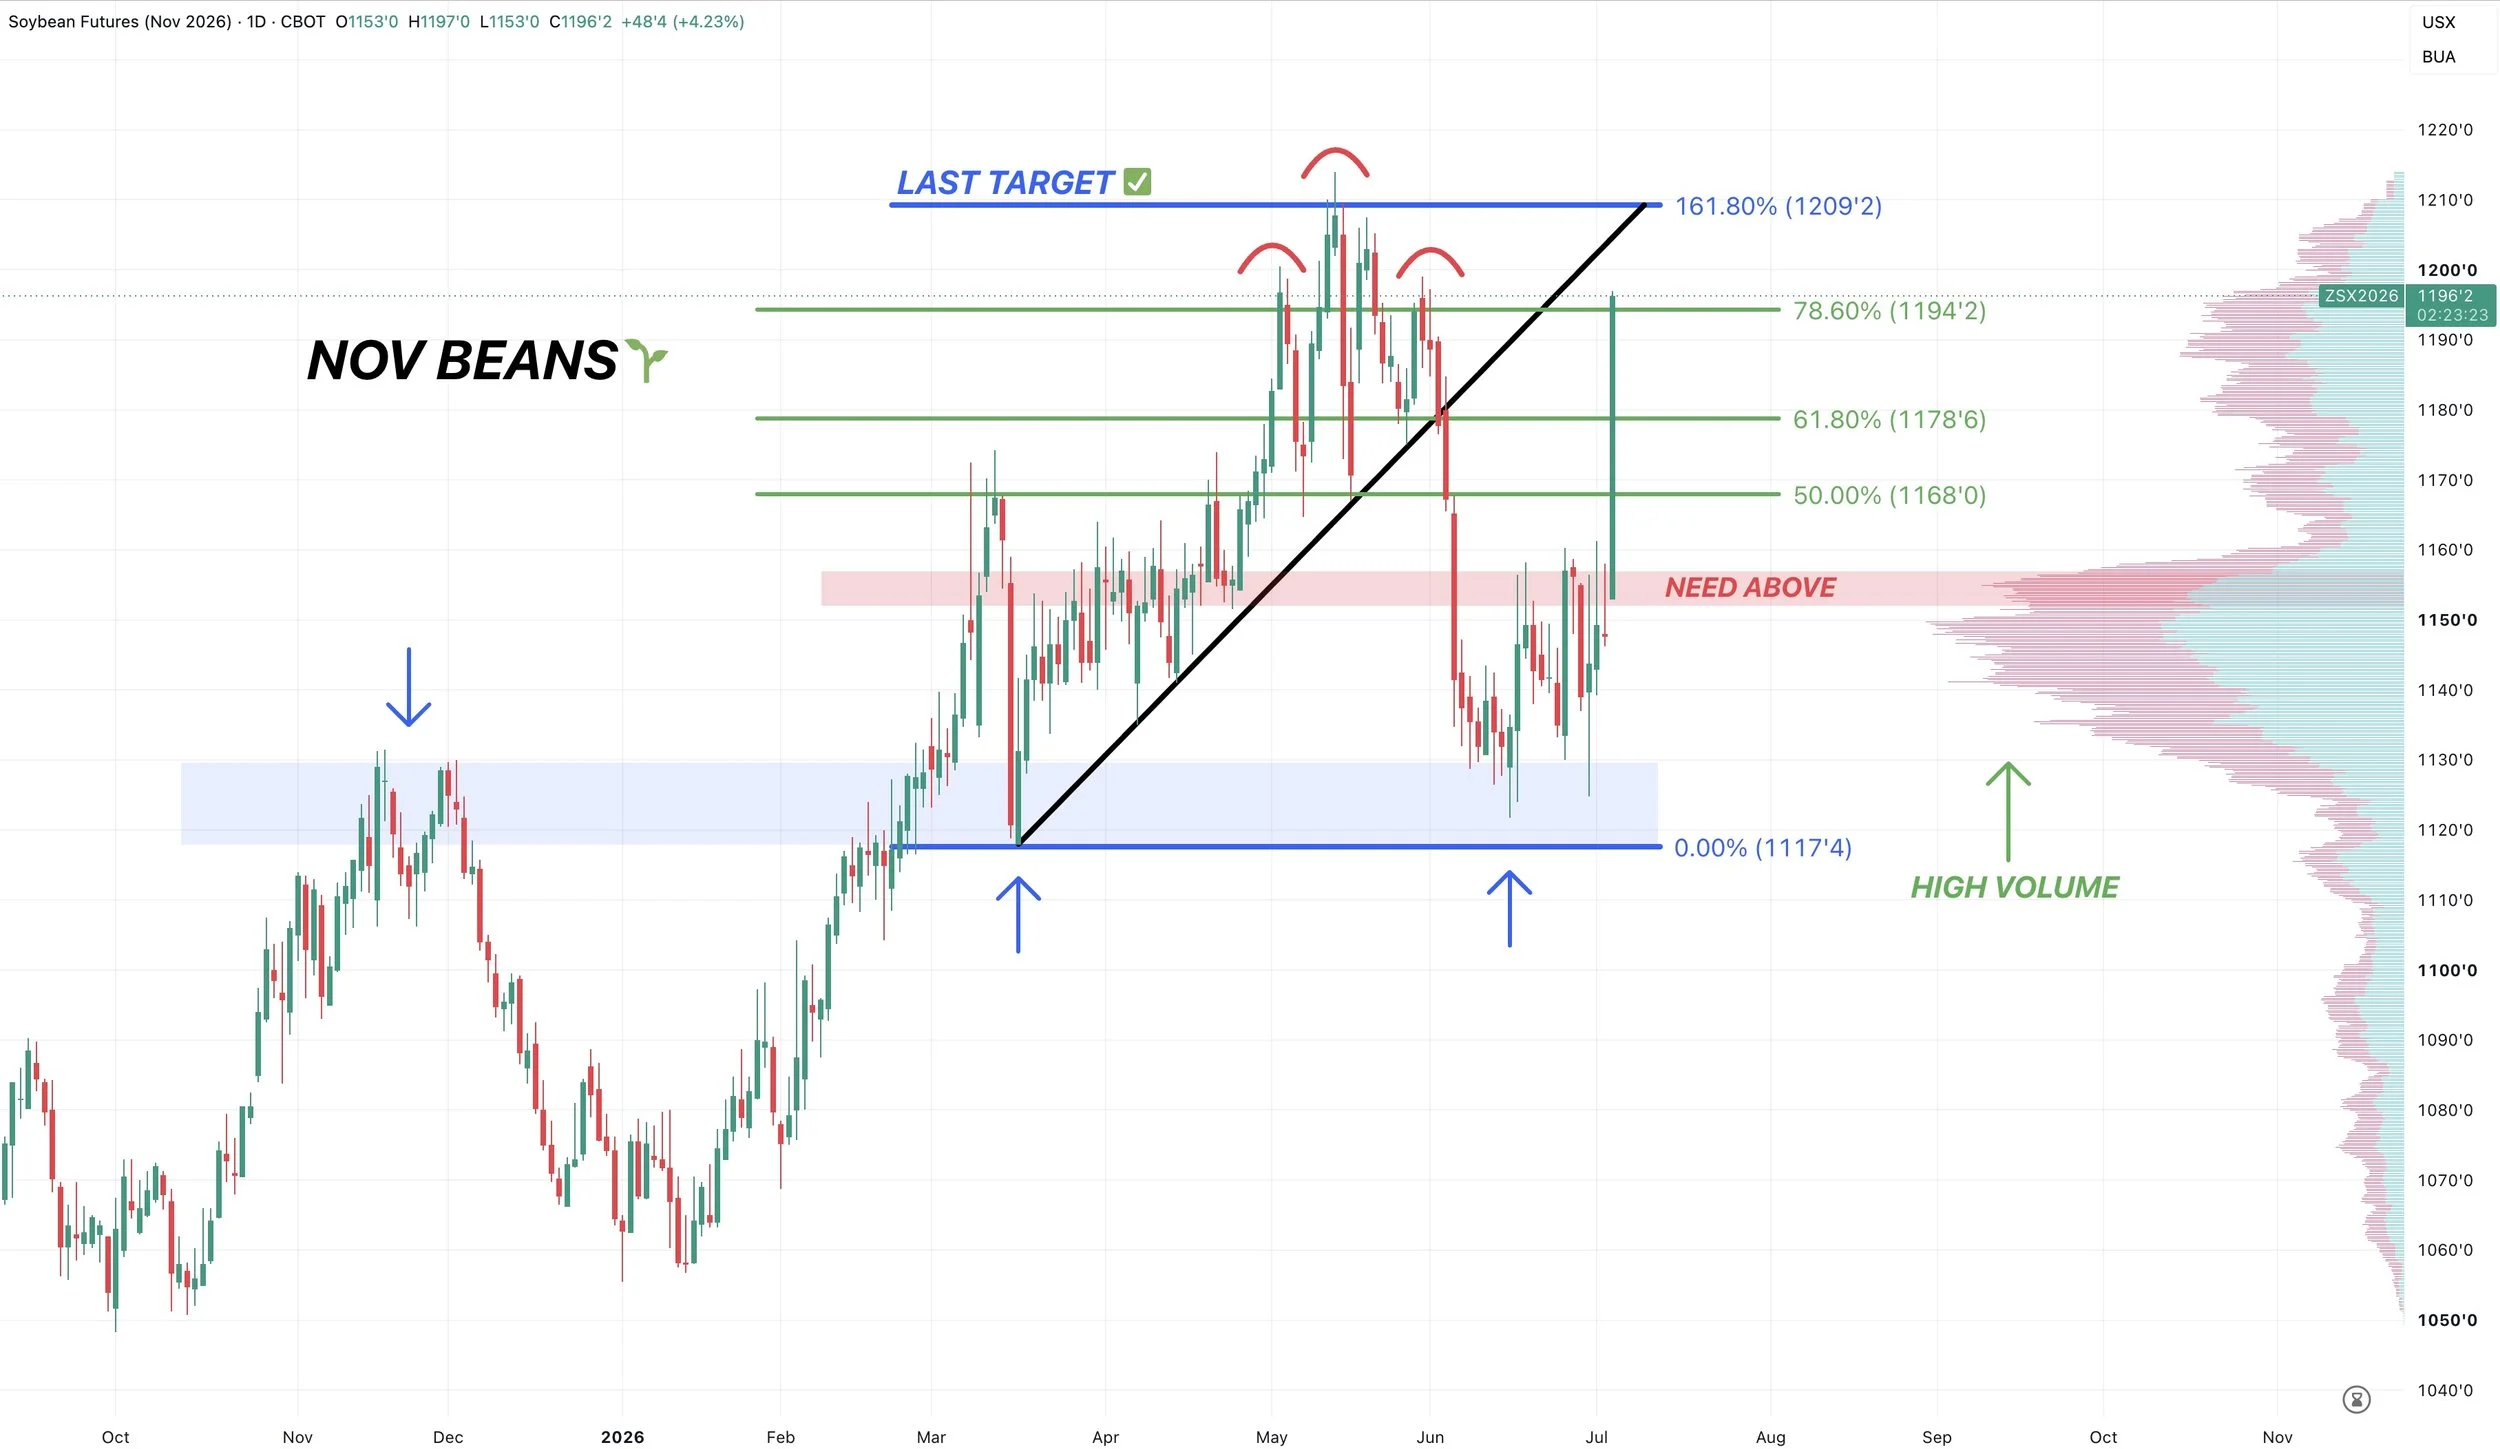
Nov Beans 🌱
We broke that resistance and an area of high volume.
We’ve now clawed back 78.6% off the sell off.
Sitting at some of the highest levels we’ve seen all year after just seeing a -90 cent drawdown.
Want to Talk?
Our phones are open 24/7 for you guys if you ever need anything or want to discuss your operation.
Jeremey & Office: (806)484-1214
Sebastian: (605)280-1186
Email: sfrost@dailymarketminute.com
Hedge Account
Interested in a hedge account? Use the link below to set up an account or give us a call.
FACTORS & UNKNOWNS IN GRAINS
AUDIO COMMENTARY
Cattle been pretty sideways for months
Be comfortable with cattle downside risk
Factors influencing grains moving forward
Unknown sides of demand
China is the biggest unknown
Why there is big potential upside & downside
New yearly highs in new crop
Soybeans nearing November highs
Corn holding up despite first notice day
Should you have new crop priced?
How spreads work in different markets
Chance for $5 new crop corn?
Wheat at potential support (chart below)*
Listen to todays audio below
Want to talk? (605)250-3863
Your subscription has expired
Please update your account or give Sebastian a call
Sebastian: (605)280-1186
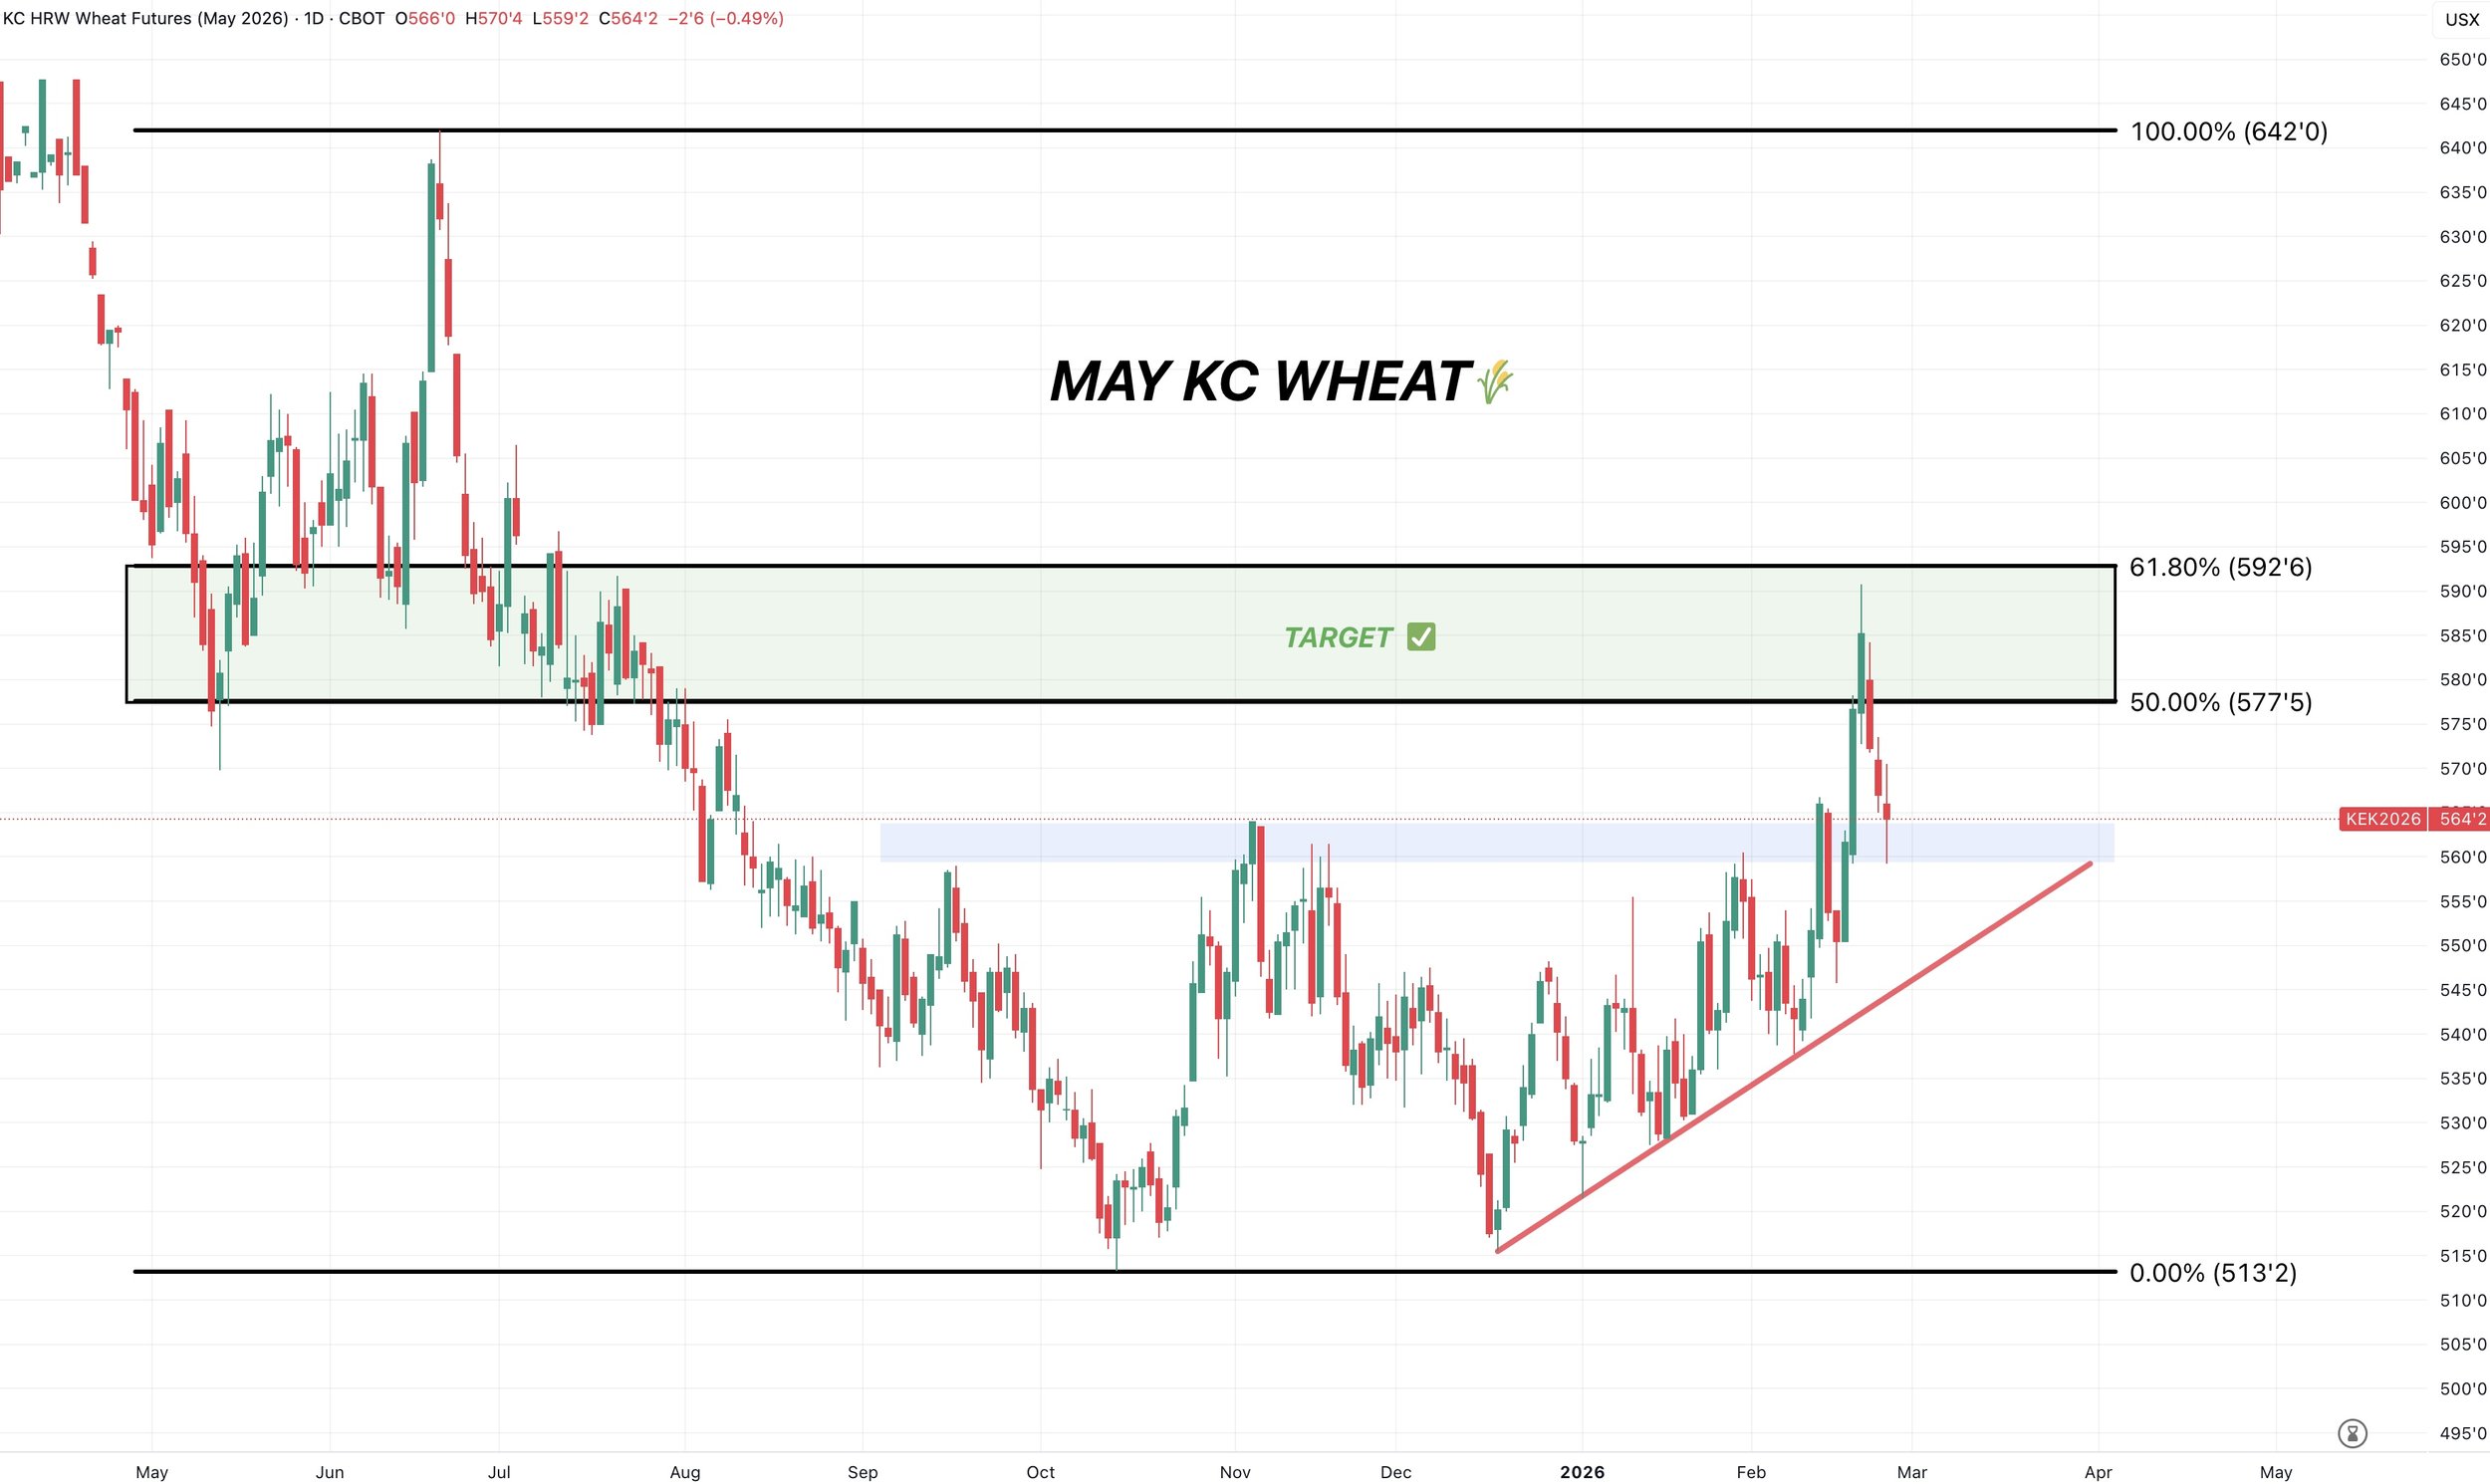
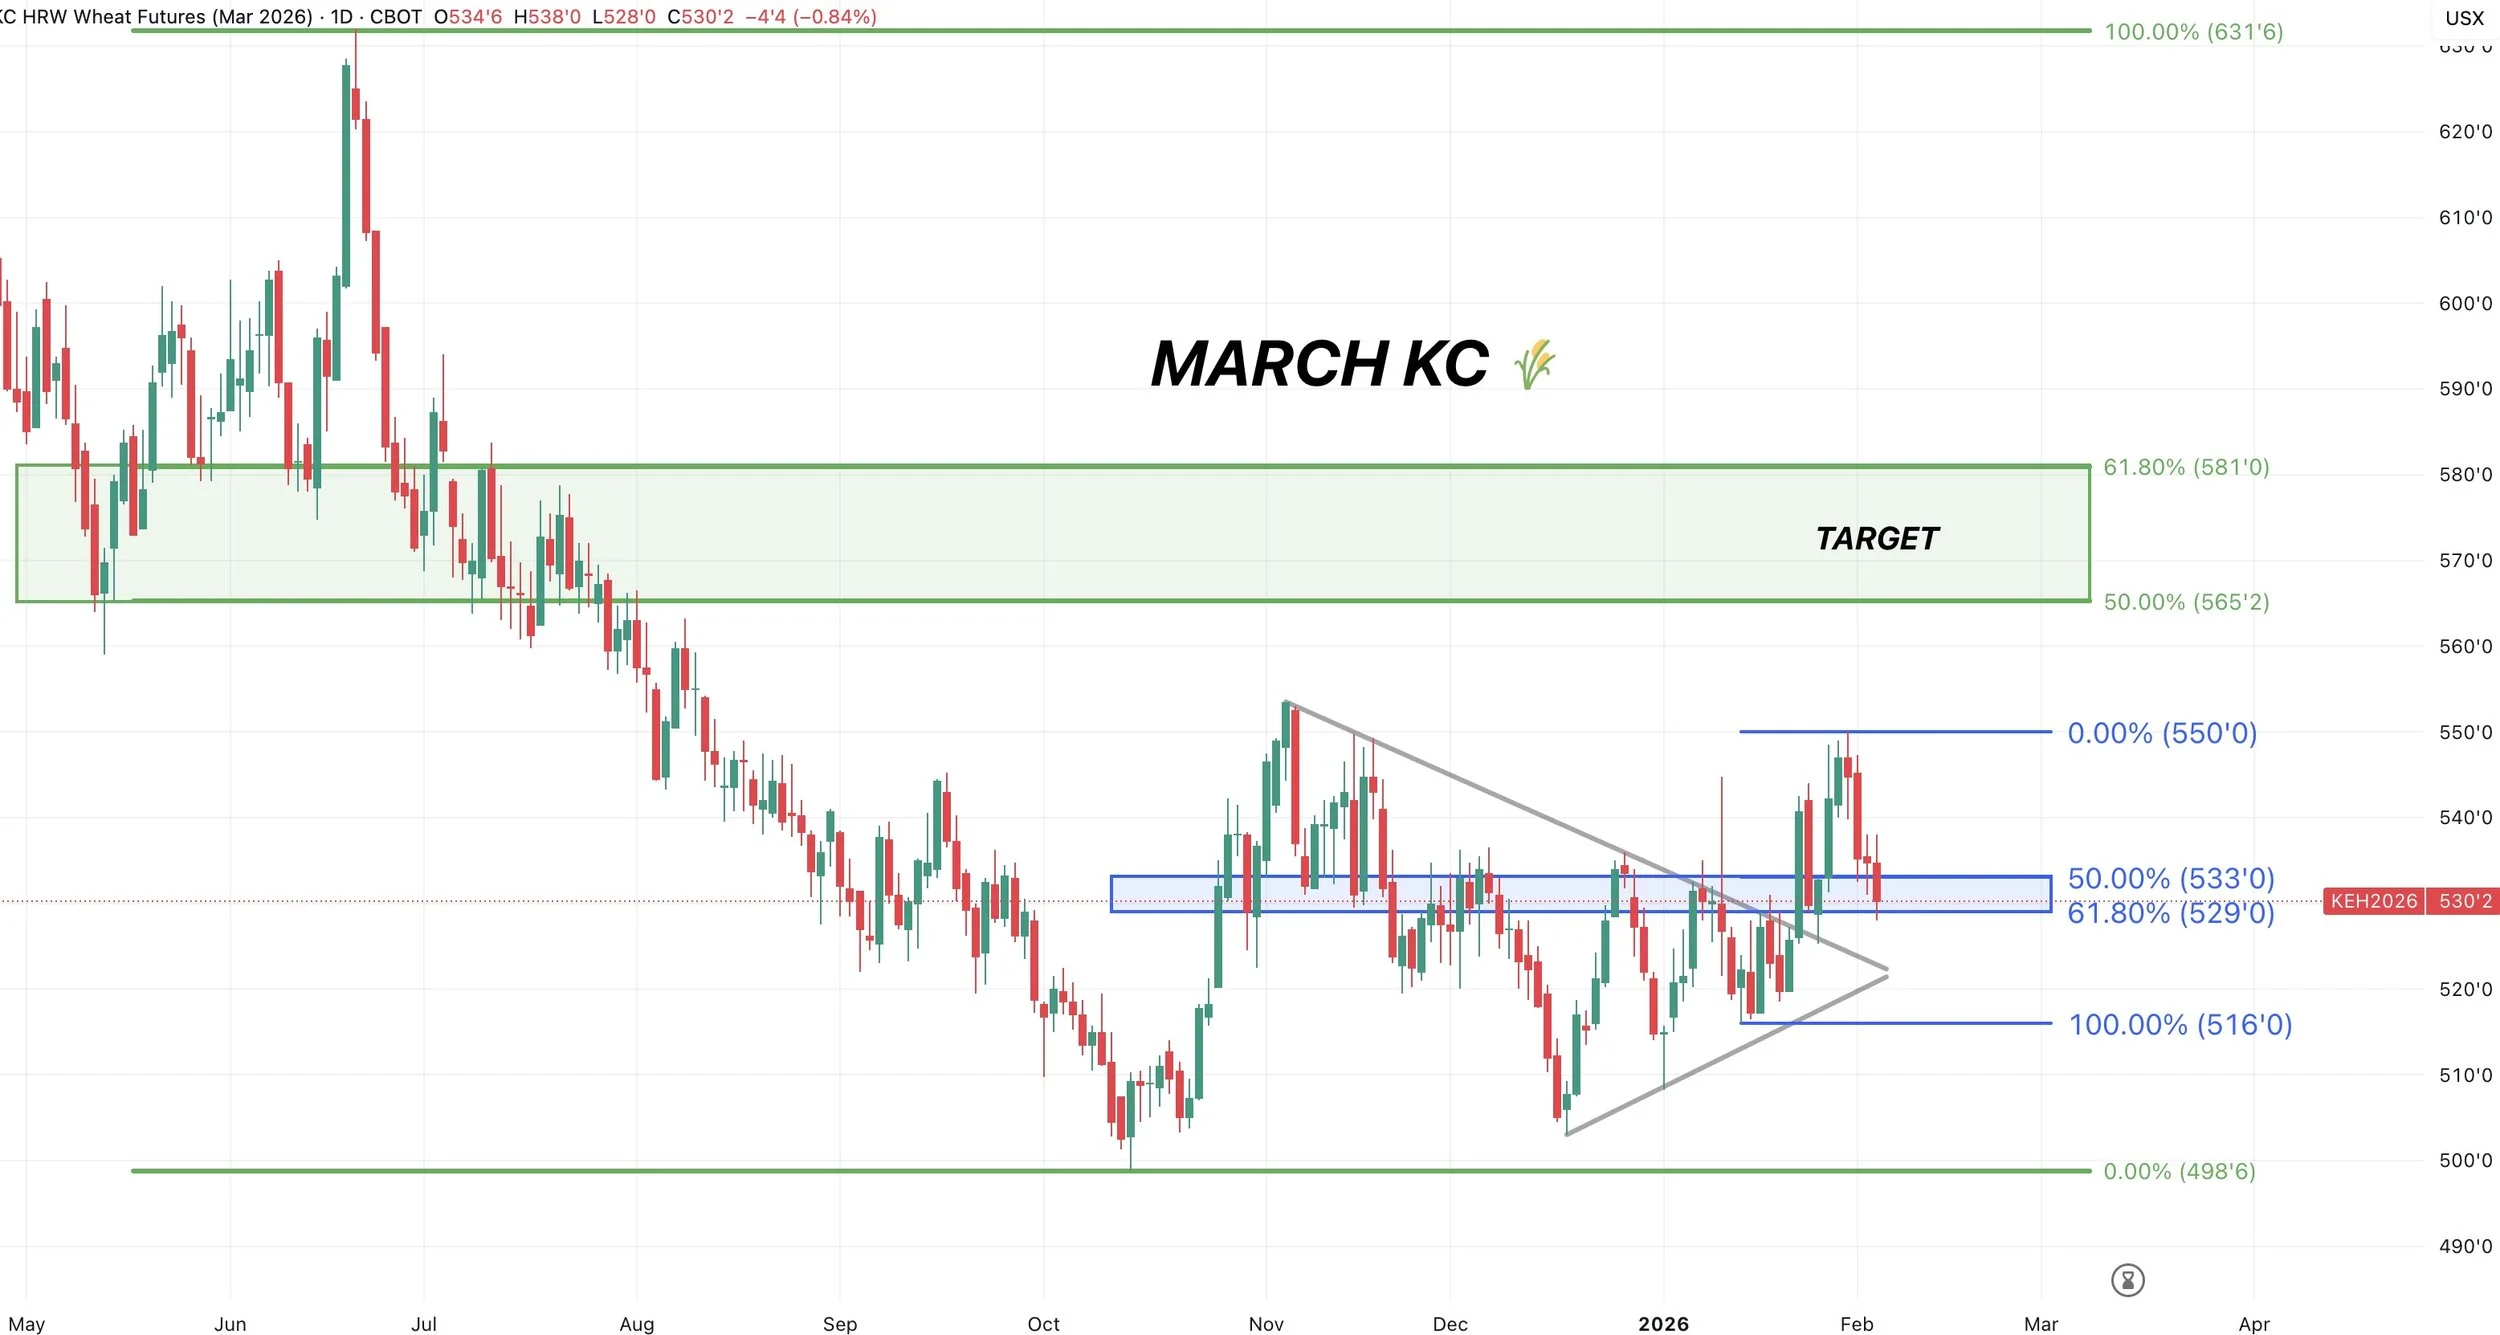
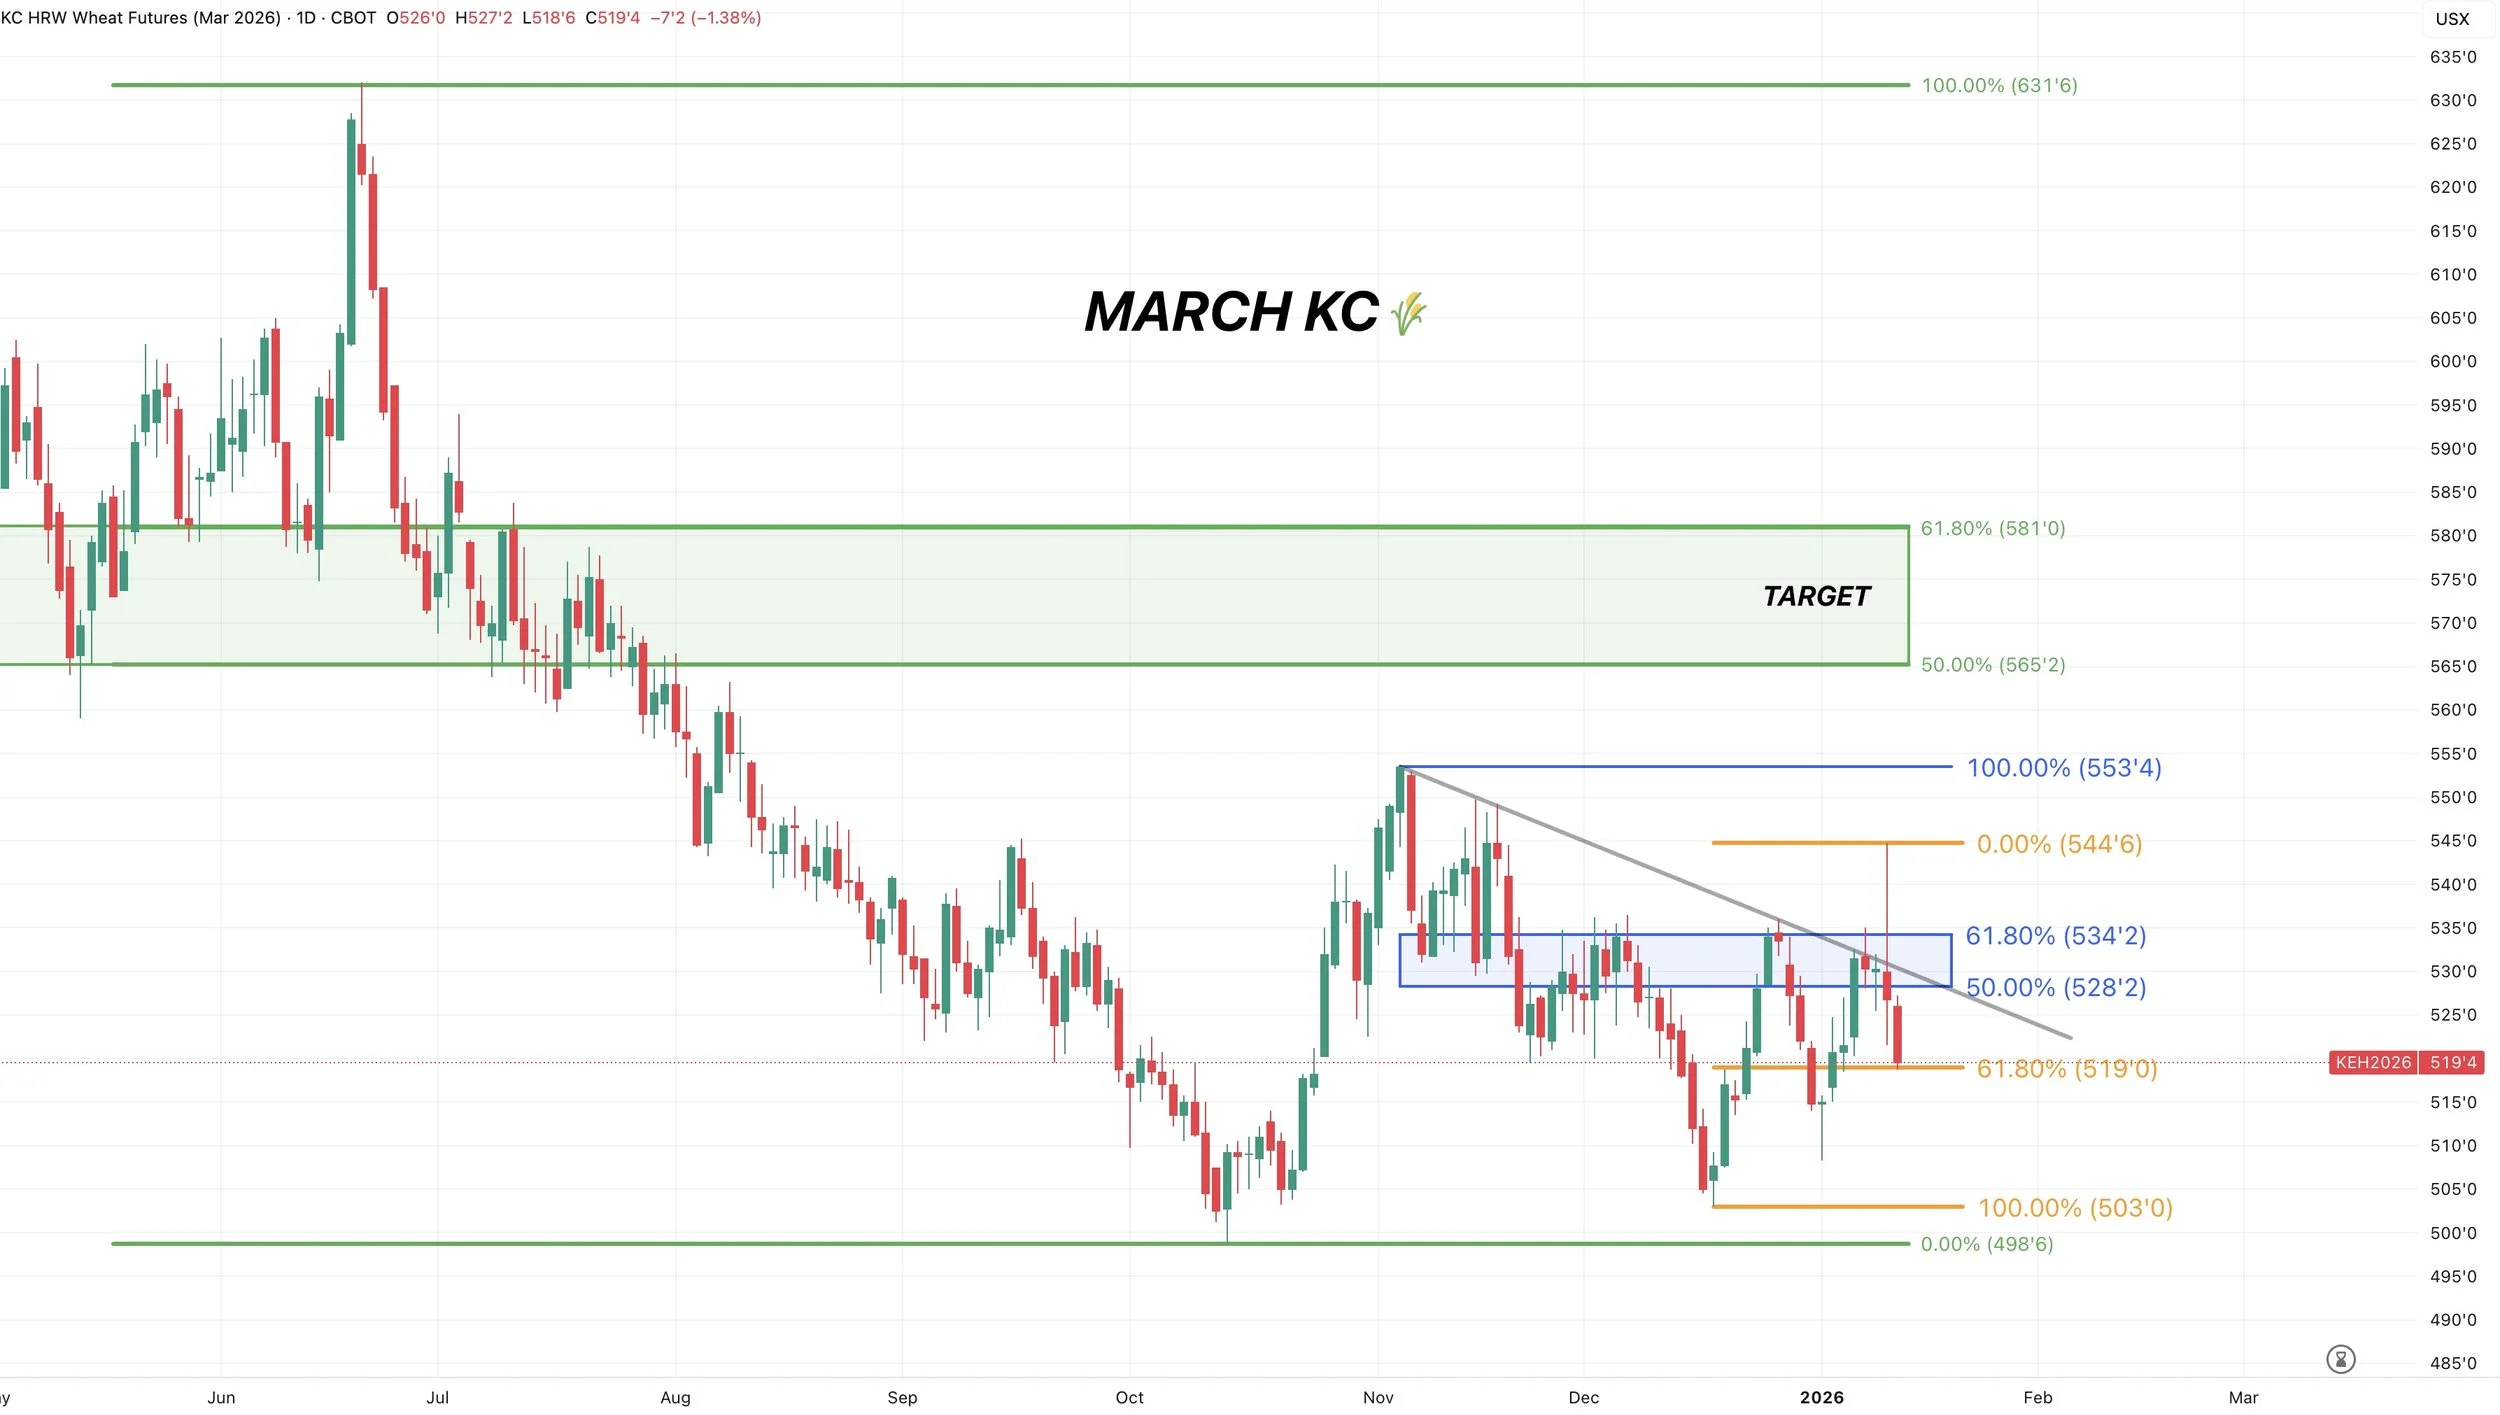
KC WHEAT CHART
May KC 🌾
Failed the target box.
Now coming down to test the old point of the breakout like we discussed.
Sitting at some potential support here.
This was our old resistance on a few occasions. Now viewed as support. Bulls would like to see us hold here.
Failure to hold wouldn’t look great short term.
Past Sell or Protection Signals
Feb 19th: 🌾
KC wheat sell signal & hedge alert.
Feb 6th: 🌽 🌱
Corn & soybean sell signal & hedge alert.
Feb 4th: 🌱
Soybean sell signal & hedge alert.
Dec 11th: 🐮
Cattle sell signal & hedge alert.
Dec 5th: 🐮
Cattle sell signal & hedge alert.
Nov 17th: 🌱
Soybean sell signal & hedge alert.
Nov 13th: 🌽 🌱
Managing risk in corn & beans ahead of USDA report.
Oct 28th: 🌽
Corn sell signal & hedge alert.
Oct 27th: 🌱
Soybean sell signal & hedge alert.
Oct 13th: 🐮
Cattle sell signal & hedge alert.
Aug 22nd: 🌱
Soybean sell signal & hedge alert.
July 31st: 🐮
Cattle sell signal & hedge alert.
July 10th: 🐮
Cattle sell signal & hedge alert.
CLICK HERE TO VIEW
June 5th: 🐮
Cattle sell signal & hedge alert.
June 2nd: 🌾
MPLS wheat sell signal.
April 10th: 🌽
Old crop corn sell signal.
March 19th: 🐮
Cattle hedge & sell signal.
Feb 18th: 🌽 🌾
Old crop KC wheat & old crop corn signal.
Jan 23rd: 🌽 🌱
Corn & beans old crop sell signal.
CLICK HERE TO VIEW
Jan 15th: 🌽 🌱
Corn & beans hedge alert/sell signal.
Jan 2nd: 🐮
Cattle hedge alert at new all-time highs & target.
Dec 11th: 🌽
Corn sell signal at $4.51 200-day MA
CLICK HERE TO VIEW
Oct 2nd: 🌾
Wheat sell signal at $6.12 target
Sep 30th: 🌽
Corn protection signal at $4.23-26
Sep 27th: 🌱
Soybean sell & protection signal at $10.65
Sep 13th: 🌾
Wheat sell signal at $5.98
May 22nd: 🌾
Wheat sell signal when wheat traded +$7.00
Want to Talk?
Our phones are open 24/7 for you guys if you ever need anything or want to discuss your operation.
Hedge Account
Interested in a hedge account? Use the link below to set up an account or shoot Jeremey a call at (605)295-3100.
TRUMP SAYS CHINA WILL BUY MORE BEANS
MARKET UPDATE
You can scroll to read the usual update as well. As the written version is the exact same as the video.
Timestamps for video:
Trump, China & Beans: 0:00min
Corn: 8:00min
Beans: 11:20min
Wheat: 12:00min
Cattle: 13:50min
Want to talk about your situation?
(605)250-3863
Futures Prices Close
Overview
Wild day for the soybean market.
The market was slightly lower, than out of nowhere we rallied a massive +50 cents in just 20 minutes.
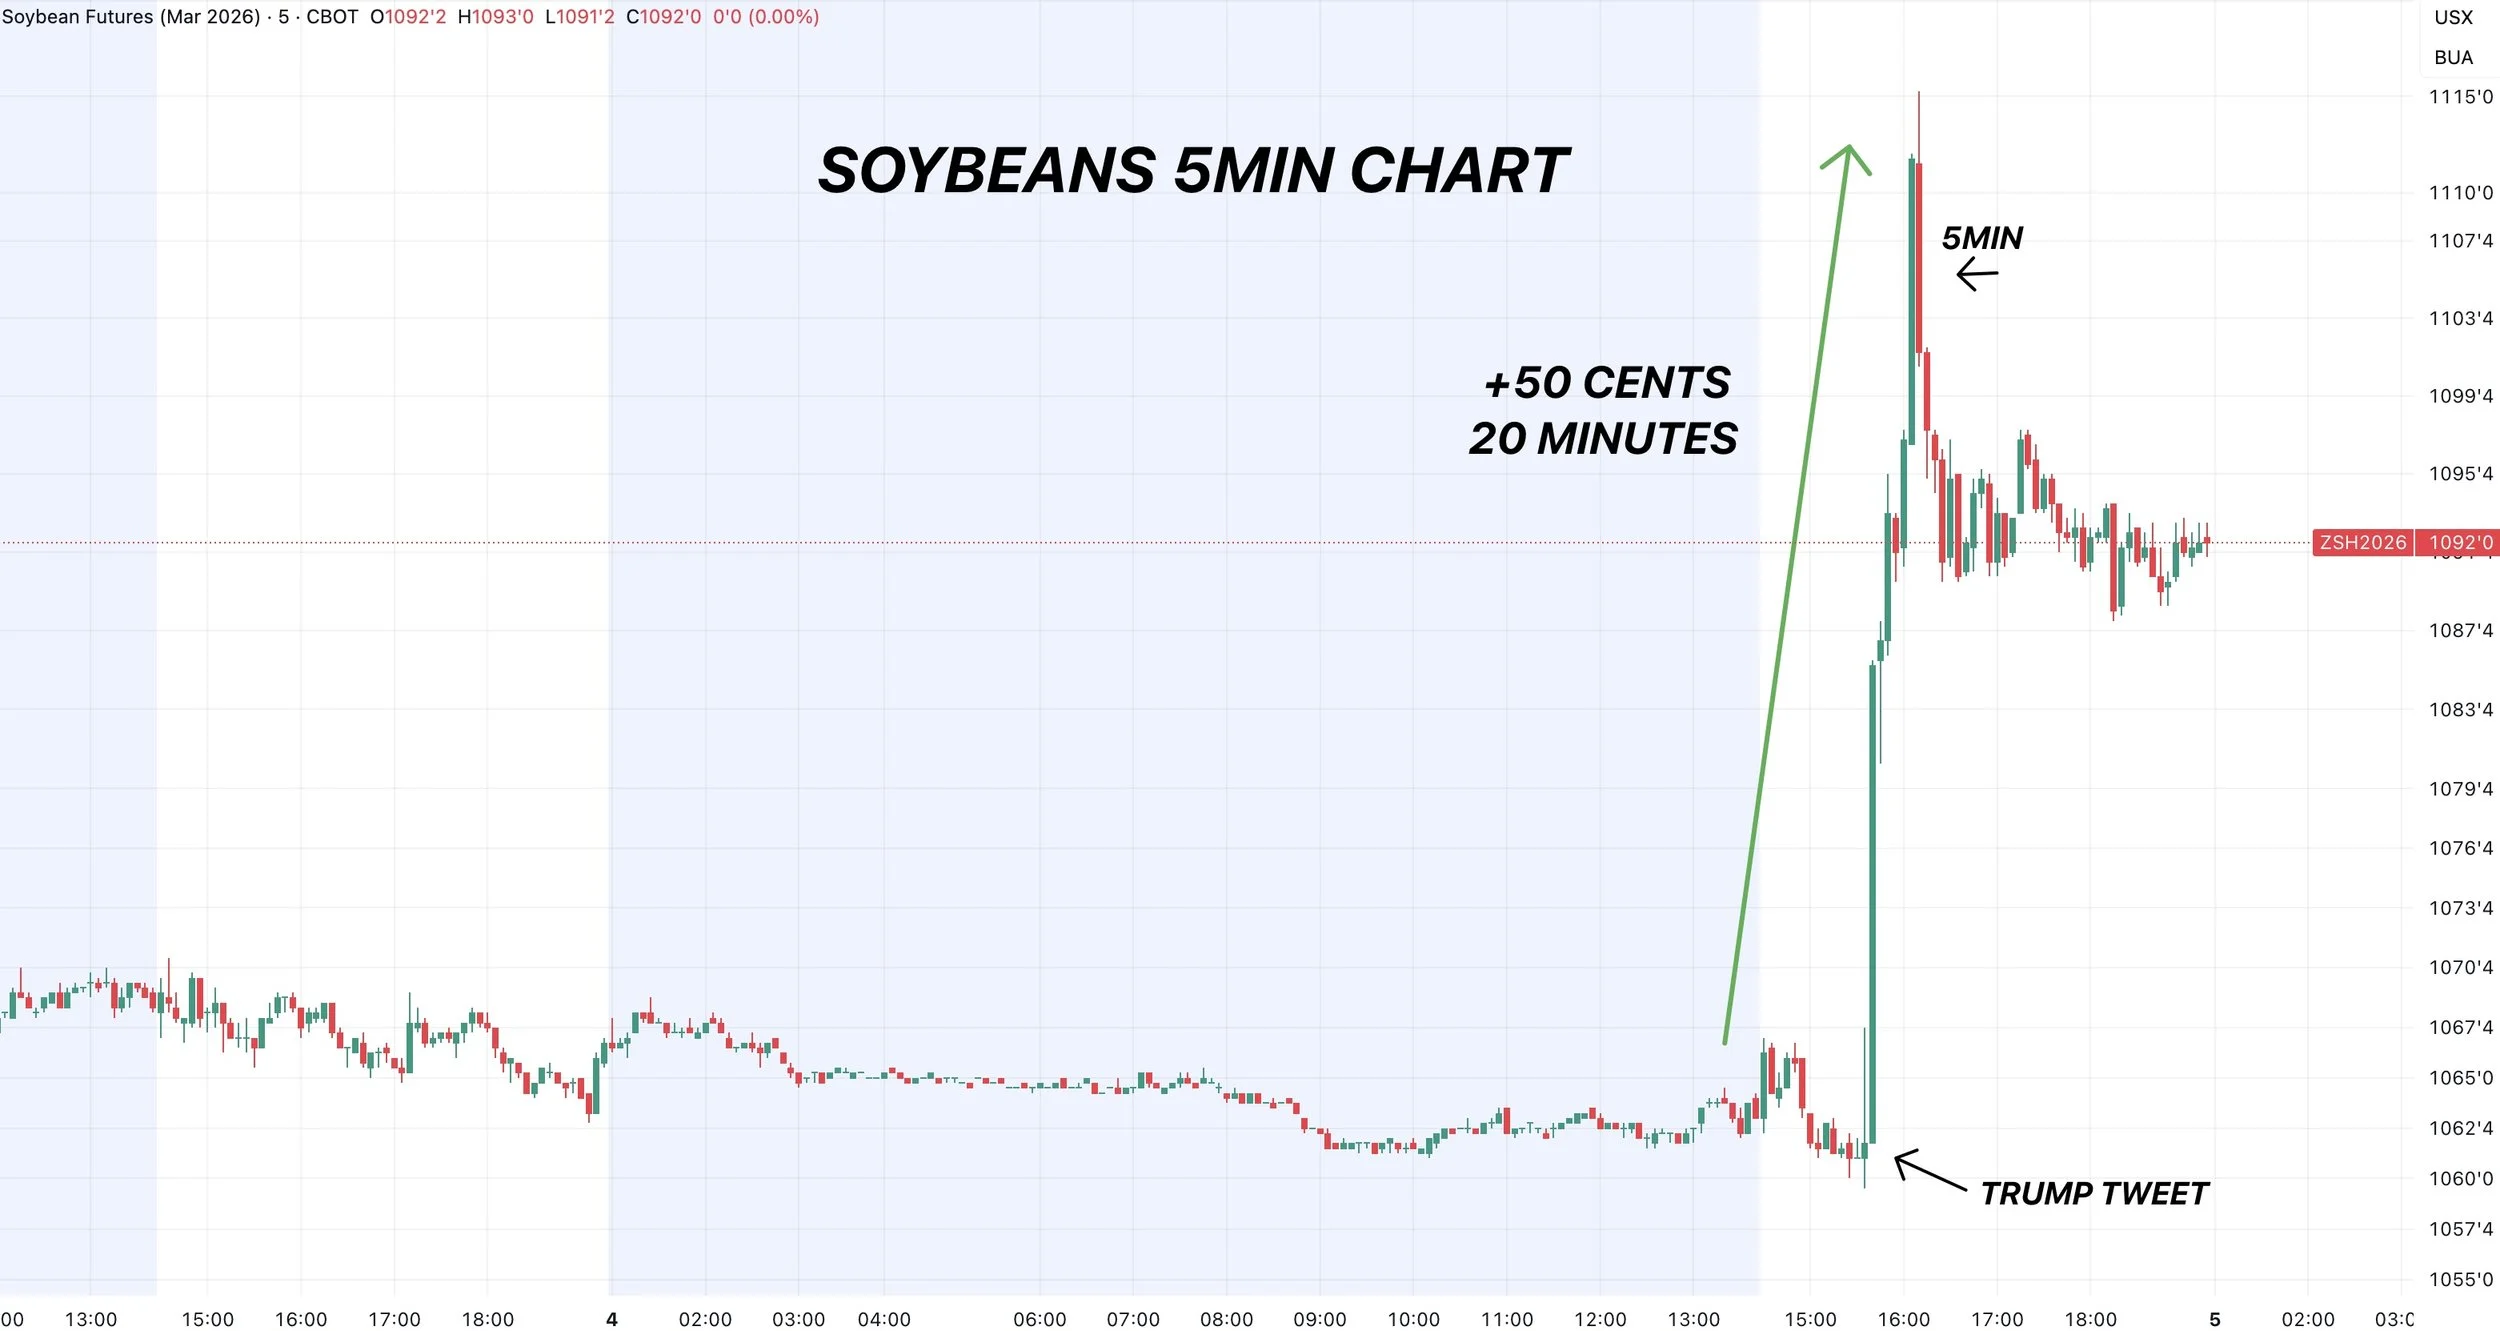
Why?
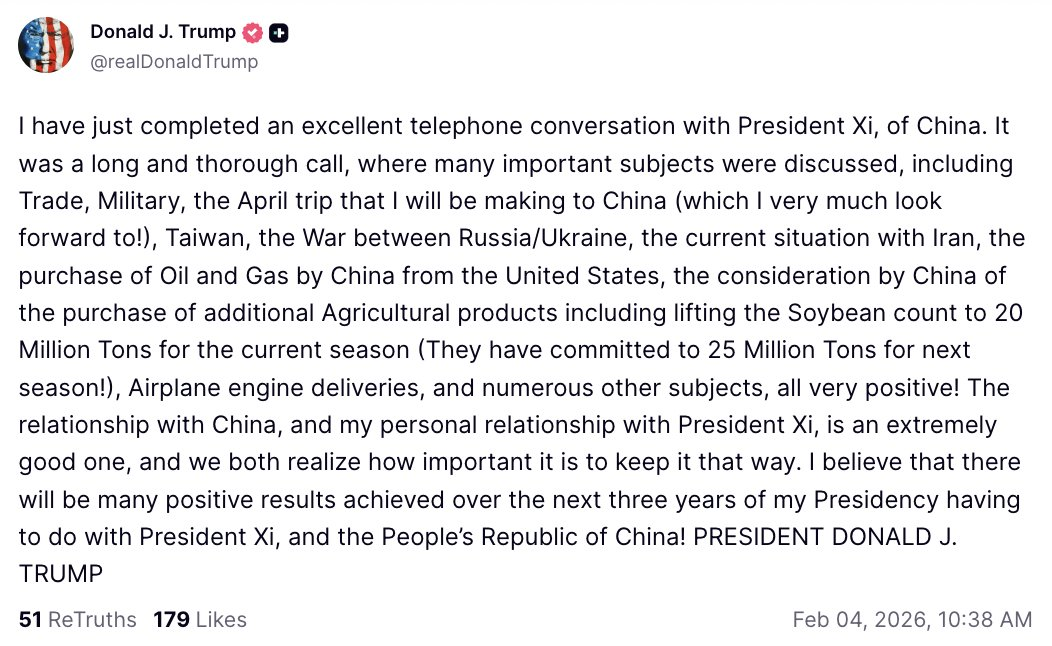
All because of one tweet from Trump.
He had a call with China. He essentially said that they discussed China bumping their soybean purchase agreement from 12 million metric tons to 20 million metric tons.
While at the same time reiterating that they are committed to fulfilling that 25 million goal for next season.
Soybean Sell Signal
This morning, we did issue our first soybean sell signal and hedge alert since November 17th, following the news.
Link to Signal
What was our reasoning behind this signal?
The main reason was simply based on the charts, as 90% of our signals are.
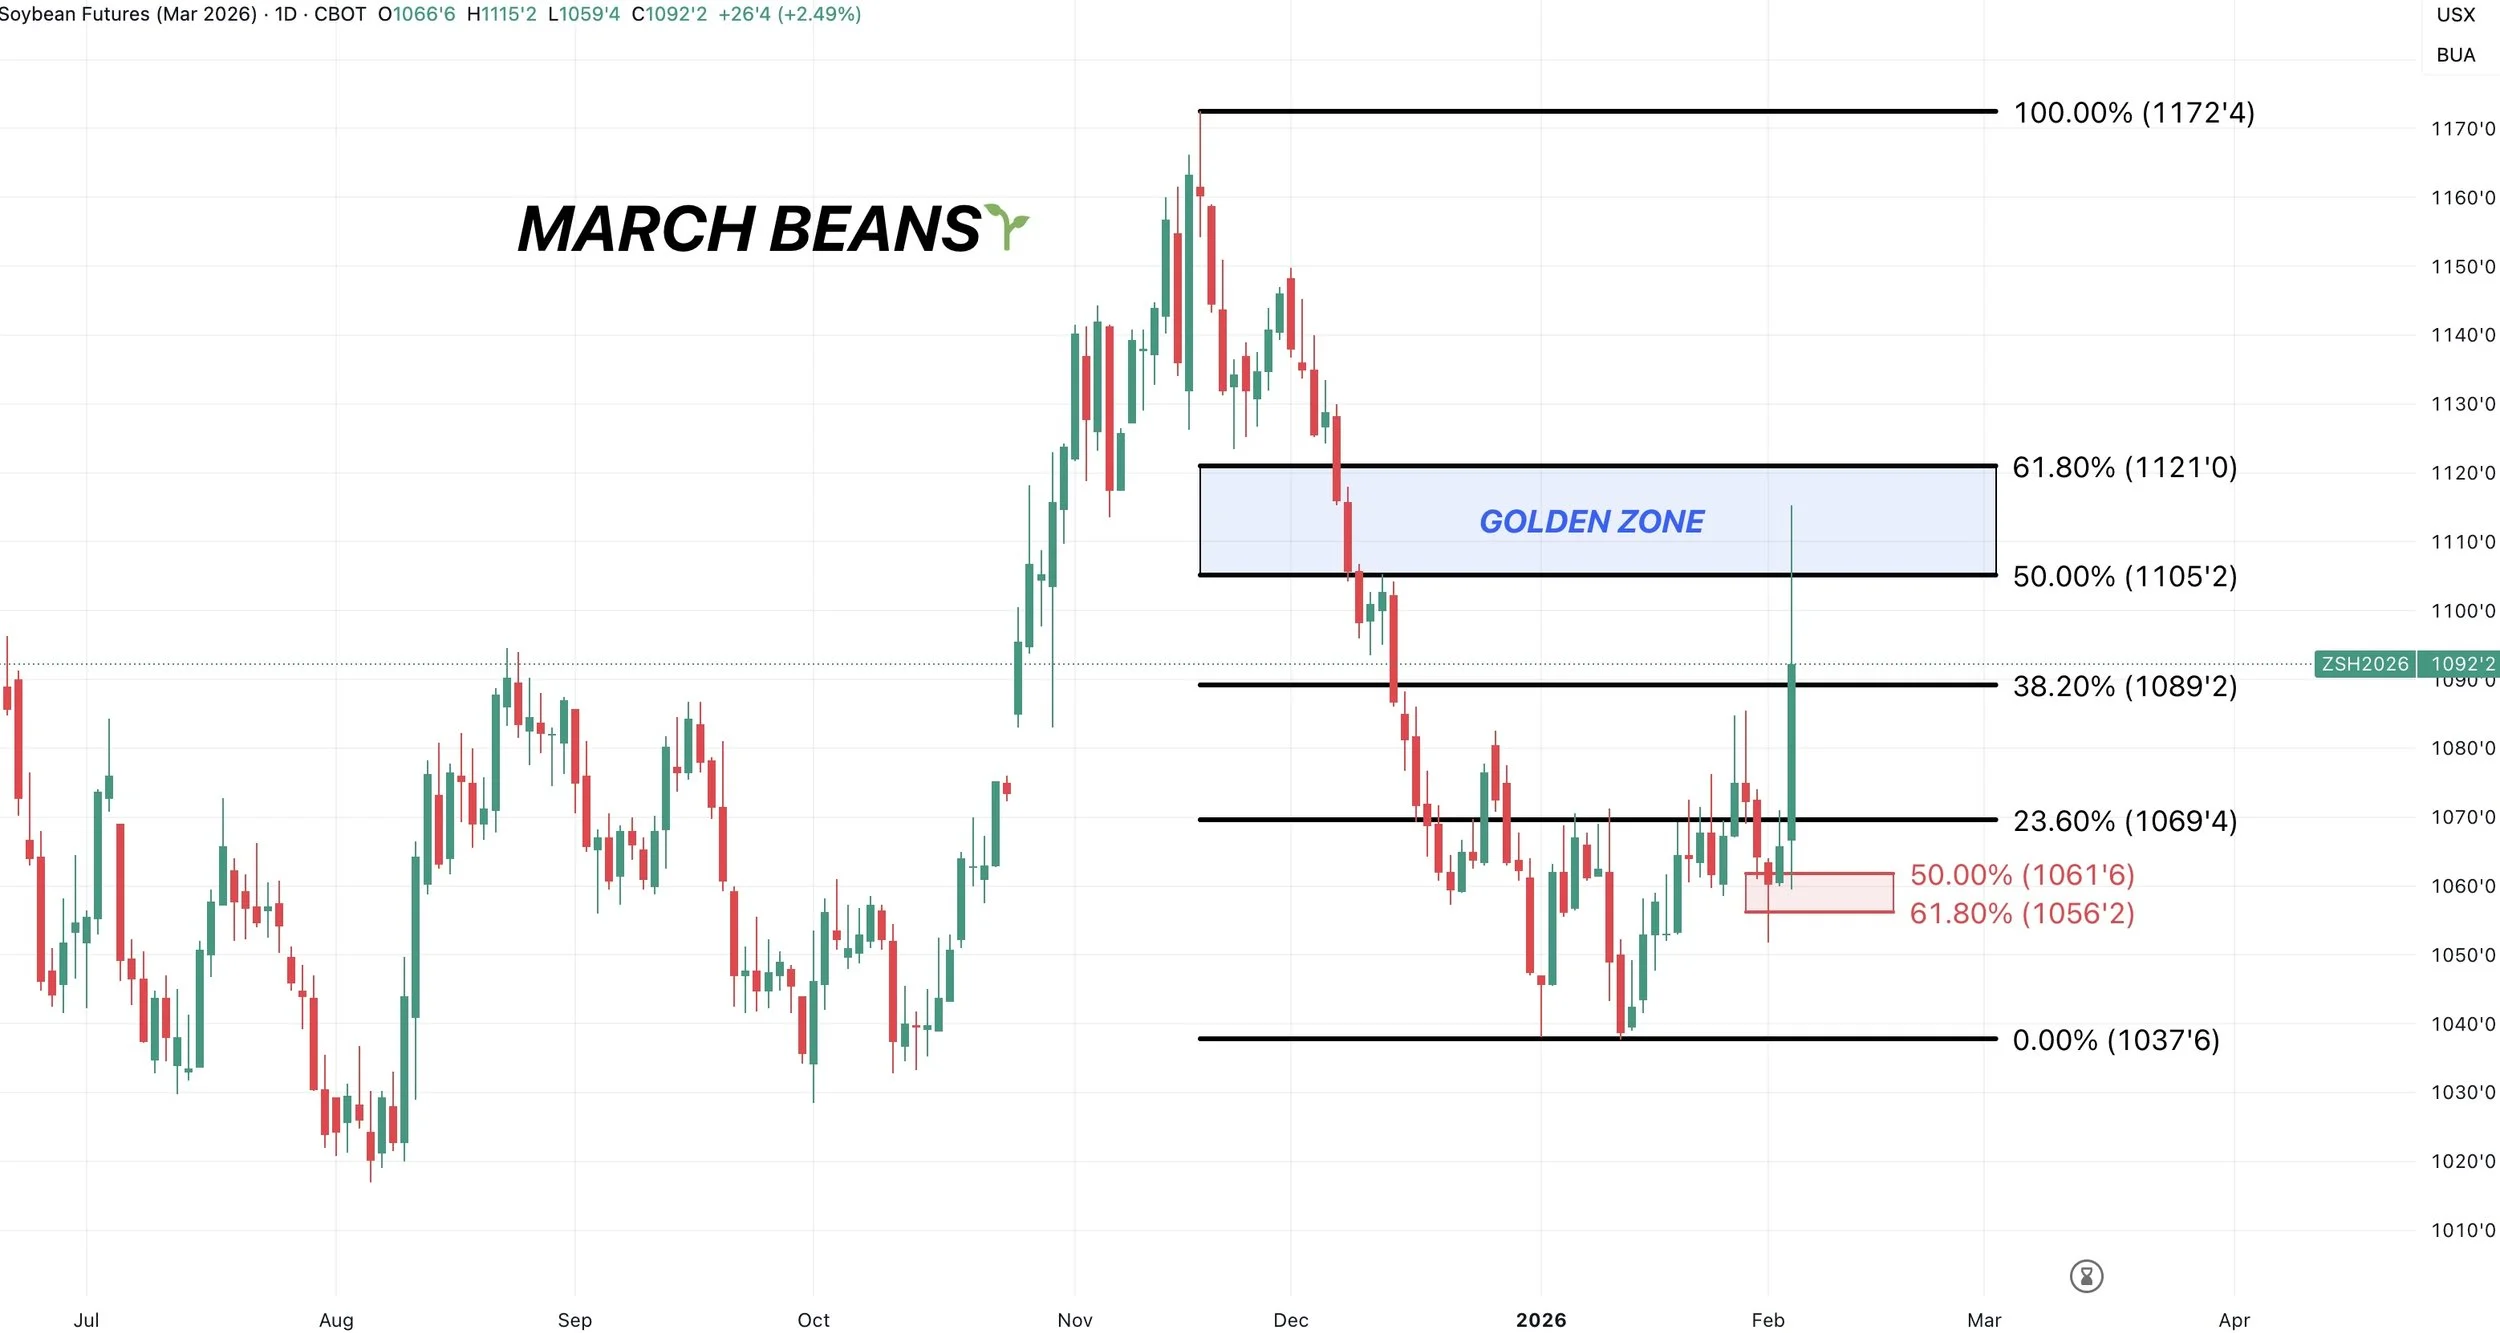
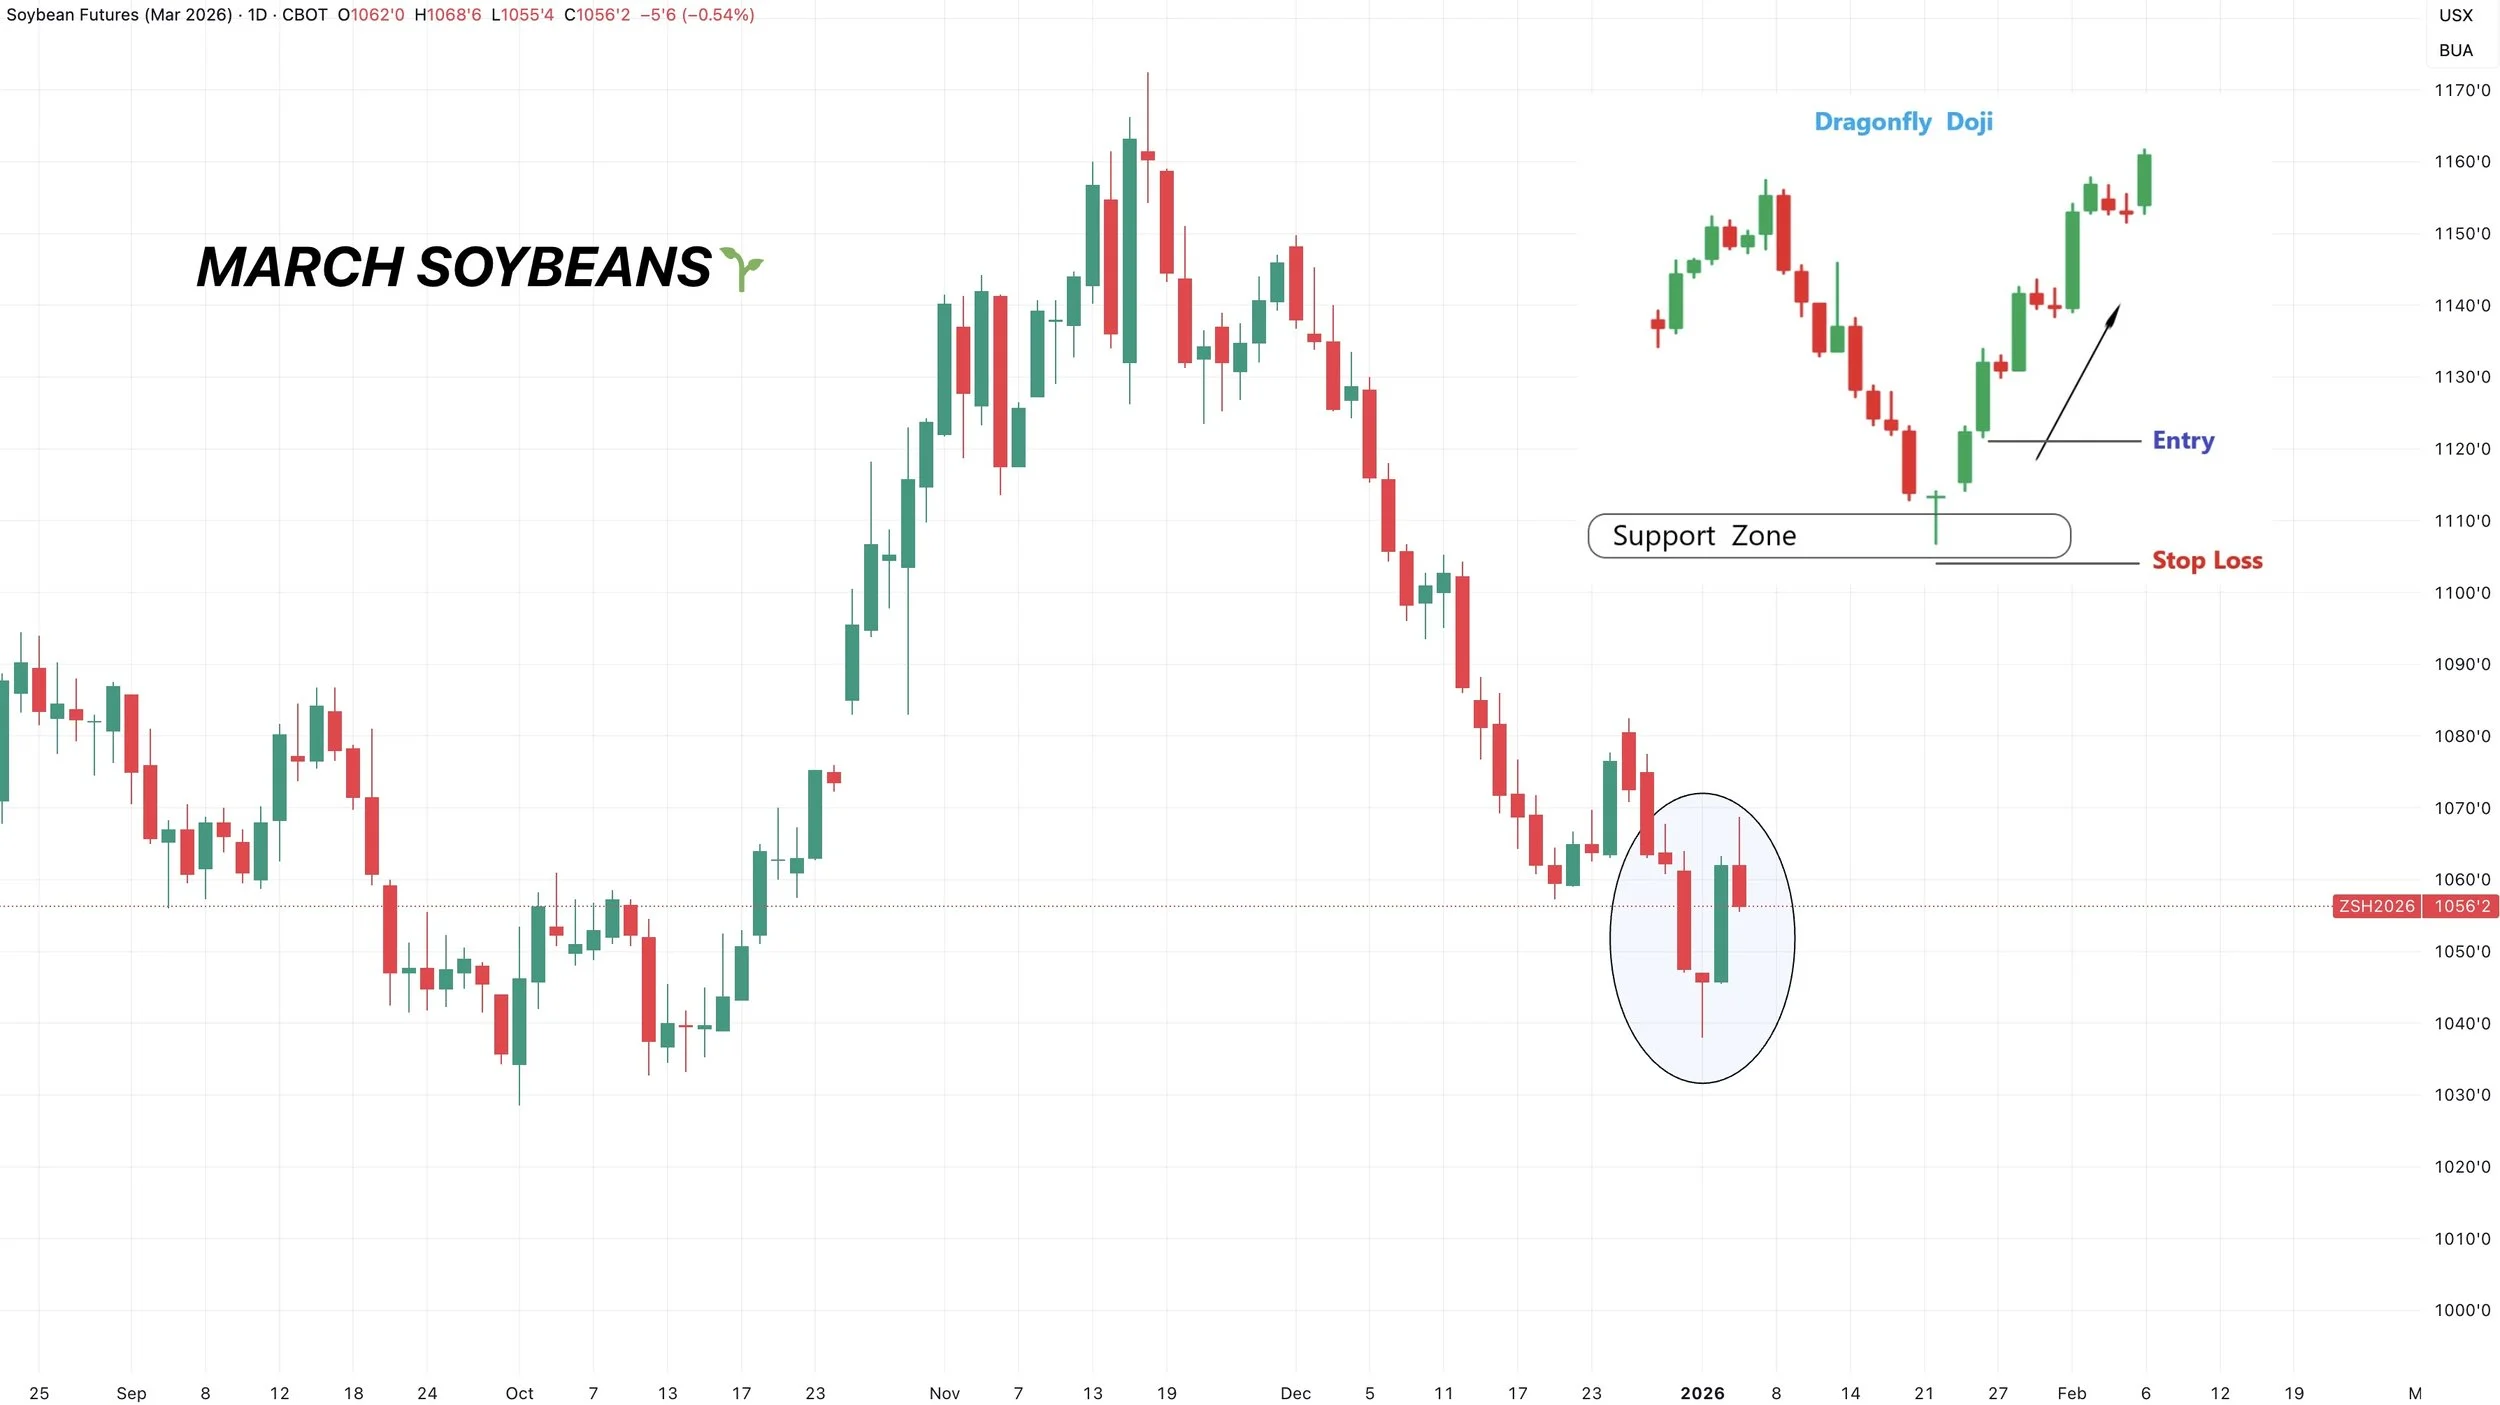
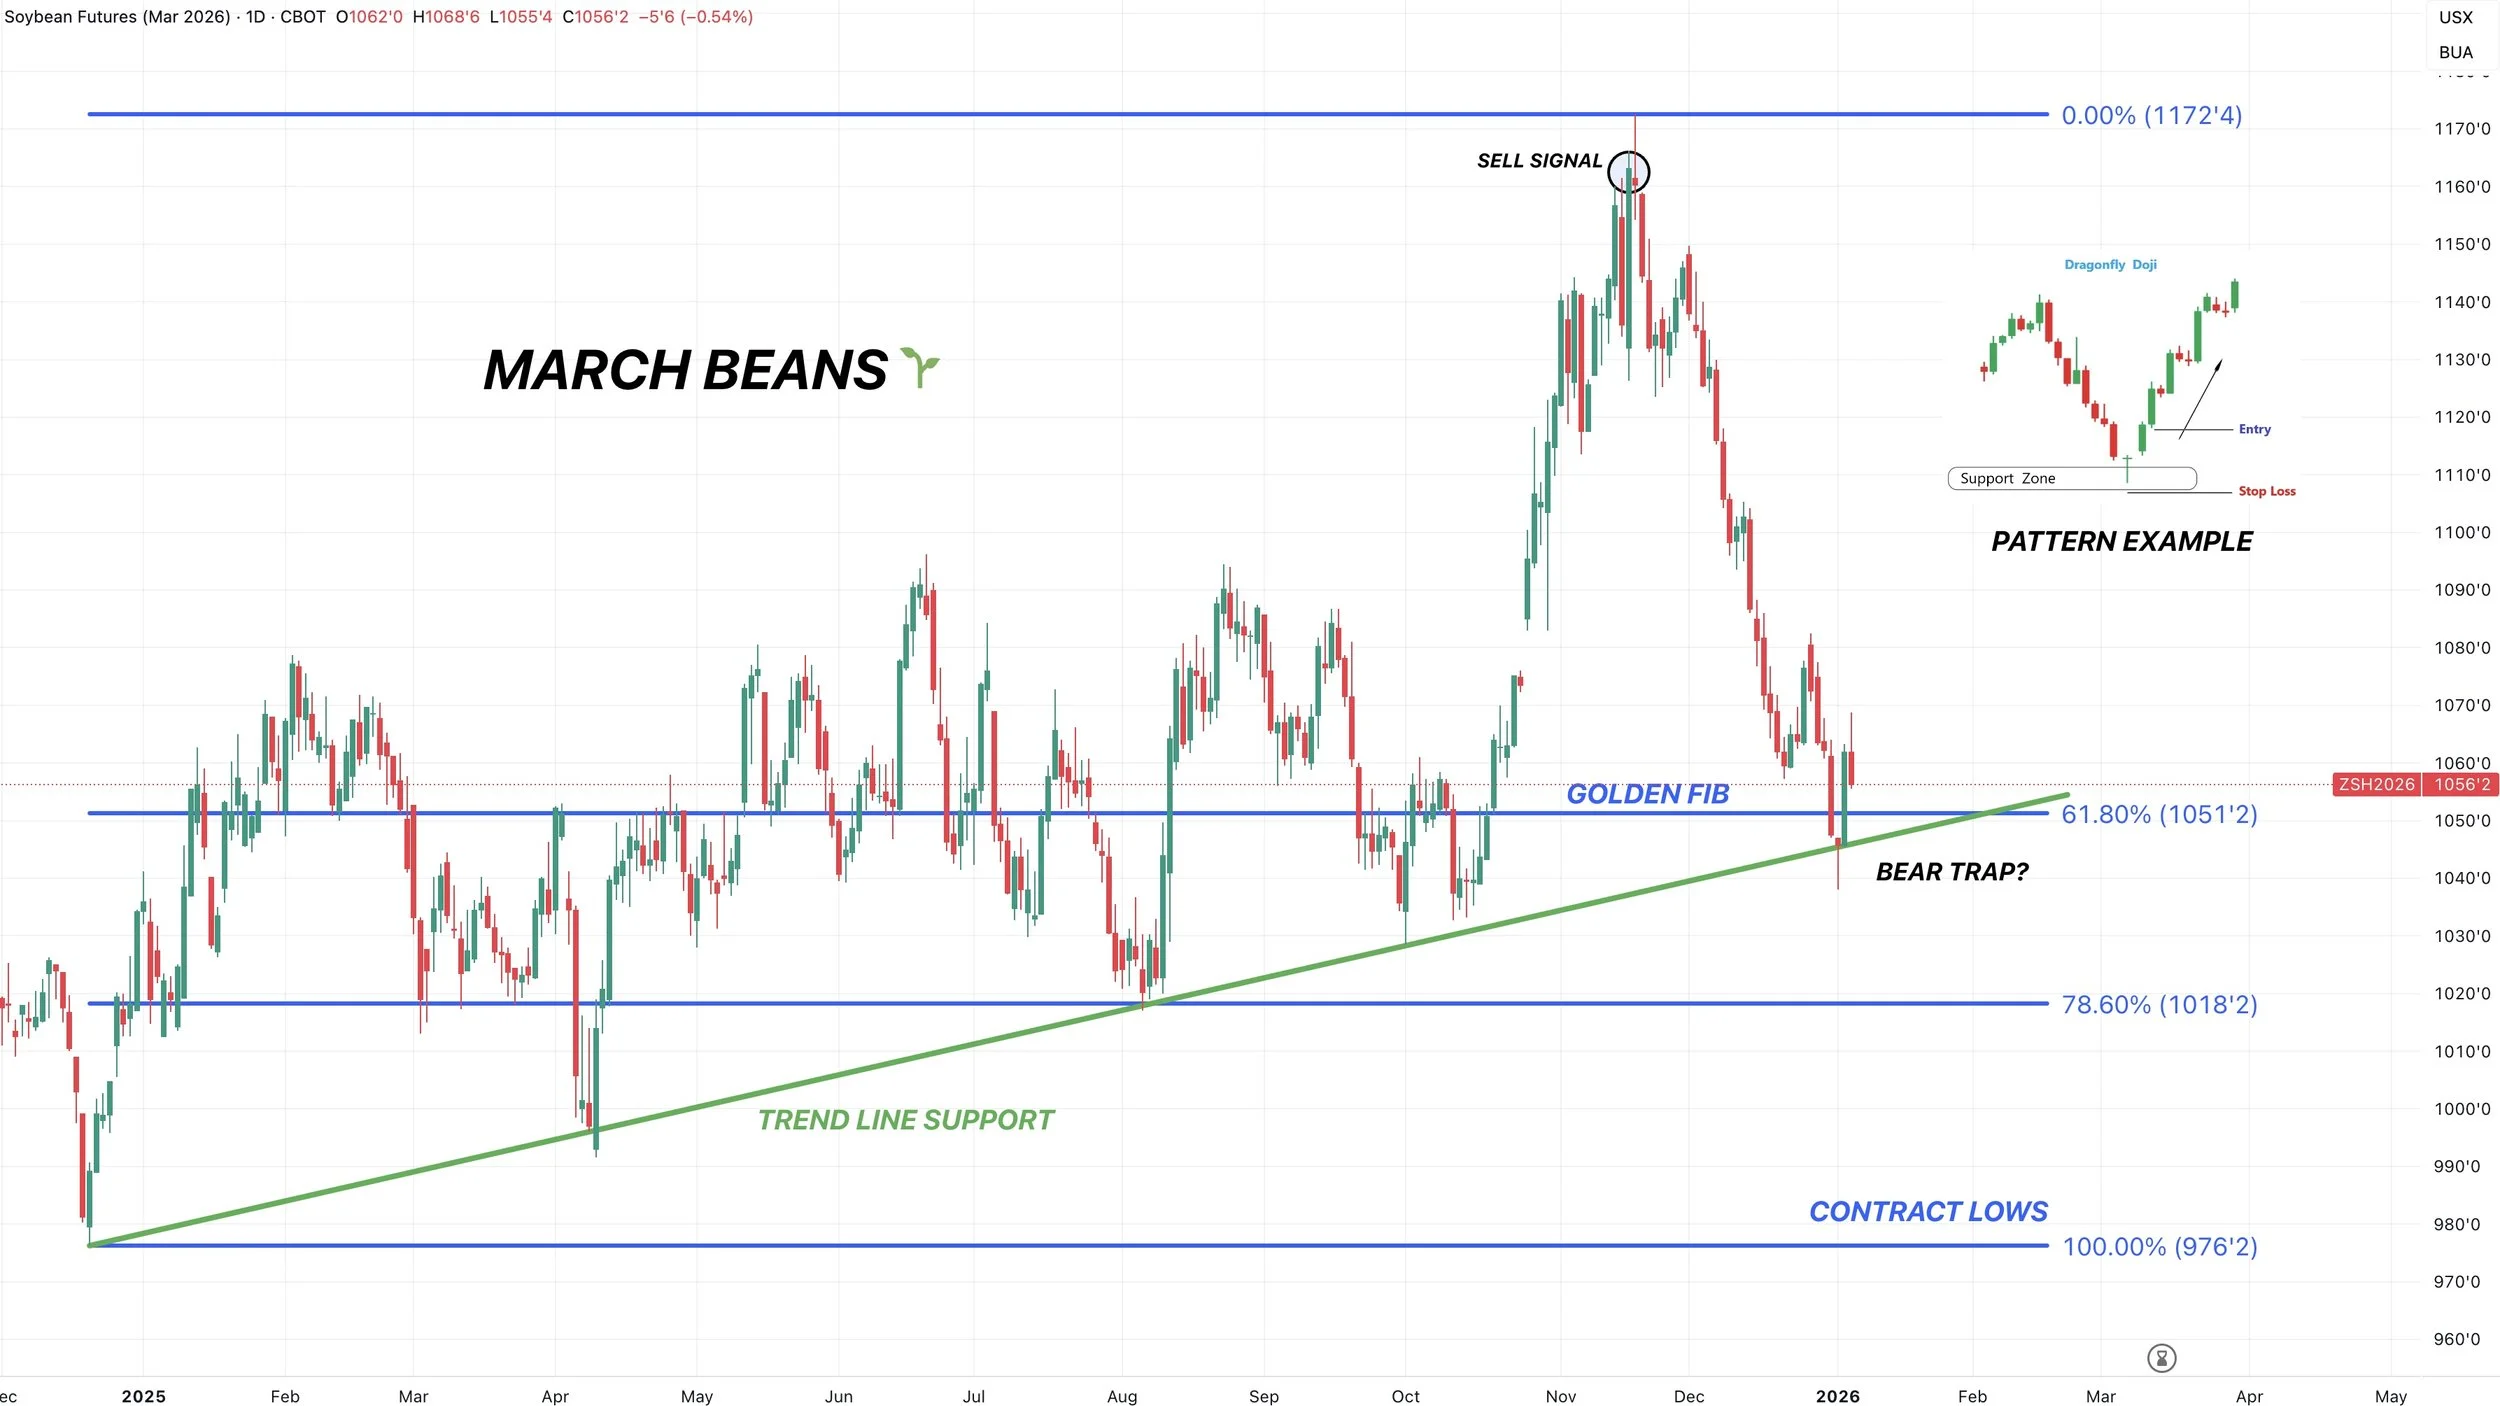
If we look at March soybeans, we alerted the signal because we hit the golden zone.
They ran right into that golden zone before ultimately falling well off their highs.
(The golden zone is when we reclaim 50-61.8% of a sell off. It is the most common spot for a bounce to fail).
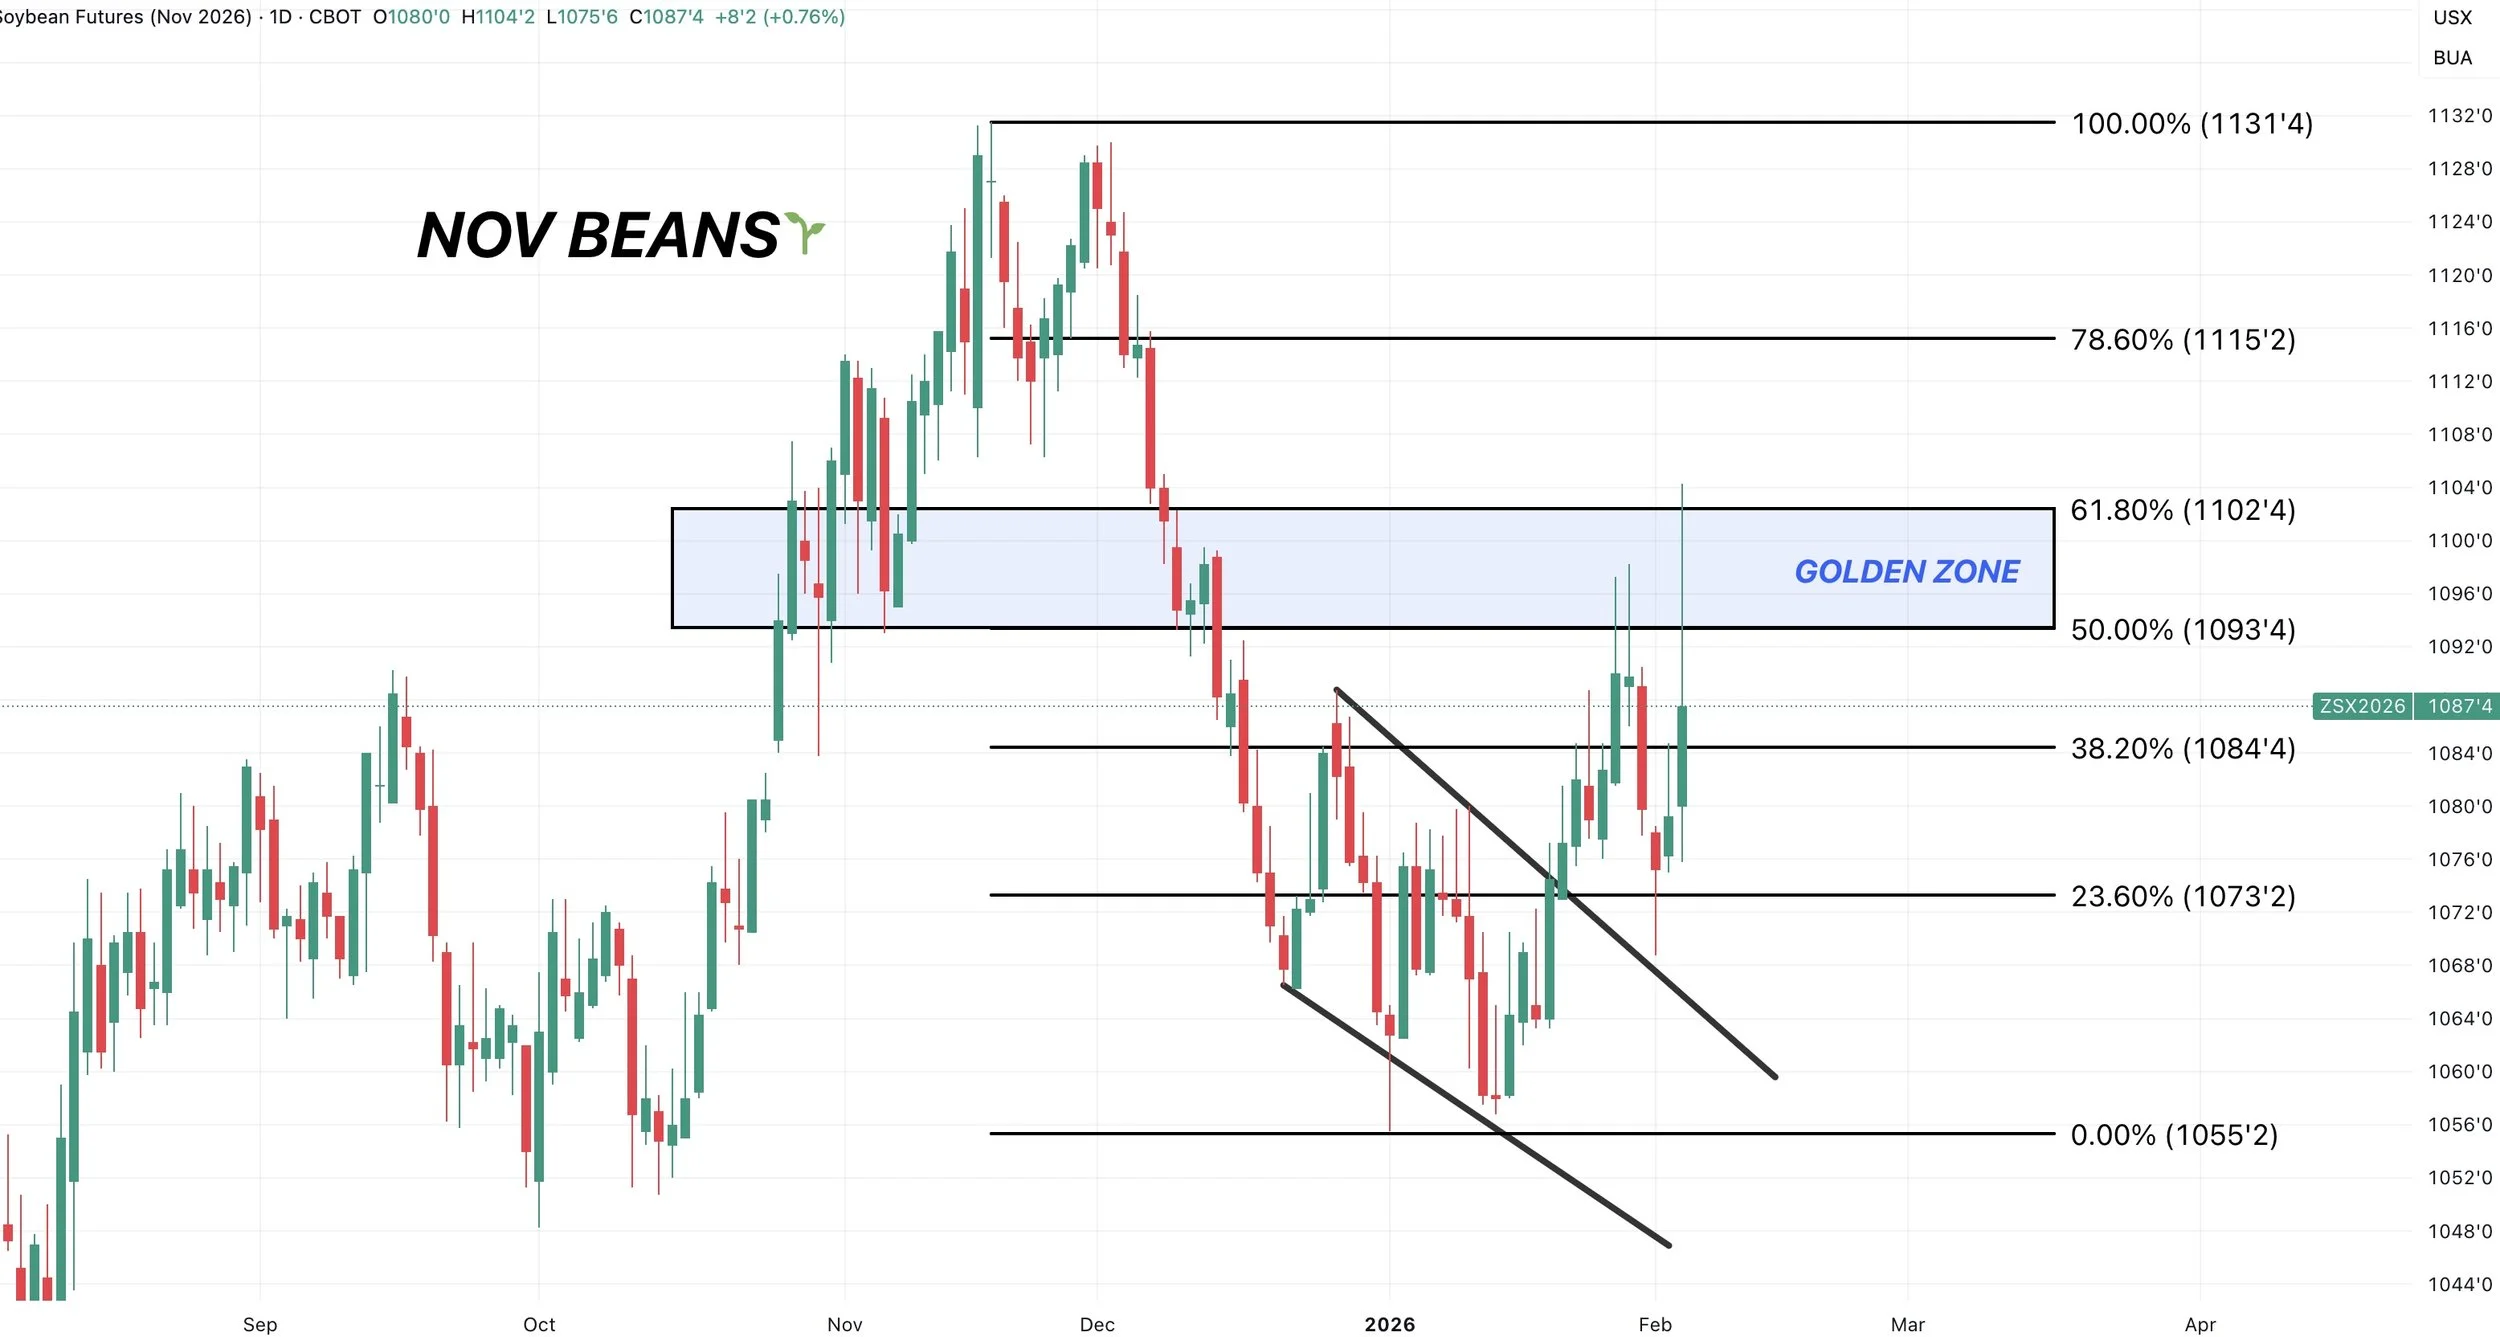
What about November soybeans?
They too hit the golden zone retracement and 61.8% level up to those November highs.
Why the Golden Zone?
You hear me talk about this all the time.
Why does this zone tend to be so important?
It is the most common spot for a bounce to fail.
Not all the time.. but it is very common.
There are several instances of this over the years.
Let's go over a few of them.
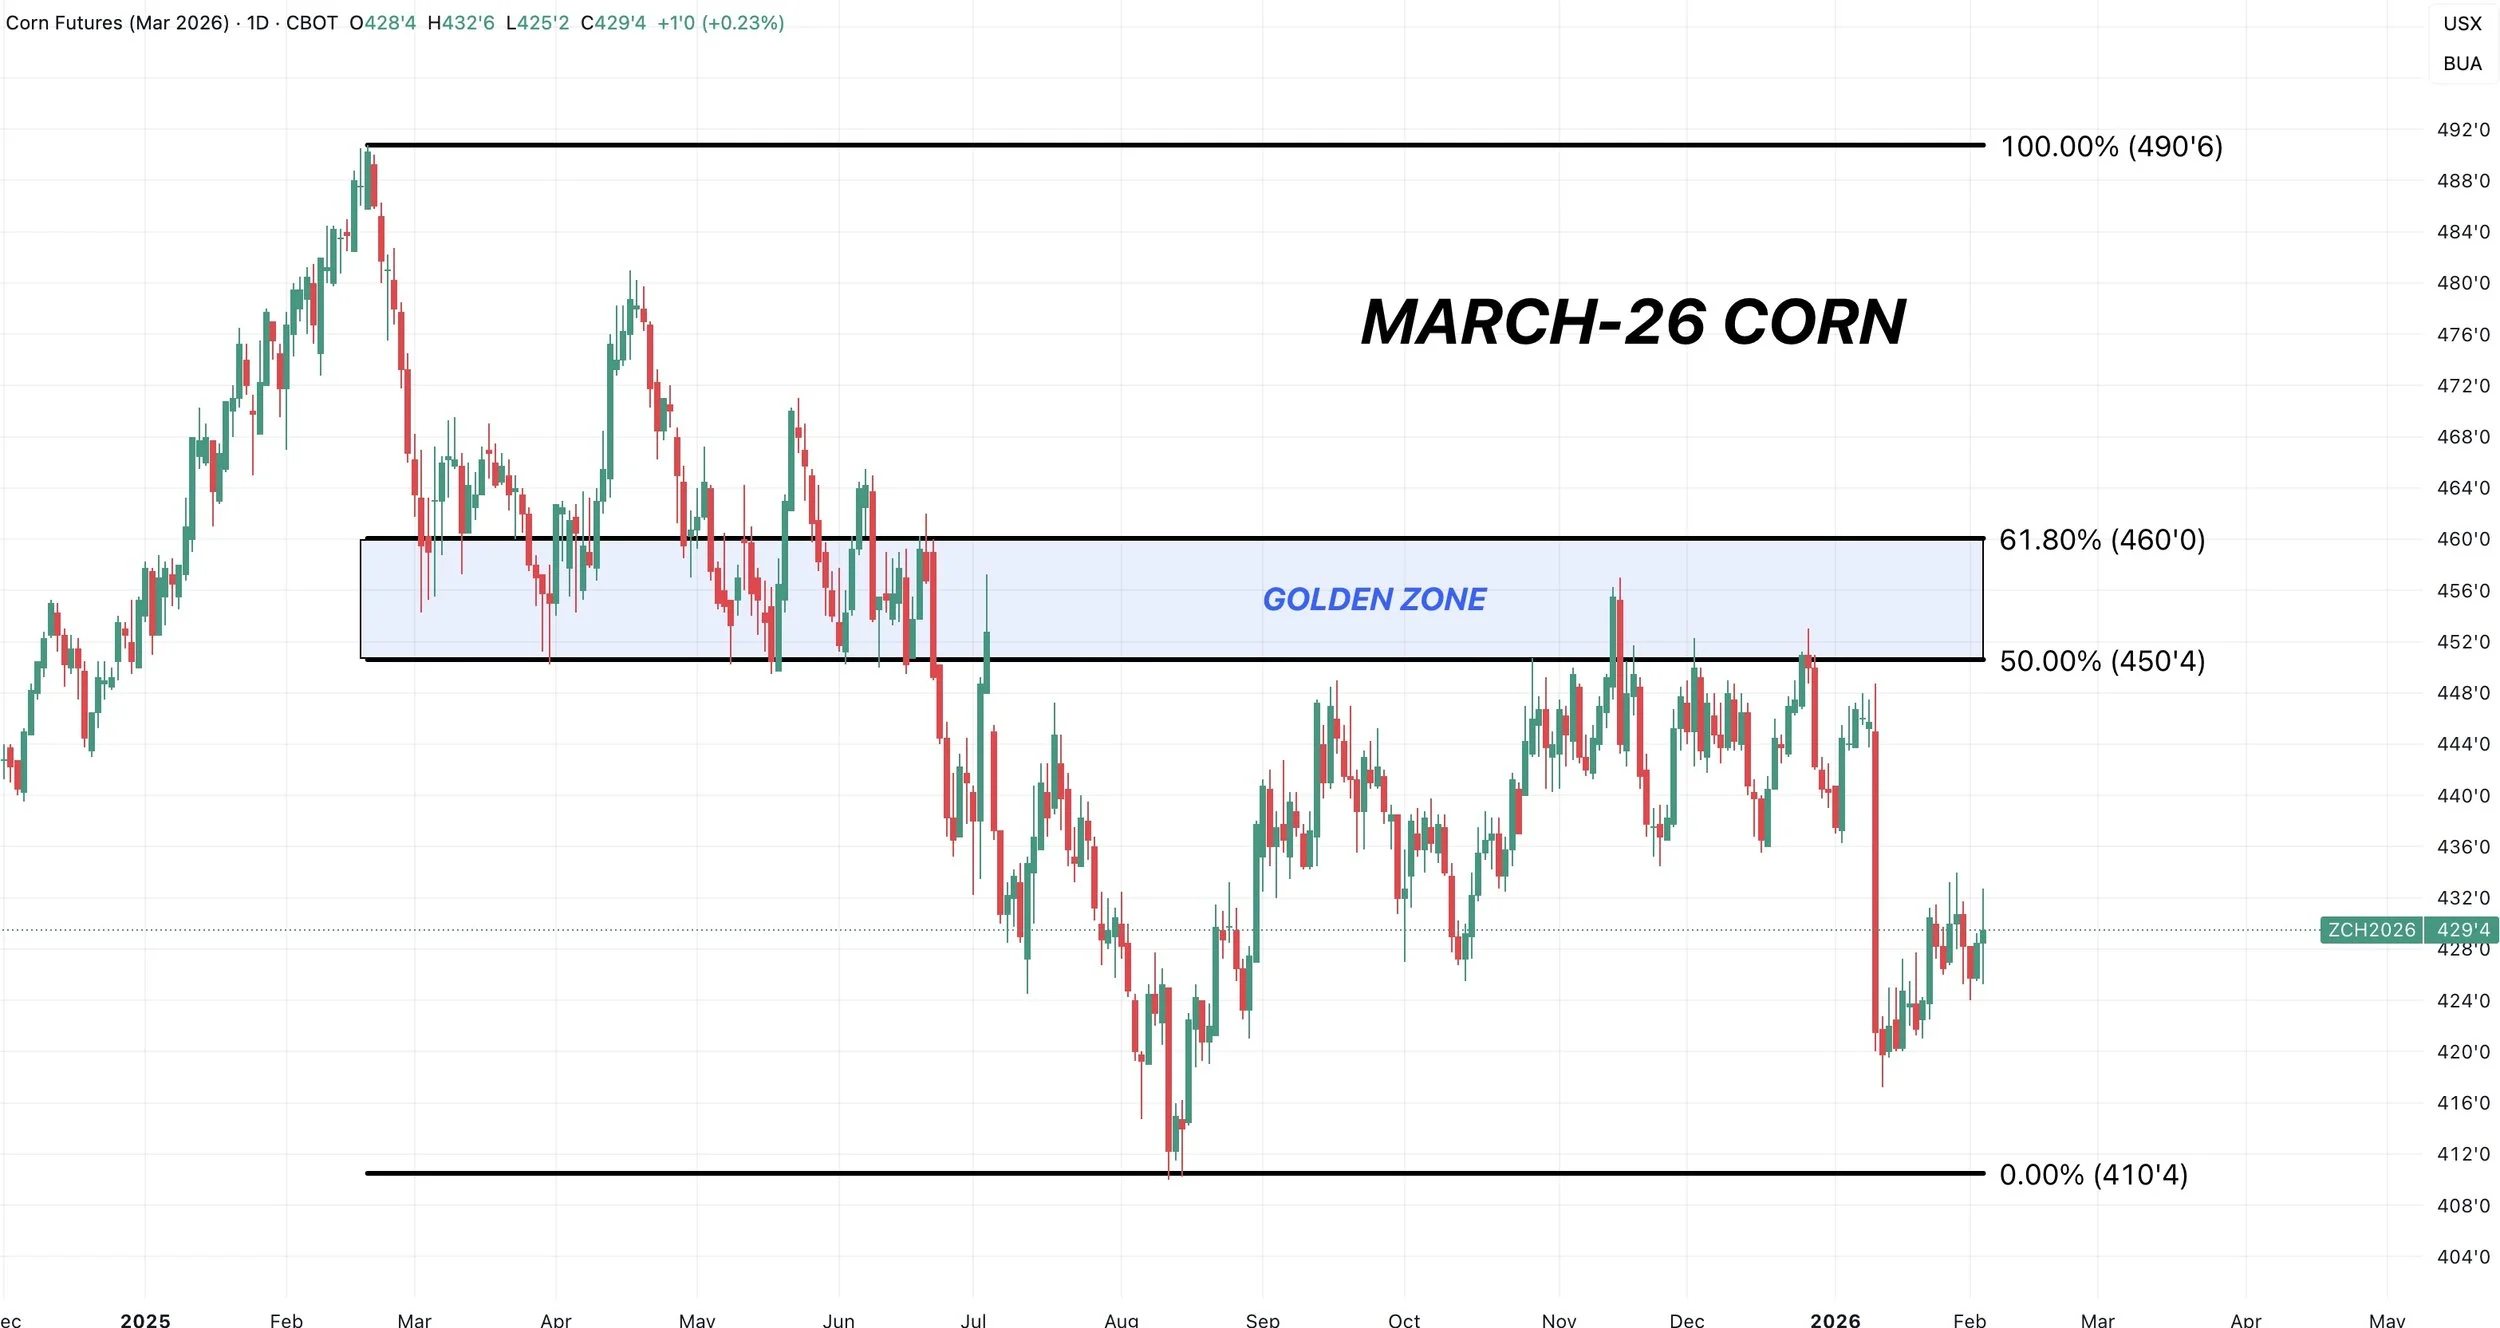
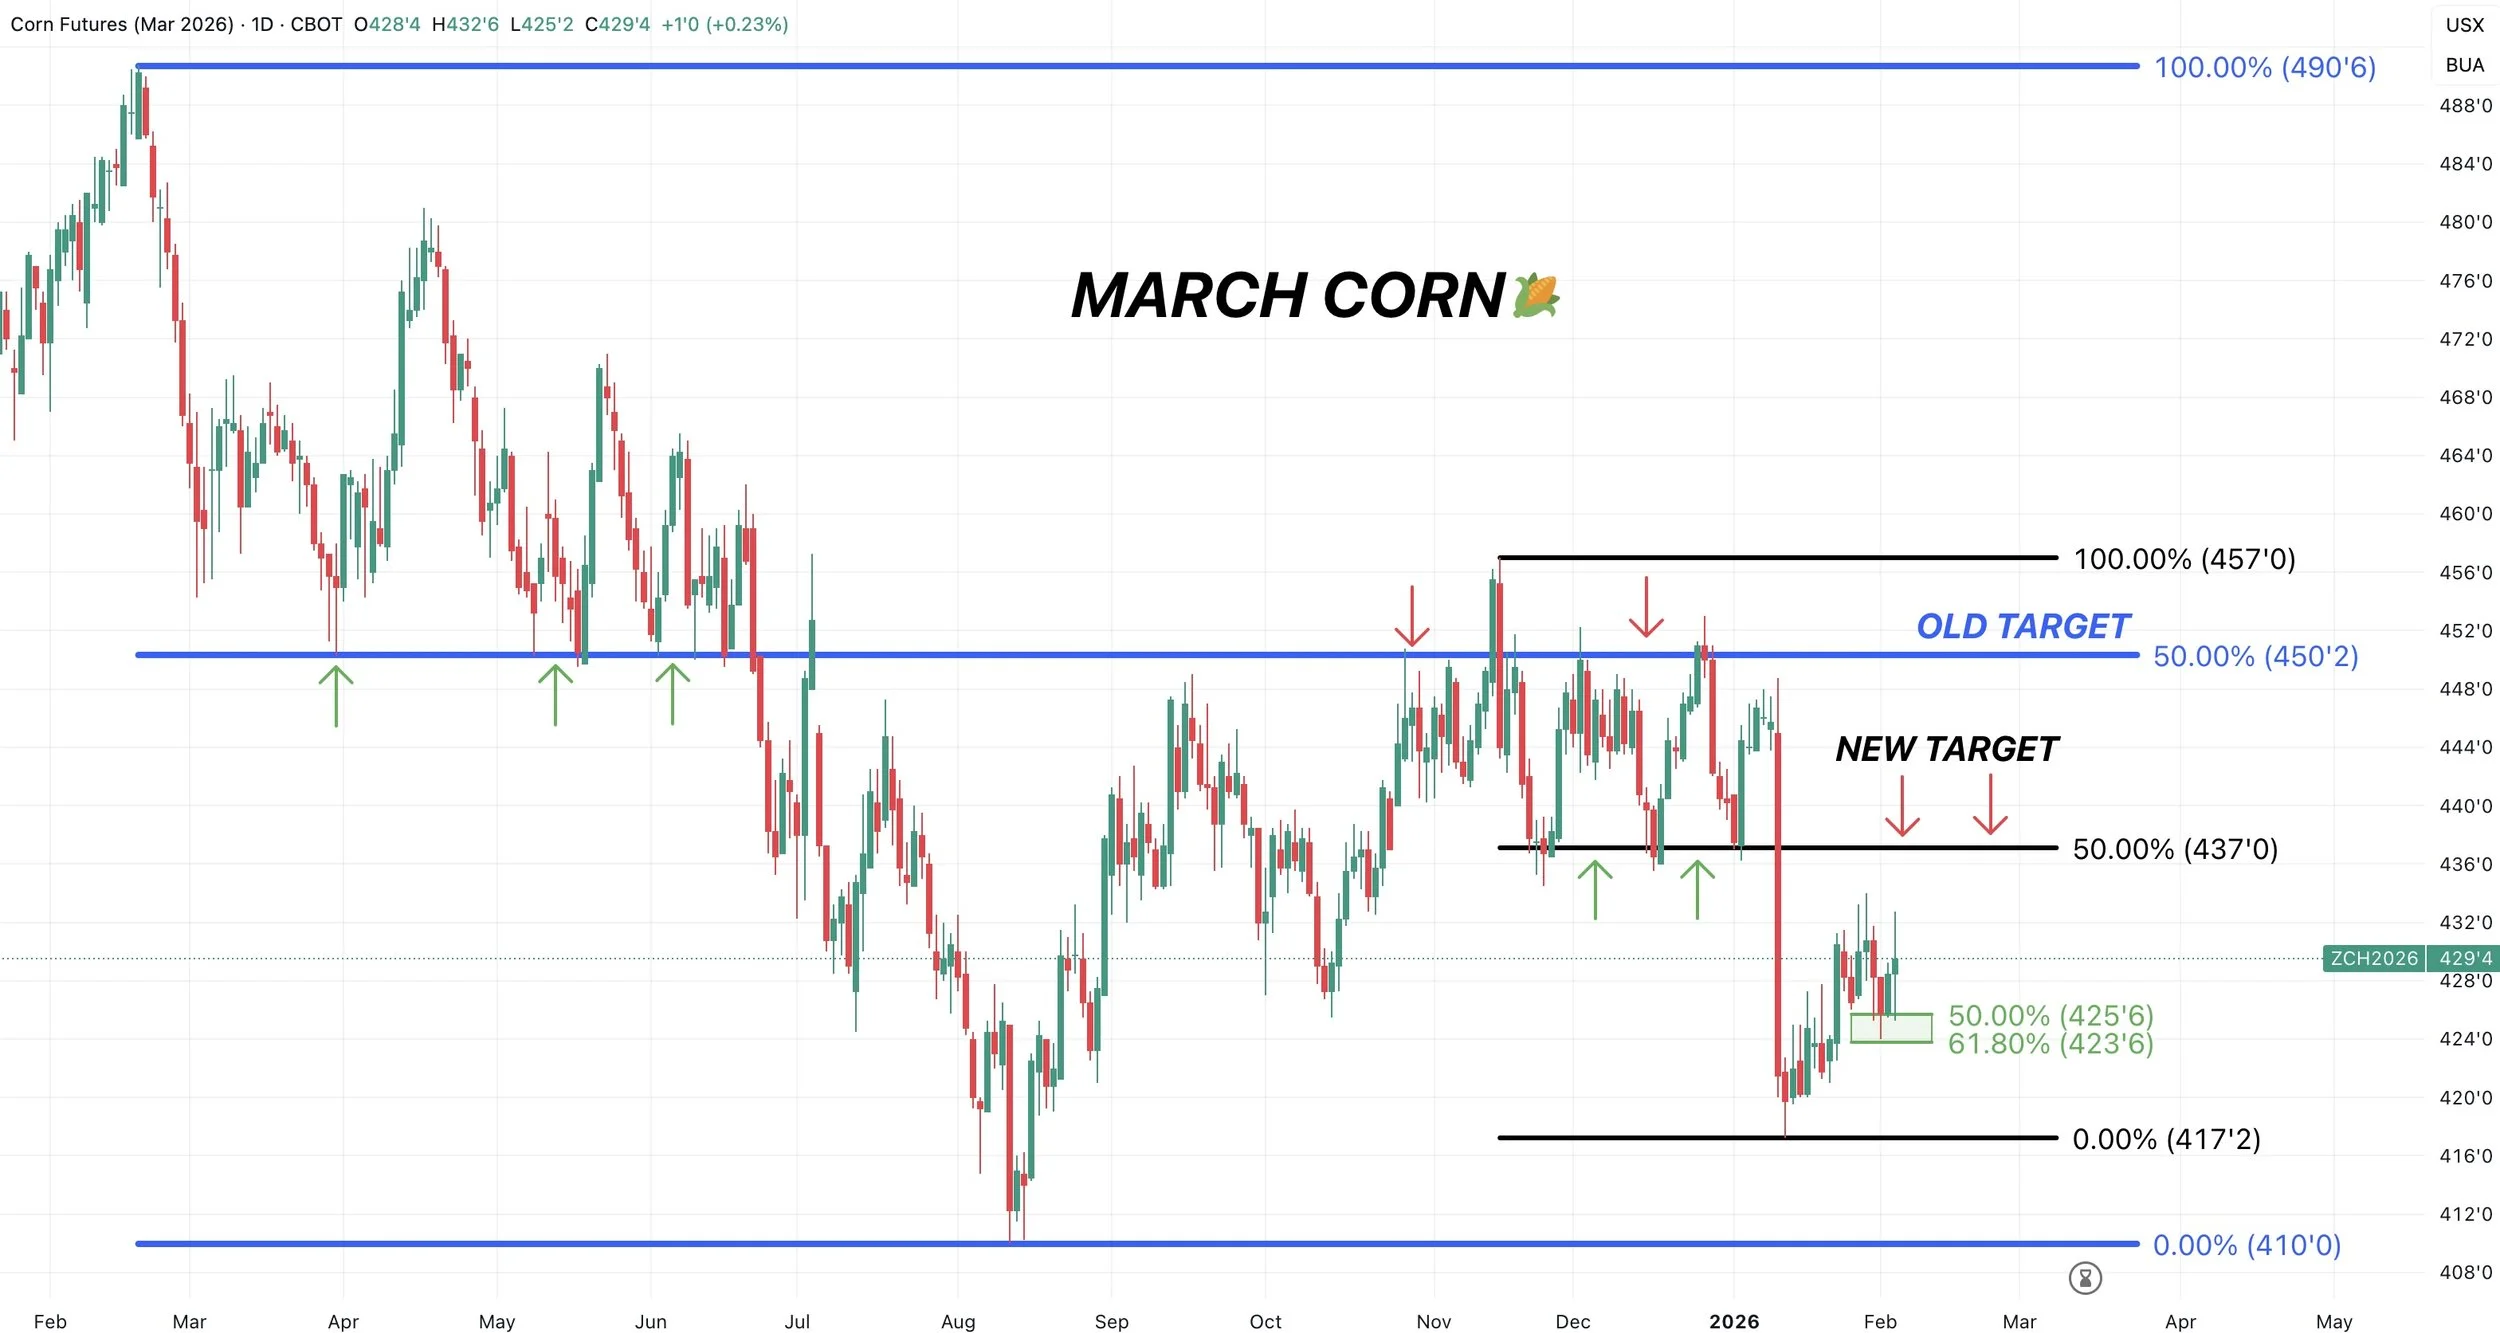
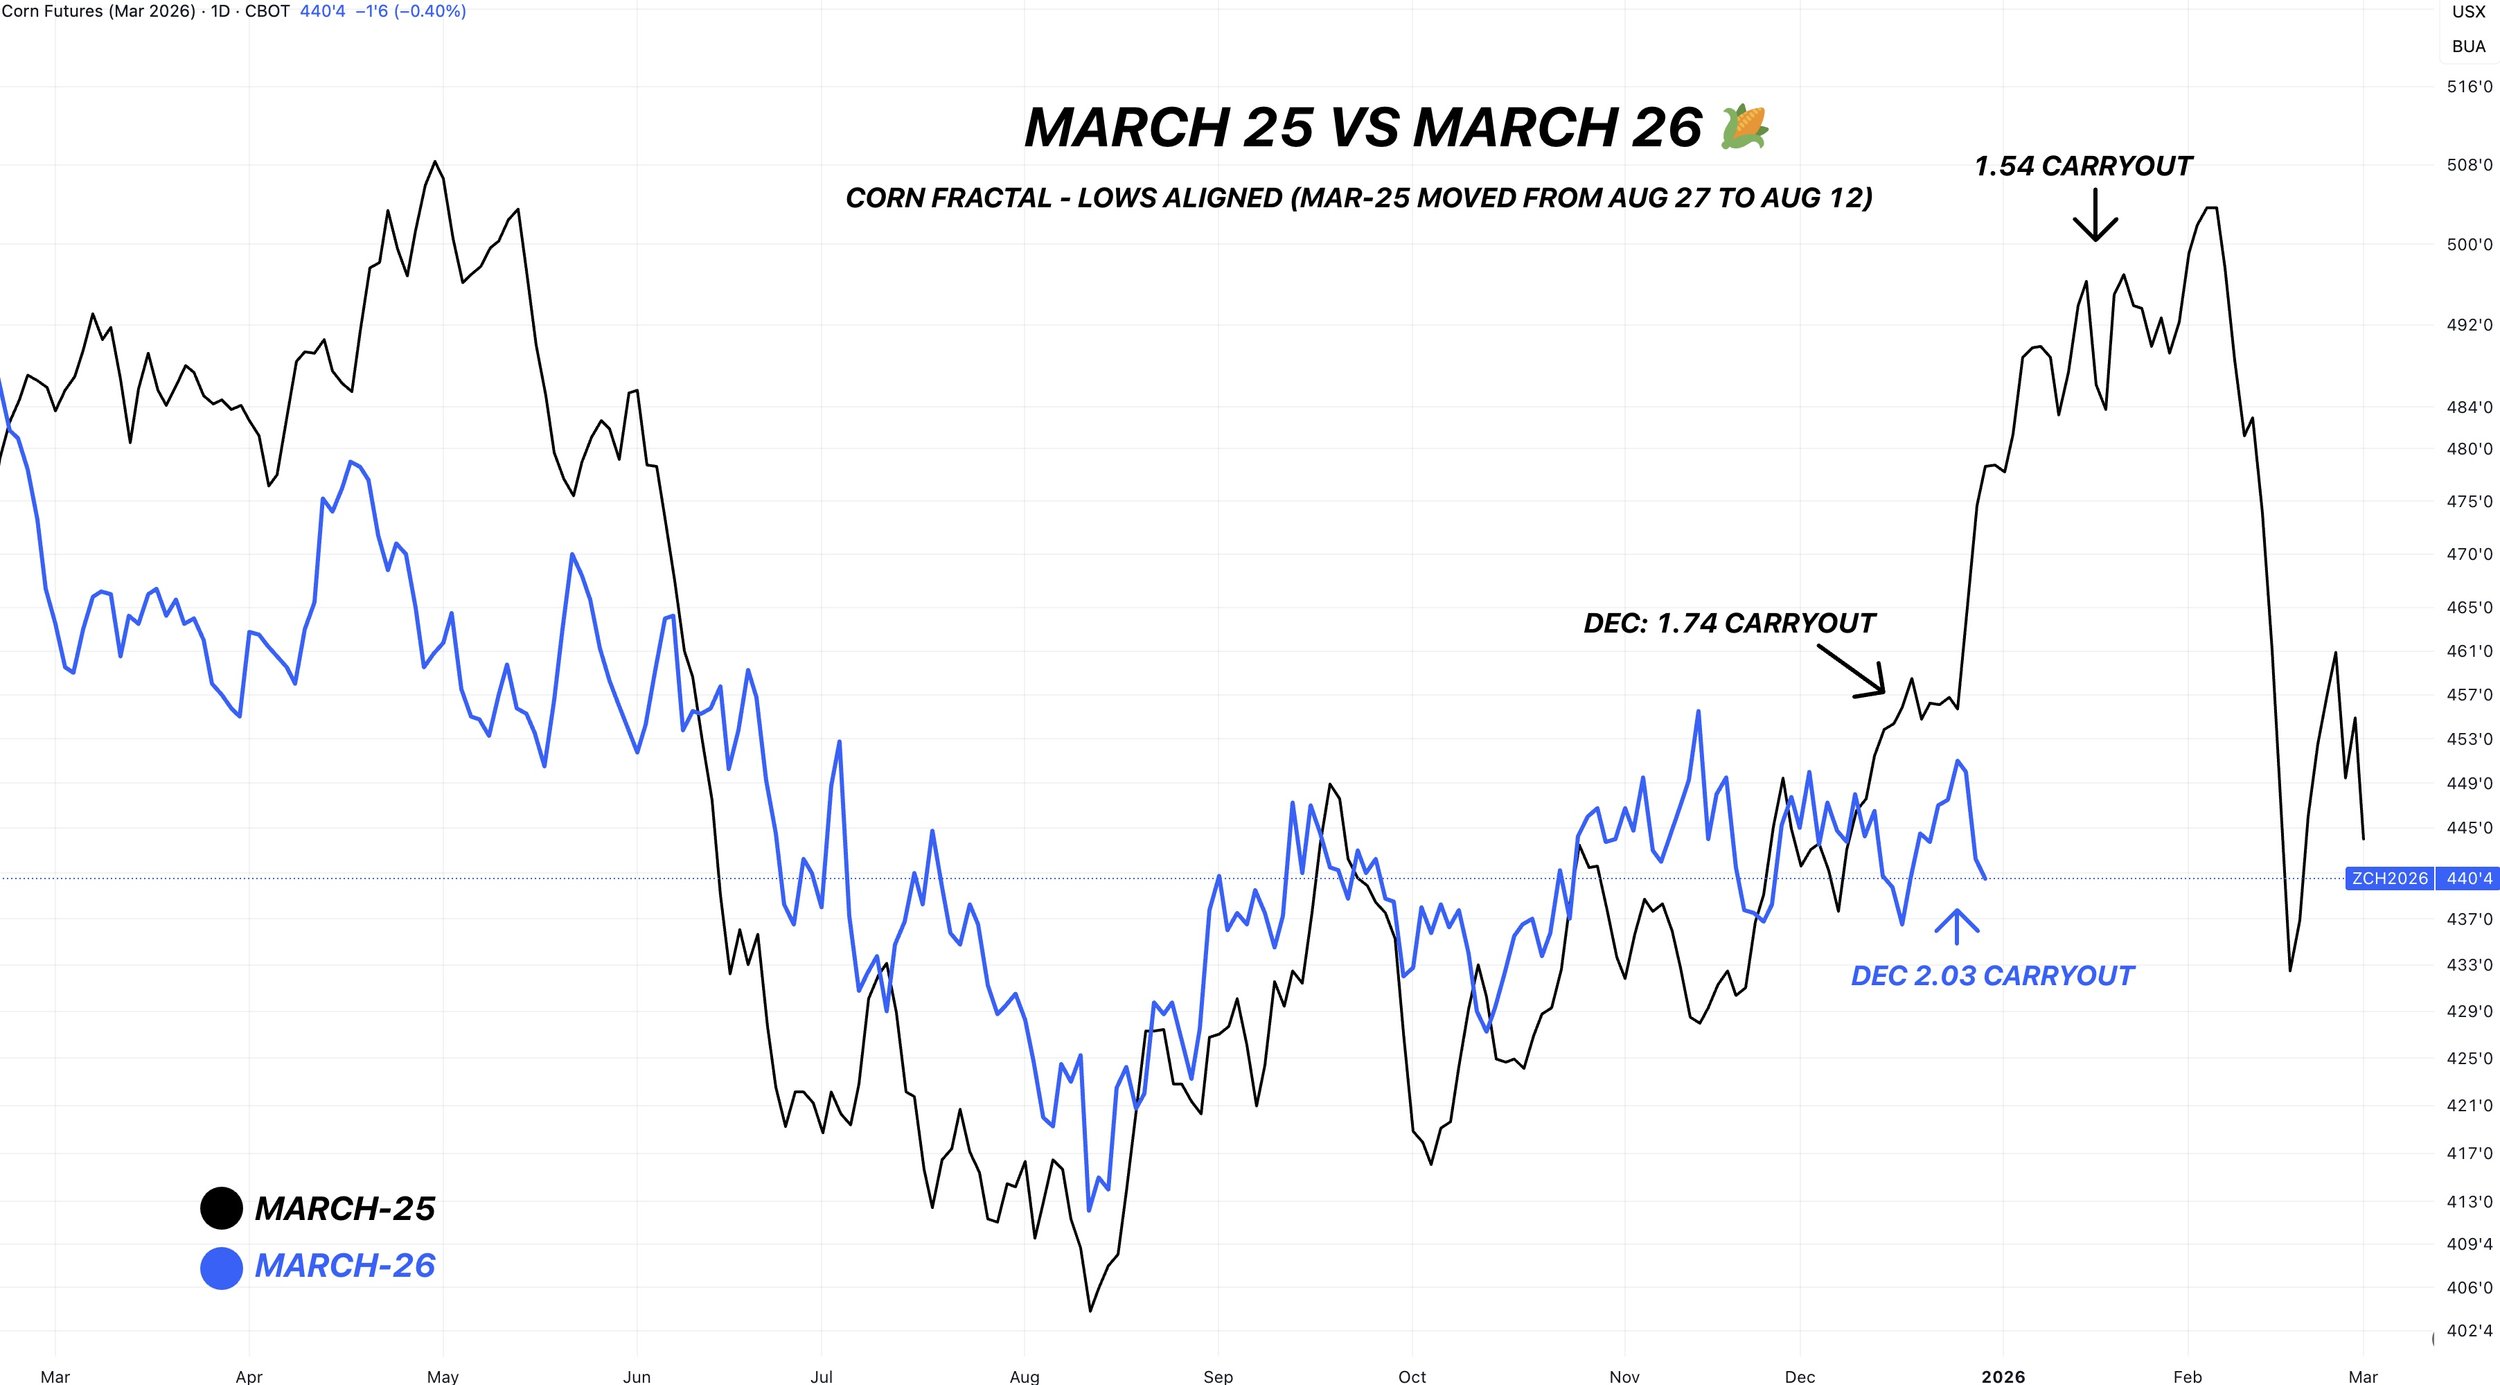
March-26 Corn: Last November
Here is the most recent example of this zone and where it marked a significant high in a market.
In this case, that same level also happened to be old support. Which we've talked about several times since harvest.
We clawed back 50-61.8% of the highs from February before failing.
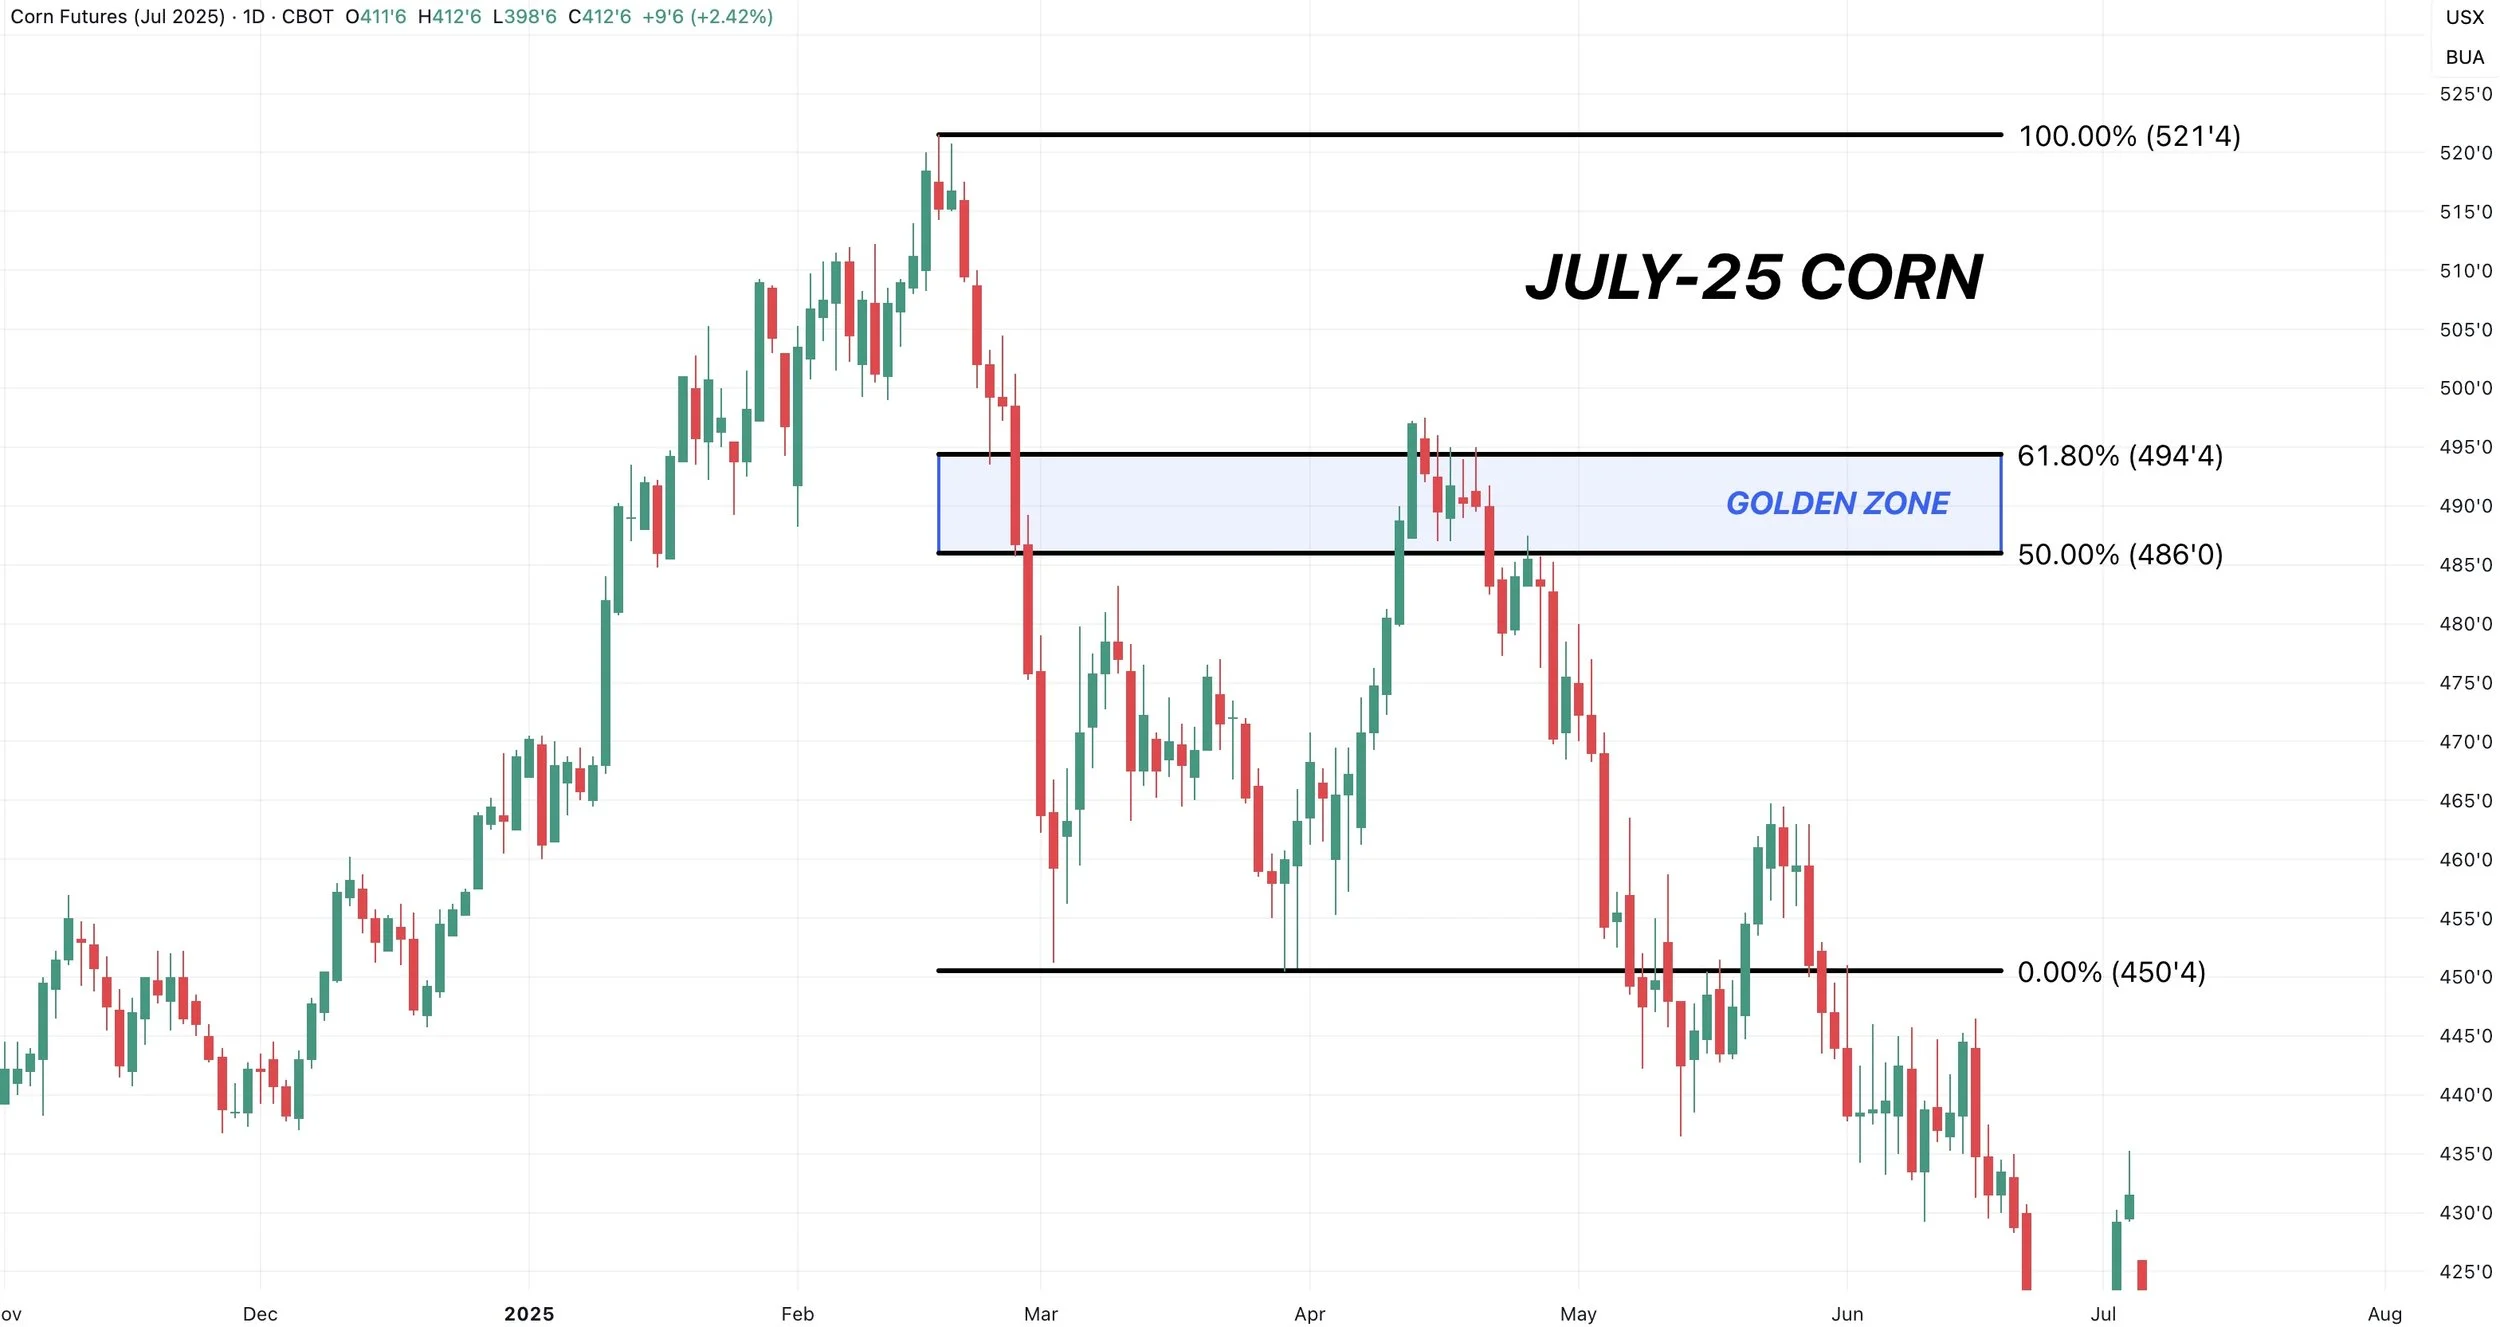
July-25 Corn: Last April
We had that brutal sell off after posting those February highs.
We then received a dead cat bounce.
It failed at the golden zone.
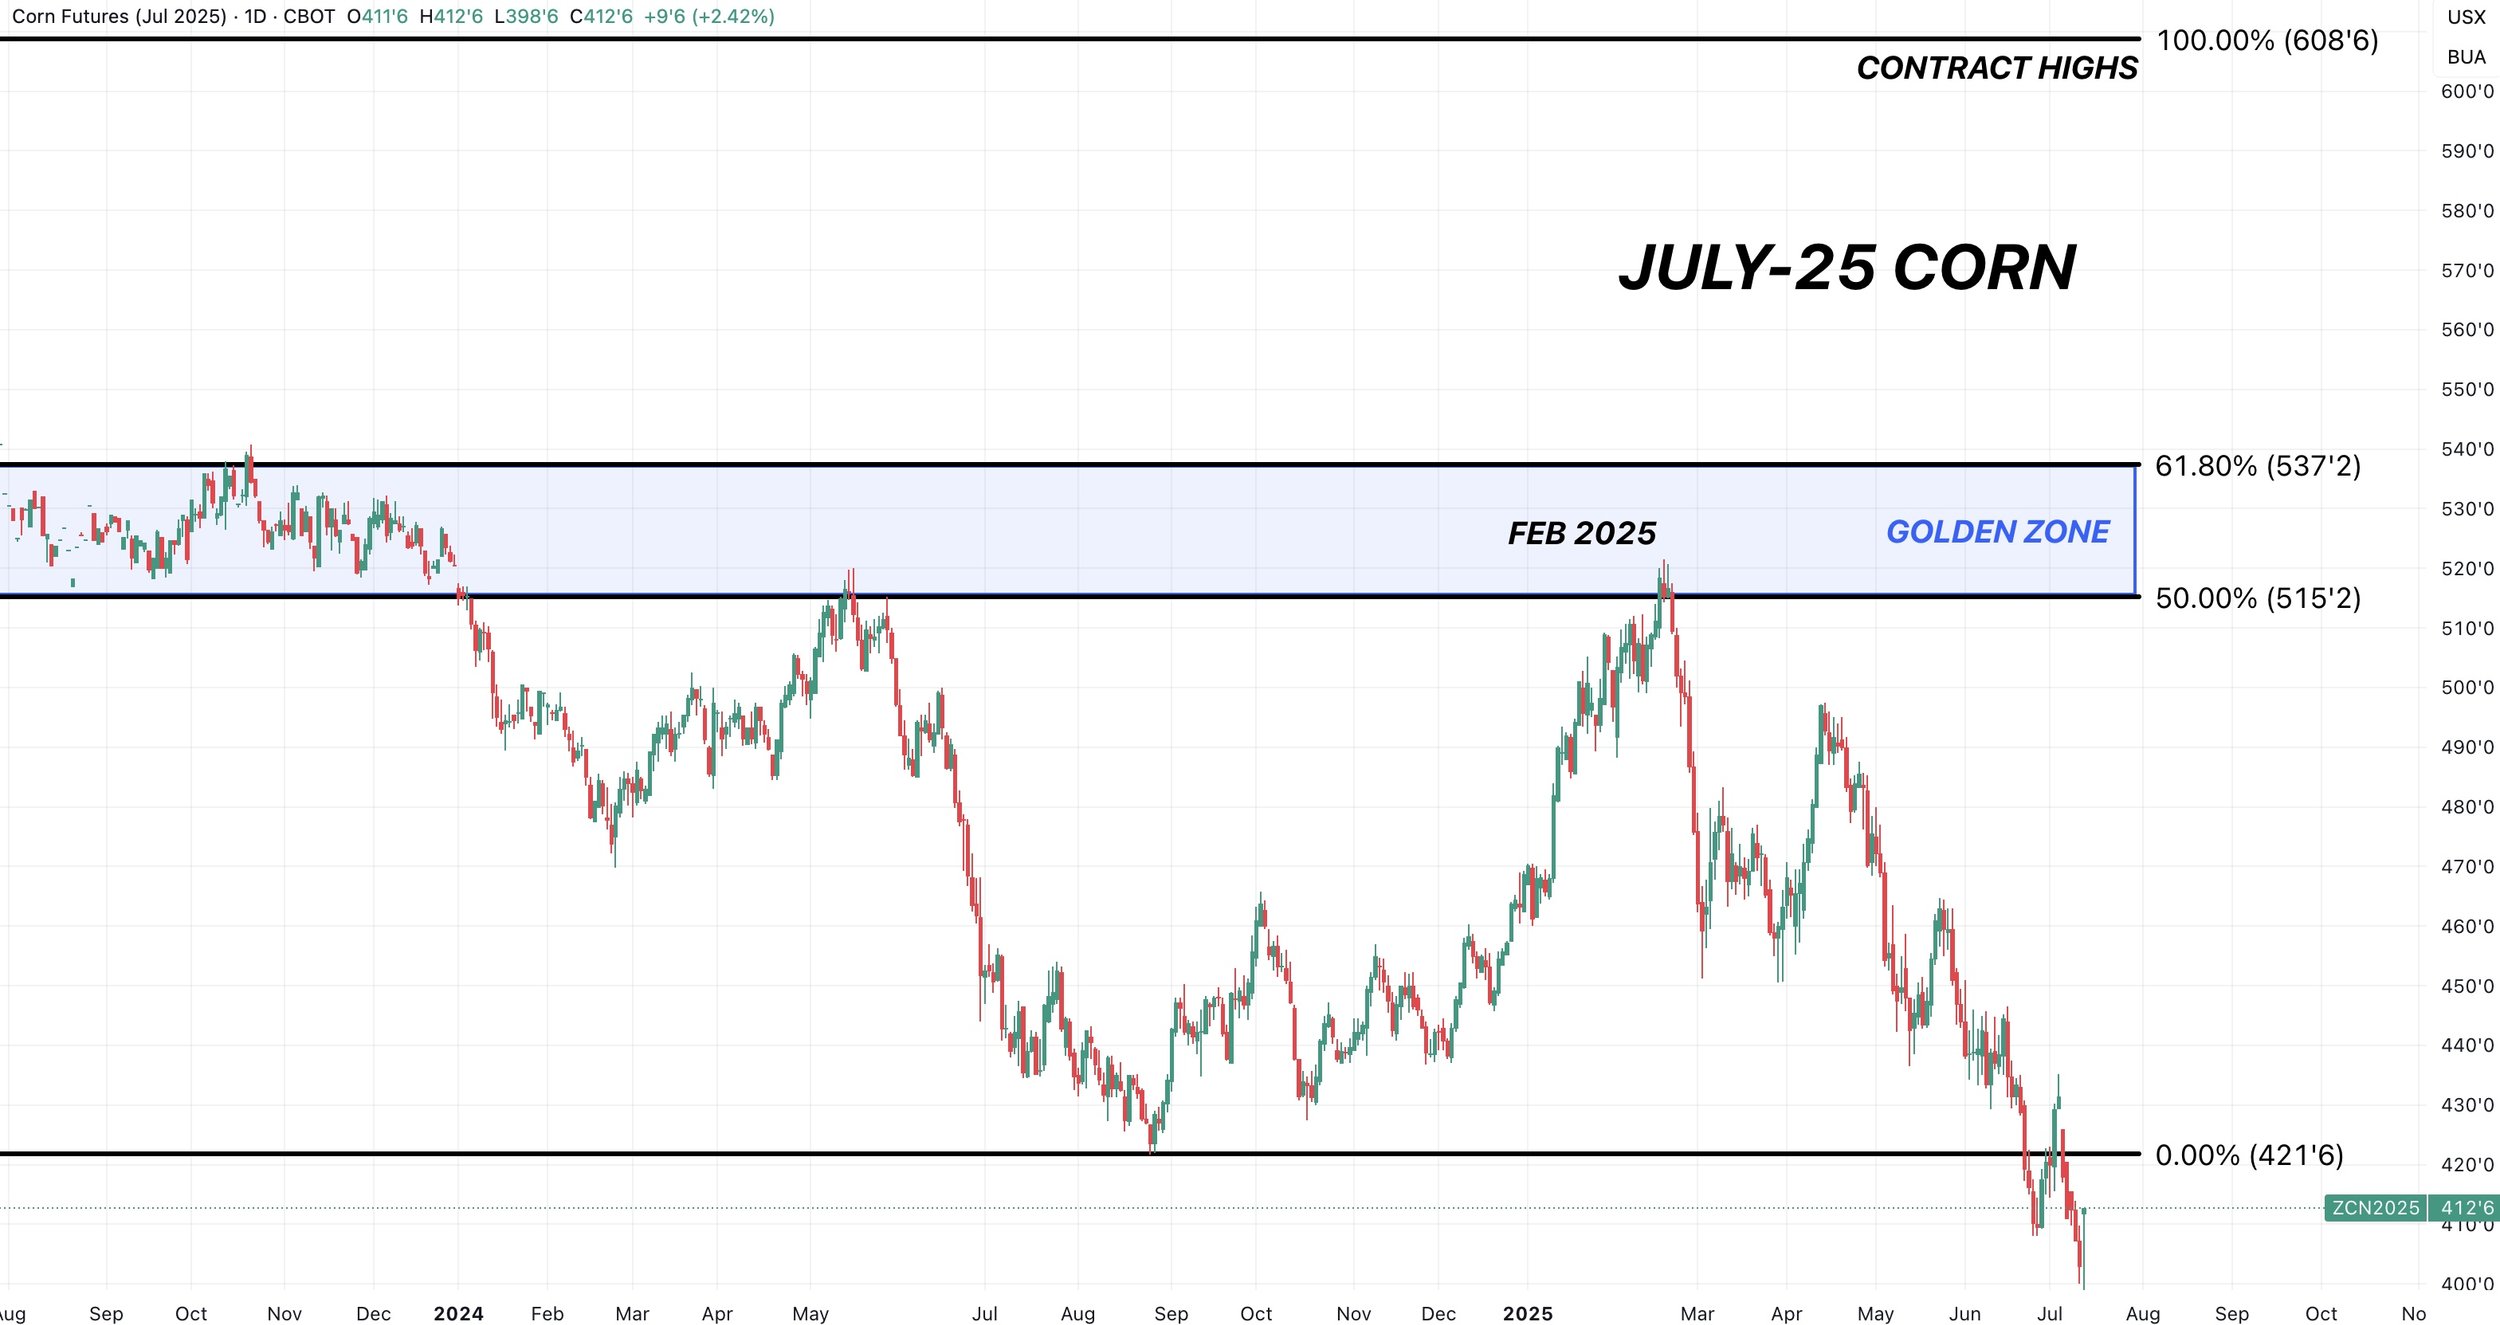
July-25 Corn: Last February
From the contract lows, that rally going into February reclaimed 50% of the contract highs.
This level lined up with prior support and resistance.
When the golden zone lines up with old points of support and or resistance, it helps narrow down the target even further.
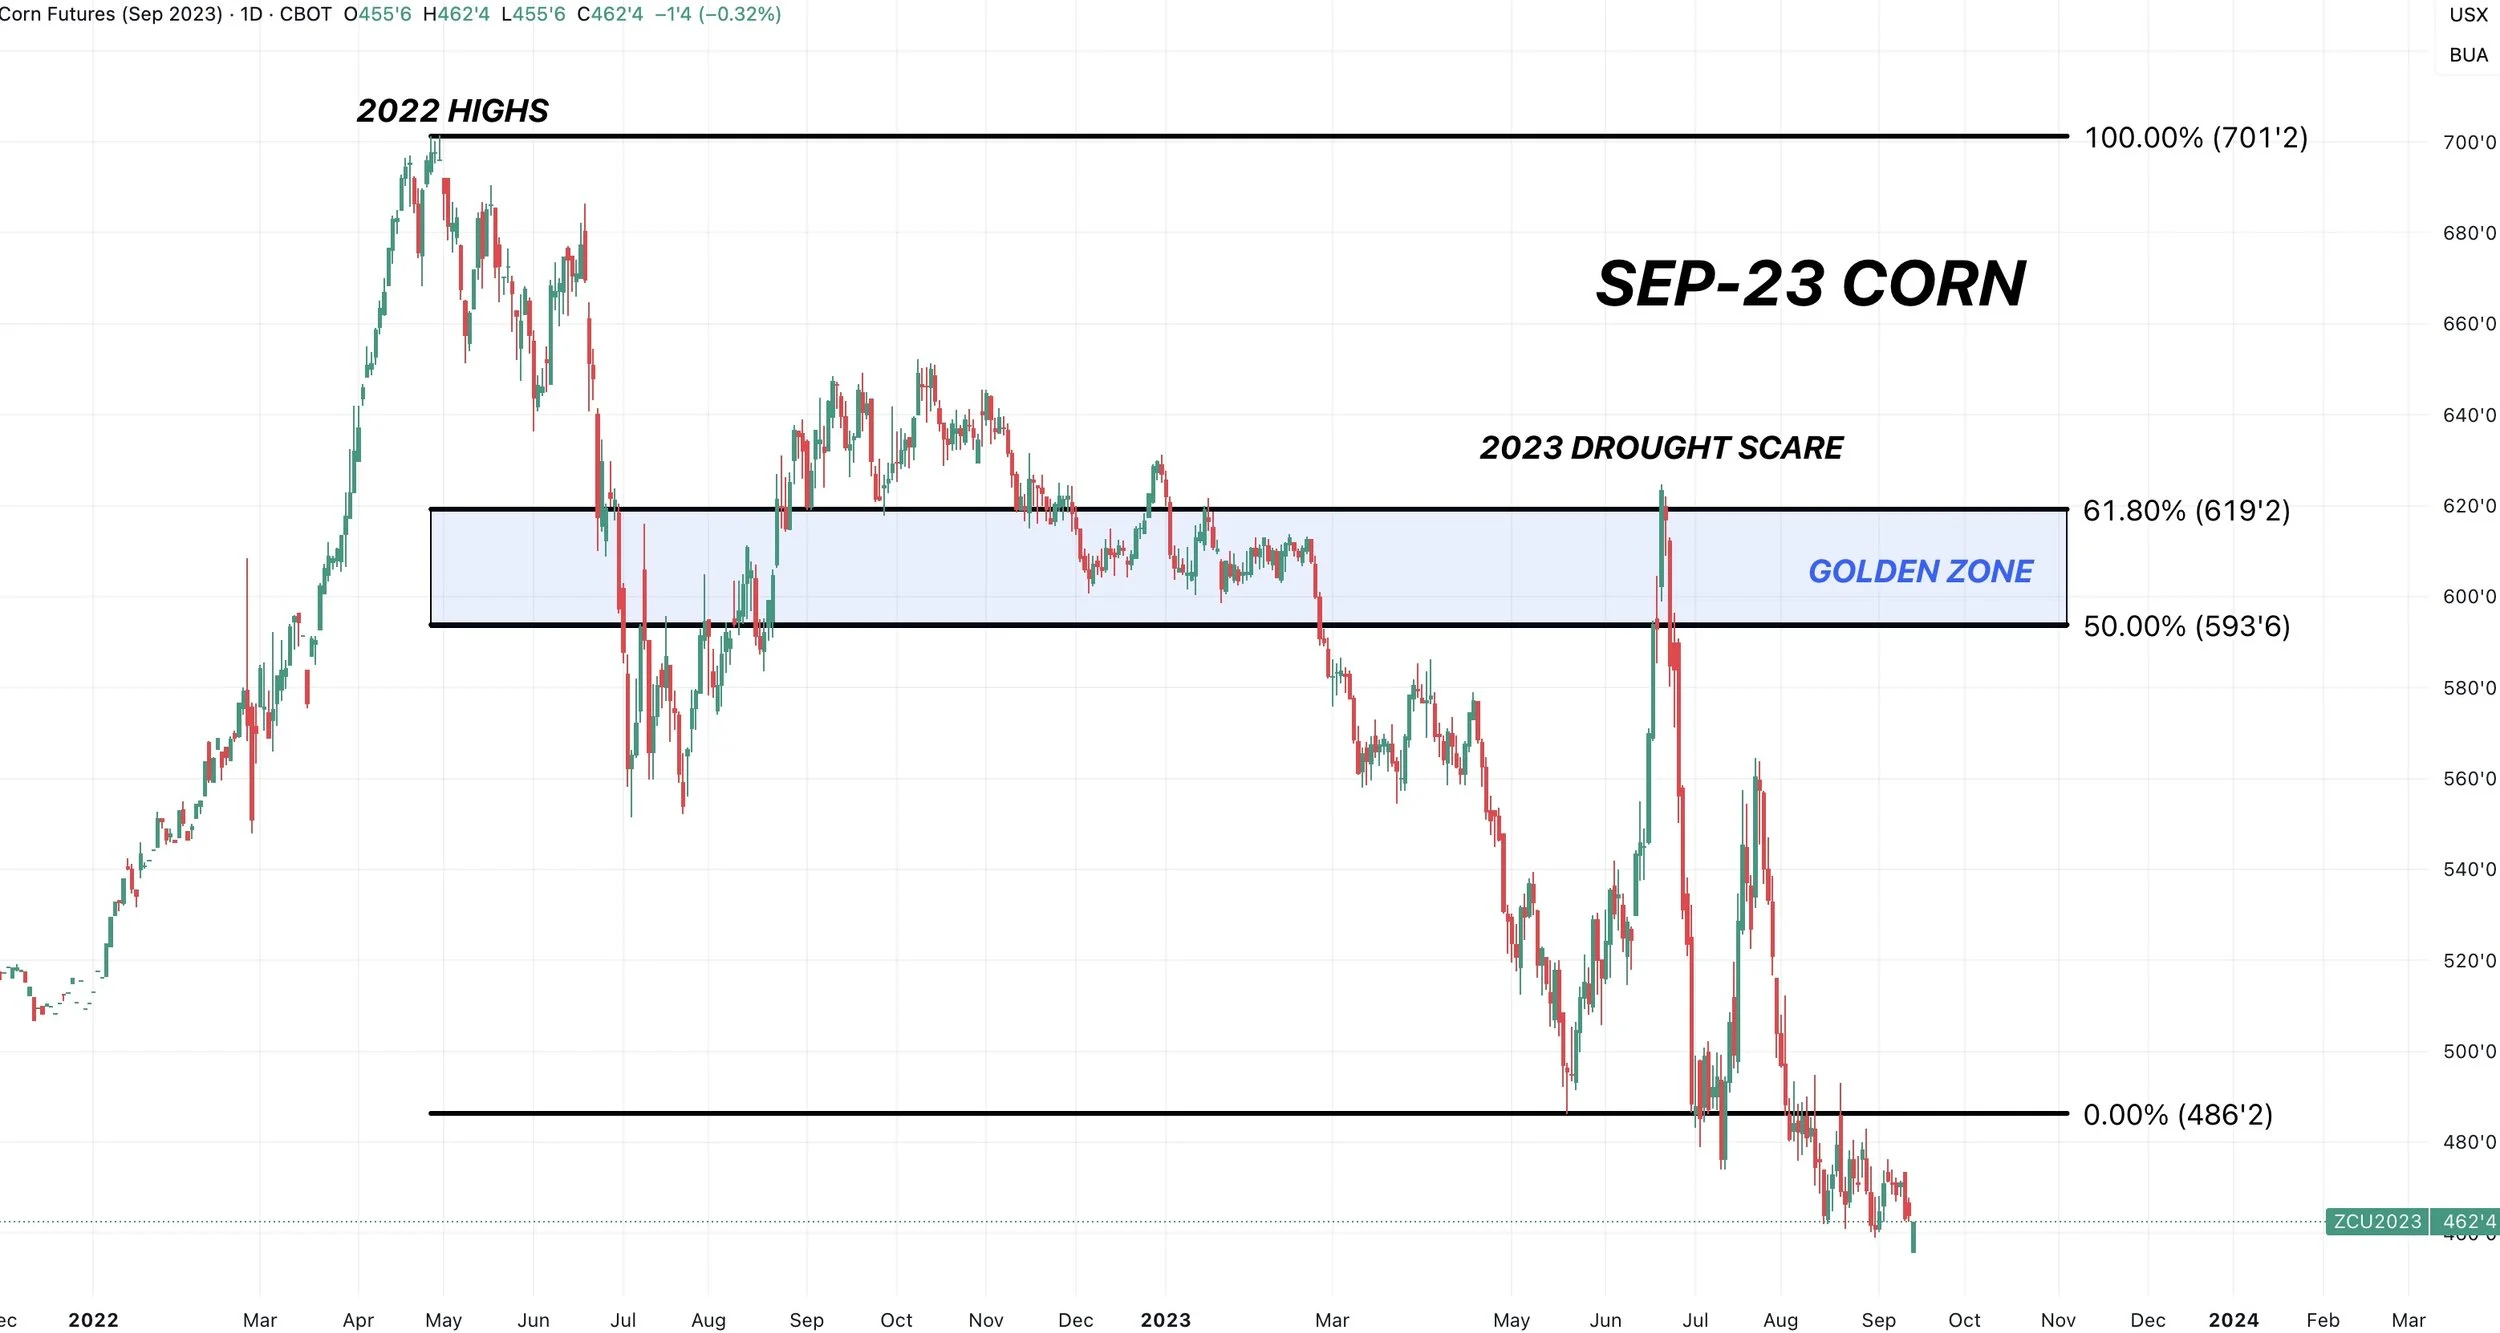
Sep-23 Corn: Summer of 2023
Remeber that weather scare in 2023 that rallied corn +$1.30 in just a month.
That rally failed after clawing back 61.8% of the contract highs.
Jan-25 Beans: Last November
This was the reason for that sell signal back in November.
We went on that China driven rally before topping out after taking back 61.8% of the contract highs.
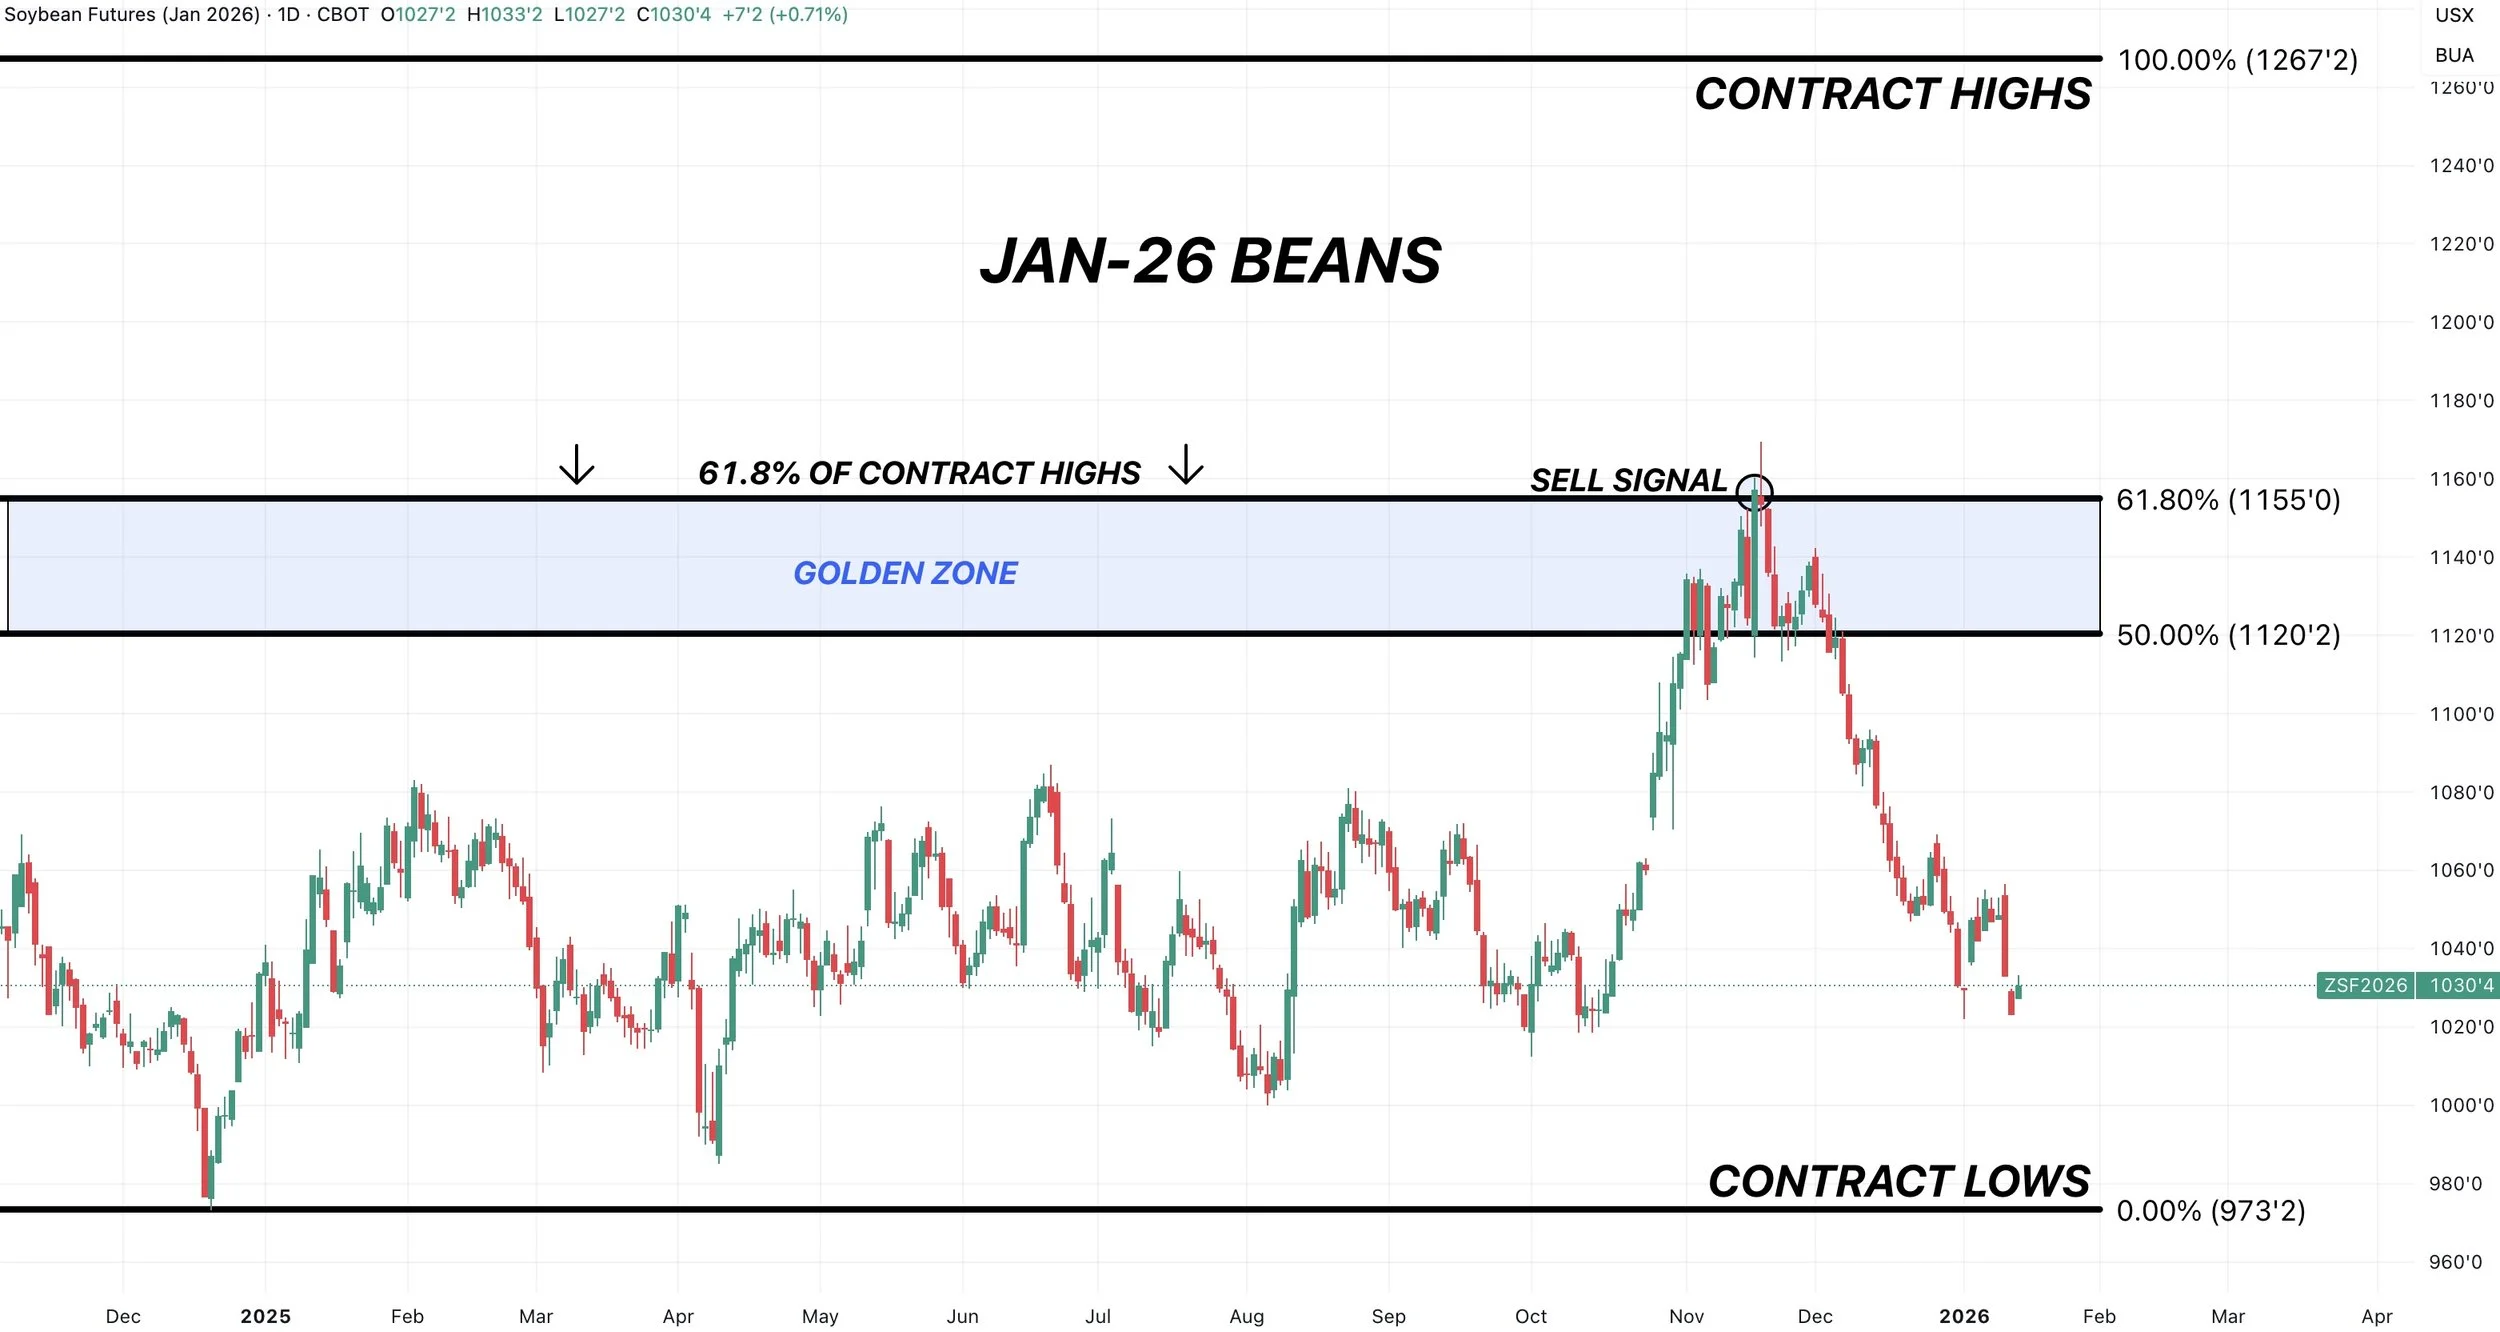
This doesn’t mean soybeans definitely topped today.
The point is that it just simply makes sense to take risk off the table in the area where it historically makes the most sense to do so.
Does Trump & China News Change Anything?
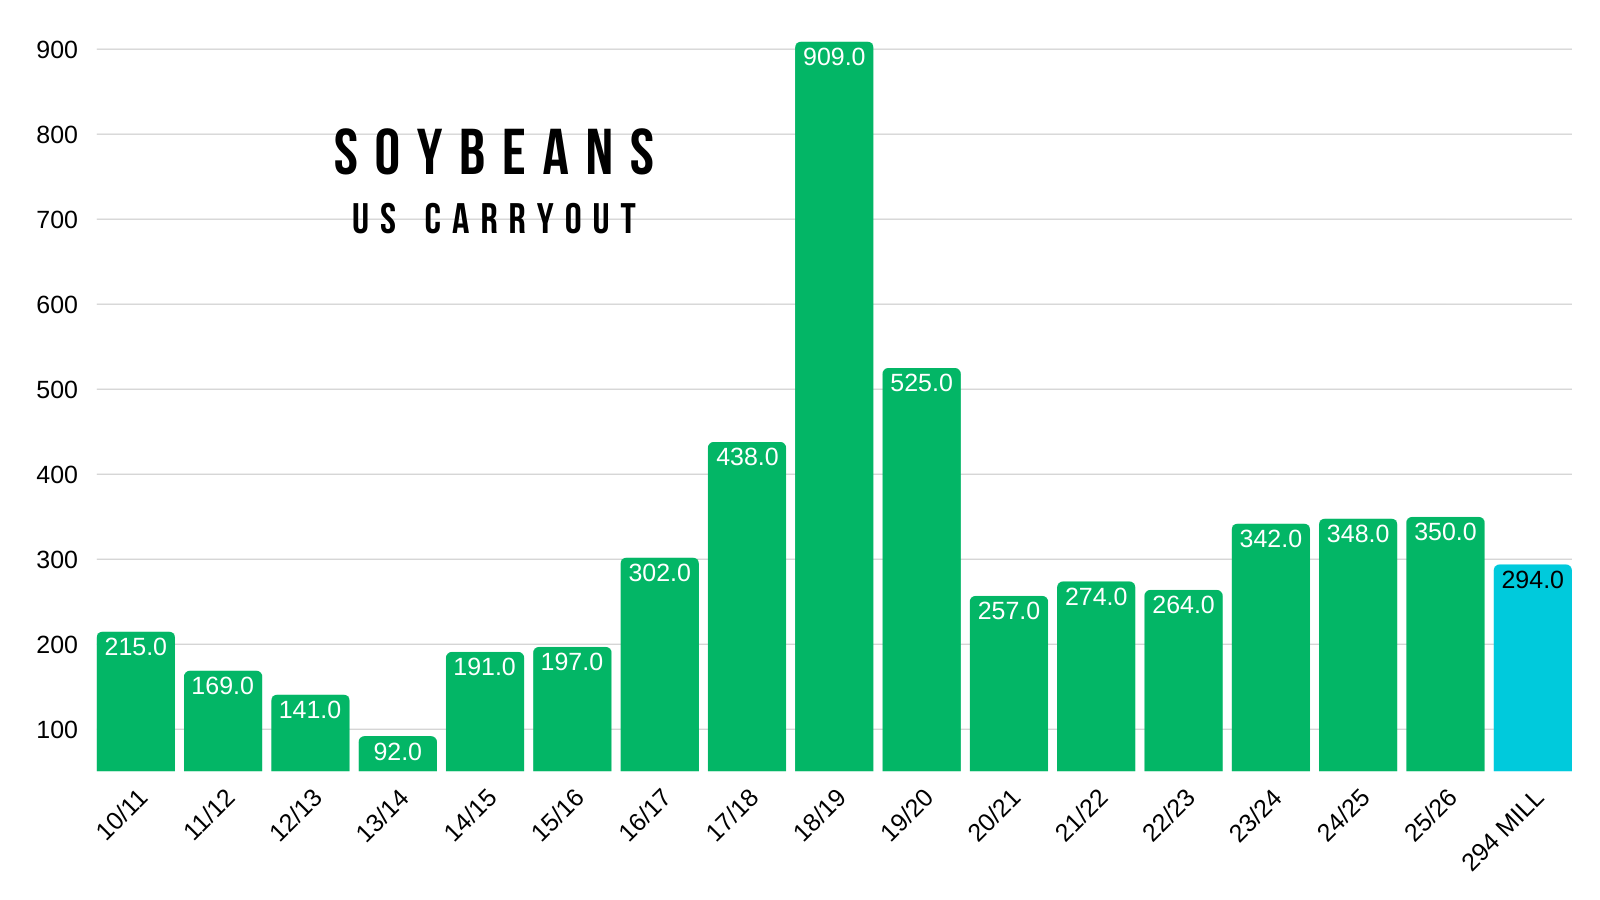
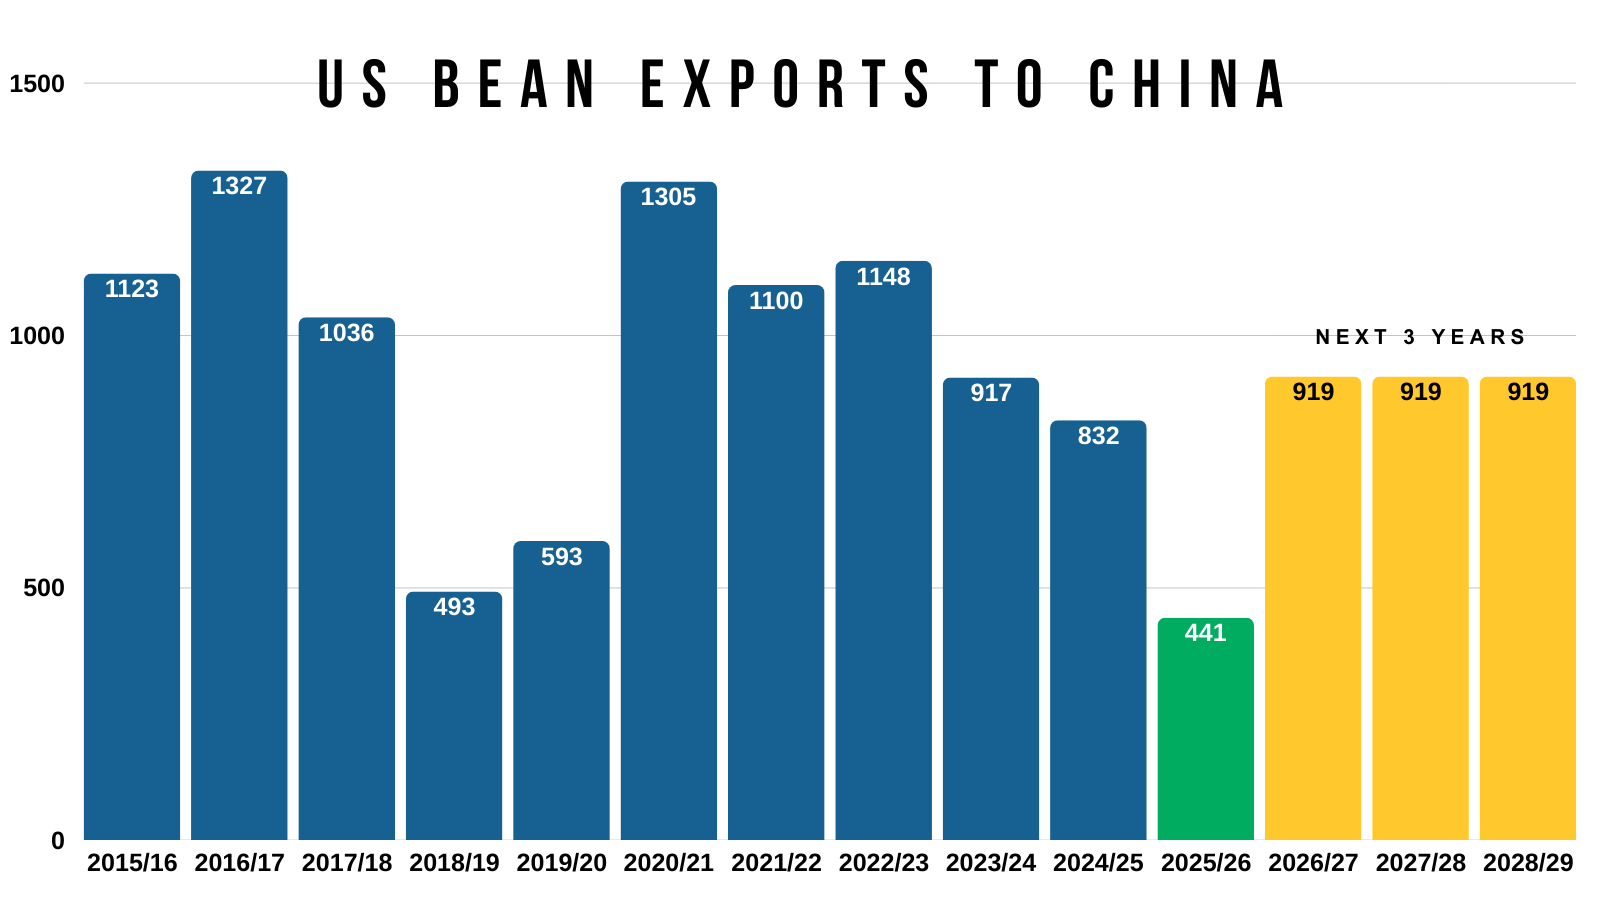
Here is a visual of China's purchases of US soybeans.
This chart includes their past purchases over the years.
It also includes their old agreement, along with the "rumored" new agreement.
12 million metric tons = 441 million bu
20 million metric tons = 735 million bu
Difference = 294 million bu
That is a pretty massive increase.
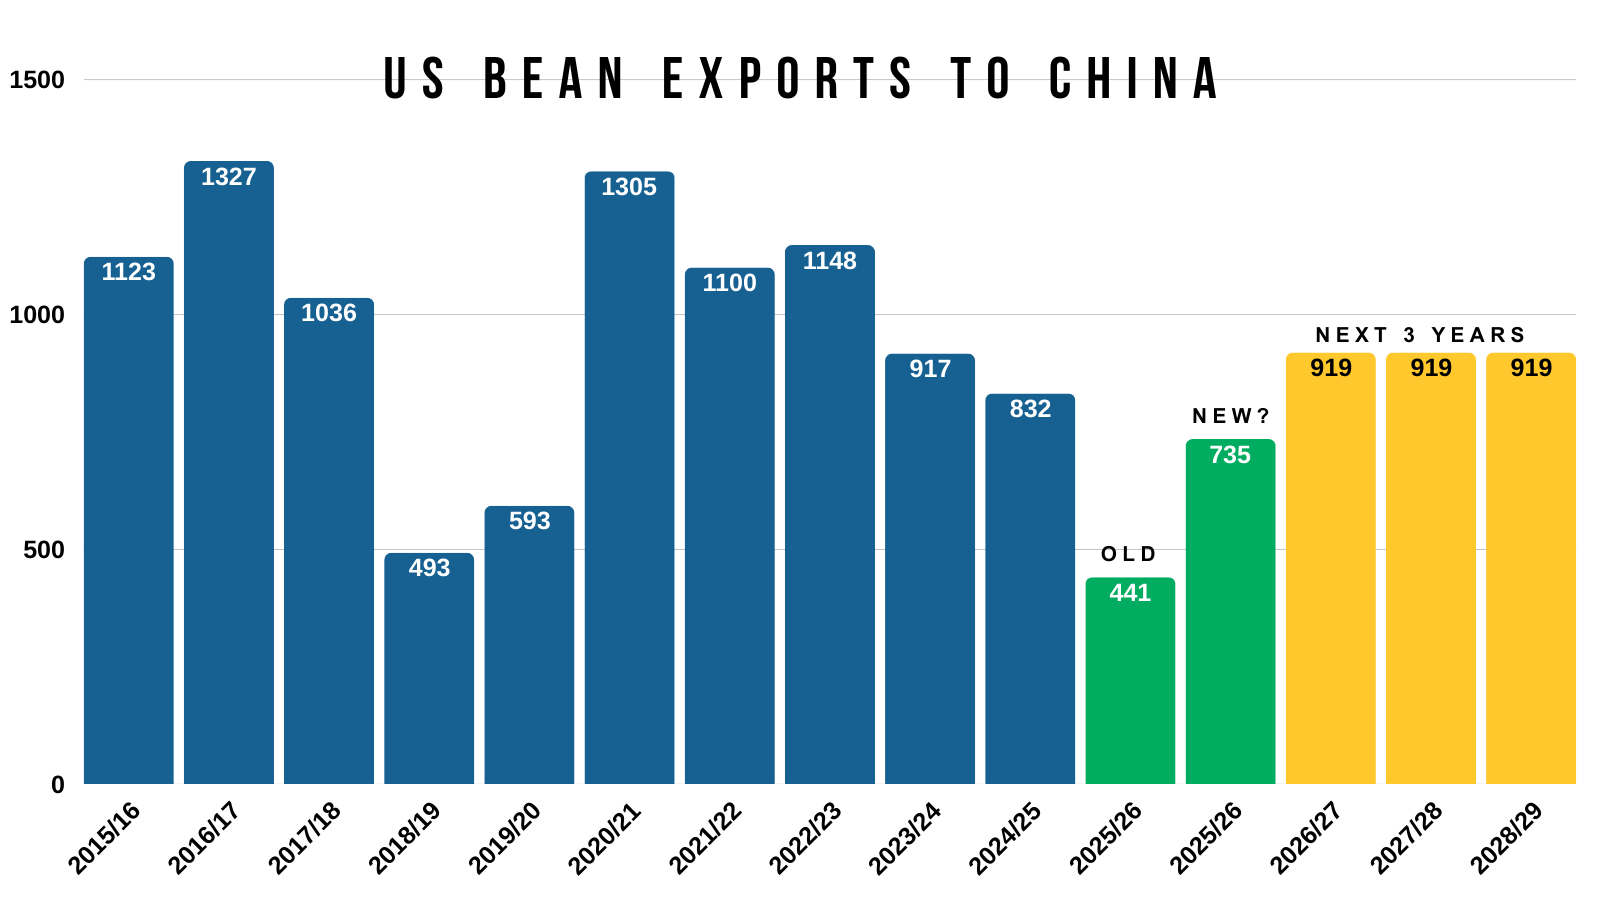
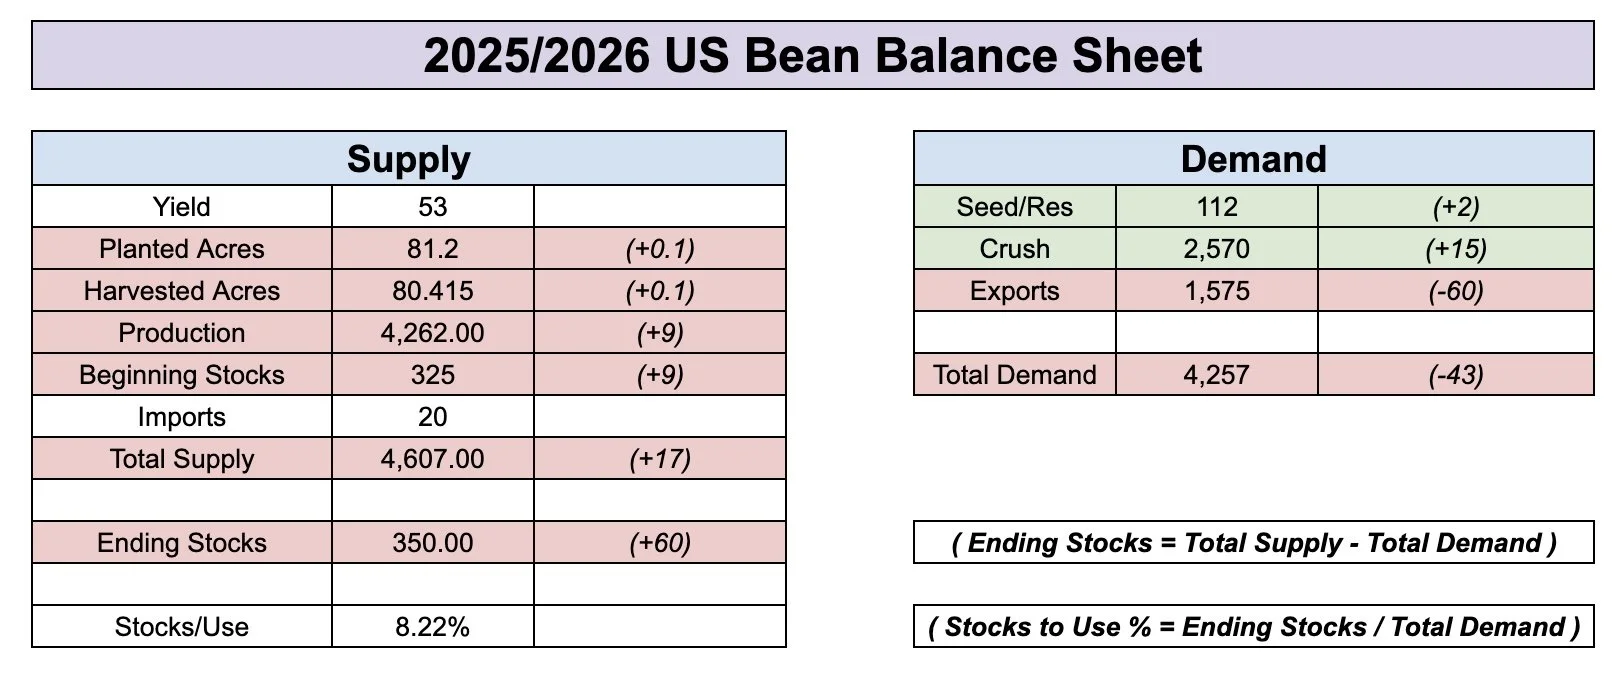
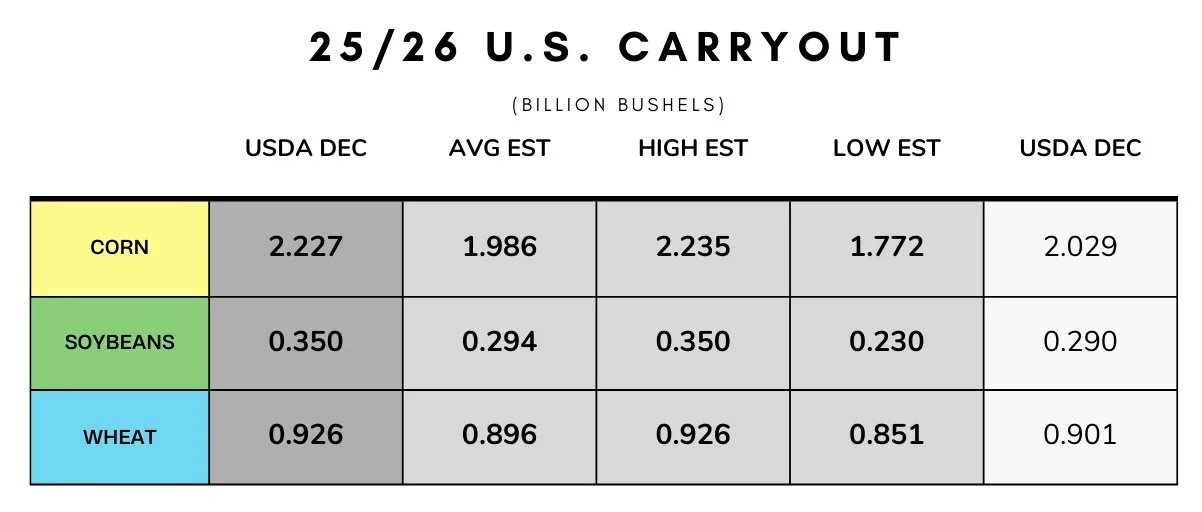
For reference, the entire US soybean carryout is 350 million bushels.
Seems pretty bullish when you think about it that way.
As the US doesn’t have an extra 300 million bushels to export.
We'd literally run out of beans.
But it's not quiet that black and white as there are a lot of moving parts.
However, we still felt that it made sense to reward that size of a move.
As the action could've very well been algo buying on the headline, and we weren’t sure if this market would see any follow through or not.
After all, Trump did only say they are "considering" bumping their purchases.
If that word changes from "considering" to "confirmed" it would be very bullish.
If it is true and China follows through, this is exactly what soybean bulls might’ve needed.
We had been talking about the impact China buying would have for a while. If they continue to buy US soybeans, the market will take notice.
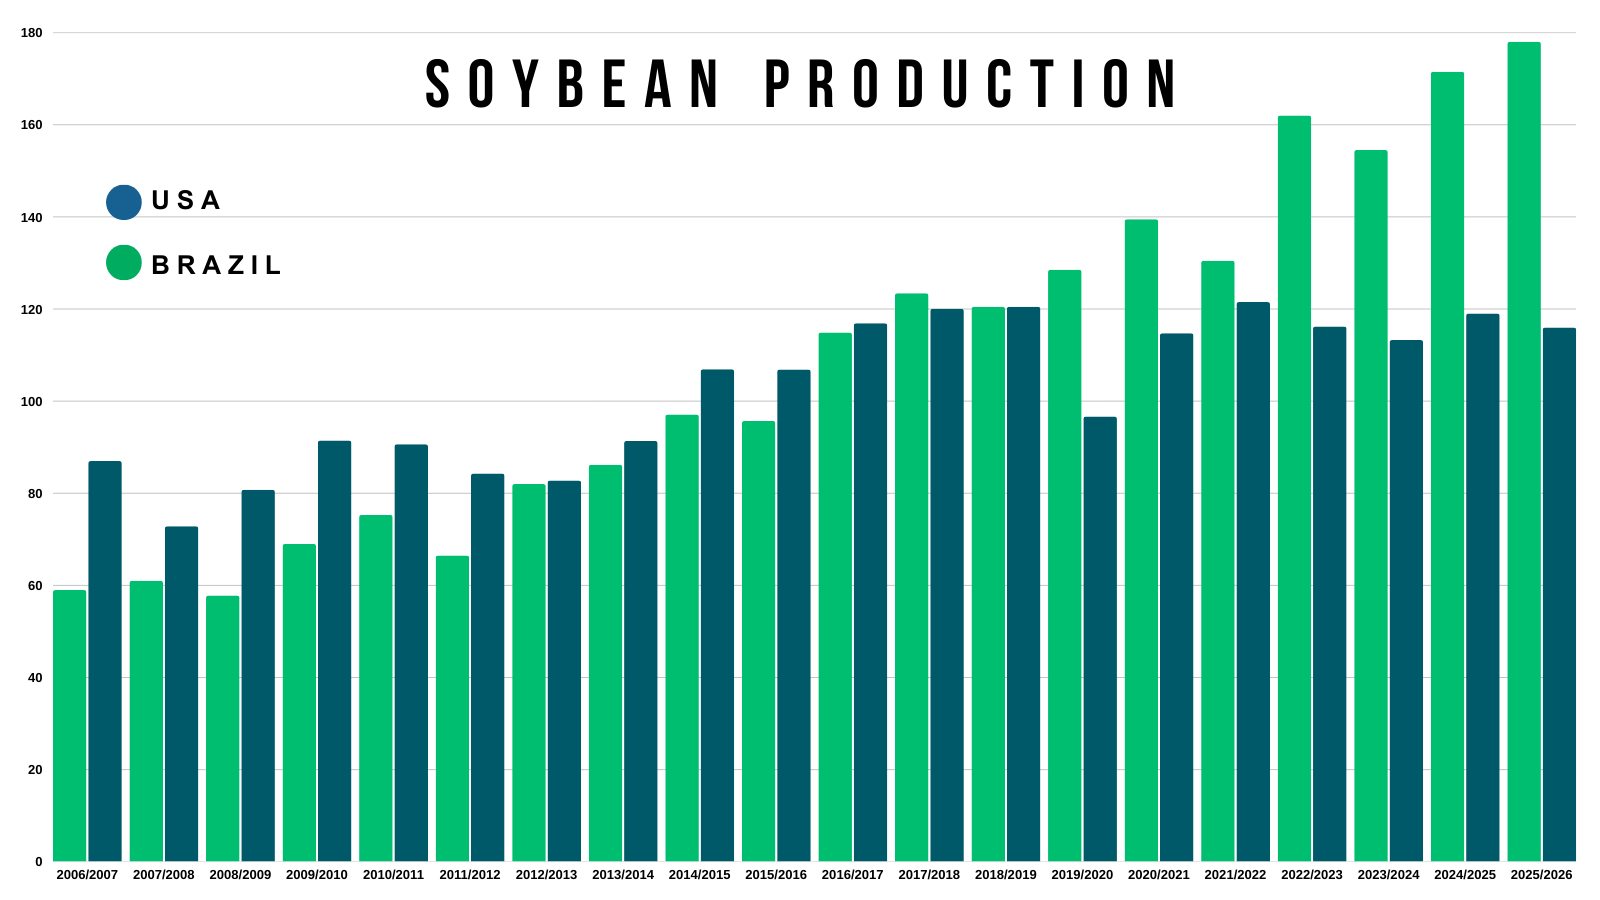
If they back off their purchases like they historically do here, given that Brazil has a monster crop coming around the corner and their soybeans are cheaper than ours, then soybeans will struggle to find a reason to go higher.
Who knows how the political chess match will turn out.
If China wants to continue buying, there is no reason we can’t go higher.
The US balance sheet does NOT have room for an extra 294 million bushels of demand. That is almost the entire carryout.
If China were to buy that amount, prices would probably have to go higher to ration demand.
Because we would need to push away our business from non-China destinations and hand it off to Brazil.
There is even talk that the US could end up having to import Brazil soybeans.
Brazil's beans are more way cheaper than ours.
So China's commercial crushers don’t have an incentive to buy at all. It just doesn’t make any sense for them to buy.
Which means the buying might have to come from their government reserve, not normal commerical demand.
If it is the government buying instead of the commercials, we could see basis and spreads do a lot of the work.
If their government is buying, it could result in the US balance sheet getting tighter, but the world balance sheet remaining the same.
Because those soybeans aren’t going to vanish into thin air. They have to go somewhere.
There is also simply some logistical question marks.
Does China even have room for an extra 300 million bushels of soybeans?
They probably don’t, and that original 12 million already has deliveries scheduled from February to August.
So for China to actually buy this amount of soybeans they might have to do something awkward. Such as buy the soybeans, then auction them into crush to help make room.
There are so many different ways it could go.
It sounds hard, but not impossible.
Like we've talked about before, soybeans could very well just be a small peace offering in the grand scheme of things for the trade war.
Something to keep in mind is that China probably won’t come in and buy these soybeans right now. They are going to be busy with Brazi's crop. We also have the Chinese new year coming up soon.
Regardless, it made sense to defend the rally in some sort of manner at a key spot on the charts.
This market sold off what felt like every day for the last 3 months.
We clawed back nearly 2/3rd's of that sell-off in 20 minutes. Not a move we want to completely ignore.
This could definitely change the tide moving forward this year.
Who knows if today's rally will simply be a one day thing or not, or the start of a bigger rally like in October.
But we still have to keep in mind that Brazil's harvest could start to add some pressure to this market.
Seasonally, soybeans do tend to struggle from the middle of February until April due to their harvest.
Similar to how the corn market finds life after getting through the harvest pressure here in the US.
Soybeans tend to do the same when it comes to the Brazil crop.
Given that Brazil is by far the dominant player now.
But if China does step up now rather than later, it could very well change things. However, there is some reasons to doubt it happens right away.
Today's Main Takeaways
Corn
Fundamentals:
Not much fresh news on corn today.
We are still essentially range bound.
We have record demand keeping a floor under us.
We have record supply keeping a lid on us.
Demand is as great as it's ever been, but we definitely aren’t short on corn here.
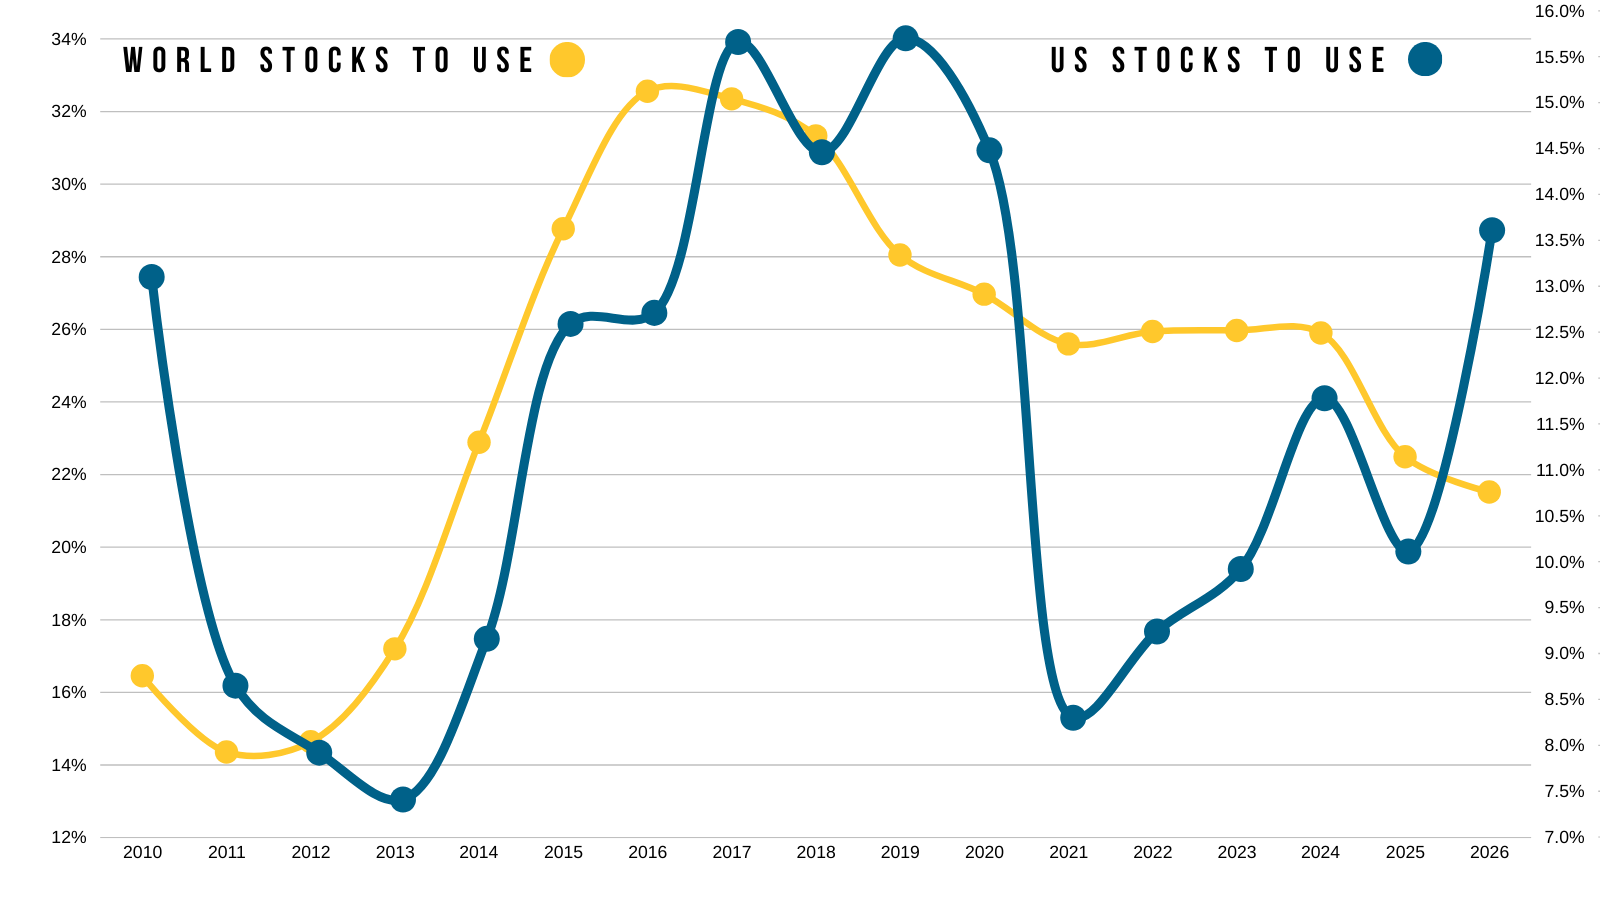
We have two completely different stories when it comes to the US vs the world for.
Here is the world stocks to use overlayed on top of the US stocks to use.
The world is the tightest in over a decade.
The US is far from being bullish.
We've talked about this several times before, but essentially, this just means the US has to perform. As the rest of the world couldn’t afford it.
One sub-par US crop would flip the corn story right around in a heart beat.
Yield has been a record for 3 straight years.
The first time we've seen a record yield 3 years in a row in around 50 years.
Can we go for 4 in a row or not?
The current situation is not overly friendly corn at all. But I don’t see a reason for us to collapse either.
It very well could take a weather scare to get a major opportunity.
Something we haven’t seen since 2023.
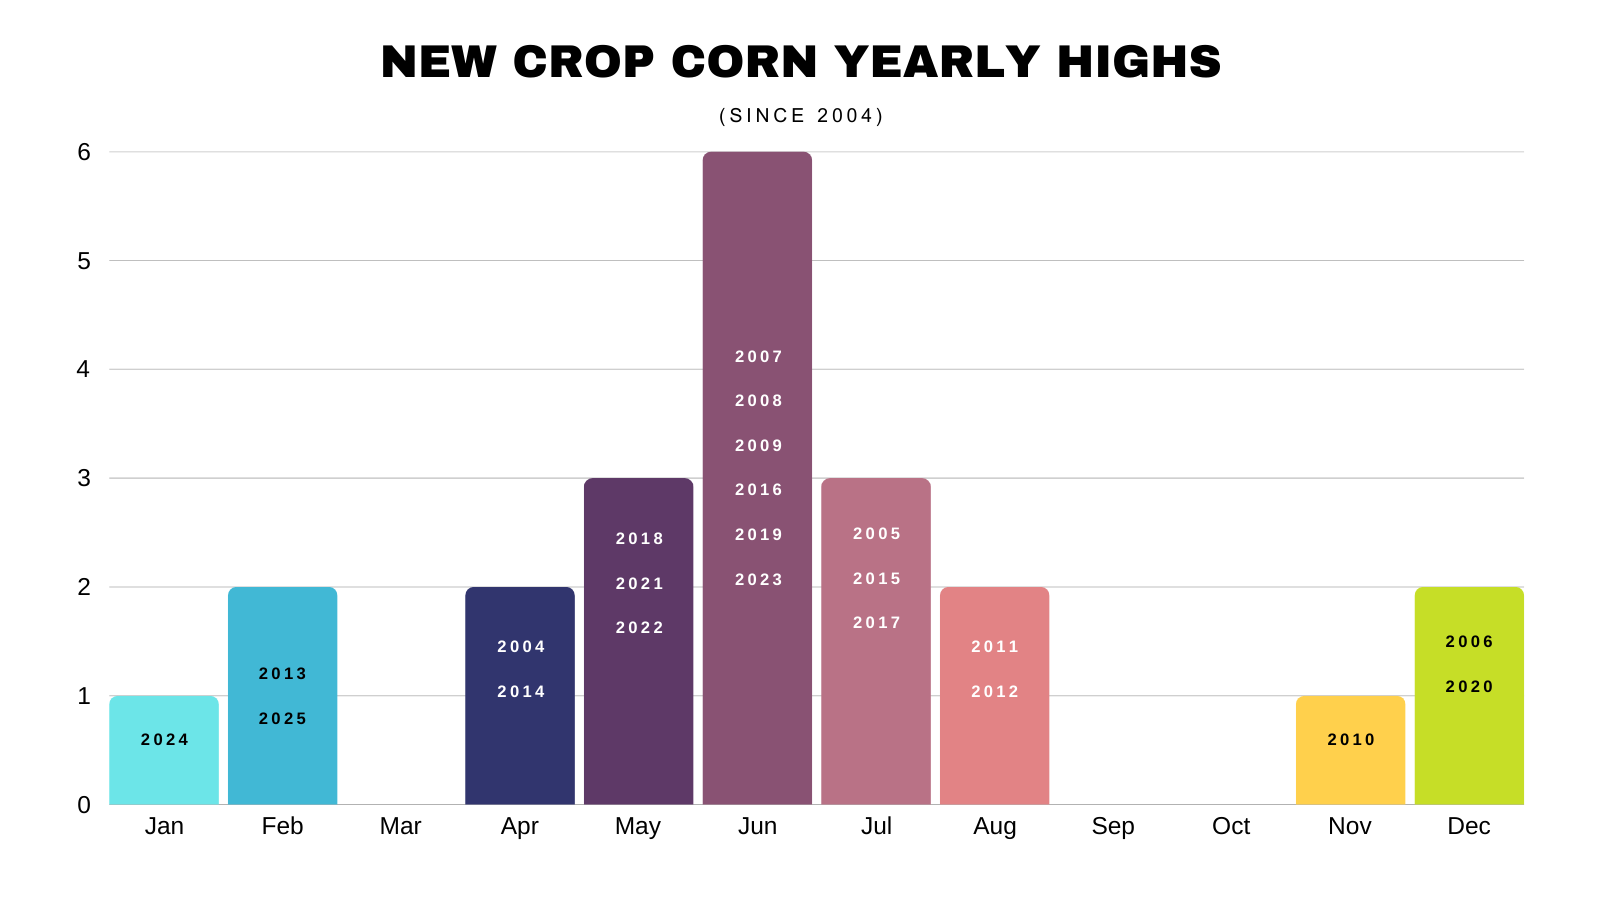
I've shown this chart in my last few updates. This is when corn has posted it's highs for the year since 2004.
We "almost" always get an opportunity in the spring or summer.
Which is typically off the back of a weather scare.
The last 2 years were in a realm of their own.
Sure, it could happen 3 years in a row. But up until 2024 we had only posted our highs for the year before April one single time.
That was in 2013 when we were already on a downfall coming off the record 2012 levels.
So history does favor an opportunity.
Short term, we still need to be cautious of first notice day.
We've traded lower the last two weeks of February 8 of the last 11 years heading into first notice day.
Overall it's hard to get super bullish on corn here unless we see a weather scare that threatens supply. For now our upside does feel limited.
The market is going to lack fresh data until we get into the acre talk and planting intentions.
We have that USDA report next week, but the only thing the USDA will play with is the demand side.
You could very well argue that they are too light on their export projections.
We've created a demand monster in corn.
What happens if the US underperforms?
If the USDA is right, the US will absolutely need another big crop to keep up with demand.
Something to keep in mind this growing season.
Technicals:
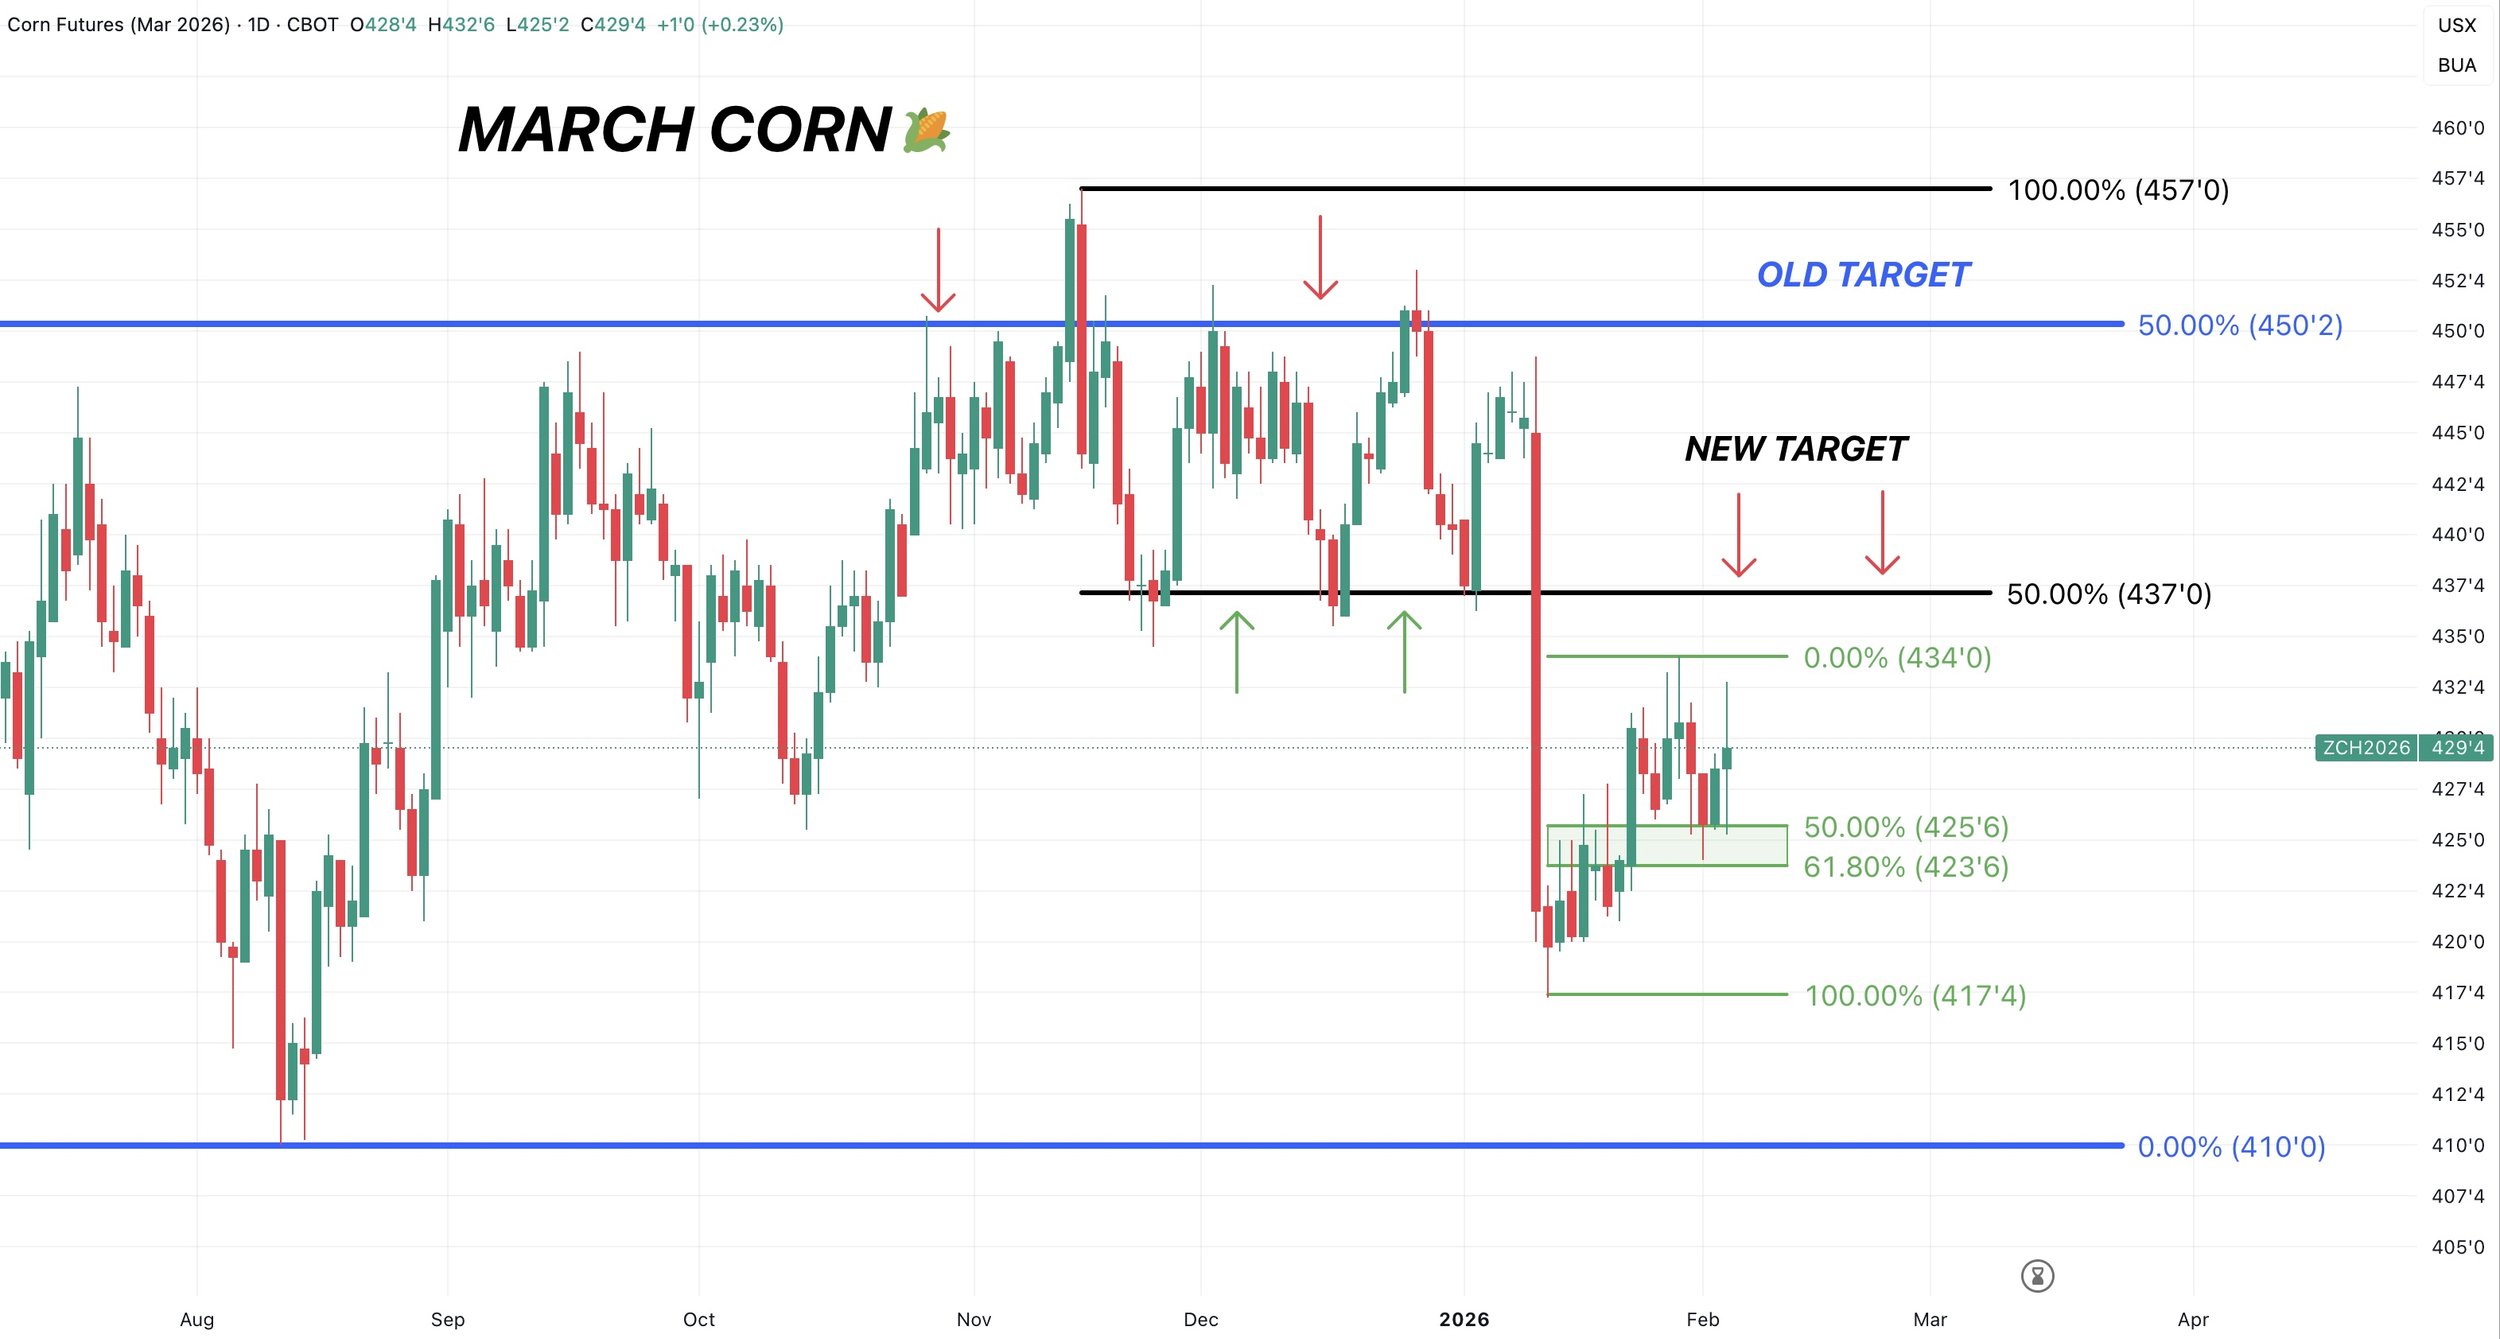
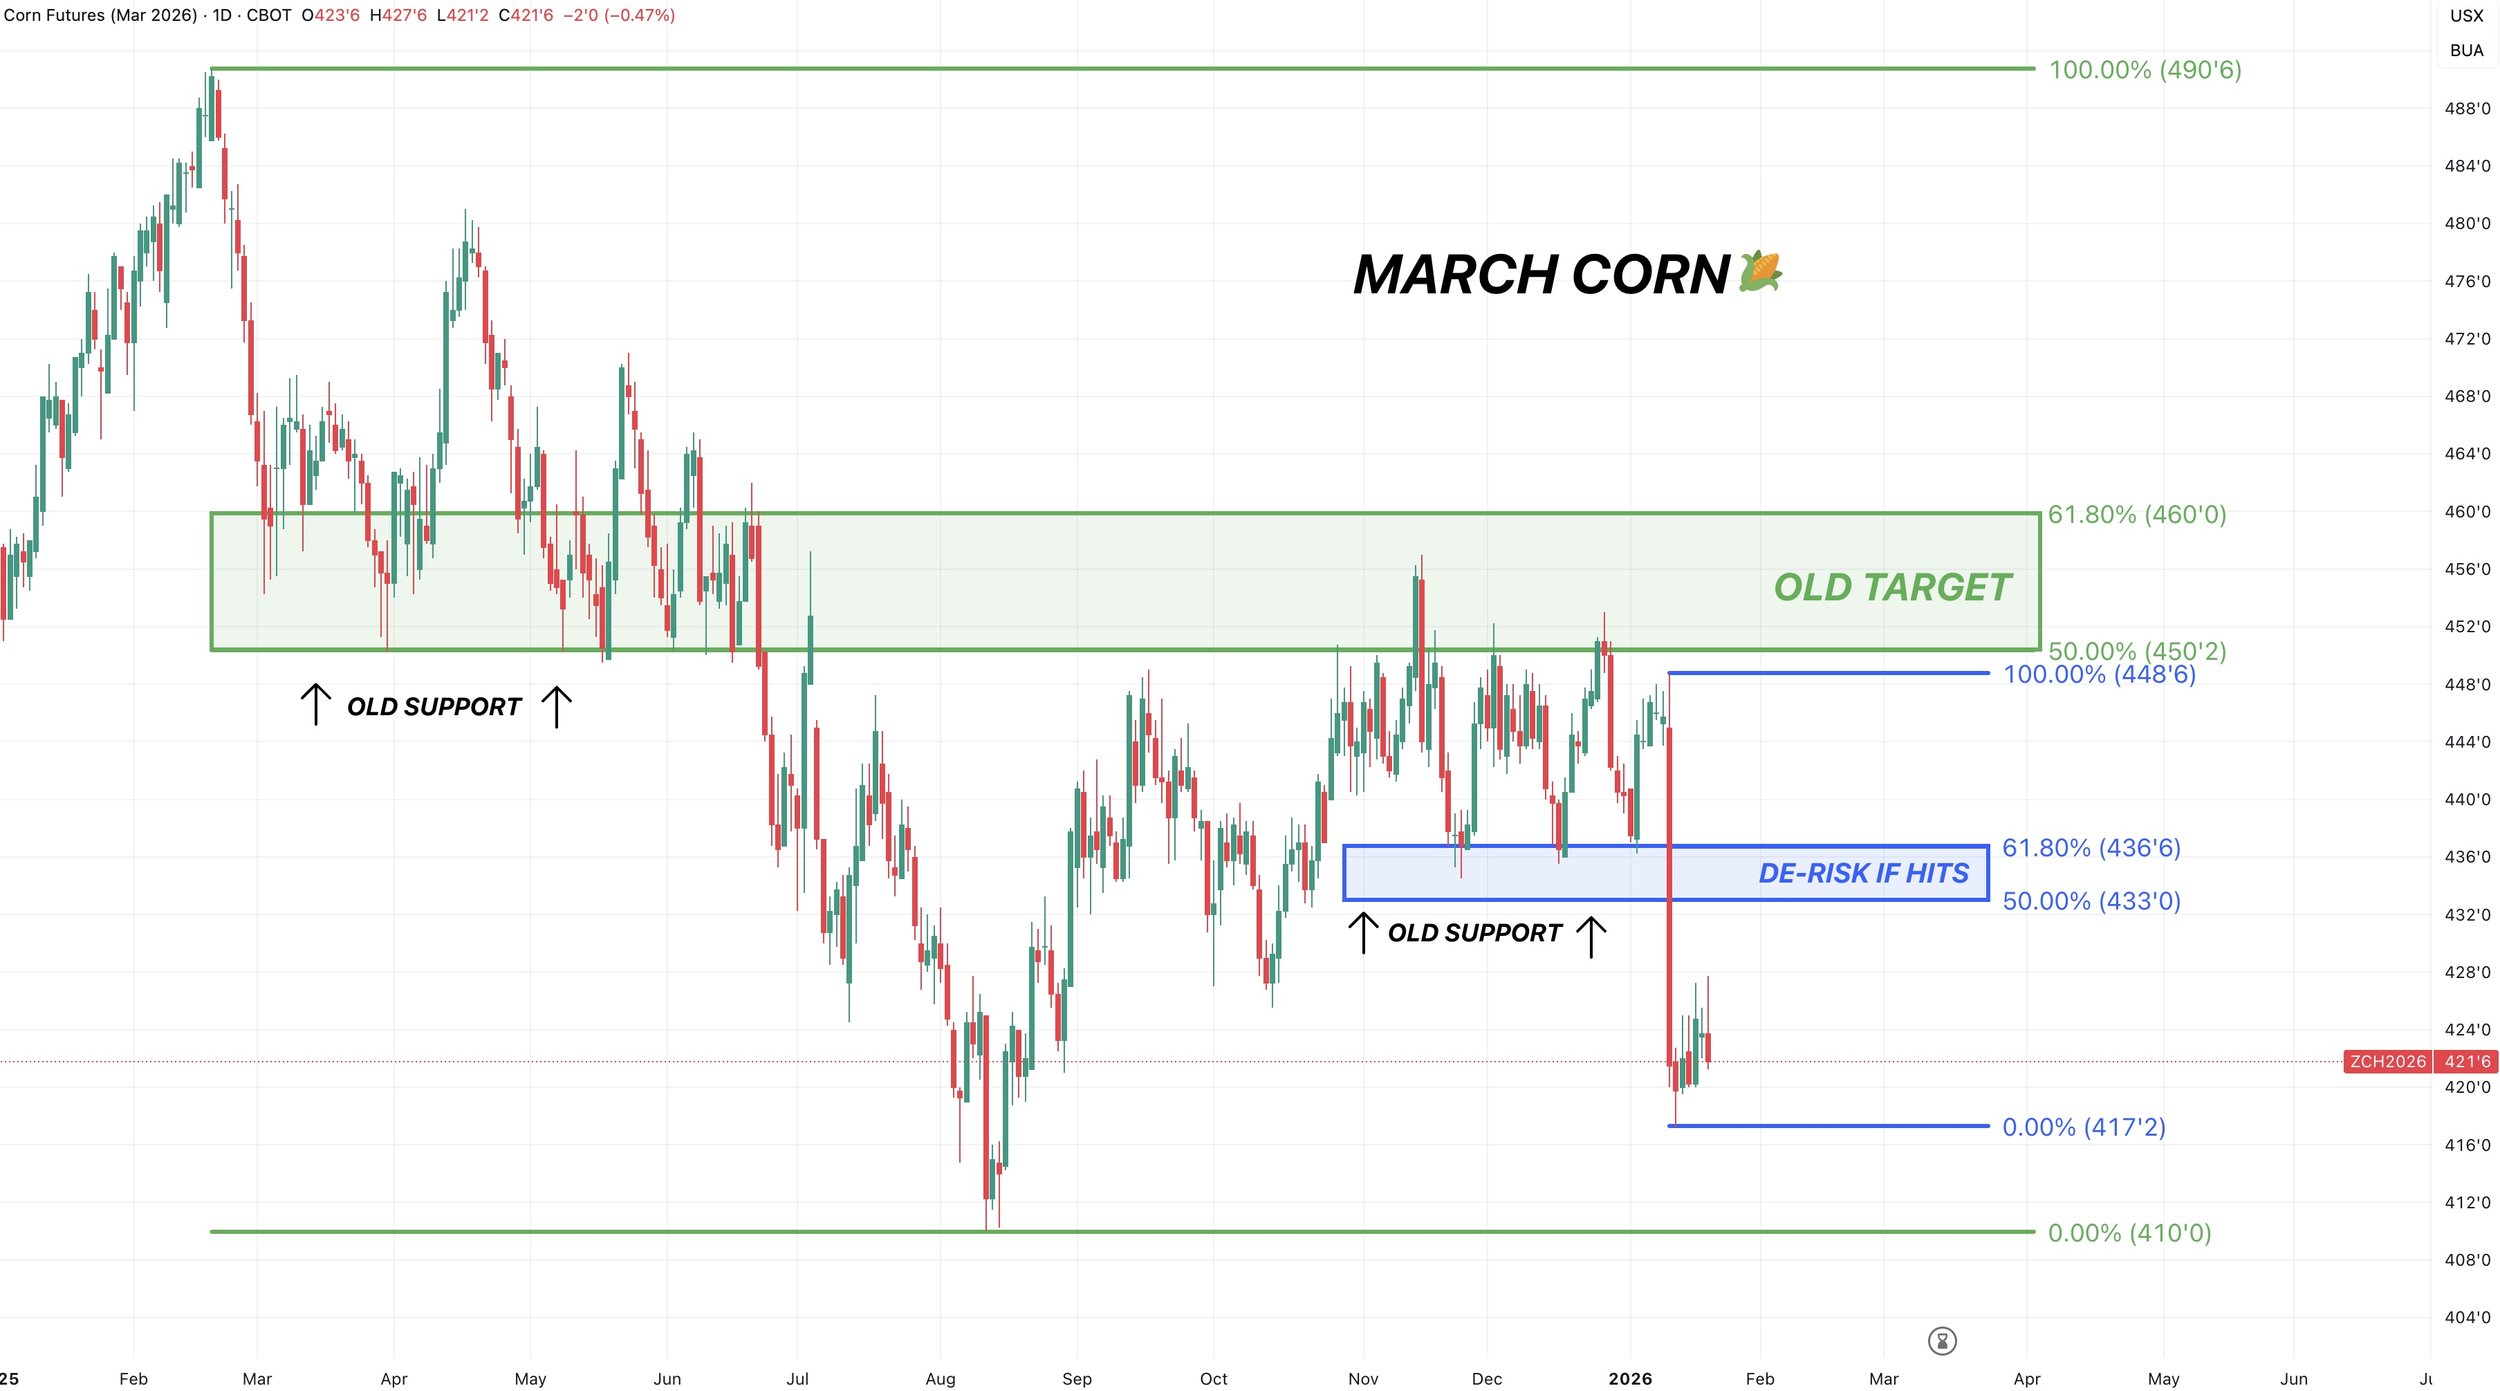
March Corn
I still want to reward a move towards $4.36 to $4.37
It's 50% of the November highs and old key support.
The fall rally failed at 50% of the February highs and key support from last spring.
Same set up. Smaller scale.
We are finding life right at the golden zone retracement of this entire bounce.
This is where the market decides if the bounce is over, or if it's time to continue higher.
Holding this level is key to keeping our bias remaining higher.
It's the most common spot for a correction to end, so bouncing here would make perfect sense.
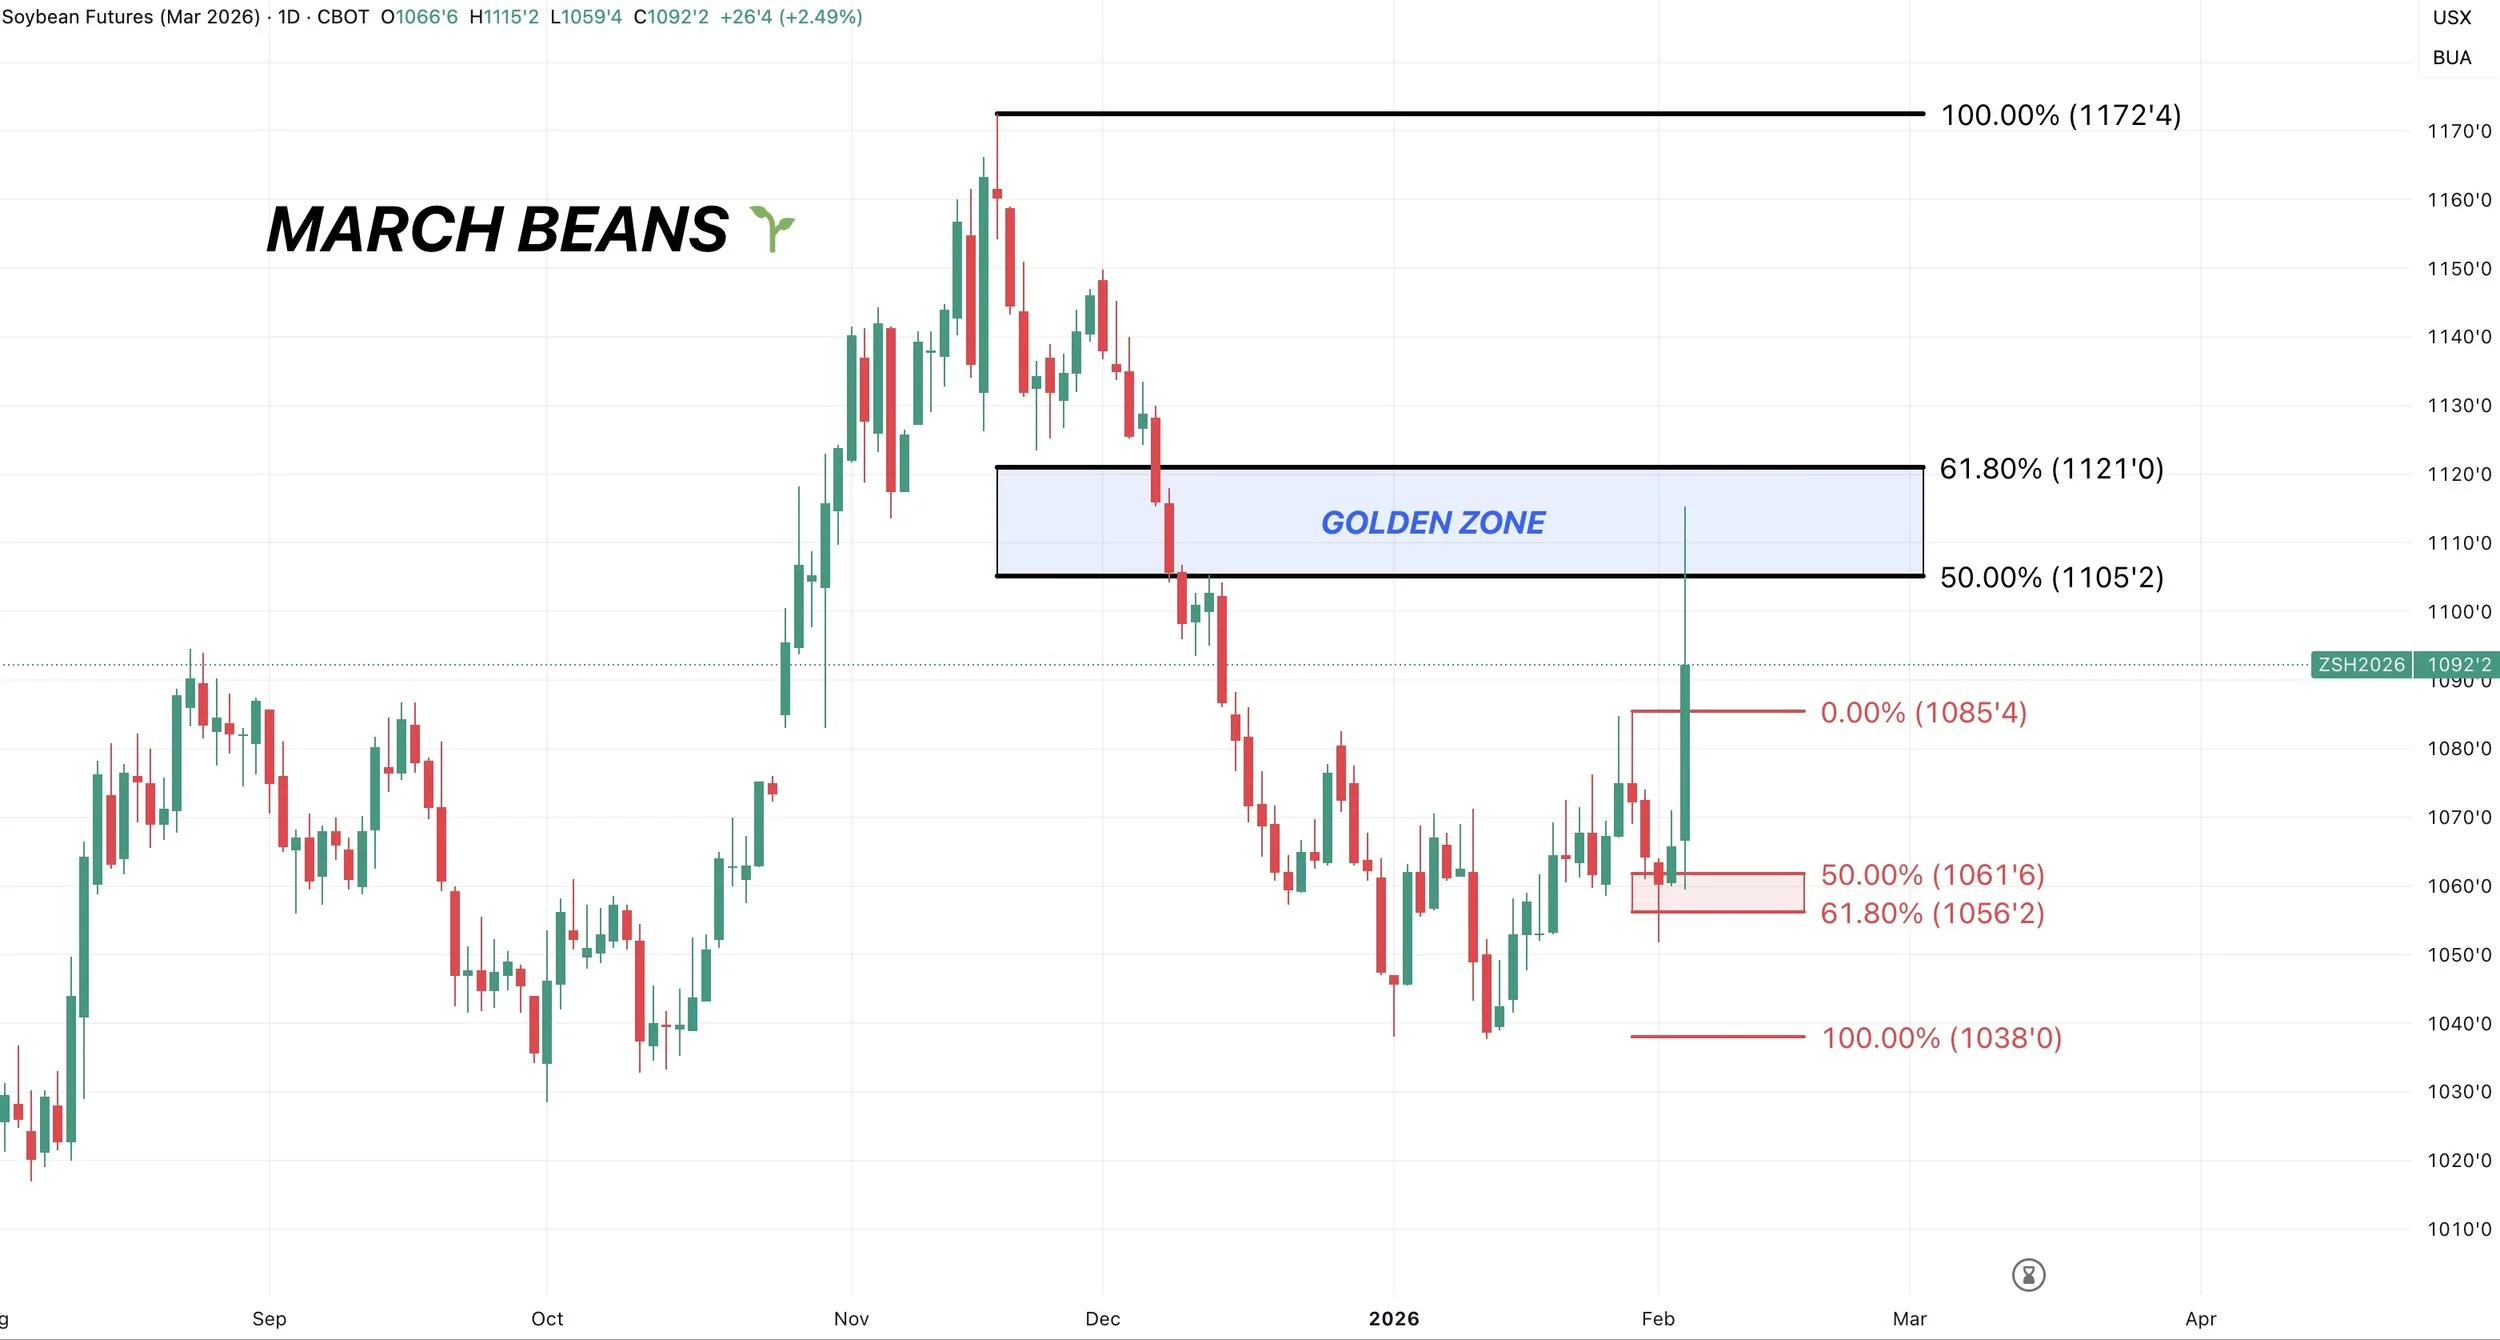
Soybeans
Fundamentals:
We covered soybeans earlier, so let's just take a quick look at the March chart.
Technicals:
March Beans
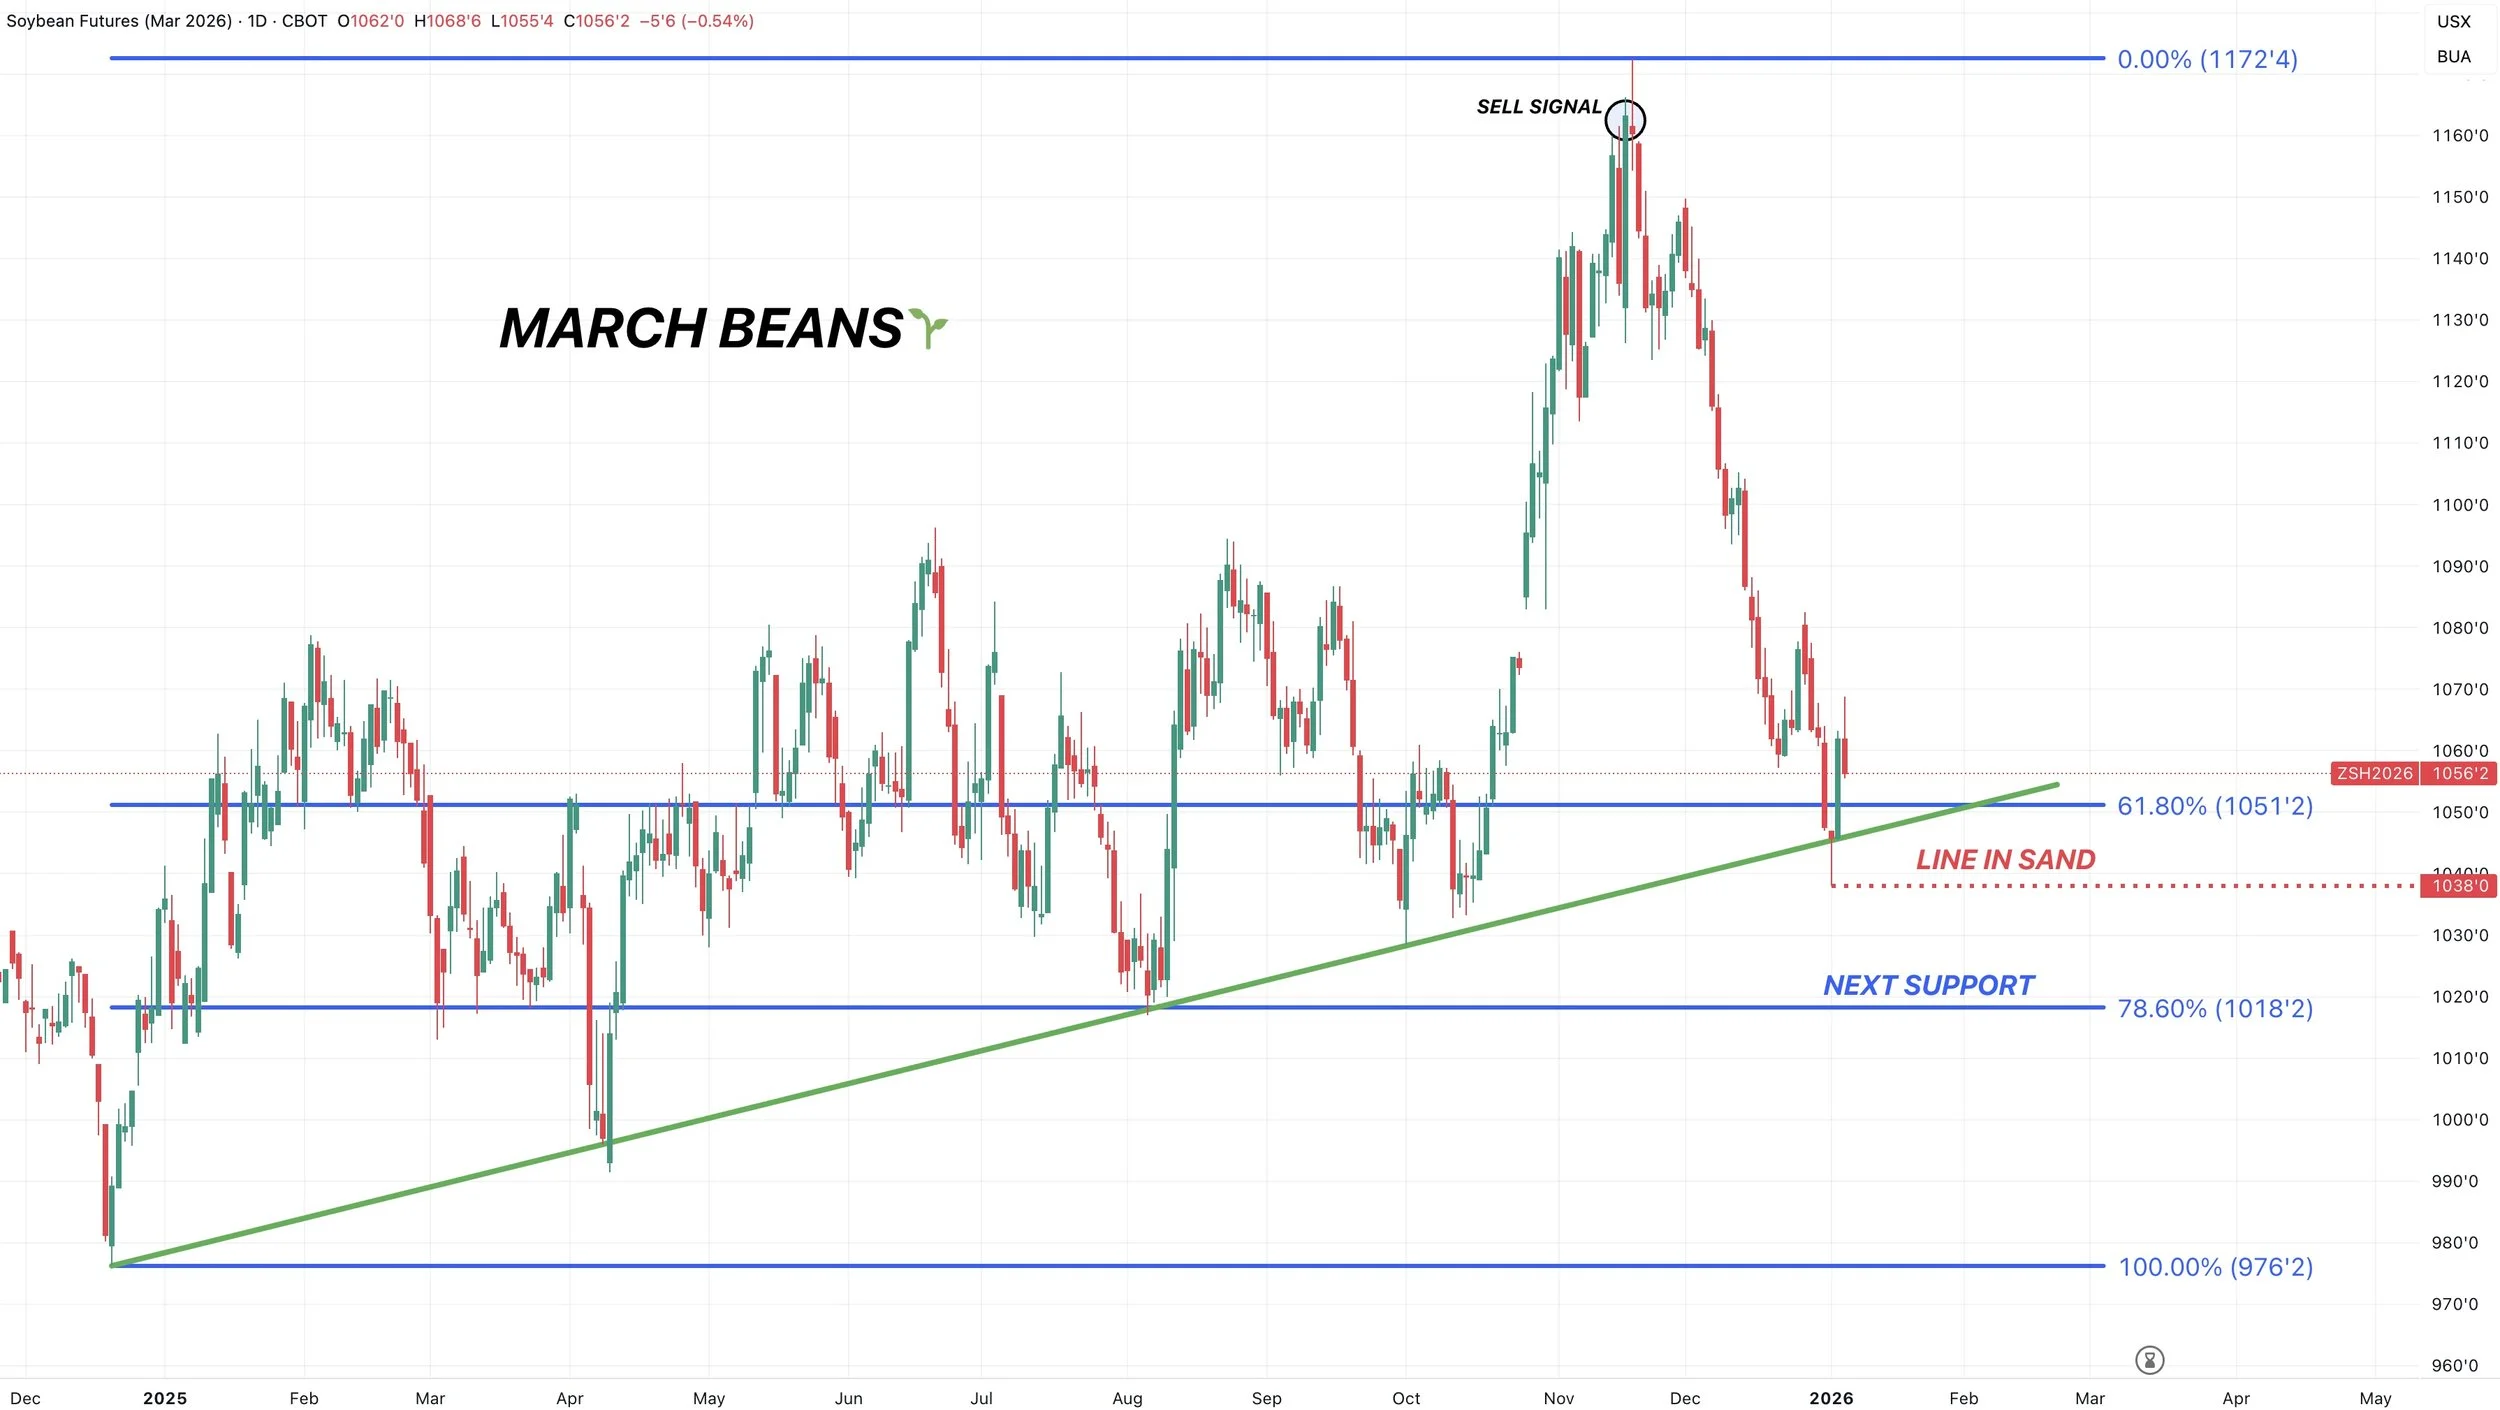
Monday we bounced right after giving back 61.8% of this entire rally.
The exact level we needed to hold.
Today we then rallied and clawed back into the golden zone retracement of the entire sell off from November.
A very common level for a bounce to fail. Hence why we issued the sell alert this morning.
We closed -22 cents off the highs today. So not the best looking candle here short term.
Tomorrow's price action will be interesting and give us some further confirmation if the rally is over for now or not.
Wheat
Fundamentals:
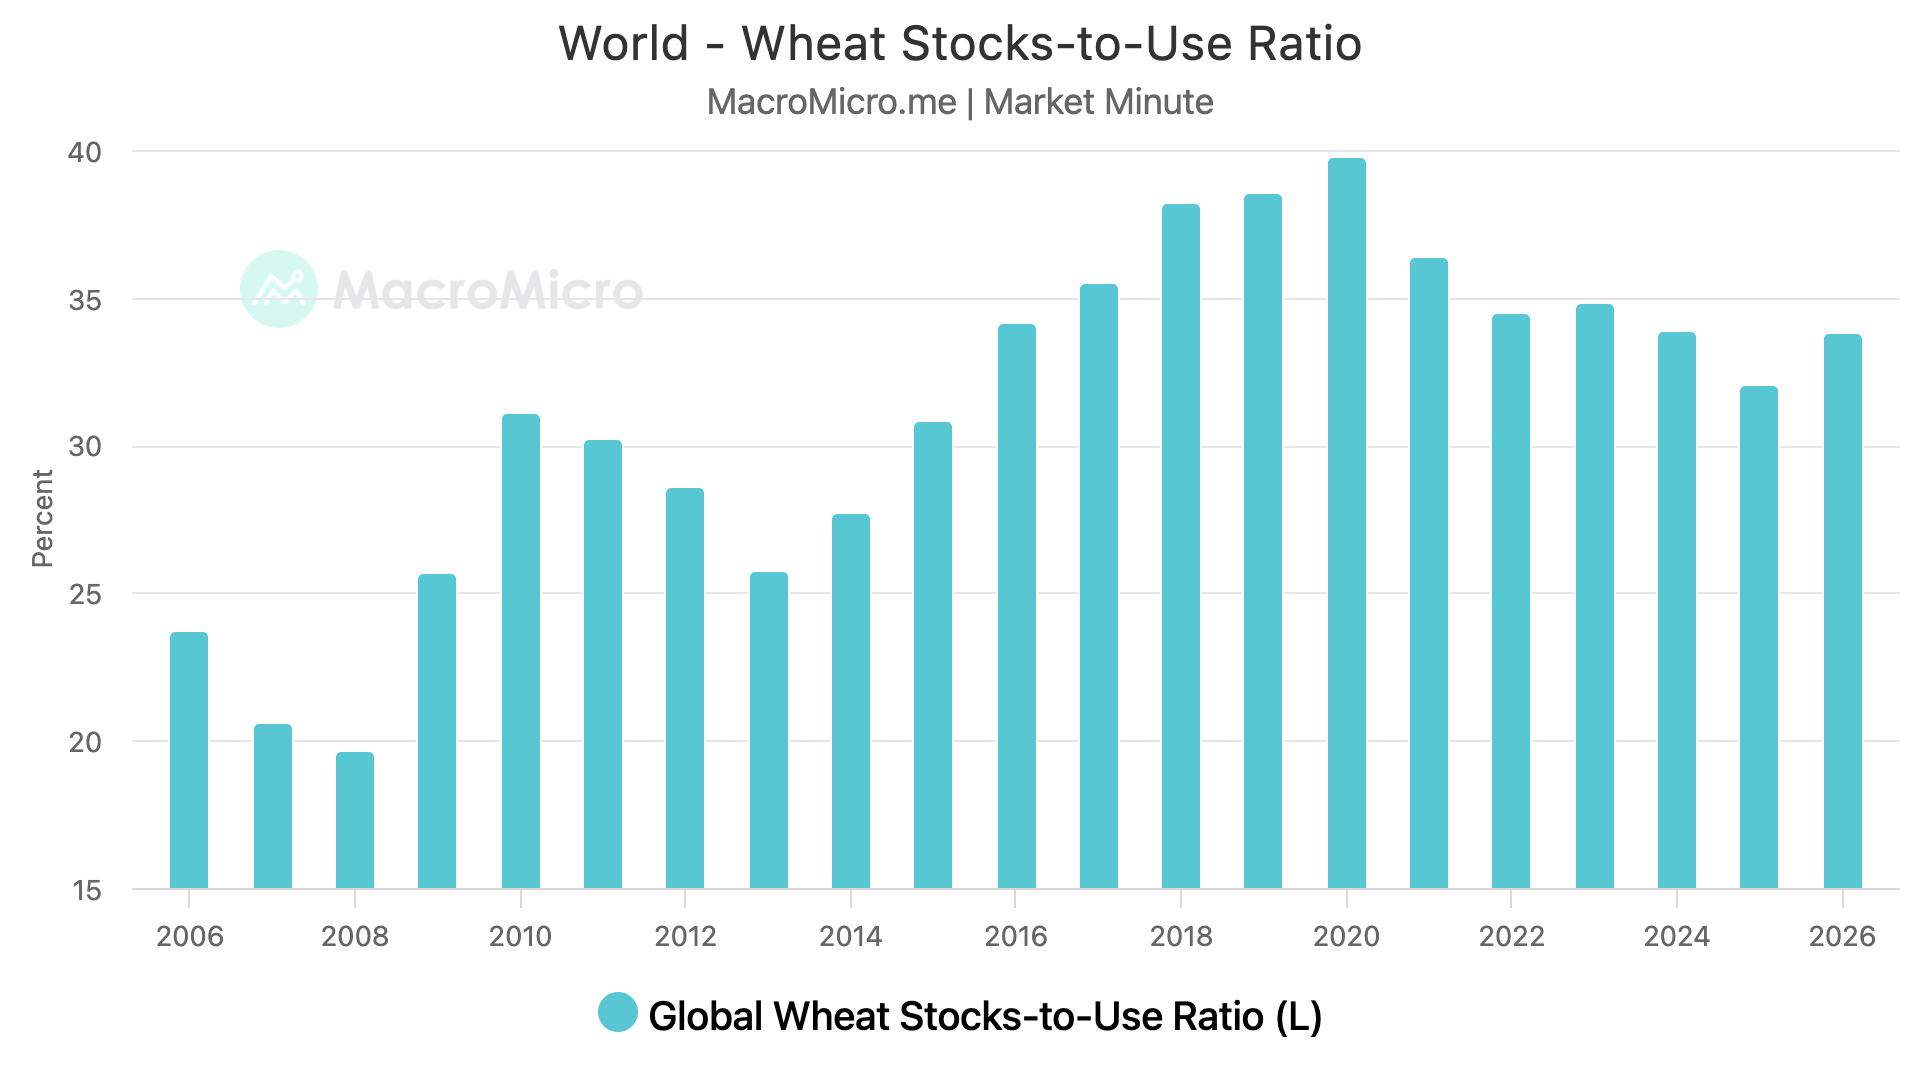
The US wheat situation is far from bullish.

The world situation is on the rise for the first time in a few years as well.
But that does not mean the wheat market cannot provide an opportunity.
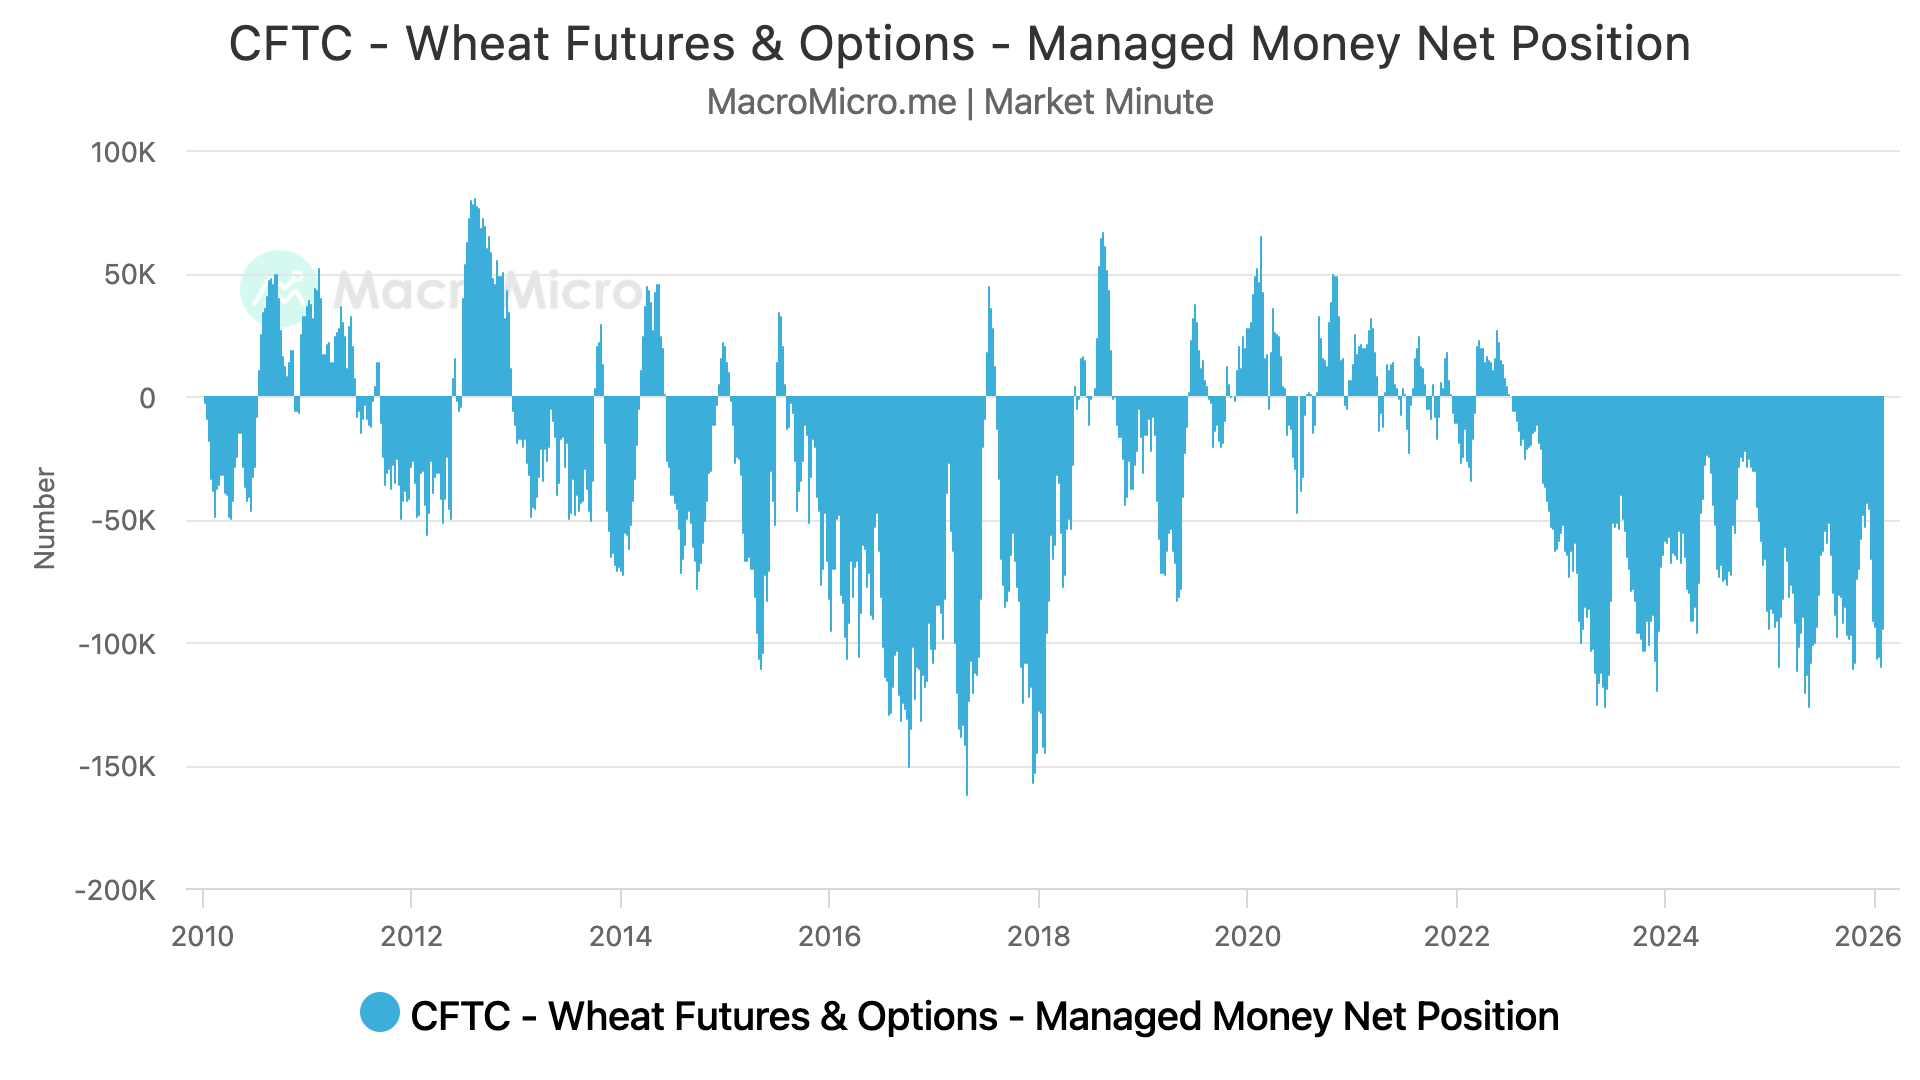
The funds are still incredibly short like usual. They haven’t been long since 2022.
Since the US and world stories are not super friendly, the wheat market will need to see some sort of supply scare somewhere in the world.
Which we have been seeing a little bit of with the US and Ukraine both experiencing brutal cold snaps recently.
We now have Russia getting awfully cold as well.
But it doesn’t appear like we've seen anything material that is going to result in a massive rally just yet.
For the wheat market to continue higher, it will likely take a supply scare.
The thing about supply scare rallies is that they don’t typically last very long. However, they can run far in a short amount of time.
Technicals:
March KC
Sitting right at the 61.8% retracement of the last bounce.
Must hold spot here short term to keep the immeditate bias remaining higher.
If we are going to bounce, it needs to be here.
Otherwise, we likely fall back into the old range.
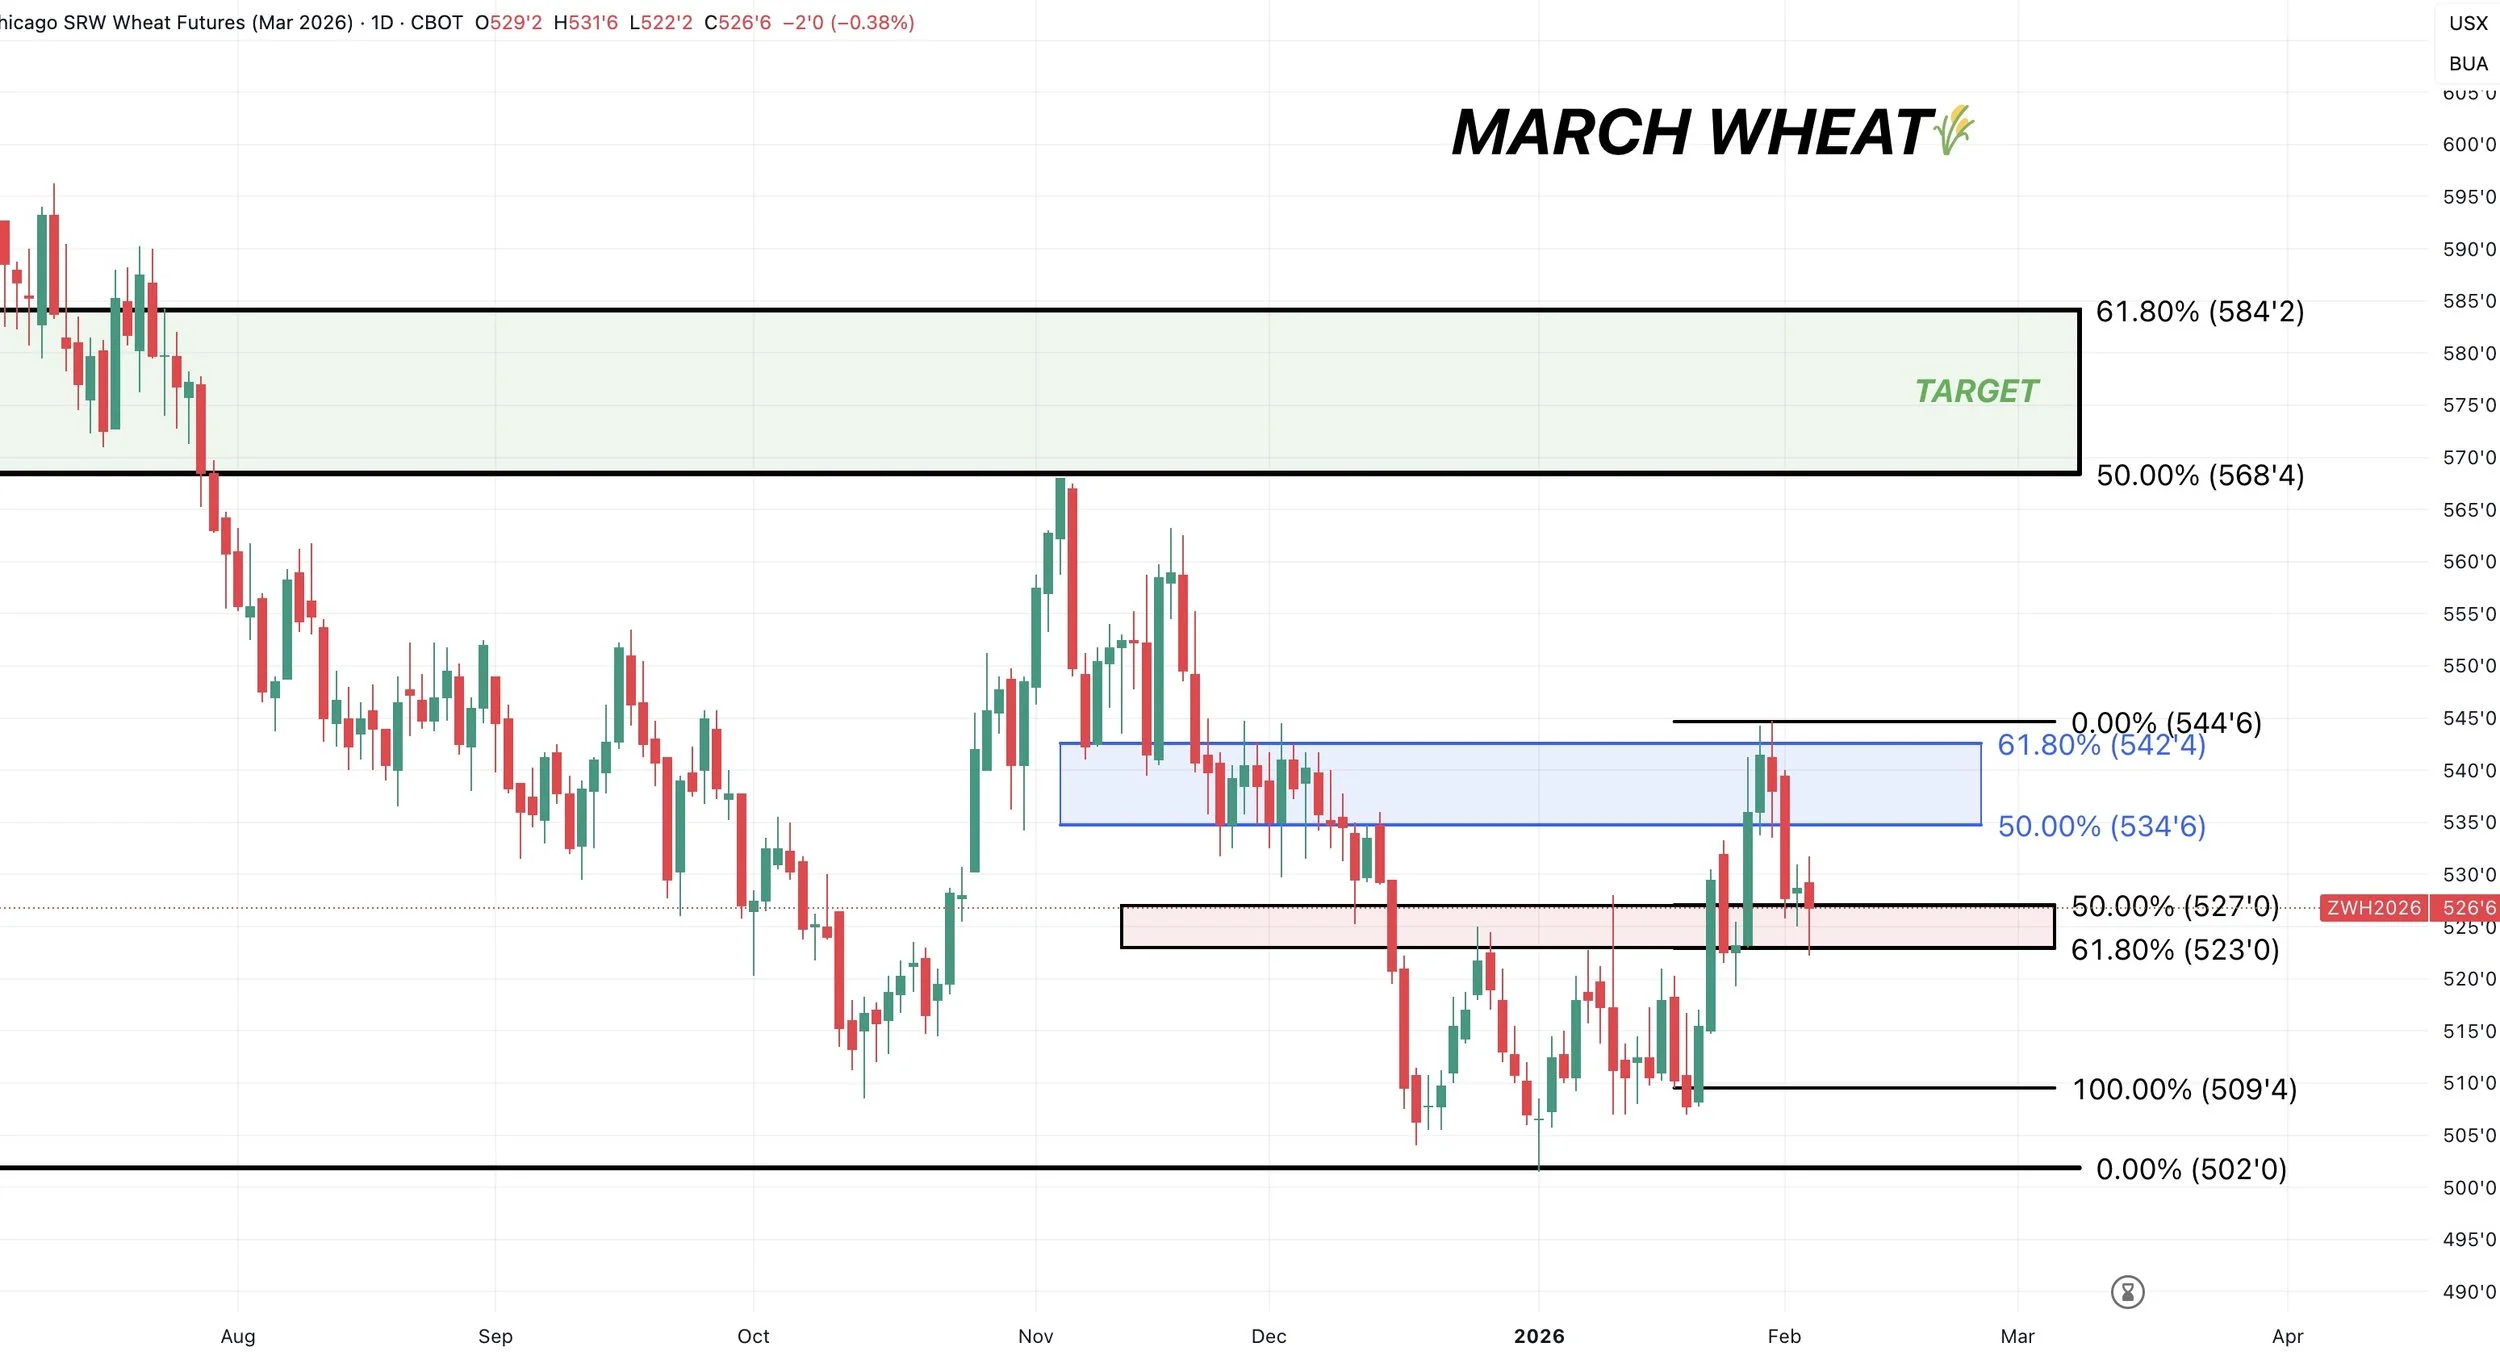
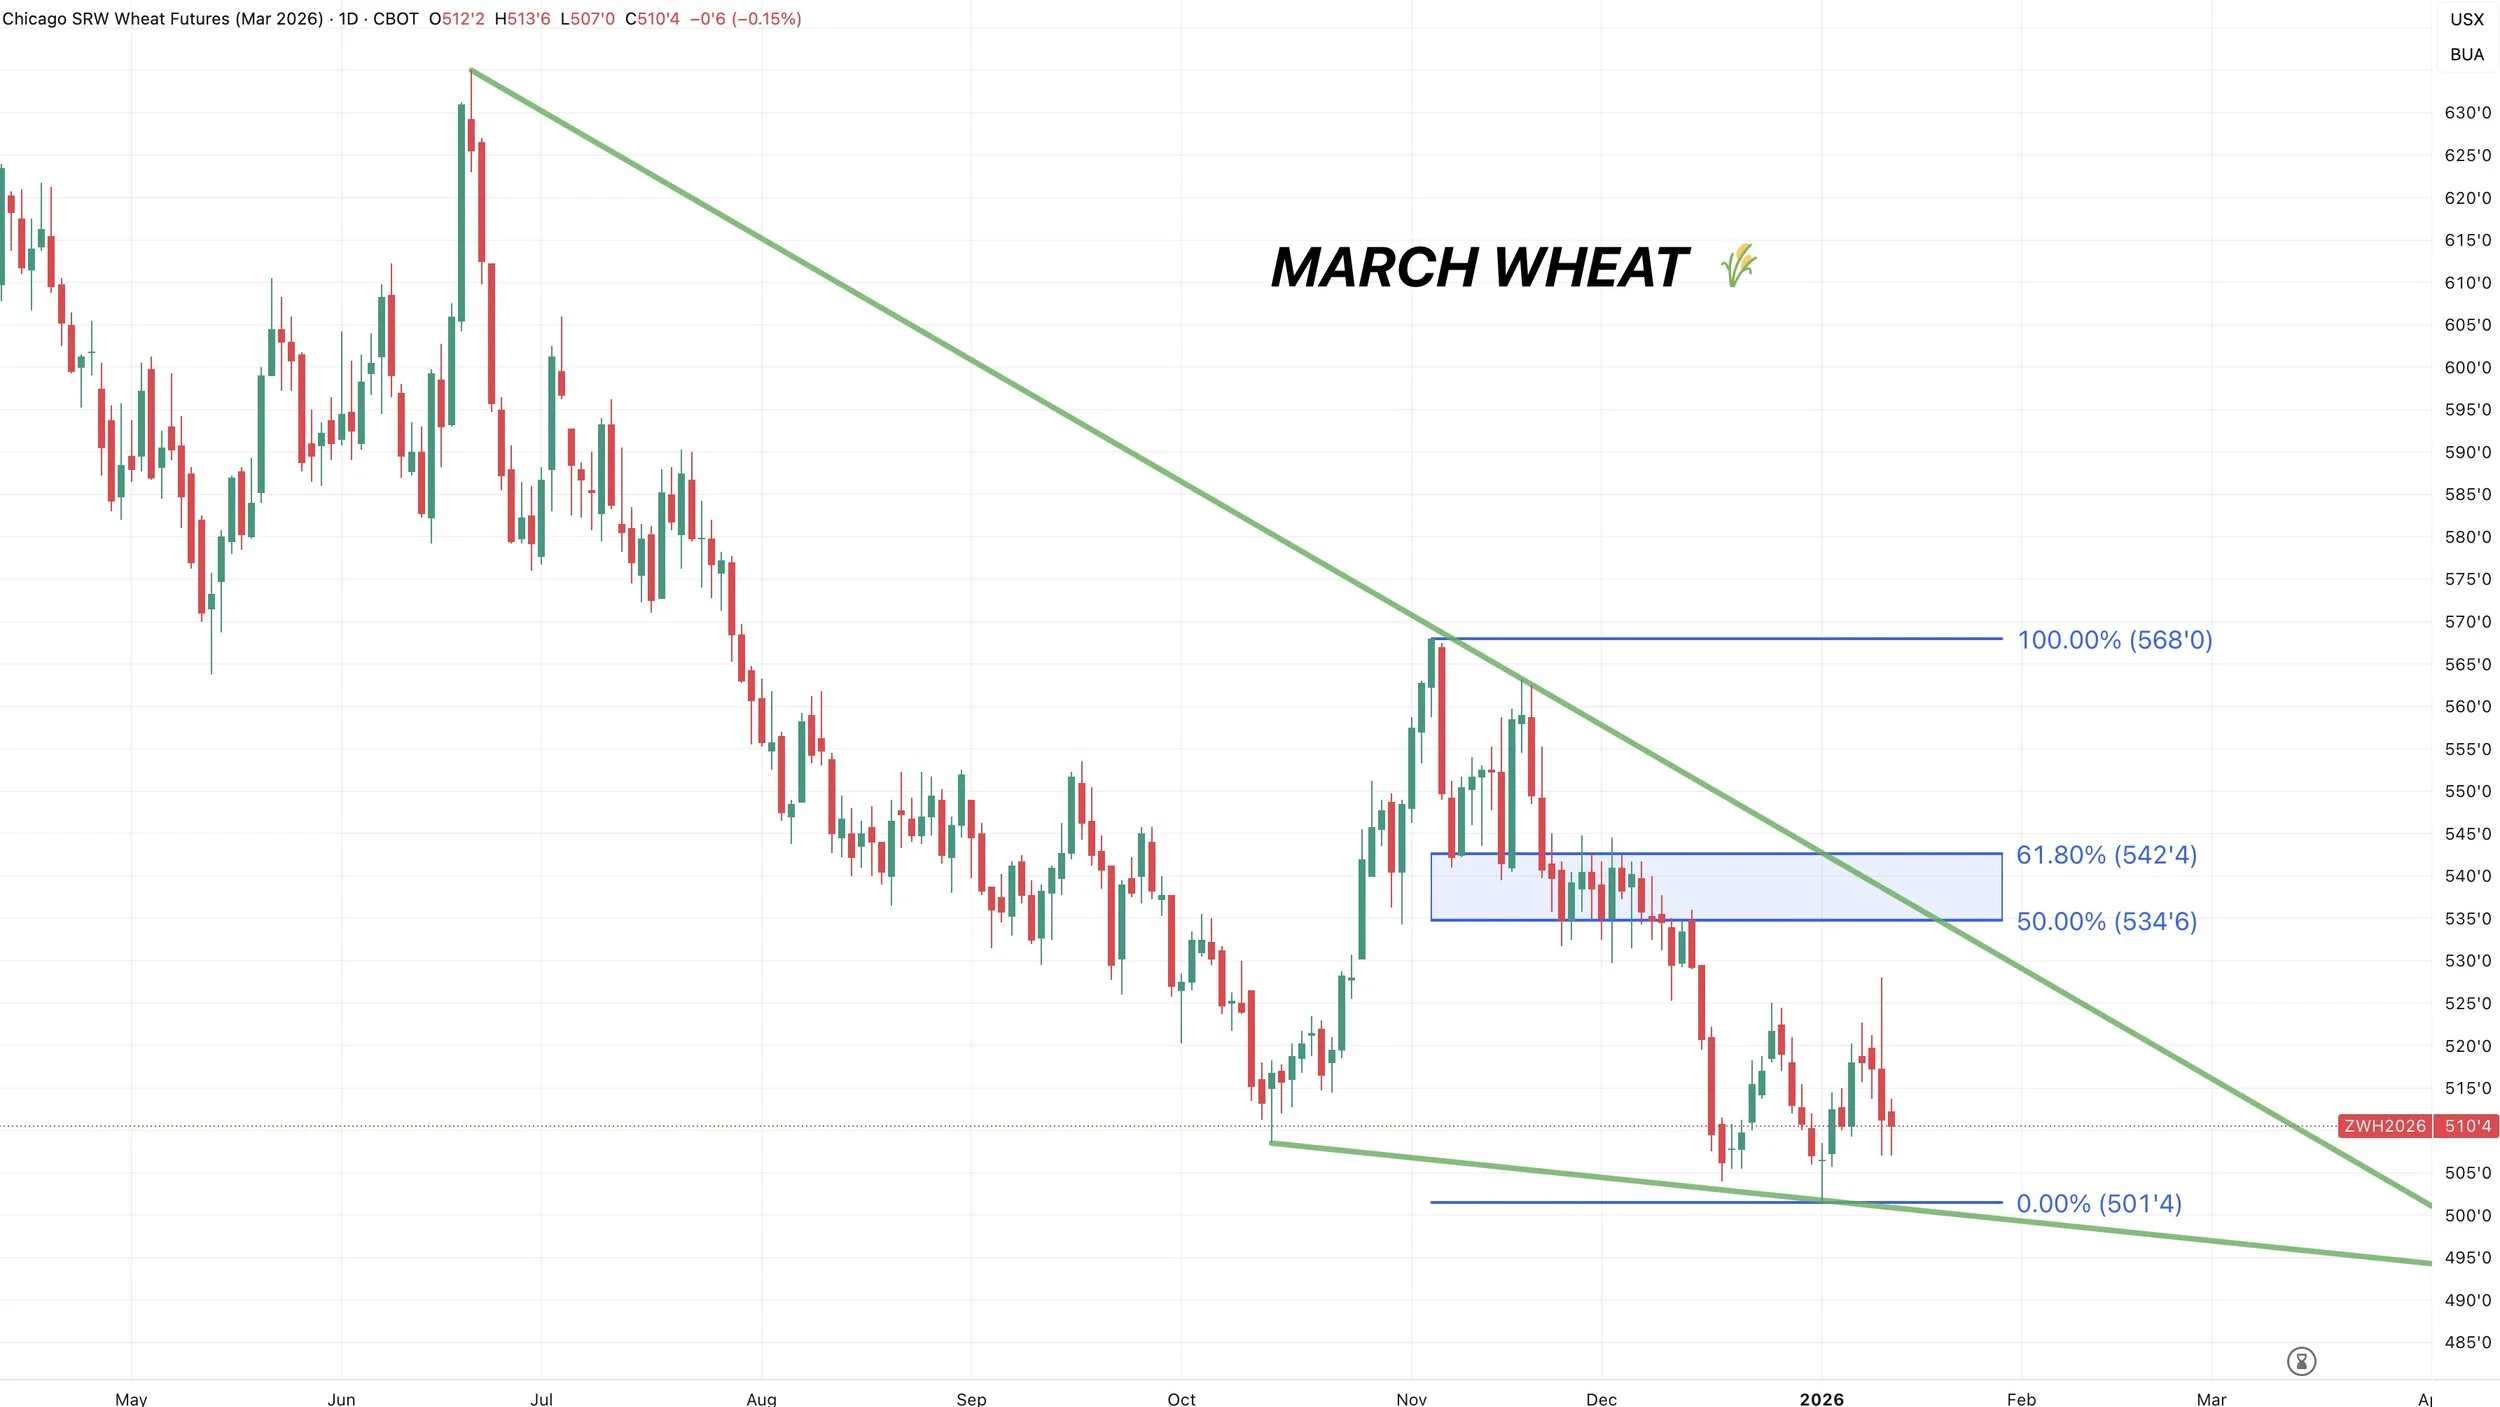
March Chicago
The recent rally failed at the 61.8% retracement up to the Nov highs.
Break above that level and it should result in further upside.
To the downside, like KC, we are at a critical spot. The golden zone retracement levels.
Need to bounce here to prevent us from going back to the old range.
Cattle
Fundamentals:
Not a lot on cattle today.
The market clearly found Friday's report to be bullish and reaffirmed the fundamental situation is as tight as ever. The tight situation isn’t something that can be fixed overnight.
This market could easily challenge the highs, but it might take some additional news for this market to go and post some crazy new highs.
There is still definitely headline risk in this market, which can happen at any time.
If you're the funds, you took a pretty big hit back in October because of one Trump tweet. What would make you want to again get overly long in this market?
The biggest headline risk has to be screwworm.
If screwworm enters the US, I am sure the algos will take the headline and run.
Despite cattle still having potential given the tight fundamentals, it still just makes sense to defend these levels given all of the headline risk.
Technicals:
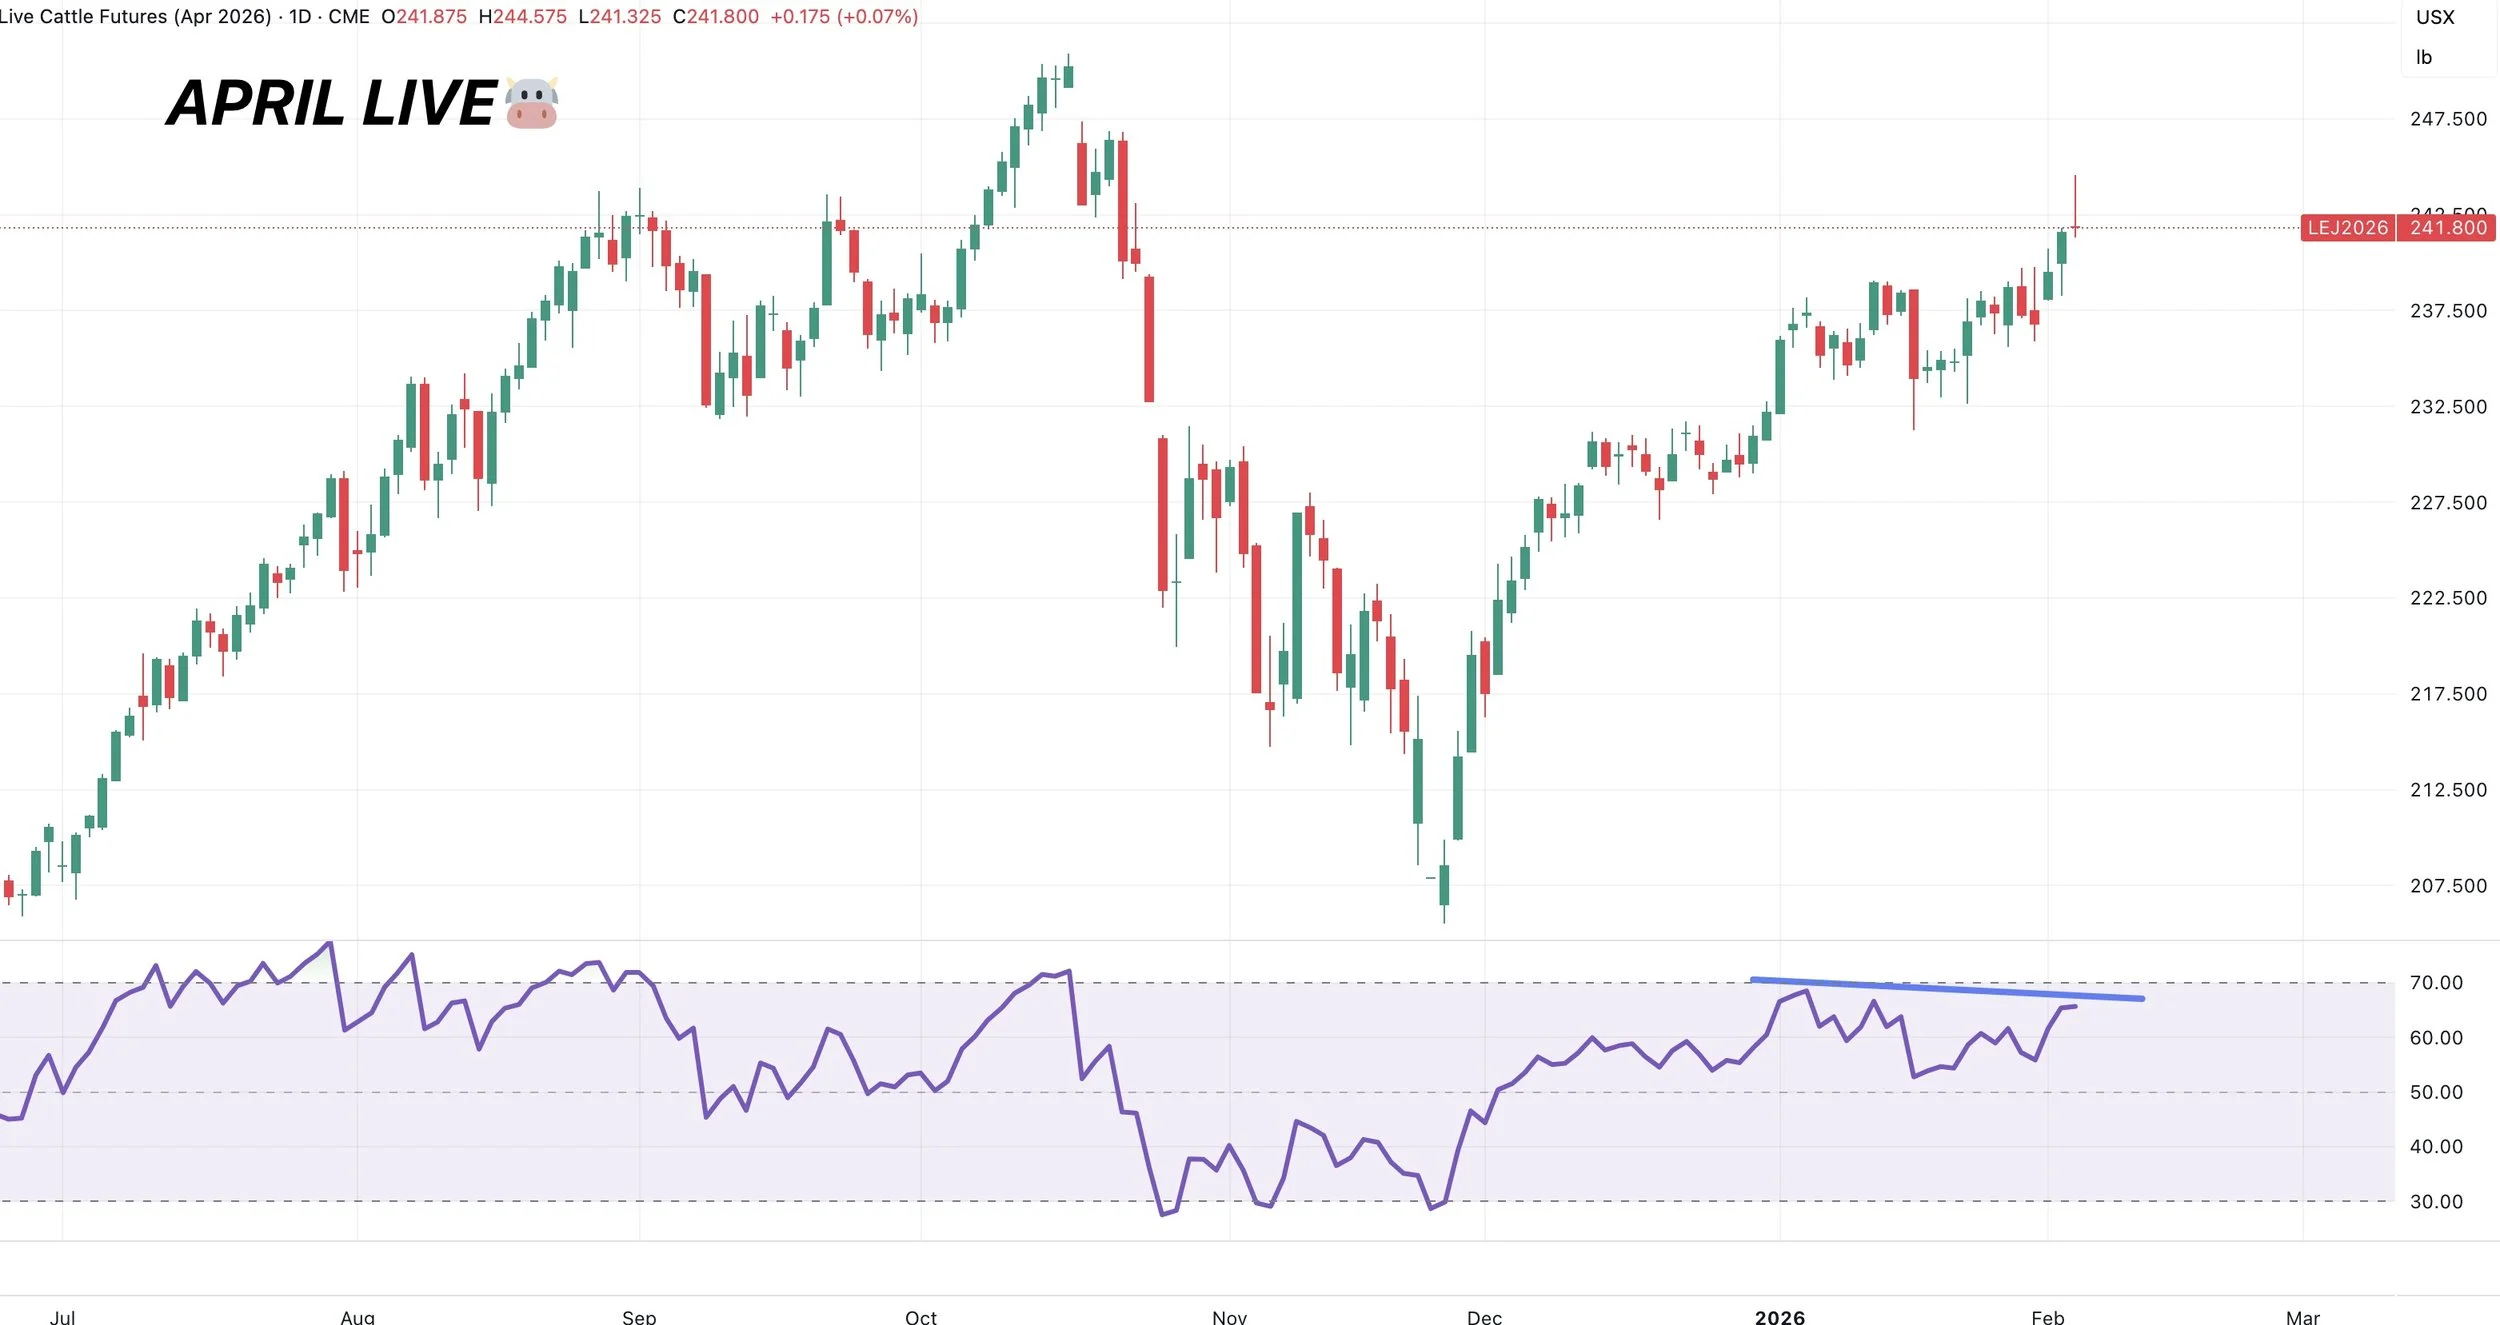
April Live
We left a gravestone doji candle today.
That can often can be considered a potential reversal candle.
Still showing some bearish RSI divergence.
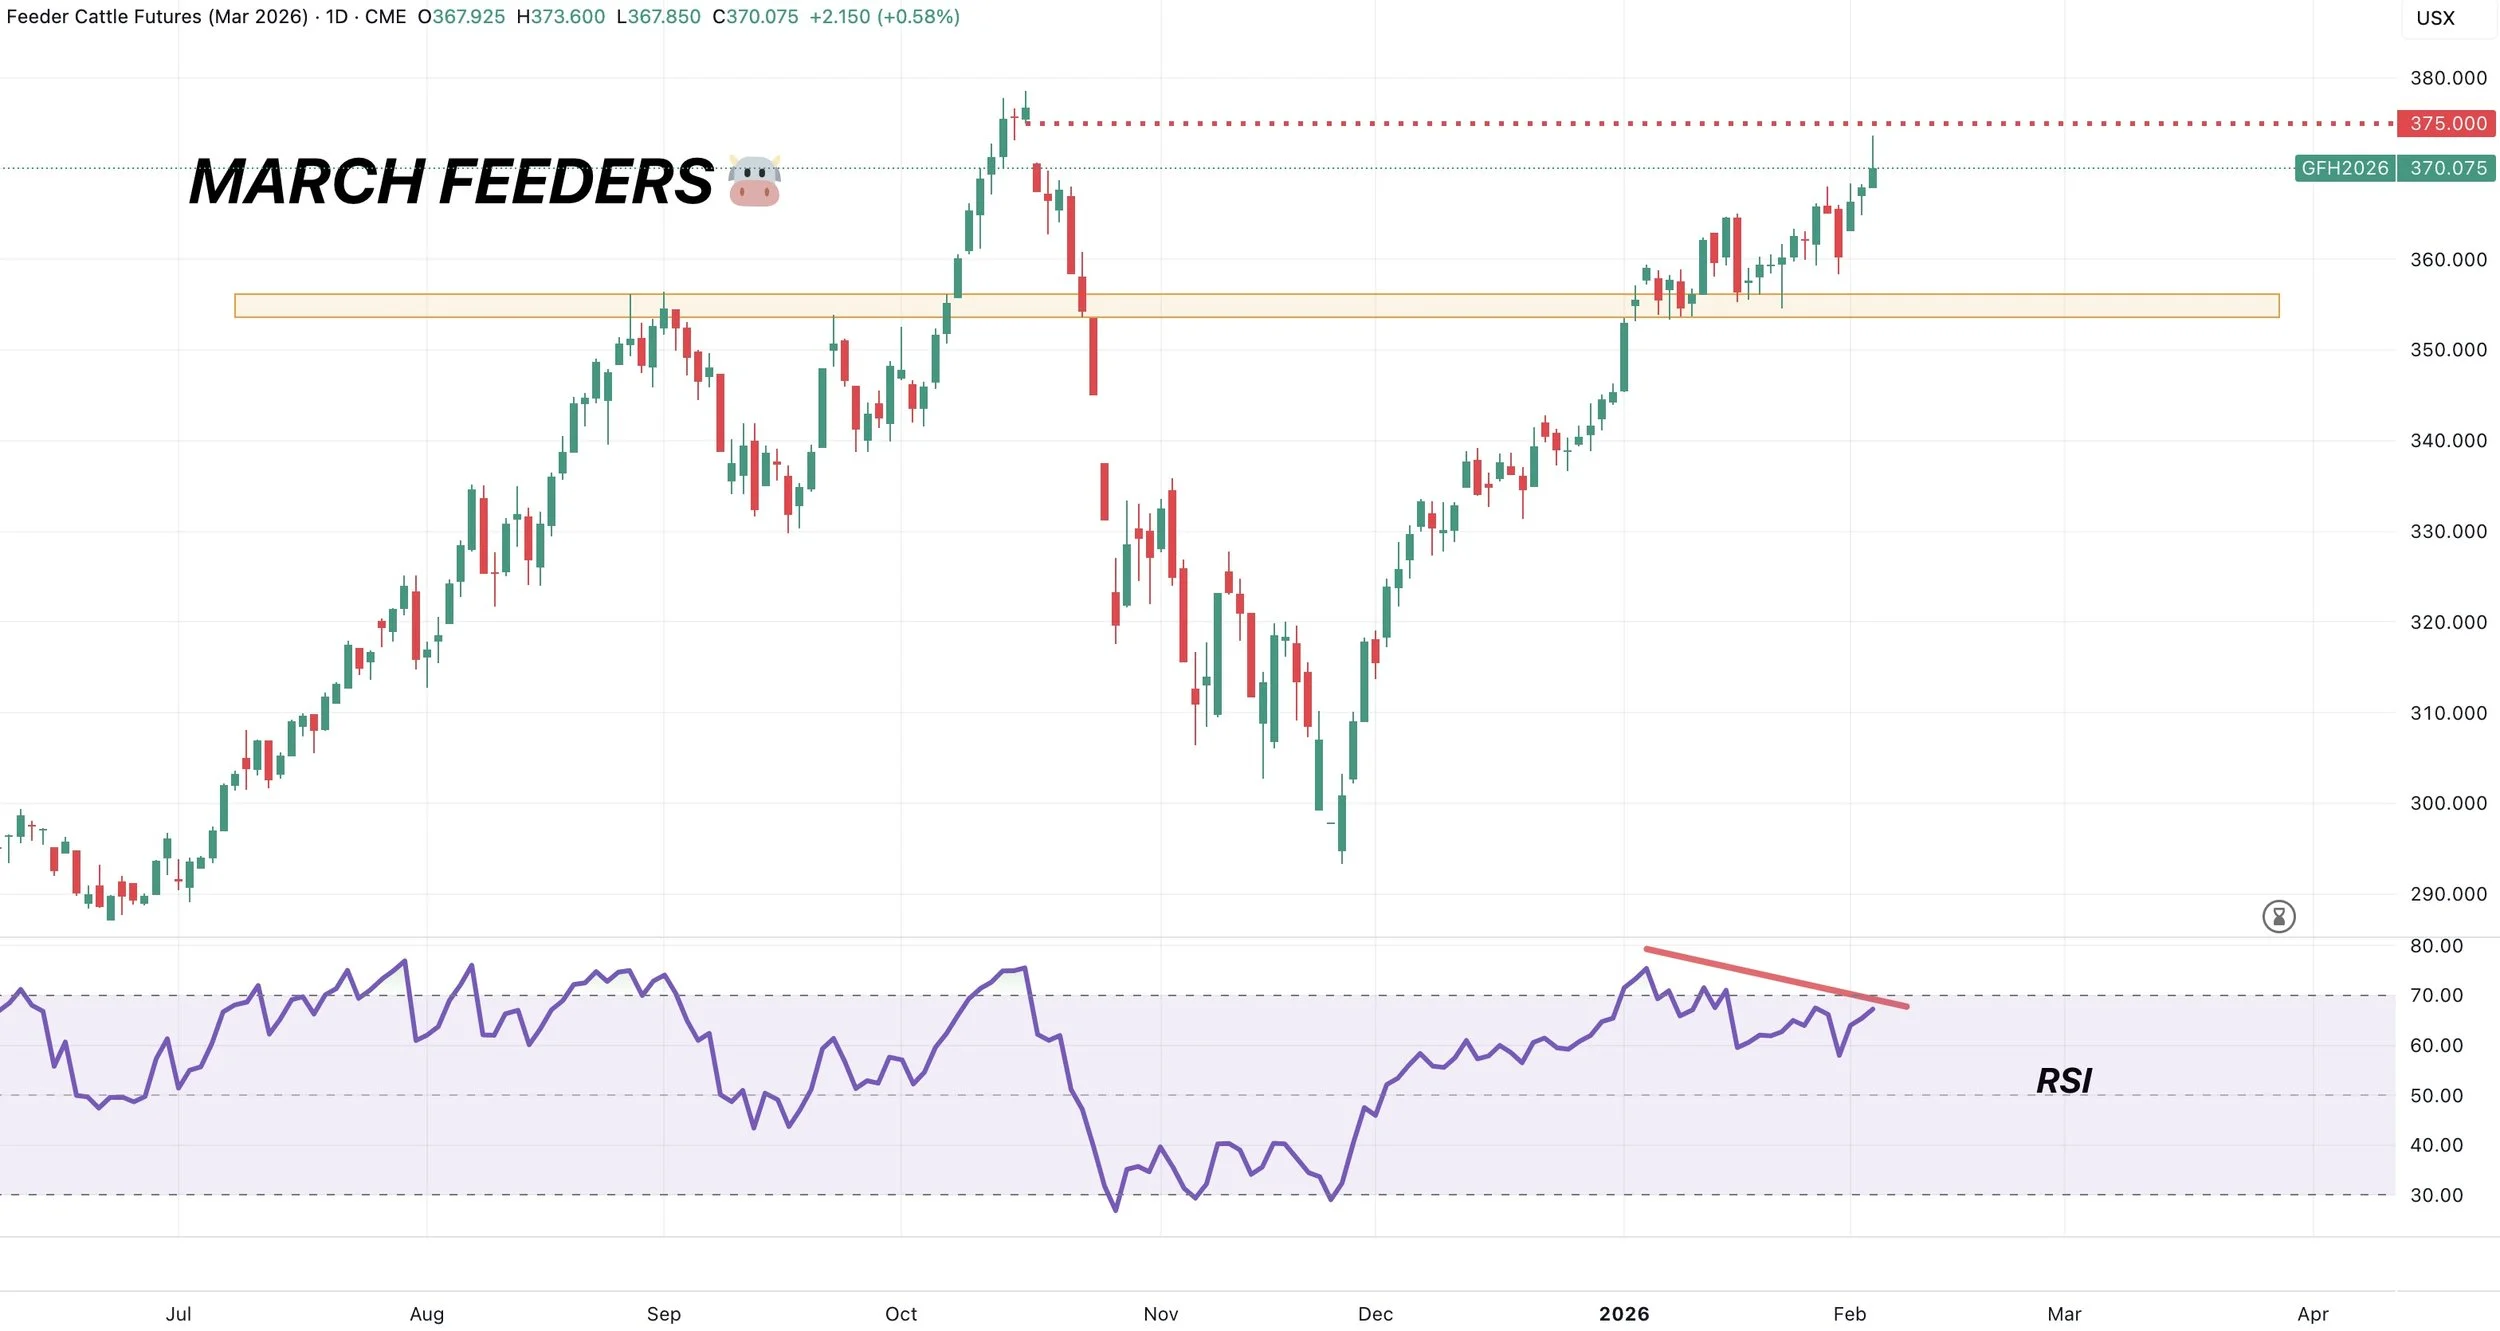
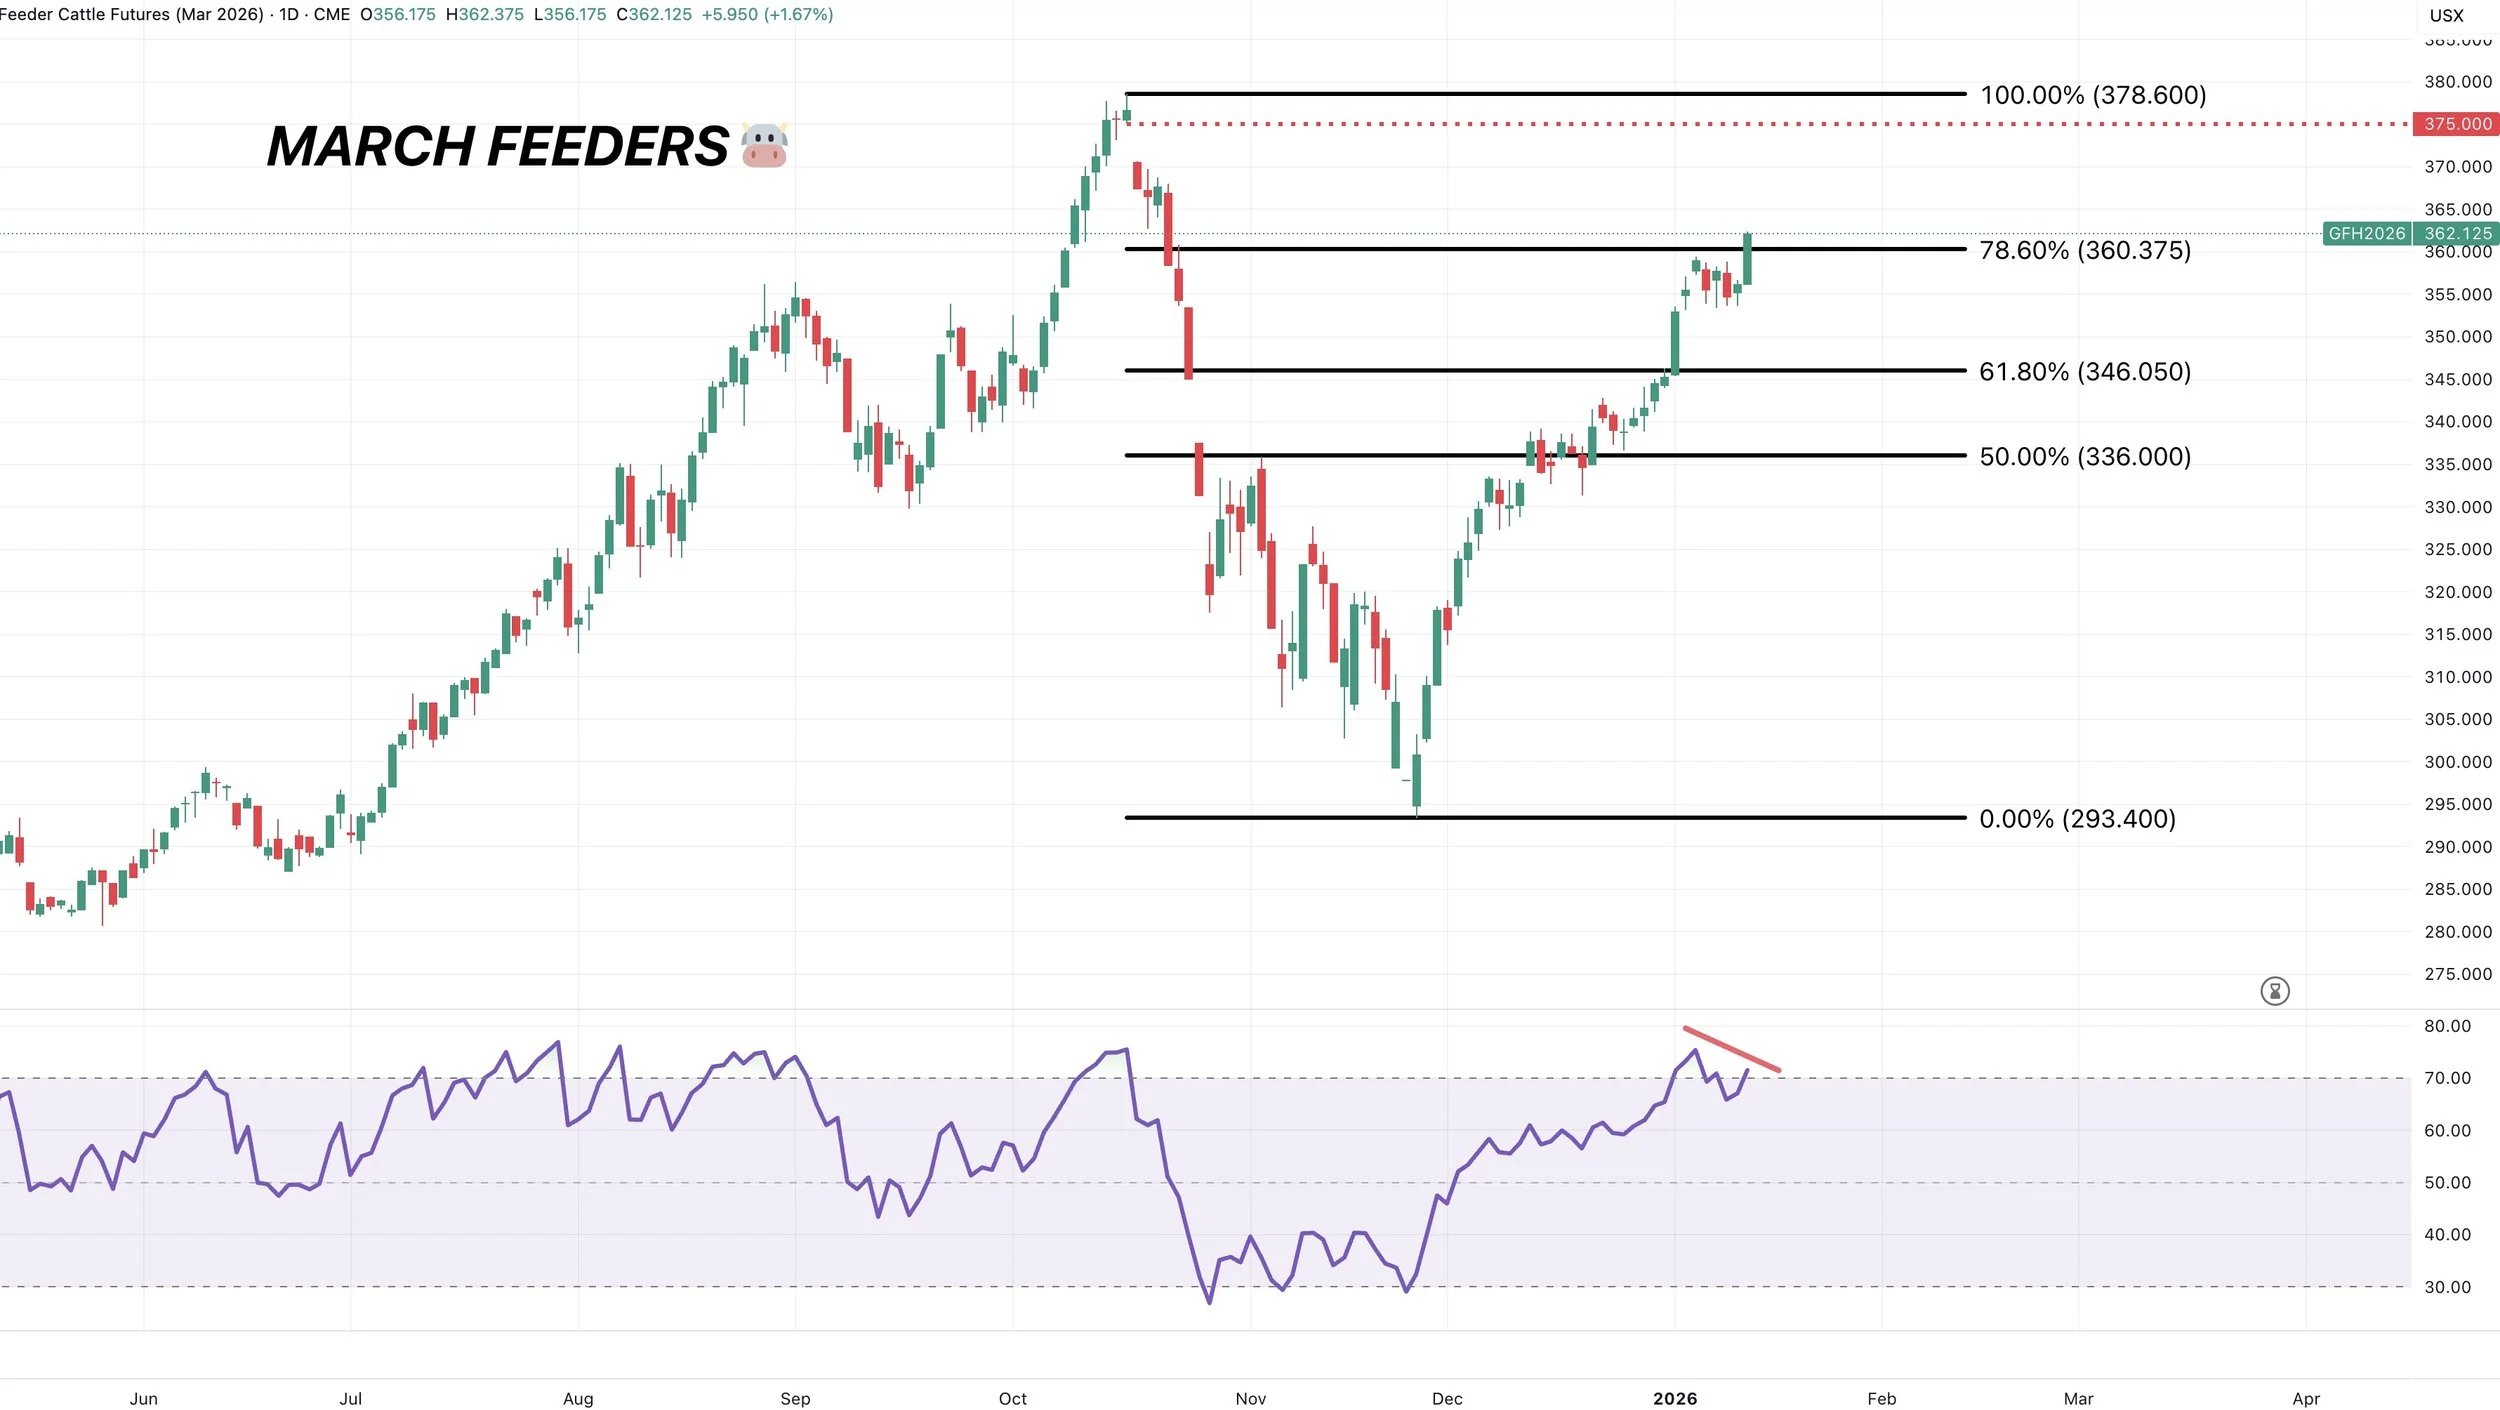
March Feeders
Nearly filled the gap.
Also still showing very clear bearish divergence on the RSI.
Which is typically a sign upside momentum is starting to get weaker.
Past Sell or Protection Signals
Feb 4th: 🌱
Soybean sell signal & hedge alert.
Dec 11th: 🐮
Cattle sell signal & hedge alert.
Dec 5th: 🐮
Cattle sell signal & hedge alert.
Nov 17th: 🌱
Soybean sell signal & hedge alert.
Nov 13th: 🌽 🌱
Managing risk in corn & beans ahead of USDA report.
Oct 28th: 🌽
Corn sell signal & hedge alert.
Oct 27th: 🌱
Soybean sell signal & hedge alert.
Oct 13th: 🐮
Cattle sell signal & hedge alert.
Aug 22nd: 🌱
Soybean sell signal & hedge alert.
July 31st: 🐮
Cattle sell signal & hedge alert.
July 10th: 🐮
Cattle sell signal & hedge alert.
CLICK HERE TO VIEW
June 5th: 🐮
Cattle sell signal & hedge alert.
June 2nd: 🌾
MPLS wheat sell signal.
April 10th: 🌽
Old crop corn sell signal.
March 19th: 🐮
Cattle hedge & sell signal.
Feb 18th: 🌽 🌾
Old crop KC wheat & old crop corn signal.
Jan 23rd: 🌽 🌱
Corn & beans old crop sell signal.
CLICK HERE TO VIEW
Jan 15th: 🌽 🌱
Corn & beans hedge alert/sell signal.
Jan 2nd: 🐮
Cattle hedge alert at new all-time highs & target.
Dec 11th: 🌽
Corn sell signal at $4.51 200-day MA
CLICK HERE TO VIEW
Oct 2nd: 🌾
Wheat sell signal at $6.12 target
Sep 30th: 🌽
Corn protection signal at $4.23-26
Sep 27th: 🌱
Soybean sell & protection signal at $10.65
Sep 13th: 🌾
Wheat sell signal at $5.98
May 22nd: 🌾
Wheat sell signal when wheat traded +$7.00
Want to Talk?
Our phones are open 24/7 for you guys if you ever need anything or want to discuss your operation.
Hedge Account
Interested in a hedge account? Use the link below to set up an account or shoot Jeremey a call at (605)295-3100.
NEXT MARKET MOVER FOR GRAINS?
AUDIO COMMENTARY
Trump cancels EU tariffs
Want to protect cattle
Risk of screwworm in U.S.
Biggest supply ever & best demand ever for the corn market
One weather scare away from story in corn
No fundamental story saying corn has to go a lot higher today
If you’re going to have to market corn soon
We won’t see any major data until planting intentions
China bought the amount of soybeans what agreed to buy. Are they done?
Soybean oil rally leading beans
Slight weather story in Argy?
There isn’t much fundamentally screaming that we have to go higher
Don’t supply the market until it pays you
Cold weather story in wheat?
Usually no material damage in winter kill
Often buy rumor sell fact on winter kill
Staying patient for now for most
Stories not as friendly as they could’ve been
Only selling new crop if you lock in profit
Listen to today’s audio below
Want to talk? (605)250-3863
Your free trial has ended.
Want to keep full access to our daily updates & signals?
CORN CHART
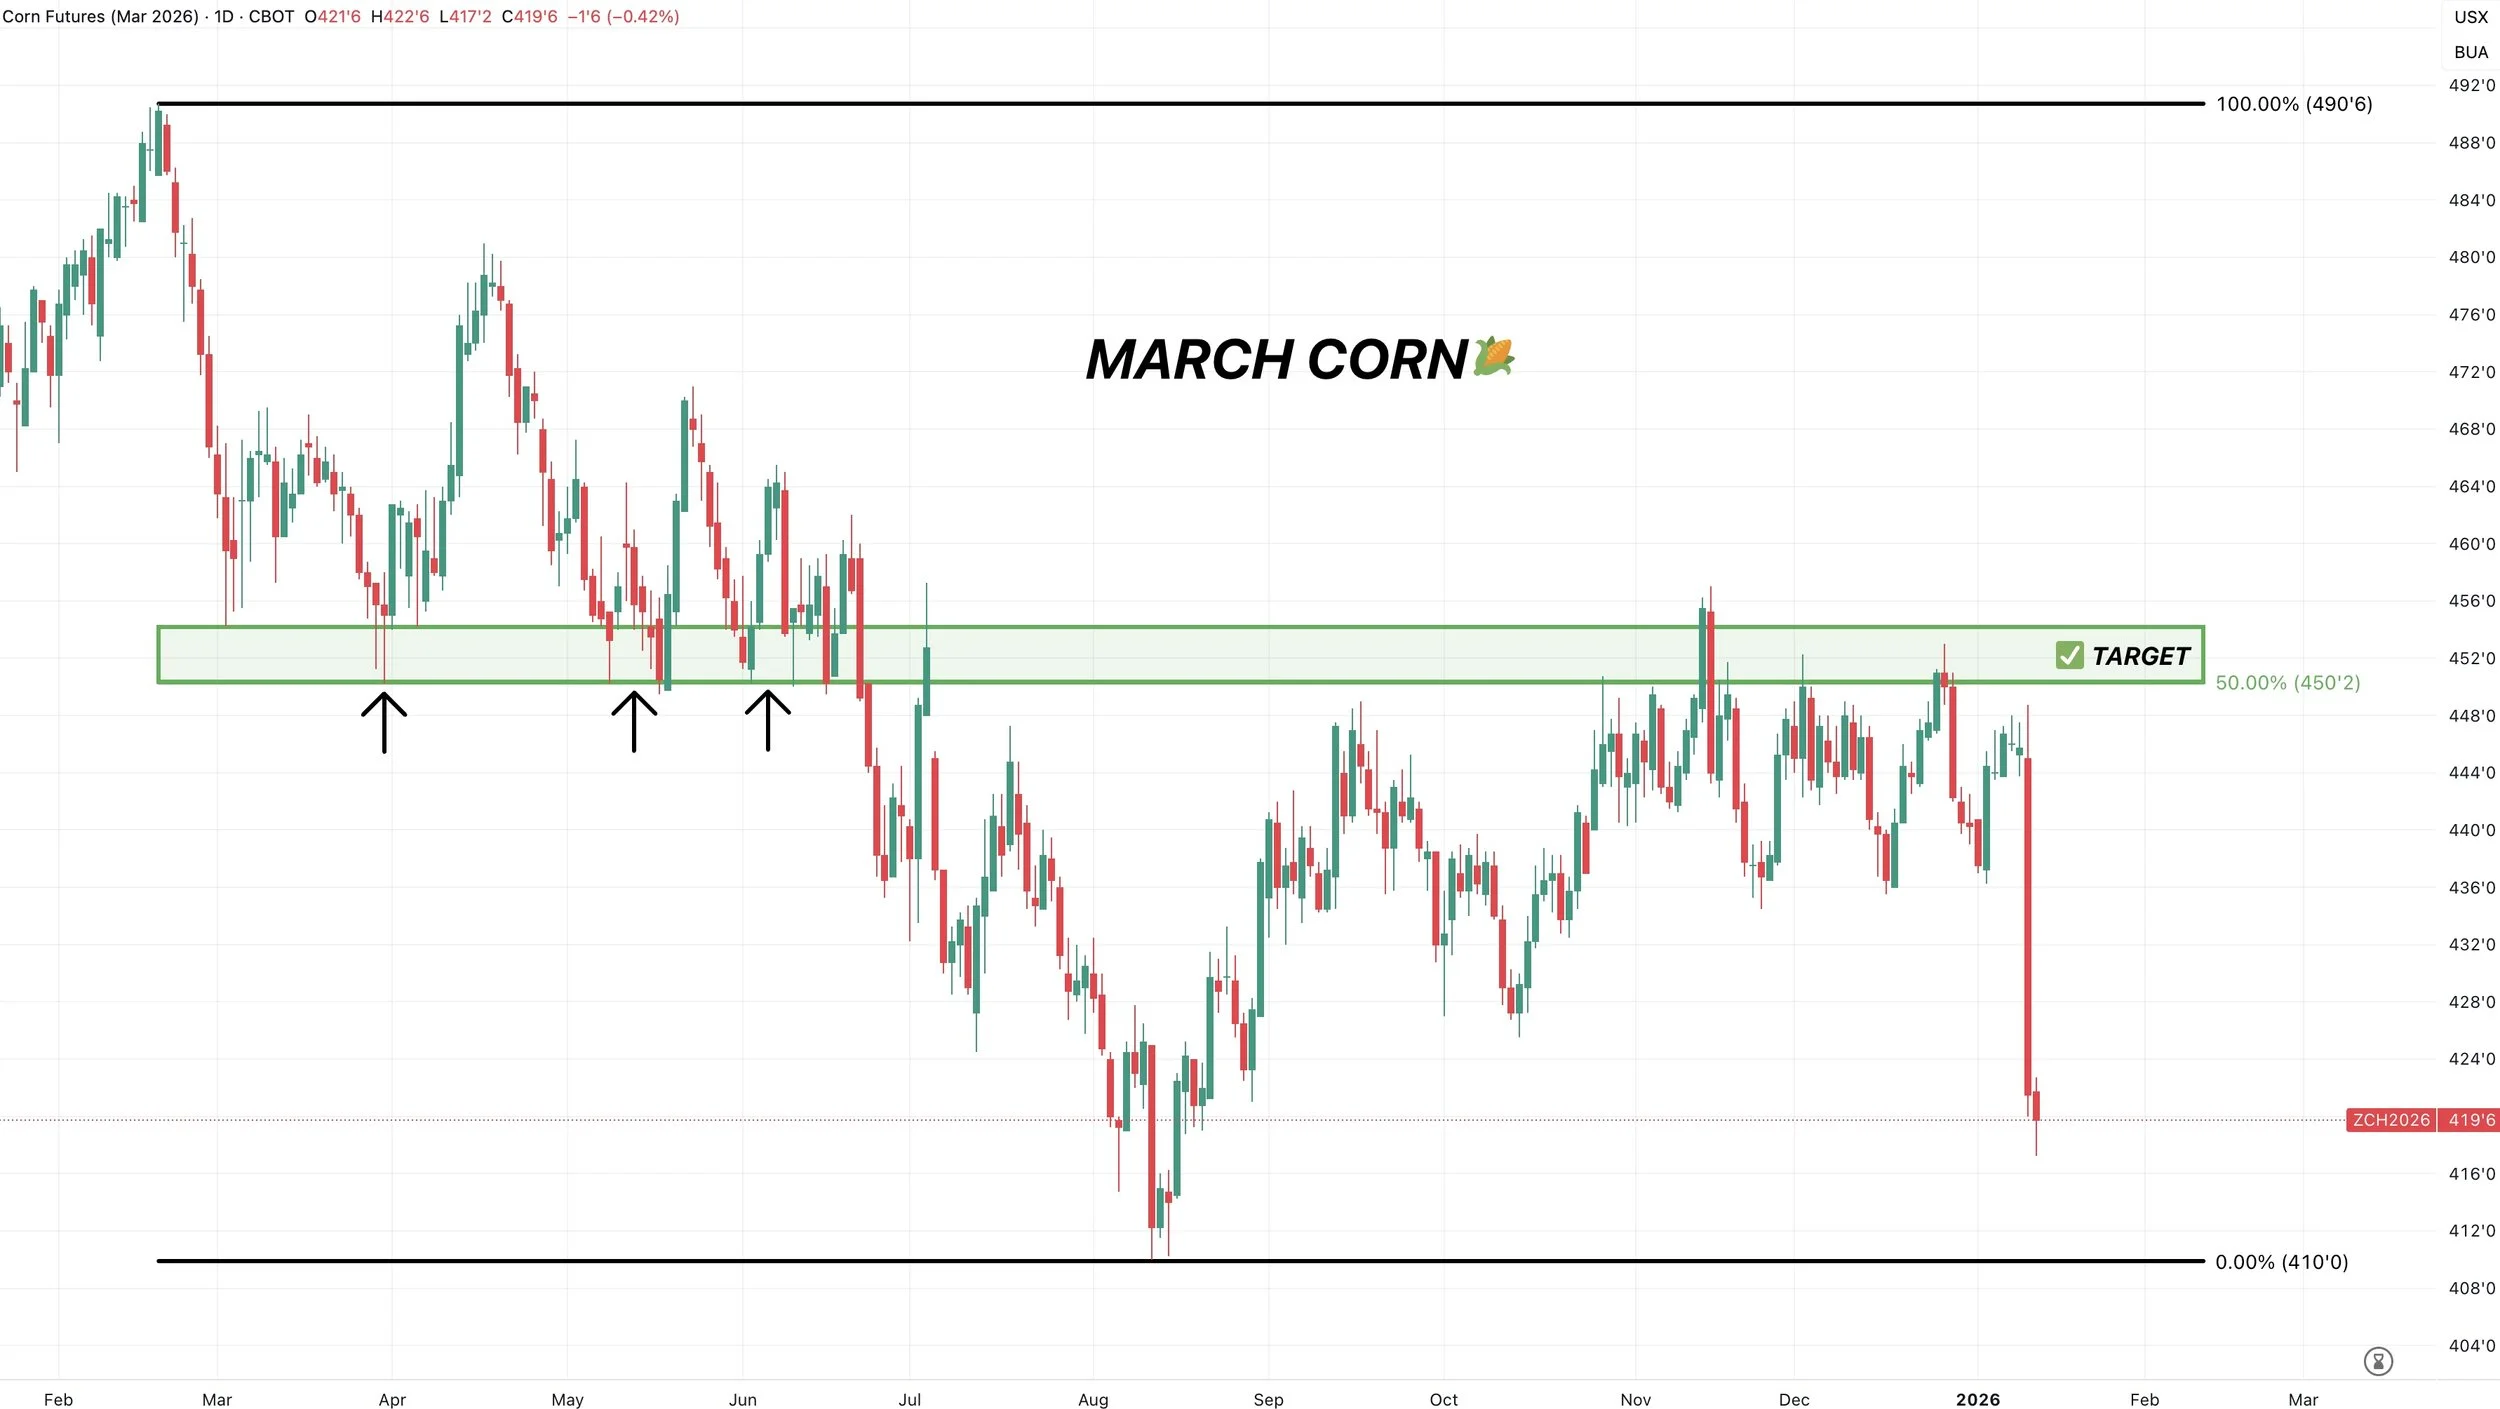
March Corn 🌽
Plan is still the same for corn.
Still looking to reward a move towards $4.33 to $4.36 if it comes.
It’s the golden zone retracement of the entire USDA sell off.
It’s also our old support from the last several months.
The rally ended after hitting the golden zone retracement up to the Feb highs. That same level was key support from spring. Hence why it was our first target to take risk off the table this fall.
We’ll go over the rest of the markets tomorrow.
Past Sell or Protection Signals
Dec 11th: 🐮
Cattle sell signal & hedge alert.
Dec 5th: 🐮
Cattle sell signal & hedge alert.
Nov 17th: 🌱
Soybean sell signal & hedge alert.
Nov 13th: 🌽 🌱
Managing risk in corn & beans ahead of USDA report.
Oct 28th: 🌽
Corn sell signal & hedge alert.
Oct 27th: 🌱
Soybean sell signal & hedge alert.
Oct 13th: 🐮
Cattle sell signal & hedge alert.
Aug 22nd: 🌱
Soybean sell signal & hedge alert.
July 31st: 🐮
Cattle sell signal & hedge alert.
July 10th: 🐮
Cattle sell signal & hedge alert.
CLICK HERE TO VIEW
June 5th: 🐮
Cattle sell signal & hedge alert.
June 2nd: 🌾
MPLS wheat sell signal.
April 10th: 🌽
Old crop corn sell signal.
March 19th: 🐮
Cattle hedge & sell signal.
Feb 18th: 🌽 🌾
Old crop KC wheat & old crop corn signal.
Jan 23rd: 🌽 🌱
Corn & beans old crop sell signal.
CLICK HERE TO VIEW
Jan 15th: 🌽 🌱
Corn & beans hedge alert/sell signal.
Jan 2nd: 🐮
Cattle hedge alert at new all-time highs & target.
Dec 11th: 🌽
Corn sell signal at $4.51 200-day MA
CLICK HERE TO VIEW
Oct 2nd: 🌾
Wheat sell signal at $6.12 target
Sep 30th: 🌽
Corn protection signal at $4.23-26
Sep 27th: 🌱
Soybean sell & protection signal at $10.65
Sep 13th: 🌾
Wheat sell signal at $5.98
May 22nd: 🌾
Wheat sell signal when wheat traded +$7.00
Want to Talk?
Our phones are open 24/7 for you guys if you ever need anything or want to discuss your operation.
Hedge Account
Interested in a hedge account? Use the link below to set up an account or shoot Jeremey a call at (605)295-3100.
DEEP DIVE INTO USDA: HOW BEARISH FOR CORN?
MARKET UPDATE
You can scroll to read the usual update as well. As the written version is the exact same as the video.
Timestamps for video:
Overview: 0:00min
Corn: 0:40min
Beans: 10:00min
Wheat: 13:10min
Cattle: 15:10min
Want to talk about your situation?
(605)250-3863
Futures Prices Close
Overview
Grains lower while cattle continues to run.
Yesterday's report was a memorbale one, and not in a good way.
It was bearish across the board. Production came in higher than estimates everywhere, and wheat plantings even came in higher than expected.
It caught almost everyone off guard.
It was the most bearish report in over a decade for the corn market.
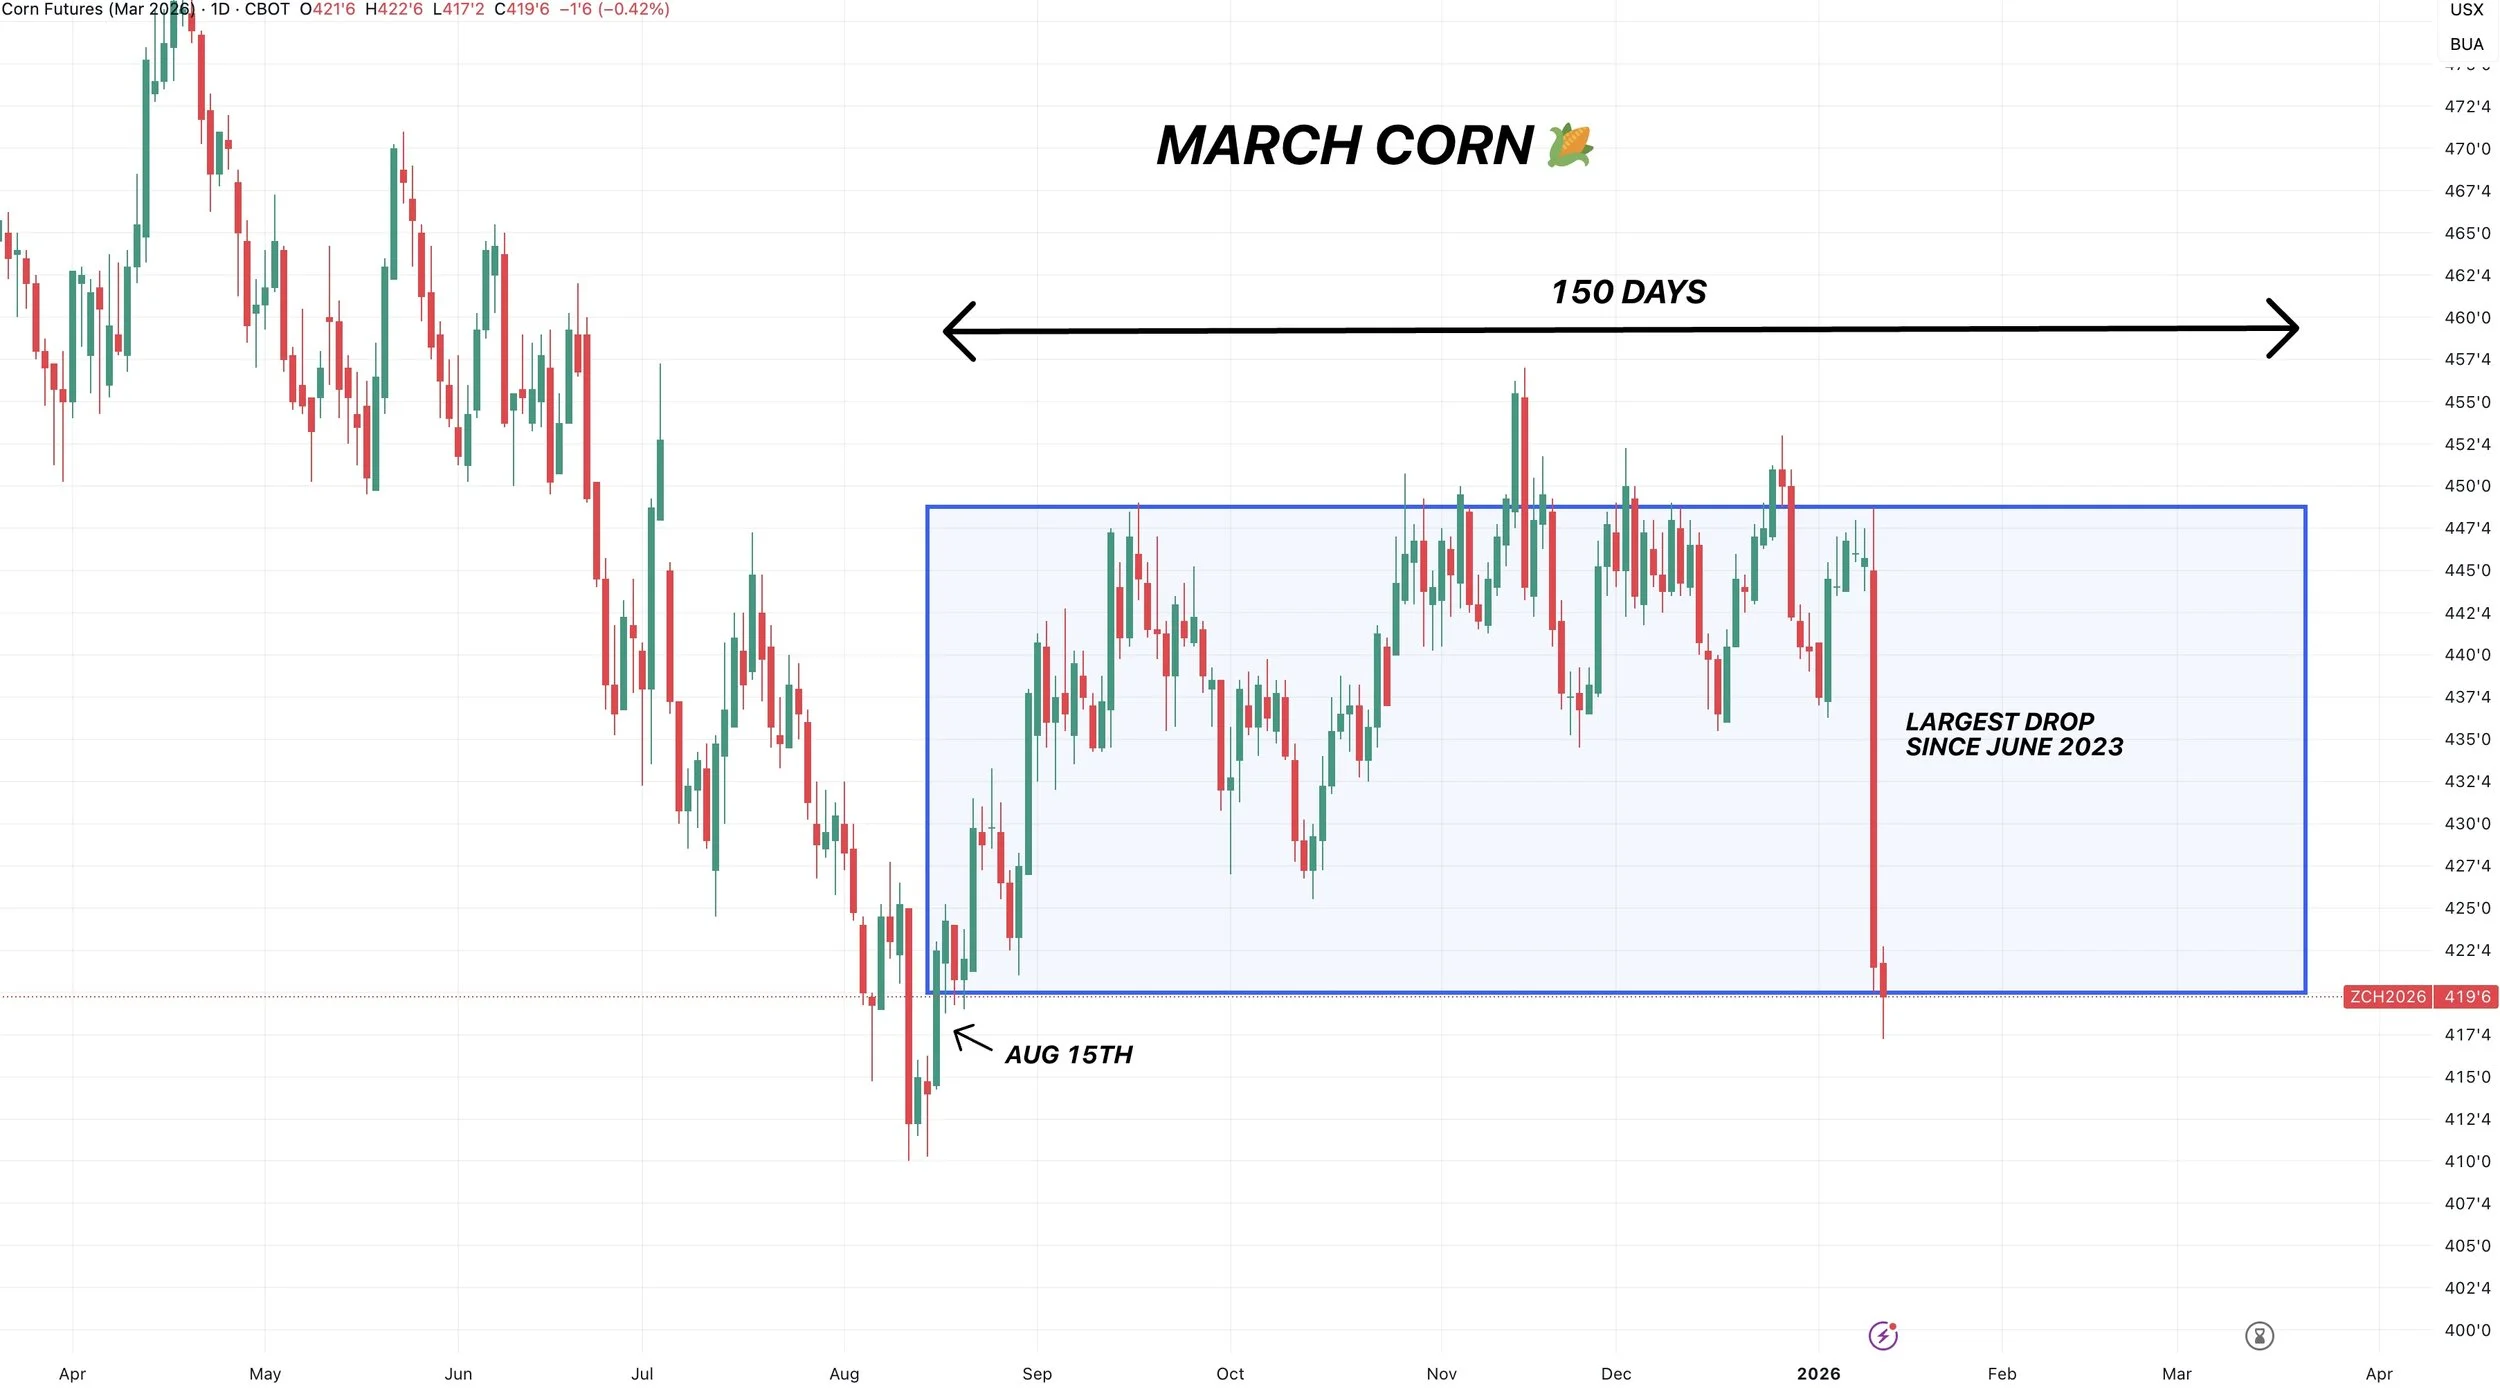
Yesterday corn saw it's largest daily loss since June 2023.
In one single candle, we wiped out the past 150 days of price action.
Let's jump right into the corn section and go through this report and what it means moving forward.
Today's Main Takeaways
Corn
Fundamentals:
Well, I didn’t have yesterday's USDA numbers on my bingo card.
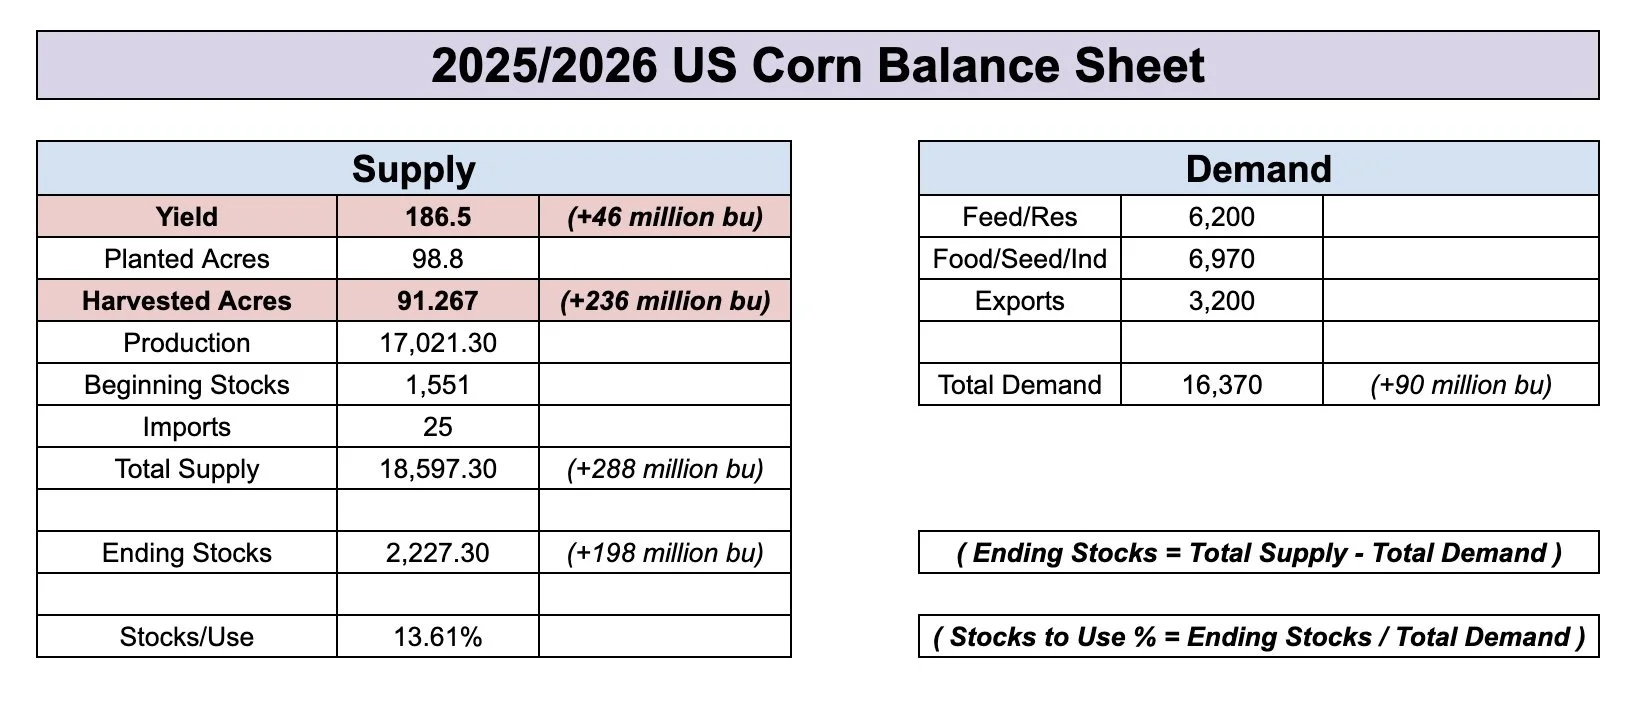
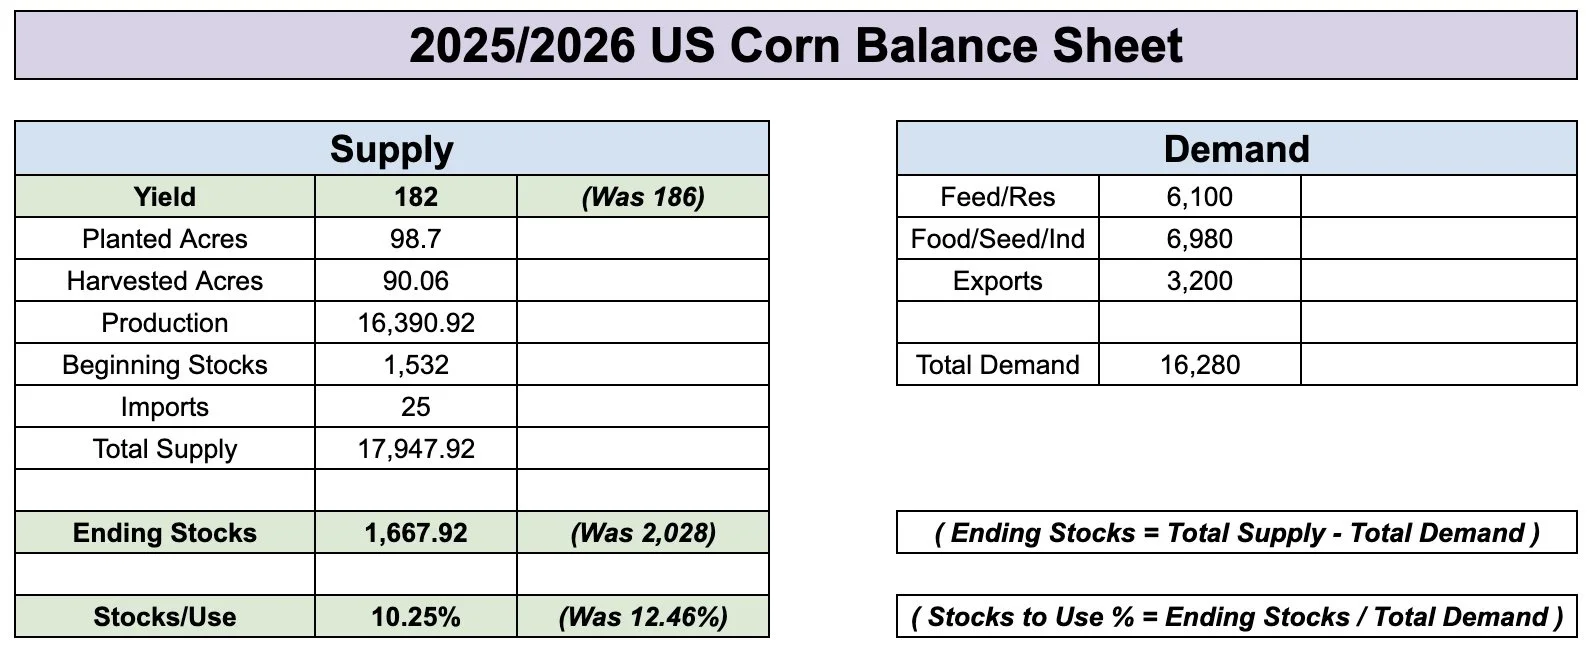
Here are the complete balance sheet changes.
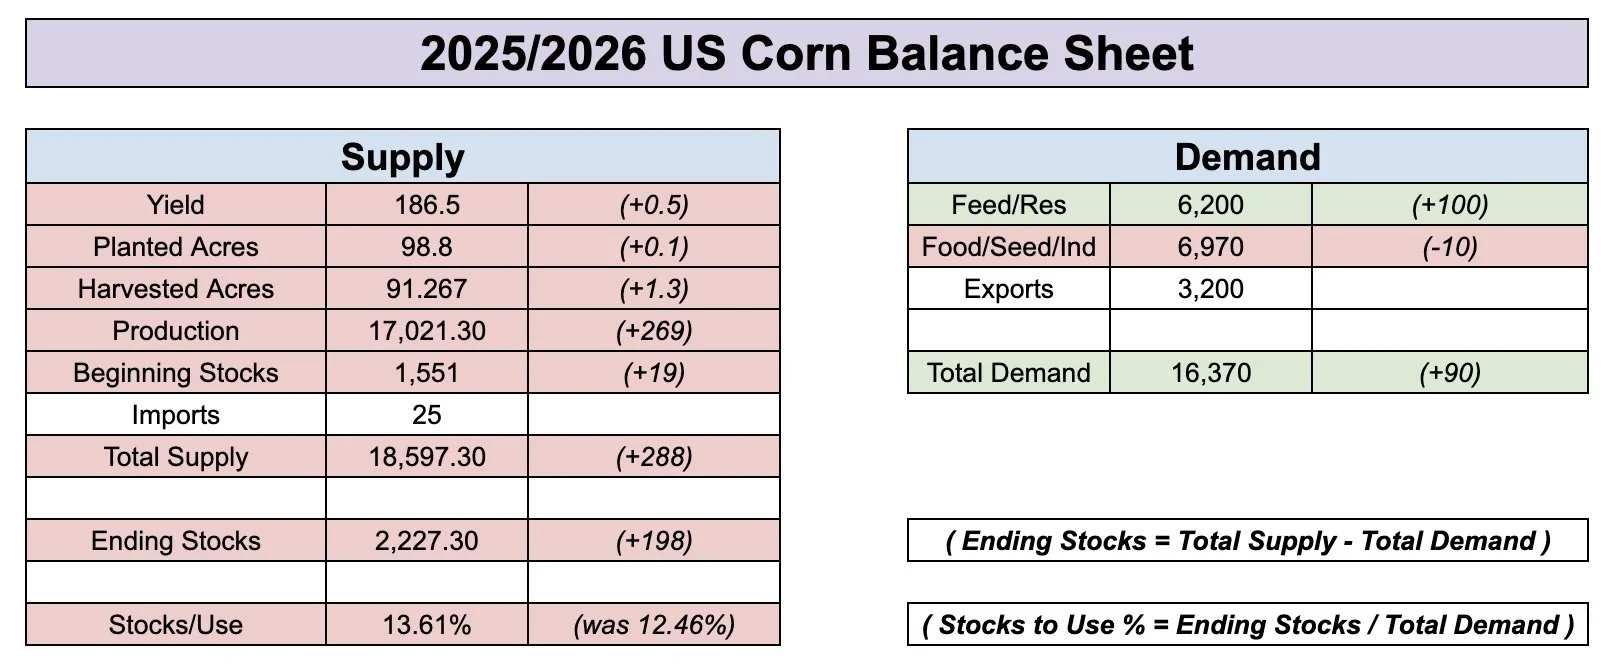
This report was about worst case possible for the corn market.
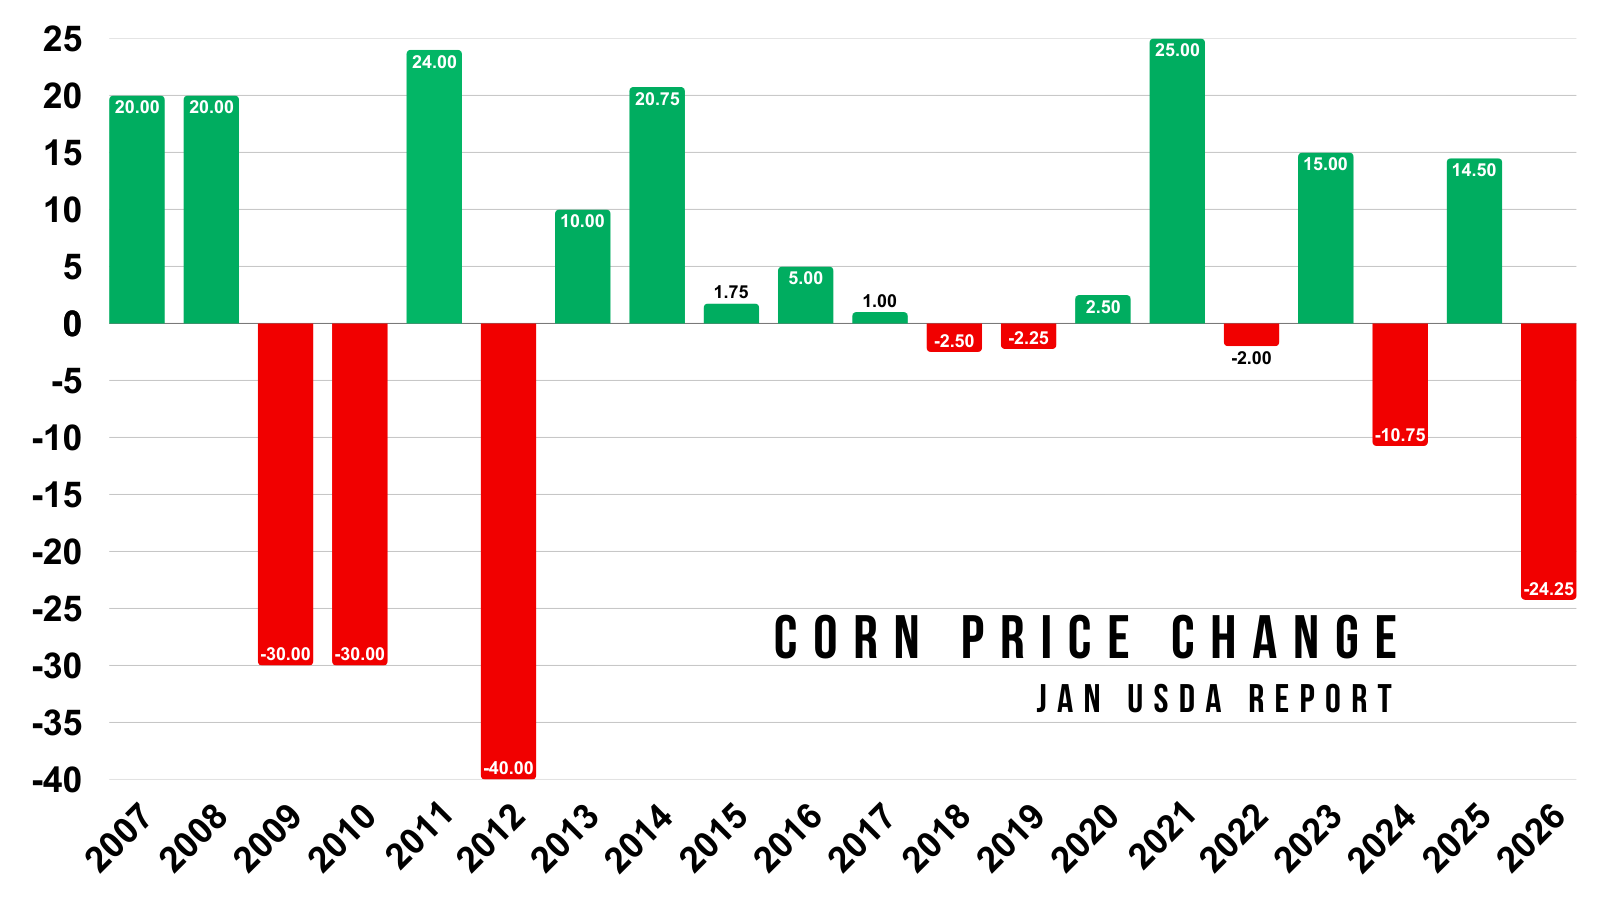
It was actually the most bearish report in 14 years.
Here is the past price changes.
It resulted in the biggest sell off for the day of this report since 2012.
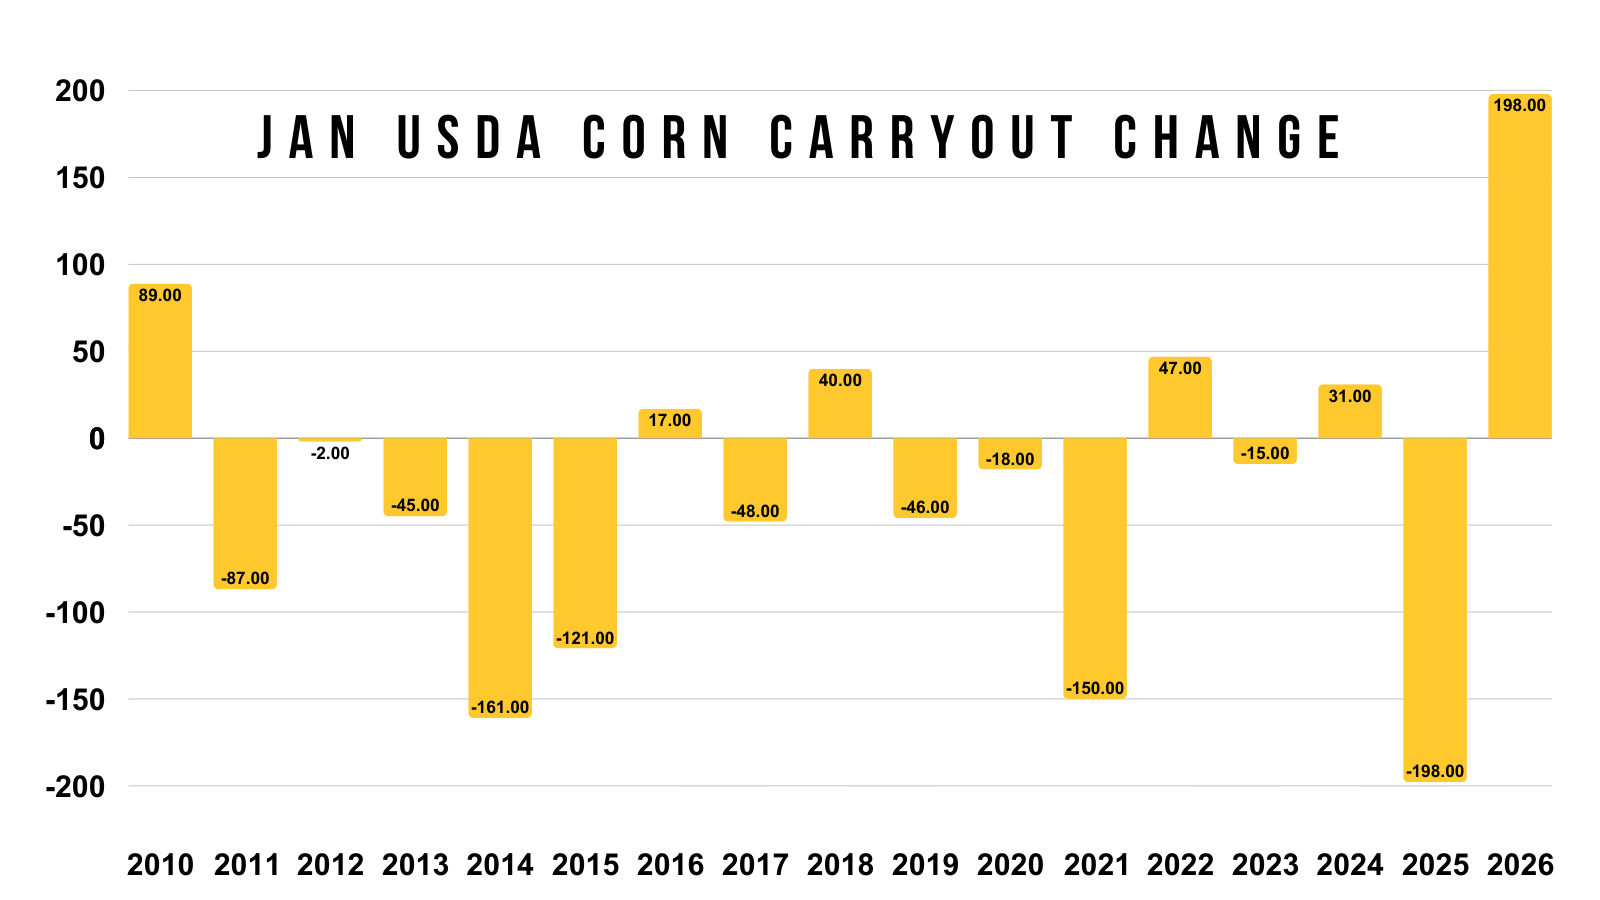
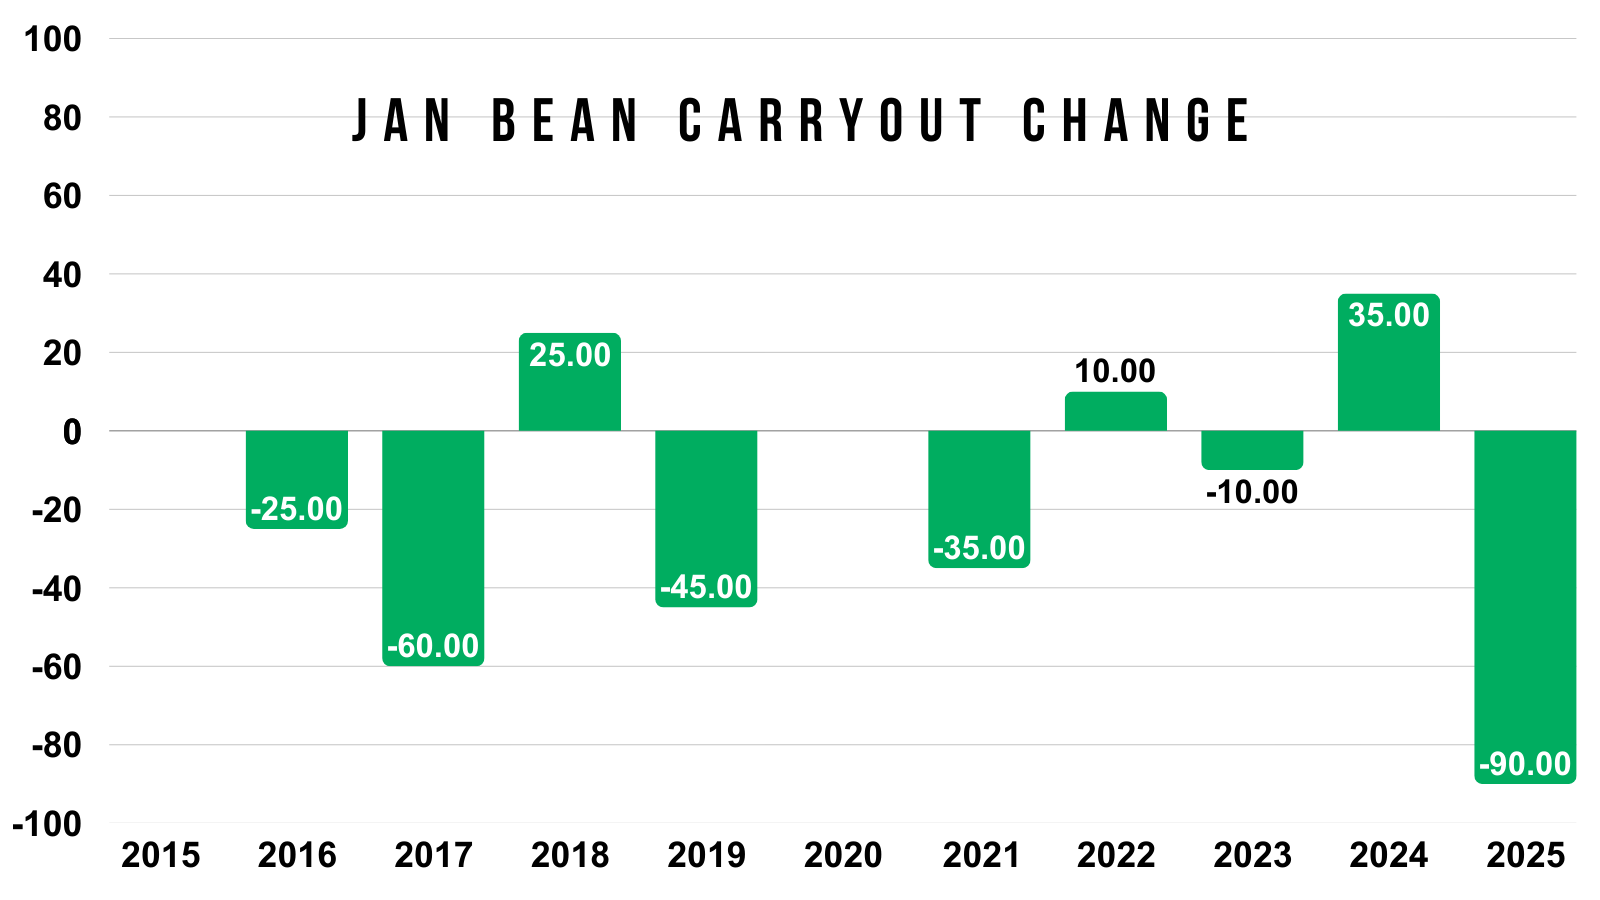
Here is the past carryout changes for this report.
Yesterday was the biggest increase to carryout we've seen in this report in over a decade.
They increased carryout by nearly +200 million bushels.
We've only seen one other year that resulted in over a +50 million bushel increase.
Clearly, this report is in a world of it's own the last decade.
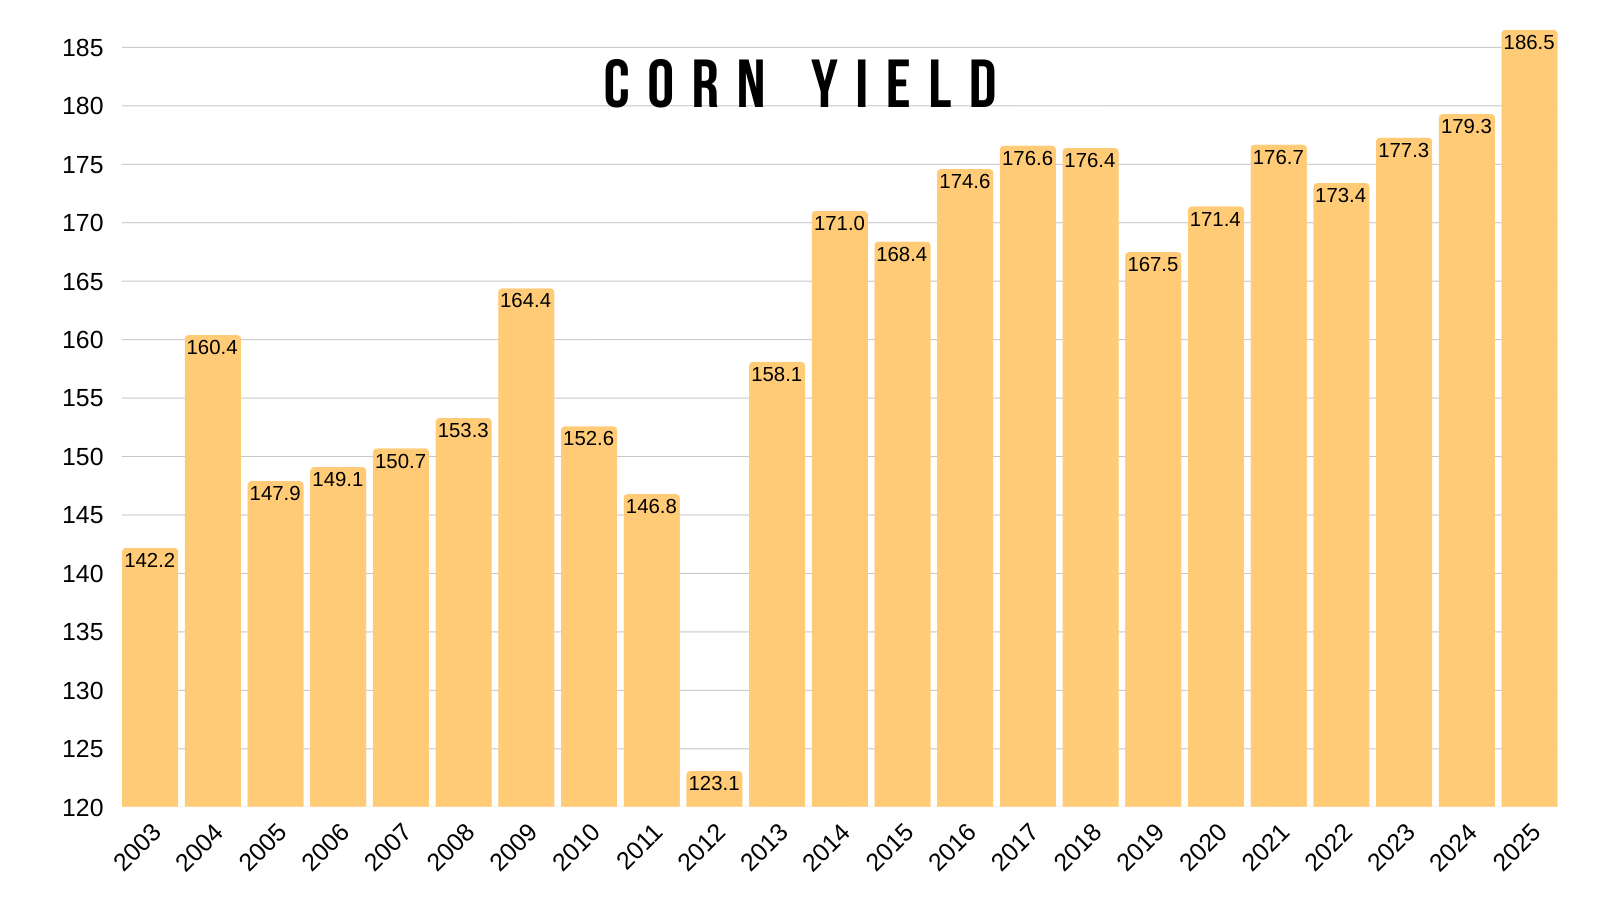
As you all know, the USDA chose to actually raise yield up to 186.5 bpa.
Almost everyone thought yield would be coming down, some thought it could be a rather drastic change.
Even Arlan of StoneX who had this 186 guess back during the summer, recently said he thought yield was 182 and wouldn’t be surprised if it was even lower.
So everyone was surprised.
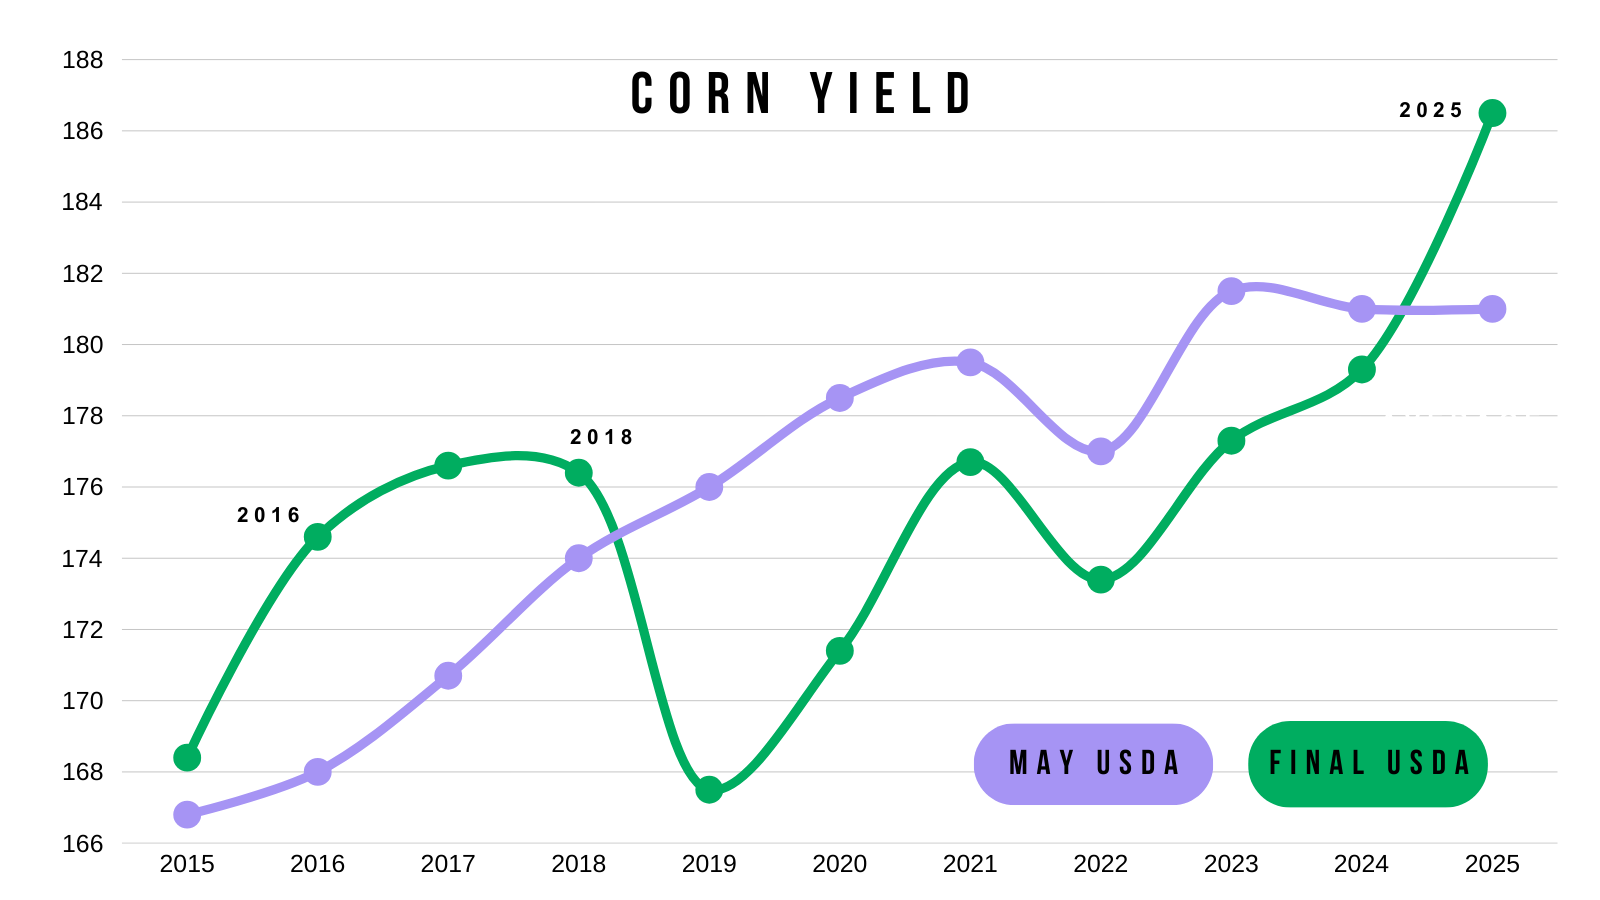
Here is a chart showing May vs final yield.
For the first time since 2018, our final yield came in higher than the orginal May estimate.
186.5 vs the orginal 181 (+5.5 bpa).
Not only did the USDA raise yield.. they also added acres.
Planted acres only rose 100k, but harvested acres jumped a large 1.3 million...
This was an even larger surprise than the yield.
And it's a more bearish factor than the yield.
Just to put it into perspective:
That 1.3 million acres added an EXTRA 236 million bushels of supply to the balance sheet.
The 0.5 bpa increase to yield only rose supply by 46 million bushels.
Not only did yield increase, but they found more acres which provided an even bigger blow.
The numbers the USDA gives us are the numbers we have to deal with.
Yes it sucks. But none of us can do anything about it whether we agree with their methodology or not.
Regardless, it is getting harder and harder to defend them when they've been incredibly inconsistent with their data the last year or two.
It's no secret that the USDA is understaffed, so you have to wonder if that is starting to show in their work.
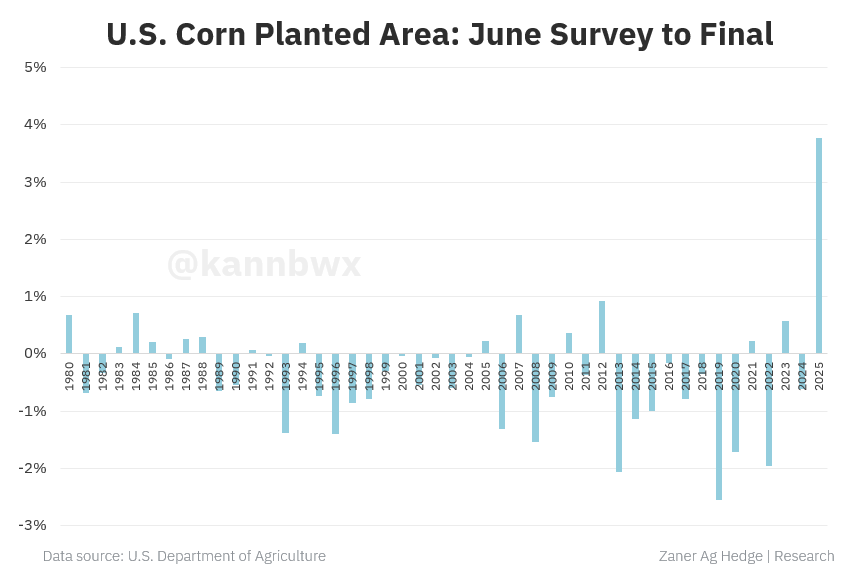
Here is a fantastic chart from Karen Braun of Zaner Hedge.
This shows corn planted area from June to final.
A completely unprecedented miss.
This has still yet to be explained.
Since the USDA added so much supply, they naturally had to balance the balance sheet to prevent our carryout from getting too large.
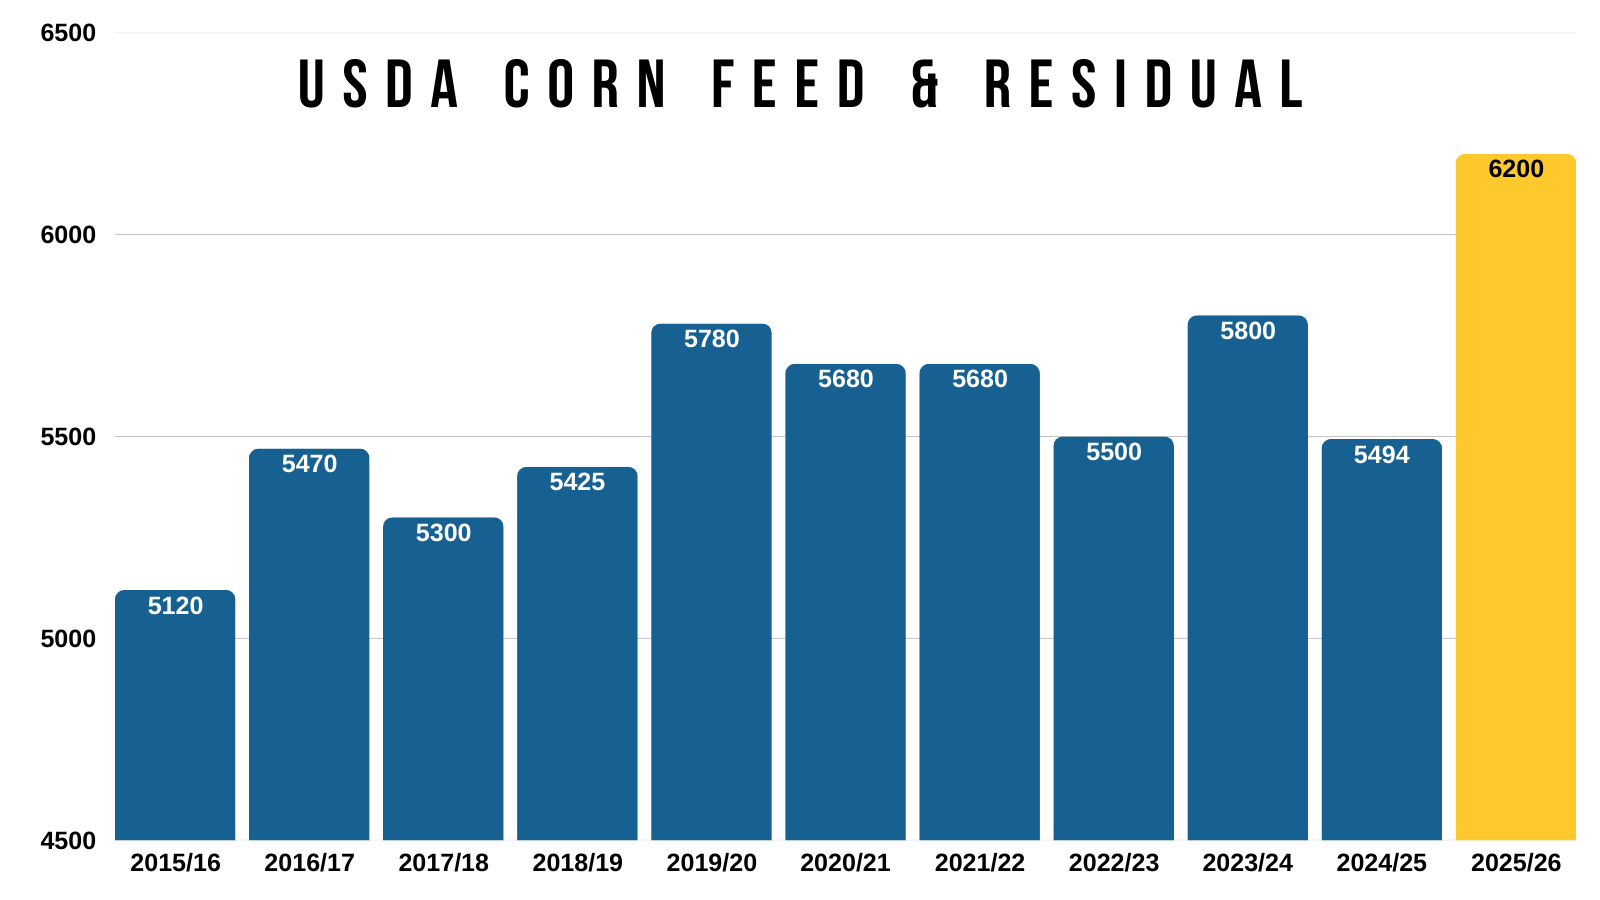
What they did was raise feed and residual by another +100 million bushels.
While leaving our export demand completely unchanged.
Almost everyone would agree this just makes no sense.
Most agree feed usage is too high to begin with.
What argument would justify feed demand being +700 million higher than last year when we have fewer animals on feed?
We have never seen this type of increase before.
The USDA is using this as a toy number so they can hide other data in there. Next year we are going to be wondering why they dropped the feed usage number.
Now on the other hand, they chose to leave exports unchanged..
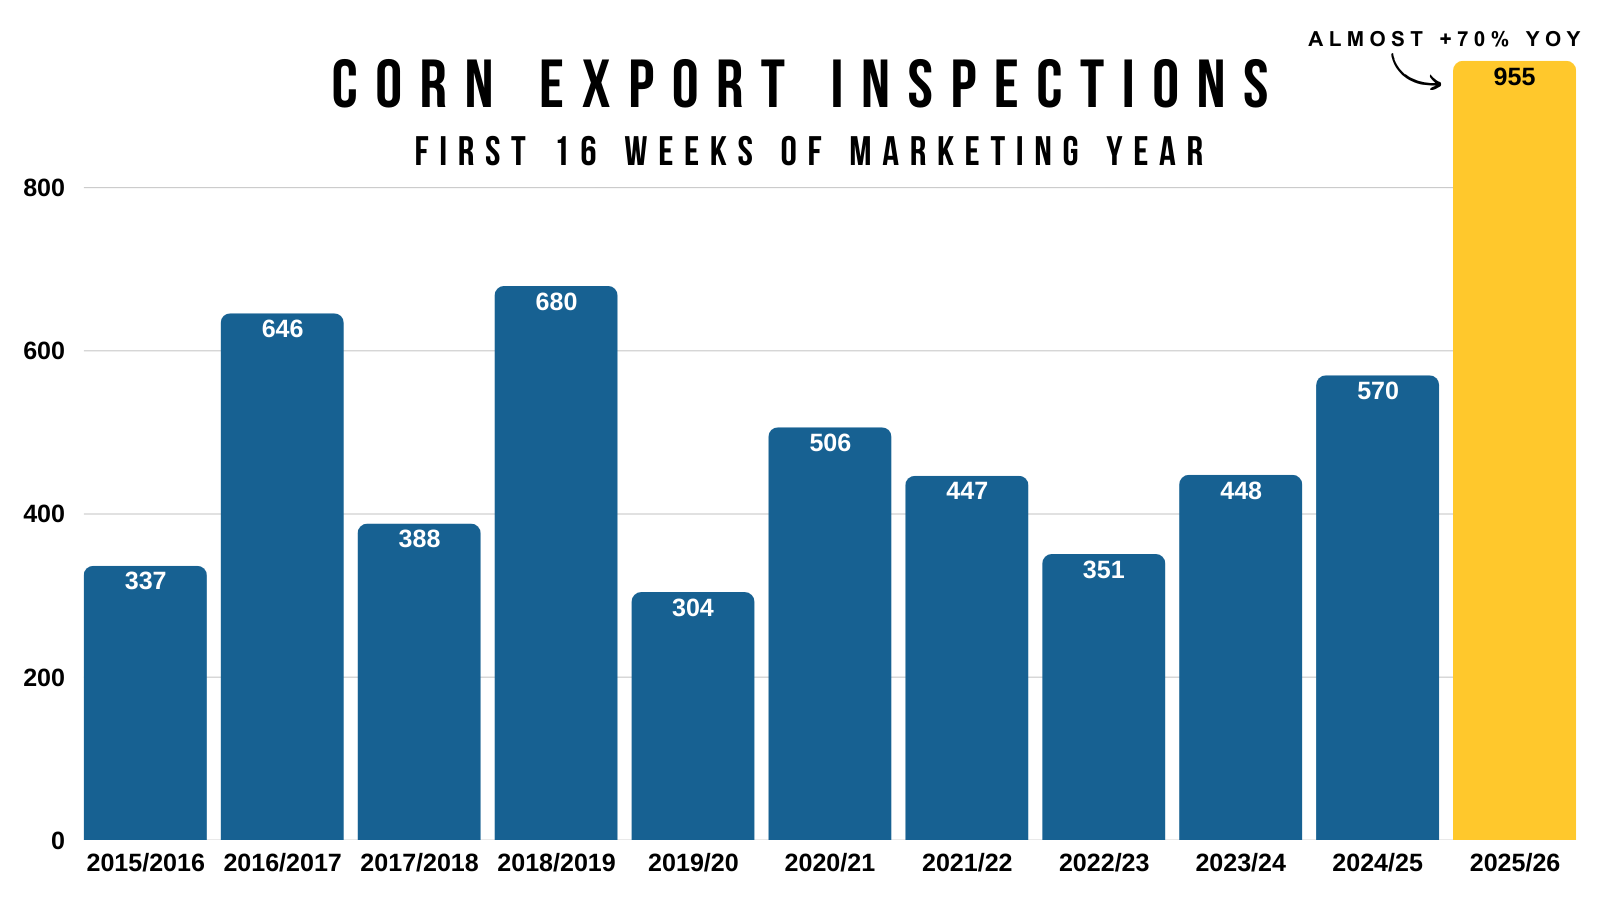
Meanwhile export inspections are up +61% vs last year.
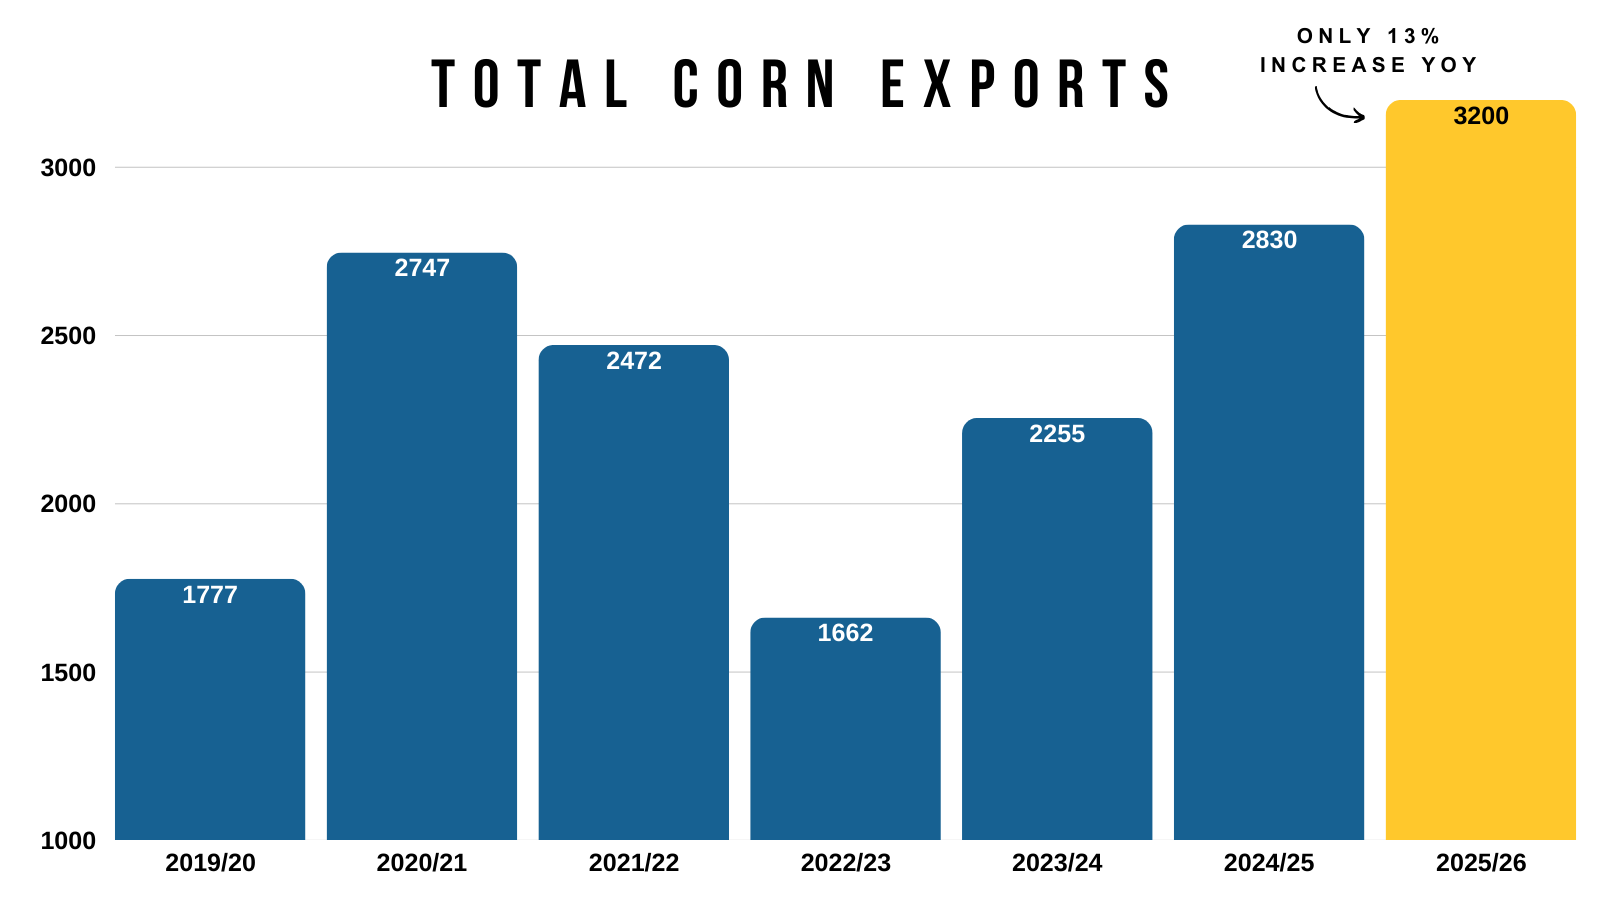
Yet the USDA projections exports only up +13% vs last year.
We are currently on pace to beat the USDA's estimate by over 300 million bushels.
So a bump in exports would’ve made sense. Rather than a bump in feed.
I'm sure exports will eventually be raised higher.
The numbers yesterday don’t make sense, but they are the numbers we got.

This report does change things it a big way.
For a long time I’ve been talking about how corn had limited upside, and it would be an uphill battle to see $5.00 this year.
Given that we had record production no matter how you sliced the pie.
That battle just a whole lot harder, some would say almost impossible without some sort of outside influence such as a weather scare.
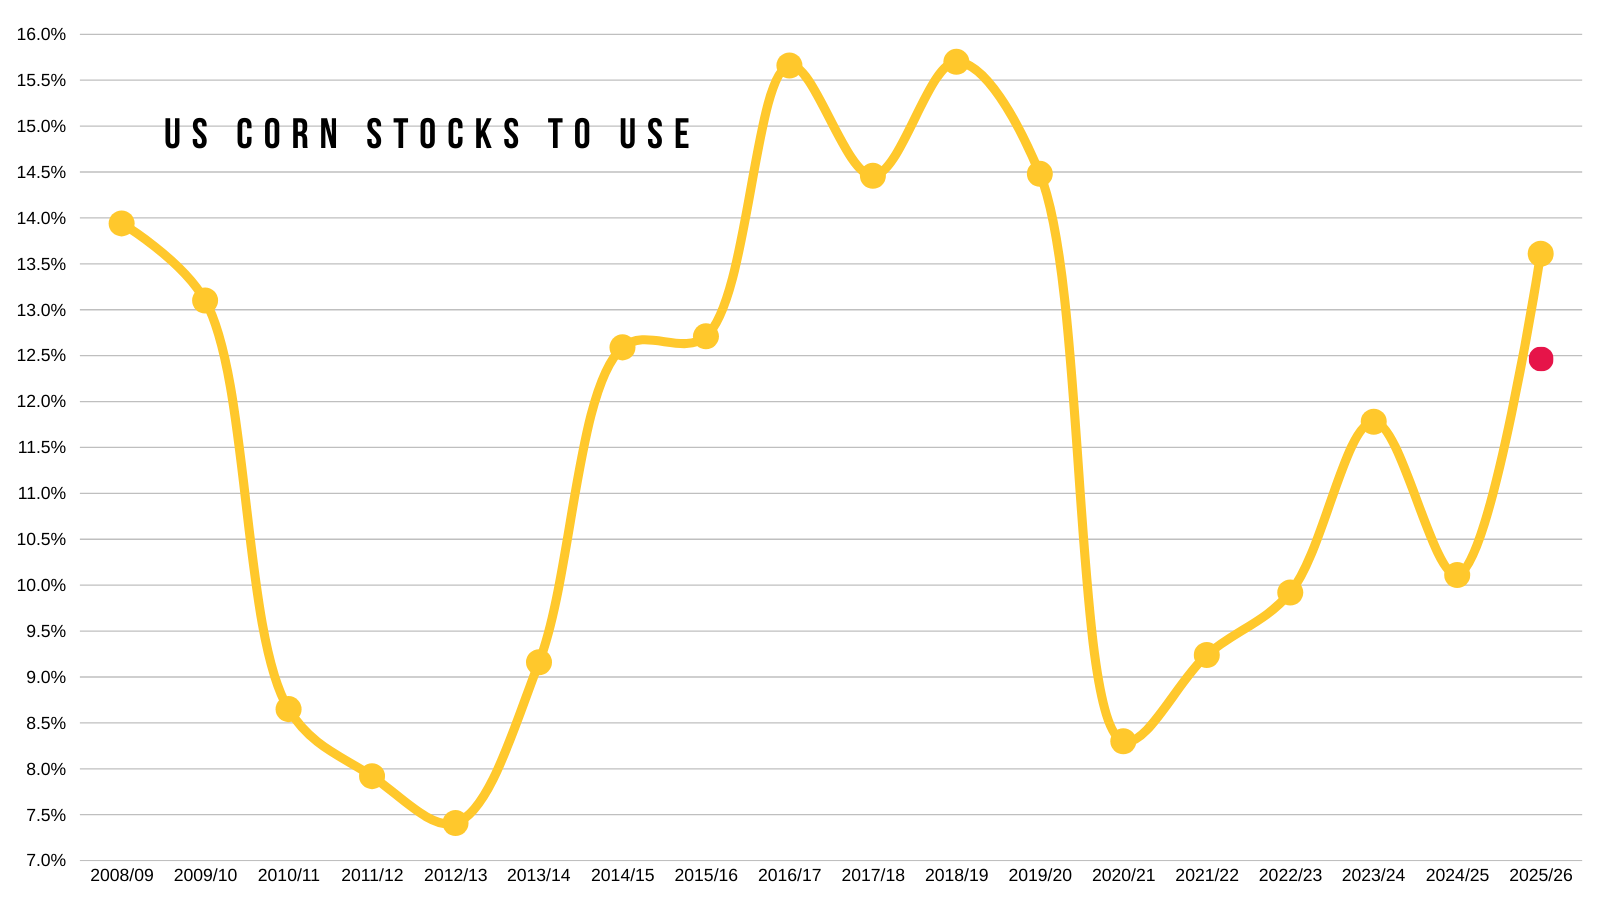
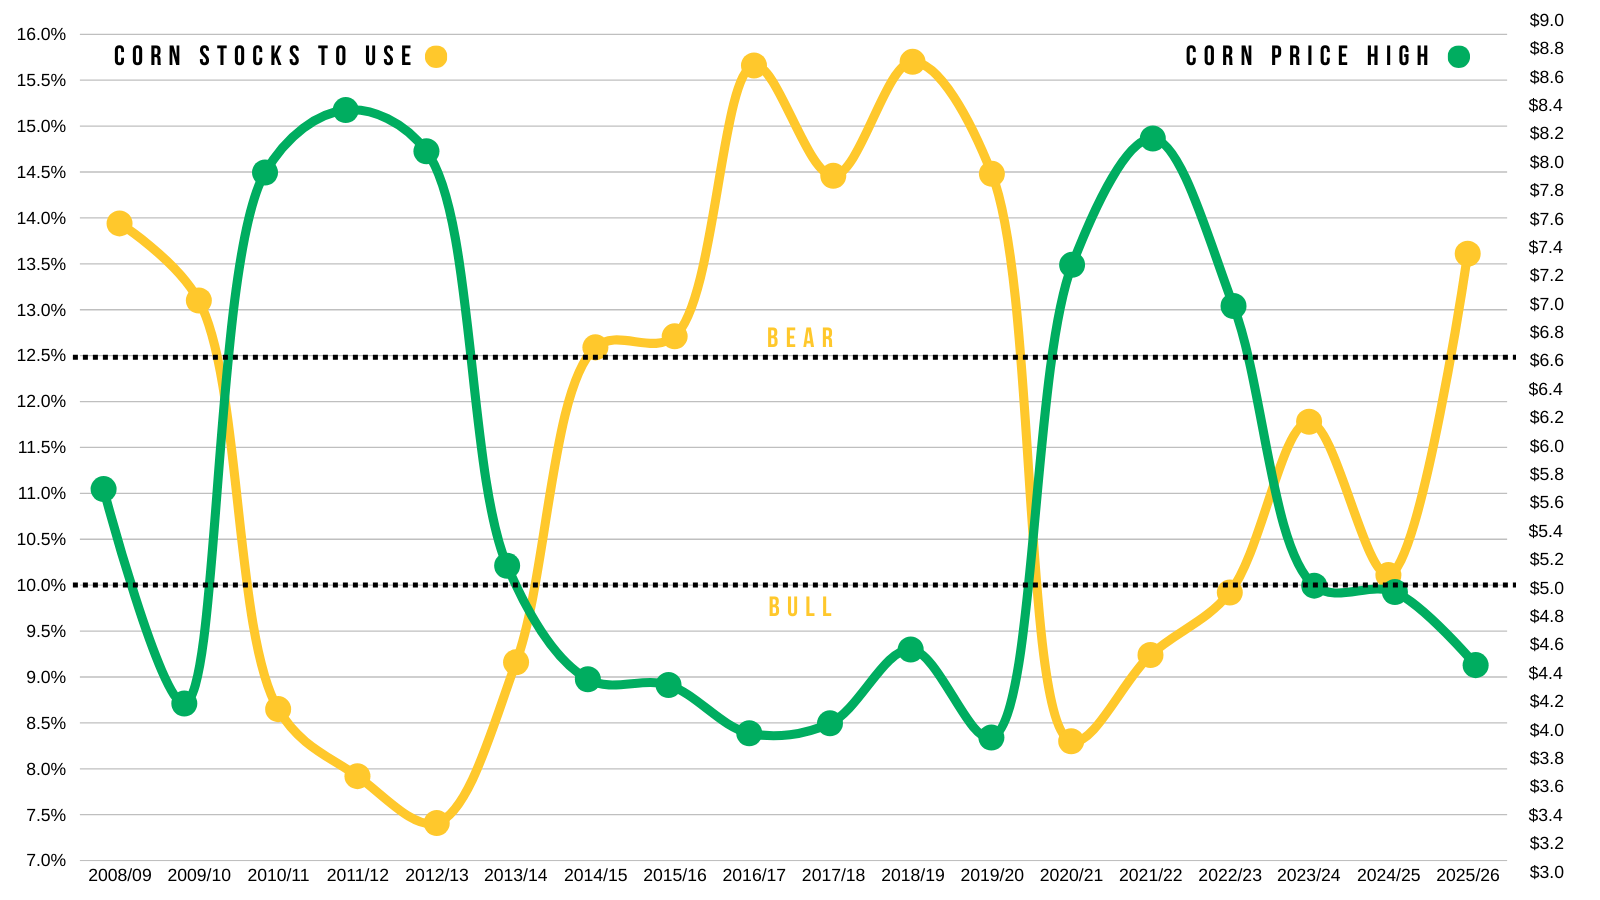
First for the stocks to use ratio.
It jumped from 12.46% to 13.61%.
That is a bearish number. The most bearish since 2019/20.
(Red dot is previous estimate)
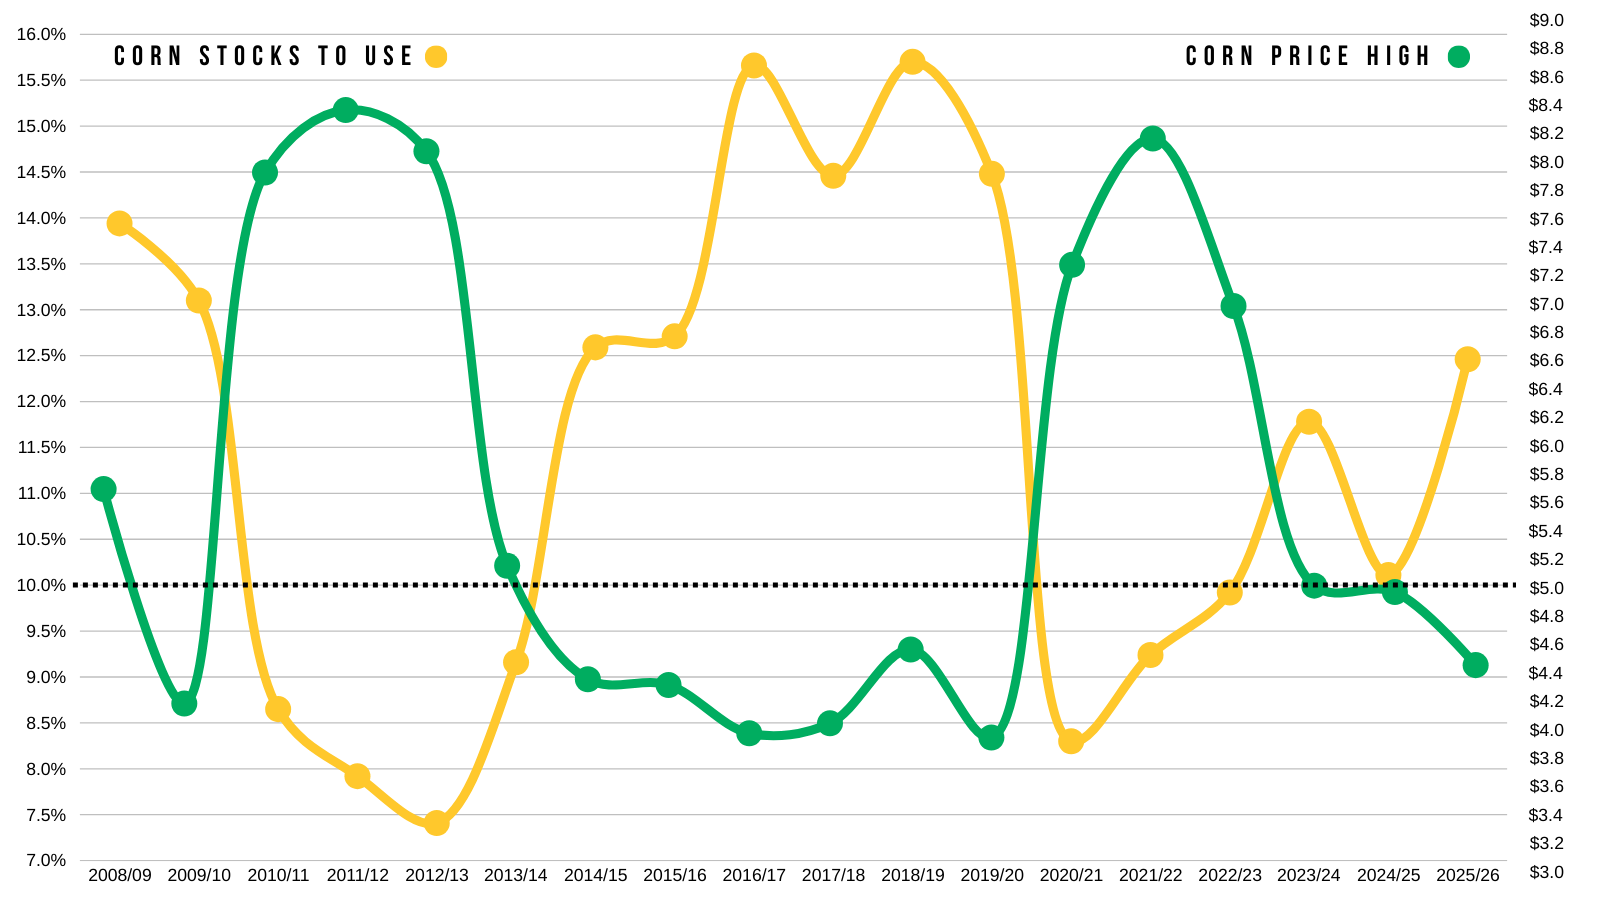
Here is a good way to visualize the stocks to use and it's impact on prices.
This chart shows our stocks to use in yellow.
Along with corn's highest price for the year in green.
I drew two lines on this chart.
One at 10% and one at 12.5%.
To get prices beyond $5.00, it almost always takes a stocks to use 10% or lower.
If you focus on that bottom line, anytime the stocks dips below 10% (yellow), the prices jump above $5.00 (green).
Now let's focus on the top line.
Anytime our stocks to use (yellow) is above 12.5%, our prices (green) tend to top out under $5.00 and result in a bear market.
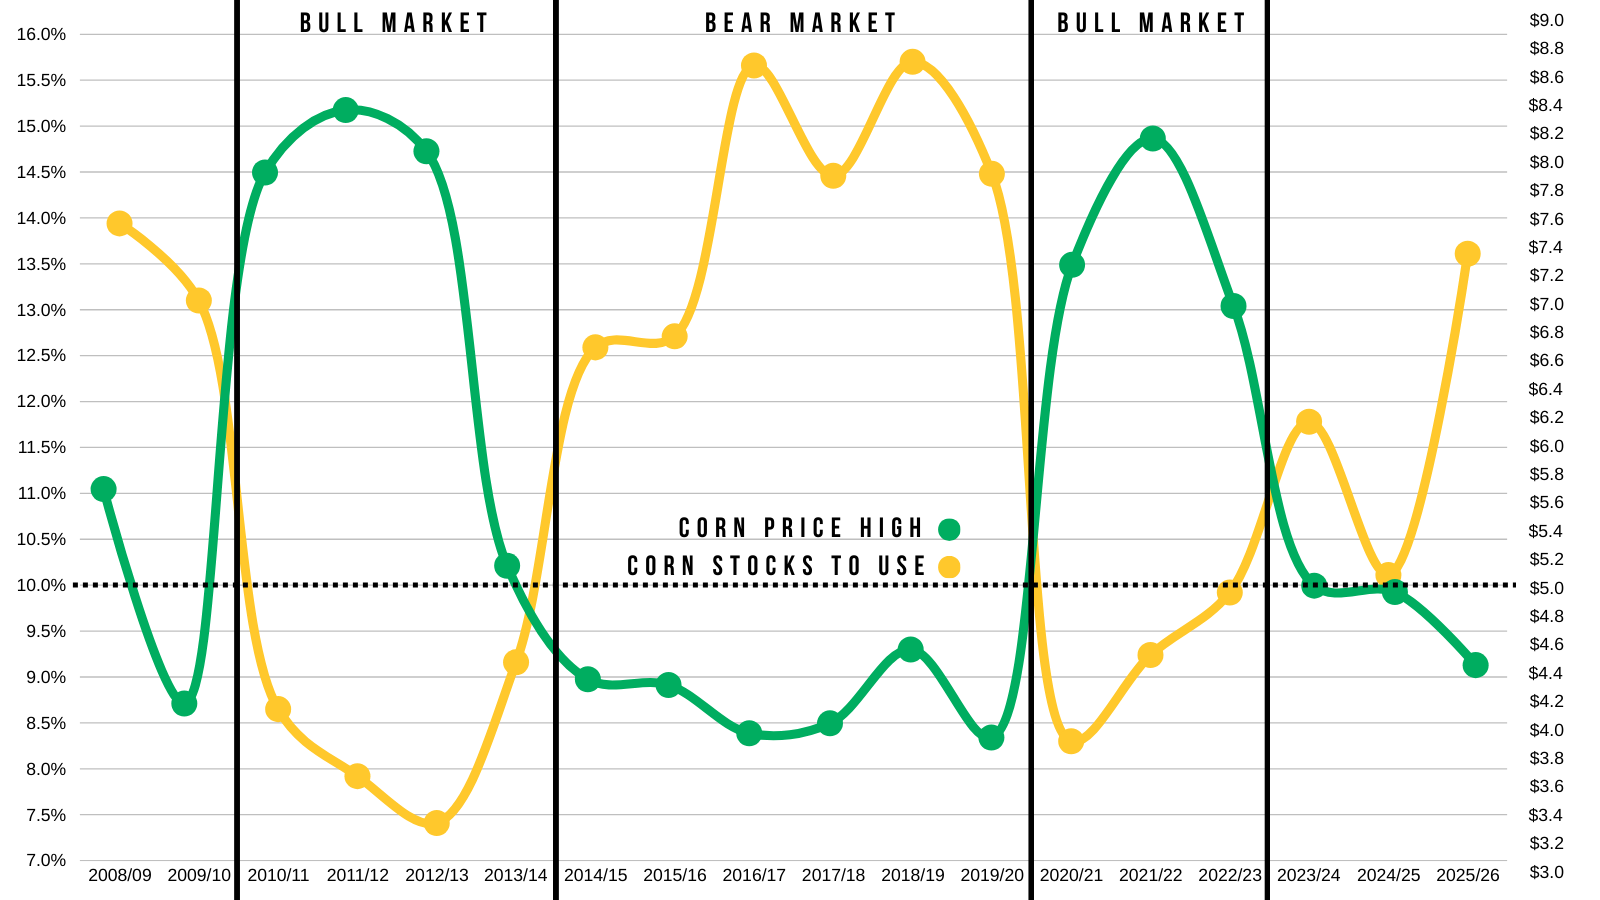
Here is another way to look at it.
By splitting up the bull markets and the bear markets.
If our stocks to use stays this high, it is about on par with the last bear market.
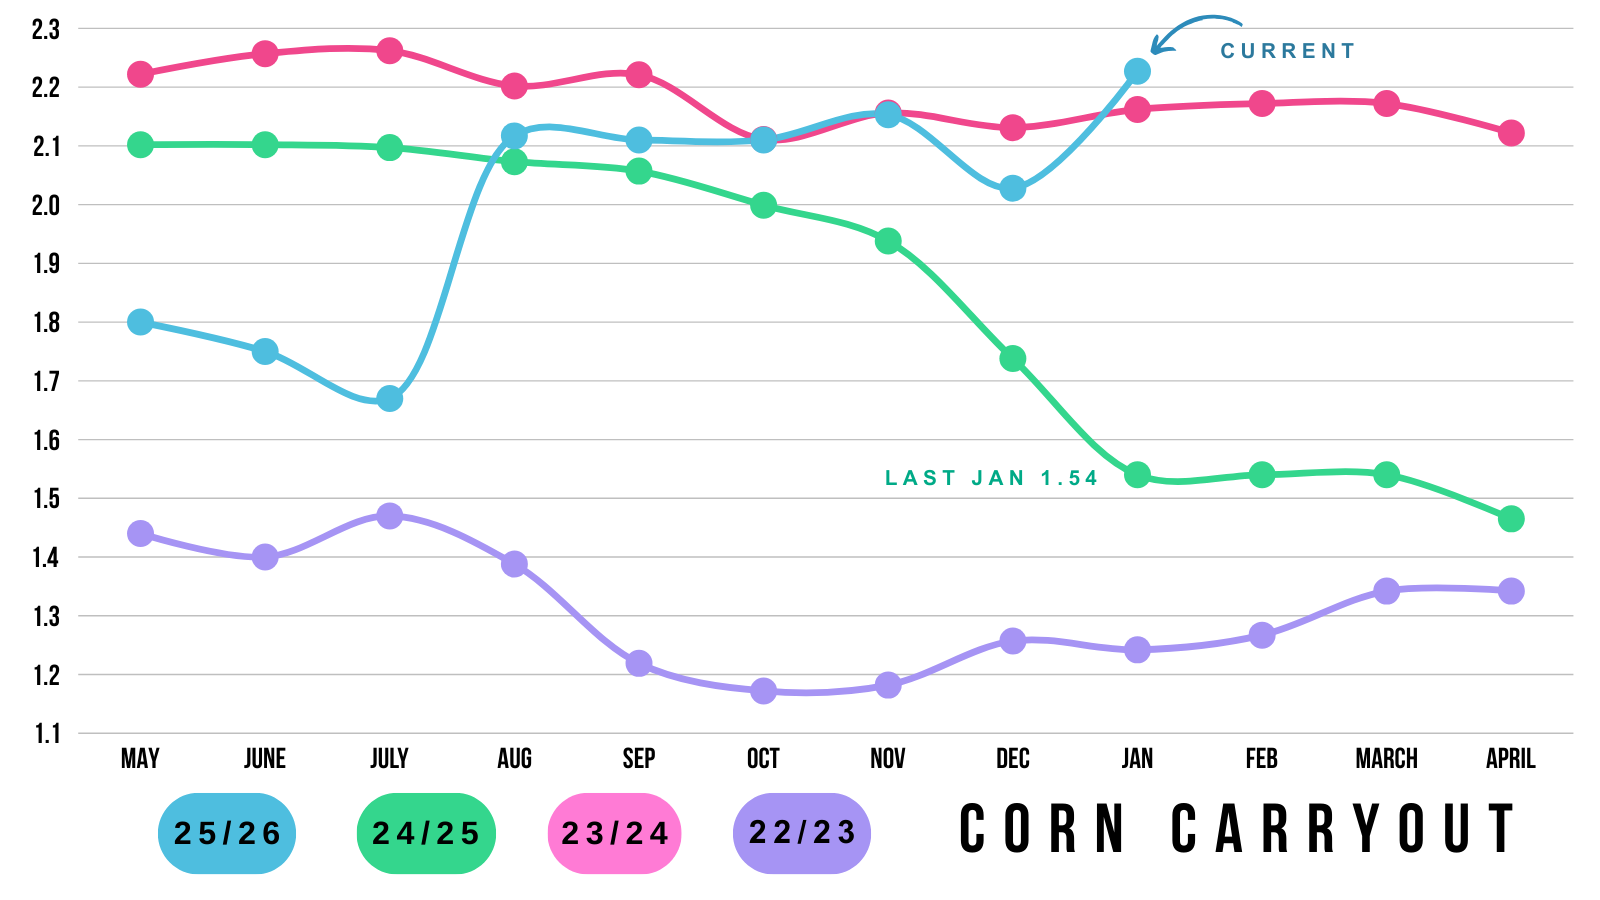
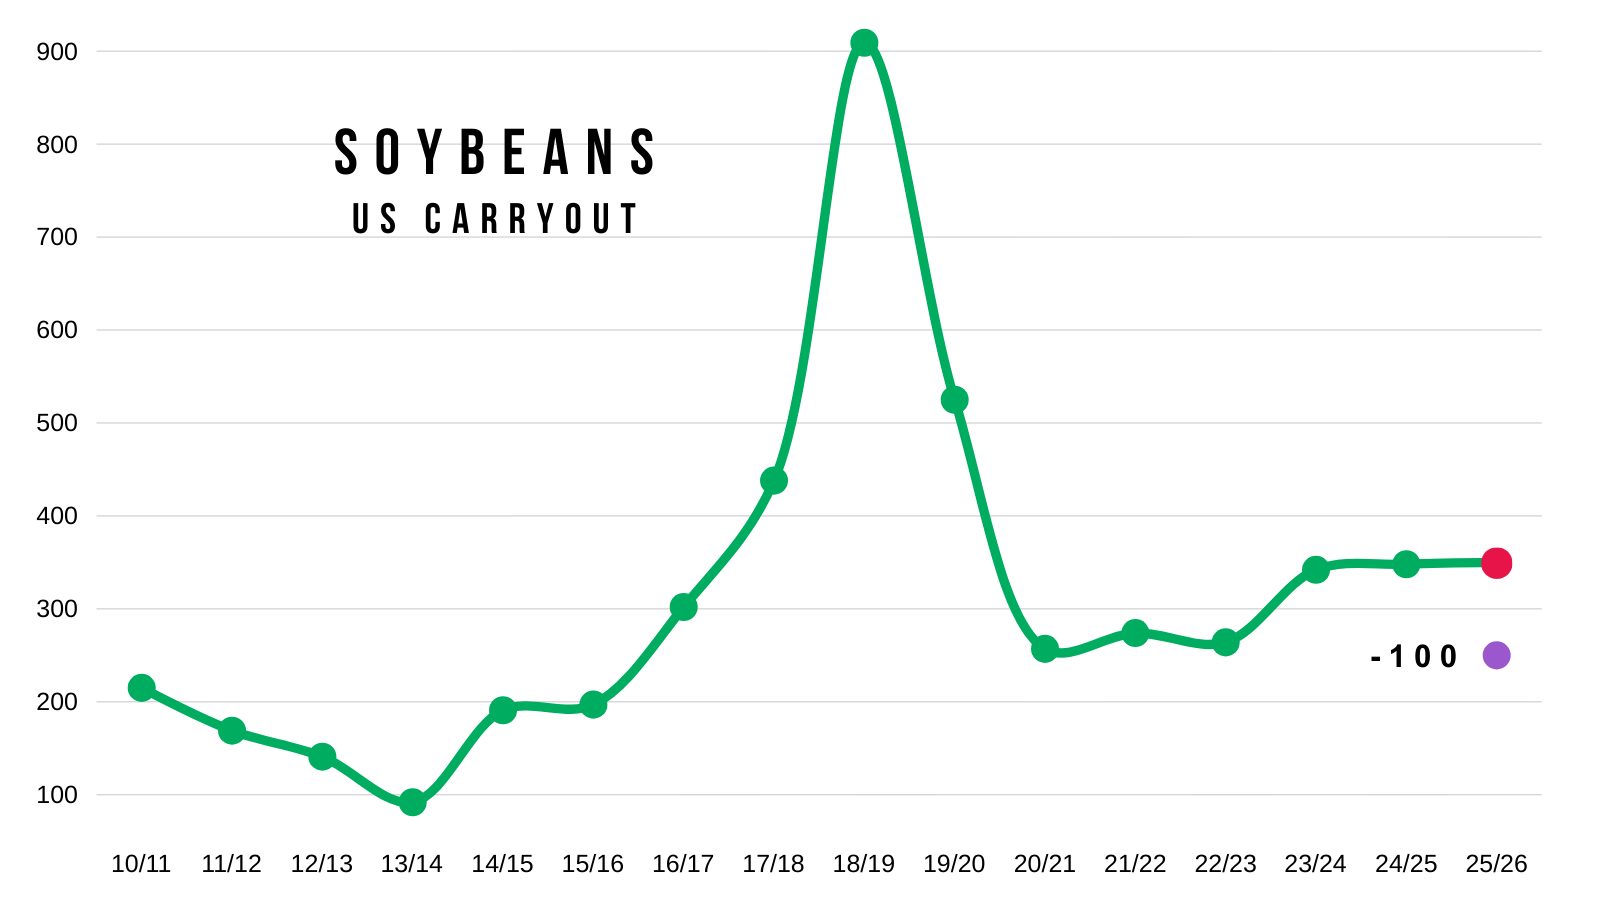
Here is a visual of our carryout.
It's now sitting at a pretty massive 2.23 billion bushels.
Which is the largest in the last few years.
We went from a not "overly bearish" situation if yield would’ve fallen down to 182 for example, to a clearly bearish situation.
To eat into that carryout, we'd have to see one of two things happen.
Demand continues to eat into it, or we get a weather scare.
The problem is that since the USDA once again upped feed usage, they more than have the ability to lower it in the future. So it seems like it'll be pretty difficult to get a carryout below 2 billion for now.
If we want corn to have a real story, we will need less acres this spring, a weather scare, or some other outside factor.
Until then, we will want to be rewarding any opportunity or rally that comes. As the fundamentals suggest sizeable rallies should be sold.
The report was indeed a game changer and answered questions about what corn's potential truly is from here.
I am not saying corn can’t go higher and we won't get an opportunity. Even bear markets provide opportunities. But it could very well be a struggle for corn here the next few months maybe even until planting.
We want to be prepared for when they do this year.
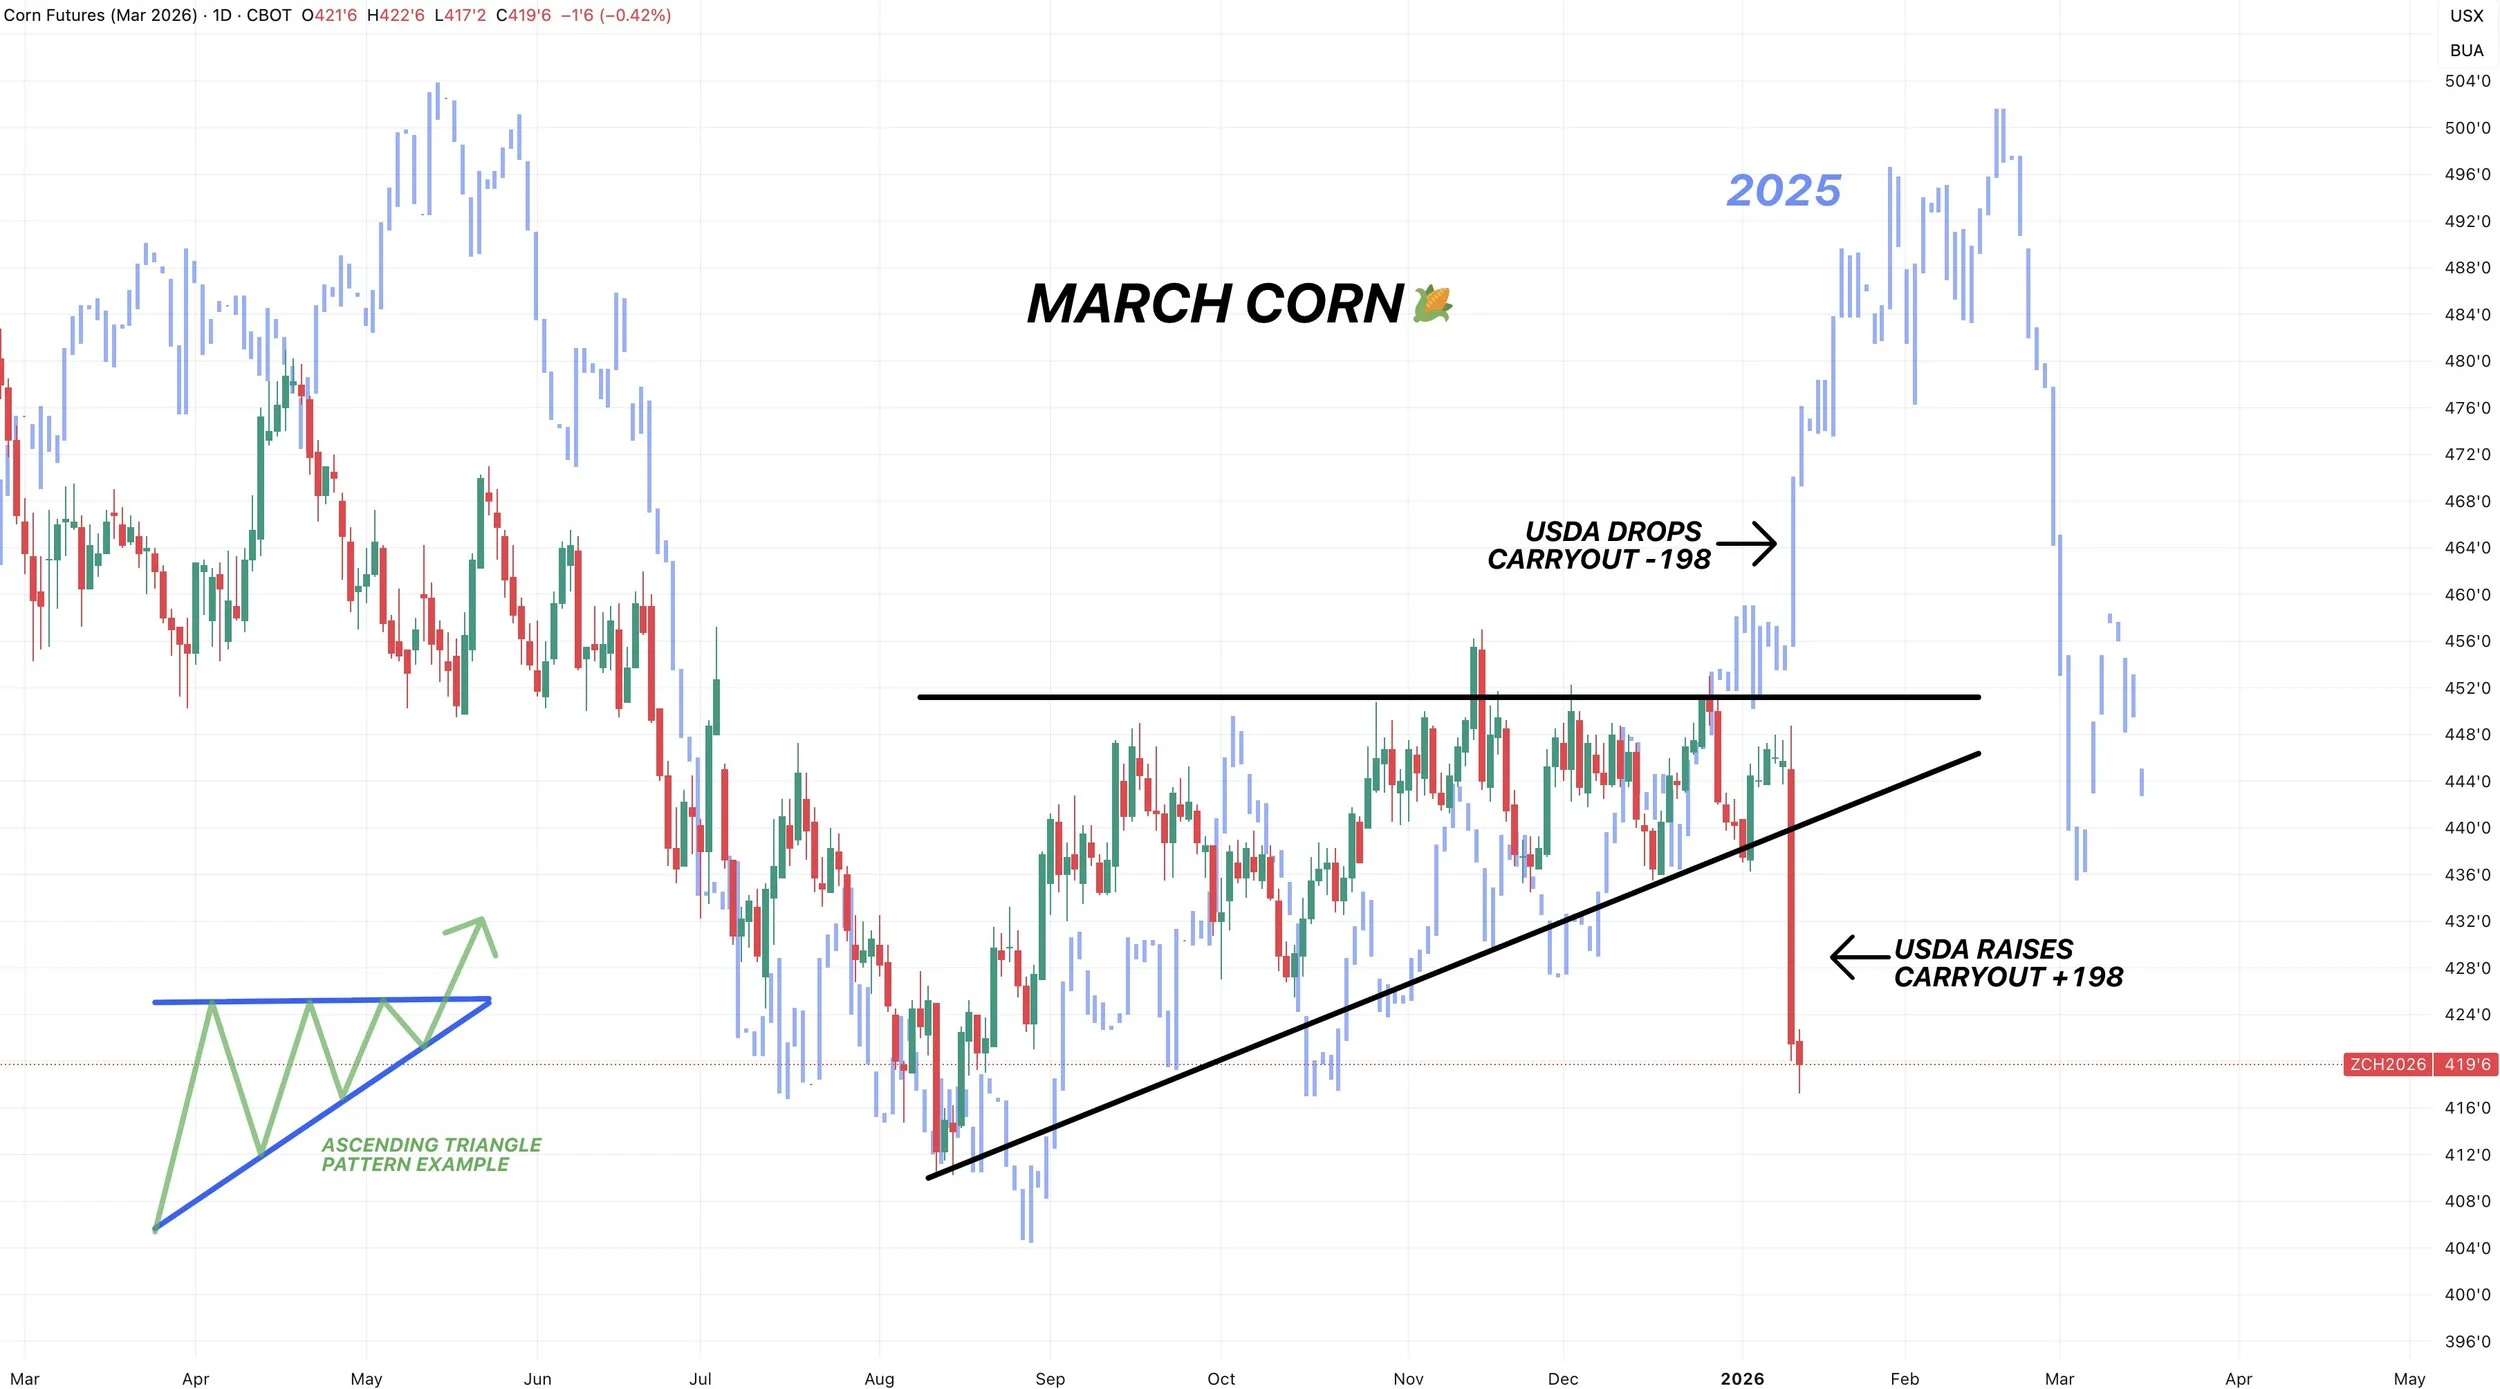
We had been tracking this pattern between March-25 and March-26 corn for the last several months.
Up until yesterday, were still tracking almost identically.
Those similarities ended yesterday.
Last year, the USDA dropped carryout by -198 million.
Yesterday, the USDA raised carryout by +198 million.
They did the exact opposite as last year, and the market got the exact opposite reaction.
Technicals:
March Corn
We originally had that sell signal at $4.50.
As it was key resistance and our first target.
In hindsight, yes, I wish we had been more aggressive.
That $4.50 was the level we needed to break through to get the next leg higher and we just didn’t get that.
Those numbers were about the only thing the USDA could’ve printed to get THAT bearish of a reaction.
I am not going to personally try to catch a falling knife here.
Today's candle did provide some optimism.
But we are essentially at our last line of defense before those contract lows.
Which is the 78.6% retracement down to contract lows.
If we take out this level, contract lows is the next point of interest.
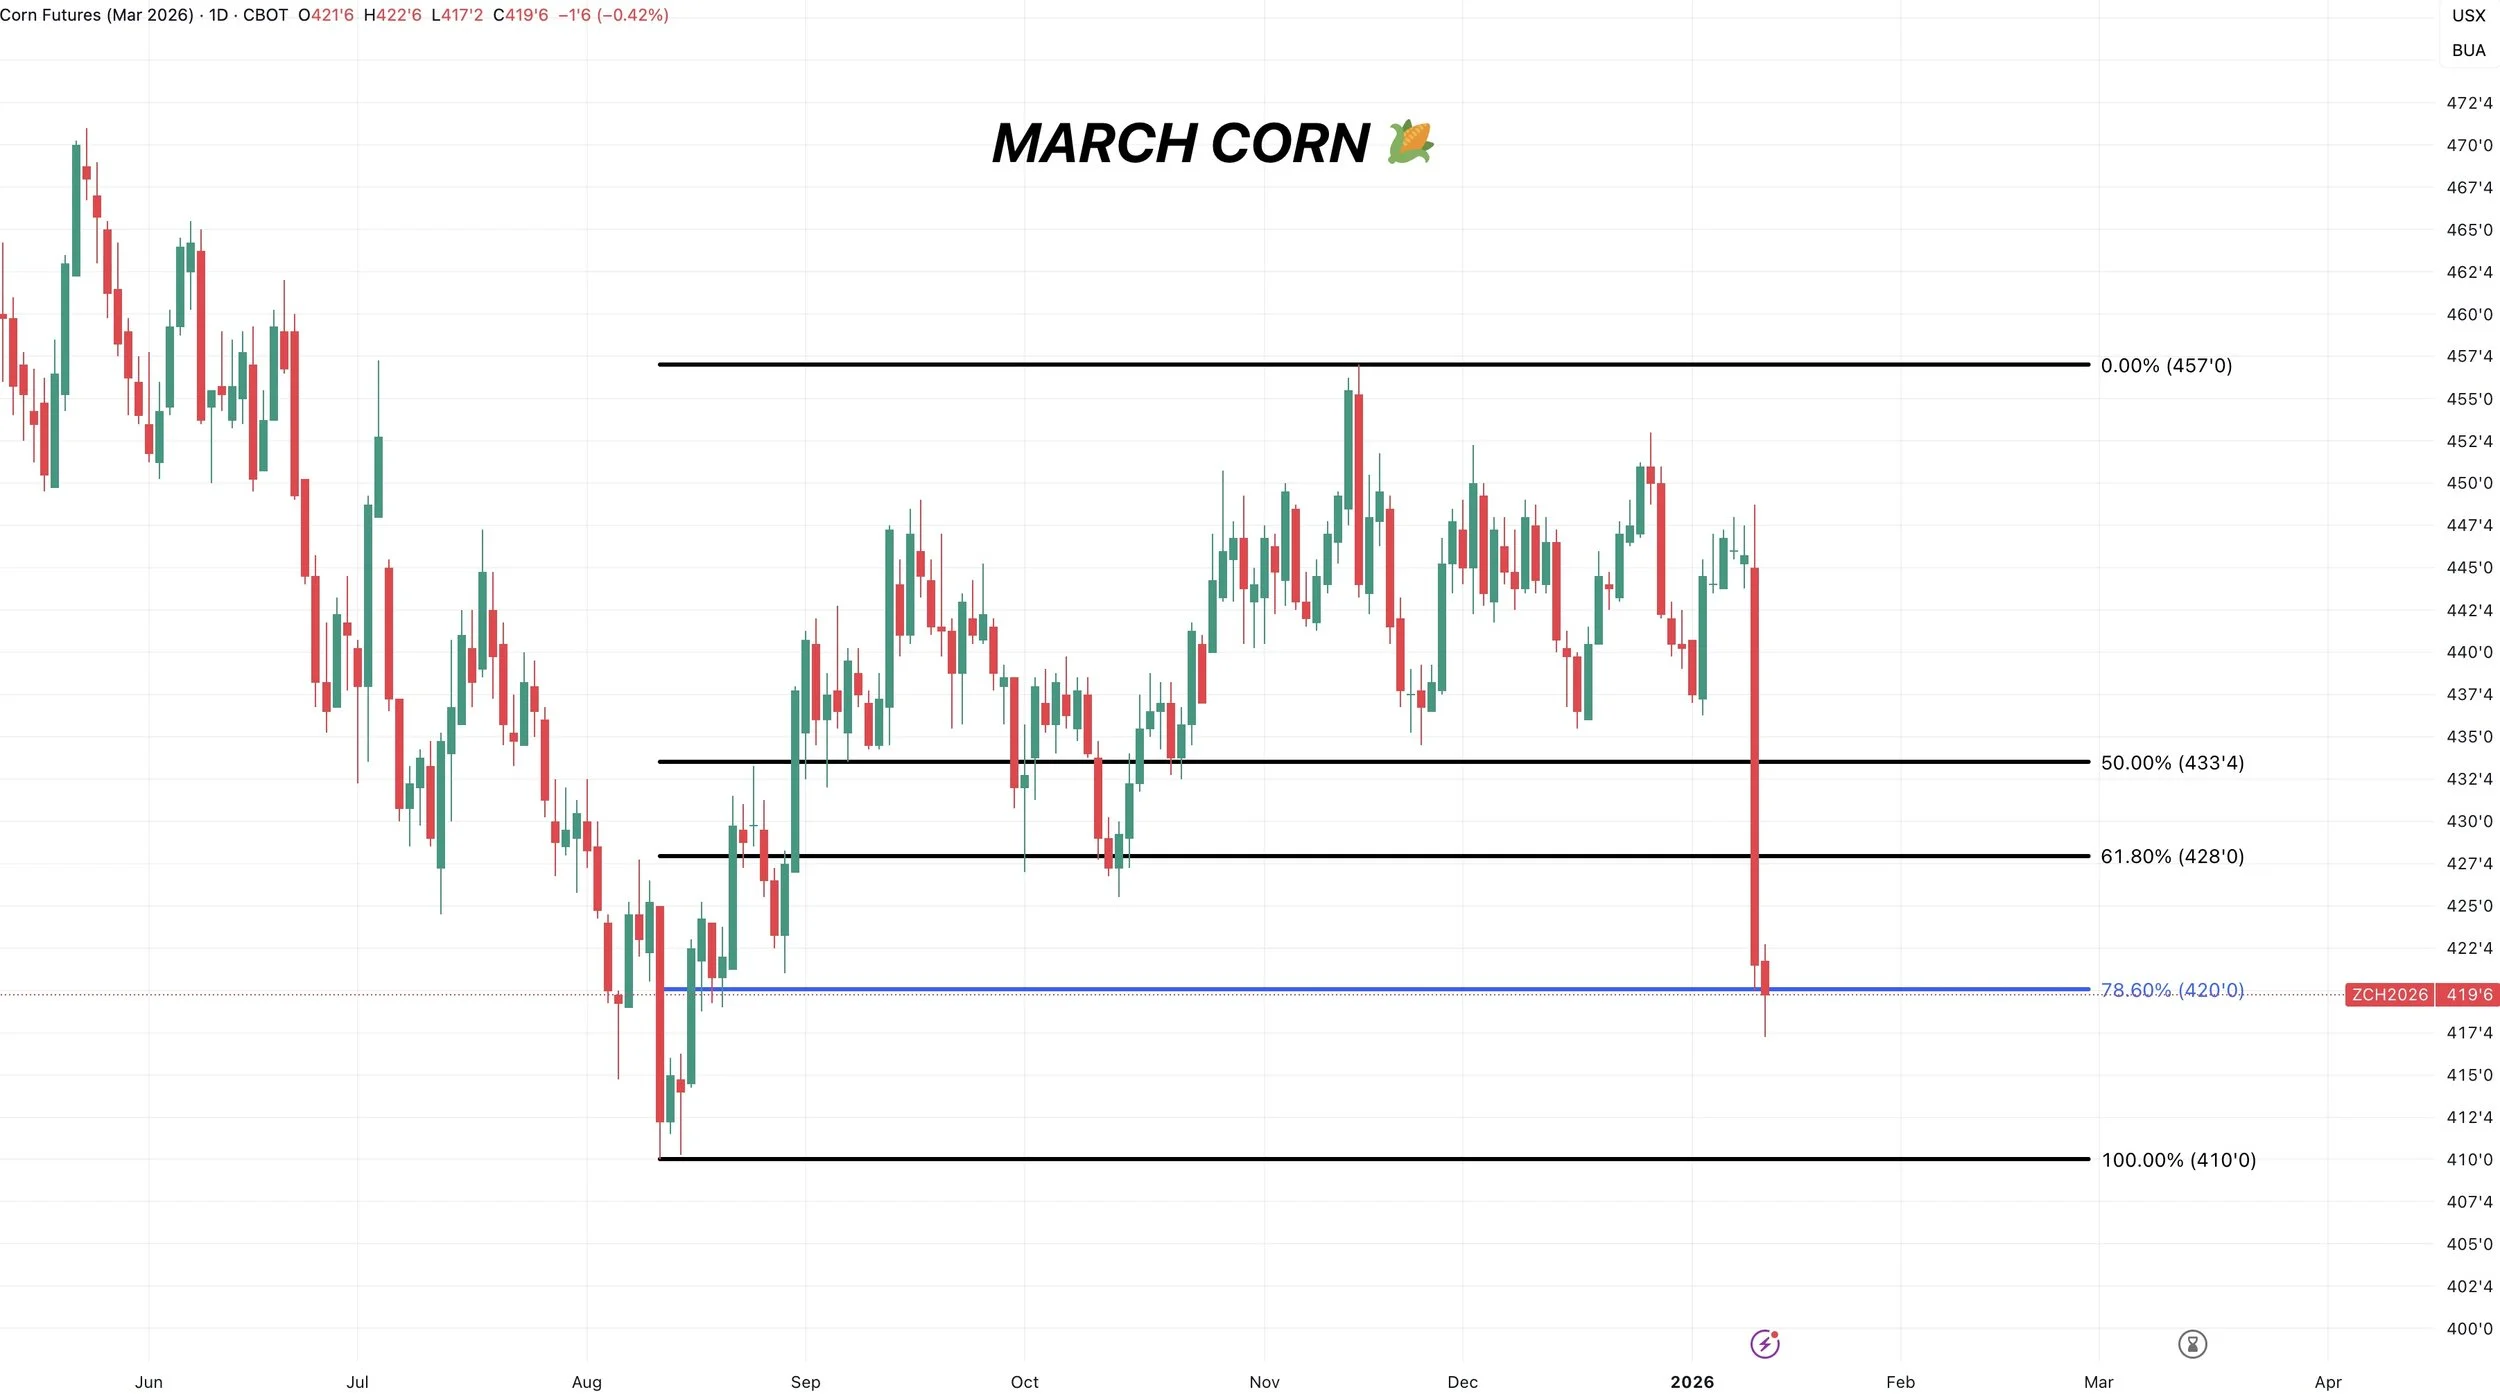
Where to de-risk:
We will get a dead cat bounce at some point whether we go lower from here first or not.
We will want to be looking to reward any relief bounce that claws back 50-61.8% of this sell off.
If we move lower, then this target box changes.
Currently, that golden zone aligns with our old support.
Targets do not have to hit. They are just there to let you know to de-risk if they do.
Soybeans
Fundamentals:
Corn's overly bearish report stole the show.
But the report for soybeans was also pretty bearish.
Not only are soybeans dealing with a bearish USDA, but we are once again dealing with trade conflicts. Which is probably part of the reason why we struggled today.
Trump announced he would be imposing 25% tariffs on any country that trades with Iran.
China is Iran's #1 trading partner.
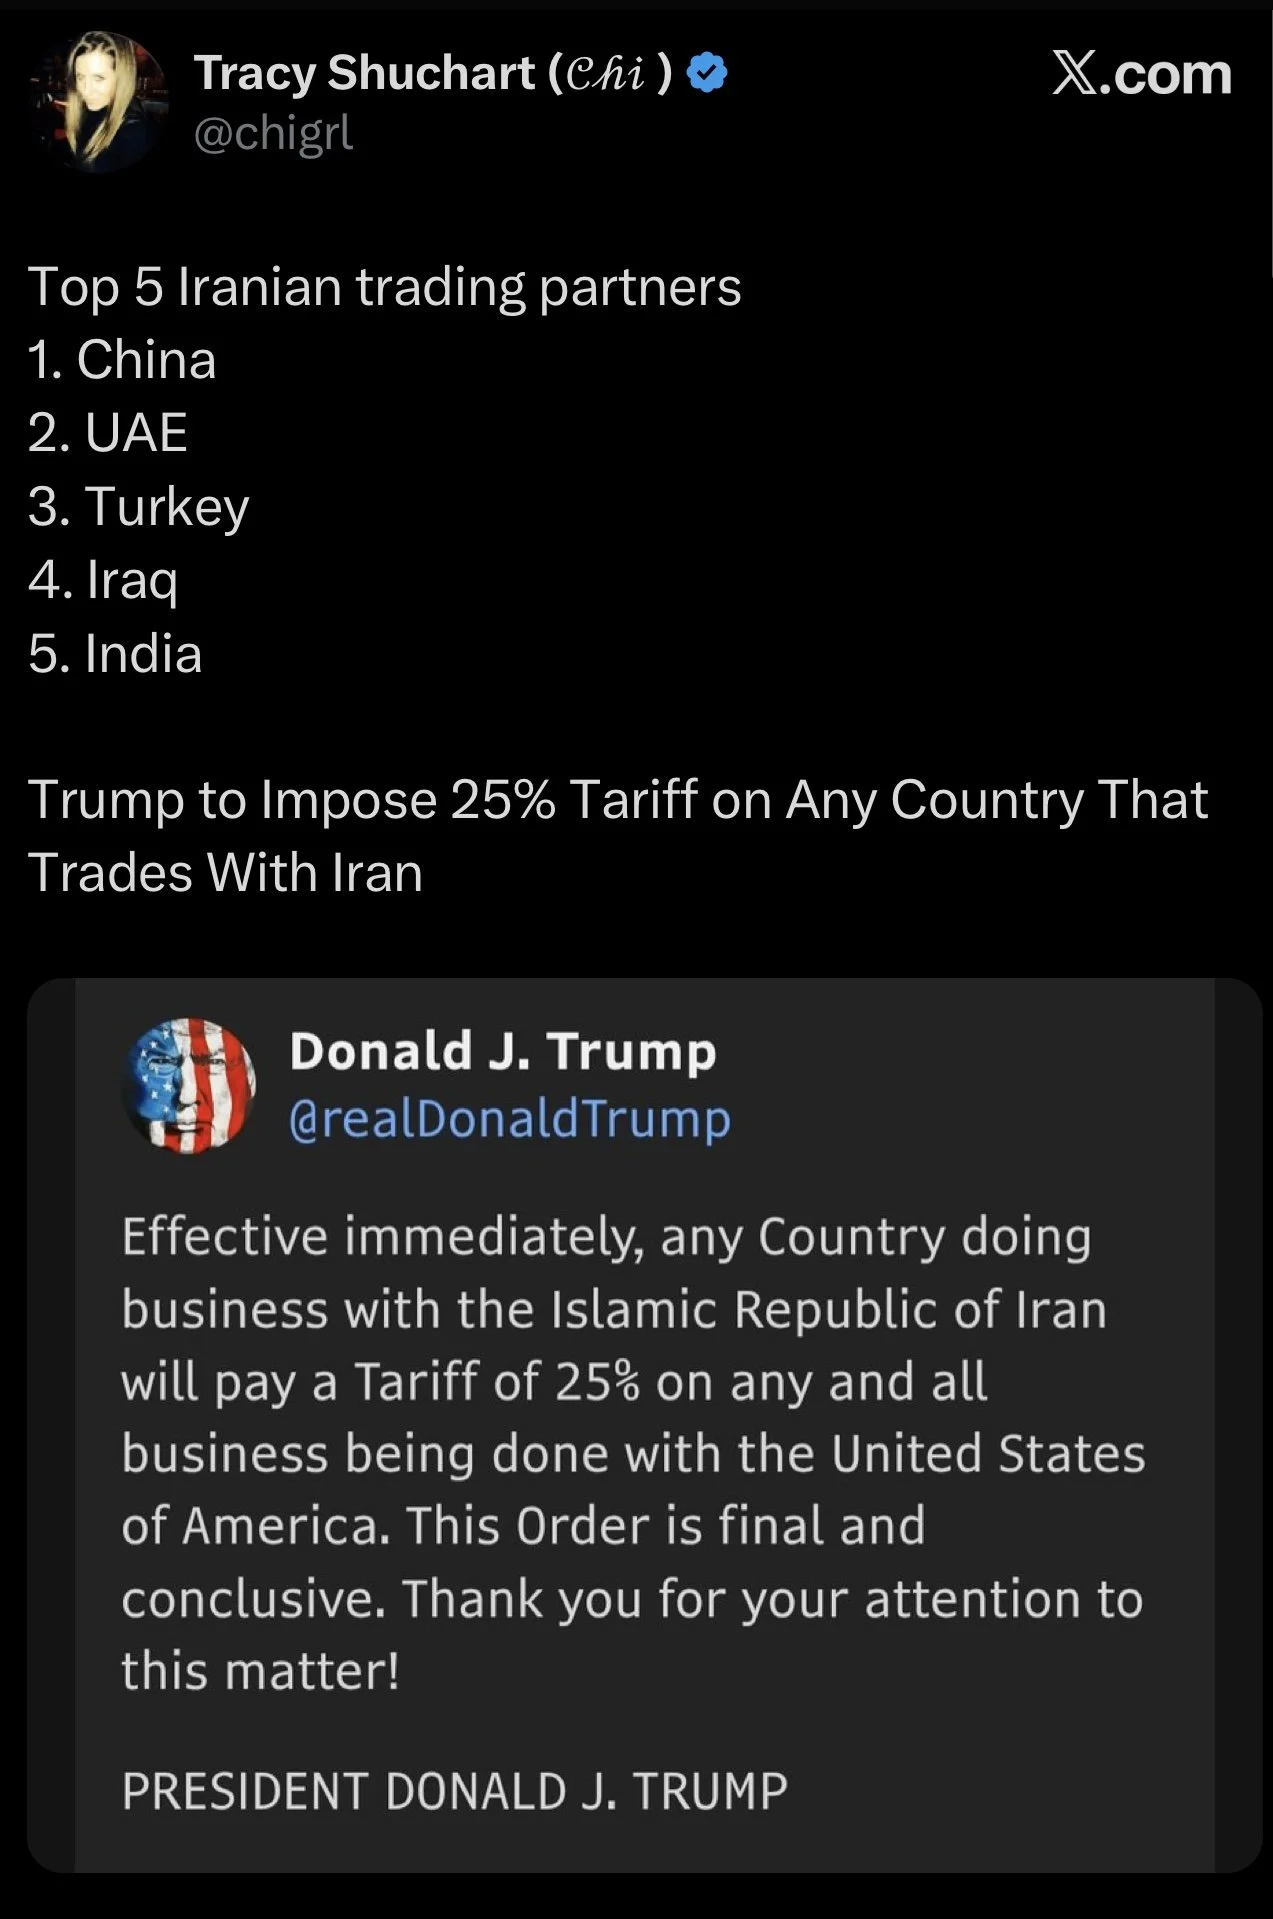
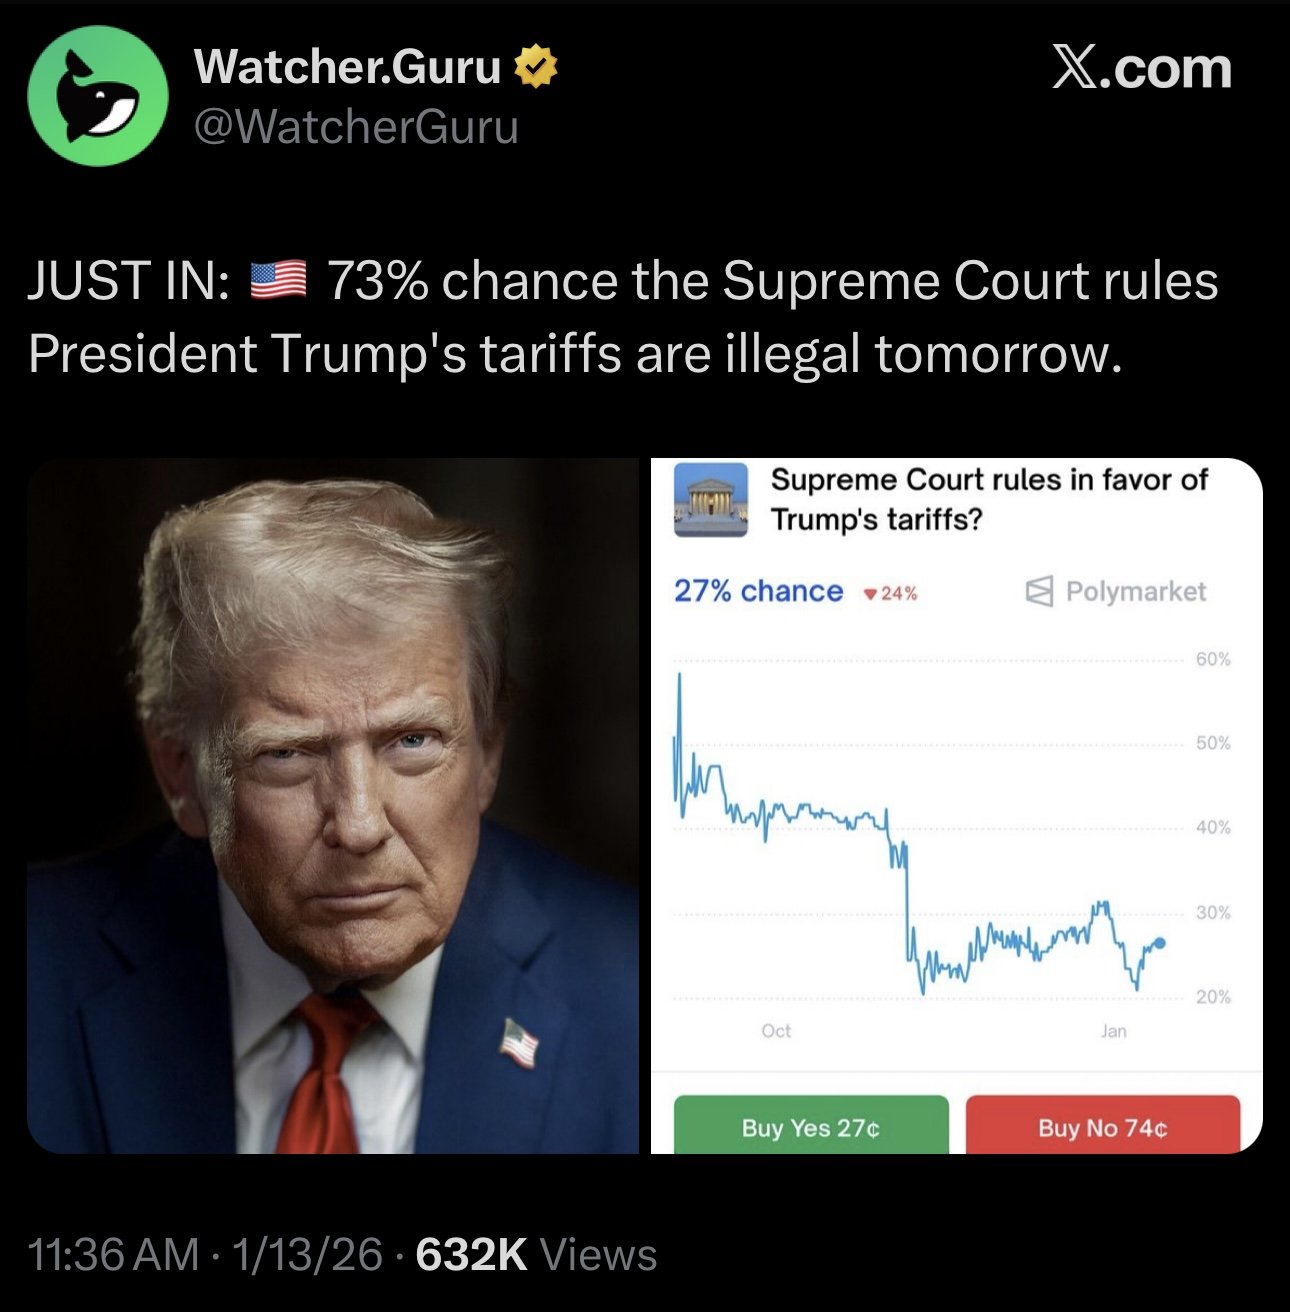
The Supreme Court rules on Trump's tariffs tomorrow.
Odd makers say there is a 73% chance they rule them illegal.
We will have to see if the soybean market reacts to the ruling.
The soybean situation does suck, given that there was so much potential for soybeans to have a really bullish situation.
The potential was definitely there.
But trade conflicts ruined that.
Our exports are estimated to be 104 million bushels below what they were in 2019/20.
The US situation would be very tight if exports would’ve been fine.
We are crushing more than ever.
Crush demand is as strong as it's ever been.
So imagine if exports weren’t awful.
Even if we had the same exports as the last trade war, you'd be taking off an extra 100 million bushels of supply on the balance sheet.
With a carryout of 350 million, that is a big swing.
Here is the balance sheet changes from the report.
Yield unchanged.
Exports dropped -60 million.
Crush increased by +15 million.
They found an extra 100k acres.
The increase in crush was offset by the increase in acres.
Resulting in carryout jumping by +60 million from 290 to 350 million.
You can’t really argue against their decision to cut exports.
I think that is totally justifiable.
Export demand is so far behind pace and we are well past our prime shipping window.
We're down -43% vs last year.
To add on to that, Brazil has a record crop that's about to come online.
They haven’t seen any weather issues.
Which makes it that much harder for soybean exports.
This was the 5th time in the last 12 years where yield didn’t come down in this report.

Like corn, this report was one of the most bearish in the last decade.
It featured our largest increase to carryout in over a decade.
Almost double the next largest one.
Technicals:
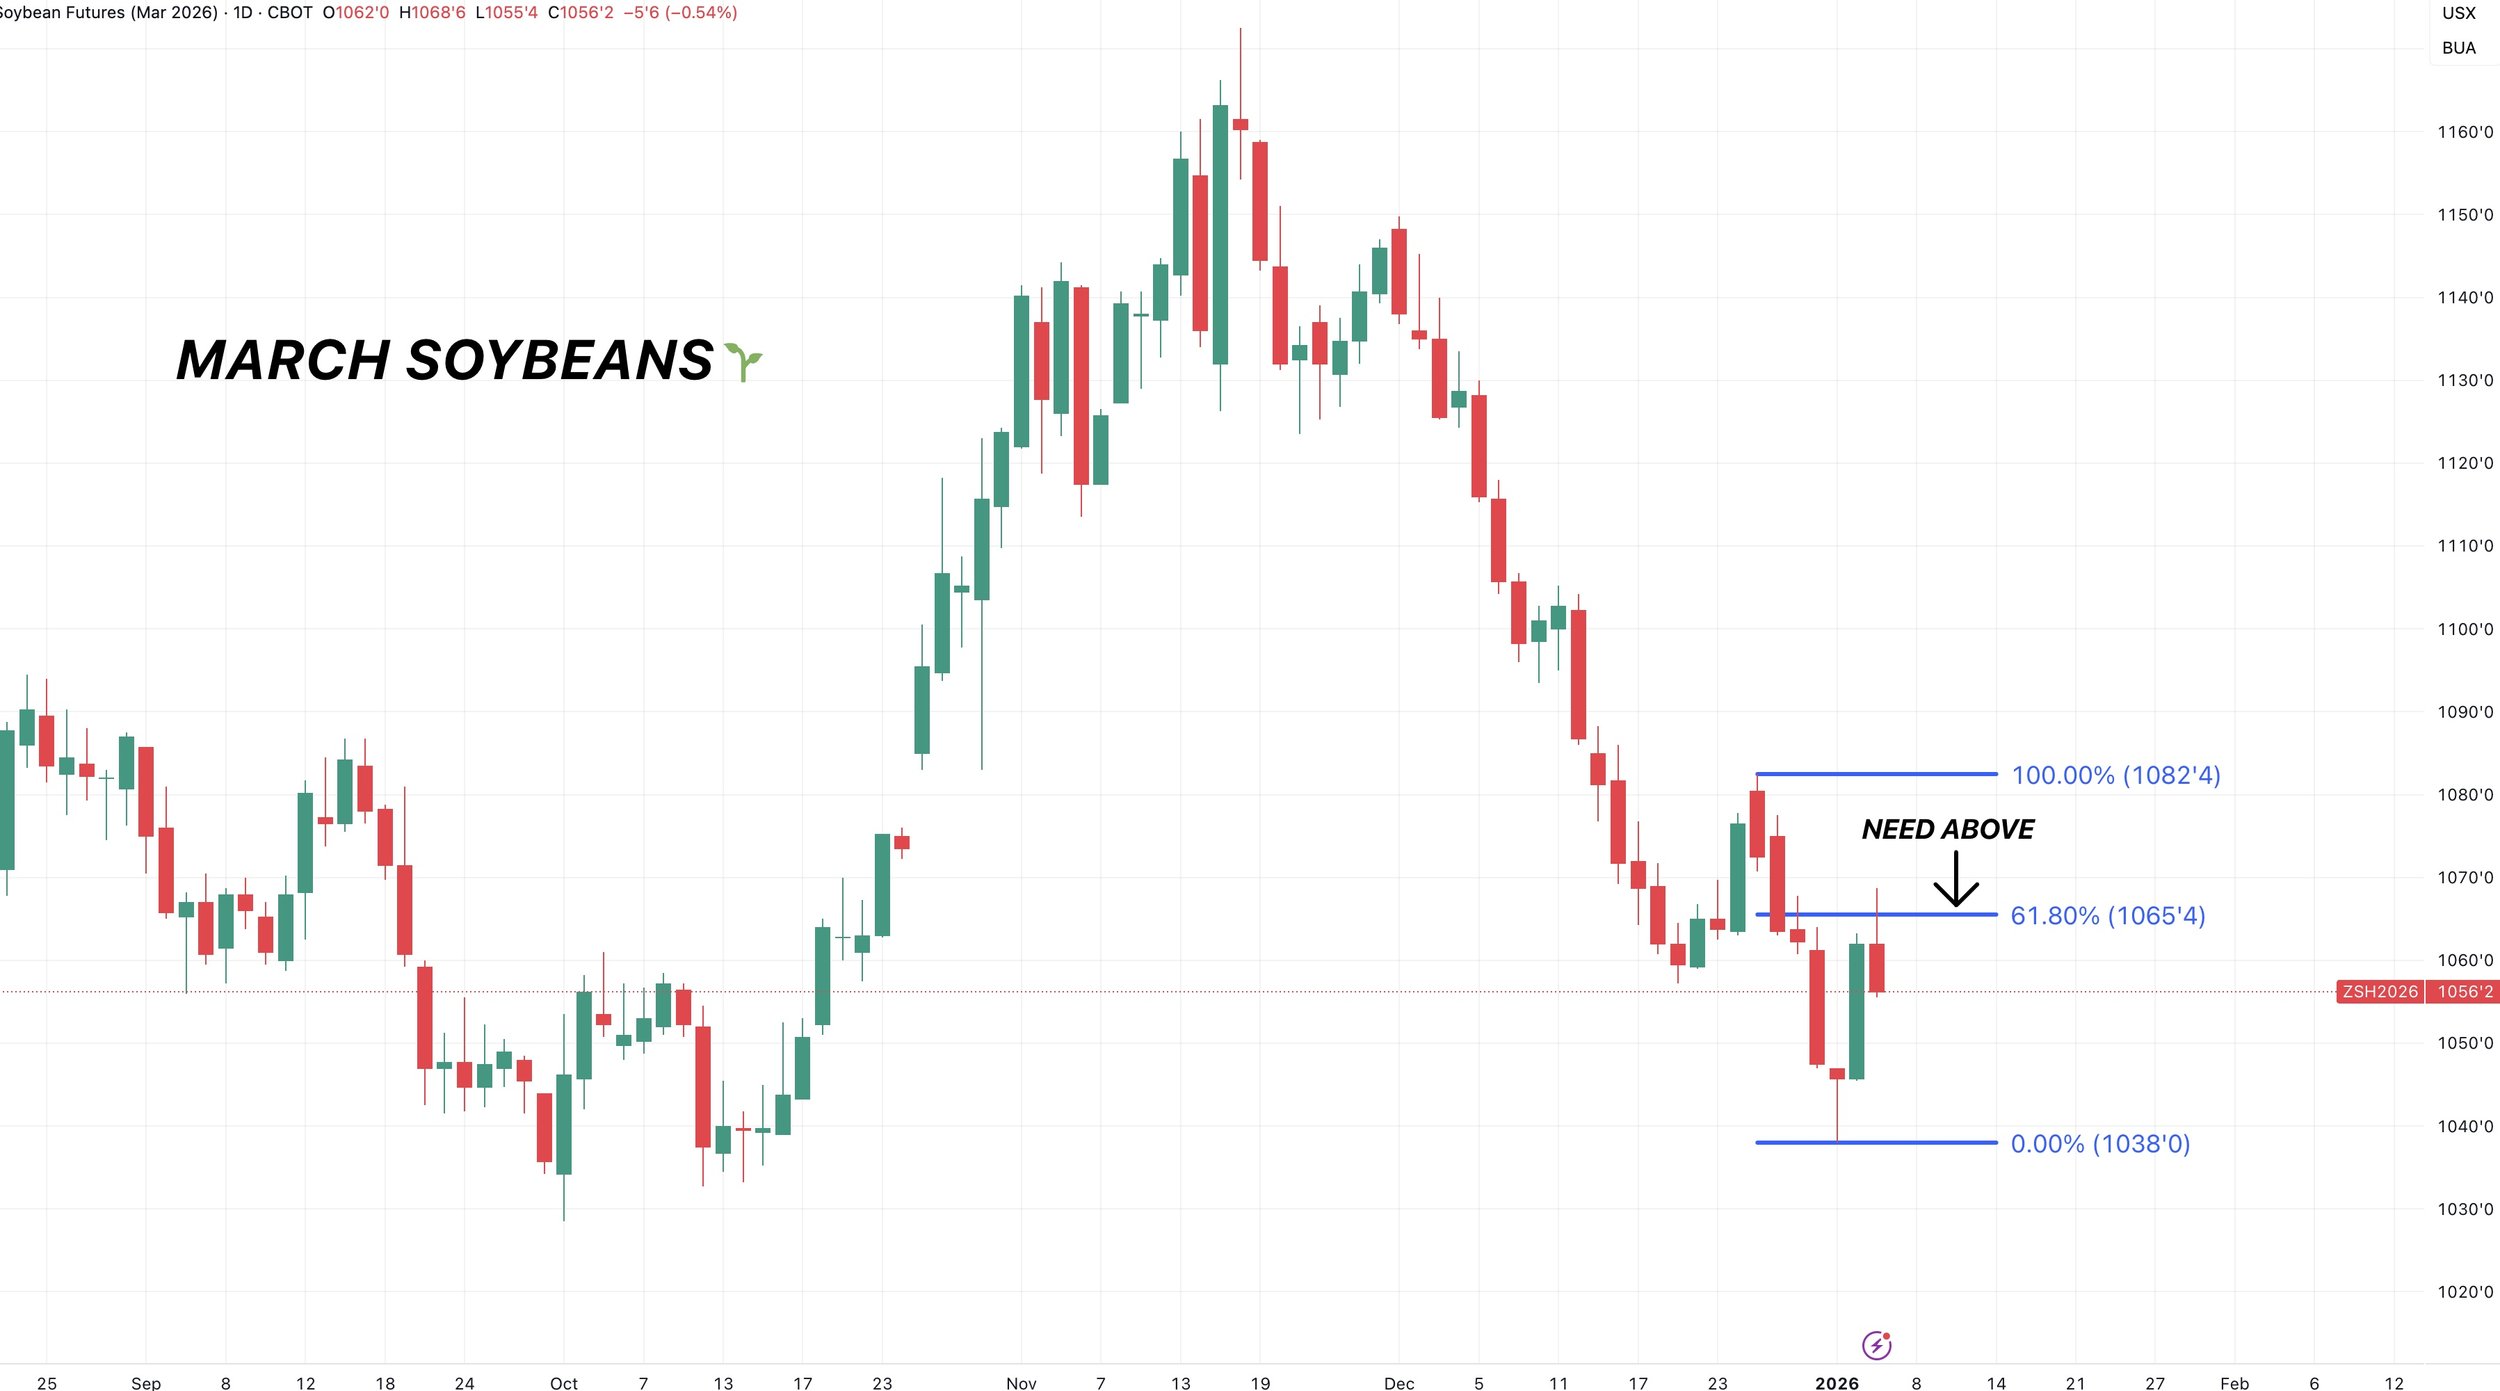
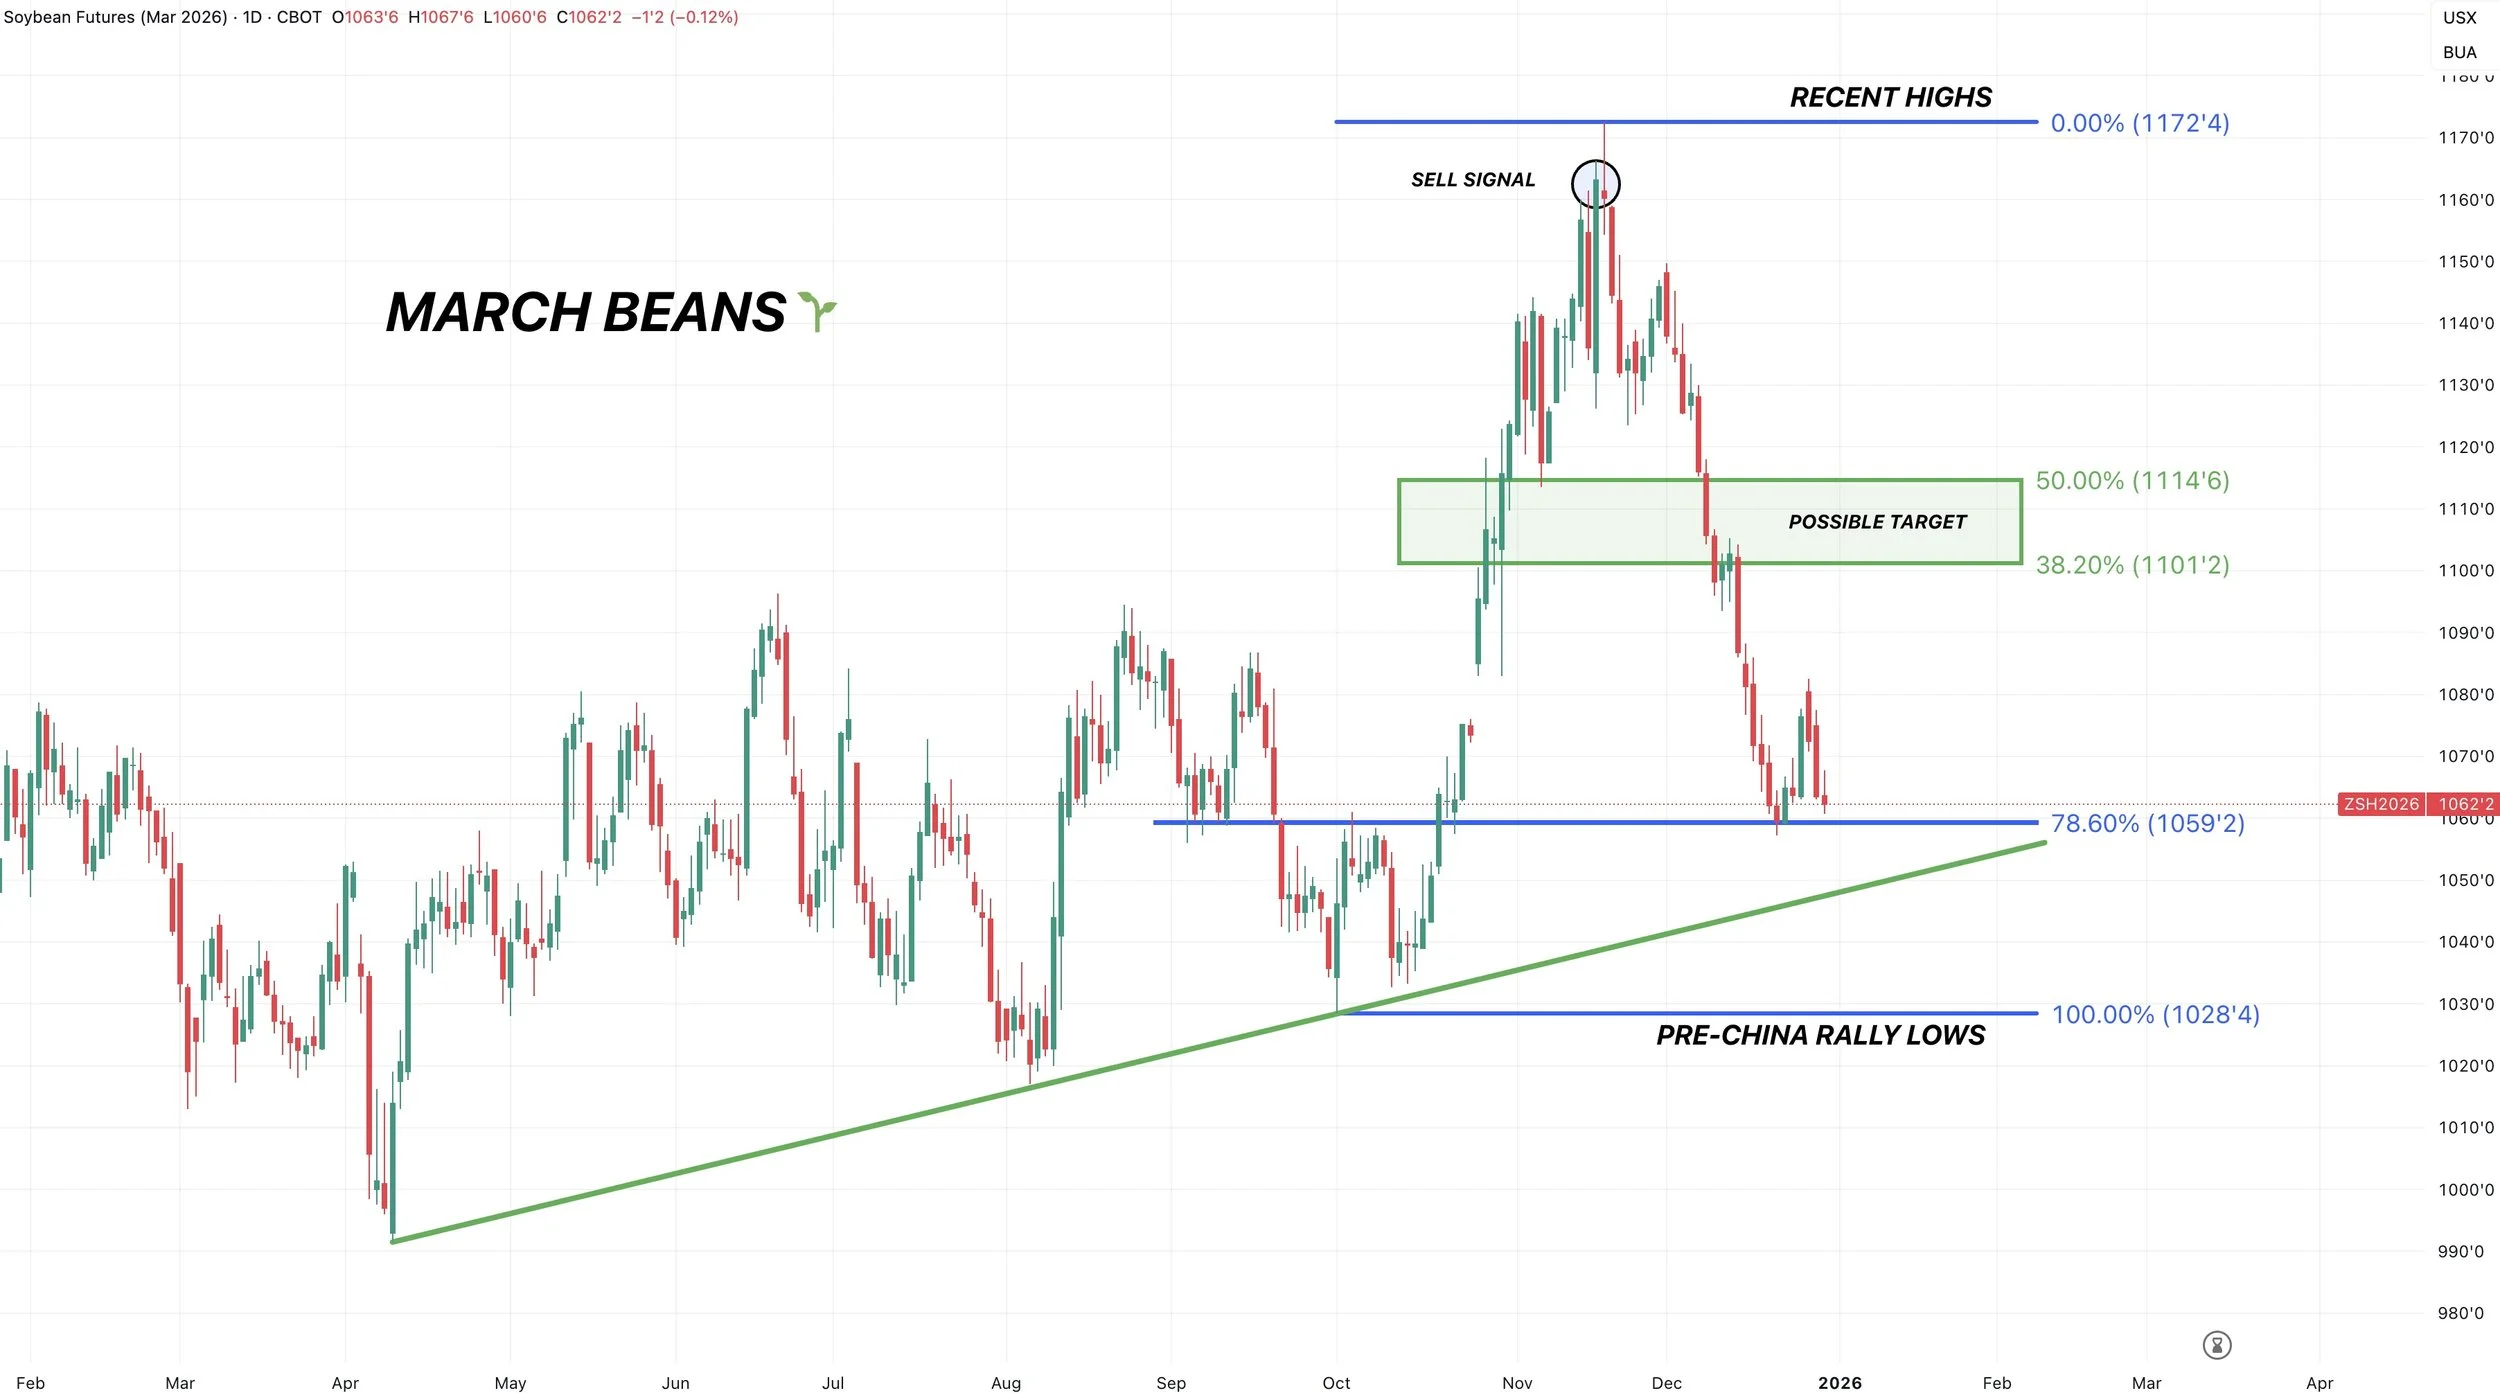
March Beans
The chart doesn’t too great here.
We failed to bust above that 61.8% retracement up to those Christmas highs. Which was the level we need to break to spark further upside.
We now broke that trendline support from contract lows.
We are now sitting right at those lows from new years.
If we fail to hold that level, it could easily open the door another -20 cents lower.
As the next point of interest is going to be the 78.6% level down to contract lows.
Still looking to reward a sizeable relief bounce if it comes.
Wheat
Wheat was trying to breakout before the report but ultimately failed. The data certainly didn’t help, but I'd imagine the collapse in corn spilled over to the wheat market.
There wasn’t a ton of adjustments for wheat in the report.
Wheat had the least bearish report, but like corn and soybeans couldn’t escape the bearish surprises.
Carryout surprised a little high.
Winter wheat plantings were down about -1% vs last year.
But came in higher than the trade was anticipating.
Most feel like this number could work itself lower given that prices are far from appealing.
You could argue that we see some downward revisions come March.

Outside of that, the wheat story still lacks a catalyst and the situation is still far from being bullish.
We have plenty of supply in the US.
The stocks to use increased once again.
(Red dot is previous month)
We also still have plenty of supply globally.
Without a major global player having any supply or weather issues, it just makes it hard for the wheat market to catch a real bid.
There will be a concern somewhere eventually, but for now there just isn’t.
Still remaining as patient as I can in wheat.
We don’t have a reason to get overly bullish. But at the same time, it's hard to justify being bearish at $5.00 wheat.
Seasonally, the wheat market tends to get it's biggest opportunity of the year during the spring.
Chicago Seasonal
KC Seasonal
Technicals:
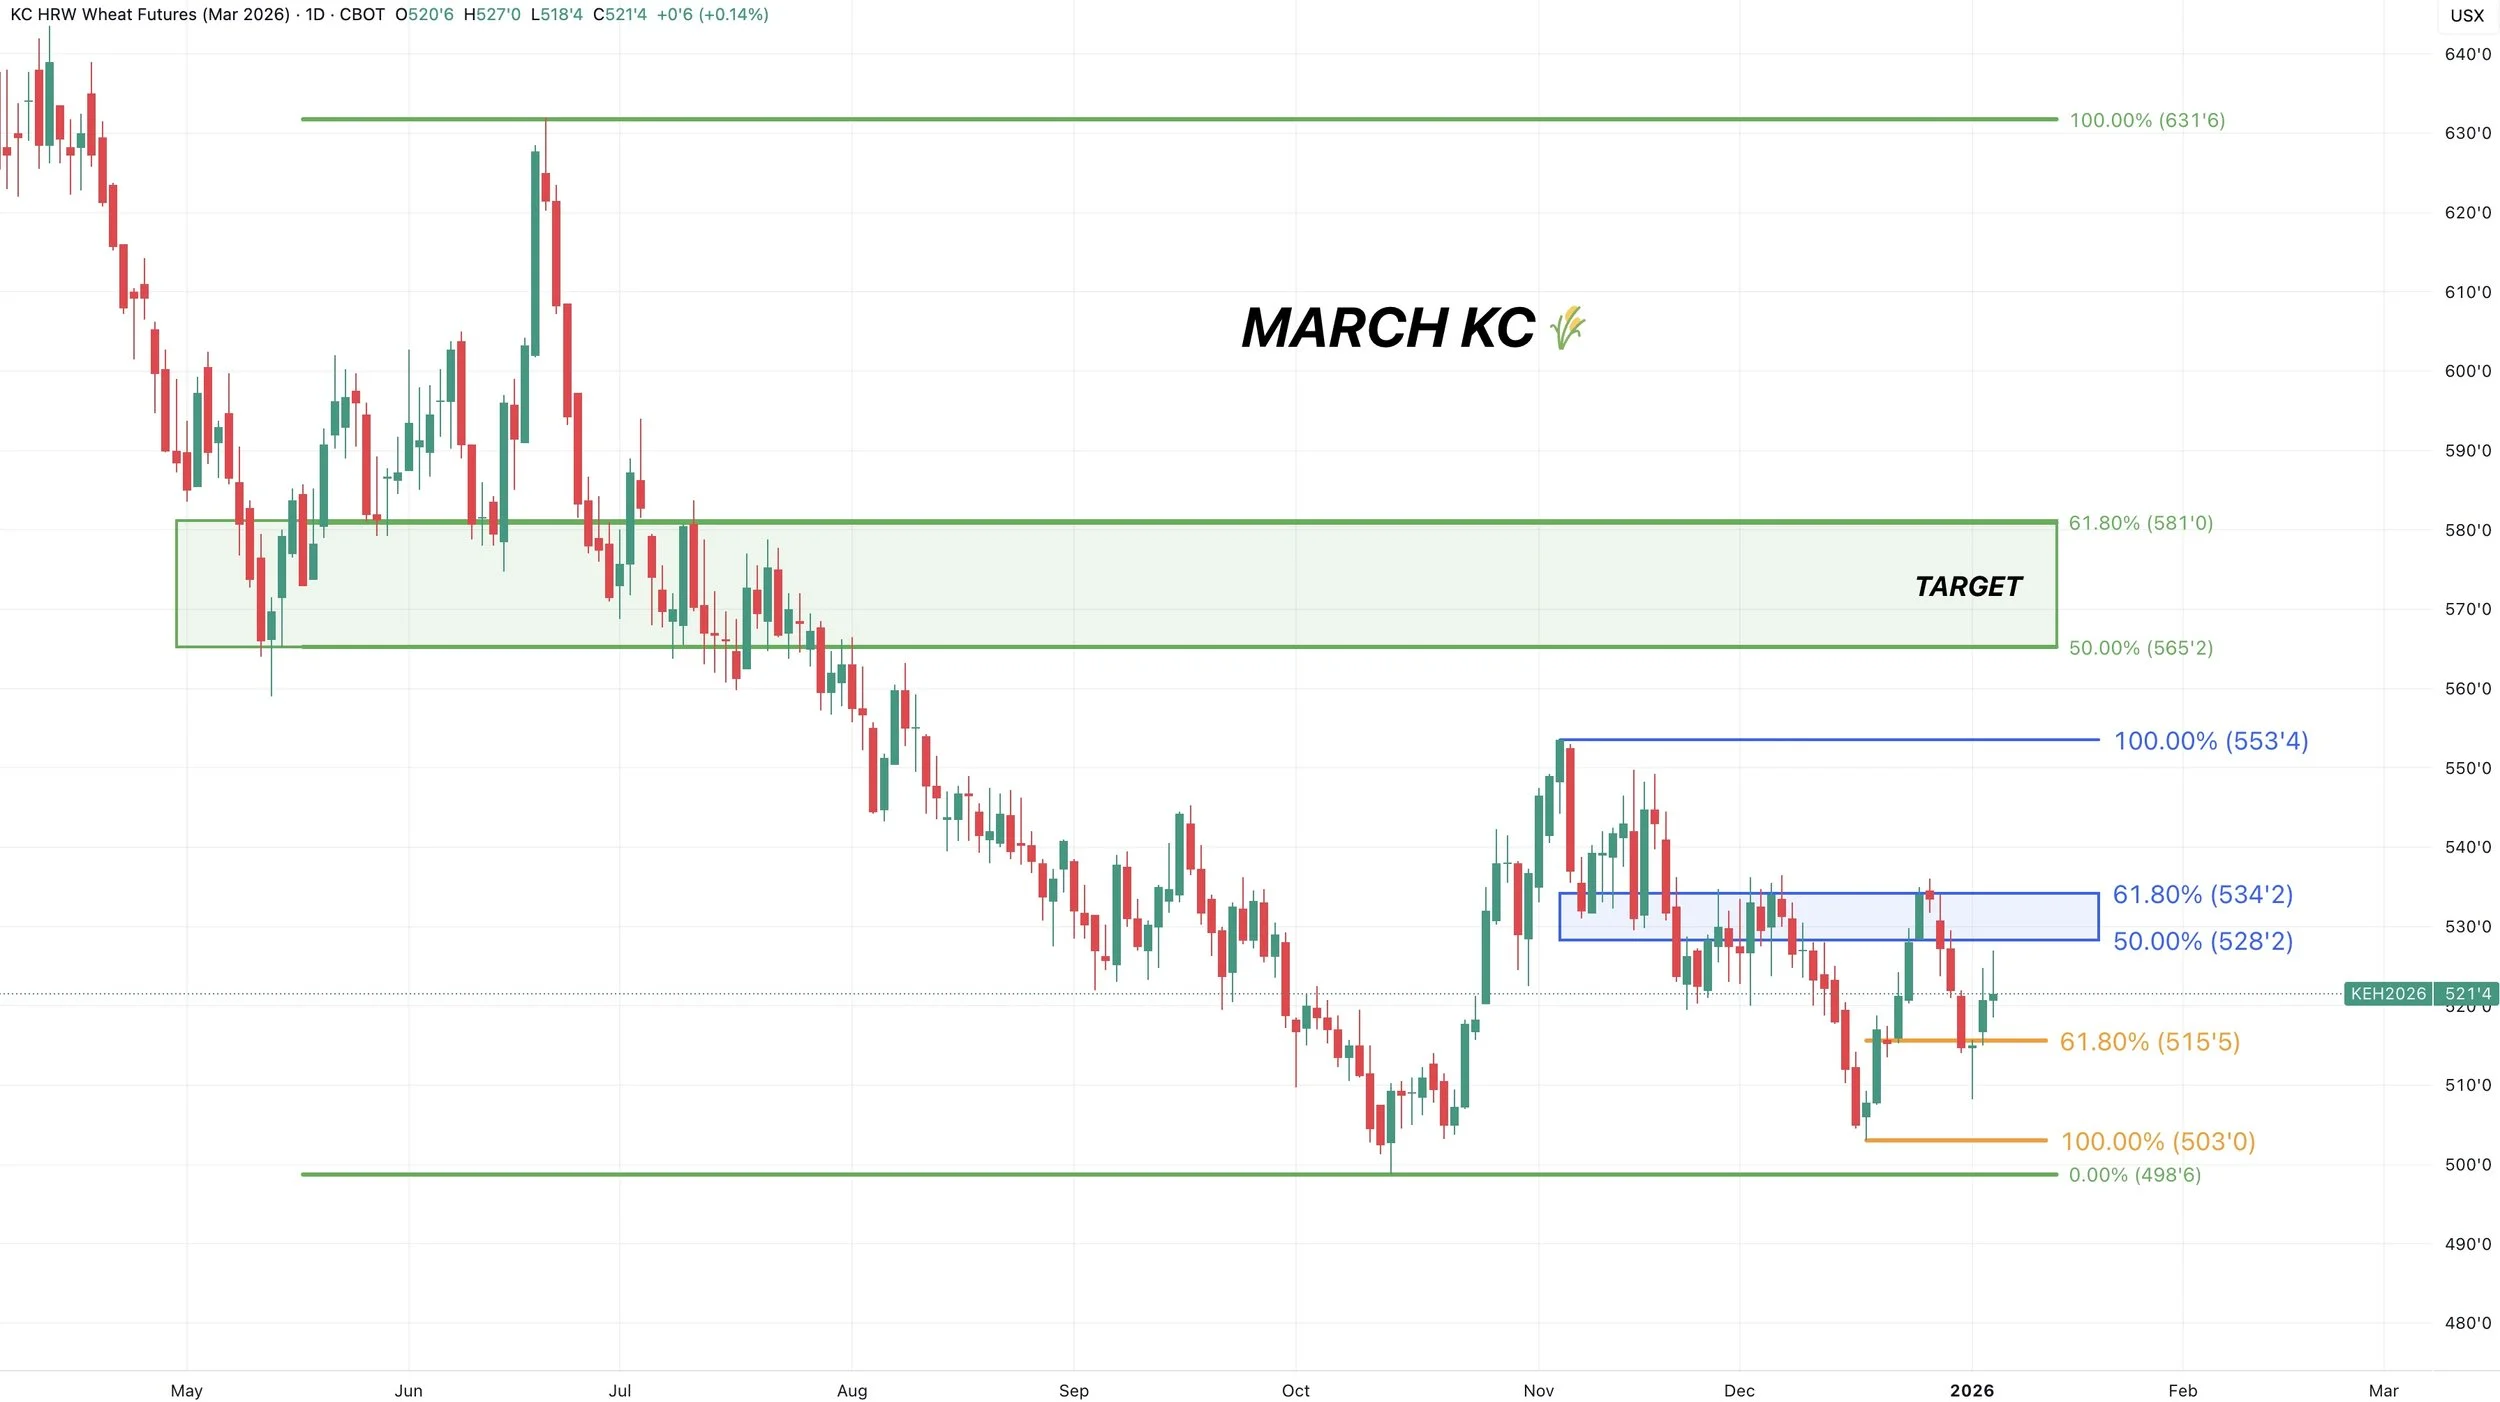
March KC
We failed right at that 61.8% retracement up to those Nov highs once again.
We also failed to break trendline resistance.
That $5.35 level is still the clear level bulls need to break to get a leg higher.
In the meantime, we've now given back 61.8% of yesterday's highs down to those Dec lows. Important spot to hold here.
If we fail to hold here, we could go test those lows.
March Chicago
Nothing to update here.
Simply consolidating near the lows.
Cattle
Fundamentals:
Not a ton on cattle today as today's focus in the update was the USDA report and the grains.
Cattle continues to push higher with the lower corn.
It makes the cost of gain cheaper so you can theoretically pay for more cattle.
Which often supports feeders the most because feedlots can pencil better margins and theoretically bid more aggressively for feeder cattle.
The cattle situation is still tight.
However, I am skeptical that we have much more upside for beef demand here.
Here is an interesting tweet I saw from Swift Trading.
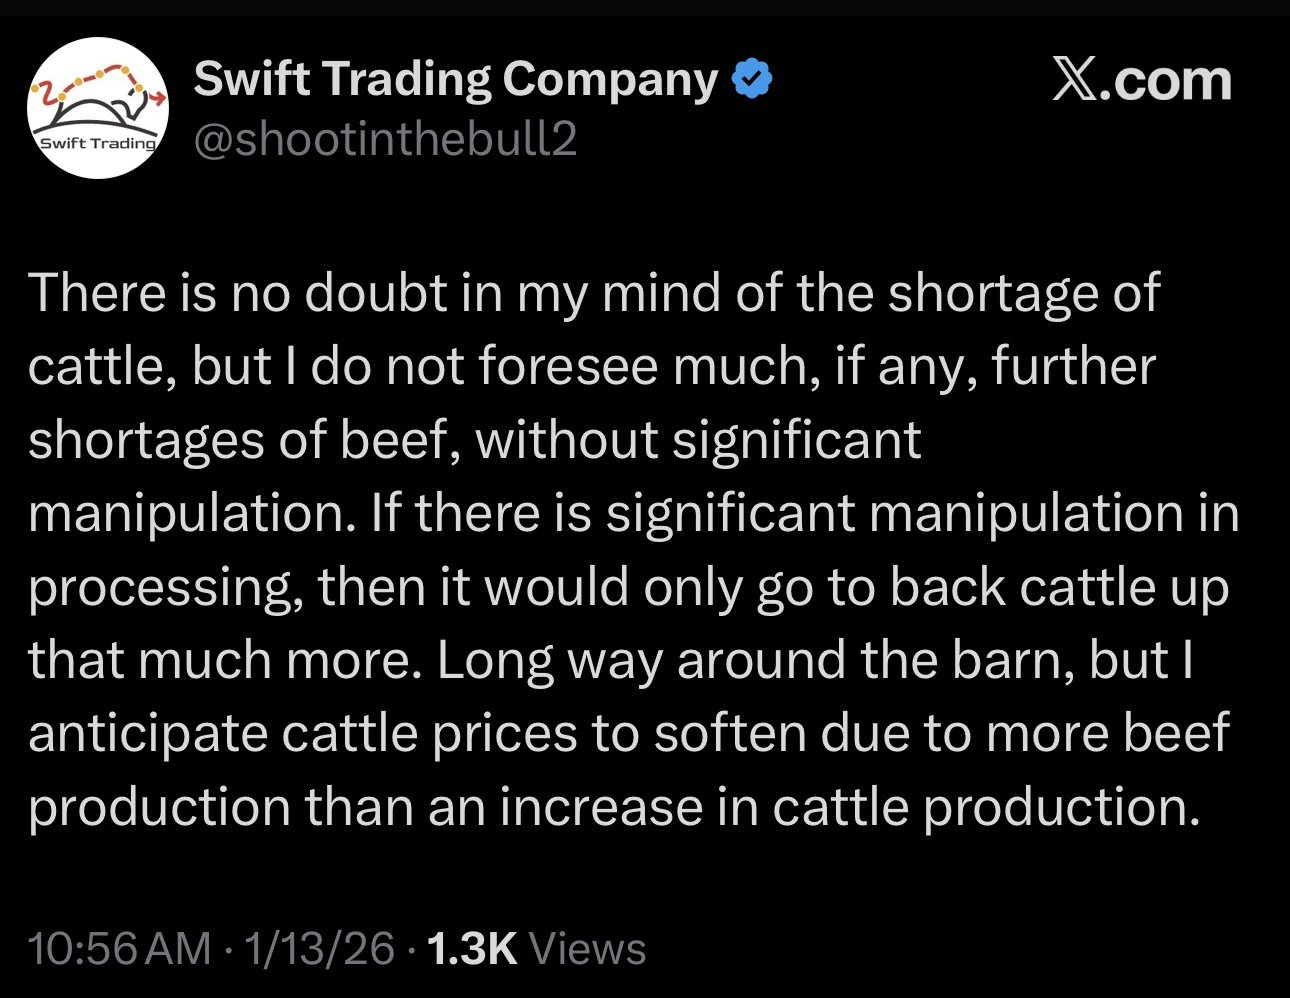
They make a good argument.
They argue that yes cattle supply is tight, but that doesn’t automatically mean beef gets tighter from here.
They are basically saying that cattle can be tight while beef production still holds up because carcass weights can increase, and slaughter pace can stay strong. You can end up with more beef showing up, even without more cattle showing up.
Cheap corn and a high cattle market will also incentivize heavier carcass weights. That is a metric we need to continue to monitor here.
So if beef production stays steady and demand isn’t growing, then you could argue cattle prices might need to soften because the beef pipeline isn’t getting tighter.
Overall, the cattle market clearly remains bullish with the big picture tight supply story.
But I am still using caution up here as some areas of demand aren’t showing a lot of room for further upside. Such as weak cut out.
The wholesale side of things are also showing some signs of weakness. For example, rib primal value is -26% lower than a month ago. Which feels important because when the wholesale side gets weak, it can often be a sign that demand is getting tapped out at these levels.
There is talk about a dairy buy out program in attempts to get ground beef prices lower. But from what I've heard, it doesn’t sound like it will be happening. The trade hasn’t seemed to care about it either.
Technicals:
March Feeders
We are now above the 78.6% level of the entire sell off.
So from a technical standpoint, the next point of interest is that last gap and those highs.
We are showing some bearish divergence on the RSI. Just a reason to have some caution as well. Prices made new highs, the RSI did not.
Overall, we still like defending these levels in some sort of matter if you have not yet done so. It's hard to call a top in a bull market.
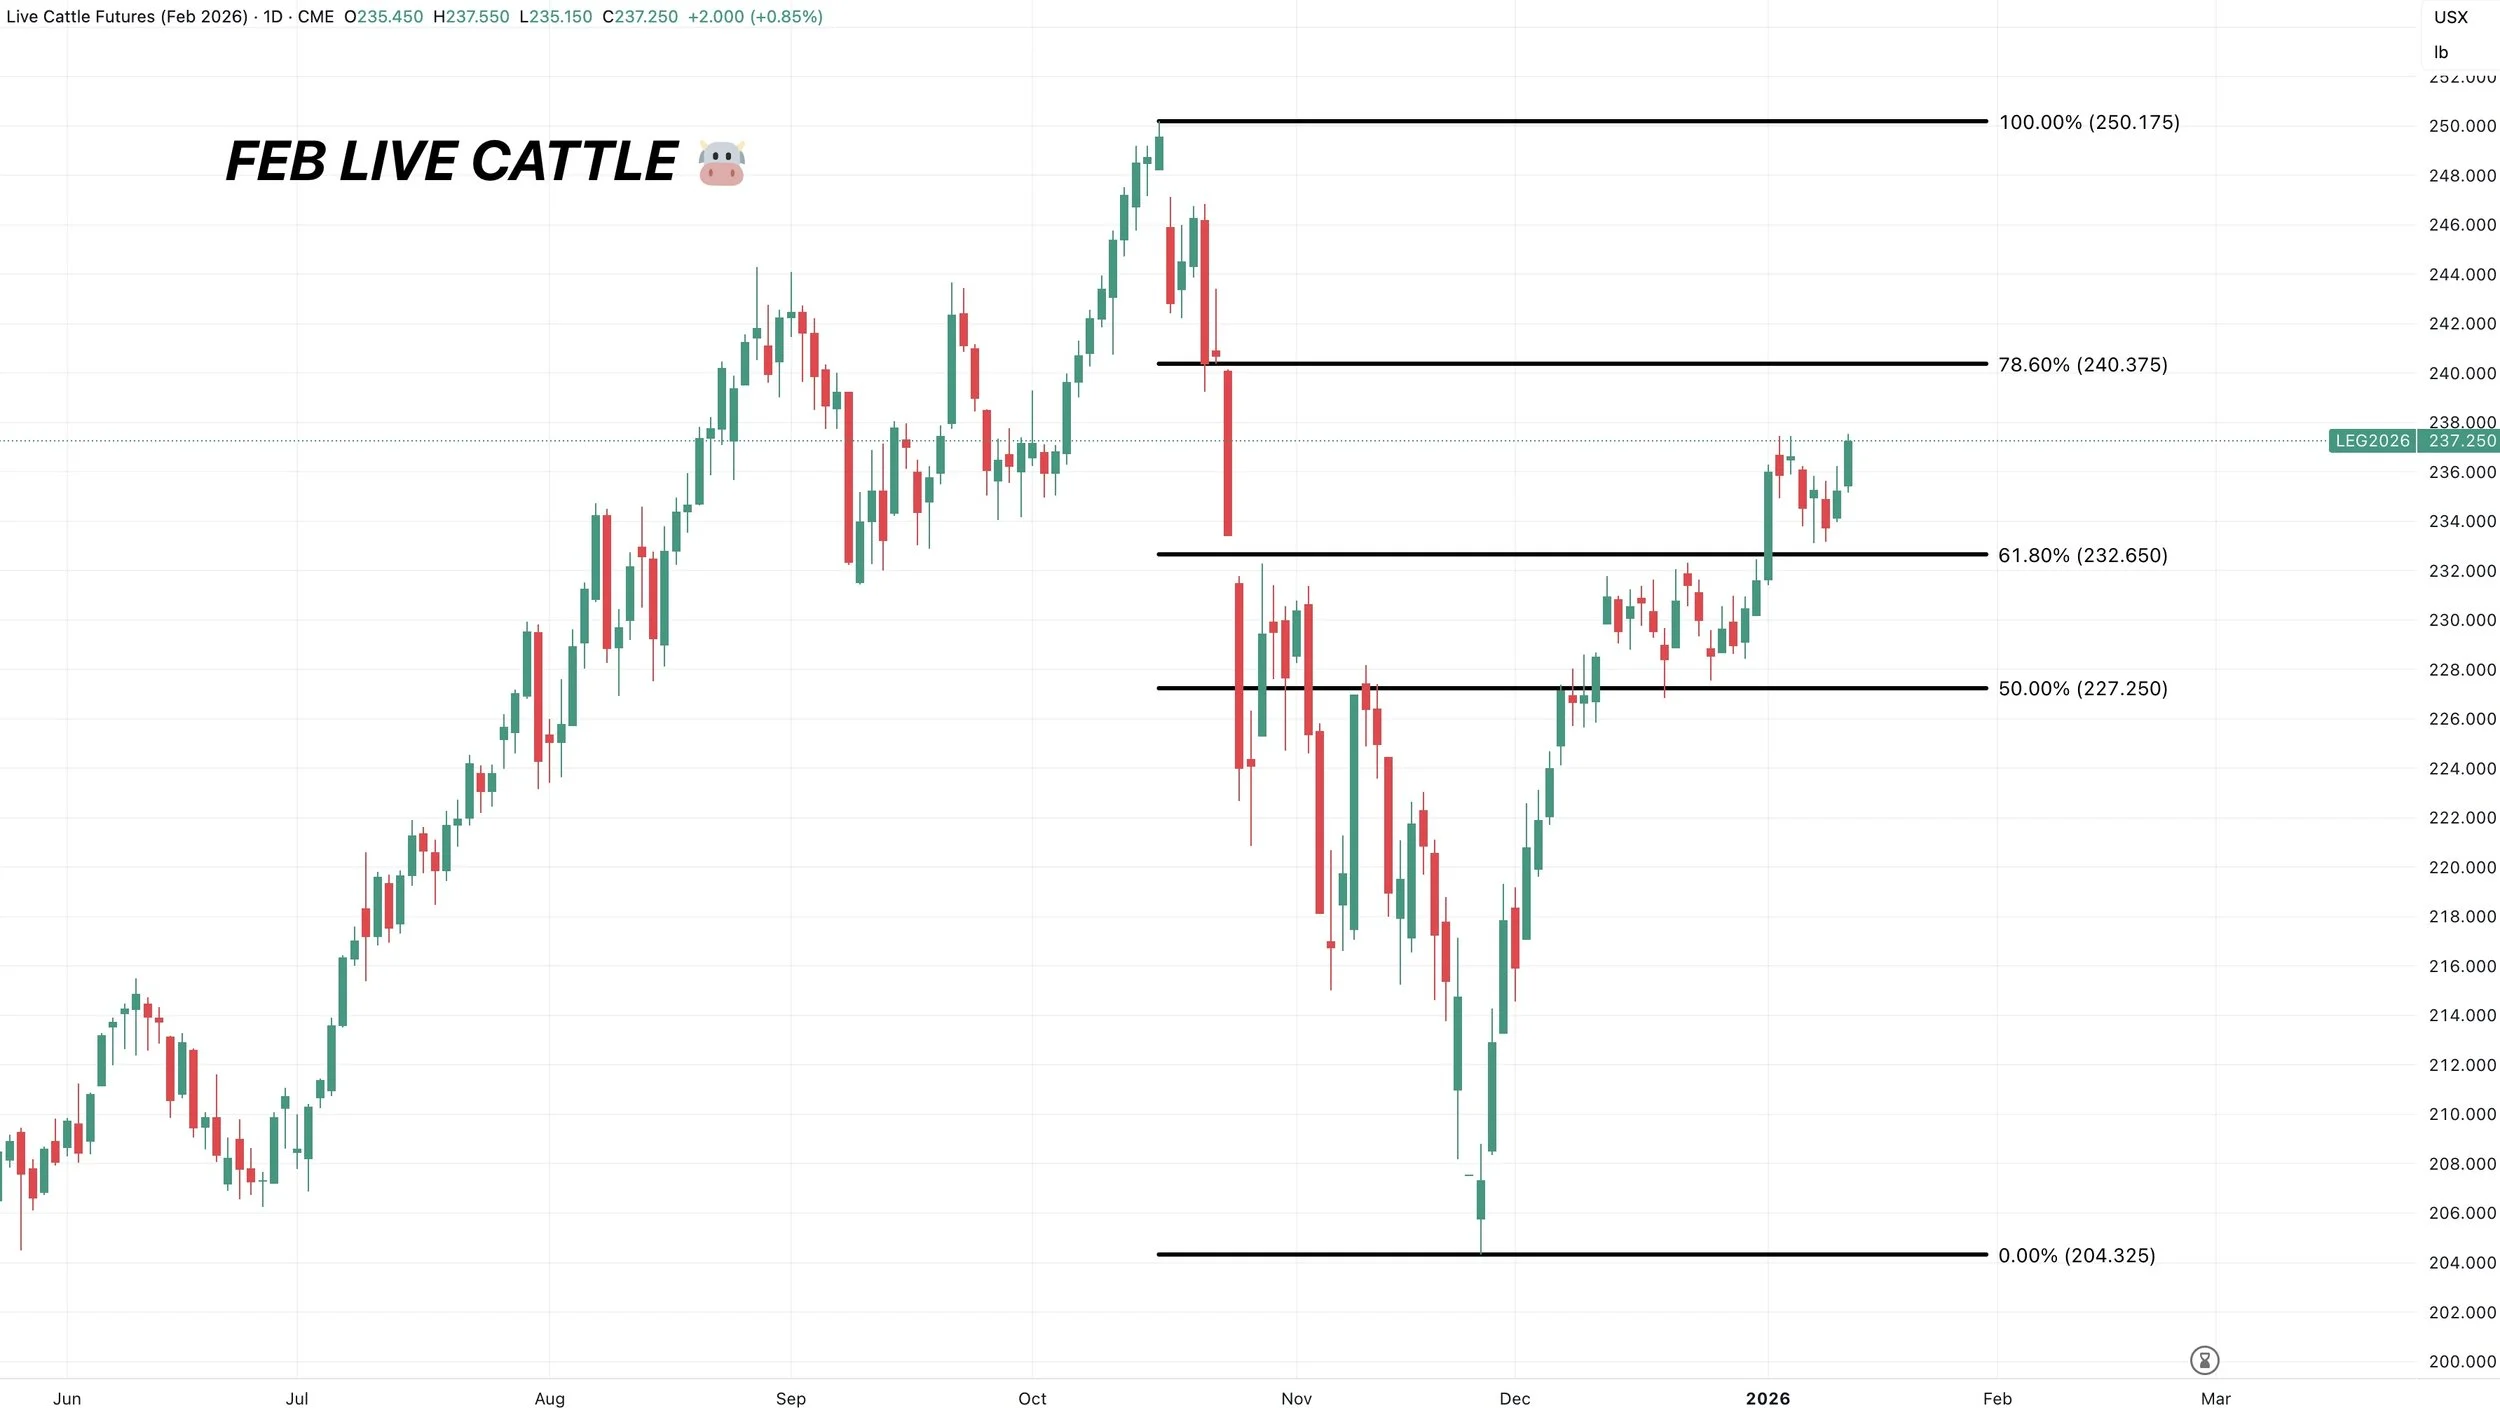
Feb Live
Next point of interest is the 78.6% level just over 240.
Past Sell or Protection Signals
Dec 11th: 🐮
Cattle sell signal & hedge alert.
Dec 5th: 🐮
Cattle sell signal & hedge alert.
Nov 17th: 🌱
Soybean sell signal & hedge alert.
Nov 13th: 🌽 🌱
Managing risk in corn & beans ahead of USDA report.
Oct 28th: 🌽
Corn sell signal & hedge alert.
Oct 27th: 🌱
Soybean sell signal & hedge alert.
Oct 13th: 🐮
Cattle sell signal & hedge alert.
Aug 22nd: 🌱
Soybean sell signal & hedge alert.
July 31st: 🐮
Cattle sell signal & hedge alert.
July 10th: 🐮
Cattle sell signal & hedge alert.
CLICK HERE TO VIEW
June 5th: 🐮
Cattle sell signal & hedge alert.
June 2nd: 🌾
MPLS wheat sell signal.
April 10th: 🌽
Old crop corn sell signal.
March 19th: 🐮
Cattle hedge & sell signal.
Feb 18th: 🌽 🌾
Old crop KC wheat & old crop corn signal.
Jan 23rd: 🌽 🌱
Corn & beans old crop sell signal.
CLICK HERE TO VIEW
Jan 15th: 🌽 🌱
Corn & beans hedge alert/sell signal.
Jan 2nd: 🐮
Cattle hedge alert at new all-time highs & target.
Dec 11th: 🌽
Corn sell signal at $4.51 200-day MA
CLICK HERE TO VIEW
Oct 2nd: 🌾
Wheat sell signal at $6.12 target
Sep 30th: 🌽
Corn protection signal at $4.23-26
Sep 27th: 🌱
Soybean sell & protection signal at $10.65
Sep 13th: 🌾
Wheat sell signal at $5.98
May 22nd: 🌾
Wheat sell signal when wheat traded +$7.00
Want to Talk?
Our phones are open 24/7 for you guys if you ever need anything or want to discuss your operation.
Hedge Account
Interested in a hedge account? Use the link below to set up an account or shoot Jeremey a call at (605)295-3100.
HISTORY OF JAN USDA
MARKET UPDATE
You can scroll to read the usual update as well. As the written version is the exact same as the video.
Timestamps for video:
Overview: 0:00min
Jan USDA: 2:20min
Corn: 4:40min
Beans: 10:00min
Wheat: 12:45min
Cattle: 13:50min
Want to talk about your situation?
(605)250-3863
Your free trial has ended
Here is extended access to our holiday sale
Don’t miss future updates or signals
Futures Prices Close
Overview
Grains mixed while cattle led the way higher.
The markets are back out of holiday mode but overall we still lack a ton of fresh news. With all eyes set on next week's USDA report.
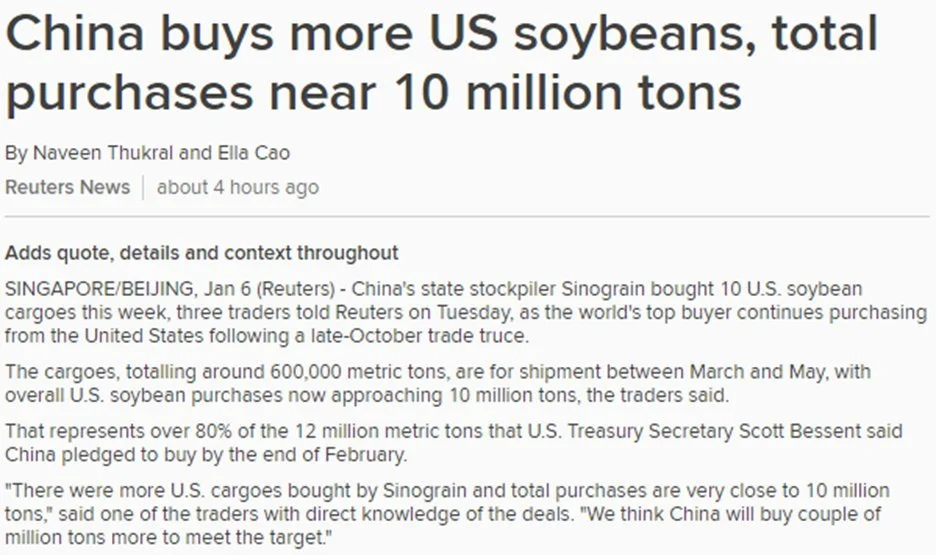
We did see China buy more US soybeans. With a 336k MT flash sale this morning.
They've officially bought around 7.2 MMT, which is 60% of the 12 MMT goal.
Chart from GrainStats
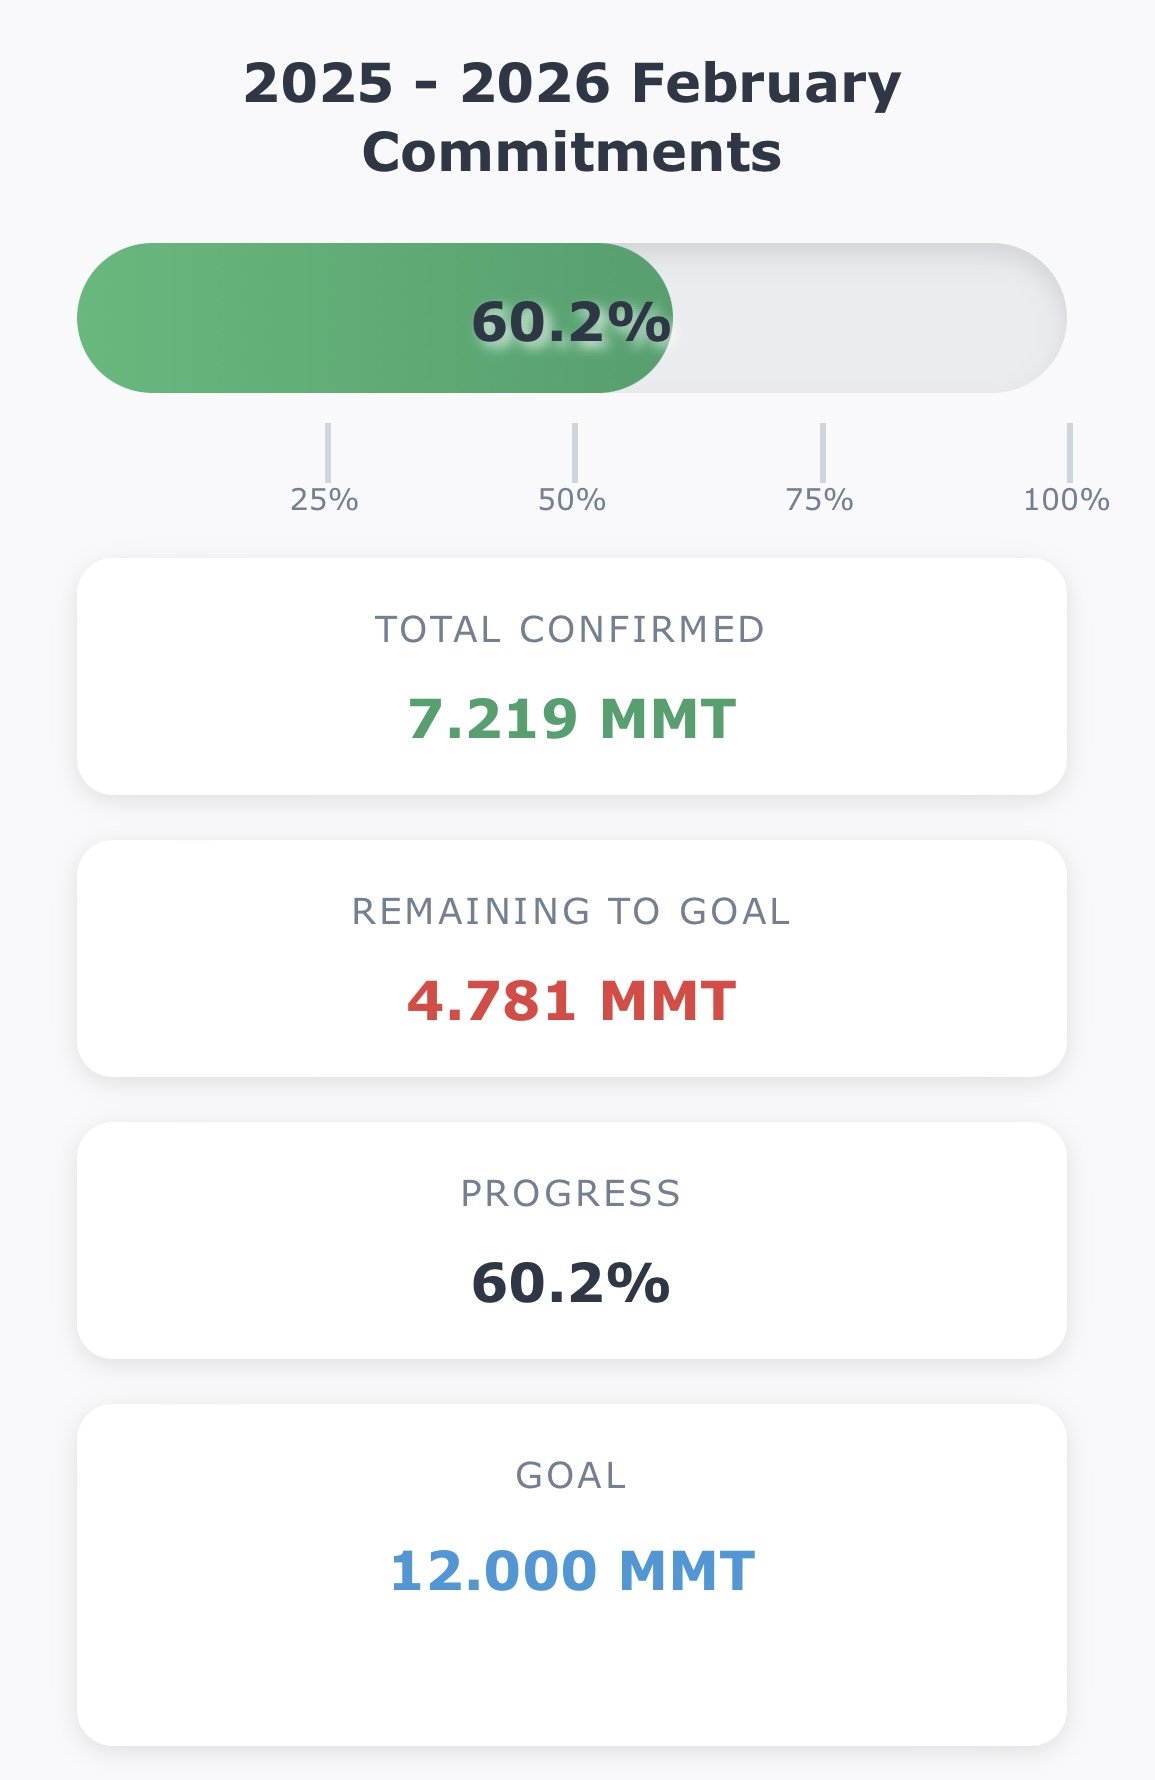
However, rumors speculate that they've actually bought closer to 10 MMT. Which would be 80% of the goal.
So it doesn’t look like it should be too hard to reach that goal by the end of February, which was Scott Bessents deadline.
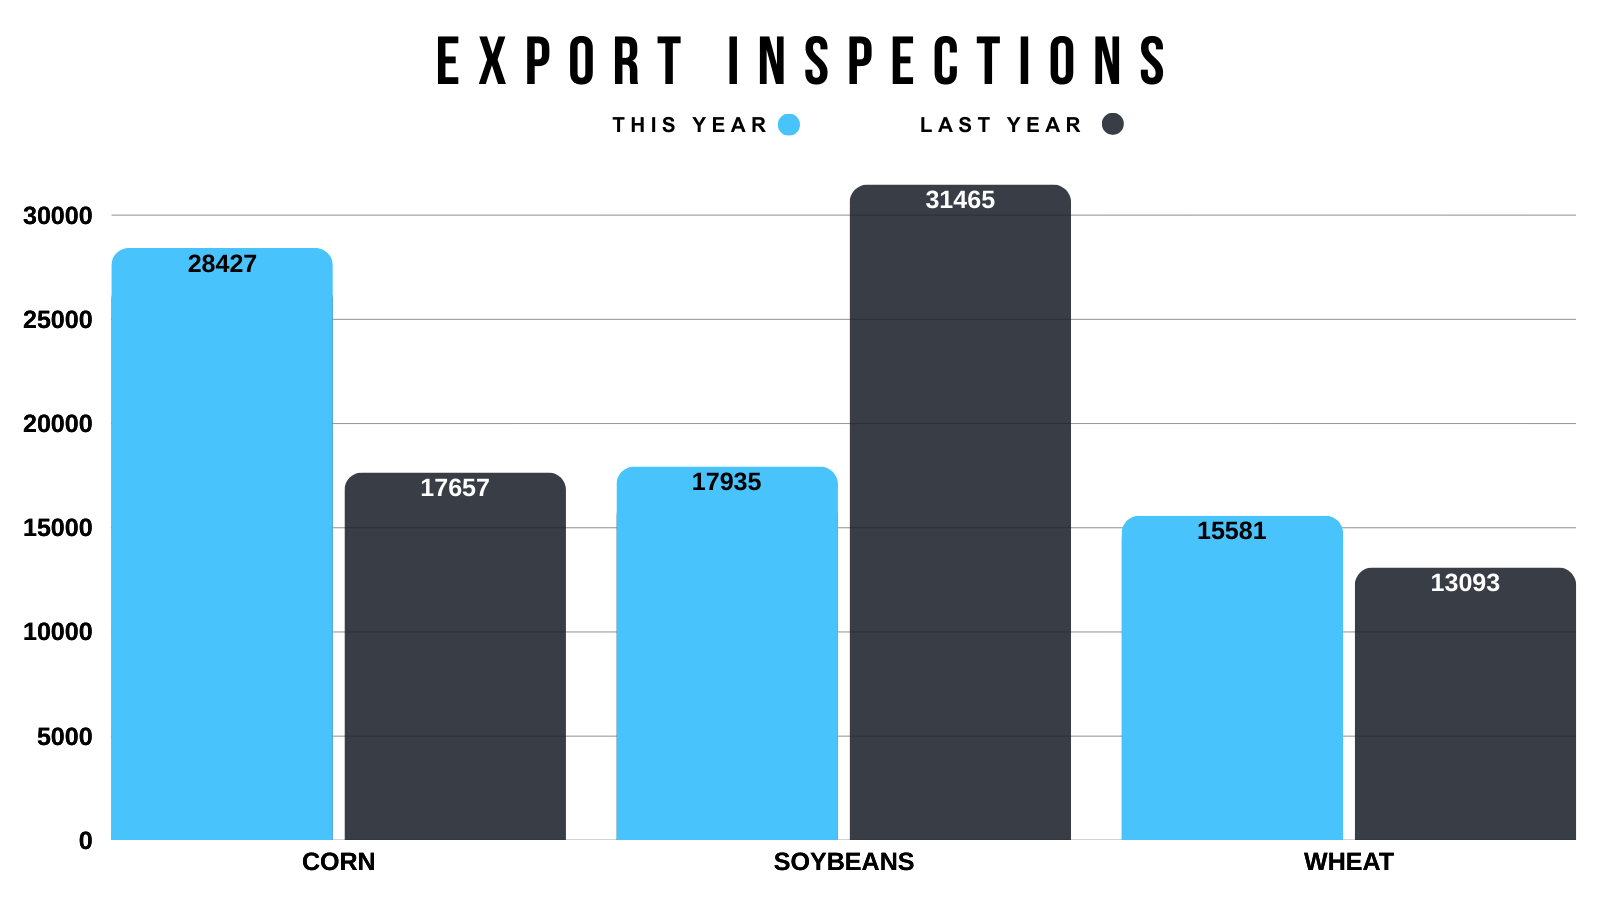
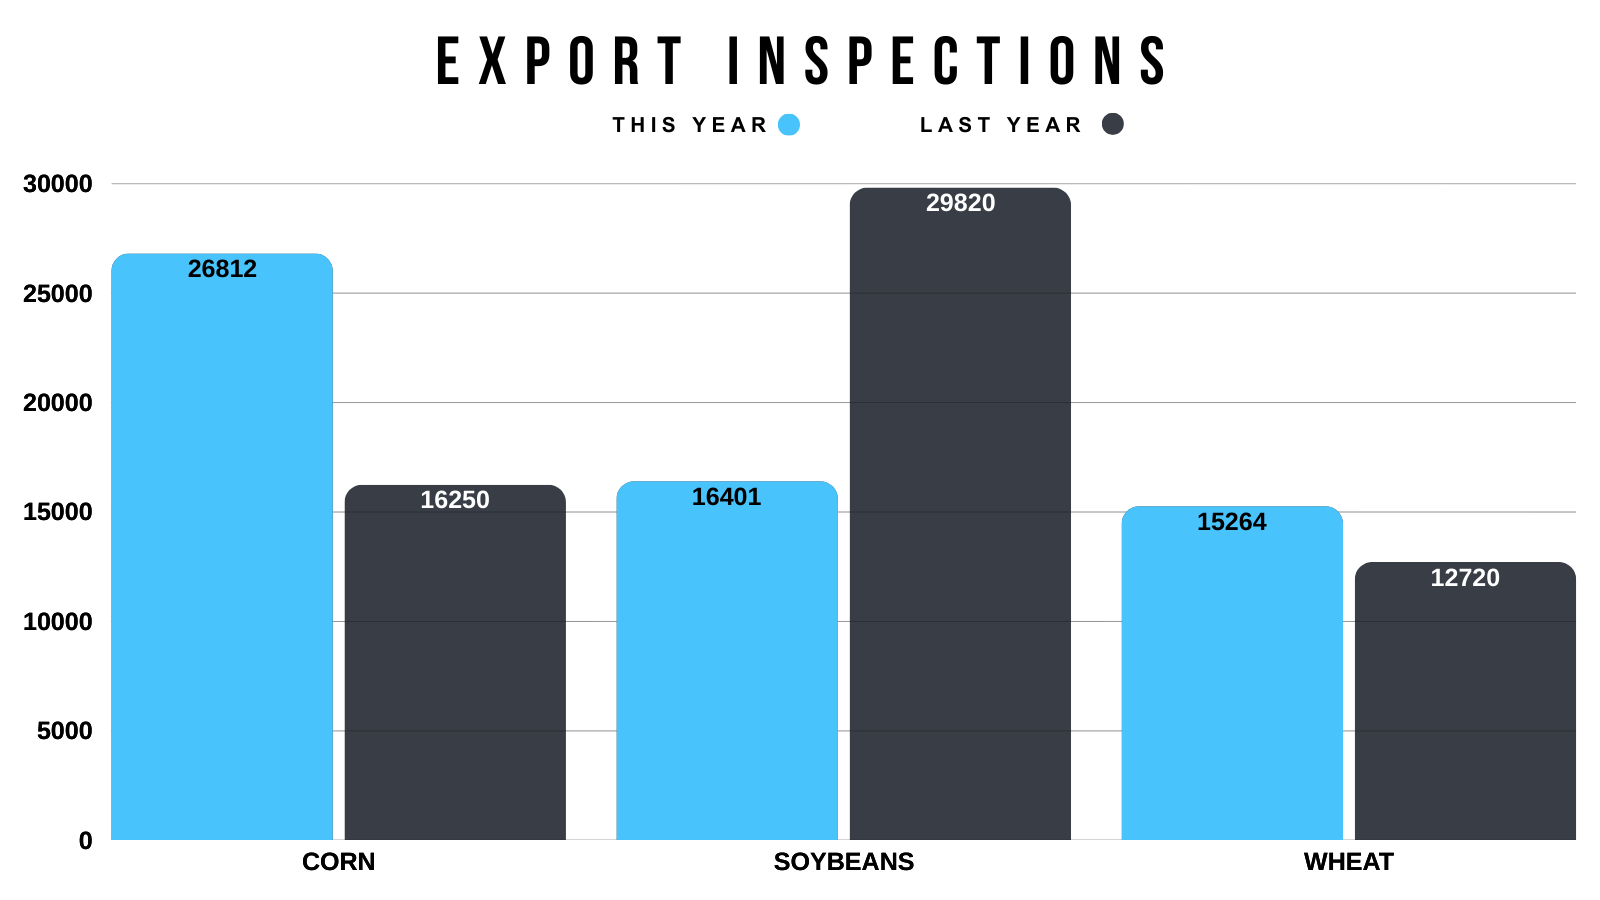
Export Inspections vs Last Year
This Year vs Last Year
Corn: +65%
Beans: -45%
Wheat: +20%
Corn demand remains phenomenonal.
Soybean demand continues to be some of the weakest on record.
Wheat demand continues to impress.
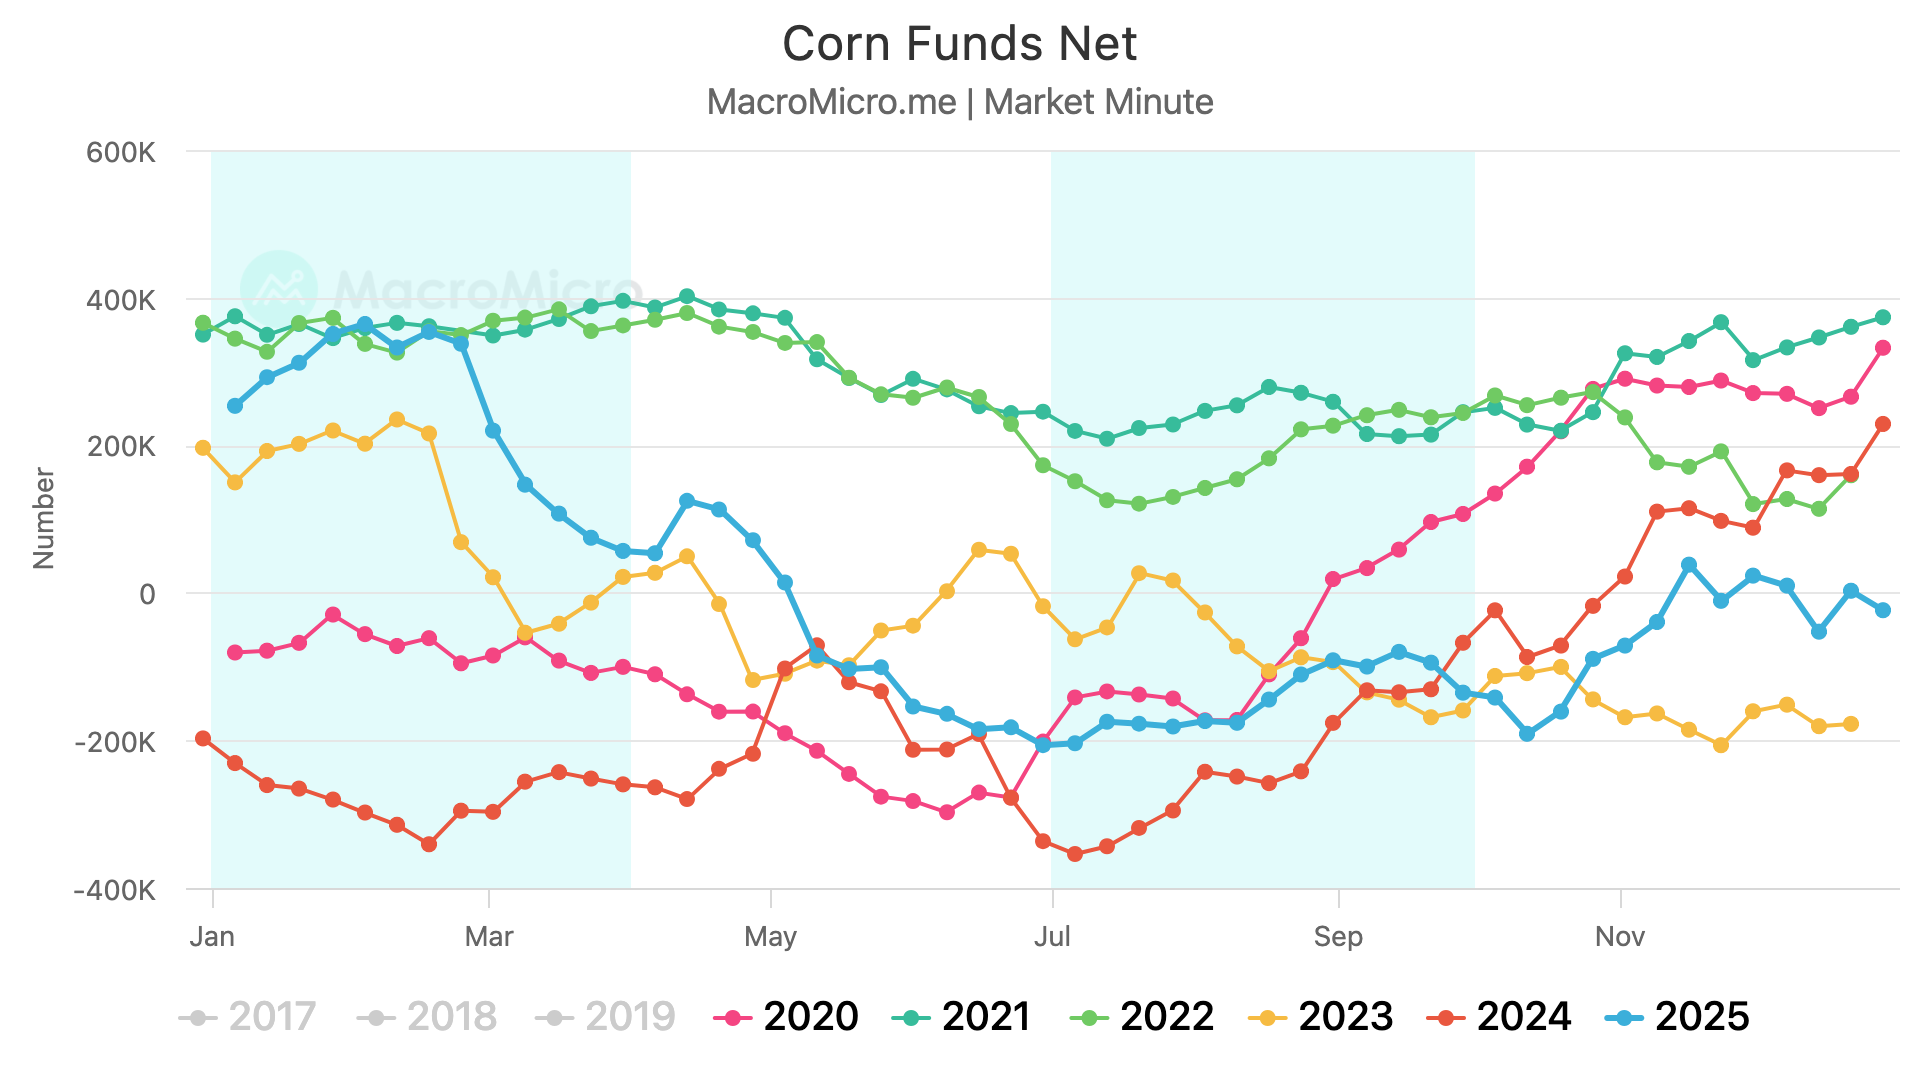
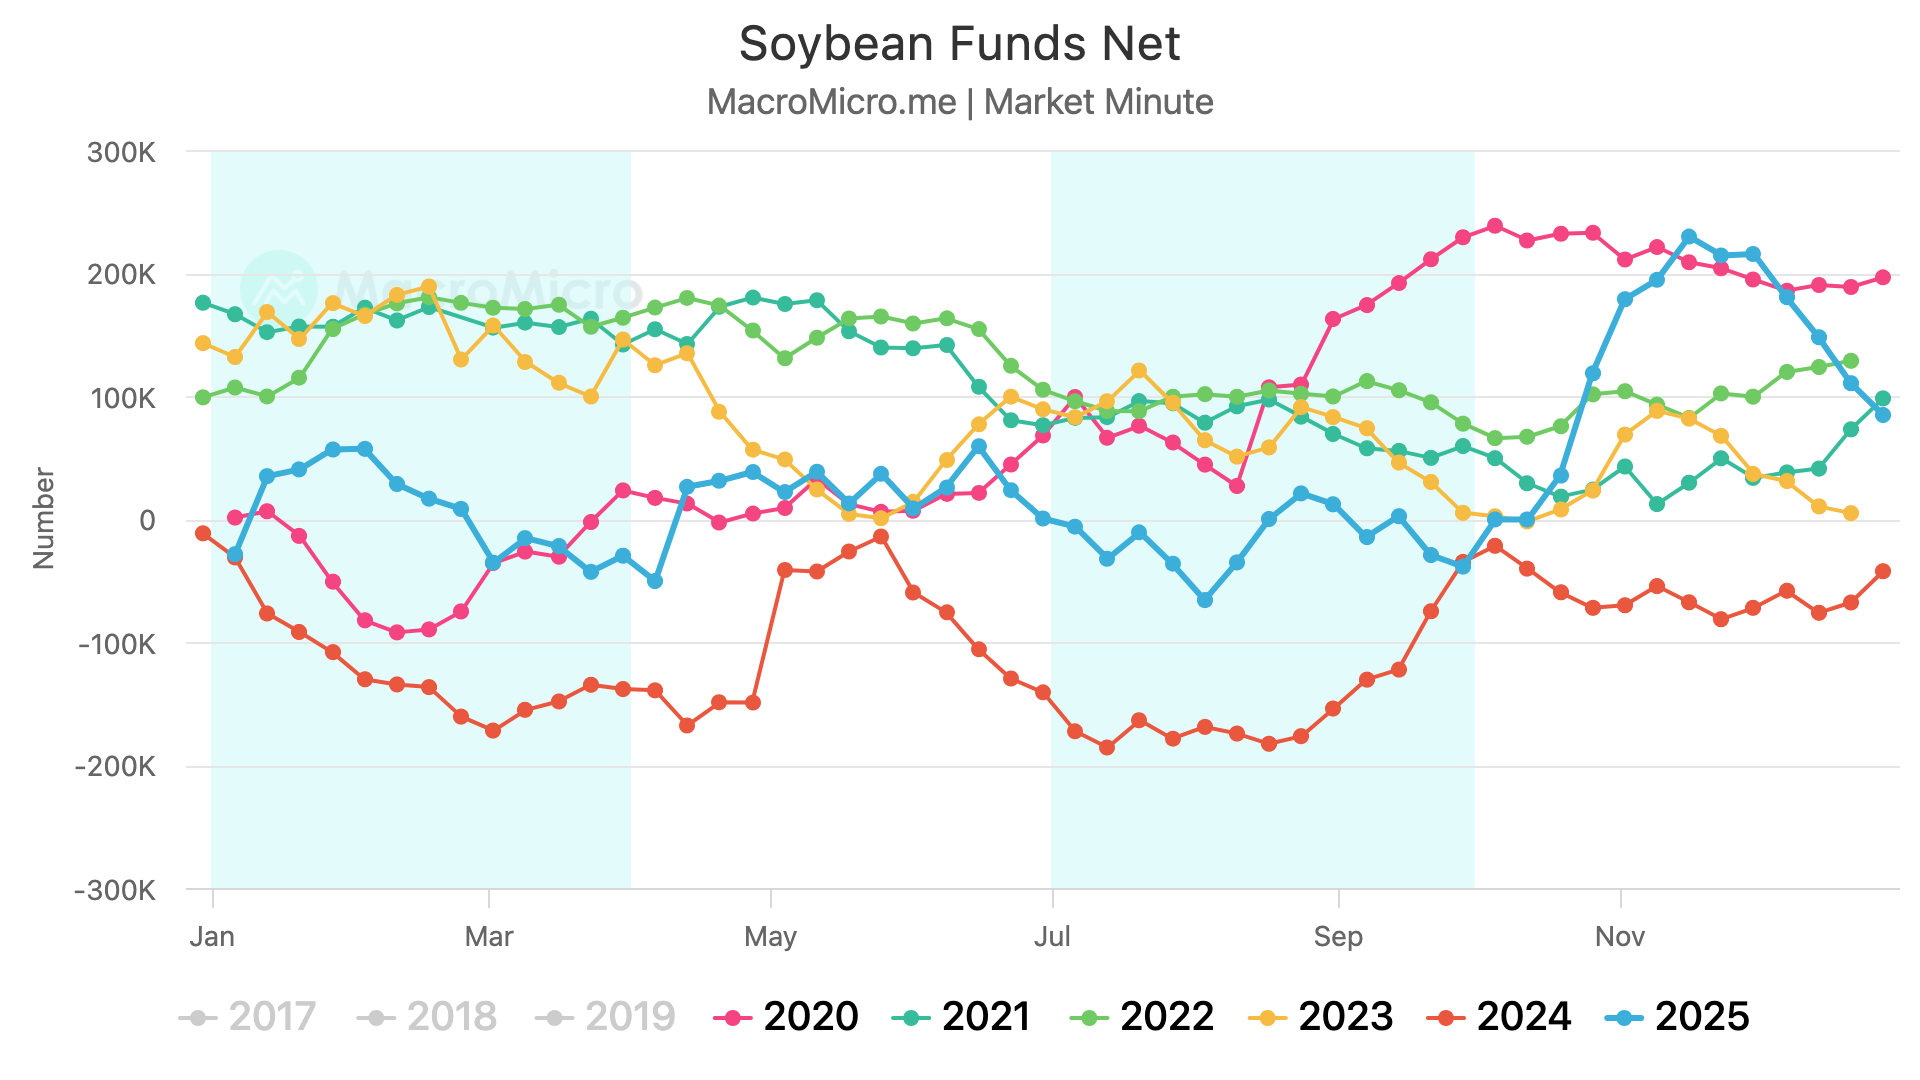
The Funds
We are finally getting caught up on all of the delayed data from the government shut down.
The funds positioning is fully up to date now.
Their positions:
Corn: -23k
Soybeans: 85k
SRW Wheat: -95k
Live Cattle: 93k
Here are the visuals.
Corn funds are essentially neutral as they haven’t done much for the last two months. Hence why prices have also traded sideways for the last two months.
For soybeans, the funds were near record long back in November.
Long 230k contracts.
They've clearly given back a big chunk of that length, but are still long 85k contracts. So they haven’t entirely given up that position.
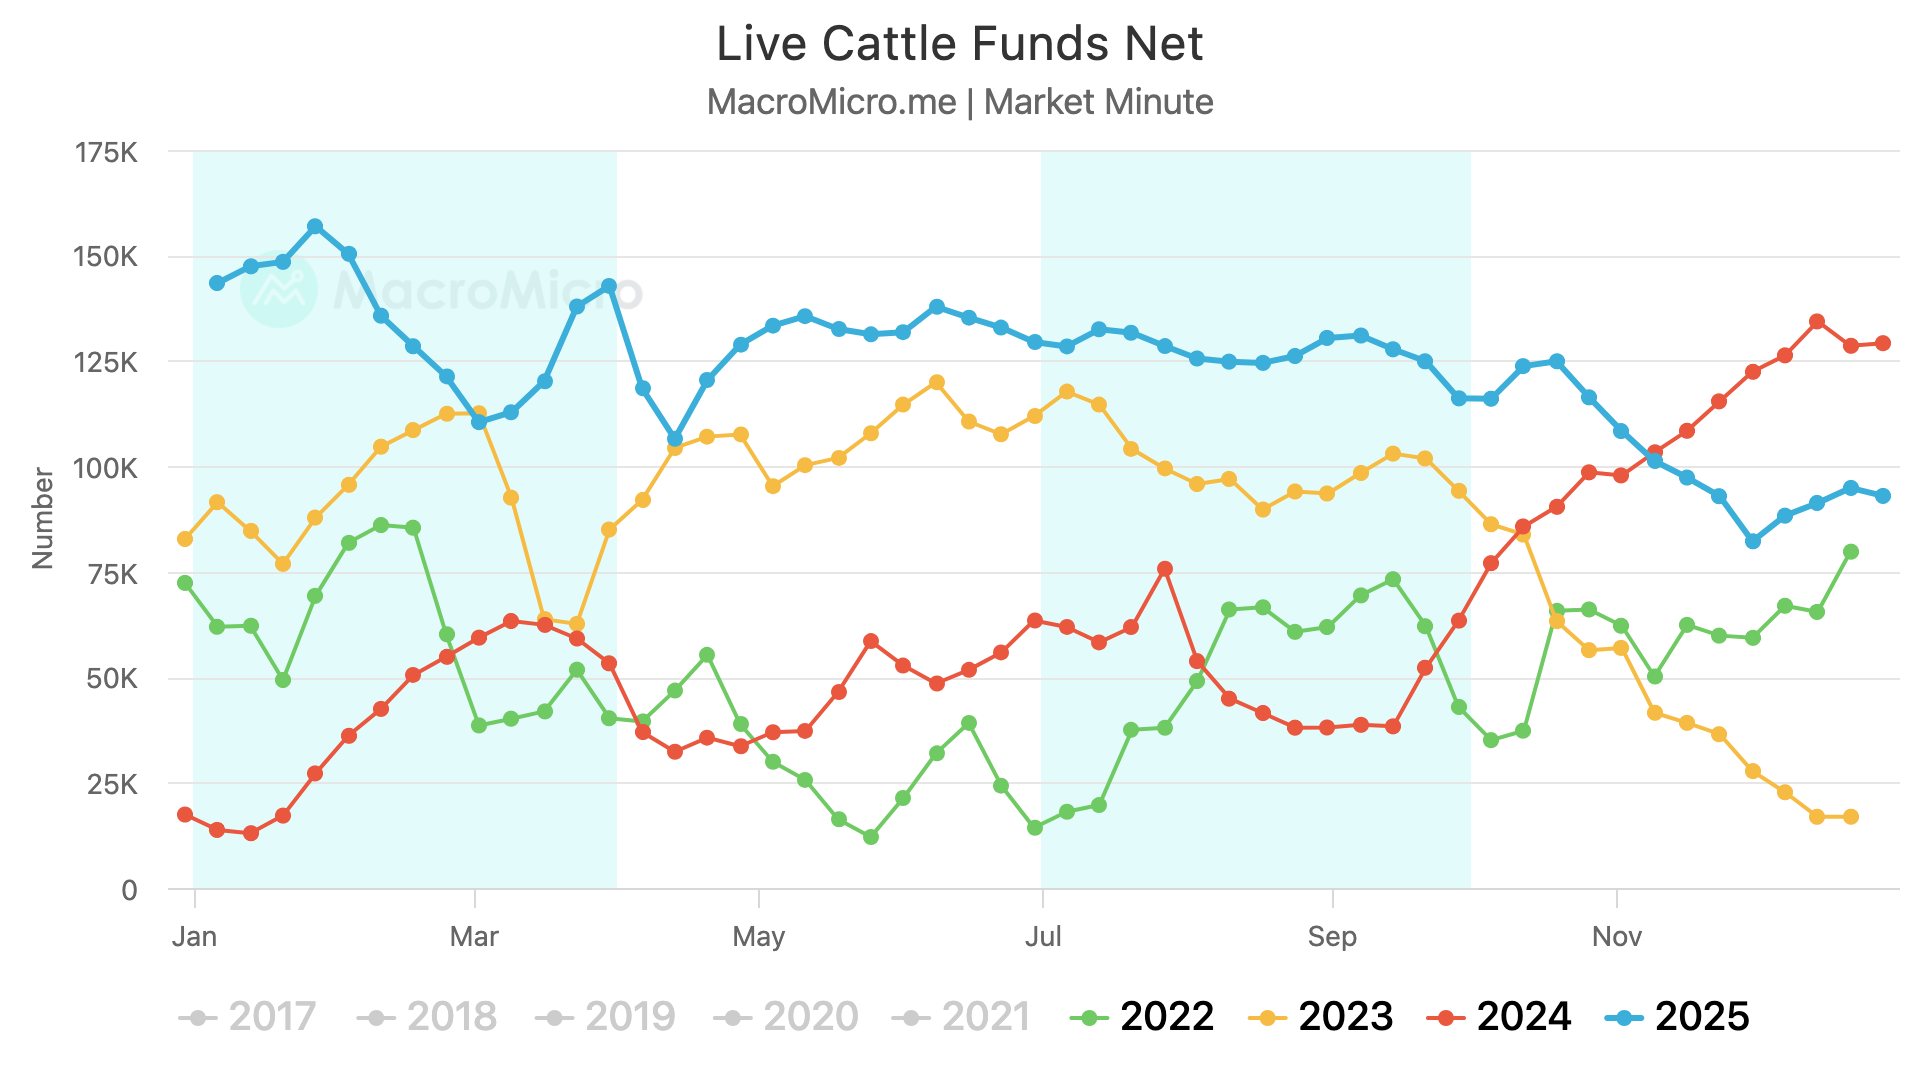
In live cattle, the funds still hold a large position historically speaking.
But isn’t close to the length we saw earlier this year.
The funds are actually holding a smaller position at the end of 2025 than they were at the end of 2024.
History of Jan USDA
This report is always one of the biggest of the year.
It can set the tone for a few months and ultimately has the potential to be a game-changer in either direction.
Let's dive into what this report has provided in the past.
First for corn.
Corn has traded higher on this report the last 8 of 12 years.
Interestingly enough, in 3 of those 4 losses we only traded lower by around 2 cents.
There is only one time in recent memory where we truly had a negative reaction. Which was 2024.
More often than not, this report doesn’t tend to be overly bearish.
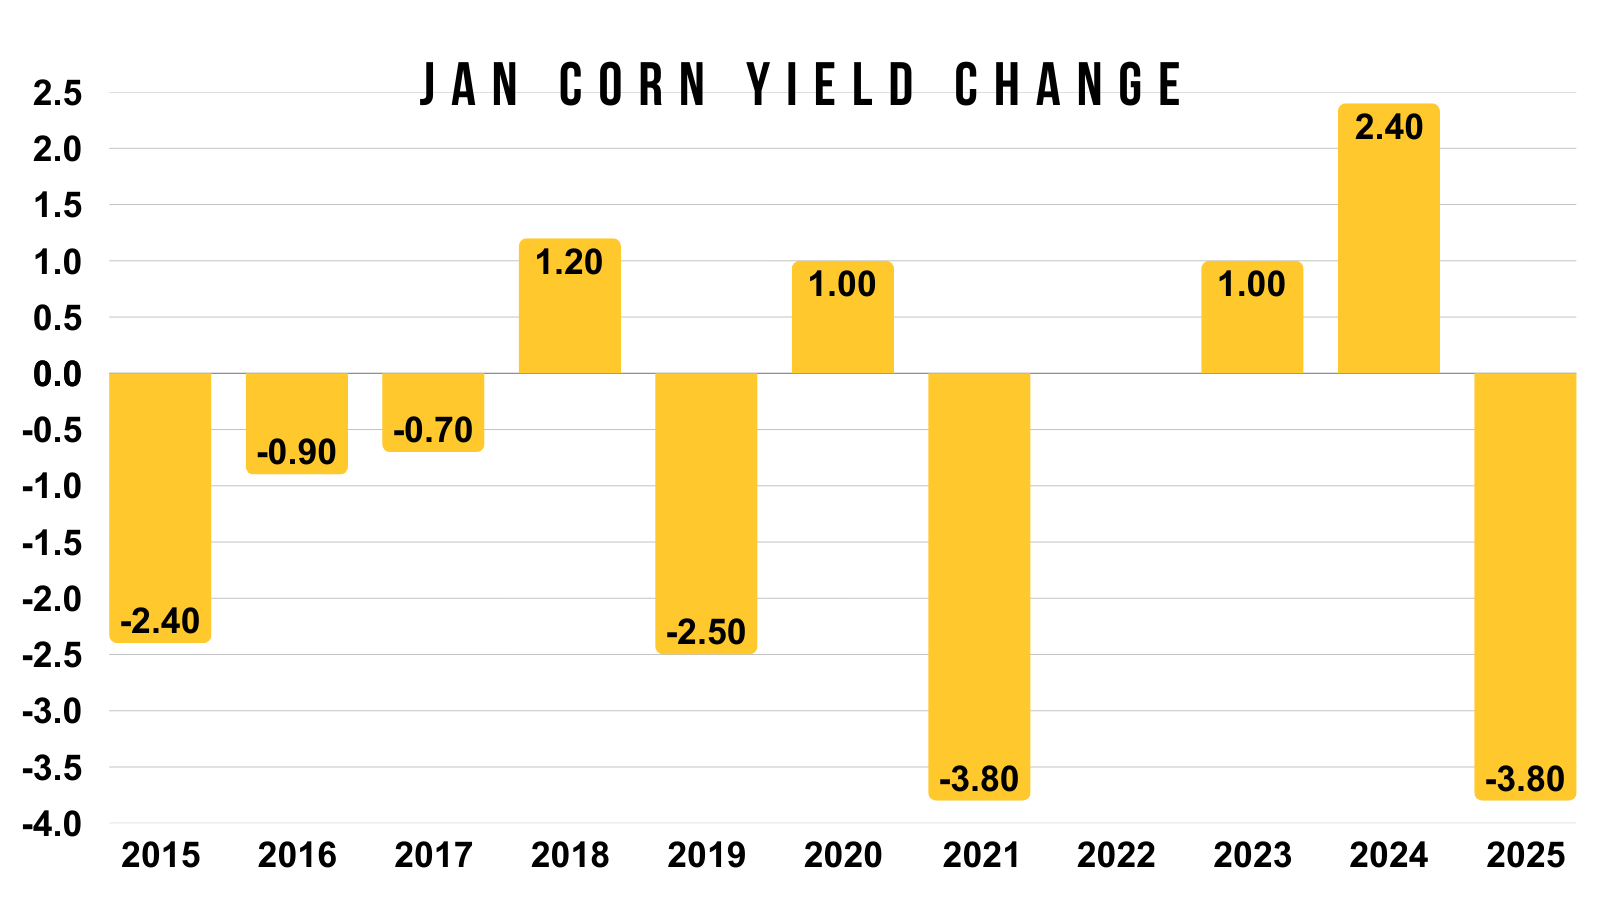
It doesn’t mean it has to be "bullish" like last year, but we rarely sell off the day of the report.

Yield tends to come down in this report.
I think everyone agrees yield should be dropping in this report.
The biggest drops we've seen in recent memory came last year along with Jan 2021.
Where yield dropped -3.80 bushels an acre.
The current yield estimate is 186. So if we saw the same cut as last year, it would peg us at 182.2 bpa.
Meaning it would take the biggest drop we've ever seen to get yield below 182 in this report.
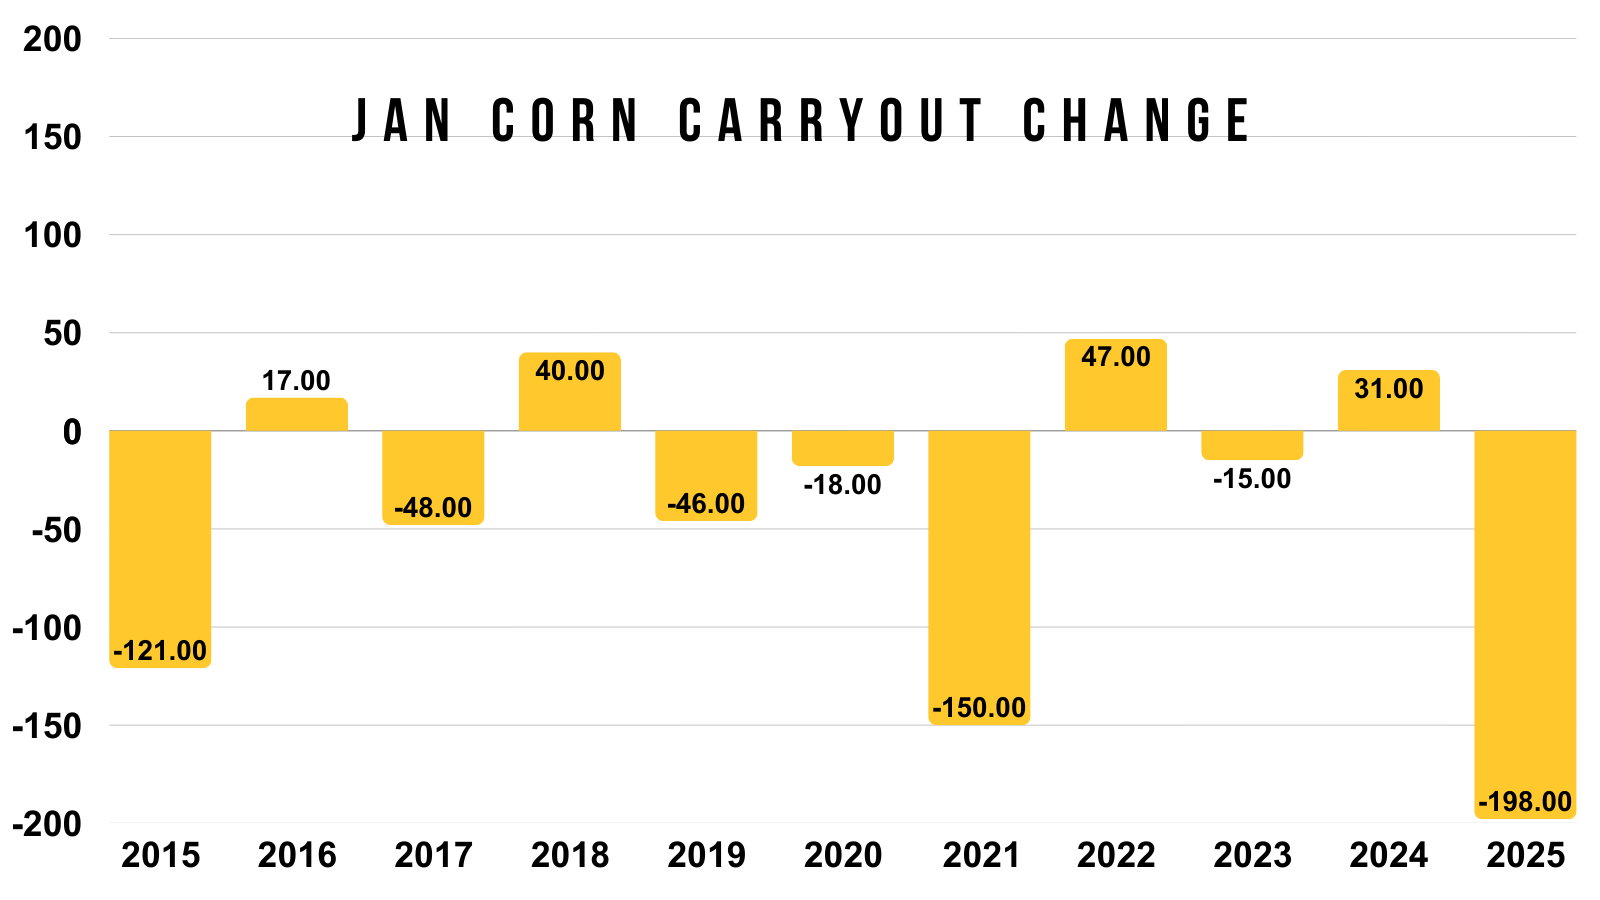
Lastly for carryout.
In at least the last decade, we've never seen carryout bumped by more than 50 million bushels.
However, we've only seen it drop by more than 100 million three times.
Last year was the largest we've seen.
Again, this report doesn’t tend to be overly bearish, even if it doesn’t wind up being mega bullish like in 2021 or last year.
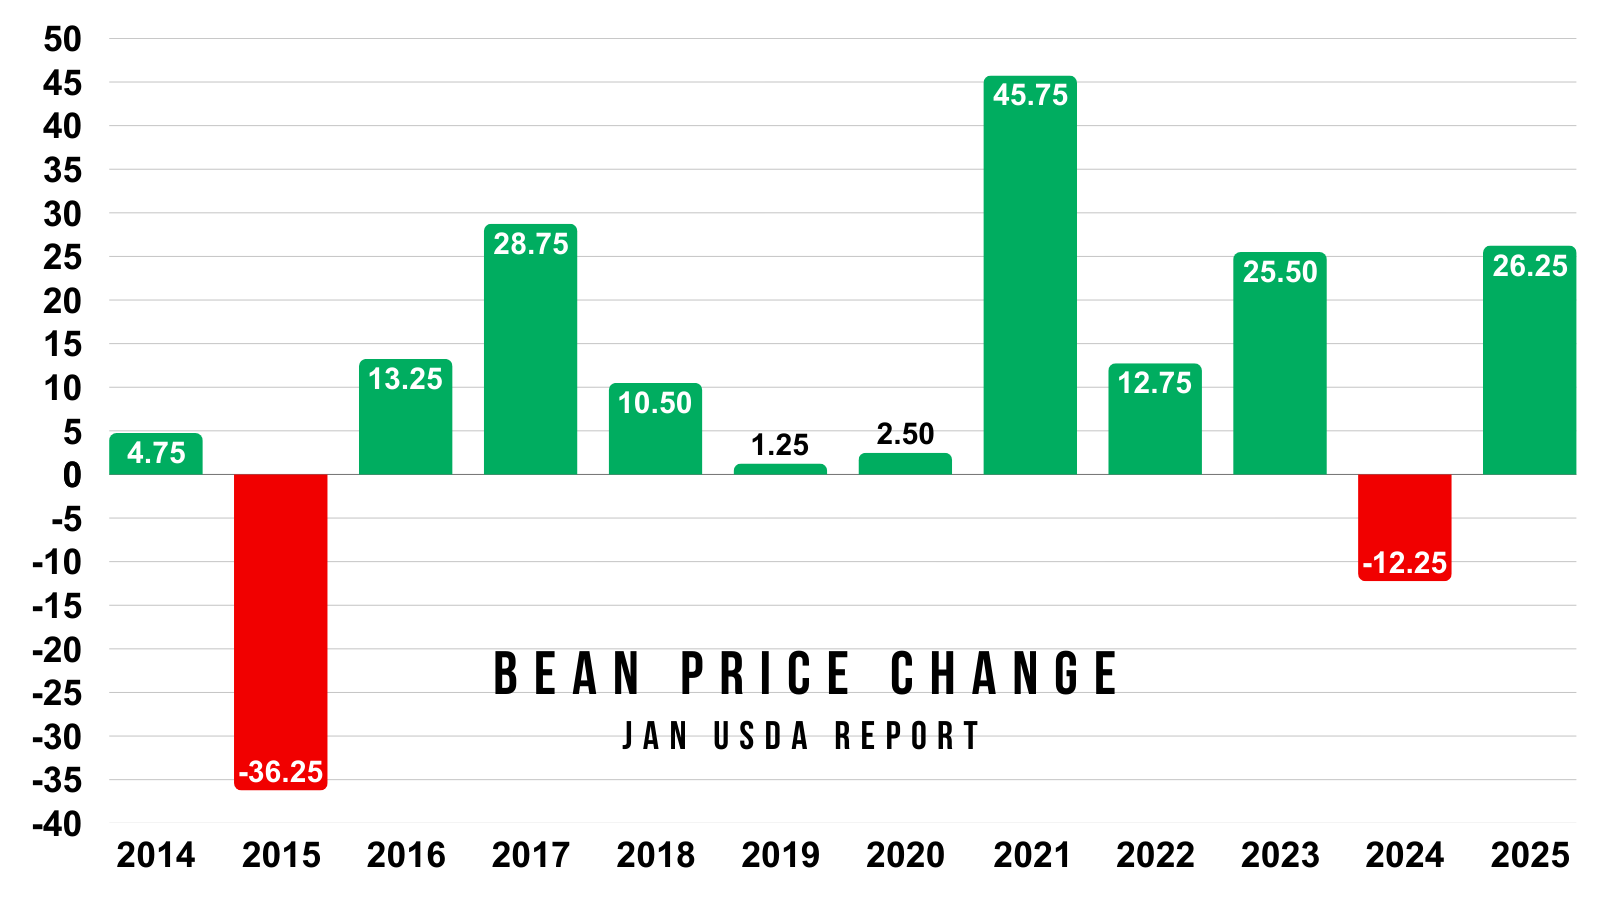
Next for soybeans.
The price action provides some interesting data.
Soybeans have only traded lower on the day of this report twice in the last 12 years.
So the data says this report does tend to be friendly.
Yield also tends to come down in soybeans.
But last year was the only year in the last decade where yield fell by a full 1 bushel an acre.
With the current estimate of 53 bpa.
That means to get a yield below 52, it would take one of the largest cuts we've seen.
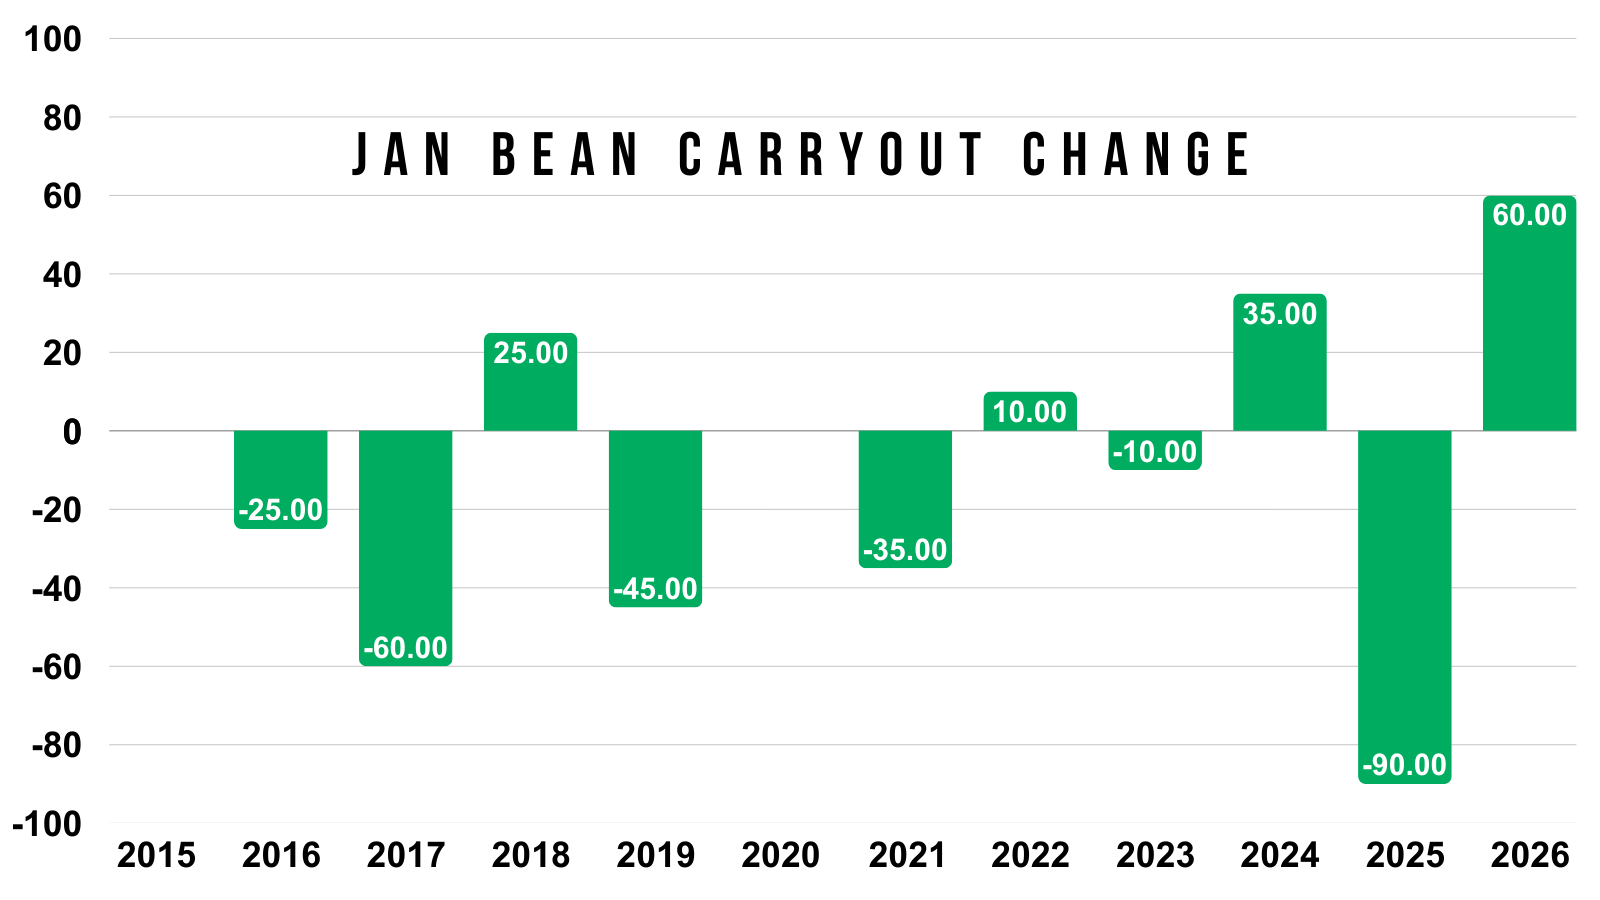
Lastly here is the carryout changes.
Last year provided one of the largest drops ever. As it dropped -90 million.
Today's Main Takeaways
Corn
Fundamentals:
Demand is still amazing. The sole reason you can’t get overly bearish on corn.
However, we still have an ample amount of supply and a carryout of 2 billion bushels.
Both of these have led to corn trading virtually sideways for a few months. Every break has been bought. Every rally has stalled.
I think corn has upside potential from here.
That record supply and large carryout has already been priced in, meanwhile we have record demand continuing to prevent this market from falling apart.
Just a reminder, corn has traded higher 8 of the last 10 years during the month of January.
Higher the last 4 of 5 years.
Higher the last 11 of 15 years.
Seasonally it's a friendly time period.
But what would it take to get corn beyond $5.00?
We have record supply, but clearly the corn story isn’t the most bearish it's ever been. Because we also have record demand.
Stocks to use ratio is the best way to determine the supply and demand story.
It tells us how much supply is left over after demand.
This chart shows our stocks to use (in yellow).
Along with the highest corn prices each marketing year (in green).
I drew line at a 10% stocks to use ratio as well as $5.00
Based on this chart, you can see that normally, to get corn much above that line of $5.00, the stocks to use ratio typically has to also drop below that line of 10%.
For example:
2010 to 2013 the stocks to use was below 10%. Prices were above $5.00
2014 to 2020 the stocks to use was above 10%. Prices were below $5.00
2021 to 2023 the stocks to use was below 10%. Prices were above $5.00
So if you want greater than $5.00 corn, you usually need a stocks to use ratio below 10%.
We currently have a stocks to use ratio of 12.5%.
Last year we ended at a 10.10% stocks to use with a high price of $5.04.
Here is the current balance sheet ahead of the USDA report.
We have:
186 yield
2.03 billion carryout
12.46% stocks to use
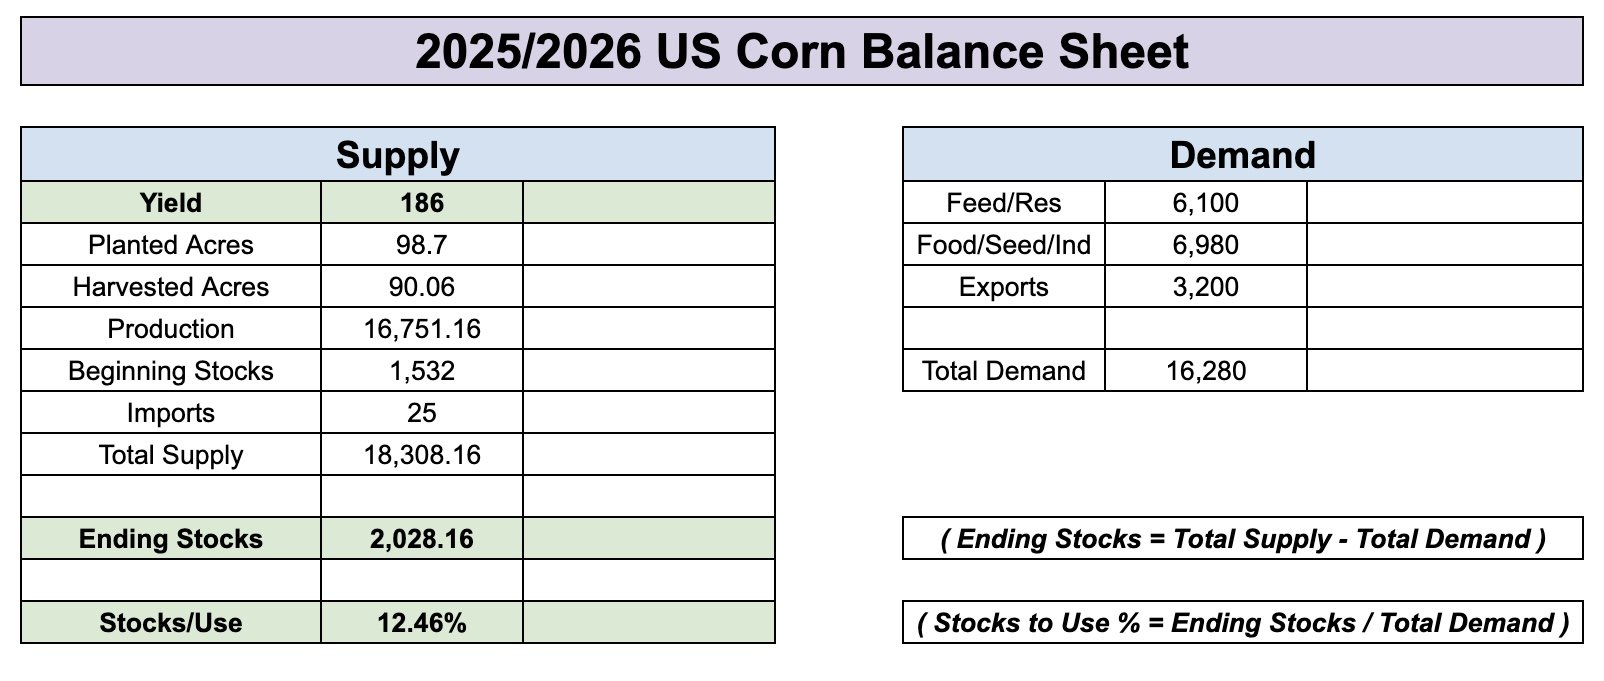
I've shown this example before.
But for this example, let's just say yield comes in at 182.
If you did NOT change any demand numbers at all.
This would drop our stocks to use ratio down to 10.25%.
HOWEVER, if the USDA drops yield, they will inevitably drop demand. To balance the balance sheet.
Most argue feed and residual demand is too high to begin with. While others argue our export demand is being understated.
Regardless, you can see that it is hard to paint a scenario where the corn balance sheet drops to near 10%.
As it would take a 182 yield with demand being left unchanged to do so.
Which is why I personally think corn's upside is limited beyond $5.00 for now.
Later in the year, a completely new story could emerge.
China could buy corn. We could run into a supply scare this summer, and ultimately go a lot higher.
I am not bearish corn, but unless one of those happens, it is an uphill battle to get a stock to use near 10%.
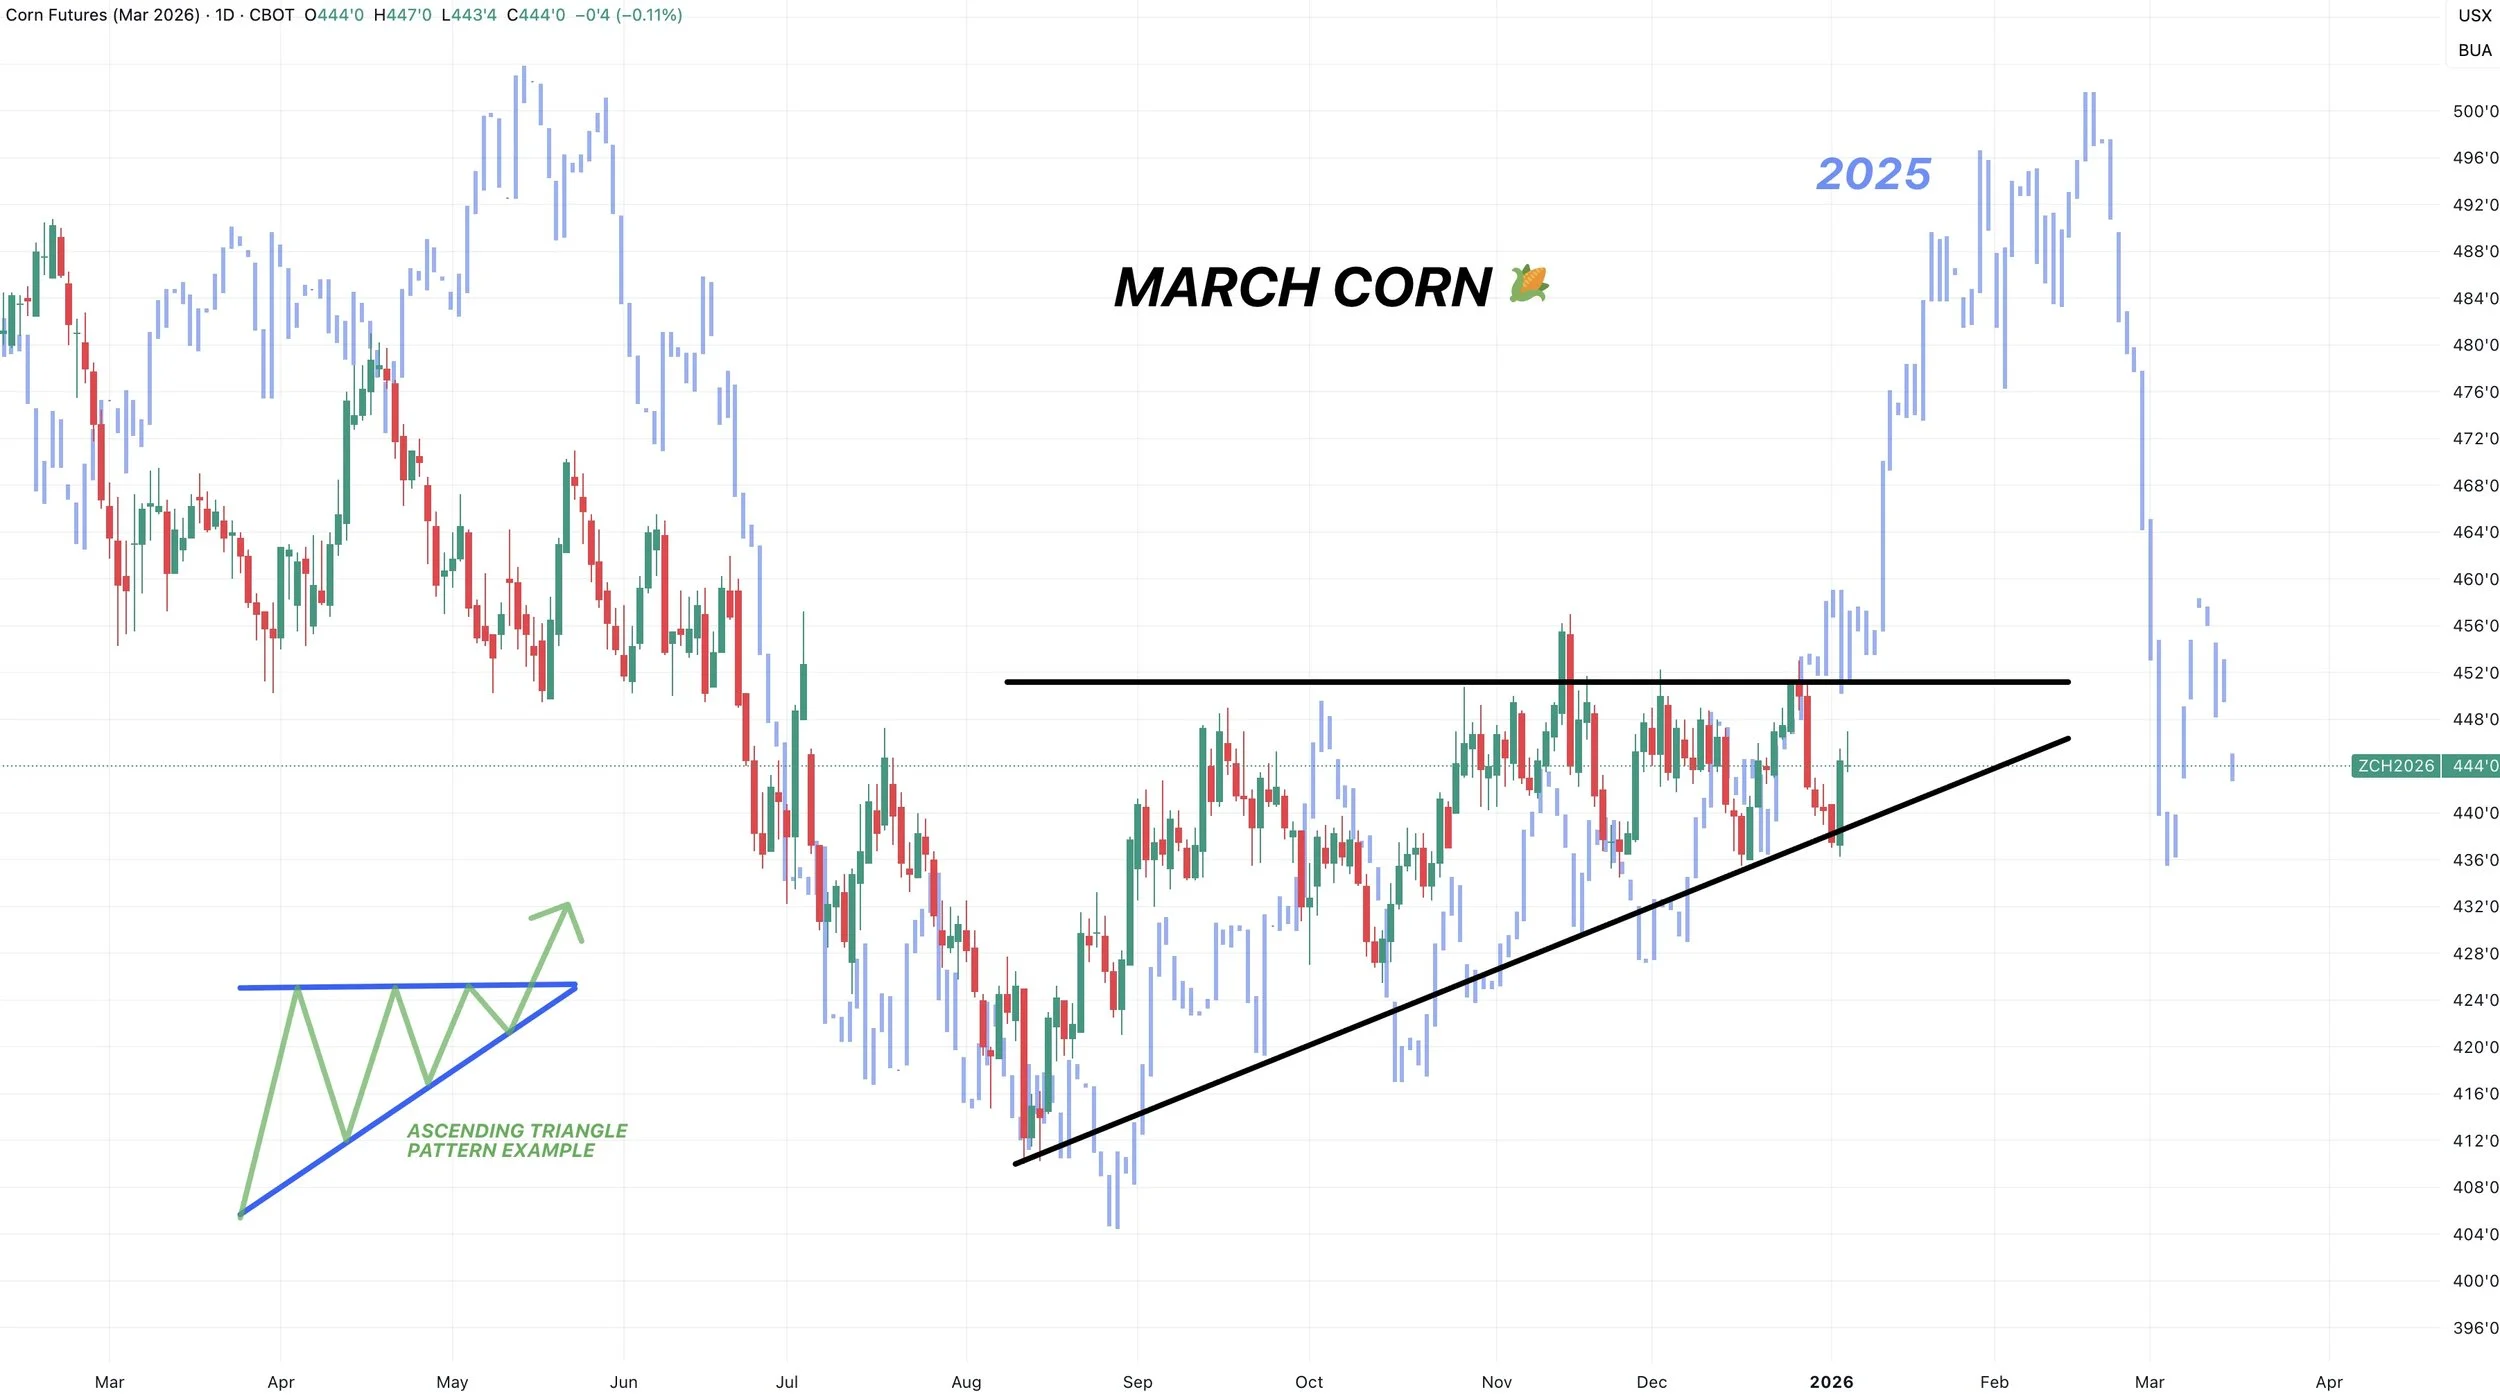
Now we are showing some very interesting similarities to corn last year when it comes to price action.
Here is March-25 corn overlayed on top of March-26 corn.
We are sitting in the exact same ascending triangle pattern.
We have seen identical action off the harvest lows.
I do not think we have quite the upside as last year, based on the fundamentals not being as friendly this year, but I do think we could follow a similar pattern with a breakout in January.
Technicals:
March Corn
We've traded sideways since October.
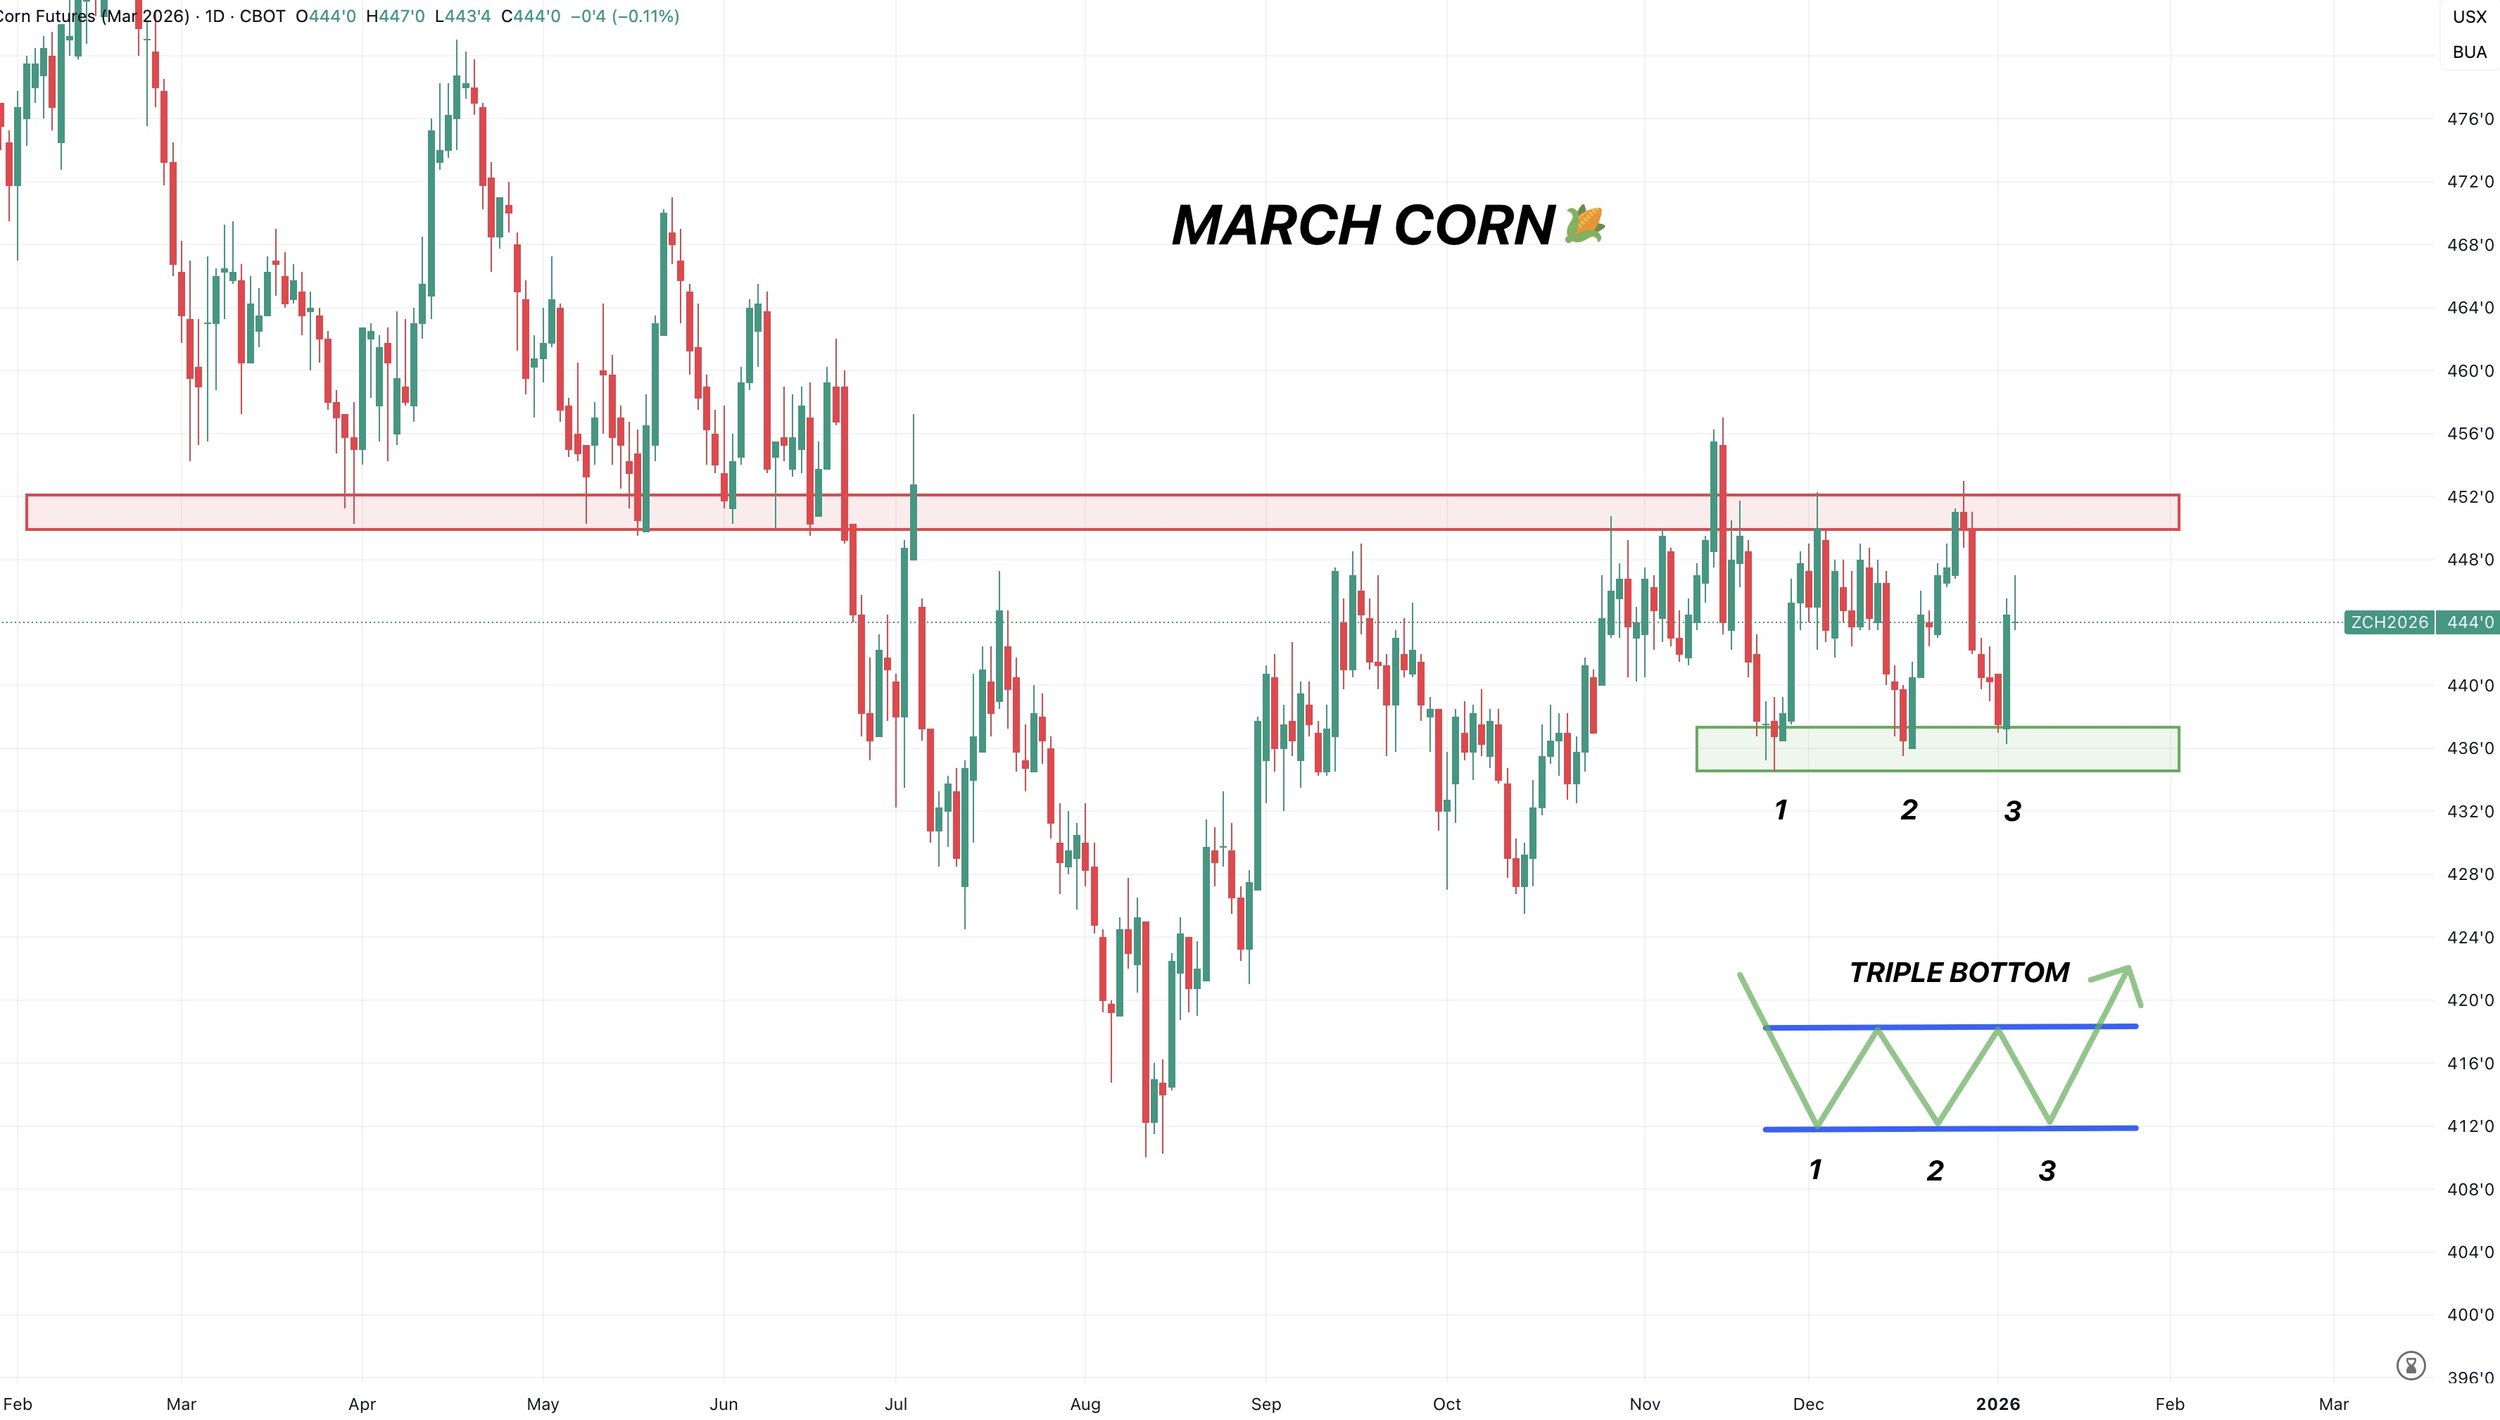
We now have a triple bottom pattern in place. Which is typically considered a bullish set up.
We've tested the local lows 3 times now.
Which is showing that sellers continue to fail while we build a floor.
The clear level to break is $4.50
If we break above, it should result in a leg higher.
In the meantime, we want to hold those local lows to prevent a leg lower.
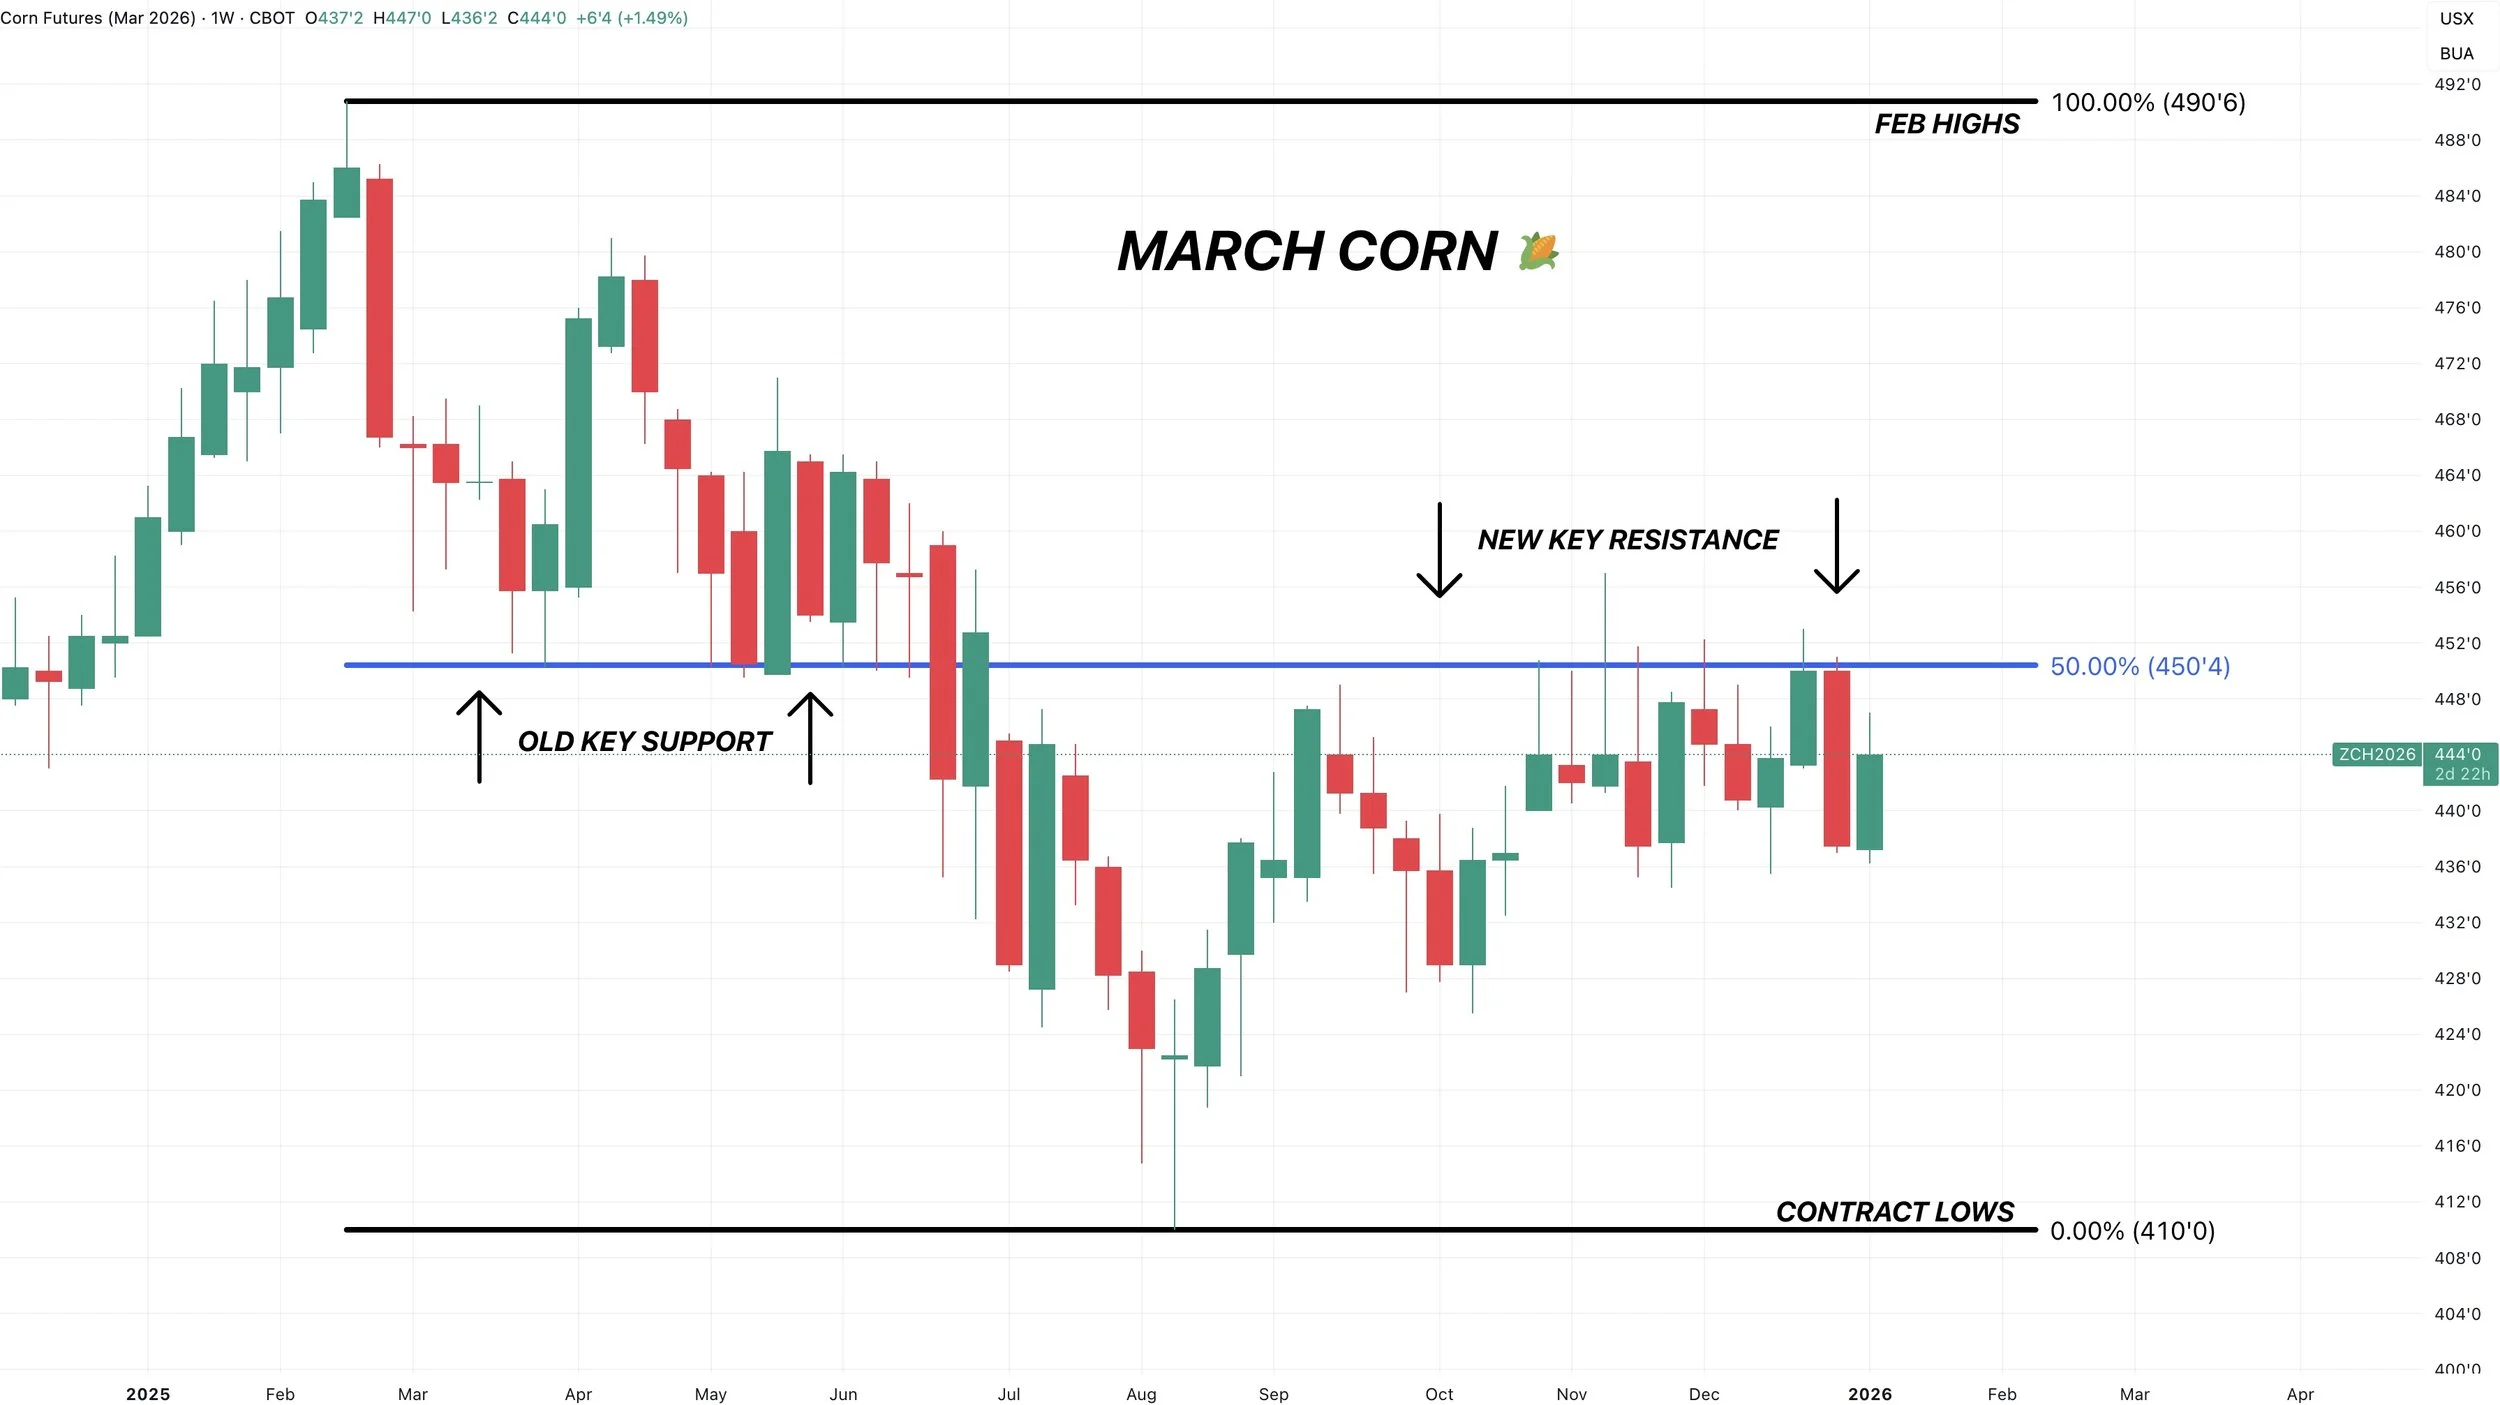
Here is the weekly chart.
We have still yet to get a close above $4.50
Again, that is key resistance.
We've failed there for months now.
It was support from spring.
It claws back 50% of the Feb highs.
Break above key resistance and we should go higher.
Soybeans
Fundamentals:
The biggest questions going into the report are going to be yield and if the USDA drops soybean exports.
I mean exports are down -45% vs last year. Yet the USDA's estimates are only -13% lower than last year.
So there is definitely an argument to be made.
The biggest thing preventing bulls from getting excited is South America.
Weather has been mostly favorable.
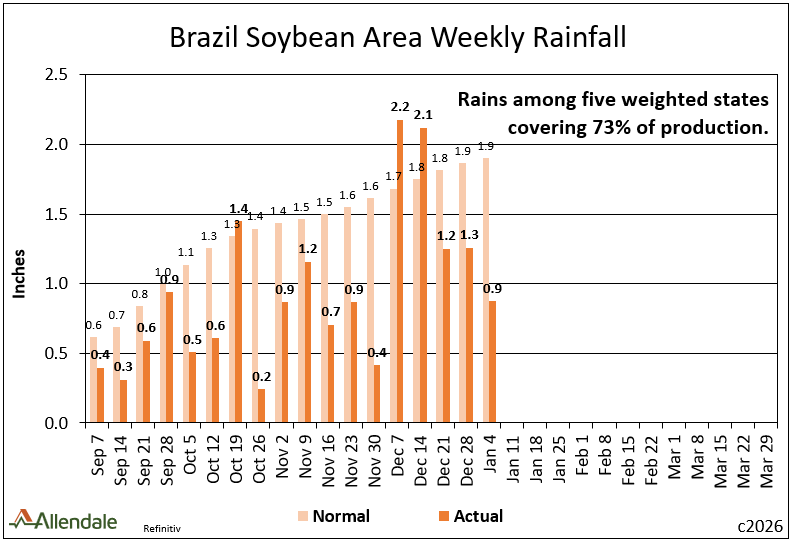
Here is Brazil's weekly rainfall amounts vs normal.
They've seen some dry weeks here and there, but overall nothing to be concerned about. Clearly the market hasn’t seemed worried about it.
Charts from Rich Nelson of Allendale
China has continued to buy soybeans and live up to their word. Which is great to see.
But the market seems to think it's not enough.
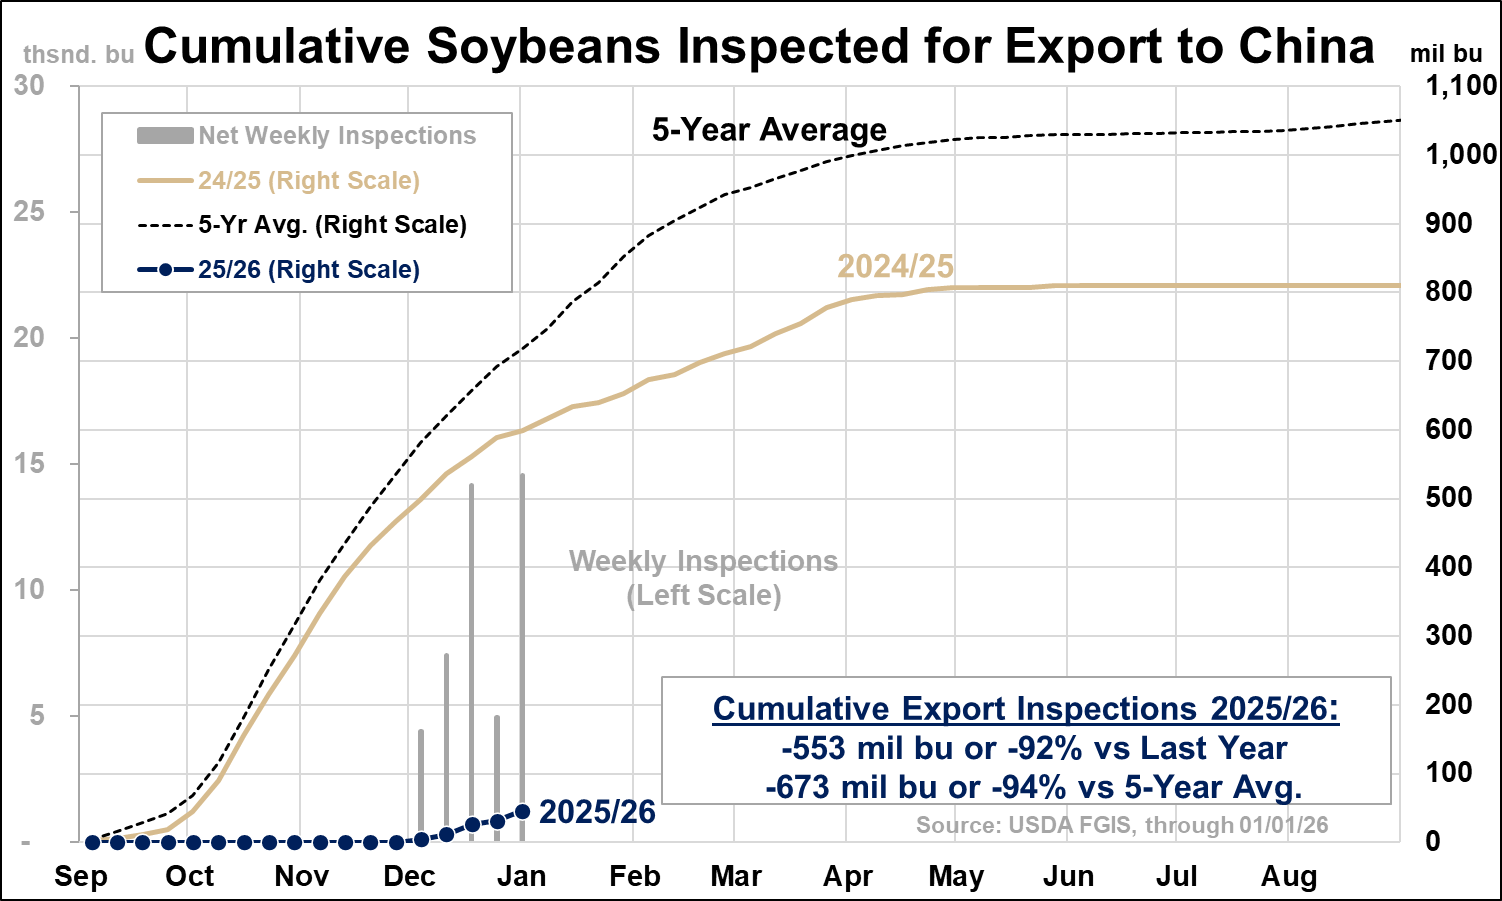
For reference, export inspections for soybeans to China do look pretty worrisome.
They are down over -90% vs last year.
Chart from Dave Brock of Brock Report
Taking a bigger picture perspective, China did agree to buy double for the next few years as to what they agreed to buy this year.
Which could be viewed as a silver lining moving forward if the agreement stays.
Overall there isn’t much for bulls to get overly excited about for now.
Brazil isn’t having any issues.
China continues to buy but overall export demand is still a big question mark.
We will have to see if the USDA provides bulls anything to chew on next week.
As the supply side of the US balance sheet is still fairly tight, given the 2nd-tightest acres of the last decade. That is if exports aren’t totally overestimated.
Technicals:
March Beans
Today was somewhat of a disappointing candle following yesterday's solid price action.
As on Friday, we left a dragonfly doji, and we then followed it up with a very solid day yesterday.
This is a textbook reversal pattern.
We also had a potential classic bear trap on Friday.
False breakdowns (aka bear traps) occur when you break below key support but quickly snap back above it.
In this case, we broke below the golden fib down to contract lows. Along with trendline support from contract lows.
Yesterday we then rallied back above them
We also posted confirmed bullish divergence.
As prices made new lows, yet the RSI did not.
Yesterday's rally looks optimistic for some further upside.
However, the line in the sand is going to be Friday's lows of $10.38.
If we break below that level, we could open the door another 20 cents lower.
As $10.18 would be the next level of support.
I'll have upside targets and areas to de-risk when I'm confident we've printed our lows.
If we close above $10.65 I'd be confident we are ready for a leg higher. As that is the 61.8% level up to those recent Christmas highs.
Wheat
Not going to go over much in wheat today as I don’t want to make today's update too long. There isn’t much new in the wheat market to begin with.
We still lack have a bullish catalyst.
As the US wheat situation is bearish, and globally, there are zero concerns with supply.
Patiently waiting for an opportunity.
Technicals:
March KC
So far we are finding some support where we need.
The 61.8% level of this entire mini bounce we had to end the year.
Need to hold that otherwise we go and test the contract low area.
To the upside we need to take out those Christmas highs at $5.34.
That claws back 61.8% of the Nov highs.
Do that and we can be confident we are ready for the next leg higher.
Weekly Continuous KC
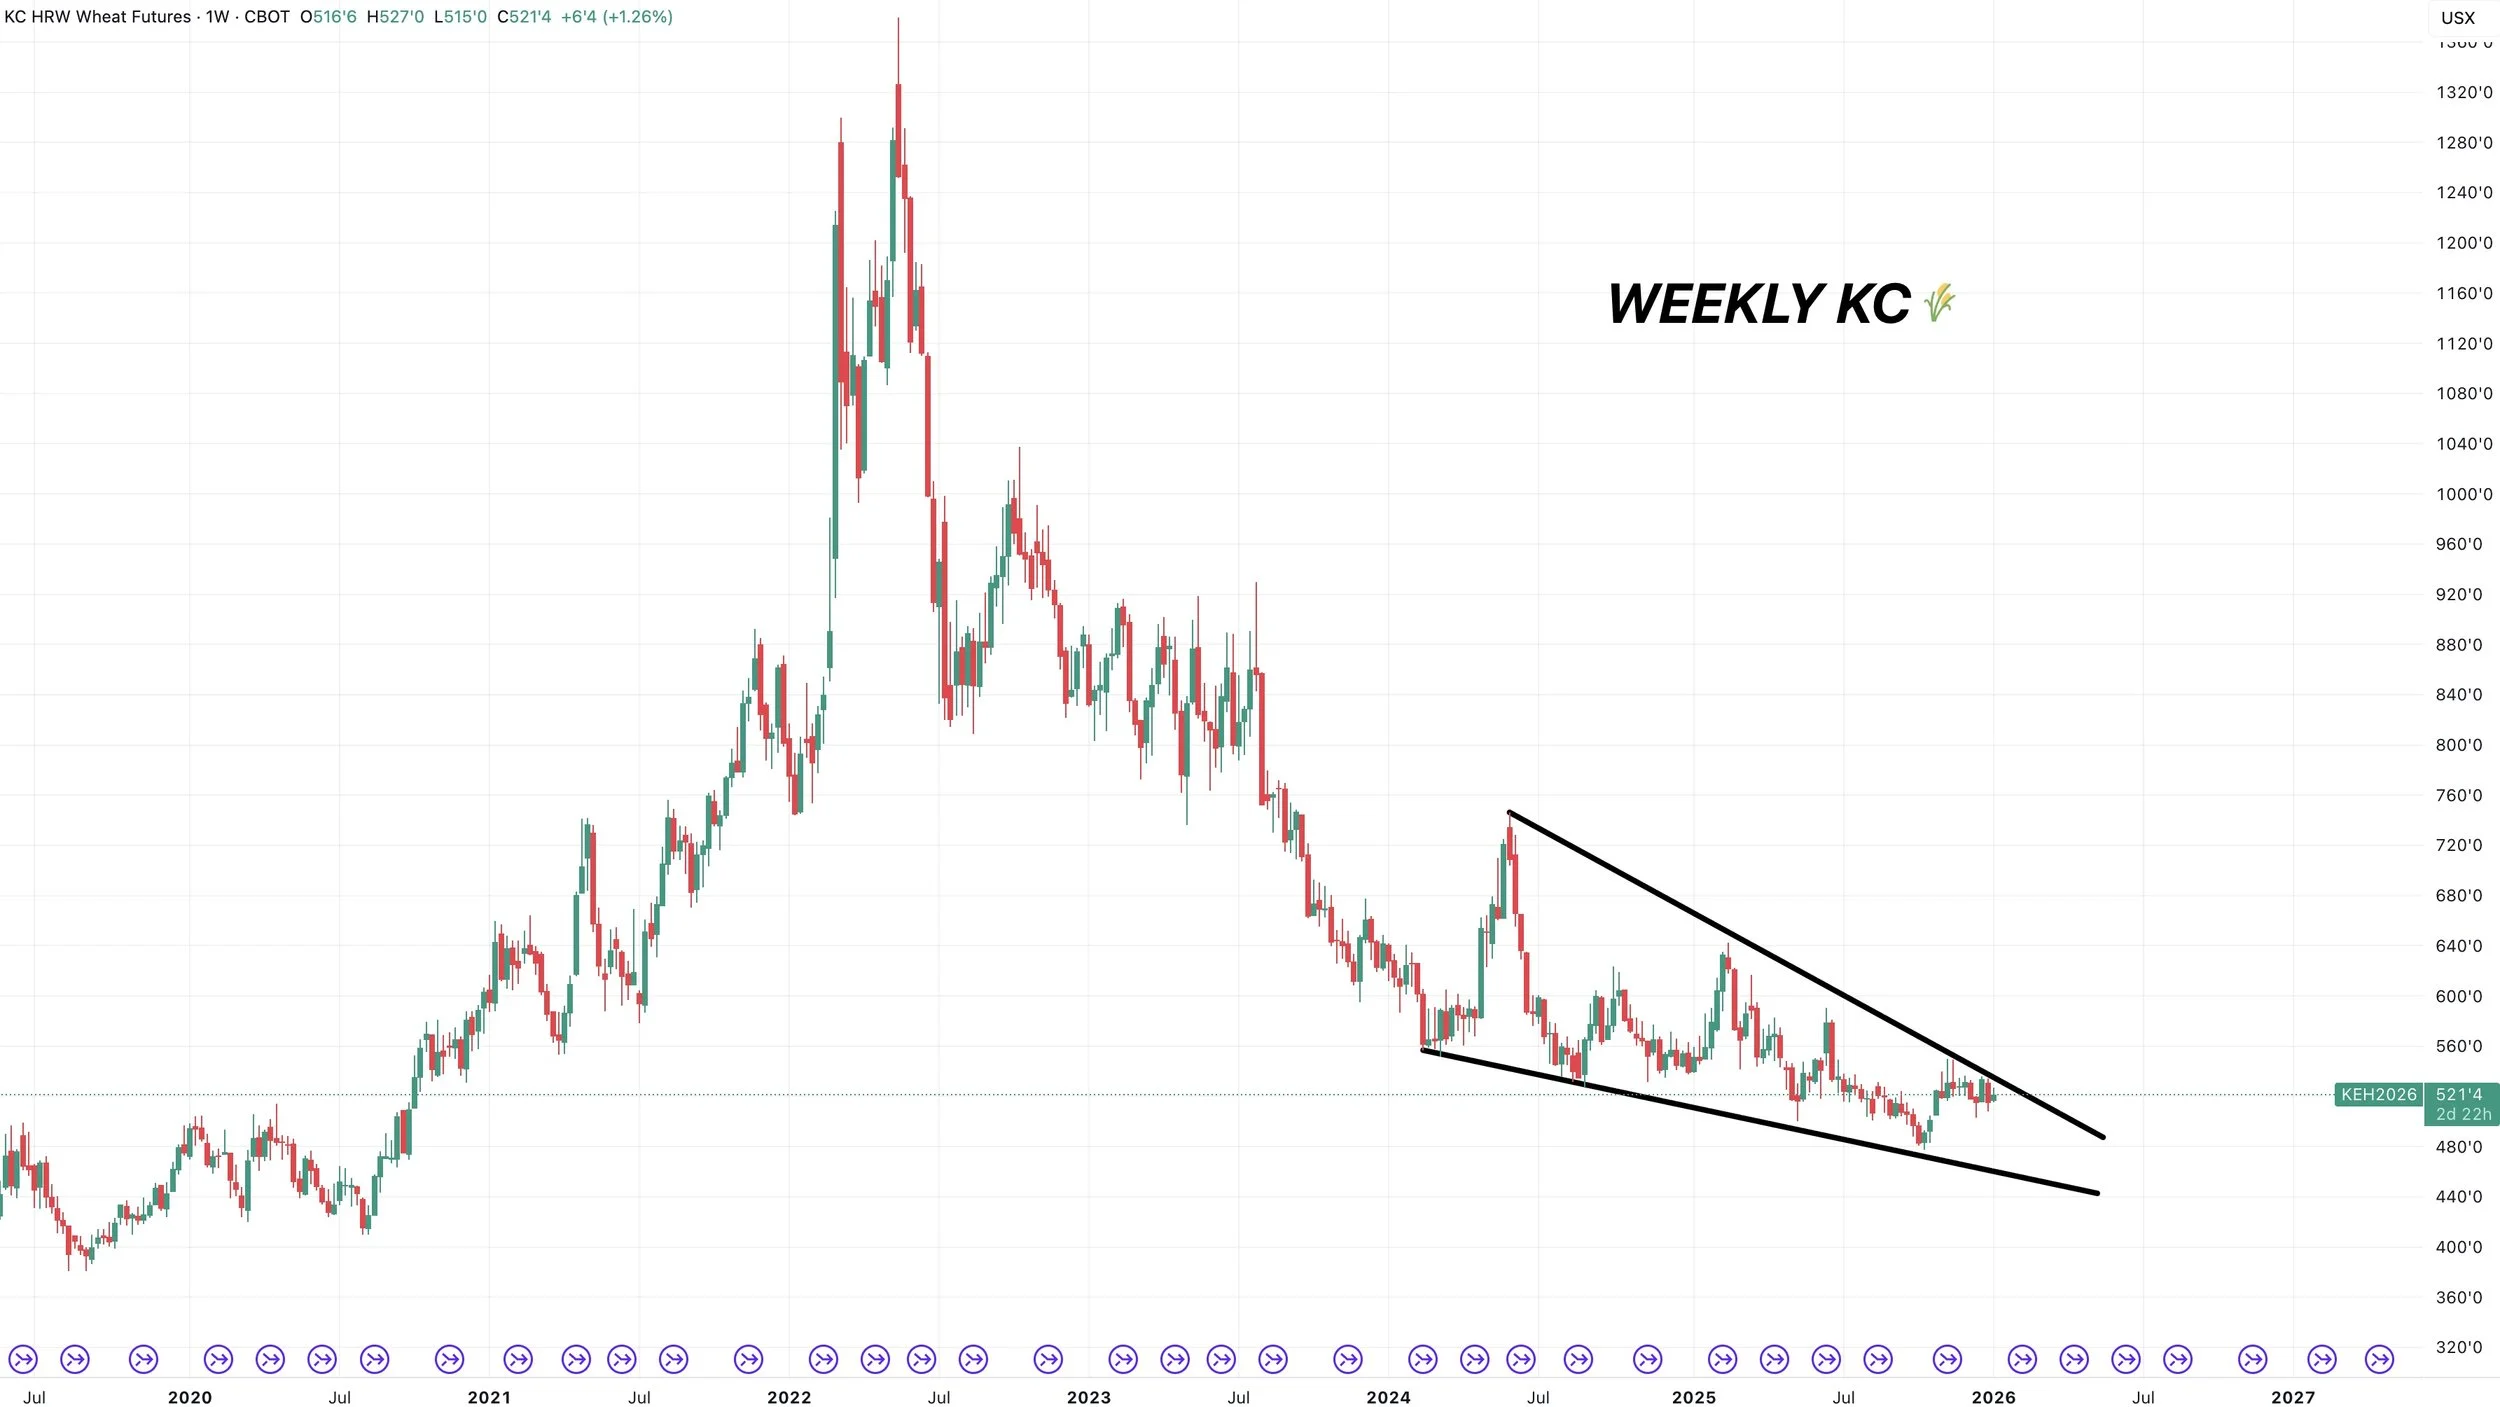
Here is the weekly chart.
We do have a massive wedge pattern we've been forming since 2024.
I'd like to think that eventually we get a break out.
Just might not happen as soon as we'd like.
March Chicago
Hovering near contract lows.
We have some work to do for me to be confident we've found a bottom.
Cattle
Fundamentals:
Live cattle are stalling while feeders continue to rally.
The price action does feel a little backwards.
Cattle is ripping higher even though packers are in the red, we had a packing plant close down, and the beef cutout isn’t strong. Yet they continue to push this market higher. So this rally is hard to justify fundamentally.
Feeders have been leading the charge on this move. It feels like a dash for cash, a race to buy feeders as fast as they can.
It feels like we are getting a little disconnected as far as margins go.
With feedlot margins and packer margins not lining up, the market is getting a little stretched out. For the rally to stay "fundamentally clean". Cash needs to keep going higher or cut out needs to improve significantly.
If you look at the charts, clearly they aren’t bearish. I've been surprised at the strength of this rally. We've blown past some key levels, and the trend remains higher unless we take out last Friday's lows.
With the market doing the opposite of what it feels like it should be doing, we want to be cautious.
We don’t want to stand in front of a moving train here. But this is absolutely a rally where we should be taking chips off the table and upgrading protection.
If you have LRP coverage with a much lower floor, consider rolling that floor up with some strategies.
Give us a call if you have questions:
Jeremey: (605)250-3863
Lauren: (806)391-7178
Technicals:
March Feeders
We've now blown past that orginal target box. Which was the golden zone retracement of the entire sell off.
We are now really close to hitting my last target before those highs.
Which is the 78.6% level up to those highs.
If we take out this level, then the next point of interest is that last gap and those highs.
Regardless we still like taking some chips off here.
Feb Live
Live cattle also above that original target box.
The next point of interest is the 78.6% level right above 240.
Past Sell or Protection Signals
Dec 11th: 🐮
Cattle sell signal & hedge alert.
Dec 5th: 🐮
Cattle sell signal & hedge alert.
Nov 17th: 🌱
Soybean sell signal & hedge alert.
Nov 13th: 🌽 🌱
Managing risk in corn & beans ahead of USDA report.
Oct 28th: 🌽
Corn sell signal & hedge alert.
Oct 27th: 🌱
Soybean sell signal & hedge alert.
Oct 13th: 🐮
Cattle sell signal & hedge alert.
Aug 22nd: 🌱
Soybean sell signal & hedge alert.
July 31st: 🐮
Cattle sell signal & hedge alert.
July 10th: 🐮
Cattle sell signal & hedge alert.
CLICK HERE TO VIEW
June 5th: 🐮
Cattle sell signal & hedge alert.
June 2nd: 🌾
MPLS wheat sell signal.
April 10th: 🌽
Old crop corn sell signal.
March 19th: 🐮
Cattle hedge & sell signal.
Feb 18th: 🌽 🌾
Old crop KC wheat & old crop corn signal.
Jan 23rd: 🌽 🌱
Corn & beans old crop sell signal.
CLICK HERE TO VIEW
Jan 15th: 🌽 🌱
Corn & beans hedge alert/sell signal.
Jan 2nd: 🐮
Cattle hedge alert at new all-time highs & target.
Dec 11th: 🌽
Corn sell signal at $4.51 200-day MA
CLICK HERE TO VIEW
Oct 2nd: 🌾
Wheat sell signal at $6.12 target
Sep 30th: 🌽
Corn protection signal at $4.23-26
Sep 27th: 🌱
Soybean sell & protection signal at $10.65
Sep 13th: 🌾
Wheat sell signal at $5.98
May 22nd: 🌾
Wheat sell signal when wheat traded +$7.00
Want to Talk?
Our phones are open 24/7 for you guys if you ever need anything or want to discuss your operation.
Hedge Account
Interested in a hedge account? Use the link below to set up an account or shoot Jeremey a call at (605)295-3100.
WHEN DO PRICES SEASONALLY RALLY & FALL APART?
MARKET UPDATE
You can scroll to read the usual update as well. As the written version is the exact same as the video.
Timestamps for video:
Seasonals: 0:55min
Corn: 5:50min
Beans: 9:30min
Wheat: 13:00min
Cattle: 14:00min
Want to talk about your situation?
(605)250-3863
Holiday sale ends tomorrow
Your free trial has ended.
If you’d like to keep full access to our updates & signals make sure you lock in our biggest offer of the year.
Futures Prices Close
Overview
Grains mostly lower while cattle trades higher today, following yesterday's brutal price action in the grains.
Overall, it's been pretty quiet with the holidays. We haven’t seen much if any major news.
Traders are on holiday mode which means small volume.
Yesterday’s blood bath could’ve easily been a spill-over trade from the weak outside markets, some last minute farmer selling, and or fund re-positioning heading into the new year. When volume is light, it can make moves over exaggerated.
All eyes are set on the USDA report scheduled for January 12th to give us some fresh fundamental news for bulls and bears to chew on.
The markets will be closed on Thursday with the new year. Outside of that, the trading schedule remains completely the same. With normal open and closes tomorrow as well as Friday.
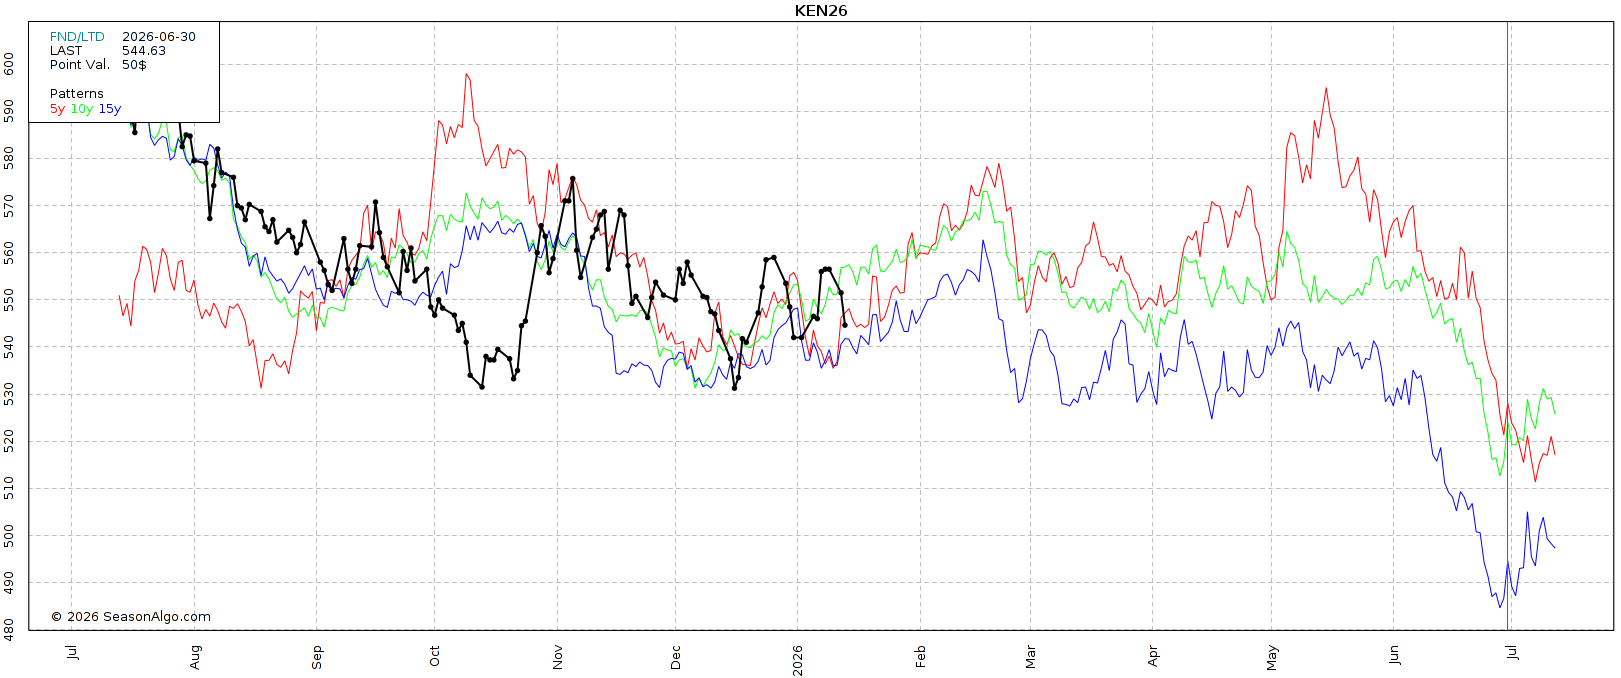
Full Seasonal Pattern Breakdowns
Since there isn’t much news to digest we are going to go over the seasonal patterns for corn, soybeans, wheat, as well as cattle.
When do each of these markets typically catch a bid or sell off based on prior years?
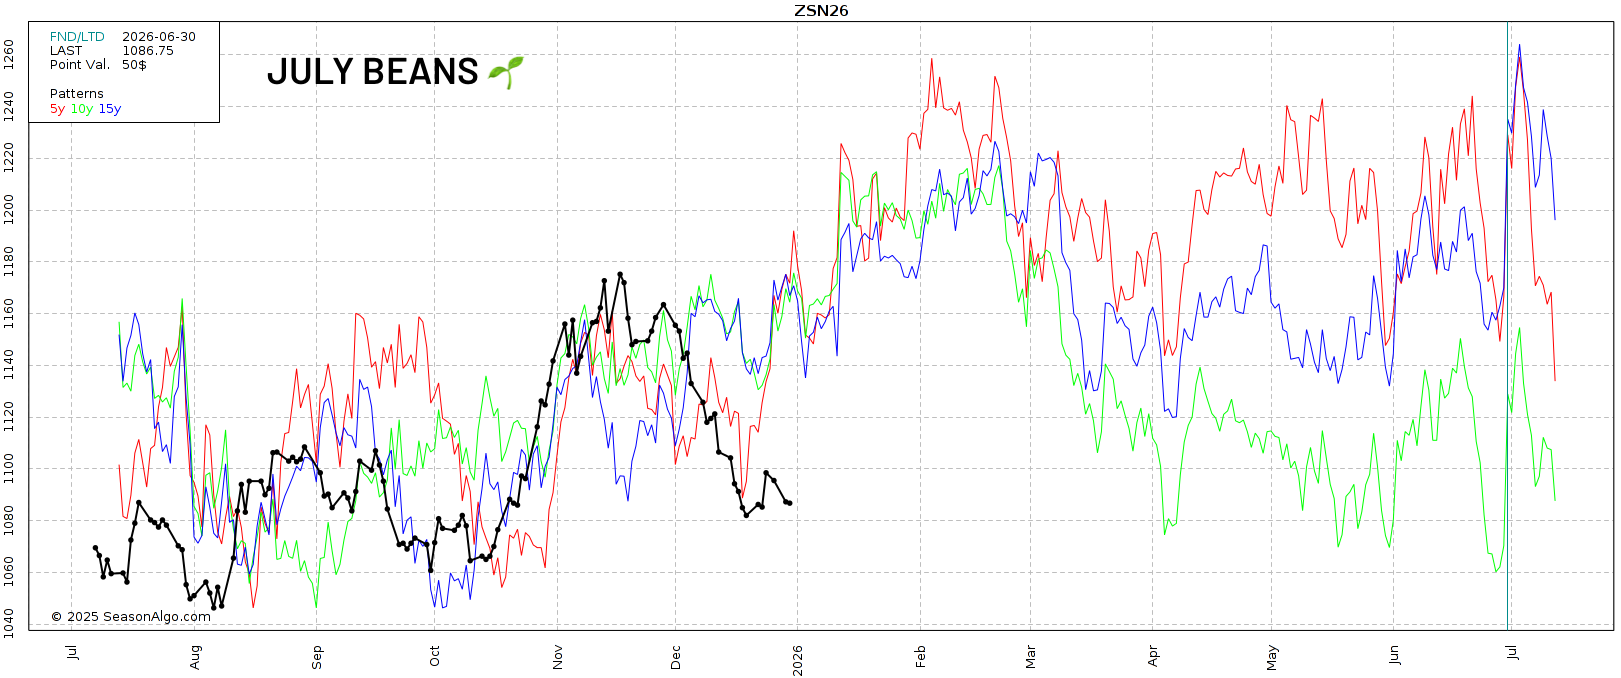
Corn
First for corn.
We are going to go into the most detail for corn, as corn tends to follow seasonal patterns more closely than the rest of the grains.
As it largely follows the US growing season. Whereas soybeans and wheat rely more heavily on growing seasons from other large players, such as Brazil for soybeans.
Let's look at March corn.
This first pattern is 2025 (last year) vs 2026 (this year).
We've been tracking very, very close to last year's price action.
Last year we continued higher before topping in February.
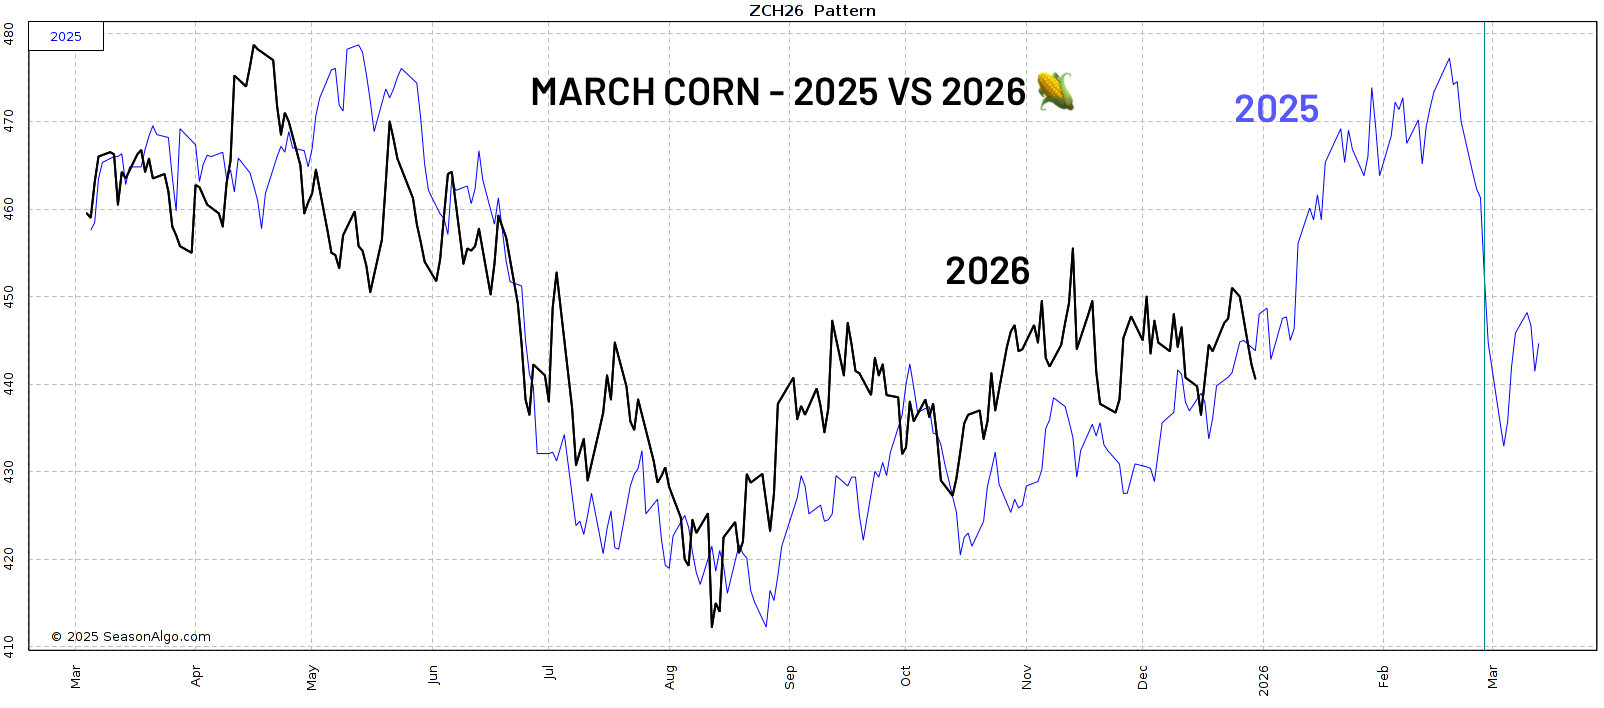
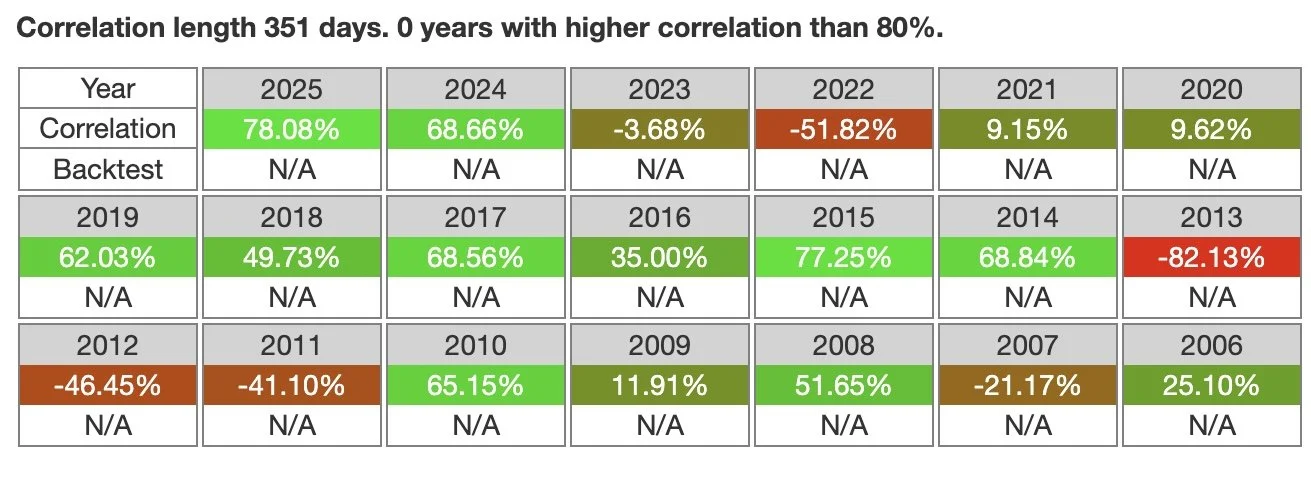
If we dive into the analytics, last year actually does have the highest pattern correlation to this year.
It sits at a near 80% correlation to one another.
These are all the correlations to this year.
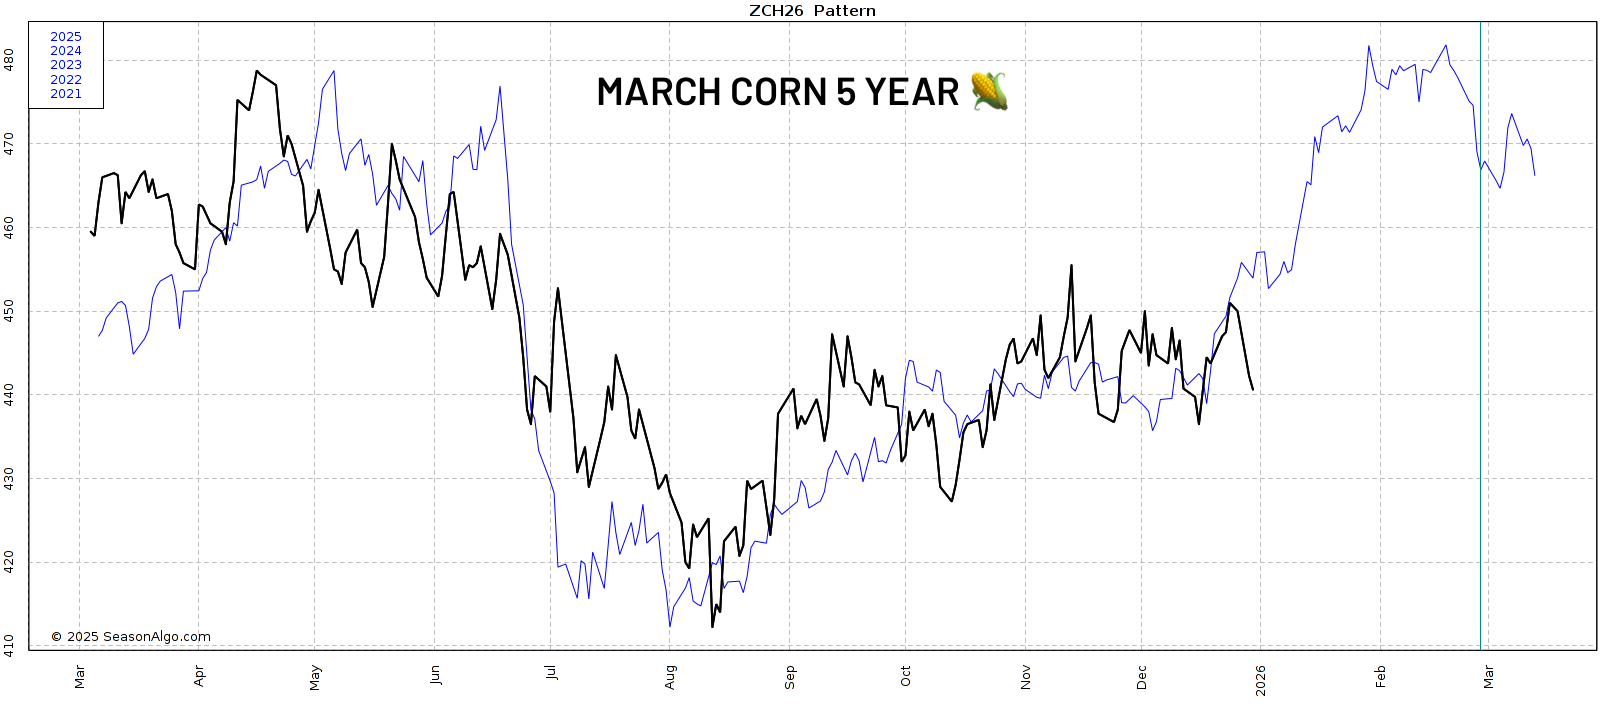
Now here is the March corn 5-year pattern.
This one has tracked very closely as well.
The summer sell off, the August bottom, the rally going into October before trending sideways. All similar.
It too has us climbing higher into February.
Here is the 10-year seasonal.
We clearly haven’t followed this pattern at all.
But it also has us continuing higher into February.
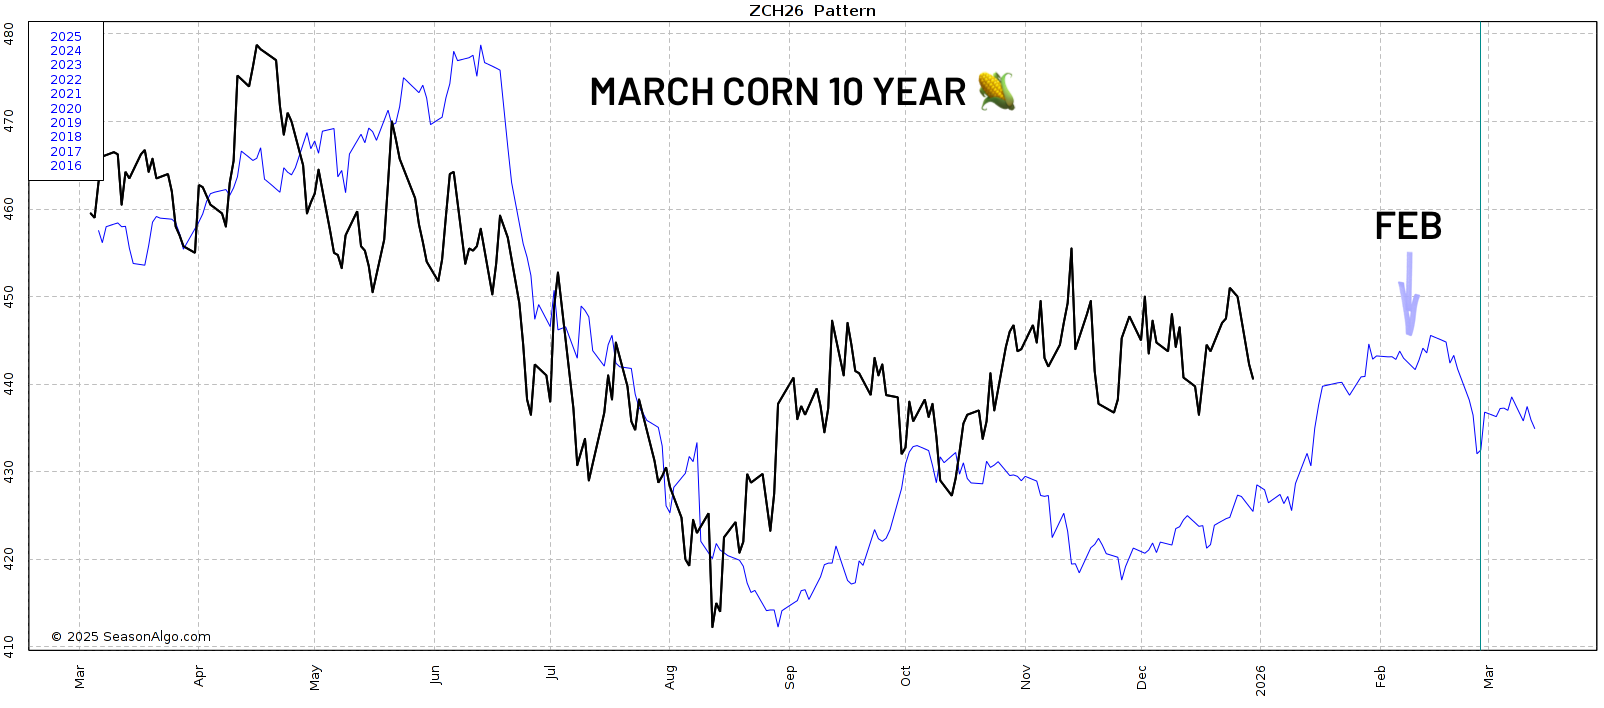
Same story with the 15-year.
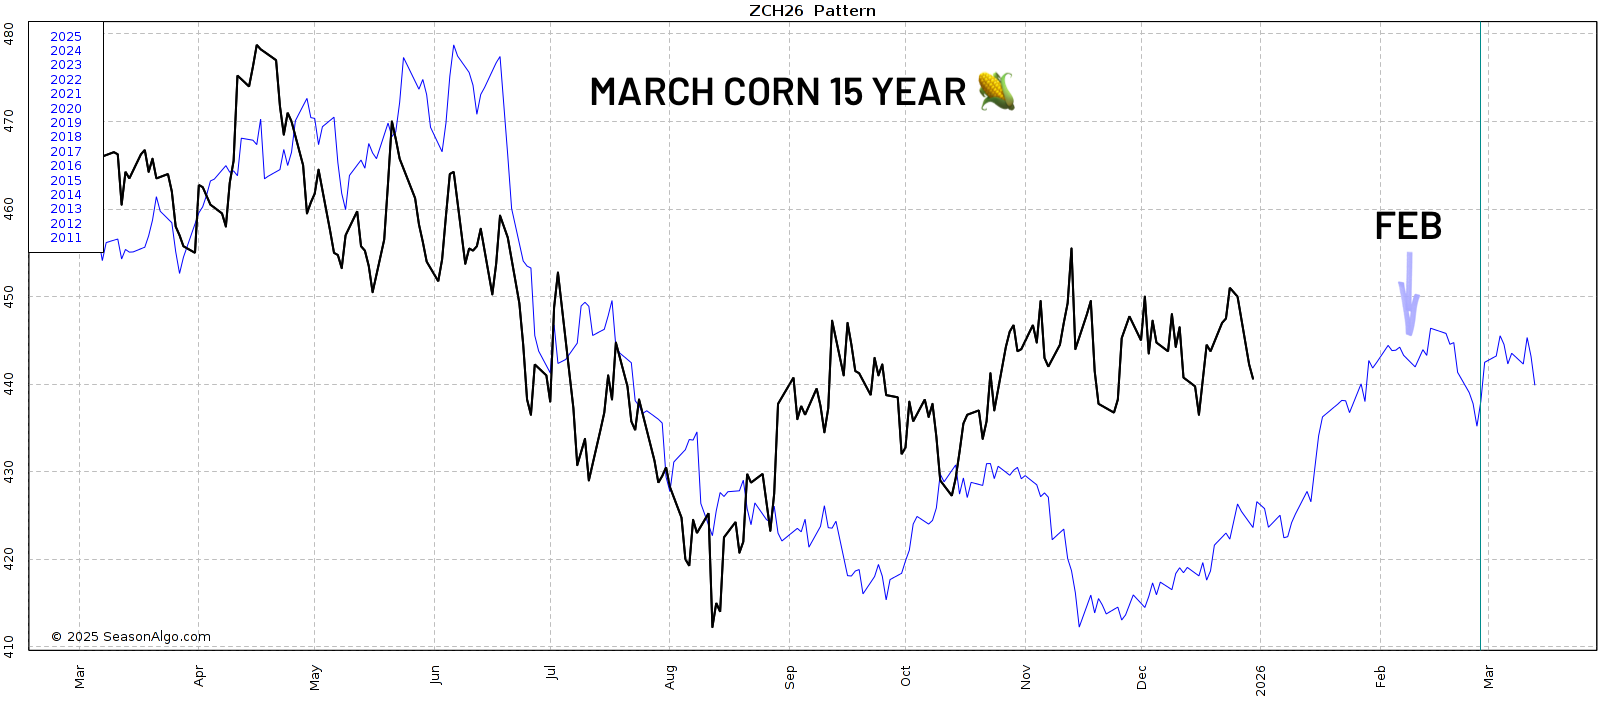
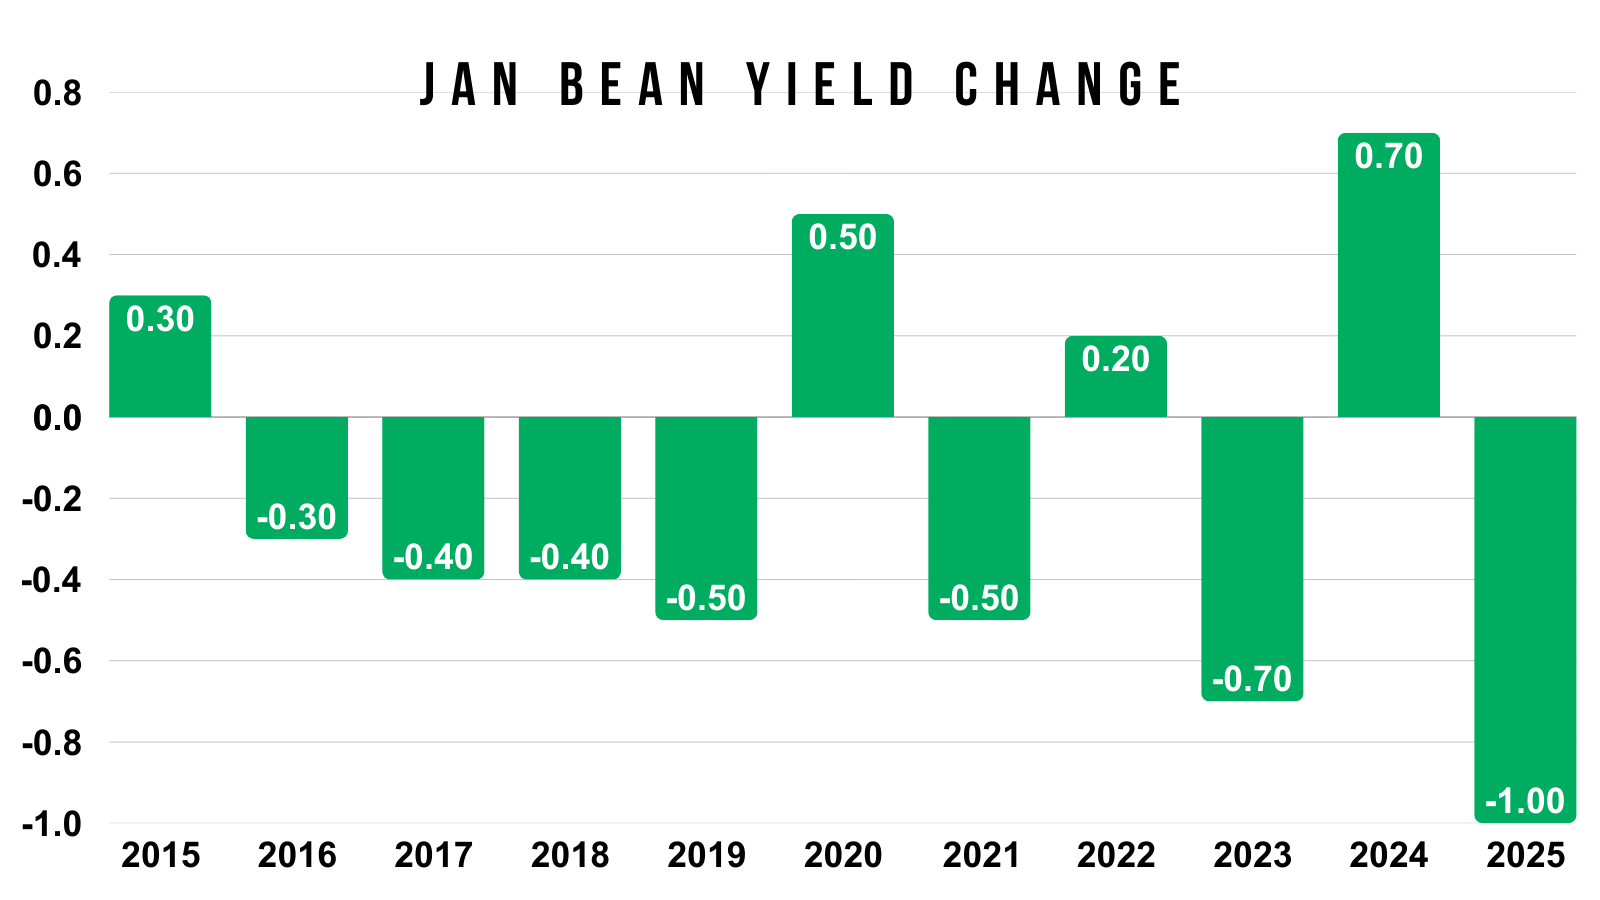
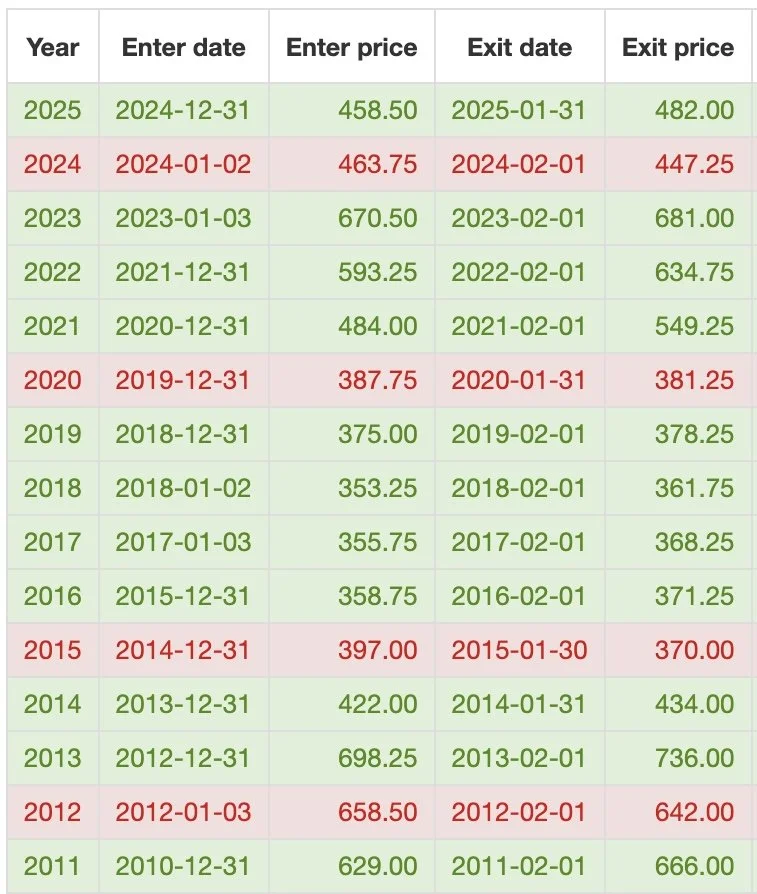
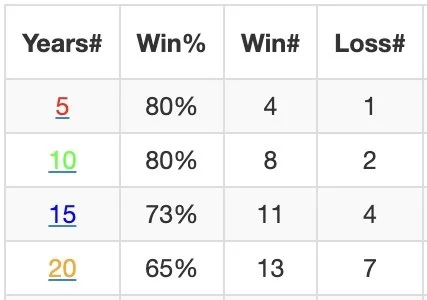
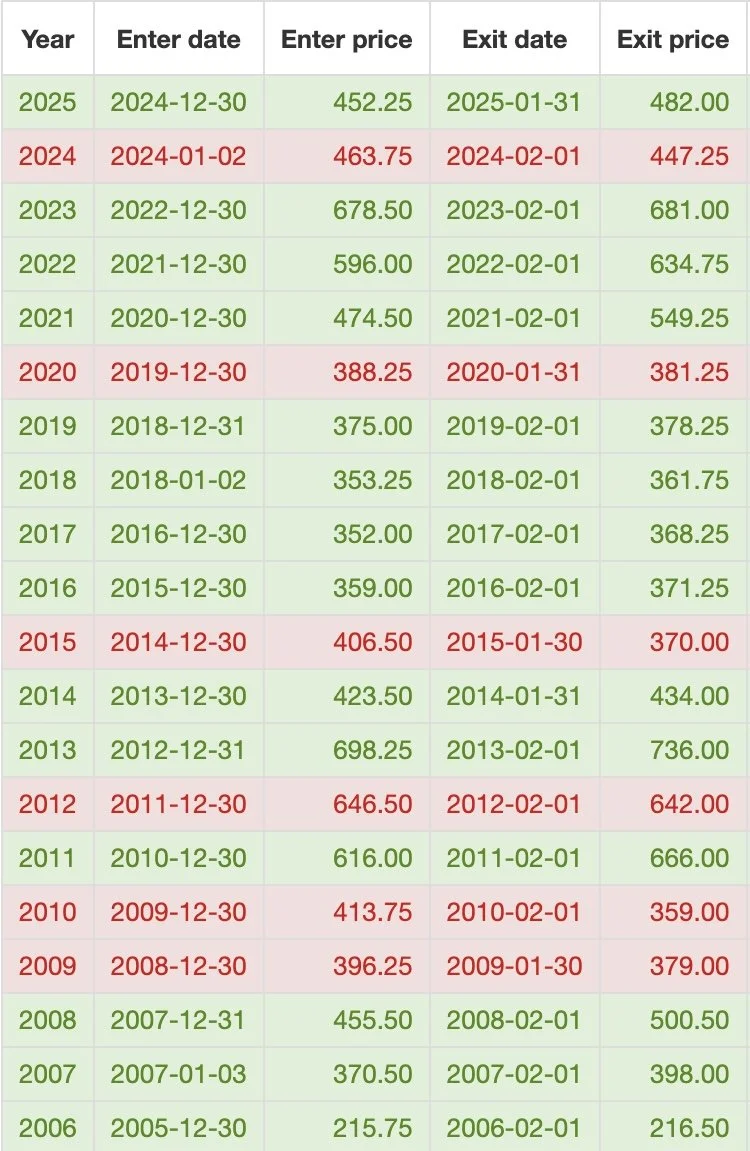
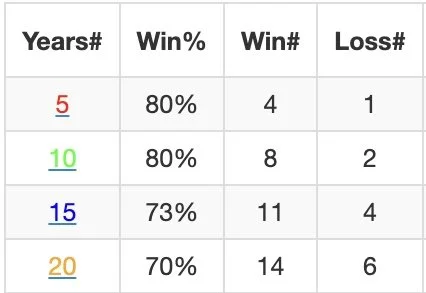
Here is the actual data for March corn's price action from today until February 1st.
We've traded higher the last:
4 of 5 years (80%)
8 of 10 years (80%)
11 of 15 years (73%)
So January is often a friendly month for the corn market.
We don’t "have" to go higher. But history favors us doing so.
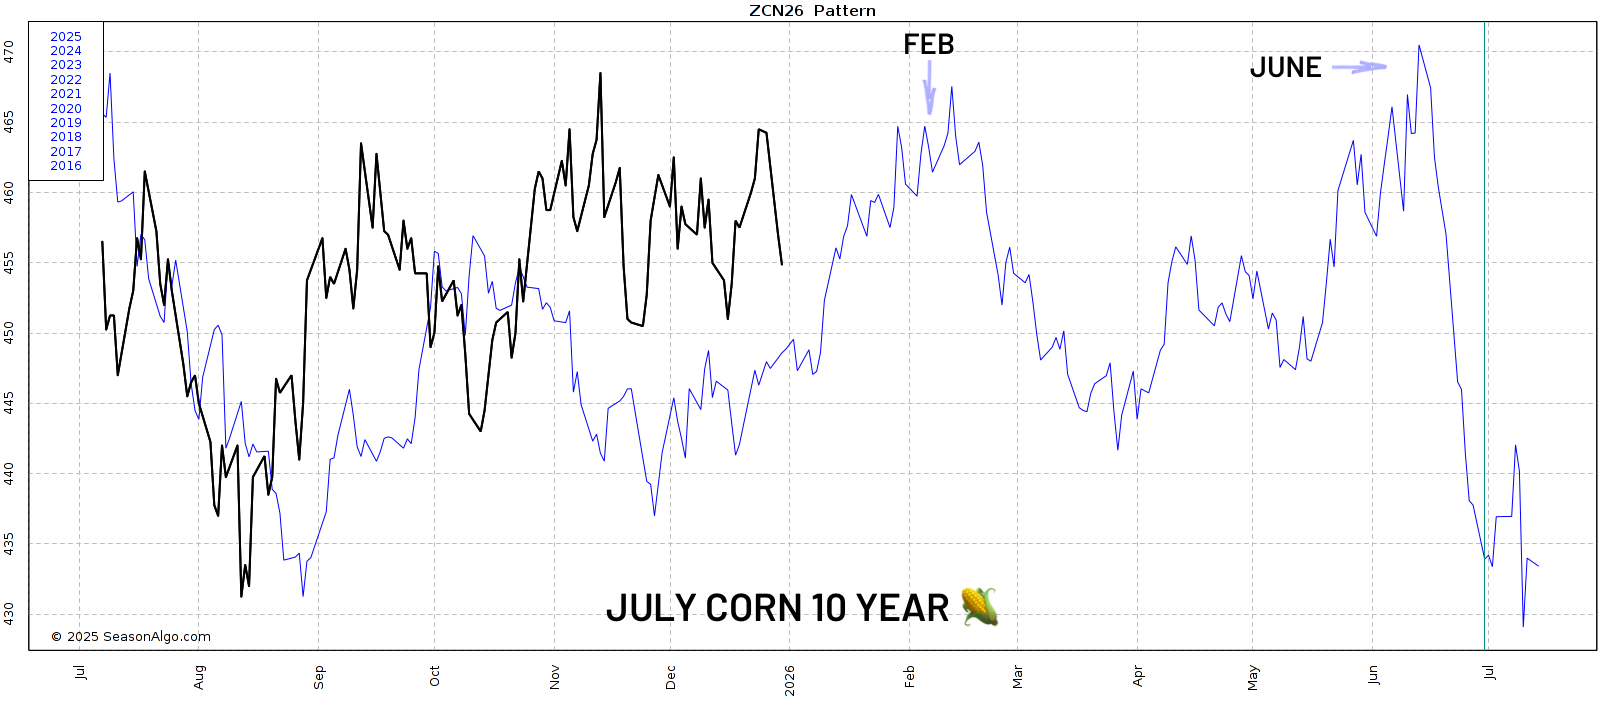
Next let's look at July corn.
First the 5-year pattern.
We typically post two major tops in this market.
Ths 1st is in February.
The 2nd is in April.
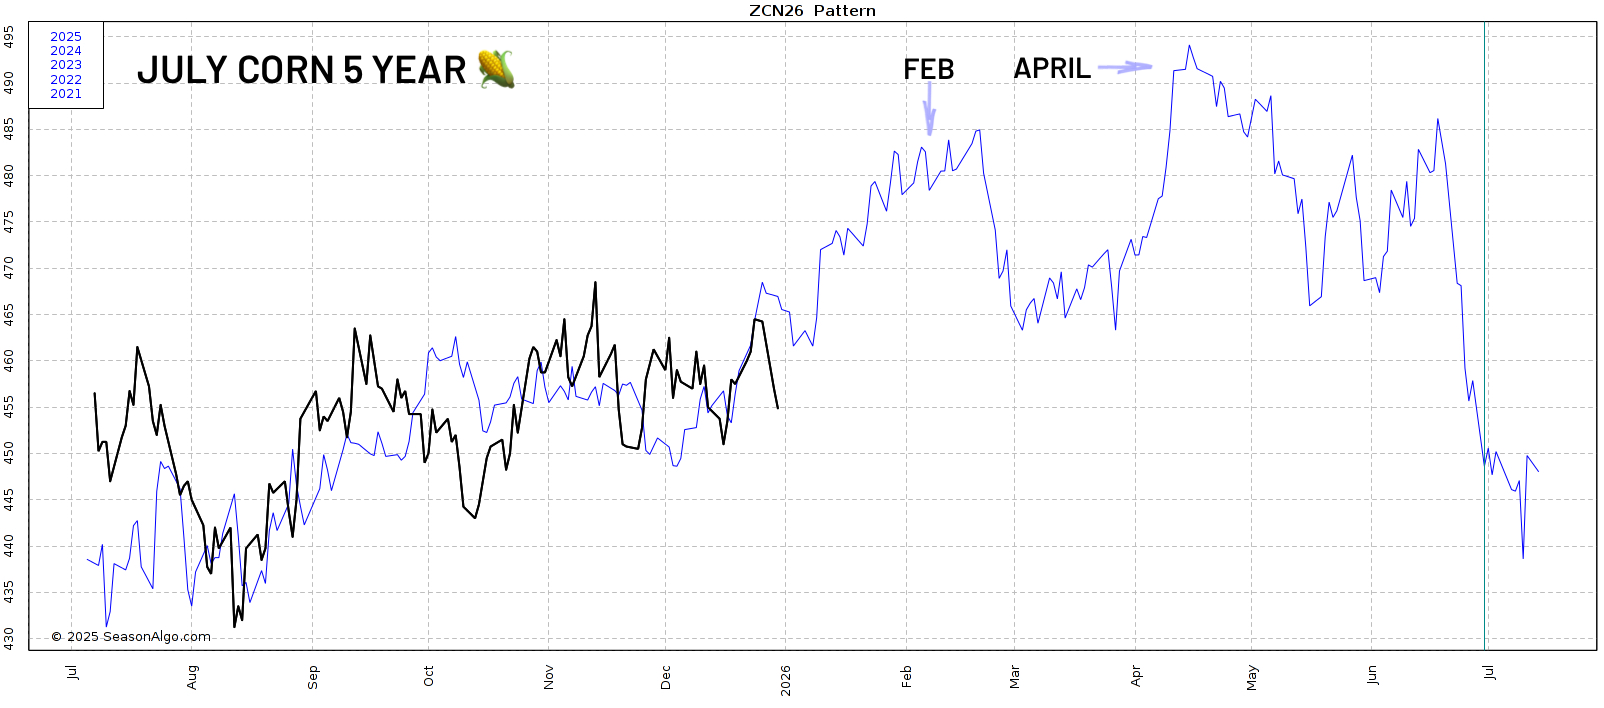
Here is the 10-year.
Again we have two tops that typically form.
February and June.
Seasonal patterns are far from perfect.
But it would be reasonable to think we get that opportunity around February followed by a second opportunity in spring or early summer.
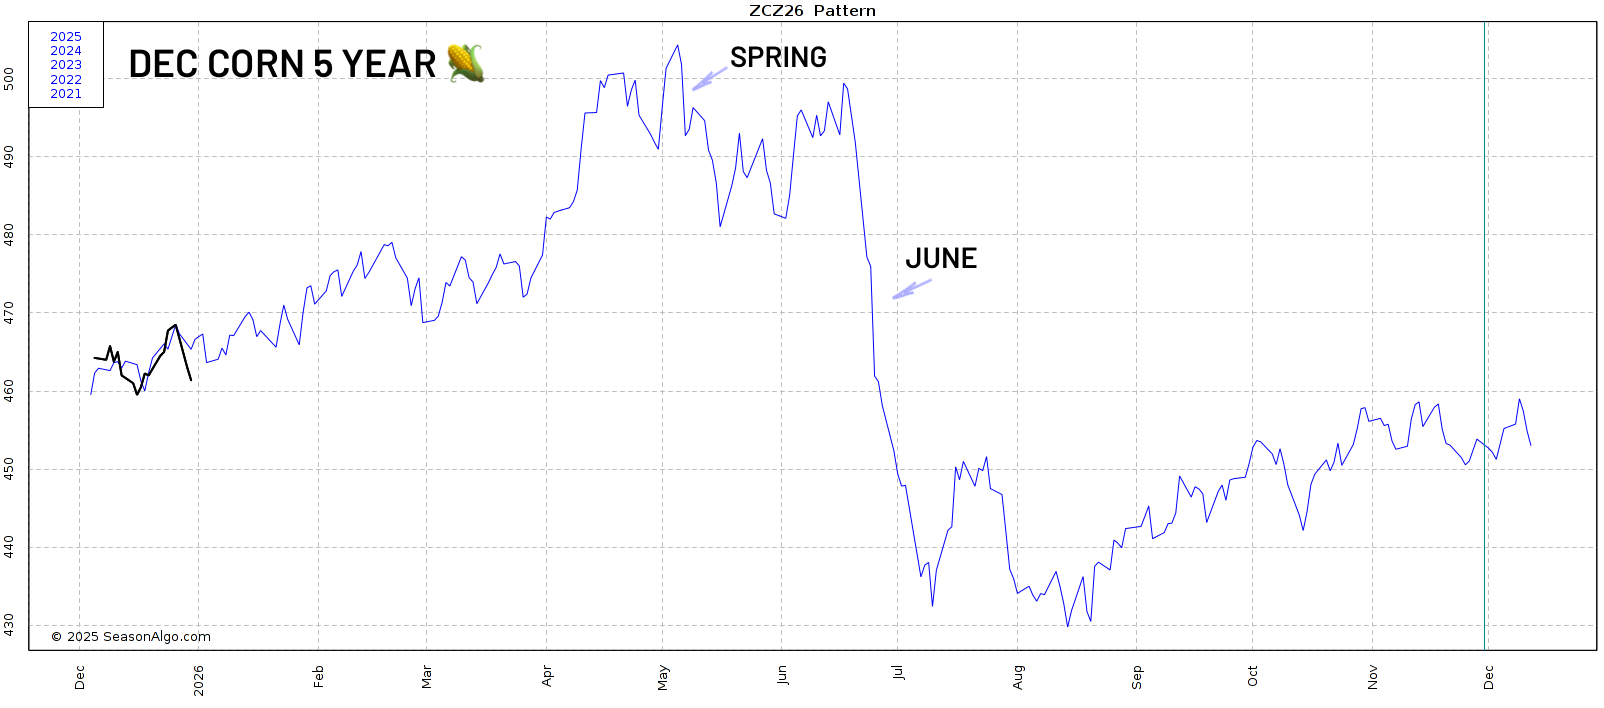
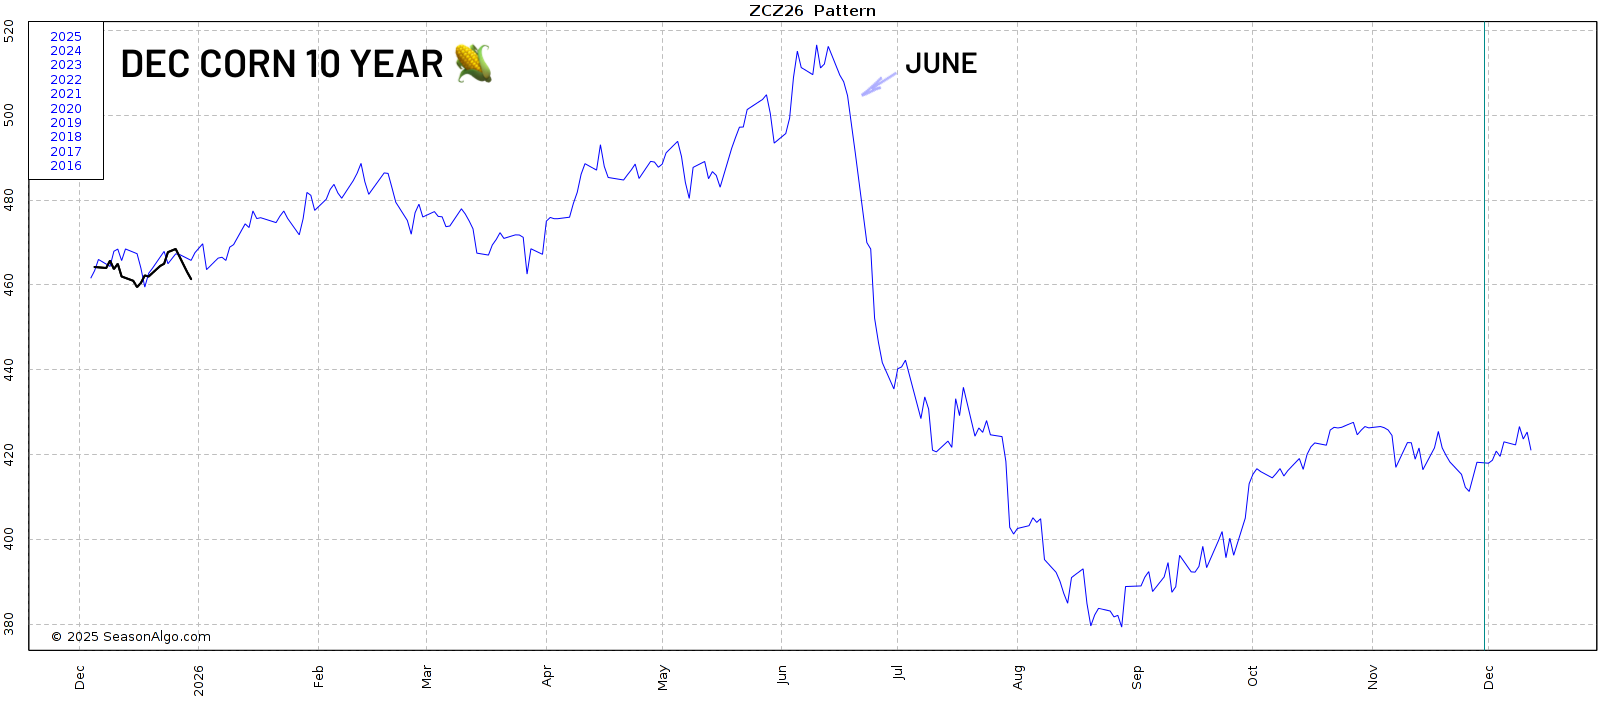
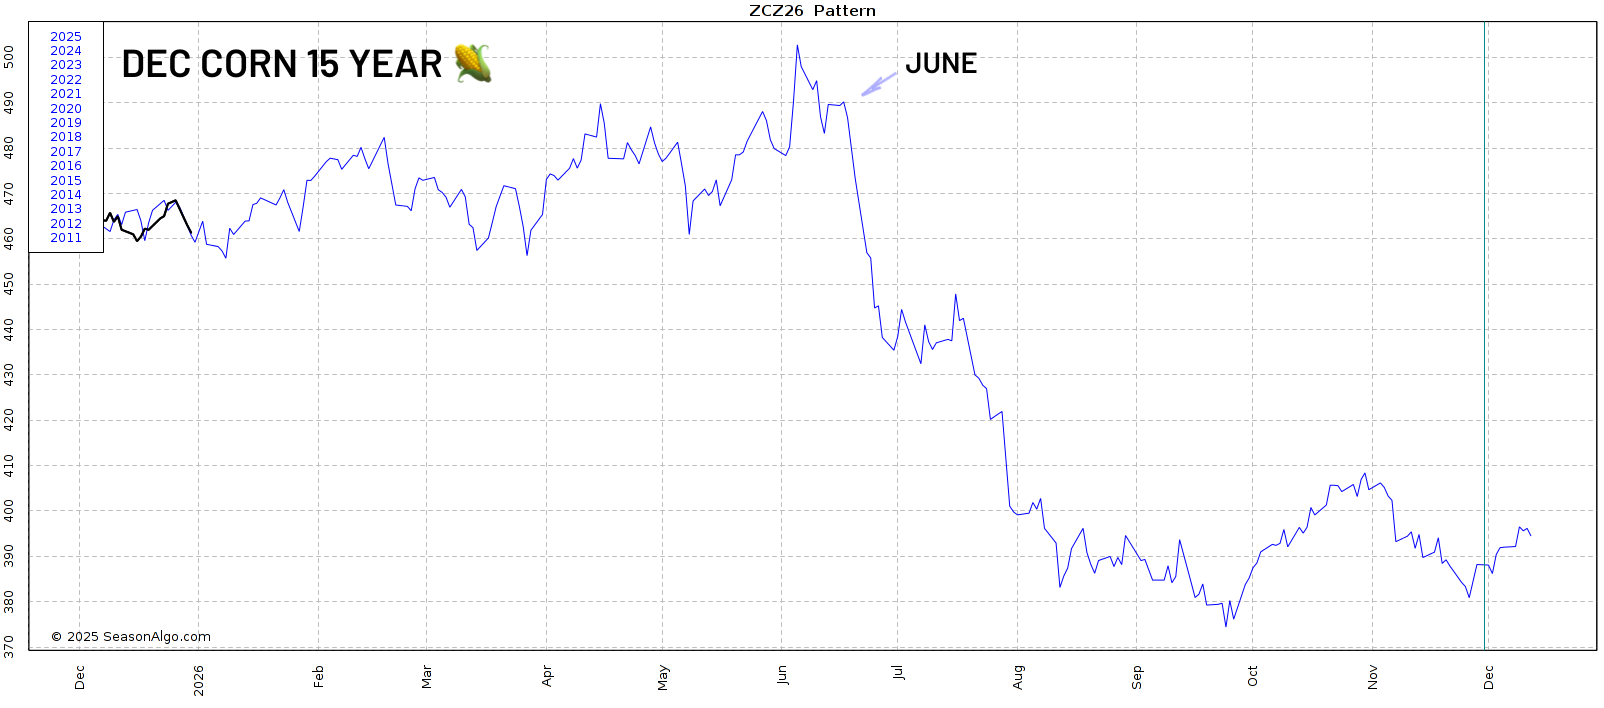
Lastly here is Dec corn.
This is the 5, 10, and 15-year patterns.
Regardless of where the high is.
Every single one of them has us collapsing in June and July.
It happens almost every year without fail. Something to keep in mind for later.
Soybeans
I am not a huge fan of seasonal tendencies in soybeans. As I mentioned, they revolve around more than one growing season so they can be skewed and differ.
However, seasonally soybeans do push higher into February in the 5 (red), 10 (green), and 15 (blue) patterns. Followed by a sell off going into April.
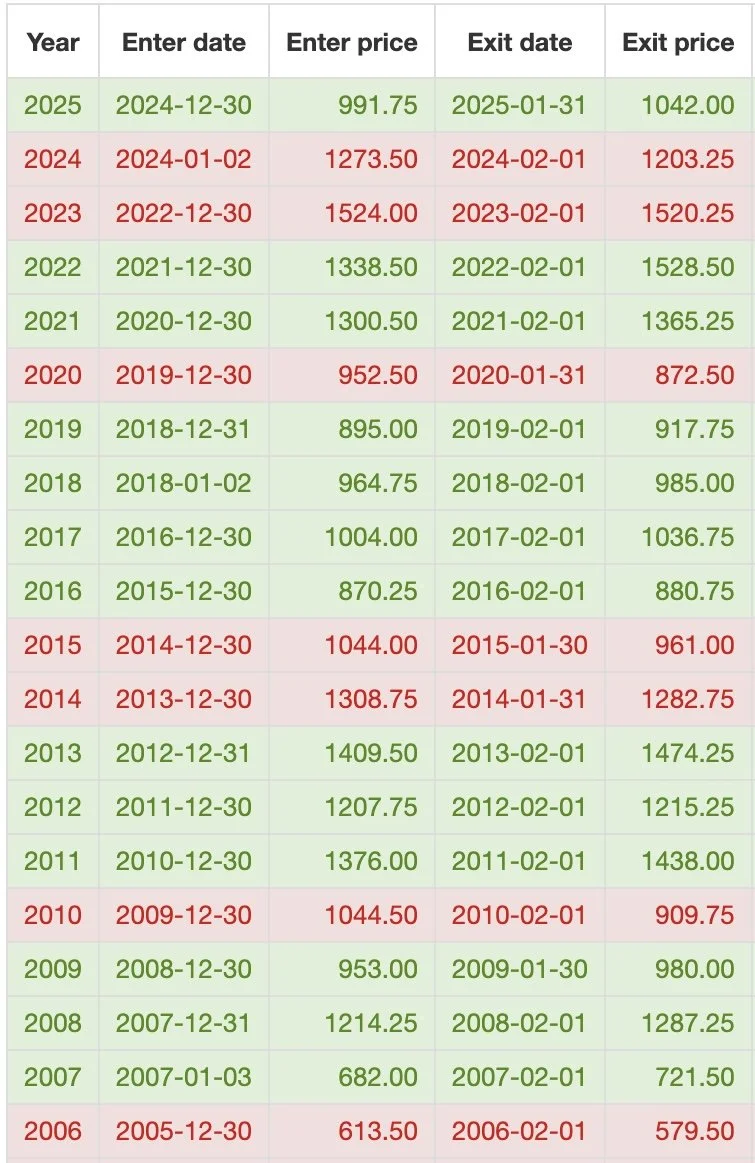
This is July soybeans.
Here is the data for March soybeans from today until February 1st.
The data leans friendly, but not as overly convincing like the corn data.
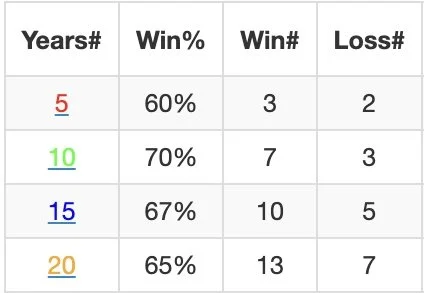
We've traded higher the last:
3 of 5 years (60%)
7 of 10 years (70%)
10 of 15 years (67%)
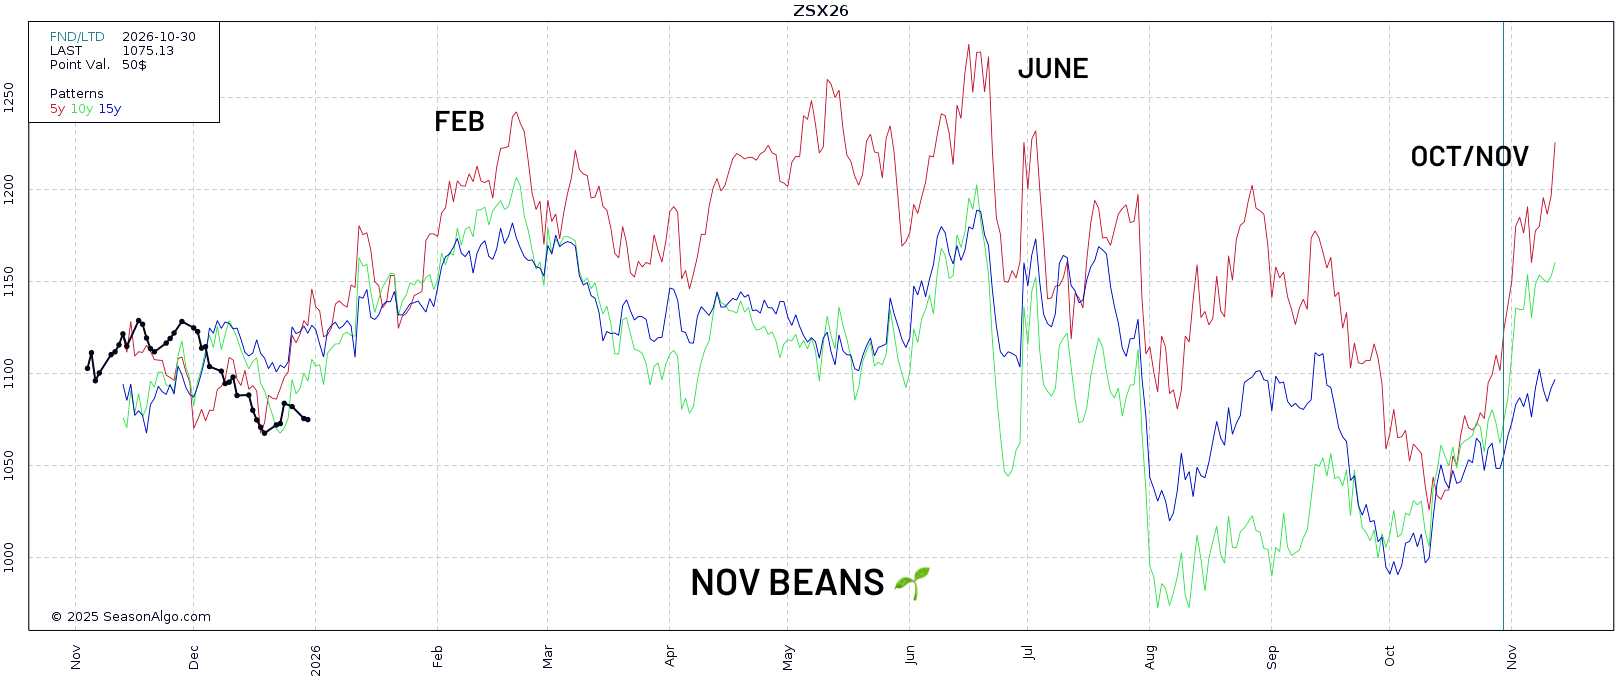
Here is Nov soybeans to give you a bigger picture.
We typically get 3 different rallies.
One going into February, June, and November.
Wheat
July wheat usually sees two opportunities.
We typically head higher in February, get a pullback, then get the final opportunity around May.
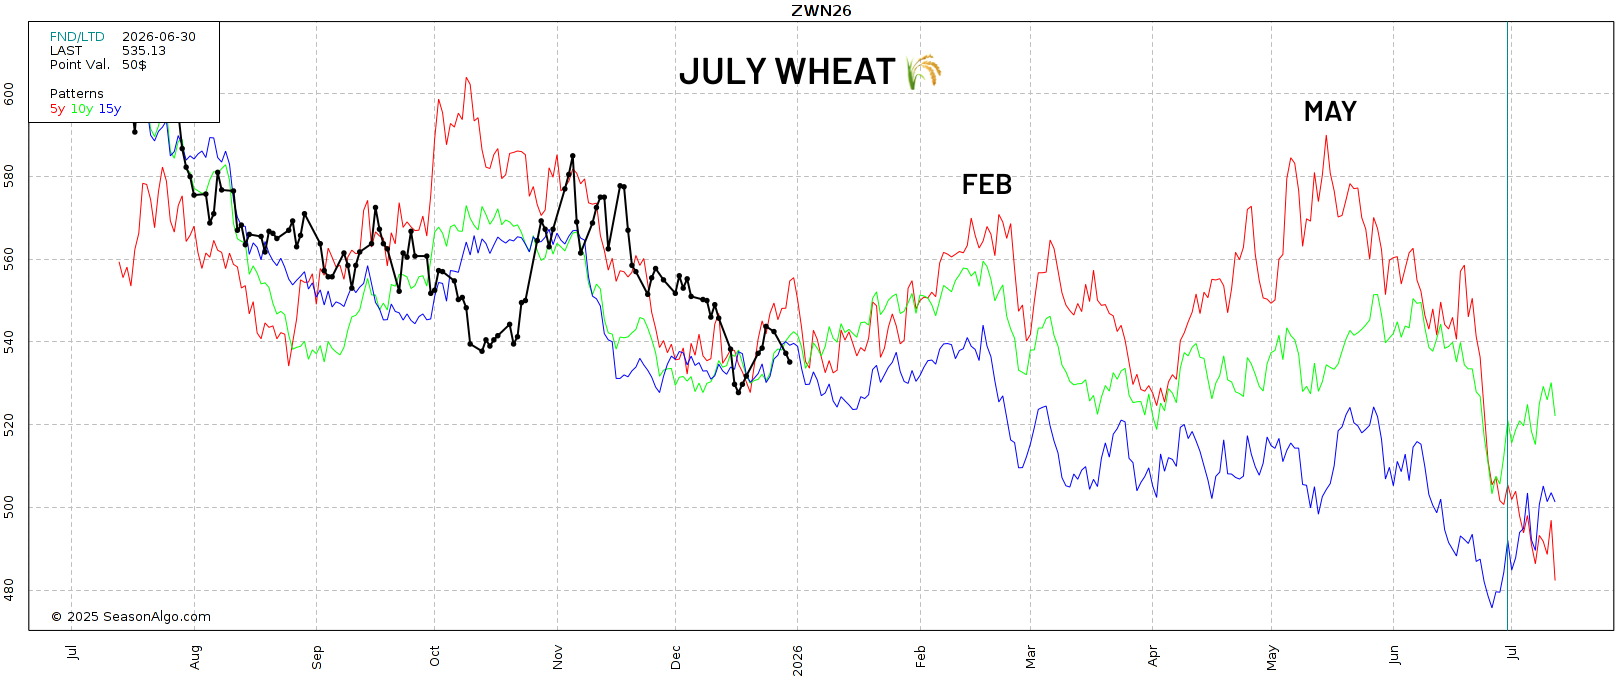
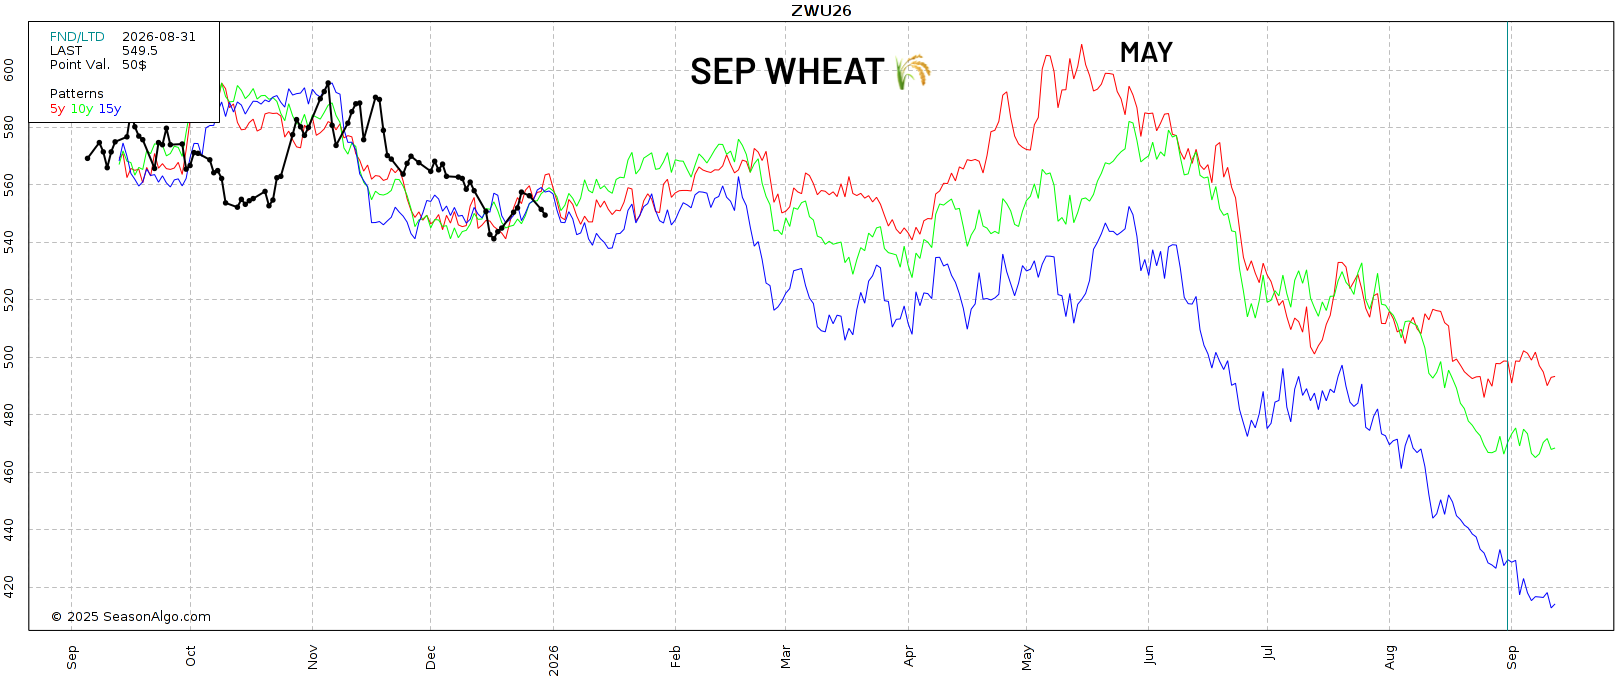
After that May opportunity, the market usually completely falls apart.
Here is Sep wheat to give you a good visual of that collapse we seasonally get.
Feeder Cattle
Here is March feeders.
We got that seasonal low about a month later than usual.
We now do tend to trend higher into February as well like the rest of the grains.
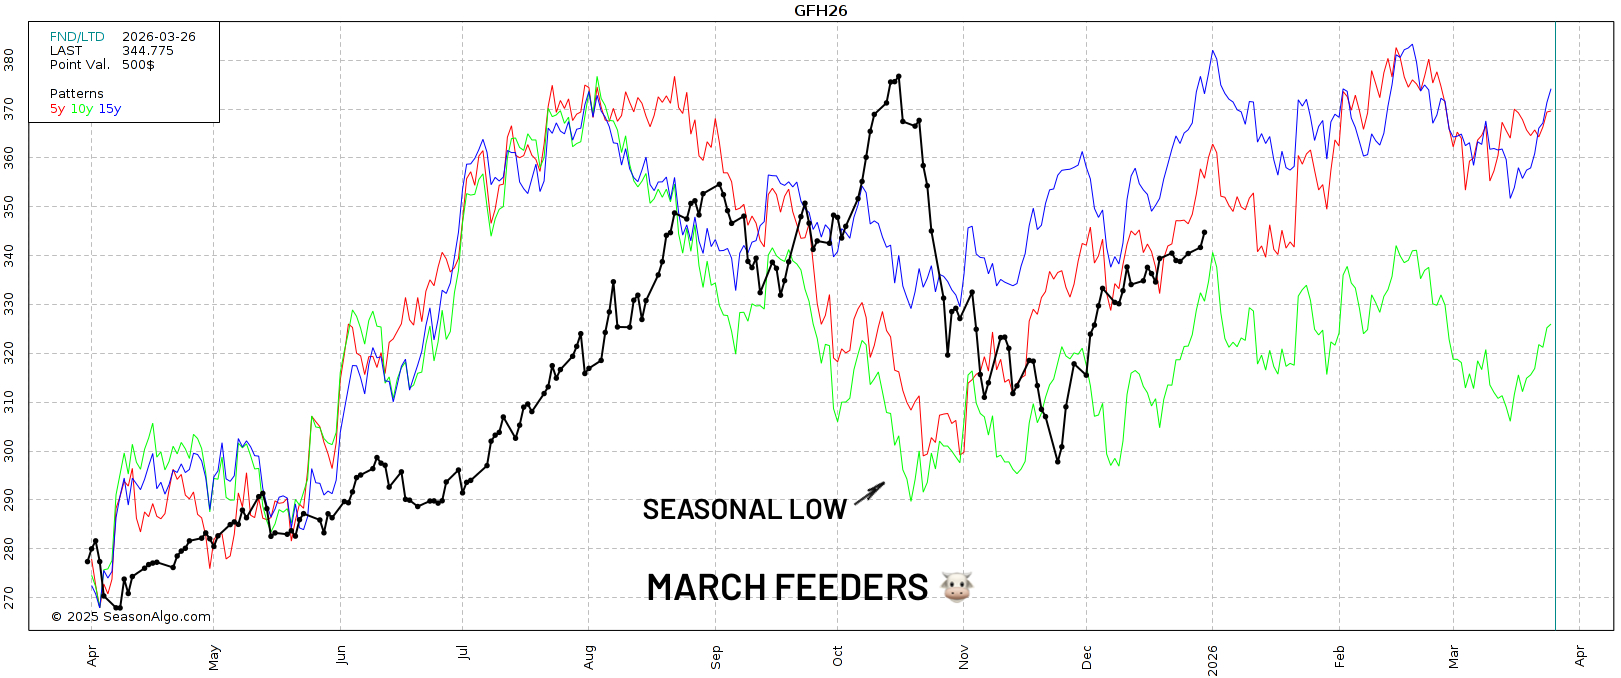
Feeders typically see two tops.
One around February to March. Then a pullback into spring.
Followed by the real top that usually comes in July and August.
Today's Main Takeaways
Corn
Fundamentals:
Yesterday corn posted it's largest daily loss in over a month.
Fundamentally, nothing has changed.
Demand is great. So every break ends up being bought.
We have a ton of supply. So every rally runs out of steam.
Export inspections are up over +65% vs last year.
Yet, the USDA is only projecting exports to be up around +13% compared to last year.
So you could easily argue exports are going to need to be bumped further.
Yield should be coming down in January. I think that is pretty clear.
The issue is that most think the USDA is going to offset some of that supply loss by cutting feed demand.
To get a corn balance sheet as tight as last year, it would take yield falling down to 182 while at the same time not touching demand at all.
That would give you a 10.25% stocks to use ratio, about on par with last year.
Altough I think we could follow a similar pattern price action wise.
It is hard to think that corn has more upside than last year based on what we know today.
Simply given that it's harder to create some mega bullish story that is friendlier than last year, unless yield is drastically lower.
Last year, the corn market topped out at just over $5.00 with a 1.54 billion bu carryout in February. Last year, we had a 1.74 billion carryout in December.
We still have a 2 billion bu carryout today.
Record demand should prevent this market from completely falling apart.
Seasonally we trend higher from here.
We should see some sort of yield reduction come January.
The bigger question is how much, and how the USDA responds on the demand side.
Do they bump exports? Do they cut feed demand?
We have to keep in mind that we're coming off a record crop fueled by record acres. This makes it harder for the balance sheet to tighten in a big way. Which makes me think our upside is capped in that $4.70 to $5.00 range for now.
Of course, we could run into a weather scare this summer. The USDA could throw a majorly bullish surprise. China could buy corn. We could go beyond $5.00
But for now, those are all just wild cards.
My bias leans higher from here, but upside feels somewhat limited unless one of those cards is drawn to shake things up.
Technicals:
March Corn
Back to the range we go.
We've essentially traded between $4.40 and $4.50 since October.
A very brutal sideways range of just 10 cents for the last 70 days.
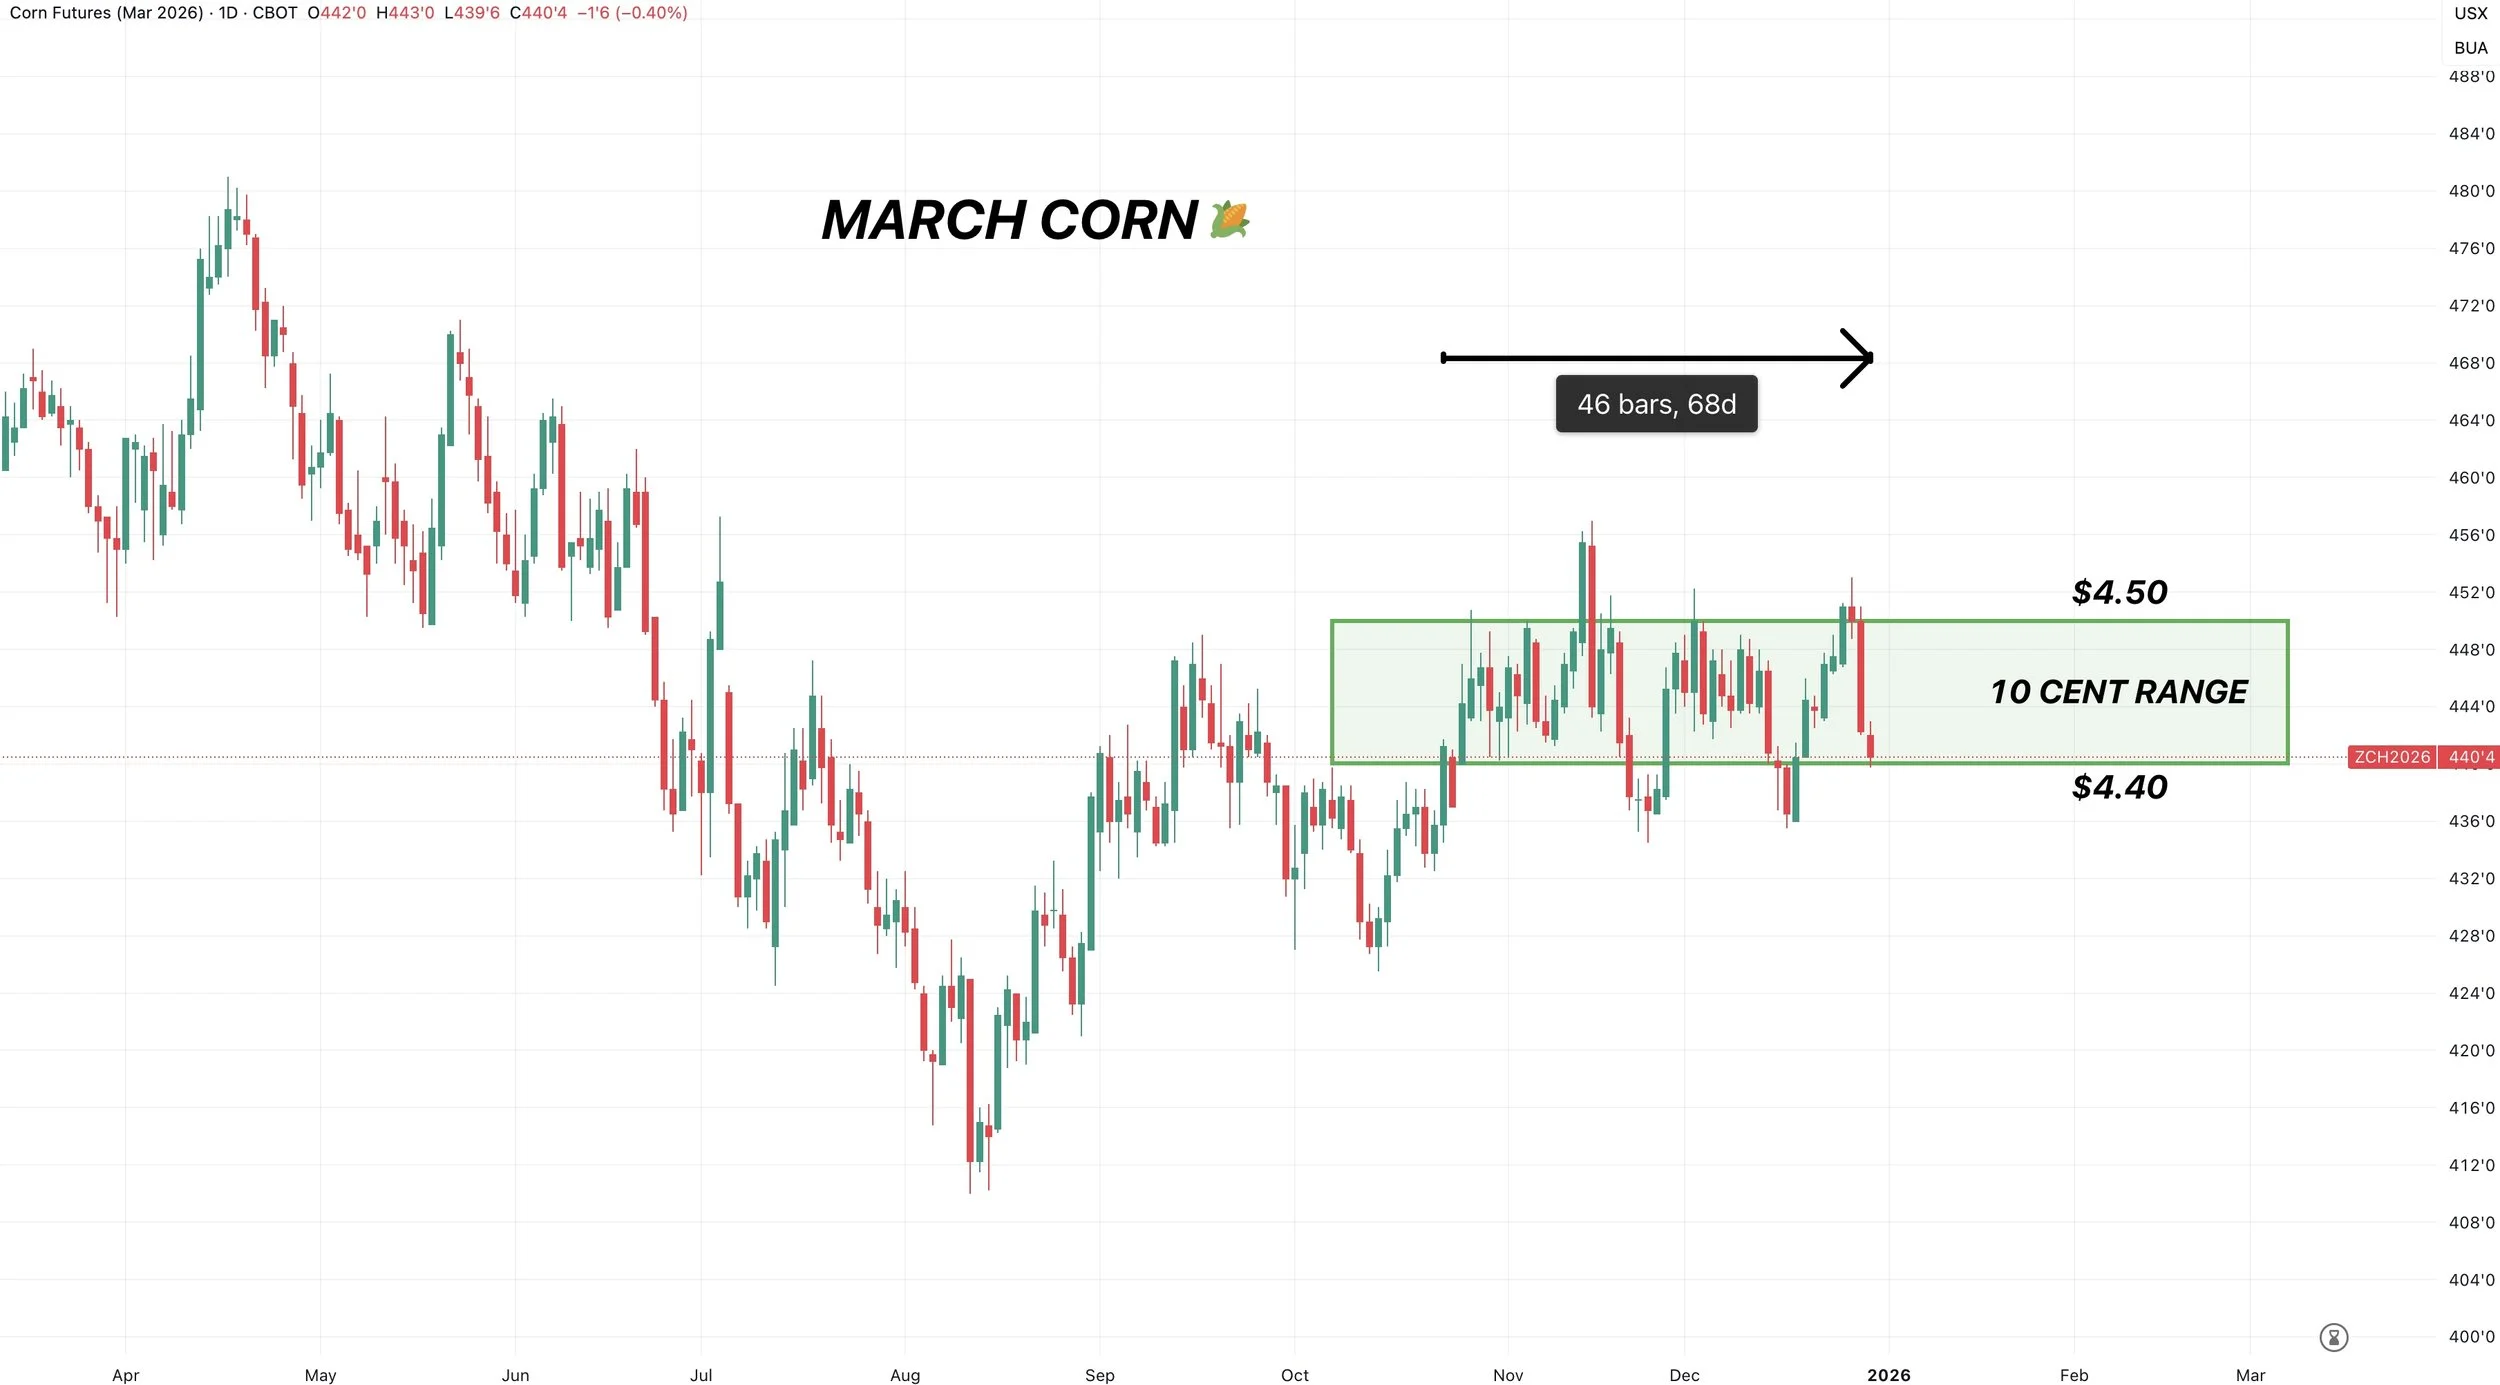
Here is the weekly chart.
$4.50 is the clear level we need to break through to get bulls excited and be confident this market is ready for the next leg higher.
It was key support from spring.
We've failed there the last 7 of 10 weeks.
It claws back 50% of the Feb highs.
Break above and it should spark further upside.
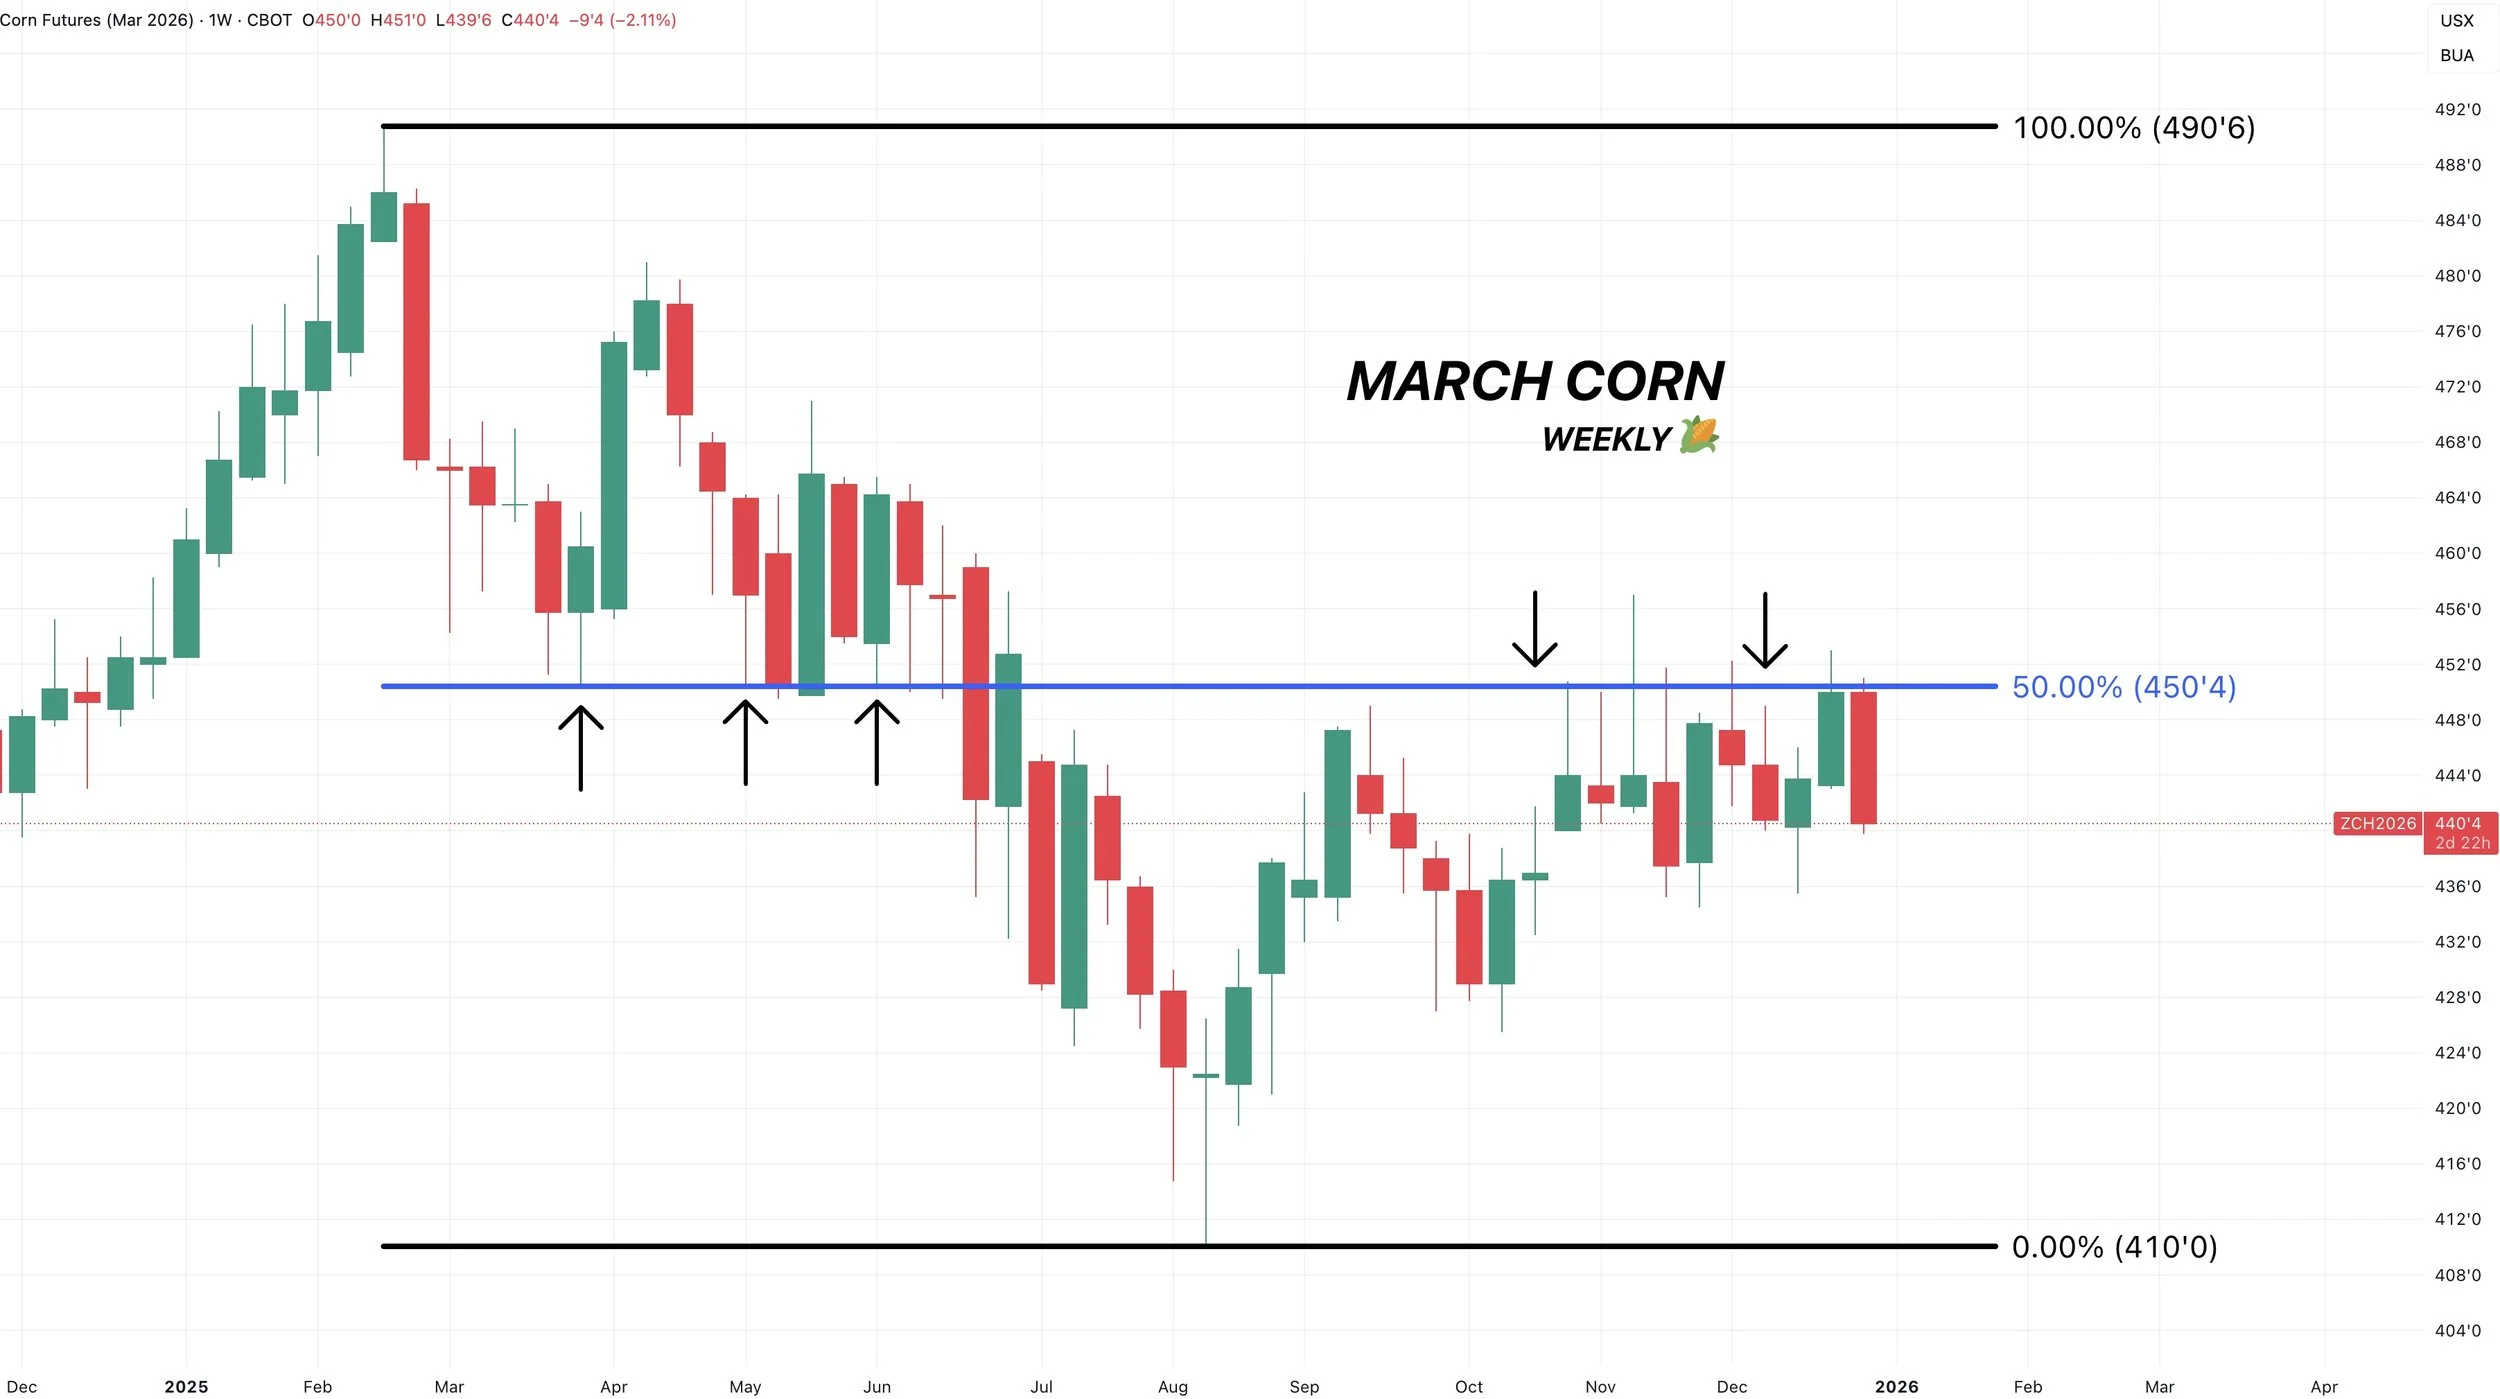
Right now we are simply range bound.
If we take out $4.50, we should go higher.
But if we were to take out those $4.35 lows the next point of interest would be the blue box.
I'd be looking to re-own around that level if it came.
As that is the 50-61.8% level down to contract lows.
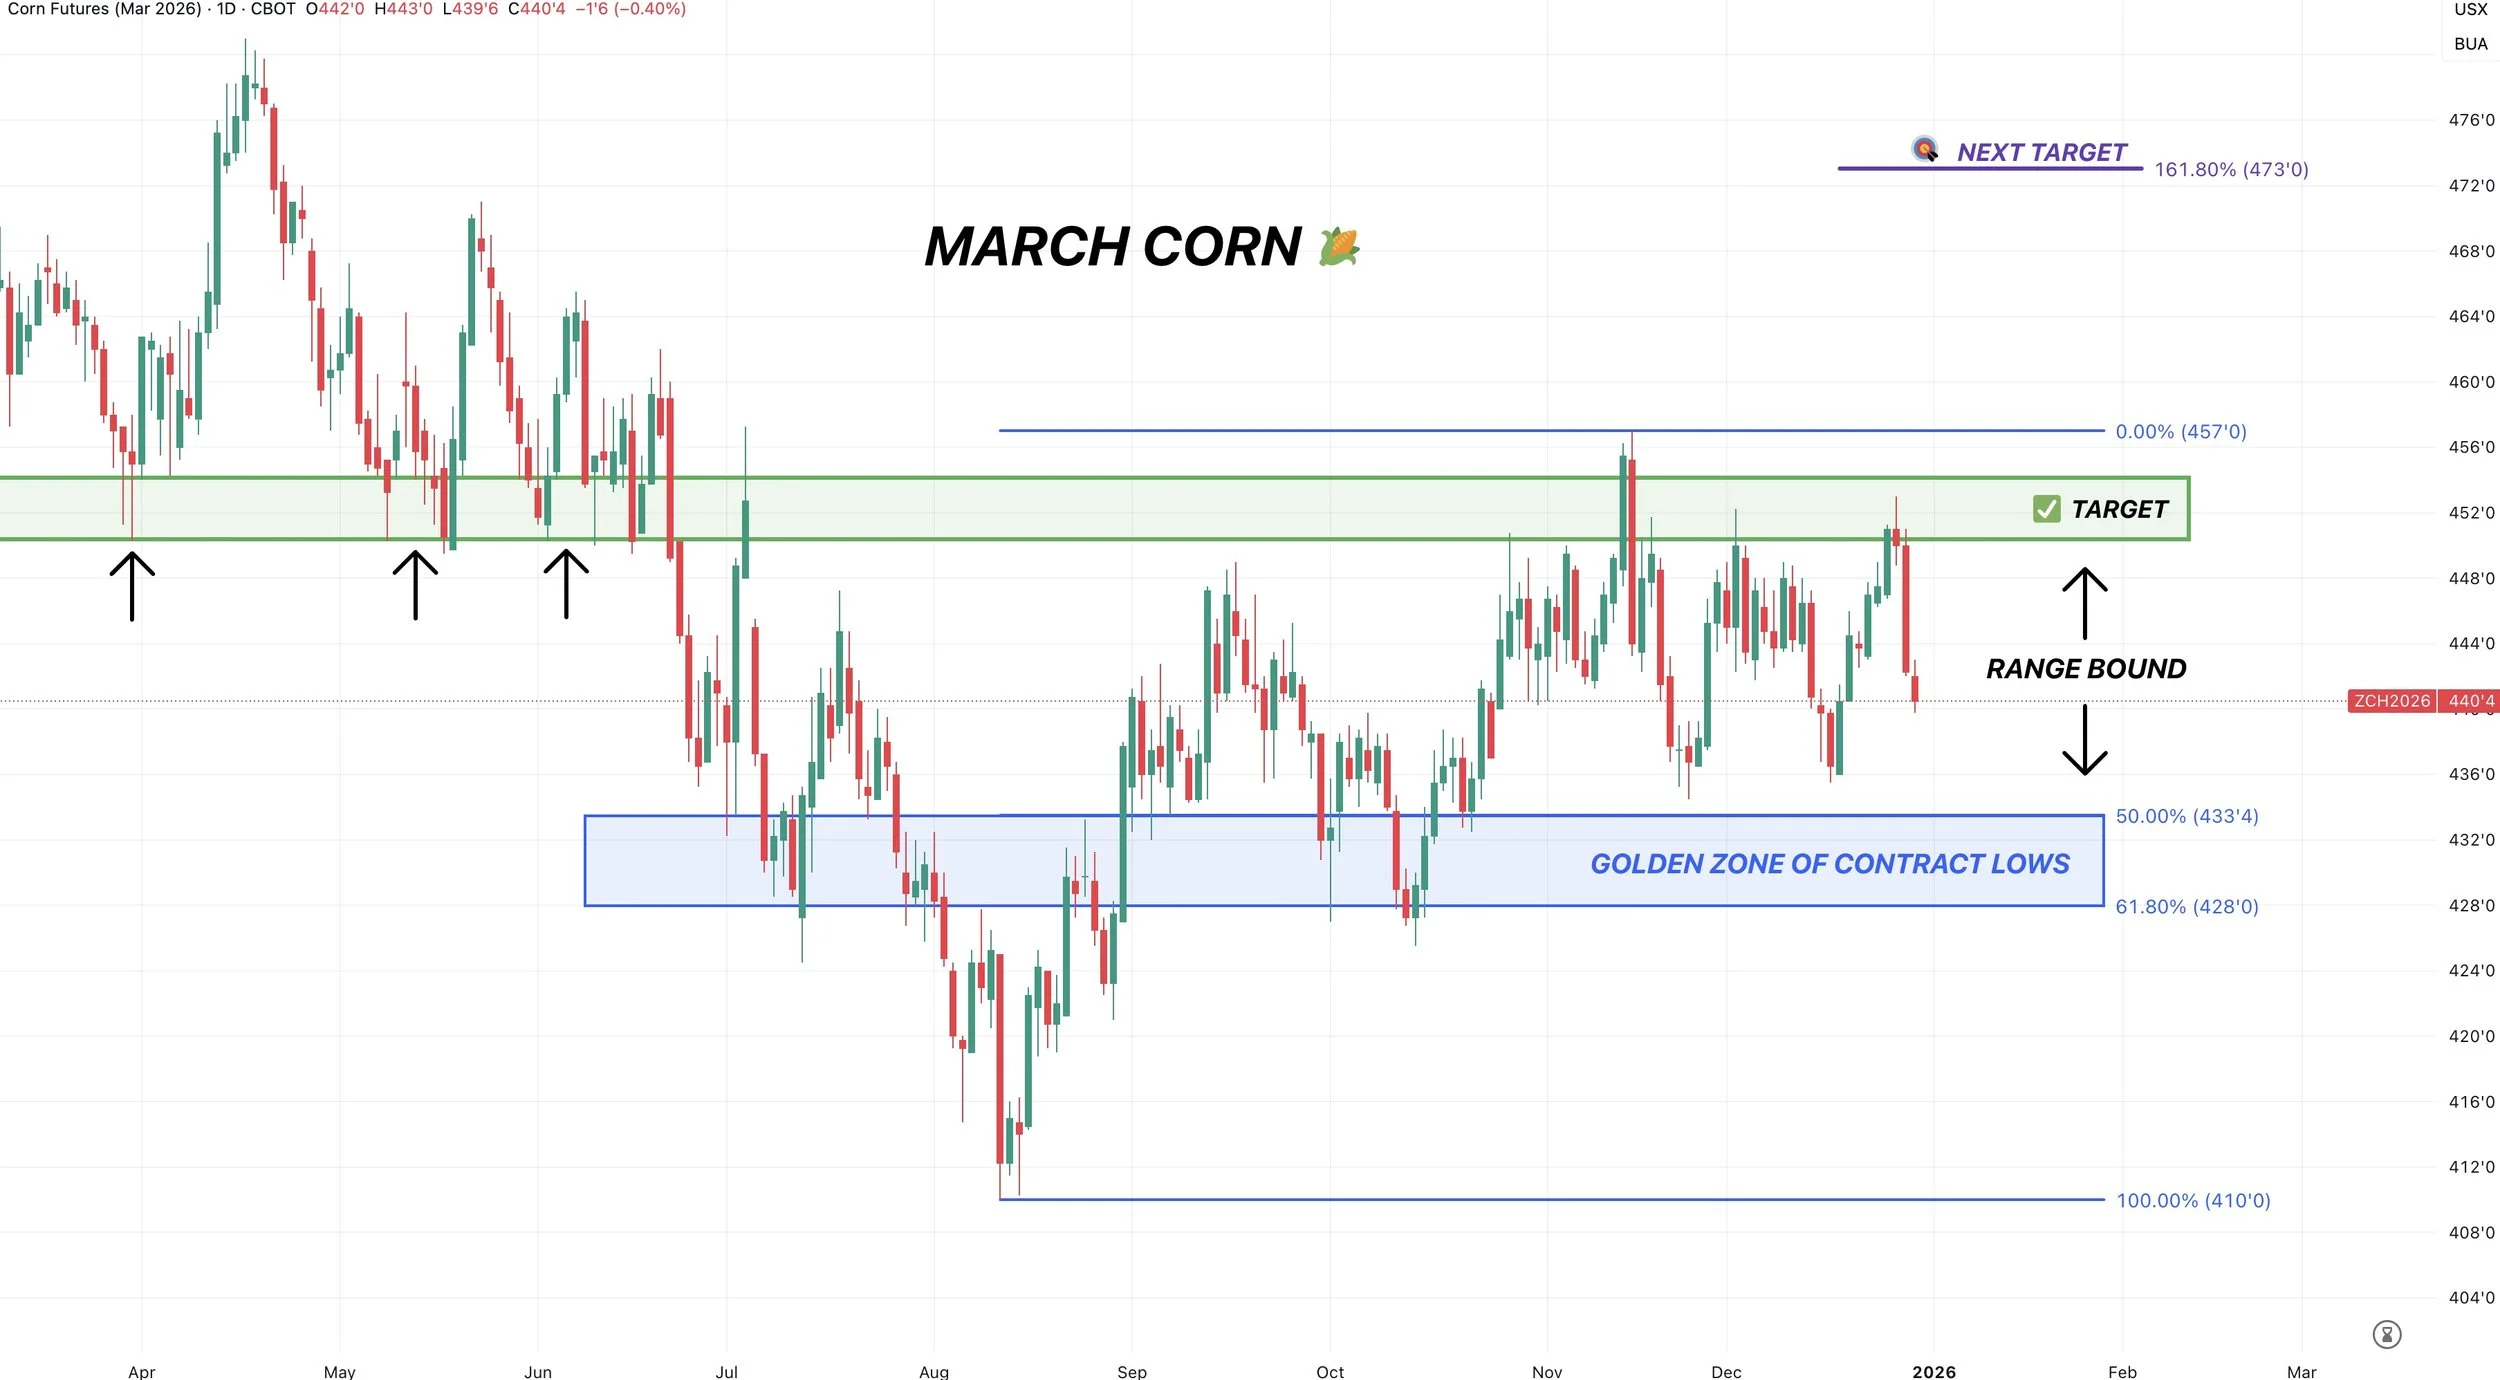
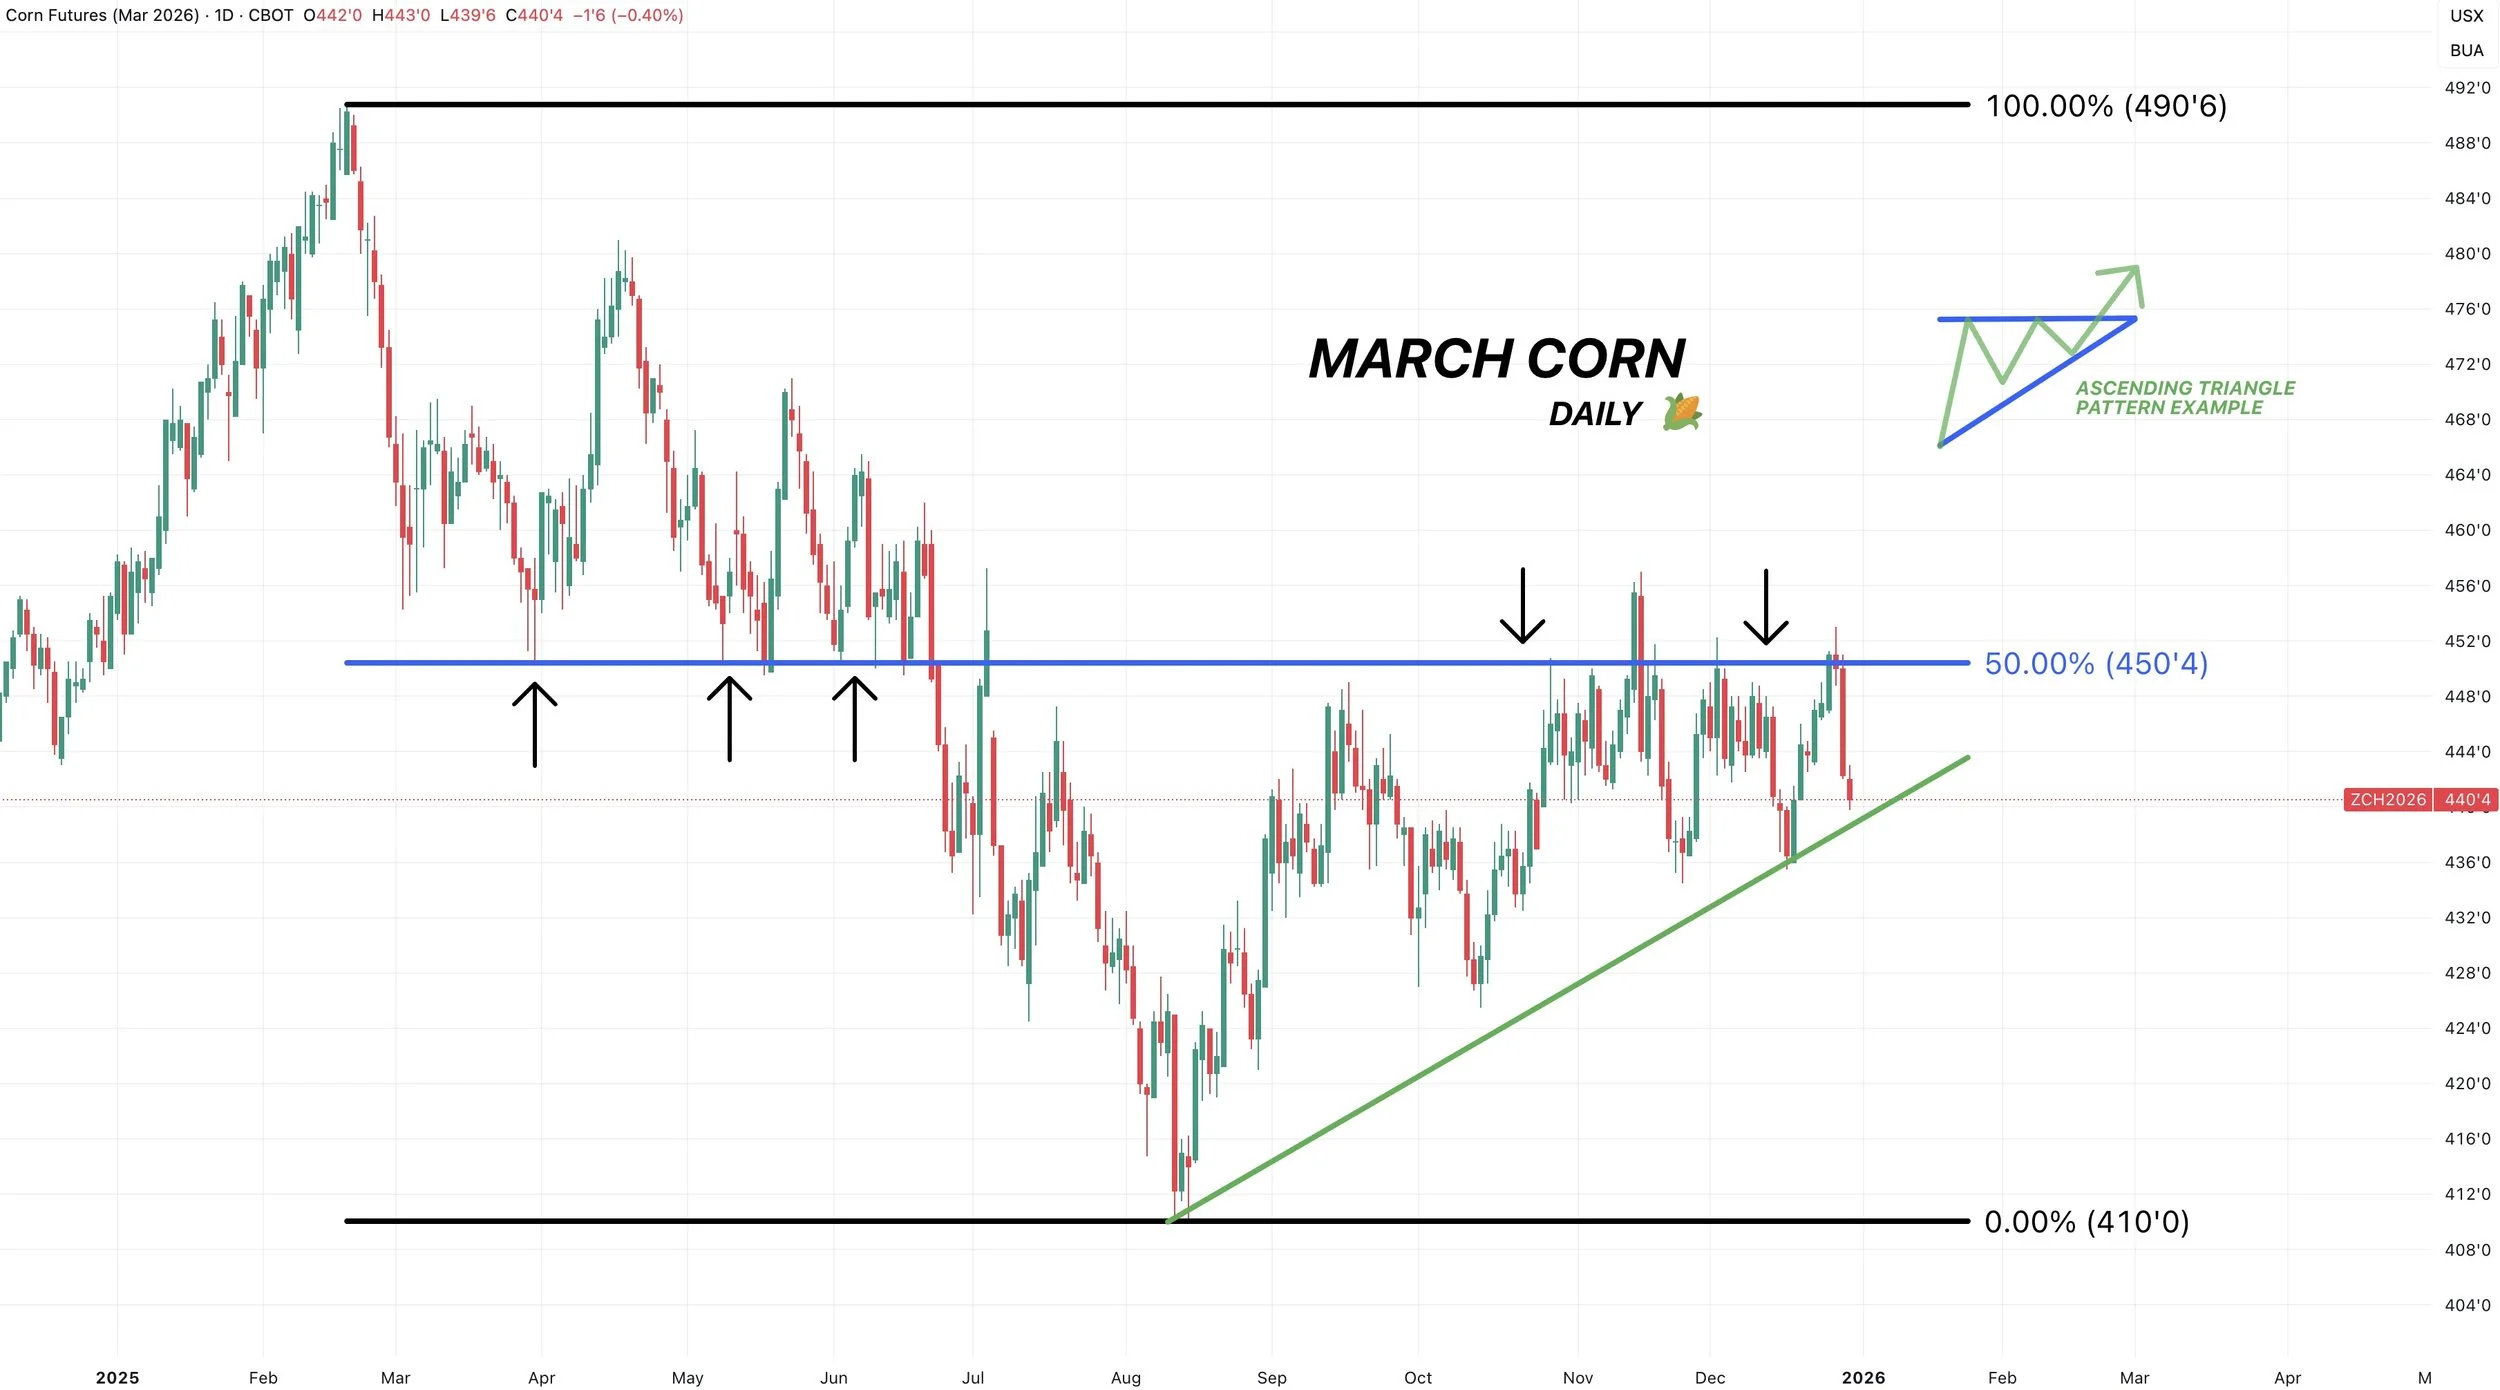
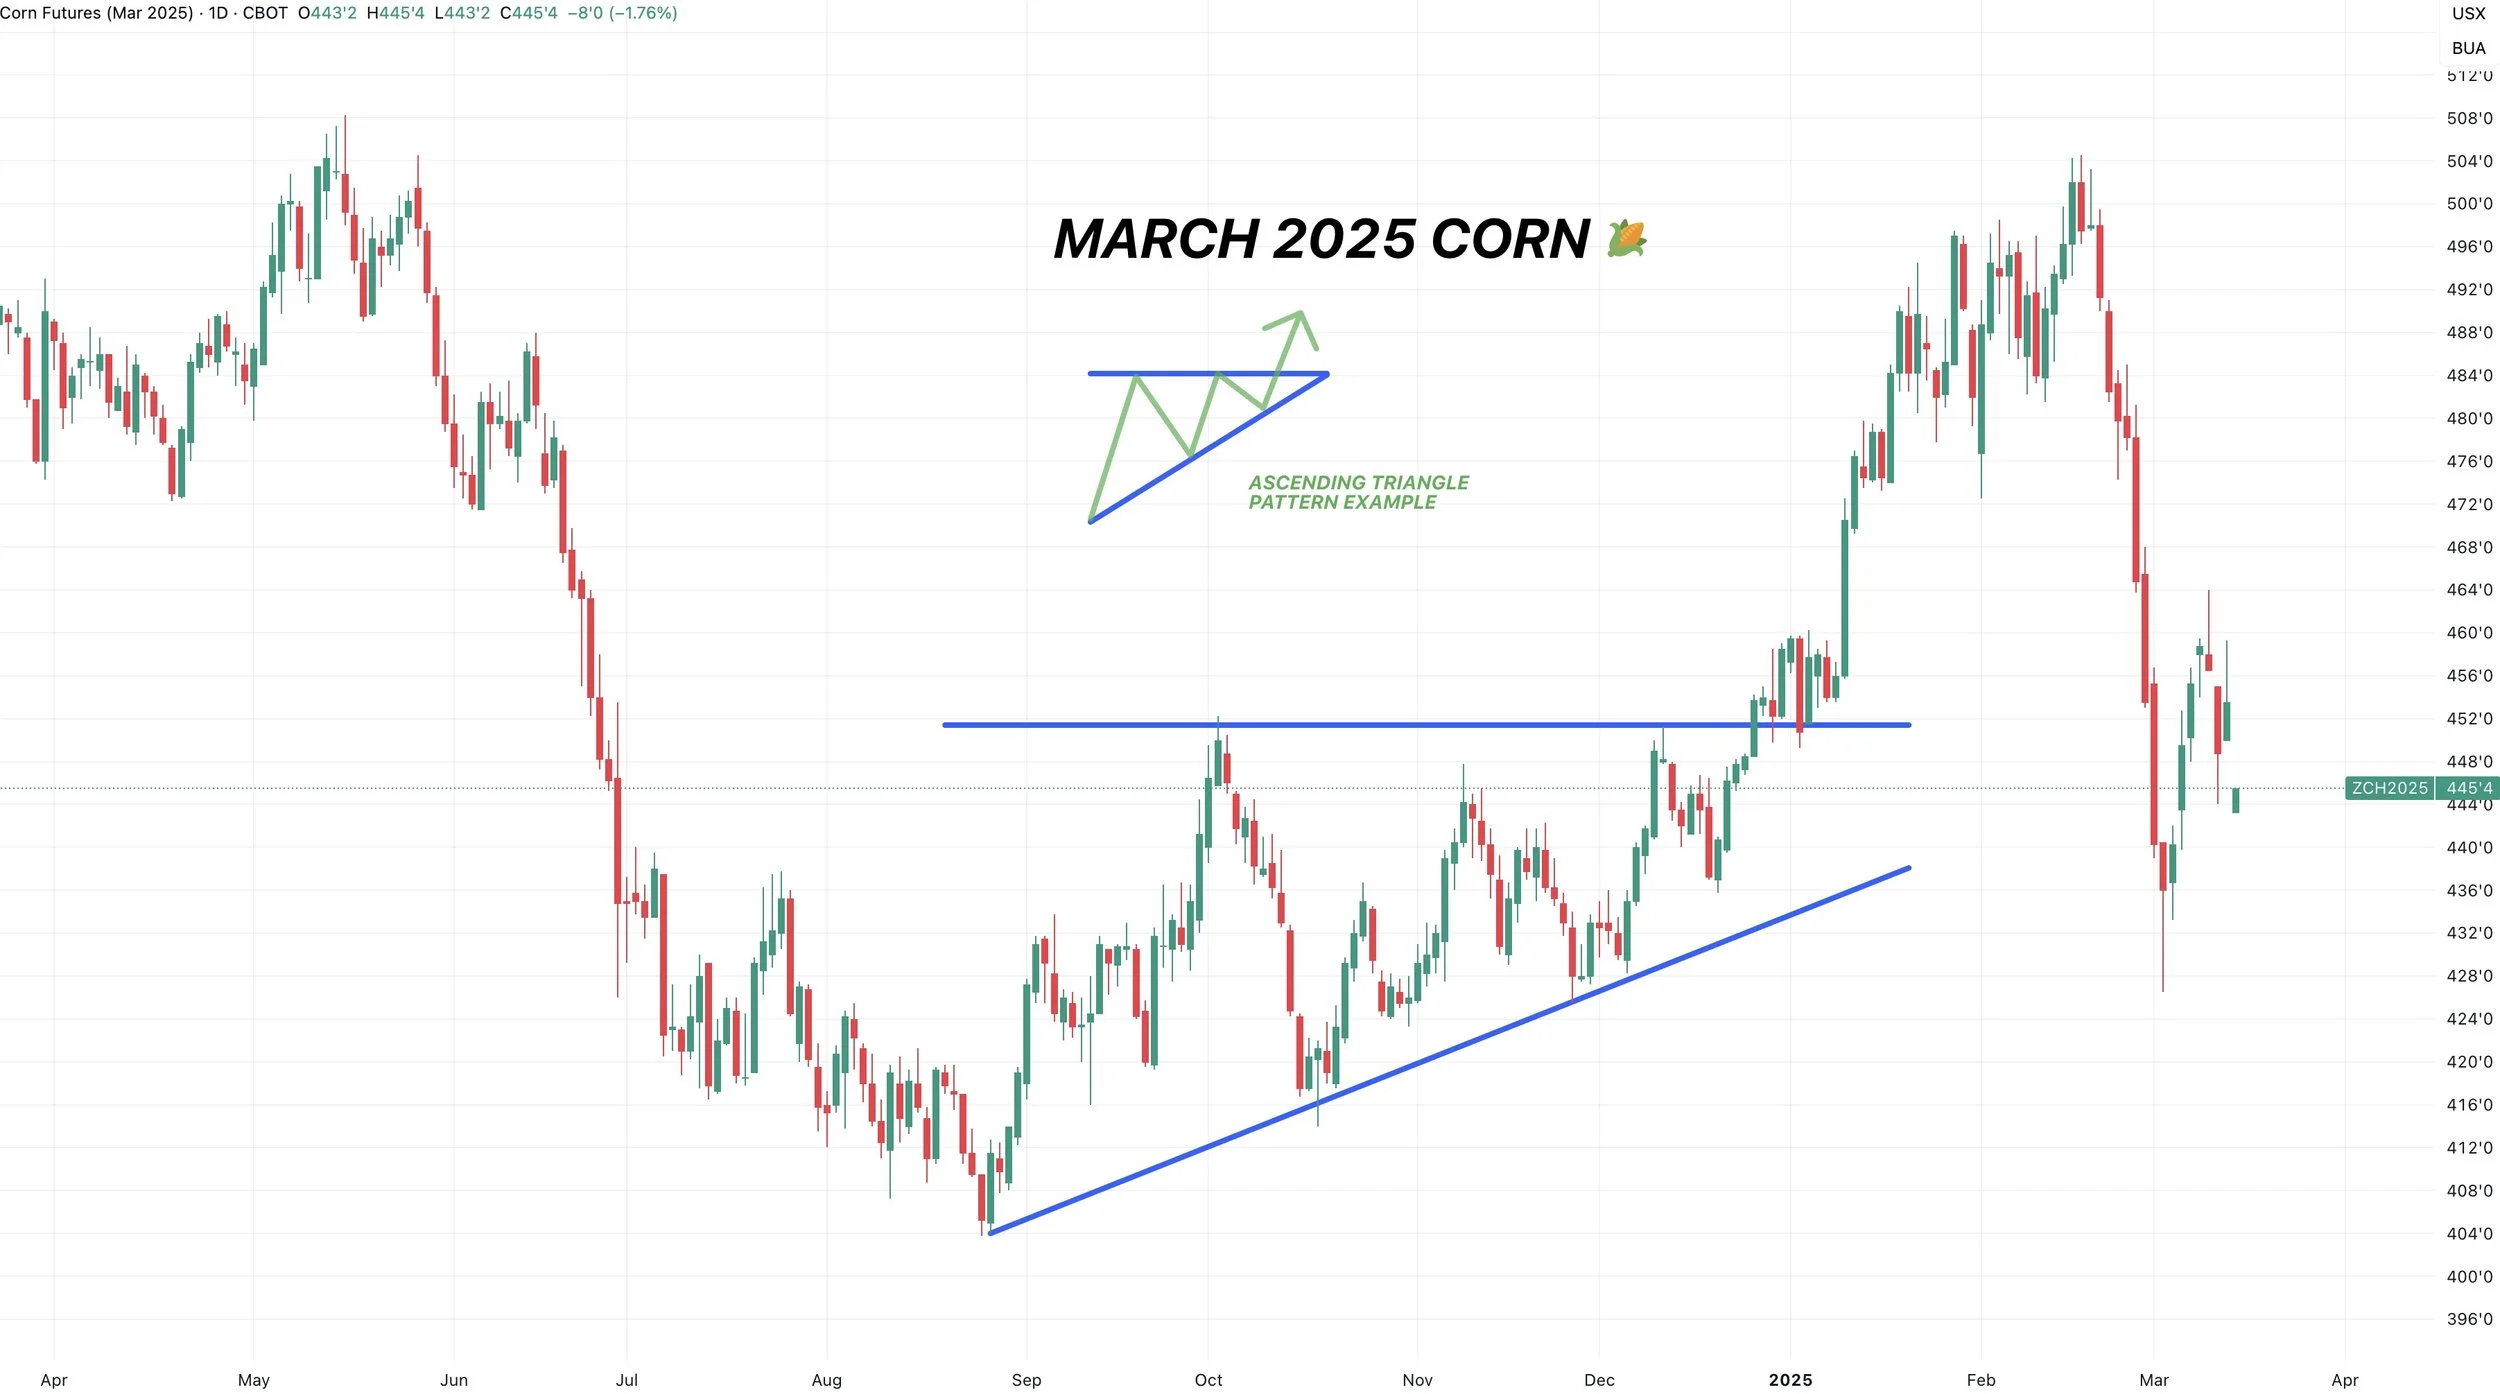
Ascending Triangle: March 2025 & 2026
We have a possible ascending triangle pattern developing on the charts.
Which is where you have horizontal resistance, but an uptrend of support.
This is a very similar pattern to what we saw in March corn last year before we ultimately broke out in January.
Soybeans
Fundamentals:
The biggest thing soybeans have going for them is that we are oversold.
We dropped over -$1.00 over the course of just 30 days.
Outside of being at an area of interest on the charts and being oversold, fundamentally soybeans don’t have many bullish factors going their way.
Yes, the US situation does have a "path" to become tight.
Arguably an easier path than corn does.
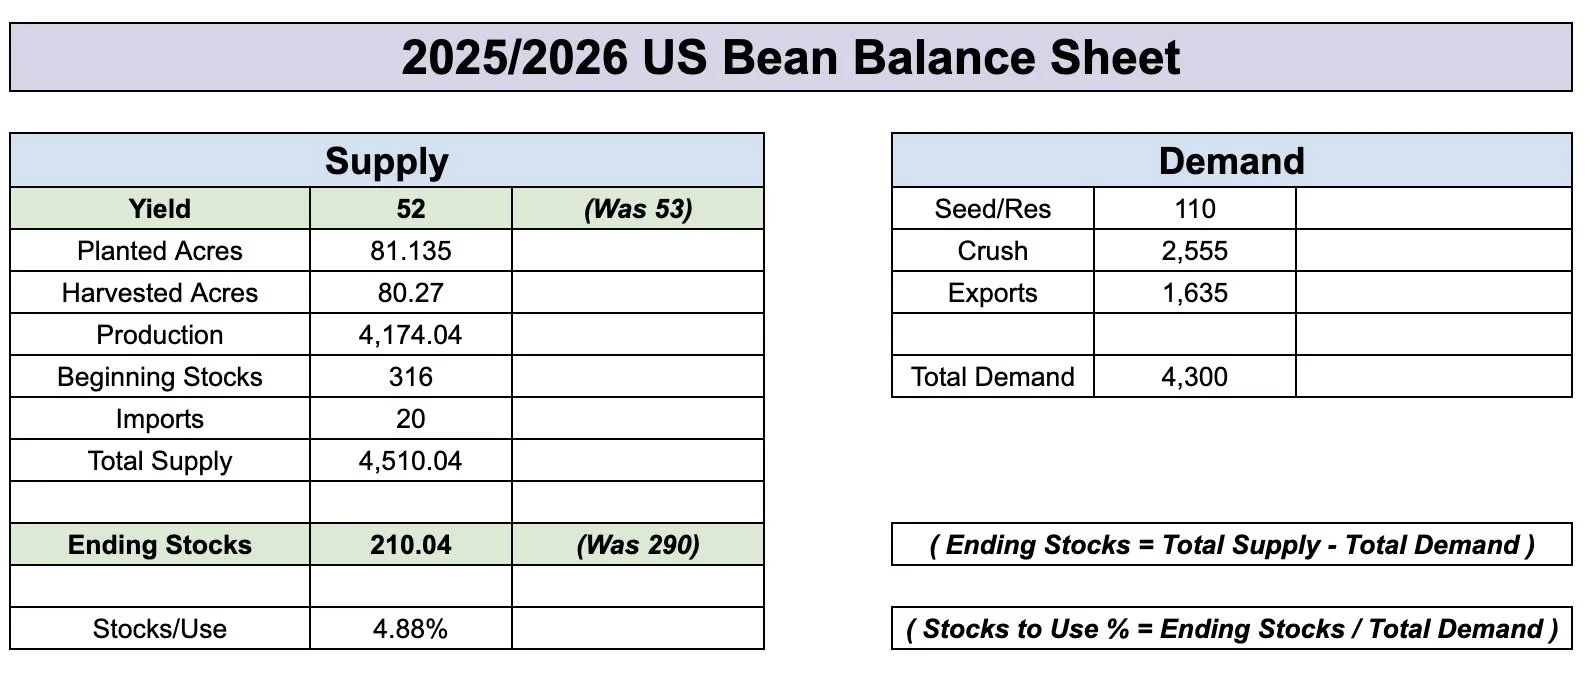
For reference, a 52 yield while leaving demand unchanged results in a near 200 million bushel carryout.
The issue is that you could definitely argue the USDA is going to have to lower export demand.
Which would offset some supply loss if it came.
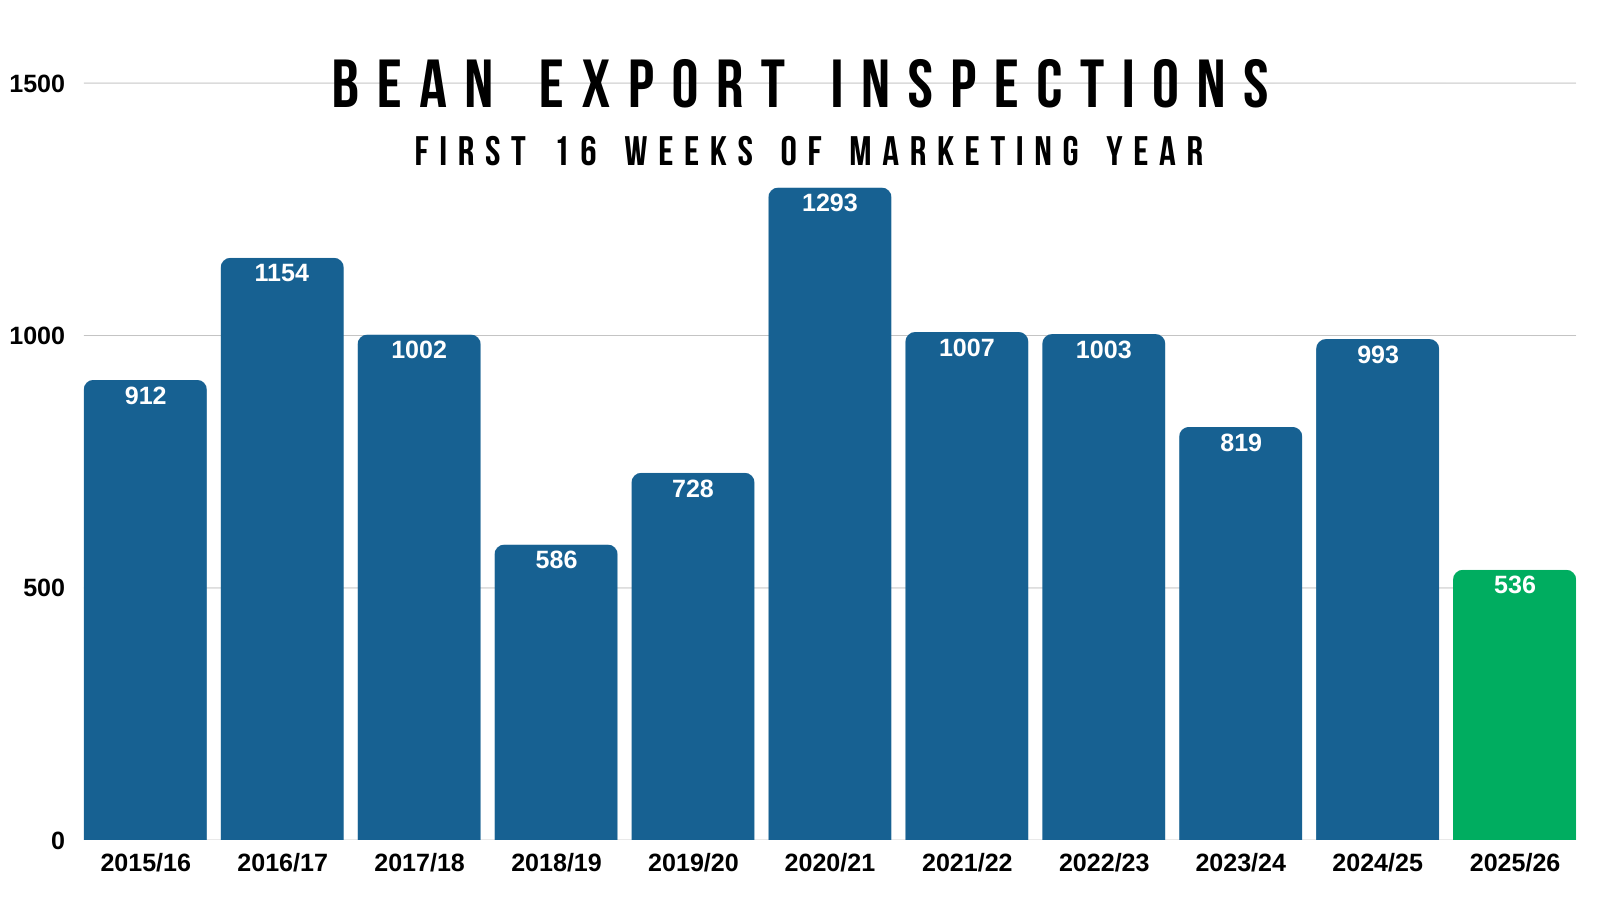
Currently export inspections are down -45% vs last year.
The USDA only expects export demand to be down -13%.
We are already past our prime shipping window.
Who knows if the USDA will lower it, but it’s a concern that the trade is aware of.
At the same time, we've seen virtually zero issues out of Brazil.
We still have not received any sort of trade agreement Rollins claimed we'd be getting several weeks ago.
Bottom line, I do still think we are at an area where soybeans could find some life. But we will want to be looking to reward the relief bounce if it comes. As a major rally might be hard to come by with no issues out of Brazil.
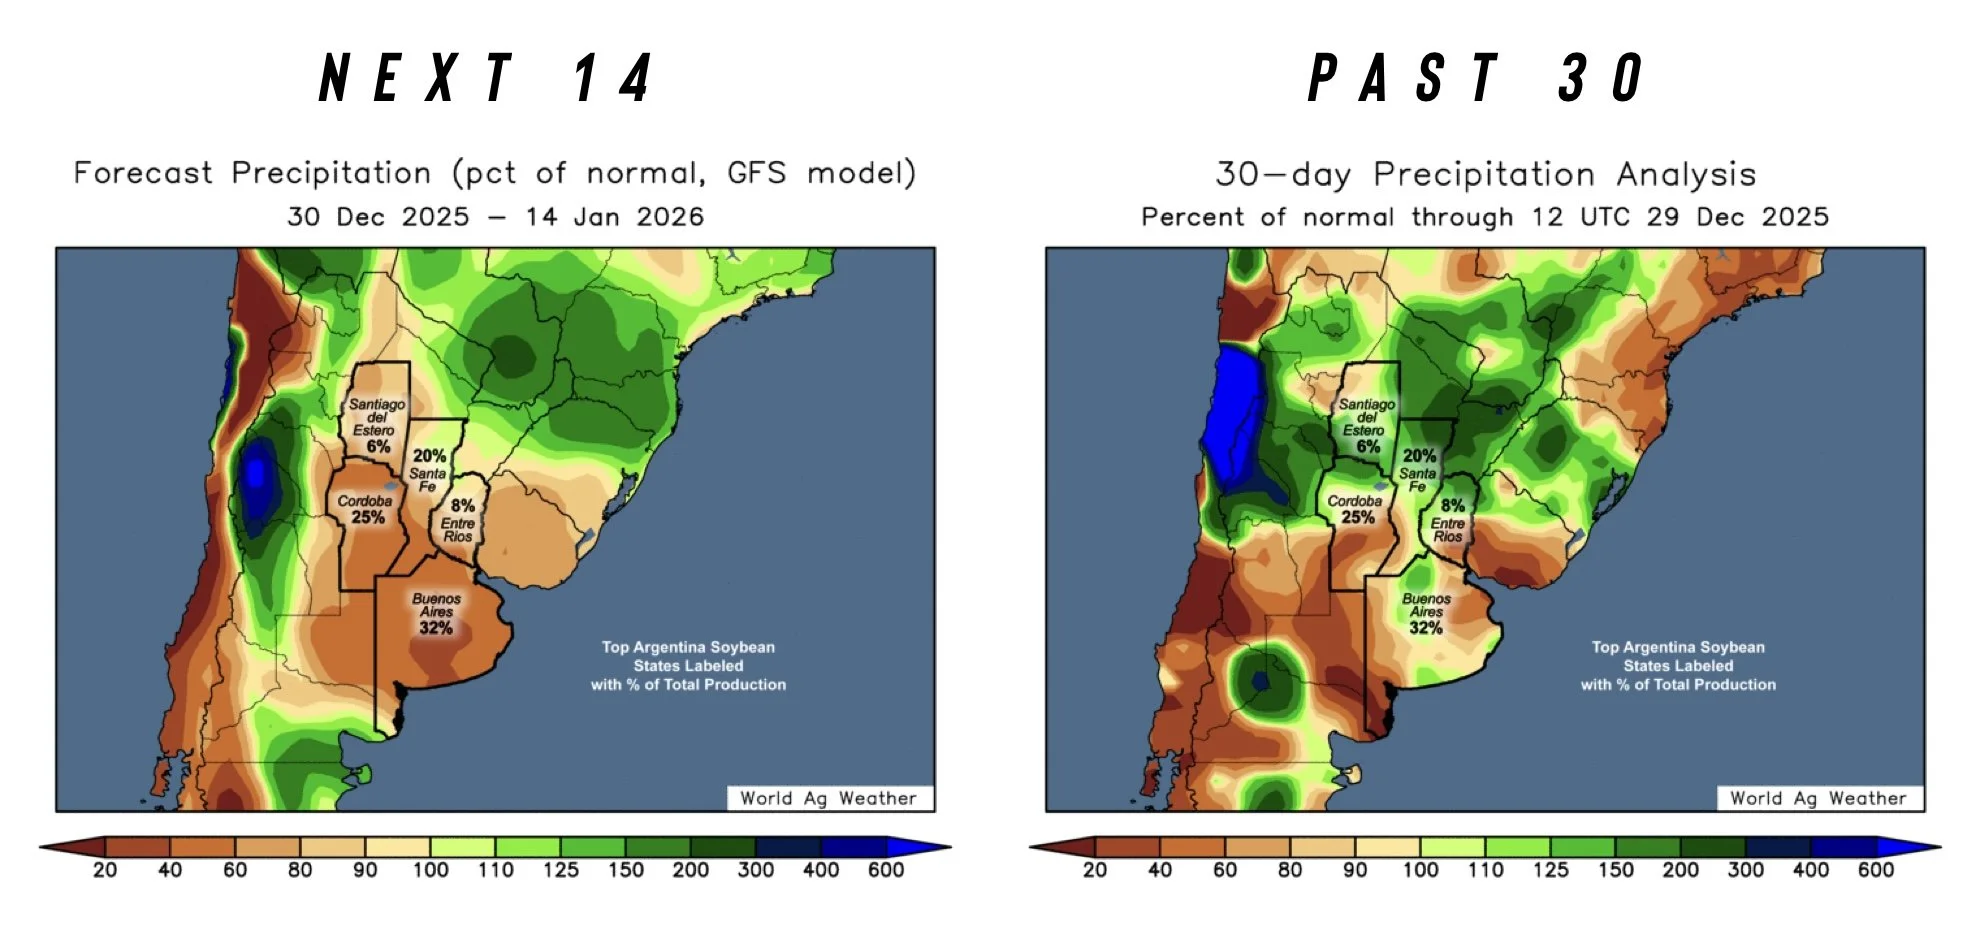
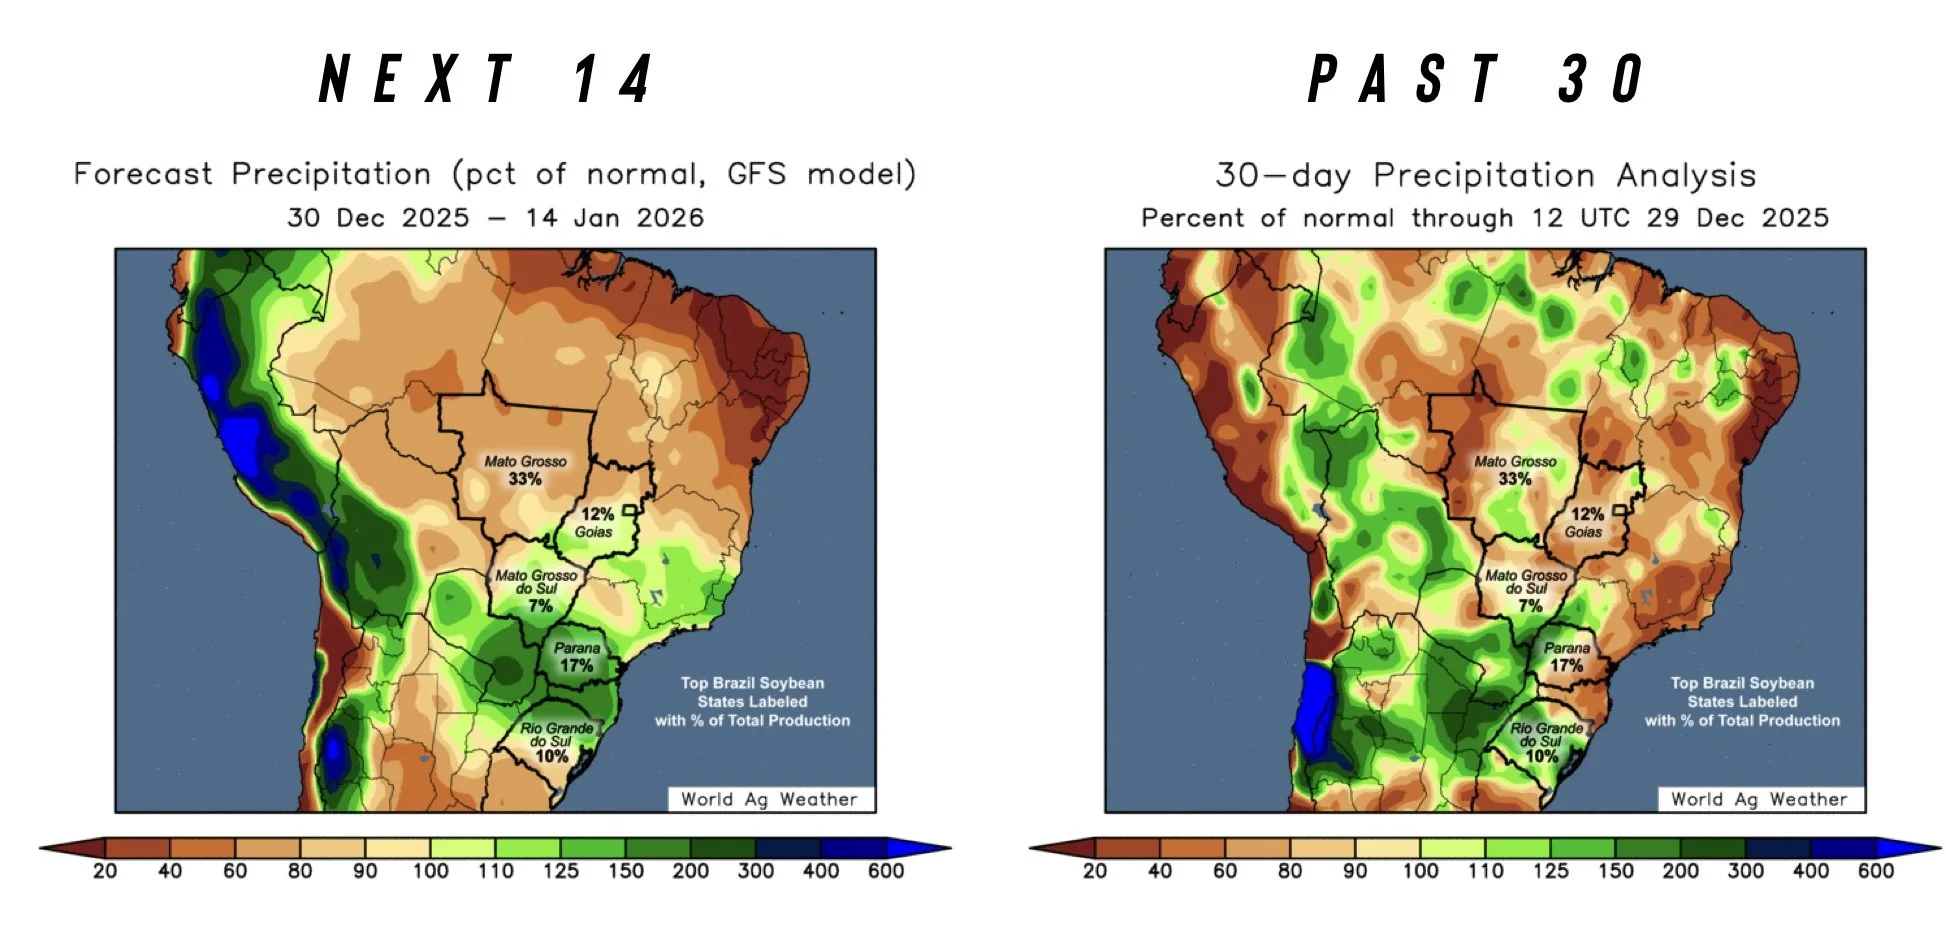
Argentina is supposed to be hot and dry for the next 2 weeks. Only receiving 50% of their normal rainfall. So perhaps that could add some support, but overall not a game changer.
Below is the 2-week forecast vs the last 30 days of precip vs normal.
Argy is dry, but Brazil looks fine for the next 2 weeks.
Neither has had any big concerns the last 30 days.
Technicals:
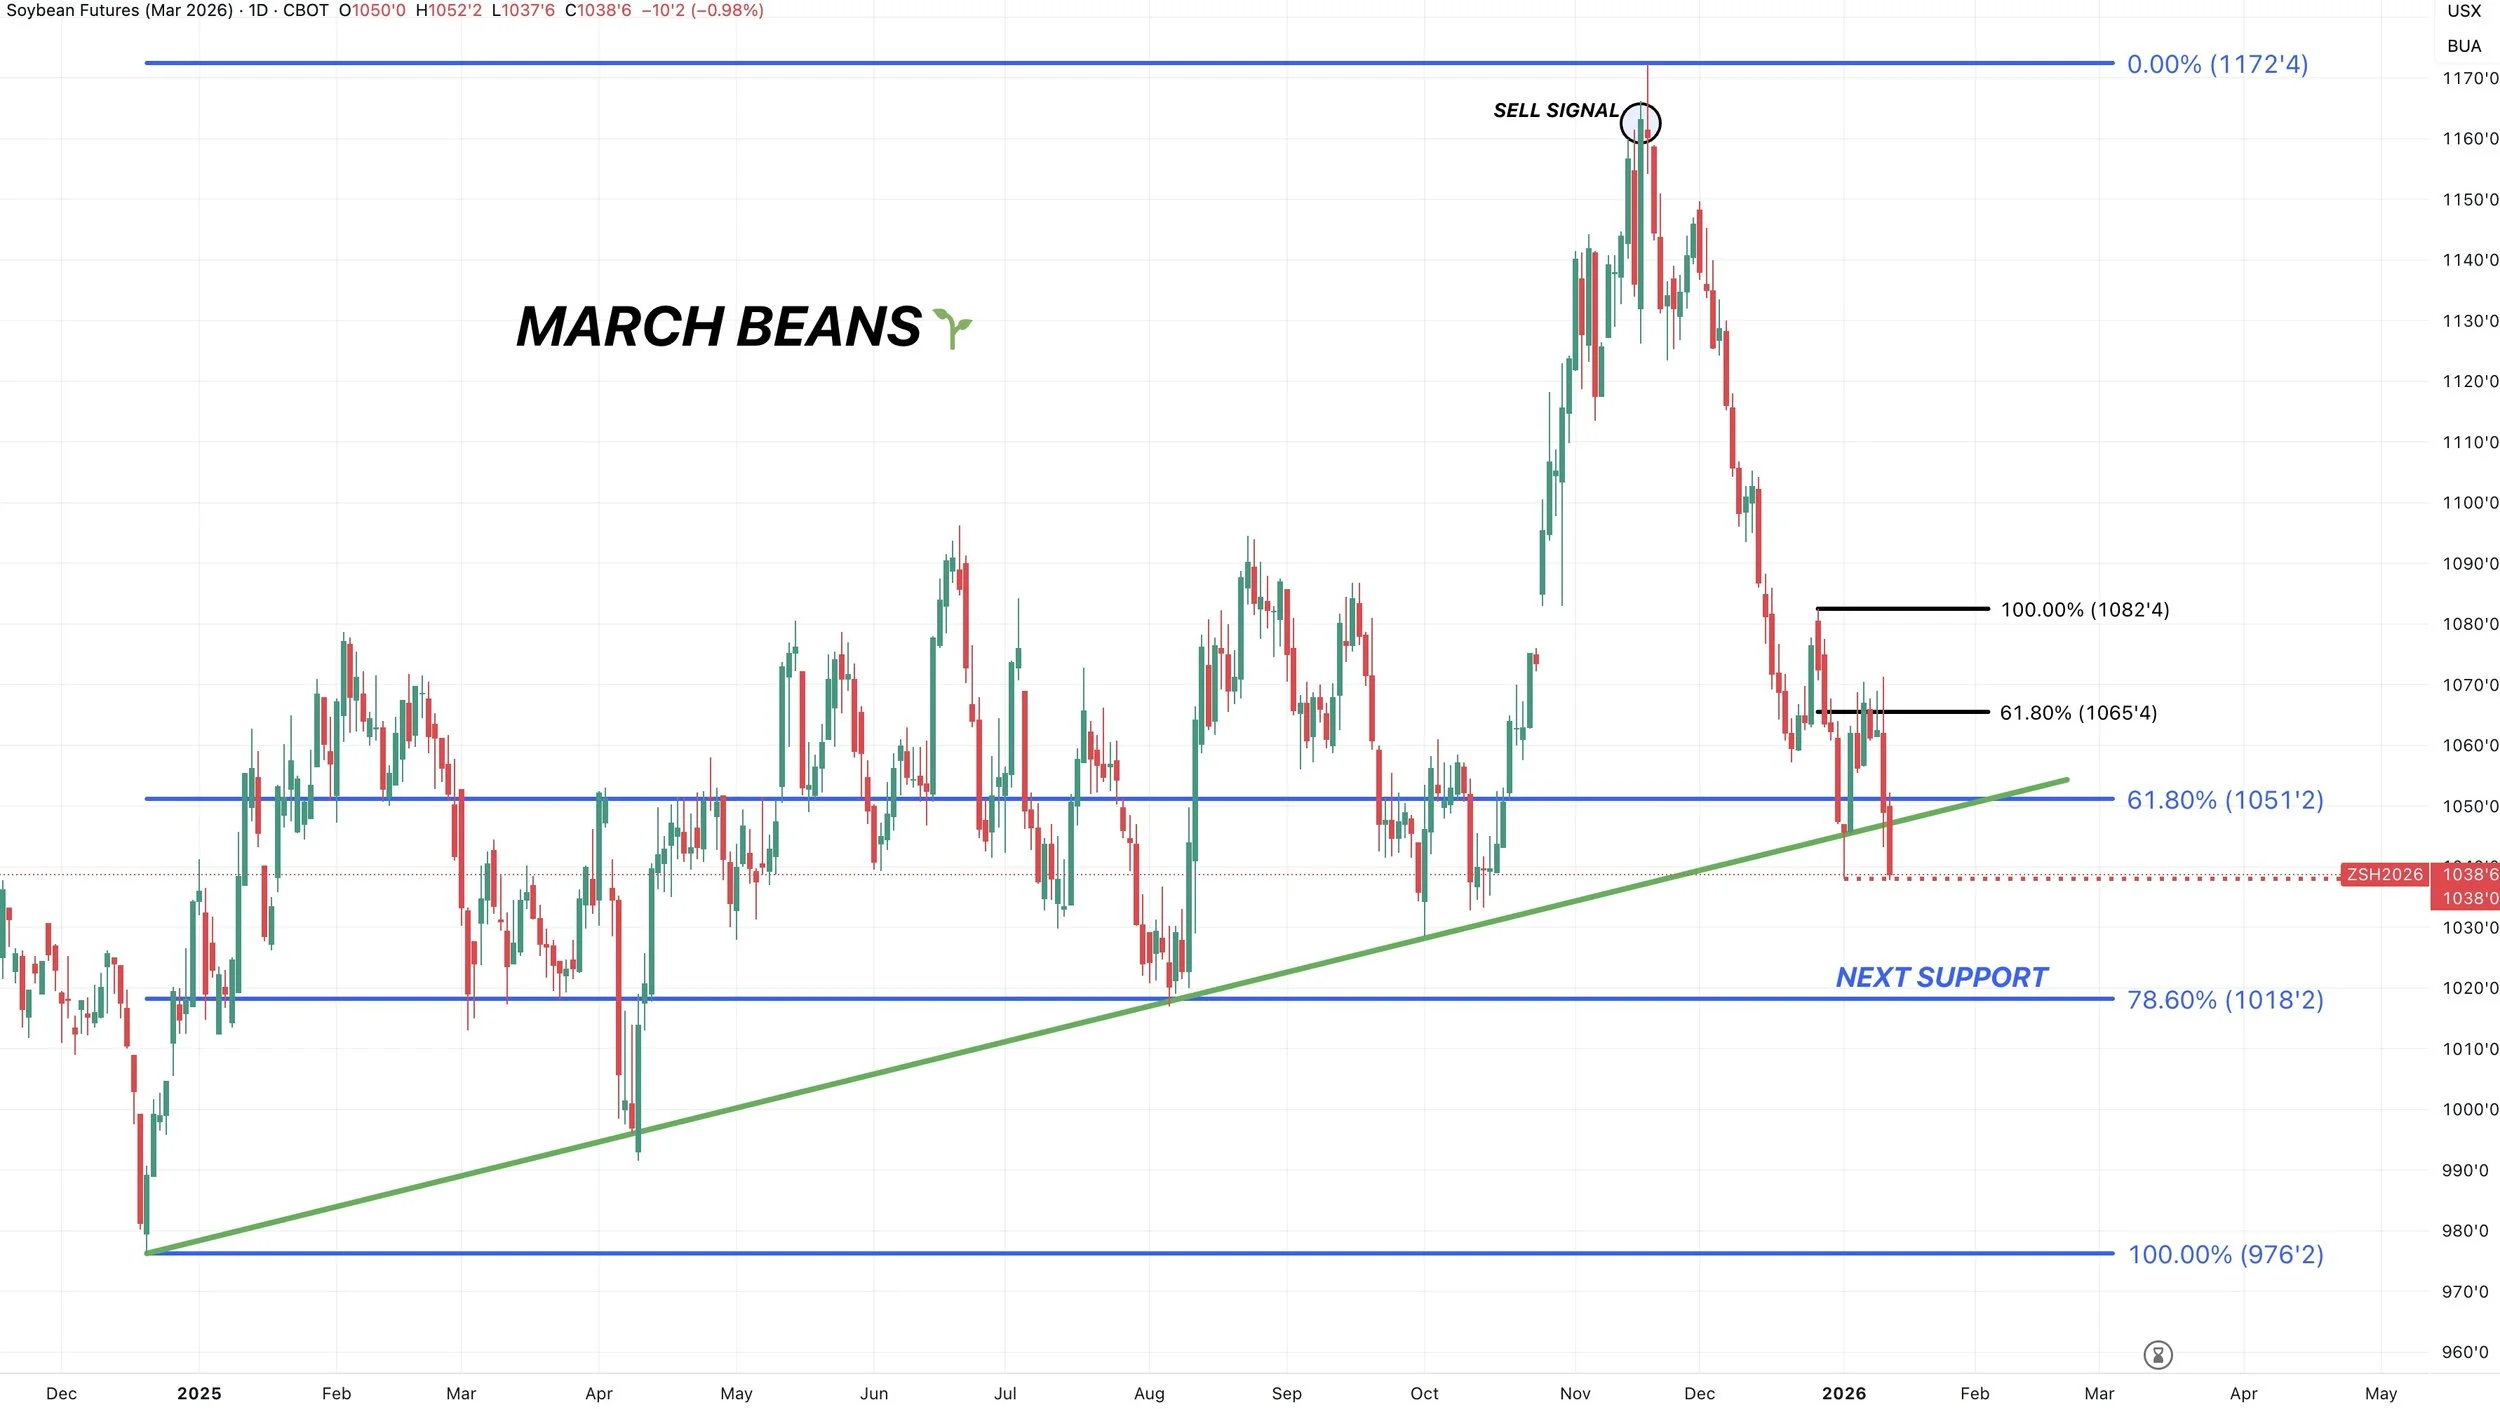
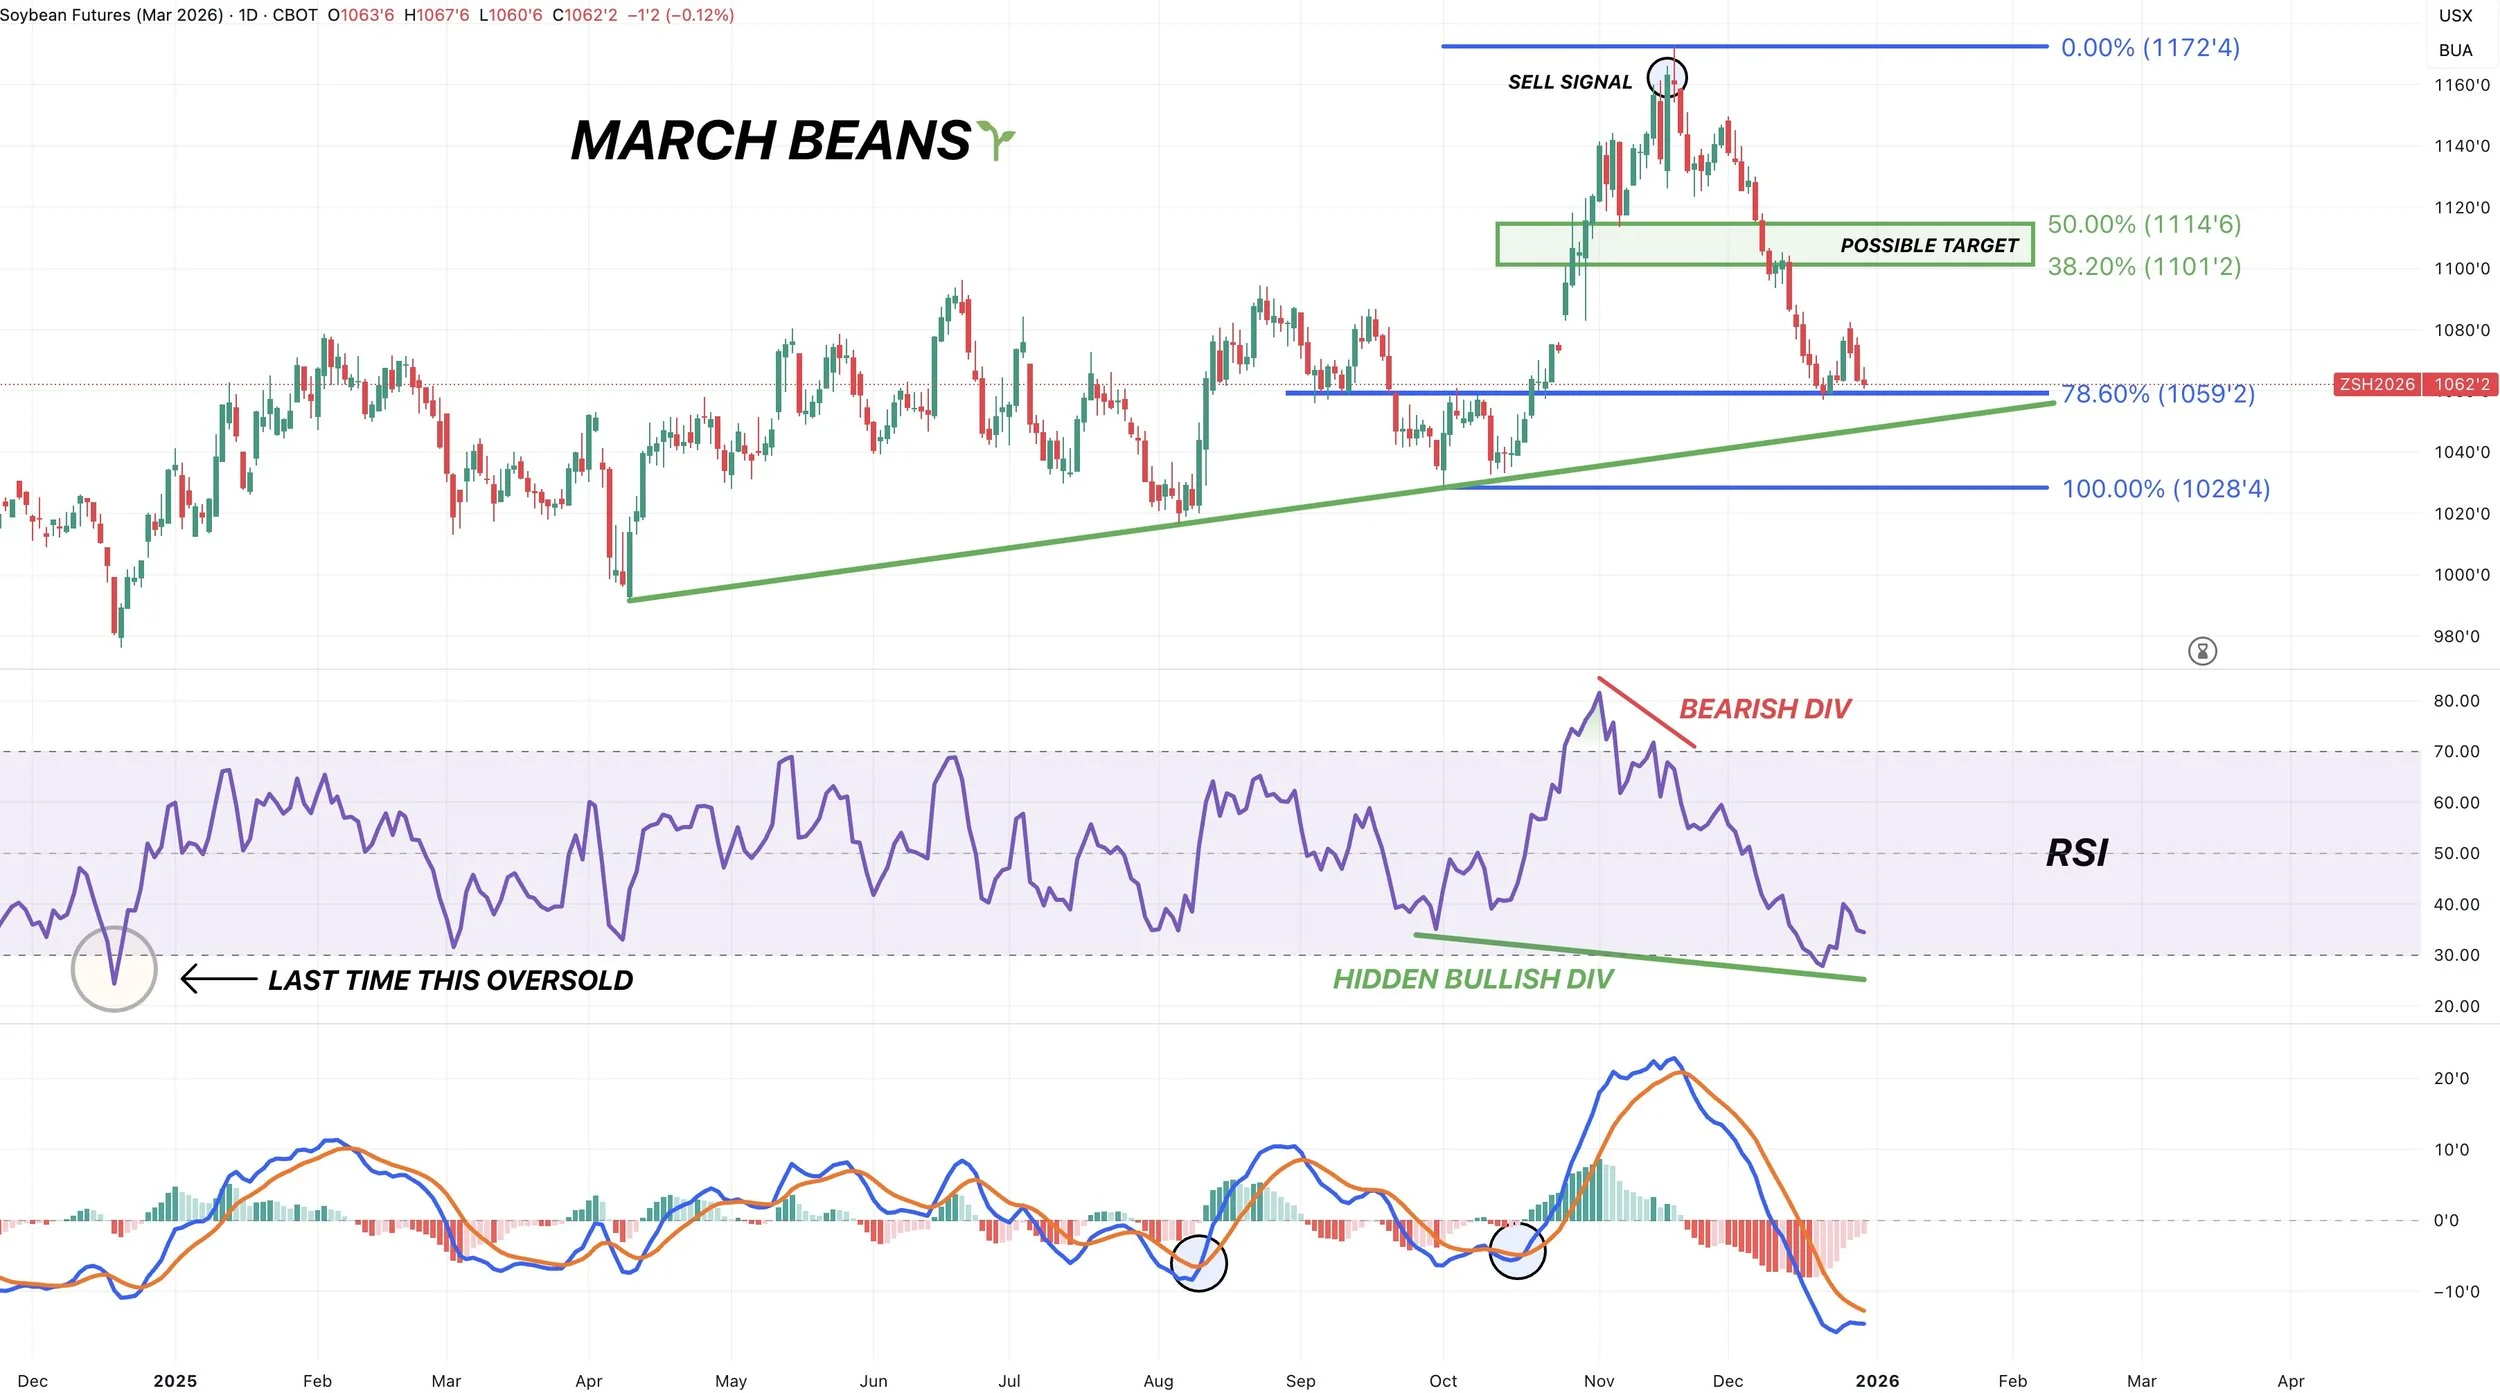
March Beans
We are still right at the 78.6% retracement level down to the pre-China fueled lows.
So finding some life here still makes sense.
If we fail to hold this level, we have some trendline support around that $10.50 area.
To the upside, we want to be looking to reward a move towards $11.00 to $11.15 if it comes. That claws back 38.2% to 50% of the entire sell off.
If we look at the indicators.
We had hidden bullish divergence. The RSI was making new lows, yet prices were a lot higher compared to the last time the RSI was this oversold.
If prices make a new low, but the RSI does not. That is called normal bullish divergence. So that could definitely we something we see here if we make new lows over the next few days but the RSI does not.
The MACD indicator is a momentum indicator (on the bottom).
It has not yet flipped bullish, but is close to doing so. The last few times it flipped bullish it did lead to higher prices.
A few other reasons why we could find life down here.
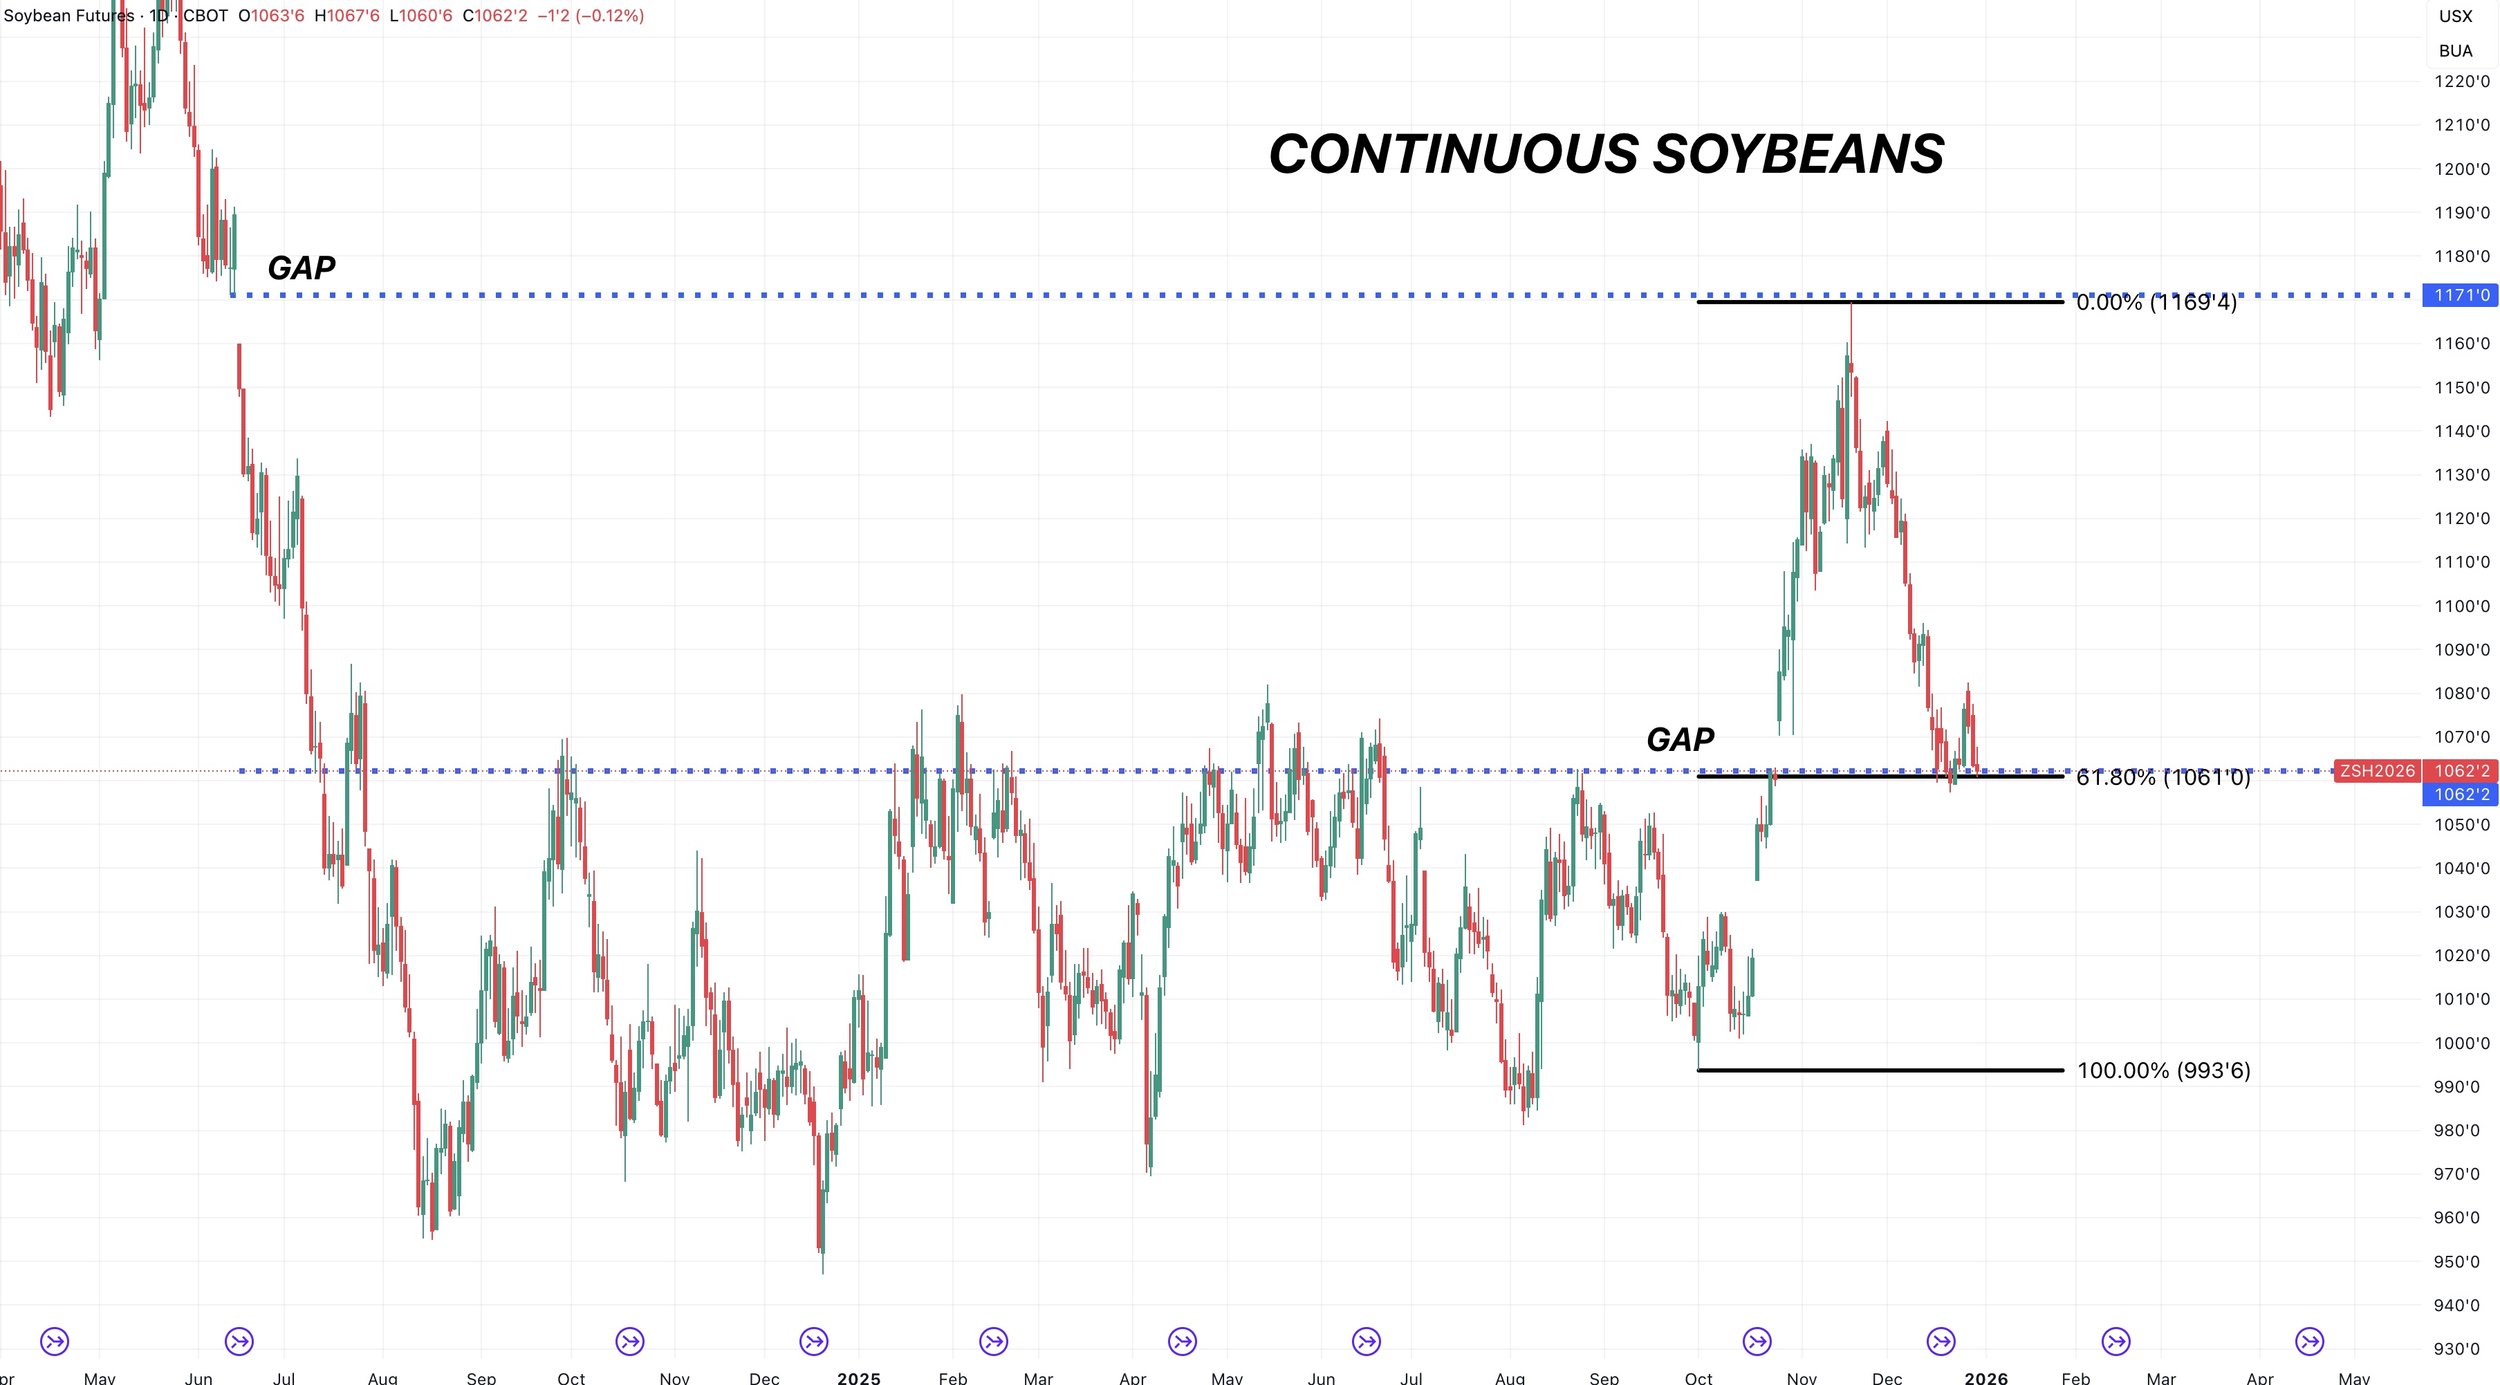
Continuous Chart
Here is the continuous chart.
At the highs, we had a gap left unfilled from 2024.
We almost perfectly filled the gap before going lower.
Now to the downside, we had a gap left open. Which we filled last week.
At the same time, this level gives back 61.8% of the entire rally.
It's also our yearly resistance.
This adds even more reasons to believe this area is a point of interest.
Wheat
Like the rest of the markets, there isn’t much for news.
Wheat demand has been great. Inspections are up over 20% vs last year.
But this market really needs a supply story to get any momentum behind it.
We just don’t have one for now.
Simply remaining patient in wheat for now. Waiting for that rally that only comes a few times a year that typically doesn’t last long.
Technicals:
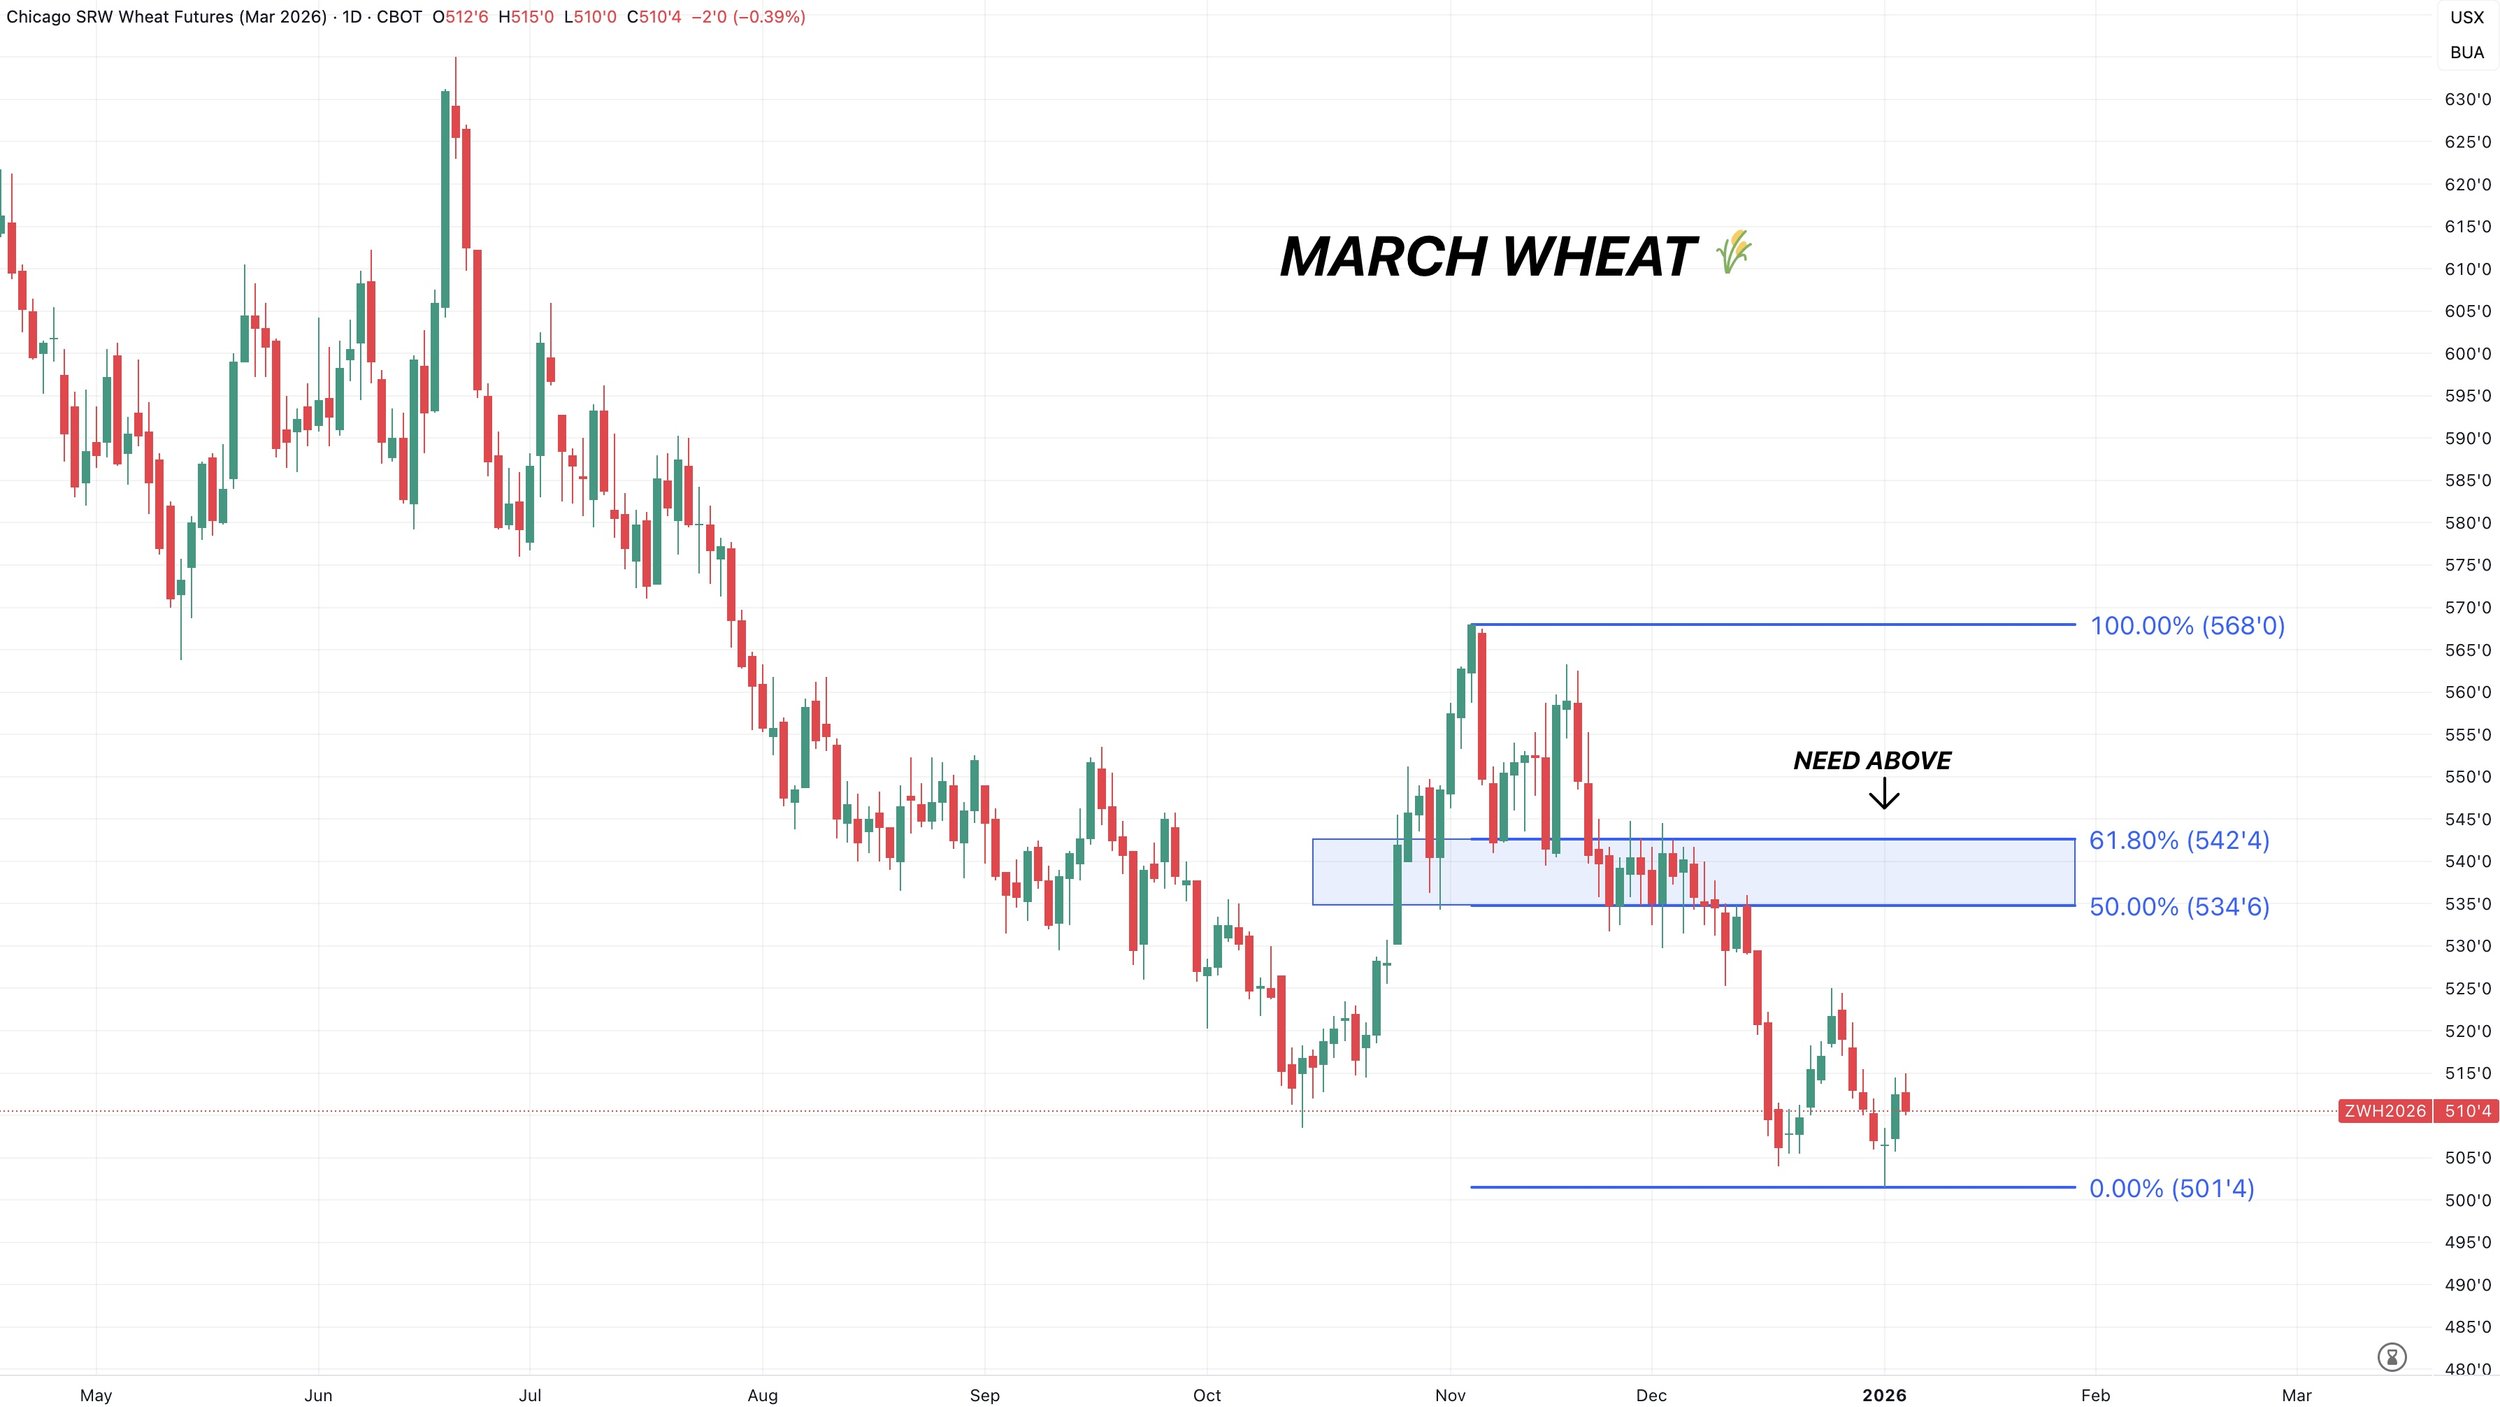
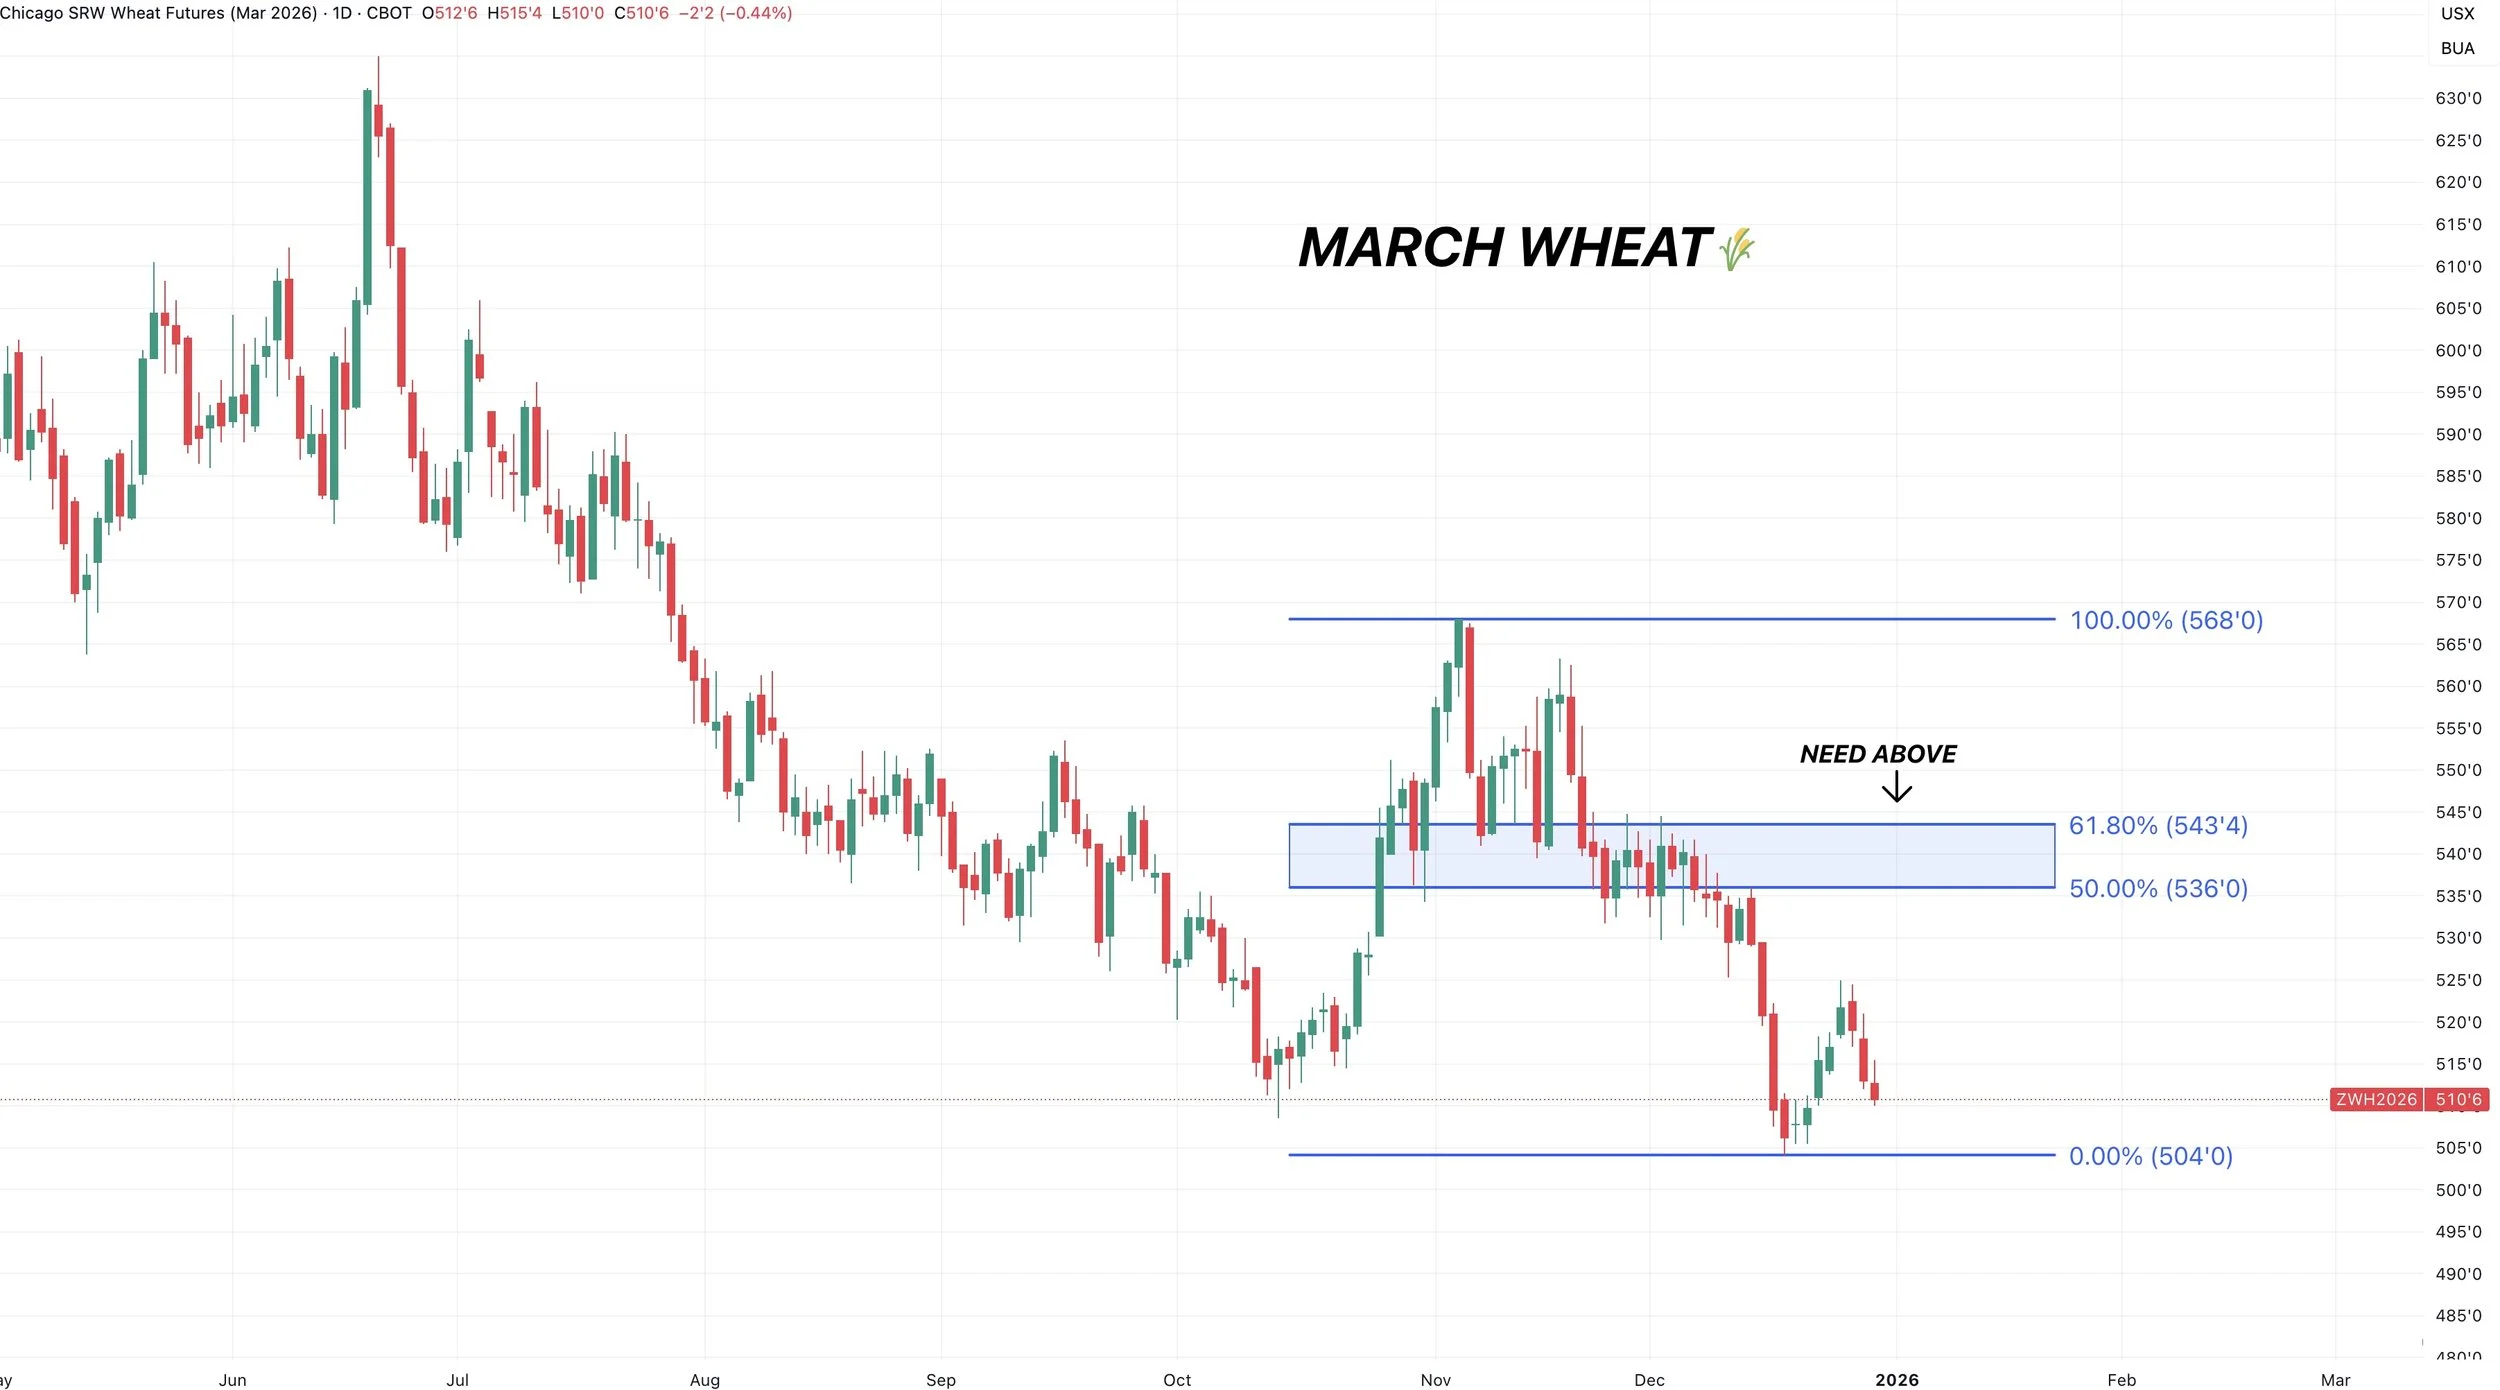
March Wheat
Nothing to update here.
Trying to call a bottom would be like trying to catch a falling knife. As I haven’t seen anything definitive that's made me believe we've put in a bottom yet.
Ultimately we need above the blue box to be confident this market is ready for a real move higher.
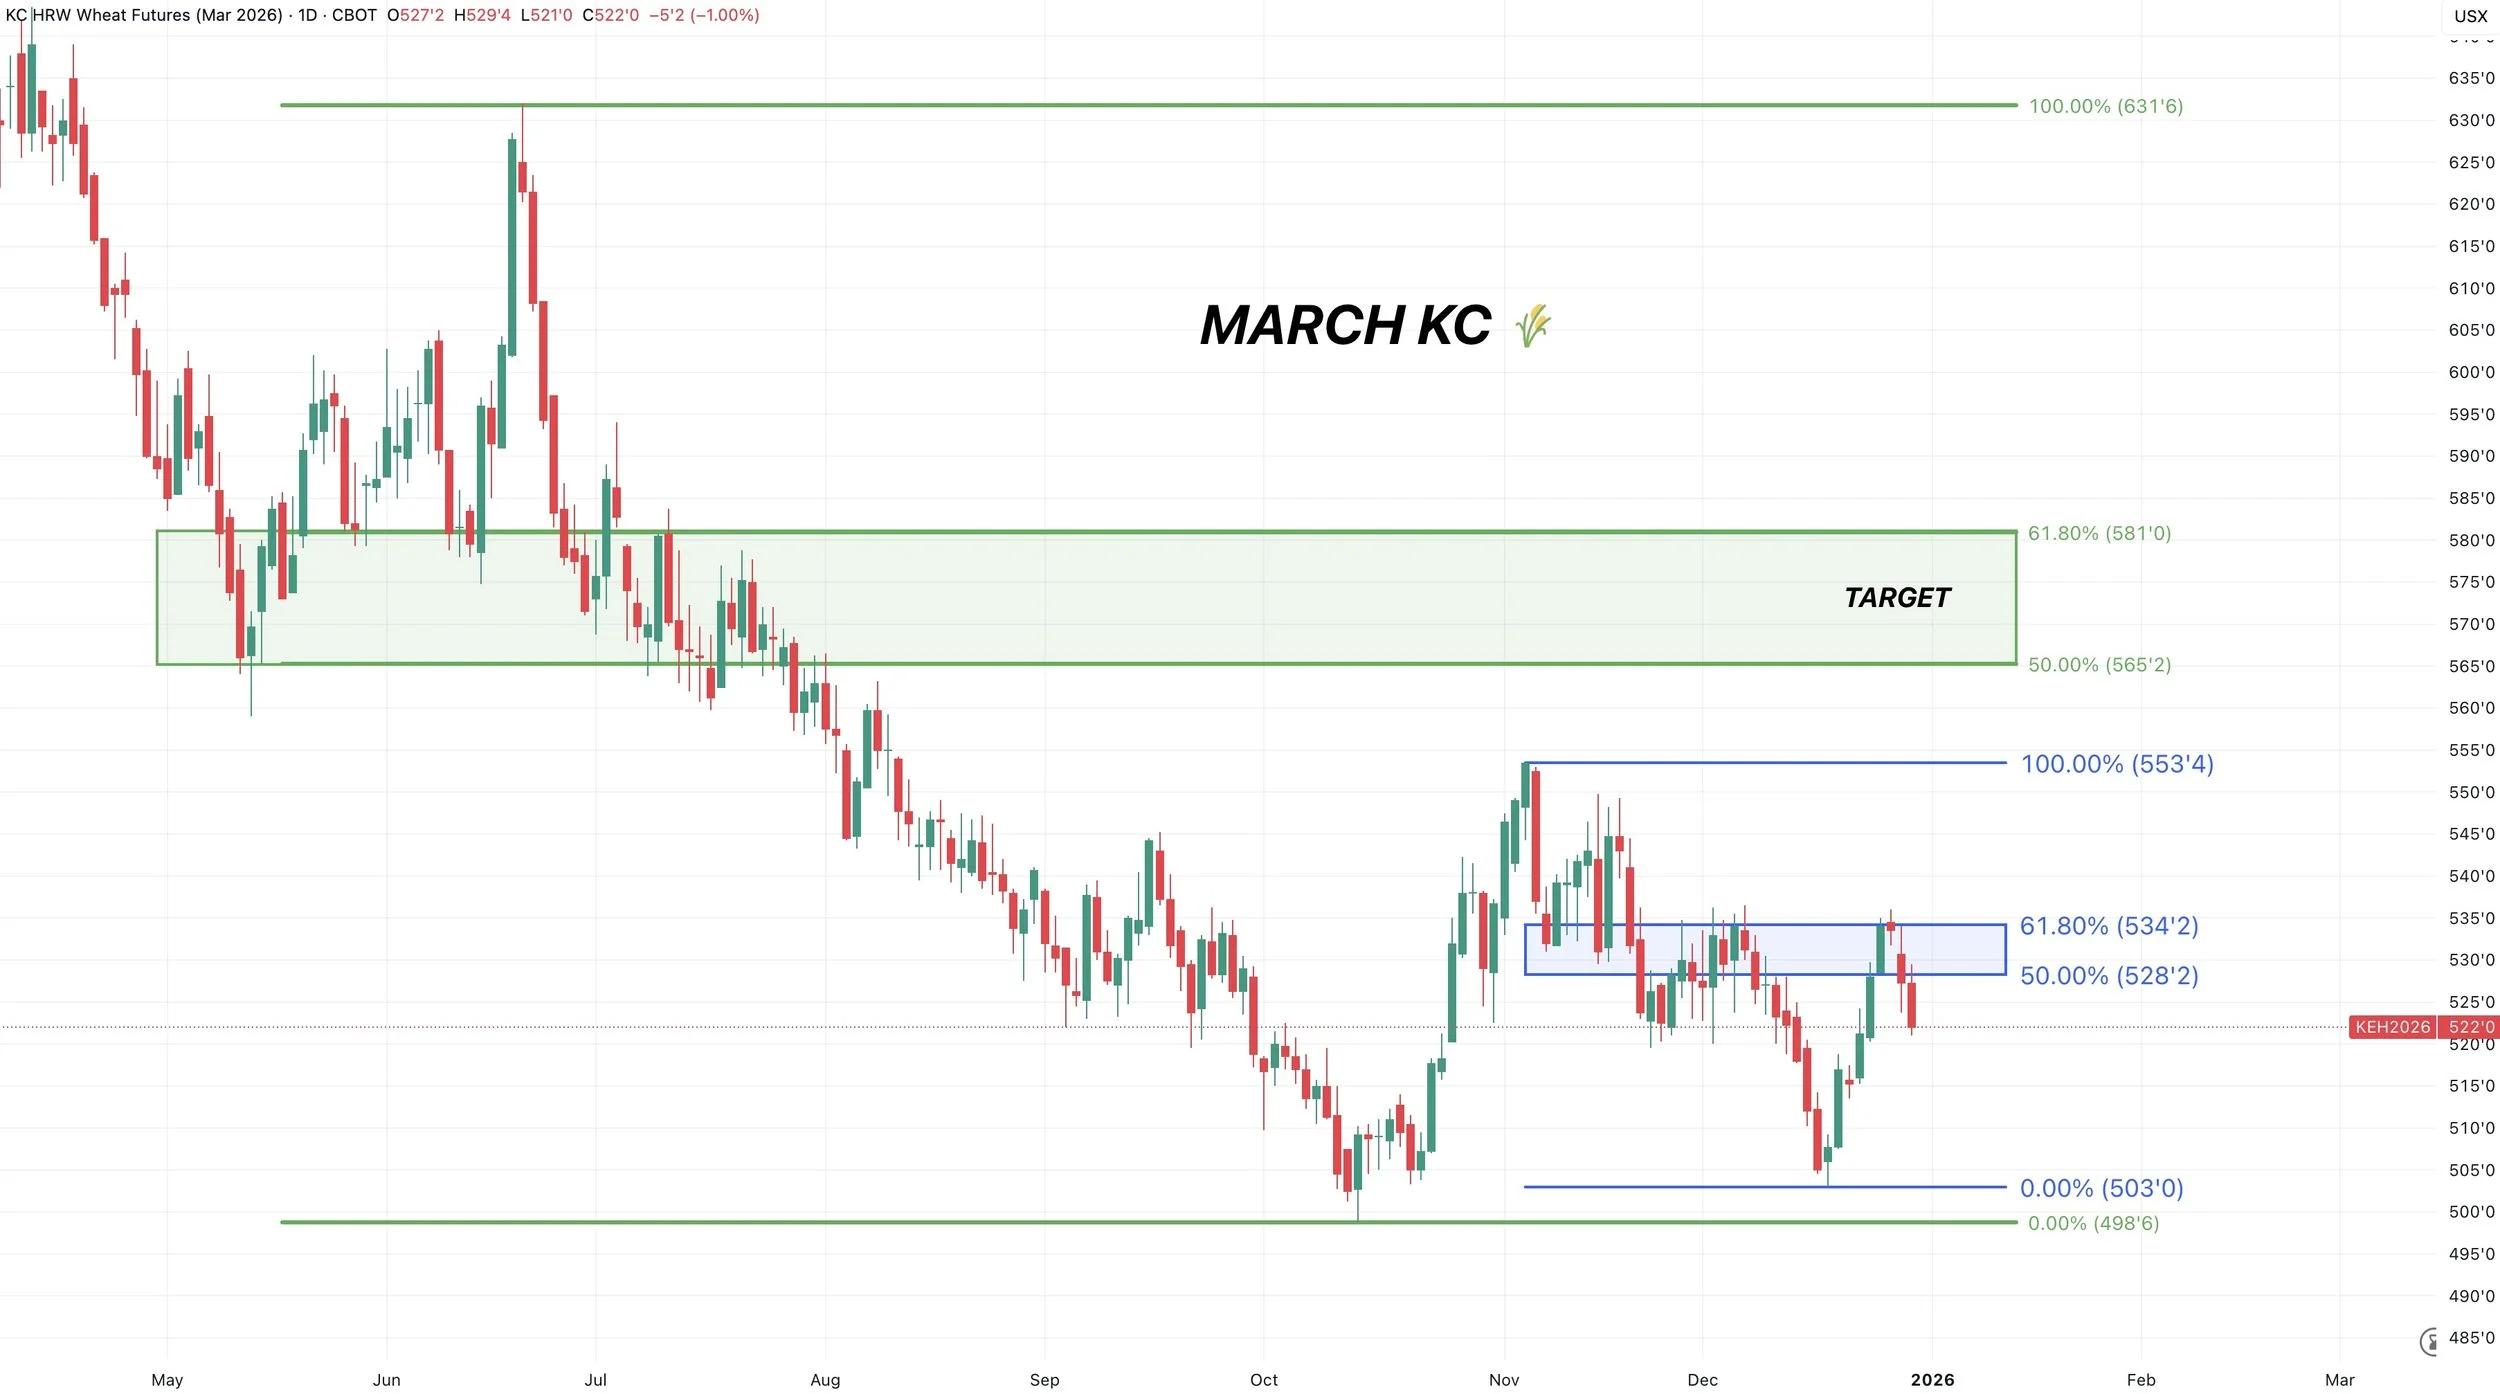
March KC Wheat
KC looks a lot better than Chicago.
We perfectly rejected that golden fib, as we clawed back 61.8% of this sell off.
That is the level we need to break above to be confident this market is going to catch a bid higher.
Like we always talk about, that level is where the market typically decides if this is simply a relief bounce or something bigger.
Cattle
Nothing new in cattle.
Fundamentally, the cattle situation is clearly still tight.
The biggest risk in cattle has to be the government.
I think the government probably keeps big money and the funds from wanting to get too long in this market, because they know a headline could pop out at any moment.
Then we have the Mexican border which could re-open early next year.
Feeder cattle did post a new high today, but live cattle has been trapped in a brutal sideways range.
We still like keeping some downside protection up at these levels.
Technicals:
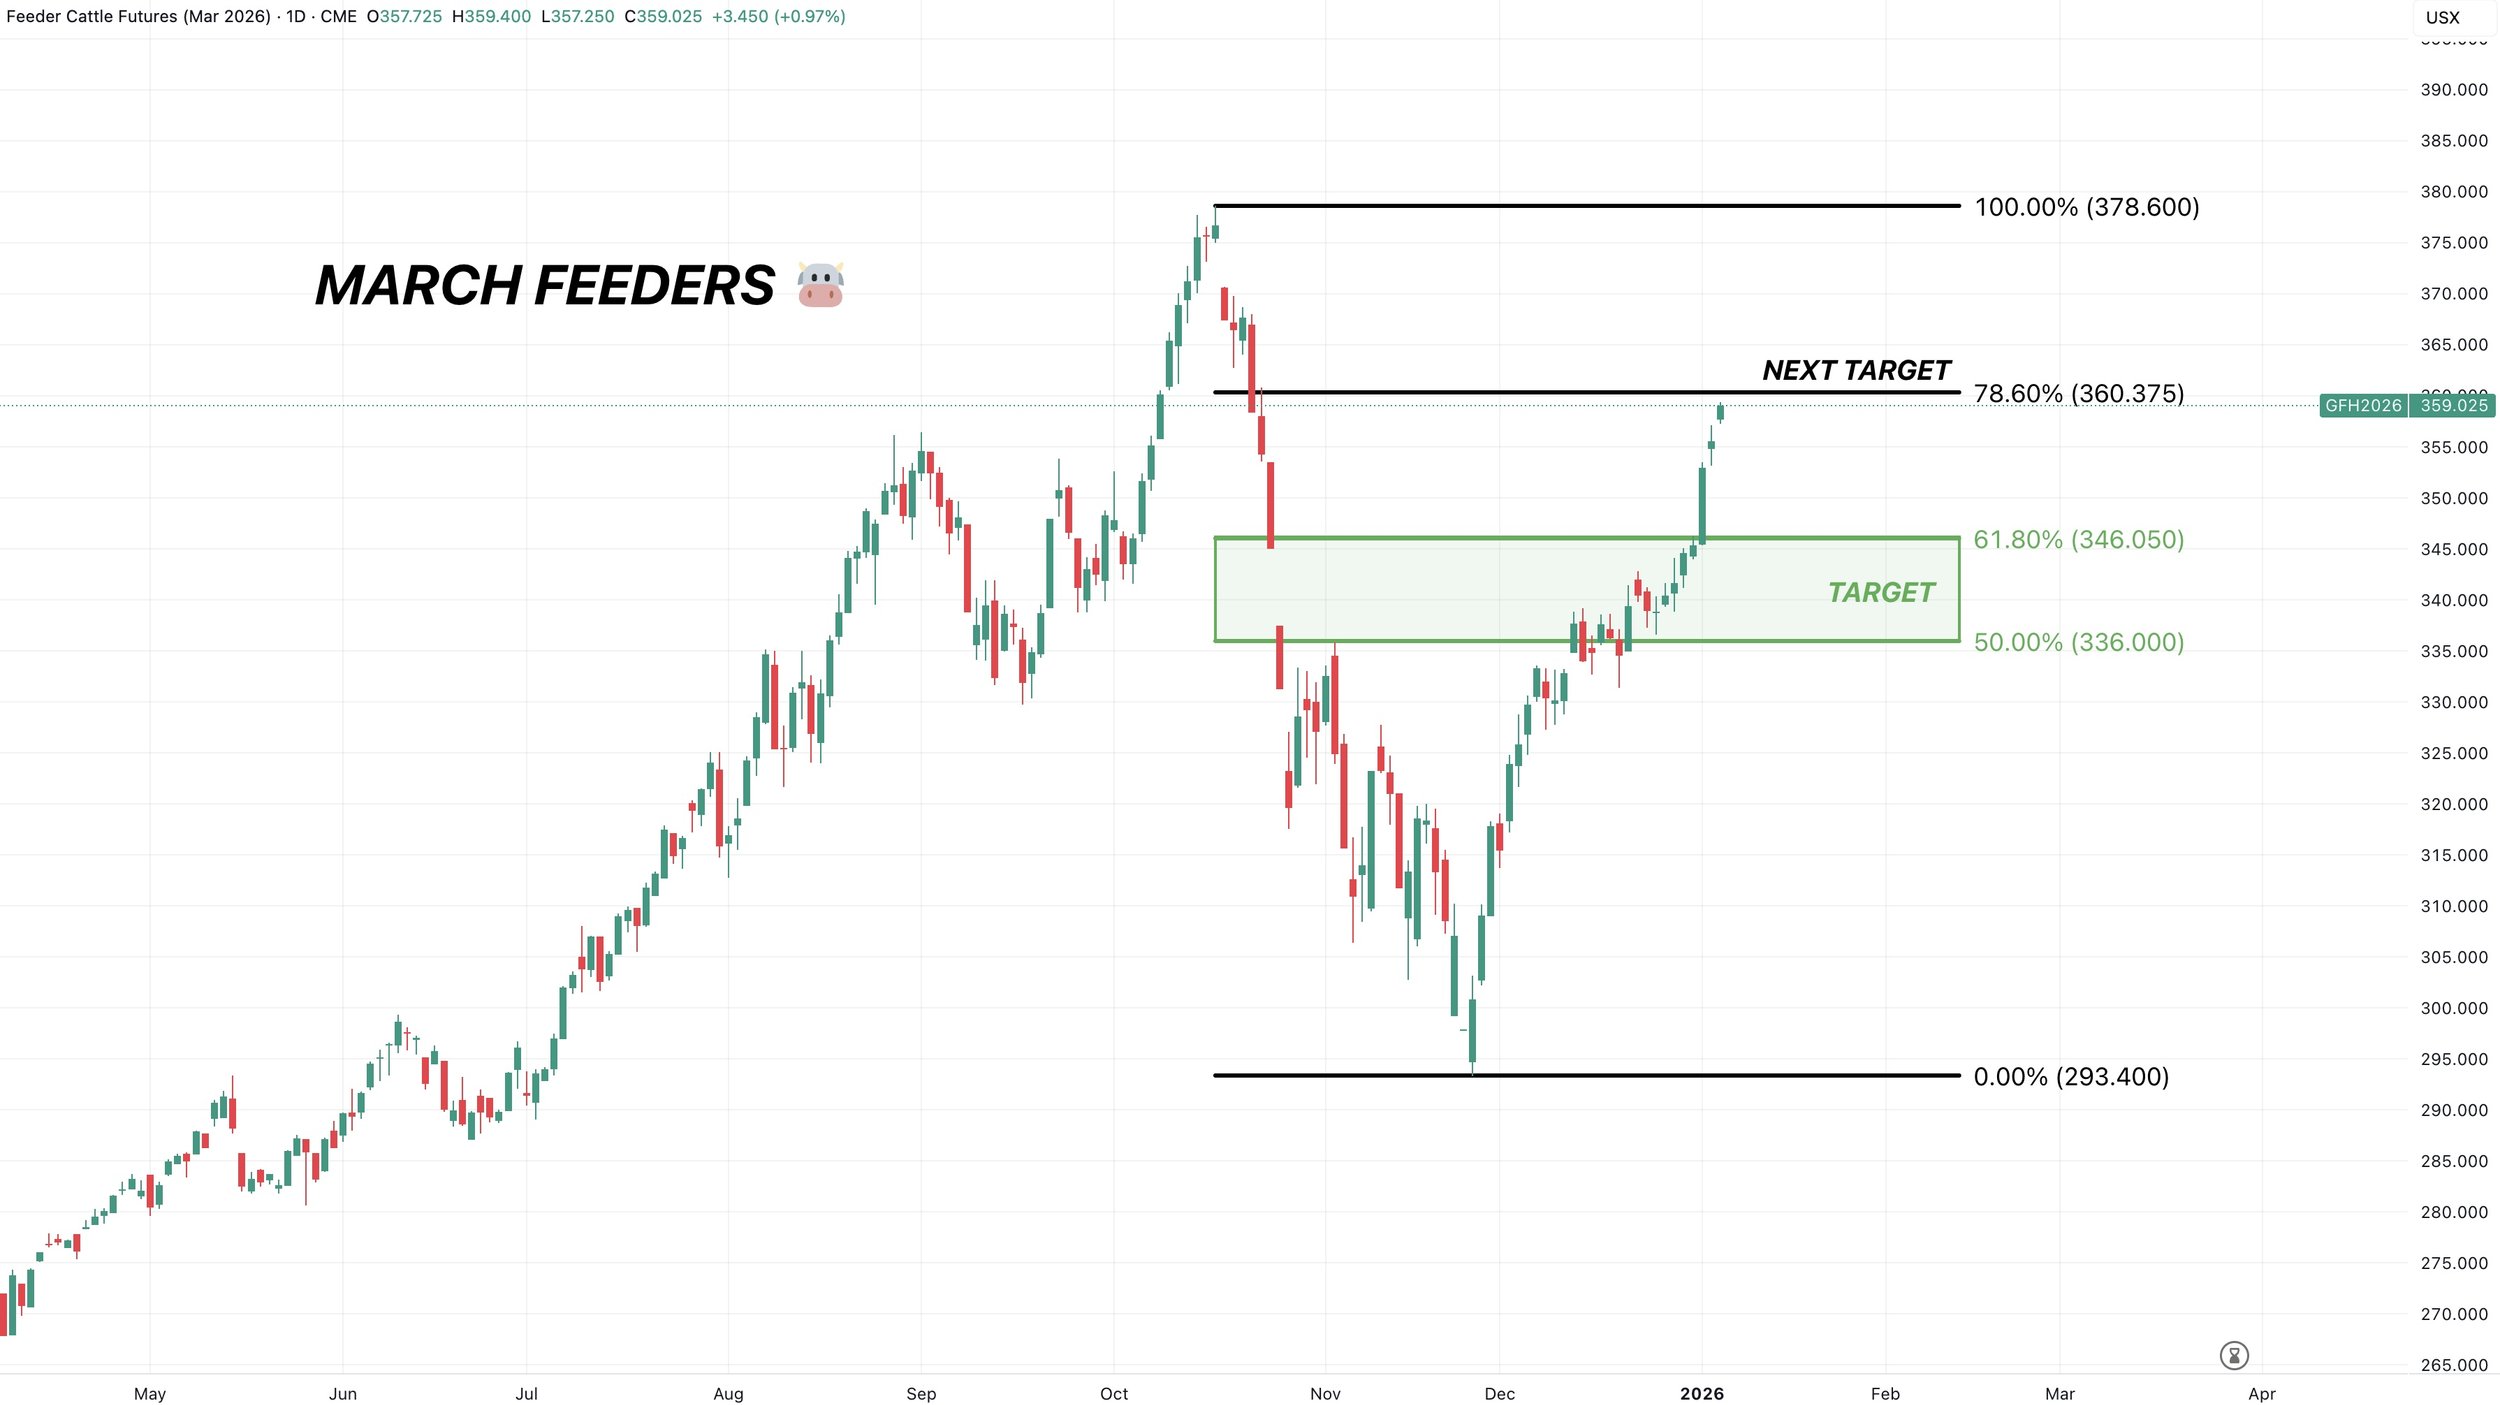
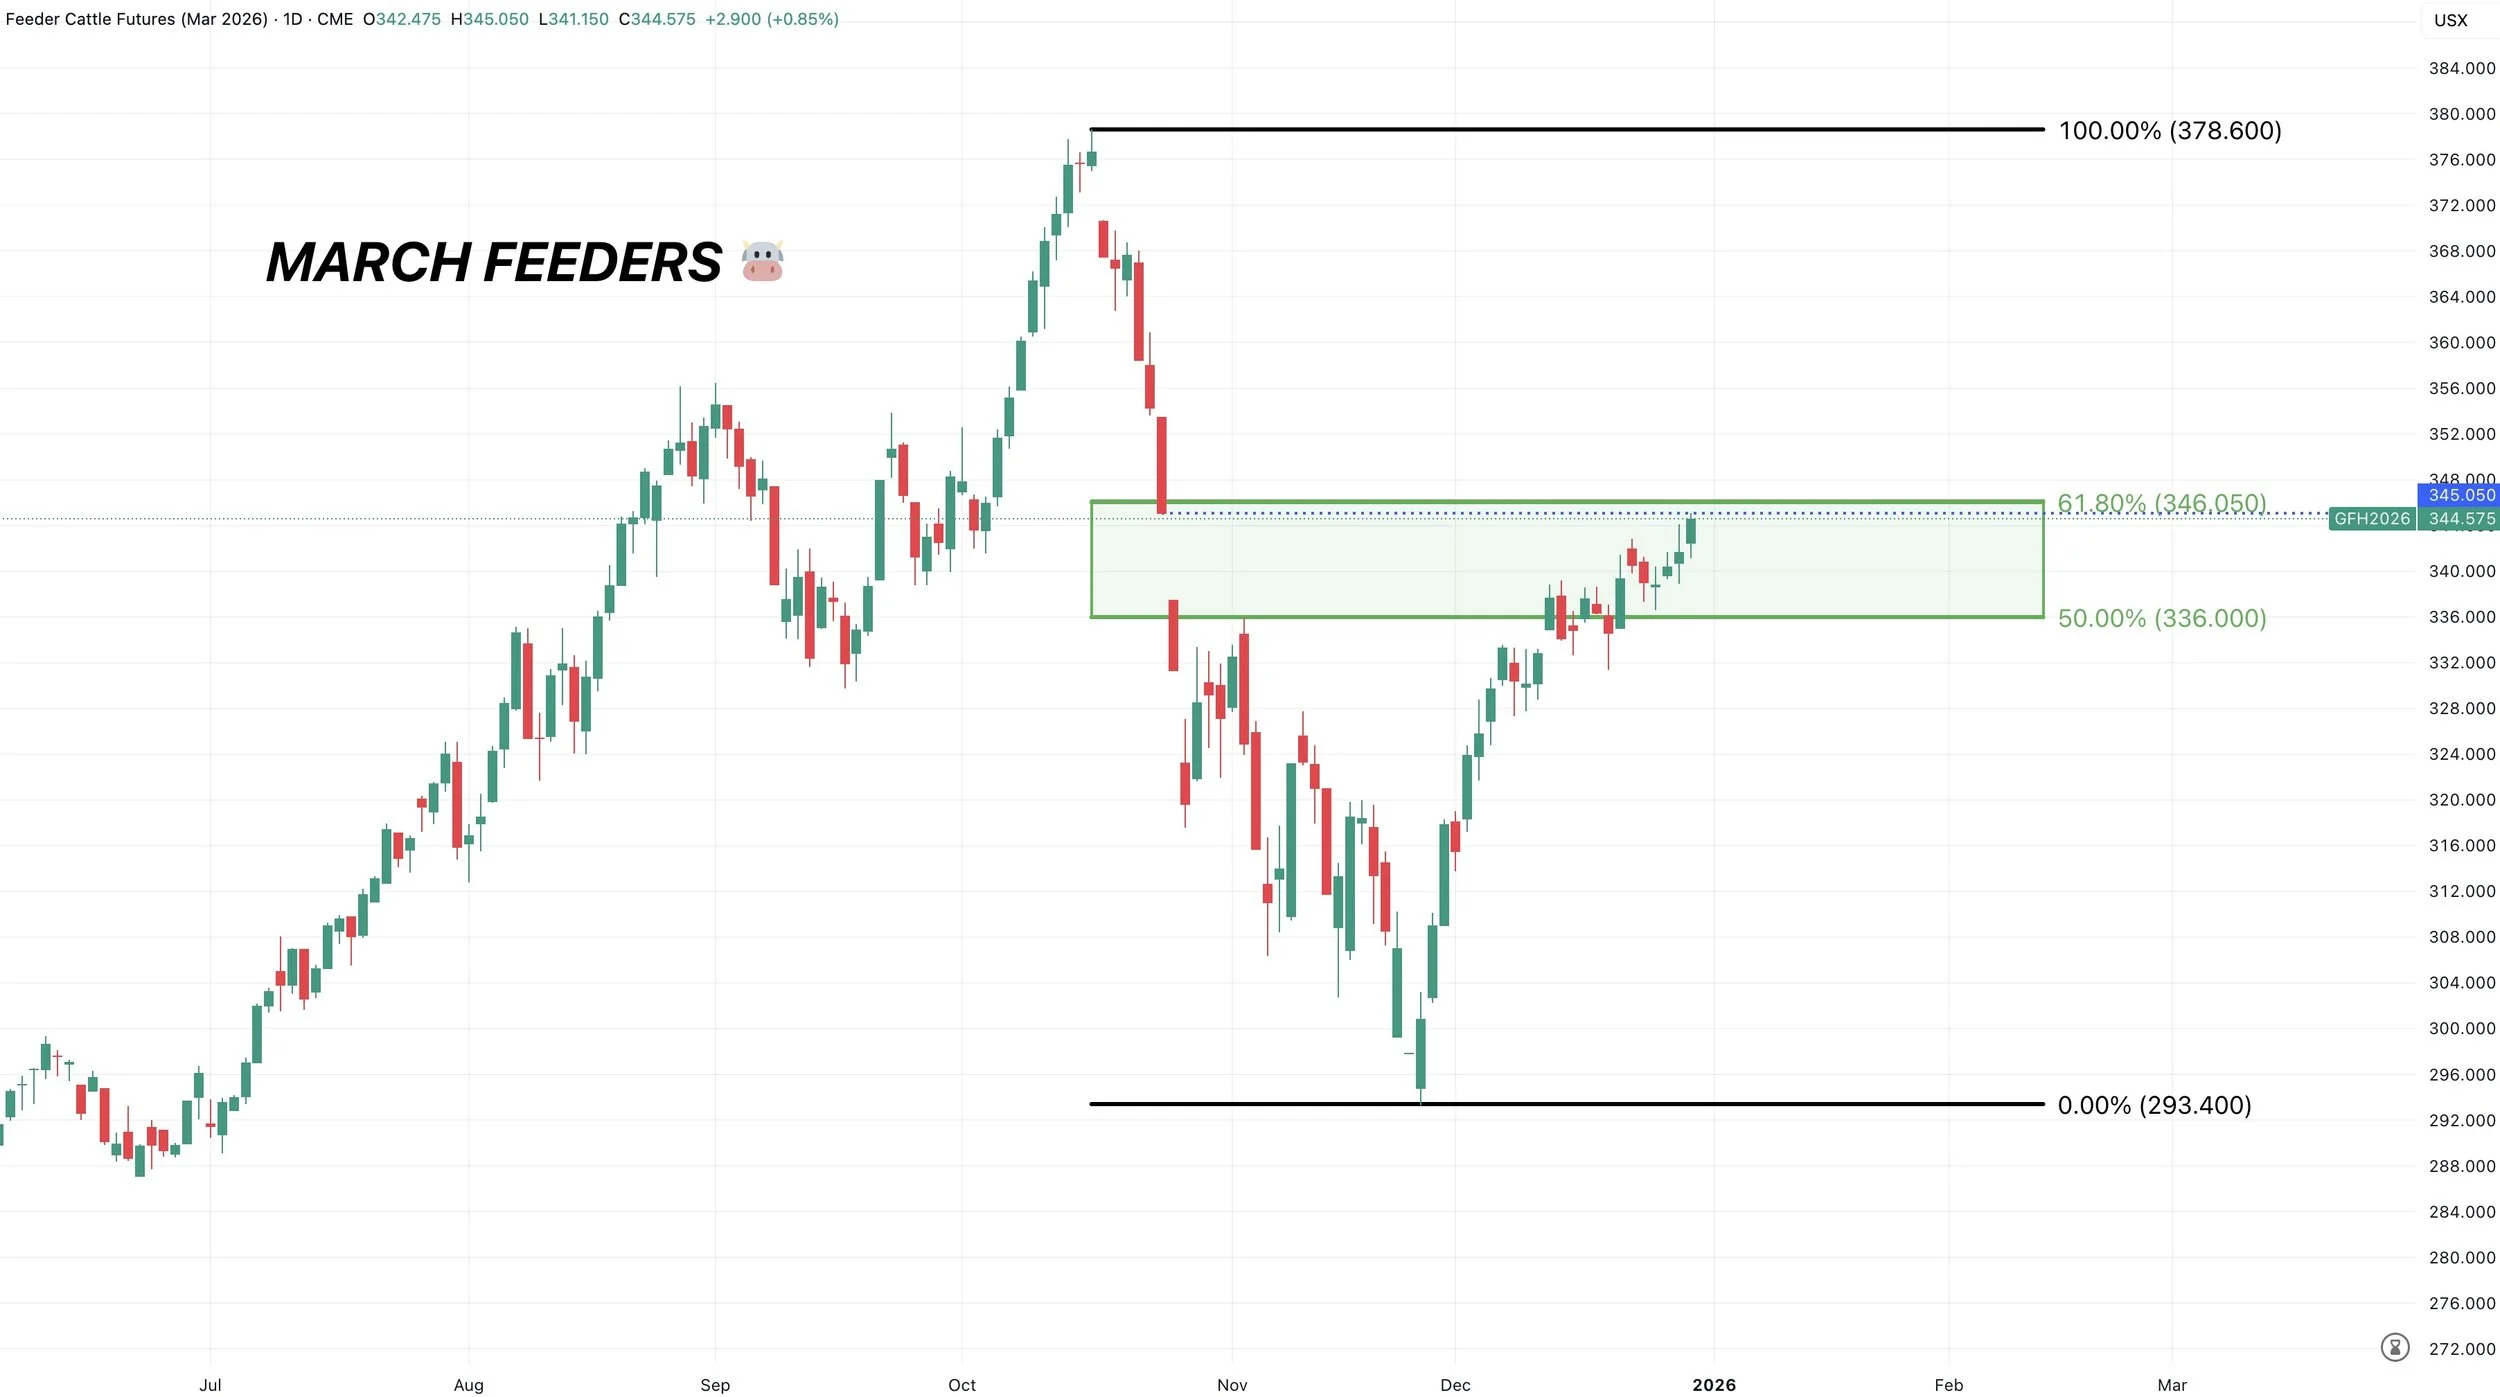
March Feeders
March feeders did offically fill that gap we left back in October.
This level almost perfectly lines up with reclaiming 61.8% of the entire sell off.
Both of these are big points of interest.
So if you haven’t yet, we still like defending this level.
As this is still where most relief bounces can tend to fail.
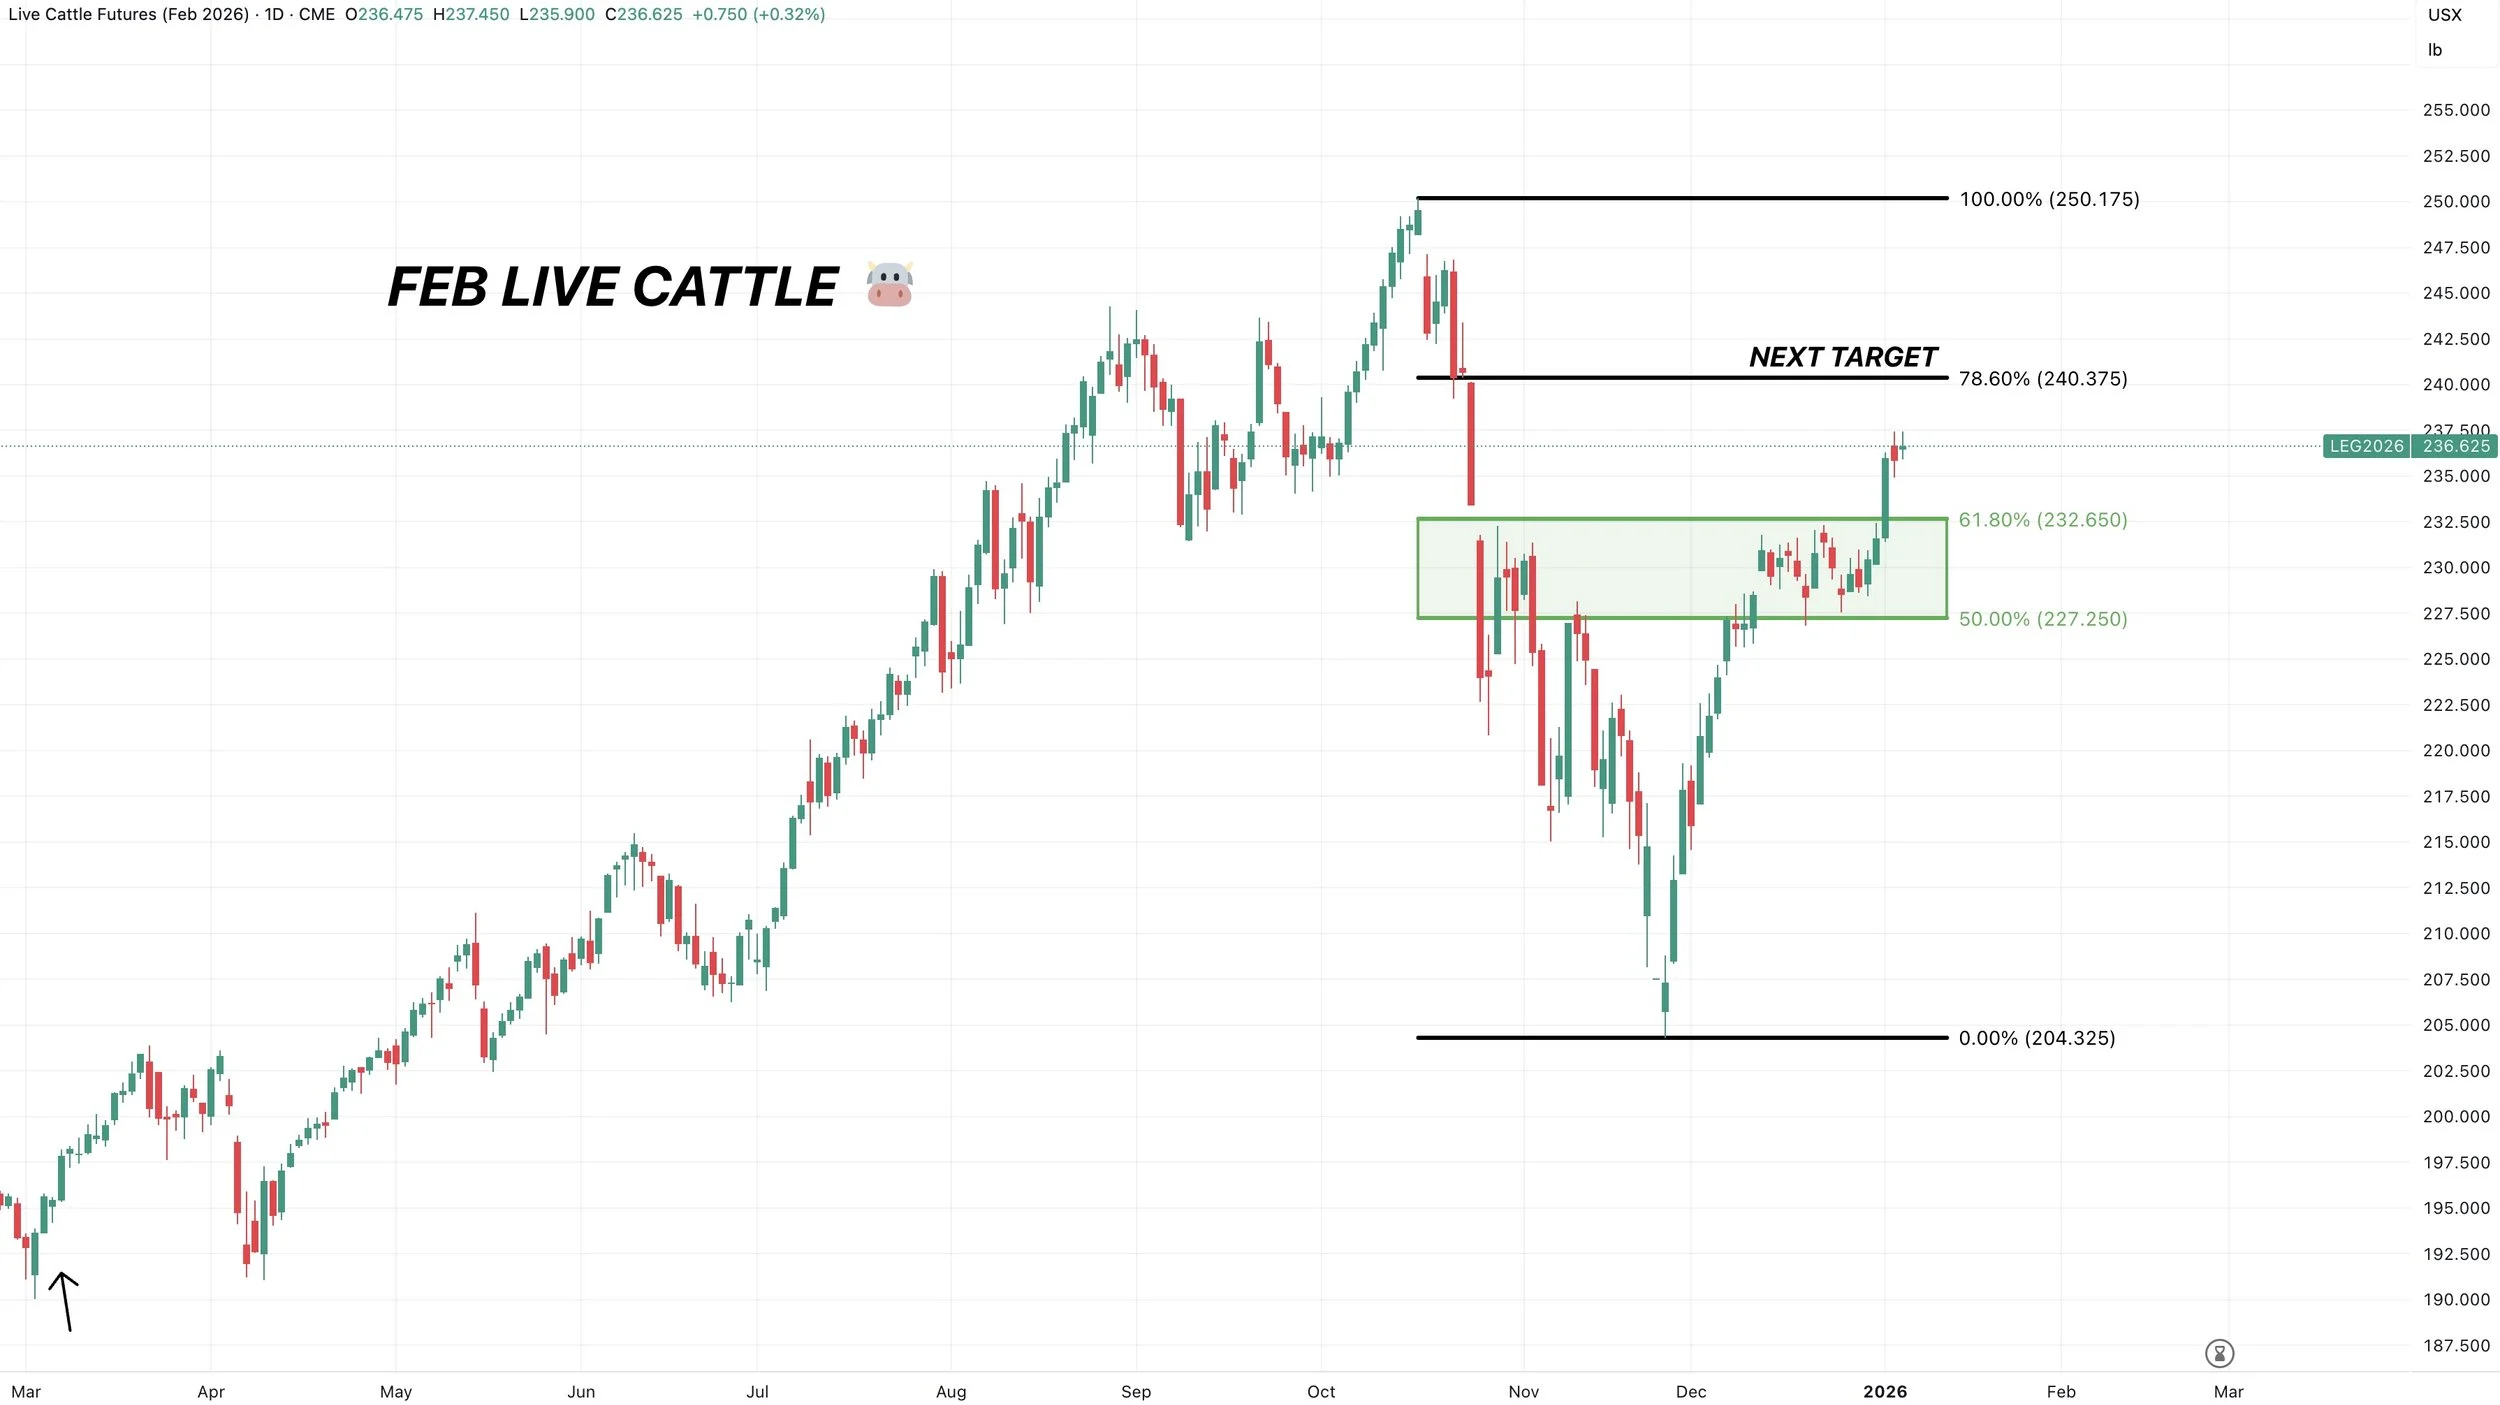
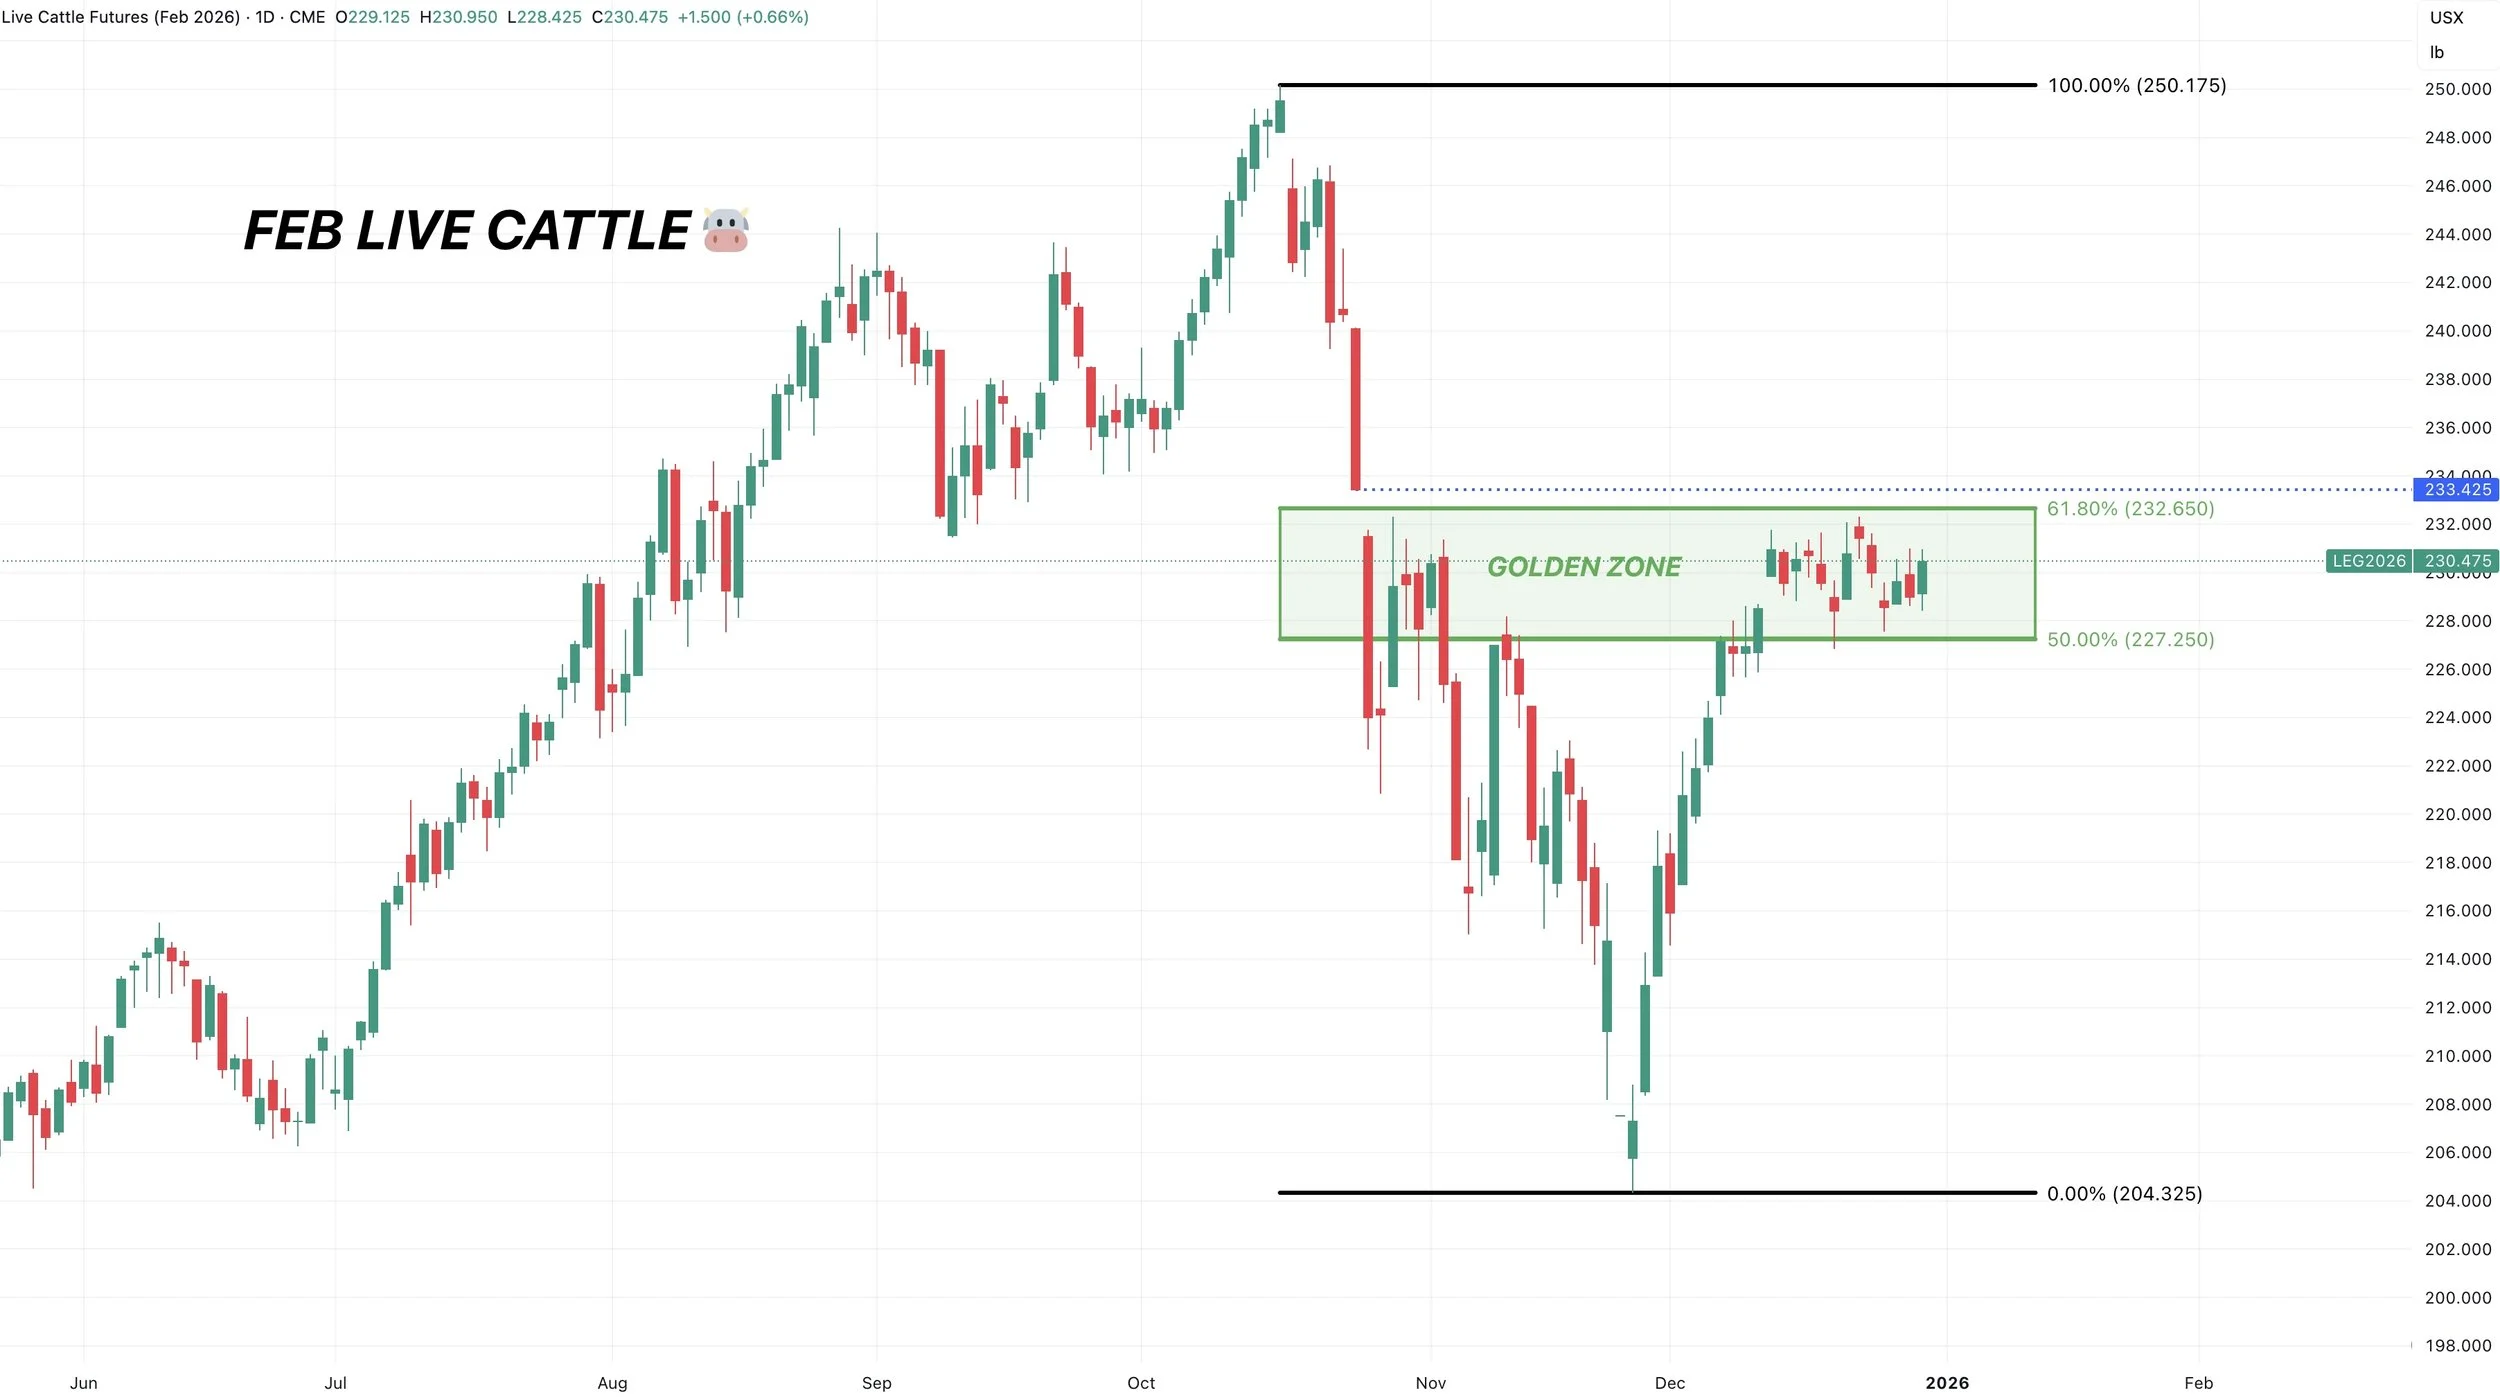
Feb Live
Completely sideways.
Consolidating right in the golden zone.
Same story as feeders. This is where relief bounces can often fail.
We still like defending here.
Past Sell or Protection Signals
Dec 11th: 🐮
Cattle sell signal & hedge alert.
Dec 5th: 🐮
Cattle sell signal & hedge alert.
Nov 17th: 🌱
Soybean sell signal & hedge alert.
Nov 13th: 🌽 🌱
Managing risk in corn & beans ahead of USDA report.
Oct 28th: 🌽
Corn sell signal & hedge alert.
Oct 27th: 🌱
Soybean sell signal & hedge alert.
Oct 13th: 🐮
Cattle sell signal & hedge alert.
Aug 22nd: 🌱
Soybean sell signal & hedge alert.
July 31st: 🐮
Cattle sell signal & hedge alert.
July 10th: 🐮
Cattle sell signal & hedge alert.
CLICK HERE TO VIEW
June 5th: 🐮
Cattle sell signal & hedge alert.
June 2nd: 🌾
MPLS wheat sell signal.
April 10th: 🌽
Old crop corn sell signal.
March 19th: 🐮
Cattle hedge & sell signal.
Feb 18th: 🌽 🌾
Old crop KC wheat & old crop corn signal.
Jan 23rd: 🌽 🌱
Corn & beans old crop sell signal.
CLICK HERE TO VIEW
Jan 15th: 🌽 🌱
Corn & beans hedge alert/sell signal.
Jan 2nd: 🐮
Cattle hedge alert at new all-time highs & target.
Dec 11th: 🌽
Corn sell signal at $4.51 200-day MA
CLICK HERE TO VIEW
Oct 2nd: 🌾
Wheat sell signal at $6.12 target
Sep 30th: 🌽
Corn protection signal at $4.23-26
Sep 27th: 🌱
Soybean sell & protection signal at $10.65
Sep 13th: 🌾
Wheat sell signal at $5.98
May 22nd: 🌾
Wheat sell signal when wheat traded +$7.00
Want to Talk?
Our phones are open 24/7 for you guys if you ever need anything or want to discuss your operation.
Hedge Account
Interested in a hedge account? Use the link below to set up an account or shoot Jeremey a call at (605)295-3100.
CORN AT BIG SPOT. BEANS BOUNCING. NEXT TARGETS & MORE
VIDEO CHART UPDATE
You can scroll to read the usual update as well. As the written version is the exact same as the video. The video may be easier to follow along with the charts.
Timestamps for video:
Beans: 0:40min
Corn: 5:20min
Cattle: 7:45min
Wheat: 8:30min
Want to talk about your situation?
(605)250-3863
Your trial has ended
Don’t miss our future updates or signals
Our holiday sale ends next week
Overview
Today, we are only going to be going over the charts and some things we're watching as there is very little fresh fundamental news with the holidays.
Soybeans are seeing a nice bounce right at those downside targets. Corn is up against some pretty key resistance bulls would like to break. The wheat market is starting to look a little more optimistic. Cattle is still consolidating at our upside targets.
The usual full video updates will resume next week. Where we'll look at seasonals and do some fundamental digging.
Here are the chart breakdowns:
Soybeans
Jan Beans
We are going to start off with soybeans, as we alerted that buy zone alert late last week.
If you missed it, check out last week's video where we went over the methodology behind it.
Click Here to View
So far, we have perfectly bounced off those downside targets we sent out in both Jan and March beans.
We will be switching over to March as the main focus, but I wanted to include Jan beans because they were a large reason for that buy alert.
On Nov 17th we issued that sell signal. Which was because we simply reclaimed 61.8% of the contract highs and were showing bearish divergence.
Late last week, we gave back 61.8% of the contract lows off those Nov highs, and were showing hidden bullish divergence. So we alerted the buy signal at $10.48
It's still too early to say that we found a bottom, but so far we've seen a great reaction off that level.
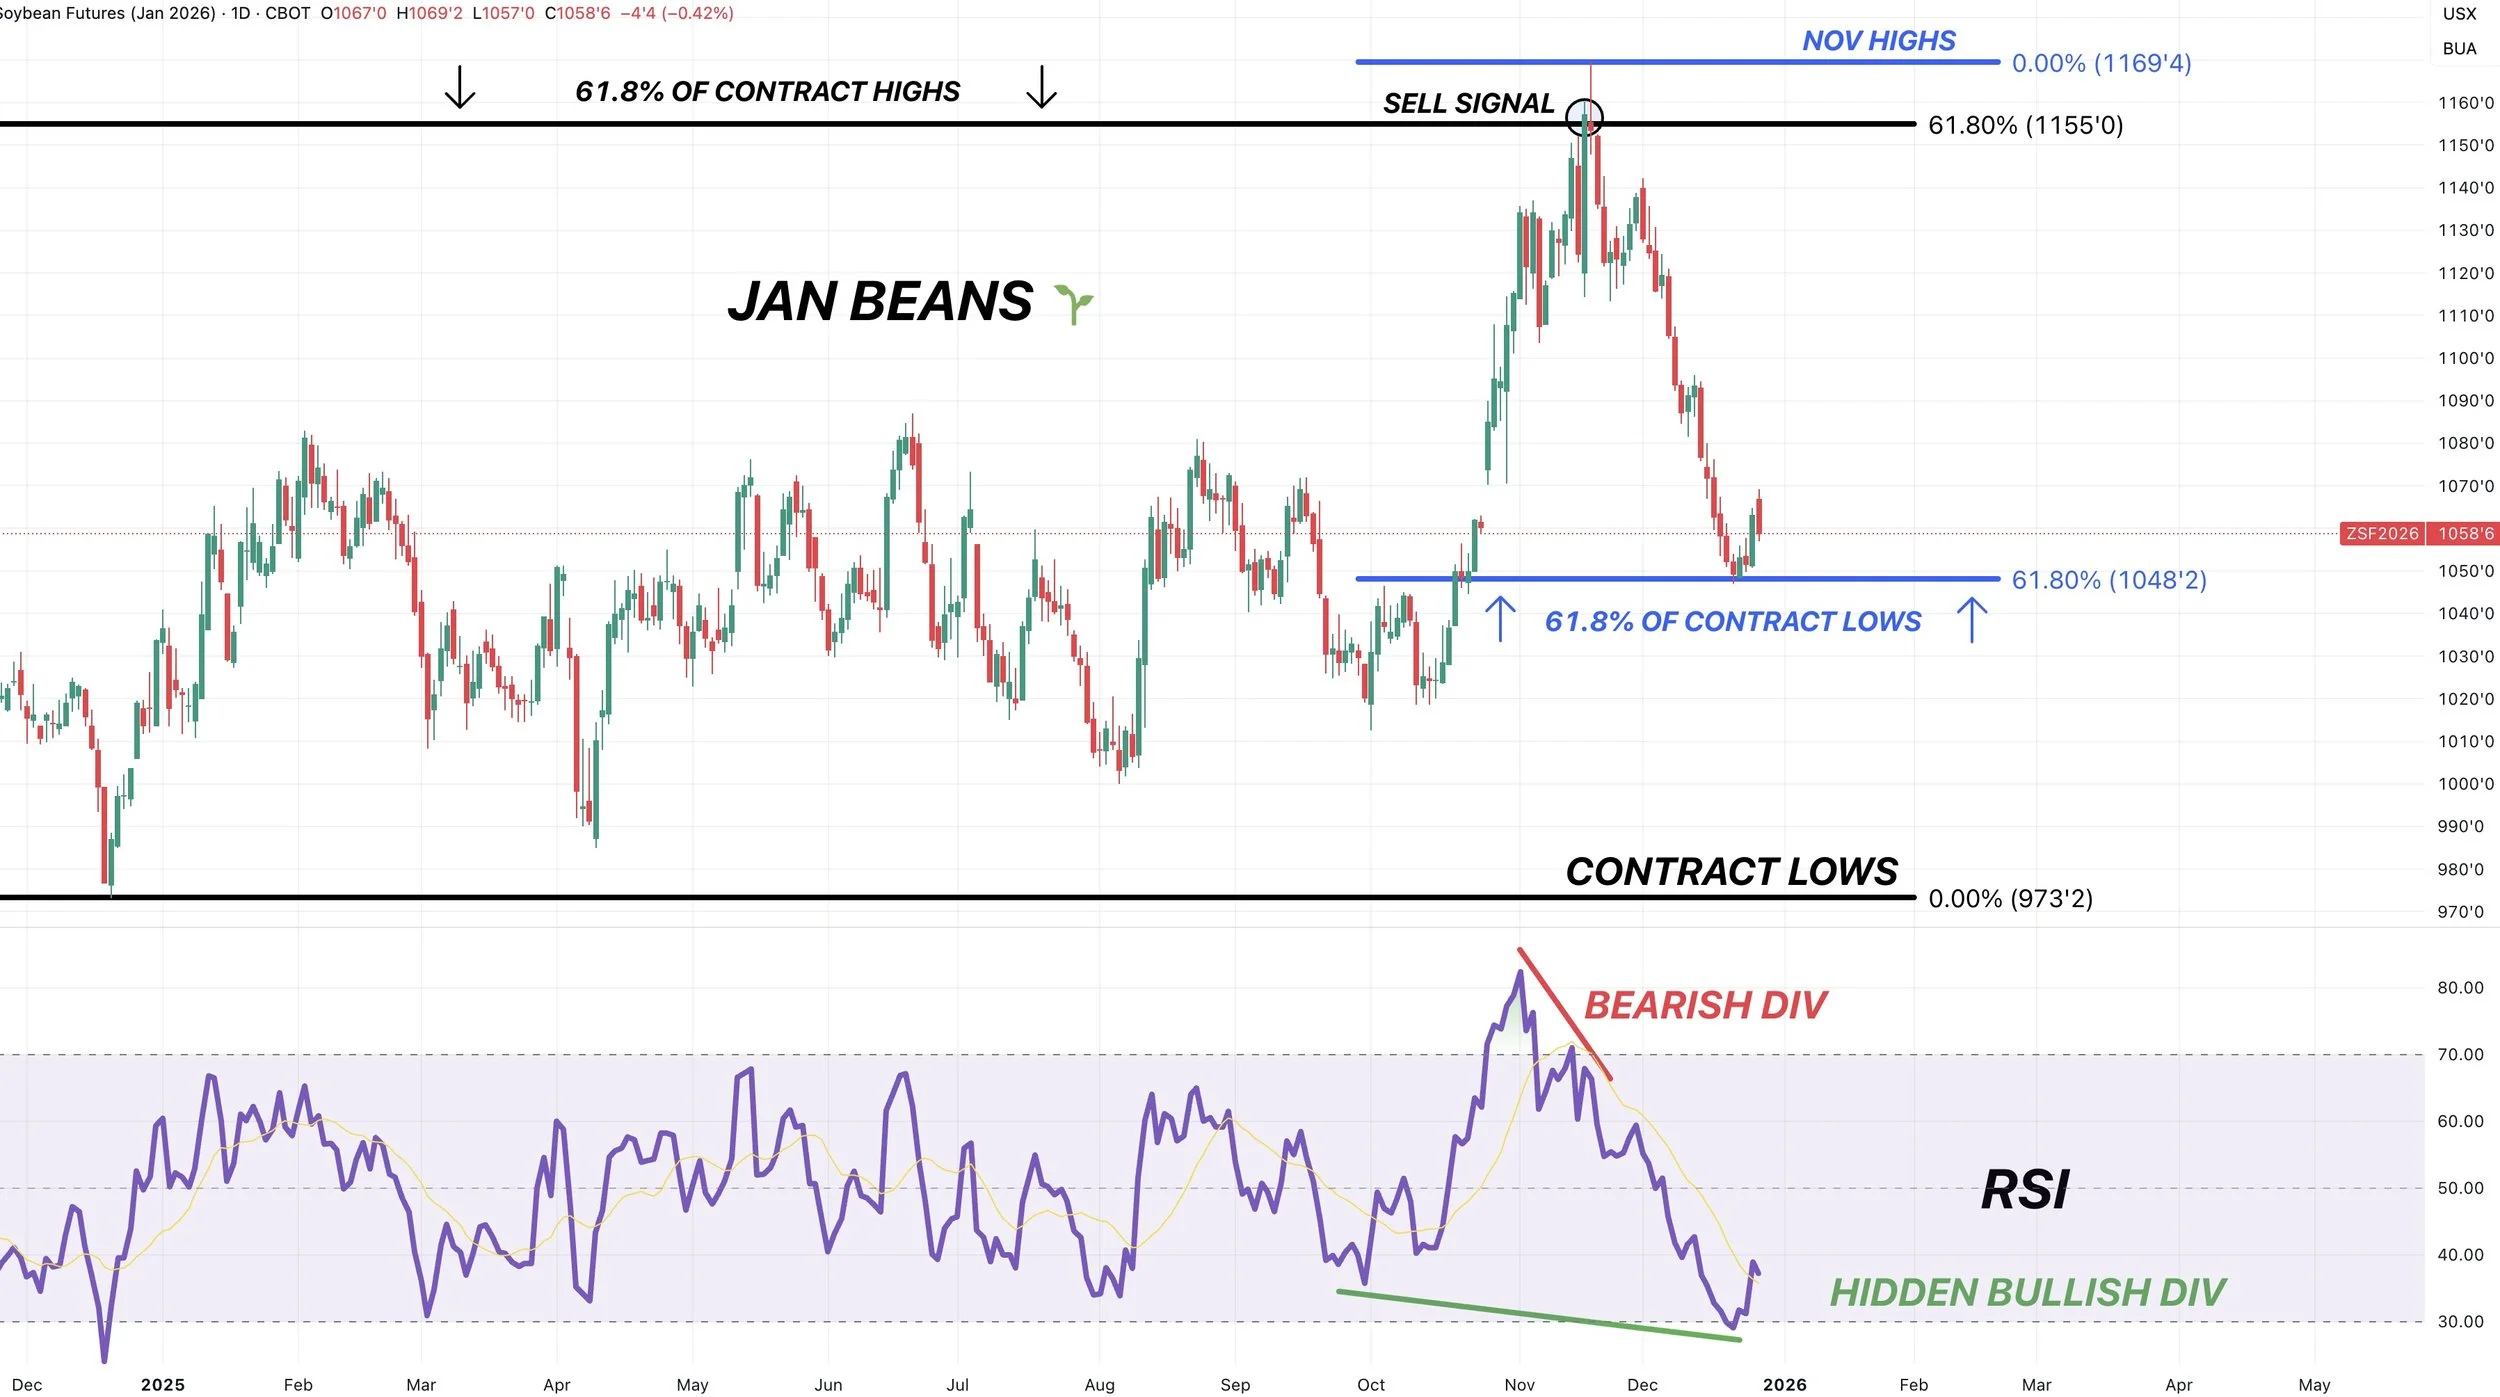
March Beans
Jumping over to March.
That buy signal came at $10.59
We broke the 61.8% level of the entire China fueld falled. The next level was the 78.6% level at $10.59
When you pair it with Jan beans approaching the 61.8% level down to contract lows, it was enough to trigger a buy signal and take profits off the shorts.
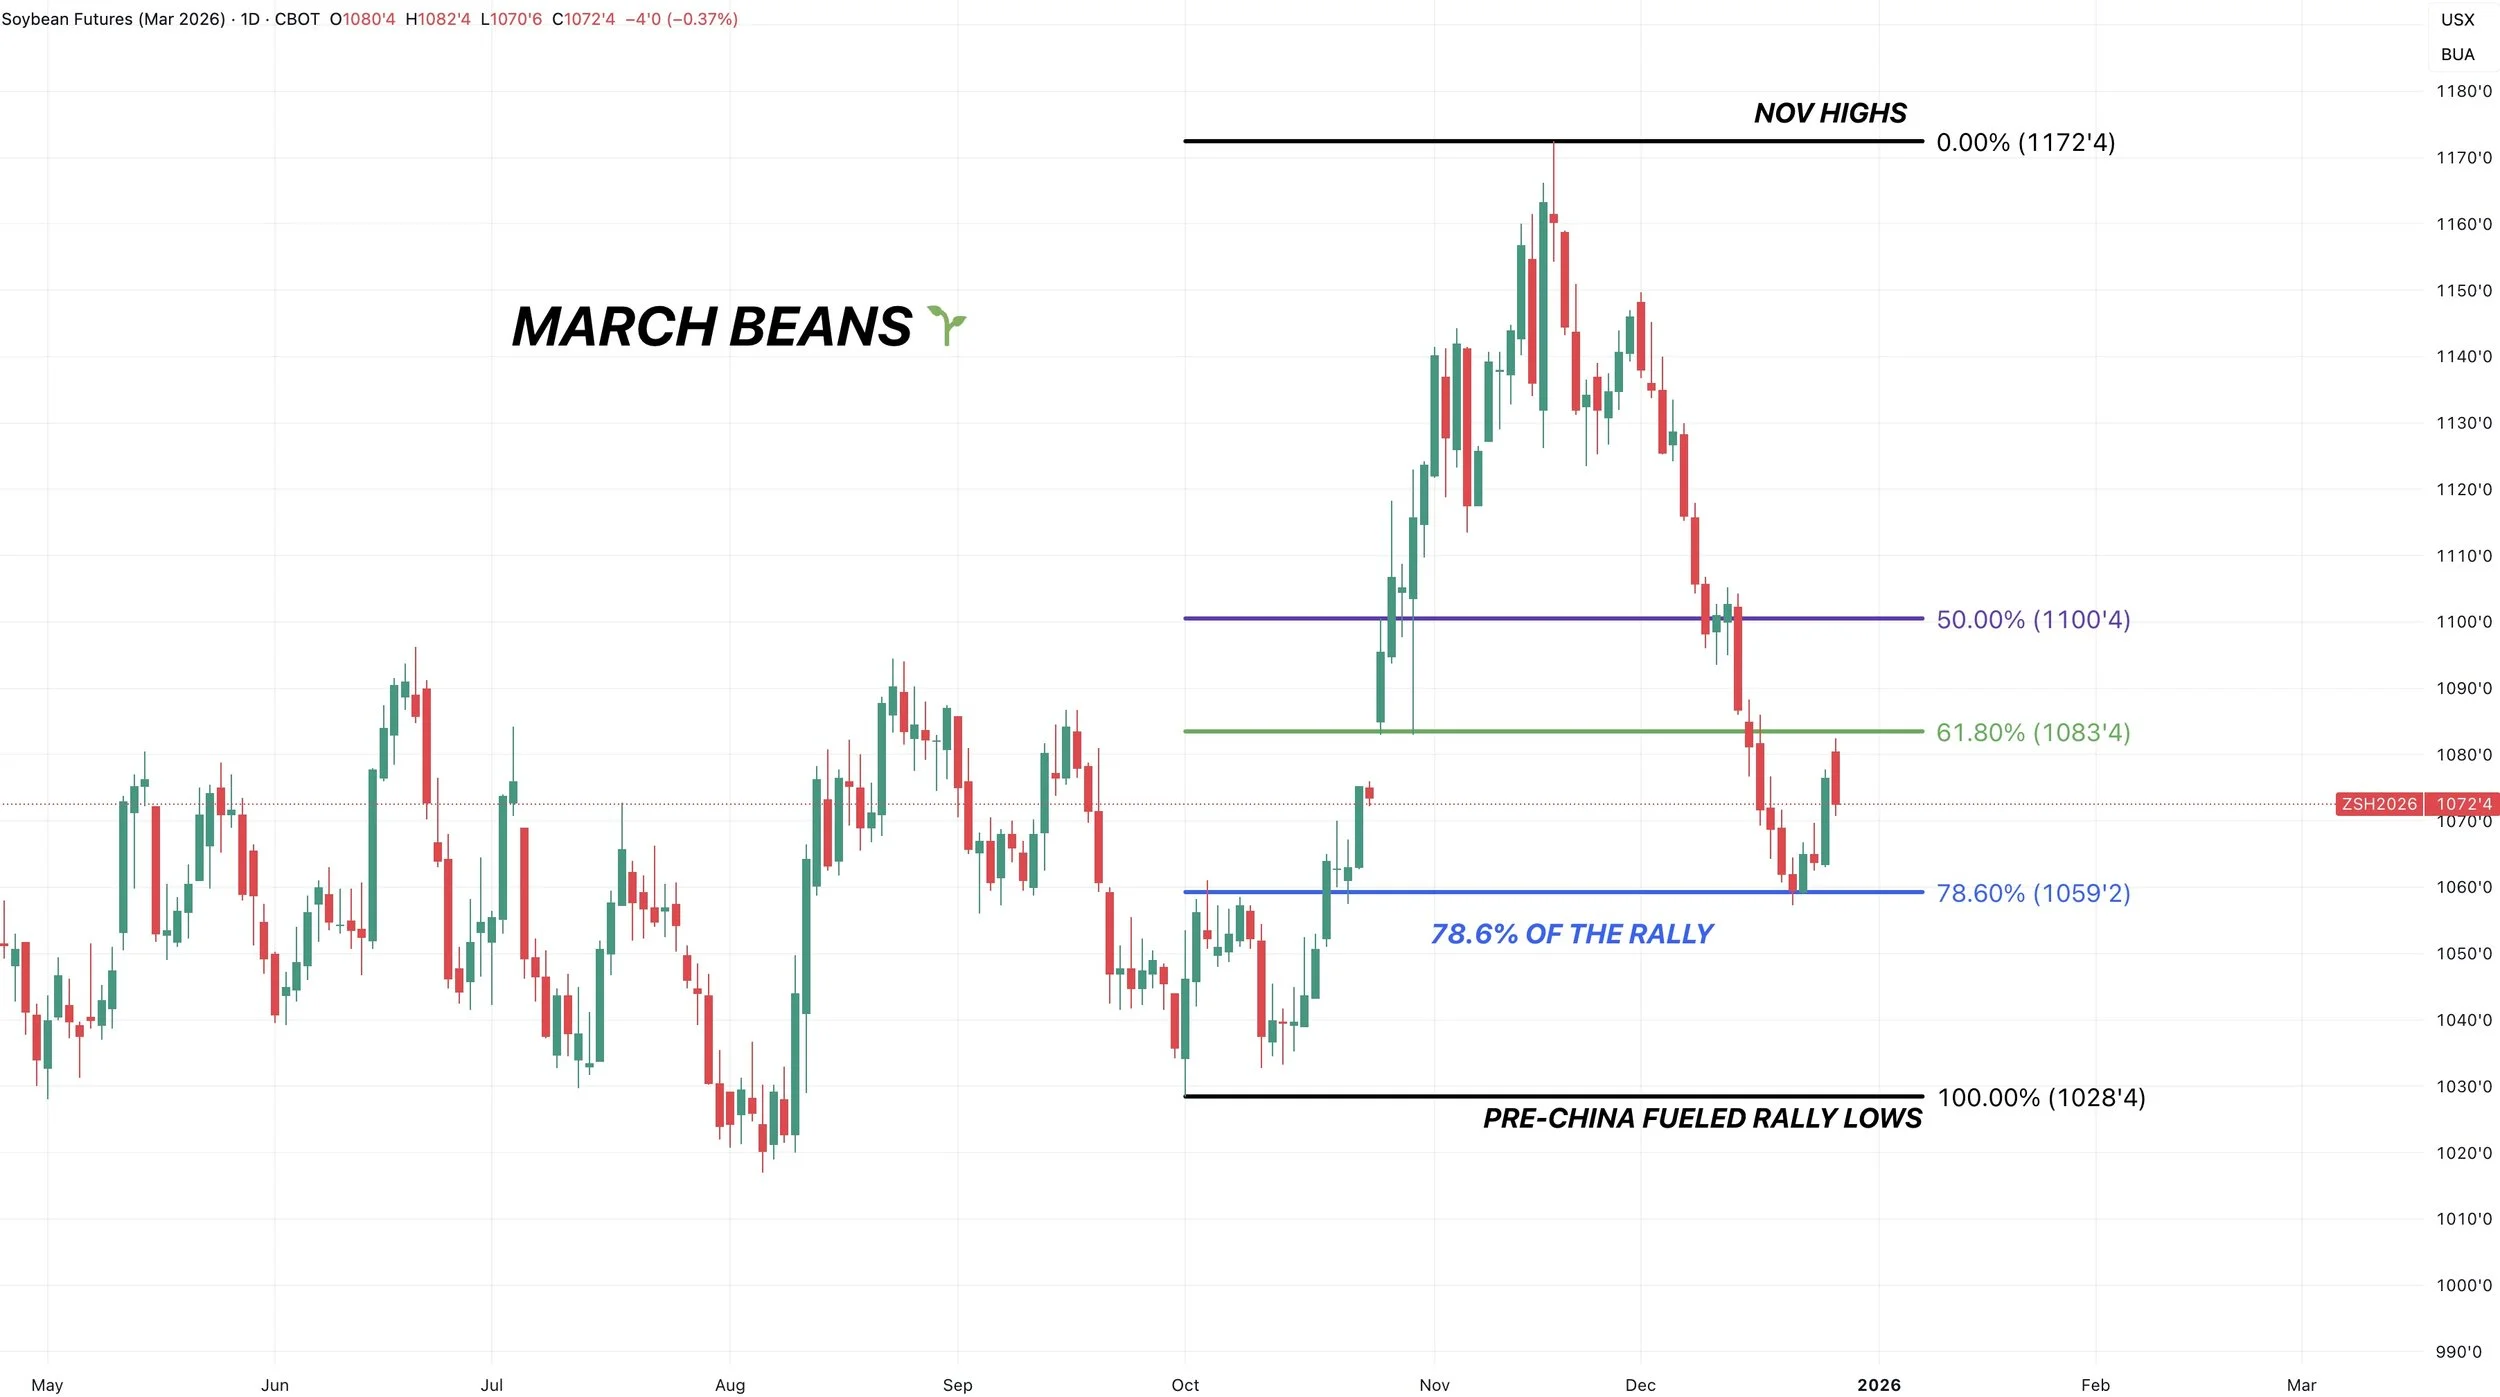
We were also the most oversold we've been in over a year.
At the same time, we were showing hidden bullish divergence here as well.
The RSI was very oversold, yet prices were much higher than the last time it was this oversold.
This doesn’t mean prices "have" to rally. It simply told us downside momentum might be getting weak.
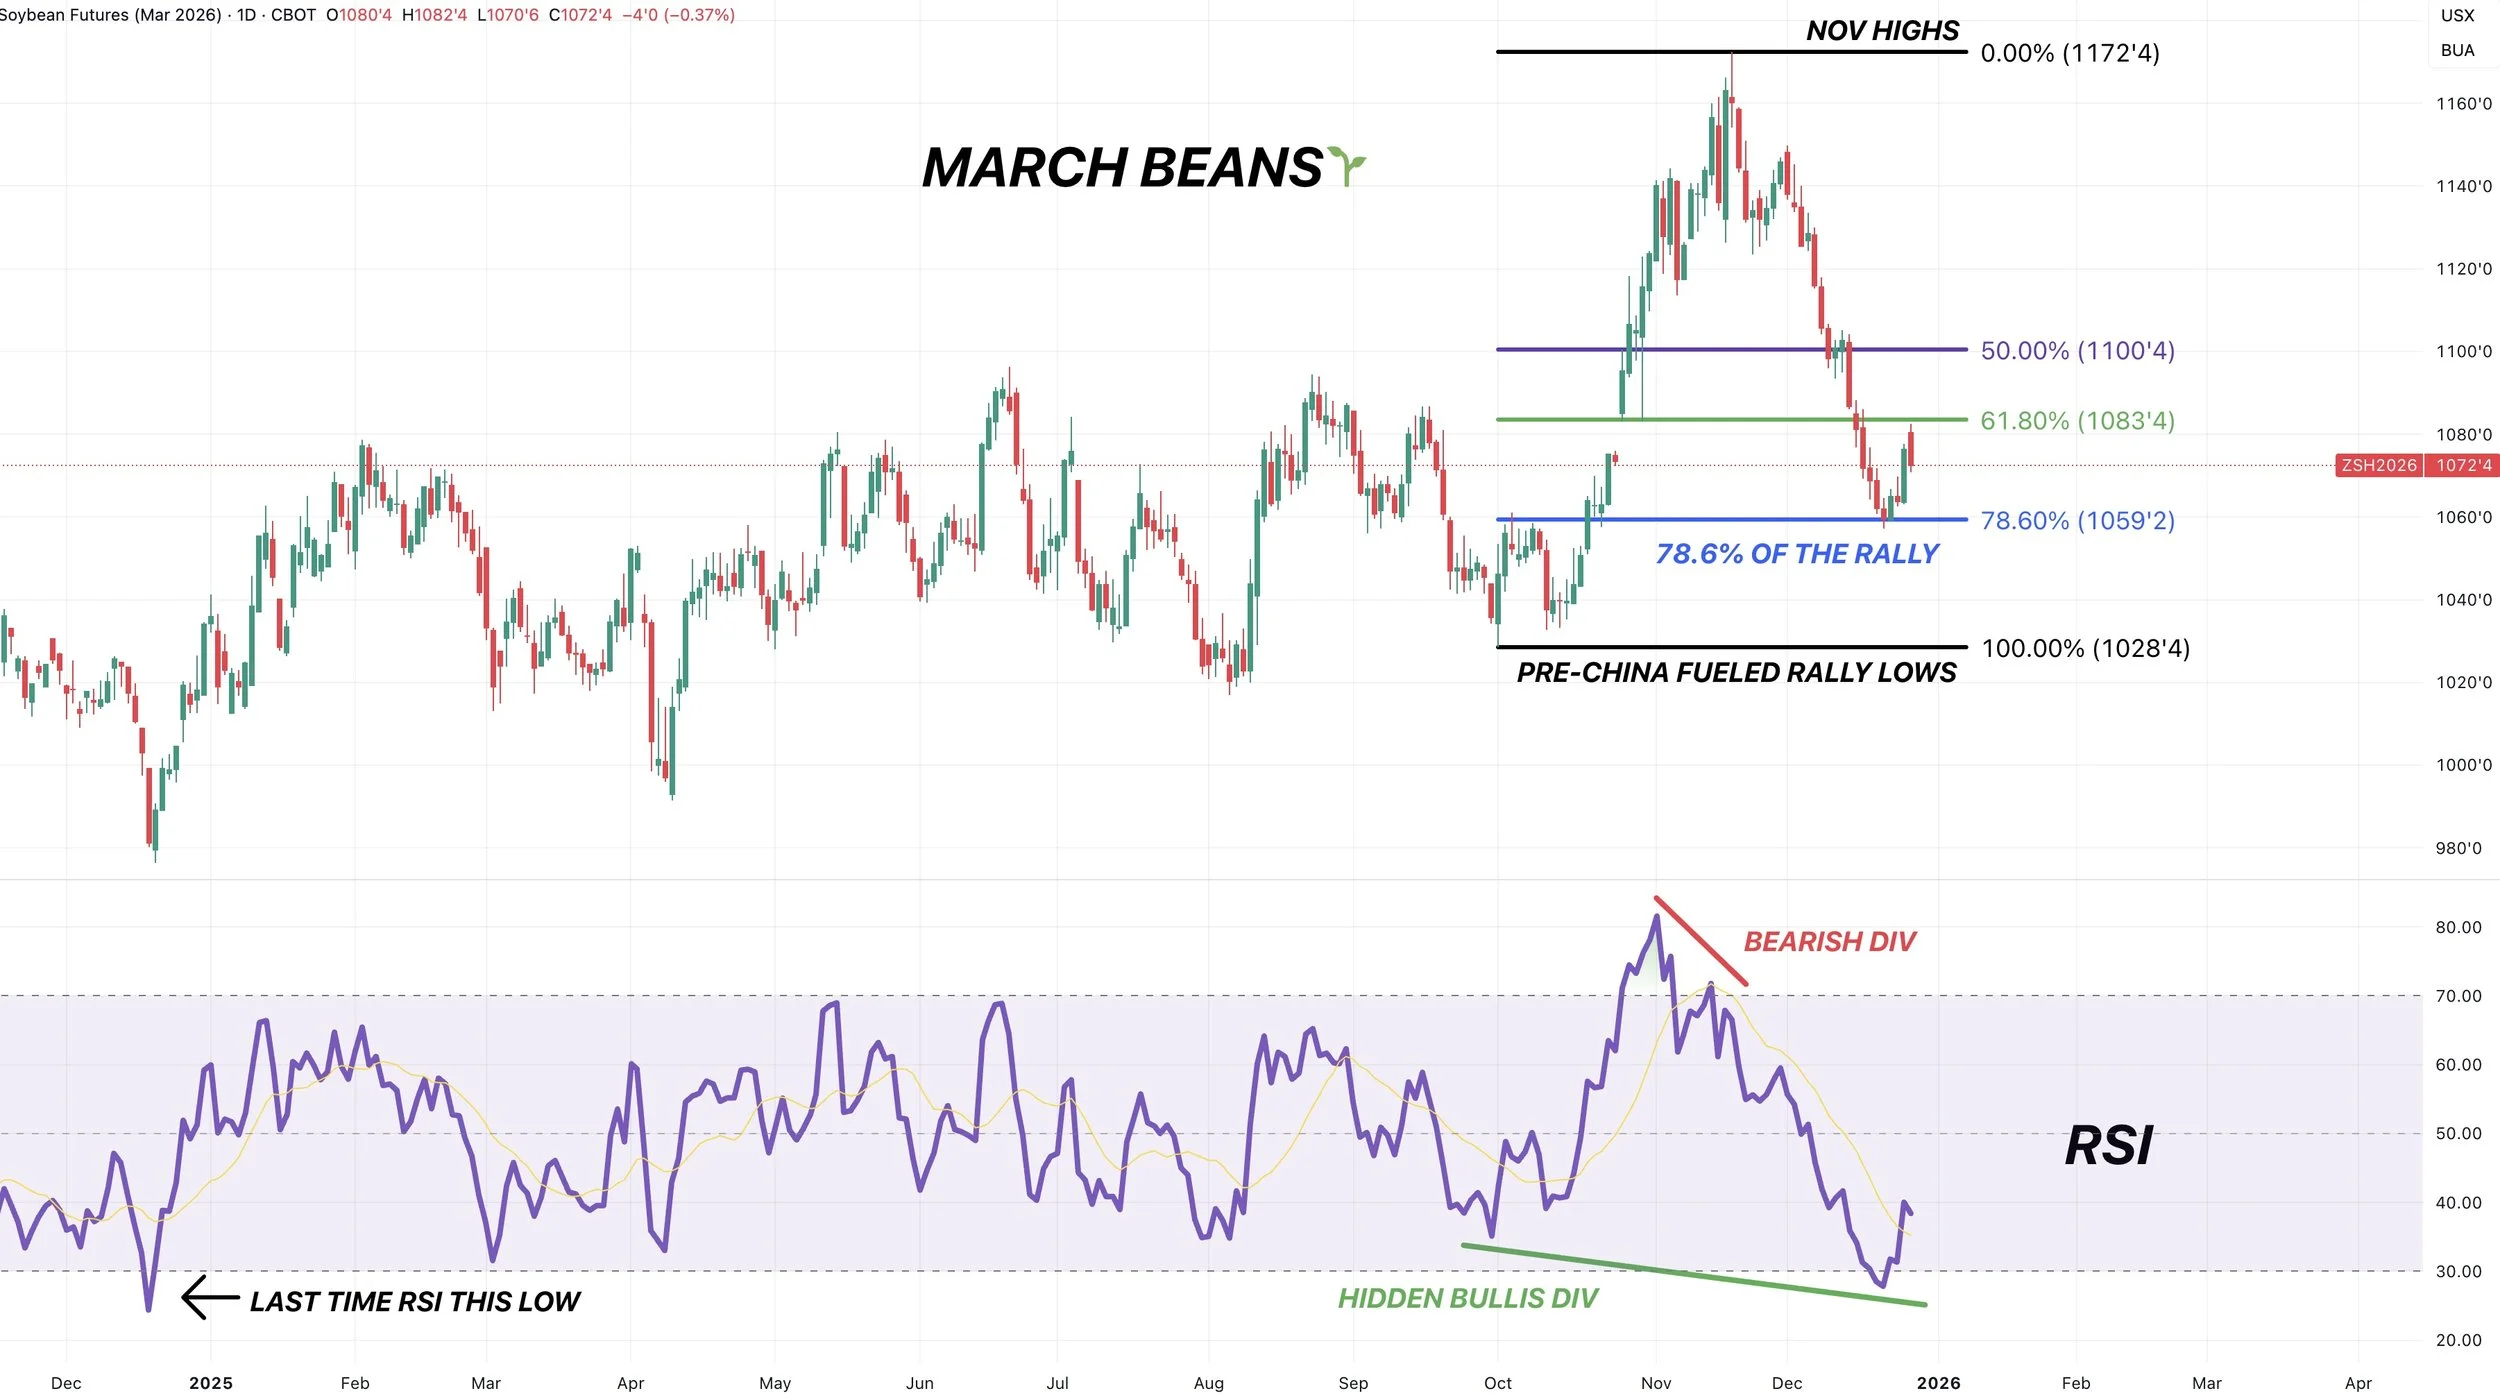
Continuous Weekly Chart
This is the continuous chart and shows the contract with the most volume.
We had a clear area of resistance all year long.
We got the break out in October.
We've now came down and tested that point of break out. Often times, old resistance becomes new support and vice versa.
A perfect example of this would be the highs we just posted. We happened to fail right at those old support levels from 2024.
At the same time, this chart had a gap left open.
Last week we filled that gap, which perfectly lined up with the old resistance. Along with the 61.8% retracement level down to the Sep lows.
So finding life here makes sense.
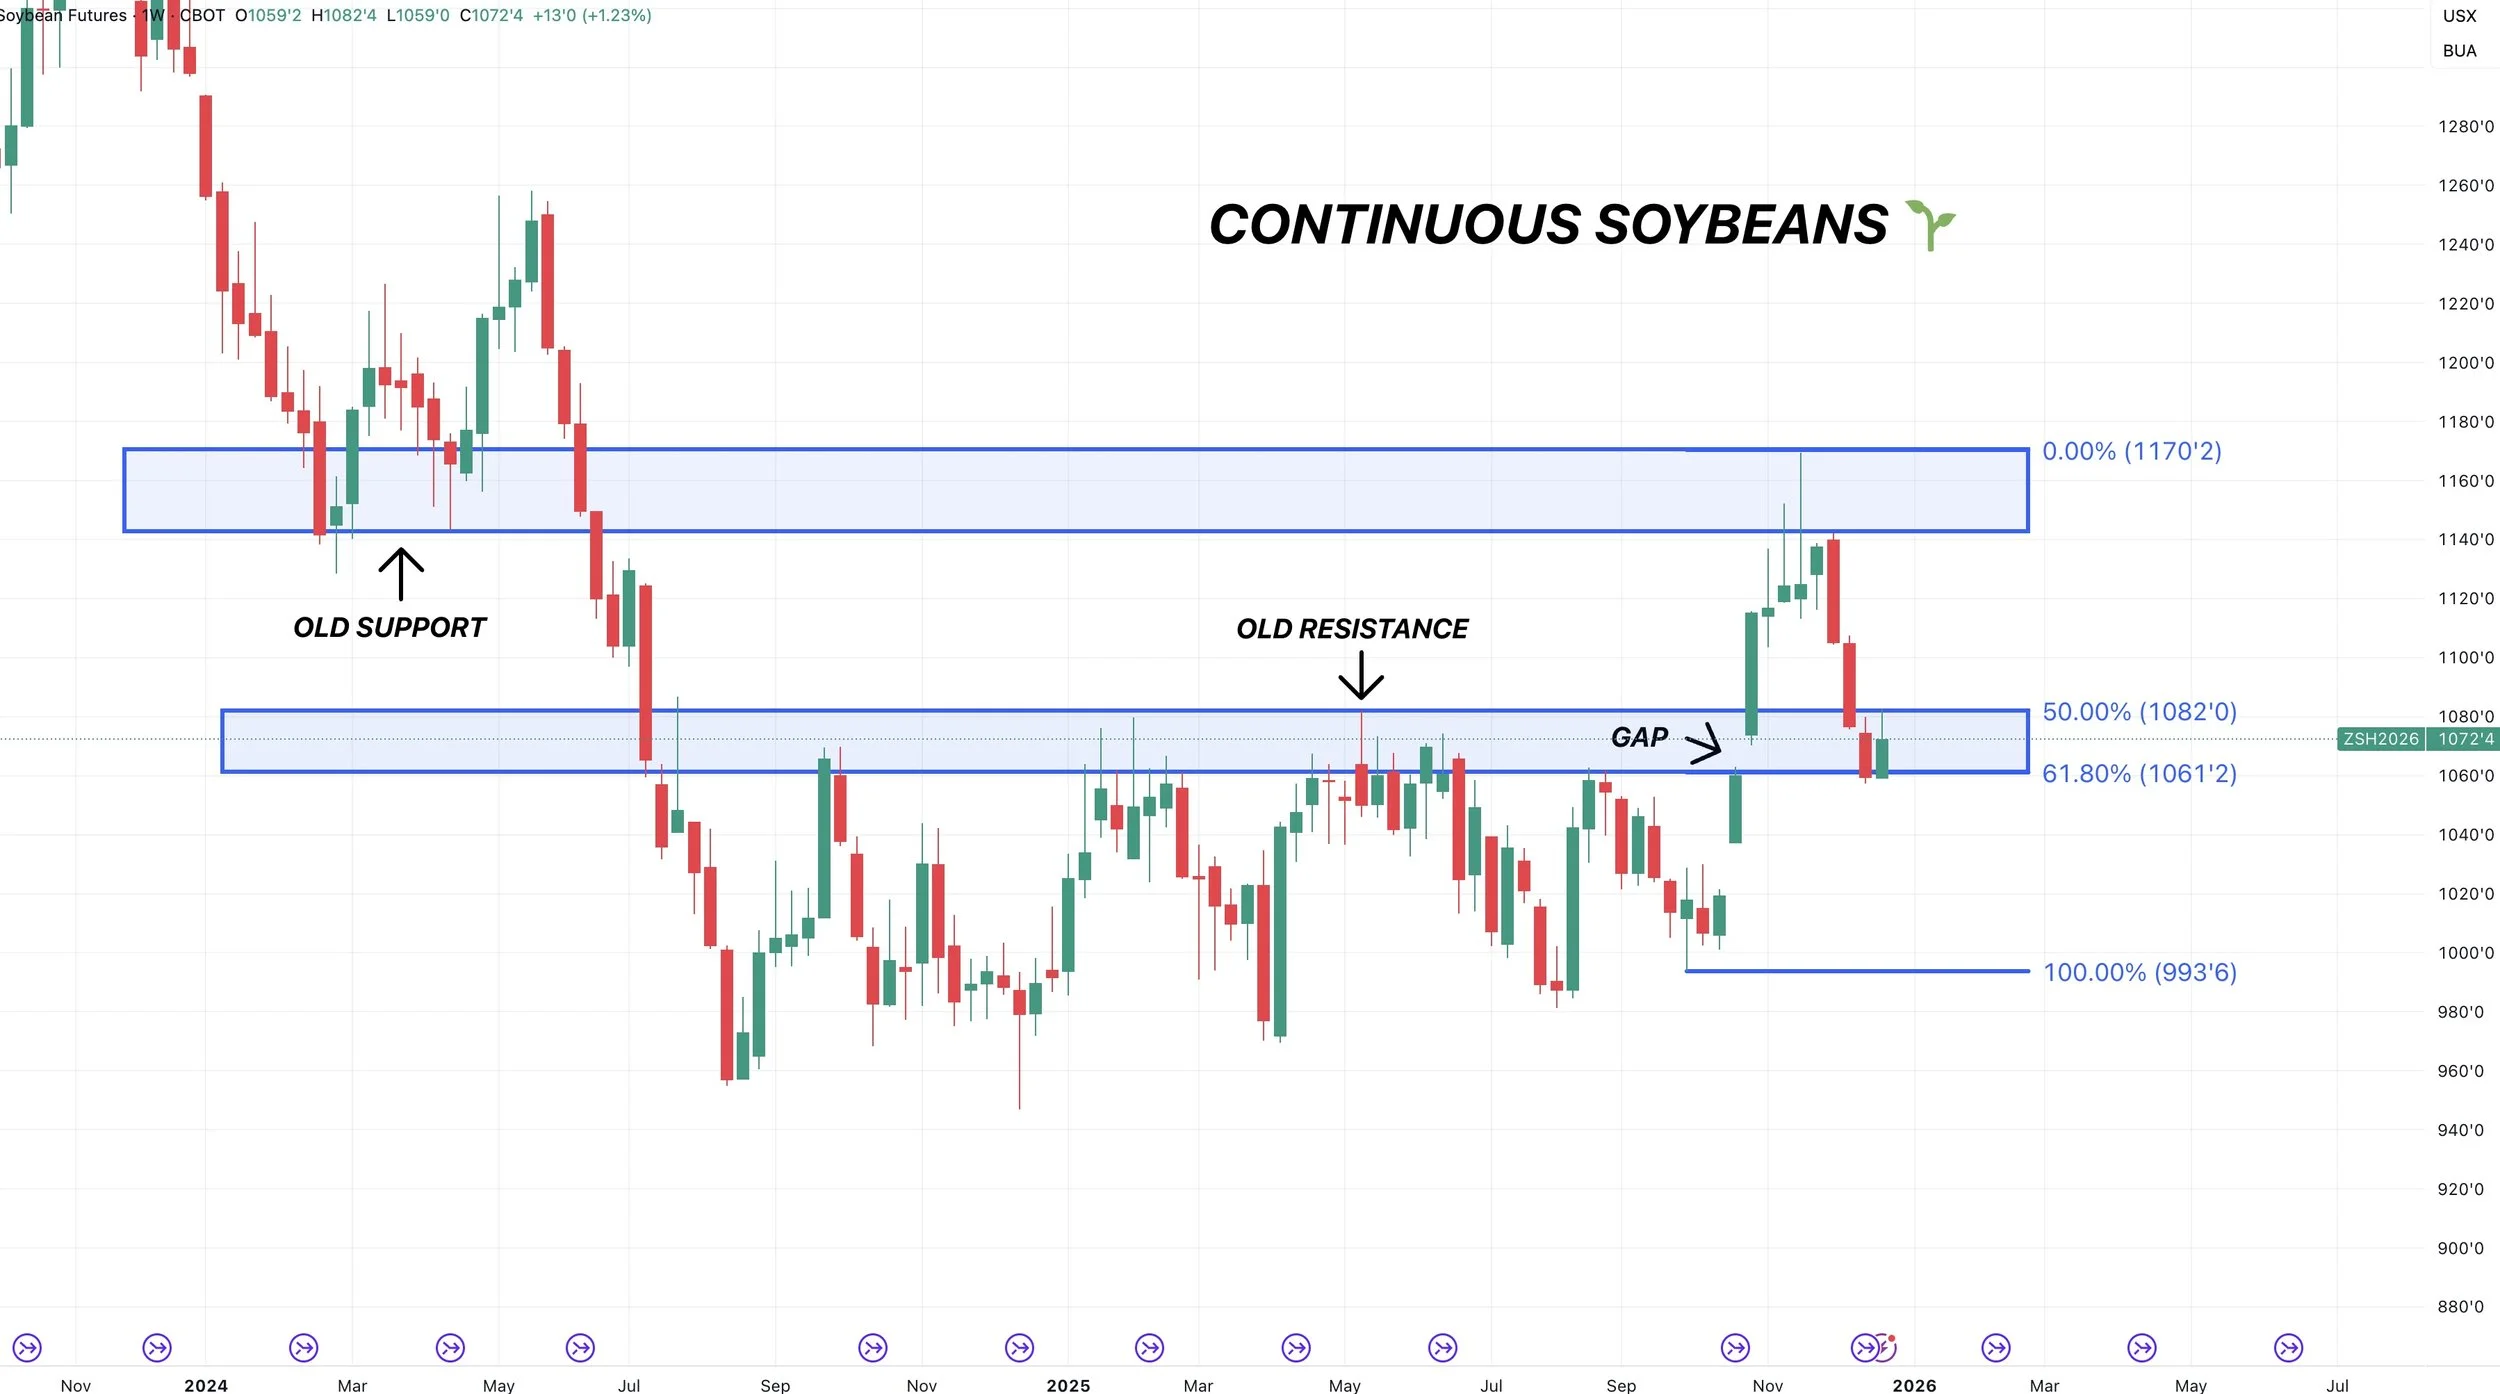
March Beans Target:
Well, now how high can we go?
Since this correction was so deep, it appears unlikely that this market is going to go and post new highs. If it did, I think it would take a larger outside factor. Such as an issue in Brazil or China buying more beans than the market has currently priced in. But for now, neither of those seem all that likely.
So if we found our local bottom here, we are going to want to be looking to reward this relief bounce.
The golden zone is the 50-61.8% levels. However, I have my doubts that this market has enough steam to get that high given the size of the sell off.
So I am looking to de-risk in the $11.00 to $11.15 area as of now, but is of course subject to change as the chart develops.
That level claws back 38.2% to 50% of the entire sell off.
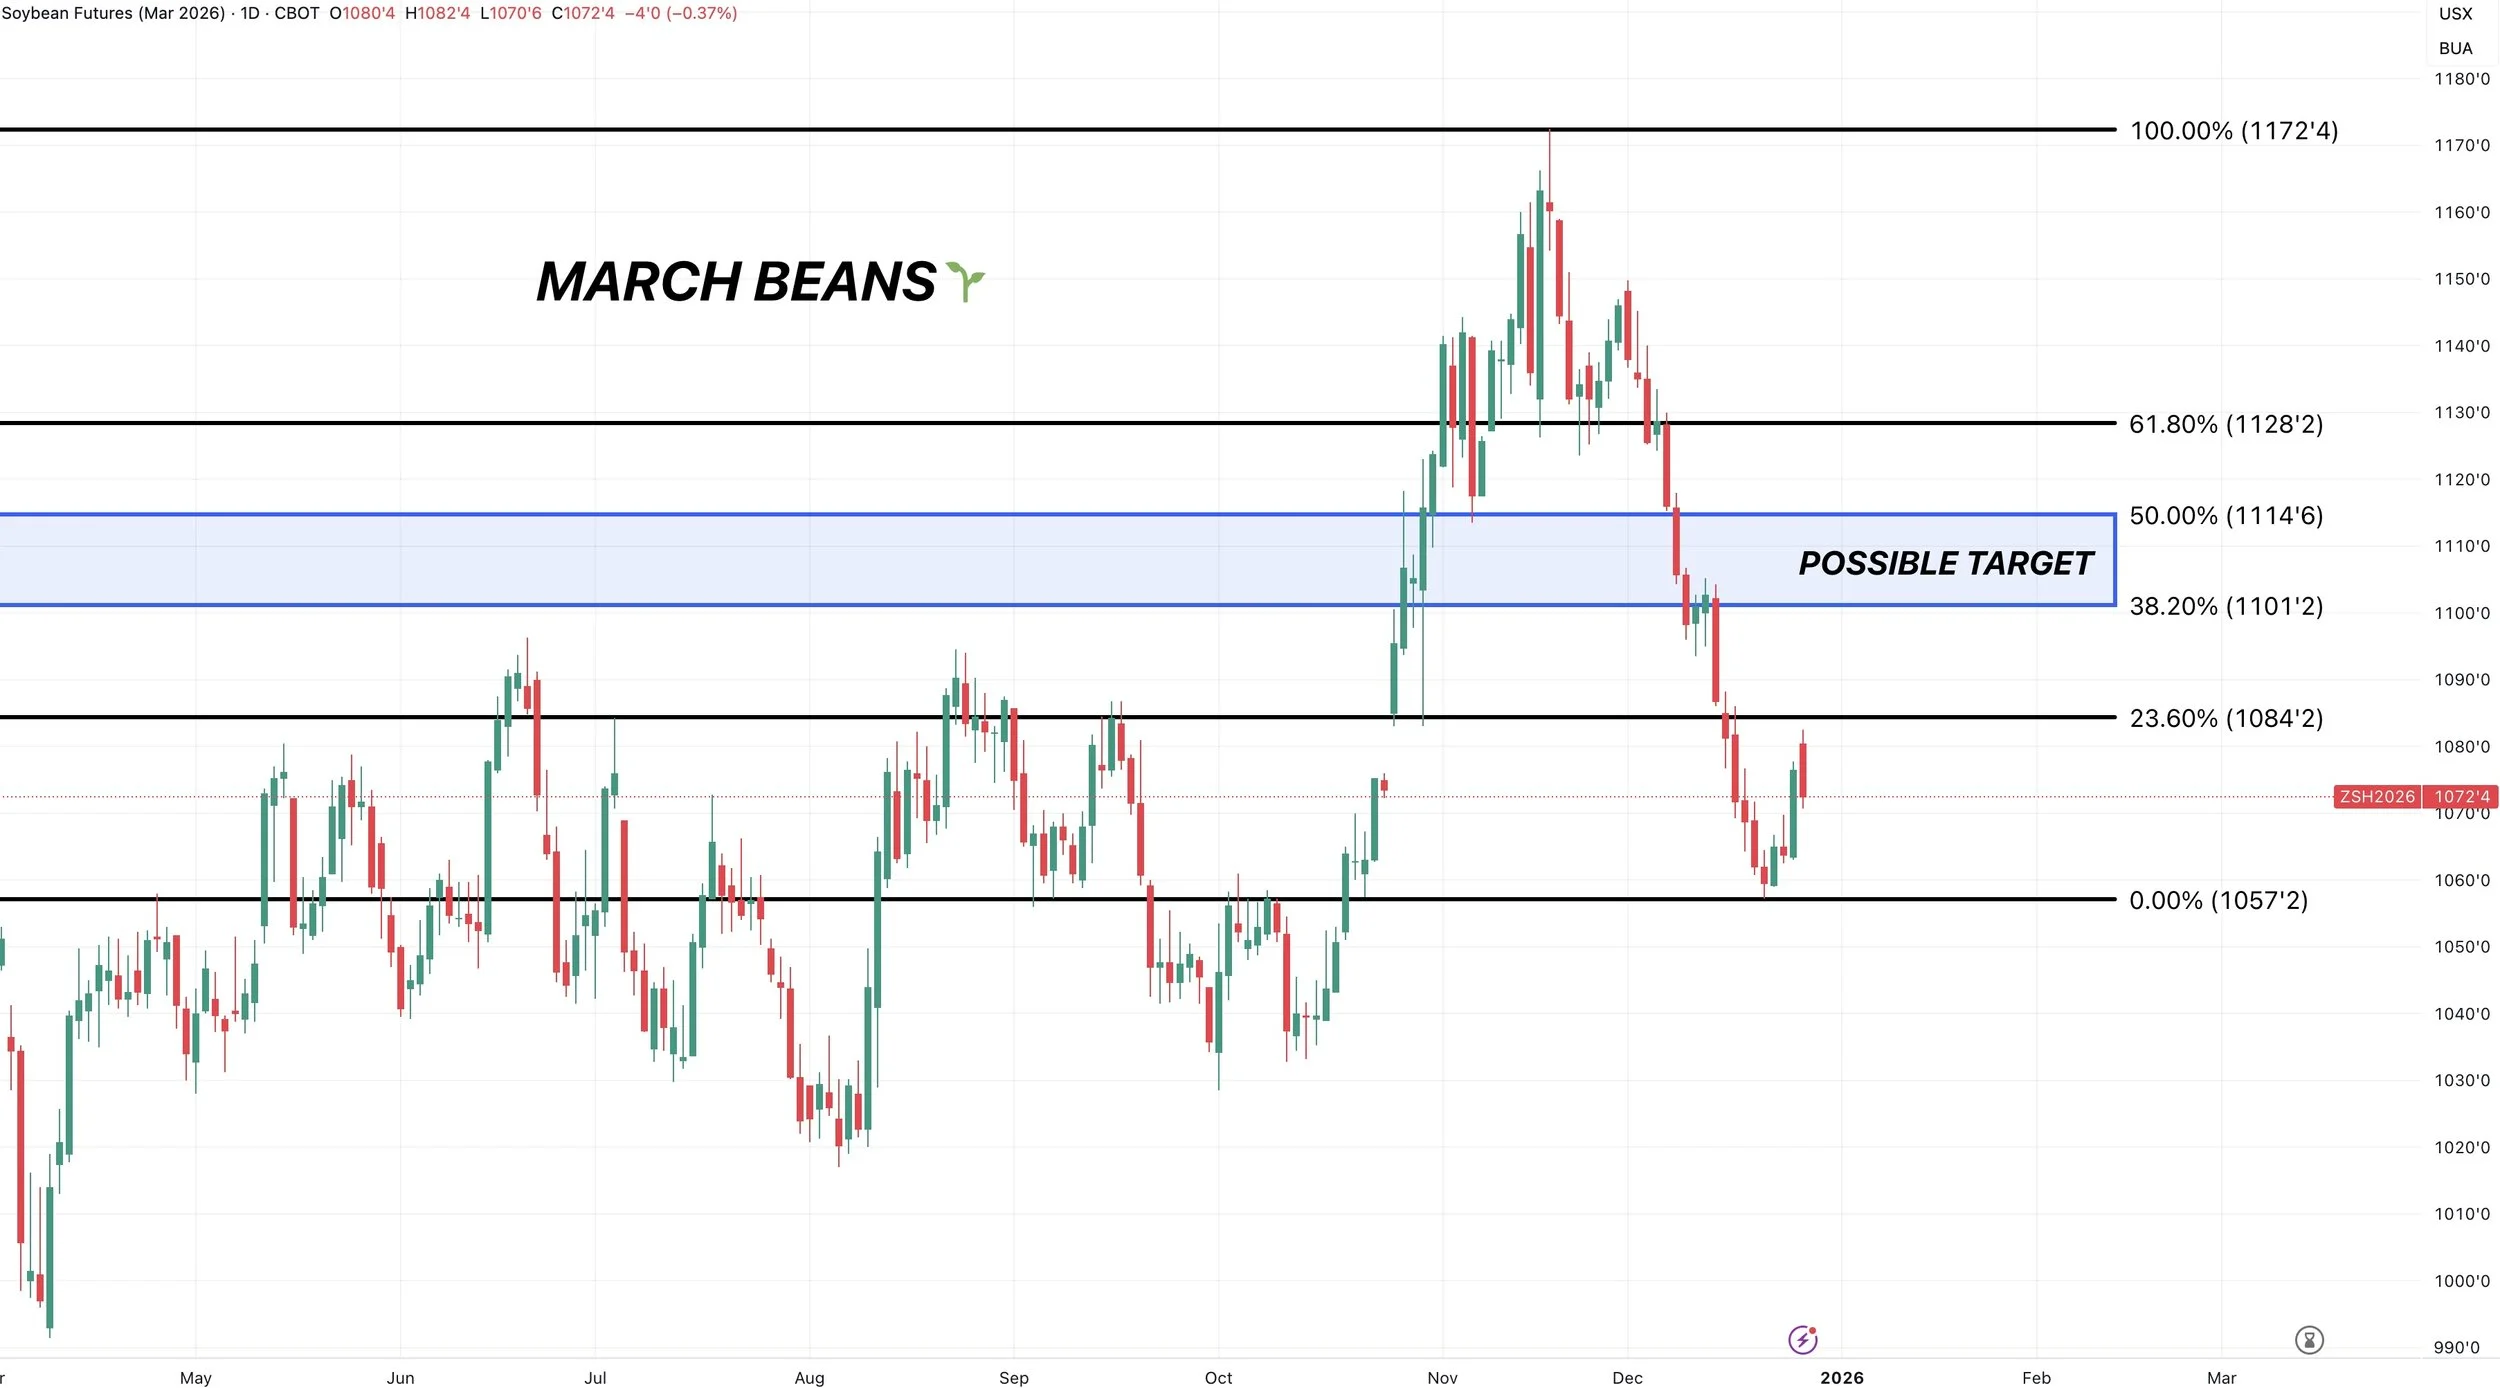
Past Relief Bounces
Like we talked about last week.
When a market posts a major high, often times it will give some sort of relief bounce. Not every time, but a lot times.
It's typically not just a straight sell off that goes to zero.
This is because the most common correction pattern is markets is called an ABC correction.
You get the intial A wave down. The B wave relief bounce. Then the last C wave down.
We showed this last week. But an example of this is July corn from earlier this year.
We got the initial sell. We then got a relief bounce up to the golden zone. We then went a lot lower.
Interestingly enough, the top was marked with bearish divergence. The bottom of the relief bounce was marked with bullish divergence.
So some similarities there to what we are currently seeing in soybeans.
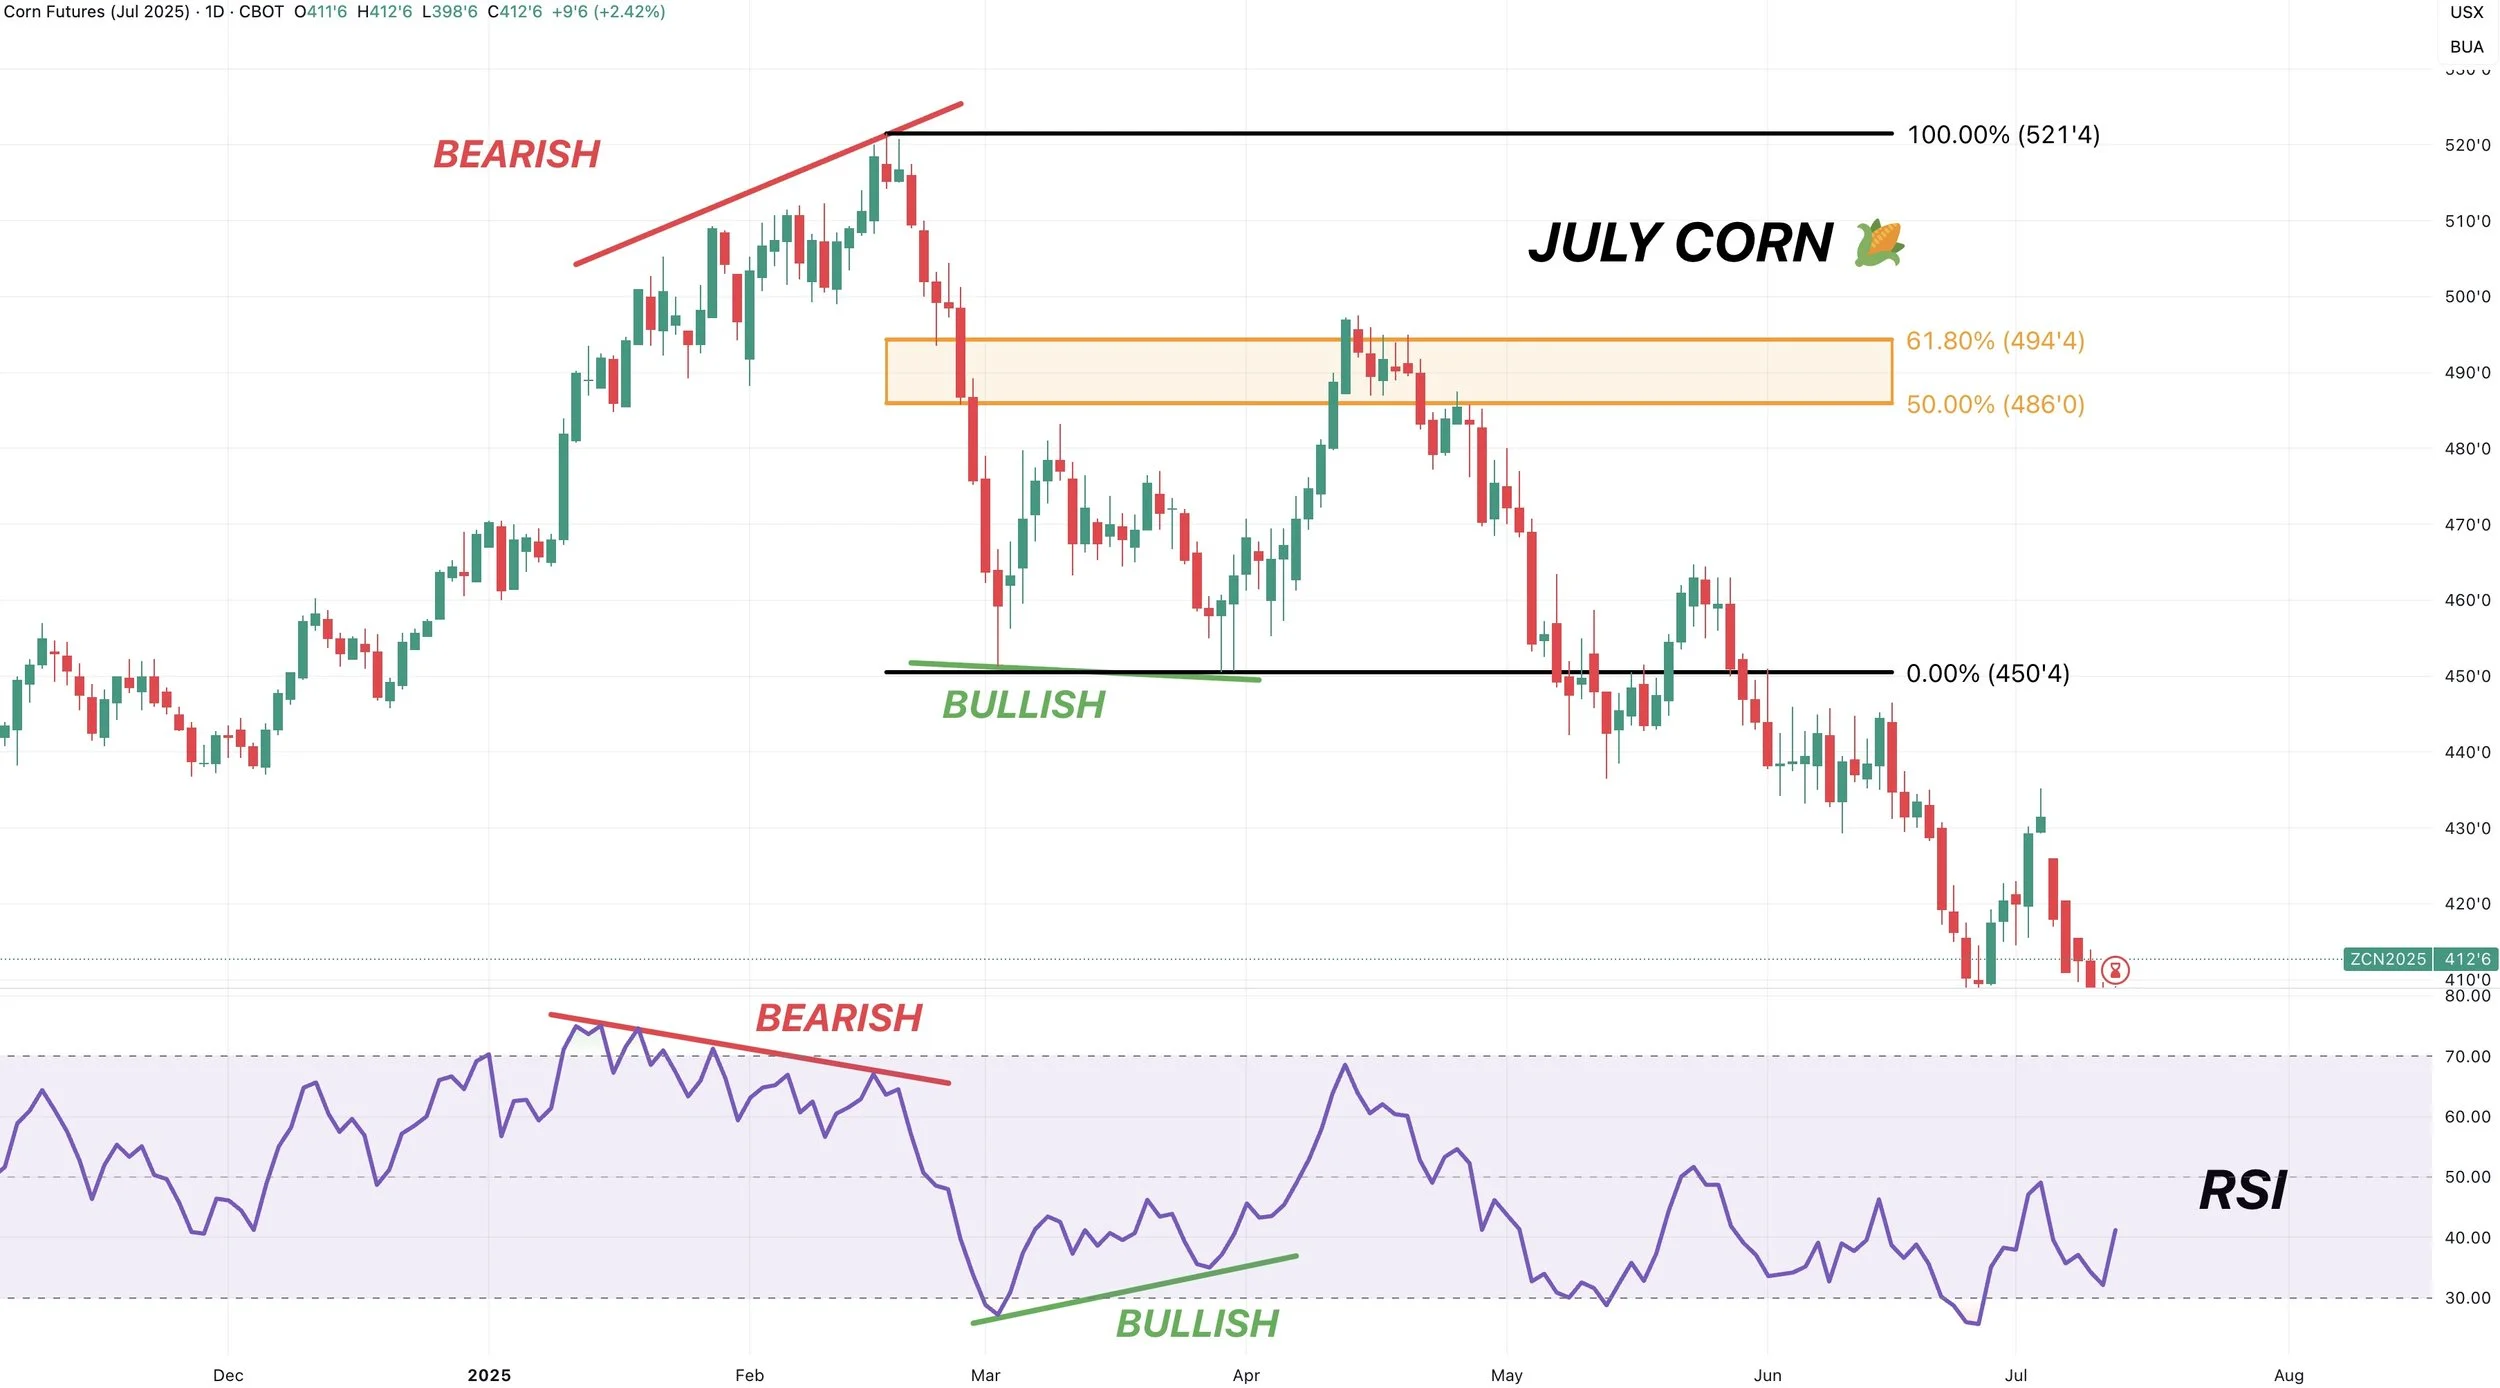
Here is another great example of a relief bounce.
This one is Dec-23 corn.
We had that weather scare rally that took corn from $4.90 to $6.30 in a few weeks.
Corn then gave it all back in just a matter of days.
But the market did offer a relief bounce before ultimately falling apart.
The relief bounce failed once again right in that golden zone.
The point is, relief bounces are common. But we want to reward it if it comes. Just like we rewarded the April bounce in corn this year.
As they are often opportunities when they present themselves.
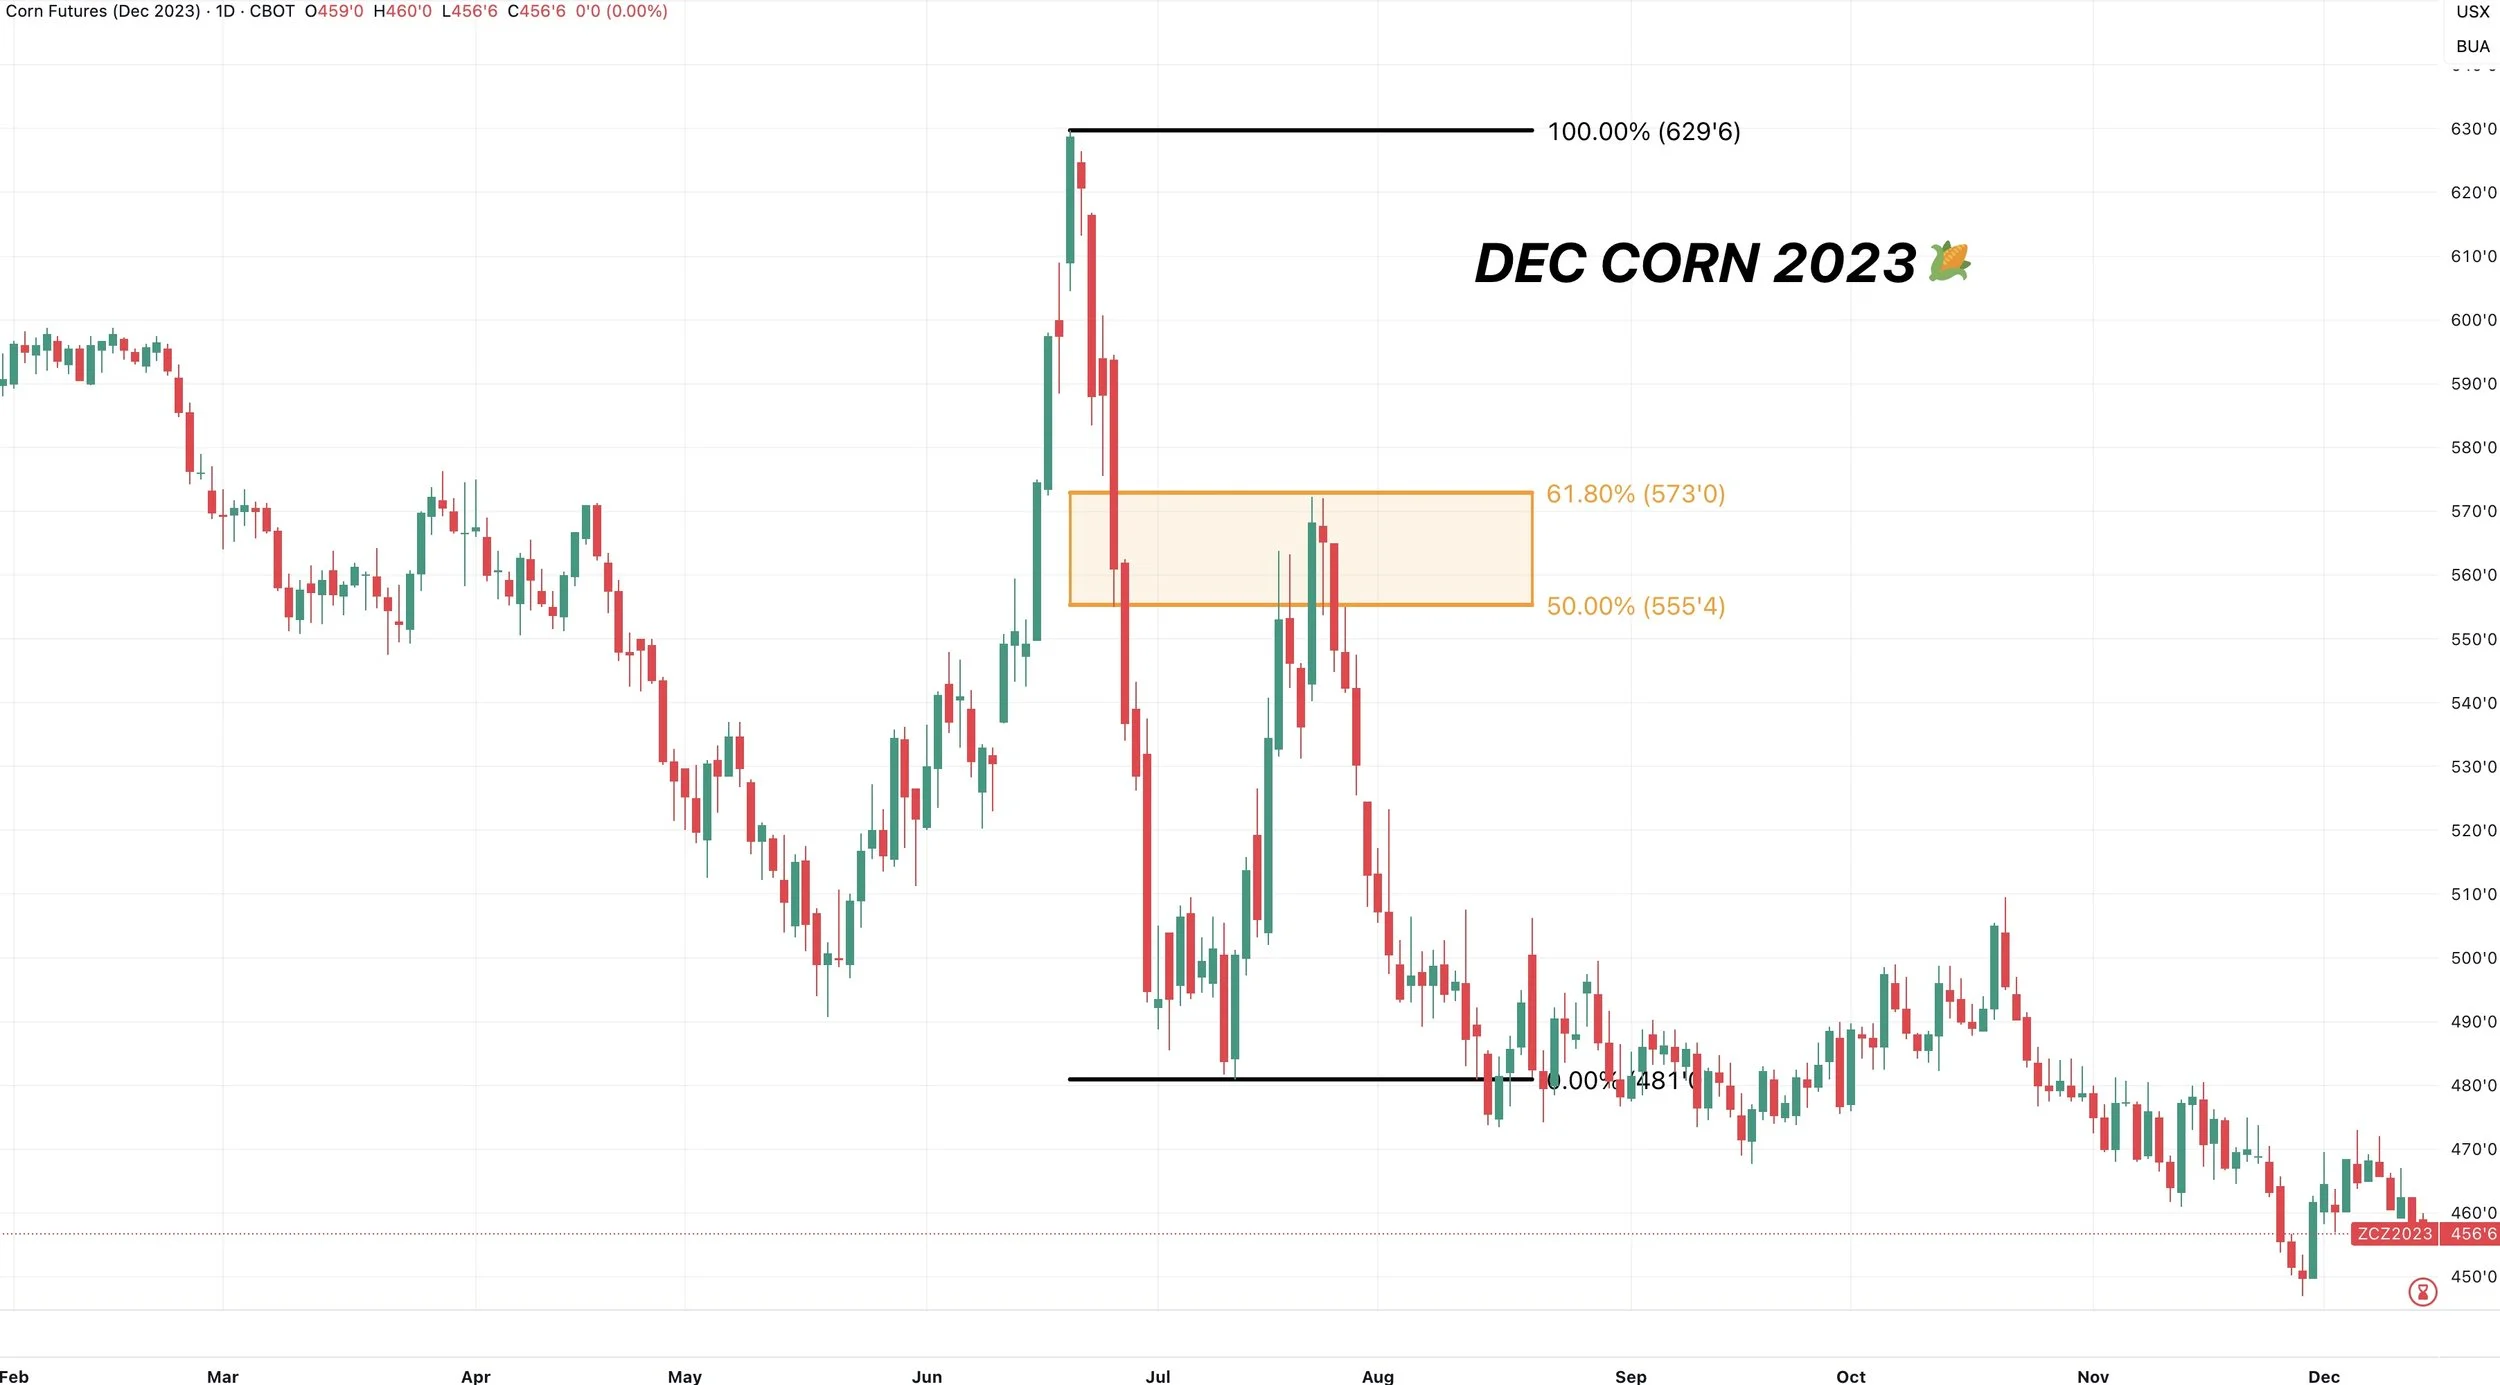
Corn
March Corn
March corn is currently battling some big resistance we've continue to struggle at for months now.
This is a big spot for corn, as we are flirting with a breakout if we can clear this level.
It was support from spring, we've rejected this level a dozen times since October.
If we get a break above, it should result in further upside.
We are also above the 200-day for the 3rd day in a row. Which is something we haven’t seen since summer.
Being above the 200-day after being below it for so long, can often be a sign that a market's long term momentum is shifting higher. So it's nice to see that.
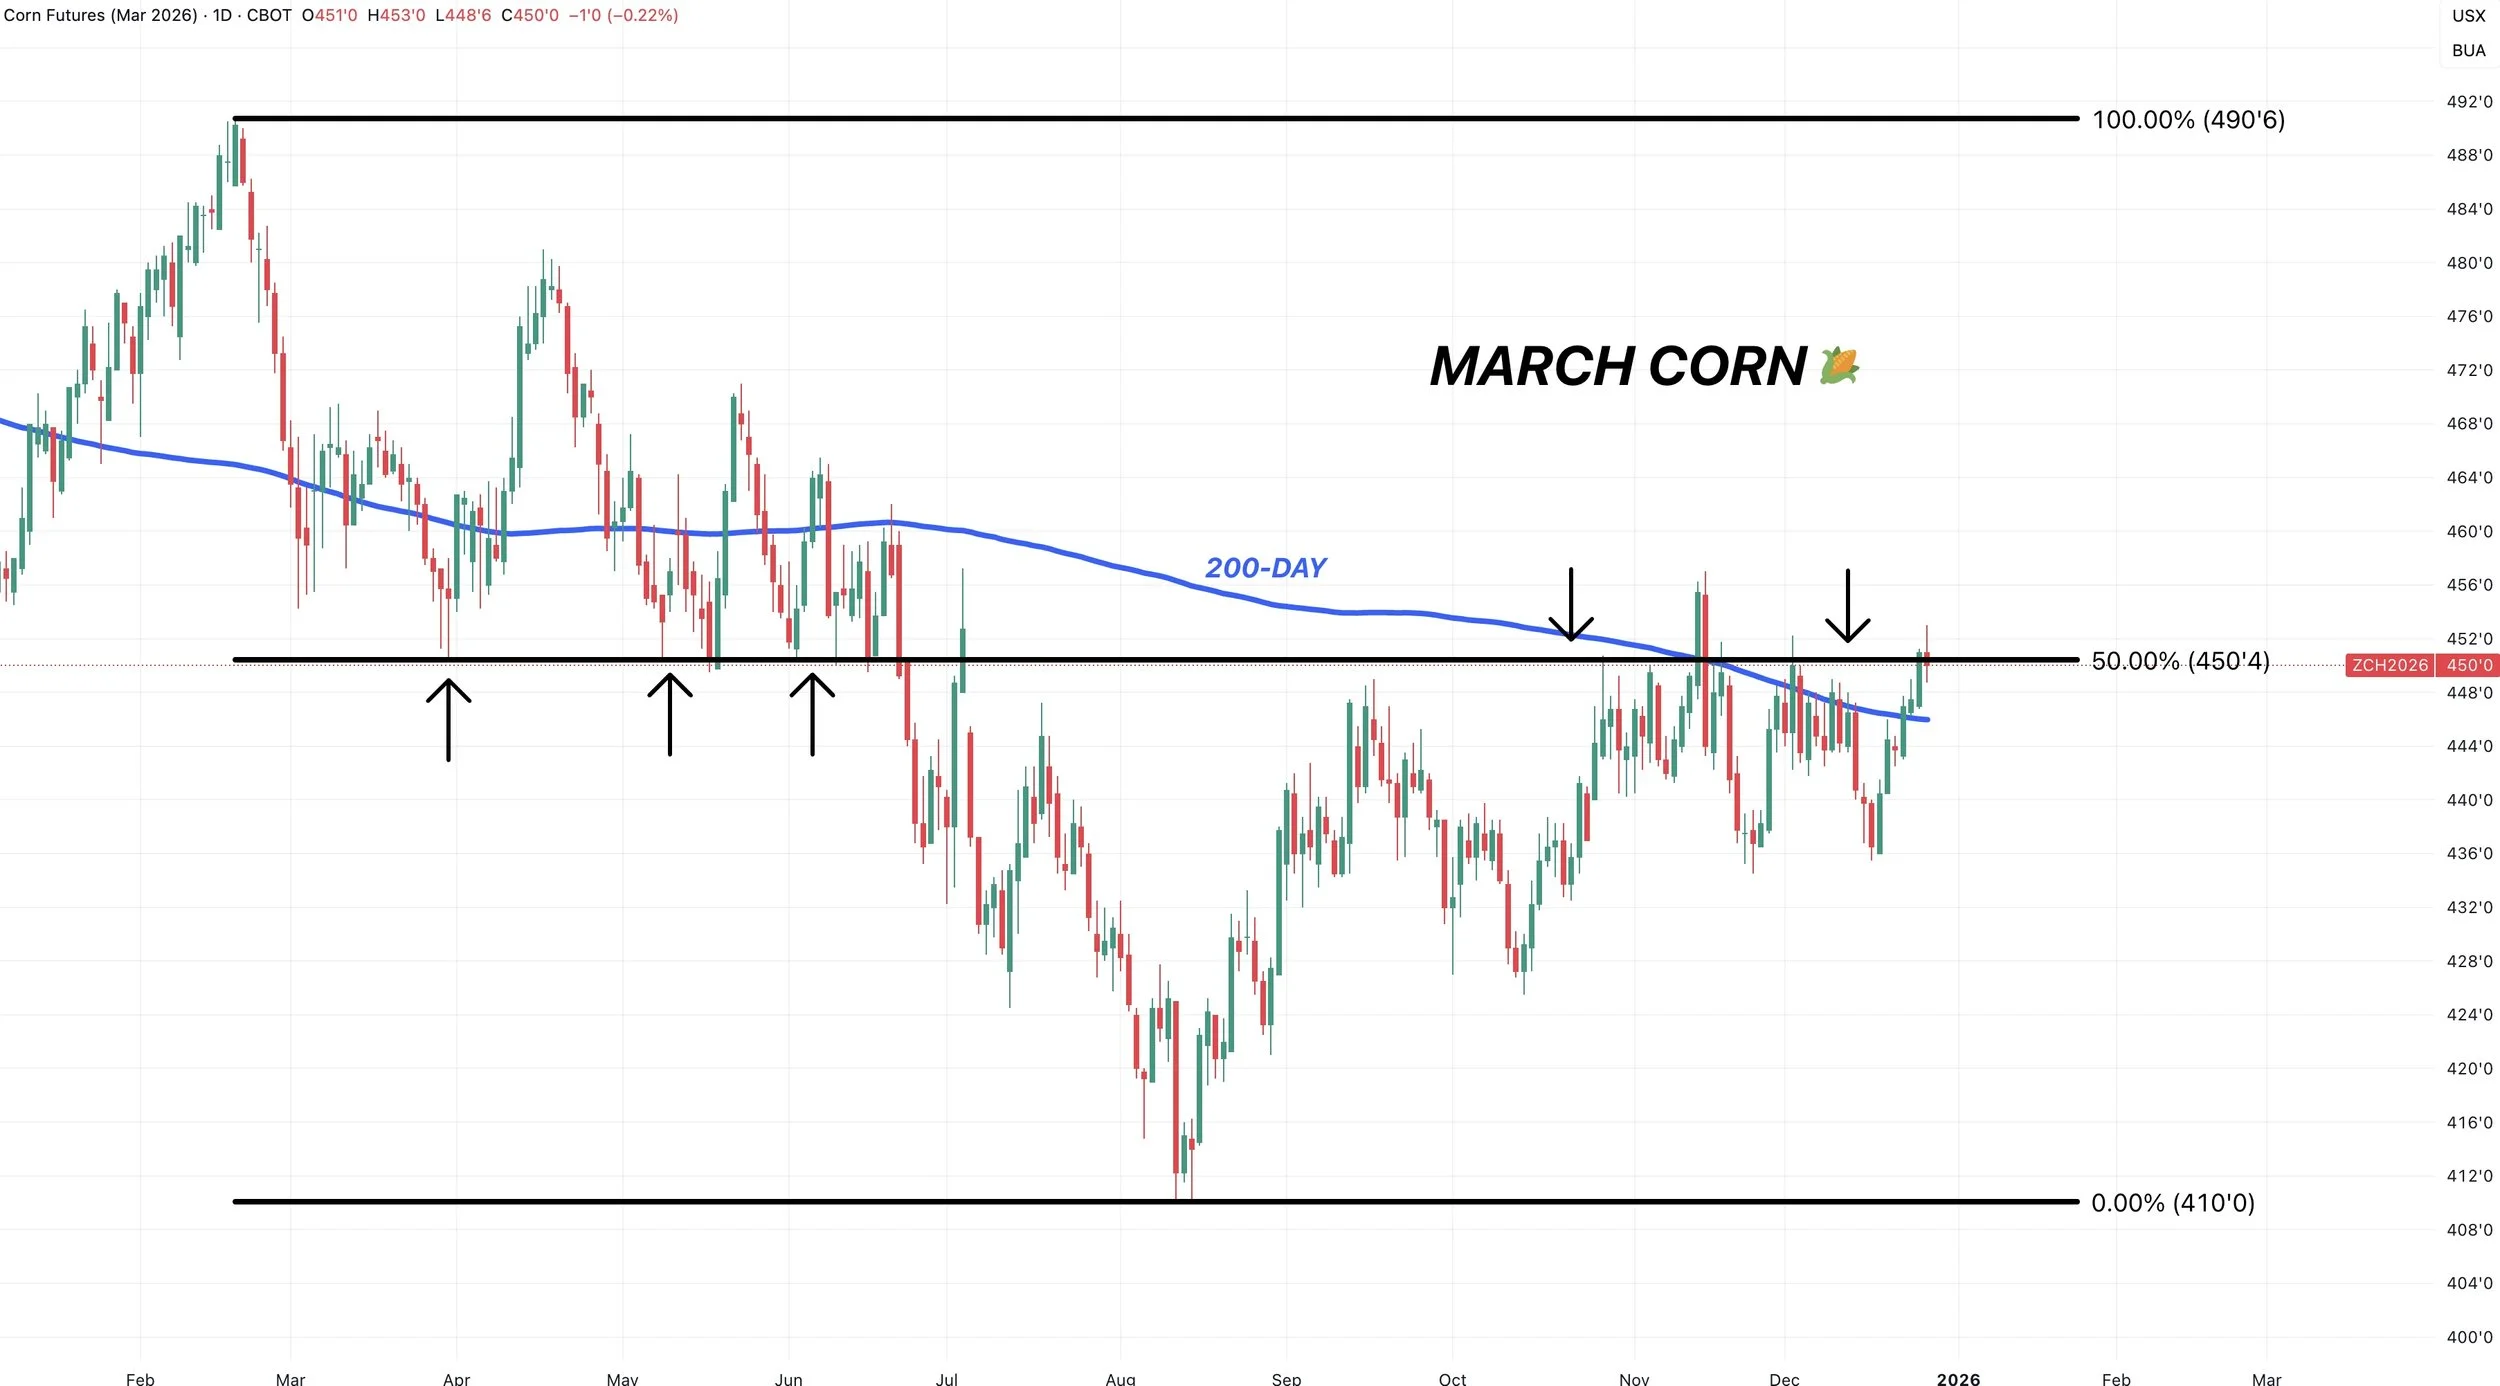
March Weekly Chart
Here is the weekly chart.
We had our highest weekly close since June today.
This chart shows you just how big of resistance that $4.50 level is.
We bounced there on 8 separate weeks this spring.
We've now failed that level 5 weeks the last two months.
Big spot to clear.
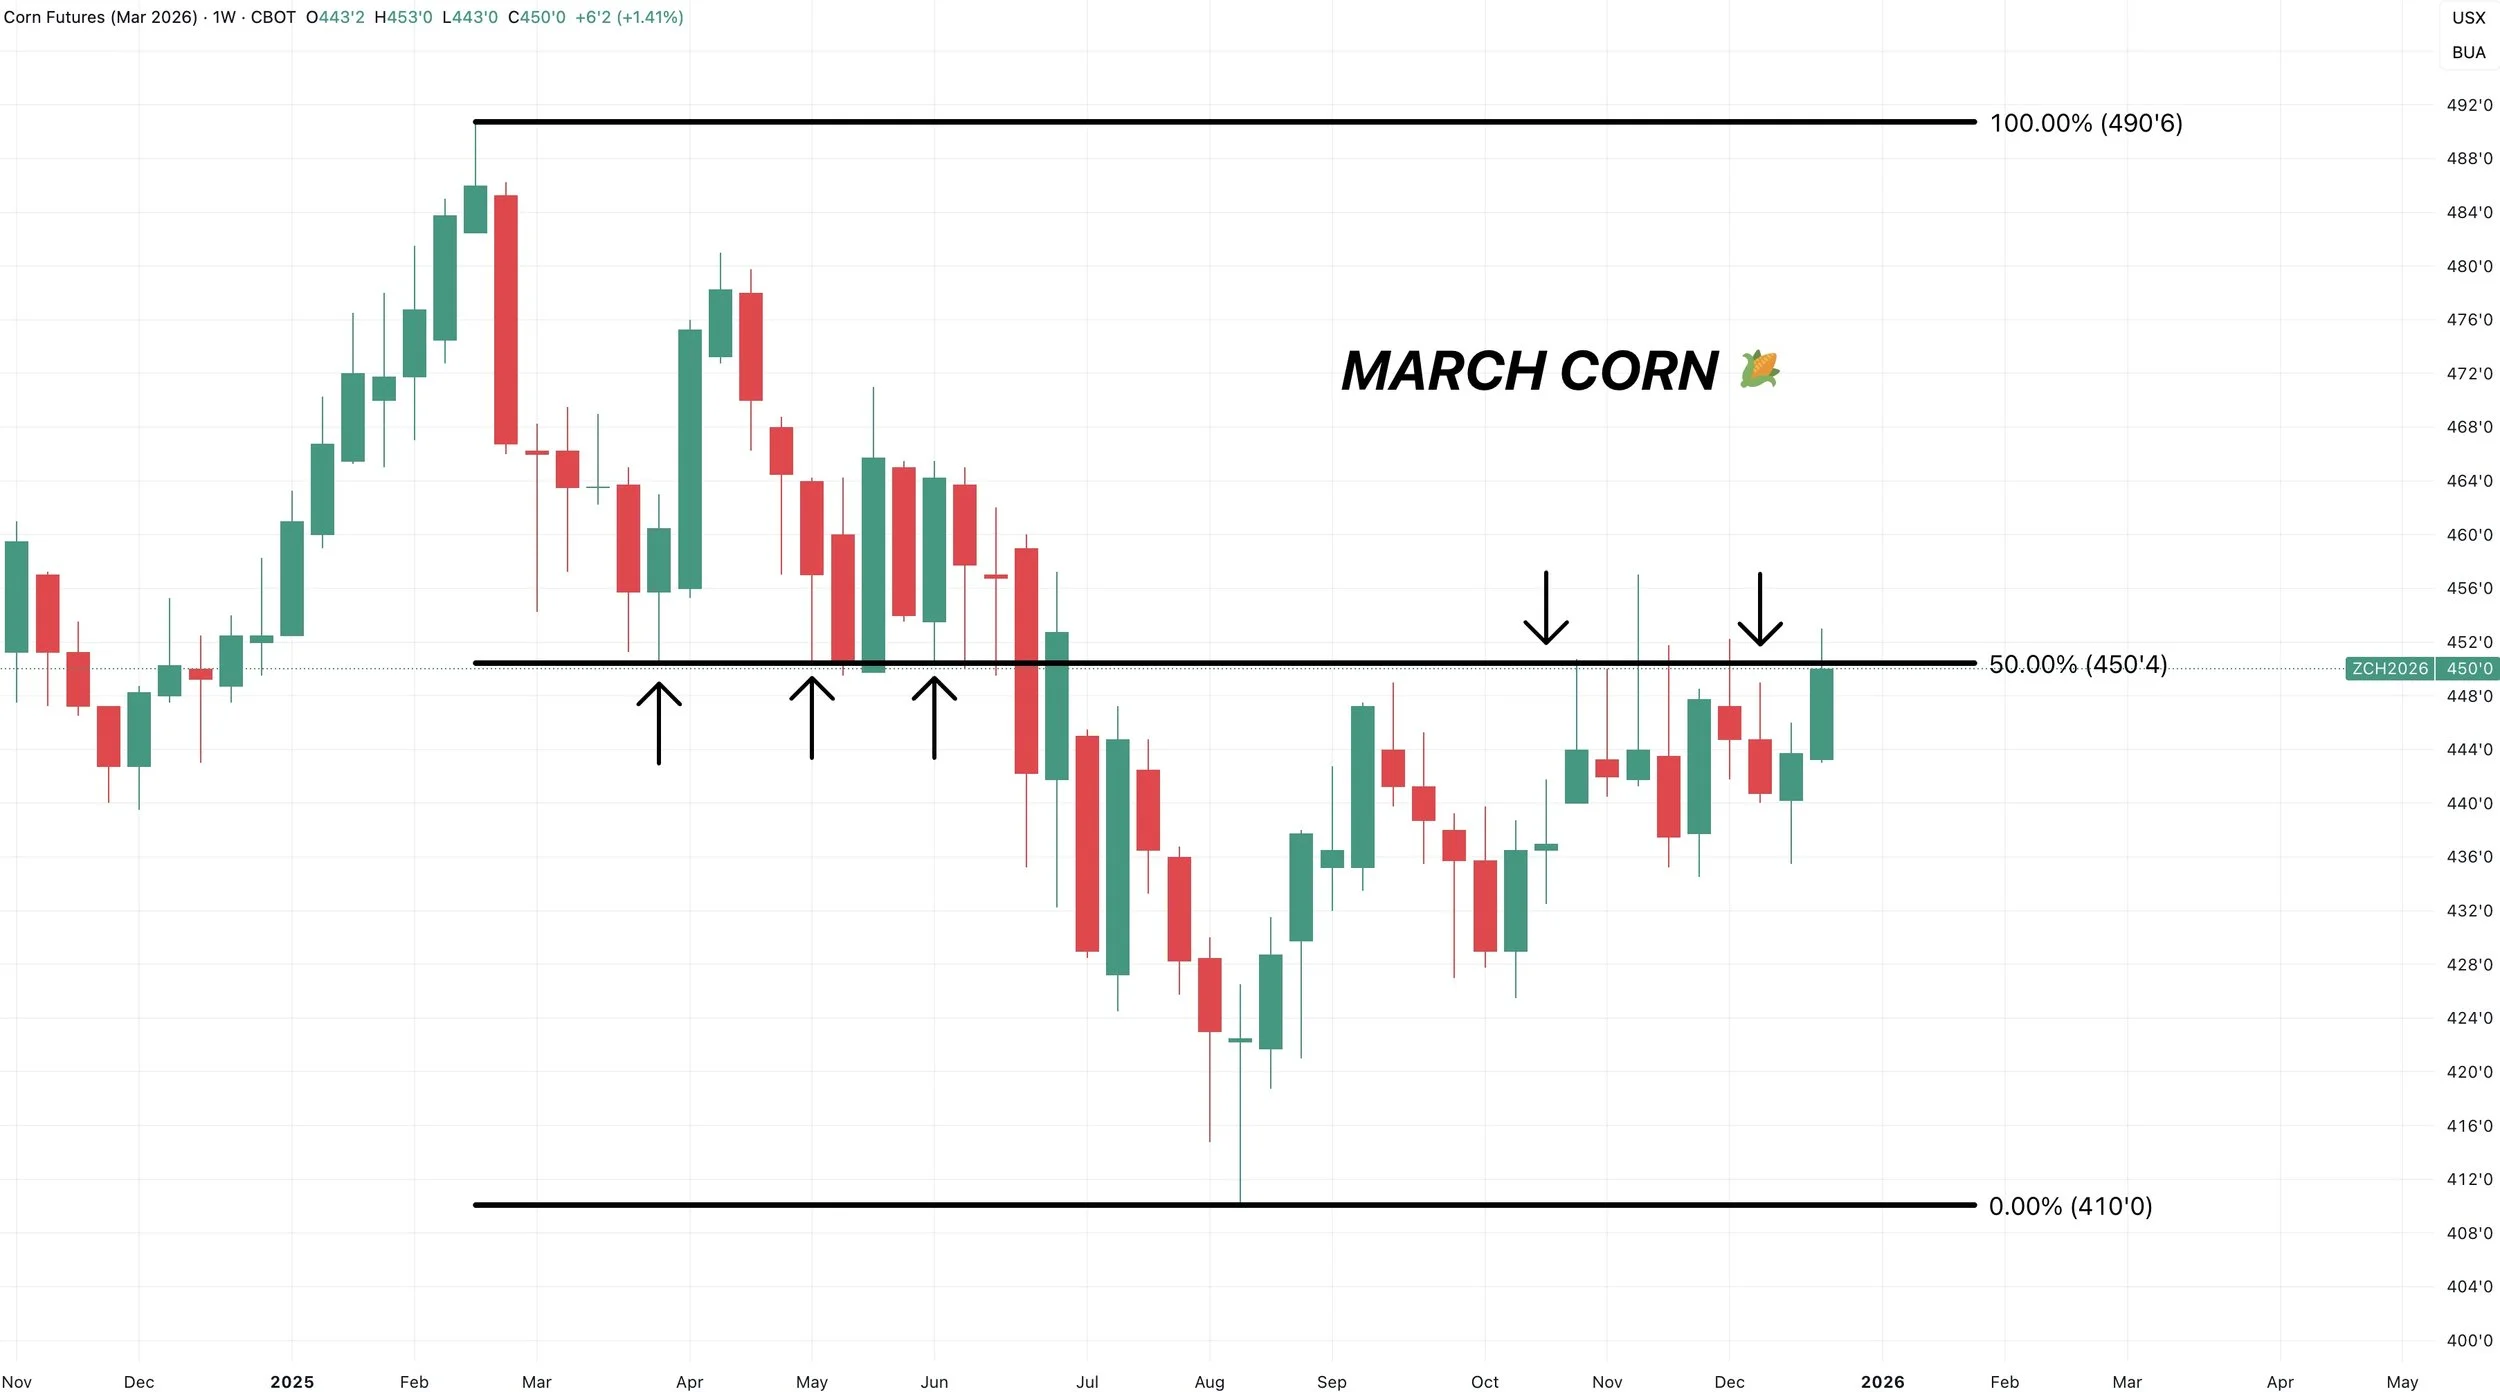
Upside Targets
We alerted our first sell signal and take risk off the table for the first time since April we hit that intial $4.50 target.
If you haven’t taken any risk off the table at all, taking a small amount off while we are sitting at our highest levels since July and some key resistance isn’t the worst idea in the world.
Since we already took some risk off, my eyes are set on the next target.
Which comes in at $4.70 to $4.75
Reason 1:
When you take the very first impulse off contract lows, up to the September highs.
And measure that move, 161.8% of that entire rally comes in at $4.73
This is a common spot for a second rally to end.
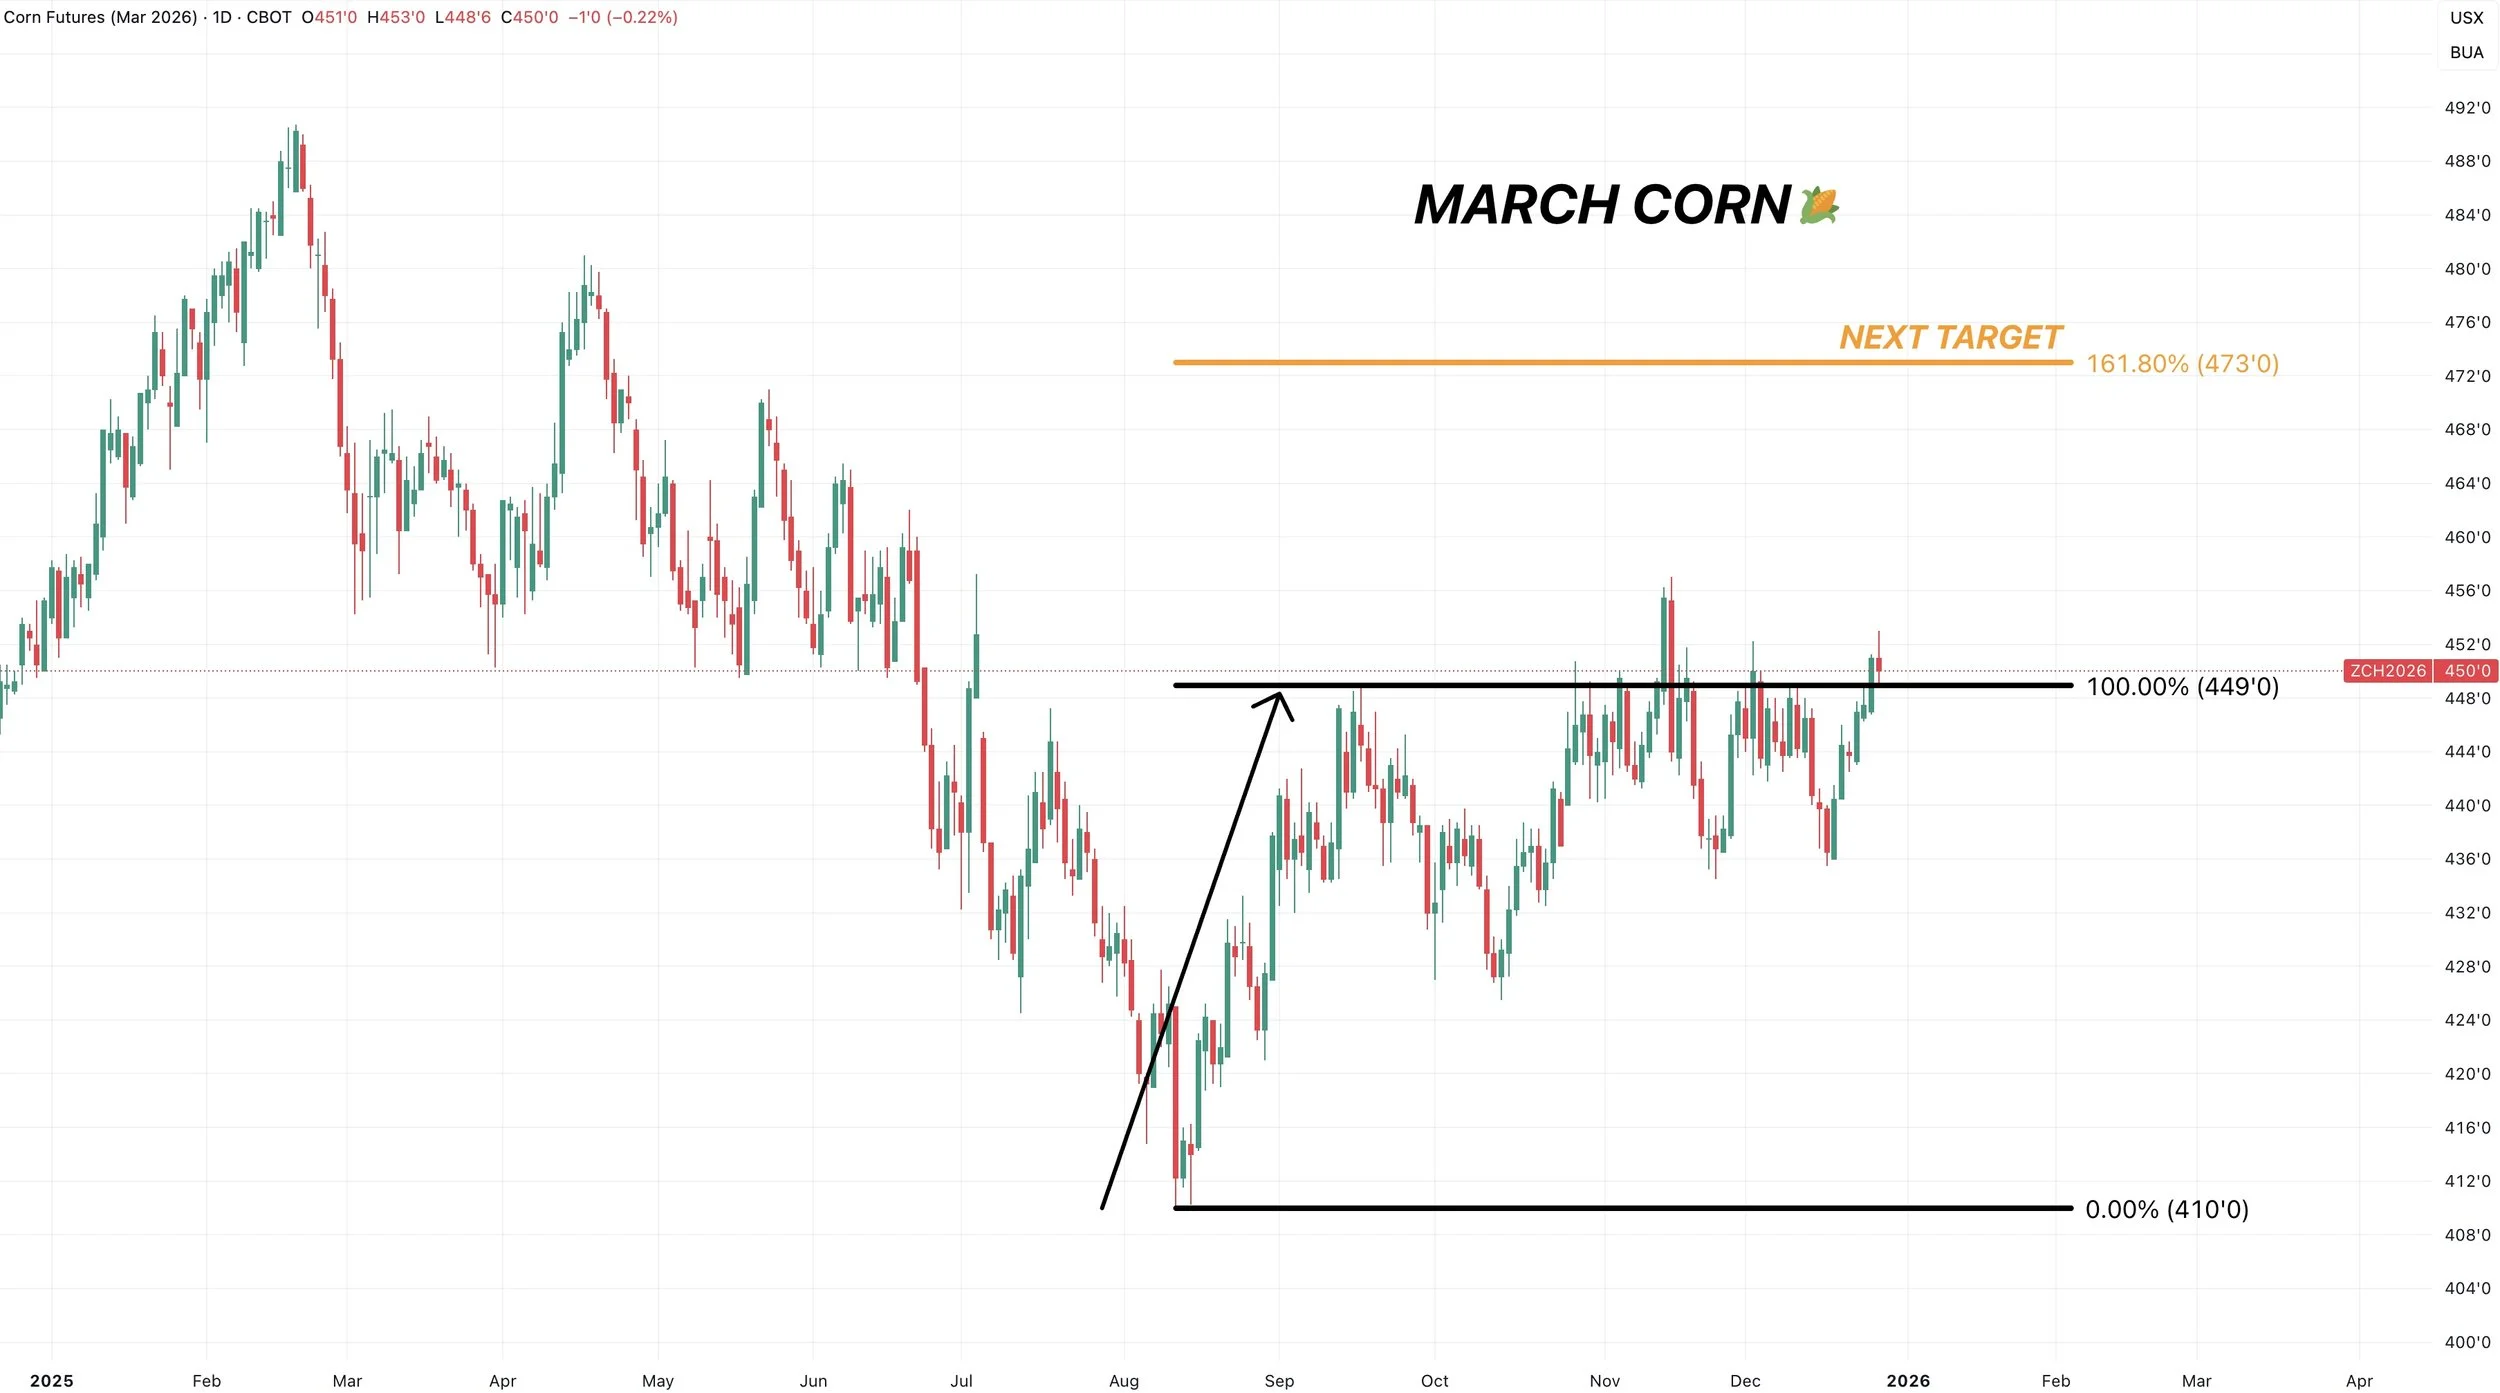
The most recent example of this would be the cattle market either this year.
This is a smaller time frame, but the same concept.
This was our reason for the sell signal back in October for cattle.
We had that first mini rally. We then pulled back.
The second rally then stopped right at that 161.8% level. Also known as the golden fib.
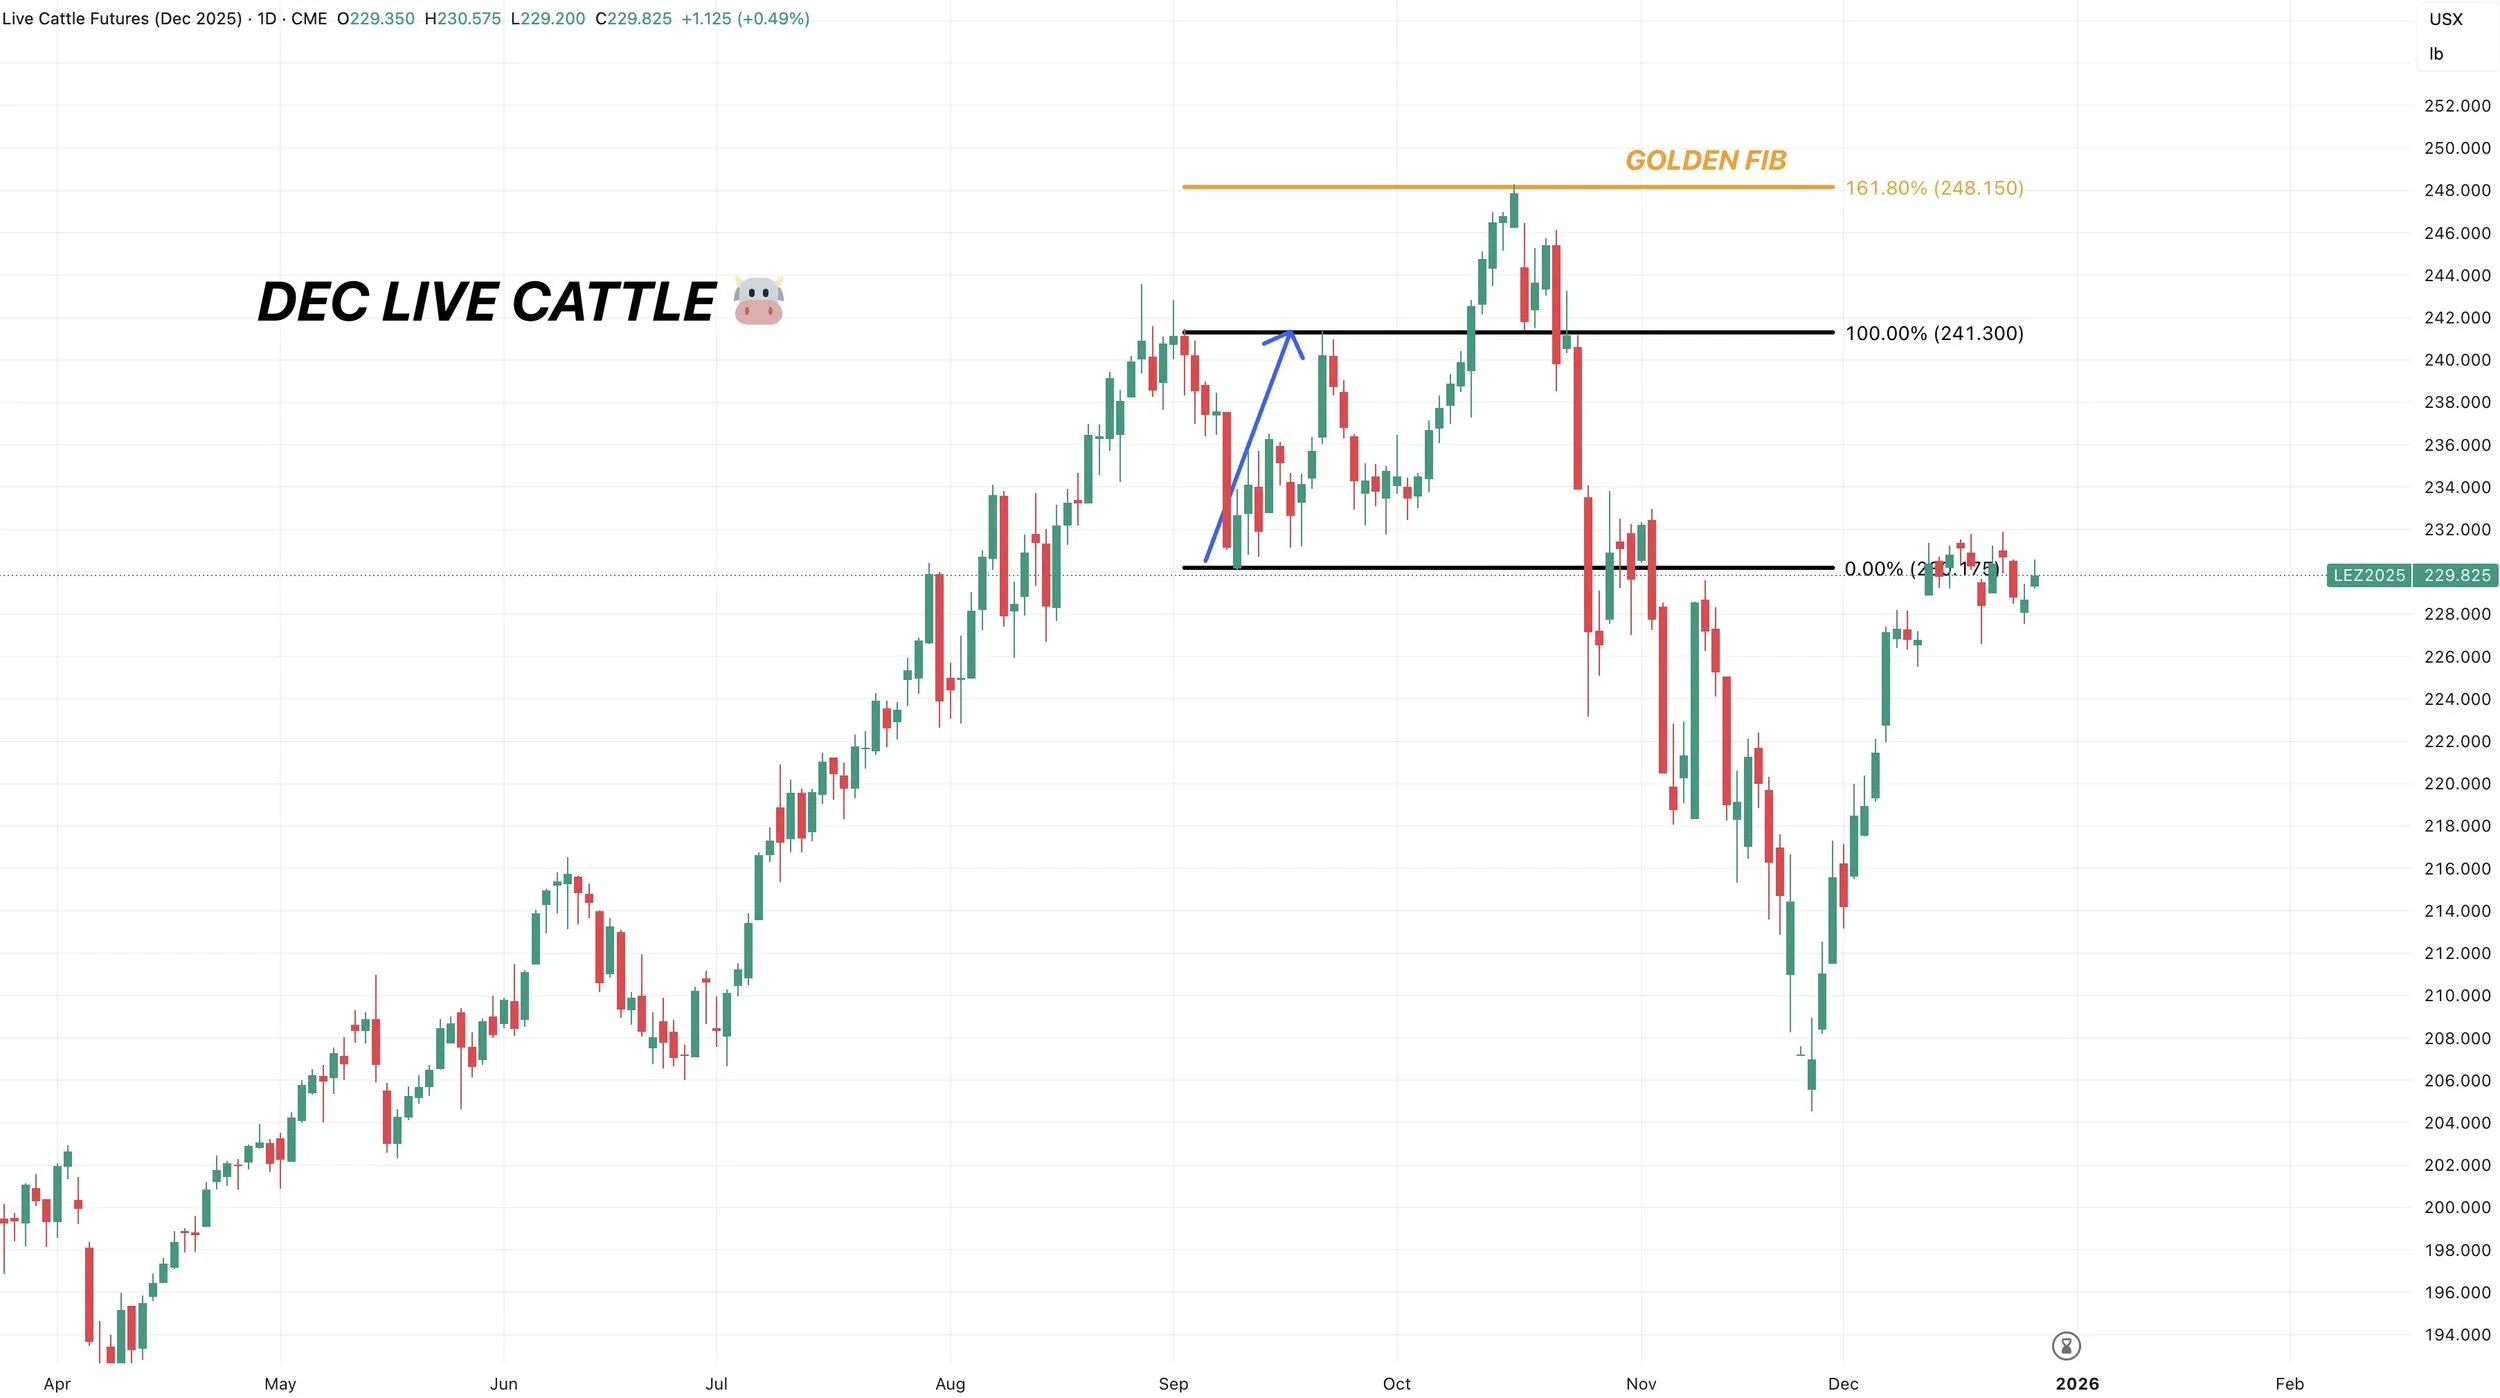
Reason 2:
This is the continuous chart.
When you take the August lows, up to the Feb highs.
So far the market reclaimed 61.8% level of that entire sell off. Which is why it makes perfect sense the market has struggled to bust above this level.
The next level is the 78.6% level which sits at $4.75
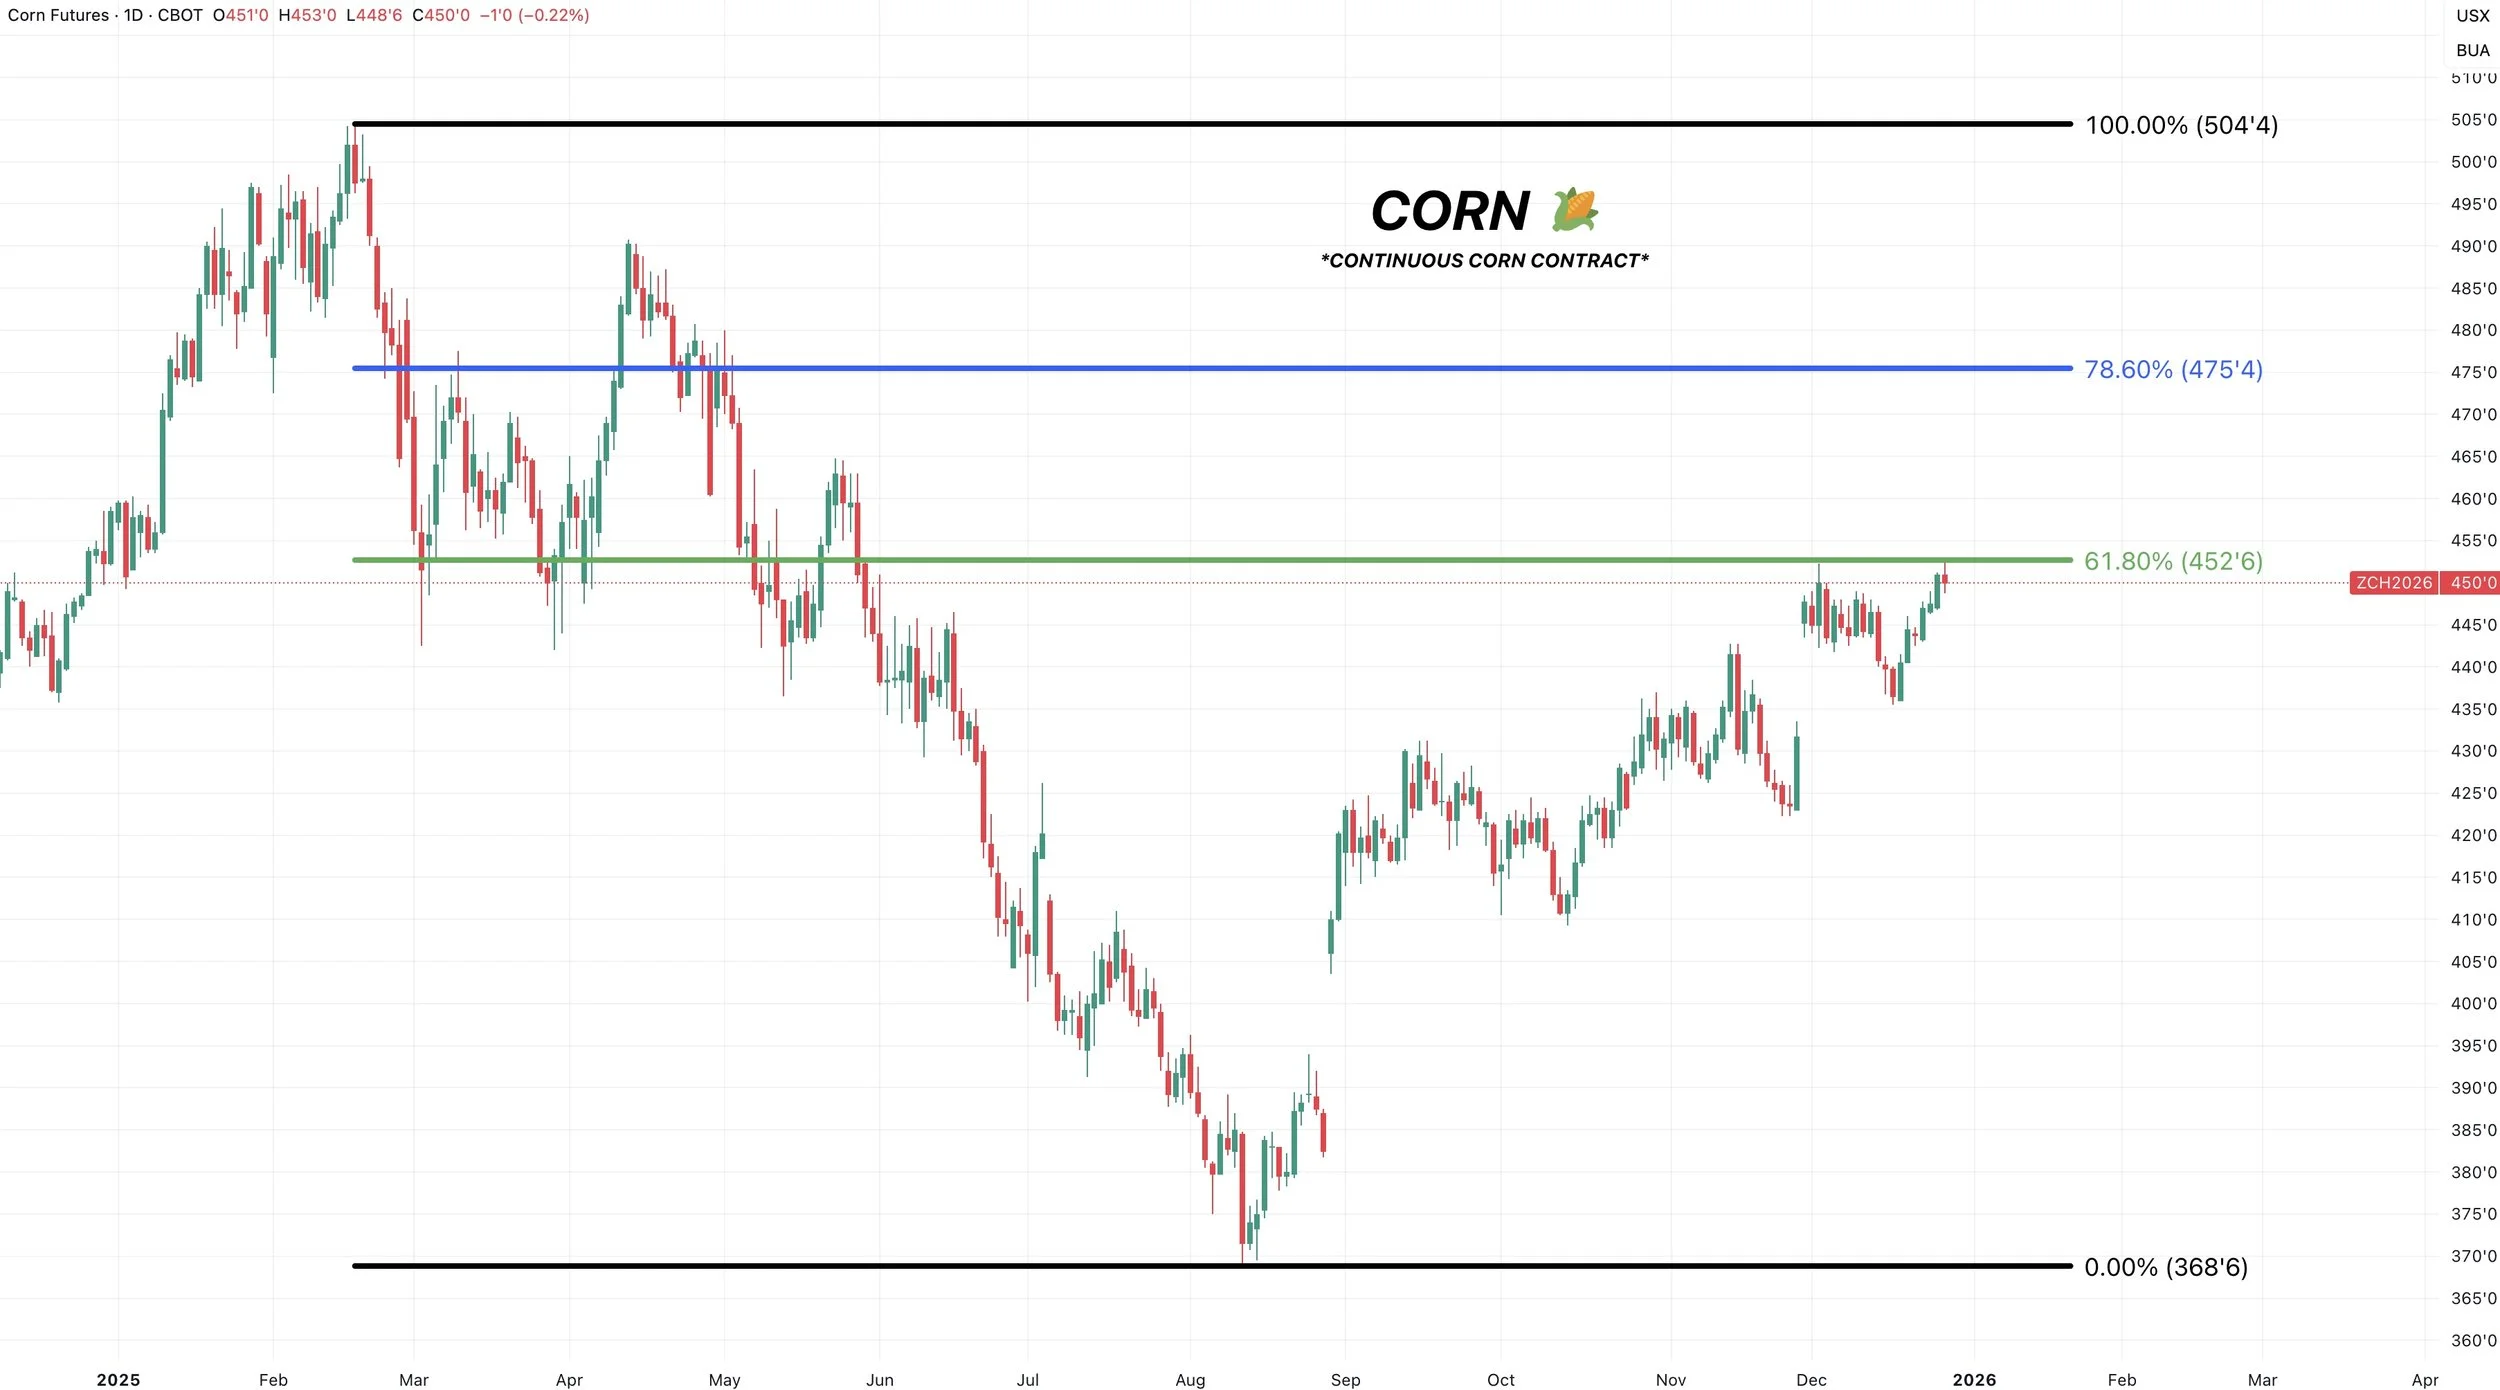
Cattle
Feb Live
Not much to update on cattle.
We've traded pretty much sideways for two weeks.
We continue to sit in this golden zone.
Which was our upside target and where we alerted a hedge signal.
We still like keeping those, as there is still risk in this market.
If the market is going to fail, most relief bounces tend to fail here.
Break above the green box and we might have a different story. But for now, it makes sense to defend this level.
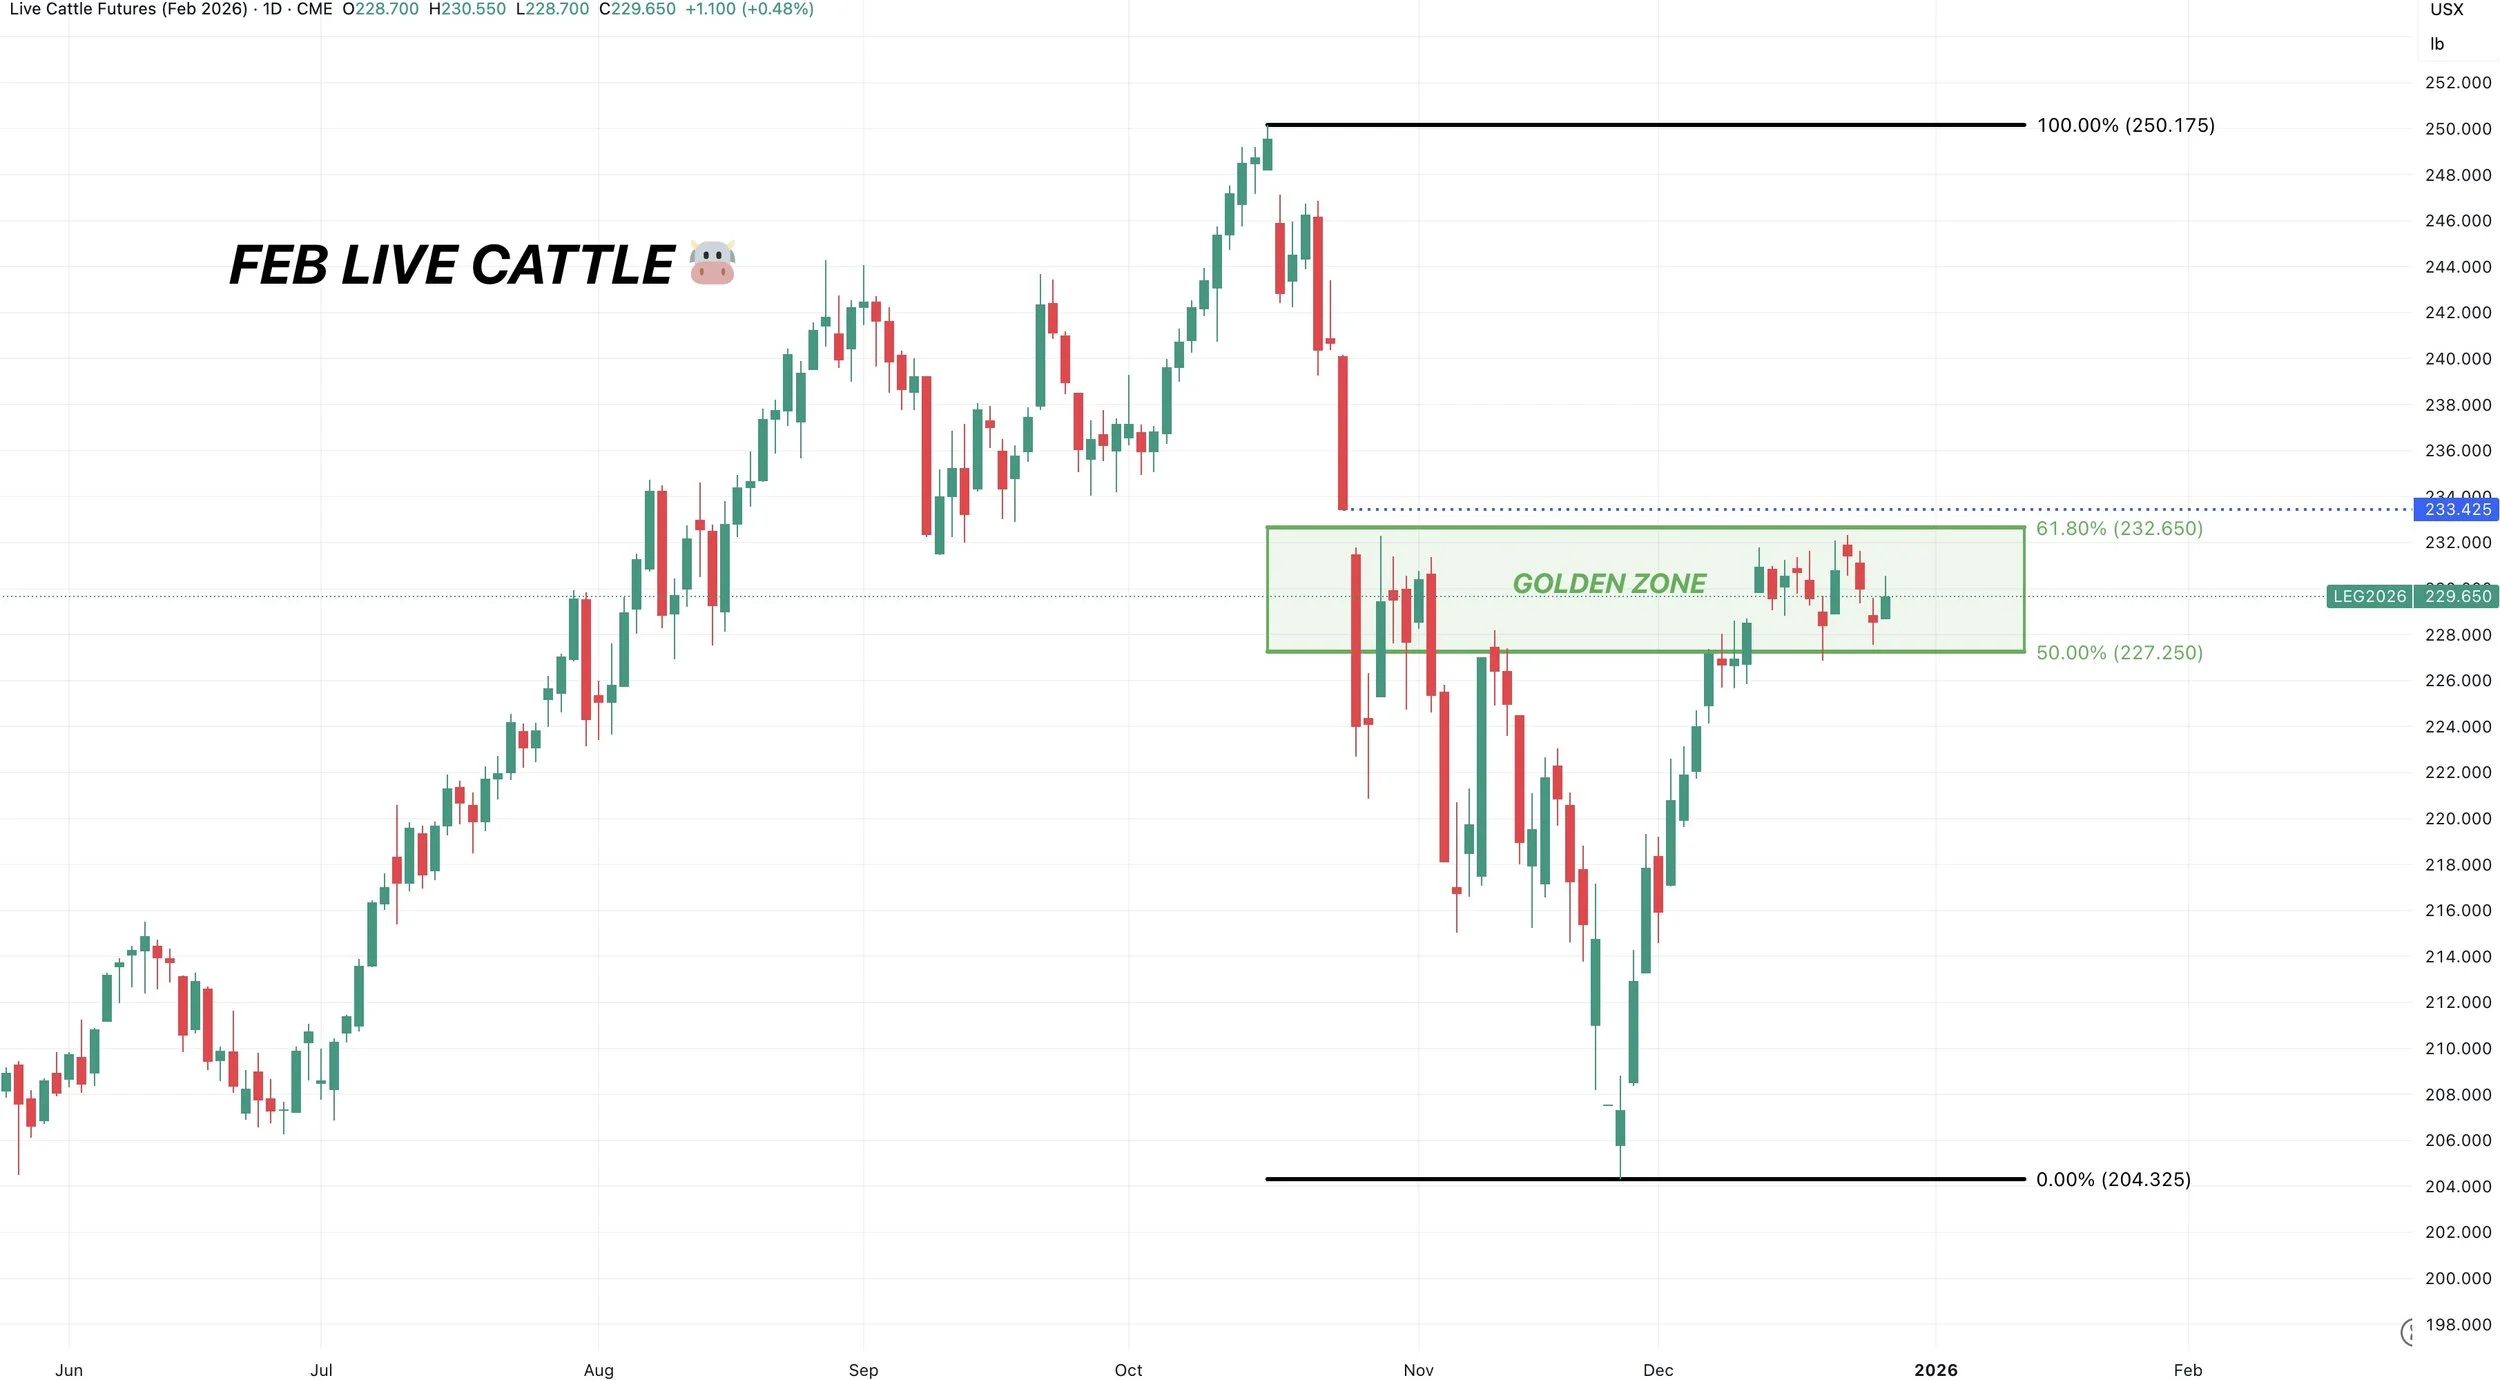
March Feeders
Same set up here.
Still sitting in the golden zone.
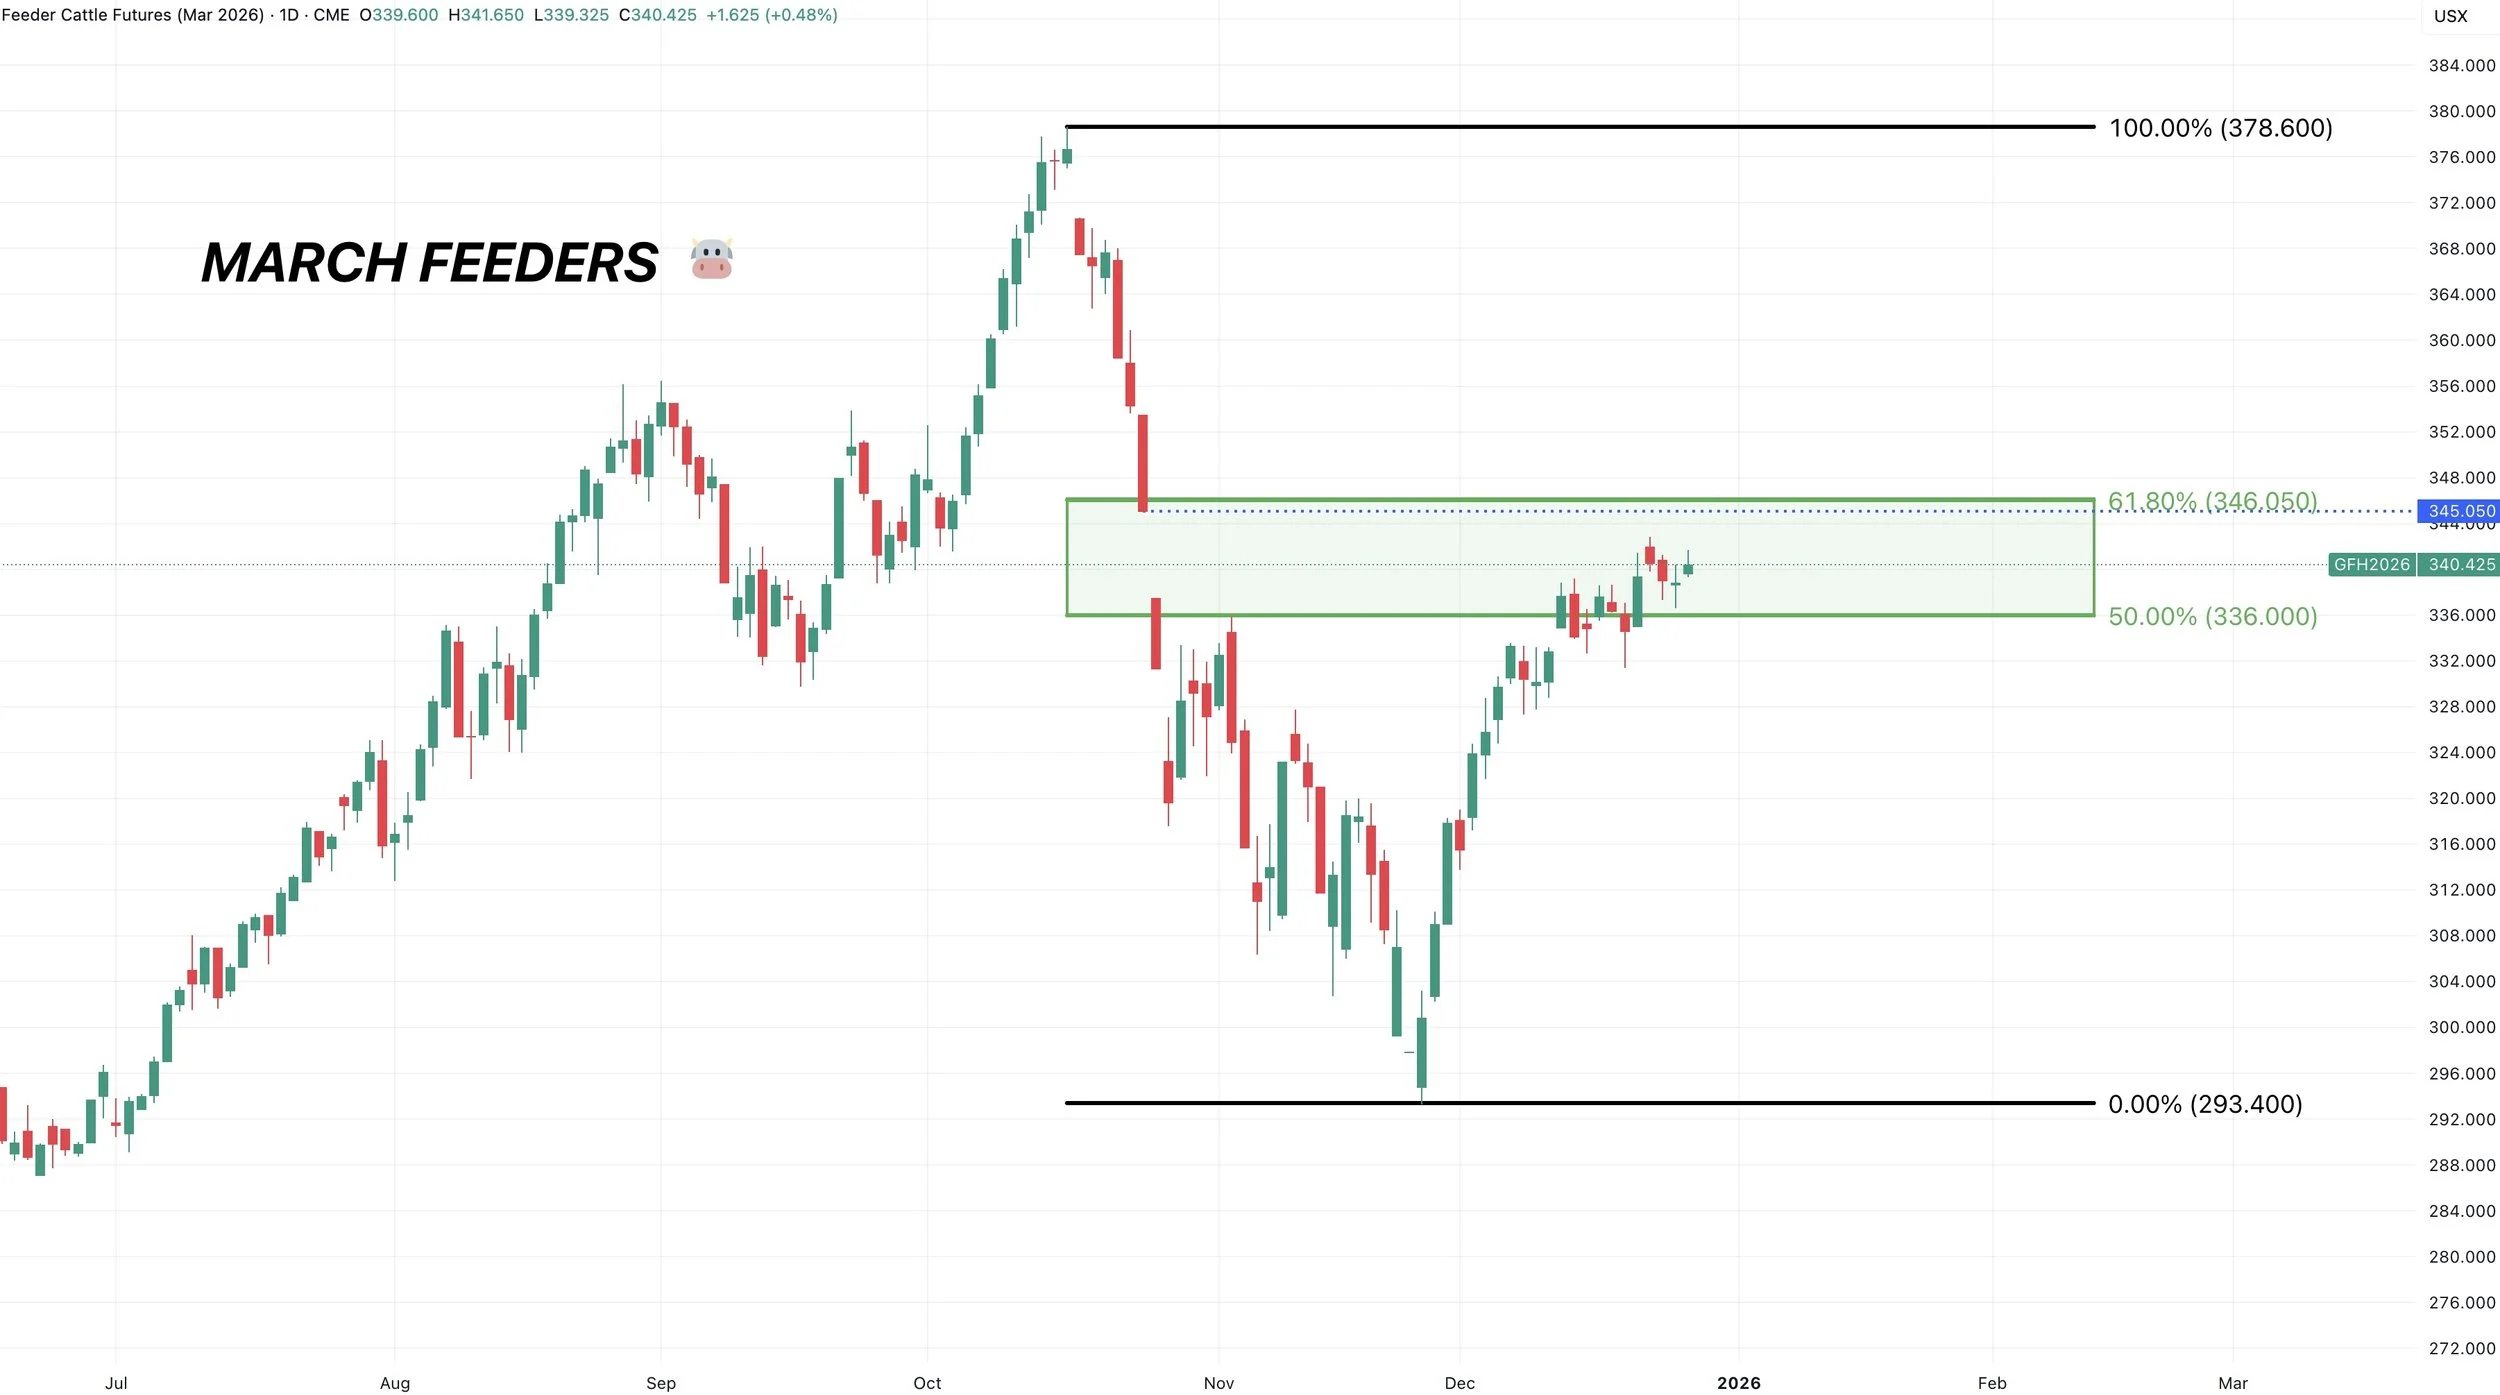
Jan Feeders
Volume has switched to March.
But Jan feeders perfectly filled that gap we left.
We also nearly tapped that 61.8% level of the entire sell off.
Both of those were pretty big points of interest.
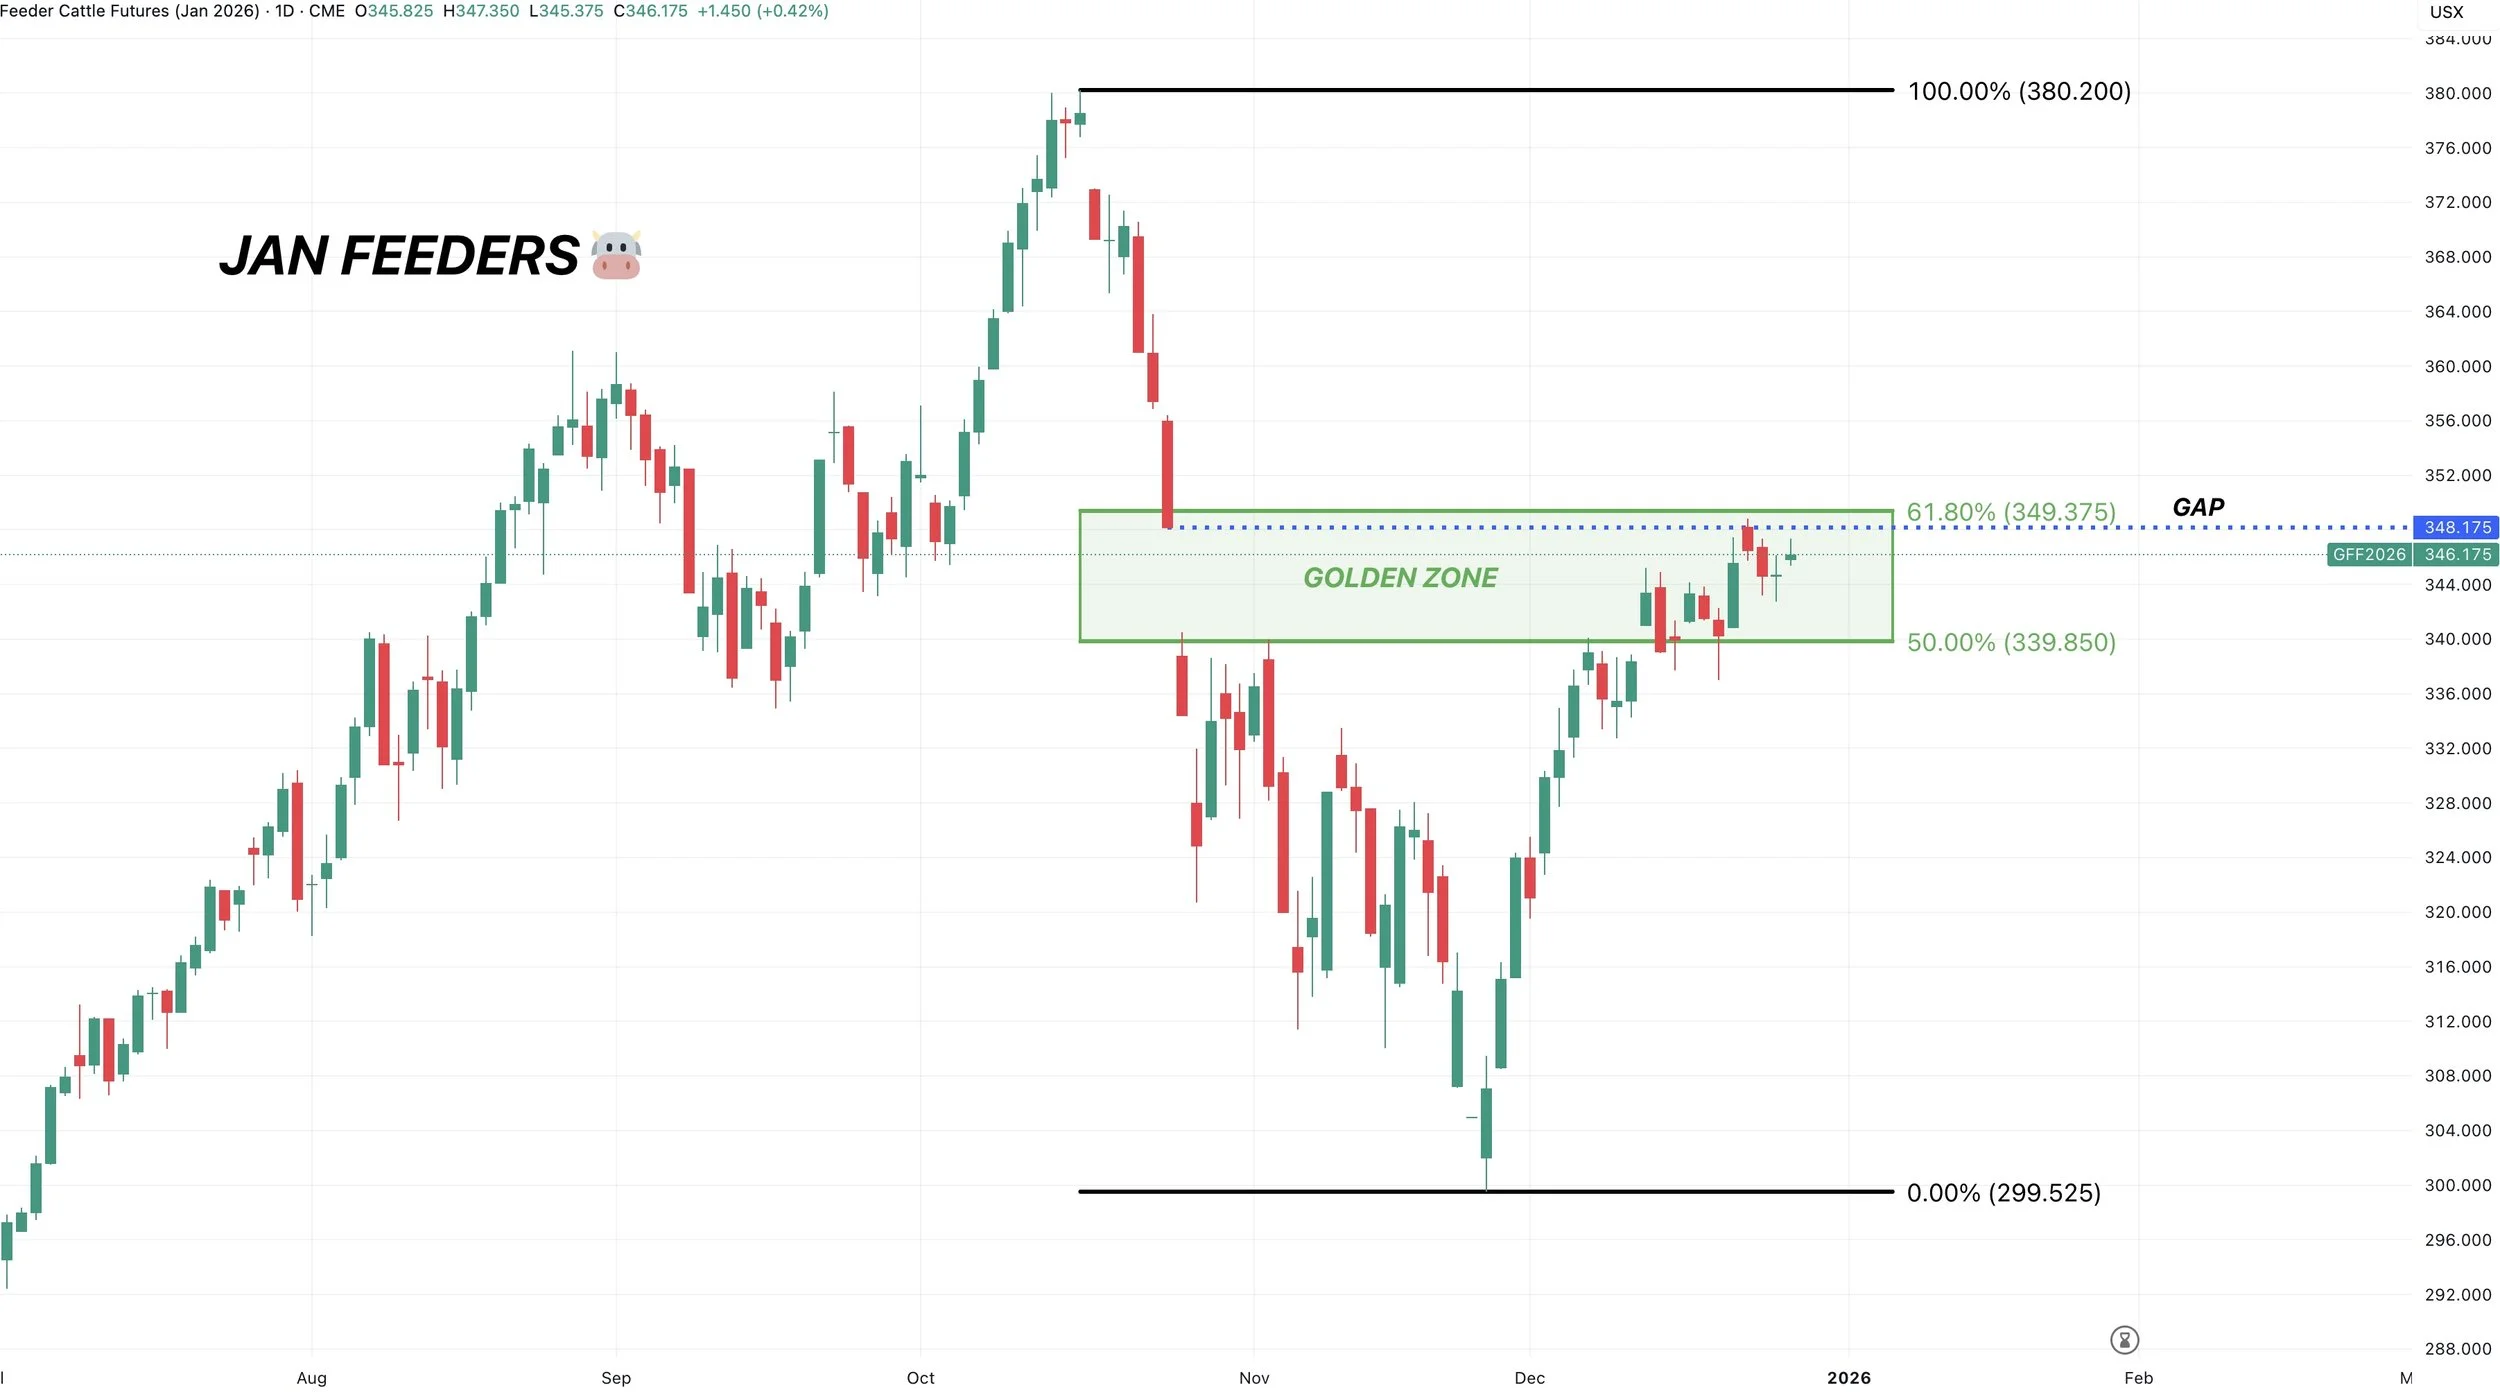
Wheat
March KC Wheat
KC has perfectly clawed back 61.8% of the entire sell off.
Pretty important spot here.
It's where the market typically decides if this is simply a dead cat bounce of the start of something bigger.
It's where bounces tend to fail, but if we break above this level it would be our first sign that this market is potentially ready for a real move higher.
Still targeting the golden zone up to those June highs if it comes.
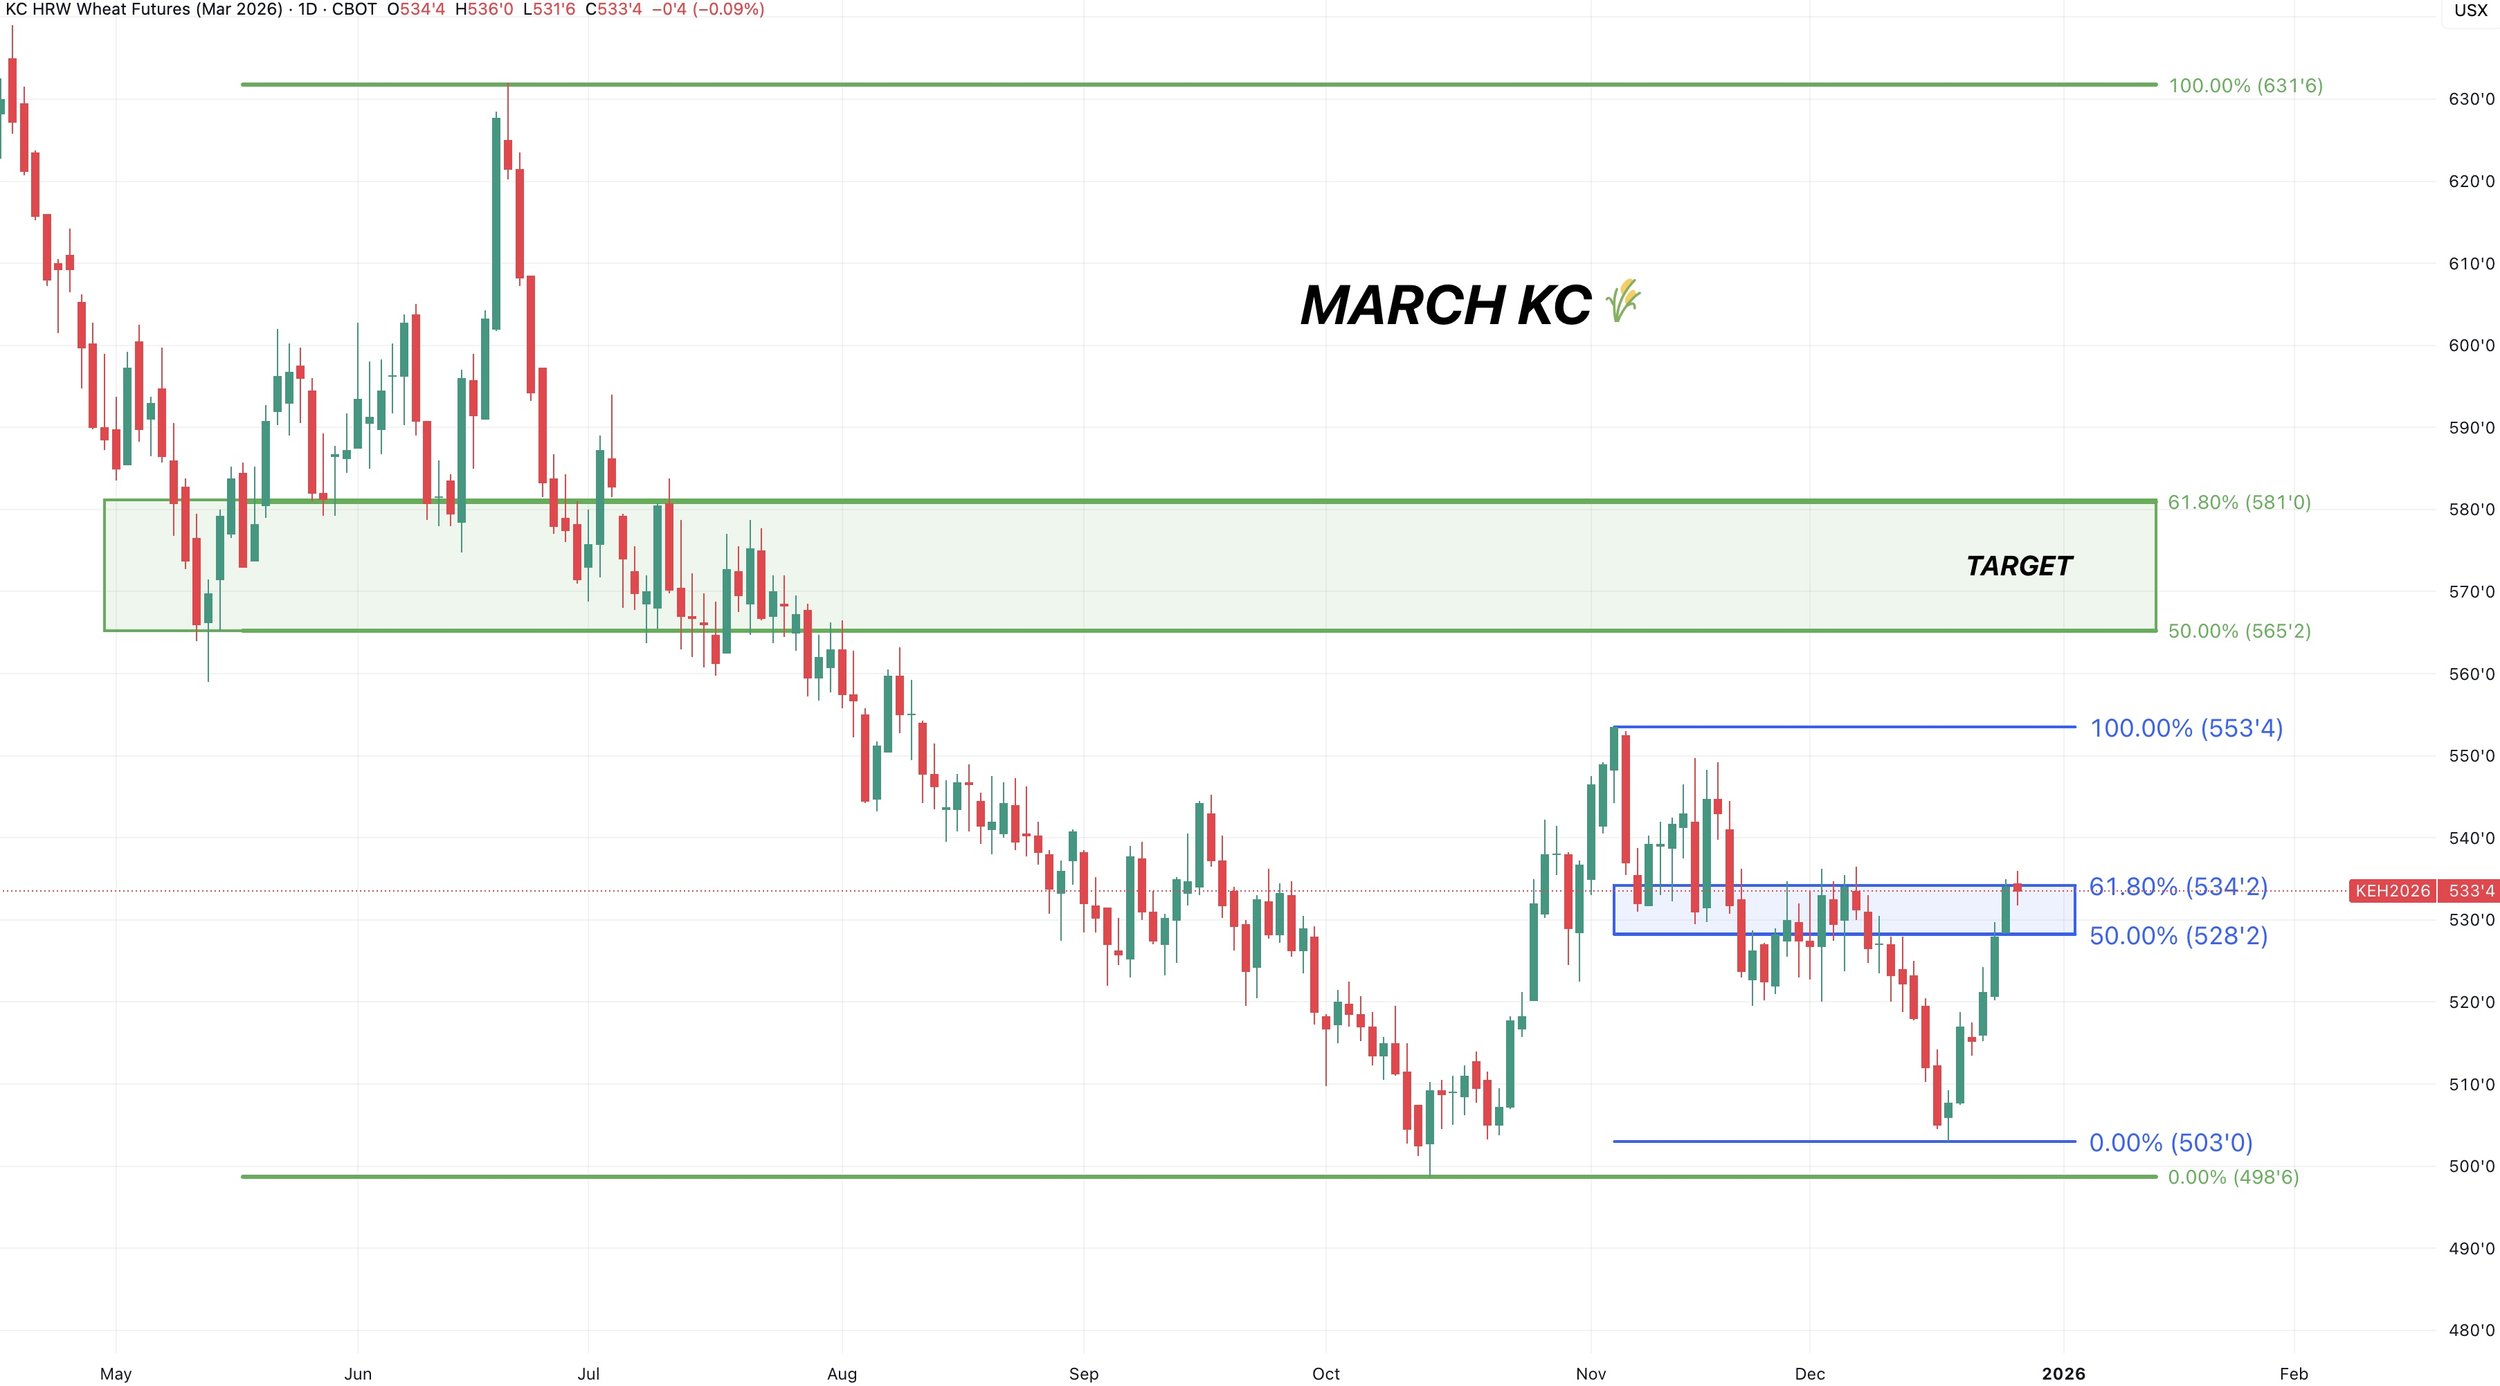
KC March Weekly Chart
The weekly chart does look pretty optimistic here.
We had the doji last week.
Followed it by strength this week.
Some would call this a morning star. Which is a pretty common reversal pattern.
We saw a very similar pattern on the June rally.
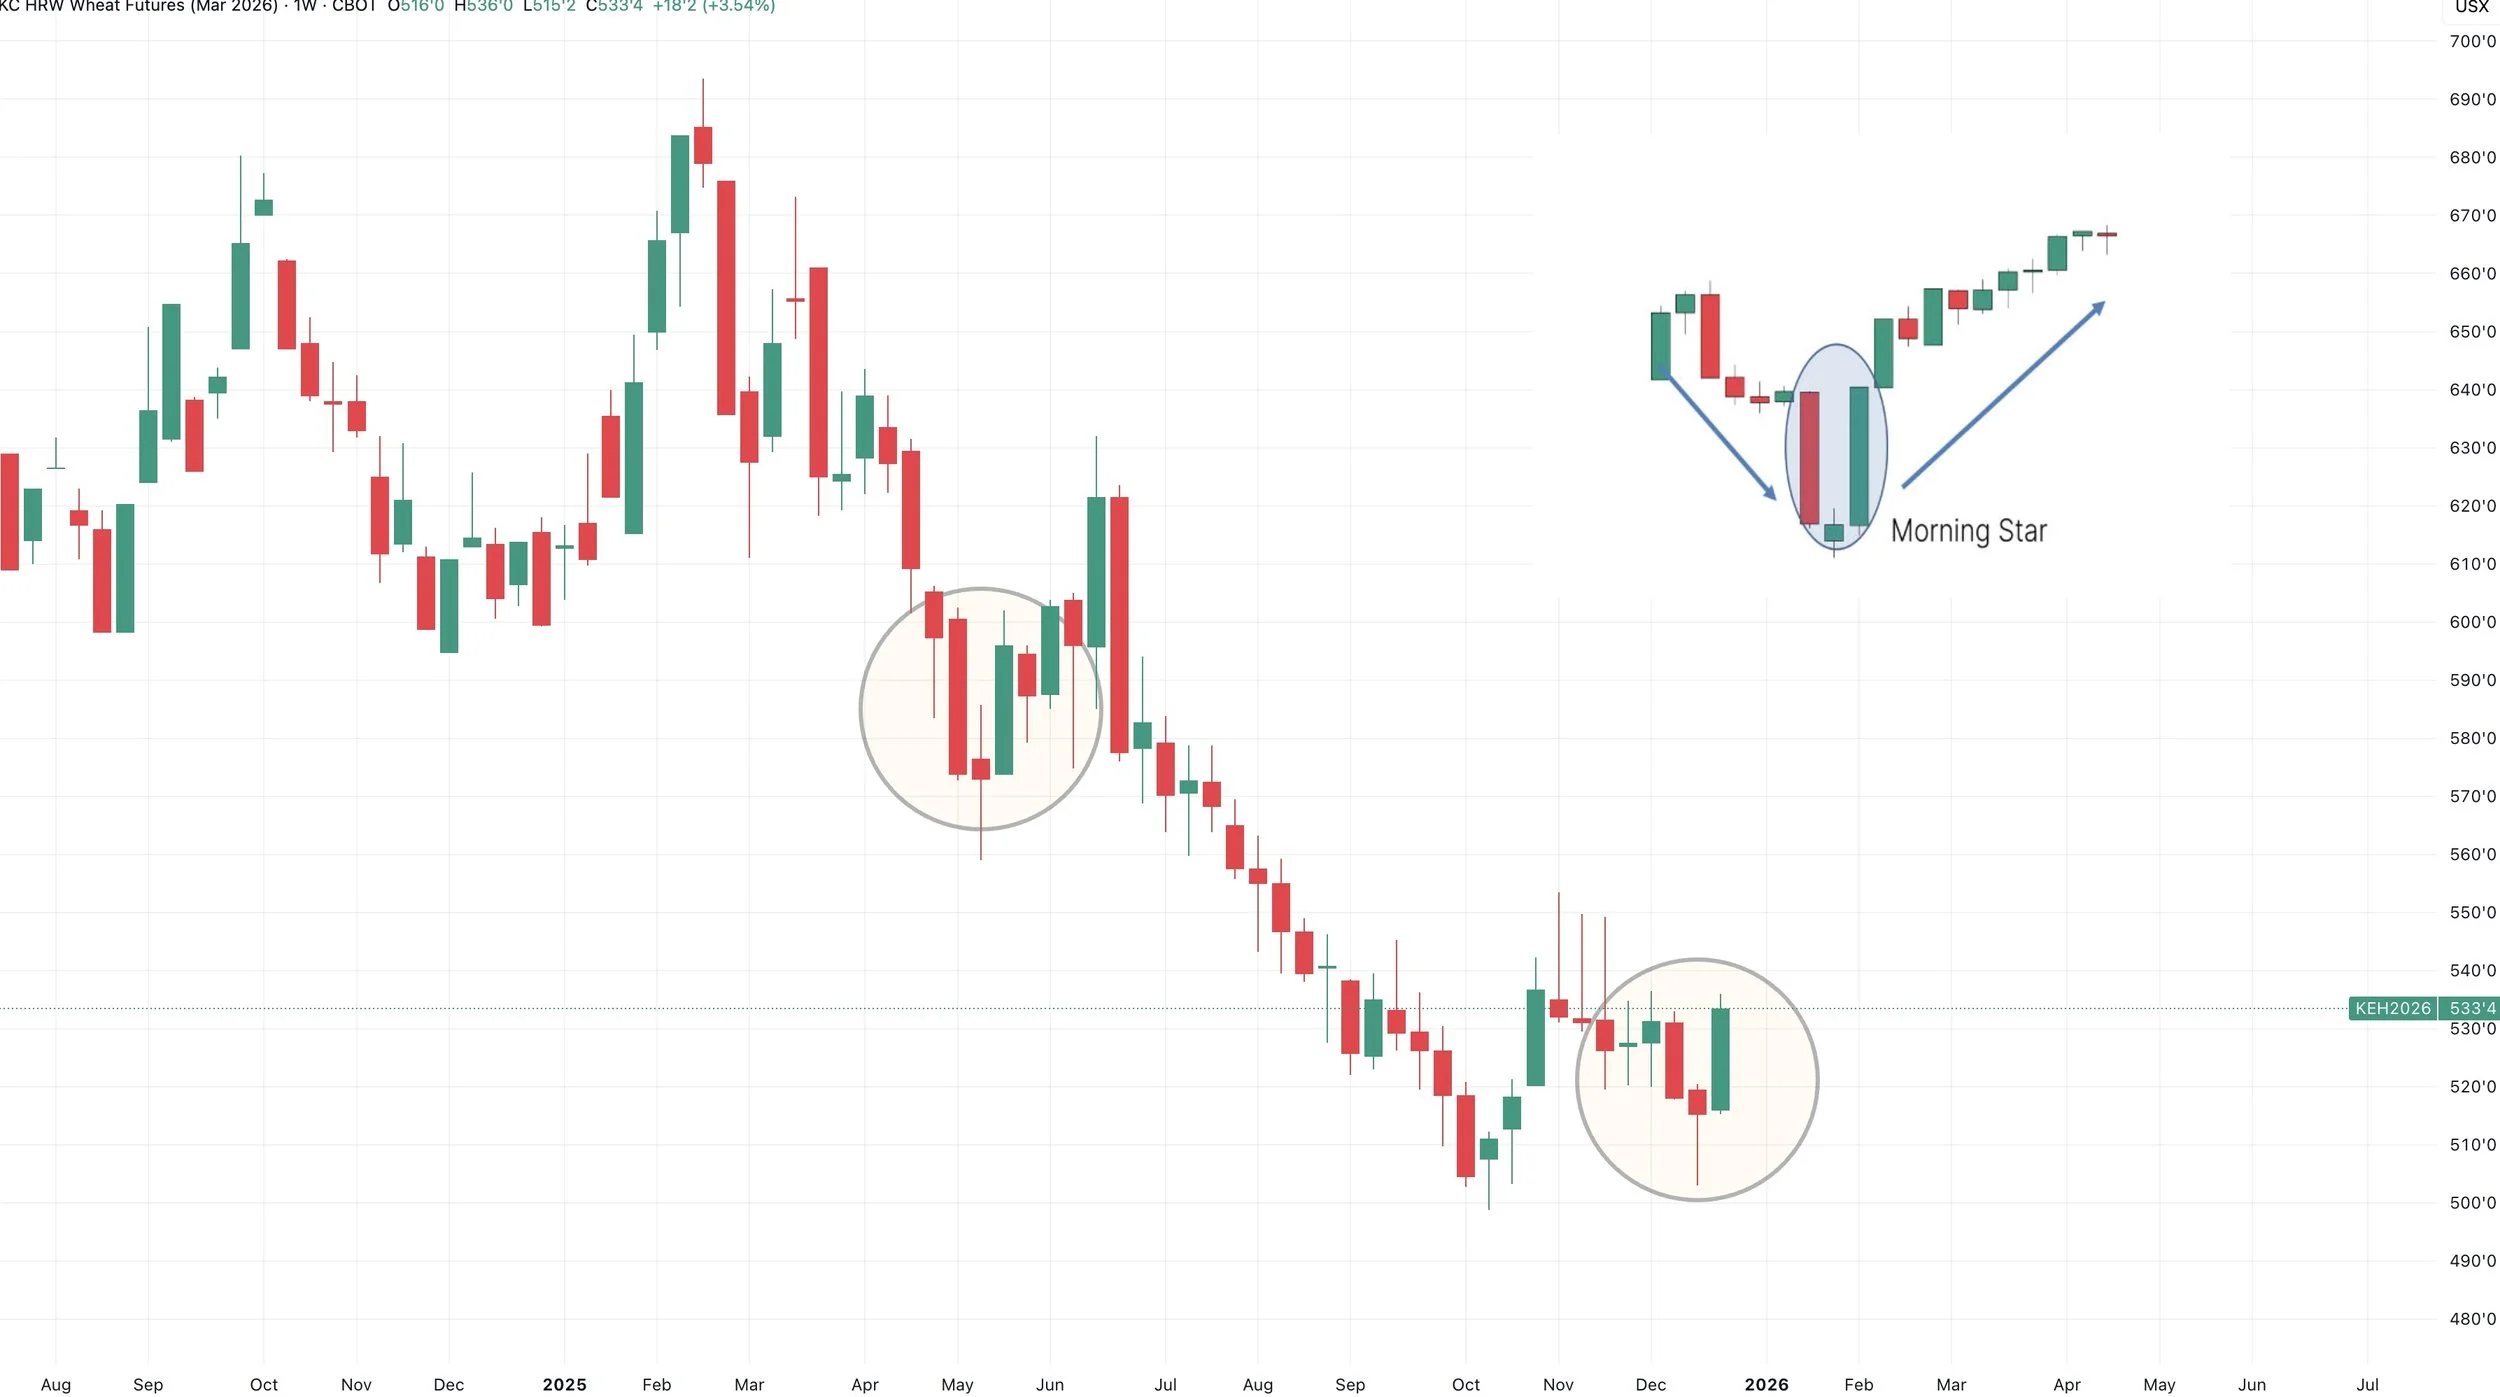
Dec Chicago Wheat
Not nearly as strong as KC.
Still need to clear the golden zone up to the recent highs to be confident we've posted some longer term lows and are ready for a real move higher.
We've seen a nice move, but need to see some more concrete evidence to believe this was truly the bottom.
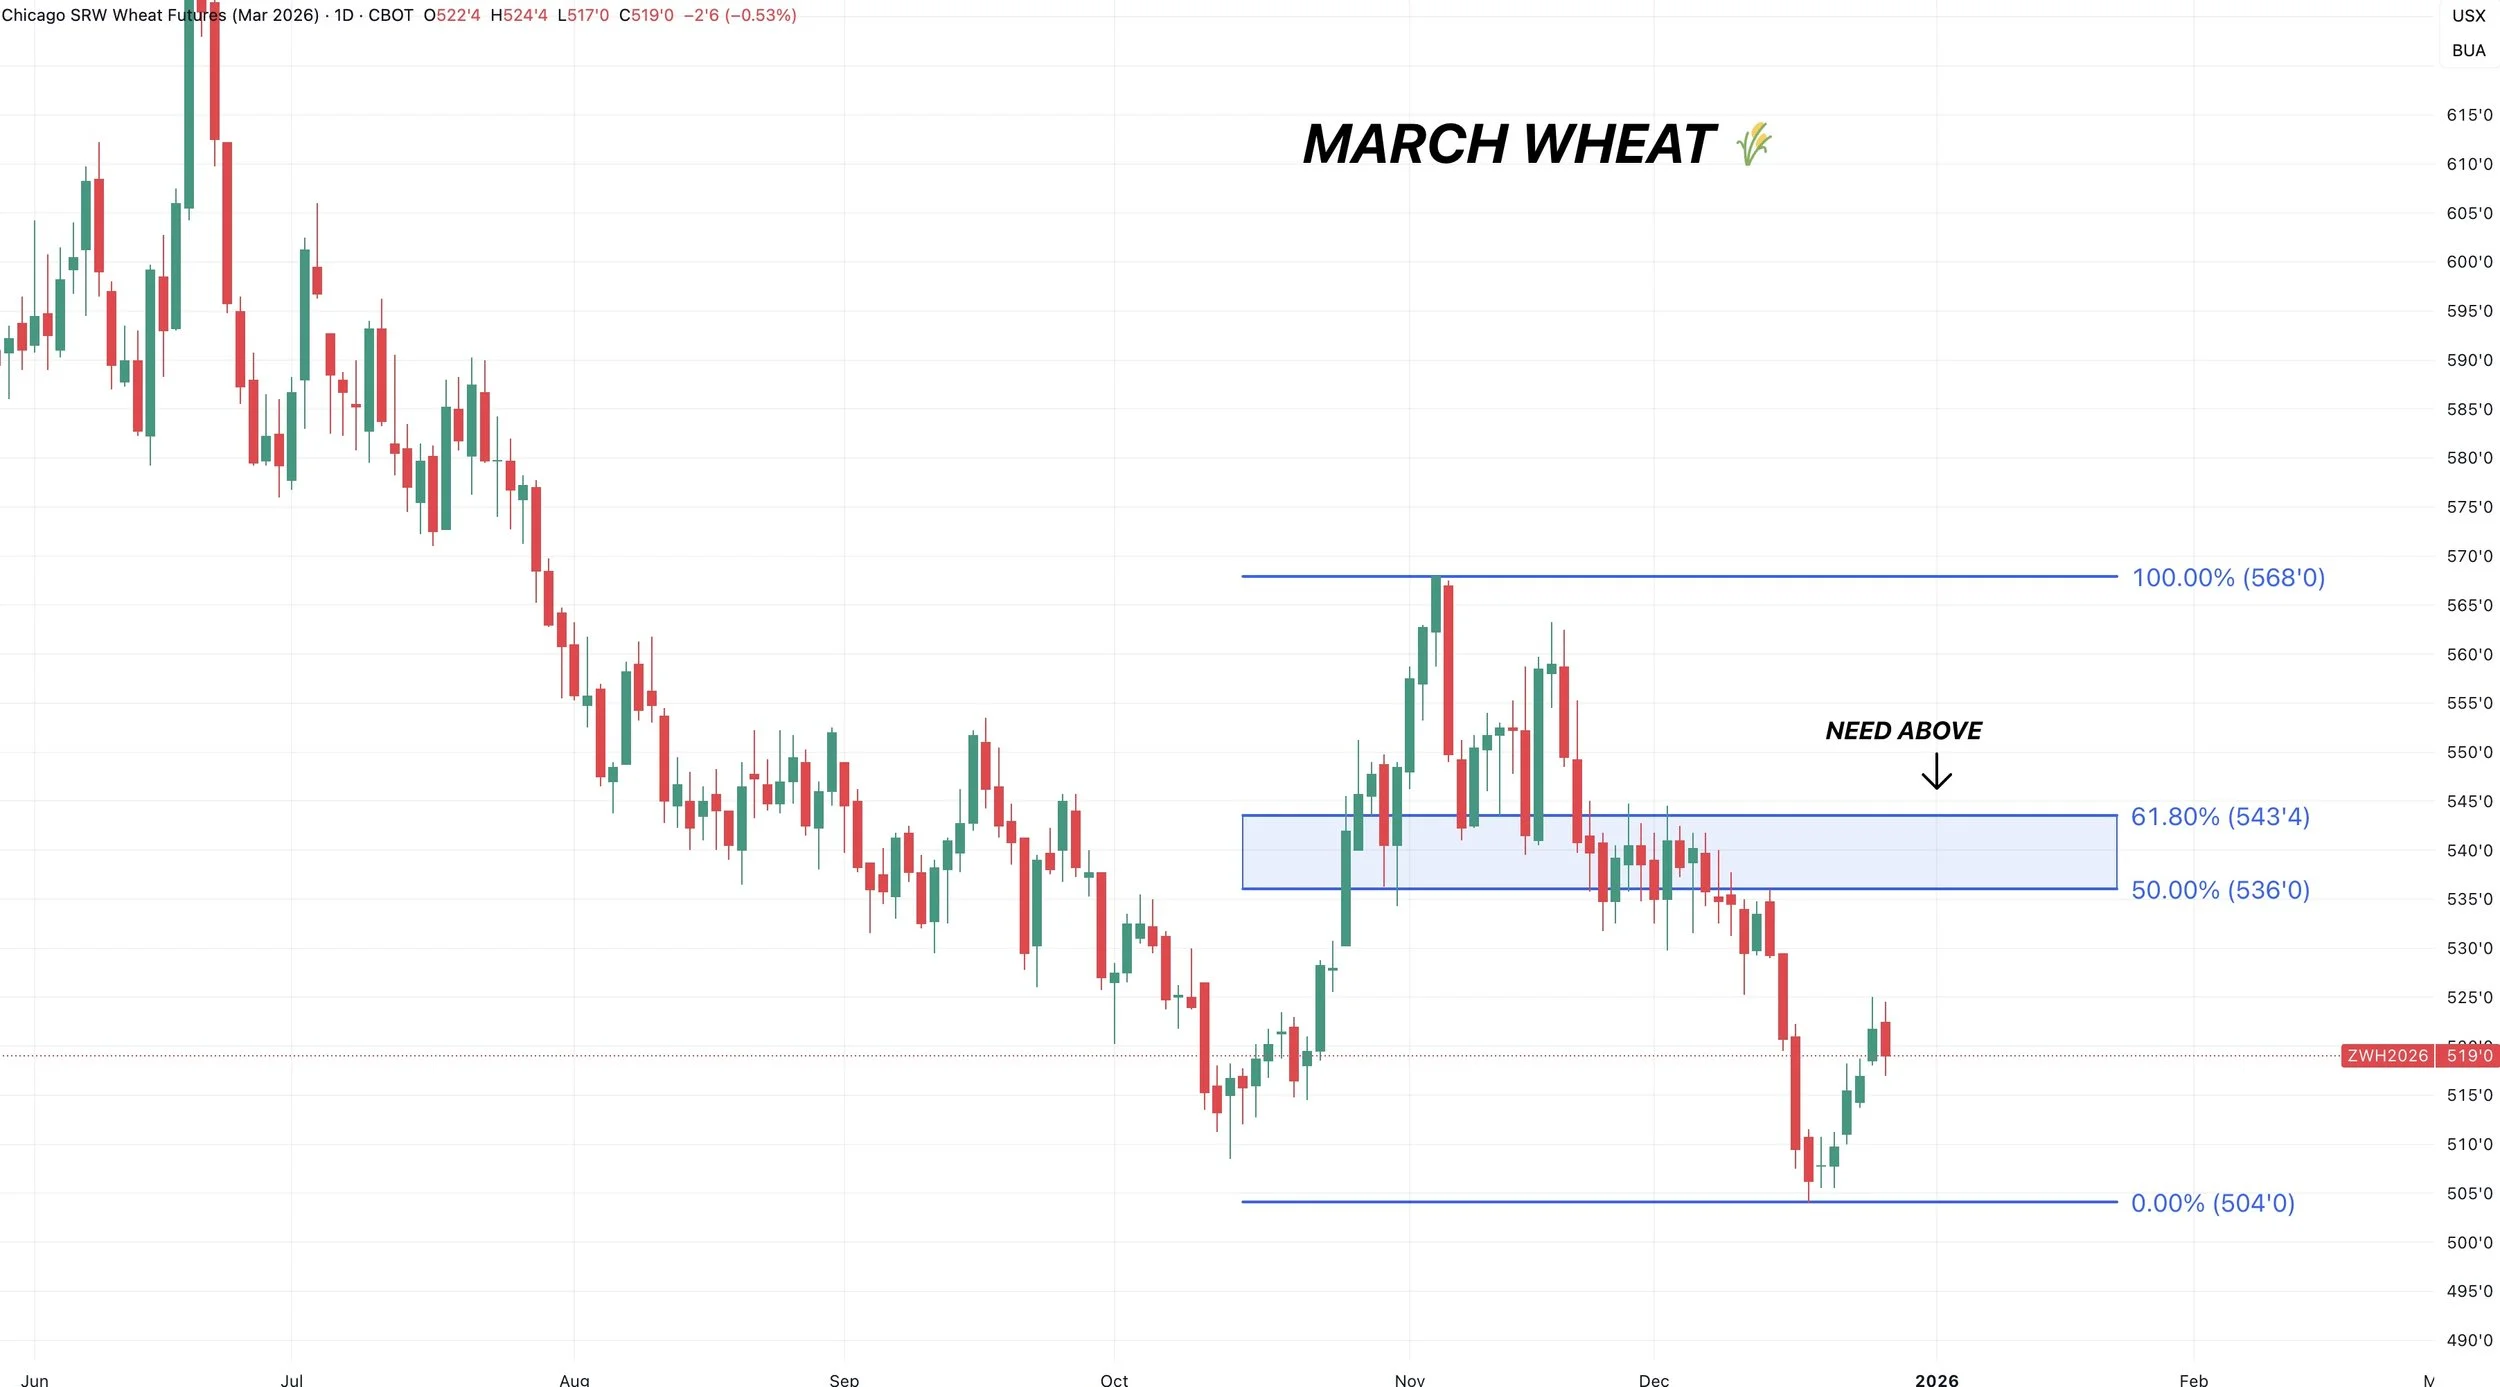
Past Sell or Protection Signals
Dec 11th: 🐮
Cattle sell signal & hedge alert.
Dec 5th: 🐮
Cattle sell signal & hedge alert.
Nov 17th: 🌱
Soybean sell signal & hedge alert.
Nov 13th: 🌽 🌱
Managing risk in corn & beans ahead of USDA report.
Oct 28th: 🌽
Corn sell signal & hedge alert.
Oct 27th: 🌱
Soybean sell signal & hedge alert.
Oct 13th: 🐮
Cattle sell signal & hedge alert.
Aug 22nd: 🌱
Soybean sell signal & hedge alert.
July 31st: 🐮
Cattle sell signal & hedge alert.
July 10th: 🐮
Cattle sell signal & hedge alert.
CLICK HERE TO VIEW
June 5th: 🐮
Cattle sell signal & hedge alert.
June 2nd: 🌾
MPLS wheat sell signal.
April 10th: 🌽
Old crop corn sell signal.
March 19th: 🐮
Cattle hedge & sell signal.
Feb 18th: 🌽 🌾
Old crop KC wheat & old crop corn signal.
Jan 23rd: 🌽 🌱
Corn & beans old crop sell signal.
CLICK HERE TO VIEW
Jan 15th: 🌽 🌱
Corn & beans hedge alert/sell signal.
Jan 2nd: 🐮
Cattle hedge alert at new all-time highs & target.
Dec 11th: 🌽
Corn sell signal at $4.51 200-day MA
CLICK HERE TO VIEW
Oct 2nd: 🌾
Wheat sell signal at $6.12 target
Sep 30th: 🌽
Corn protection signal at $4.23-26
Sep 27th: 🌱
Soybean sell & protection signal at $10.65
Sep 13th: 🌾
Wheat sell signal at $5.98
May 22nd: 🌾
Wheat sell signal when wheat traded +$7.00
Want to Talk?
Our phones are open 24/7 for you guys if you ever need anything or want to discuss your operation.
Hedge Account
Interested in a hedge account? Use the link below to set up an account or shoot Jeremey a call at (605)295-3100.
NOBODY TRUSTS SOYBEAN DEMAND. CHINA CANCELS WHEAT
AUDIO COMMENTARY
We still like having hedges in cattle
Cattle still viewed as relief bounce for now until proven otherwise (chart below)*
How to properly manage risk in cattle
Area we’d re-own corn (chart below)*
Record ethanol numbers
Corn “usually” goes higher end of year
China cancels US wheat
Looking at getting feed coverage
No issues in South America, but market no longer cares about these China purchases
Nobody trusts the demand in soybeans
We could have plenty of soybeans if we don’t have any South America scares
Find a different approach if the tax man is forcing you to sell
Level I’m looking for in soybeans (chart below)*
Listen to today’s audio below
Want to talk? (605)250-3863
Your trial has ended..
Don’t lose access to our updates or signals
Here is our holiday sale
CHARTS
March Corn 🌽
This could be the bottom. We closed back above the 61.8% retracement to the Oct lows. Exactly where we recently found a bottom a few weeks ago.
I’m not looking to re-own unless we drop down into the blue box. That would be a great point of interest. As it is the golden zone of the entire rally.
It gives back 50-61.8% of the entire rally off contract lows.
I am not looking to re-own anything -10 cents off the highs and where we last sold at $4.50
If we come down to the blue box, that would be a reasonable place to find a bottom if this red box and yesterday’s lows do not hold.
To the upside, $4.50 is the clear level to break above.
We rejected there multiple times. It was old support from spring. It reclaims 50% of the Feb highs.
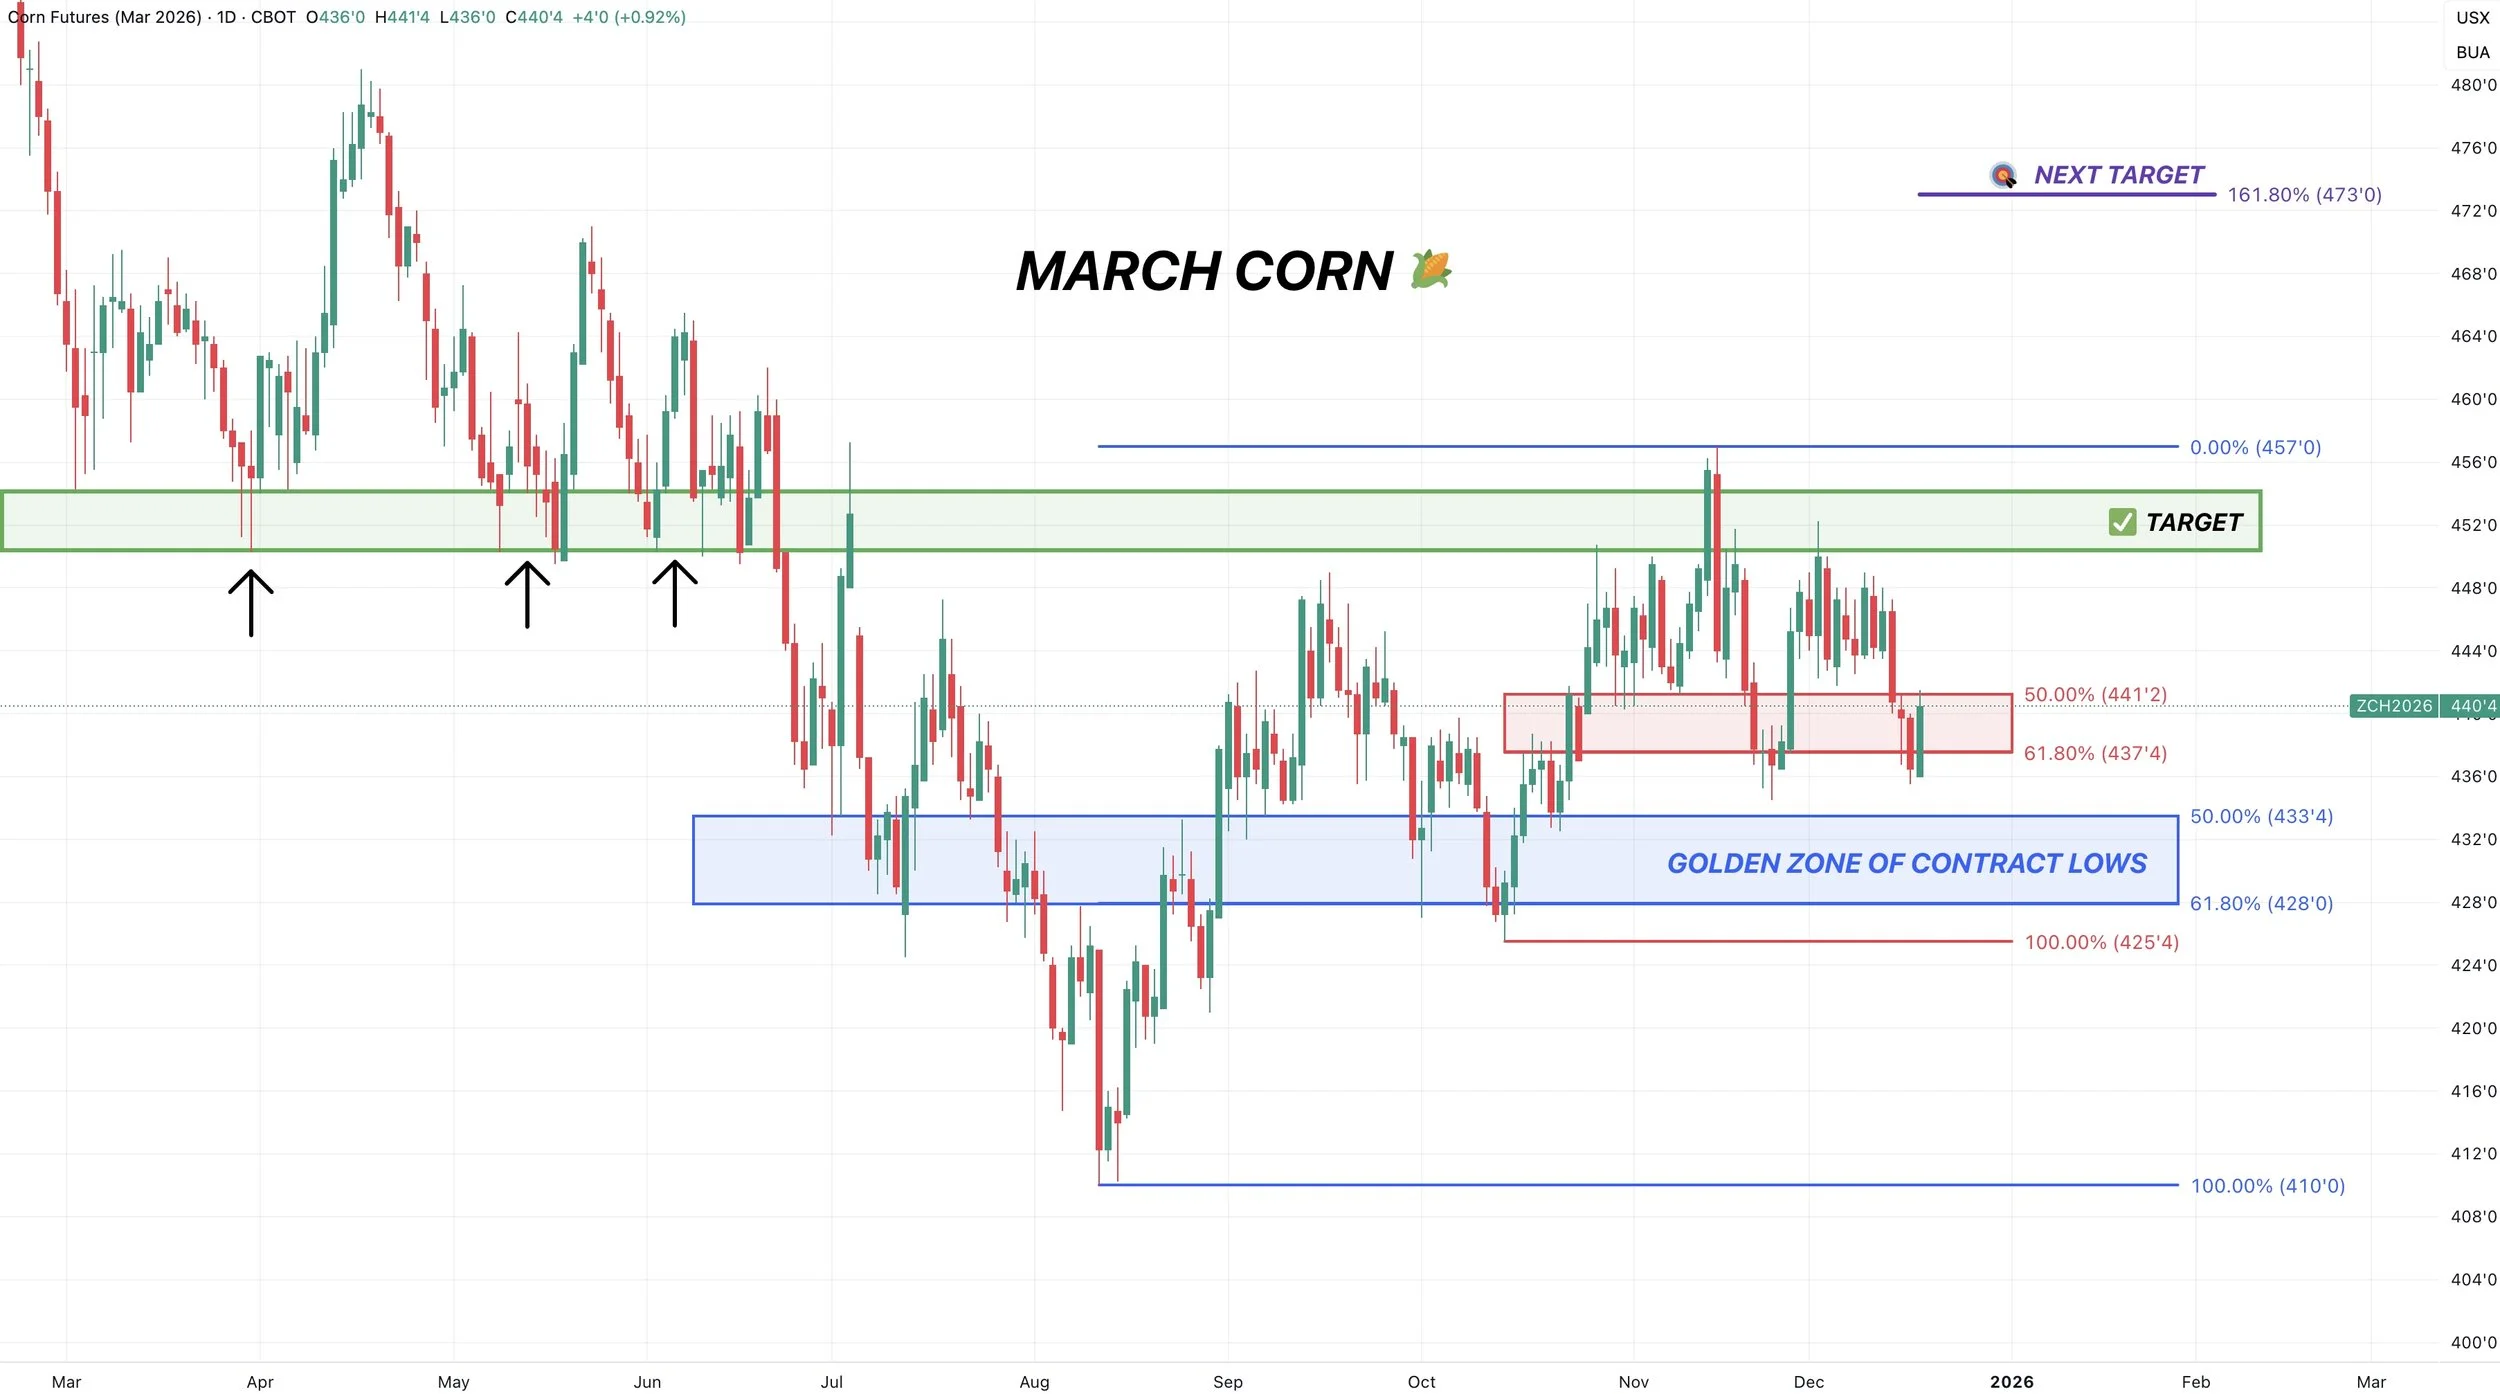
Jan Beans 🌱
We broke below the golden zone of this entire China fueled rally?
Now what?
Scroll to view where I think the bottom could be*
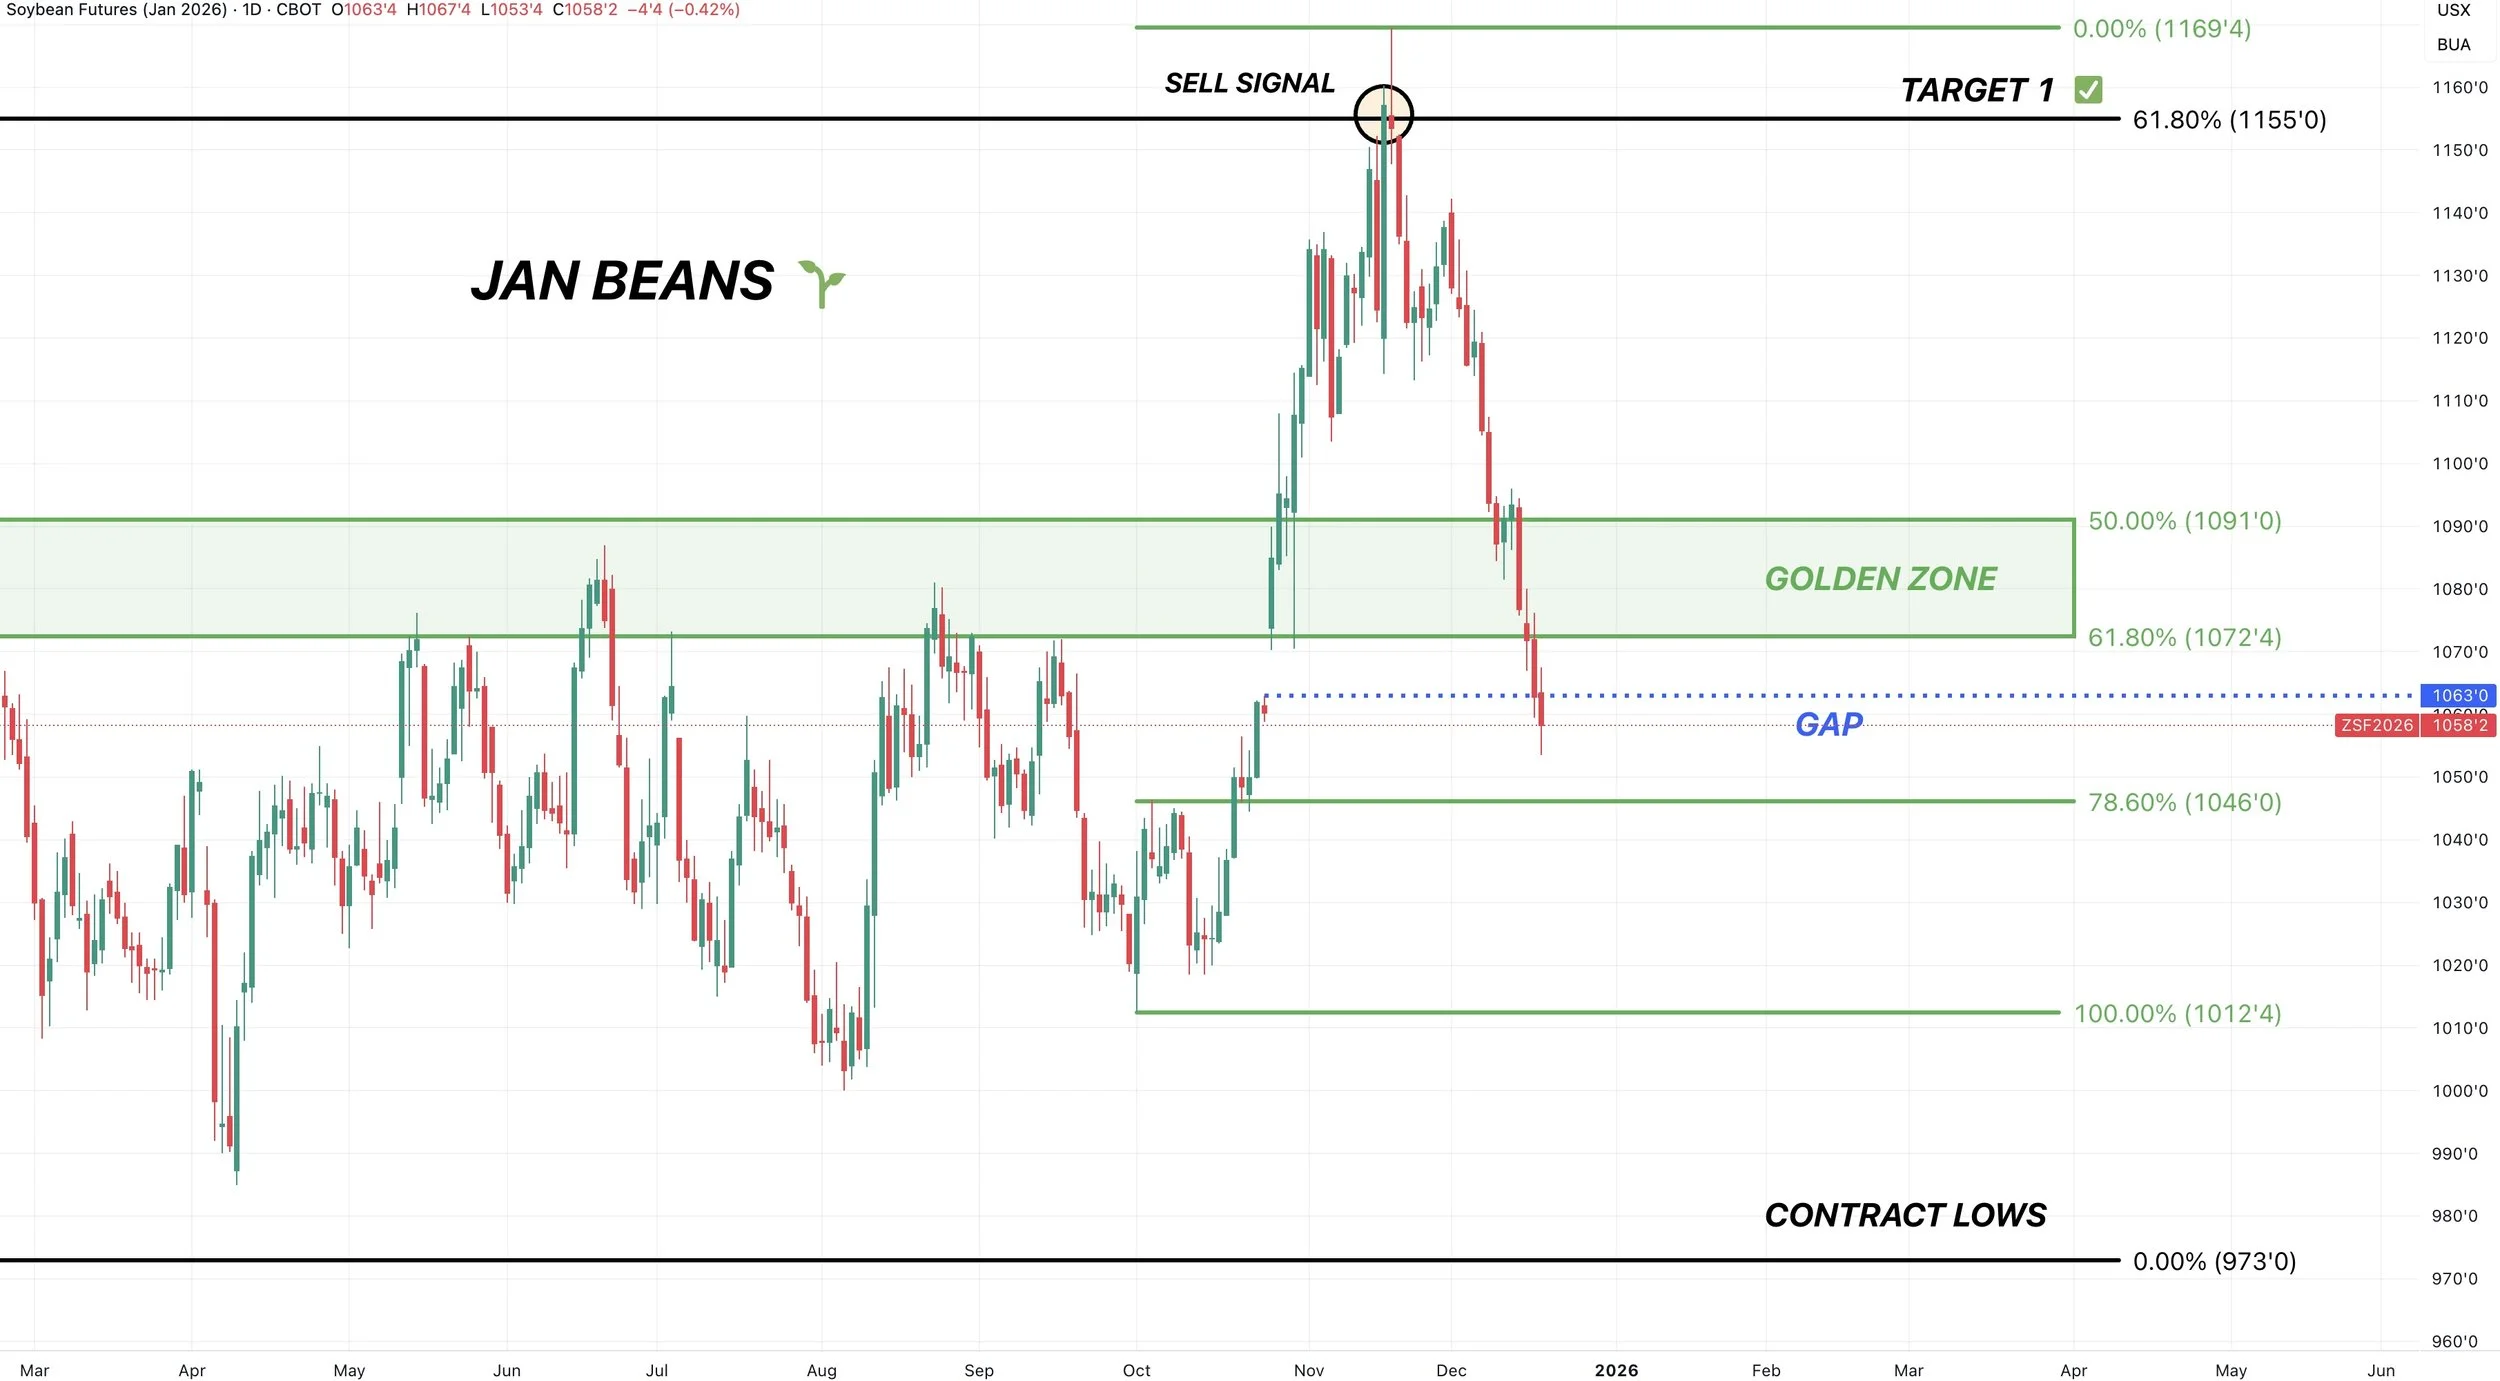
Since we broke that first 61.8% level.
The point of interest is going to be 61.% of the entire rally from contract lows.
That comes in at $10.48
That would be a great spot to look to re-own in my opinion.
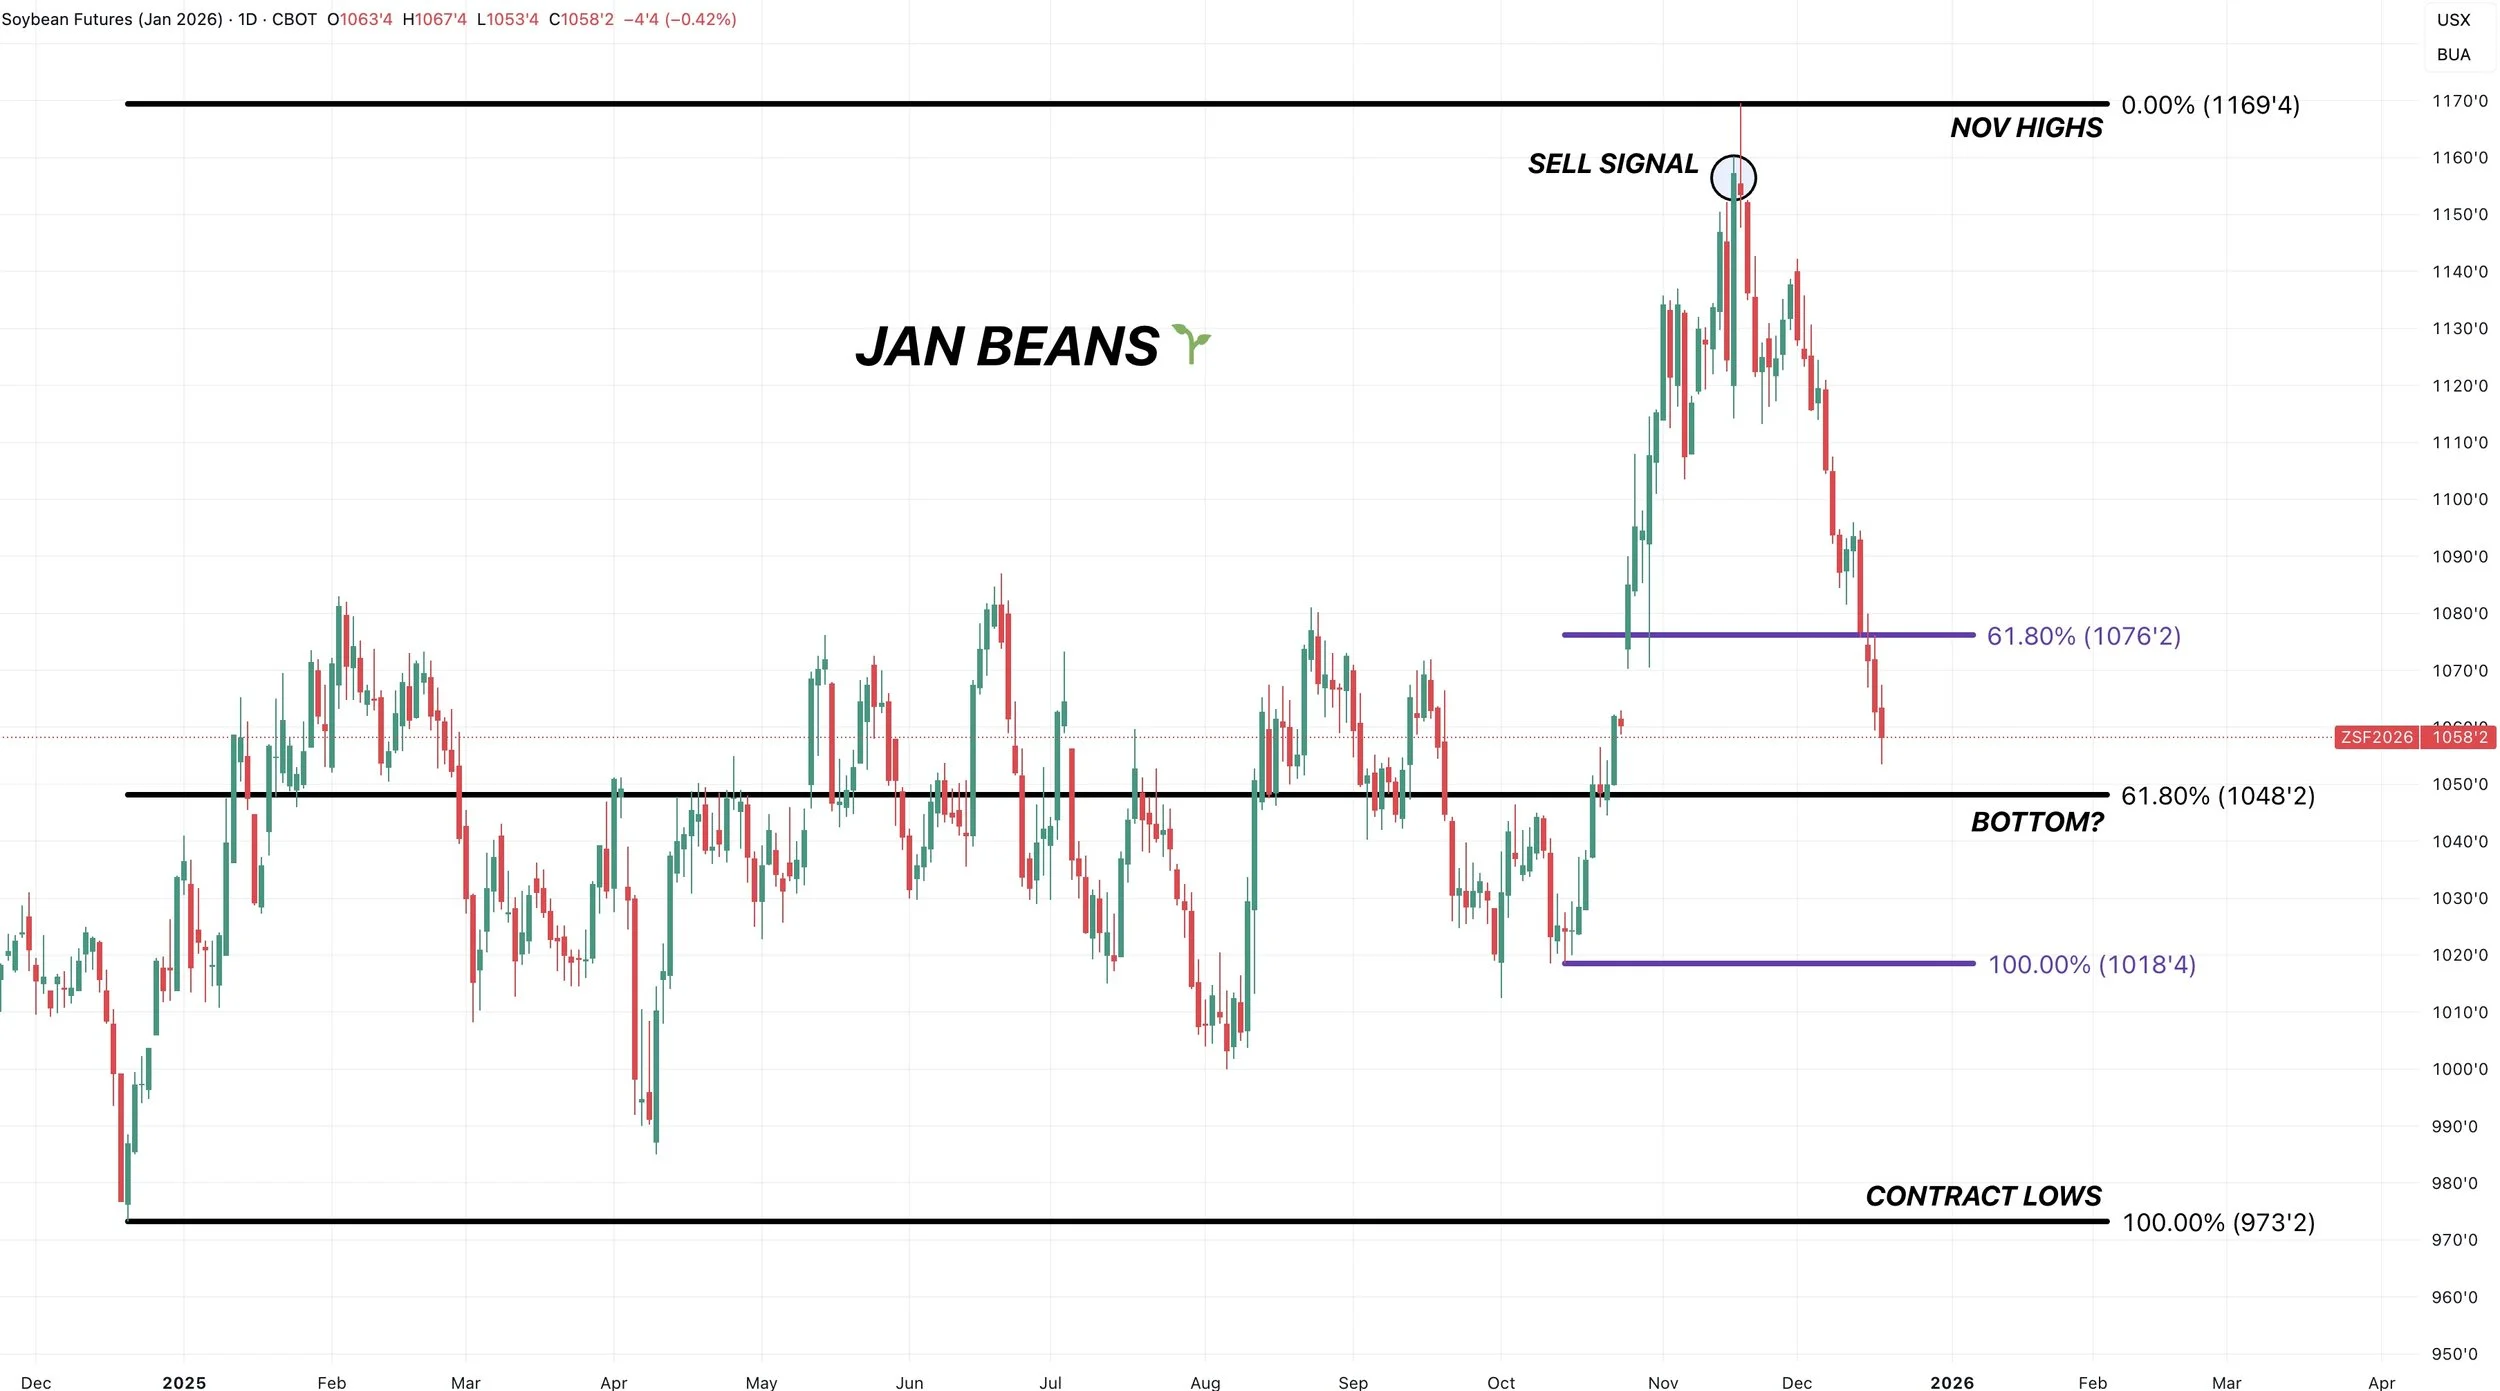
If you remember.. the recent highs where we issued that sell signal were marked by reclaiming 61.8% of the contract highs.
So finding a bottom after giving back 61.8% of the entire rally from contract lows would make perfect sense.
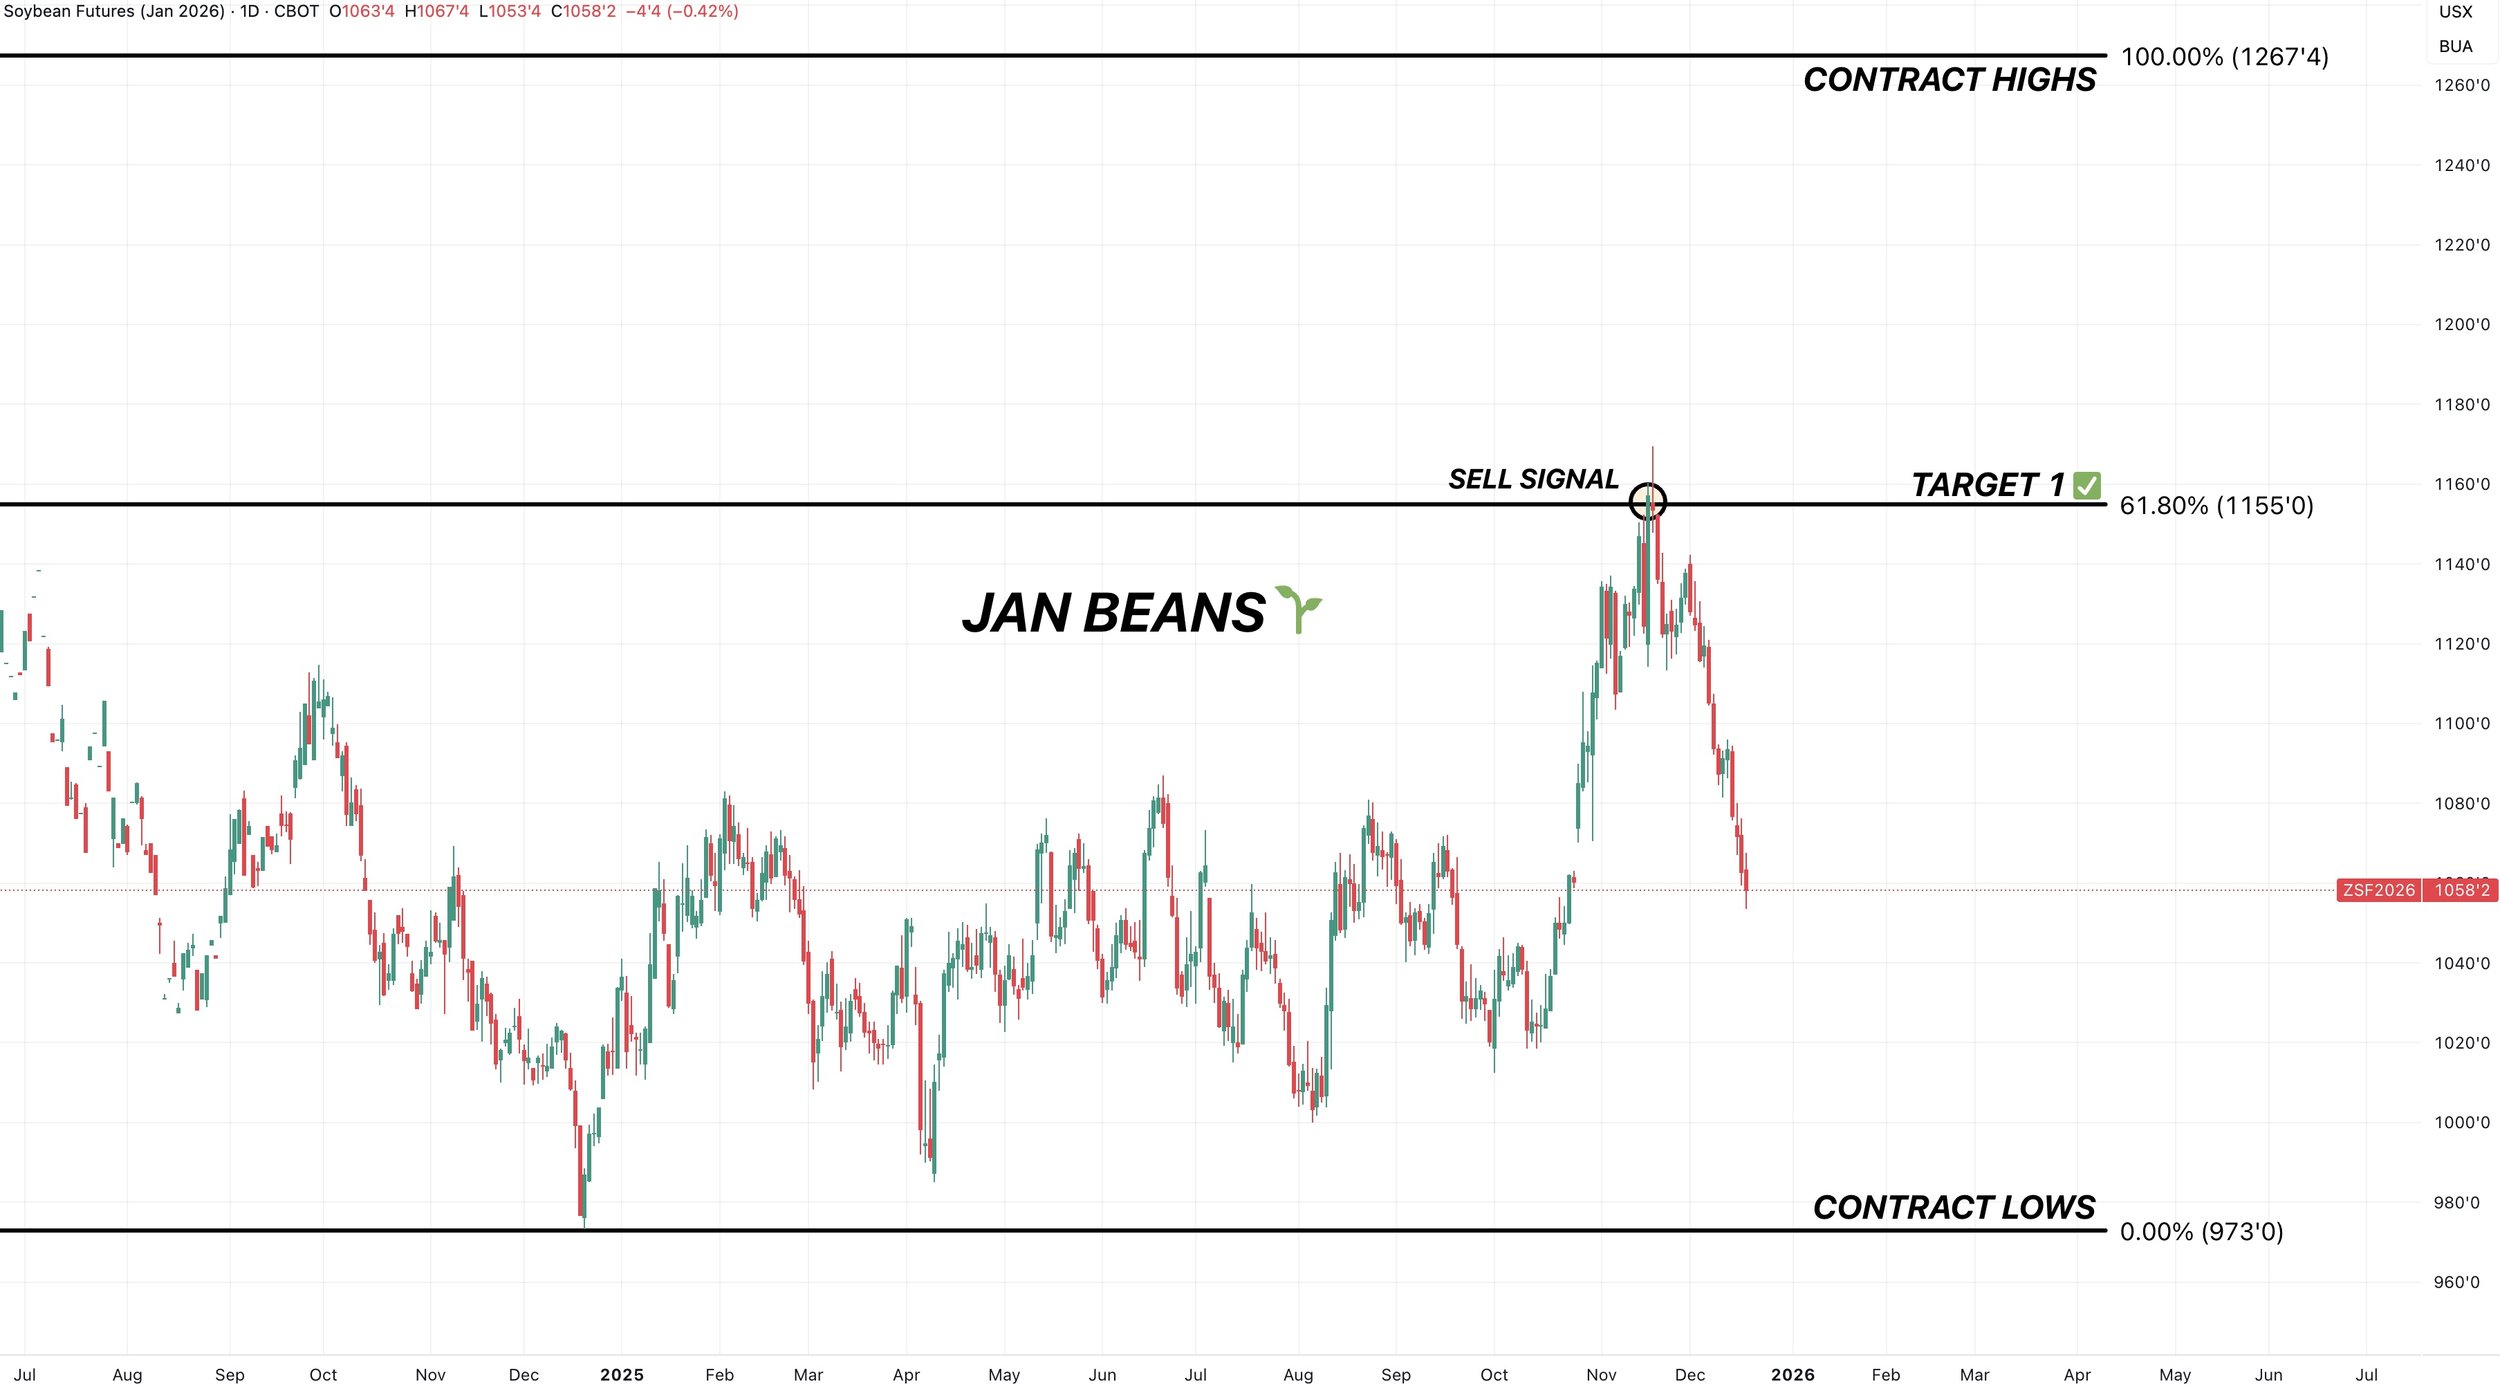
Feb Live Cattle 🐮
Still sitting in the golden zone.
Still like taking some chips off the table here.
This is a common spot for a bounce to fail.
Take out the 61.8% level and we could be looking at something bigger, but until that happens this is viewed as a bounce that should be rewarded in my opinion.
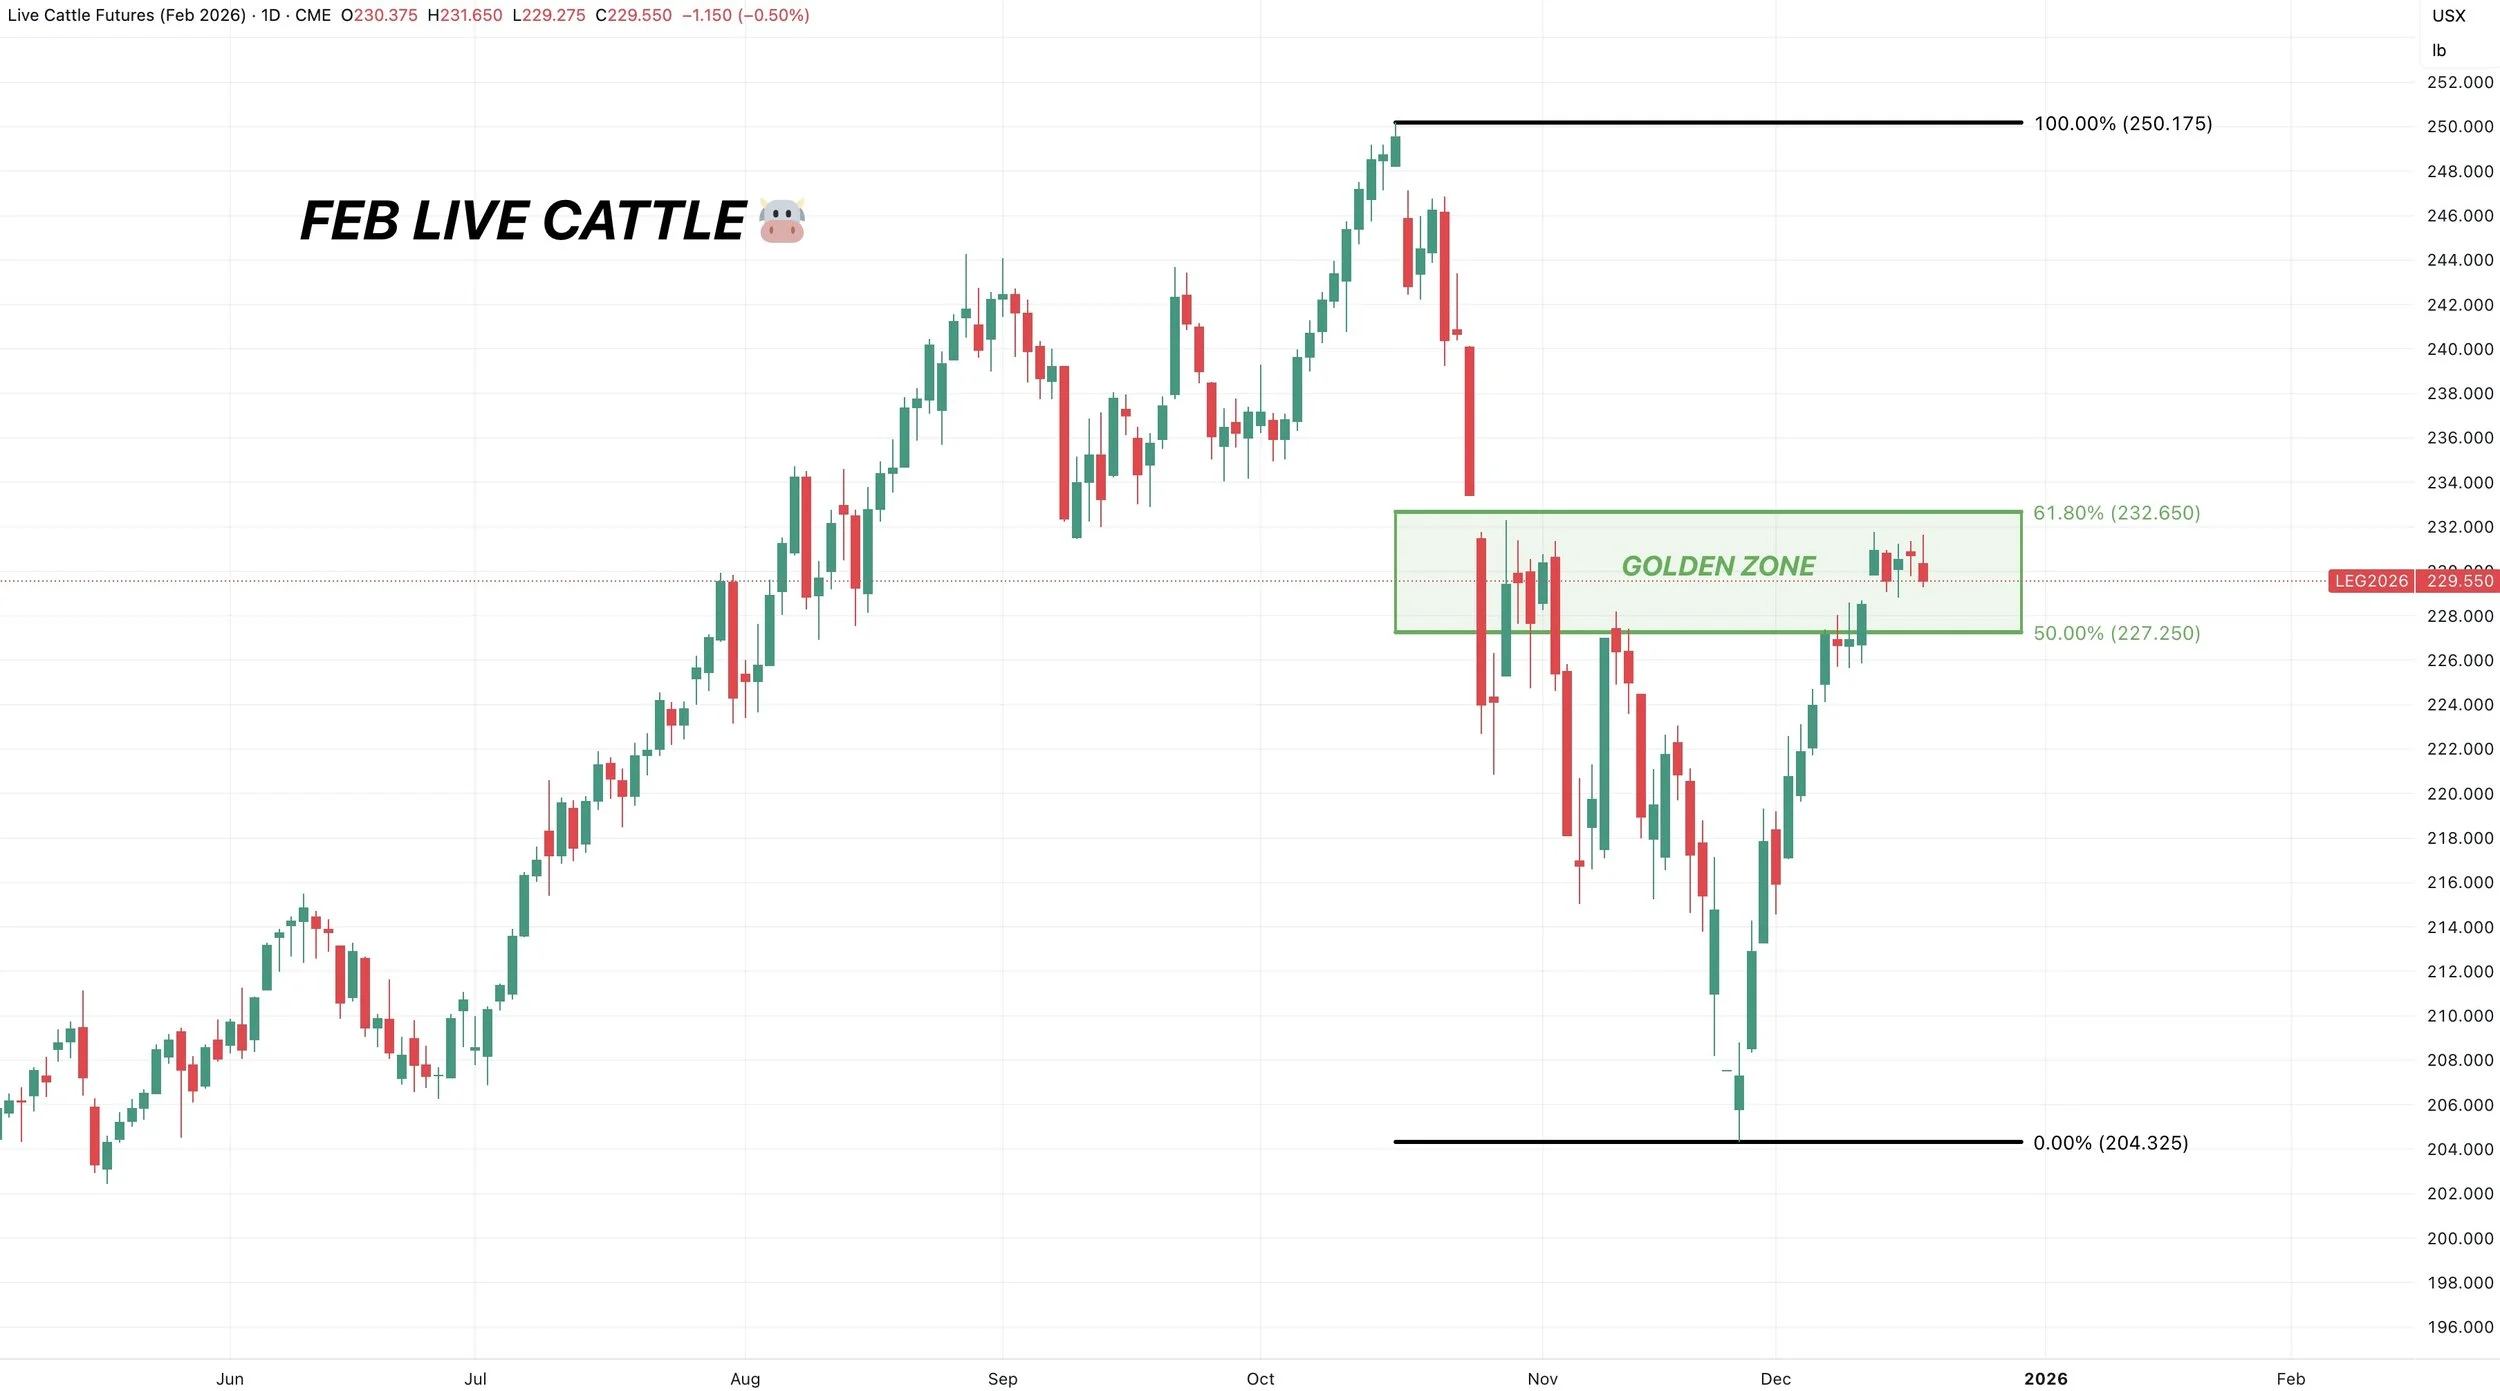
Jan Feeders 🐮
Same exact story.
Still in the golden zone.
I also think we could have a potential exhaustion gap from last week. Which makes me even more cautious.
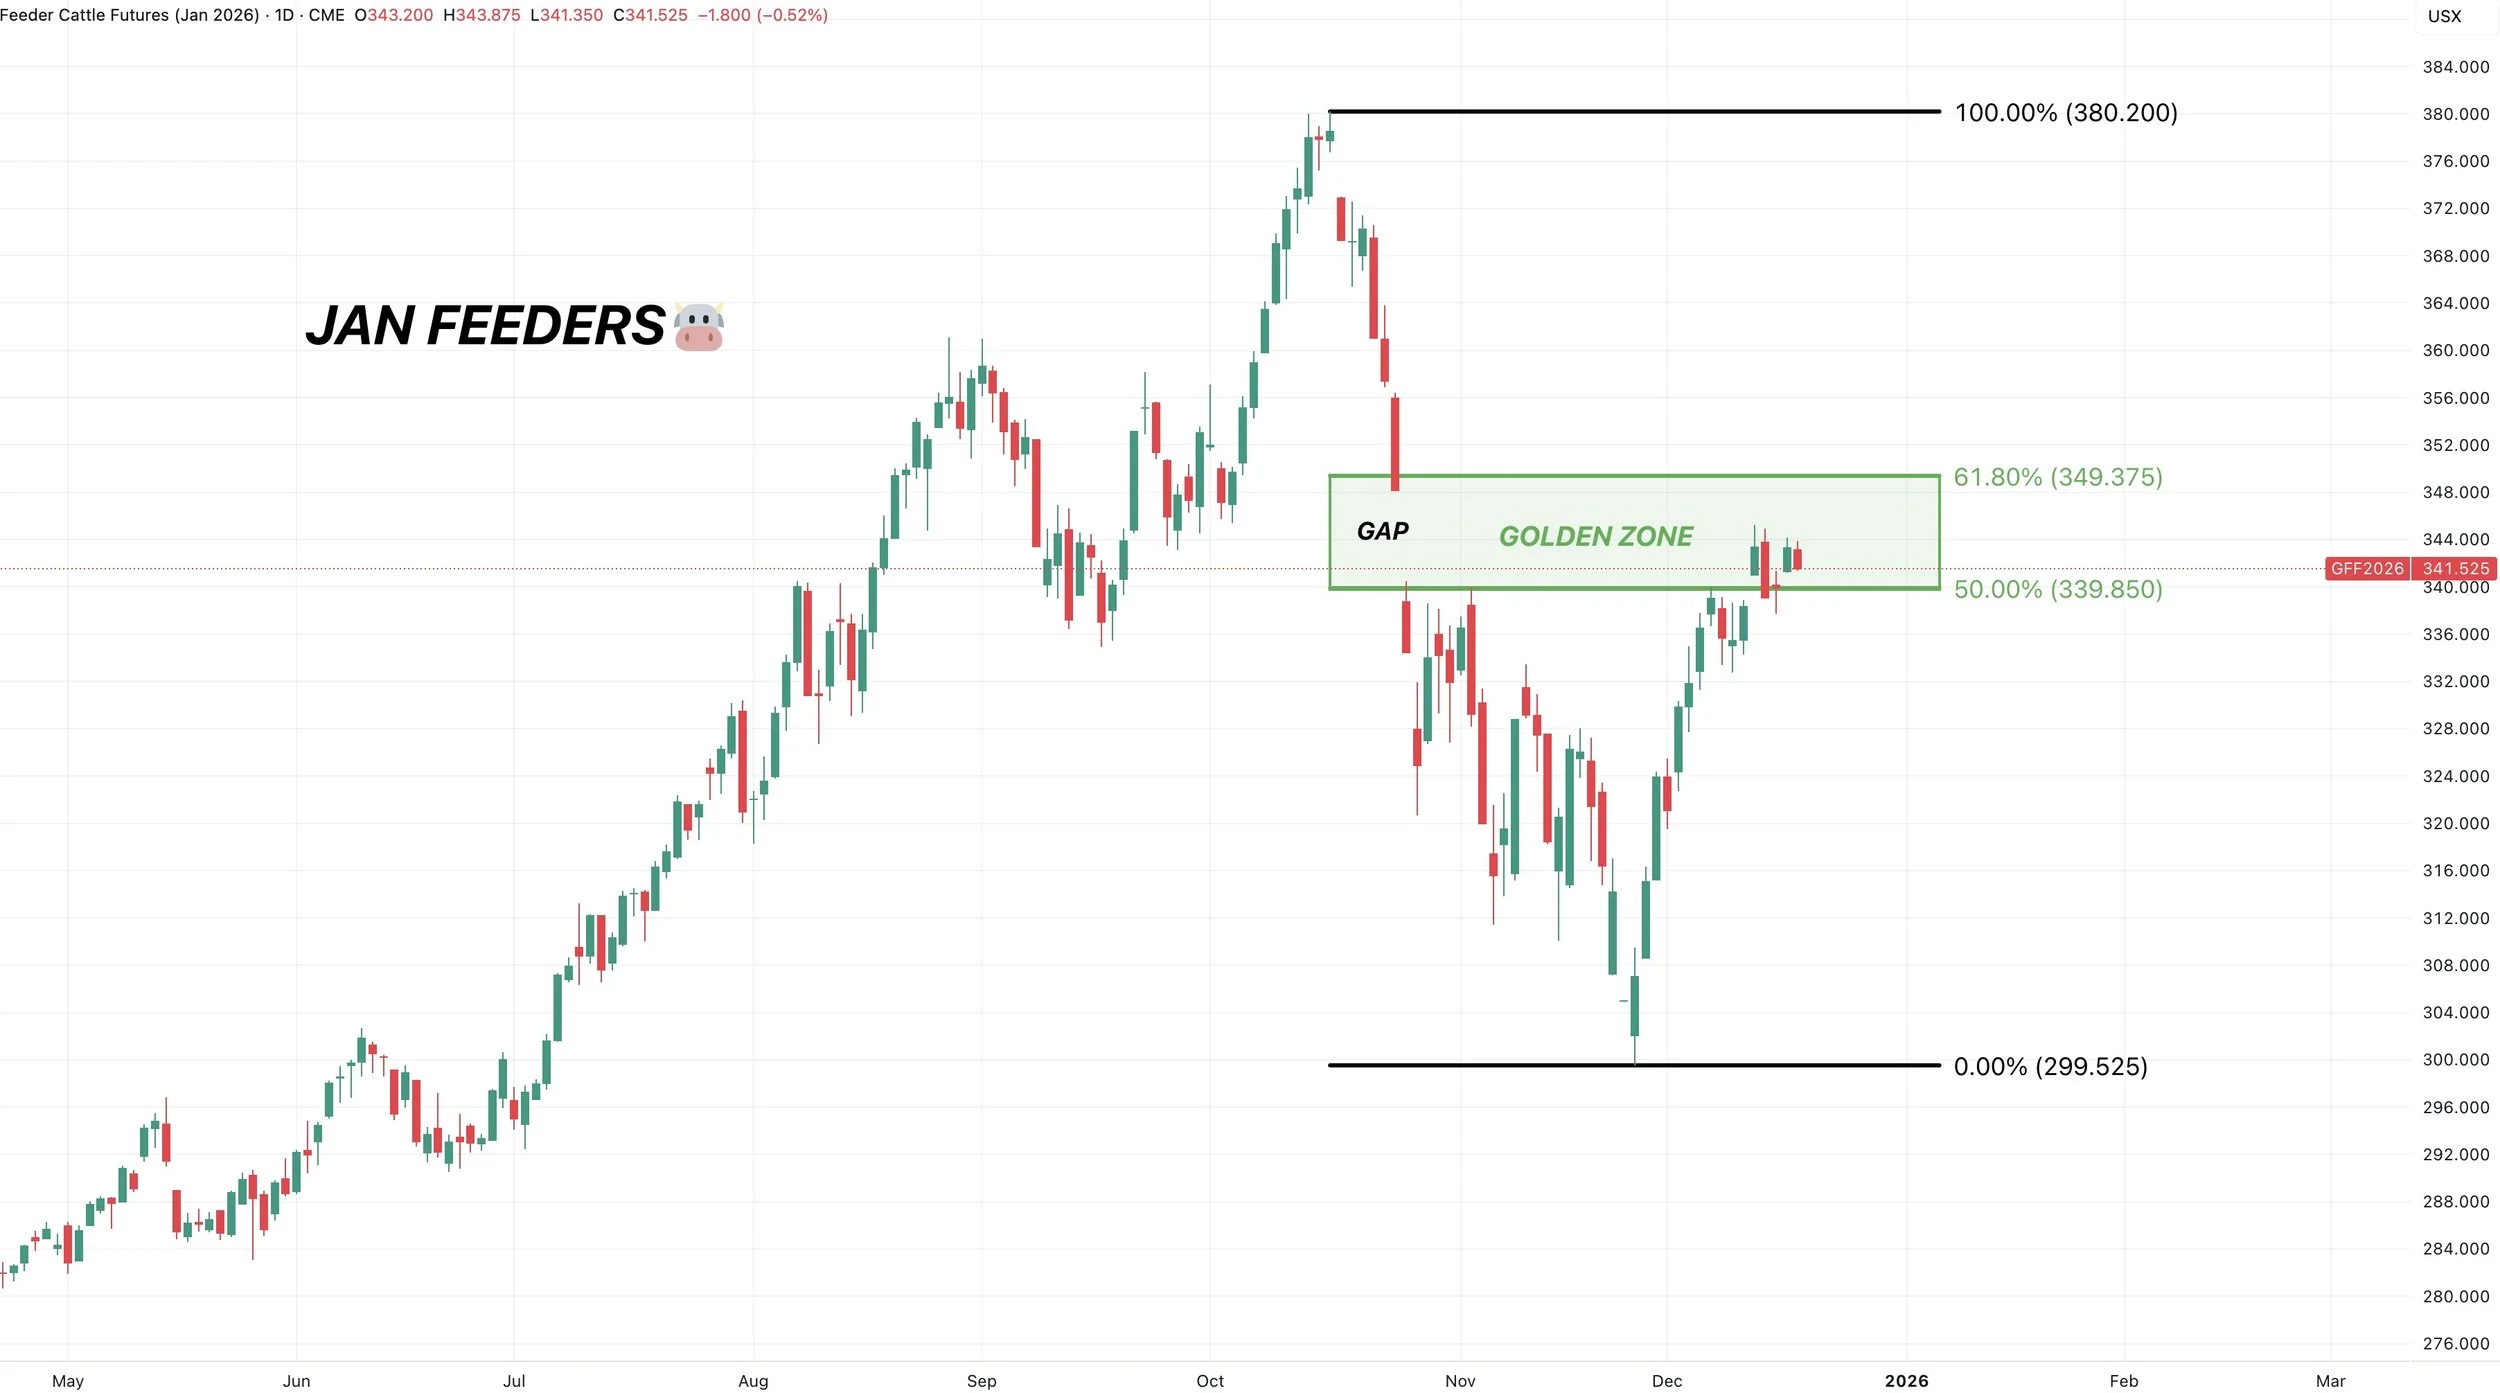
Past Sell or Protection Signals
Dec 11th: 🐮
Cattle sell signal & hedge alert.
Dec 5th: 🐮
Cattle sell signal & hedge alert.
Nov 17th: 🌱
Soybean sell signal & hedge alert.
Nov 13th: 🌽 🌱
Managing risk in corn & beans ahead of USDA report.
Oct 28th: 🌽
Corn sell signal & hedge alert.
Oct 27th: 🌱
Soybean sell signal & hedge alert.
Oct 13th: 🐮
Cattle sell signal & hedge alert.
Aug 22nd: 🌱
Soybean sell signal & hedge alert.
July 31st: 🐮
Cattle sell signal & hedge alert.
July 10th: 🐮
Cattle sell signal & hedge alert.
CLICK HERE TO VIEW
June 5th: 🐮
Cattle sell signal & hedge alert.
June 2nd: 🌾
MPLS wheat sell signal.
April 10th: 🌽
Old crop corn sell signal.
March 19th: 🐮
Cattle hedge & sell signal.
Feb 18th: 🌽 🌾
Old crop KC wheat & old crop corn signal.
Jan 23rd: 🌽 🌱
Corn & beans old crop sell signal.
CLICK HERE TO VIEW
Jan 15th: 🌽 🌱
Corn & beans hedge alert/sell signal.
Jan 2nd: 🐮
Cattle hedge alert at new all-time highs & target.
Dec 11th: 🌽
Corn sell signal at $4.51 200-day MA
CLICK HERE TO VIEW
Oct 2nd: 🌾
Wheat sell signal at $6.12 target
Sep 30th: 🌽
Corn protection signal at $4.23-26
Sep 27th: 🌱
Soybean sell & protection signal at $10.65
Sep 13th: 🌾
Wheat sell signal at $5.98
May 22nd: 🌾
Wheat sell signal when wheat traded +$7.00
Want to Talk?
Our phones are open 24/7 for you guys if you ever need anything or want to discuss your operation.
Hedge Account
Interested in a hedge account? Use the link below to set up an account or shoot Jeremey a call at (605)295-3100.
A LOT RIDING ON USDA & BRAZIL
AUDIO COMMENTARY
Corn & beans bounce off their lows
Corn shipments great, beans poor
How long can strong corn demand continue?
Corn holding key level (chart below)*
Good risk parameter in corn
Beans near the gap (chart below)*
Bullish bean divergence? (chart below)*
Need the funds to get interested
A lot riding on USDA and Brazil weather
Everyone across world increasing crush
What if China buys more than agreed?
Possible zero-cost strategies for upside
Re-own area in soybeans?
EPA news adding pressure
Still like protecting cattle rally
Wheat not looking hot (chart below)*
Defining your marketing timeline
Listen to today’s audio below
Want to talk? (605)250-3863
Holiday Sale
Your free trial has ended
Subscribe so you don’t miss future updates or signals
CHARTS
March Corn 🌽
We bounced right where we needed to hold.
Which is those recent lows and the 61.8% level down to those October lows.
Big spot to hold short term. As failure to hold, could bring us down to the blue box.
The blue box is 50-61.8% of the the entire rally from contract lows.
Need above $4.50 to spark more upside. That remains key resistance.
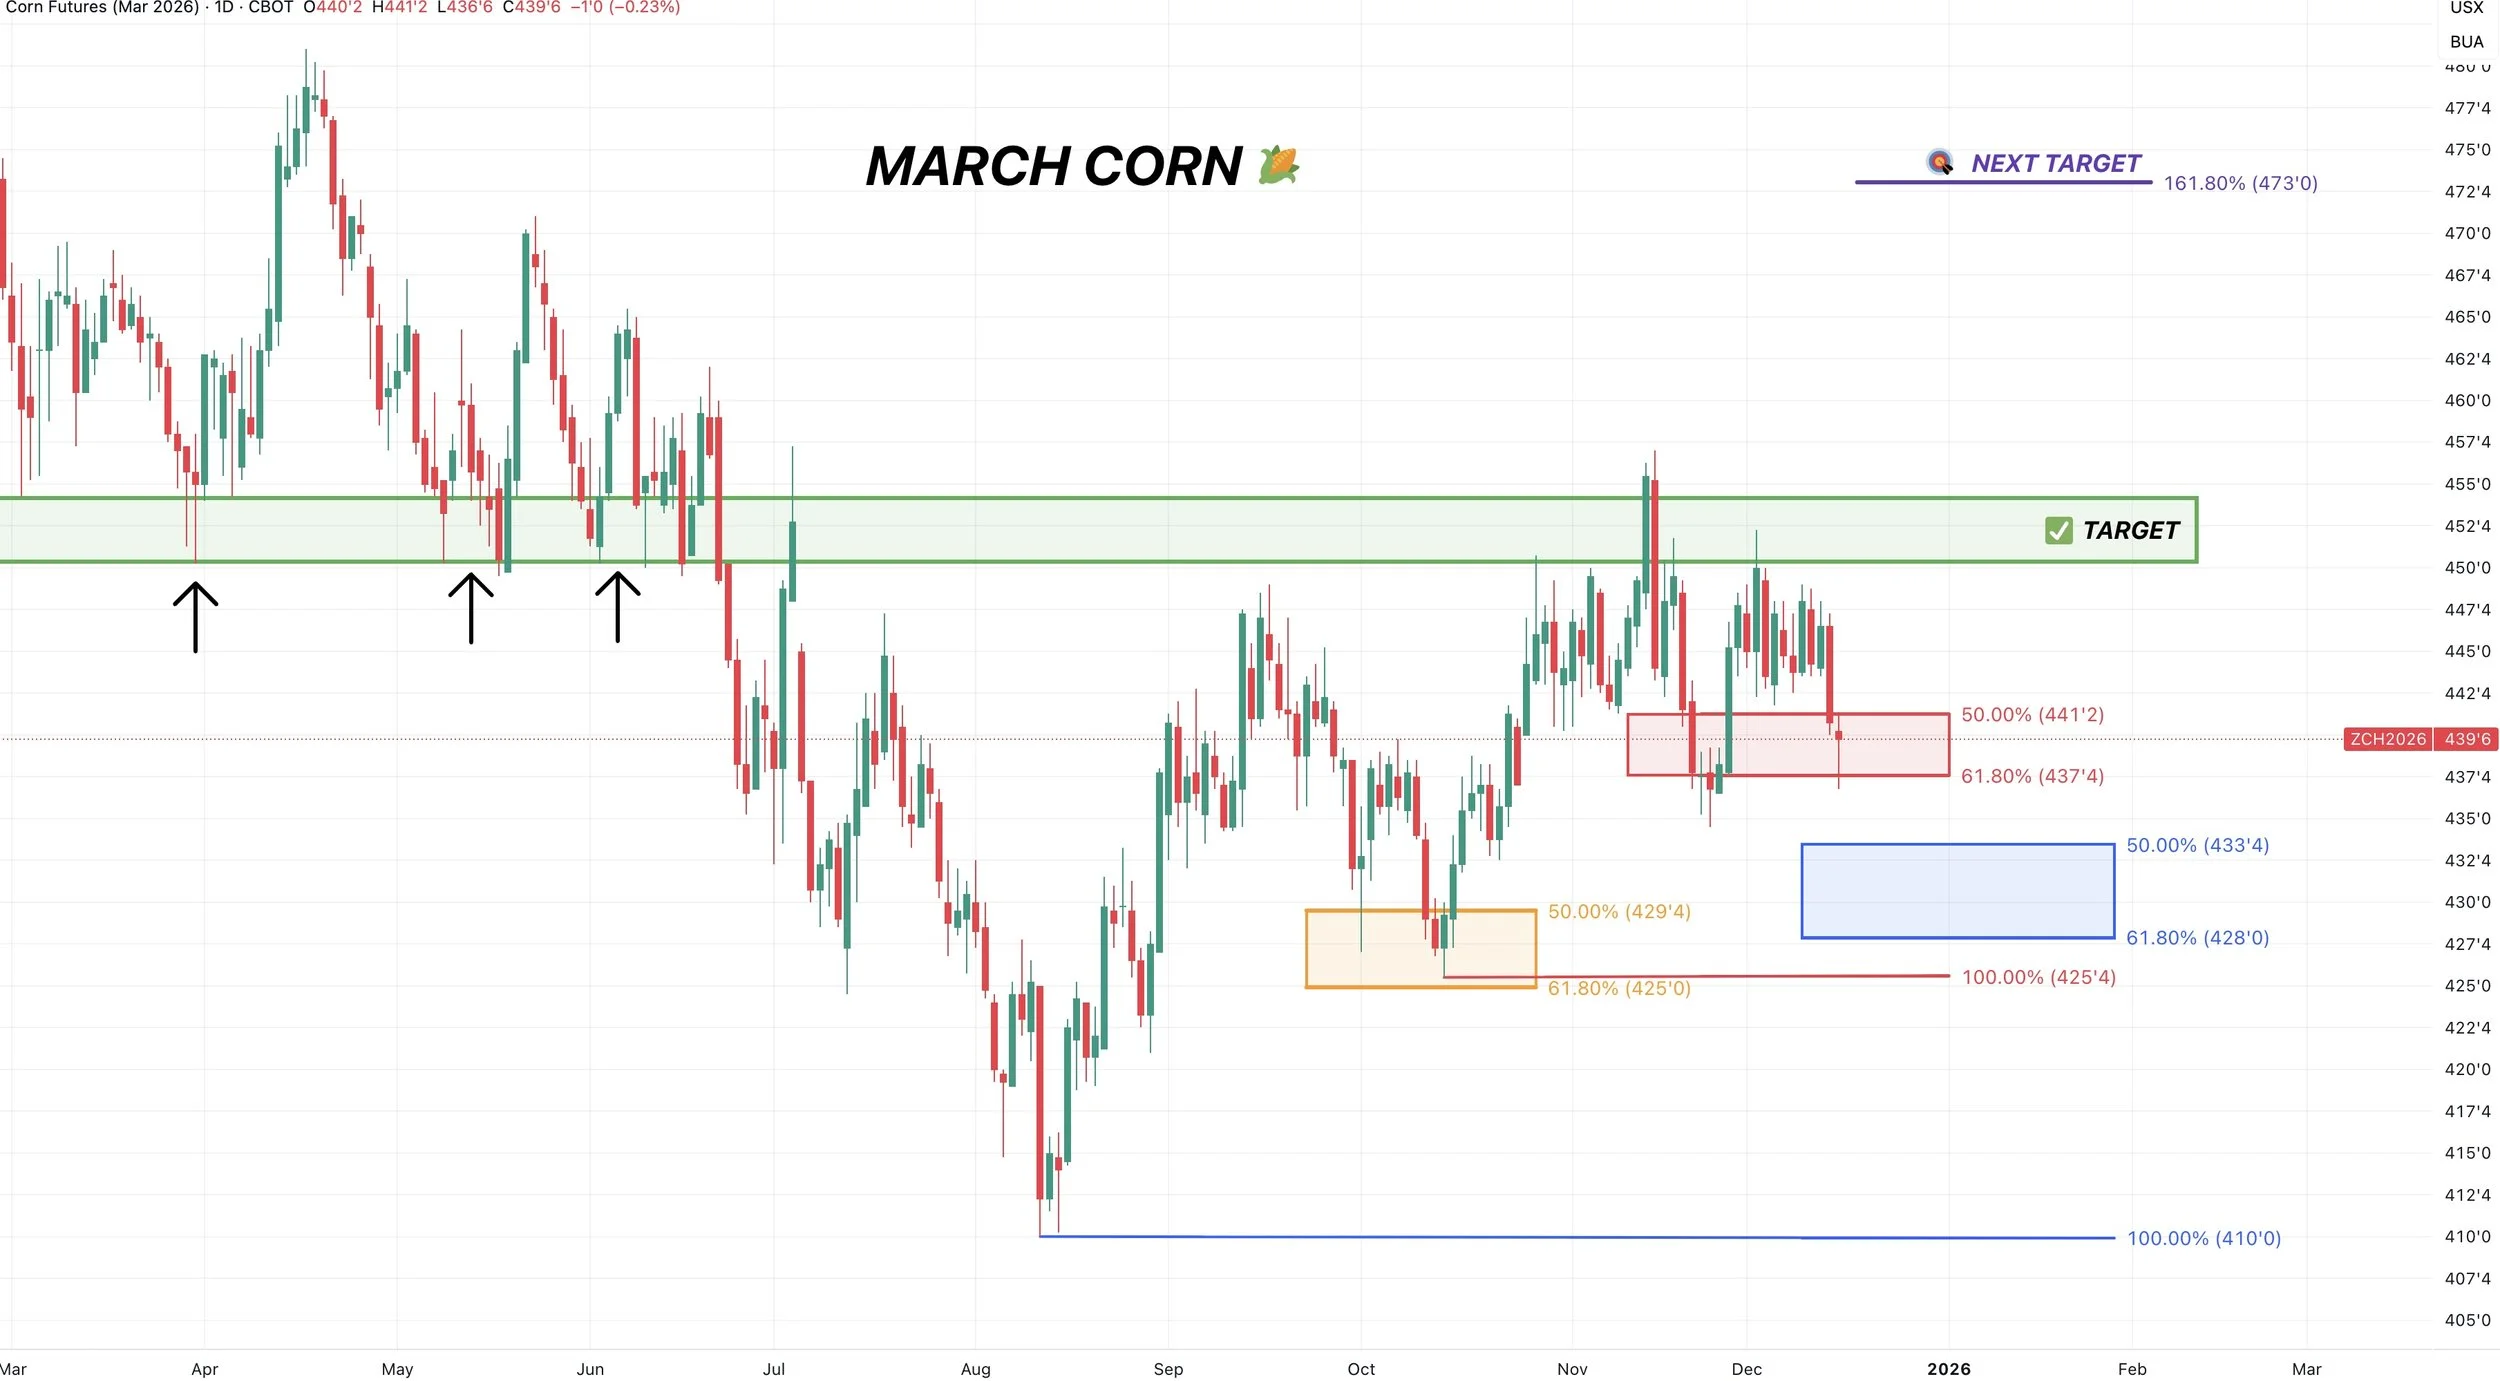
Jan Beans 🌱
Nearly closed the gap today but did not.
Now sitting right at the golden fib. Which gives back 61.8% of the entire rally.
This also happens to be our yearly resistance.
If we are going to be bounce, it needs to be right about here. A bounce here still makes sense.
Failure to hold could result in us dropping to the 78.6% level at $10.46 and could drop us back into the brutal yearly range we were trapped in.
Since we had a sell signal at $11.55, I will share my next target once I am confident we’ve put in a bottom.
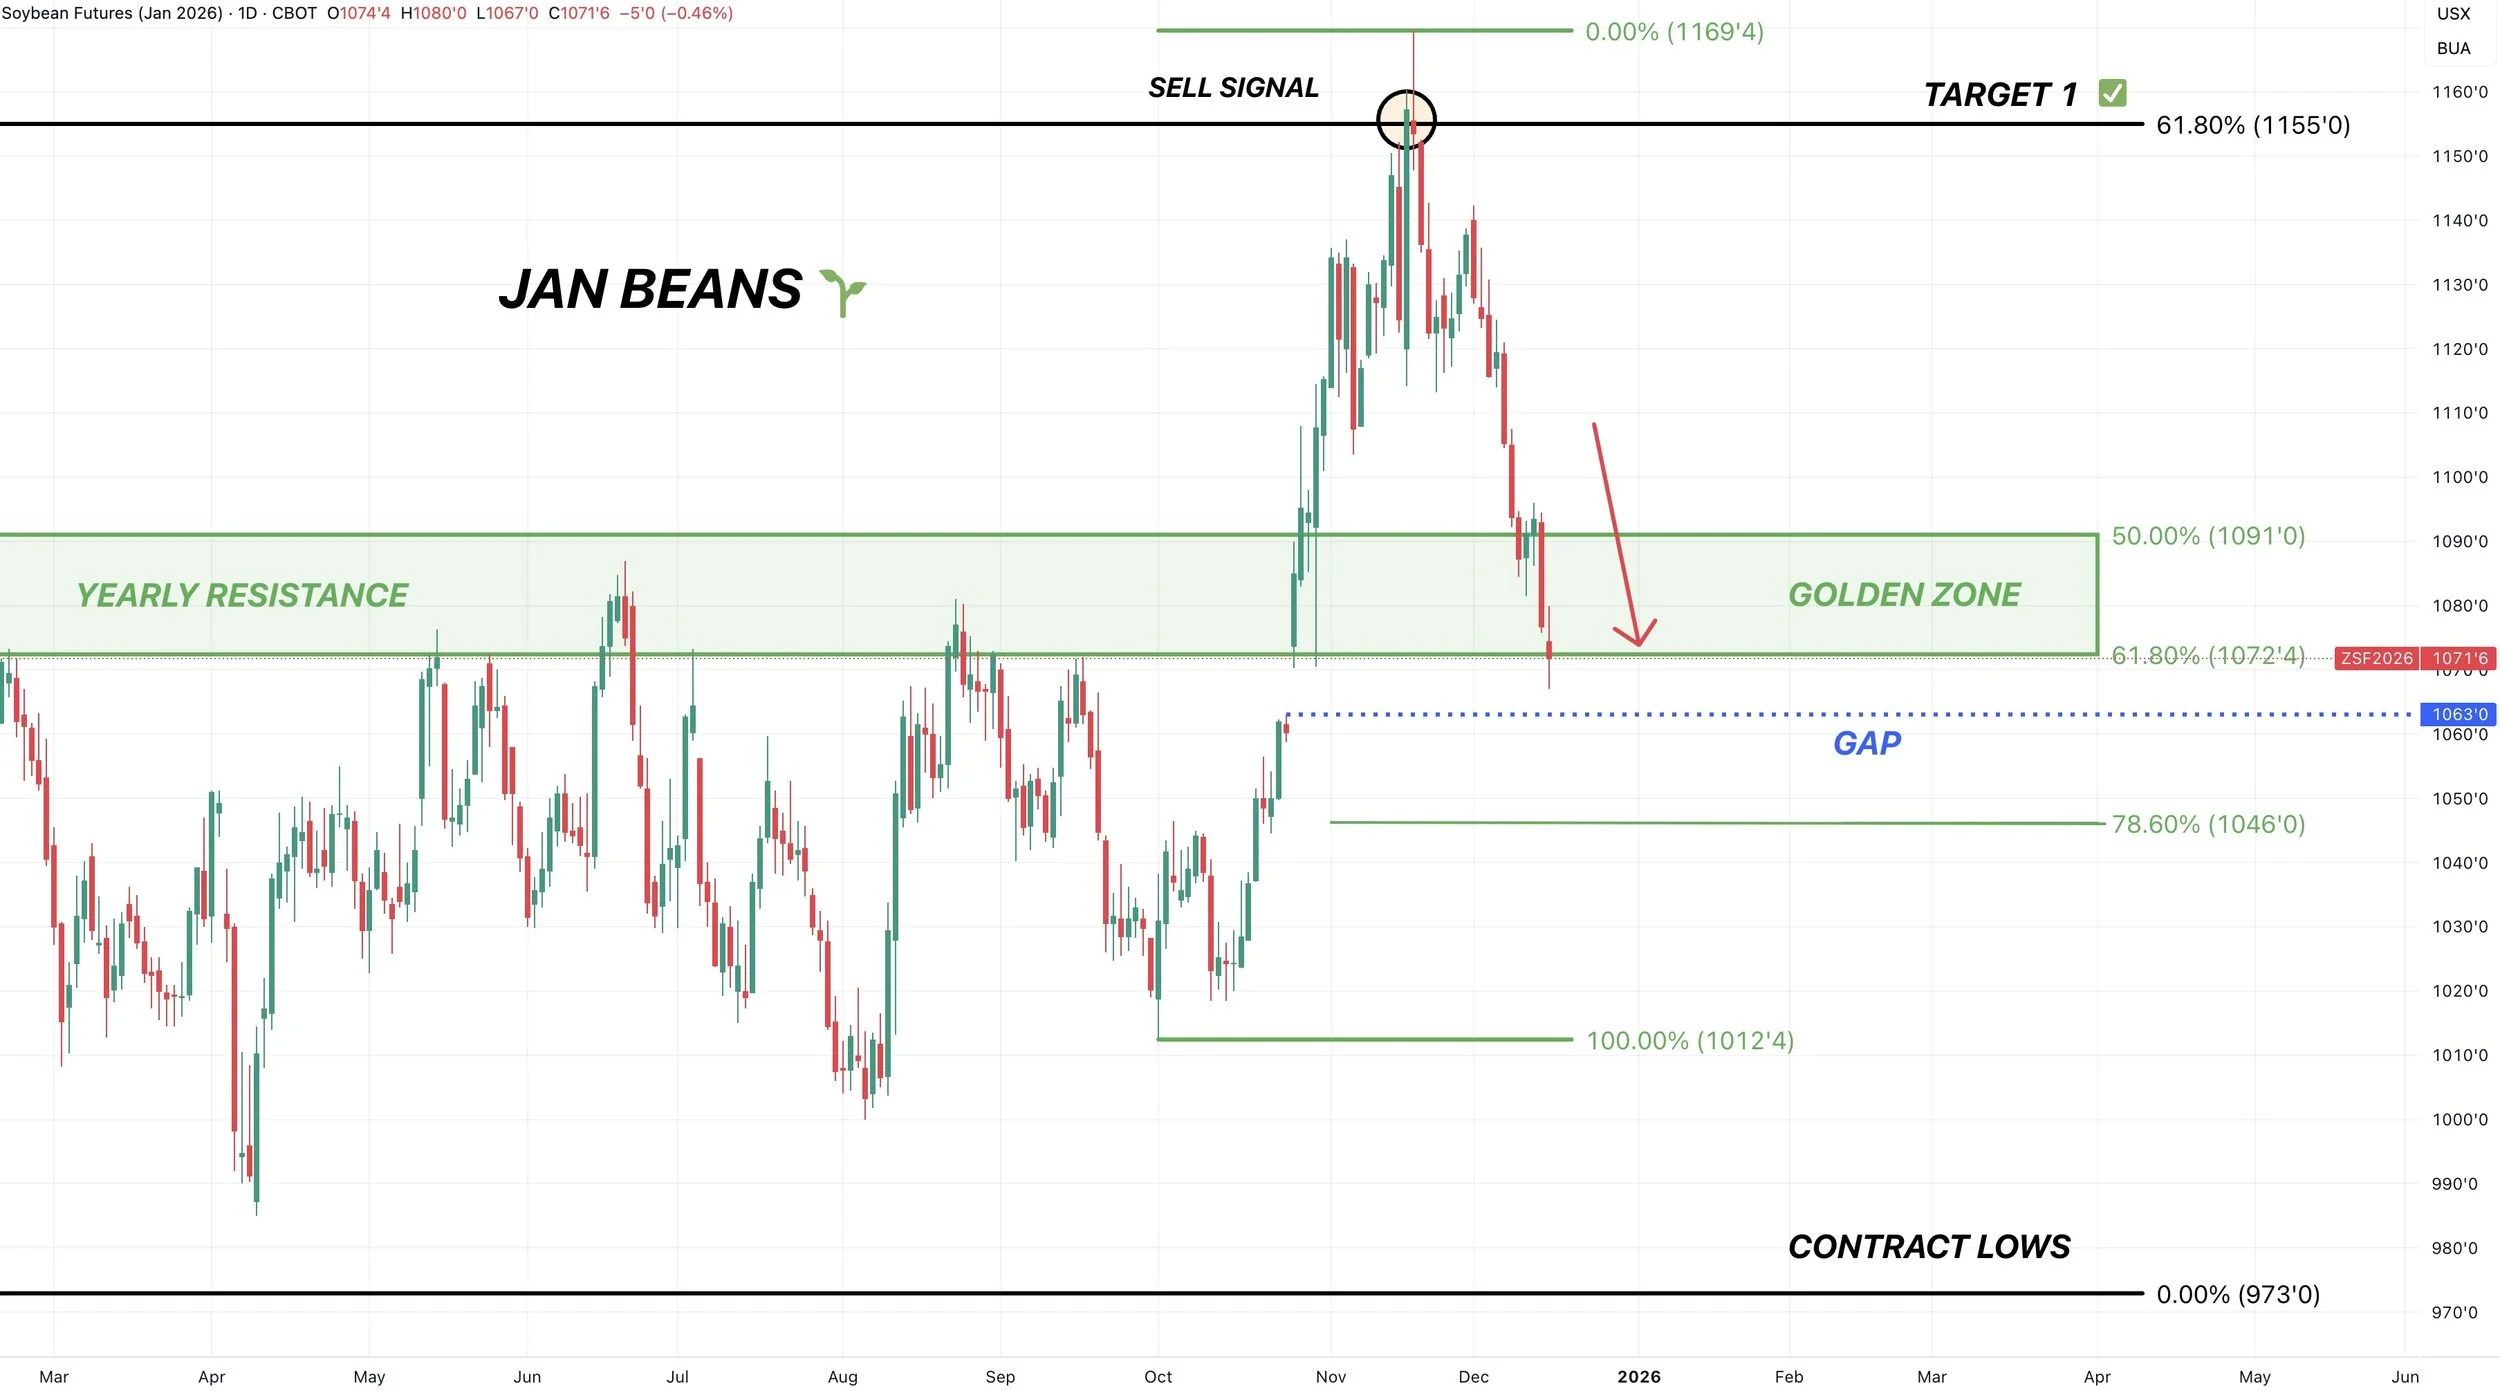
Here is another reason to believe we could possibly find a local bottom here soon.
We are showing potential hidden bullish RSI divergence.
Where the RSI is making lower lows, but prices are clearly higher than where they were the last time the RSI was this low.
Bearish divergence marked those highs. As prices were making higher highs, but the RSI was not.

March Wheat 🌾
Not looking to good here.
We broke below the 61.8% level of the contract lows, which was seen as a must hold spot.
The last line of defense we have is the 78.6% level. Otherwise it’s those contract lows.
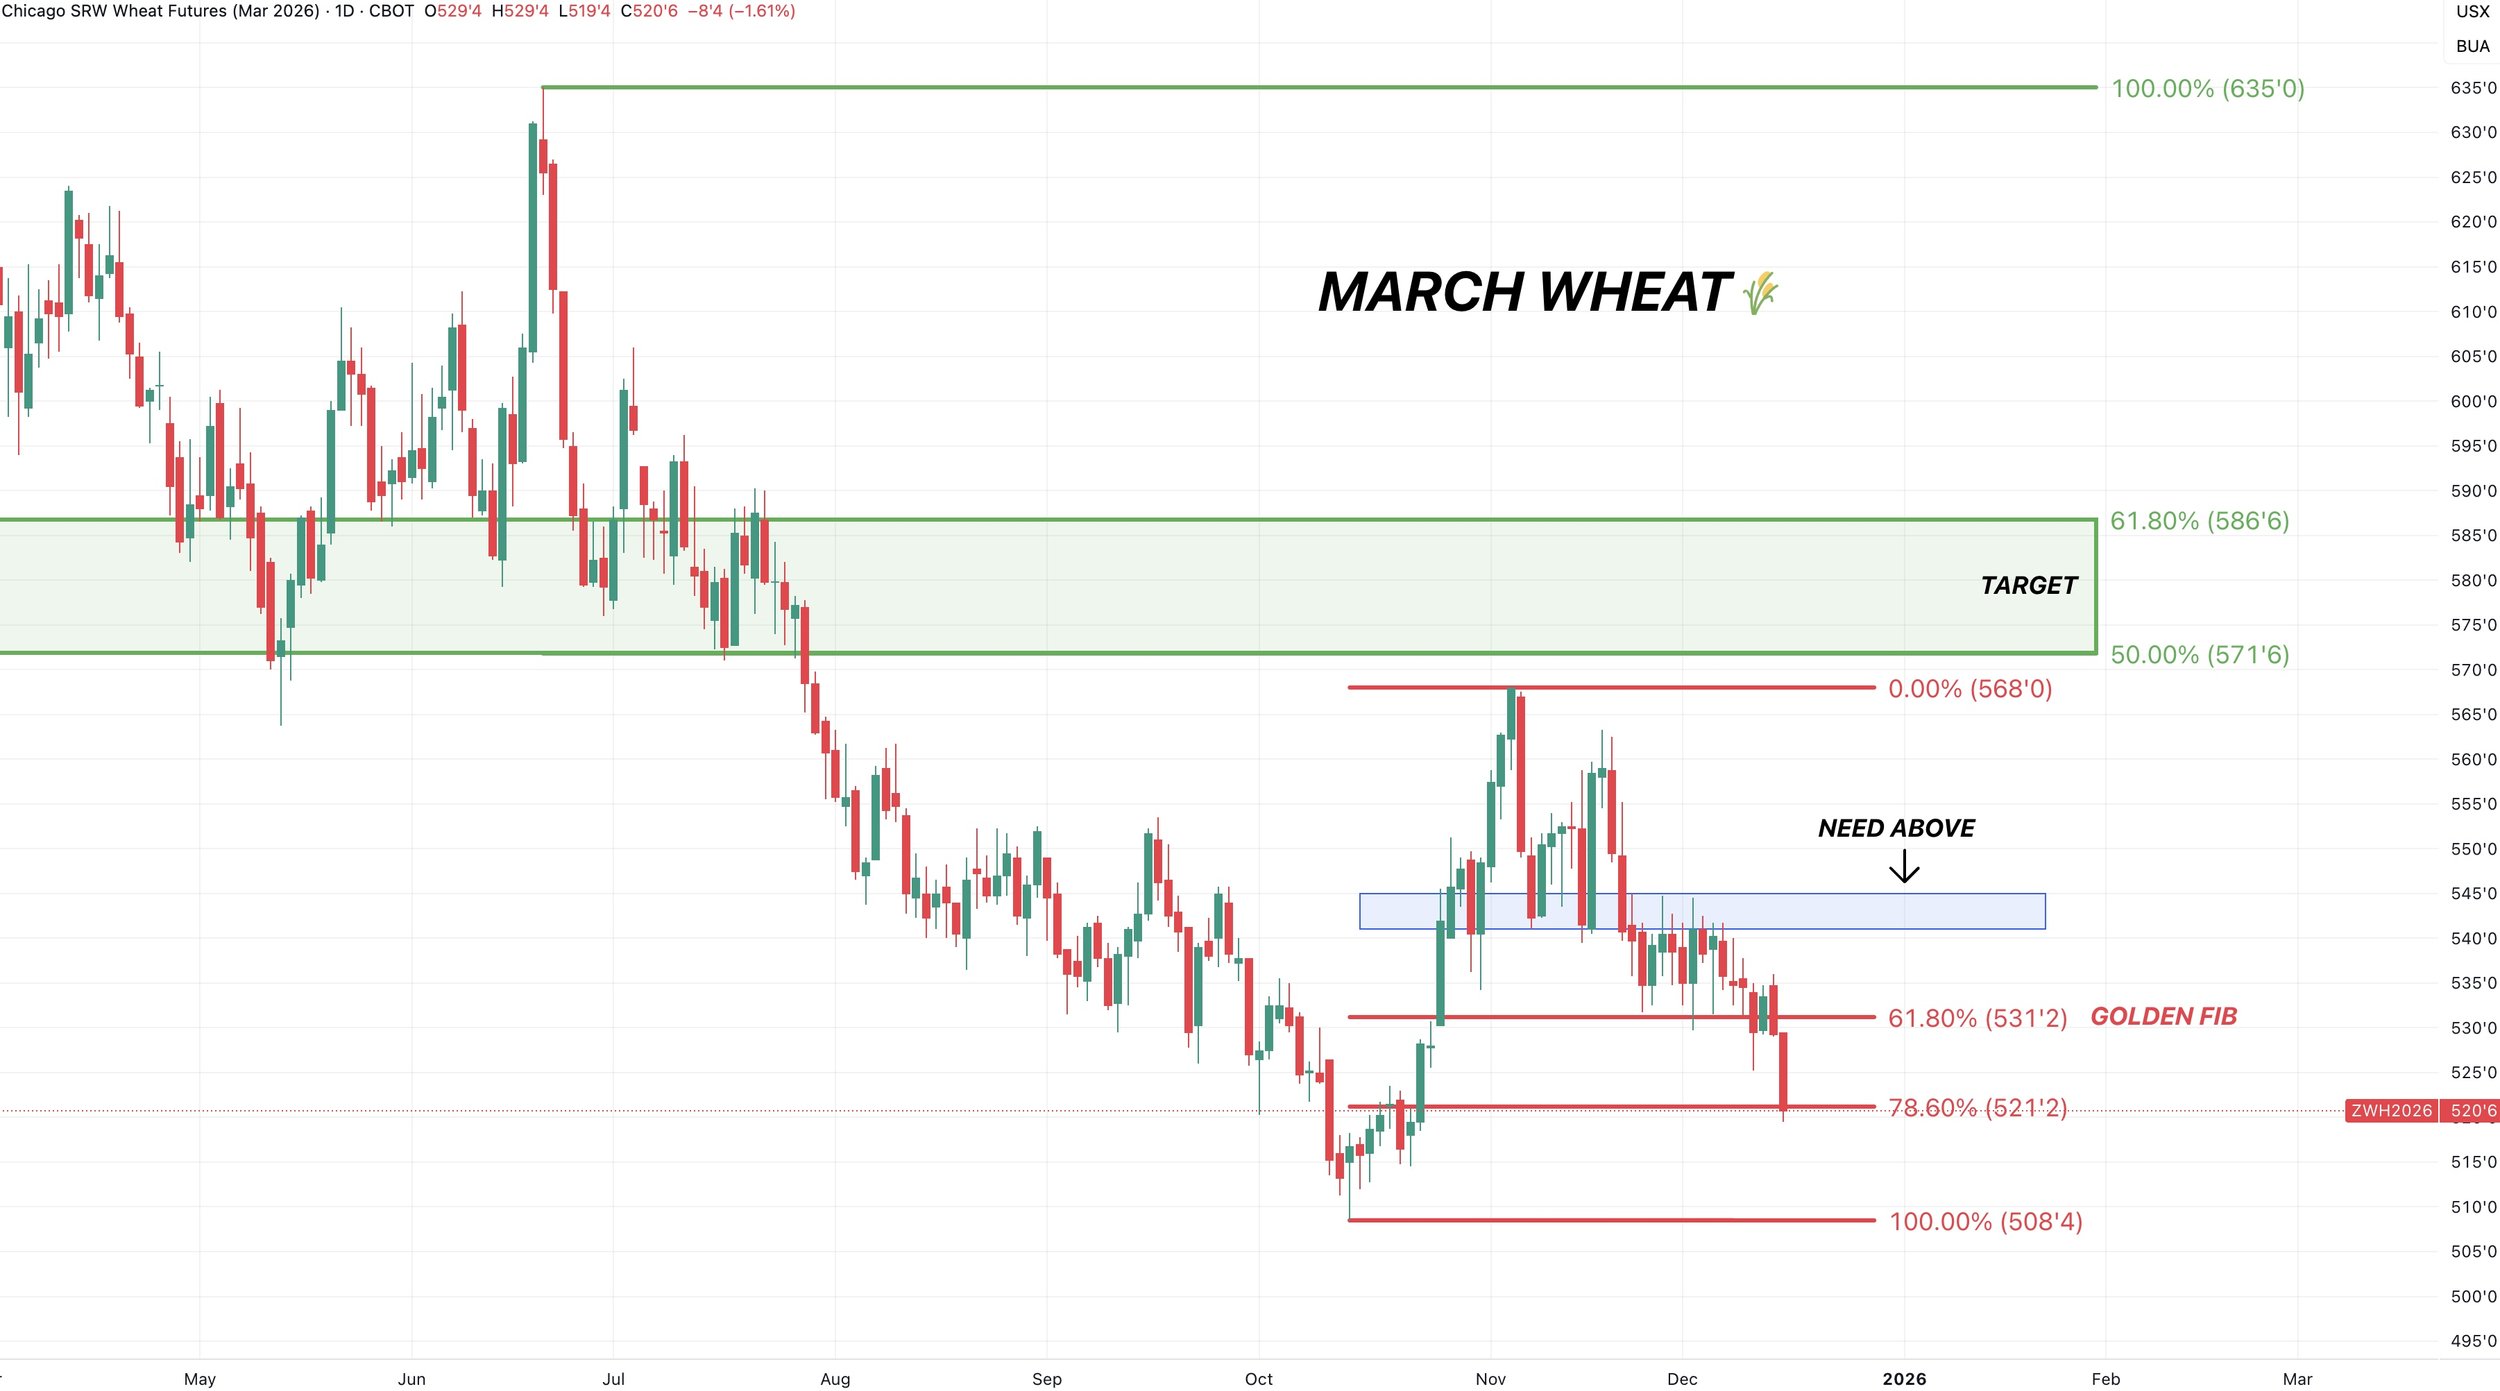
Jan Feeders 🐮
Both feeders & live cattle currently sitting in our target box and the golden zone.
This is where the market typically decides if this is just a correctional relief bounce or the start of a real rally.
This is where most relief bounced fail.
So this is viewed as a relief bounce unless we break above the green box and 61.8% level. If that happens, then often times it tells us this is not a relief bounce but something bigger.
I am still being very cautious that this was an exhaustion gap. We gapped higher after a big rally. We have now filled it in feeders.
Those type of gaps can often mark the end of a trend. Doesn’t have to. But it happening in the golden zone is all that more reason to be cautious.
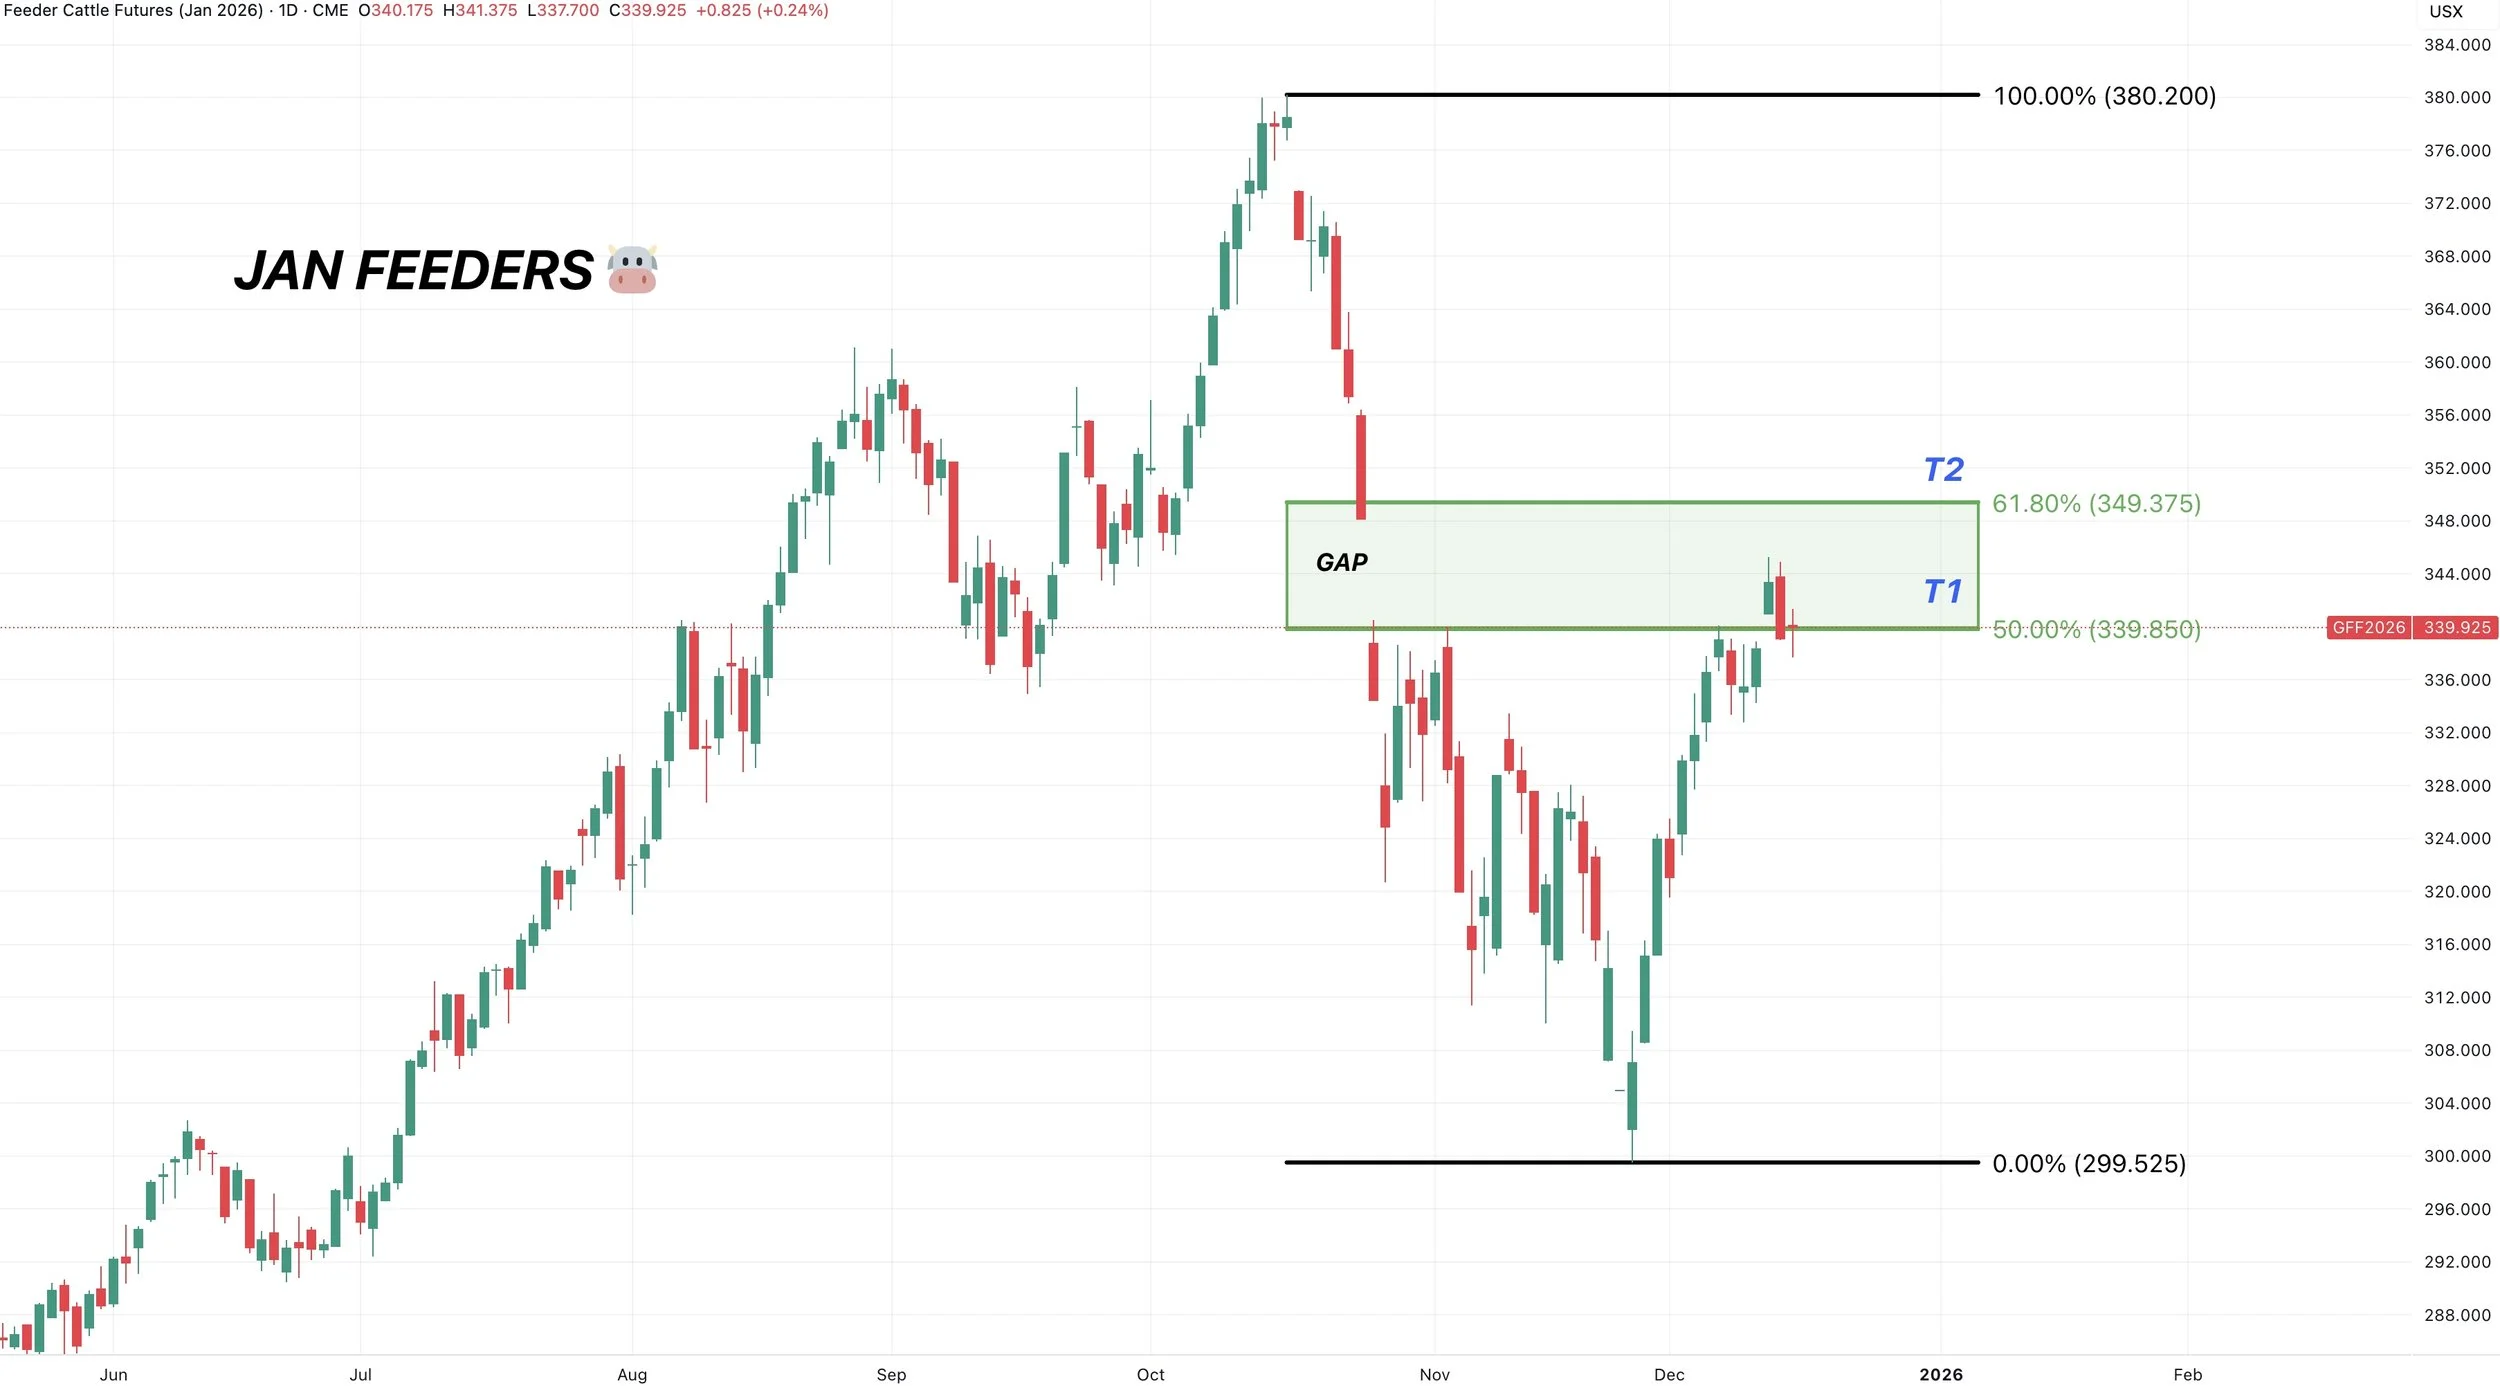
Past Sell or Protection Signals
Dec 11th: 🐮
Cattle sell signal & hedge alert.
Dec 5th: 🐮
Cattle sell signal & hedge alert.
Nov 17th: 🌱
Soybean sell signal & hedge alert.
Nov 13th: 🌽 🌱
Managing risk in corn & beans ahead of USDA report.
Oct 28th: 🌽
Corn sell signal & hedge alert.
Oct 27th: 🌱
Soybean sell signal & hedge alert.
Oct 13th: 🐮
Cattle sell signal & hedge alert.
Aug 22nd: 🌱
Soybean sell signal & hedge alert.
July 31st: 🐮
Cattle sell signal & hedge alert.
July 10th: 🐮
Cattle sell signal & hedge alert.
CLICK HERE TO VIEW
June 5th: 🐮
Cattle sell signal & hedge alert.
June 2nd: 🌾
MPLS wheat sell signal.
April 10th: 🌽
Old crop corn sell signal.
March 19th: 🐮
Cattle hedge & sell signal.
Feb 18th: 🌽 🌾
Old crop KC wheat & old crop corn signal.
Jan 23rd: 🌽 🌱
Corn & beans old crop sell signal.
CLICK HERE TO VIEW
Jan 15th: 🌽 🌱
Corn & beans hedge alert/sell signal.
Jan 2nd: 🐮
Cattle hedge alert at new all-time highs & target.
Dec 11th: 🌽
Corn sell signal at $4.51 200-day MA
CLICK HERE TO VIEW
Oct 2nd: 🌾
Wheat sell signal at $6.12 target
Sep 30th: 🌽
Corn protection signal at $4.23-26
Sep 27th: 🌱
Soybean sell & protection signal at $10.65
Sep 13th: 🌾
Wheat sell signal at $5.98
May 22nd: 🌾
Wheat sell signal when wheat traded +$7.00
Want to Talk?
Our phones are open 24/7 for you guys if you ever need anything or want to discuss your operation.
Hedge Account
Interested in a hedge account? Use the link below to set up an account or shoot Jeremey a call at (605)295-3100.
WHAT NEEDS TO HAPPEN FOR HIGHER PRICES?
AUDIO COMMENTARY
What needs to happen for higher beans
Funds need a reason to get behind this
Beans near golden fib (chart below)*
Could the aid help basis?
We’ve created massive demand in corn
When to NOT use basis contracts
Lot of unknown business to corn
Making sales that make sense
SA crop isn’t having big issues
Options strategy that “could” be a home run IF we repeat last year’s price action in corn
Puts are cheap if you need protection
Being proactive when you want to. Not when you have to
Exhaustion gap in cattle? (chart below)*
All chart breakdowns below audio*
Listen to today’s audio below
Want to talk? (605)250-3863
Your trial has ended
Don’t miss our next sell signal
Take advantage of our holiday sale
CHARTS
Jan Beans 🌱
Getting close to that downside target.
The 61.8% retracement of the entire rally.
This is where the market usually decides if this is a correction or if we truly falling apart.
Pretty big spot to hold. If we break below, it usually indicates we are not in some simple correction before heading higher. Meaning further downside could be ahead. If we bounce here, it tells us the uptrend is still in tact.
It also happens to be outryearly resistance.
We do not have to fill the gap, but it is possible.
Only 35% of breakaway gaps fill compared to 80-90% of normal gaps.

Here is the weekly chart to give you another perspective.
The 61.8% level and yearly resistance are at the same level.
We were trapped in a range for over a year.
We broke out. We are now retesting that point of break out.
If we break below this 61.8% level, we break back into that old range. Which would be viewed as a potential failed breakout.
So ideally we hold it, or we could go back into that brutal range.
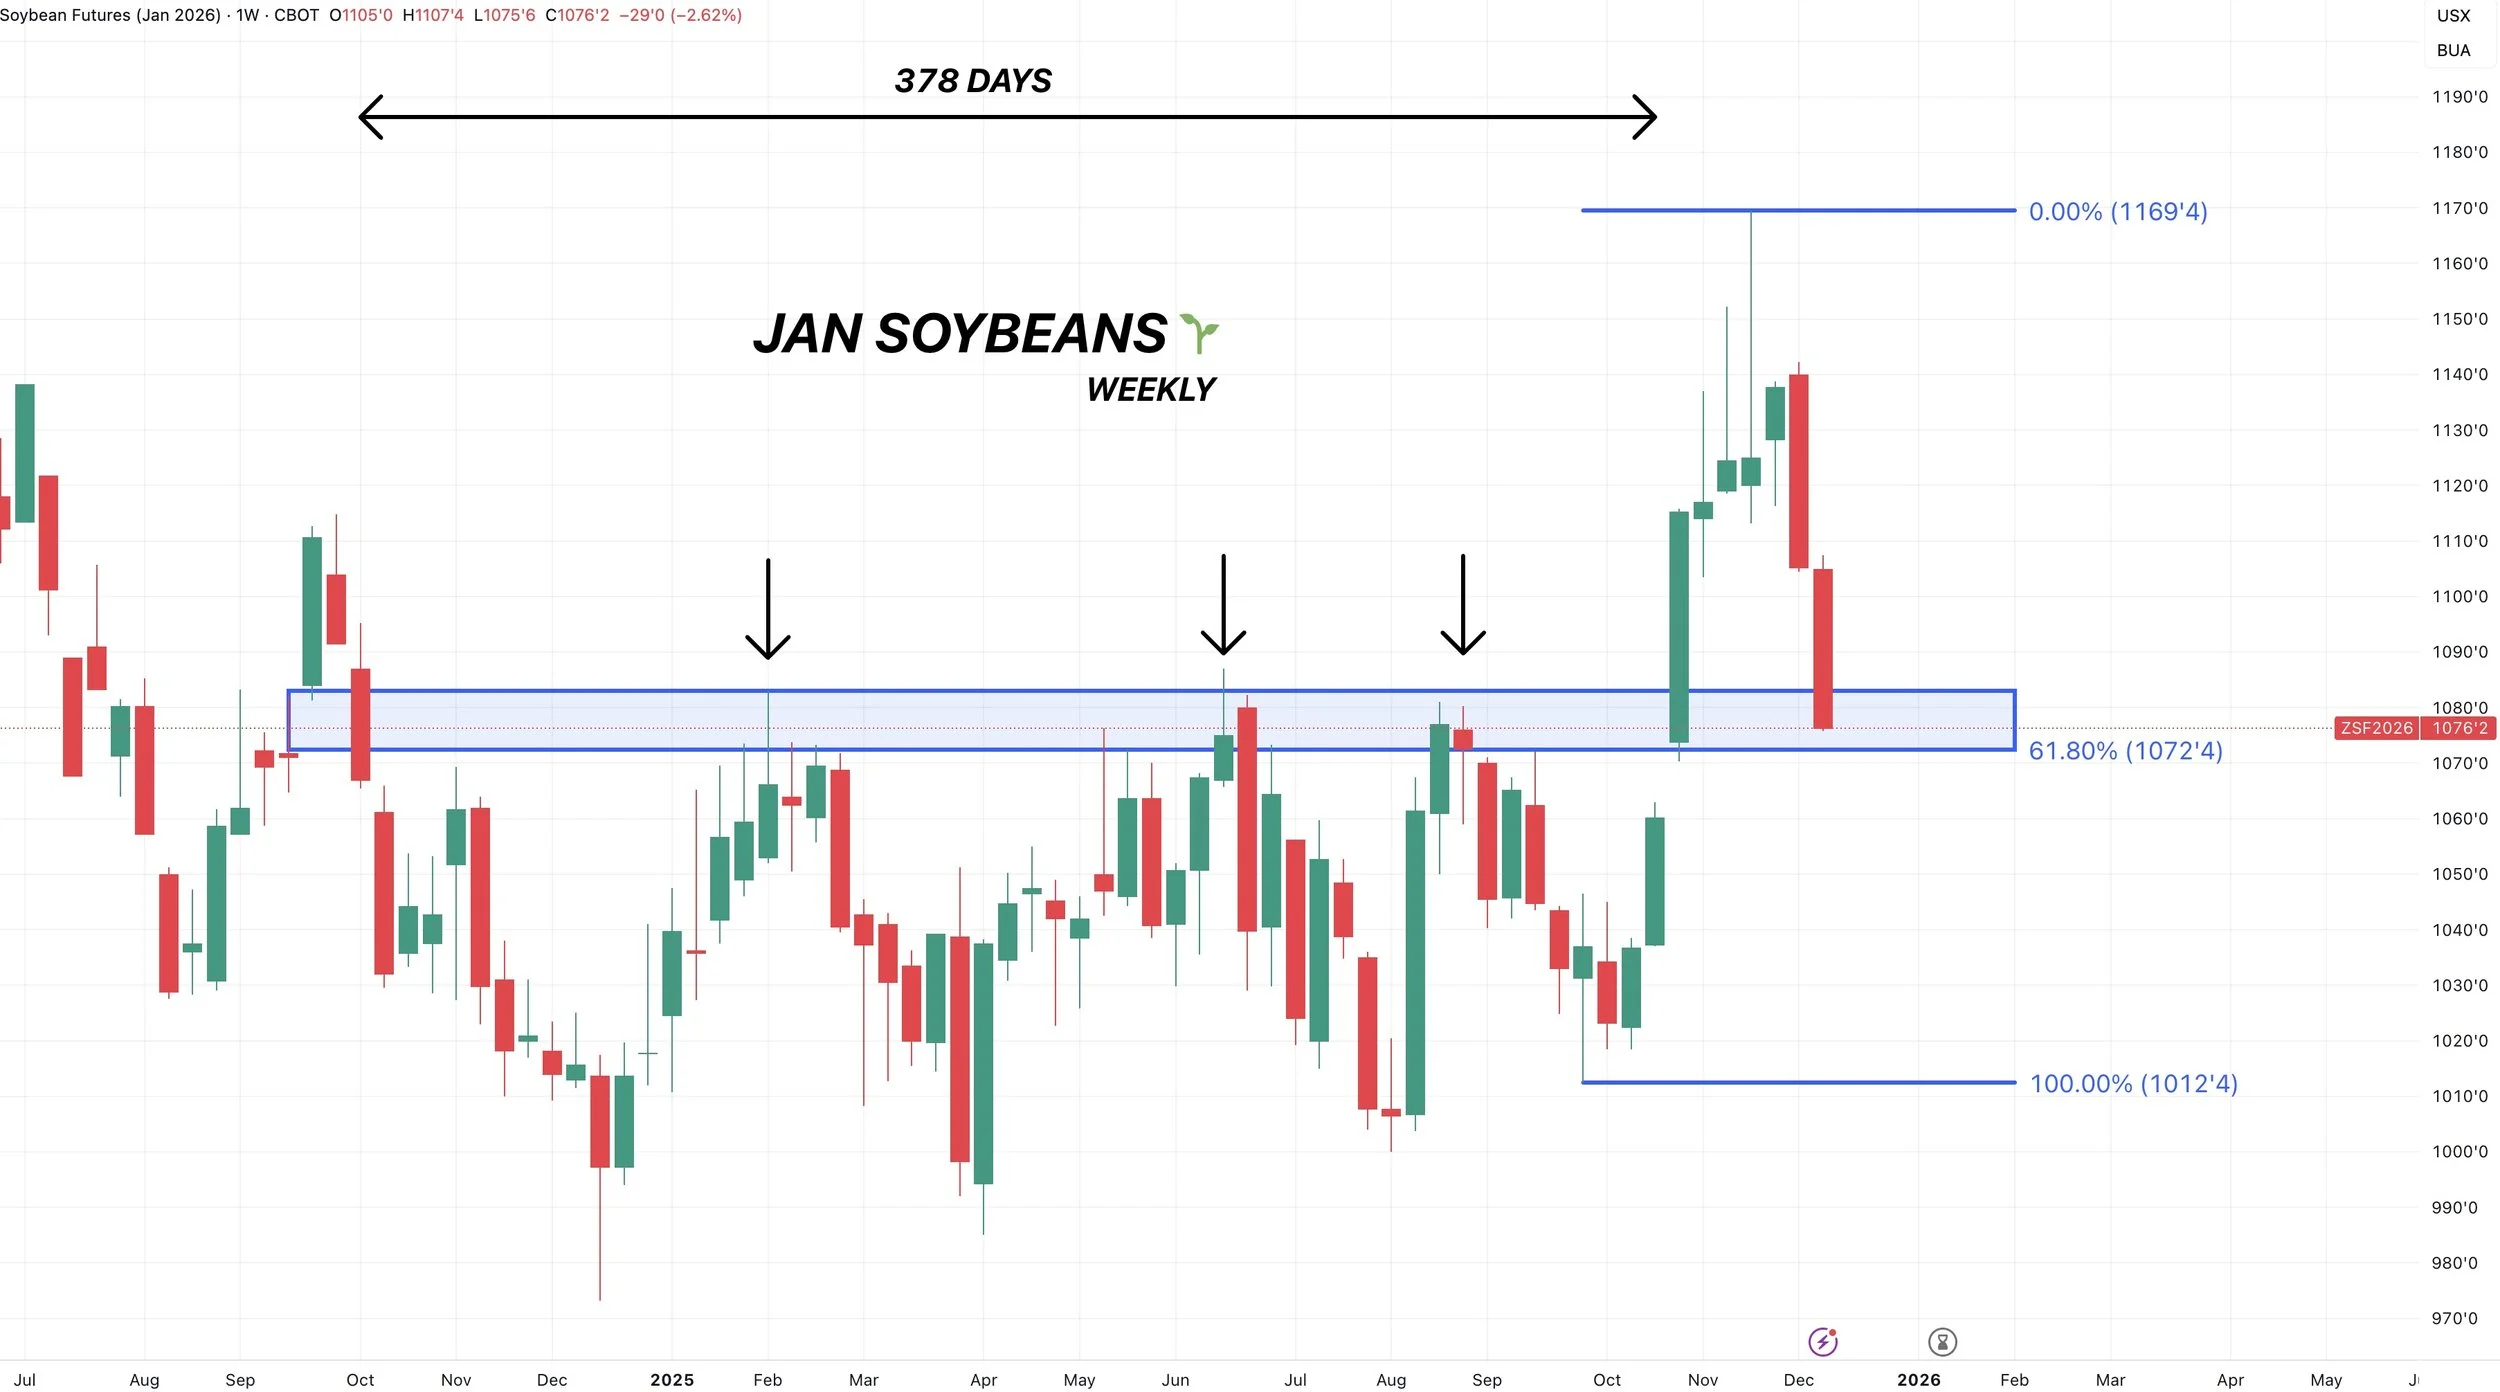
Jan Feeders 🐮
We are in the golden zone.
This is where relief bounces often fail.
If we were to take out that 61.8% level, it usually tells us that this is not a relief bounce and is the start of something bigger. But for now, this is viewed as a relief bounce. Hence our sell signal yesterday.
We also had a potential “exhaustion gap” yesterday.
There are 3 types of gaps.
Normal gaps:
The every day ones.
Break away gaps:
A break away gap is a gap that breaks out of a range and resistance. A very bullish type of gap. What we saw in soybeans.
Exhaustion gaps:
They occur after a big move and at the end of a trend. Oftentimes they can mark the tops or bottoms. As it happens late in trends. Basically it is viewed as the last burst of energy before the momentum fades.
This could very possibly be what we are seeing here. However, we have not yet filled that gap. Typically, you need the gap to be filled to get confirmation this is an exhaustion gap.
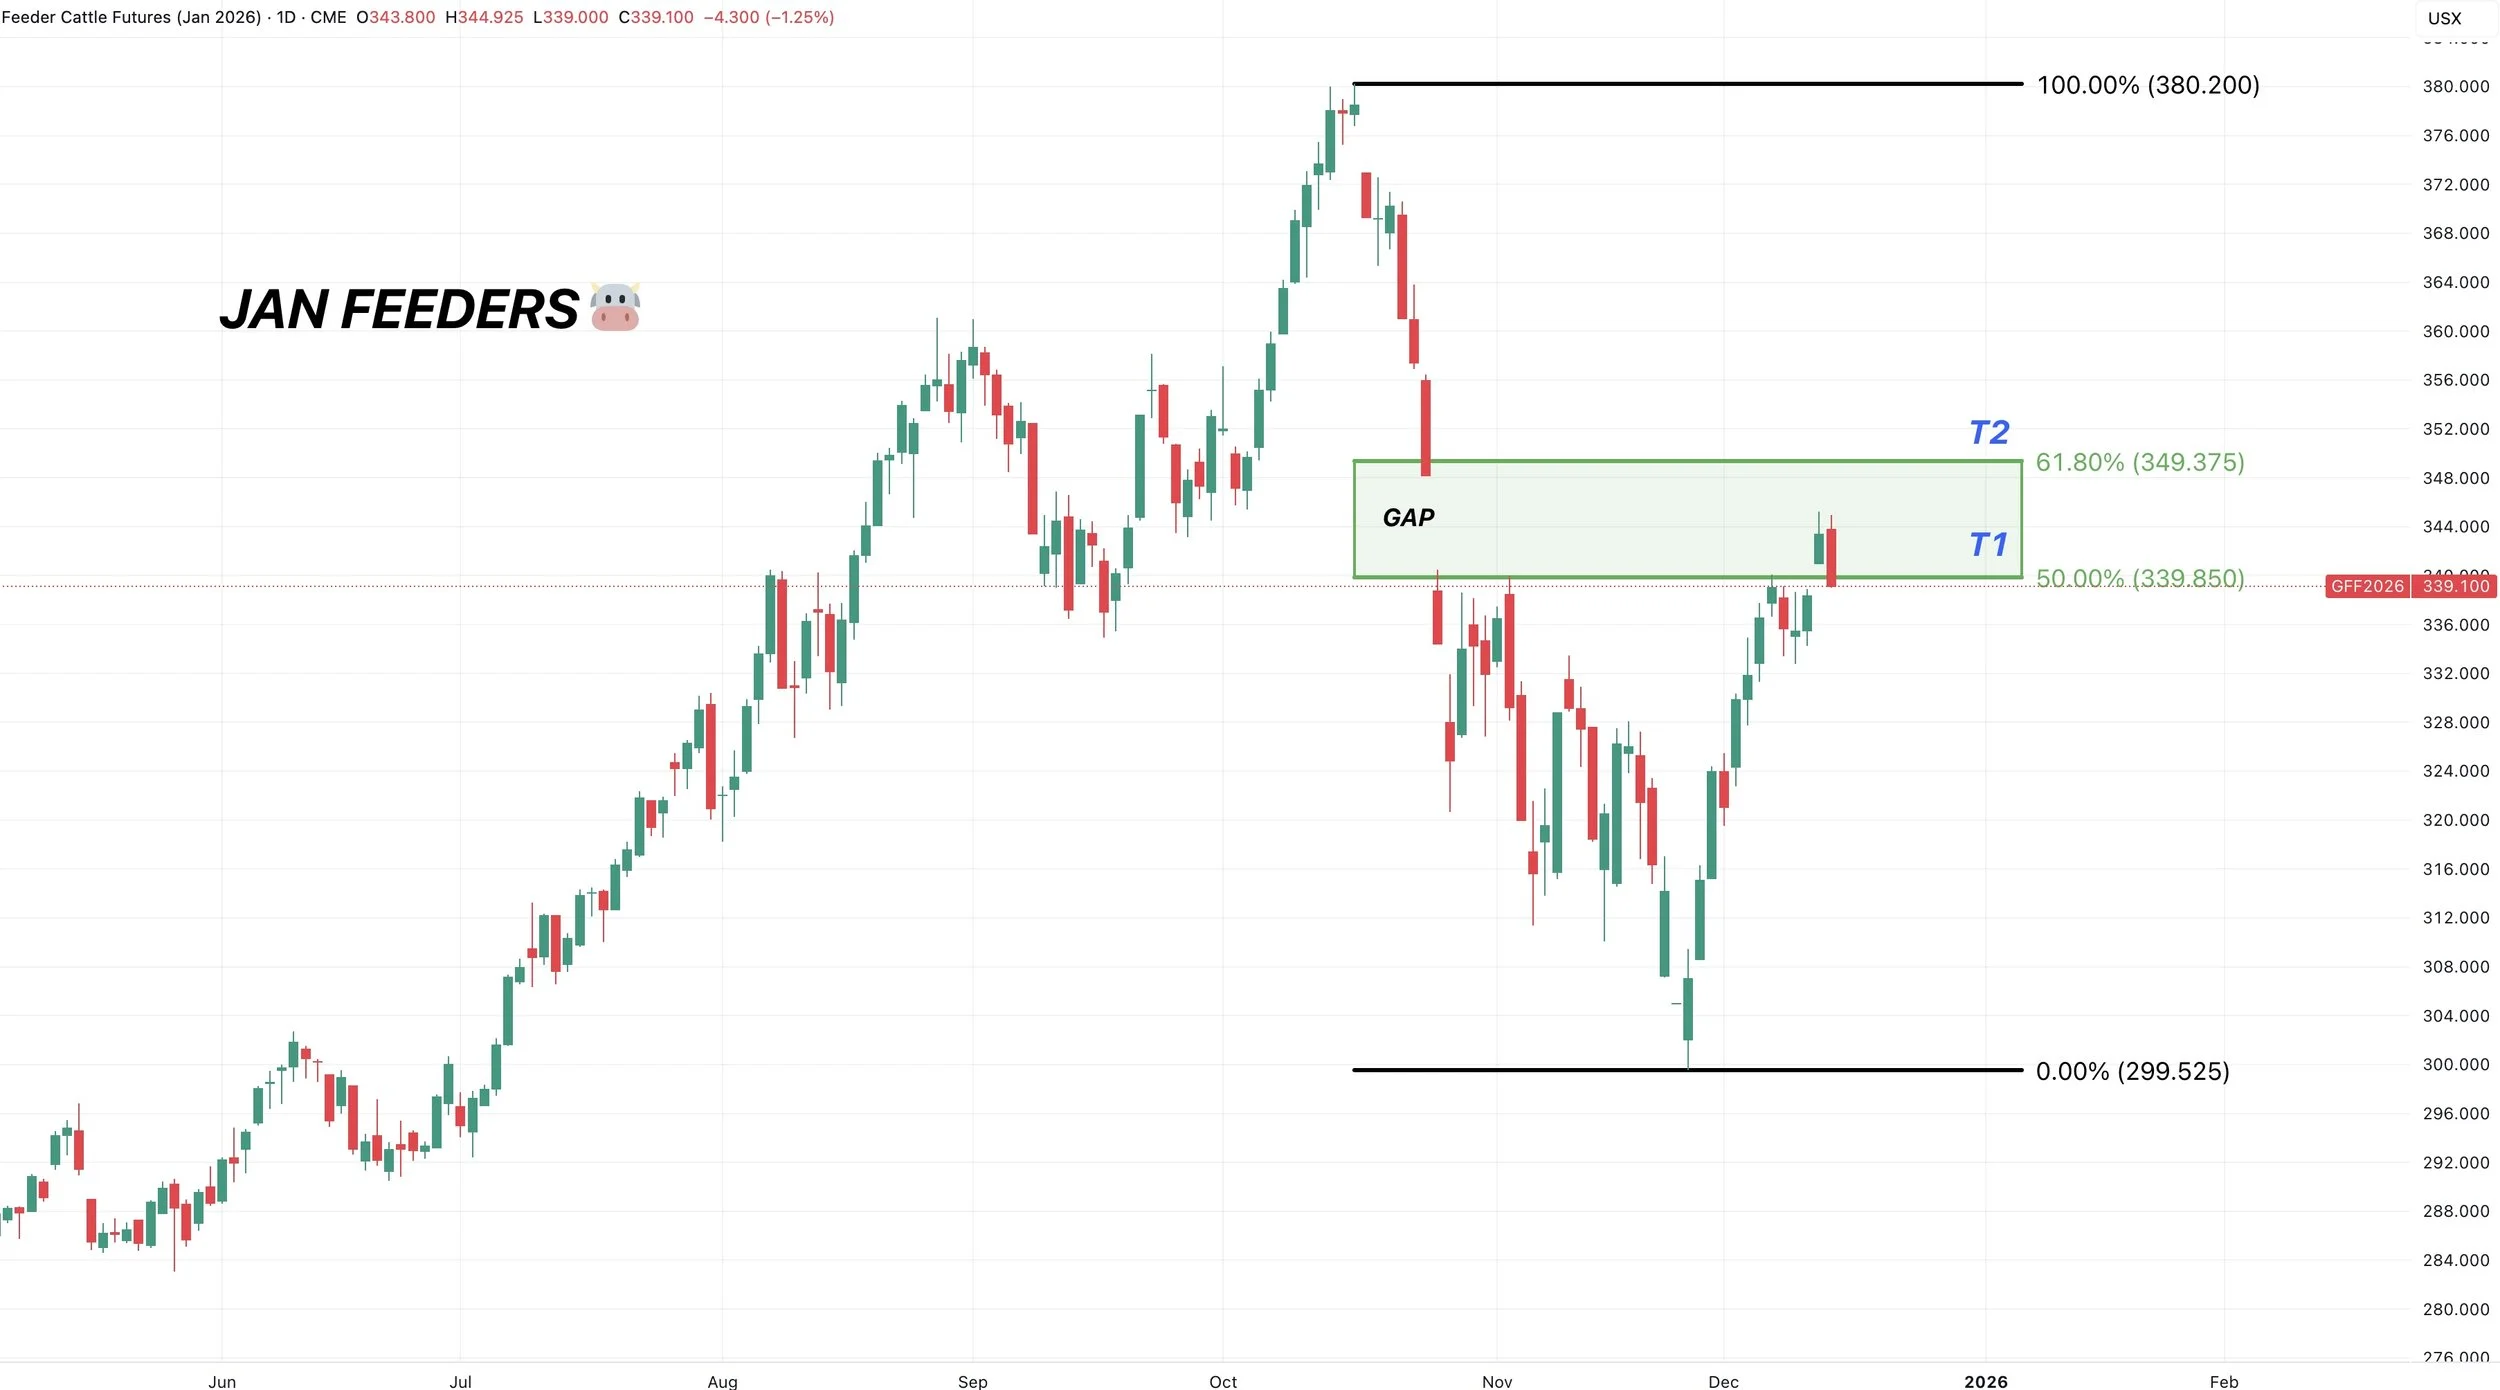
Feb Live 🐮
Looks just like feeders.
We are in the golden zone.
If we fill that gap, it could possibly be an exhaustion gap.
Something to be cautious of up here.
If we take the 61.8% level out, it often indicates this is no longer just a relief bounce.
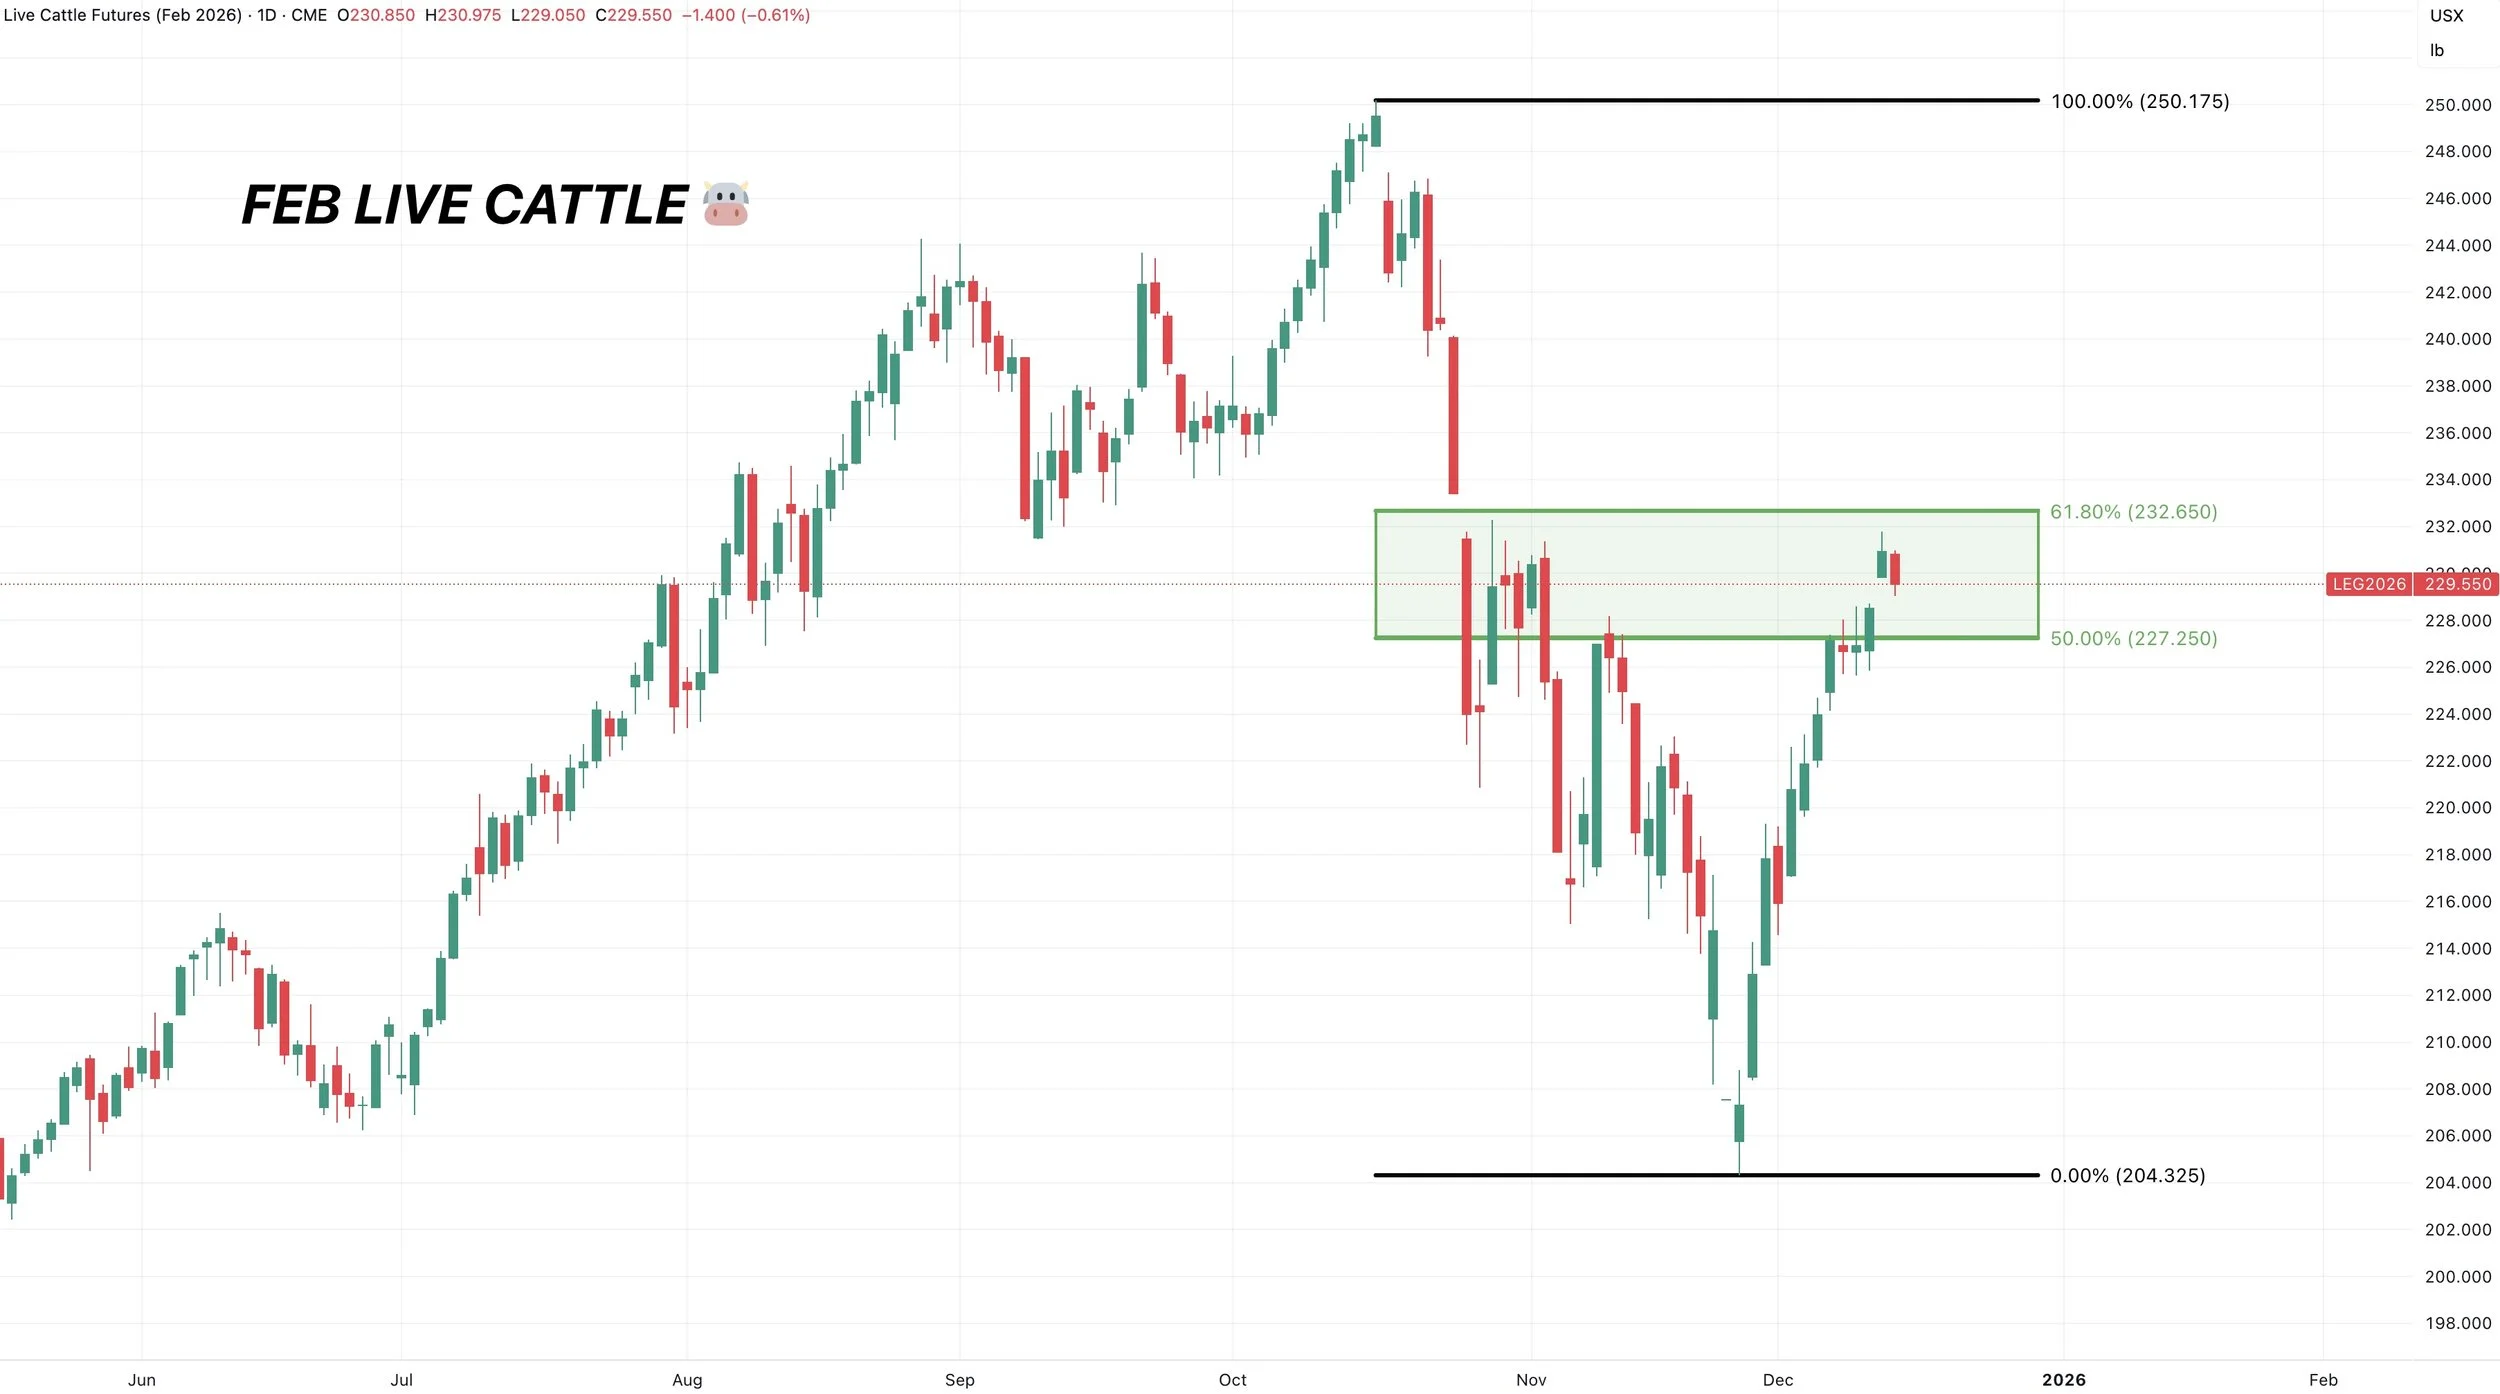
March Corn 🌽
We are in an uptrend until we break below that red box.
If we break below the red box, we probably revist that orange box area.
The red box is 50-61.8% of this rally from Oct. The most common spot for a correction to end.
To the upside, we need to clear $4.50 to see more upside. It’s been clear resistance for several reasons we’ve talked about.

March KC Wheat 🌾
Sitting right at the 61.8% level. The golden fib.
We closed below it today by a hair. If we get back to back days below it, it probably signals we are headed lower.
Pretty much a must hold spot.
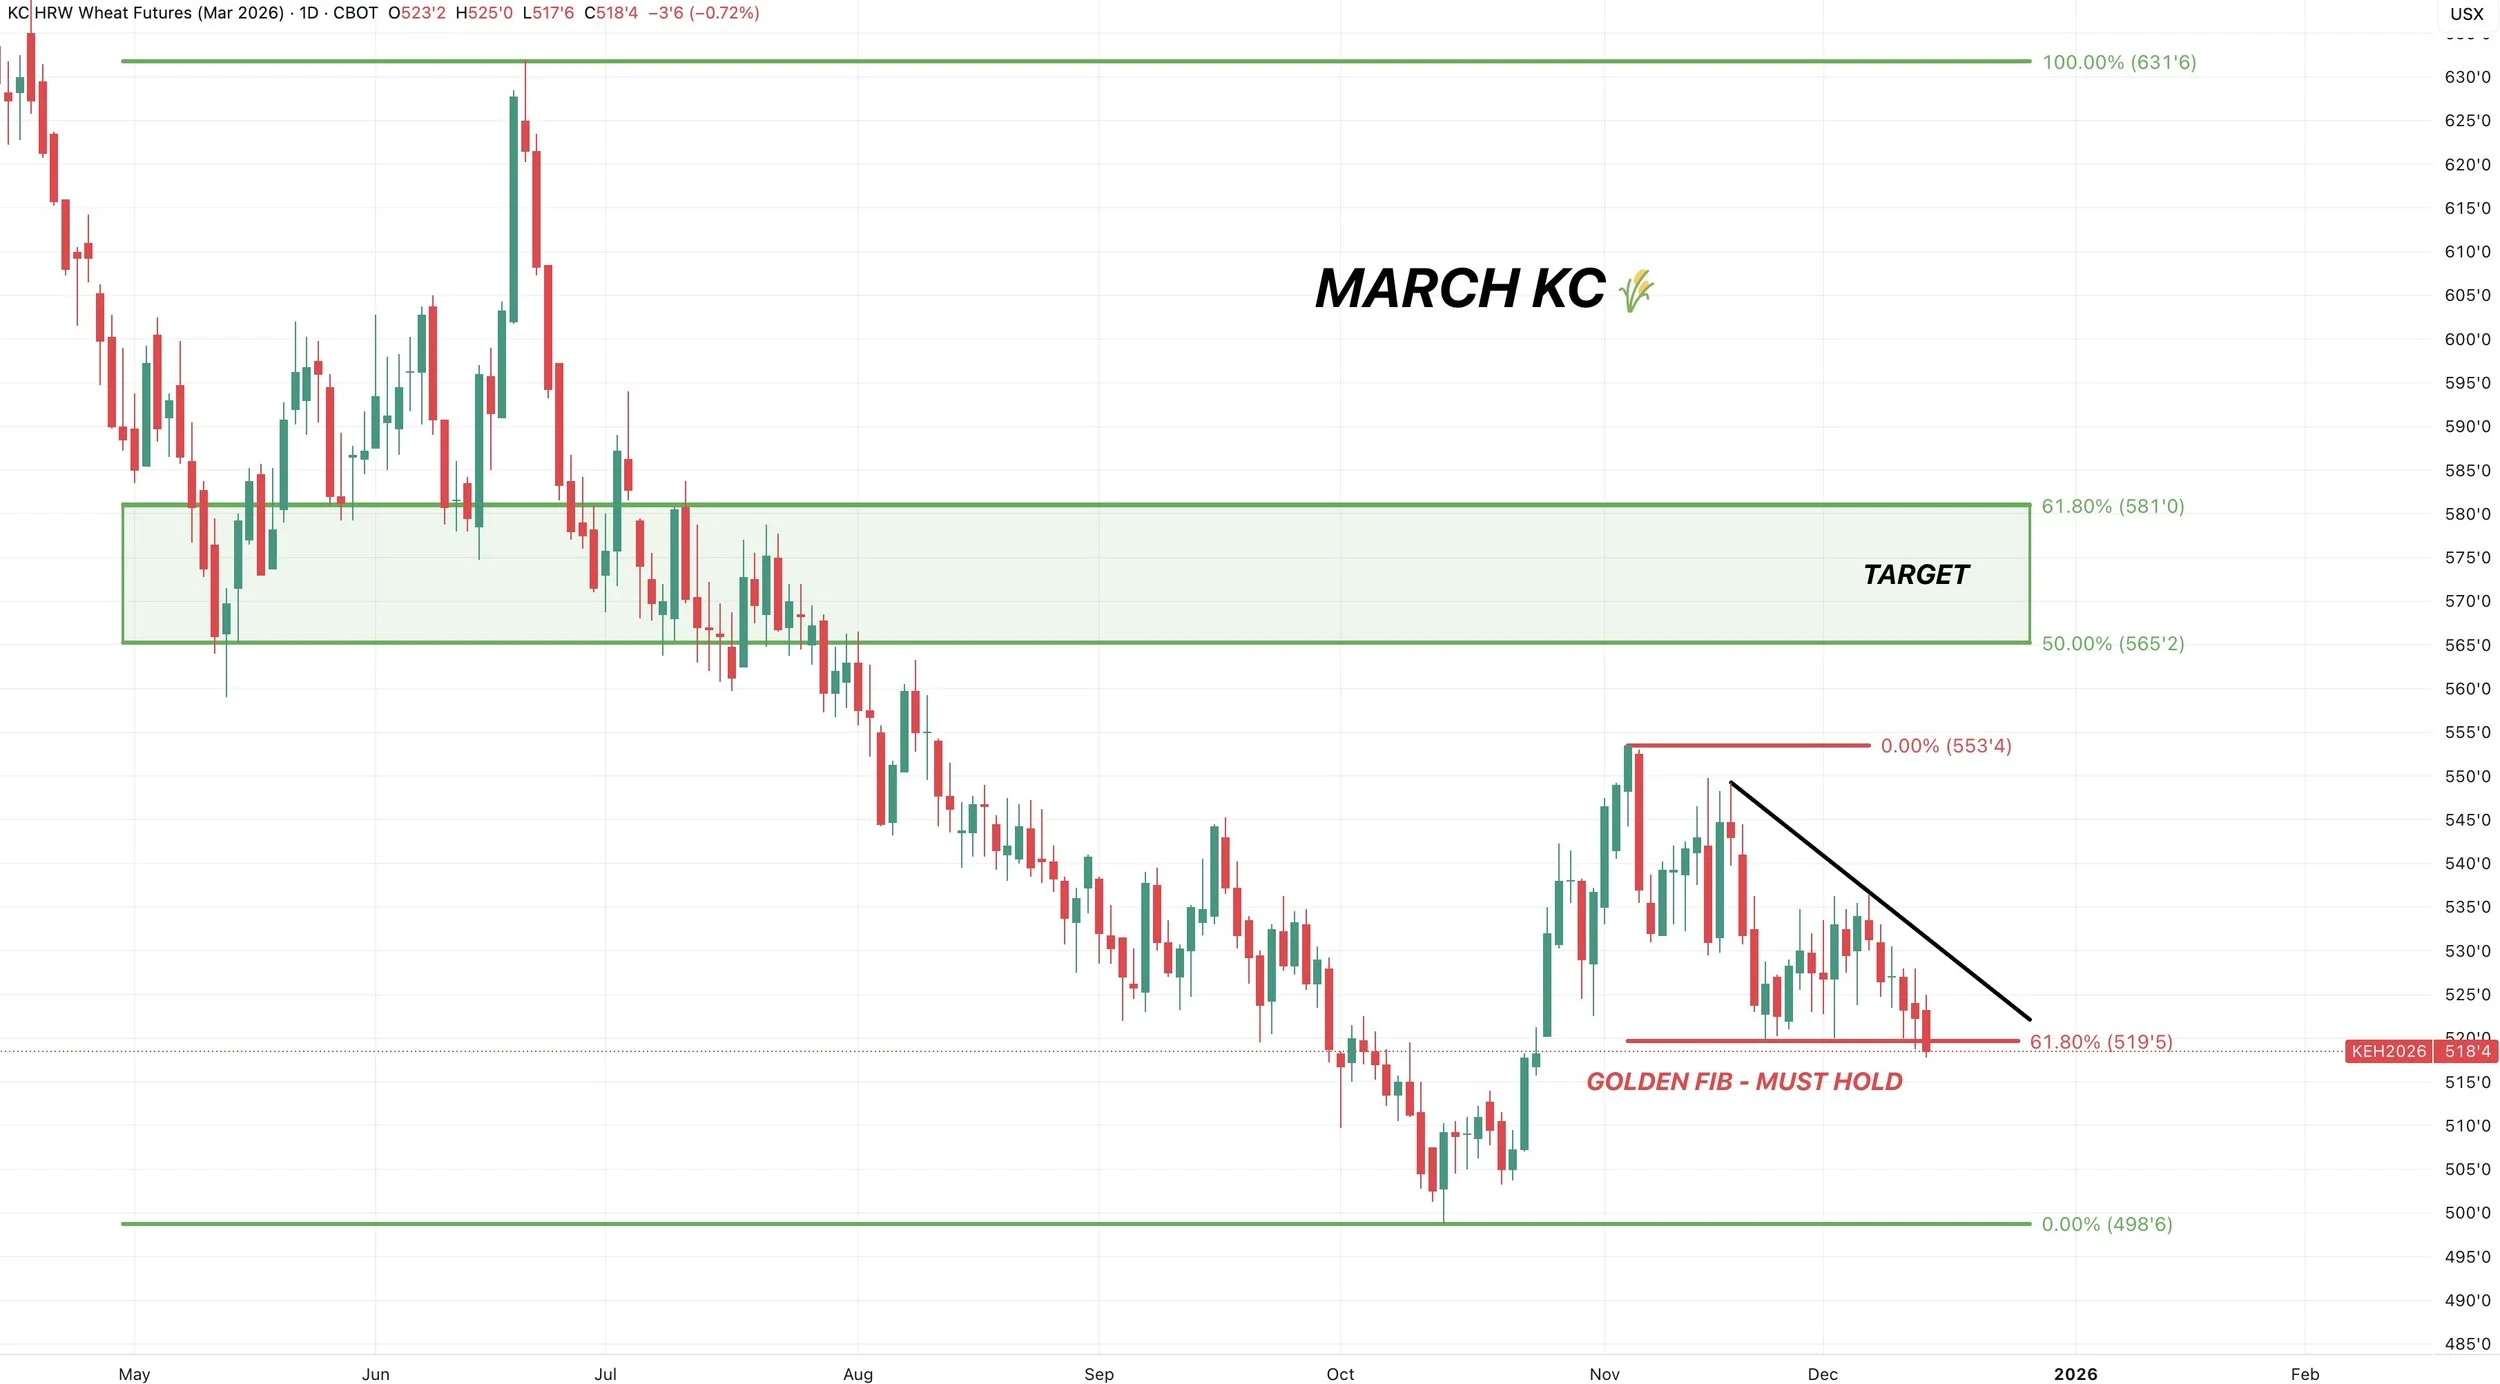
Past Sell or Protection Signals
Dec 11th: 🐮
Cattle sell signal & hedge alert.
Dec 5th: 🐮
Cattle sell signal & hedge alert.
Nov 17th: 🌱
Soybean sell signal & hedge alert.
Nov 13th: 🌽 🌱
Managing risk in corn & beans ahead of USDA report.
Oct 28th: 🌽
Corn sell signal & hedge alert.
Oct 27th: 🌱
Soybean sell signal & hedge alert.
Oct 13th: 🐮
Cattle sell signal & hedge alert.
Aug 22nd: 🌱
Soybean sell signal & hedge alert.
July 31st: 🐮
Cattle sell signal & hedge alert.
July 10th: 🐮
Cattle sell signal & hedge alert.
CLICK HERE TO VIEW
June 5th: 🐮
Cattle sell signal & hedge alert.
June 2nd: 🌾
MPLS wheat sell signal.
April 10th: 🌽
Old crop corn sell signal.
March 19th: 🐮
Cattle hedge & sell signal.
Feb 18th: 🌽 🌾
Old crop KC wheat & old crop corn signal.
Jan 23rd: 🌽 🌱
Corn & beans old crop sell signal.
CLICK HERE TO VIEW
Jan 15th: 🌽 🌱
Corn & beans hedge alert/sell signal.
Jan 2nd: 🐮
Cattle hedge alert at new all-time highs & target.
Dec 11th: 🌽
Corn sell signal at $4.51 200-day MA
CLICK HERE TO VIEW
Oct 2nd: 🌾
Wheat sell signal at $6.12 target
Sep 30th: 🌽
Corn protection signal at $4.23-26
Sep 27th: 🌱
Soybean sell & protection signal at $10.65
Sep 13th: 🌾
Wheat sell signal at $5.98
May 22nd: 🌾
Wheat sell signal when wheat traded +$7.00
Want to Talk?
Our phones are open 24/7 for you guys if you ever need anything or want to discuss your operation.
Hedge Account
Interested in a hedge account? Use the link below to set up an account or shoot Jeremey a call at (605)295-3100.
WORLD VS US SITUATIONS
MARKET UPDATE
You can scroll to read the usual update as well. As the written version is the exact same as the video.
Timestamps for video:
News: 0:00min
World vs US: 3:30min
Corn: 6:10min
Beans: 11:20min
Wheat: 13:30min
Cattle: 14:45min
Want to talk about your situation?
(605)250-3863
Your free trial has ended
Don’t miss future updates or signals
Here is extended access to our Black Friday sale
Futures Prices Close

Overview
Grains mostly higher, while the cattle market showed some strength gapping higher on the open.
Today we did issue another cattle hedge alert, so check that out if you haven’t.
Click Here for Signal
Funds "Were" Near Record Long Beans
Overall there hasn’t been any major pieces of news.
We're still getting the backlog of data from the government such as export sales and the funds positions.
The most recent funds data we received yesterday showed the funds were at near record long levels in the soybean market back on the November 10th data.
As they were long 195k contracts. Just shy of the record in 2020.
Clearly they've now backed off of that position.
The CTFC orginally planned to be caught up with the positions in January. They announced they will now be caught up by the end of the year.
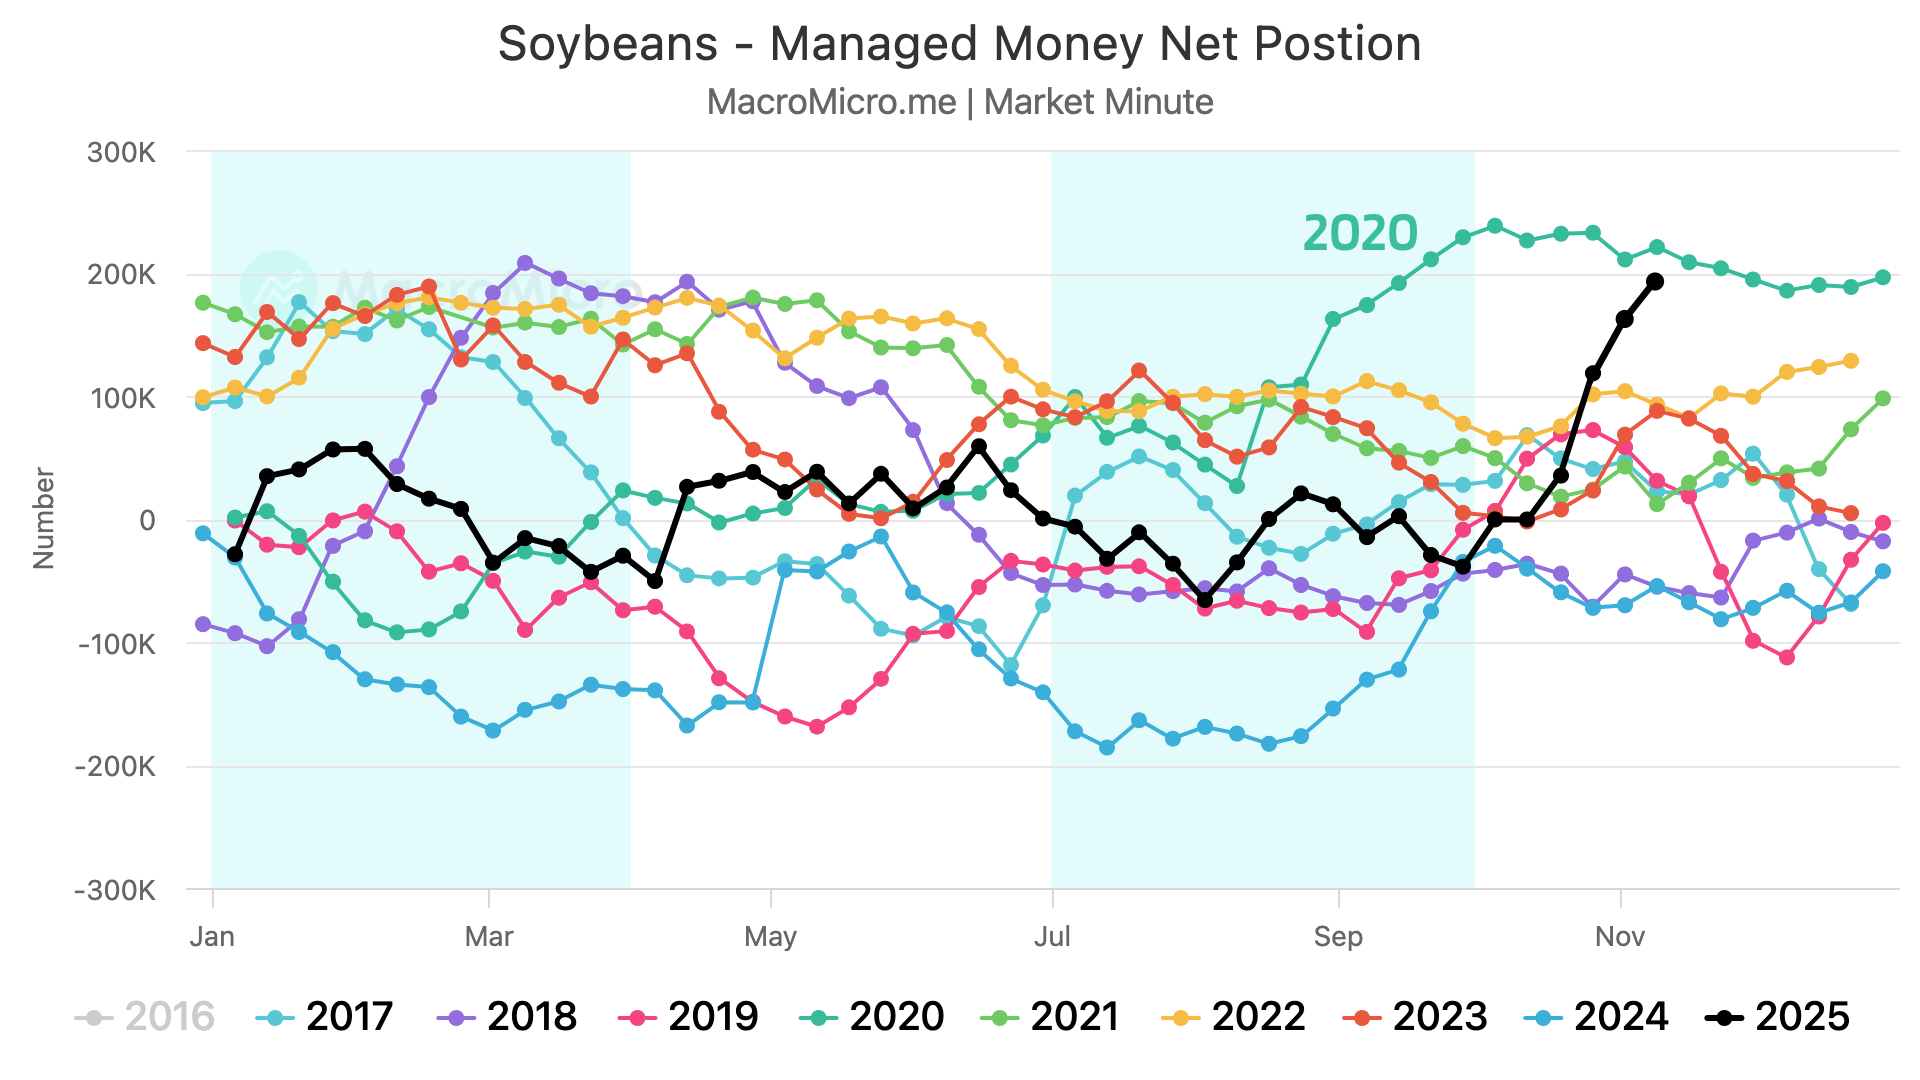
More China & Soybean Confusion
This wasn’t mentioned in yesterday's audio.
But US trade rep Jamieson Greer said that the deadline for China to buy the 12 MMT of soybeans is the end of the "growing season". Not the end of the calendar year.
If he talking about the US growing season next year? Is he talking about Brazil?
It really doesn’t make any sense.
Who knows if he even knows what he's talking about.
Bessent the other week claimed the deadline was the end of February.
Now this does makes sense.
That is when Brazil's crop comes online, so it makes sense we would get these soybeans sold before Brazil takes over.
If it actually is the end of the growing season, that would suck. Because you have to remember we have that 25 MMT of soybeans we are suppose to ship every year for the next 3 years.
Getting this 12 MMT done by February would be nice because we can then start that 25 MMT for new crop later in the year.
Originally the White House fact sheet clearly said the end of 2025.
Who knows if they have no clue what they are talking about, or if they really are just attempting to gas light everyone.
Guess we'll find out.
We still do not have that trade agreement Rollins claimed we would be getting any day now either.
As there is nothing in writing and China has yet to verify anything.
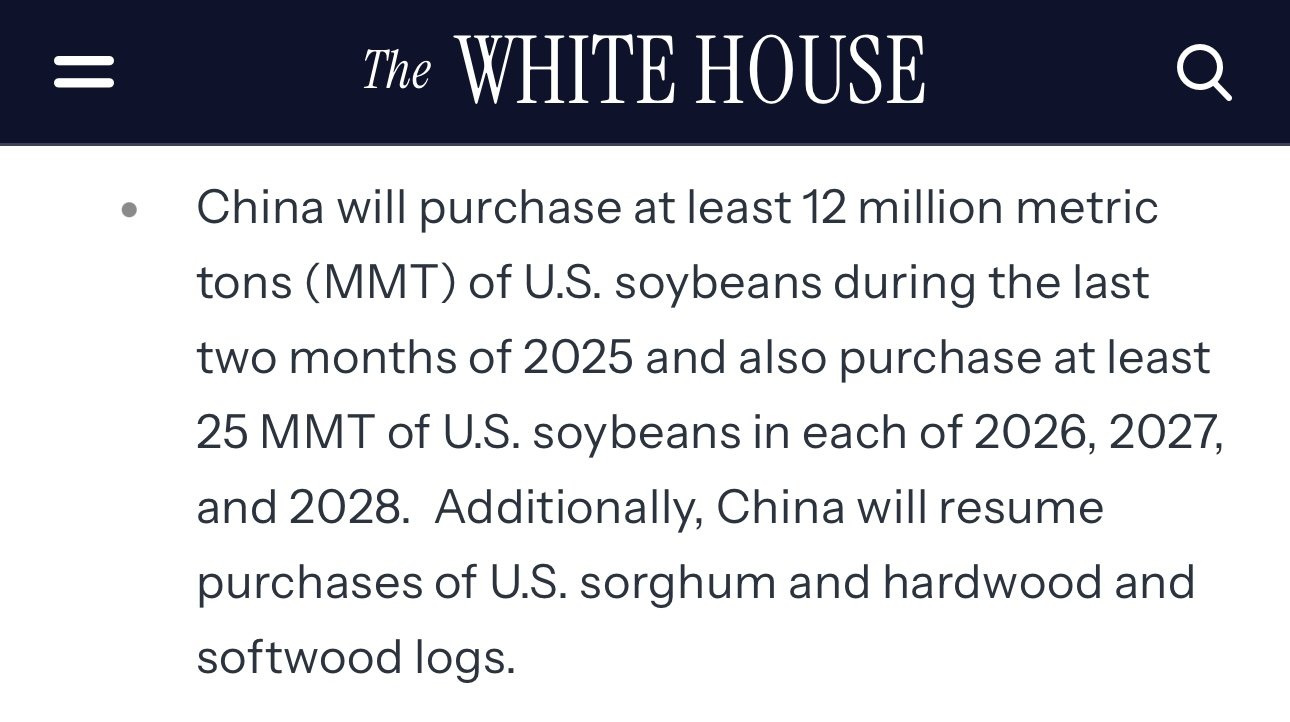
More Bean Sales to China
Despite the confusion, China continues to do what the US claims they agreed to do.
As they do continue to purchase soybeans.
With another flash sale of soybeans to China today.
We have now seen 3.4 million metric tons of the 12 million goal.
Which is 28% of the goal.
It's been about a month since they started buying.
We are over 1/4 of the way to the goal.
So seeing us meet that goal over the next 2 1/2 months by the end of February does not seem unreasonable at all.
Chart from GrainStats
Feds Cut Rates
Feds cut rates once again yesterday as expected.
This is the 3rd cut this year.
Trump said he is going to hire a new fed chair in May when Powell's term ends.
He basically said he is going to hire someone who listens to him and just keeps cutting rates.
Rate cuts lead to higher inflation. This supports higher prices for commodities.
Rate hikes lead to lower inflation. Lower inflation entices lower-priced commodities.
I've shown this chart countless times, but there is a clear correlation when it comes to inflation and the price of corn and soybeans. Whether it's a coincidence or not, it's hard to argue against it.
Take the top of the bull market in corn for example. It ended when the feds started hiking rates at the most aggressive pace in history to lower inflation.
If the feds continue to cut rates, and inflation goes up. It could be bullish for prices LONG TERM, not immediately.
Something to keep on the back burner long term.
World vs US Situations
We've got a tale of two stories here when it comes to corn and soybeans.
First for corn.
Like I shared earlier this week, the world corn situation is actually tight.
It is the tightest it has been in 13 years.
Even with a record US crop.
Does this matter today?
Yes and no.
It doesn’t matter because the US currently has plenty of supply.
But it will matter if the US or Brazil ever run into a production issue (which is bound to happen someday). We've seen a few years in a row without a weather scare.
If the world is the tightest it's been on corn in a decade, and we run into a weather scare, this chart right here would amplify the effects.
The world clearly still needs our corn.

But if the world situation is tighter than it was during the bull market.. why aren’t prices higher?
Like I said, the US has a record crop.
Our stocks to use ratio here at home isn’t viewed as bullish as of today.
The bull market featured a tight US situation.

Why does this matter?
Because the US is clearly the most dominant global player in corn.
We produce 31% of the world's corn.
China doesn’t export corn as they use it domestically.
The next closest is Brazil at 11%.
So the US corn situation matters more than the world corn situation when it comes to it's affect on prices.
Next for soybeans.
Our US situation is actually decently tight.
A 290 million bushel carryout is almost on par with those bull market years.
So why aren’t prices higher?
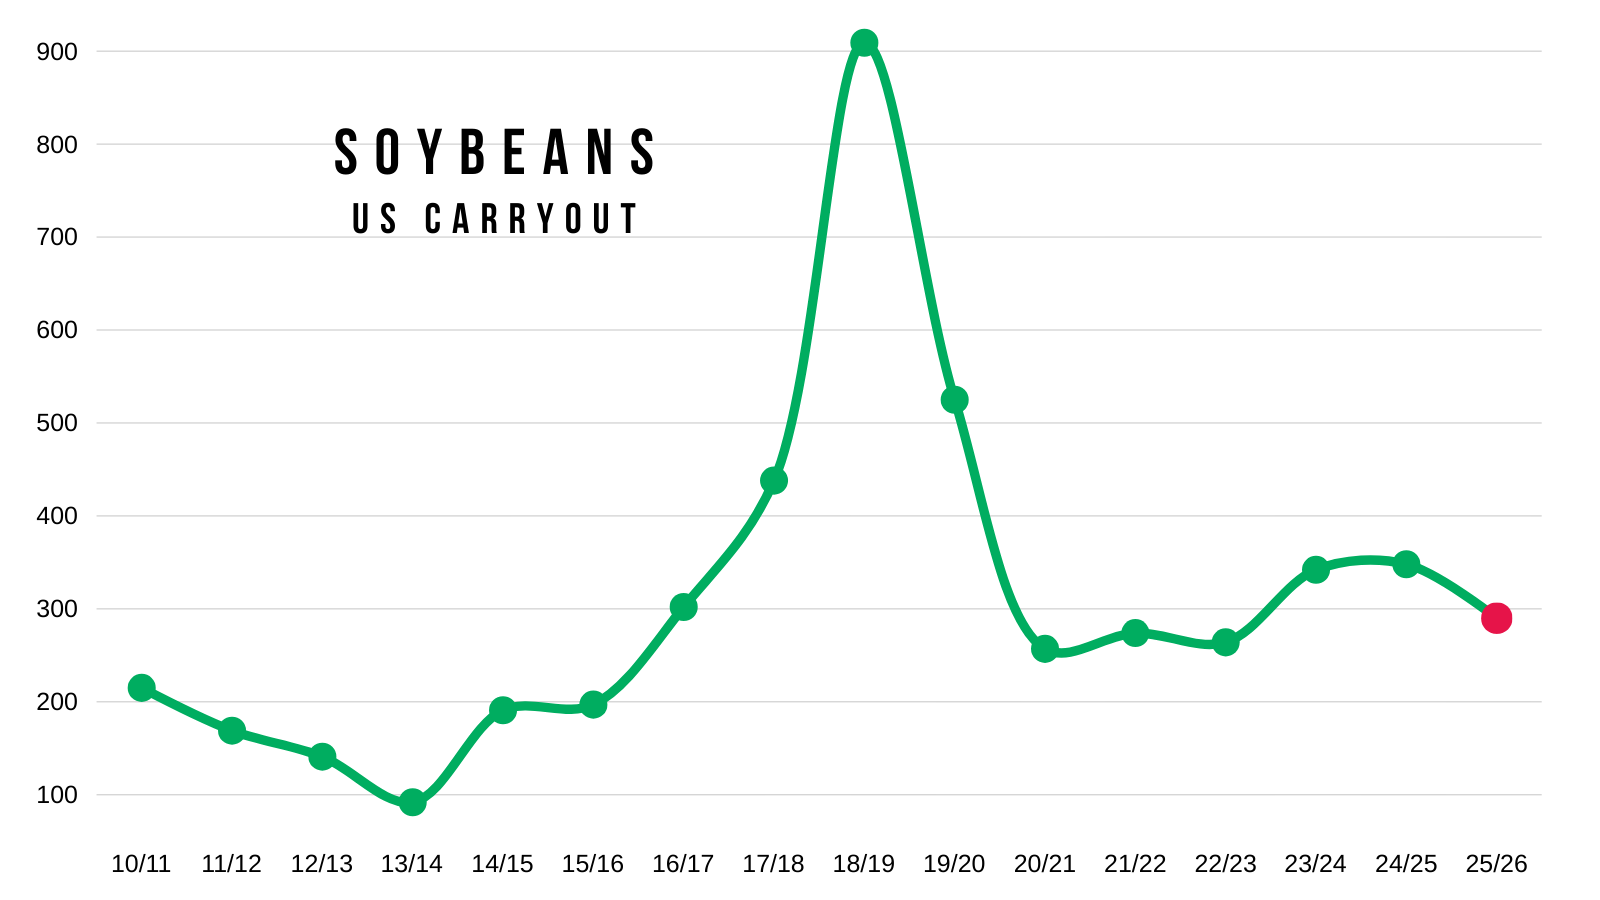
Because the world situation in soybeans isn’t bullish.
It's still sitting at some high levels historically.
Only behind the last two years and the trade war.
That bull market featured a tight world situation.
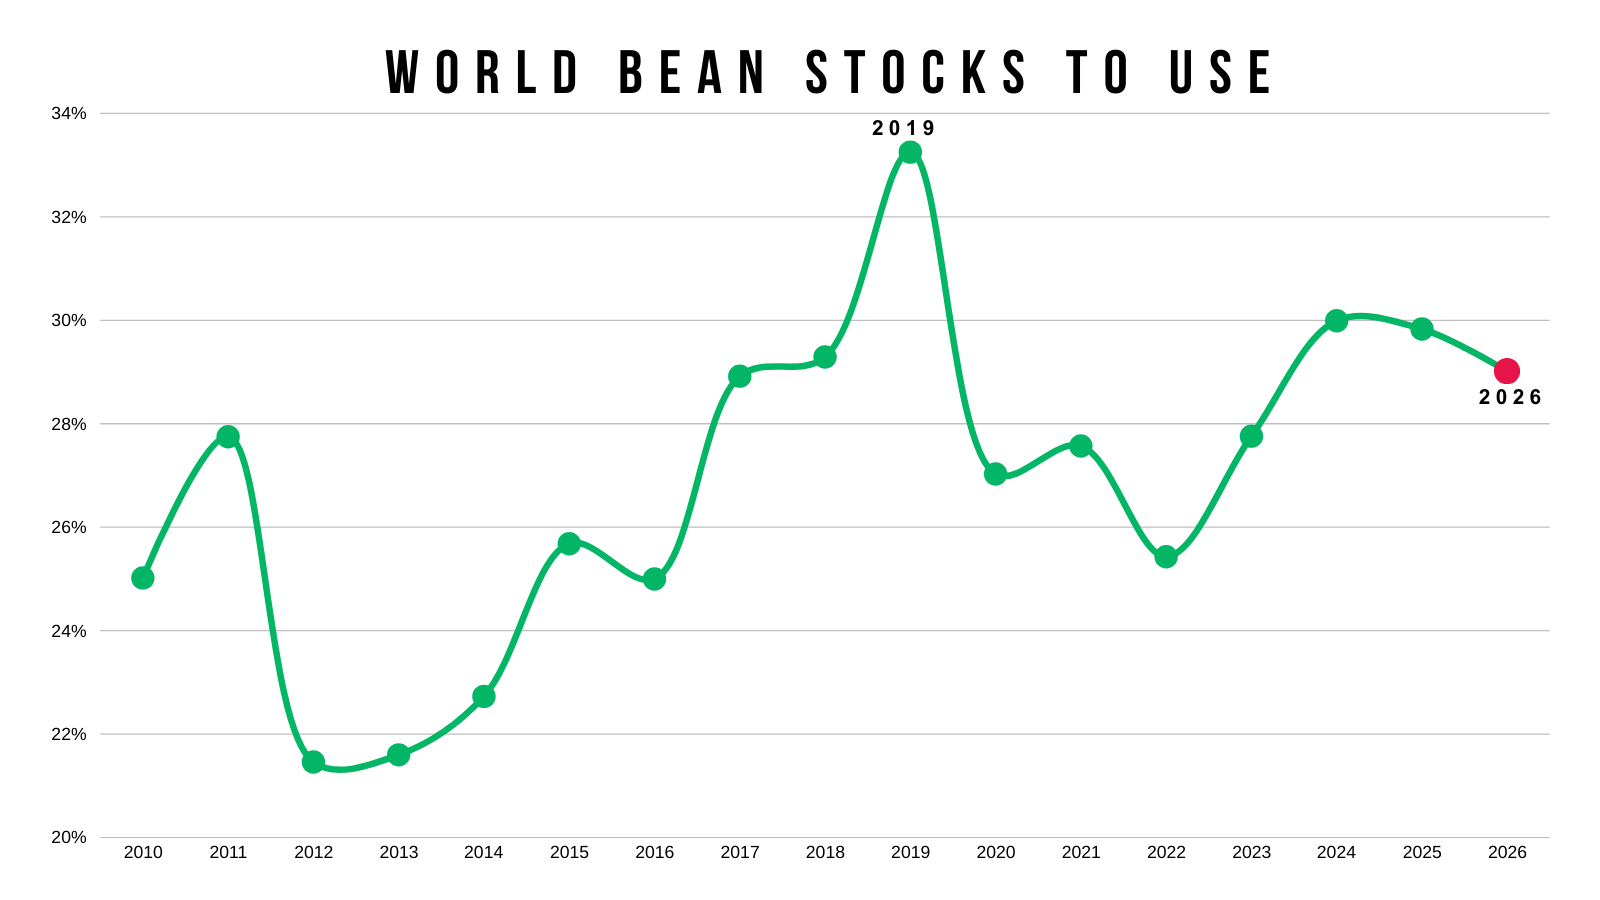
Why does this matter?
Unlike corn, the US does not dominate the world market for soybeans.
Brazil does.
So the US situation matters more in the corn market.
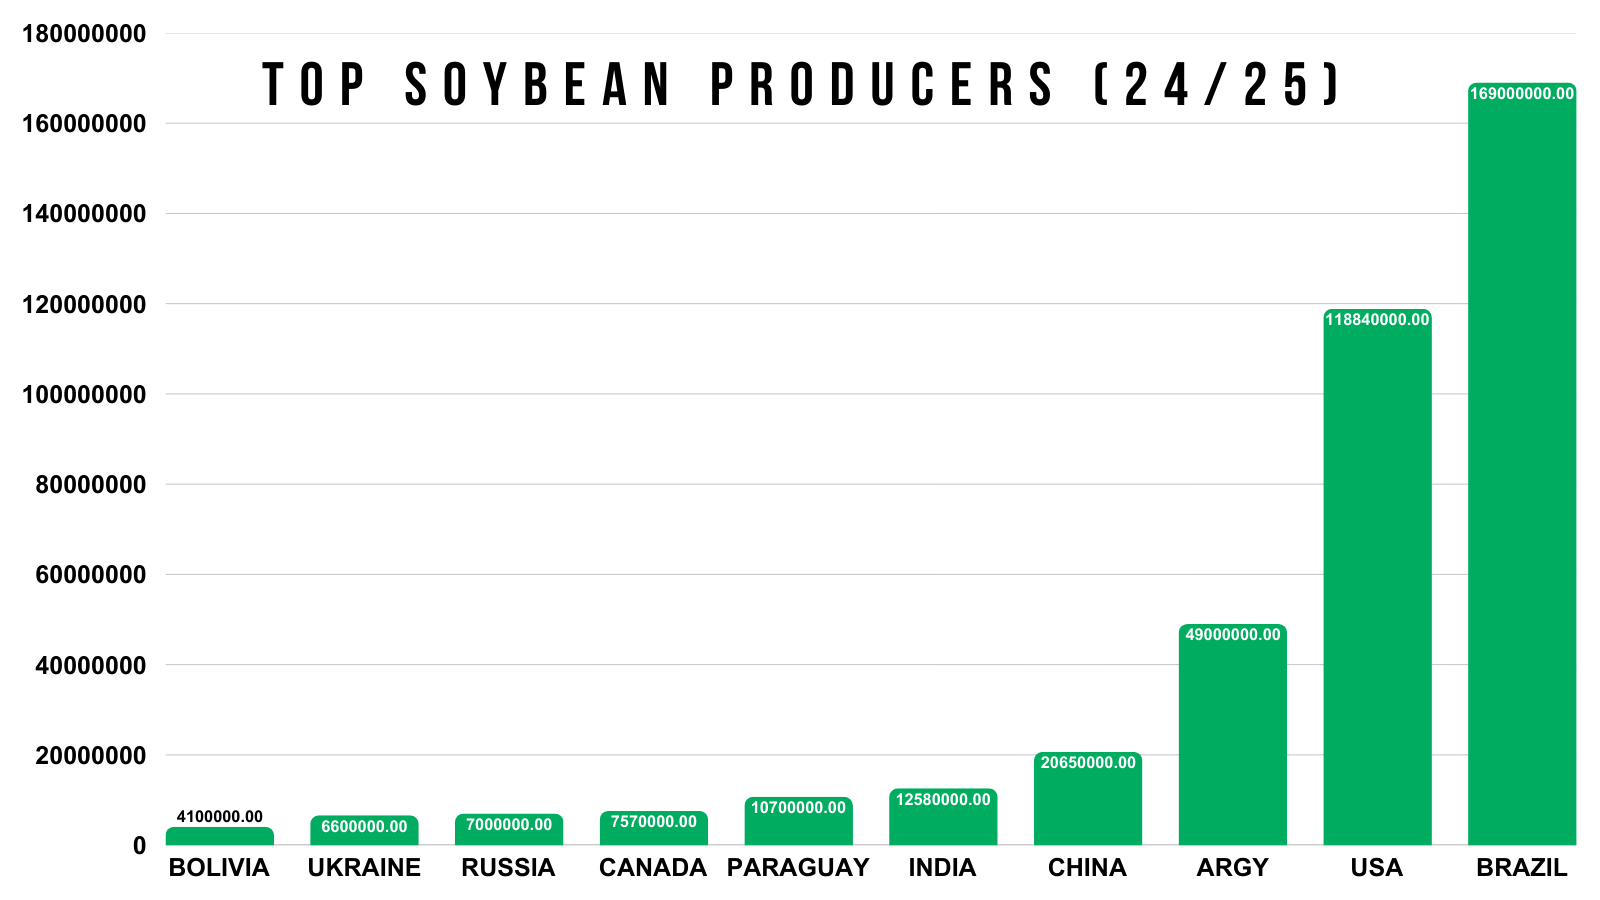
Lastly here is a quick look at the wheat market.
Neither the US or global picture is super friendly.
For starters, the US situation is the most bearish it's been in 5 years.

The world situation is actually tighter than it was the last few years.
But the stocks to use has started to pick back up this year.
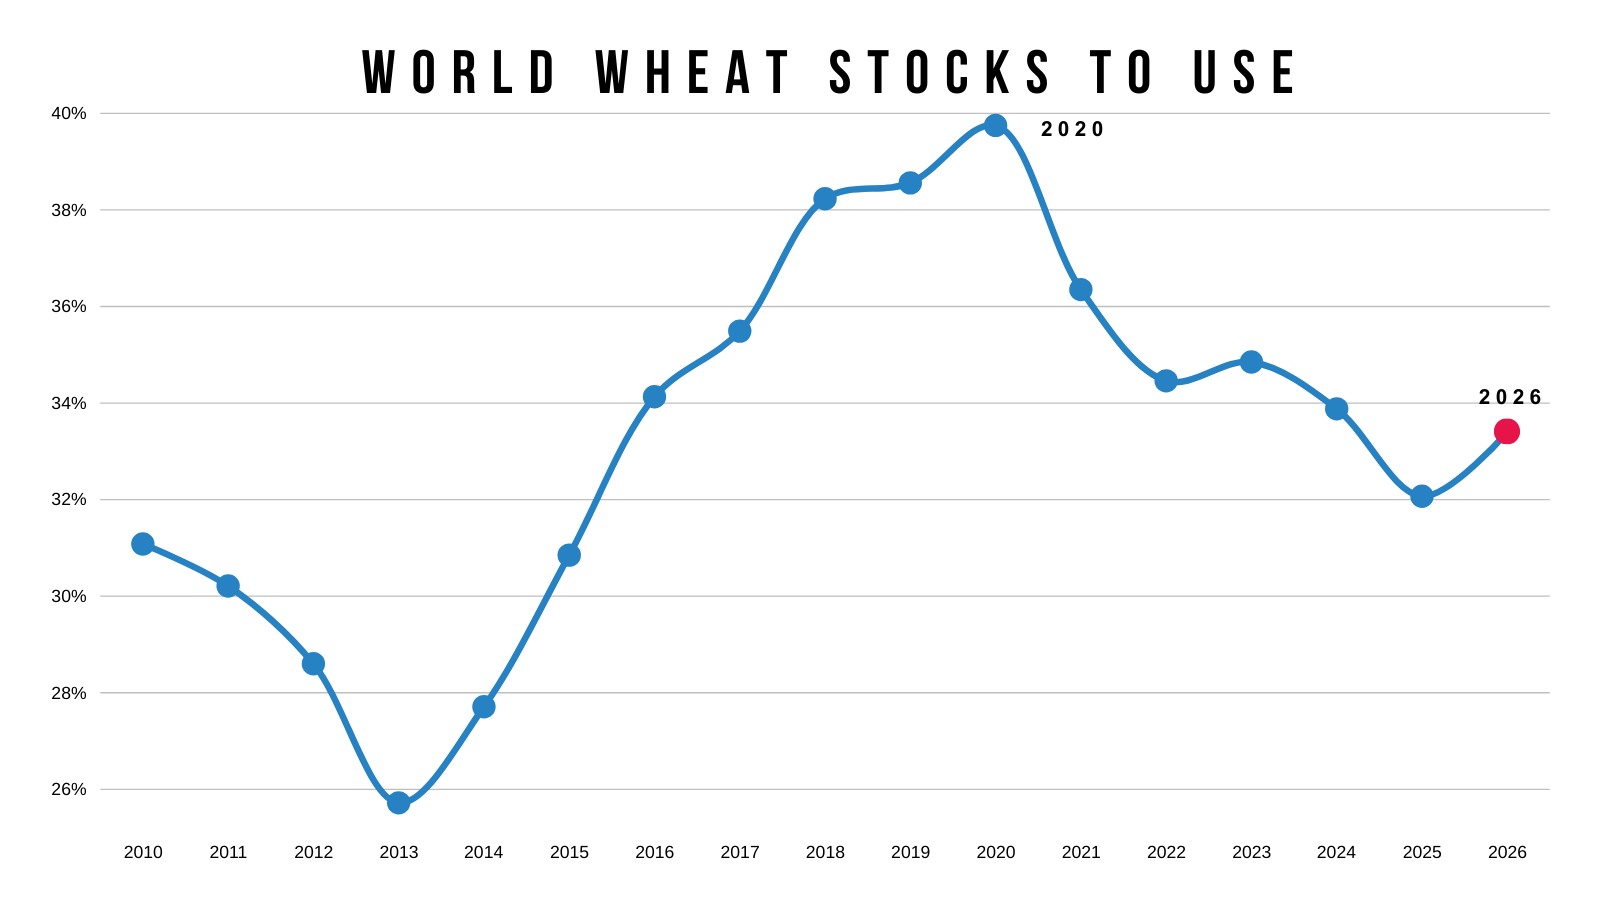
This is because global production is outpacing demand this year.
This is not a great sign when paired with ample US supply.

Today's Main Takeaways
Corn
Fundamentals:
Let's take a look at some of the seasonals today.
I shared these most of these on social media the other day.
Here is the March corn 10-year seasonal.
Clearly it hasn’t tracked this at all.
So this pattern doesn’t really matter.
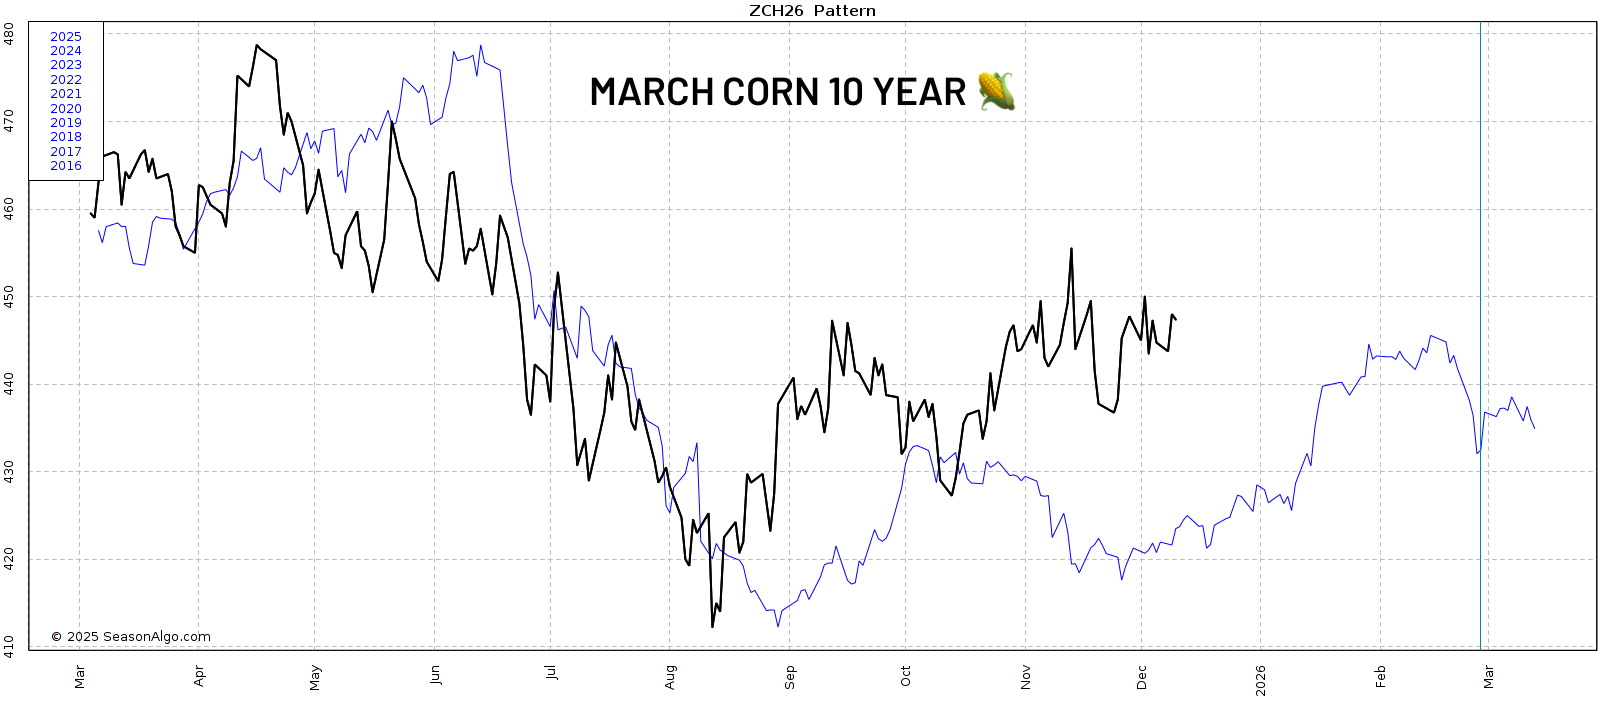
This is the Dec corn 5-year seasonal.
It played out pretty much perfectly.
Altough it wasn’t quite as strong, it followed the exact pattern.
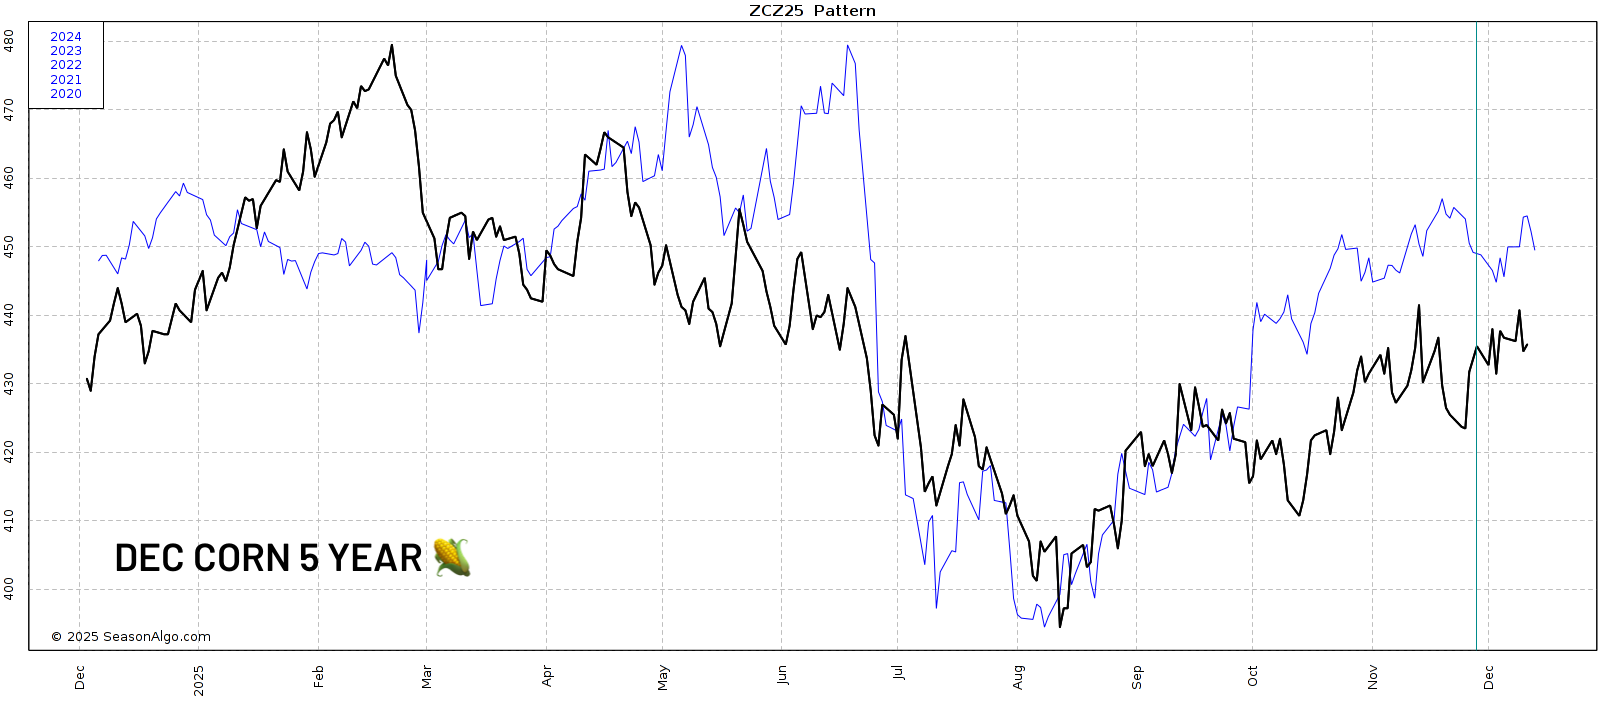
Here is the March corn 5-year seasonal.
We've been following this almost tick for tick.
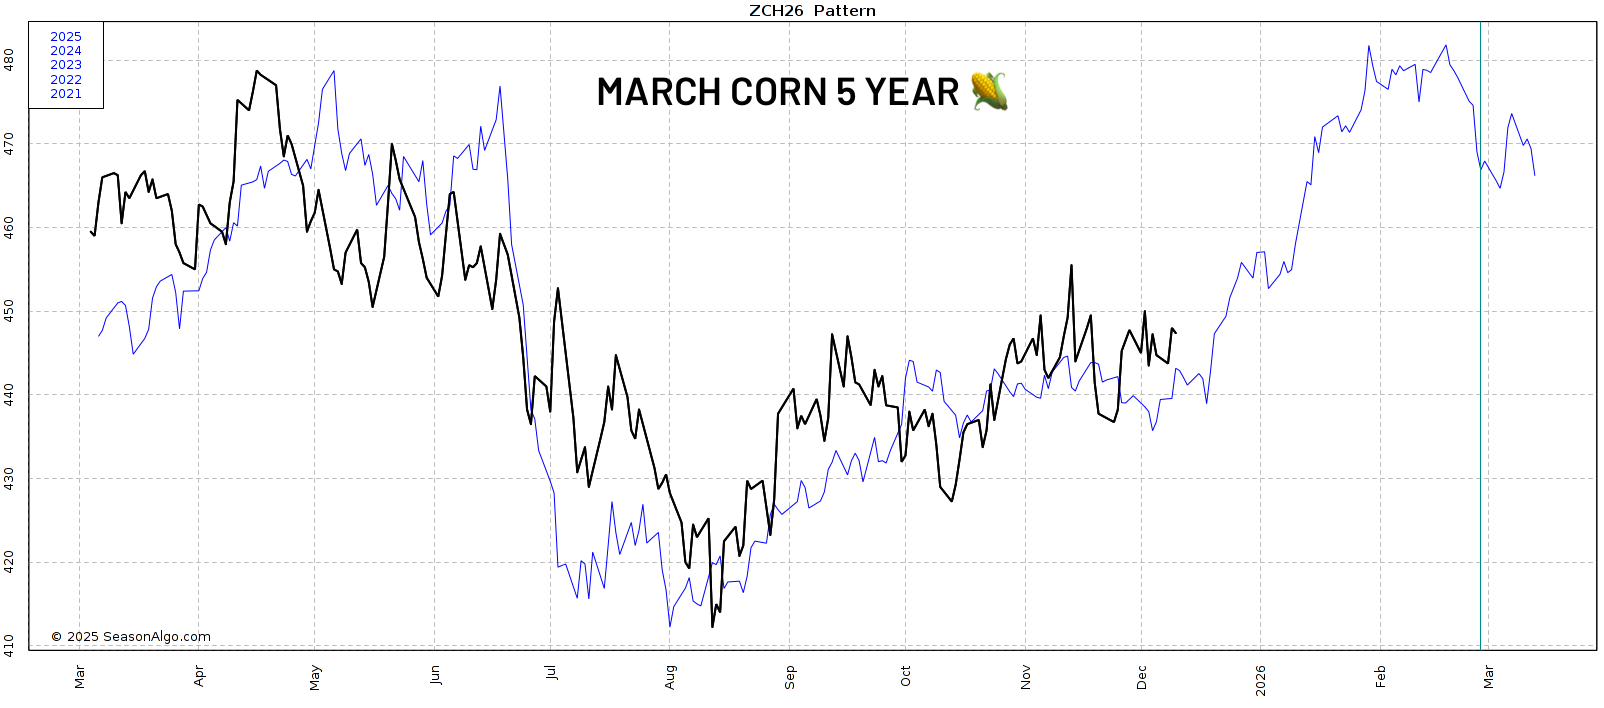
Lastly, here is March-25 vs March-26 corn.
Very similar as well.
In both the 5-year pattern as well as last year's pattern, we re-vist the highs we posted in spring.
If we were to do that again this year, it would put corn in that $4.70 to $4.80 range.
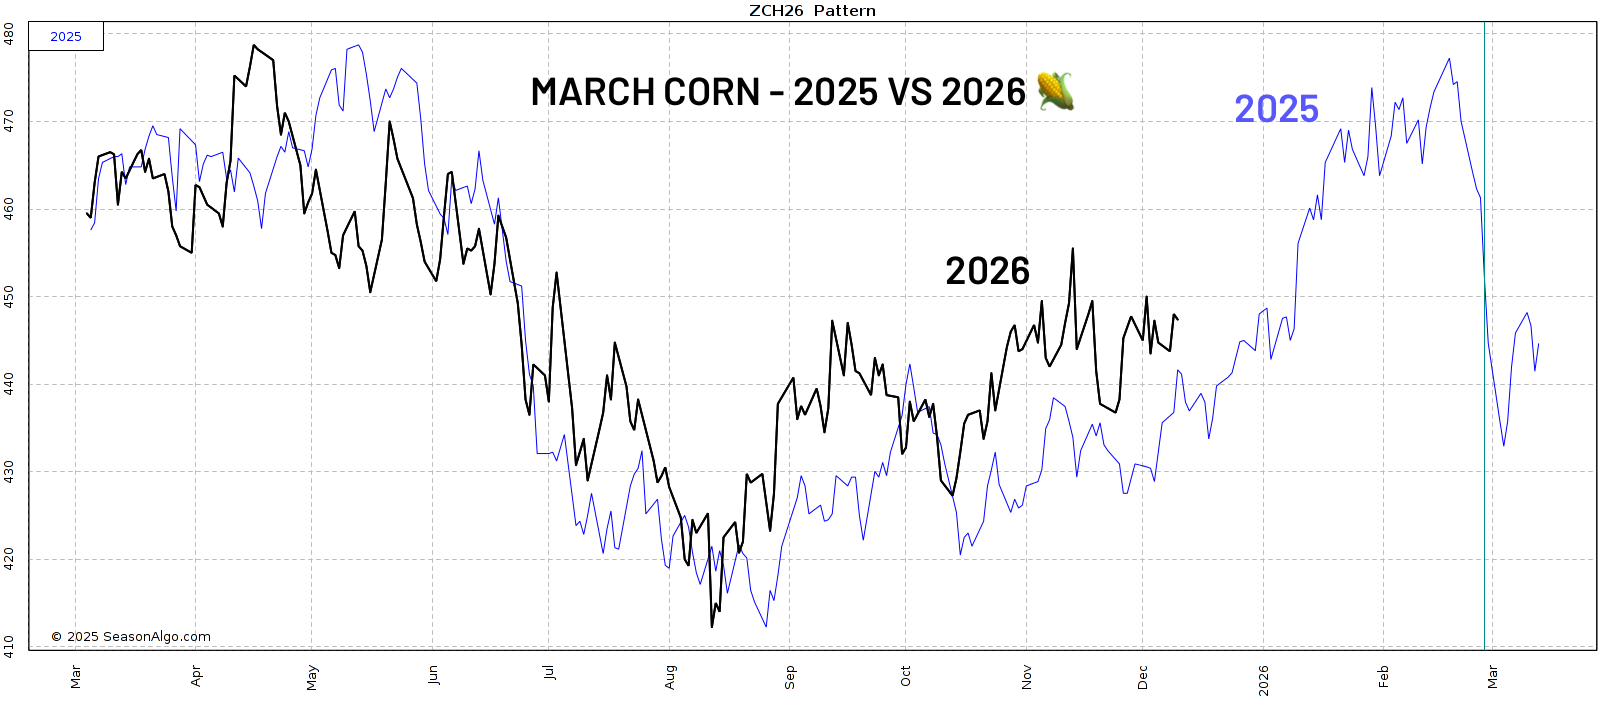
Bottom line, I am not bearish corn. But I do think our upside is still limited beyond $5.00 for now.
Simply because we do have massive production numbers here in the US.
At the same time, record demand should help keep a floor under this market.
To see this market get that next leg higher, it might take a yield cut in the Jan report. The issue is that I'm sure the USDA will walk back some demand numbers at the same time.
But taking a long term perspective on this market.. we have built all of this demand.
What happens if acres come down next year?
What happens if weather isn’t perfect next summer?
We already created a demand monster.
That is why "low prices cure low prices".
It's the markets job to put prices at a level that justify the demand.
For the market to justify lower demand in the future, prices typically have to go higher.
So short term, I think the path to significantly higher prices is harder. Long term we could have a story behind this demand when supply and acres aren’t shattering records.
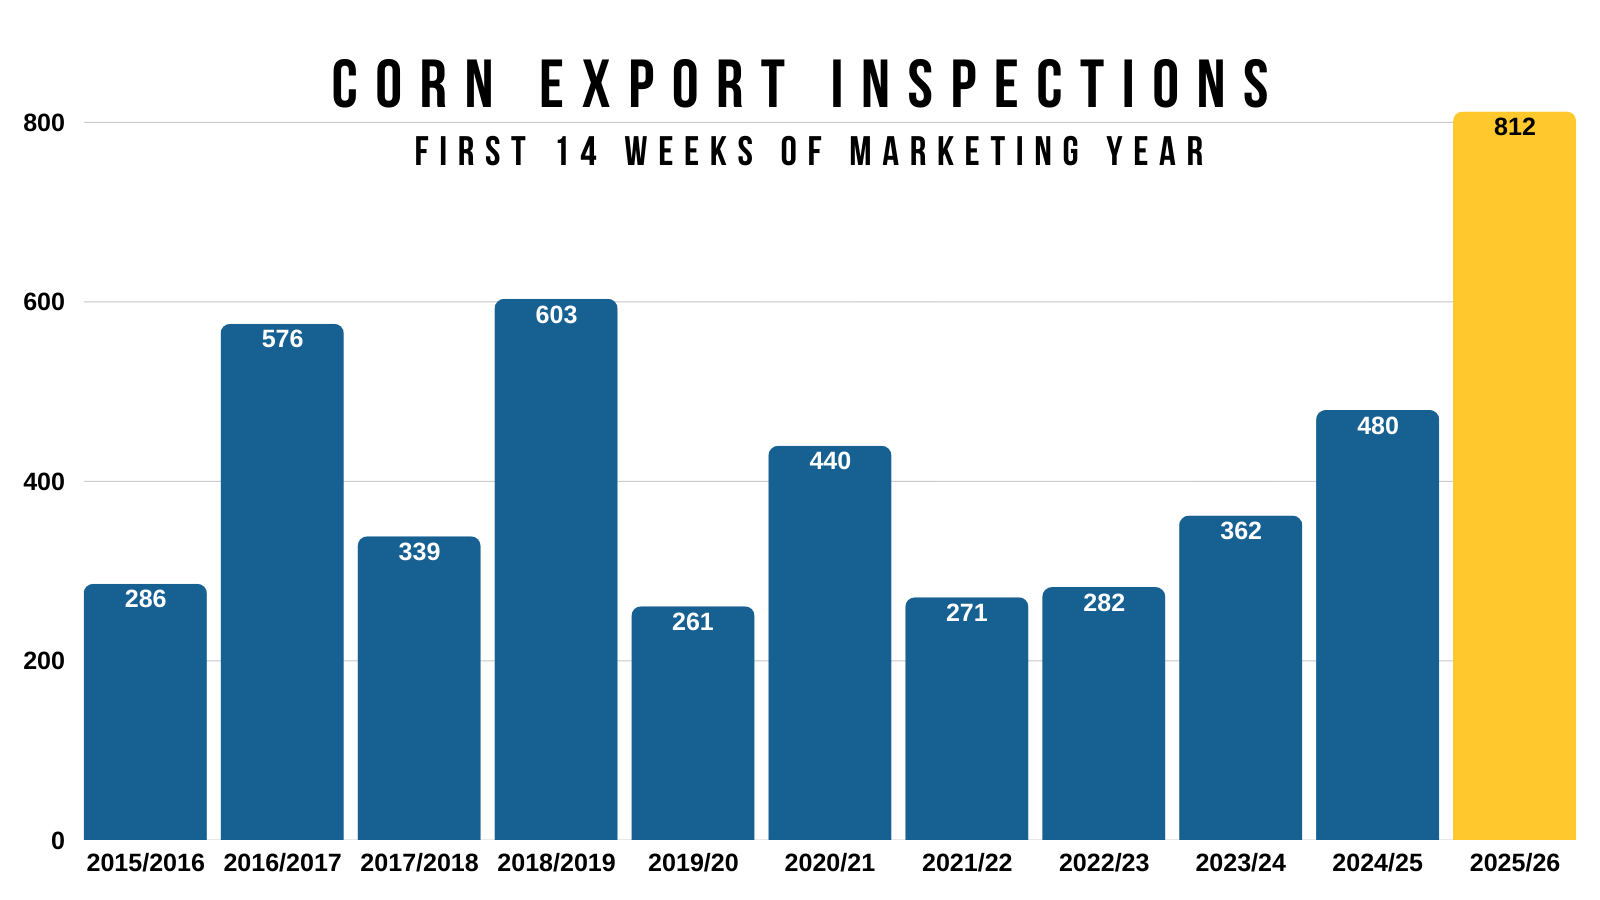
Corn Options Ratio Strategy
For those with hedge accounts, this is a strategy Jeremey and Lauren are considering for some.
Right now, March corn is trading about exactly where it was last year.
From then, corn went on to rally to around $5.00.
If we wind up with even a remotely similar path, there are ways you can capitalize on that potential.
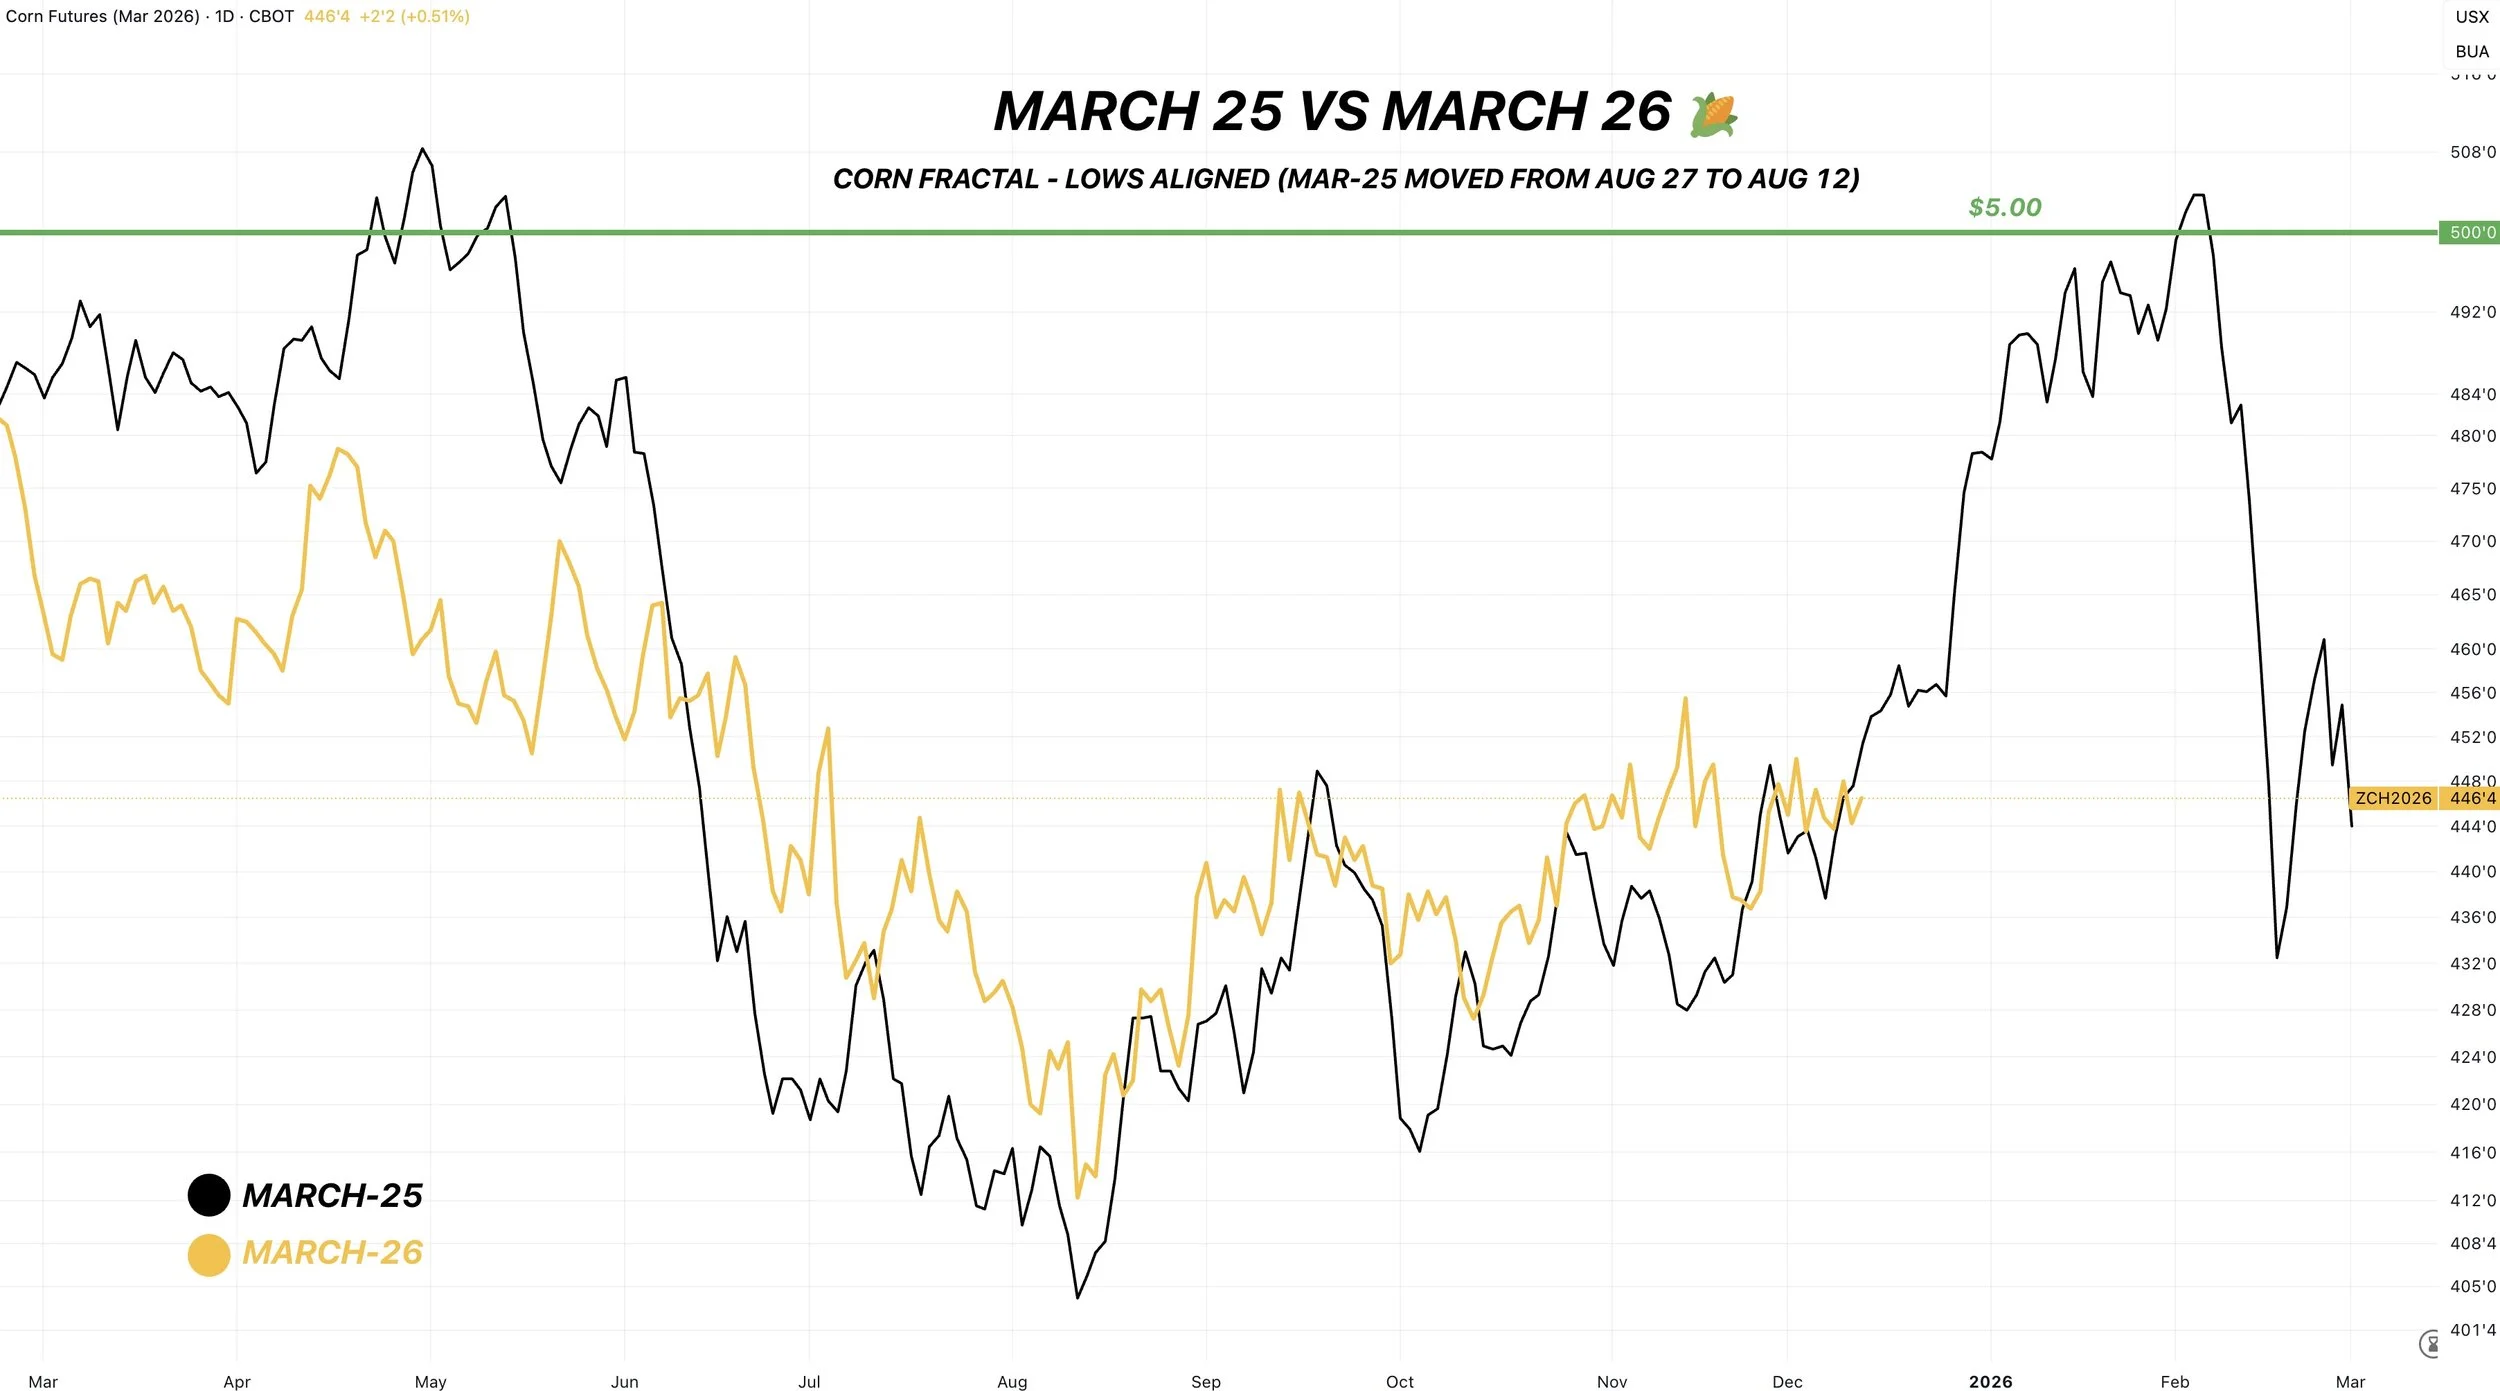
The trade in simple terms:
Buy 4 February $4.60 corn calls.
Sell 1 December 2026 $5.00 corn call.
Selling the one call pay for the bought calls.
Here is what the calls would approximately be worth at expiration if we rallied to the following:
$4.70 = Each Feb call worth 10 cents
4 of them = $0.40
$4.80 = Each Feb call worth 20 cents
4 of them = $0.80
$4.90 = Each Feb call worth 30 cents
4 of them = $1.20
$5.00 = Each Feb call is worth 40 cents
4 of them = $1.60
$5.50 = Each Feb call is worth 90 cents
4 of them = $3.60
(The Math: Futures Price - $4.60 = Call's Worth at Exp)
Here is a visual on the potential price you'd get for your corn plus the value of the calls at different corn prices. Not inlcuding basis.
This chart is provided that the Dec call you sold expires worthless and you collect the entire premium.
We are not saying any of this has to happen at all, this is simply the results if it happened.
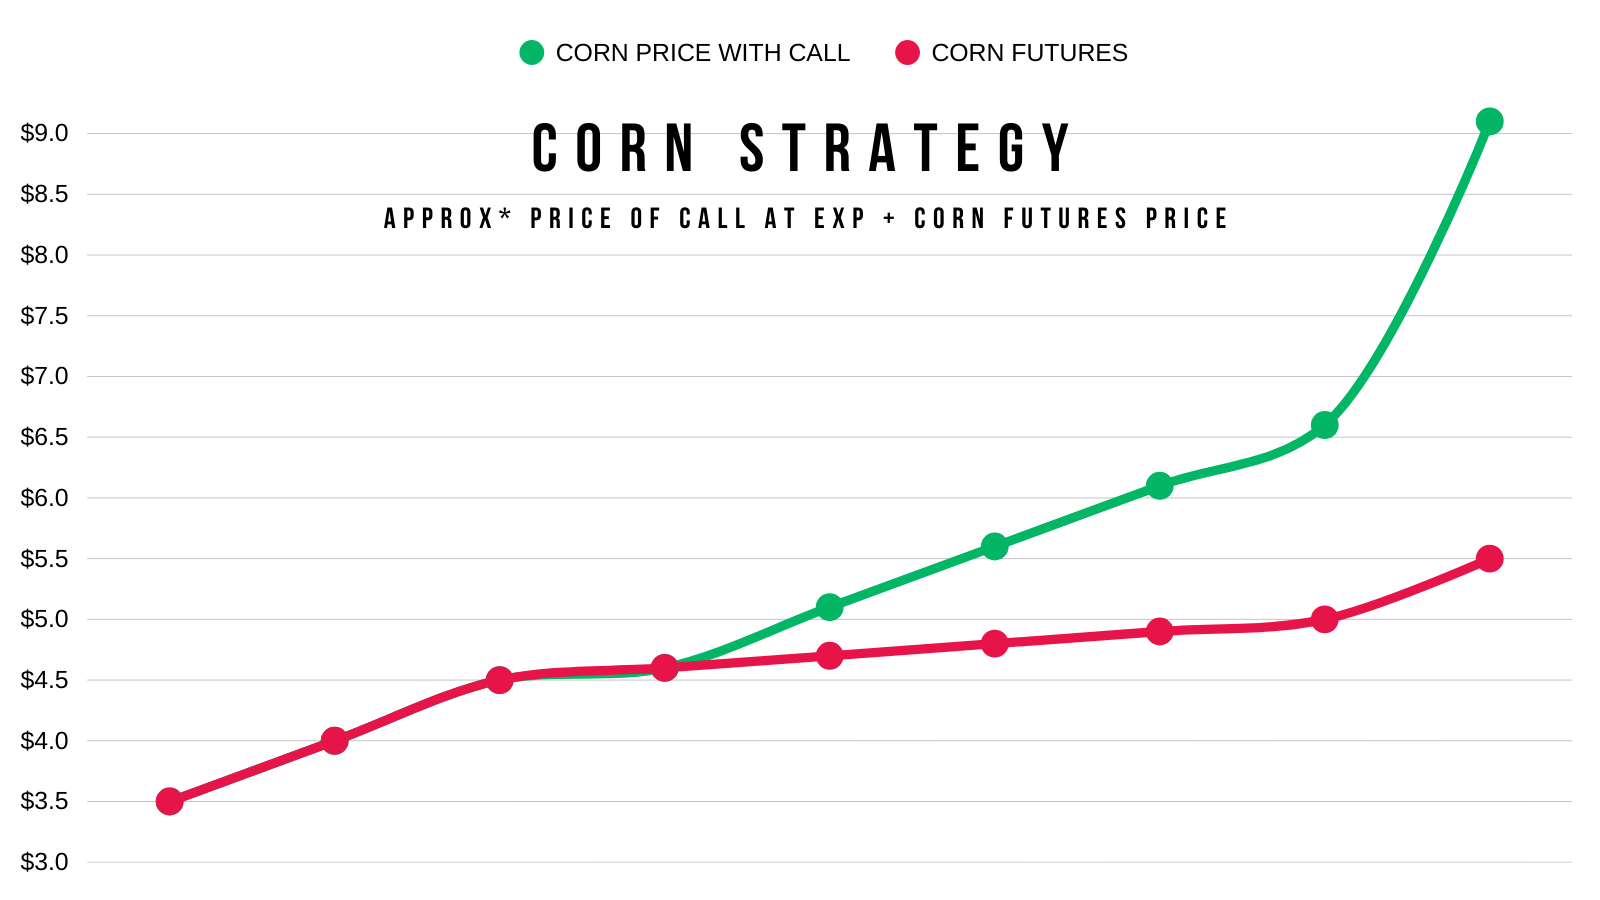
It's a trade that could pay for a farm if the market did decide to take off, or it could turn a break-even year into a profitable one.
Why not just buy calls?
In case the market does not go higher.
By selling the one call, it completely pays for buying the other 4 calls.
If the calls go to zero, you don’t lose much if anything.
Basically, a way to play the upside for free until the long calls expire.
This is just a way to play for a similar type of rally to last year while taking advantage of low implied volatility.
Lauren broke this down even further along with some variations, if you want to check that out:
CLICK HERE FOR LAURENS'S STRATEGY
If you’re interested in this trade, reach out to Jeremey or Lauren.
Jeremey: (605)250-3863
Lauren: (806)391-7178
Technicals:
March Corn
Nothing new on the corn chart.
We've traded pretty much sideways for over a month now.
We have closed between $4.40 and $4.50 for the last 27 of 32 trading days.
A very small 10 cent range for over a month.
Whatever way this range breaks should give us our next direction. Everything in between in noise.

Corn still remains in an uptrend as long as we hold the red box.
Which gives back 61.8% of the Oct rally.
We've been battling the 200-day MA for 10 days in a row now. Two consective closes above would be nice to see.
Ultimately, to say we are ready for further upside we need over $4.50
We've only closed above that key resistance one time. It was the day before the USDA report before the USDA sent us straight back down.
It's still clearly the level to break. It is our old key support from spring. Now key resistance.
It reclaims 50% of the Feb highs.

Soybeans
Fundamentals:
Just going over the technical charts today as I do think we are in an area where we should start to find some support.
It's really going to come down to two things here over the next few months.
China and Brazil.
We need China to continue to step in here and buy to help keep a floor under this market. Which I think happens.
But for this market to get super bullish, it very well could take a production scare out of Brazil. It is still early, but so far we haven’t seen many issues.
There are a ton of possibilities in this bean market.
Some could result in +$12.00, some could result in us staying below $11.00.
The potential for a lot higher prices still exists, but the bulls need to keep getting fed.
Whether that's China buying more than expected, a weather scare in Brazil, or a yield surprise in the Jan report.
Technicals:
Jan Beans
Have we found a bottom?
I'm still hesitant to say we bottomed.
But I do still think we bottom somewhere in this green box.
This has been my downside target since those highs.
Giving back 50-61.8% of a rally is viewed as a standard correction.
That is where the market decides if we are still in an uptrend or starting to fall apart.
It also just so happens to be our yearly resistance.
Everyone is screaming about that gap.
Fun Fact: only 35% of breakaway gaps get filled.
it's possible, but I do not think we have to fill that gap.
If everyone thinks something is going to happen, often times it doesn’t happen.

Here is the weekly chart.
We clearly broke out of that brutal range we were trapped in for over a year.
When you break out of a range, it is extremely common to back test the point of breakout.
It was resistance for over a year on several separate occasions.
We are now coming down to test it as support.
We do not want to fall back into that range, as that would be viewed as a failed breakout.
The golden fib (61.8%) sits there as well.
So breaking below that would tell us we are probably in for more downside.
But for now, bouncing in this area makes perfect sense.
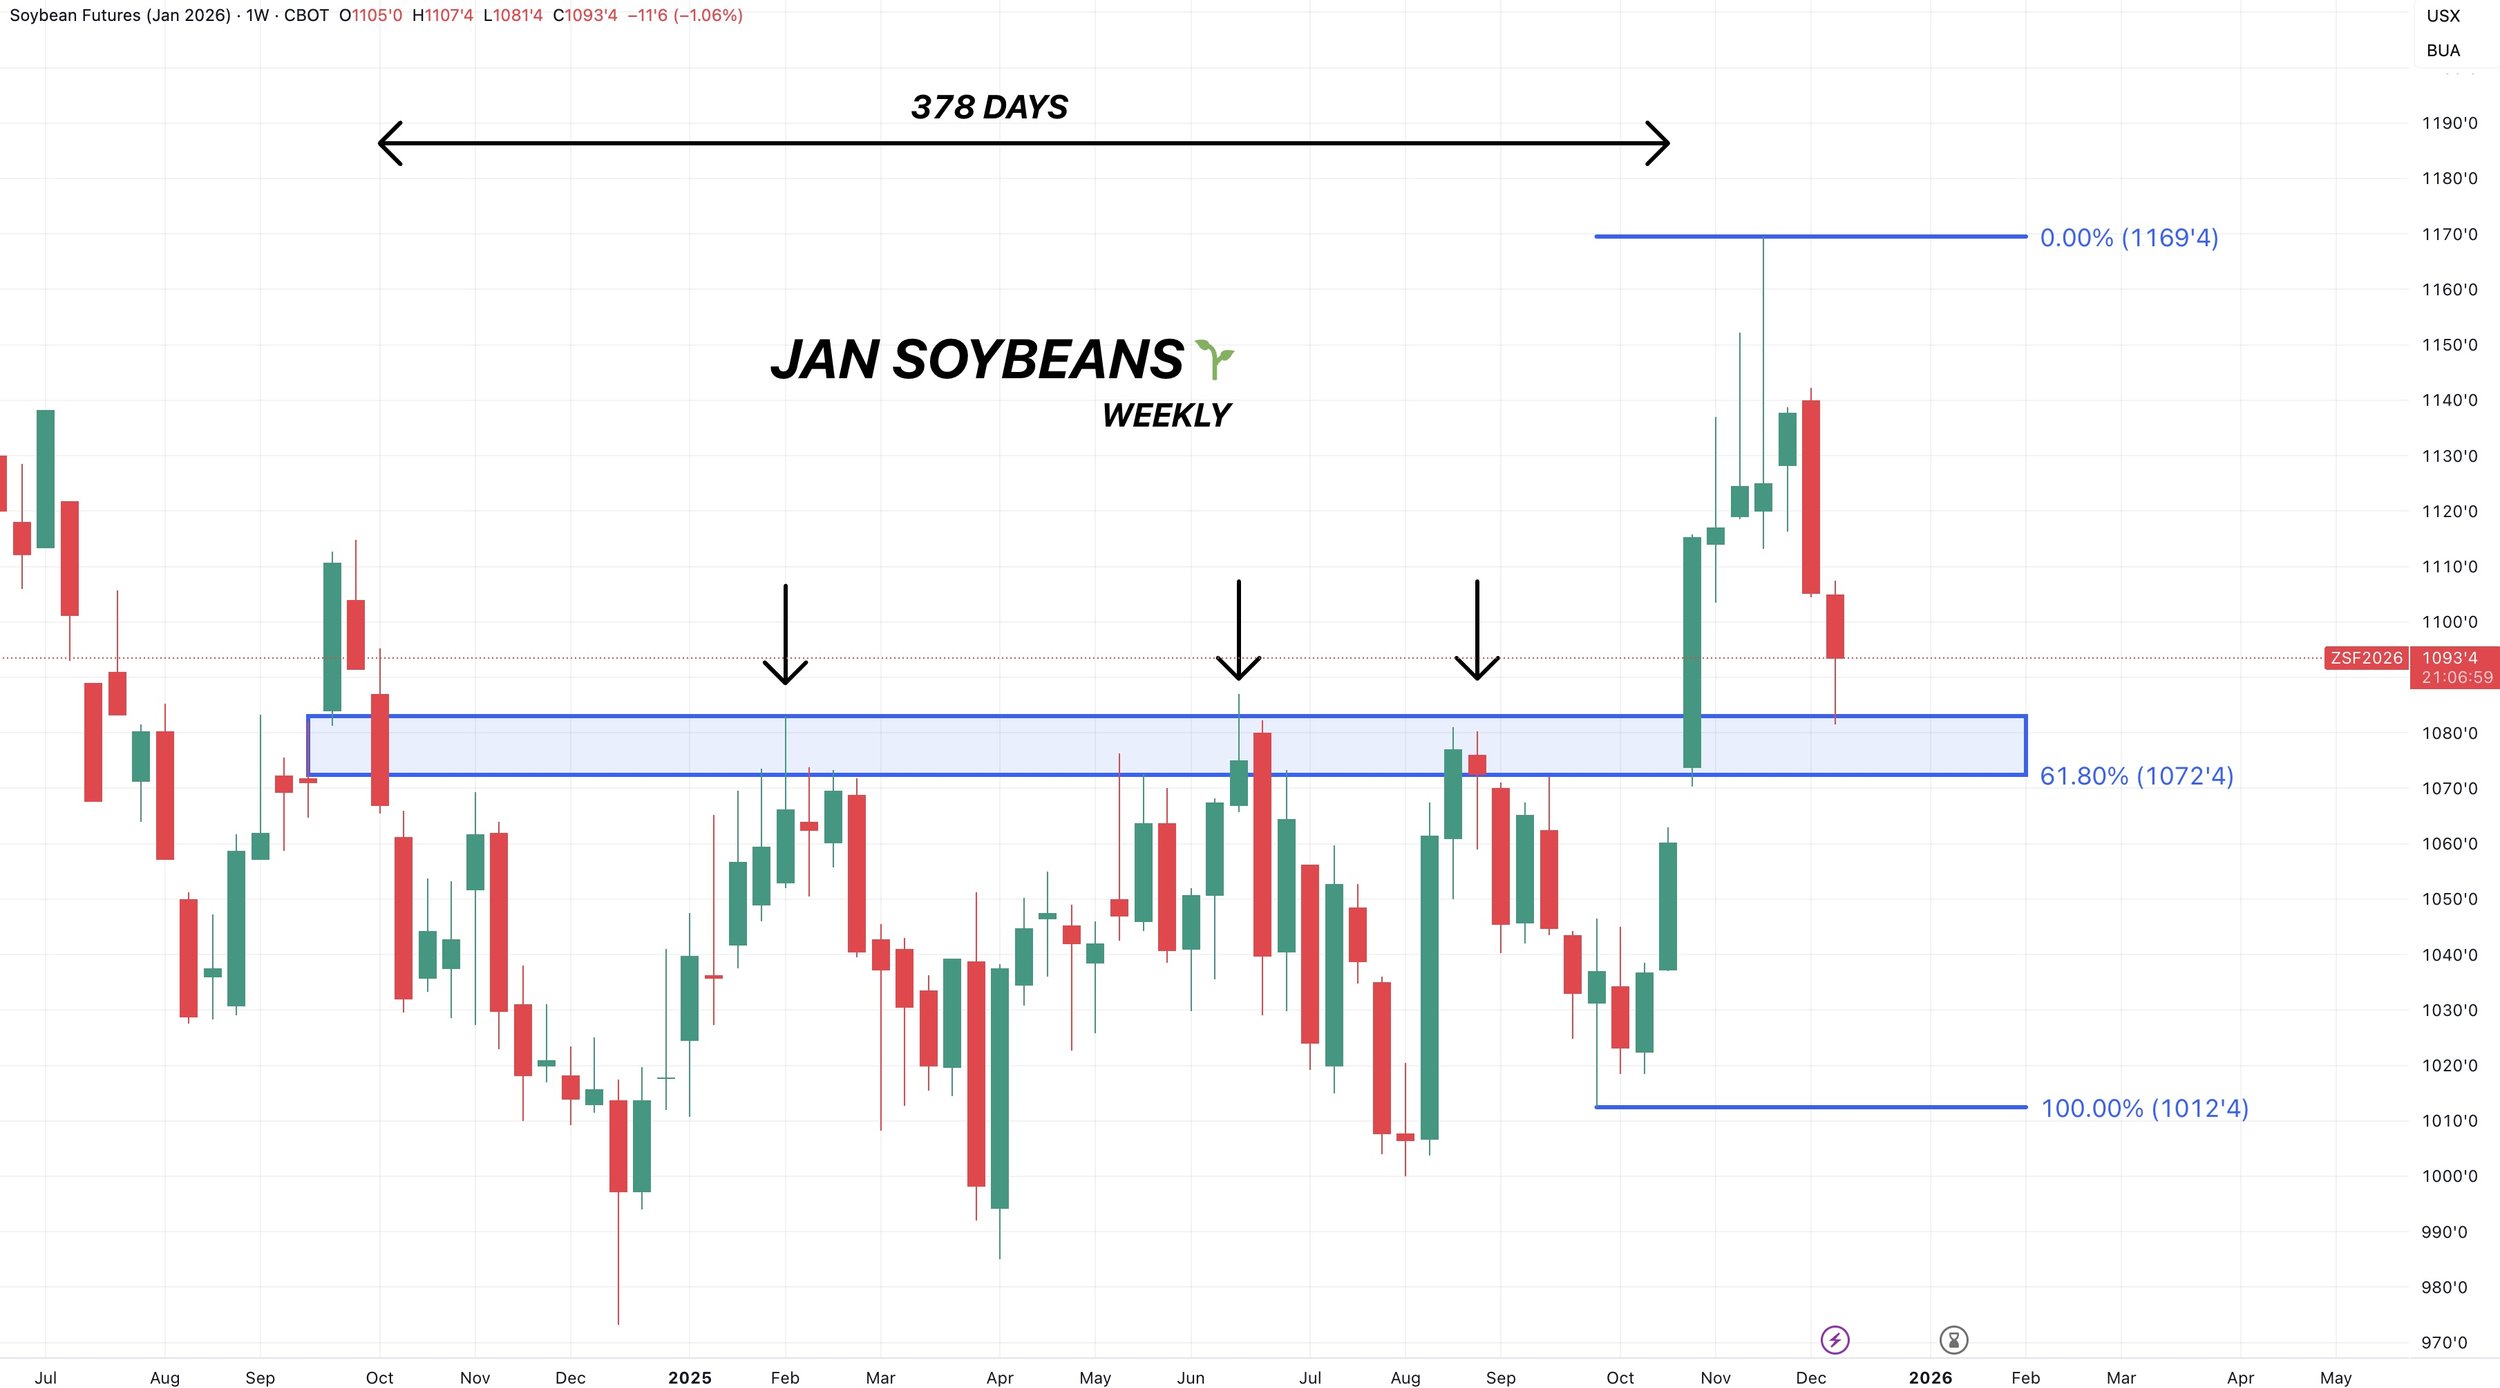
Wheat
Like soybeans, just going to be going over the charts today as there really isn’t anything new fundamentally since the USDA report.
We are also at some pretty key levels on the chart.
The wheat market is digesting the news from the USDA.
They confirmed that the wheat crops around the world are getting bigger, and there is no concern globally surrounding wheat.
So the wheat market still lacks a catalyst.
Seeing those production increases in several countries does make you think the wheat market could continue to struggle for some time. So there is no reason to get super bullish, but I find it hard to get overly bearish at these levels.
Simply waiting for an opportunity. Which in the wheat market seems to only come a handful of times a year.
Technicals:
March Wheat
We are sitting right at the golden fib.
61.8% of the entire rally.
This is a must hold spot.
If we fail here, we could easily revist those contract lows.
If we bounce here, this sell off is still viewed as a normal correction and we are still in an uptrend.
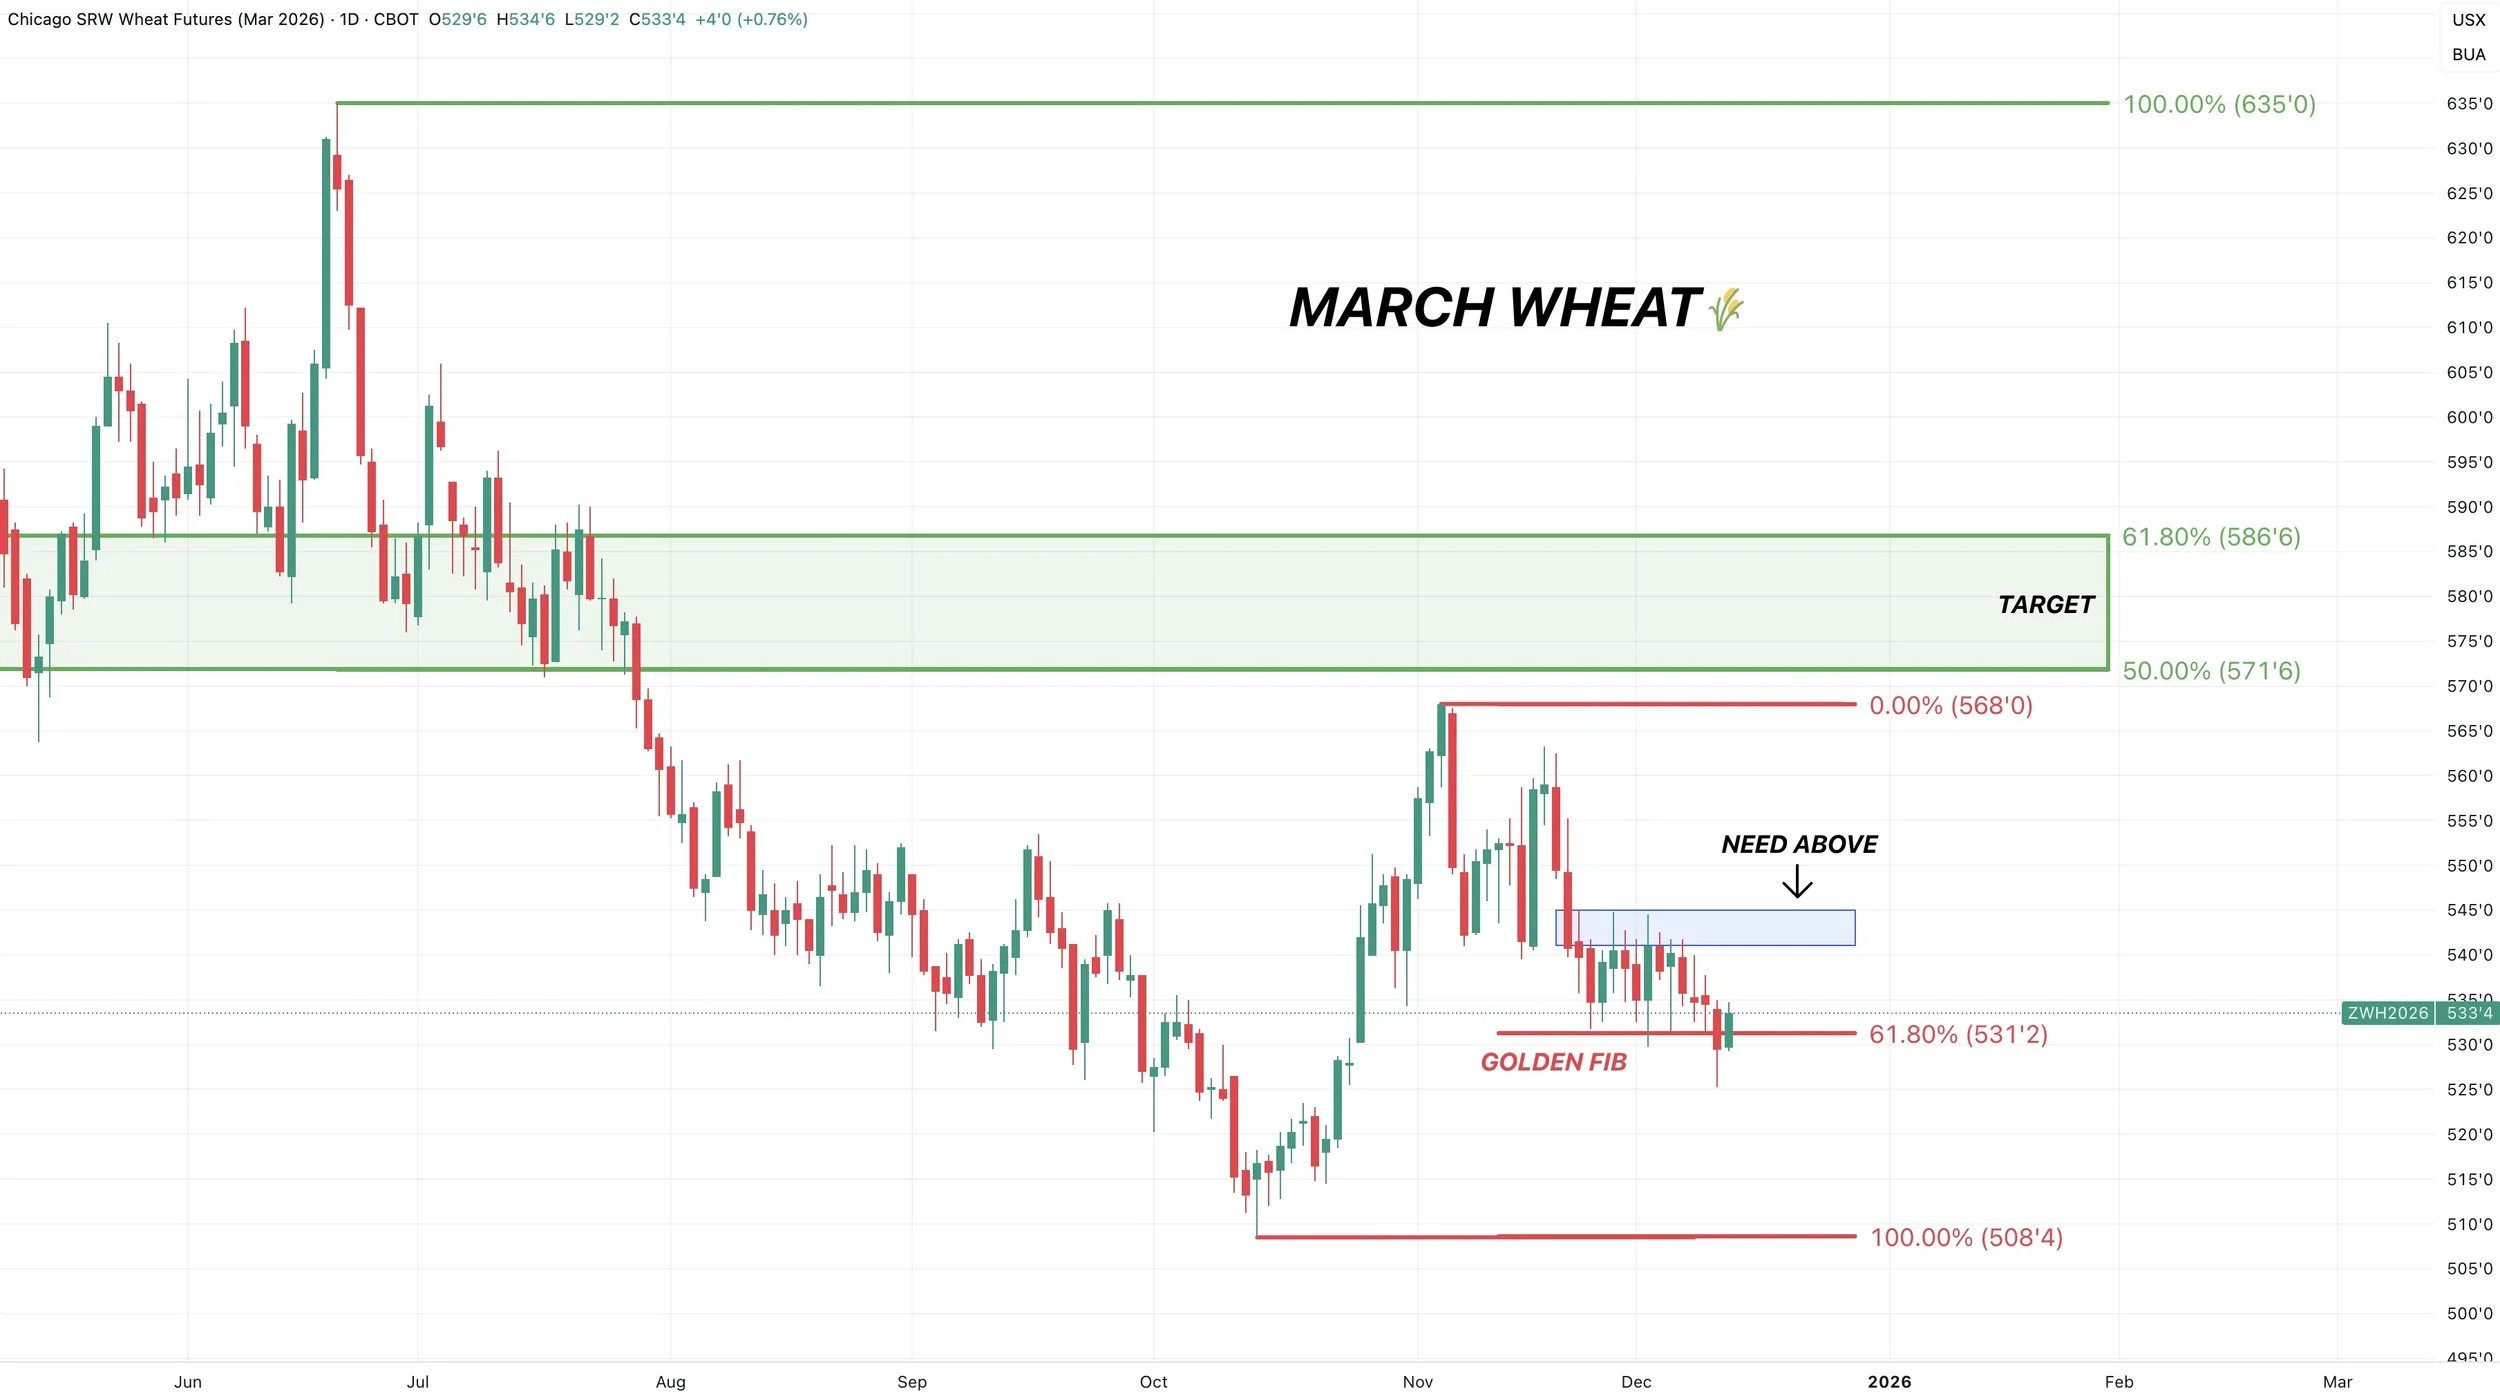
Dec KC Wheat
Exact same story for KC.
Sitting right at the golden fib.
Absolutely a must hold spot. As a break below opens the door lower.

Cattle
Like I mentioned, today we did issue another sell signal and hedge alert for the cattle market.
This comes after that hedge alert we issued on Friday.
Why the signal?
Let's jump into the charts.
Technicals:
Feb Live
Live cattle is approaching our 2nd target.
Which claws back 61.8% of the sell off.
That is the most common spot where a corrective bounce will fail before heading lower.
We are also right up against the 100-day MA.
We issued the alert on Friday because we reclaimed 50% of the sell off and were approaching the 50-day MA.
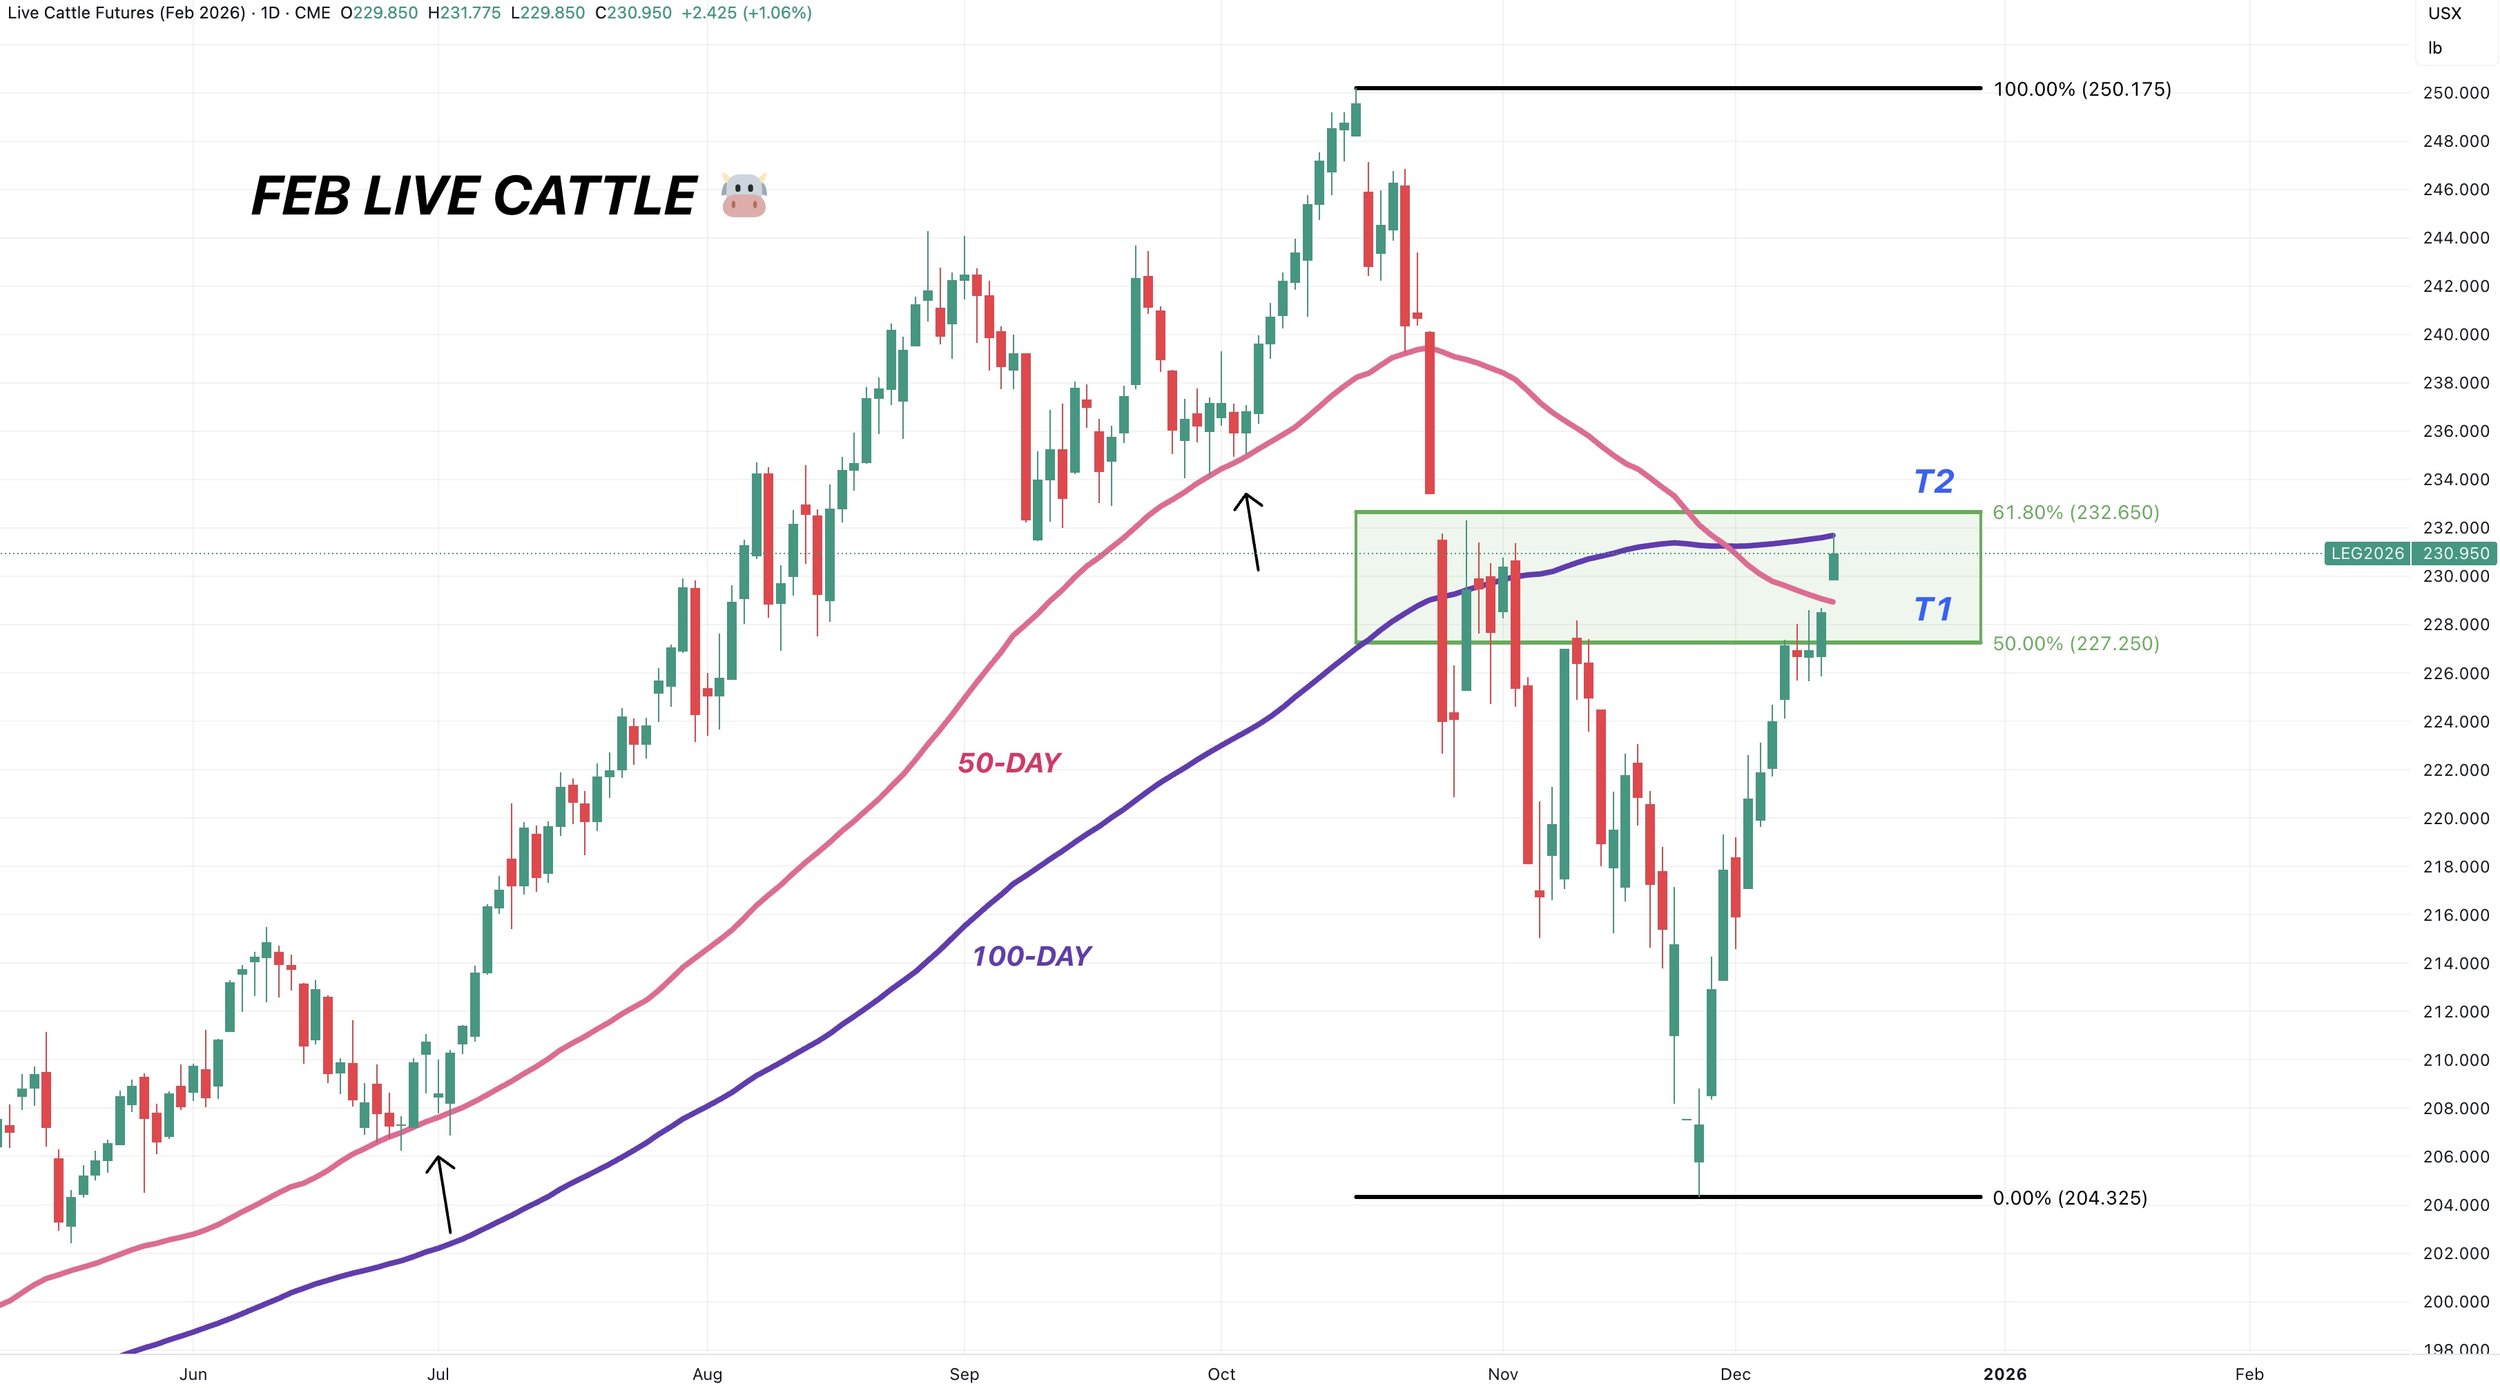
Jan Feeders
Feeders aren’t quite as close to hitting the 61.8% level as live cattle is.
But since we are approaching the target in live cattle, the signal is for feeder cattle as well.
Regardless, this green box is where the market makes a decision and tells us if this is simply a relief bounce before heading lower.
As relief bounces usually claw back 50-61.8% before failing.
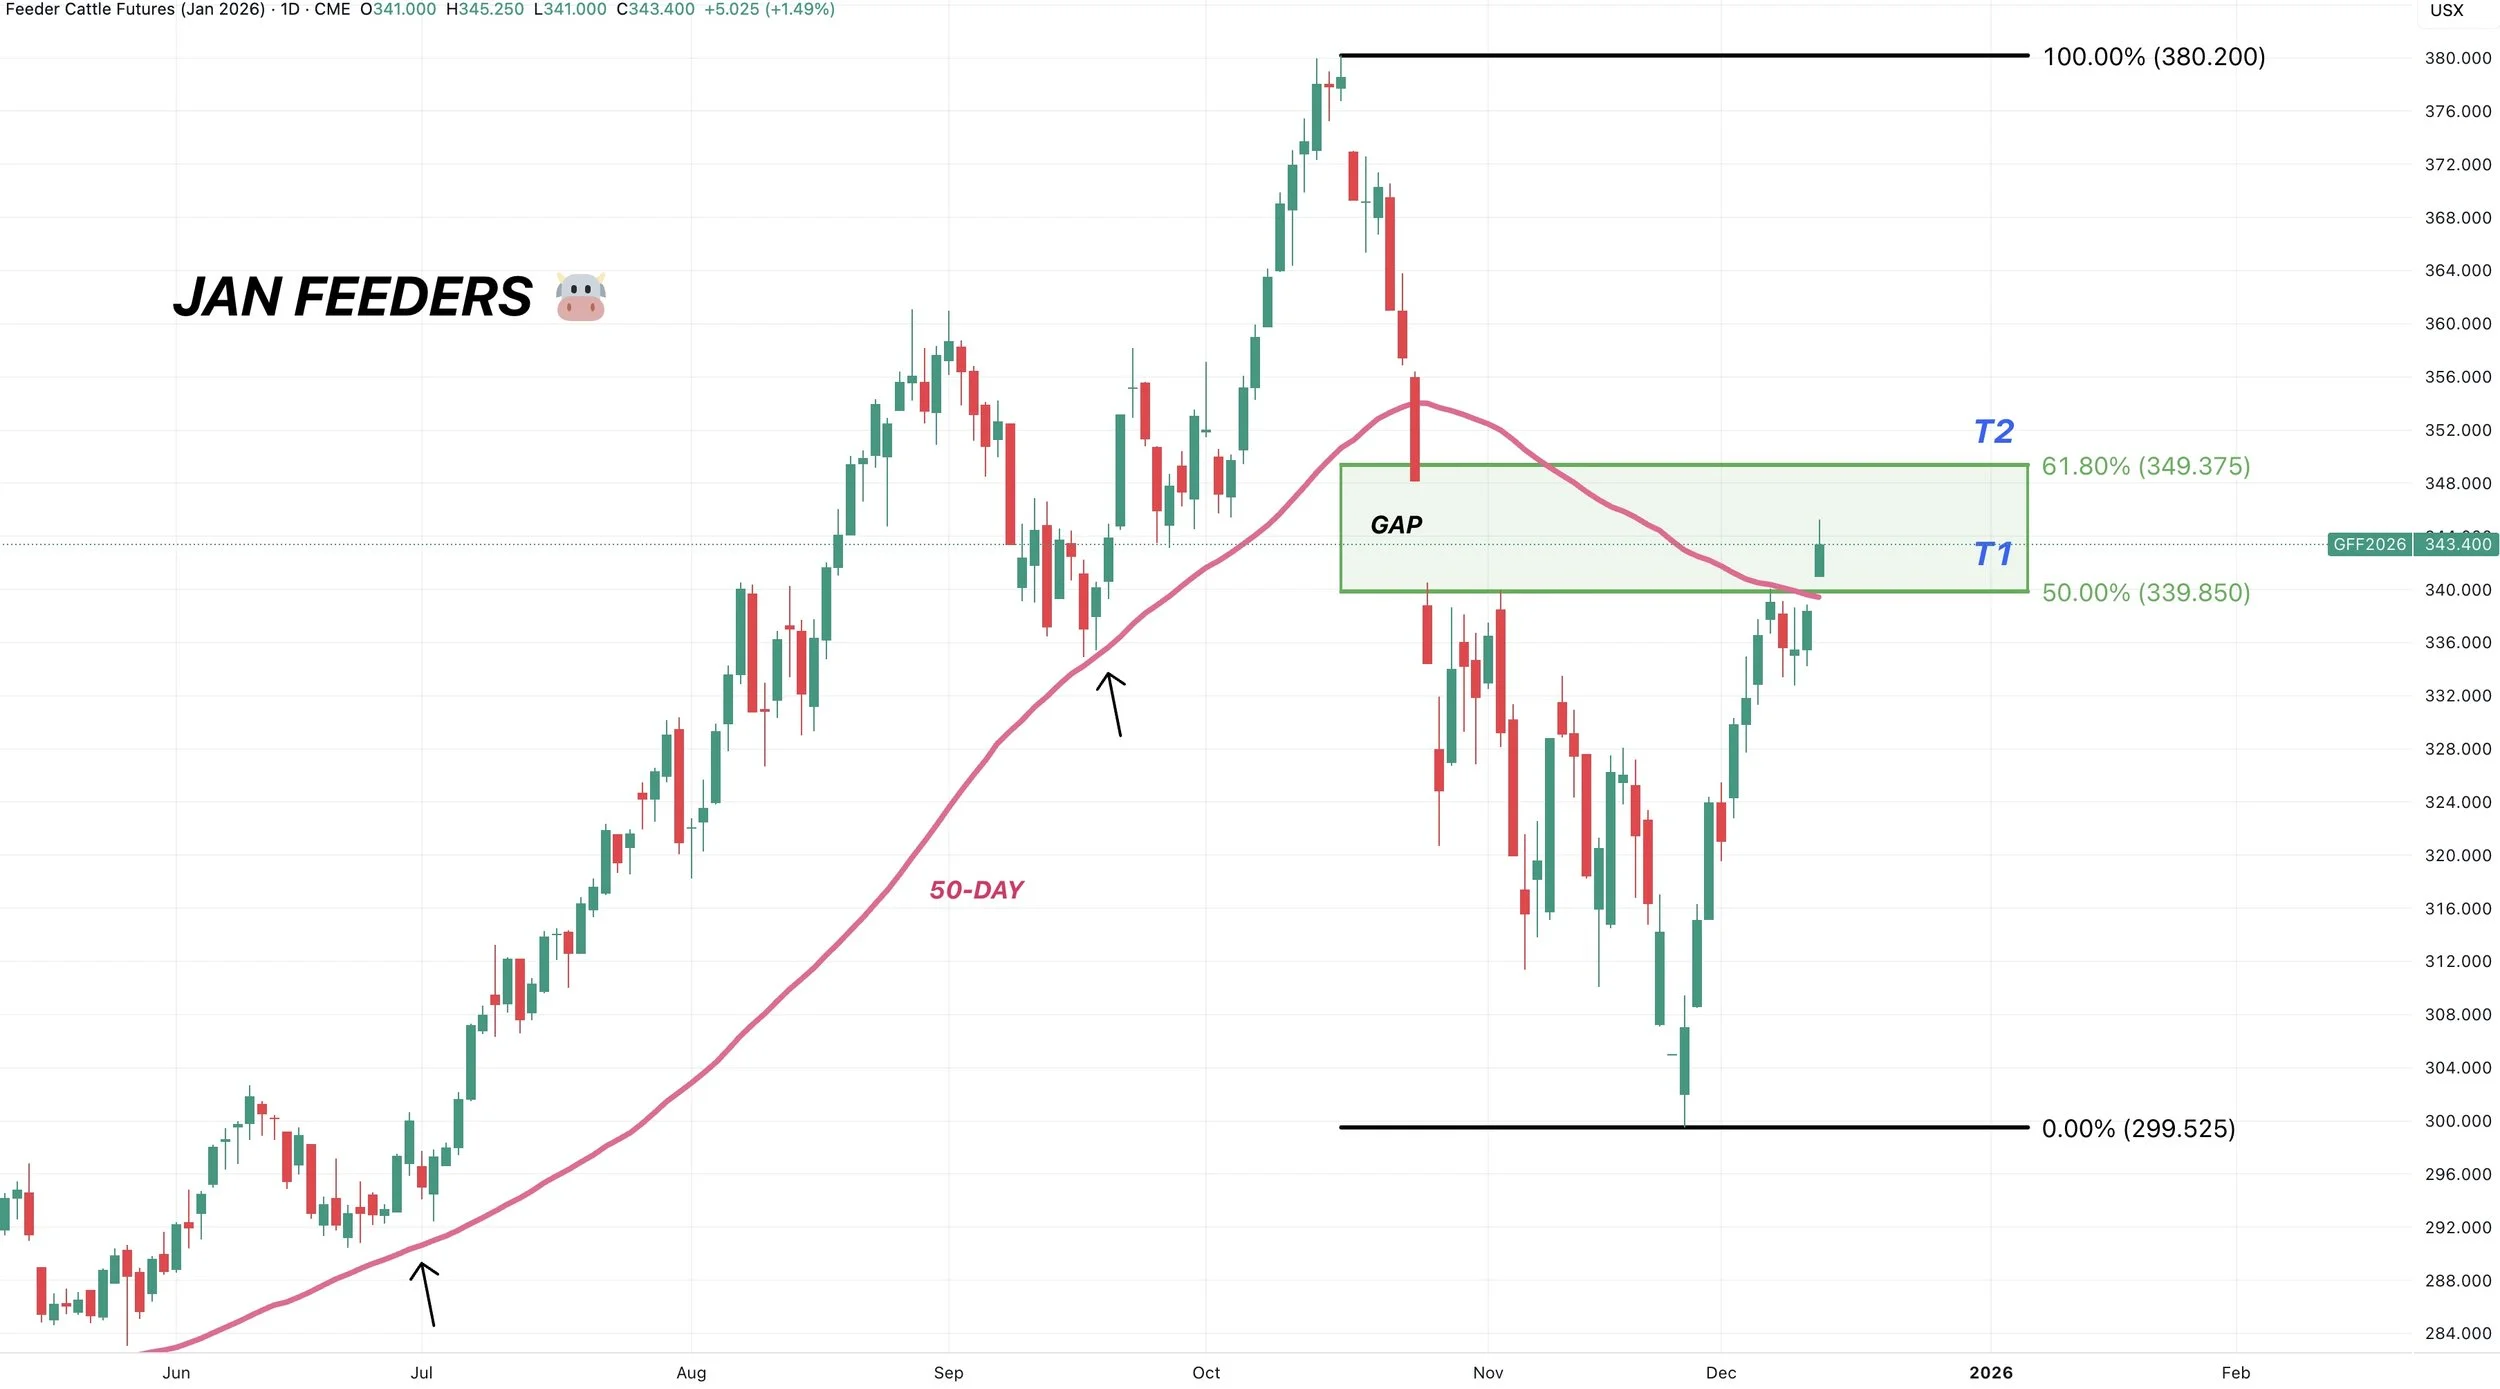
Open Interest
This is something that has me pretty cautious of up here as well.
On the bottom is open interest for Jan feeders.
It's been decreasing this entire rally.
Which means this is a short covering rally.
Meaning shorts are exiting the market, but this rally isn’t fresh longs stepping up and buying into this market.
This usually isn’t something you see if a market is going to go ahead and post new highs.
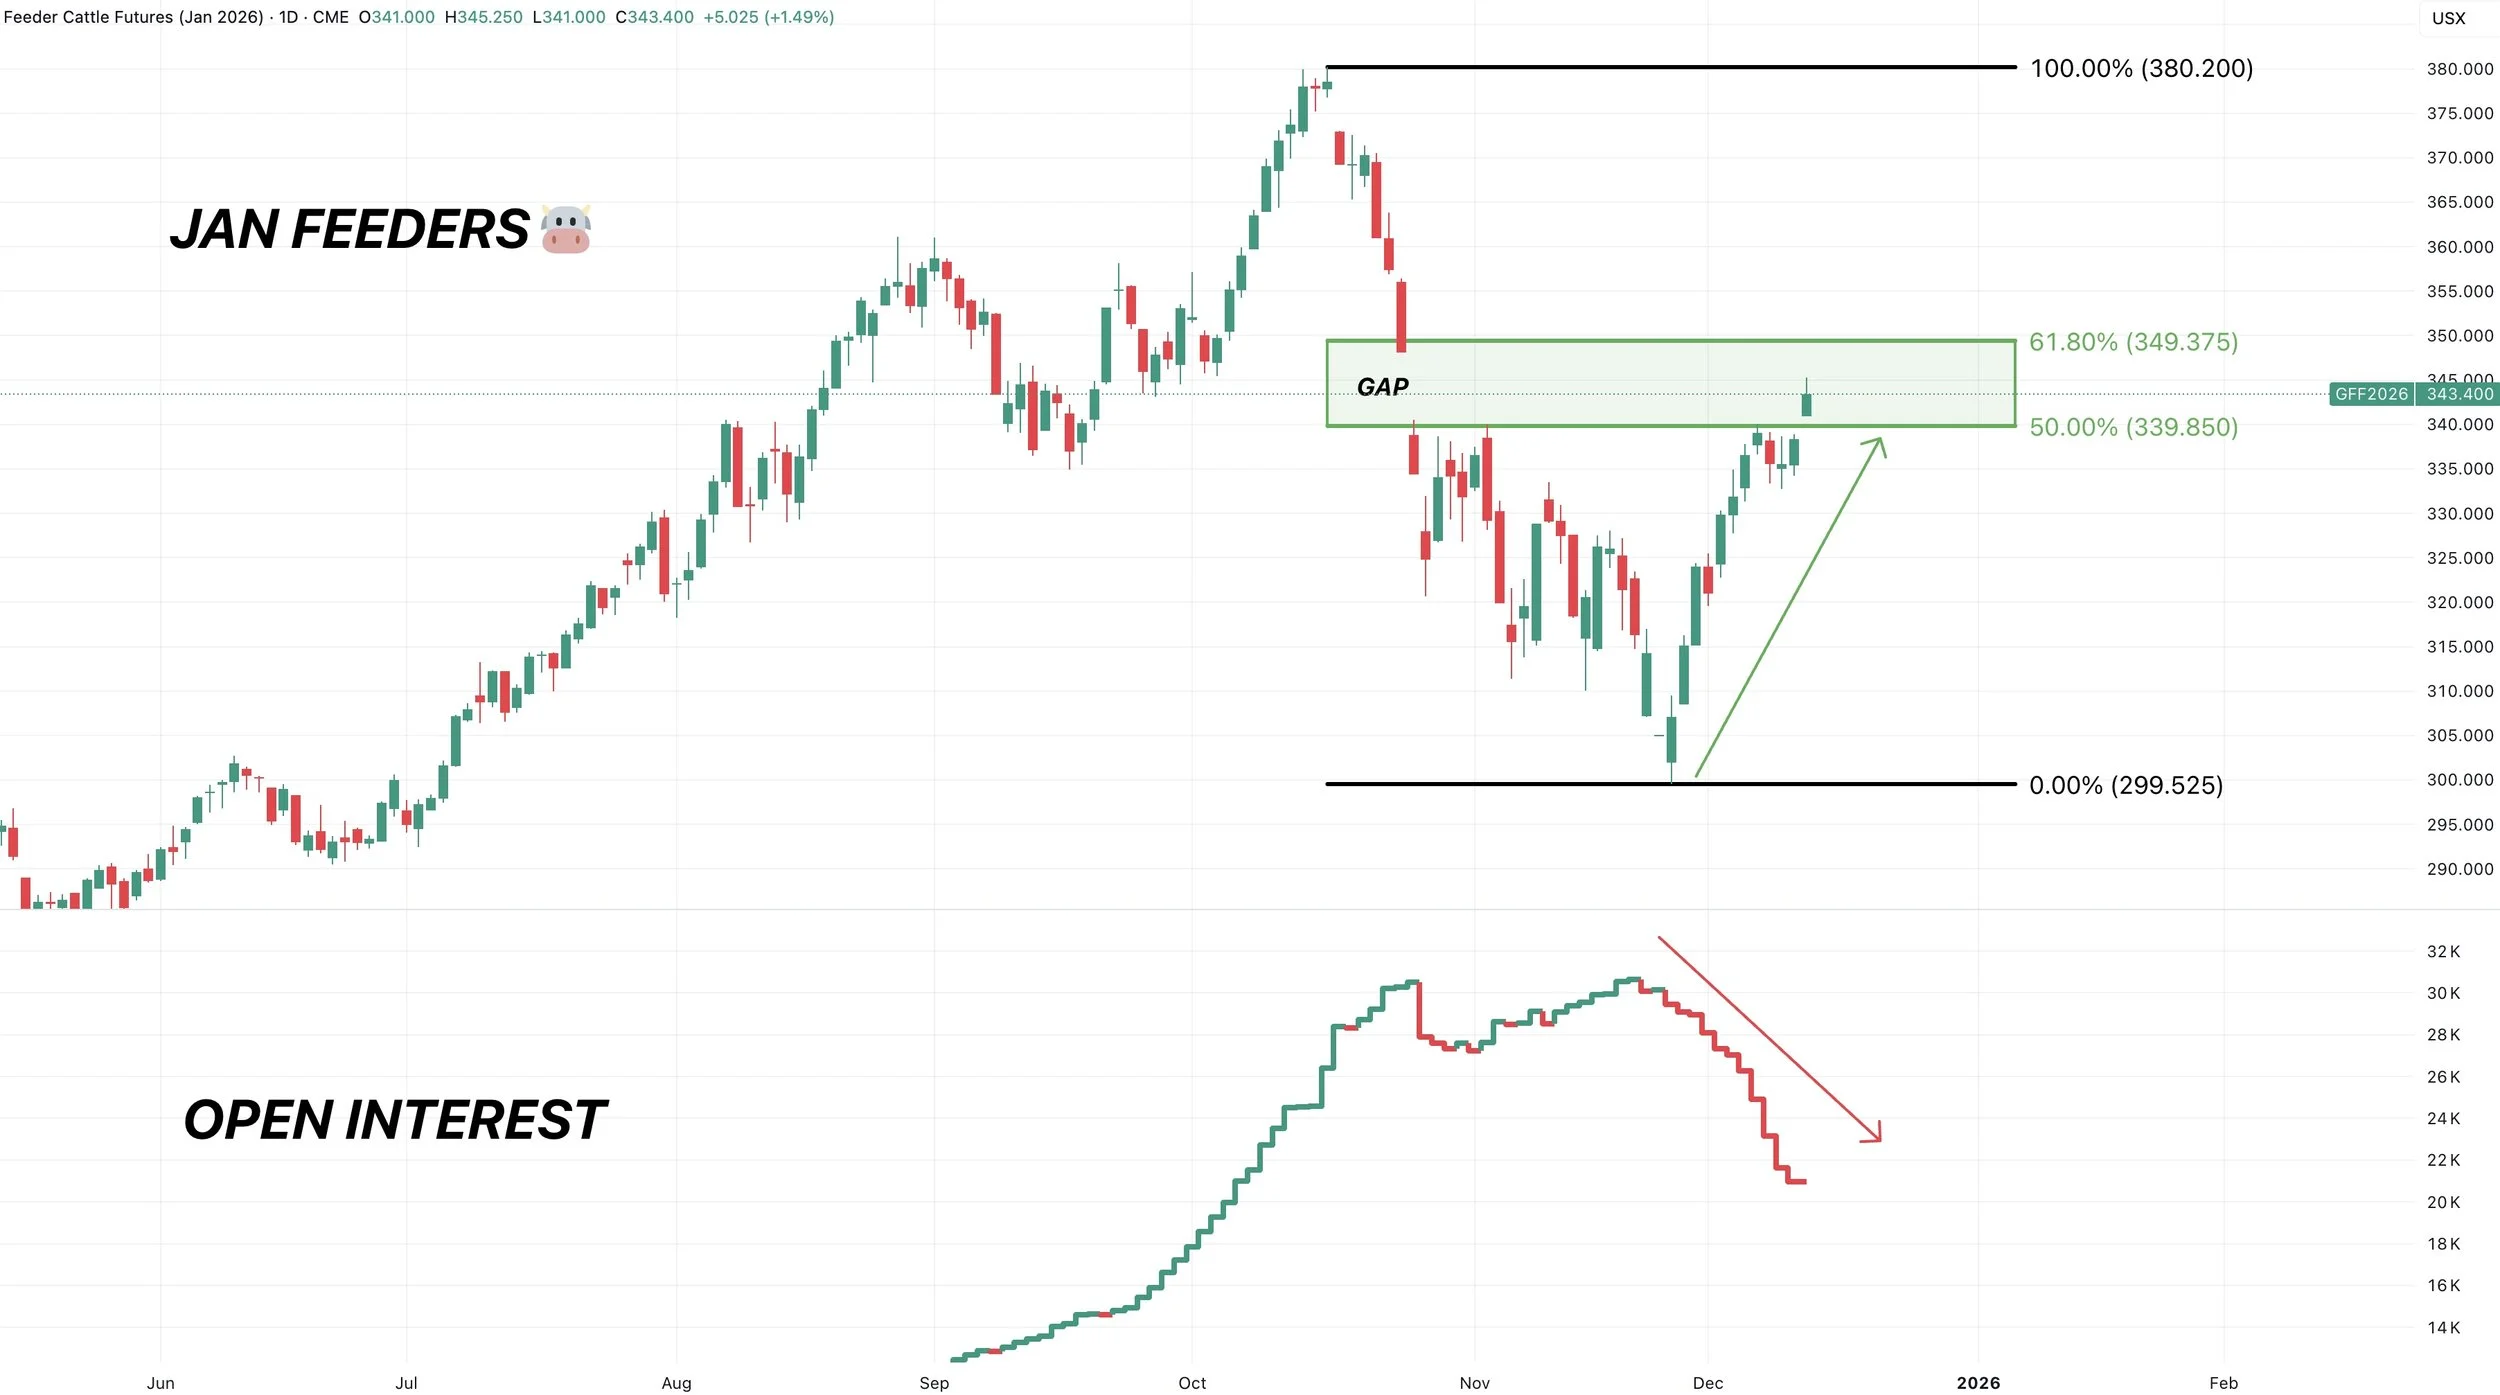
Past Sell or Protection Signals
Dec 11th: 🐮
Cattle sell signal & hedge alert.
Dec 5th: 🐮
Cattle sell signal & hedge alert.
Nov 17th: 🌱
Soybean sell signal & hedge alert.
Nov 13th: 🌽 🌱
Managing risk in corn & beans ahead of USDA report.
Oct 28th: 🌽
Corn sell signal & hedge alert.
Oct 27th: 🌱
Soybean sell signal & hedge alert.
Oct 13th: 🐮
Cattle sell signal & hedge alert.
Aug 22nd: 🌱
Soybean sell signal & hedge alert.
July 31st: 🐮
Cattle sell signal & hedge alert.
July 10th: 🐮
Cattle sell signal & hedge alert.
CLICK HERE TO VIEW
June 5th: 🐮
Cattle sell signal & hedge alert.
June 2nd: 🌾
MPLS wheat sell signal.
April 10th: 🌽
Old crop corn sell signal.
March 19th: 🐮
Cattle hedge & sell signal.
Feb 18th: 🌽 🌾
Old crop KC wheat & old crop corn signal.
Jan 23rd: 🌽 🌱
Corn & beans old crop sell signal.
CLICK HERE TO VIEW
Jan 15th: 🌽 🌱
Corn & beans hedge alert/sell signal.
Jan 2nd: 🐮
Cattle hedge alert at new all-time highs & target.
Dec 11th: 🌽
Corn sell signal at $4.51 200-day MA
CLICK HERE TO VIEW
Oct 2nd: 🌾
Wheat sell signal at $6.12 target
Sep 30th: 🌽
Corn protection signal at $4.23-26
Sep 27th: 🌱
Soybean sell & protection signal at $10.65
Sep 13th: 🌾
Wheat sell signal at $5.98
May 22nd: 🌾
Wheat sell signal when wheat traded +$7.00
Want to Talk?
Our phones are open 24/7 for you guys if you ever need anything or want to discuss your operation.
Hedge Account
Interested in a hedge account? Use the link below to set up an account or shoot Jeremey a call at (605)295-3100.
CATTLE SELL SIGNAL & HEDGE ALERT
On Friday we issued a hedge alert for cattle.
We now like scaling into even more protection.
Whether that is puts, futures, or LRP.
On Friday our advice was to be in the realm of 50% hedged. We now like being up to 75% hedged here. You could also look at rolling up your puts or LRP levels.
If you want to talk specifics or have any questions at all don’t hesitate to give us a call or a text. As futures are not suitable for everyone so you may want to use options instead.
Jeremey: (605)250-3863
Lauren: (806)391-7178
If you would like to work with us one on one and open a hedge account with us call our office:
Office: (806)484-1214
Why the alert?
Friday we hit our first target in both live and feeder cattle. Which was 50% of the entire sell off.
Today we gapped open higher and are approaching that secondary target in live cattle.
Which reclaims 61.8% of the entire sell off. The most common level for a correctional bounce to fail.
We are above the 50-day MA, but now up against the 100-day MA in live cattle.

Feeders have not ran up to that secondary target like live cattle has.
But since live cattle is approaching the target, this signal is also for feeder cattle.
Feeders also left a gap. We have already quickly given back a good part of that gap.
Something else to note is that on both live and feeders, the 50-day MA crossed below the 100-day MA. I don’t love MA cross overs as they are somewhat of a delayed indicator.
But that is considered a “death cross” and suggests we are in a longer term downtrend.
Then we do also have open interest suggesting that this rally is shorts leaving the market rather than new longs piling in. As open interest has been decreasing not increasing. Not usually something you see in a market that is going to run up and post new highs.

Don’t miss future updates or signals
Your free trial has ended.
Make sure you subscribe before your full access is removed.
Here is extended access to our Black Friday sale that ended a few weeks ago.
Past Sell or Protection Signals
Dec 5th: 🐮
Cattle sell signal & hedge alert.
Nov 17th: 🌱
Soybean sell signal & hedge alert.
Nov 13th: 🌽 🌱
Managing risk in corn & beans ahead of USDA report.
Oct 28th: 🌽
Corn sell signal & hedge alert.
Oct 27th: 🌱
Soybean sell signal & hedge alert.
Oct 13th: 🐮
Cattle sell signal & hedge alert.
Aug 22nd: 🌱
Soybean sell signal & hedge alert.
July 31st: 🐮
Cattle sell signal & hedge alert.
July 10th: 🐮
Cattle sell signal & hedge alert.
CLICK HERE TO VIEW
June 5th: 🐮
Cattle sell signal & hedge alert.
June 2nd: 🌾
MPLS wheat sell signal.
April 10th: 🌽
Old crop corn sell signal.
March 19th: 🐮
Cattle hedge & sell signal.
Feb 18th: 🌽 🌾
Old crop KC wheat & old crop corn signal.
Jan 23rd: 🌽 🌱
Corn & beans old crop sell signal.
CLICK HERE TO VIEW
Jan 15th: 🌽 🌱
Corn & beans hedge alert/sell signal.
Jan 2nd: 🐮
Cattle hedge alert at new all-time highs & target.
Dec 11th: 🌽
Corn sell signal at $4.51 200-day MA
CLICK HERE TO VIEW
Oct 2nd: 🌾
Wheat sell signal at $6.12 target
Sep 30th: 🌽
Corn protection signal at $4.23-26
Sep 27th: 🌱
Soybean sell & protection signal at $10.65
Sep 13th: 🌾
Wheat sell signal at $5.98
May 22nd: 🌾
Wheat sell signal when wheat traded +$7.00
Want to Talk?
Our phones are open 24/7 for you guys if you ever need anything or want to discuss your operation.
Hedge Account
Interested in a hedge account? Use the link below to set up an account or shoot Jeremey a call at (605)295-3100.
WHAT’S HAPPENING IN GRAINS
AUDIO COMMENTARY
Cattle still at our targets (charts below)*
Area we could easily fail in cattle. Gap doesn’t have to be filled in cattle
Still feel there is risk in cattle
Beans approaching golden zone (chart below)*
Argy cut taxes yet beans strong today
Buying back sold calls for pennies on the dollar
Bear trap in wheat? (chart below)*
Report wasn’t friendly for wheat
Putting wheat on the market when the market wants it
Could corn exports increase more?
World corn tightest in over a decade
World story amplifies weather scares
Corn needs to clear $4.50 (chart below)*
What if feed demand comes down?
Interest rates dropped again. Will this help push the funds to get long?
Bridge payments
Listen to today’s audio below
Want to talk? (605)250-3863
Your free trial has ended
Don’t miss our future signals or updates
Subscribe for full access
Here is extended access to our Black Friday sale
CHARTS
Jan Feeder 🐮
Still battling this first point of interest.
50% of the sell off.
The 50-day MA which used to be big support (now resistance).
This is a big spot that we could easily fail at, hence the sell signal.
If the rally continues, the next target is the 61.8% level and the gap fill

Feb Live 🐮
We are right at that 50-day MA that used to be a a critical support.
We’ve reclaimed 50% of the sell off.
Big point of interest here.
If we go higher, next target is 61.8% level.
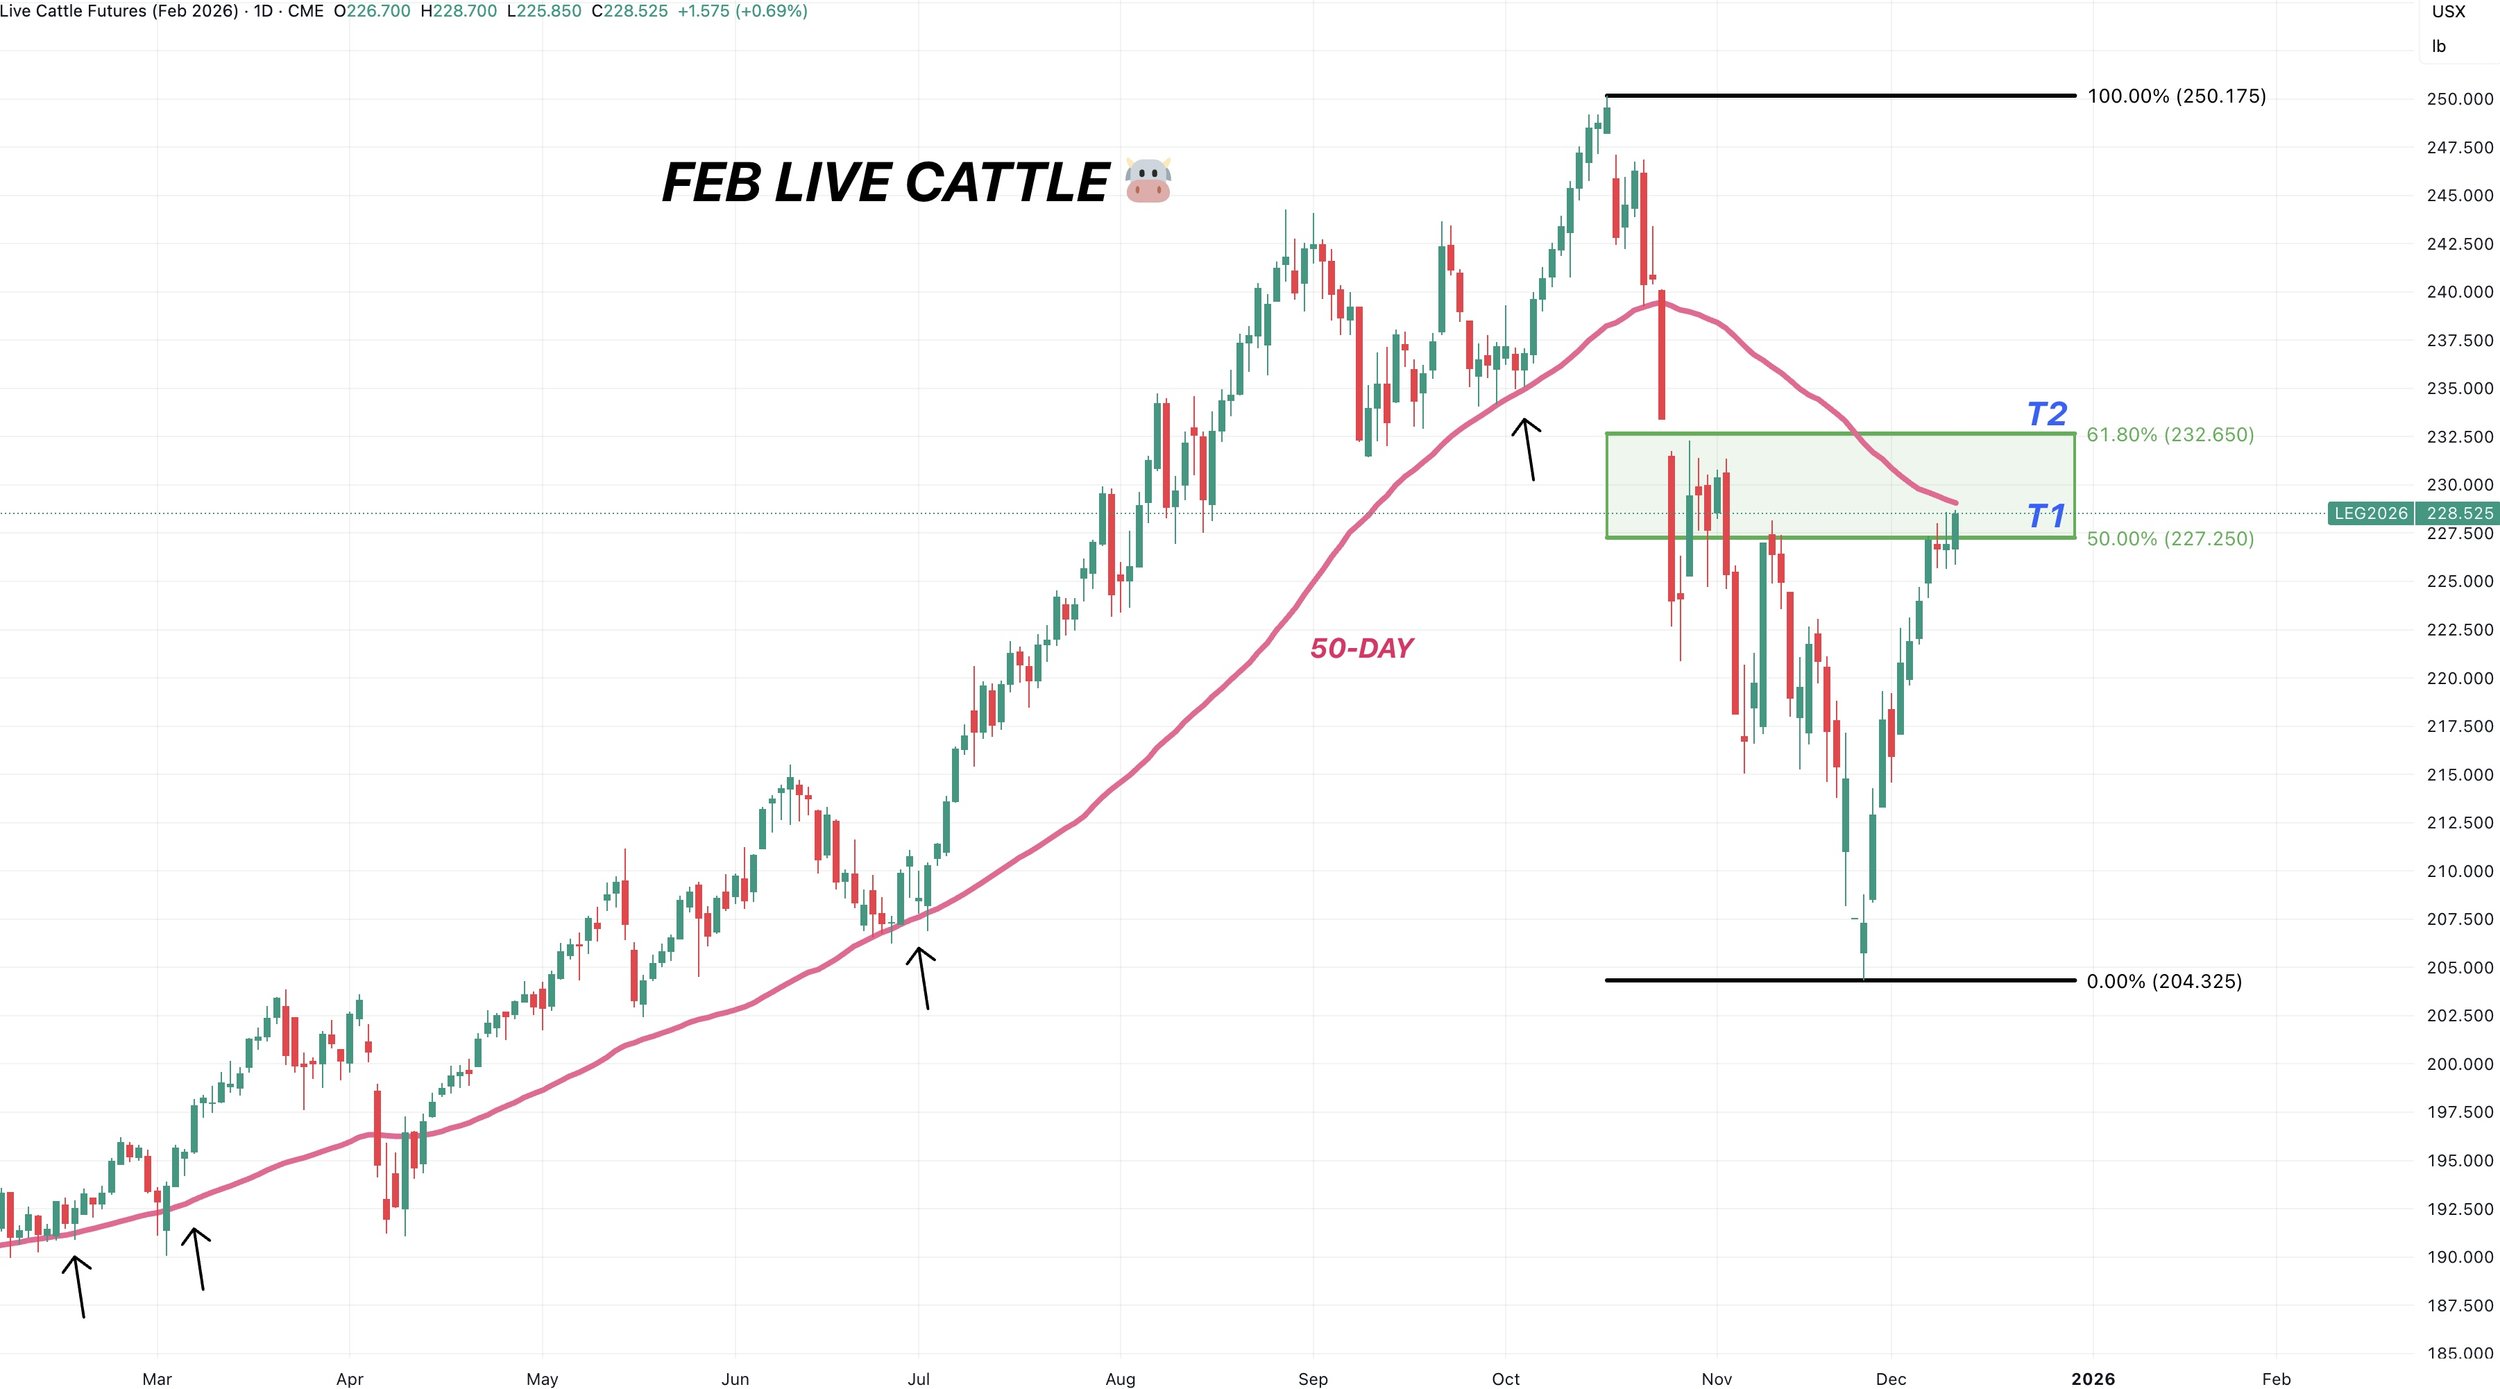
Jan Beans 🌱
This green box has been my downside target since those highs.
The golden zone.
The most common spot for a correction to end.
Finding a bottom in here makes sense.
We “could” fill the gap. But we do not “have” to.
This was a breakaway gap. The gap did not fill within the first few days. Breakaway gaps only fill 35% of the time.
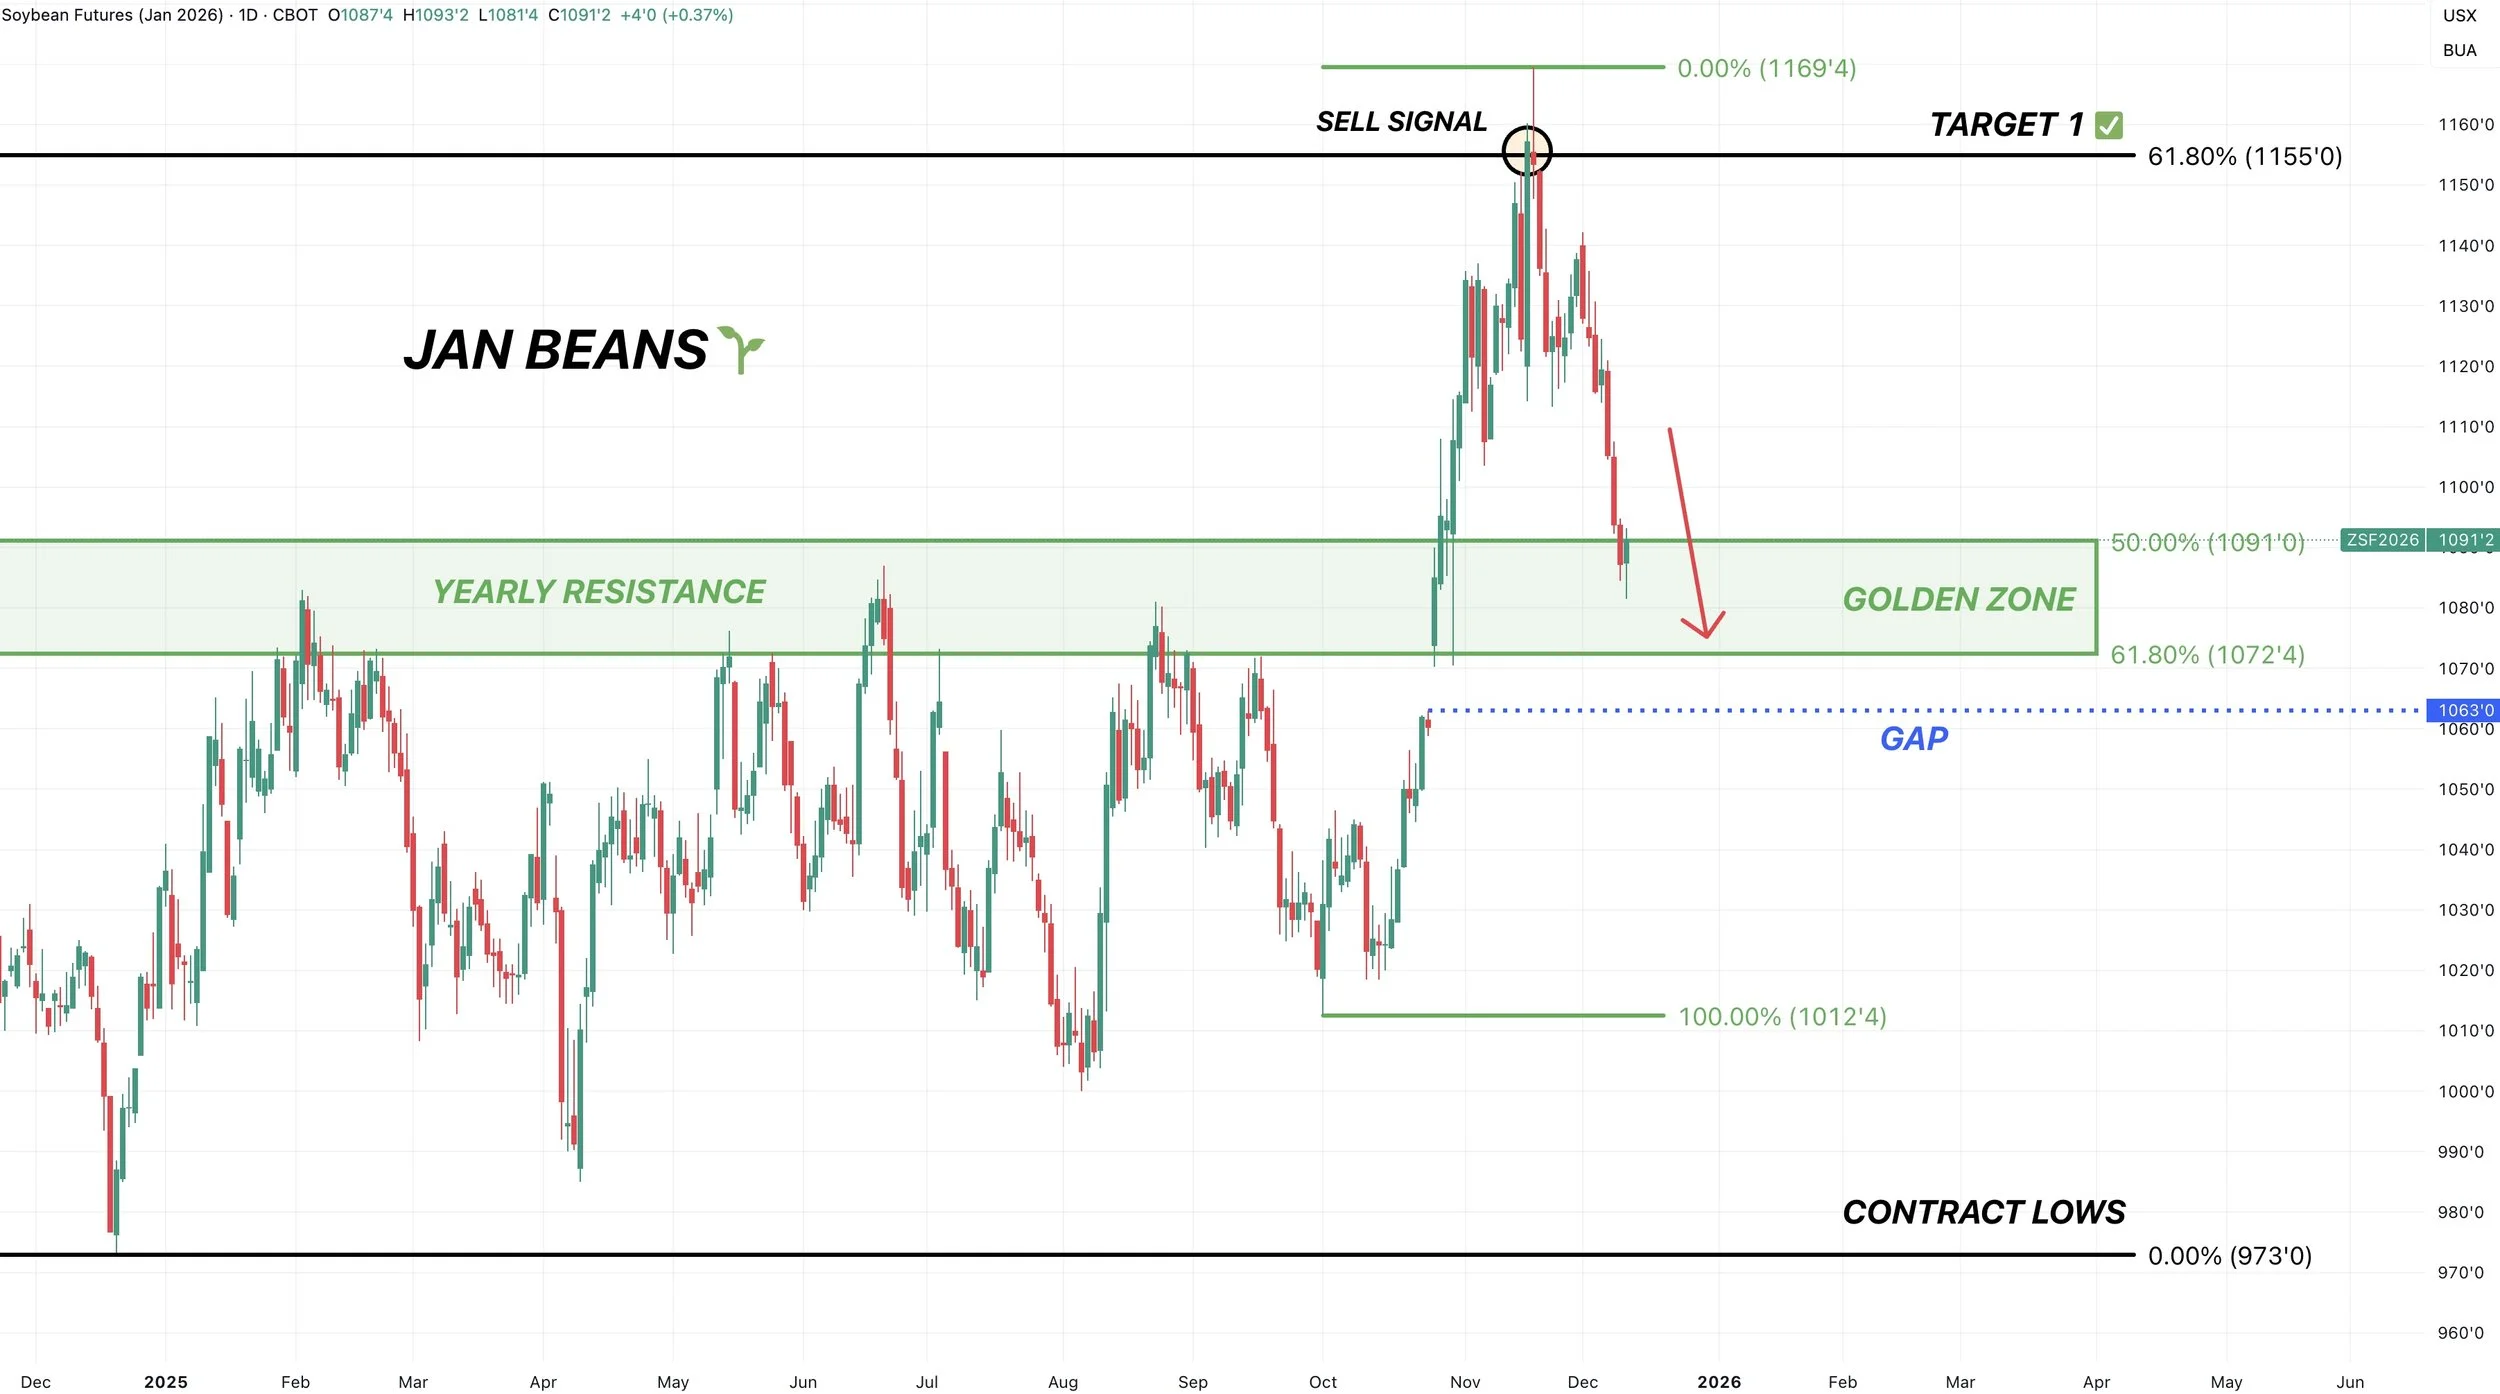
March Corn 🌽
Really need to clear $4.50 for more upside.
To the downside, need to hold red box.

March Wheat 🌾
Not the best look here.
Broke below the golden fib. 61.8% of the entire rally.
Rule of thumb is that if you close below this level 2 days in a row, the odds favor us heading lower.
So we need to close above tomorrow or we could be in for further downside.
If we close above it tomorrow, this could be a bear trap.
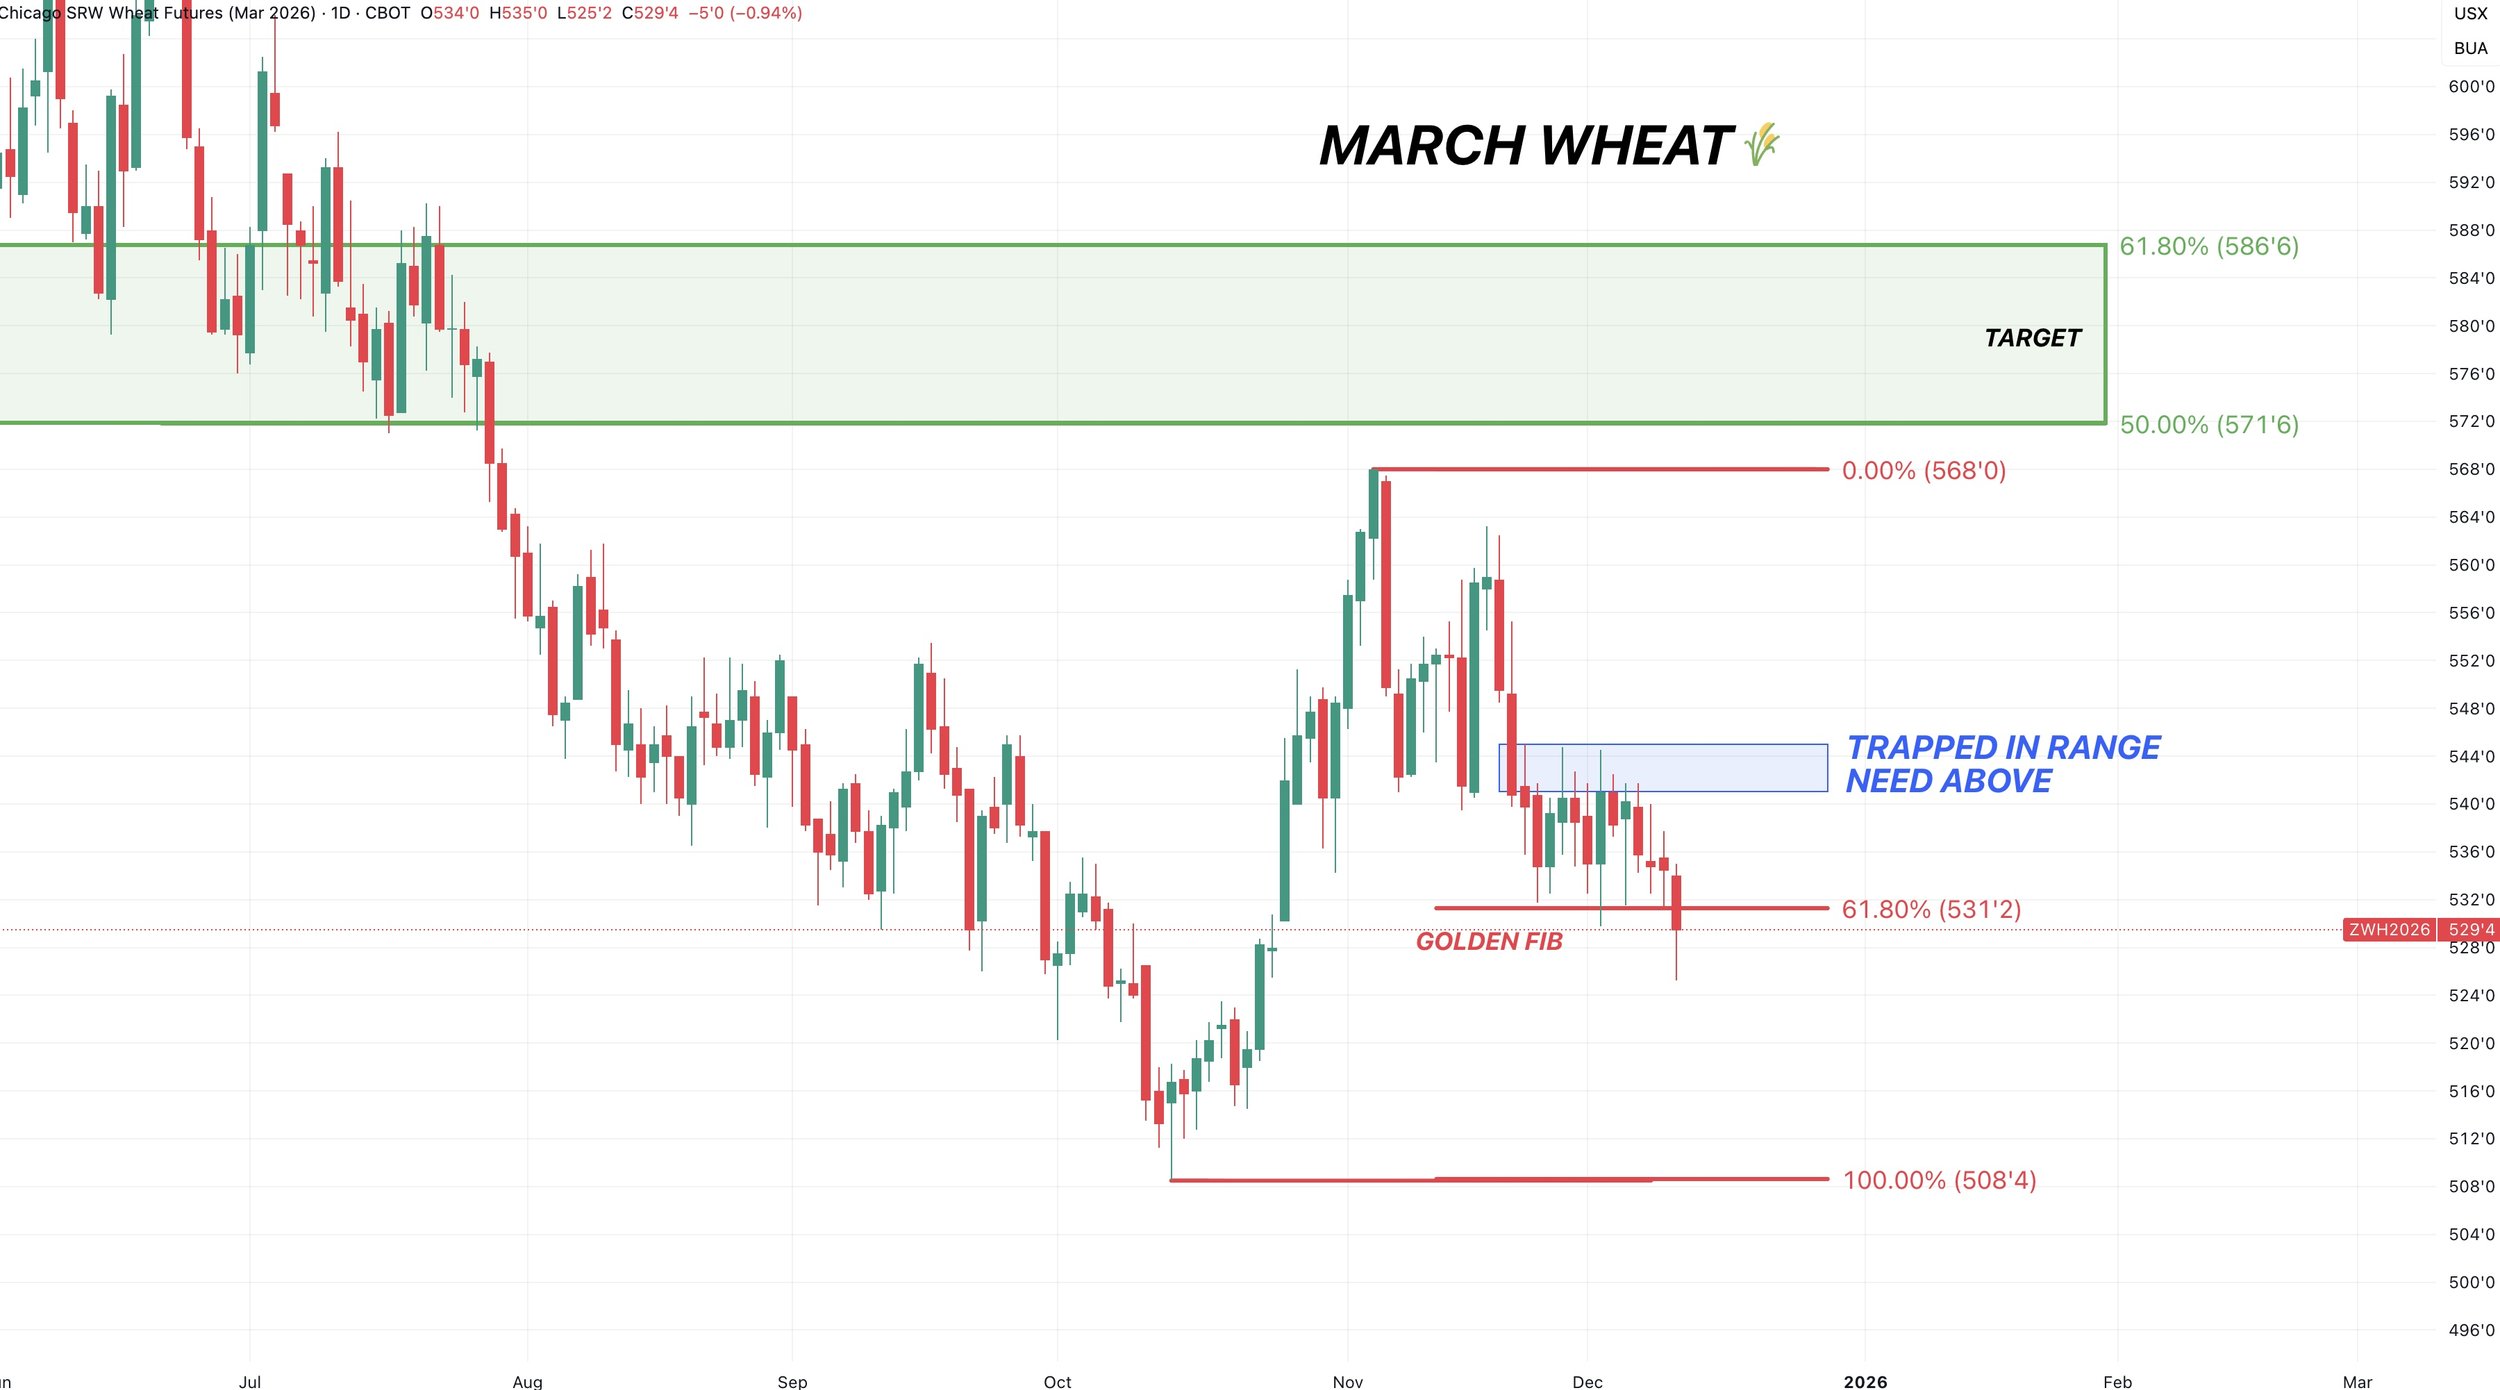
Past Sell or Protection Signals
Dec 5th: 🐮
Cattle sell signal & hedge alert.
Nov 17th: 🌱
Soybean sell signal & hedge alert.
Nov 13th: 🌽 🌱
Managing risk in corn & beans ahead of USDA report.
Oct 28th: 🌽
Corn sell signal & hedge alert.
Oct 27th: 🌱
Soybean sell signal & hedge alert.
Oct 13th: 🐮
Cattle sell signal & hedge alert.
Aug 22nd: 🌱
Soybean sell signal & hedge alert.
July 31st: 🐮
Cattle sell signal & hedge alert.
July 10th: 🐮
Cattle sell signal & hedge alert.
CLICK HERE TO VIEW
June 5th: 🐮
Cattle sell signal & hedge alert.
June 2nd: 🌾
MPLS wheat sell signal.
April 10th: 🌽
Old crop corn sell signal.
March 19th: 🐮
Cattle hedge & sell signal.
Feb 18th: 🌽 🌾
Old crop KC wheat & old crop corn signal.
Jan 23rd: 🌽 🌱
Corn & beans old crop sell signal.
CLICK HERE TO VIEW
Jan 15th: 🌽 🌱
Corn & beans hedge alert/sell signal.
Jan 2nd: 🐮
Cattle hedge alert at new all-time highs & target.
Dec 11th: 🌽
Corn sell signal at $4.51 200-day MA
CLICK HERE TO VIEW
Oct 2nd: 🌾
Wheat sell signal at $6.12 target
Sep 30th: 🌽
Corn protection signal at $4.23-26
Sep 27th: 🌱
Soybean sell & protection signal at $10.65
Sep 13th: 🌾
Wheat sell signal at $5.98
May 22nd: 🌾
Wheat sell signal when wheat traded +$7.00
Want to Talk?
Our phones are open 24/7 for you guys if you ever need anything or want to discuss your operation.
Hedge Account
Interested in a hedge account? Use the link below to set up an account or shoot Jeremey a call at (605)295-3100.
USDA RECAP. NOW WHAT?
MARKET UPDATE
You can scroll to read the usual update as well. As the written version is the exact same as the video.
Timestamps for video:
Overview: 0:00min
Corn: 2:10min
Beans: 10:10min
Wheat: 12:35min
Cattle: 15:10min
Want to talk about your situation?
(605)250-3863
Your free trial has ended
Don’t miss future updates or signals
Subscribe to keep full access
Here is extended access to our Black Friday sale
Futures Prices Close
Overview
Grains mixed following the USDA report. With corn leading the way higher and soybeans leading the way lower.
As soybeans have now traded lower the last 6 of 7 days.
Not a ton of fresh news aside from the USDA report, so let's jump right in.
USDA Recap
As expected, this report was on the boring side. With no changes to the supply side of the balance sheet.
As for US carryout, we saw corn drop by -125 million to 2.03 billion due to a bump in exports.
This drop was about -100 million more than expected.
Meanwhile, soybeans and wheat were both left completely unchanged from last month. The trade was not looking for big changes to begin with.

Here is the updated balance sheet for corn.
The only change we saw was corn exports being raised by +125 million.
So this resulted in our carryout dropping by -125 million.
We still have a carryout of just over 2 billion bushels.
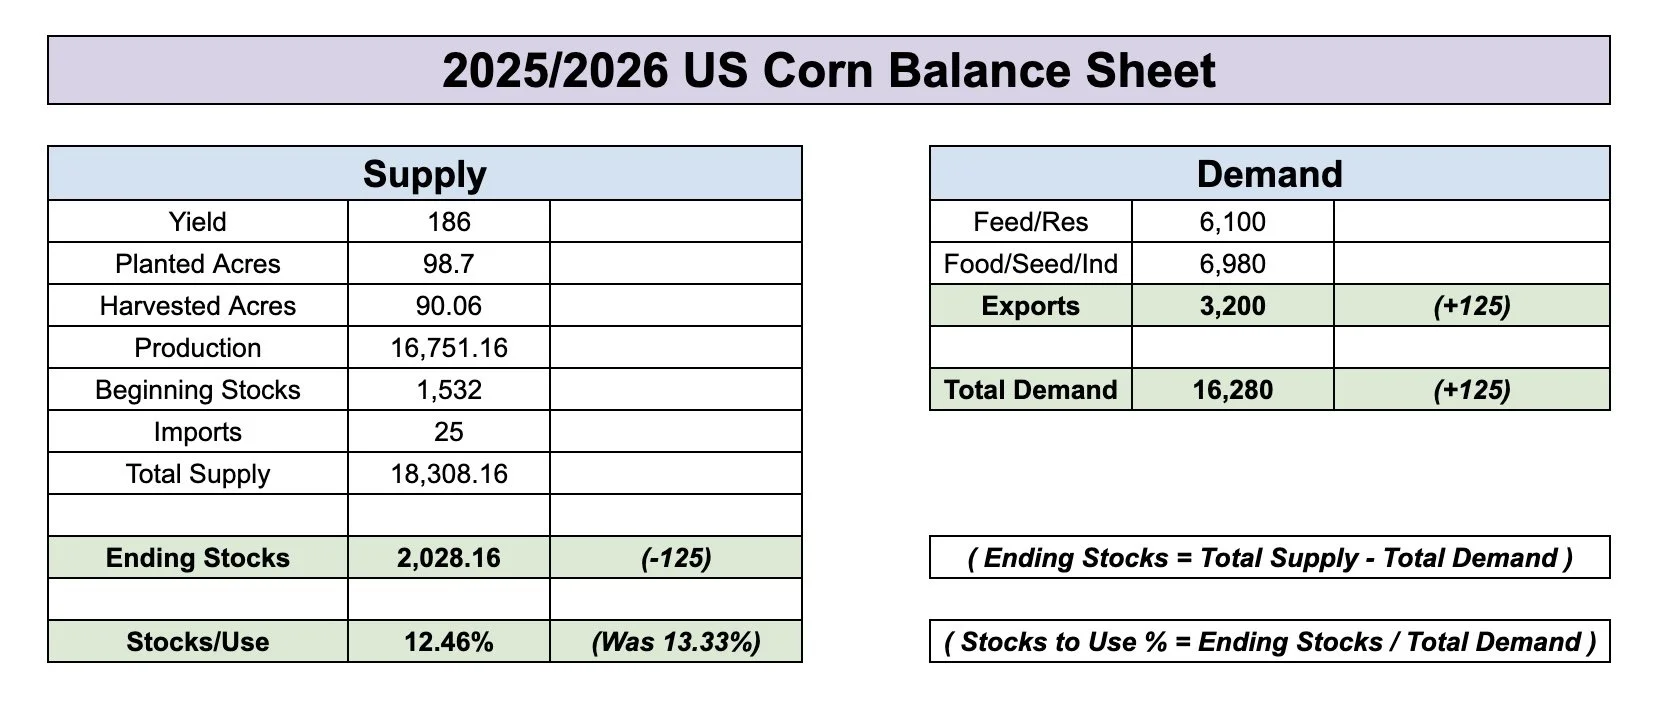
Here is the balance sheet for beans.
Completely left unchanged.
Carryout remains at 290 million.
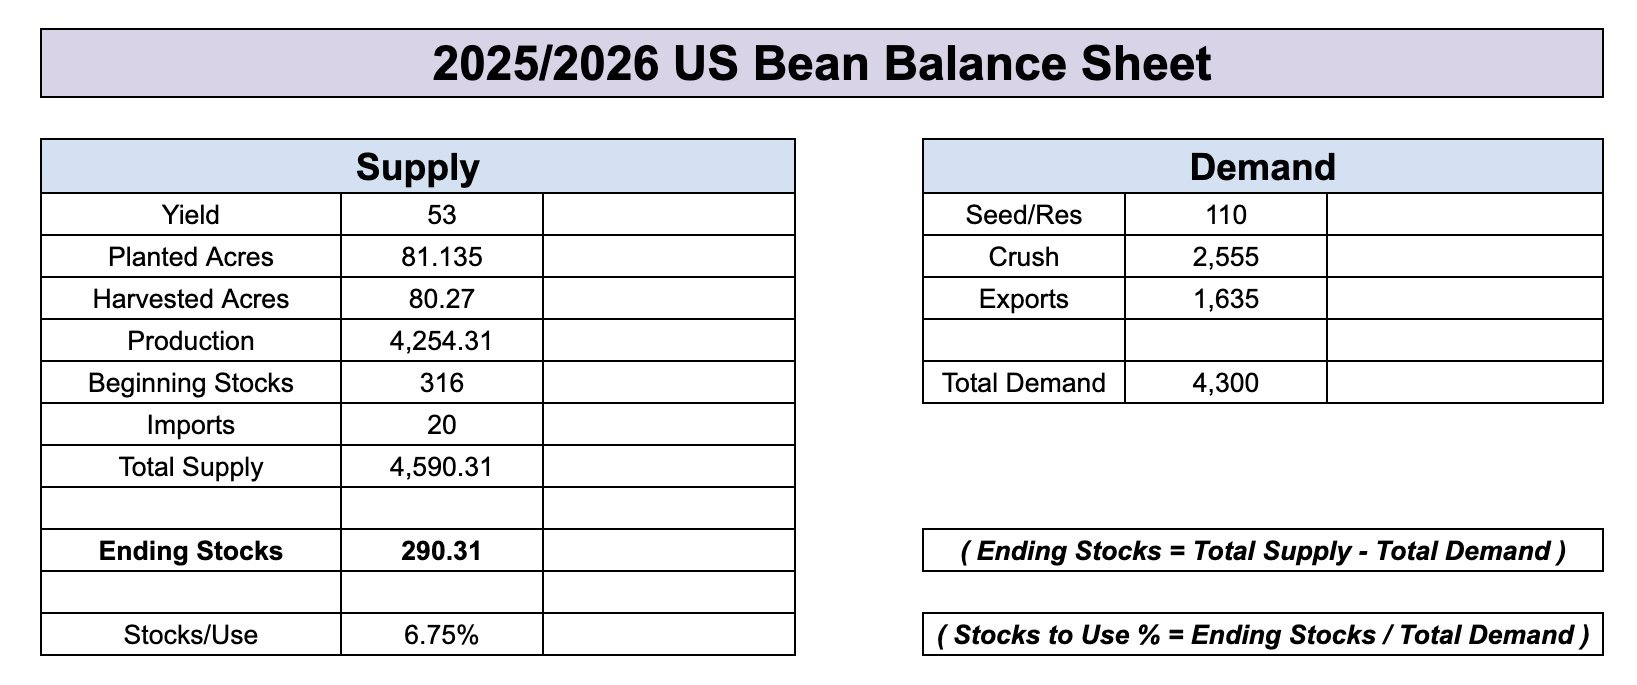
Despite not seeing "massive" changes.
This was the 2nd largest drop we've seen to corn carryout for the Dec report in the last decade. Only behind last year's -200 million drop.
5 of the last 10 years the USDA left the carryout completely unchanged.
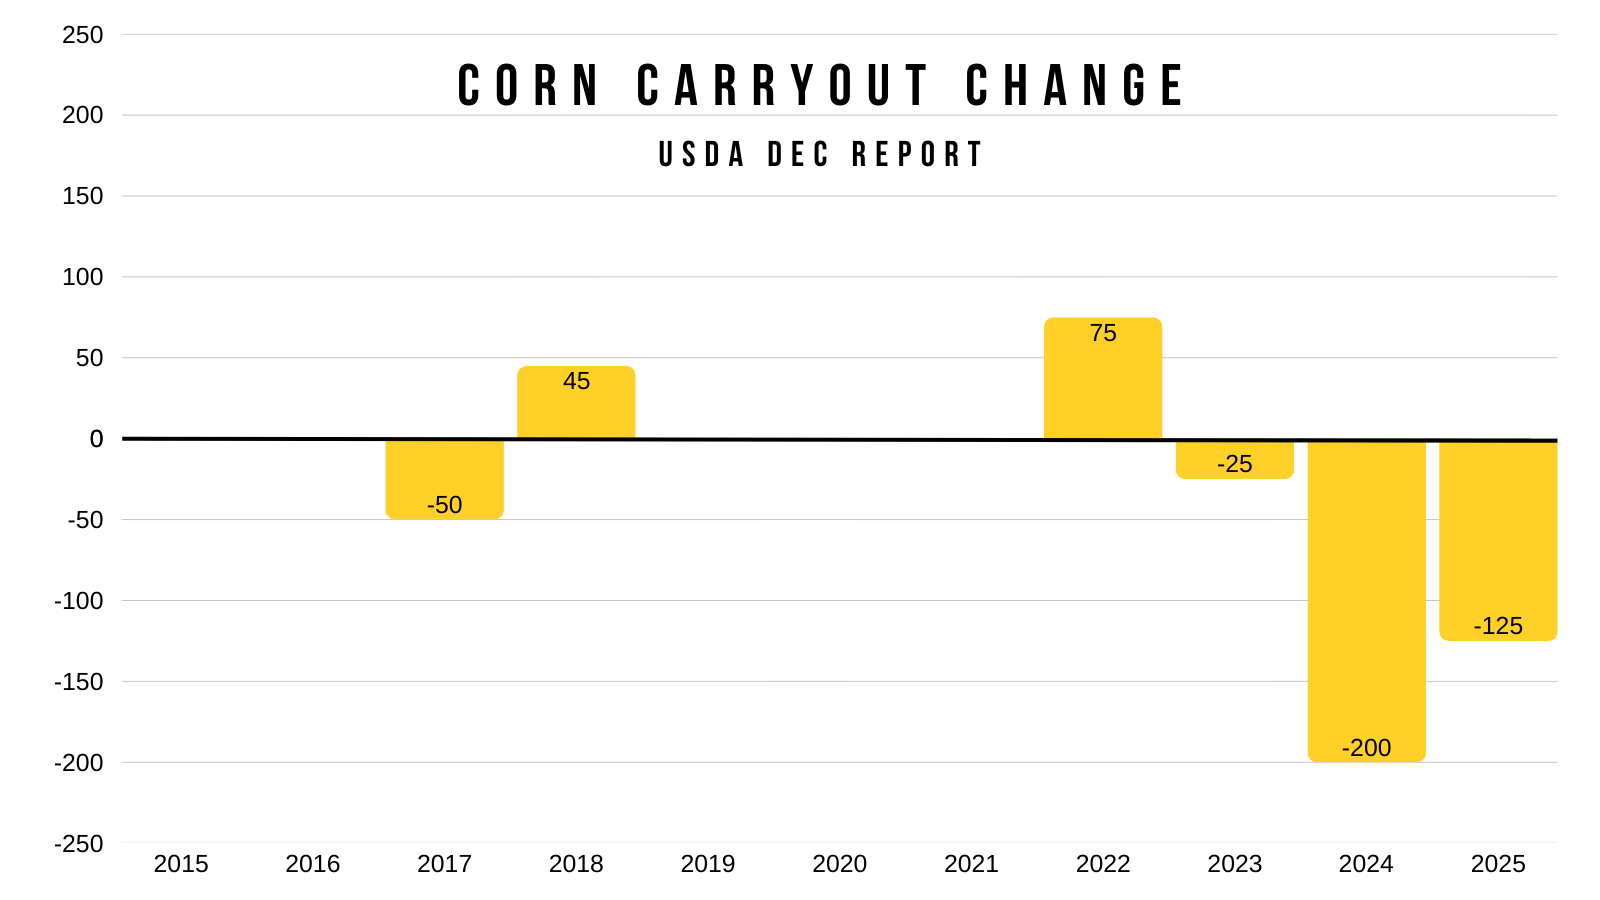
It's no surprise we didn’t see any changes to soybeans.
They've only changed the soybean balance sheet 3 times in the last decade.
With the last one being back in 2020.

World Carryout
The world numbers did provide somewhat of a surprise.
Corn surprised slightly lower than expected.
Soybeans came in right about as expected.
However wheat surprised above the expectations.
As the USDA bumped a lot of countries wheat estimates.
Here are the changes they made:
Austraila (+1 MMT)
Argy (+2 MMT)
Canada (+3 MMT)
EU (+1.7 MMT)
Russia (+1 MMT)

South America Numbers
The South America numbers were left completely unchanged.

Today's Main Takeaways
Corn
Fundamentals:
Here is an updated visual of our stocks to use ratio.
We went from 13.33% last month to 12.45% today.
On this chart, I put where our stocks to use ratio was pegged at during the Nov and Dec reports for both this year and last year.
Last Nov: 12.90%
This Nov: 13.33%
Last Dec: 11.40%
This Dec: 12.45%
Last Year Final: 10.11%
So currently, it does appear that we were in a "more bullish" scenario last year when compared to this year.
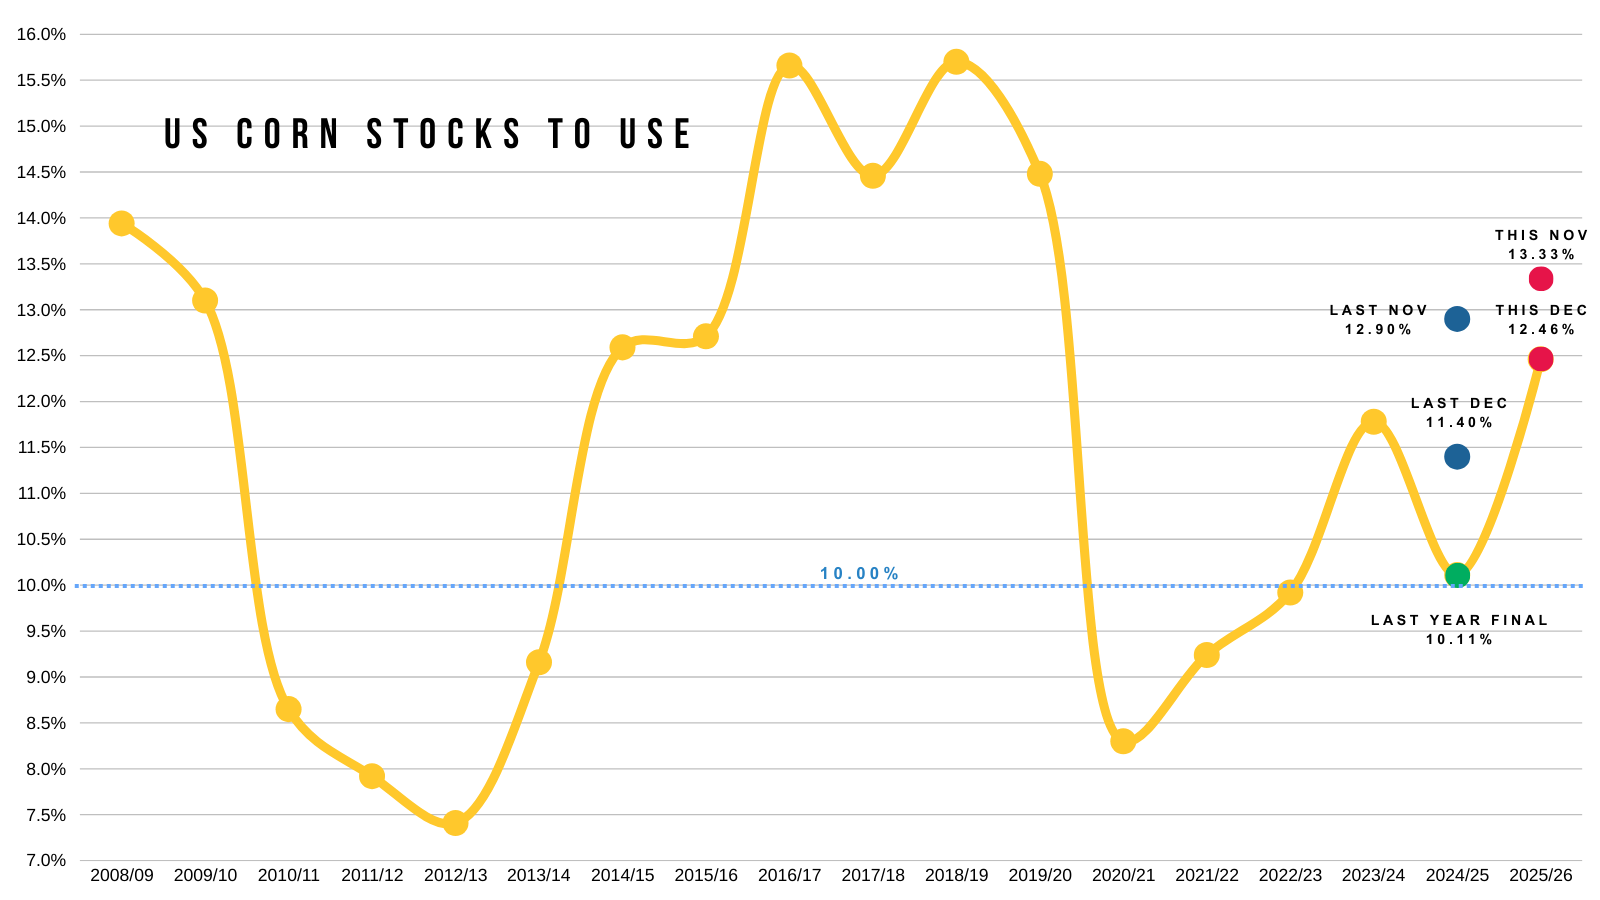
Here is a visual of our carryout changes over the year.
Blue line = this year
Green line = last year
Last year we started to drop pretty sharply after November.
Last Nov: 1.94
This Nov: 2.15
Last Dec: 1.74
This Dec: 2.03
Last Jan: 1.54
Again, it appears that the corn situation isn’t quiet as friendly as it was last year barring some major change in Jan. Which is something we saw last Jan.
As the USDA dropped carryout by -200 million in both the Dec and Jan report's last year.
Bringing carryout from 1.94 to 1.54 billion. A massive change.
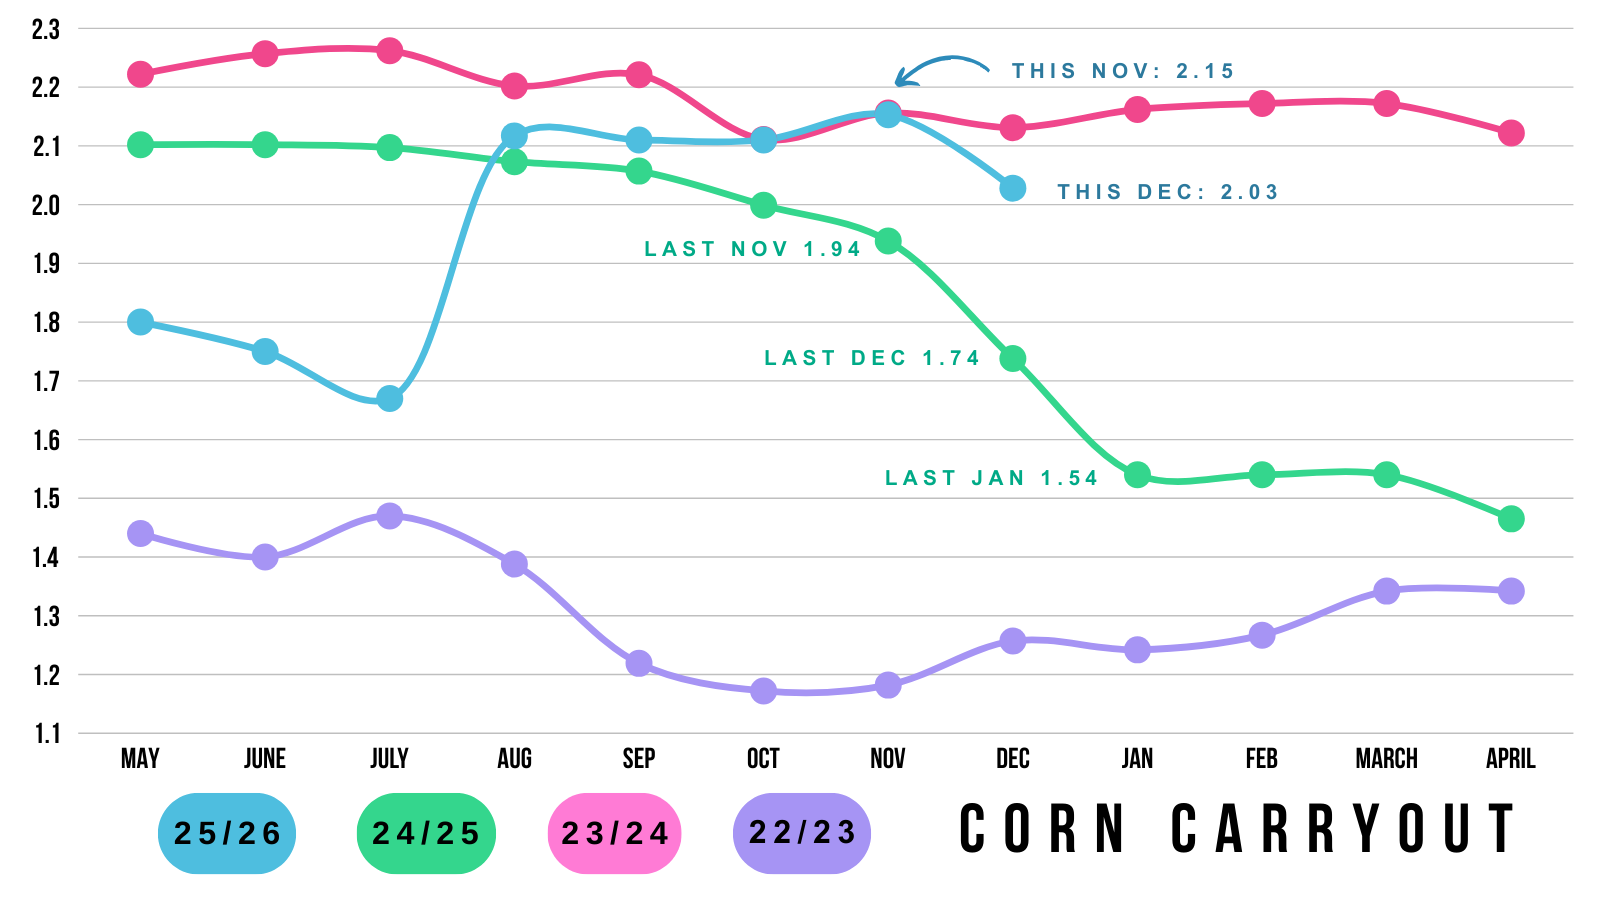
Looking towards the Jan report, I've shown this chart before.
We have a yield of 186.
The biggest drop we've seen in the Jan report in recent memory was -3.80 bpa back in both 2020 and 2024.
Which would put us in that 182-183 range if we saw that same size of drop.
So it's probably more reasonable to think we see them peg yield around there rather than 180 or lower. It could happen, but we've never seen a yield drop of that magnitude before.
We did just go a few months without having a report, and some of their data might not have been the best. So perhaps we do see a bigger change than normal. But it would take the biggest drop we've ever seen to get down to 180.
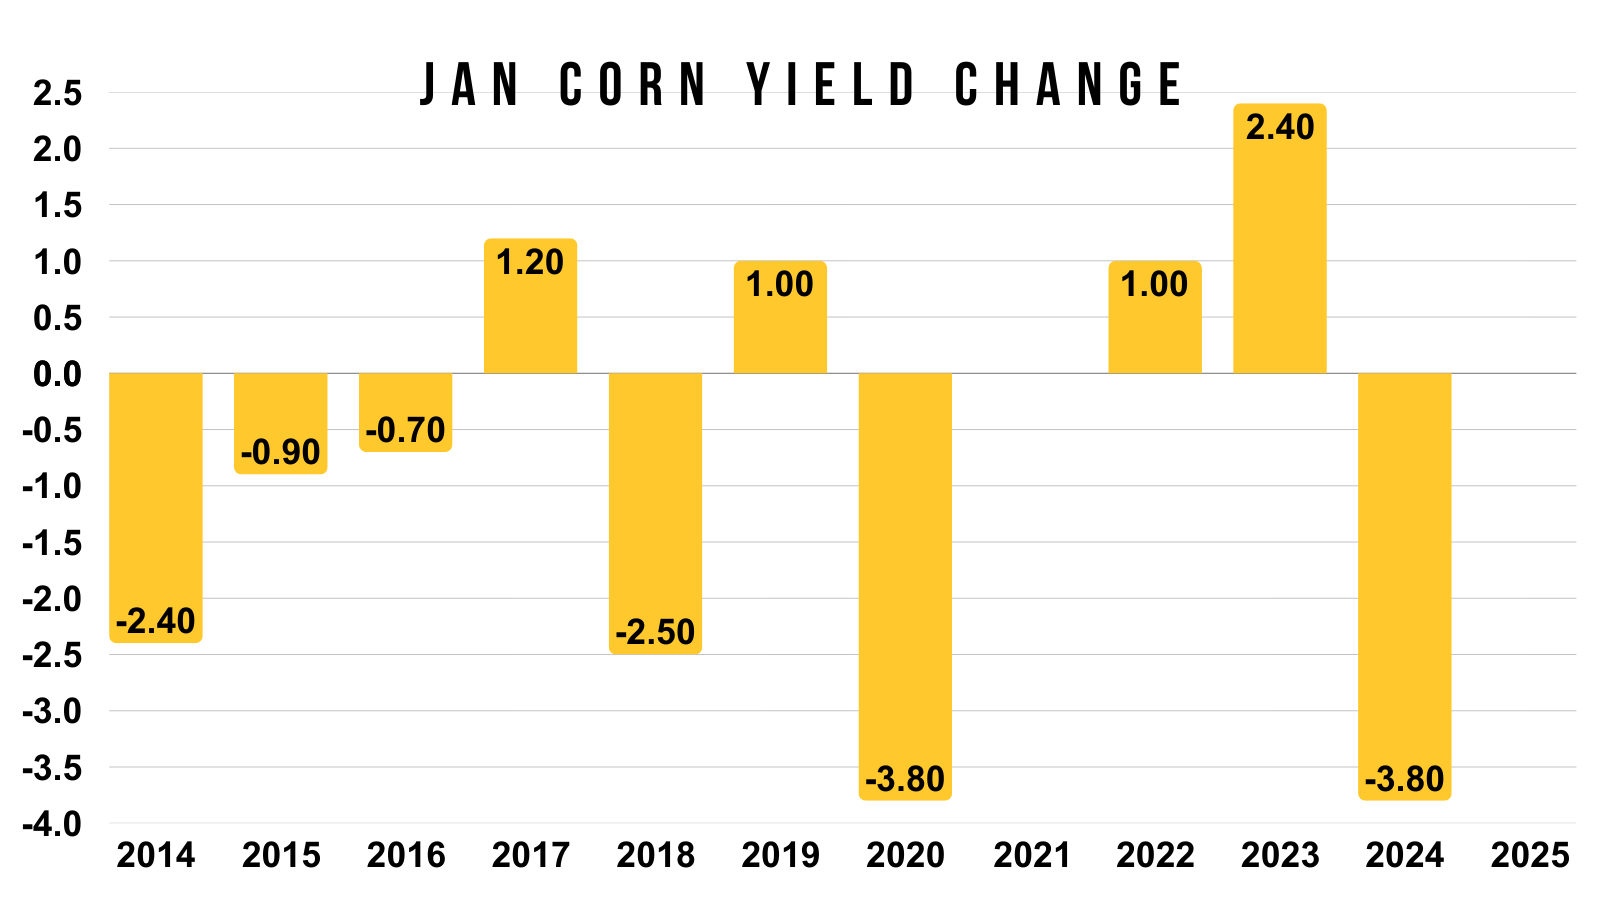
What would it take to get a situation similar to last year?
Where our stocks to use ratio climbs into that 10% range?
Here are balance sheet scenarios for a 183 and 182 yield, without changing the demand side at all.
A 183 yield without touching demand, puts the corn market in a situation that isn’t "super" bullish but not overly bearish either.
A 182 yield puts you almost where we were at last year. Creeping towards that 10% level.
But again.. this is without touching demand. If the USDA drops yield, I am pretty confident they will drop feed and residual demand to offset some losses.
The other question is do exports continue to be bumped higher?
(Pinch to zoom in on the numbers)
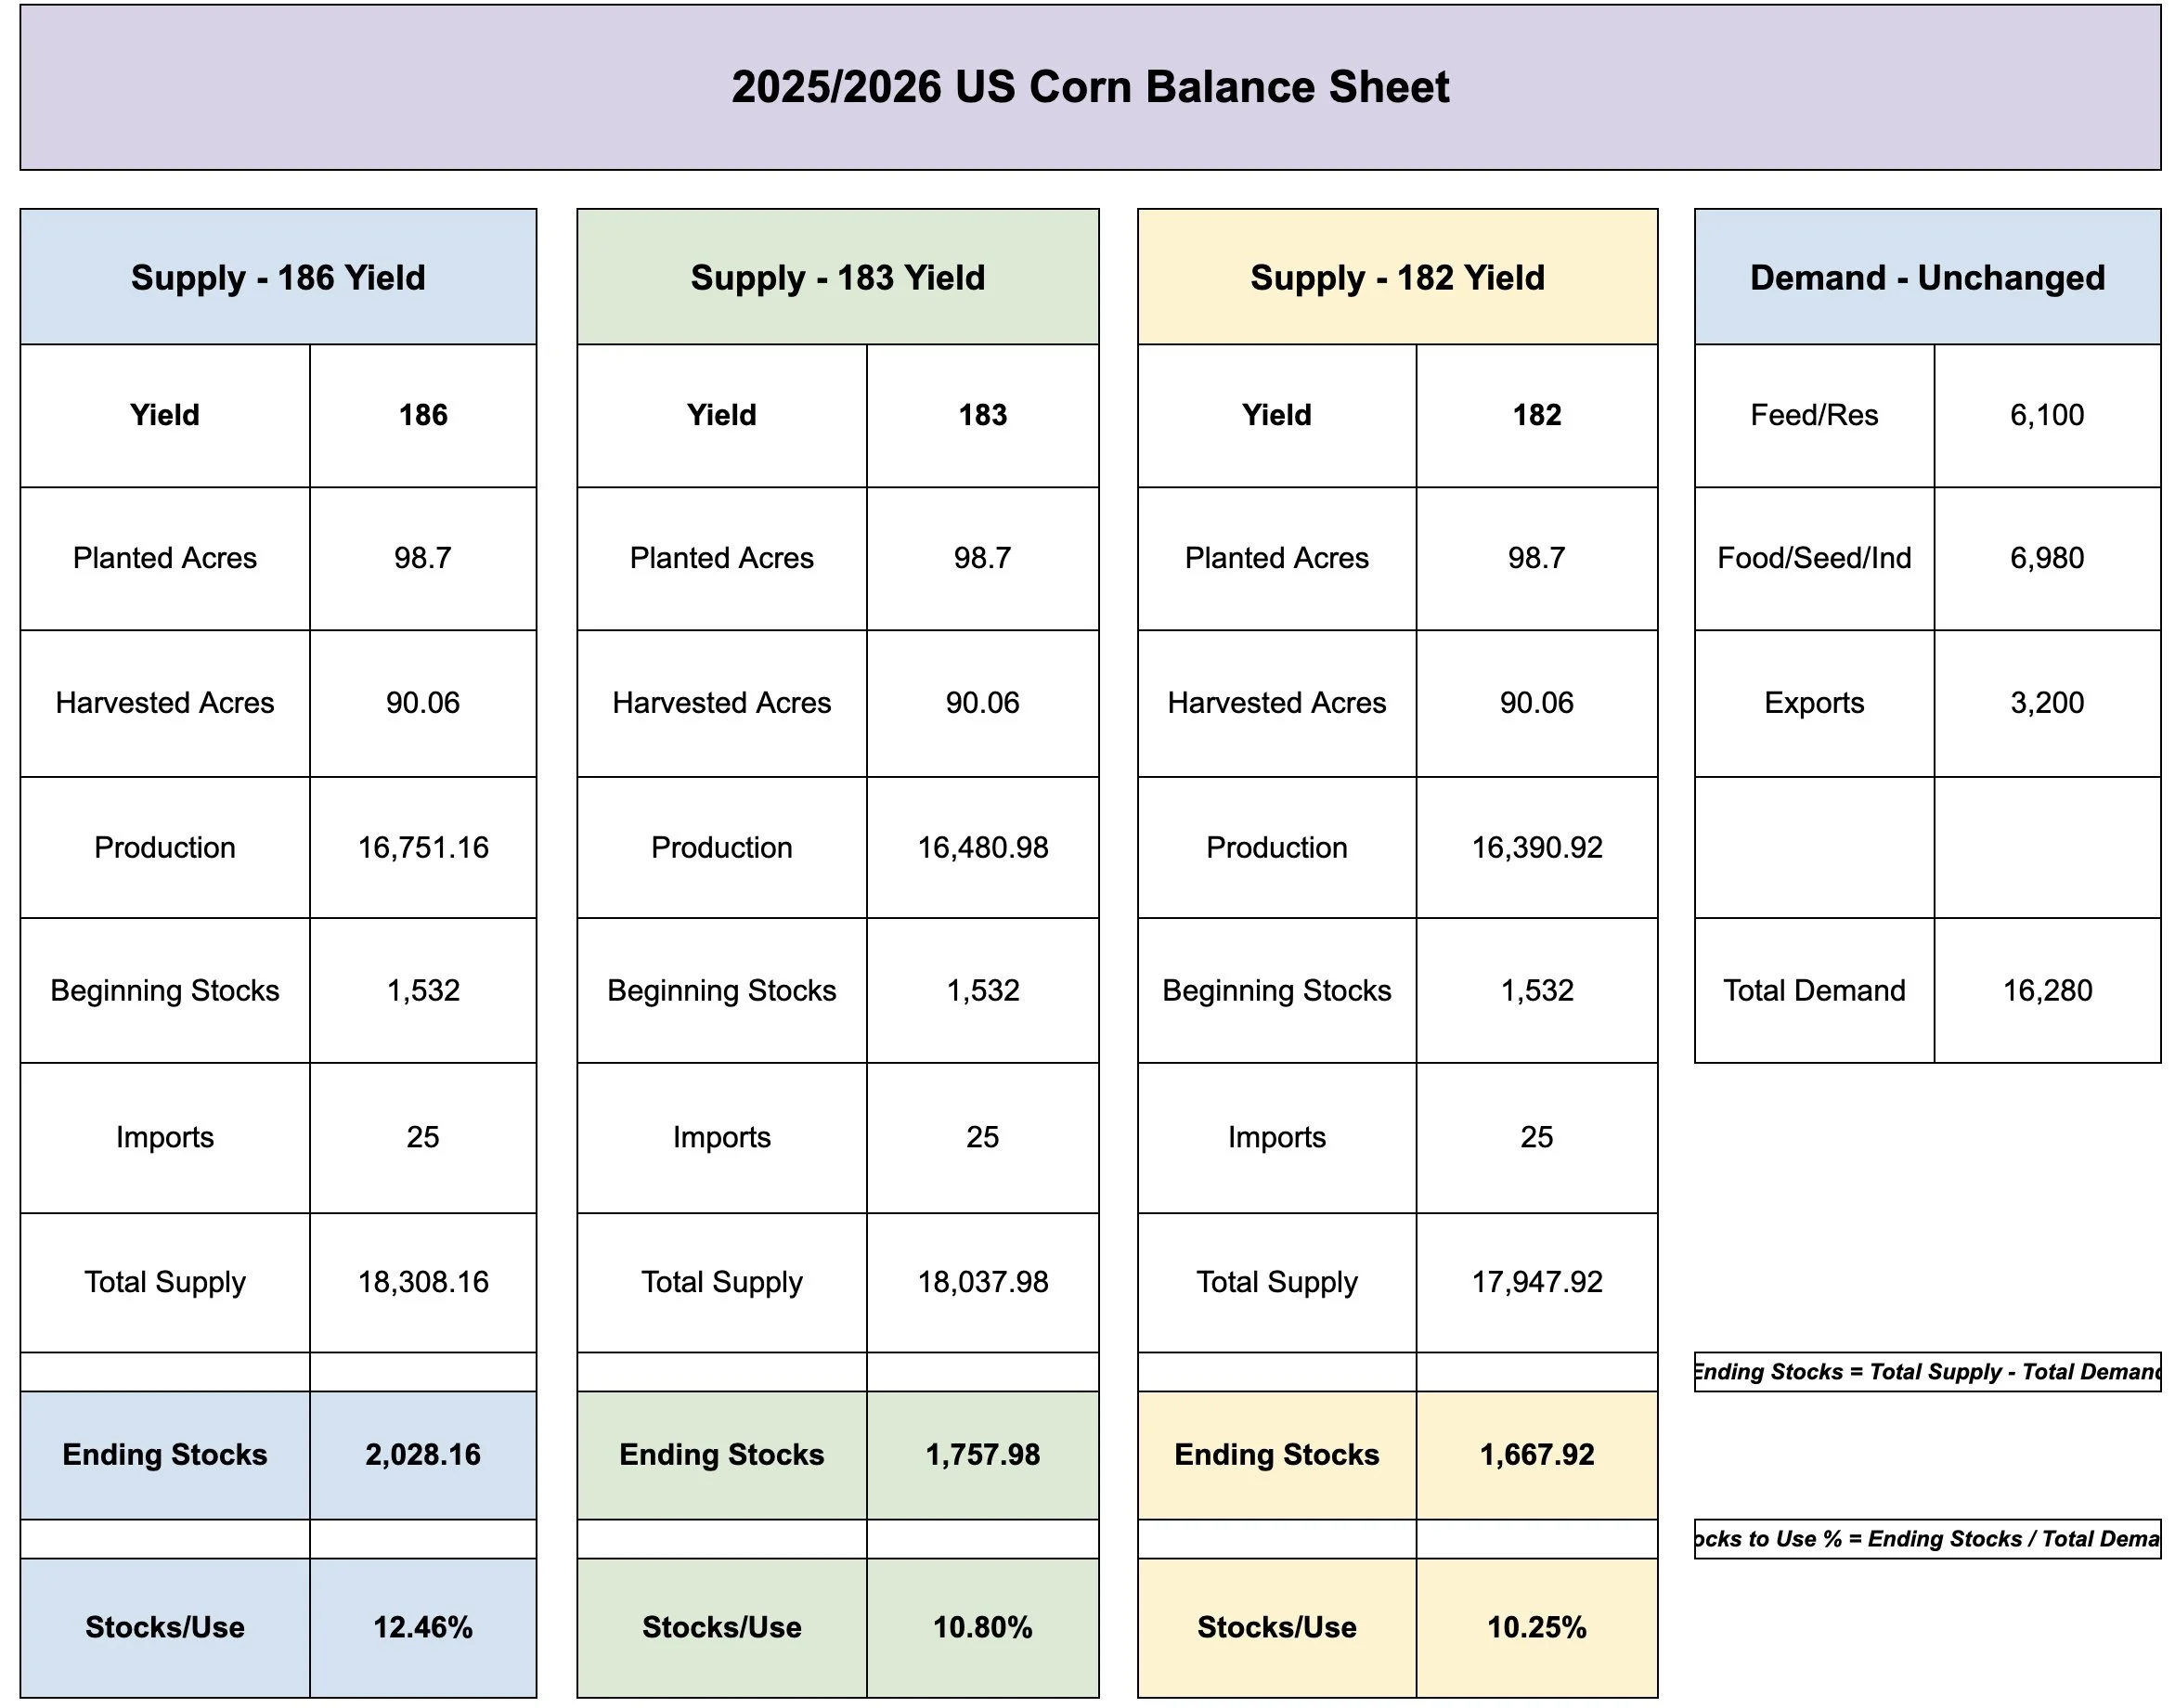
As there is a very good arguement to be made that feed and residual is too high to begin with.
As it's projected to be up over +600 million vs last year, despite animal units being roughly the same.
Consensus agrees that this number isn’t really justified.
So what probably happens is we get that yield cut in January, but they then offset some of that supply loss by cutting feed demand.
They did this on purpose to give themselves some wiggle room on the balance sheet. As they know yield will come down to some extent.
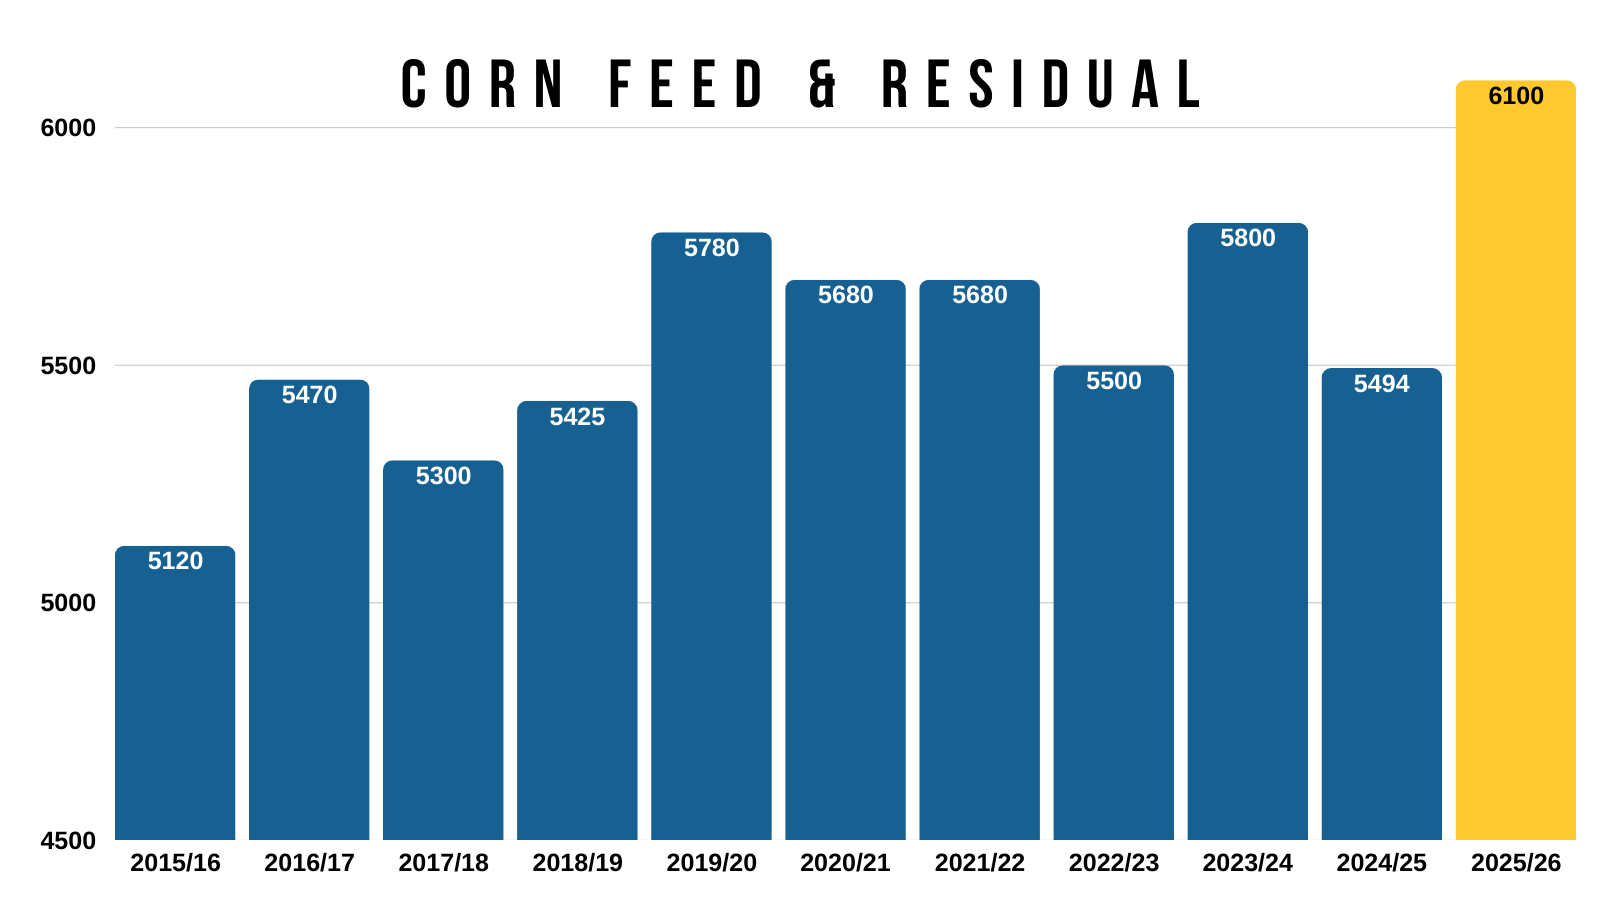
Exports on the other hand are justified.
Export demand is phenomenal for corn.
It is the sole reason you can’t get too bearish on corn.
We are selling and shipping more corn than ever before.
With the increase today, the USDA export projection is up +13% vs last year. Which was a record year for demand.
The last time we had a record large crop was 2023.
We will break that record this year.
However.. export demand is projected to be up a massive +42% from 2023.
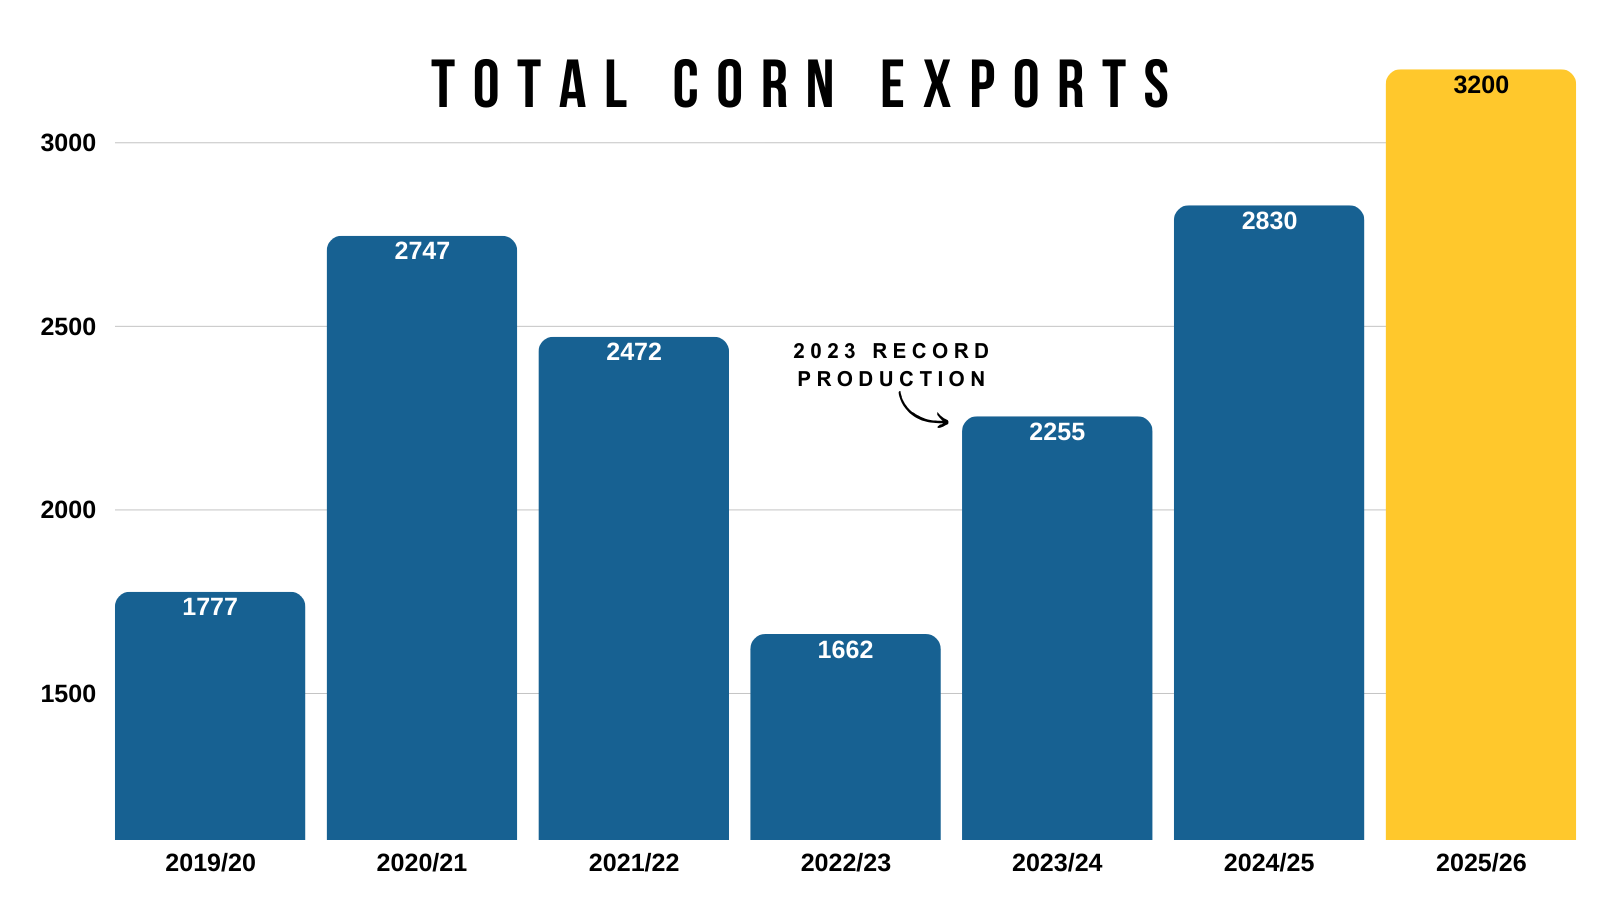
You can’t doubt the USDA's choice to raise exports once again.
Our export inspections are up +70% vs last year.
They are up a whopping +210% compared to the 5-year average.
Absolute monster demand for corn.

Based on the current fundamentals and record large acres, last year's situation heading into the end of the year was viewed as more friendly than the current situation we are in today.
Last year March corn ran from $4.04 in August up to $5.04 in February. An entire +$1.00 rally.
Last year, we essentially just revisted our highs from spring.
If we were to do that again this year, and revisit our April highs, it would put corn in that $4.70 to $4.80 range.
But another thing to keep in mind is that last year's rally did somewhat get muted as focus started shifting to the utterly massive acres we would eventually see.
Then you do always have the possibility of a weather scare in the summer, which is something we haven’t seen since 2023.
But based on the current fundamentals and what we know, it is reasonable to think that the $4.70 to $4.80 range is very attainable.
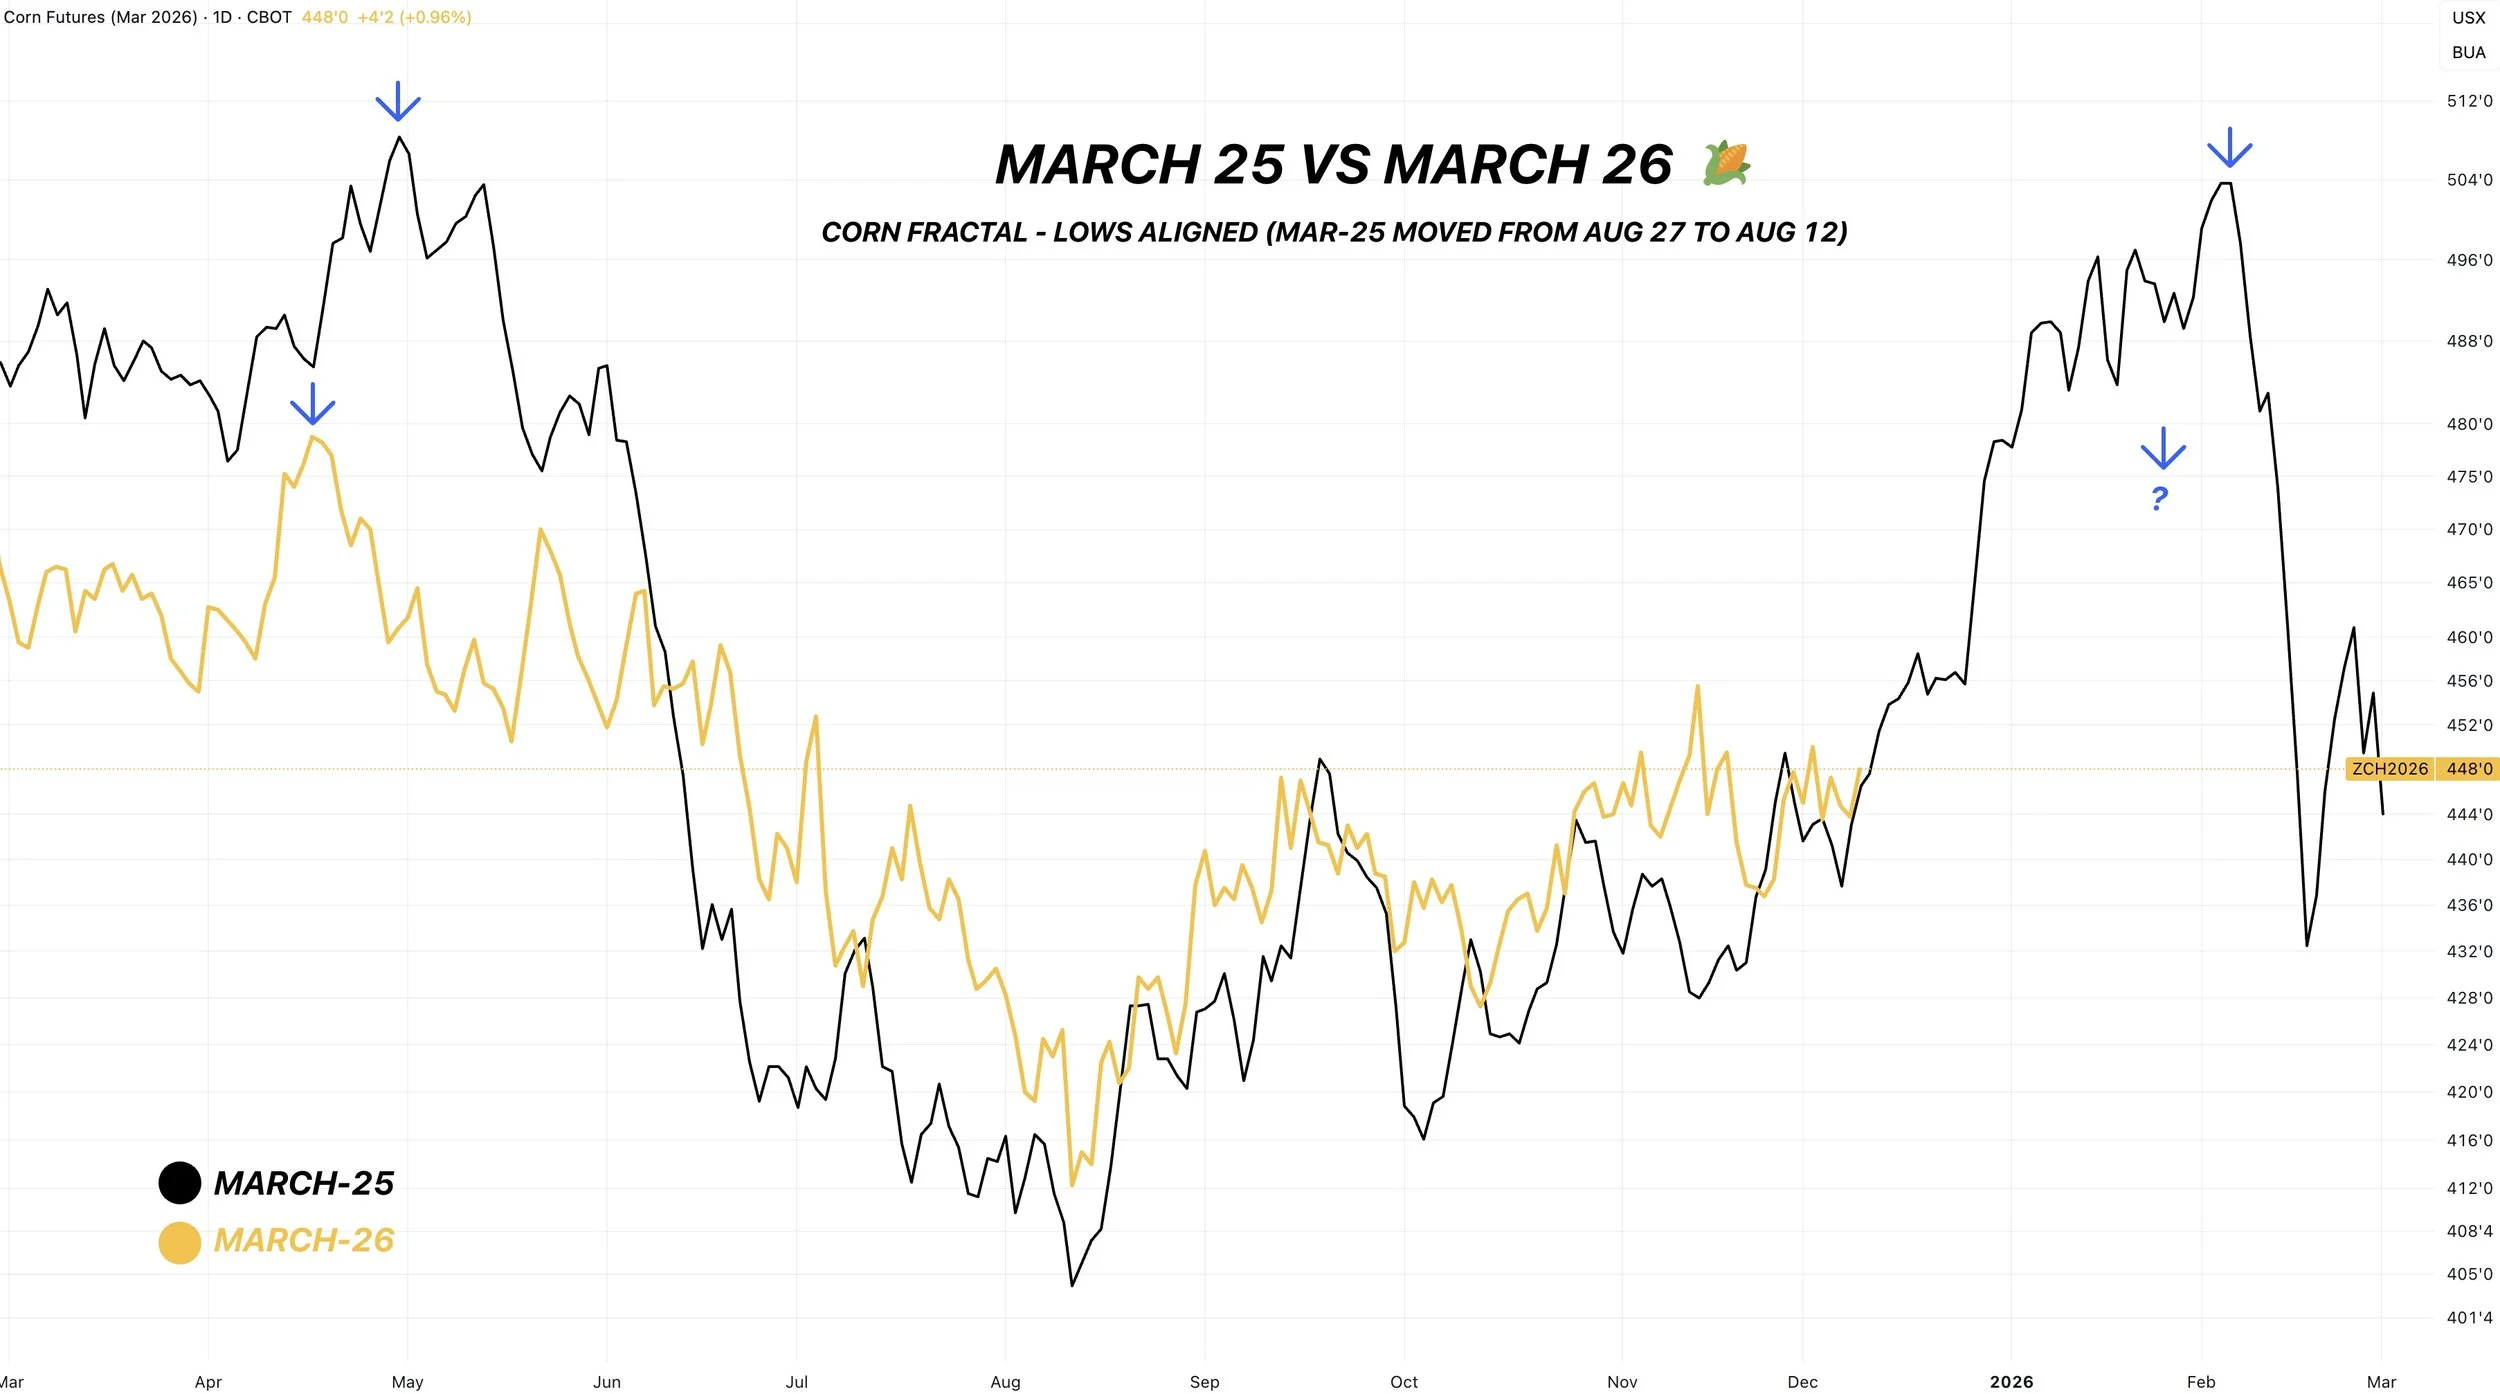
World Corn Situation
This is the last thing I wanted to touch on today.
Our world stocks to use ratio is the tightest in over a decade.
Does this matter today?
No not exactly.. as the US currently has plenty of supply given our record crop.
What does this mean?
It means the world as a whole is the tightest it's ever been on corn. This is with the record US crop and big Brazil crop.
The world needs our corn.
If the US (or Brazil) ever run into a production issue, or if China ever ends up buying US corn, this could end up being a game changer.
None of those have to happen.
But if the world is the tightest it's been on corn in over a decade.. and the world's largest producer (the US) runs into even just a weather scare, this chart right here could flip this market drastically.
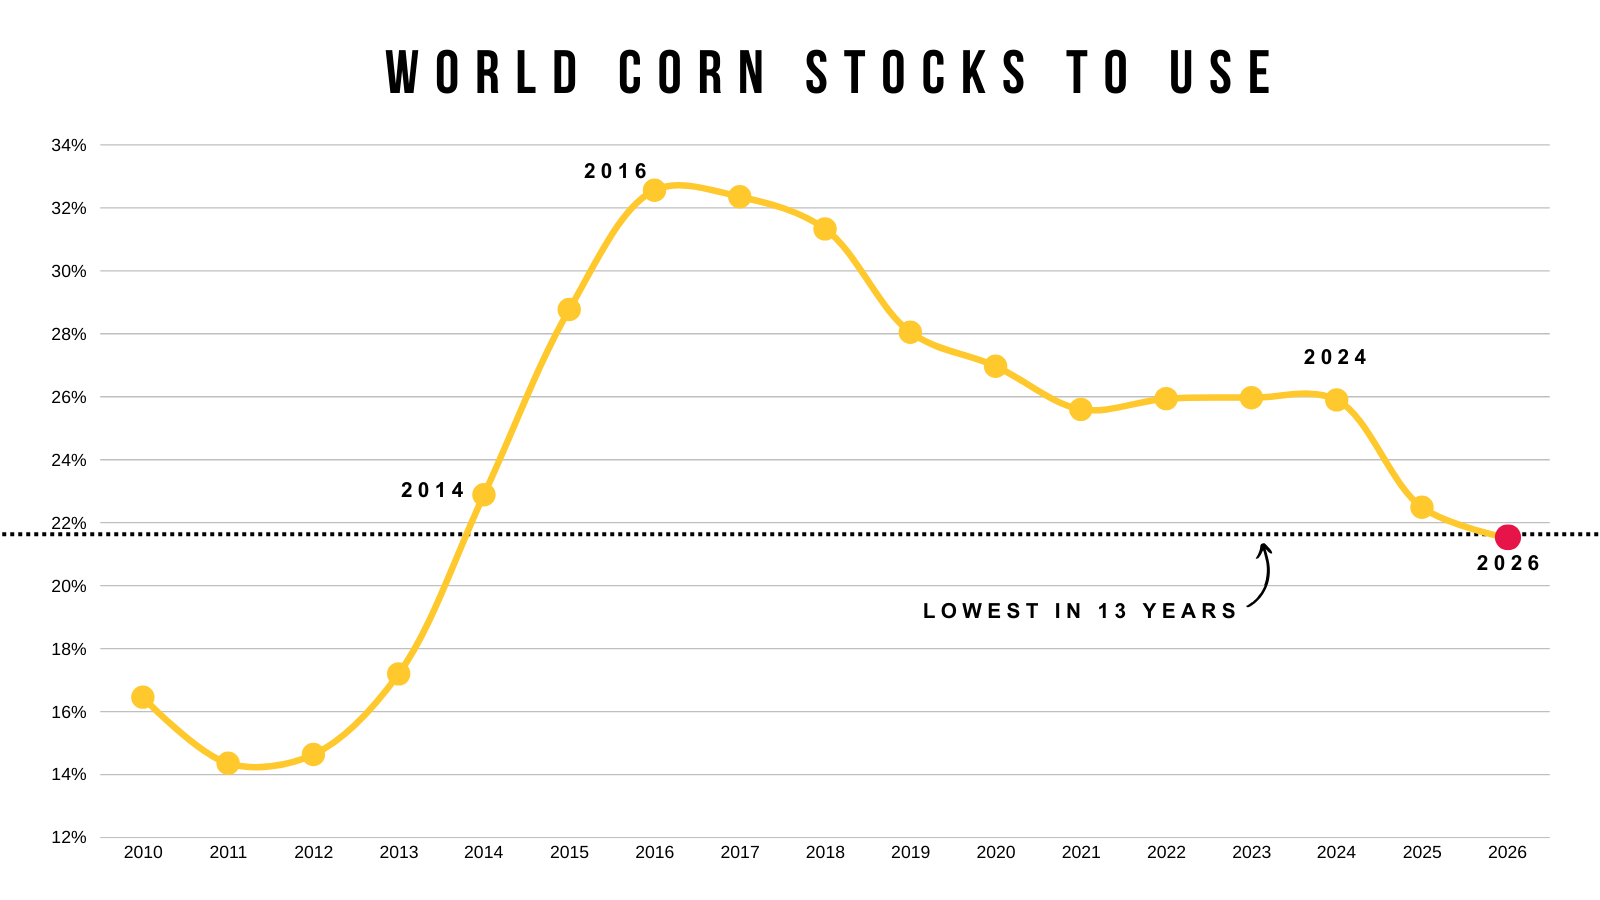
But for now, the tight world situation doesn’t matter that much.
As the US has a record crop.
I've shown this plenty of times, but it would take a yield of 170 for us to NOT see a record crop.
That is a big crop.
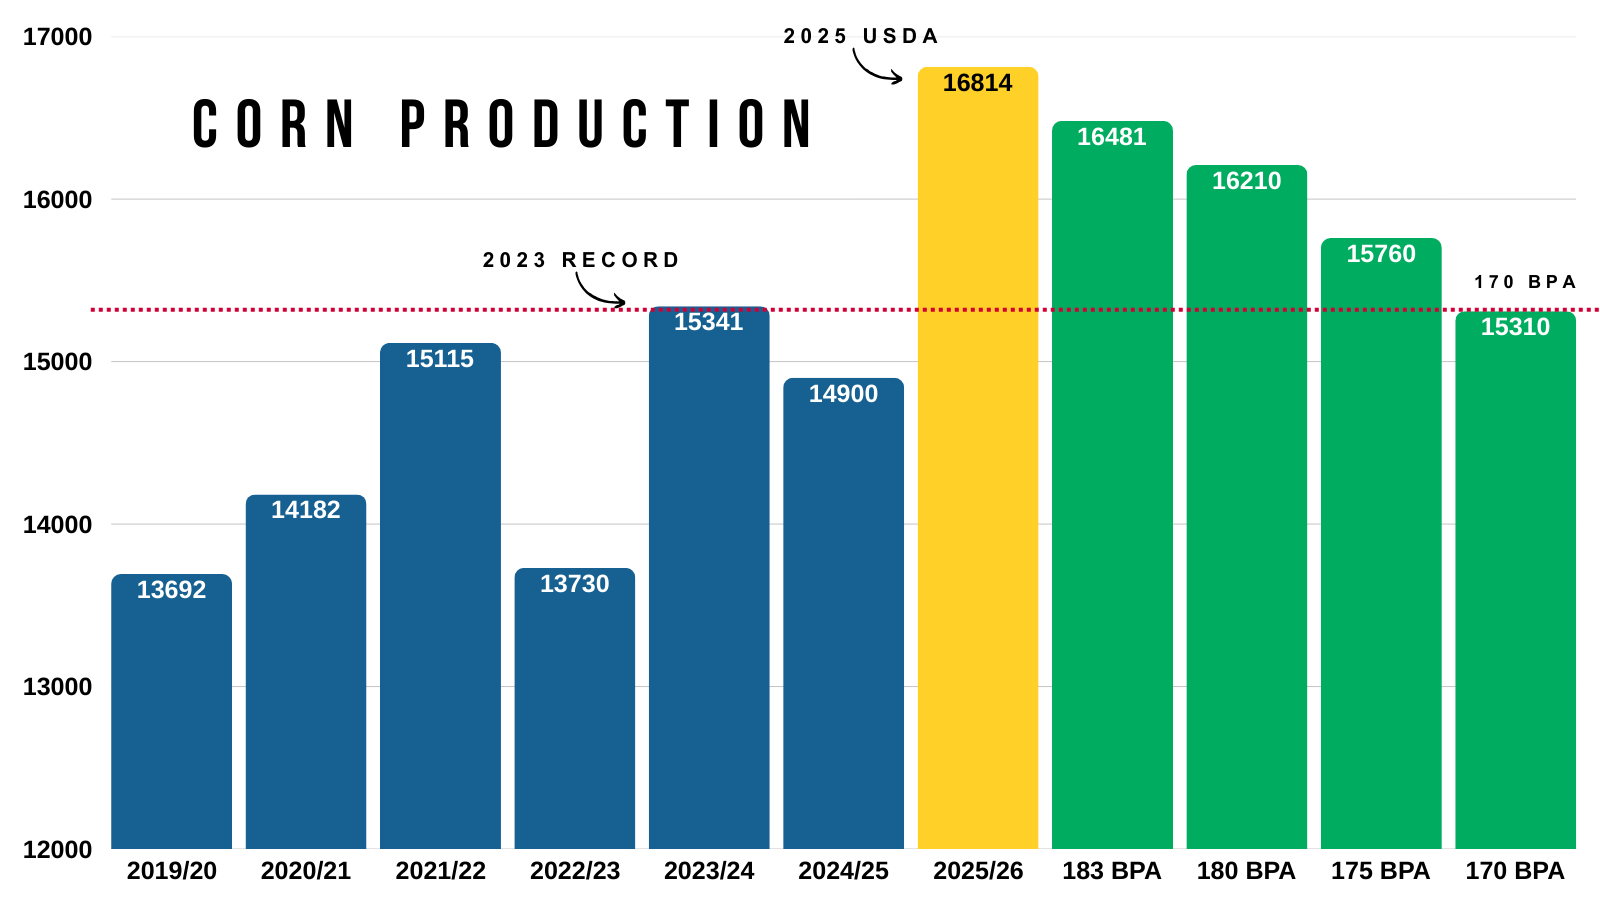
Technicals:
March Corn
Corn is still at some pretty big resistance here.
The $4.50 level has clearly been hard to get through. As we've been trapped under it for the last 40 days.
We are also sitting right at the 200-day MA.
Breaking above the 200-day MA for more than one day in a row would be a very good sign. As we haven’t done that since May really.
But really we need to break that $4.50 level to open the door higher.
Since we took risk off the table and alerted a sell signal at $4.50. Our next target is still $4.73 as that is 161.8% of the rally from contract lows to our September highs.
We still need to hold this red box. As it gives back 50-61.8% of the rally from October.

Soybeans
Fundamentals:
We aren’t going to dive into the fundamentals today in soybeans as the USDA provided zero fresh data or changes.
The biggest thing is going to be South America and whether they run into a weather issue or not. As the next month or so is going to make or break that crop. Currently they don’t seem to be having major issues despite being on the dry side the last month.
I do think China meets their purchase goal of 12 million metric tons. The problem is that Bessent and the government pushed that deadline back to February rather than the end of the year. So that disappointment has been a large part of this sell off.
The soybean situation here in the US isn’t bearish, and I still think this market has "potential". With the small acres and slim room for error on the supply side here in the US.
Bulls just need to be fed to justify more upside.
Whether that is a ton of China purchases or production issues in South America. Neither of which we've seen yet.
Technicals:
Jan Beans
Soybeans are now down over -80 cents off their highs and our sell signal from November 17th.
Where could the bottom be?
The last few weeks I've been talking about this green box being a point of interest.
50-61.8% of the entire rally we saw (61.8% is the most common level).
That is a normal-sized correction and usually where the market decides if this is simply a correction or if we are truly starting to roll over.
Not only that, the 61.8% level almost perfectly lines up with our yearly resistance, where we rejected countless times this year. It is now viewed as support.
So I'd like to think we can find some footing around there.
Everyone is talking about that gap.
Could we fill it? Very possible.
Do we have to fill it? No we don’t.
This was a break away gap. The typical rule of thumb is that if a gap isn’t filled in a few days it doesn’t have to be filled.
I could easily see a situation where traders wait for that gap fill, then we bounce before hand at that 61.8% level and they get left waiting for a gap that doesn’t fill.
I am not saying it "can’t" happen. I am just saying it does not "have" to happen.
That 61.8% level at $10.72 is very important to hold.
It makes sense to bounce there, but if it breaks, we could go deeper than just the gap. As a lot of times if you break below the 61.8% level, it tells us this is more just than a normal correction.
Wheat
The wheat market probably had the most bearish report.
As world carryout surprised high and let us know once again that the world simply has an ample amount of supply.
Here is the changes the USDA made to the world balance sheets.
They bumped several countries.
Chart from Brock Report
For reference, here is the world wheat production and demand overlaid on top of each other.
Do you notice how production has diverted heavily from the demand number this year?
(Blue = Production & Pink = Demand)
This is a big reason why the wheat market has sucked.
Production has been outpacing demand globally.
The other issue is the US situation.
Here is the US wheat stocks to use ratio.
It's been on a climb for the last few last years.
The current estimate is the highest in 5 years.
Now on the bright side, exports have continued to be impressive.
Which is one way you can start to tighten up that US situation.
You could make a pretty argument that the USDA is going to need to bump wheat export demand.
Export inspections are up over 20% vs last year.
But overall the wheat market still lacks a true story and catalyst for tremendously higher prices. As there is no concern about supply globally, as there haven’t been any weather issues anywhere really.
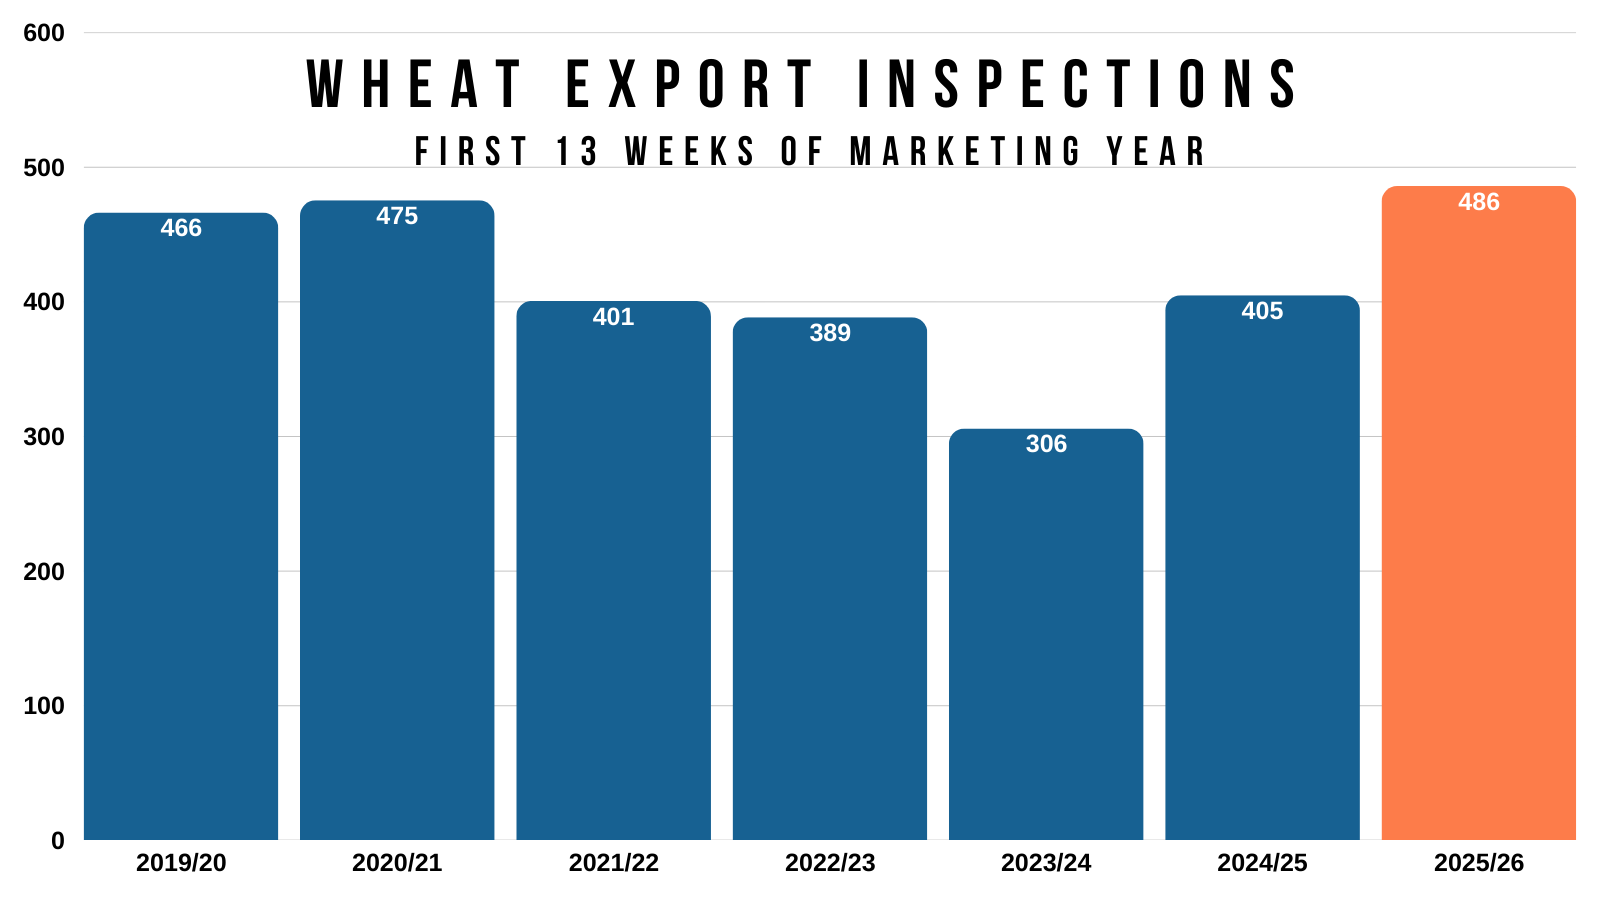
Technicals:
March Wheat
We've been trapped in a very small range for 15 days in a row now.
Trapped under that blue box resistance.
But holding above the golden fib.
(The golden fib gives back 61.8% of the entire rally from contract lows)
So pretty much watching two levels here.
Break above the blue box and our recent highs, we probably get a leg higher.
Break below the golden fib and the door opens lower. Must hold spot.
If we bounce here, it would be a great sign. As bouncing at that 61.8% level means the uptrend is still in tact.
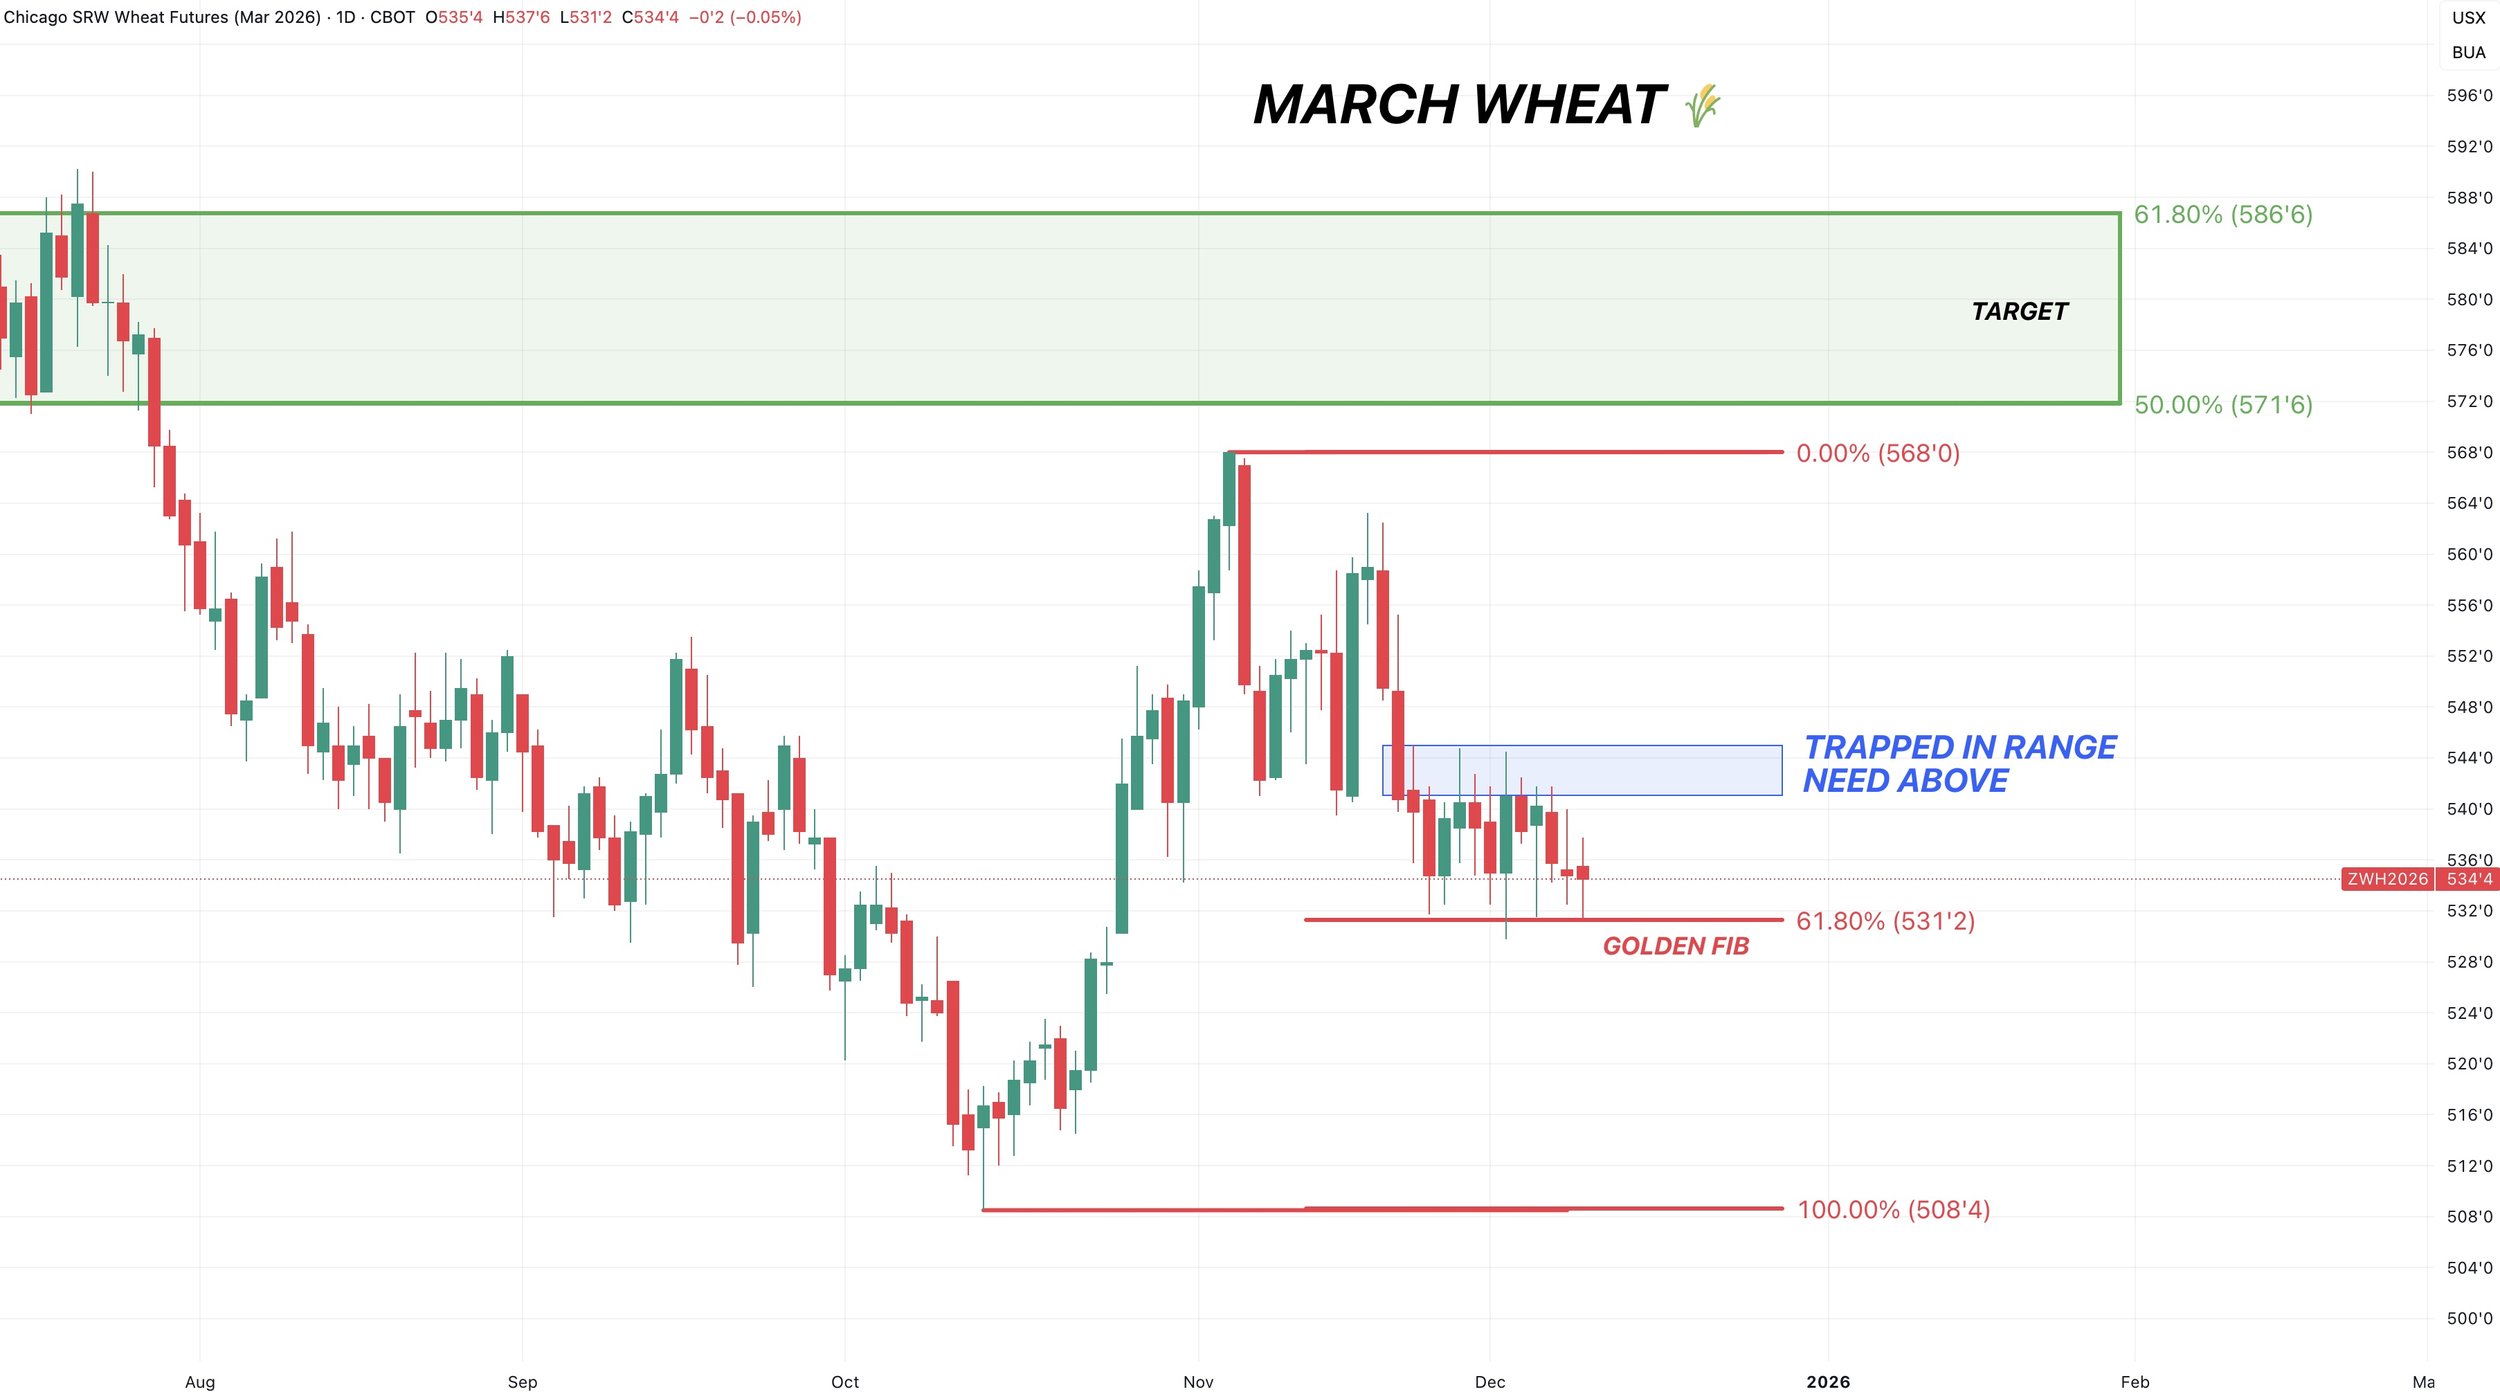
Still looking for the green box to reward this market.
50-61.8% of the June highs.
The 200-day sits there as well. Which the wheat market has struggled to stay above for very long for over a year.
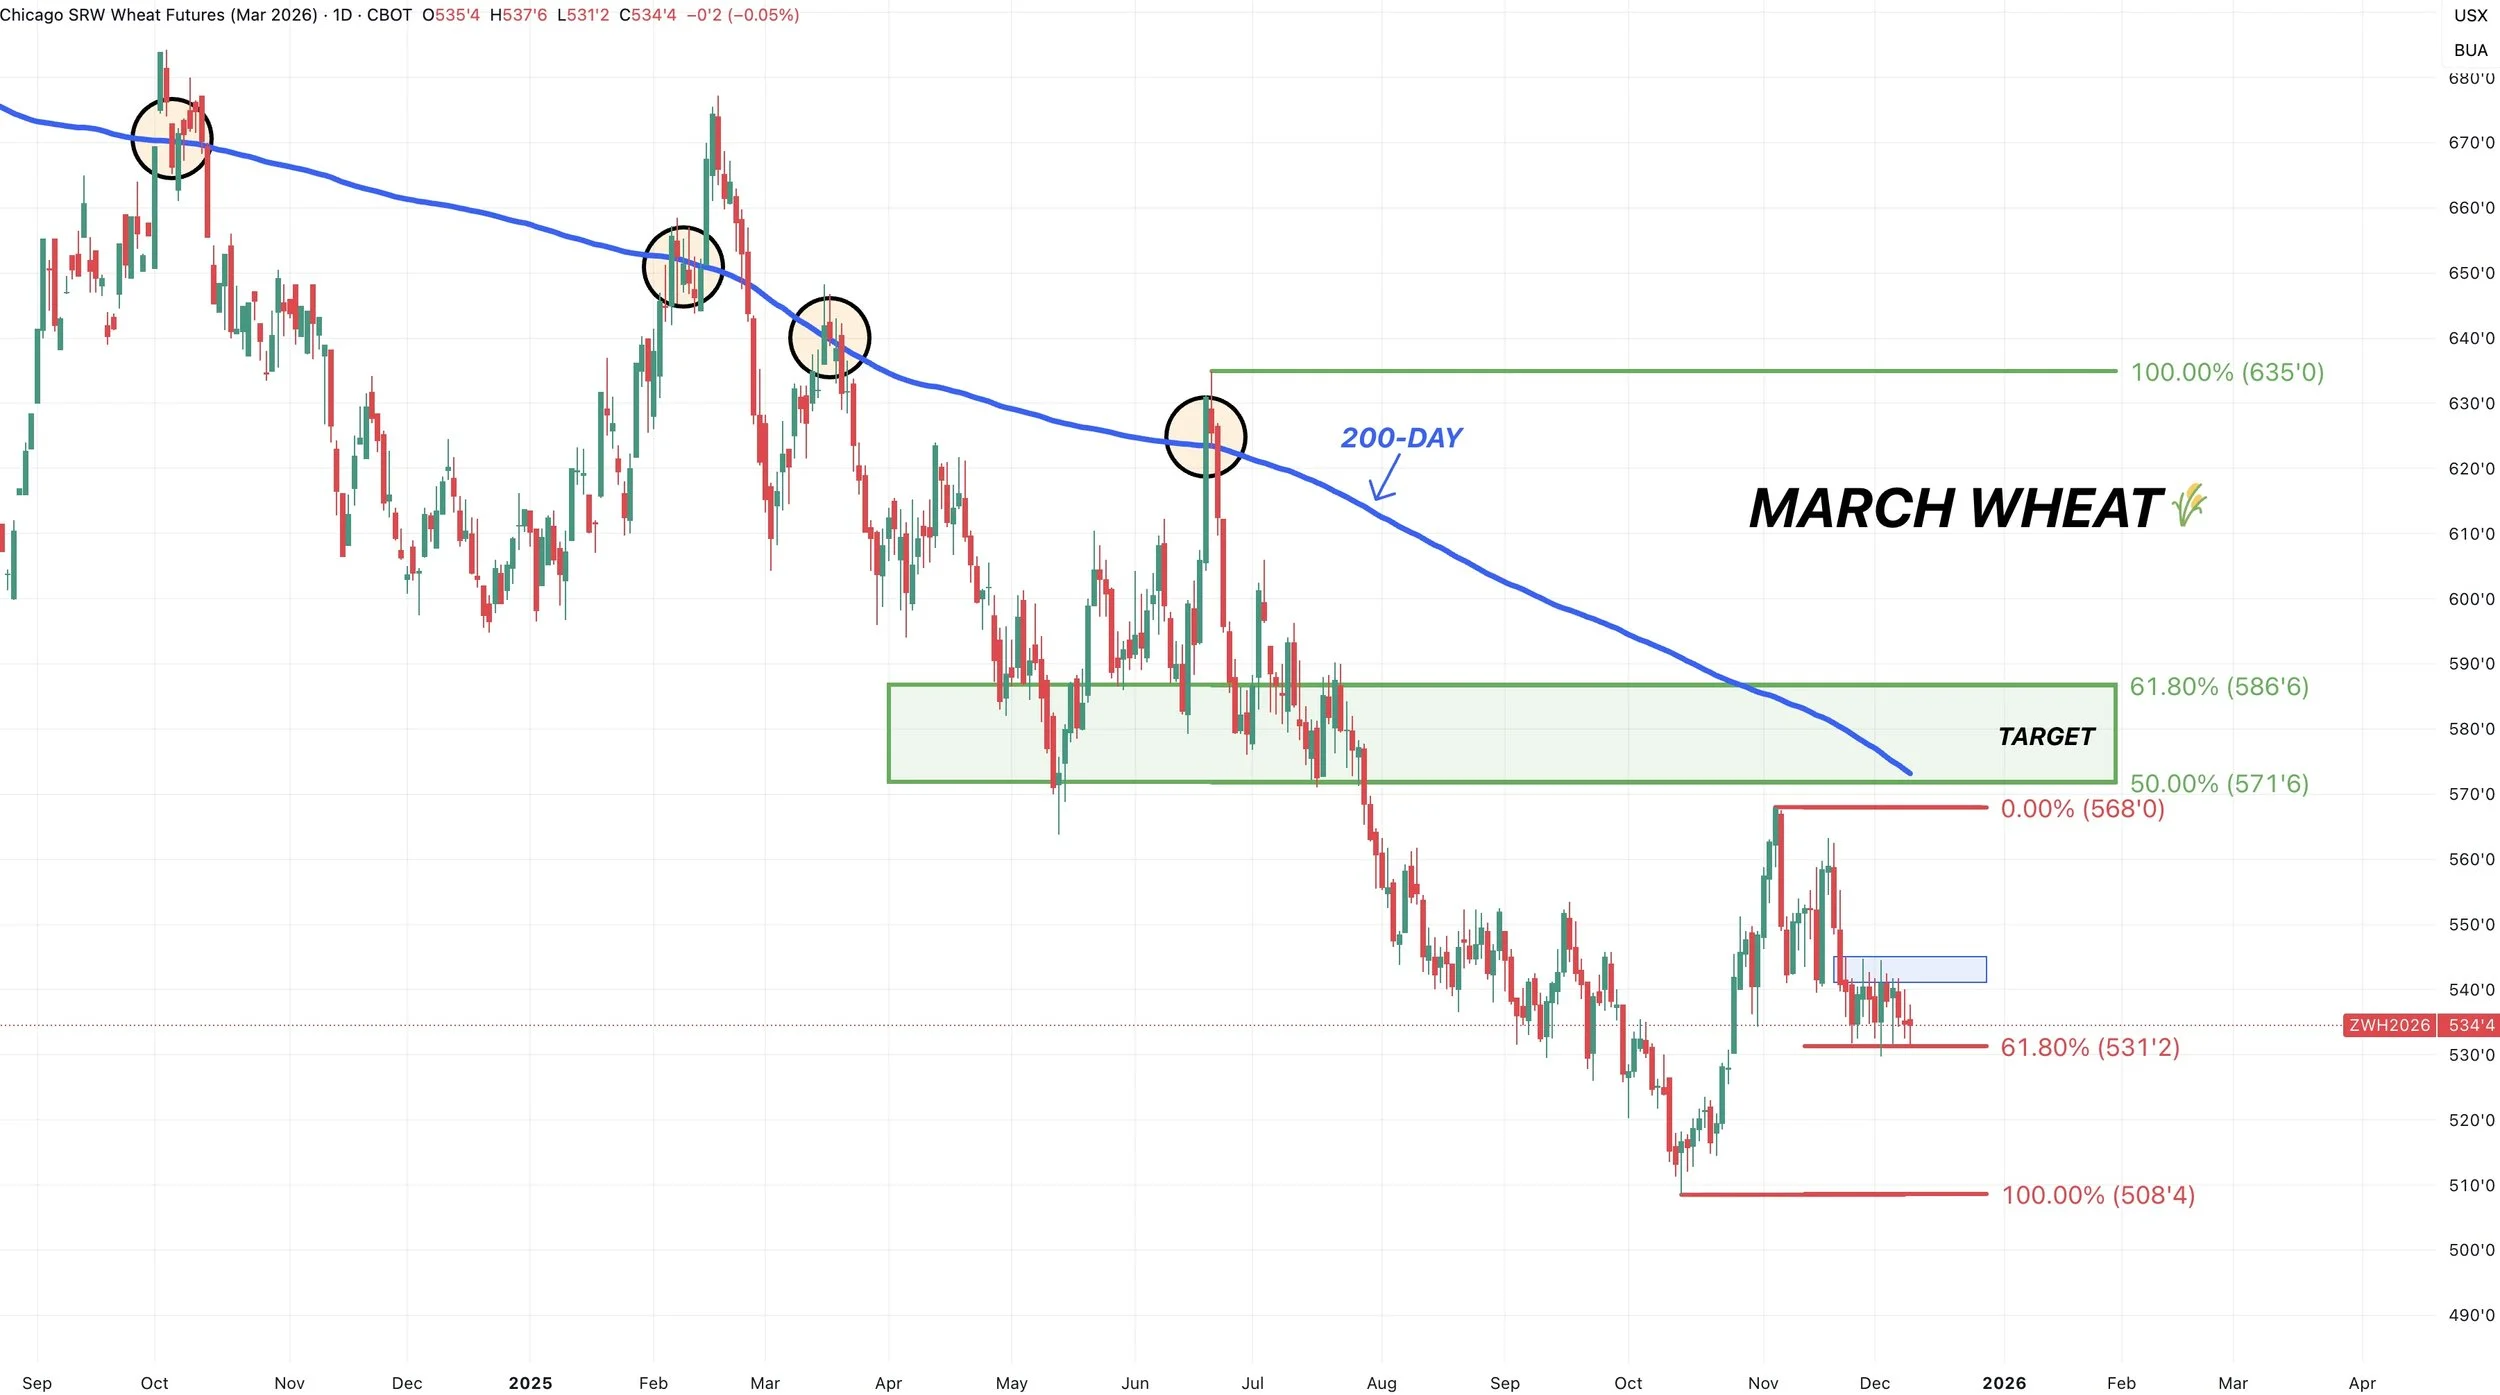
Dec KC Wheat
Very similar chart in KC and Chicago, except we do not have as defined of a range.
Regardless, we just need to hold that 61.8% level at $5.19. That is the must hold spot.
Bounce there and this is seen as a normal correction.
Fail there and this is seen as the start of a bigger sell off.

Cattle
Friday we did alert a cattle sell signal and hedge alert.
We do still like rewarding this rally.
If you missed that alert or want specifics, here is a link to it:
CLICK HERE FOR SIGNAL
Technicals:
Jan Feeders
So far we are rejecting right at that first target.
As we clawed back exactly 50% of the entire sell off.
Not only that, we tapped the 50-day MA.
The 50-day used to be major support. So it's now resistance.
If this rally were to continue, the secondary target is the 61.8% level. Which lines up with filling that gap. If that hits, we will be looking to further de-risk.
But I am not sure if we have enough juice to get there, hence why we issued an alert on the first target.
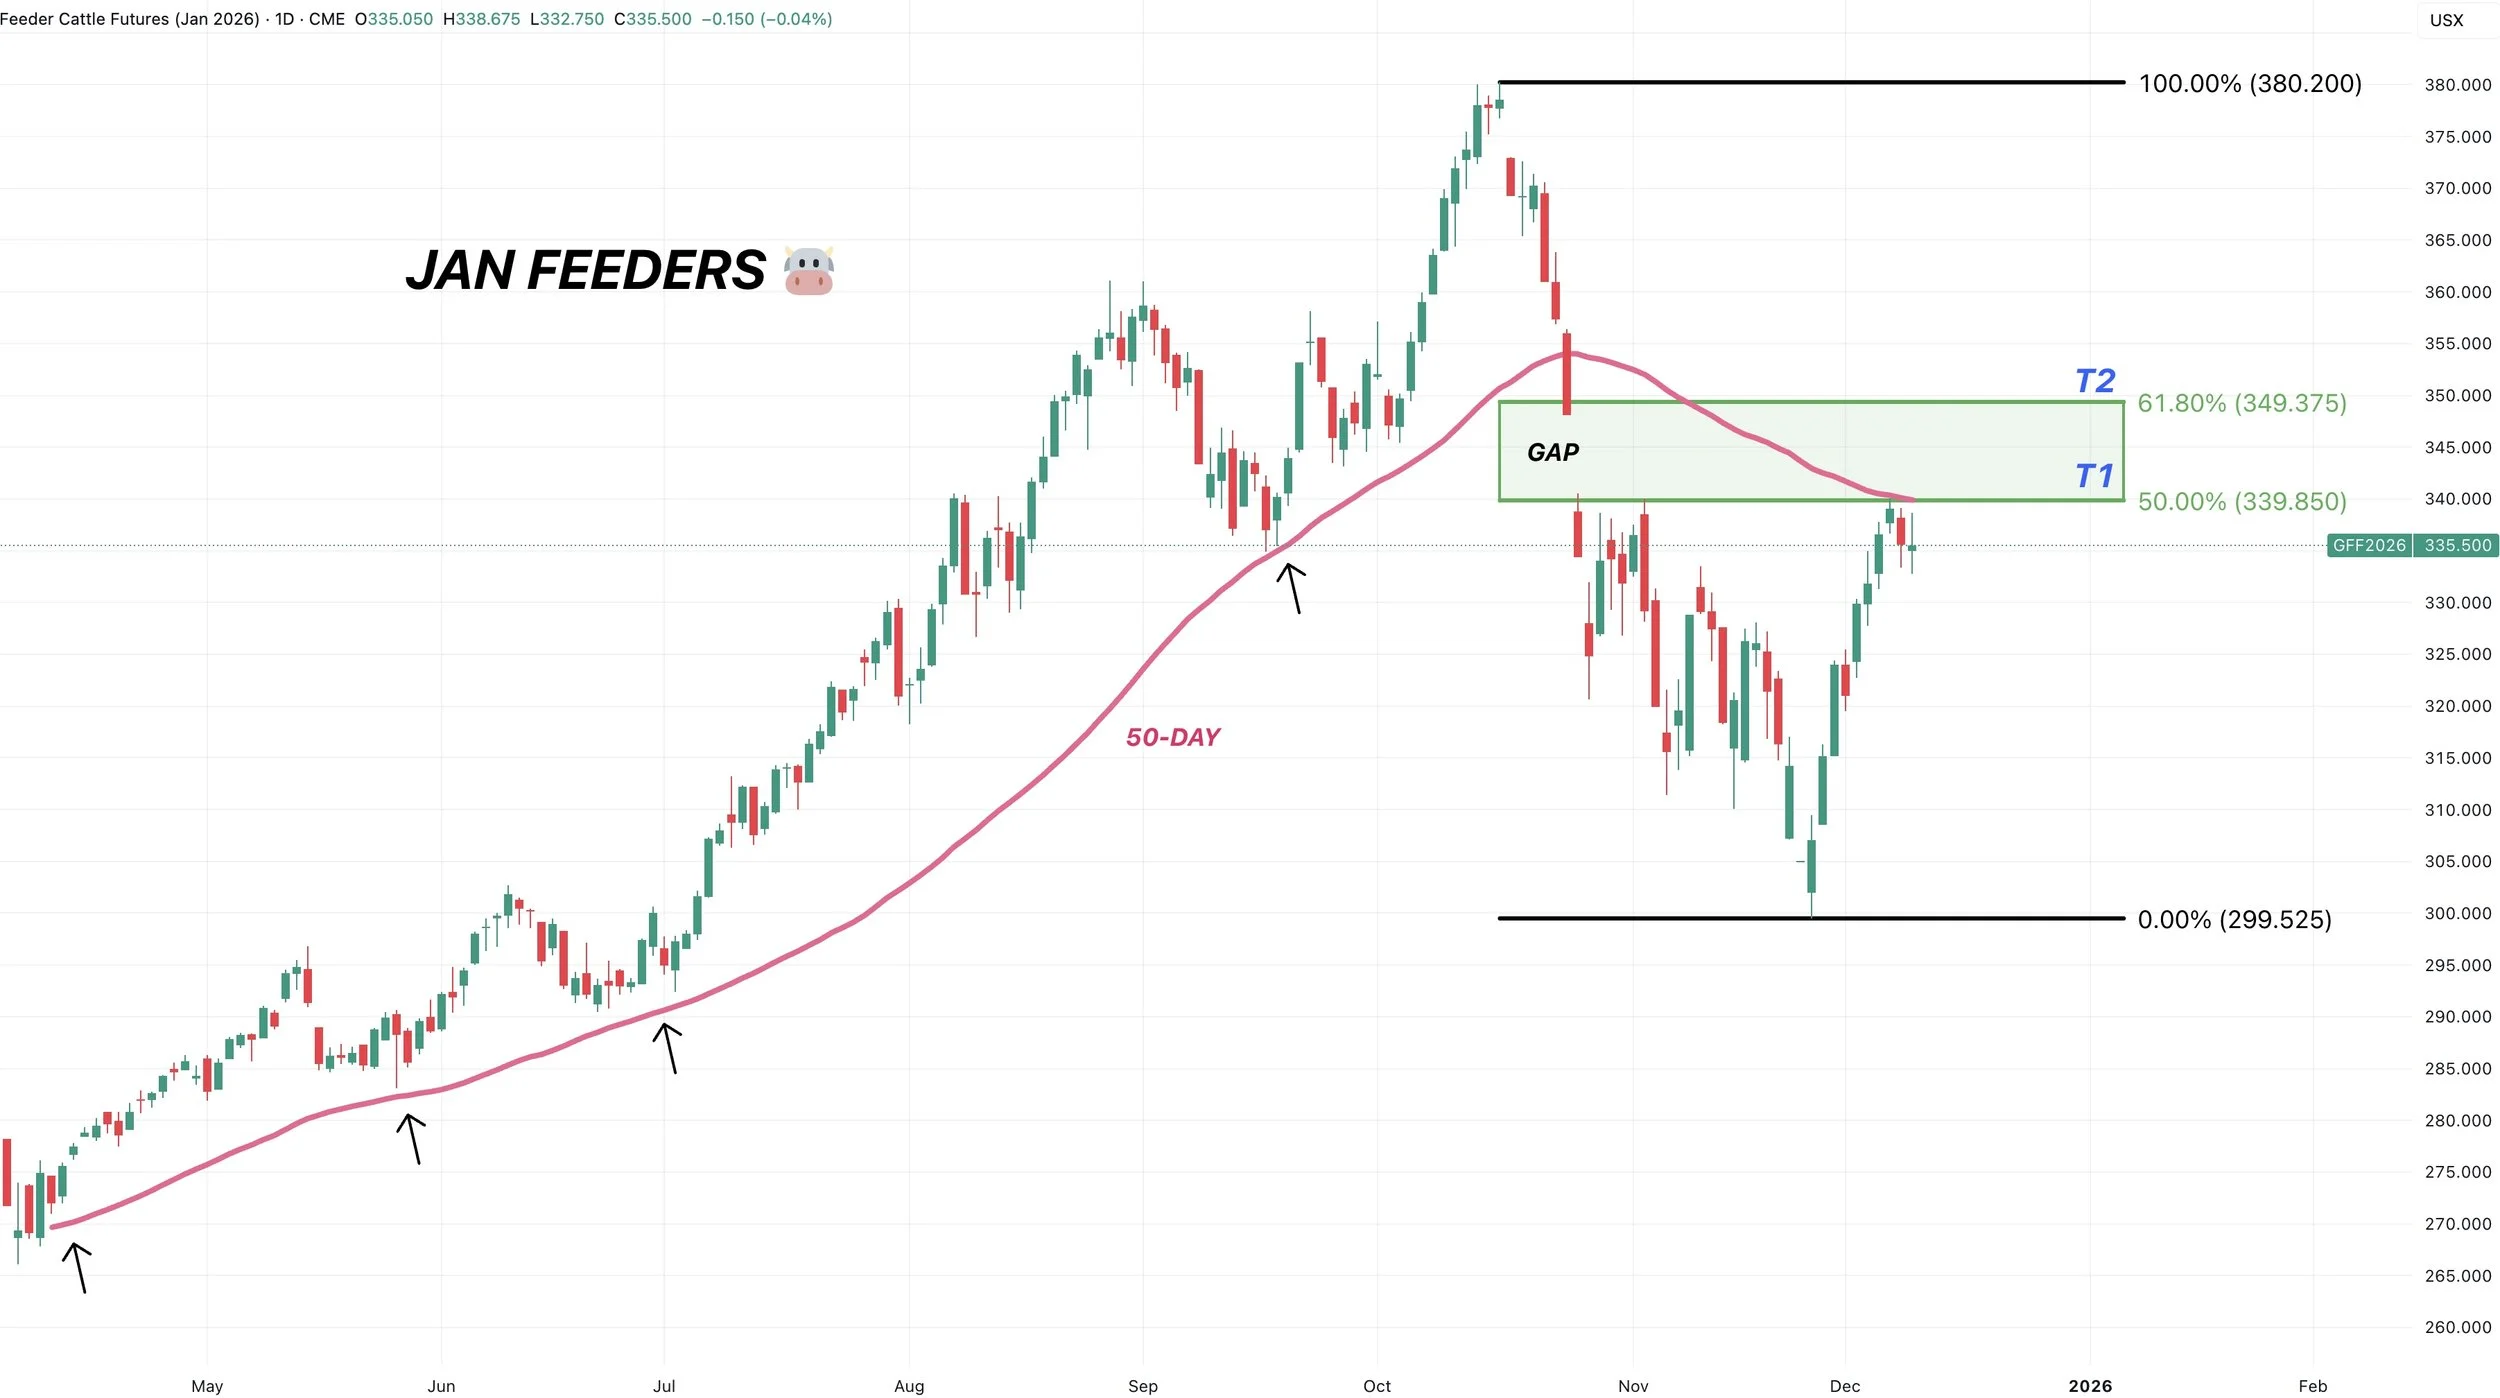
Continuous Feeders
Here is another reason why this level was a point of interest.
This is the continuous chart that shows the active contract.
We left a roll gap when we swtiched from Nov to Jan feeders.
We filled that gap on Friday perfectly.
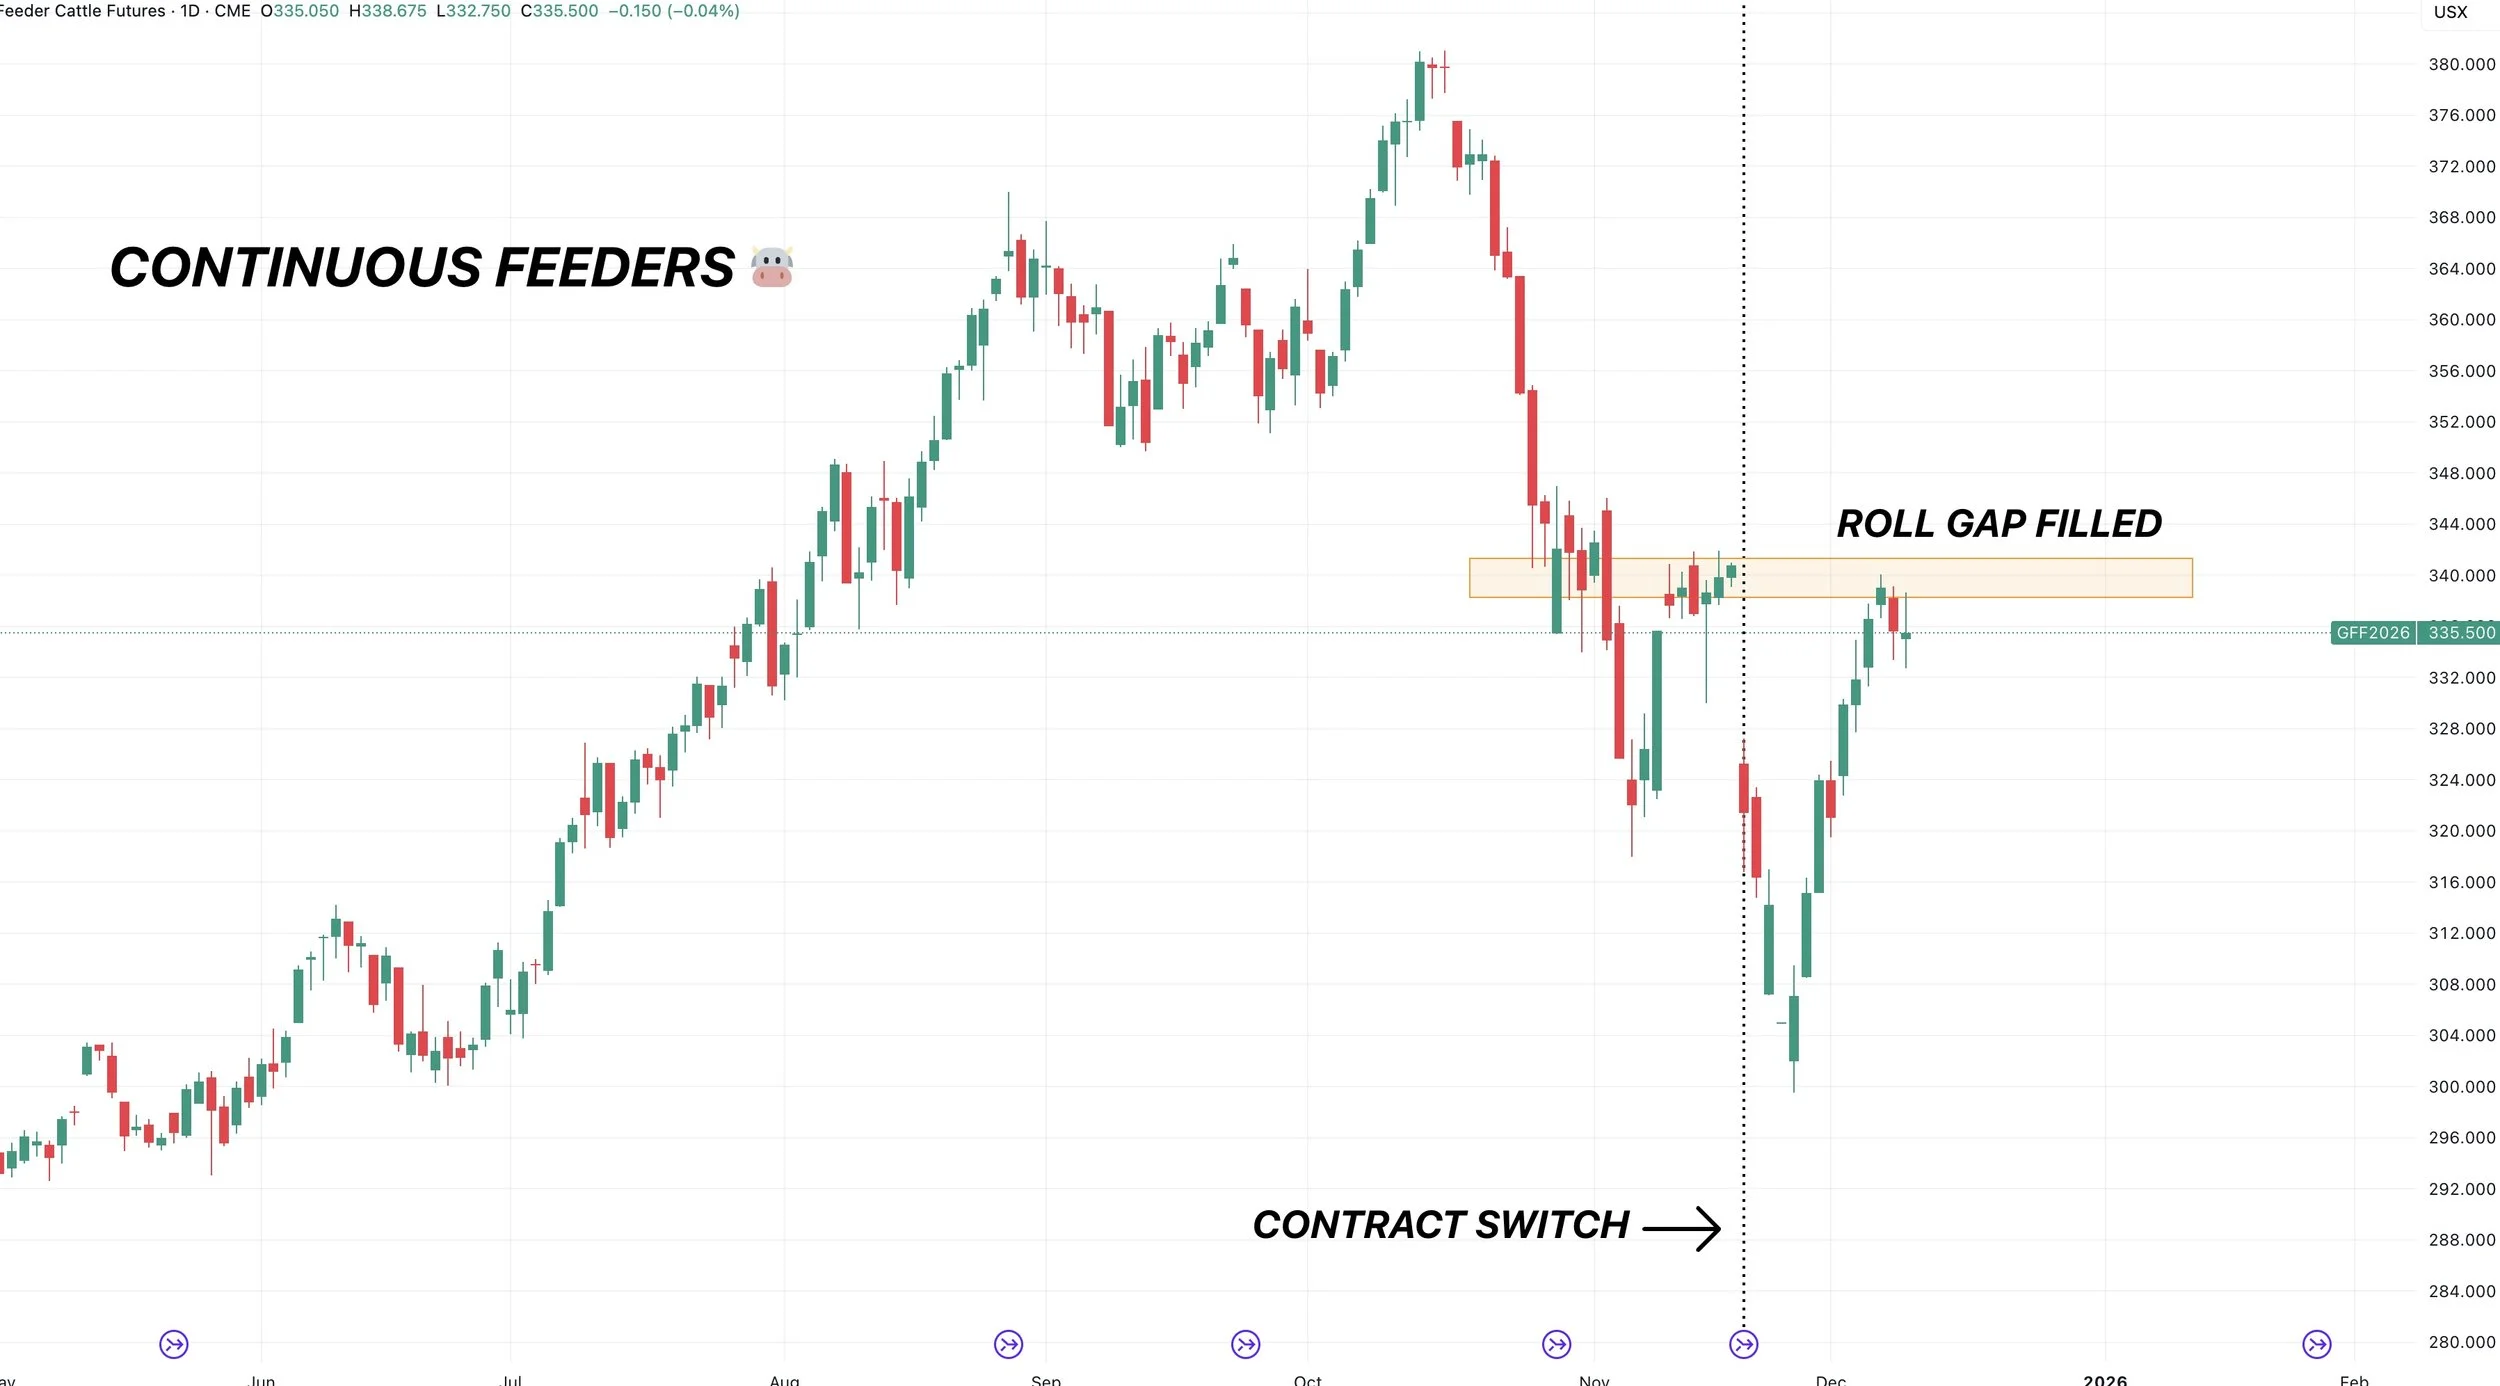
Overall I still think there is plenty of risk in this market long term.
The most common correction pattern in markets is known as an ABC correction.
You get the first A wave down.
Then you get the B wave up that is a relief bounce.
People think the bottom is in.
Then you get a final C wave lower that marks the actual bottom.
Doesn’t have to shake out this way, but it's something I am being very cautious of up here.
Something to note:
Open interest has been decreasing on this rally. Not increasing.
This means that shorts are leaving the market. This rally is not fresh new longs entering the market.
Seeing this usually makes it hard to go and post new highs in a market.
So I like rewarding the rally we've had.

Feb Live
Very similar chart to feeders.
We tapped that 50% retracement and nearly hit the 50-day MA today.
If we work our way higher we want to look to de-risk further.
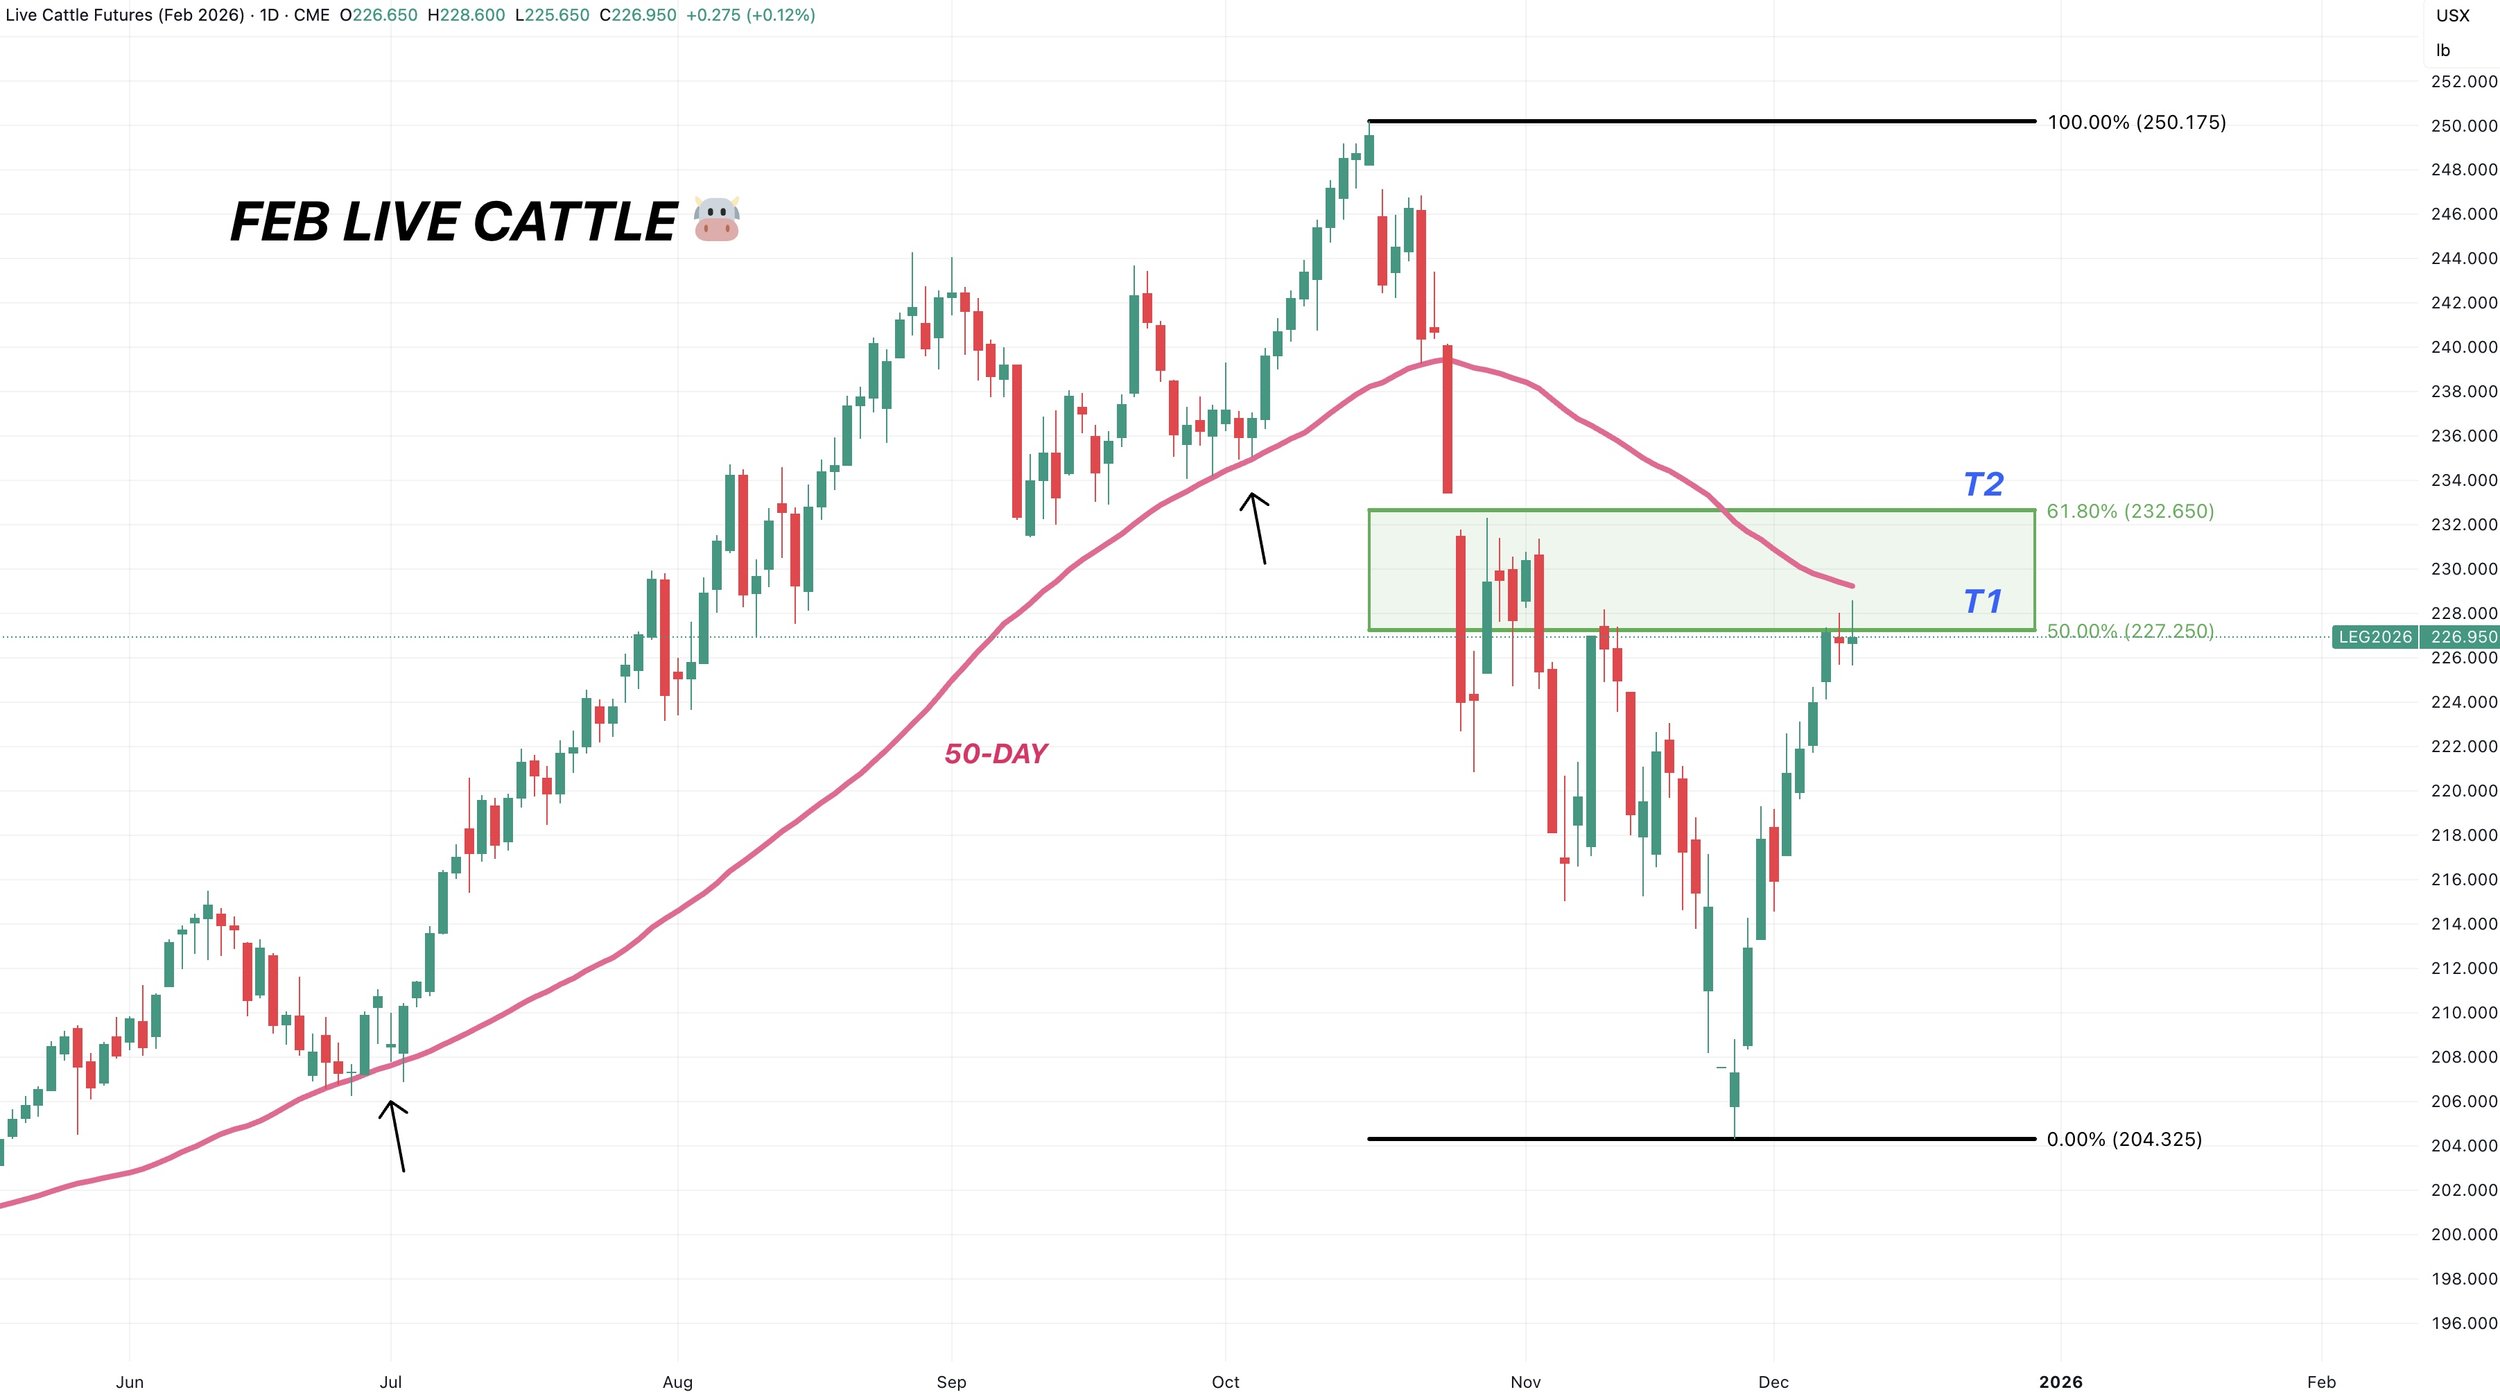
Past Sell or Protection Signals
Dec 5th: 🐮
Cattle sell signal & hedge alert.
Nov 17th: 🌱
Soybean sell signal & hedge alert.
Nov 13th: 🌽 🌱
Managing risk in corn & beans ahead of USDA report.
Oct 28th: 🌽
Corn sell signal & hedge alert.
Oct 27th: 🌱
Soybean sell signal & hedge alert.
Oct 13th: 🐮
Cattle sell signal & hedge alert.
Aug 22nd: 🌱
Soybean sell signal & hedge alert.
July 31st: 🐮
Cattle sell signal & hedge alert.
July 10th: 🐮
Cattle sell signal & hedge alert.
CLICK HERE TO VIEW
June 5th: 🐮
Cattle sell signal & hedge alert.
June 2nd: 🌾
MPLS wheat sell signal.
April 10th: 🌽
Old crop corn sell signal.
March 19th: 🐮
Cattle hedge & sell signal.
Feb 18th: 🌽 🌾
Old crop KC wheat & old crop corn signal.
Jan 23rd: 🌽 🌱
Corn & beans old crop sell signal.
CLICK HERE TO VIEW
Jan 15th: 🌽 🌱
Corn & beans hedge alert/sell signal.
Jan 2nd: 🐮
Cattle hedge alert at new all-time highs & target.
Dec 11th: 🌽
Corn sell signal at $4.51 200-day MA
CLICK HERE TO VIEW
Oct 2nd: 🌾
Wheat sell signal at $6.12 target
Sep 30th: 🌽
Corn protection signal at $4.23-26
Sep 27th: 🌱
Soybean sell & protection signal at $10.65
Sep 13th: 🌾
Wheat sell signal at $5.98
May 22nd: 🌾
Wheat sell signal when wheat traded +$7.00
Want to Talk?
Our phones are open 24/7 for you guys if you ever need anything or want to discuss your operation.
Hedge Account
Interested in a hedge account? Use the link below to set up an account or shoot Jeremey a call at (605)295-3100.
CHINA & SOYBEAN WHIPSAW
MARKET UPDATE
You can scroll to read the usual update as well. As the written version is the exact same as the video.
Timestamps for video:
Overview: 0:00min
Corn: 2:20min
Beans: 5:35min
Wheat: 12:20min
Cattle: 14:00min
Want to talk about your situation?
(605)250-3863
Black Friday Sale
Your Free Trial Has Ended
Subscribe so you don’t miss future updates or signals
Futures Prices Close

Overview
Grains higher across the board following Friday's post-USDA blood bath.
We had some rollercoaster action in soybeans the last few days.
Friday we closed down -22 cents.
Overnight today, we gapped open lower.
Trading as much as -10 cents lower.
We then went on to rally a massive +45 cents off the lows today.
Closing the day up +33 cents. Which is the largest daily gain of the entire year.
Soybean 15 Minute Chart

So what happened?
Like we talked about Friday, the USDA itself wasn’t bearish. If anything it was neutral to perhaps even a tad friendly.
Production came in lower than expected. US and world carryout both came in lower than expected as well. Yet.. we sold off.
The reason we sold off on Friday was because we received export sales data.
That data disappointed.
As it showed that China had not been buying.
China agreed to buy 12 million metric tons.
The export sales showed that China had only bought a confirmed 332k metric tons.
Which is less than 3% of what they agreed to buy this year with time running out.
There was 616k metric tons to unknown, which "could" be China but isn’t a confirmed number. Which means the maximum number of soybeans China could’ve possibly bought was right arounf 1 million metric tons.
Which is only 8.3% of the 12 million they agreed to buy.
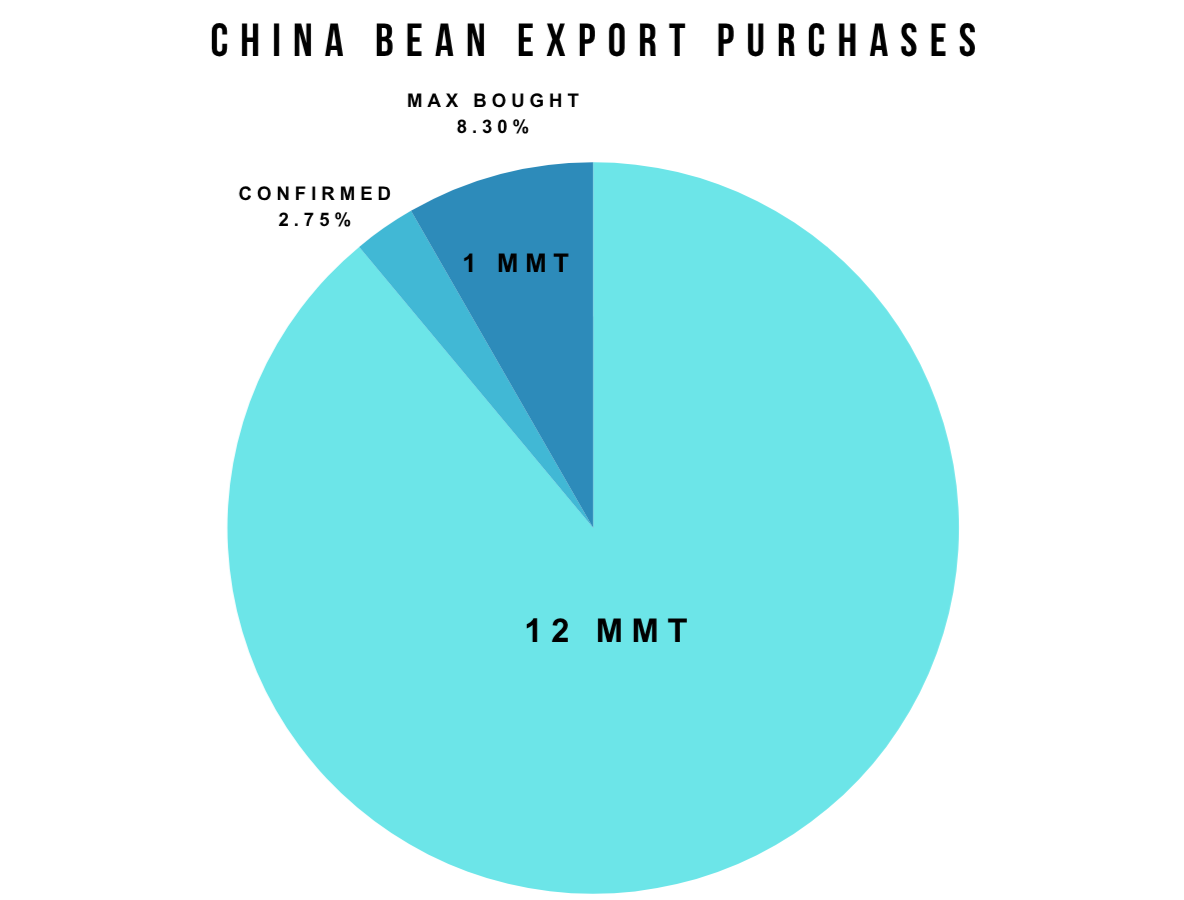
Why did we rally today?
We had a few pieces of news come out.
Last night, Bessent said that we would hopefully have a US and China agreement by Thanksgiving.
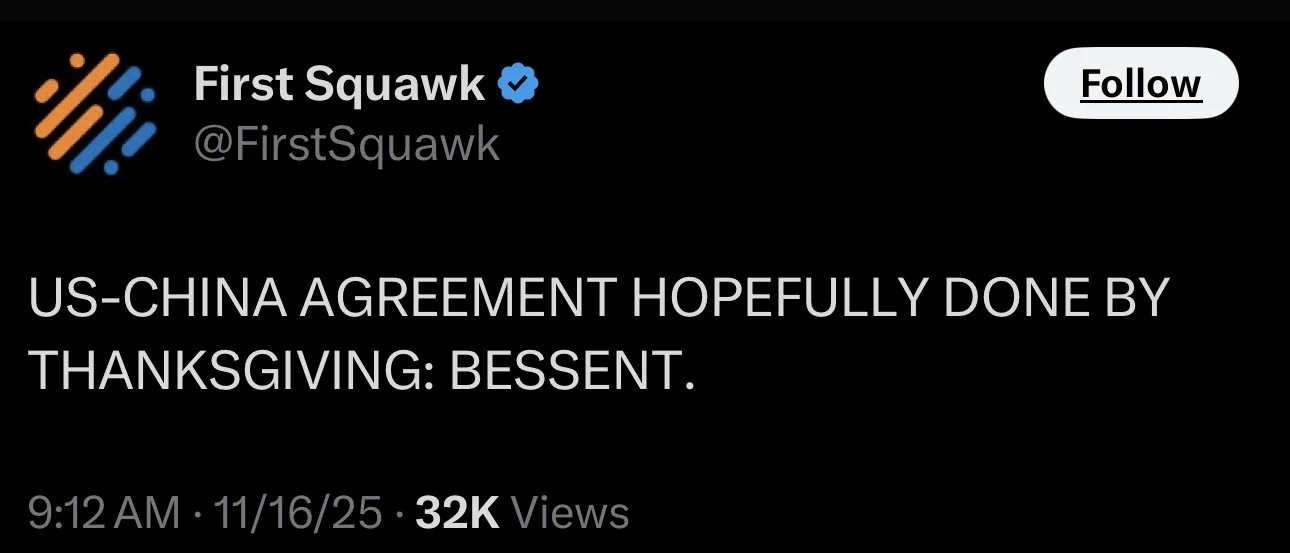
This morning, US Ag Secretary Rollins said she was:
"Confident China will buy US soybeans."
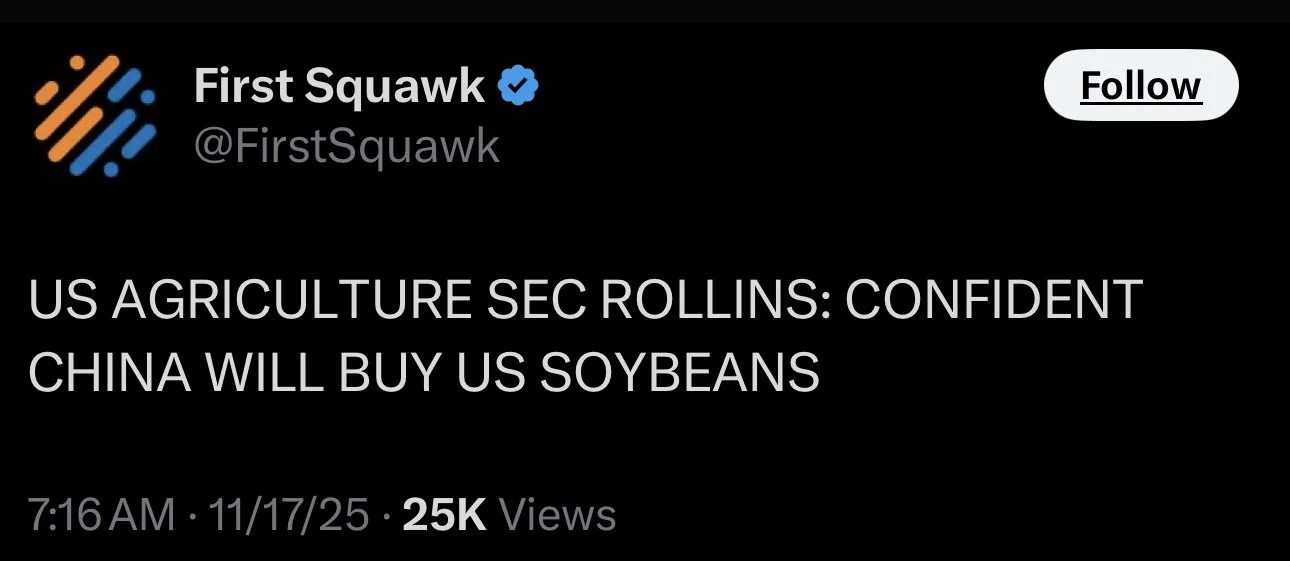
She also said:
"We've already just got about 330k tons out, but we'll get there.. we're going to get that deal signed.. and then we're off to the races."
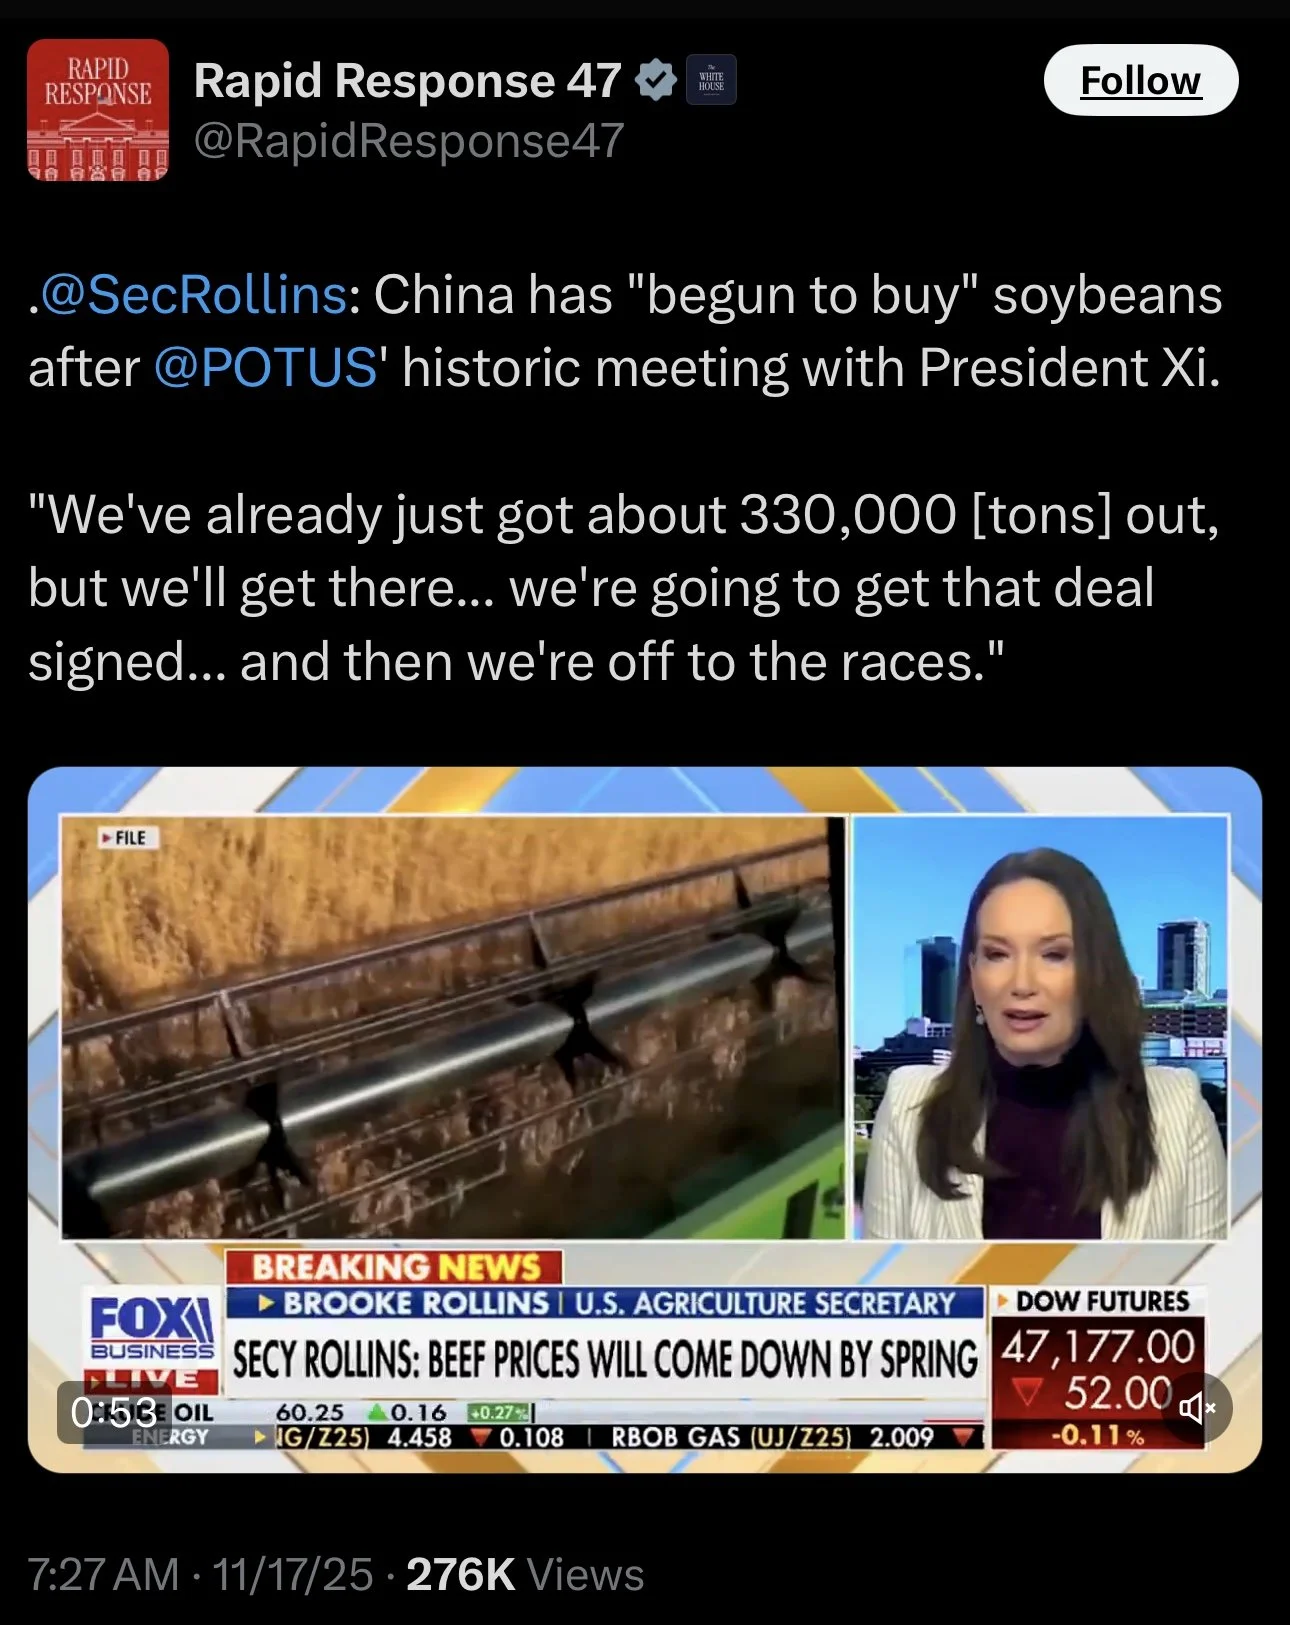
So Friday we sold off because it looked like China hadn’t been buying and traders were worried they wouldn’t be able to meet that 12 million metric tons.
Today we are rallying because optimism of China buying soybeans has returned.
Today we also saw a -100k metric ton sale of soybeans to China cancelled.
The market seems to not care because 100k isn’t really that much when they are suppose to buy 12 million.
Today's Main Takeaways
Corn
Fundamentals:
Today we saw some monster corn export inspections.
This is the 6th best week on record, and the best since 2021.
With zero business to China.
Cleary, corn demand isn’t slowing down.
Here is a seasonal chart from Karen Braun.
We are well above previous years.
Here is another great graphic from the Brock Report.
Corn export inspections are up +72% vs last year.
They are up a massive +116% vs the 5-year average.
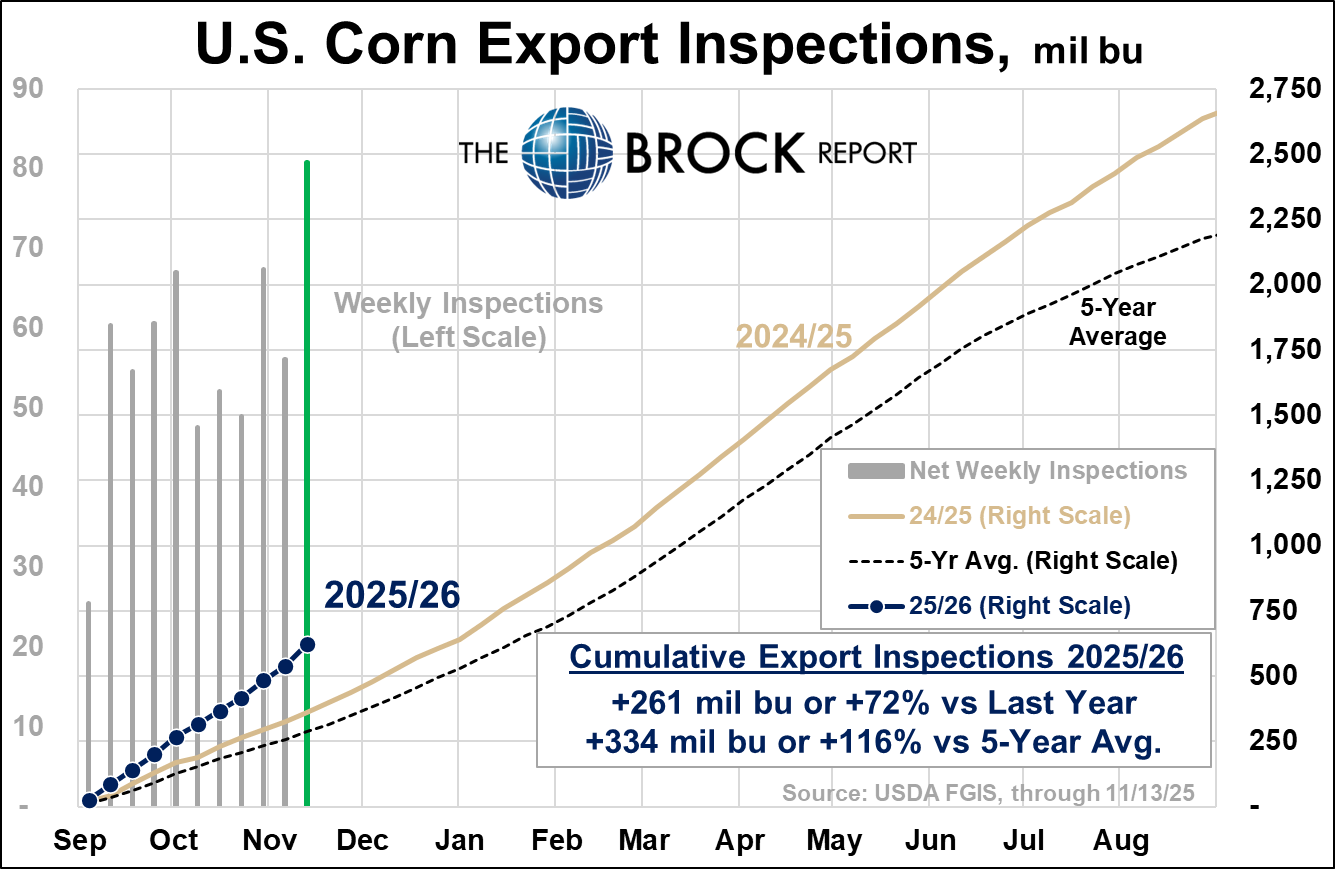
Demand is the number one reason you can’t get bearish on the corn market.
We are going to have record production no matter where yield comes in at.
However, export projections are up over +30% compared to the last time we saw record production back in 2023.
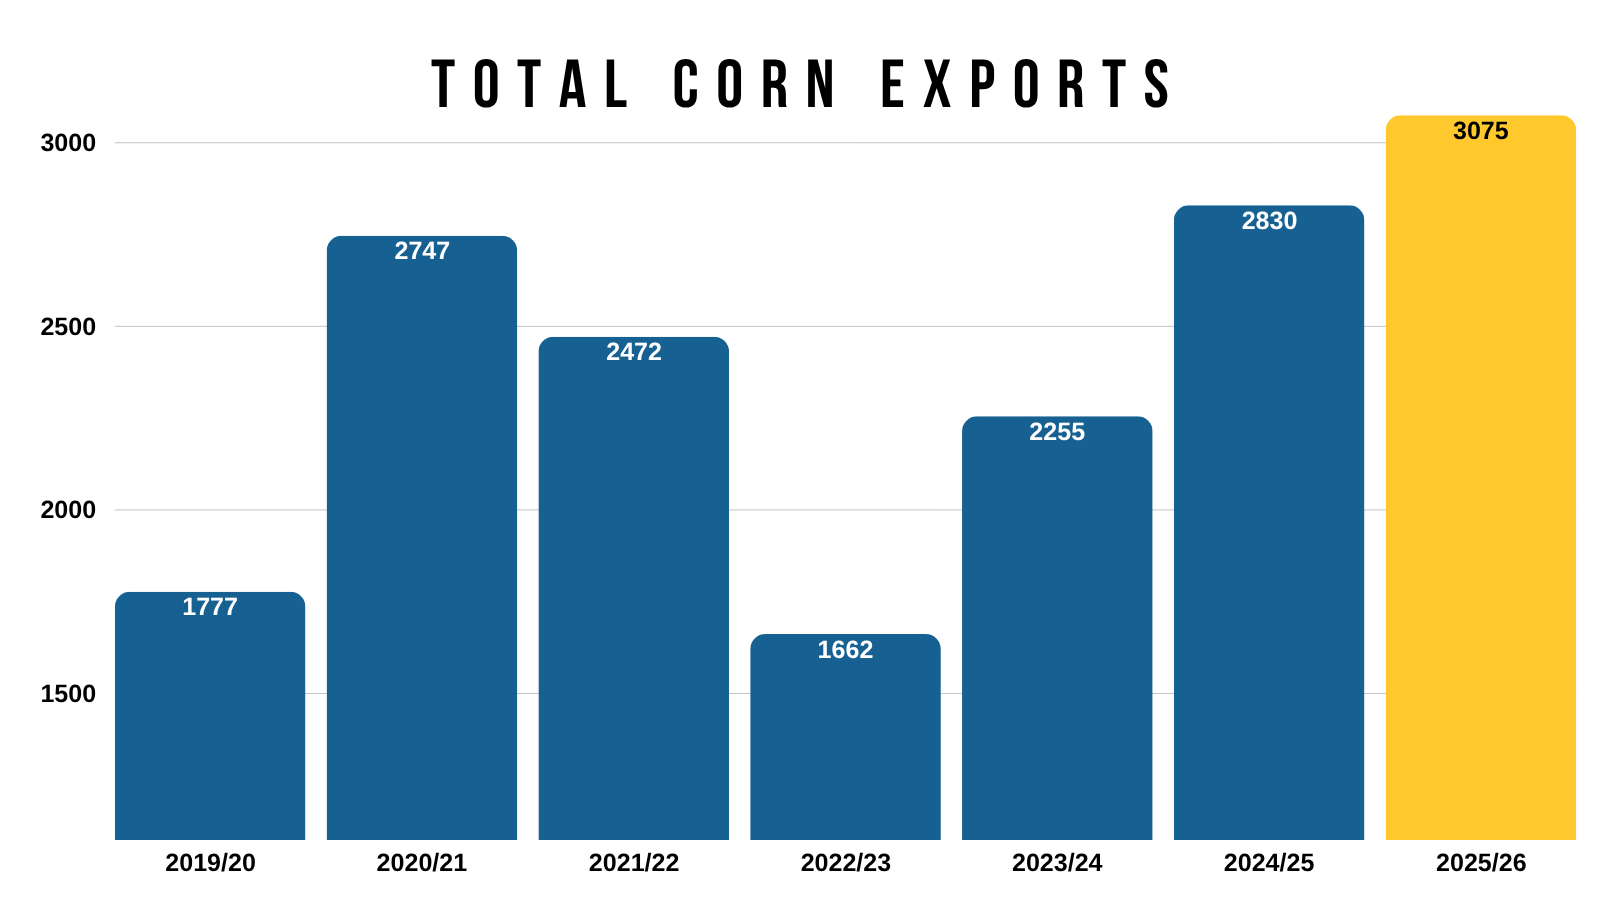
I don’t think there is any chance we don’t see yield fall further in January.
Outside of 2019, every time we've seen a yield cut in November it was followed by an even bigger yield cut in January.
The average cut in January the past decade is -3.12 bpa.
The largest we've seen this decade was 2020 and last year. Both saw -3.80 bpa cuts.
The issue is that for us to get a 180 yield, we'd have to see a -6 bpa cut. Which doesn’t usually happen.
As the average cut puts us at 183.
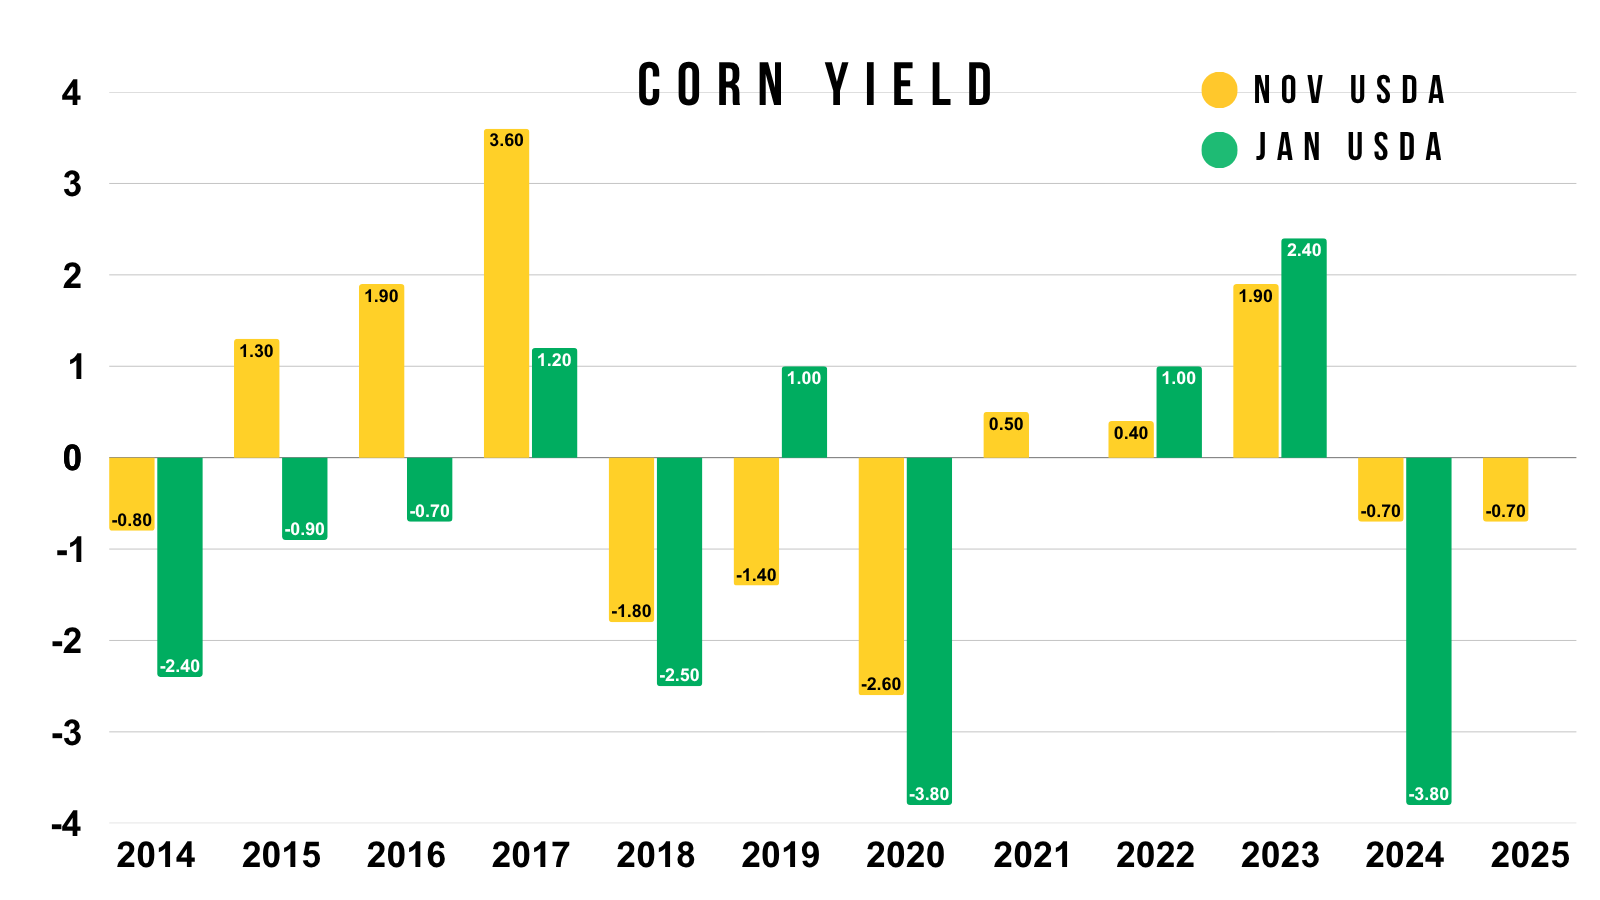
I've shown this chart countless times but I'm still watching this pattern of March-25 vs March-26 corn.
The two years are still tracking pretty closely.
Last year, the real run started in December.

Here is the 5-year seasonal for March corn.
This suggests higher into next year as well.
This seasonal has the top at around $4.80 in February.
We topped at $5.04 in February last year.
For those that think we will continue to track last year's price action, give Jeremey a call as he some options strategies that will perform very well if we do.
Jeremey: (605)250-3863
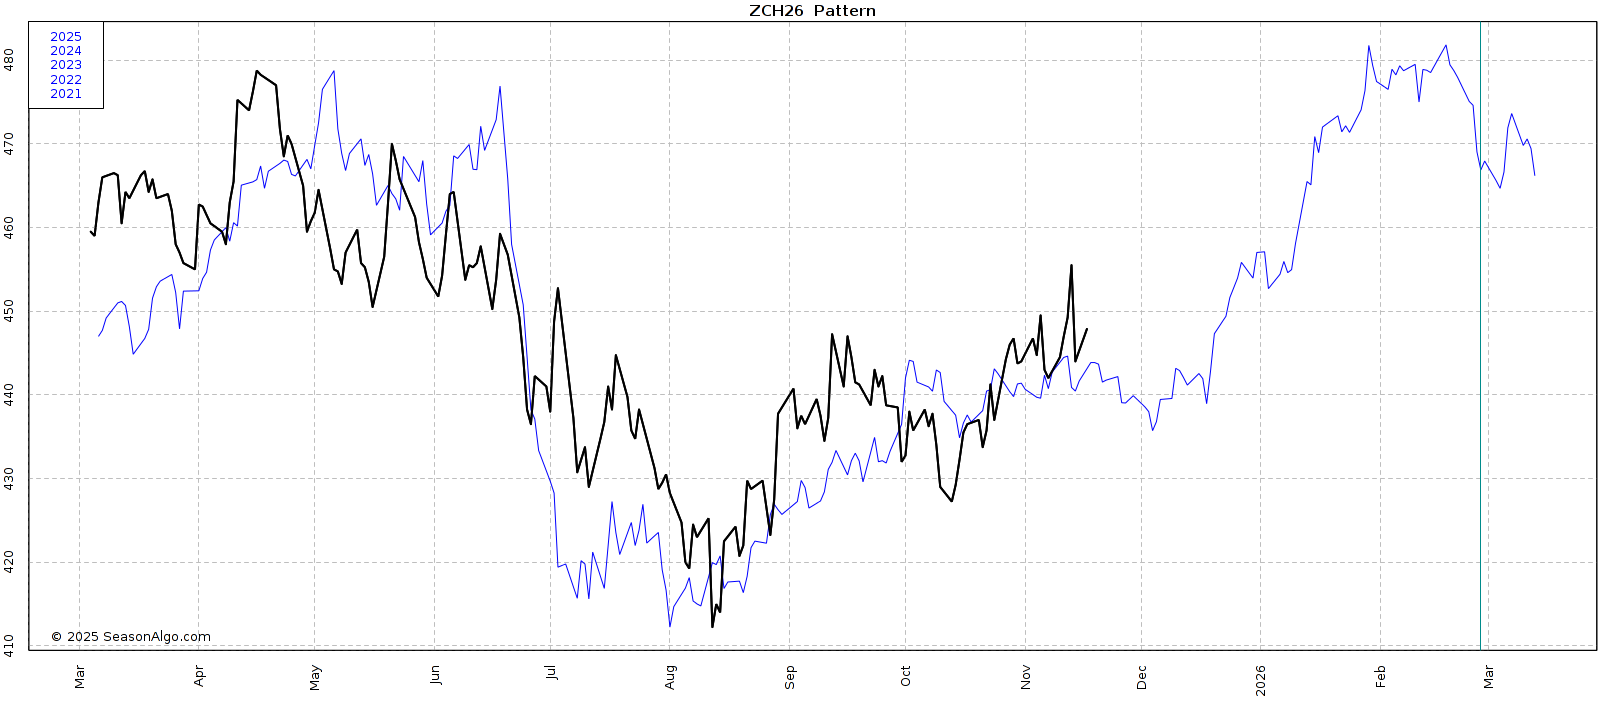
Technicals:
Dec Corn
The USDA spoiled the breakout we had.
Ultimately, bulls want to hold the red box to keep the short term bias remaining higher. As that would be a standard correction from the recent rally (50-61.8%).
The September correction bottomed at that same 50-61.8% level (orange box).
If we get consective closes above the 200-day, it could spark further upside.
Since we alerted a sell signal and hedge alert at that $4.35 resistance a few weeks ago, our next target to take risk off the table is $4.55
That is 161.8% of the contract low to September rally. Known as the golden fib and a common spot for a 2nd rally to stall.

March Corn
Same story in March corn.
Need to hold the red box ideally.
Break above the 200-day MA and I'd like to think we see further upside.
The next target is $4.73, which is 161.8% of the original rally off contract lows.

Soybeans
Today's Sell Signal & Hedge Alert:
Today we did offically alert our first sell signal since we tapped those yearly highs +80 cents or so ago.
We have been very very patient on selling soybeans this year. This was only our 3rd sell signal since January.
The last two were at the August highs and then a few weeks ago when we hit yearly resistance.
Here is the link in case you missed it: CLICK HERE
Below is a visual of our signals:

Do I think soybeans have more upside? Yes I do.
It simply makes sense to take a little risk off the table following the size of rally we've seen.
Especially if you have DP, basis contracts, or know you are going to have to move soybeans by the end of the year.
If you have more time on your hands, you have more flexibility and do not have to be as proactive as someone who is in one of those scenarios.
Our advice was to do one of the following:
Buy a put. This protects you and gives you a floor while keeping your upside open. If prices go lower, your put makes money. If prices go higher, you only lose out on the cost of your put.
Sell some grain and buy a call. This gives you a worst case scenario while also keeping your upside open. If we go lower, you only lose the cost of your call. If we go higher, your call makes money.
If you do not have a hedge account, you could simply make an incremental sale.
We prefer to use options. Because both of these strategies keep our upside open in the event that prices continue to go higher. My personal bias leans higher so I want to keep my upside open.
I don’t think the top is in. It simply makes sense for most to have some downside protection following a $1.50 rally.
I am not getting carried away here at all. I do not want to be oversold if soybeans go to $12 or higher like I've been stating on each of these signals.
Fundamentals:
Some people are bearish because China hasn’t bought many beans. They think that they won’t.
Some people are bullish because China hasn’t bought many beans. What happens if they do?
If they really are going to buy the amount they agreed to, that means they have a lot of catching up to.
Soybeans have rallied this much on the "rumor" and perception of China buying beans. You can only imagine what happens if they do.
Bears argue, "Why would China buy US soybeans if Brazil's beans are cheaper?"
Which is a valid question. But in the grand scheme of things, soybeans are a small fraction of the deals they are going for. Essentially a drop in the bucket compared to the other deals. Soybeans are a bargaining chip for them to reach other deals.
Then we also have the US supply situation.
If demand is fine, we aren’t swimming in soybeans.
Even with a 53 bpa yield, our carryout is the tightest it's been in 3 years.
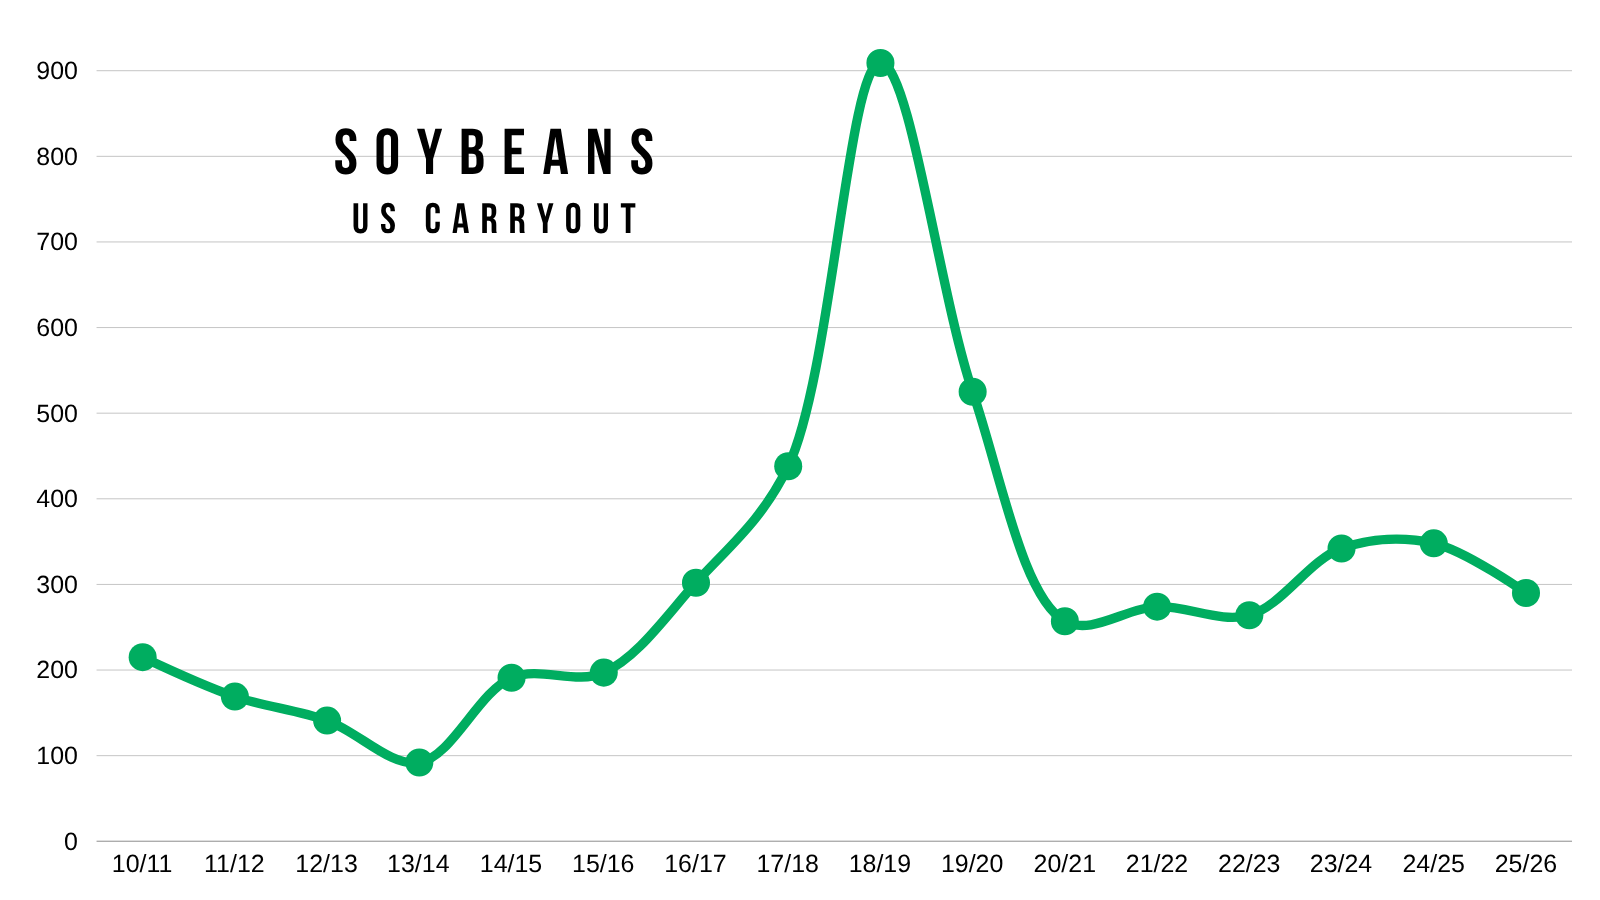
Here is a chart that shows you how yield effects carryout.
This uses the current demand projections and does not take into account changes to demand. If supply drops, the USDA will offset some of that loss by cutting demand. It won’t actually be linear.
But this gives you a clear picture at just how tight the room for error really is like we've been talking about all year long.
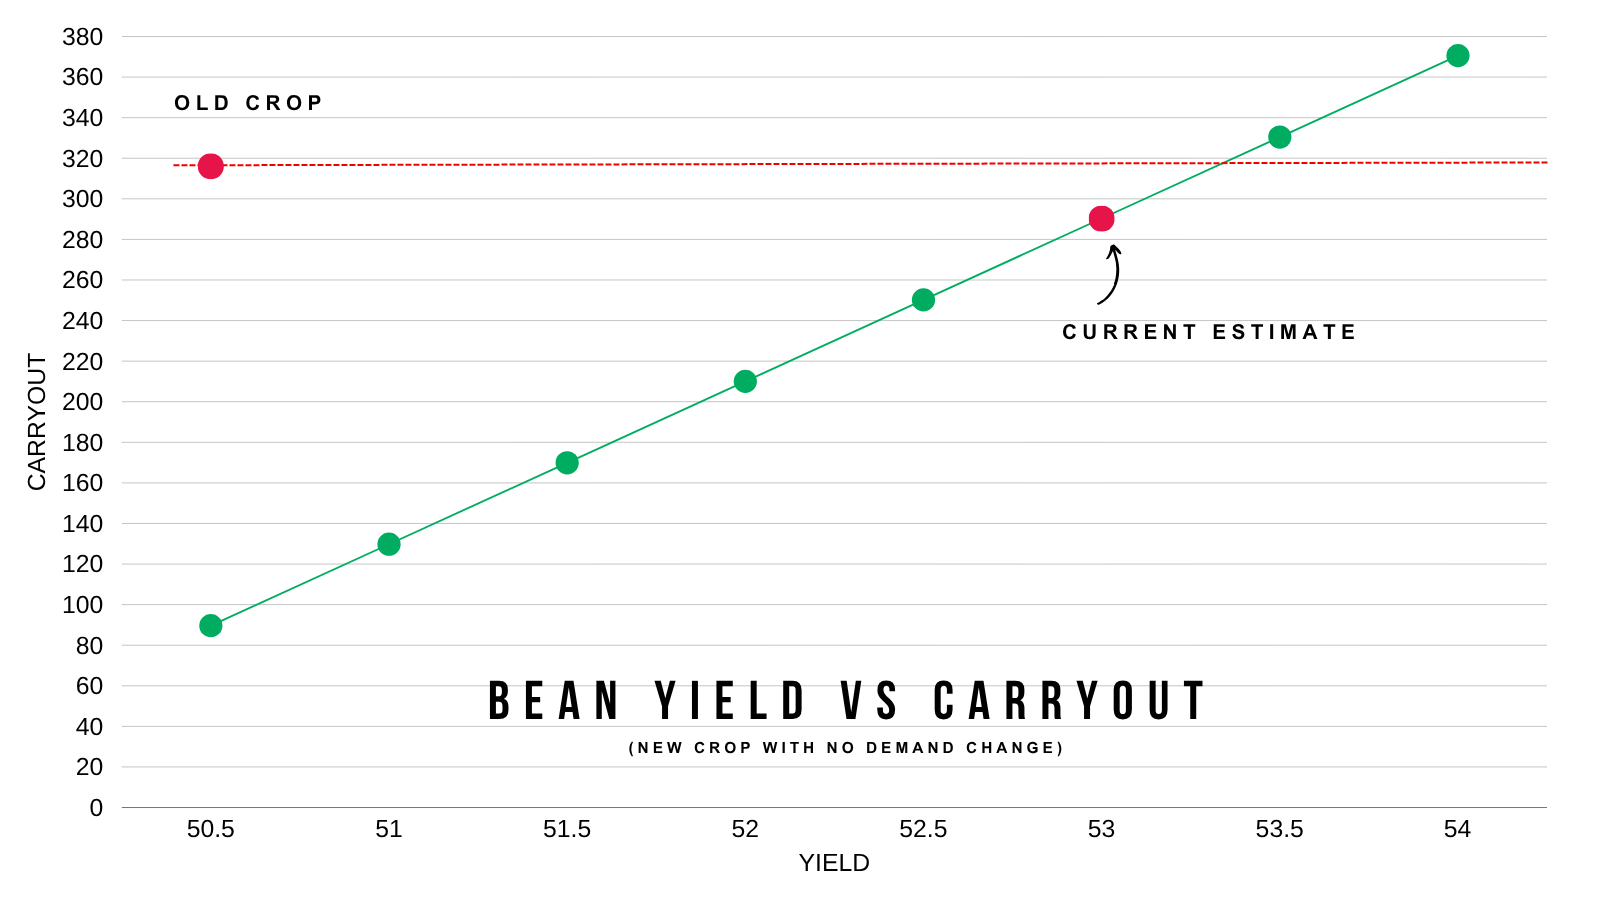
The other big factor is Brazil.
What happens if they run into a weather issue?
An issue with their crop would have a much larger impact on the world soybean situation than if we had an issue in the US.
If Brazil runs into an issue, that could also force China to have to buy even more soybeans from the US.
A problem in Brazil is one of the ways you could run into an extremely bullish market. Such as $13 to $14 beans. I am not saying that will happen. I am saying that is the possibility IF Brazil has an issue.
We already have the 2nd lowest acres of the last decade here in the US. Things would get very interesting if Brazil ran into a production hiccup.
Here is their outlook for November and December. It does appear to be slightly on the dry and warm side, but too early to call for any sort of scare.
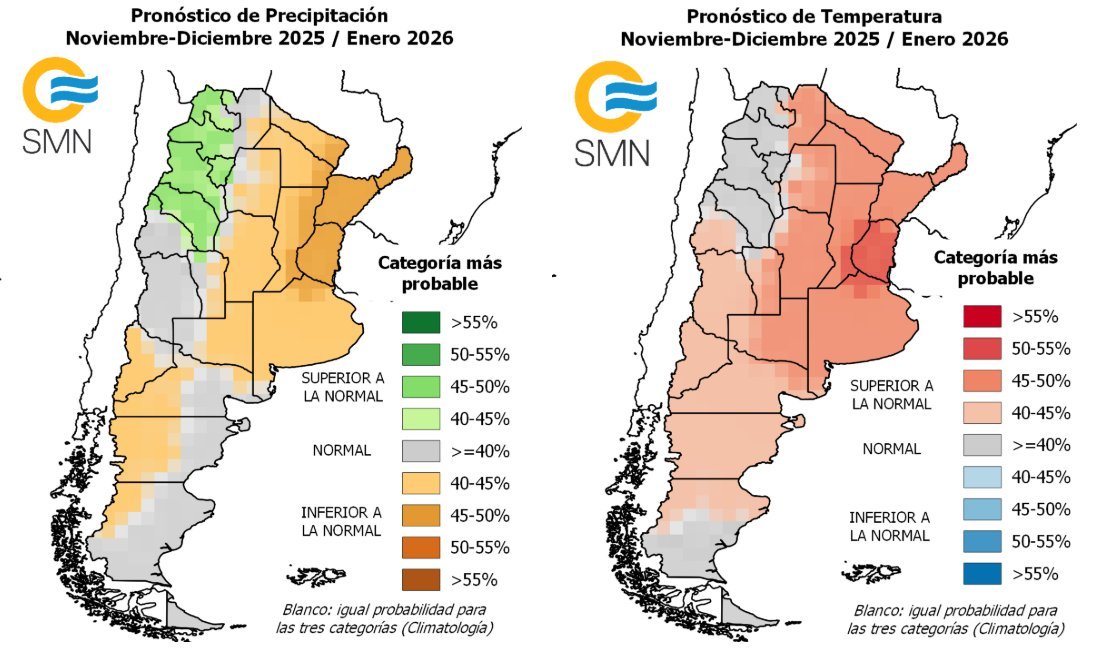
Domestic crush demand is also one of the friendliest factors that seems to be flying under the radar.
Crush demand is +200-300 million bushels more than the last time China bought as many soybeans as they've agreed to buy.
Meaning we have an extra +200-300 million bushels of demand compared to the last time China bought as many soybeans as they've agreed to buy over the next few years.
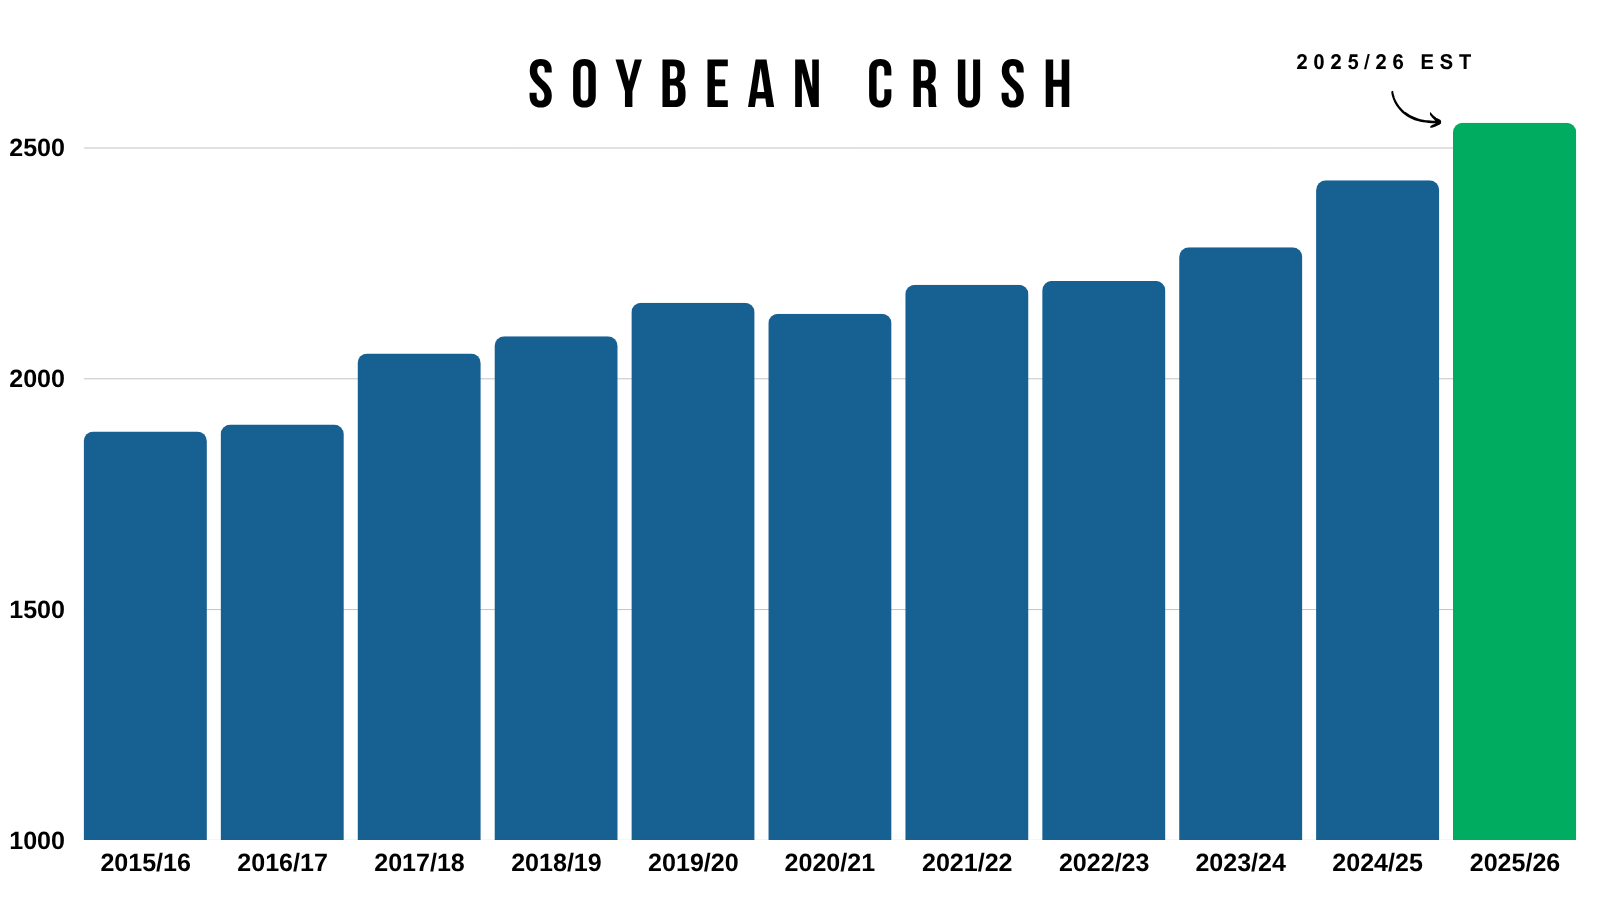
NOPA crush was phenomenal today.
The October number shattered the record for any month by +10 million bushels.
It was the best October by +28 million bushels. Which is a +12% record for the month.
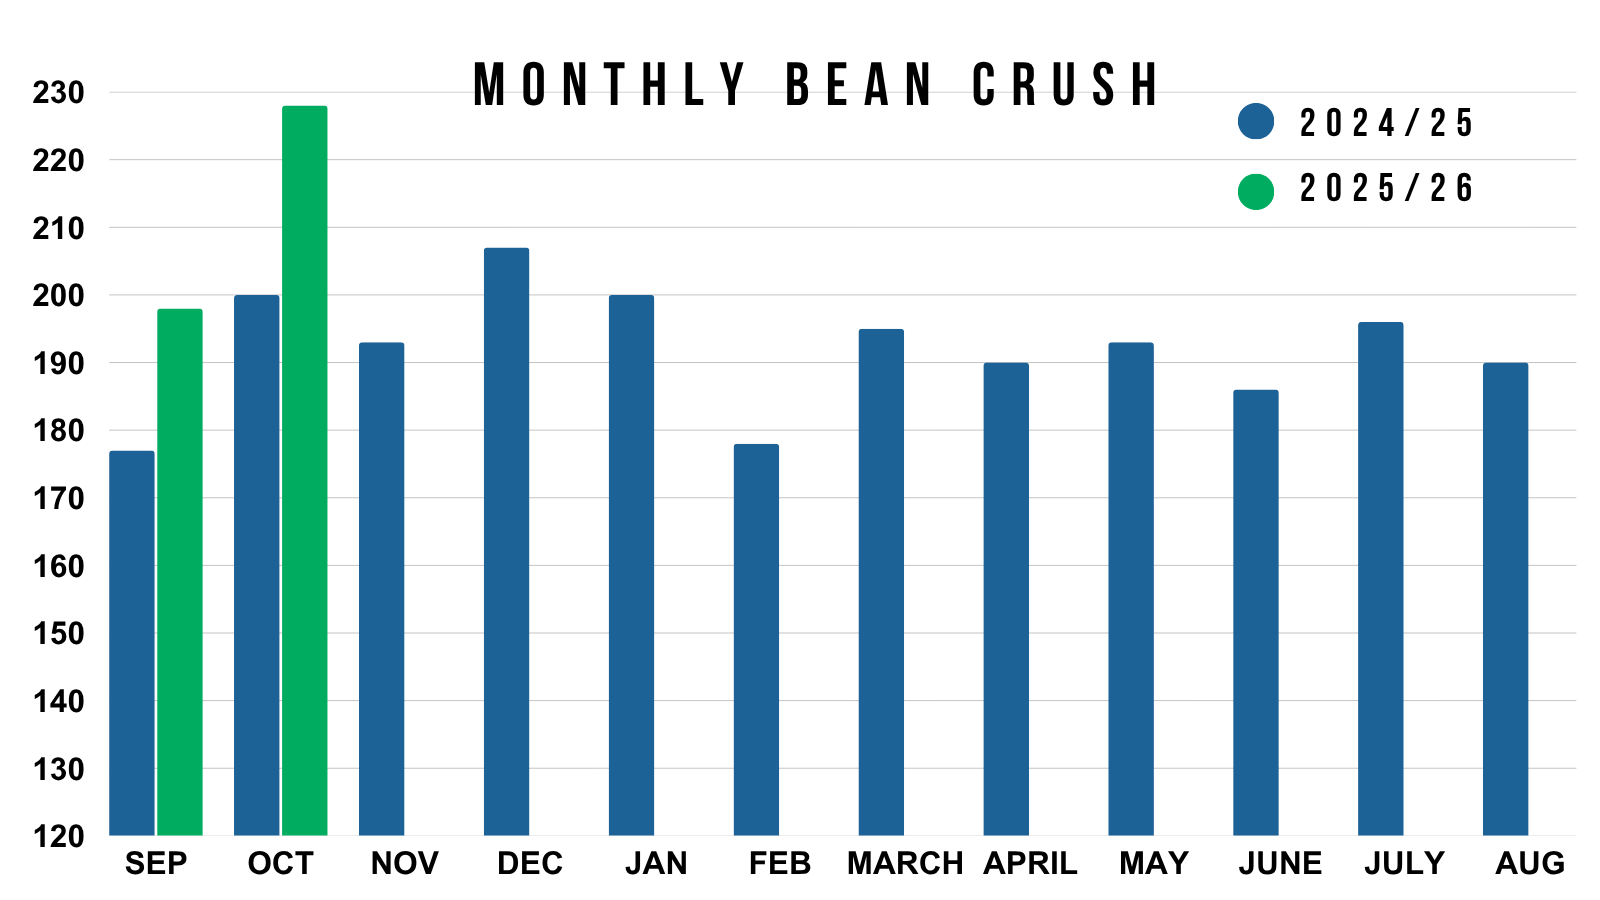
Technicals:
Jan Beans
The chart looks good.
The reason for the sell signal & hedge alert today was that we hit our first target.
That target was $11.55 as it reclaimed 61.8% of the contract highs.
Our next target is right around $12.00
As the next fib level is the 78.6% level at $12.05
Friday we posted an outside down day. Today we posted an outside up day. Trading below Friday's lows but closing above the highs.
That signal and hedge alert is not us saying to go and try to speculatively short soybeans. I would not speculatively short this market as I see the potential for further upside.

I personally think we have a very solid chance at seeing $12.00.. perhaps even higher.
Here are a few other charts as to why I think $12.00 is very possible.
If you take the entire $1.14 range we were trapped in this year.
Then you add that on top of the point of breakout at $10.87 and our resistance this year.
You get $12.01
($1.14 + $10.87 = $12.01)

We were trapped under that $10.80 to $11.00 resistance for over a year.
When it broke, we had some clear air to the upside.
In the past decade, we've only broken that resistance twice until now.
2016: we ran right to $12.00
2020: we went much higher
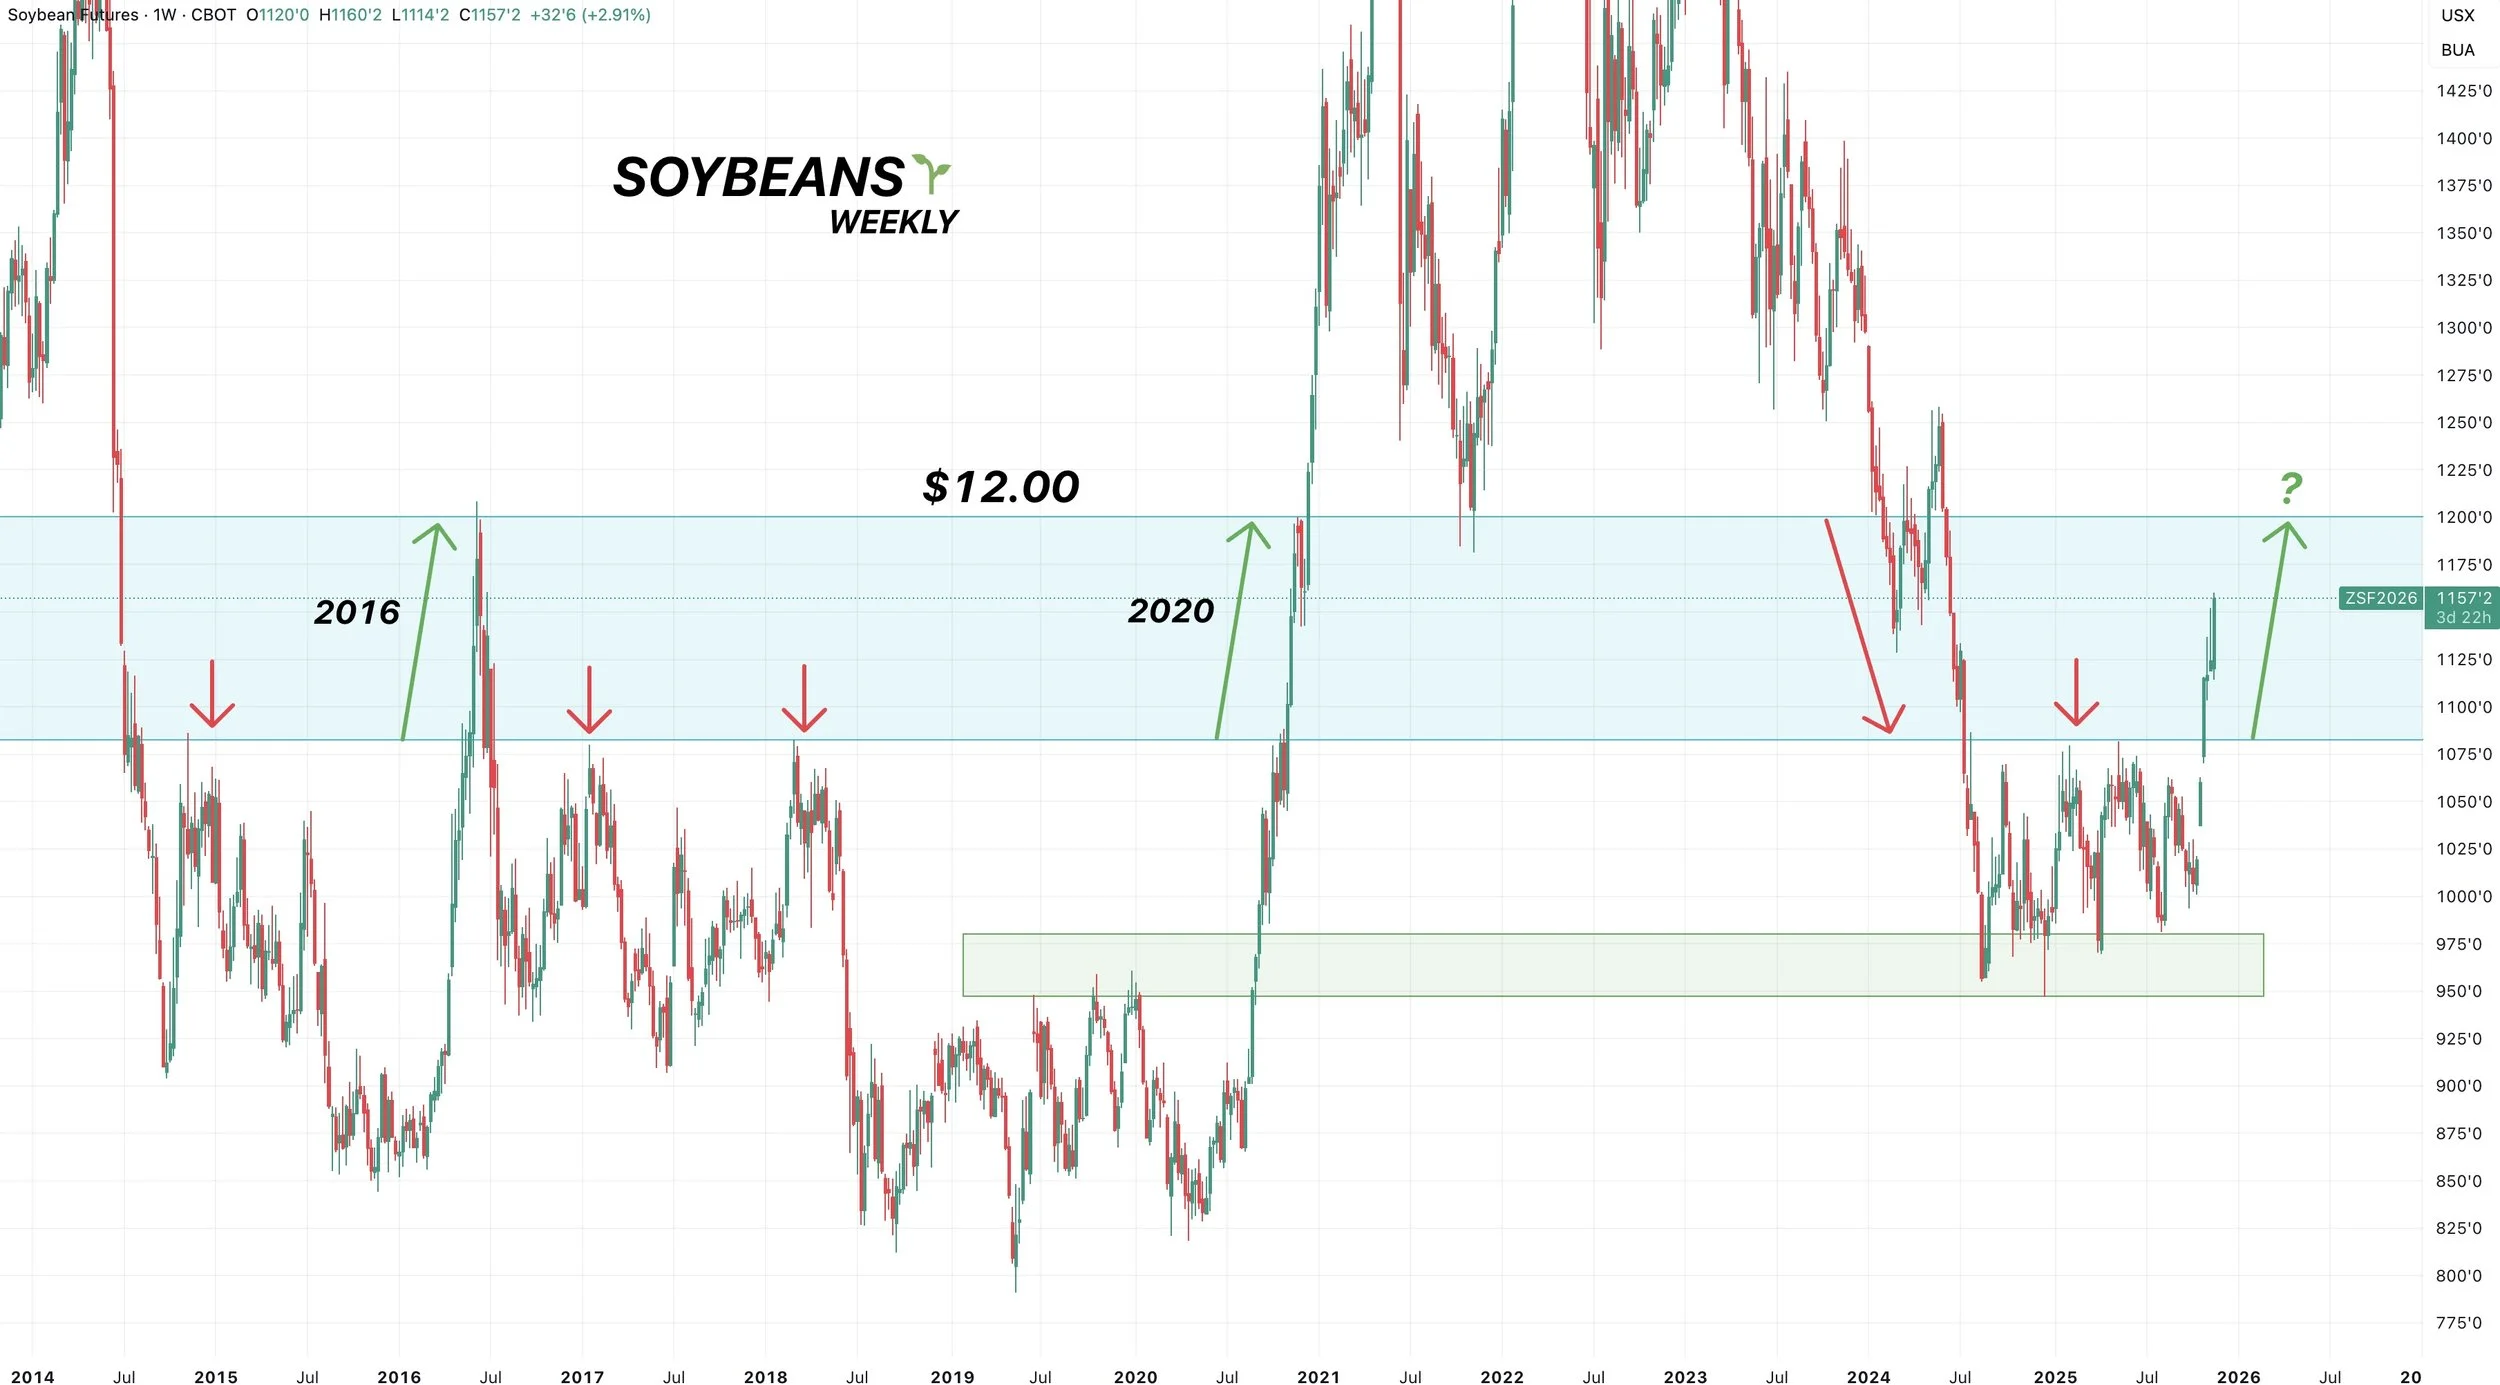
If you look at the monthly chart, soybeans really just hardly trade in the $11.00's
We've created virtually zero support or resistance in this range because we never trade in it.
Every time we either run to $12.00 or fall below $11.00
As a matter of fact, every single time soybeans have been below $11.00 and then broke above.. we have never stopped in the $11.00's
We have always went to $12.00 or higher. Every time.
Does it have to happen this time? No of course not, but it is a very compelling argument and I personally think it happens again.
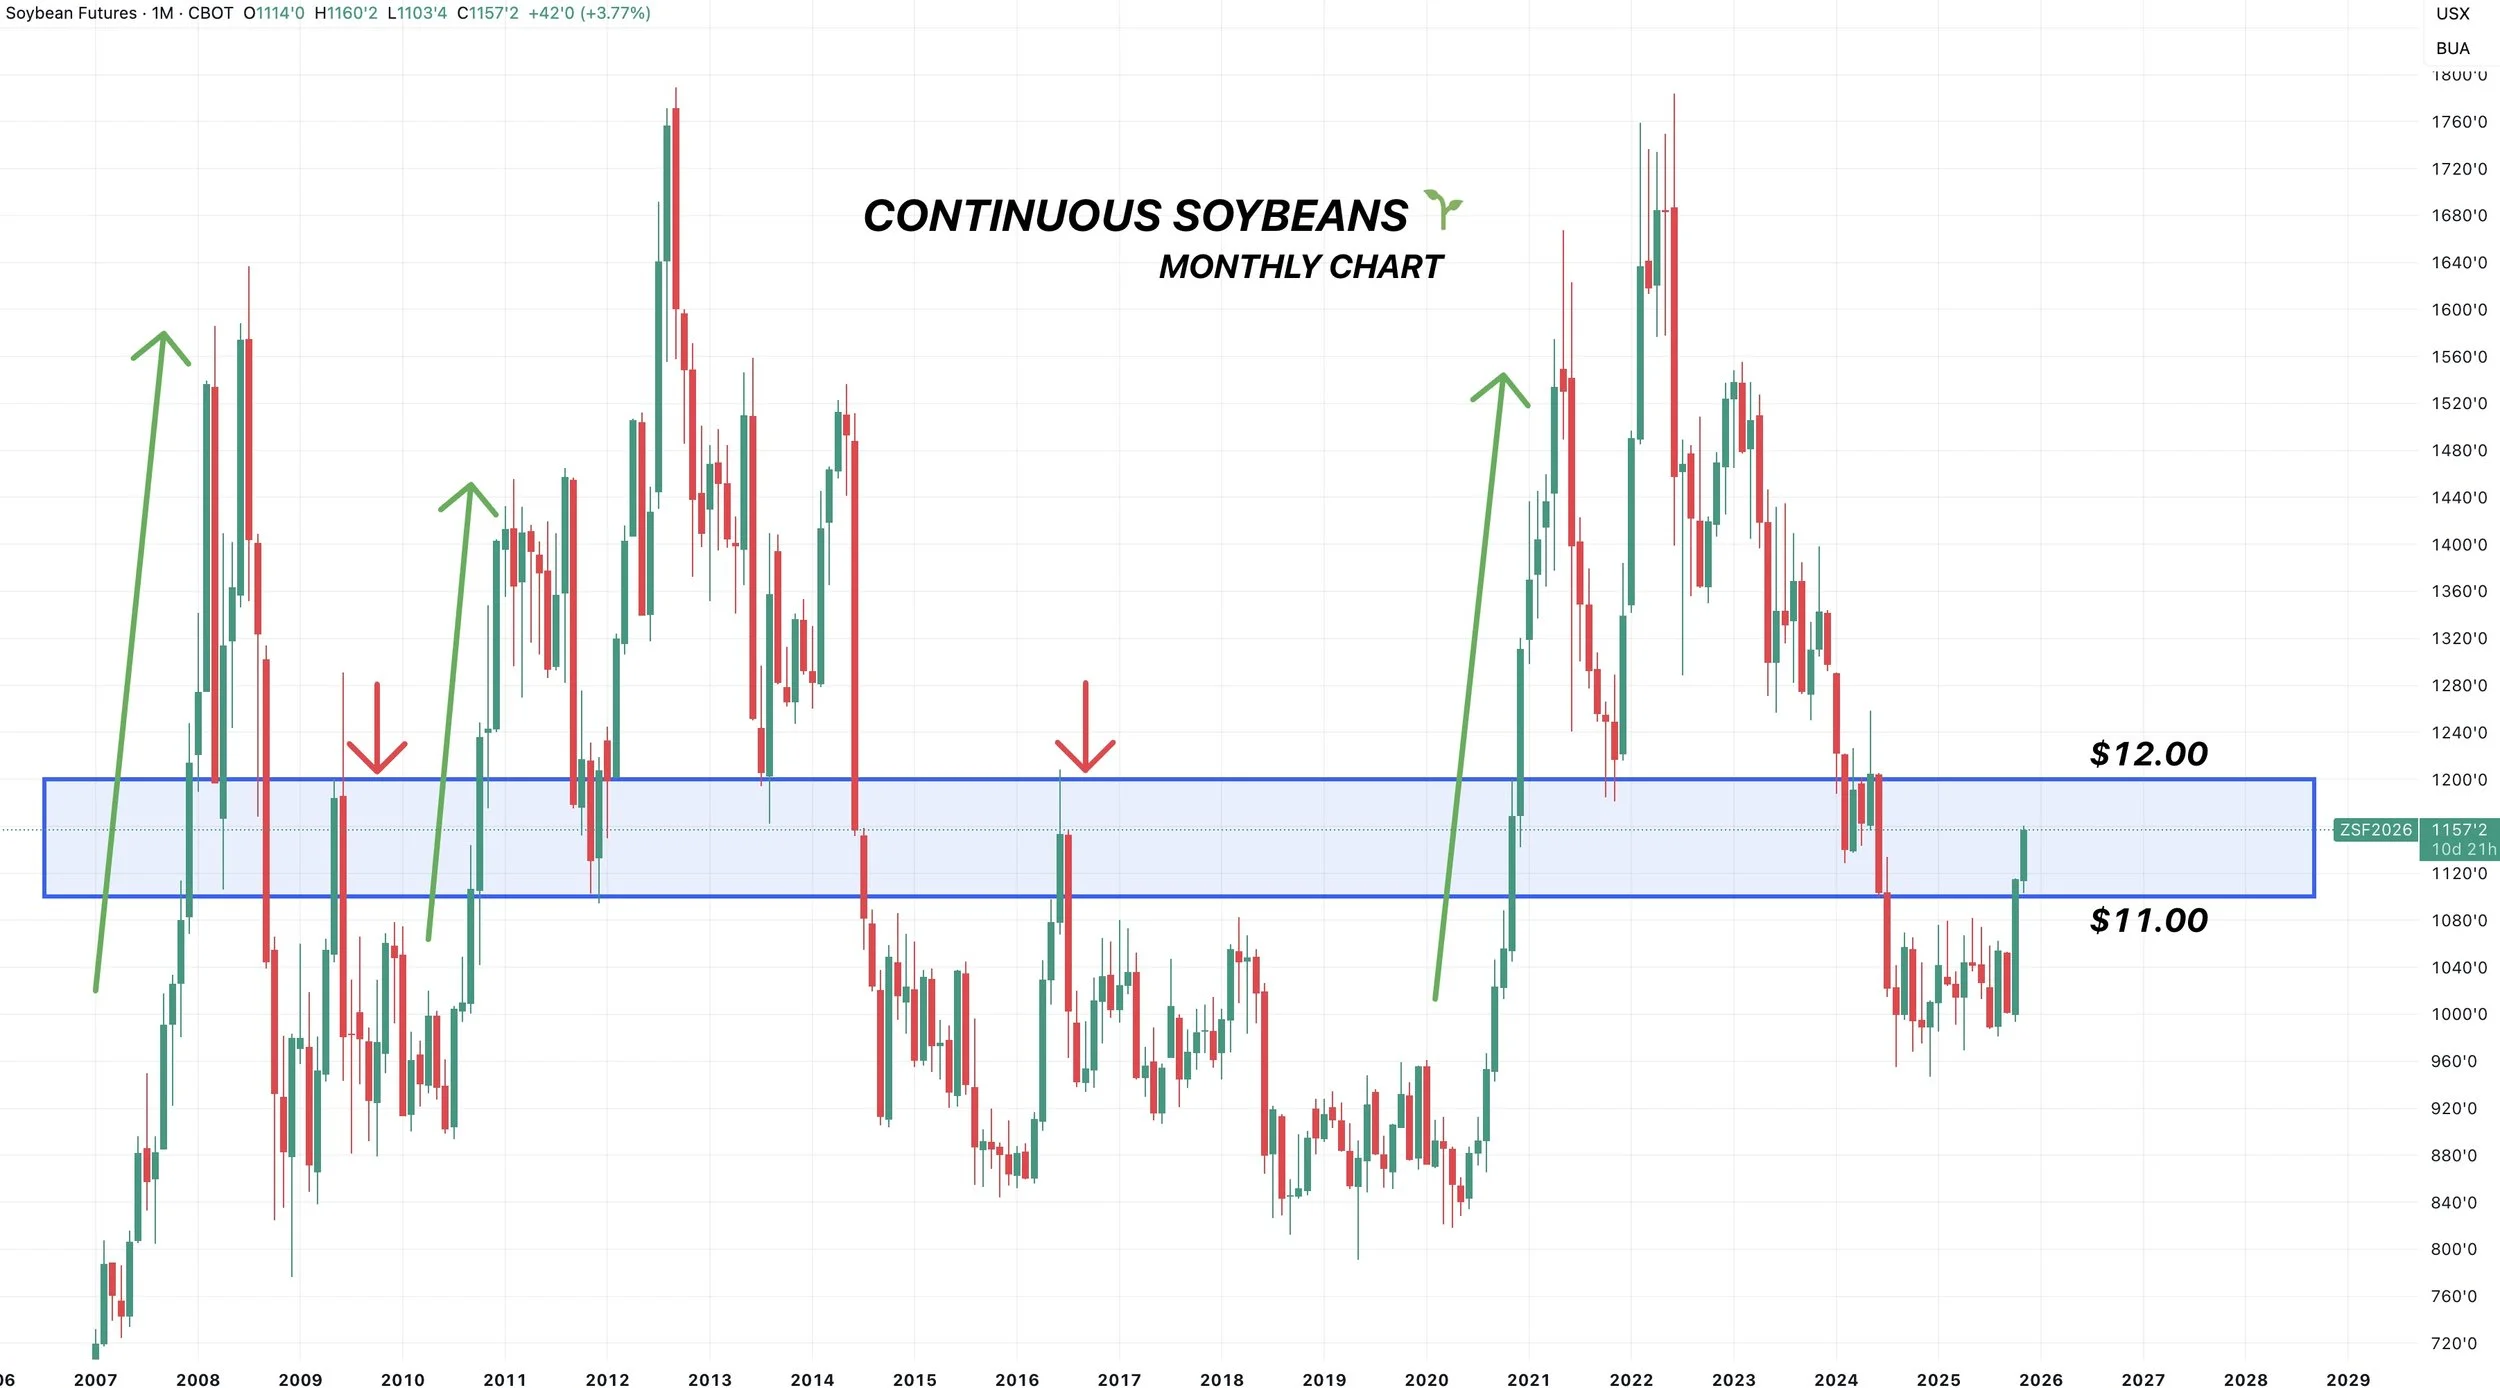
Wheat
Fundamentals:
Wheat caught a nice bid higher today. Erasing the losses from the USDA report.
Fundamentally, there still isn’t much to update here.
We lack a catalyst to go dramatically higher. As ample global production is keeping a lid on us.
But I can’t get bearish at 5-year lows either.
Simply waiting to seize an opportunity.
In the wheat market, that opportunity usually only comes a handful of times a year and doesn’t last long.
India announced they would start exporting wheat again. Which is bearish. As they’ve had restrictions for the last 3 years. They are considering exporting due to ample supplies.
We need a catalyst for some short covering.
Maybe that comes from a technical breakout. Maybe it comes from a fundamental factor.
Some speculate that a brutally cold December forecast could be the spark we need. As it could offer potential winter kill damage with a lack of snow cover. I guess we will have to wait and see.
Regardless, I am not in a hurry to sell a bunch of wheat down here.
Technicals:
Dec Wheat
I still like taking a little risk off the table in the green box.
As that claws back 50-61.8% of the June highs.
The 200-day MA also sits in that box.
The wheat market has really struggled to stay above the 200-day MA for very long.
It's been above it just 3 times since Sep 2024. Each time did not last very long at all.
To the downside, bulls want to hold the orange box.
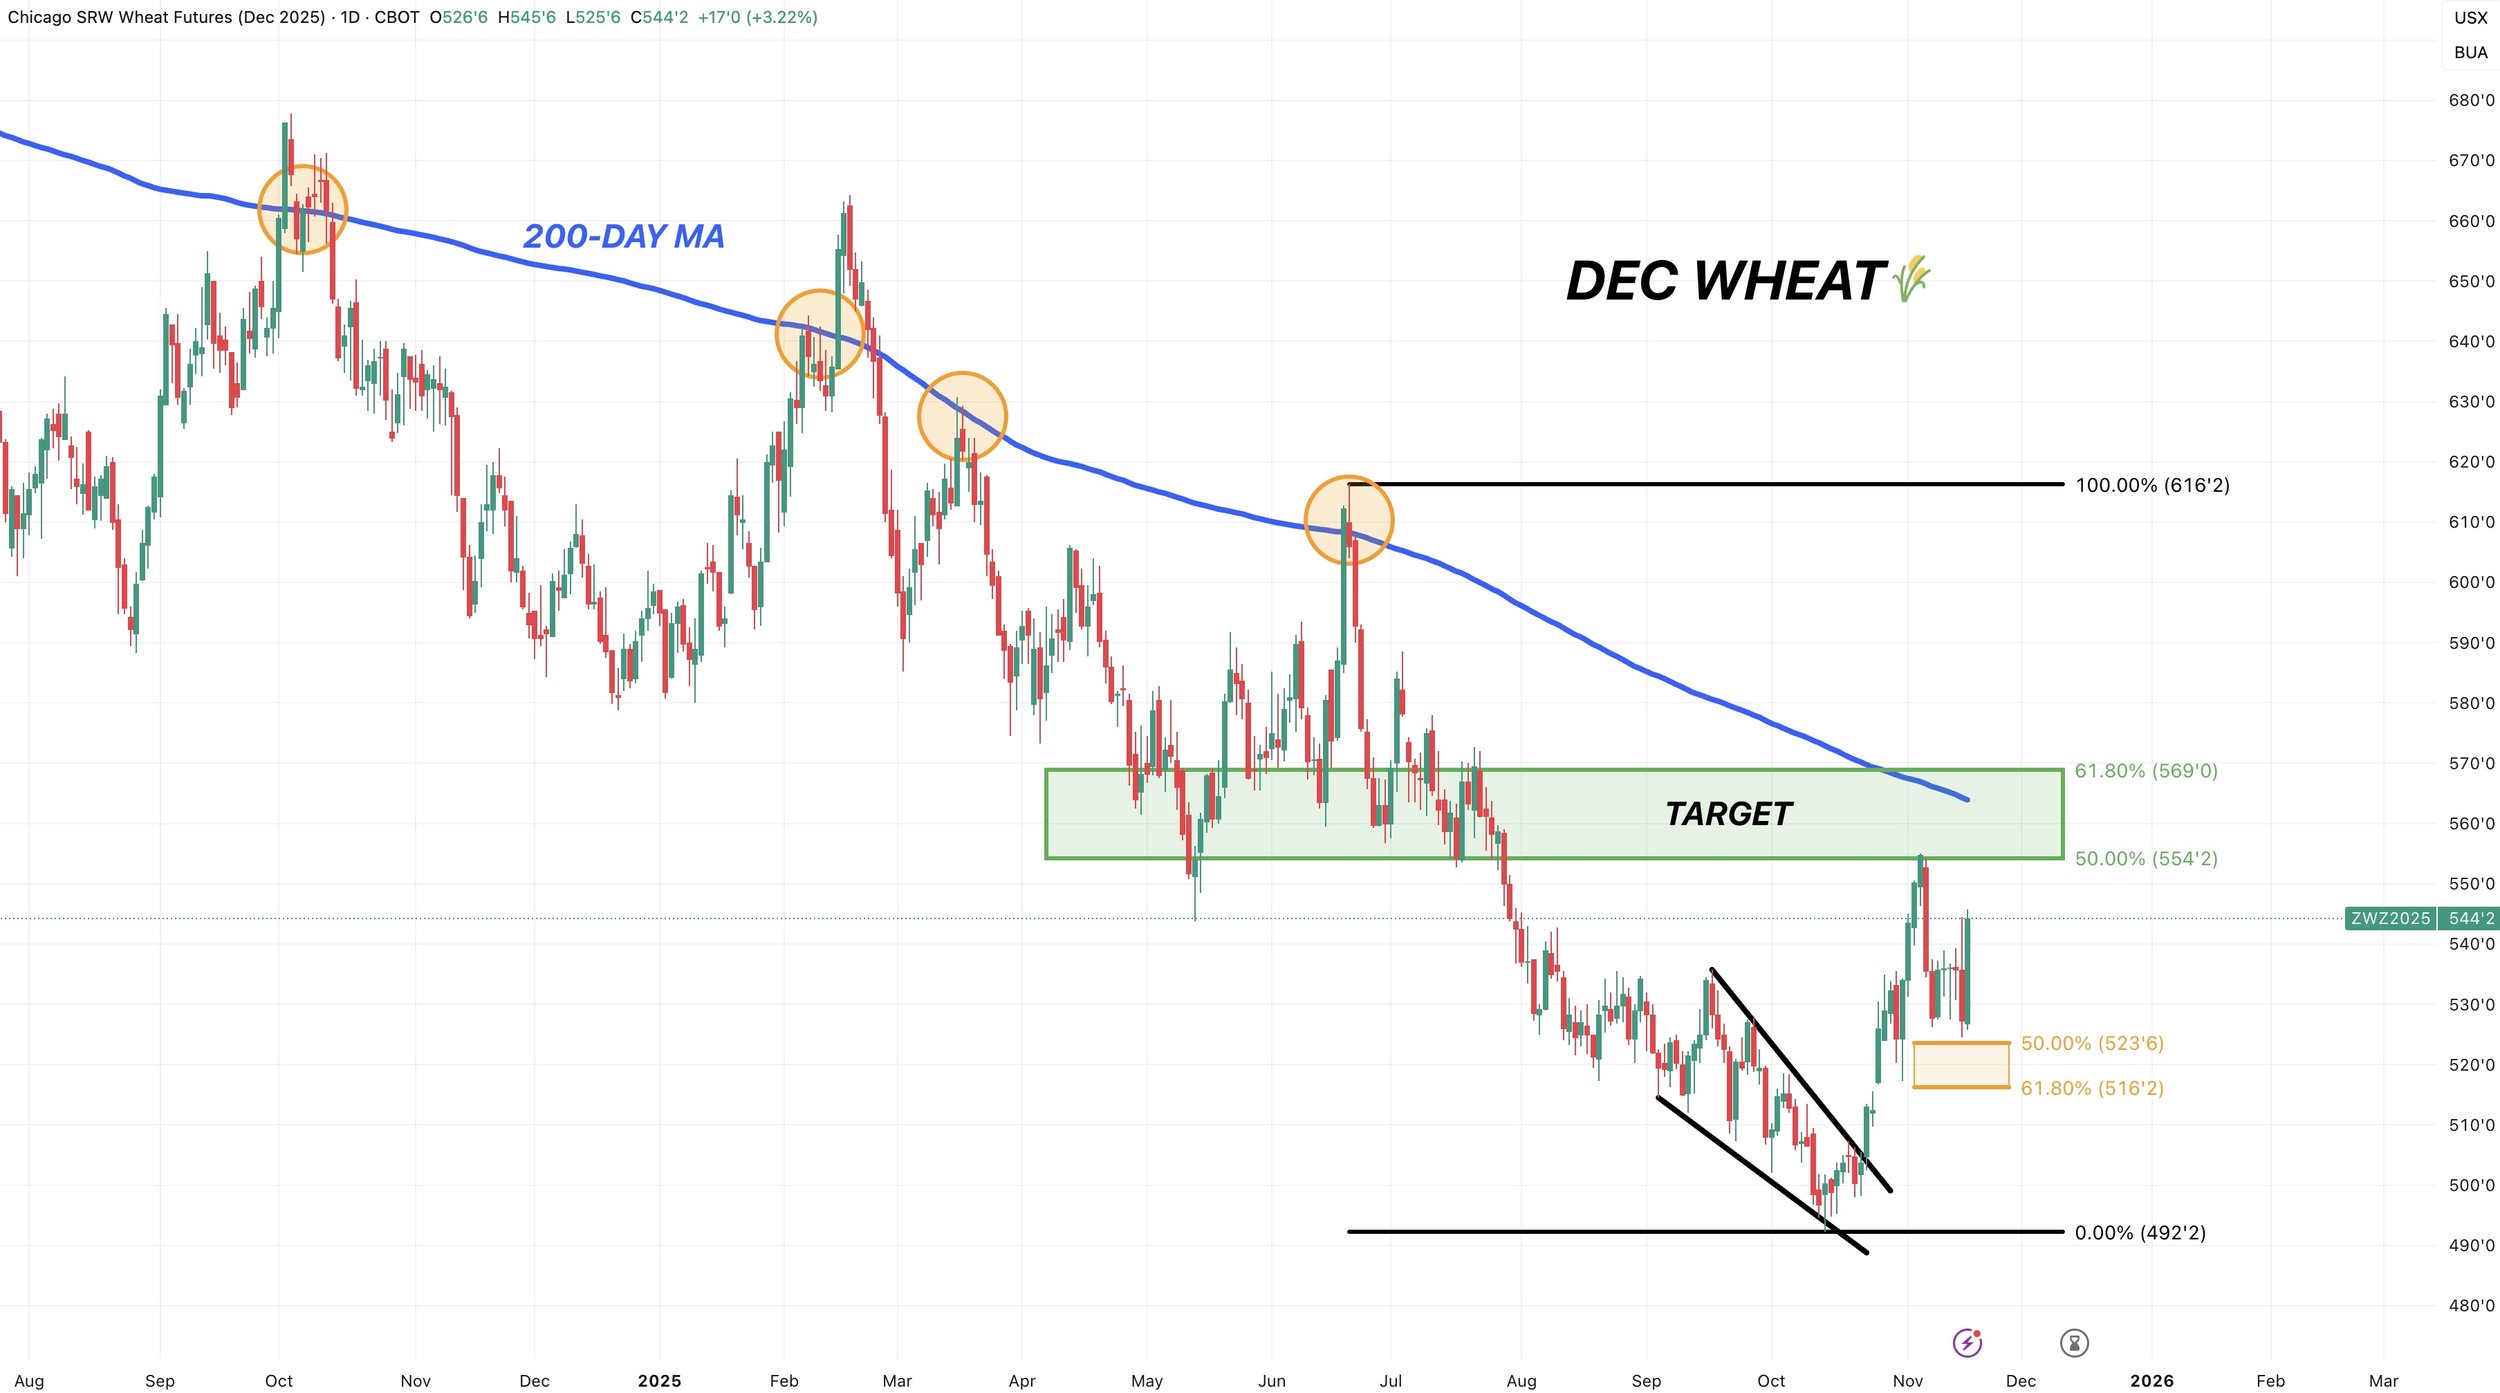
Dec KC Wheat
For KC our upside target is still that green box to look at taking some risk off the table.
As it gives back 50-61.8% of the June highs.
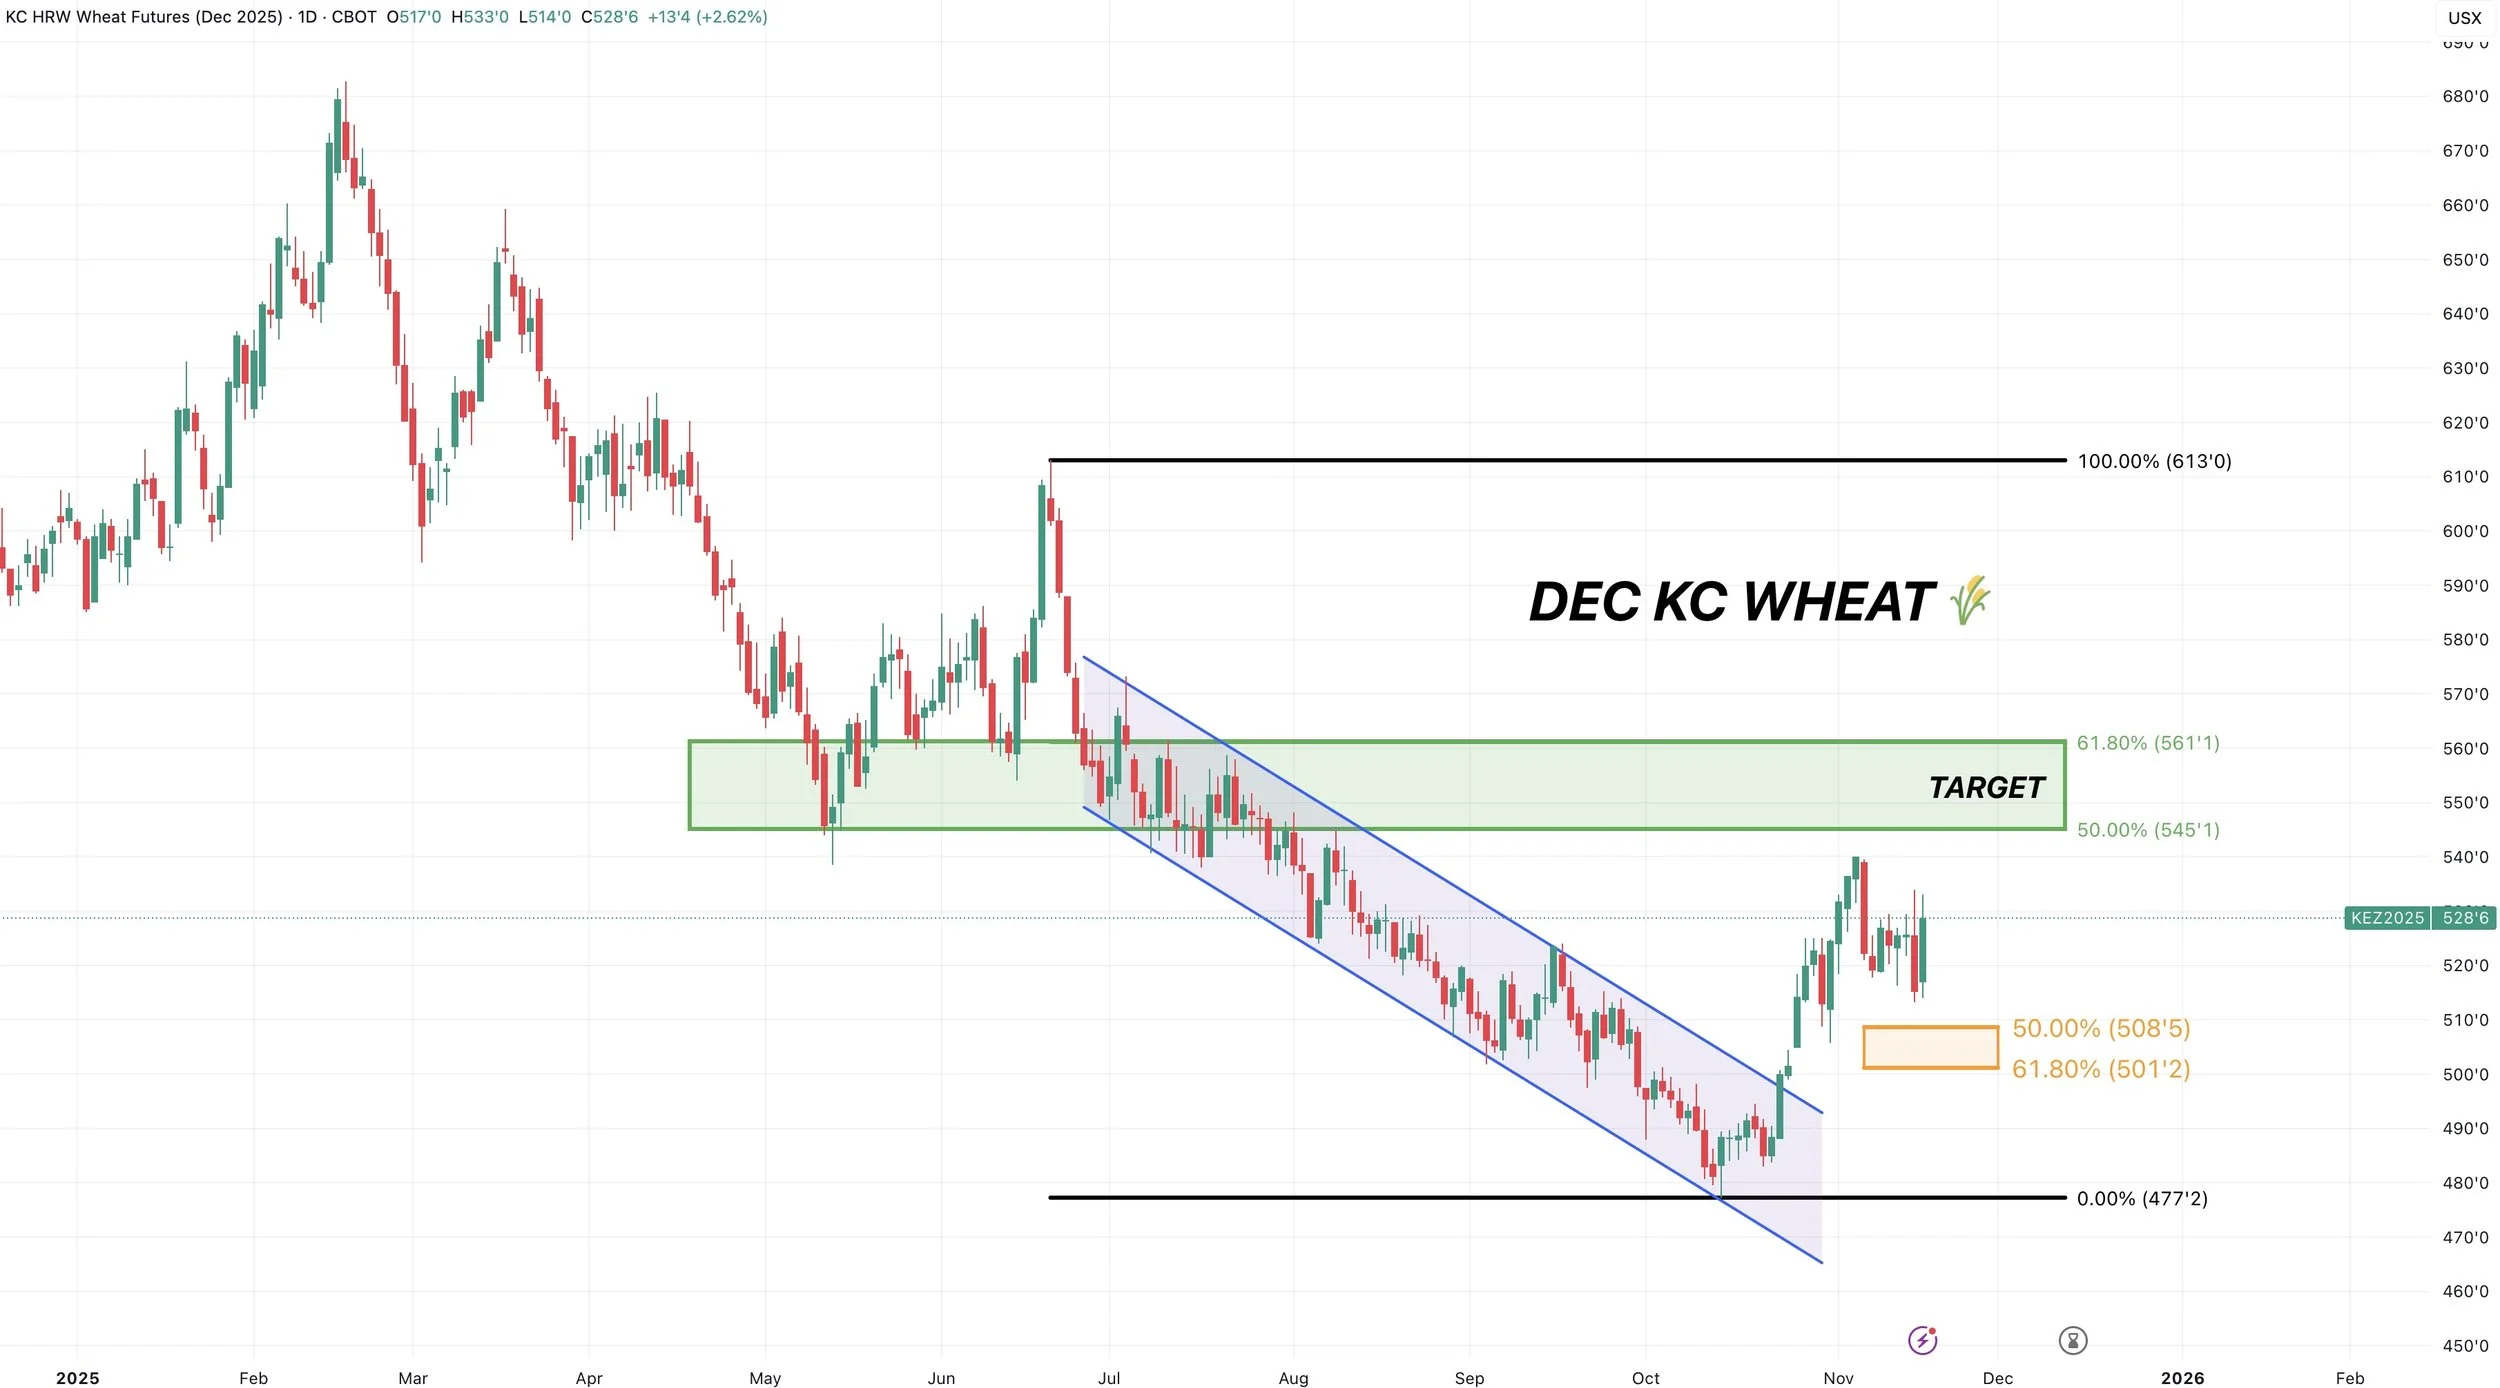
Cattle
The headlines in cattle are bearish.
We just had Rollins say that beef prices will come down by spring.
As cattle continues to make the headlines and grab attention.

Despite the cleary bearish headlines, the market has held up the last few days and seemed to shrug off the news.
We gapped open lower then got bought strongly today.
So perhaps we could find some support down here and be due for a corrective bounce.
We have a cattle on feed report on Friday.
The estimates have placements down -7.5% vs last year, and the smallest in 3 years.
With marketing also down -7.5% vs last year.
Then they have on feed down -1.8% from last year. At the smallest level in 3 years.
Dec Live Cattle
So far we are finding life at this 200-day MA.
This is a very crucial spot to hold if we want to prevent further downside. As a break below probably sparks more algo selling.
If we do get a corrective bounce, we want to be rewarding the bounce.
If we can reclaim 50-61.8% of the green box that would be a very good place to reward the rally if it comes.
The 50-day MA currently sits in that box as well.

Jan Feeders
We are also hovering and finding support right above the 200-day MA.
I apologize that it's hard to see the 200-day MA. As it just received enough data to become available a few days ago on Jan feeders.
But essentially that is the big spot to hold like in live cattle.
To the upside, if we somehow get a bounce up towards the green box we want to be rewarding the rally if it comes.
As the government is telling you they are actively trying to lower prices.

Past Sell or Protection Signals
Nov 13th: 🌽 🌱
Managing risk in corn & beans ahead of USDA report.
Oct 28th: 🌽
Corn sell signal & hedge alert.
Oct 27th: 🌱
Soybean sell signal & hedge alert.
Oct 13th: 🐮
Cattle sell signal & hedge alert.
Aug 22nd: 🌱
Soybean sell signal & hedge alert.
July 31st: 🐮
Cattle sell signal & hedge alert.
July 10th: 🐮
Cattle sell signal & hedge alert.
CLICK HERE TO VIEW
June 5th: 🐮
Cattle sell signal & hedge alert.
June 2nd: 🌾
MPLS wheat sell signal.
April 10th: 🌽
Old crop corn sell signal.
March 19th: 🐮
Cattle hedge & sell signal.
Feb 18th: 🌽 🌾
Old crop KC wheat & old crop corn signal.
Jan 23rd: 🌽 🌱
Corn & beans old crop sell signal.
CLICK HERE TO VIEW
Jan 15th: 🌽 🌱
Corn & beans hedge alert/sell signal.
Jan 2nd: 🐮
Cattle hedge alert at new all-time highs & target.
Dec 11th: 🌽
Corn sell signal at $4.51 200-day MA
CLICK HERE TO VIEW
Oct 2nd: 🌾
Wheat sell signal at $6.12 target
Sep 30th: 🌽
Corn protection signal at $4.23-26
Sep 27th: 🌱
Soybean sell & protection signal at $10.65
Sep 13th: 🌾
Wheat sell signal at $5.98
May 22nd: 🌾
Wheat sell signal when wheat traded +$7.00
Want to Talk?
Our phones are open 24/7 for you guys if you ever need anything or want to discuss your operation.
Hedge Account
Interested in a hedge account? Use the link below to set up an account or shoot Jeremey a call at (605)295-3100.
USDA TOMORROW
AUDIO COMMENTARY
Corn breaking out (chart below)*
Very solid price action in corn & beans
Corn highest since July 4th
Beans post 16-month highs
Risk for USDA bull trap
A lot riding on tomorrows report
Will take until Jan until export sales up to date
Not sure if report will be done properly
Massive trade ranges for this report
All announcements coming at same time as USDA
Bears argue beans fundamentally overvalued
Details on our pre-USDA alert
How to manage your risk here
Using calls to establish minimum prices
When to use a call vs a put?
Soybean nearing next target (chart below)*
USDA estimates below audio*
Listen to today’s audio below
Your free trial has ended
Make sure you subscribe so you don’t miss future signals or updates
CHARTS & USDA ESTIMATES
Dec Corn 🌽
We have offically broken above this key resistance we’ve been talking about for months.
As long as the USDA doesn’t spoil the party.. the chart looks poised for more upside.
The level we just broke above was key support from spring. Which was now viewed as resistance. As we rejected there for 2 weeks in a row.
This was also 50% of the Feb highs.
Not only that.. but we closed above the 200-day MA for the first time since June (really for the first time since May).
I will share my next target tomorrow if the USDA doesn’t ruin the break out.

We also have that inverse head and shoulders I’ve been showing since September.
The implied move for this does bring you to $4.70

Jan Beans 🌱
We are approaching our next target of $11.55
That gives back 61.8% of the contract highs
There is also a gap at $11.55 on the active daily continuation chart (scroll for this chart).
Our 2nd target is going to be right about at $12.00
That is the 78.6% level to contract highs and a big psychological level.
I personally think there is a solid chance we will see $12.00 (scroll for my reasoning as to why).
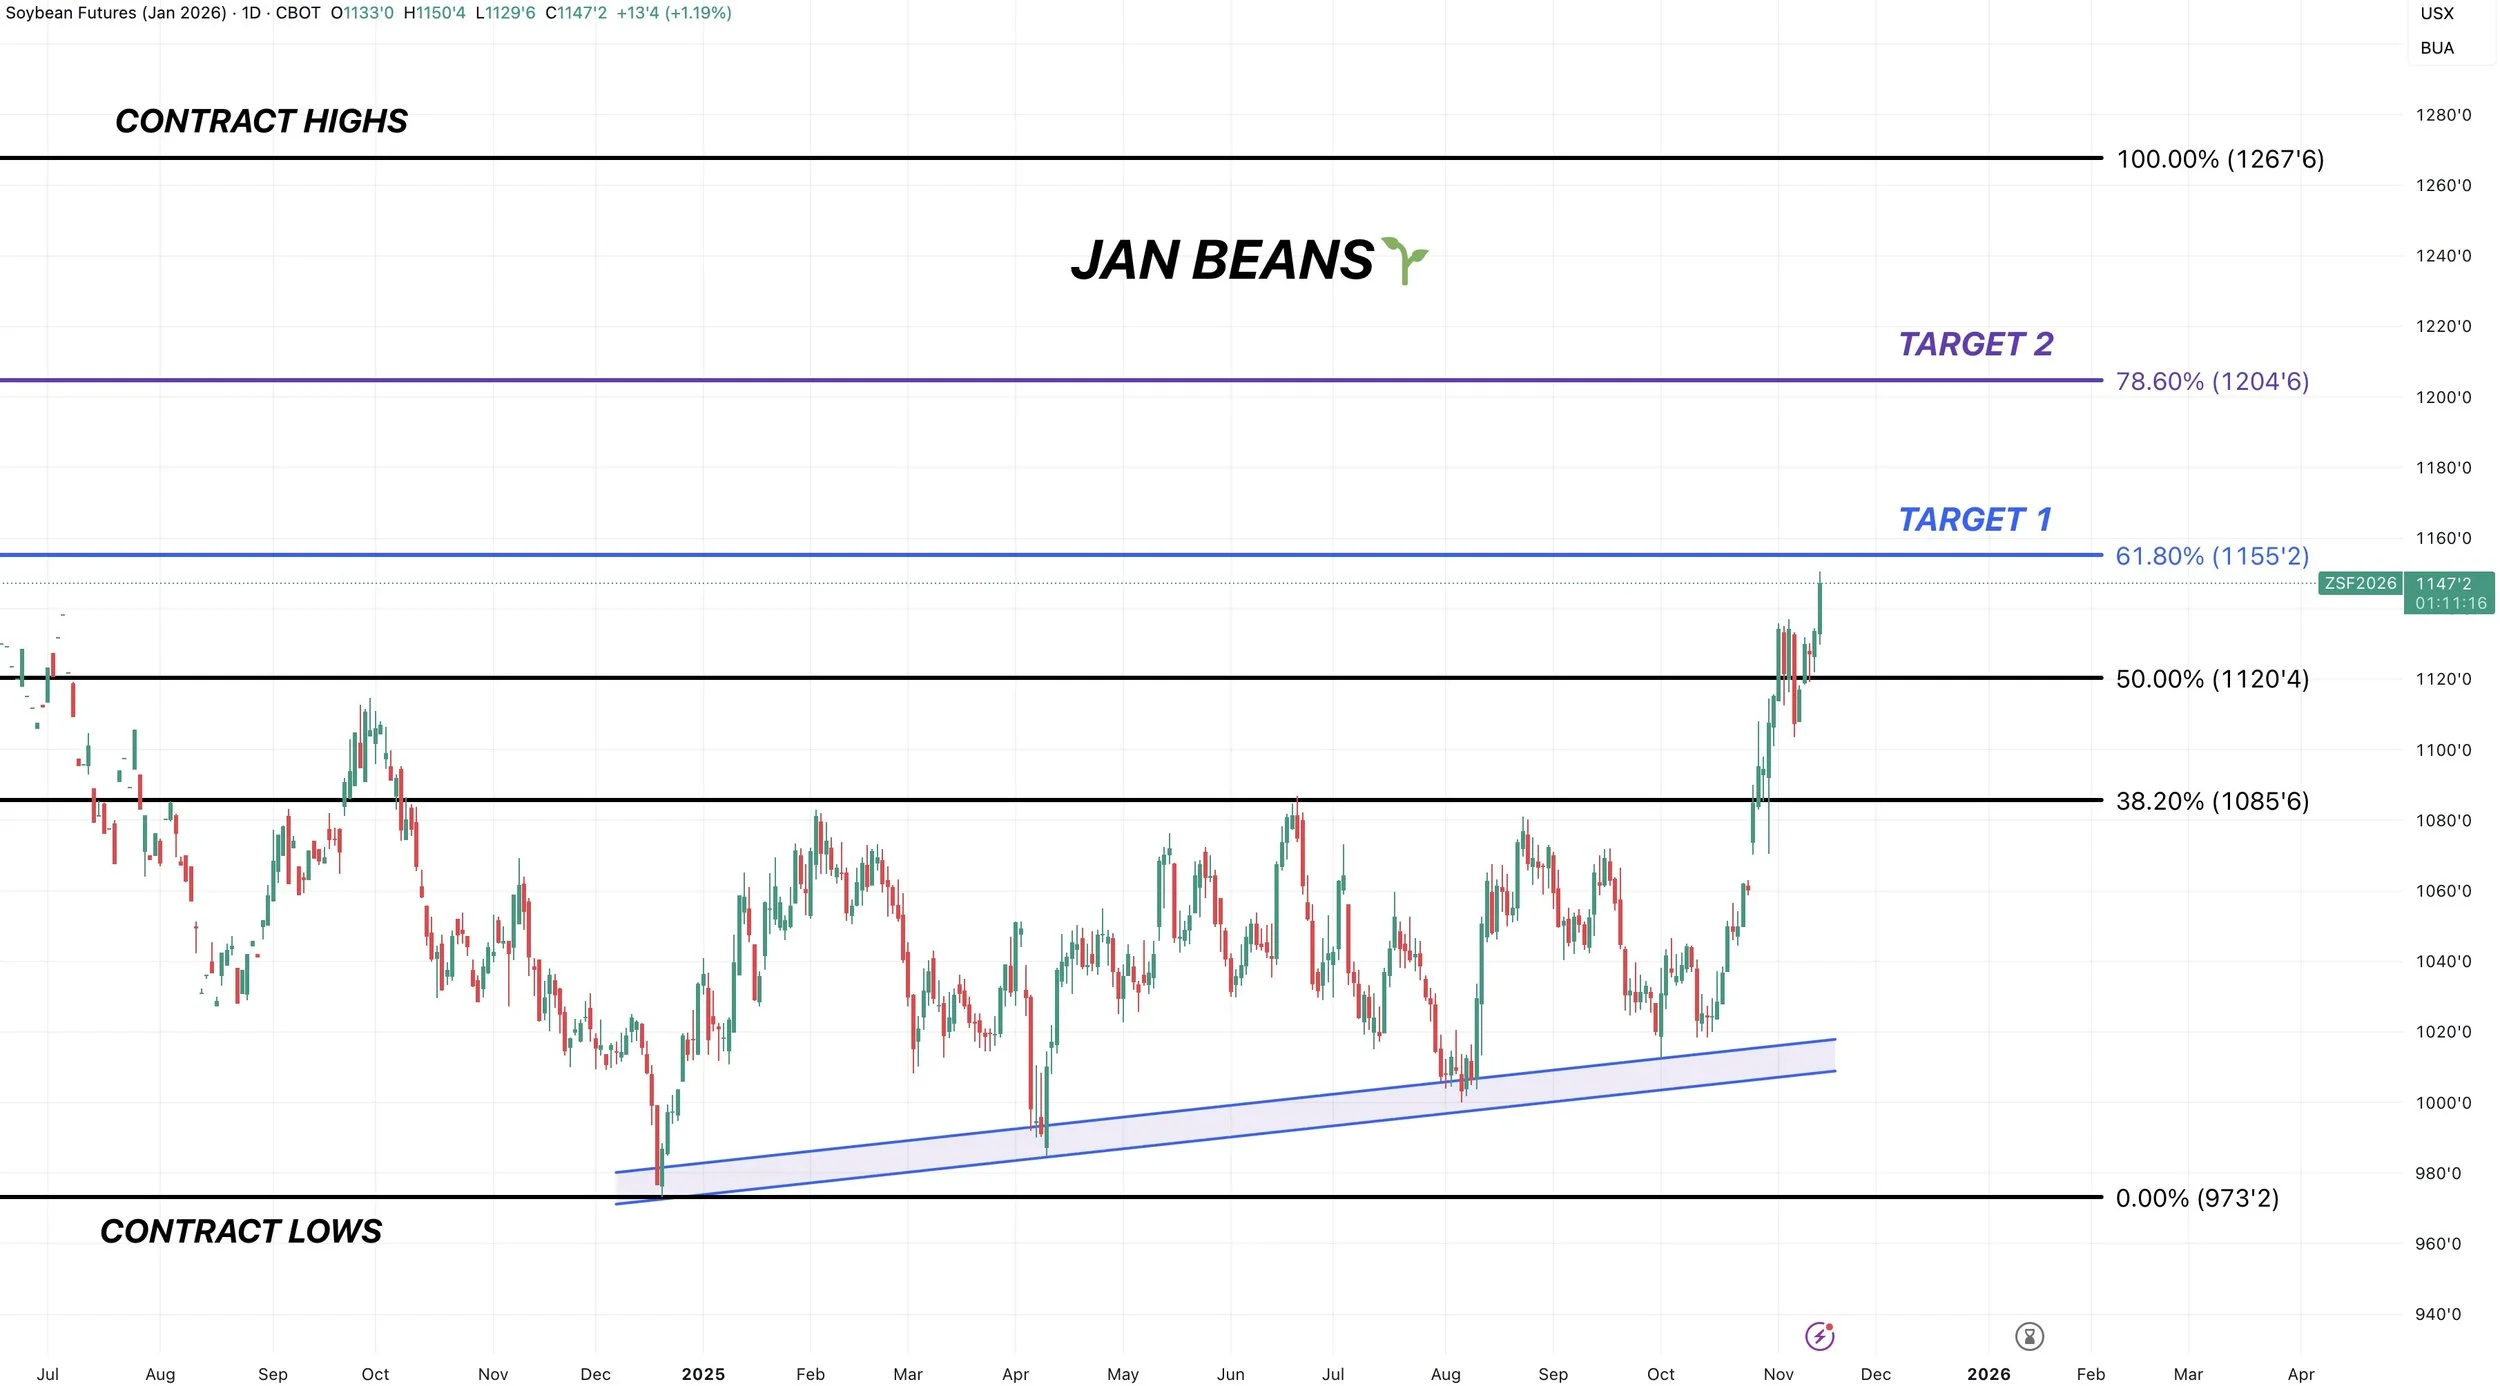
Here is the active daily continuation chart.
When we rolled off the July contract, we left a gap at $11.55
That level perfectly lines up with 61.8% of the contract highs.
So it is our next target which we are quickly approaching.
Here is the weekly chart.
This is why I think soybeans have a great shot at $12.00
When we broke out of that yearly range.. it opened the door to an incredible amount of upside.
Where we rejected all year long was the same spot we rejected in 2015, 2017, and 2018.
The two times we broke above that resistance.. we ran a lot higher.
2016 we ran right to $12.00 before failing there.
2020 we went much higher.
There just simply isn’t any real resistance between $10.80 and $12.00 like we’ve been talking about all year long.
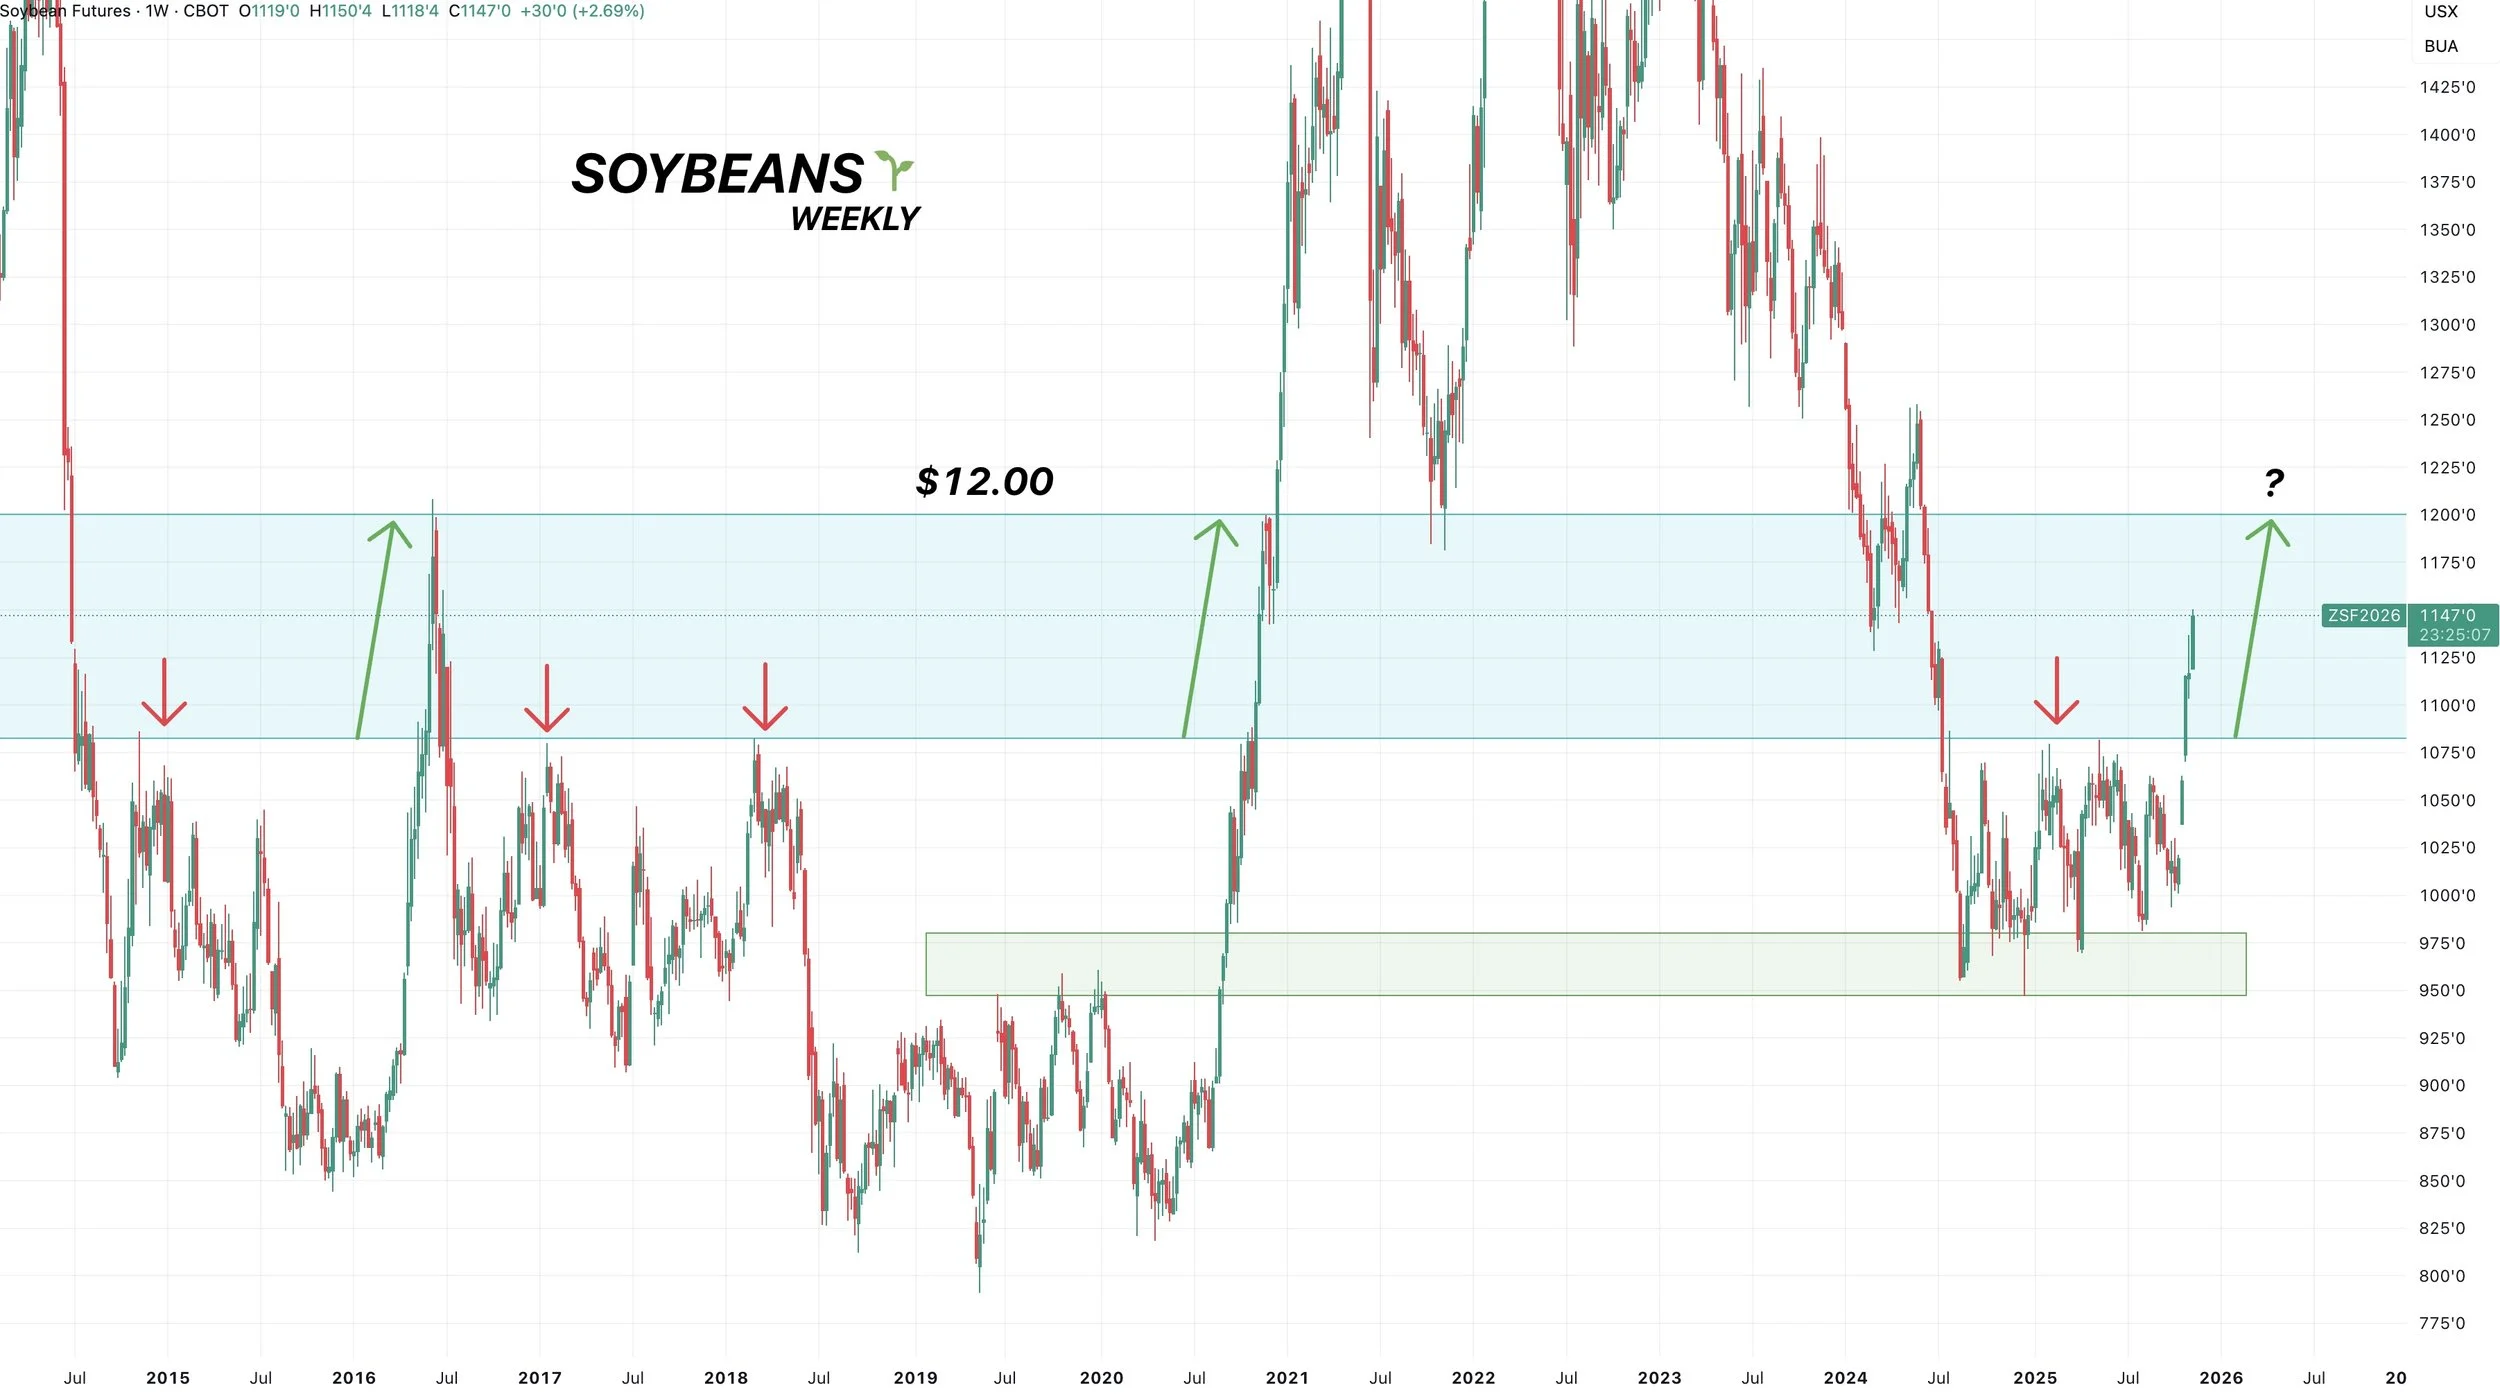
USDA ESTIMATES
We have a massive trade range.
Over 4 bpa in corn yield.
A 500 million range in corn carryout.
A 300 million range in soybean carryout.
A 187 bean carryout would be the tightest in a decade. A 494 bean carryout would be one of the largest of all-time only behind the trade war.

Past Sell or Protection Signals
Nov 13th: 🌽 🌱
Managing risk in corn & beans ahead of USDA report.
Oct 28th: 🌽
Corn sell signal & hedge alert.
Oct 27th: 🌱
Soybean sell signal & hedge alert.
Oct 13th: 🐮
Cattle sell signal & hedge alert.
Aug 22nd: 🌱
Soybean sell signal & hedge alert.
July 31st: 🐮
Cattle sell signal & hedge alert.
July 10th: 🐮
Cattle sell signal & hedge alert.
CLICK HERE TO VIEW
June 5th: 🐮
Cattle sell signal & hedge alert.
June 2nd: 🌾
MPLS wheat sell signal.
April 10th: 🌽
Old crop corn sell signal.
March 19th: 🐮
Cattle hedge & sell signal.
Feb 18th: 🌽 🌾
Old crop KC wheat & old crop corn signal.
Jan 23rd: 🌽 🌱
Corn & beans old crop sell signal.
CLICK HERE TO VIEW
Jan 15th: 🌽 🌱
Corn & beans hedge alert/sell signal.
Jan 2nd: 🐮
Cattle hedge alert at new all-time highs & target.
Dec 11th: 🌽
Corn sell signal at $4.51 200-day MA
CLICK HERE TO VIEW
Oct 2nd: 🌾
Wheat sell signal at $6.12 target
Sep 30th: 🌽
Corn protection signal at $4.23-26
Sep 27th: 🌱
Soybean sell & protection signal at $10.65
Sep 13th: 🌾
Wheat sell signal at $5.98
May 22nd: 🌾
Wheat sell signal when wheat traded +$7.00
Want to Talk?
Our phones are open 24/7 for you guys if you ever need anything or want to discuss your operation.
Hedge Account
Interested in a hedge account? Use the link below to set up an account or shoot Jeremey a call at (605)295-3100.
CHINA BUYING WHEAT? GRAIN RALLY CONTINUES
AUDIO COMMENTARY
Very volatile day in grains
New highs in beans & wheat
Rumors China buying wheat
China hasn’t bought wheat in over a year
What if China buys corn & wheat?
USDA scheduled for 14th if gov open
Price action looks like China buying beans
Balance sheets change drastically if yield slips like some suggest it could
Sue Martin says much higher beans
How to use stops & puts in beans
Letting soybeans ride higher with a hedge account
Soybeans rarely stop at $11.00’s
There is still black swan risks
Some argue this bean demand just shifted more demand back to Brazil
Who should reward the wheat rally soon?
Corn re-ownership strategy
What to do if you’re forced to sell corn
Still see downside risk in cattle
Wheat breaking out (chart below)*
Soybean targets (chart below)*
Listen to today’s audio below
Want to talk? (605)295-3100
Miss our Halloween sale?
Here is extended access
Since your trial ended, you will not receive our next signal or future updates. Subscribe so you don’t miss out
CHARTS
Dec Corn 🌽
Still battling this resistance box and our first target of $4.35-40.
Until we break above, it is viewed as resistance.
On the other hand, if we break above, it does open the door higher.
As we have a pretty clear text book inverse head & shoulders pattern as well.
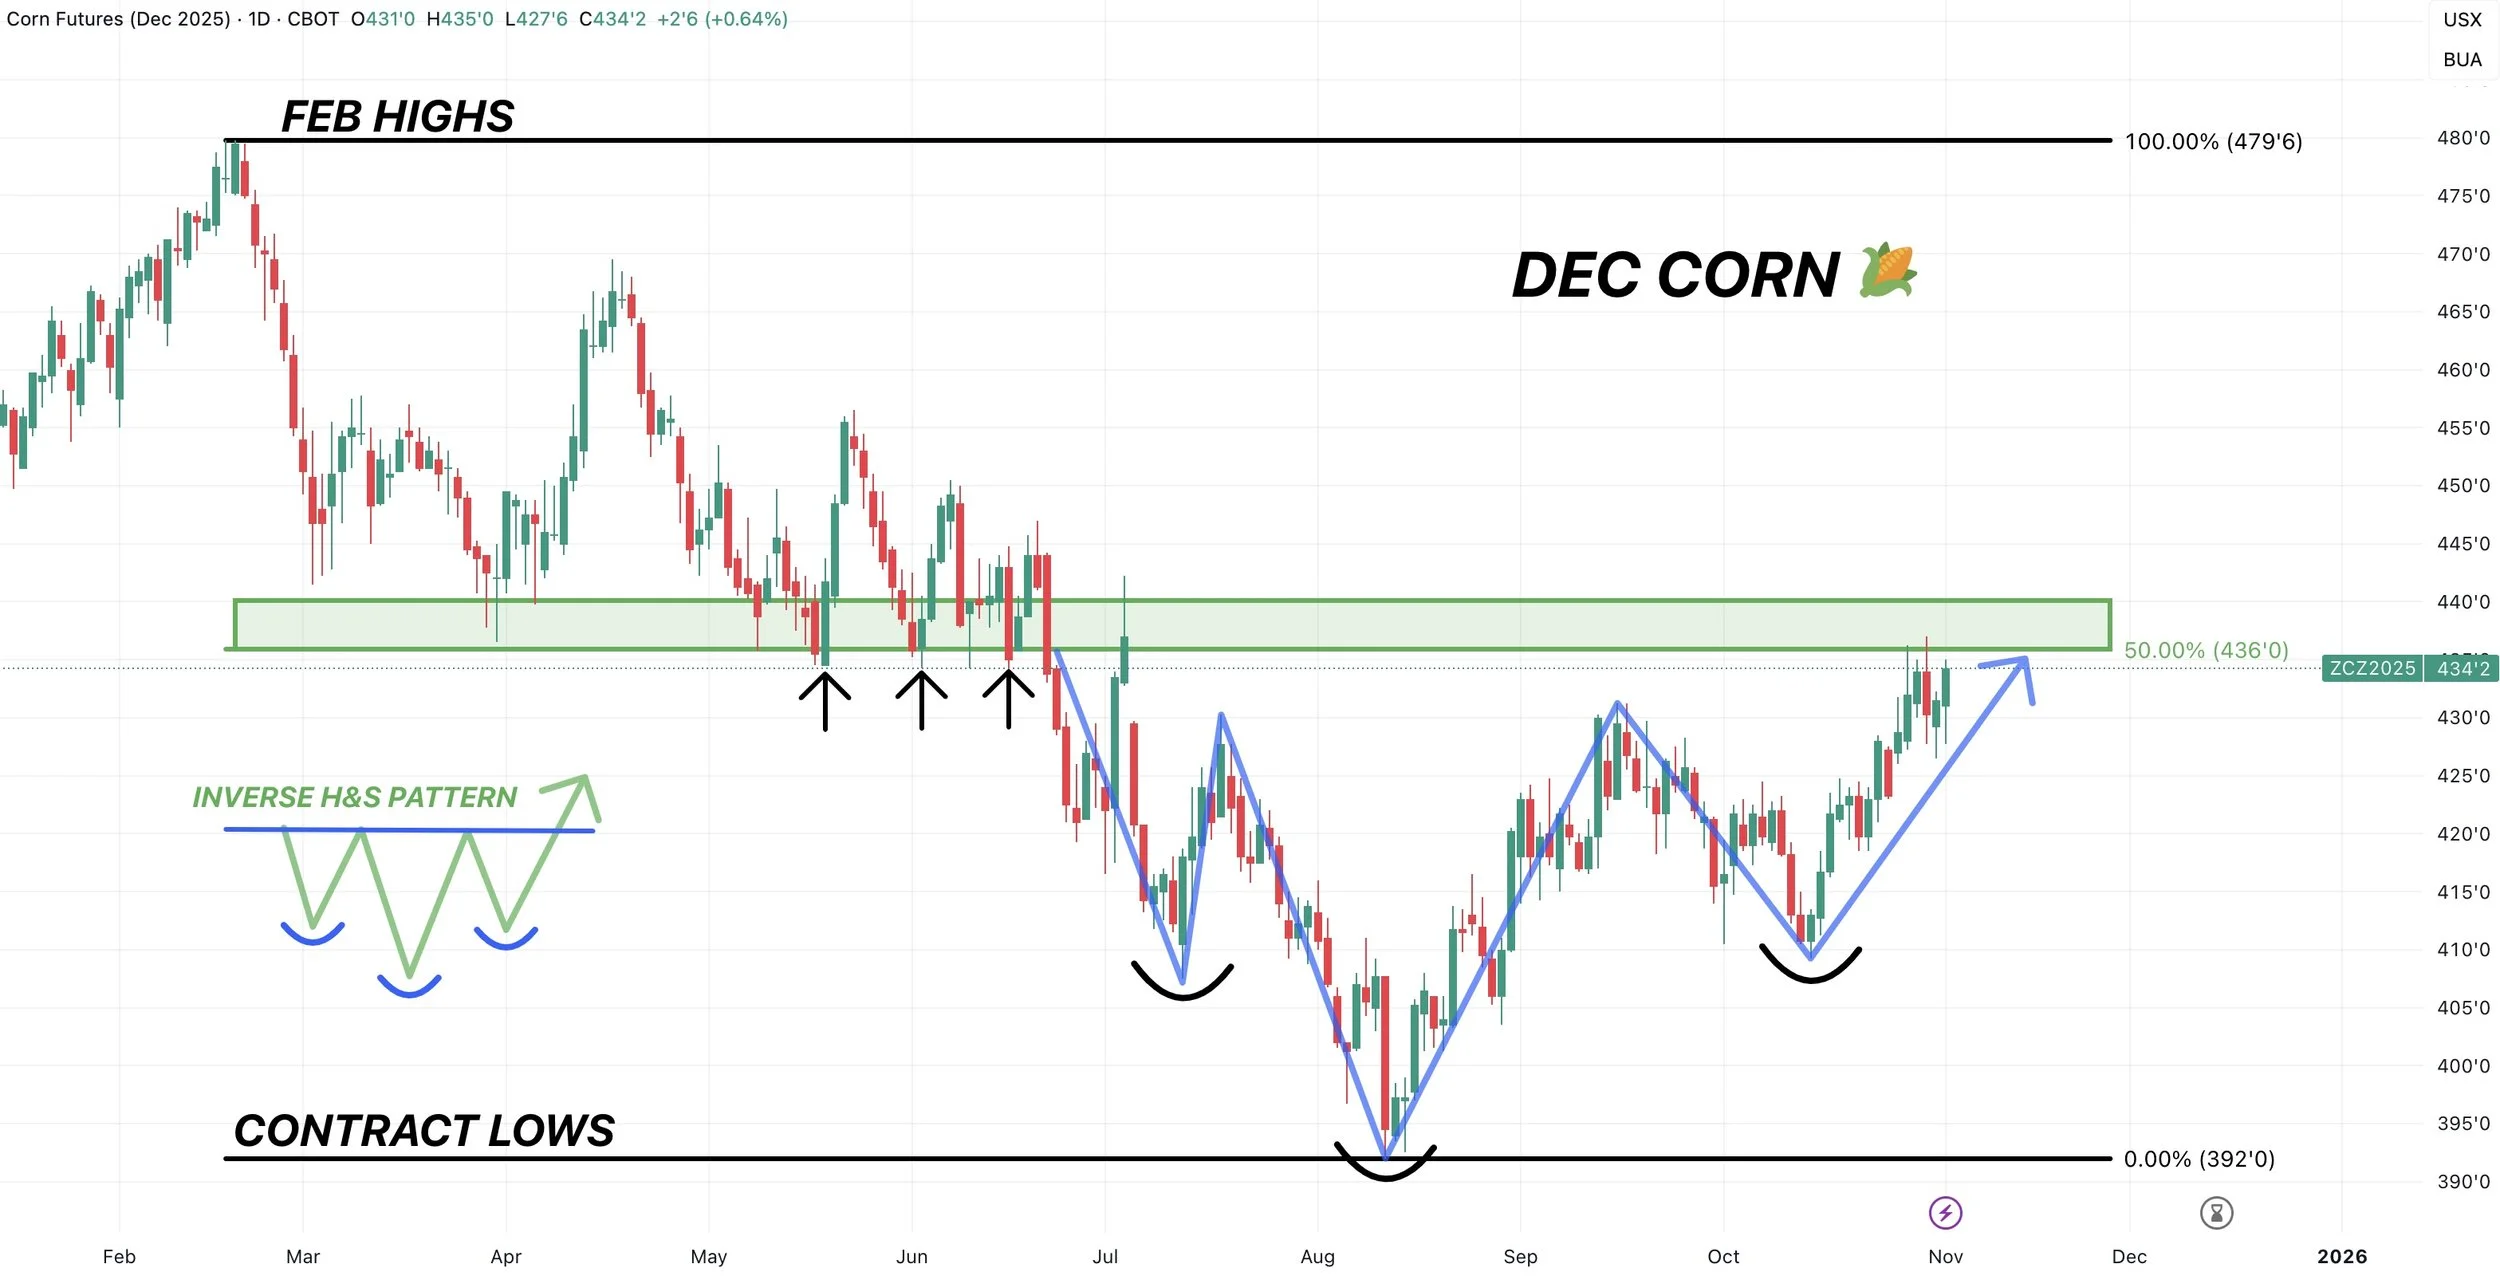
Jan Beans 🌱
Our first target is $11.55
That is the 61.8% retracement to the contract highs from the contract lows. We are above the 50% level, so the next level is the 61.8%.
Our summer highs topped out at the 38.2%.
Our second target is going to be right about at $12.00
That is the 78.6% retracement to the contract highs.
Not only that, but if you were to take the entire range we were trapped in all year, and then added that range to the point of breakout. It spits out $12.00 as well.
The monthly chart also suggests $12.00 as a possible target which we will talk about sometime this week in my video update.
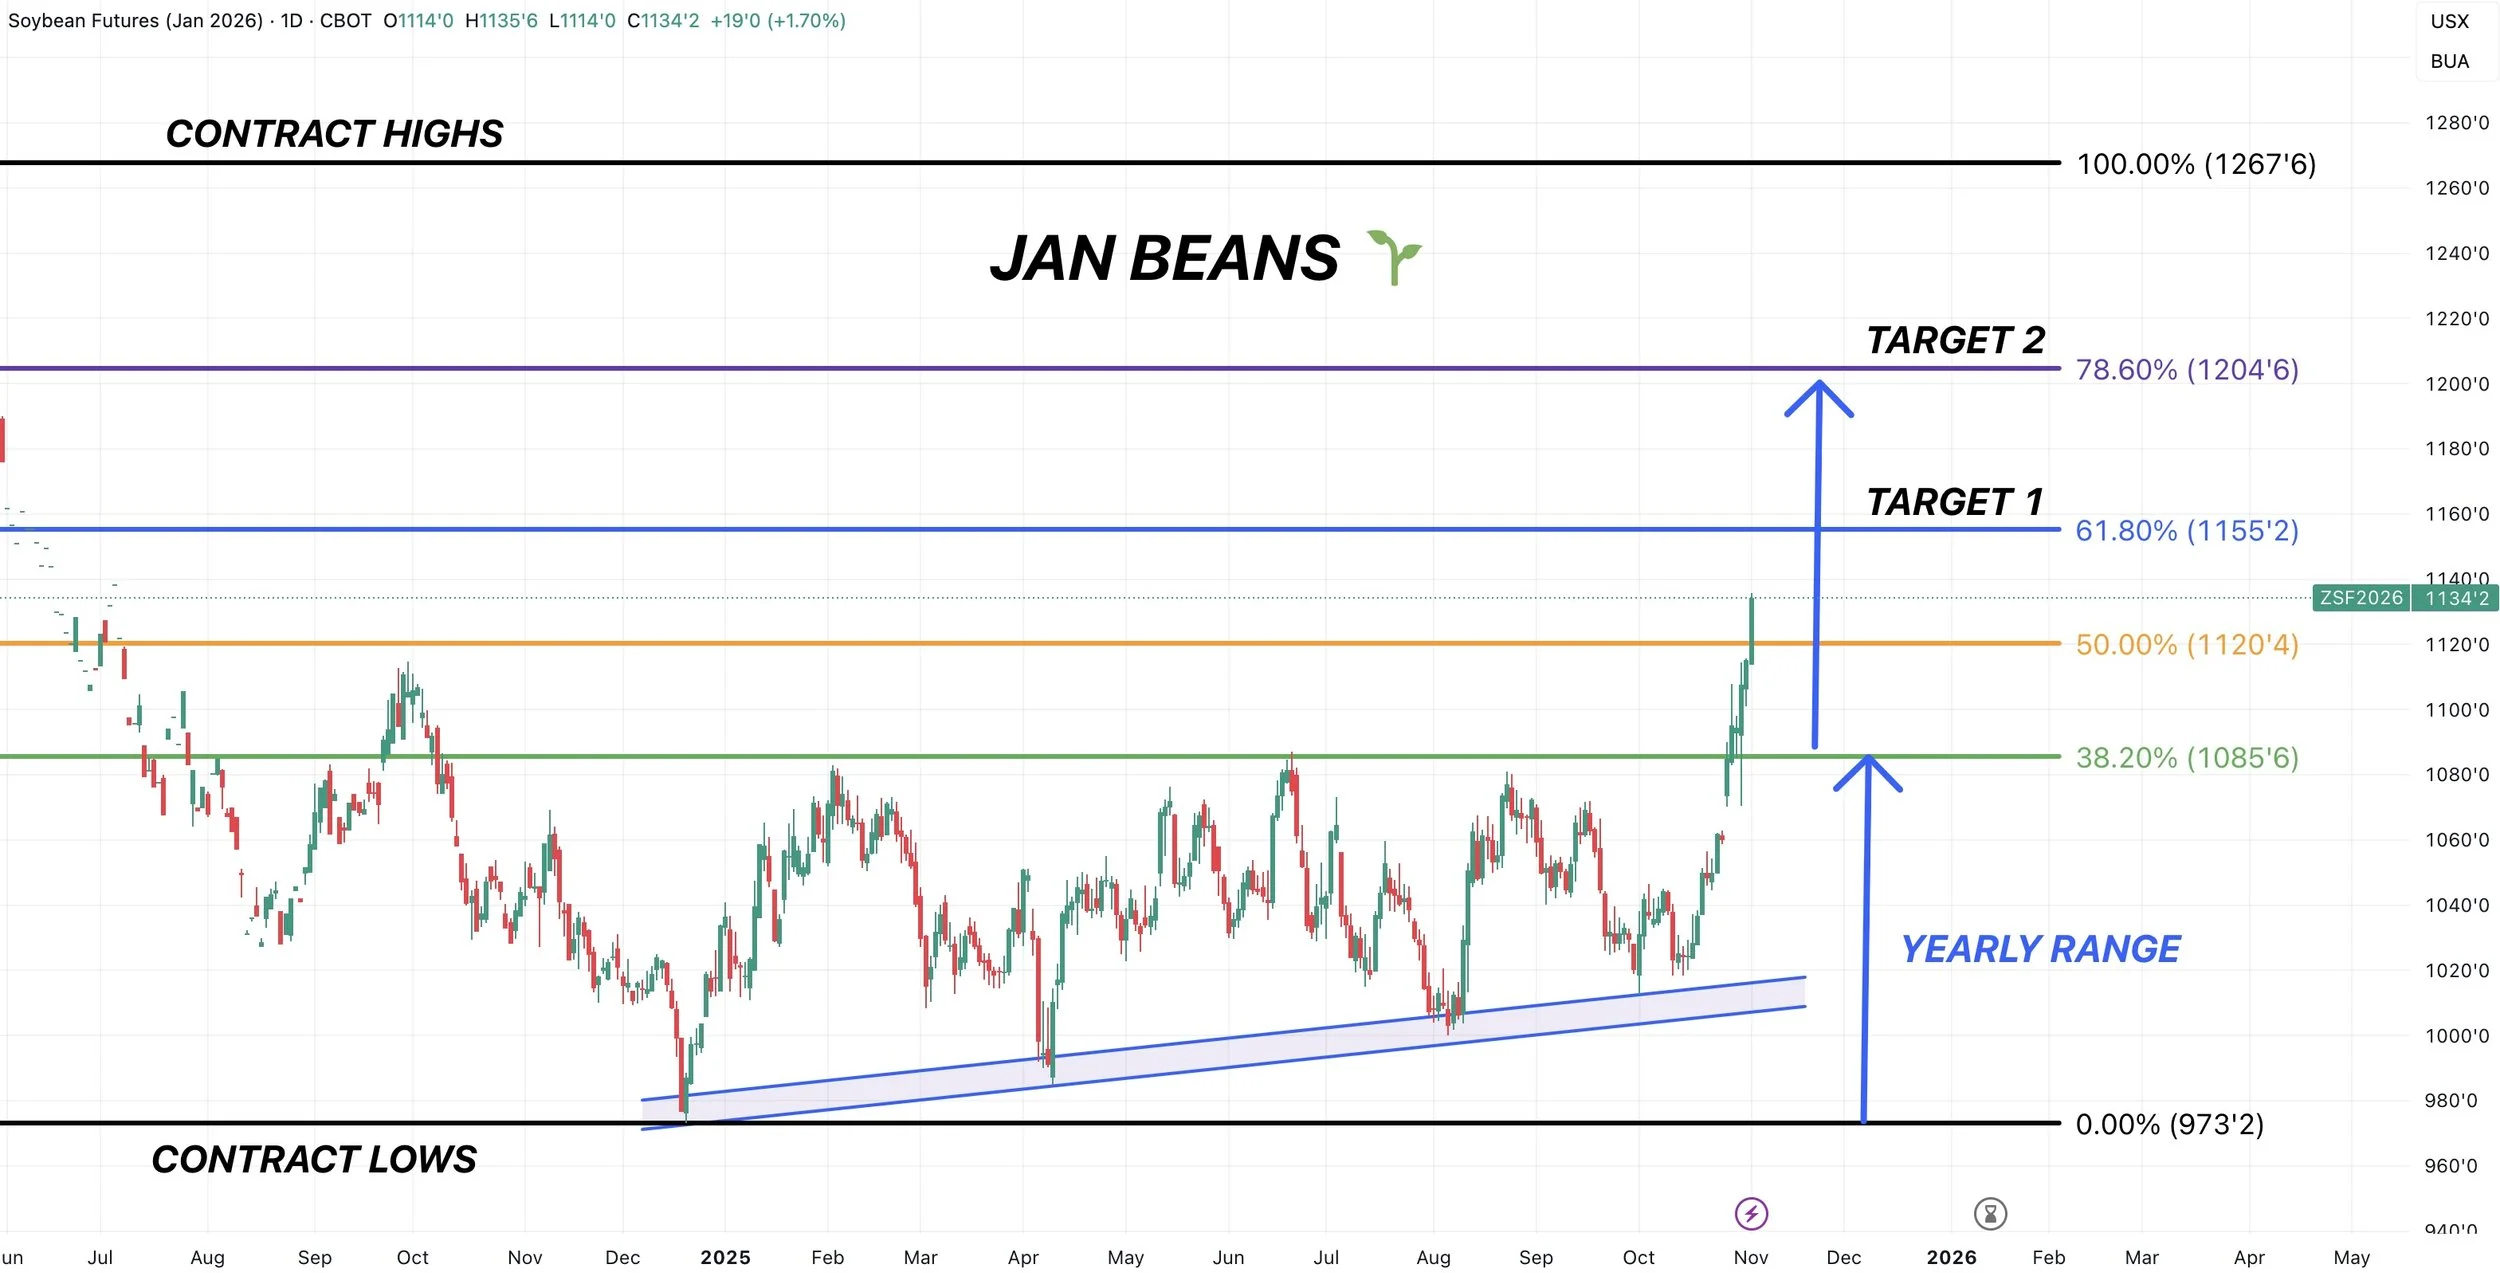
Here is a more simple visual of that range.
We were trapped in a $1.14 range for a year.
We broke out.
If you add $1.14 to the point of breakout, you get $12.00
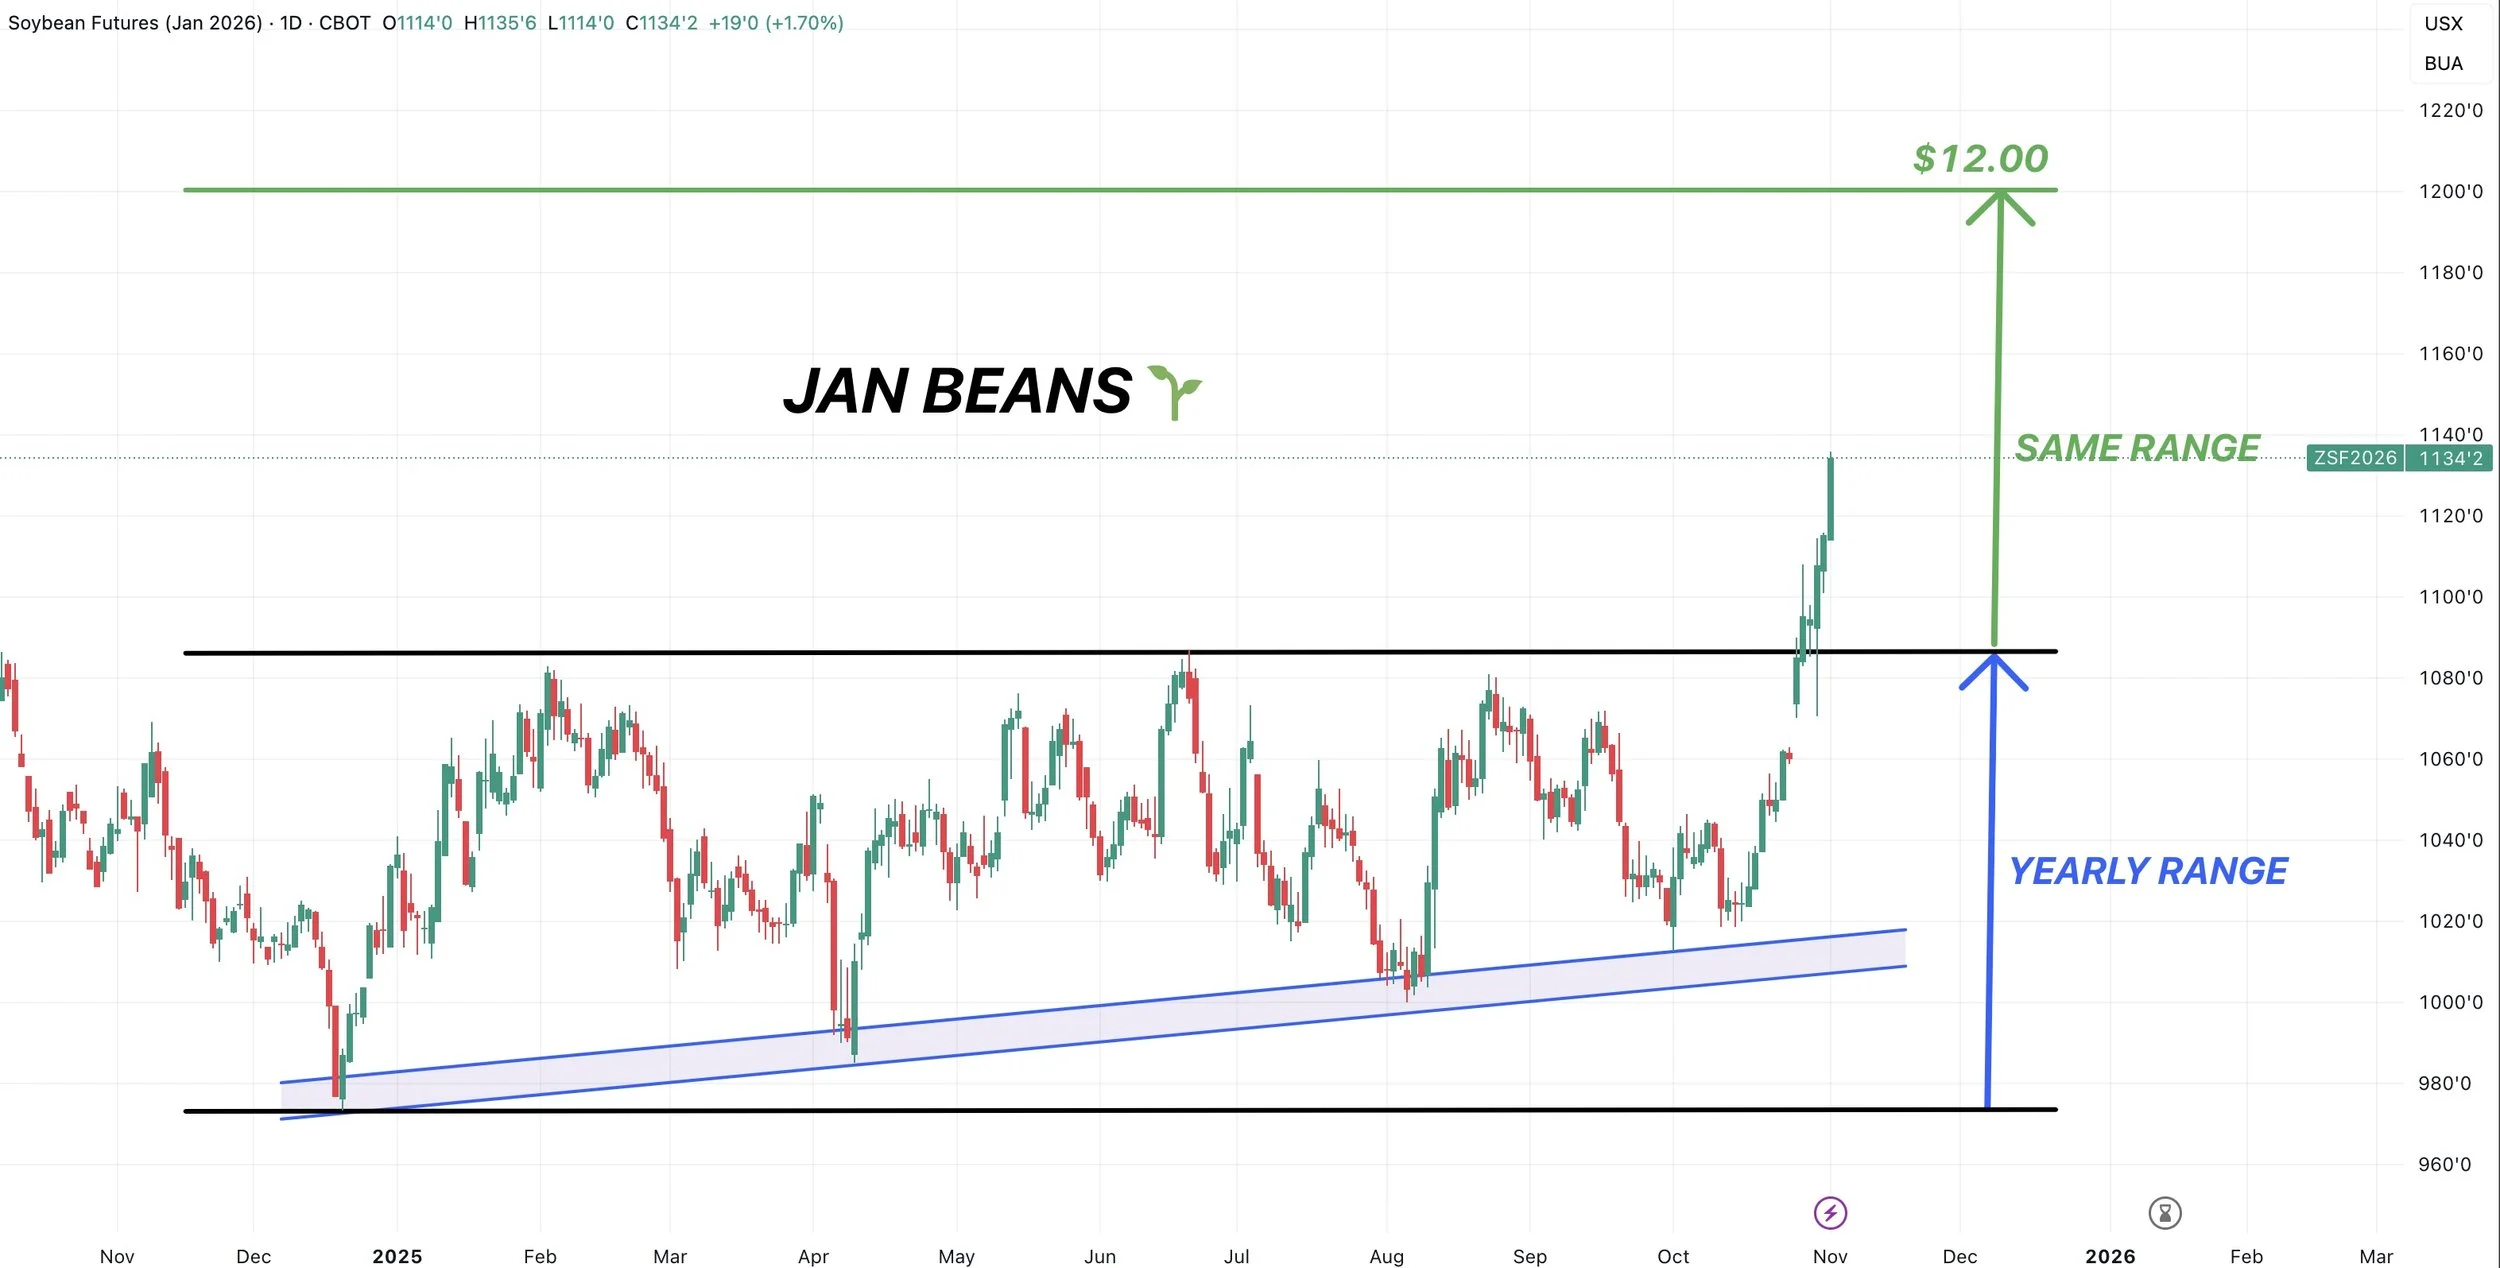
Dec Wheat 🌾
We got a clear breakout.
As we broke above those Sep highs.
Which should offer more potential upside towards that green box.
That green box is the golden zone. It claws back 50-61.8% of the June highs. The most common spot for prices to revert back to.
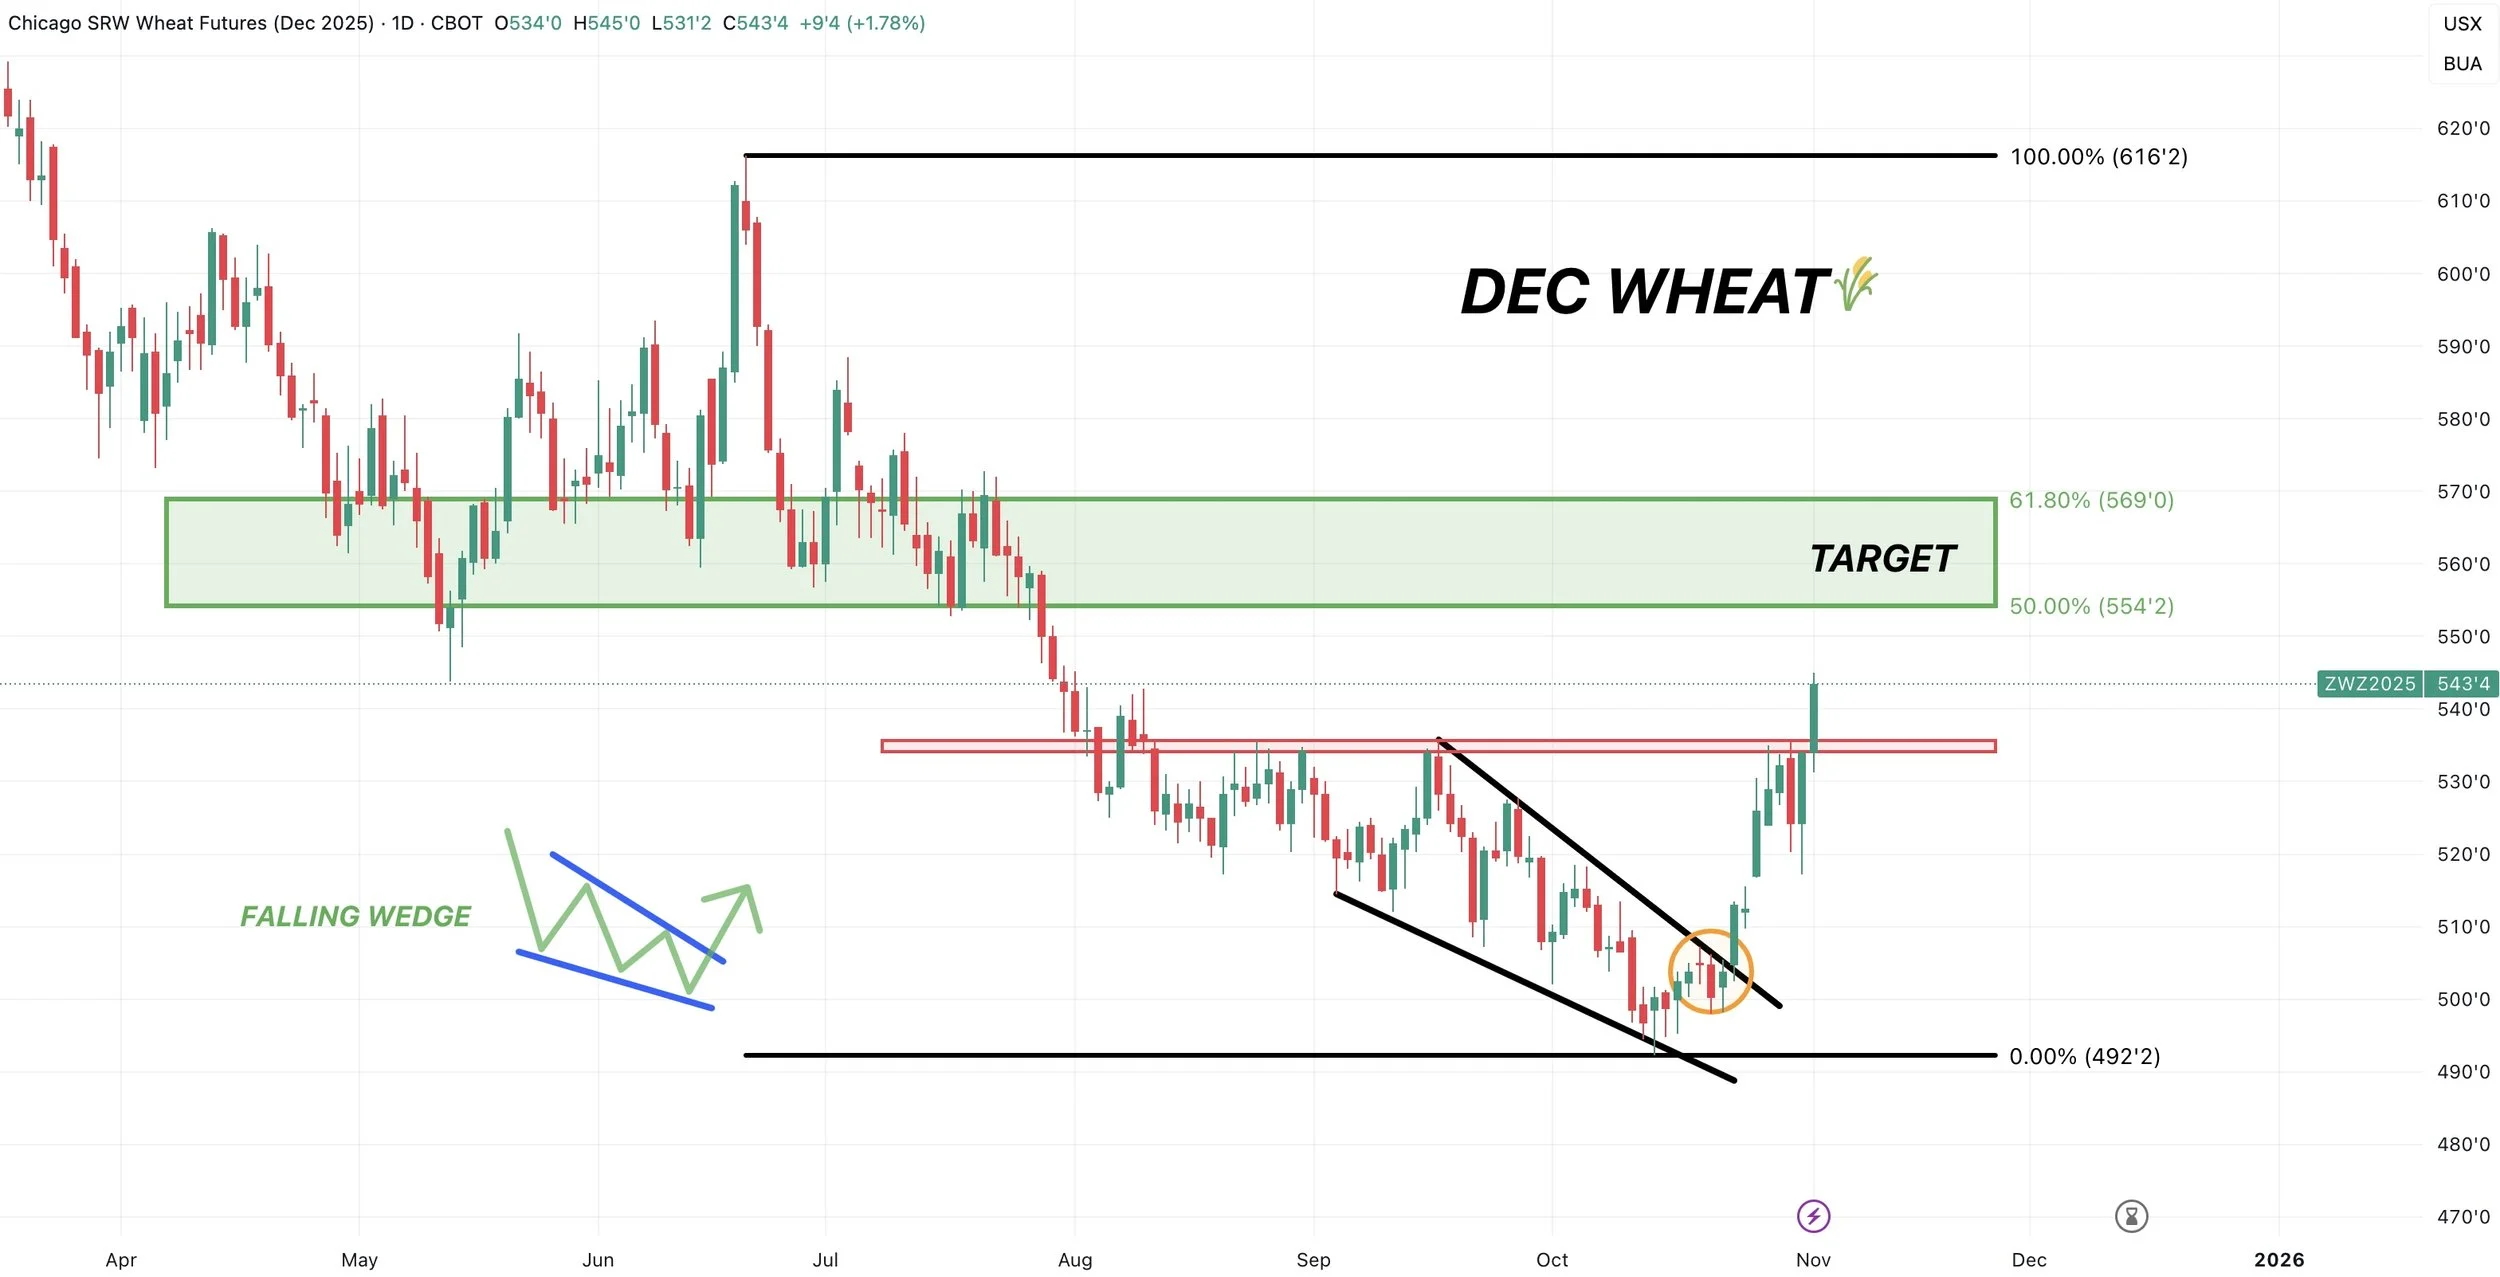
Past Sell or Protection Signals
Oct 28th: 🌽
Corn sell signal & hedge alert.
Oct 27th: 🌱
Soybean sell signal & hedge alert.
Oct 13th: 🐮
Cattle sell signal & hedge alert.
Aug 22nd: 🌱
Soybean sell signal & hedge alert.
July 31st: 🐮
Cattle sell signal & hedge alert.
July 10th: 🐮
Cattle sell signal & hedge alert.
CLICK HERE TO VIEW
June 5th: 🐮
Cattle sell signal & hedge alert.
June 2nd: 🌾
MPLS wheat sell signal.
April 10th: 🌽
Old crop corn sell signal.
March 19th: 🐮
Cattle hedge & sell signal.
Feb 18th: 🌽 🌾
Old crop KC wheat & old crop corn signal.
Jan 23rd: 🌽 🌱
Corn & beans old crop sell signal.
CLICK HERE TO VIEW
Jan 15th: 🌽 🌱
Corn & beans hedge alert/sell signal.
Jan 2nd: 🐮
Cattle hedge alert at new all-time highs & target.
Dec 11th: 🌽
Corn sell signal at $4.51 200-day MA
CLICK HERE TO VIEW
Oct 2nd: 🌾
Wheat sell signal at $6.12 target
Sep 30th: 🌽
Corn protection signal at $4.23-26
Sep 27th: 🌱
Soybean sell & protection signal at $10.65
Sep 13th: 🌾
Wheat sell signal at $5.98
May 22nd: 🌾
Wheat sell signal when wheat traded +$7.00
Want to Talk?
Our phones are open 24/7 for you guys if you ever need anything or want to discuss your operation.
Hedge Account
Interested in a hedge account? Use the link below to set up an account or shoot Jeremey a call at (605)295-3100.
WILD DAY. CHINA AGREES TO BUY SOYBEANS
MARKET UPDATE
You can scroll to read the usual update as well. As the written version is the exact same as the video.
Timestamps for video:
Overview: 0:00min
Corn: 2:25min
Beans: 5:25min
Wheat: 10:55min
Cattle: 12:30min
Want to talk about your situation?
(605)295-3100
Your free trial has ended
Our Halloween sale ends in 2 days
Subscribe so you don’t miss future updates or signals
Futures Prices Close
Overview
Soybeans higher with corn & wheat trade lower, meanwhile cattle was about unchanged.
Originally, grains were down drastically lower this morning.
Soybeans were down -23 cents at one point.
Corn was down -6 cents at one point.
Last night and into this morning it appeared that the Trump and China meeting was simply a "buy the rumor, sell the fact" event.
As after the meeting we did not get any specific commit numbers out of China.
All Trump said was:
"Purchases of soybeans will start immediately"
"On a scale of 1-10 the meeting with Xi was a 12"

It was also announced that they came to a one-year agreement and that Trump would be dropping tariffs from 57% down to 47%.
He also said he would be visiting China in April.
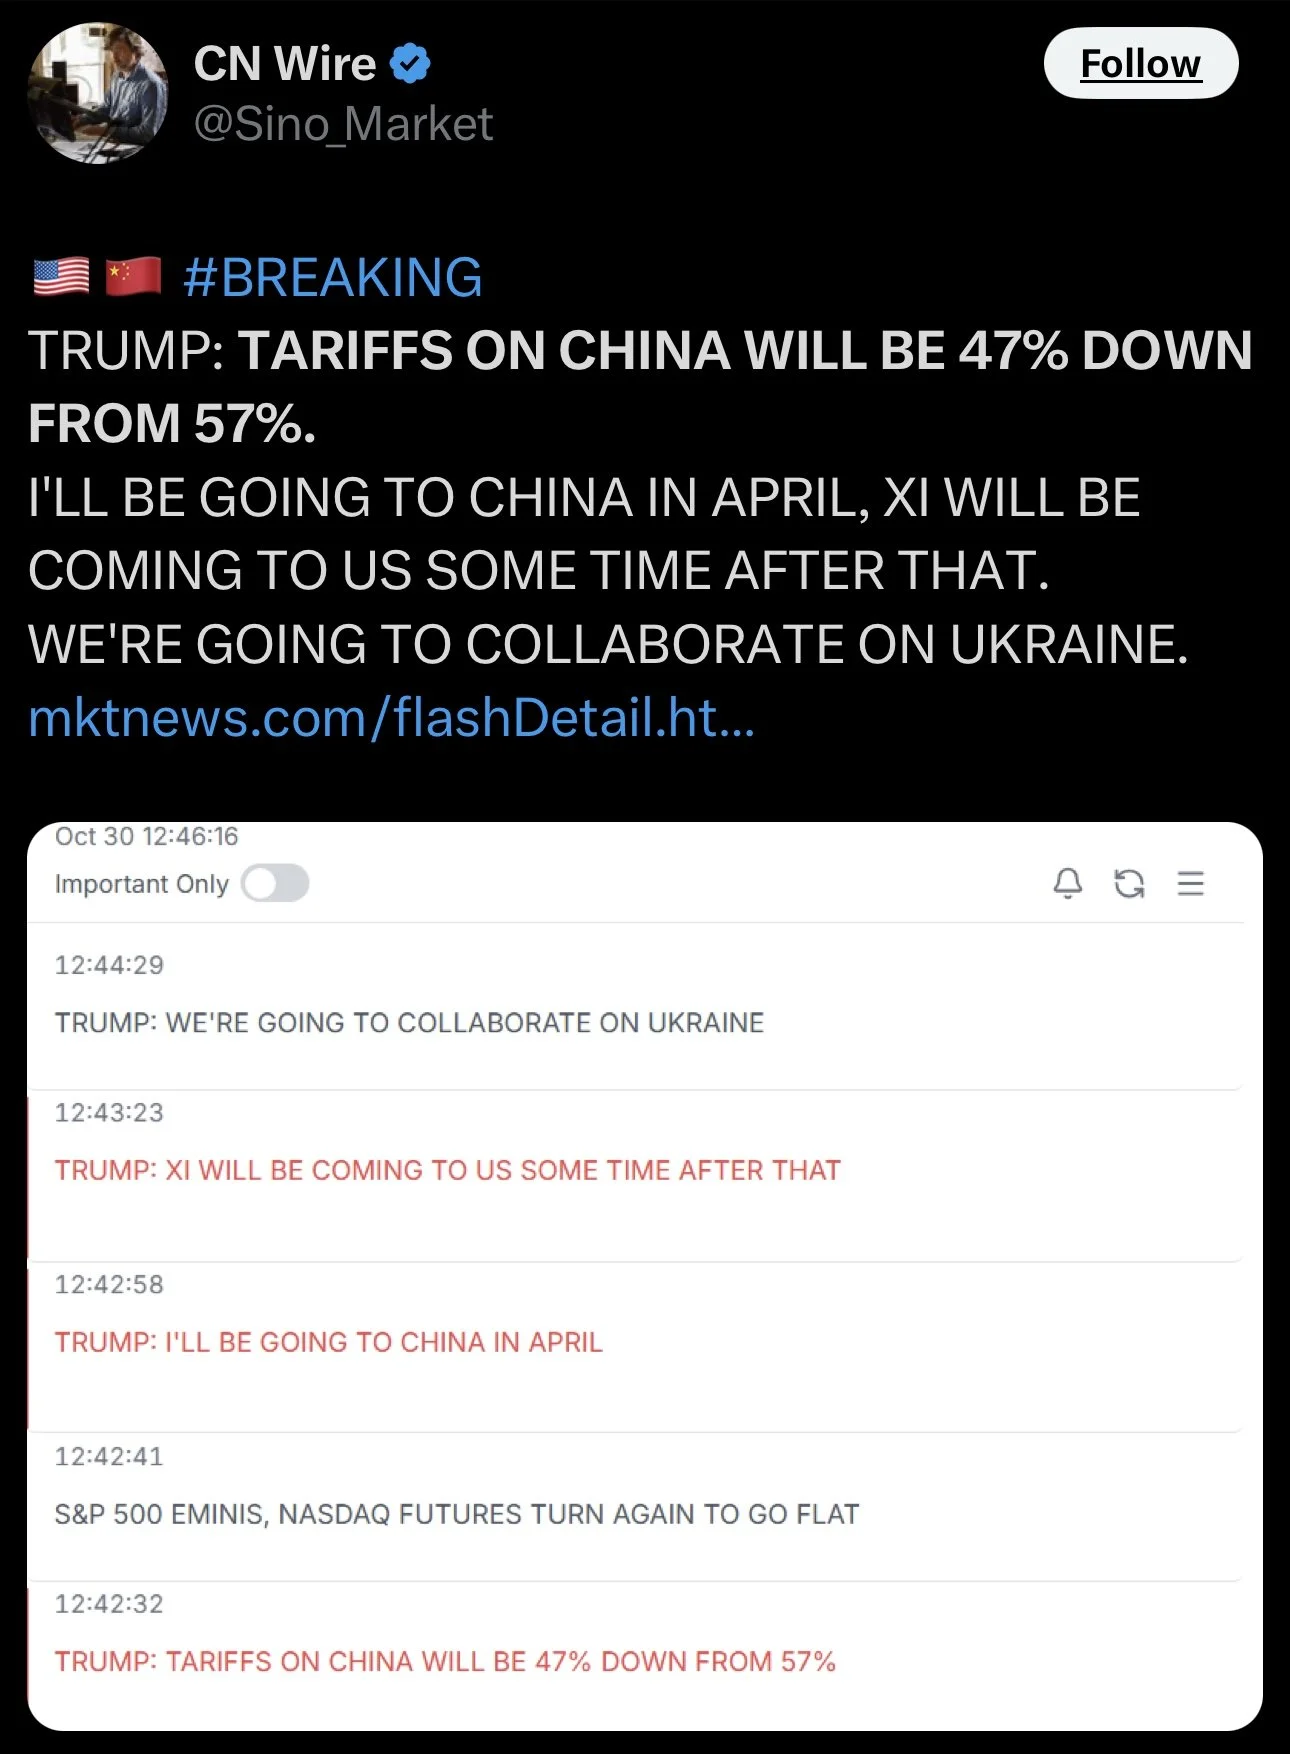
Now since there wasn’t any specifics announced, soybeans tanked hard last night.
However.. this morning things got pretty interesting.
As we got volume specific news.
Bessent and Rollins announced that China agreed to buy 12 MMT (440 milllion bu) of soybeans this year.
While also buying 25 MMT (920 million bu) of soybeans for the next 3 years.
They also stated we had had come to an agreement with 6 other countries to increase soybean demand by 19 MMT (700 million bu). However, we did not get on details on this. So we have no clue what time period this is over or how it's different from what they already buy.
They also said they would buy US sorghum but no specific details were announced.
While removing tariffs on grains and ag products.
This news resulted in soybeans rallying a massive +40 cents off their lows in just 2 hours.
Here is a 15 minute chart to give you a good visual.
We started off the night slightly higher going into the meeting.
Right after the meeting ended, we dropped -35 cents because details weren’t announced.
Then when this announcement came out that we had specific purchase numbers from China, we ran +40 cents.
So it was a sell fact.. until it wasn’t.
Absolutely wild price action today. Soybeans traded in a +/-44 cent range. The largest trading range in the life of the Jan contract.
We will dive into these China numbers more in the soybean section.

Today's Main Takeaways
Corn
Fundamentals:
Not much to update on corn today.
We are fighting that $4.35 resistance we've been talking about following our sell signal on Tuesday. Which was the first one we've issued since the April rally.
I am going to keep today's corn section on the light side as there isn’t much new.
Here is why you can’t get "super" bullish on corn (not yet anyways).
We do have a massive crop regardless of where yield comes in at.
Even if it drops to 175 bpa, we are still looking at a record.
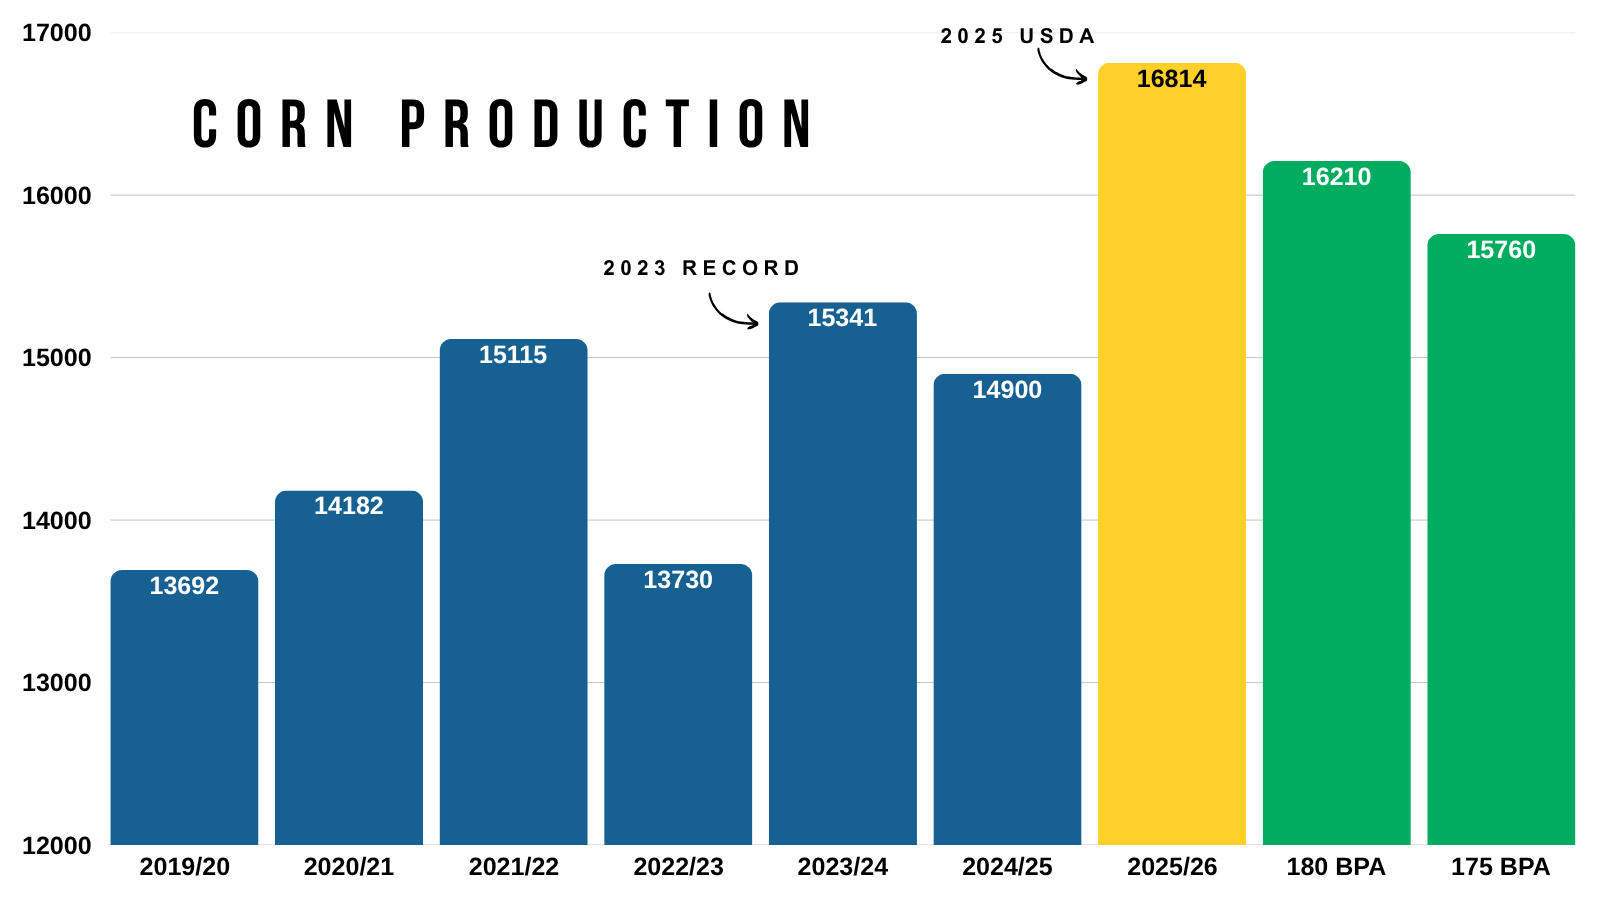
This is almost entirely due to the utterly massive acres.
As acres this year were record high.

On the flip side, demand is the greatest it has ever been.
Export inspections up to this point in the marketing year are double what they normally are.
The best on record.
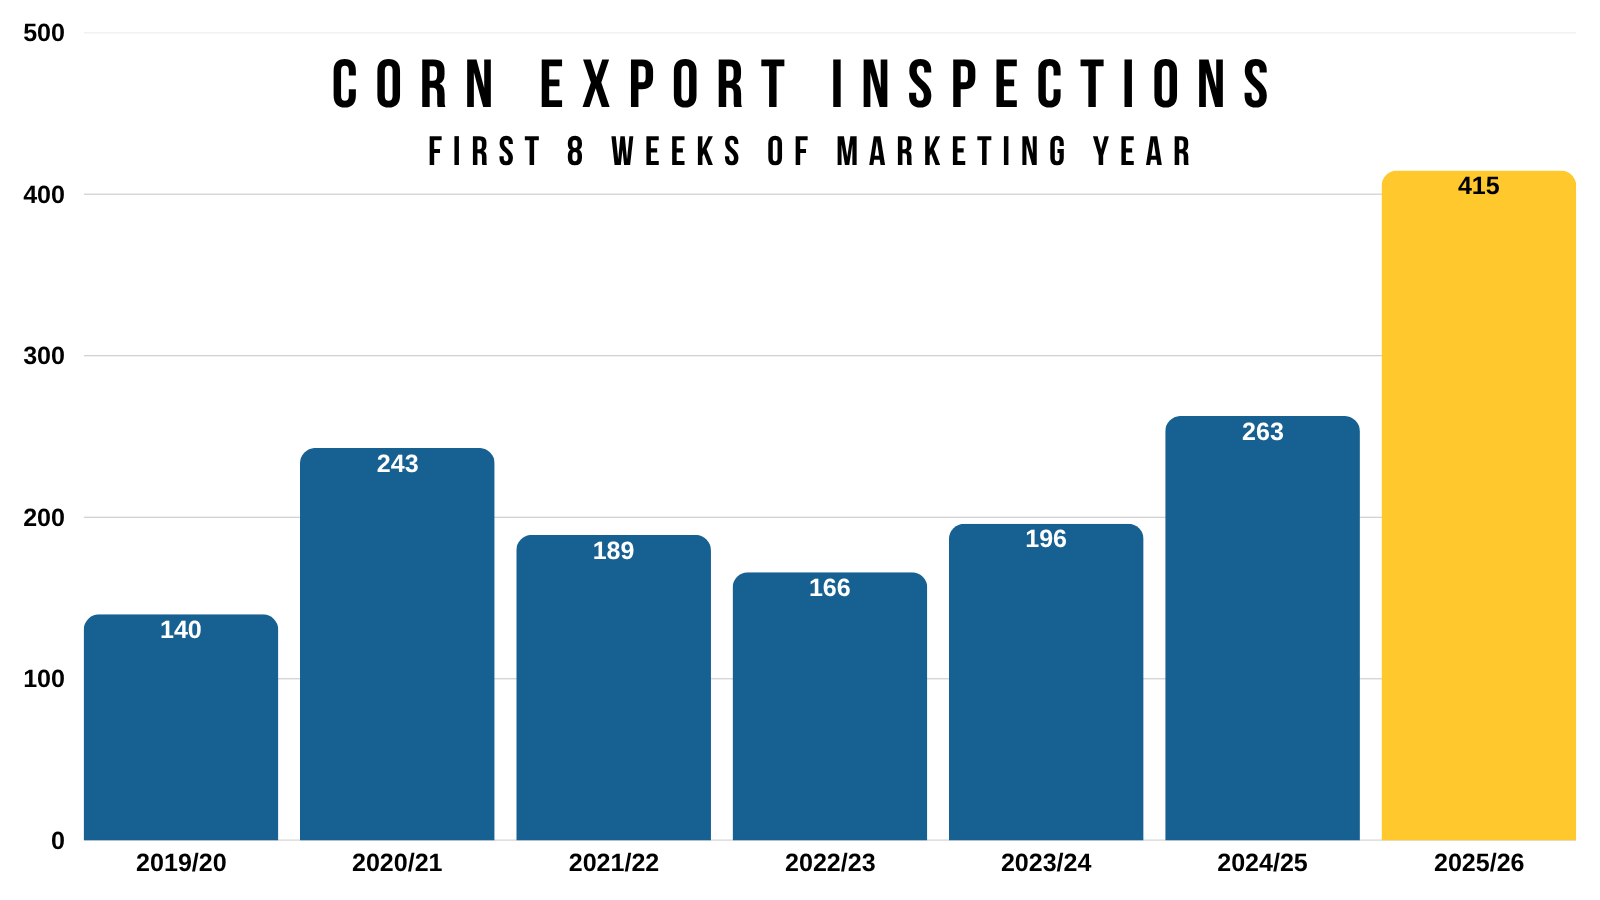
We haven’t had actual export data in a while, but based on the last USDA report they are expecting export demand to be the best it's ever been.
So that is why you can’t get too bearish on corn here either.
As I'd like to think record demand should help keep a floor under this market.
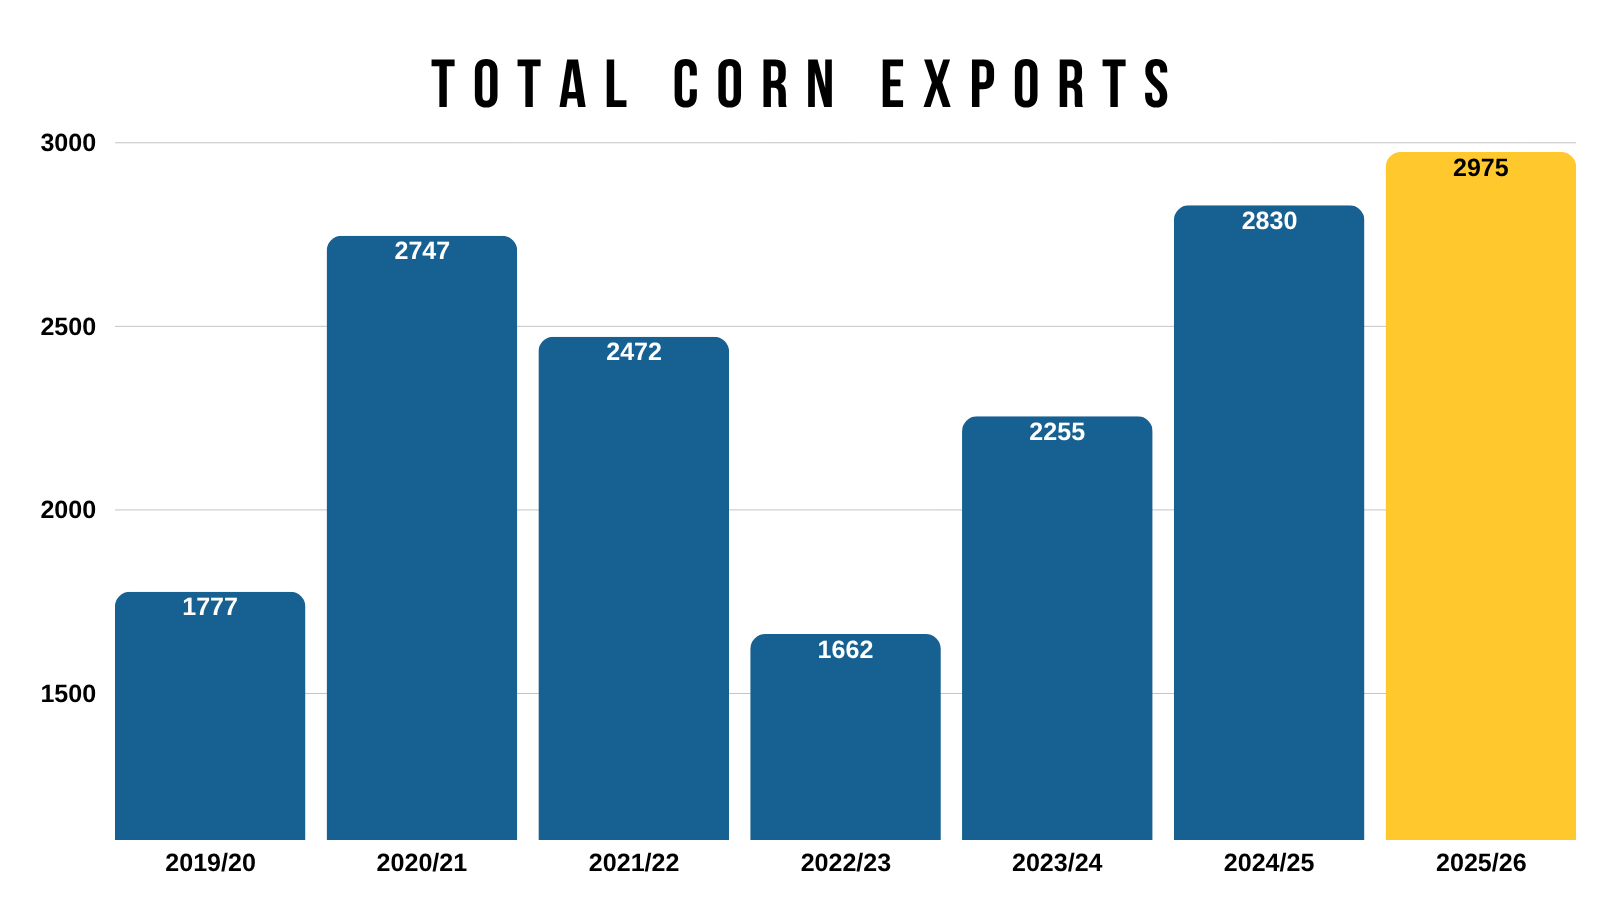
At the same time, yield is coming down.
That is a given.
By how much is the bigger question.
And will it take until January for it to be realized due to the government shutdown?
I've shown this chart a lot recently.
This is March-25 vs March-26 corn if you align the harvest lows.
It is still tracking pretty closely.
I can easily see a scenario where corn goes sideways before getting a greater opportunity towards the end of the year or into next.

If we look at a quick seasonal.
Corn has traded lower from Nov 1st to Nov 19th the last 13 of 15 years.
The only years we traded higher was 2024 and 2020.
So seasonally, we are entering a weak time period, but doesn’t have to happen.

Technicals:
Dec Corn
Tuesday we hit that $4.35 target in Dec corn and alerted a sell signal & hedge alert.
Currently we are struggling here. As we've rejected there twice.
This reclaimed 50% of the Feb highs. It was also key support from spring. It is now viewed as resistance until proven otherwise.
If we can bust above this green box, then it could certainly open the door higher. But for now, it is resistance.
Maybe soybeans continue to drag corn higher. If that is the case, I will have my next target out if we break above this green box.
To the downside, if this truly was our local top, we want to hold $4.20. That would be a standard sized correction.
As it gives back 61.8% of the recent rally.

March Corn
If you have JFM delivery, we also hit our target March corn.
$4.50 clawed back exactly 50% of the February highs.
It was also old suppport from spring.
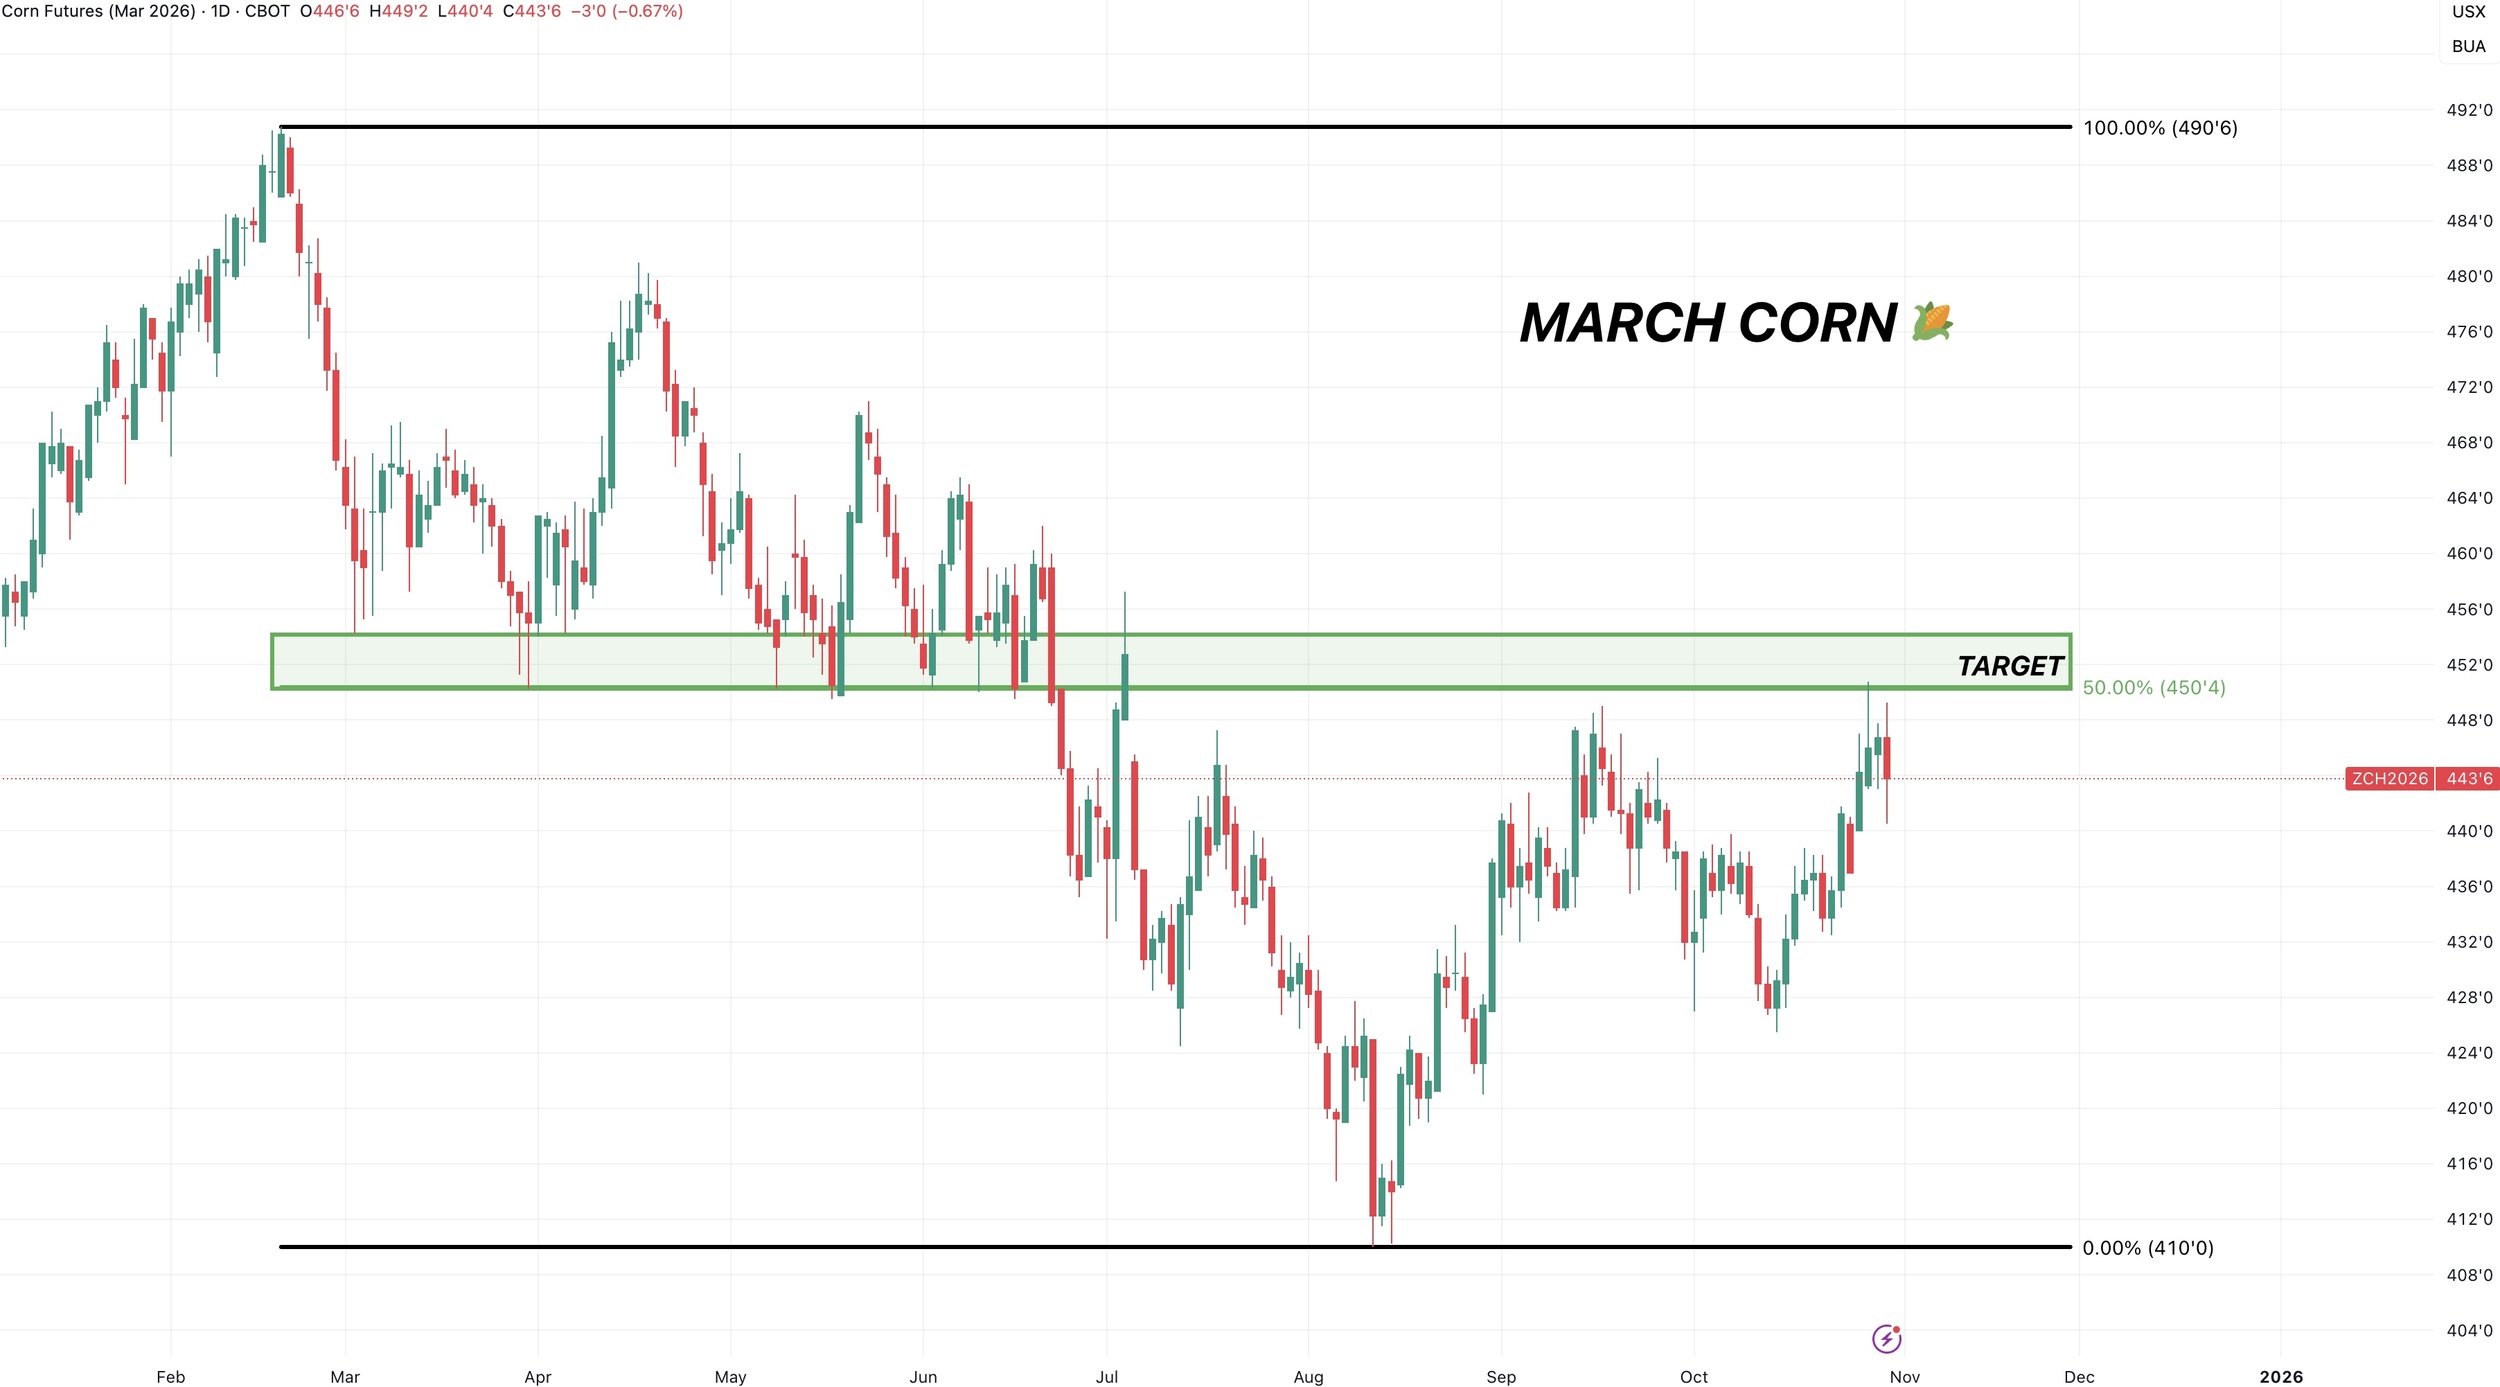
Soybeans
Fundamentals:
Let's dive right into the China news.
They said that China has agreed to buy 12 MMT (440 million bu) of soybeans this year.
Not only that, but they agreed to buy 25 MMT (920 million bu) of soybeans each year for the next 3 years.
Now are these massive numbers? No.
China essentially agreed to buy the same amount of soybeans they had previously been buying the last few years.
Here is a visual of that.
This is assuming they are talking about marketing years, not calendar years. That was not specified.

However, here is the difference.
Crush.
We are crushing more than ever. Our domestic demand is as strong as it's ever been.
So China is going to be roughly the same amount of soybeans they've been buying the last few years.
If you compare the years that resemble the same amount of soybeans China has agreed to buy, crush demand is +200-300 million bushels higher than those years.
So even though this commitment from China isn’t out of this world large, it is still friendly.

We also have far less acres than those years.

China does have a pretty shaky track record or living up to their promises. As they only fulfilled 58% of what they agreed to buy during the phase one trade deal.
However, that might be largely due to how the deal was structured back then.
In the phase one deal China agreed to buy a set dollar amount rather than pure volume. Soybeans were at low prices at the time, but ramped up. So it was harder for them to meet their requirement.
This agreement is far more reasonable and attainable because they are basically just buying what they normally do.
With the domestic demand we have, if Brazil has any weather issues at all, things could get pretty interesting.
Not to mention, we do have the 2nd lowest acres of the last decade.
Which makes the room for error on the balance sheet all that more smaller.
Here is a 2024 vs 2025 yield comparison.
Last year, Oct yield was the same as where the analysts pegged it at earlier this month.
Oct 2024: 53.10
Oct 2025: 53.20 (analyst est)
Last yield, yield fell substantially in Nov and Jan.
Nov 2024: 51.70
Jan 2025: 50.70
We had a similarly dry finish this year.
Odds favor us not getting a yield update until January with the government shutdown.
But what happens if we see a similar drop in yield like last year?
China has agreed to buy their usual amount of soybeans. We have small acres. Crush is at a record. There just isn’t a ton of room for error on the supply side.
I have been preaching this argument for months, but that is why this market has "potential".
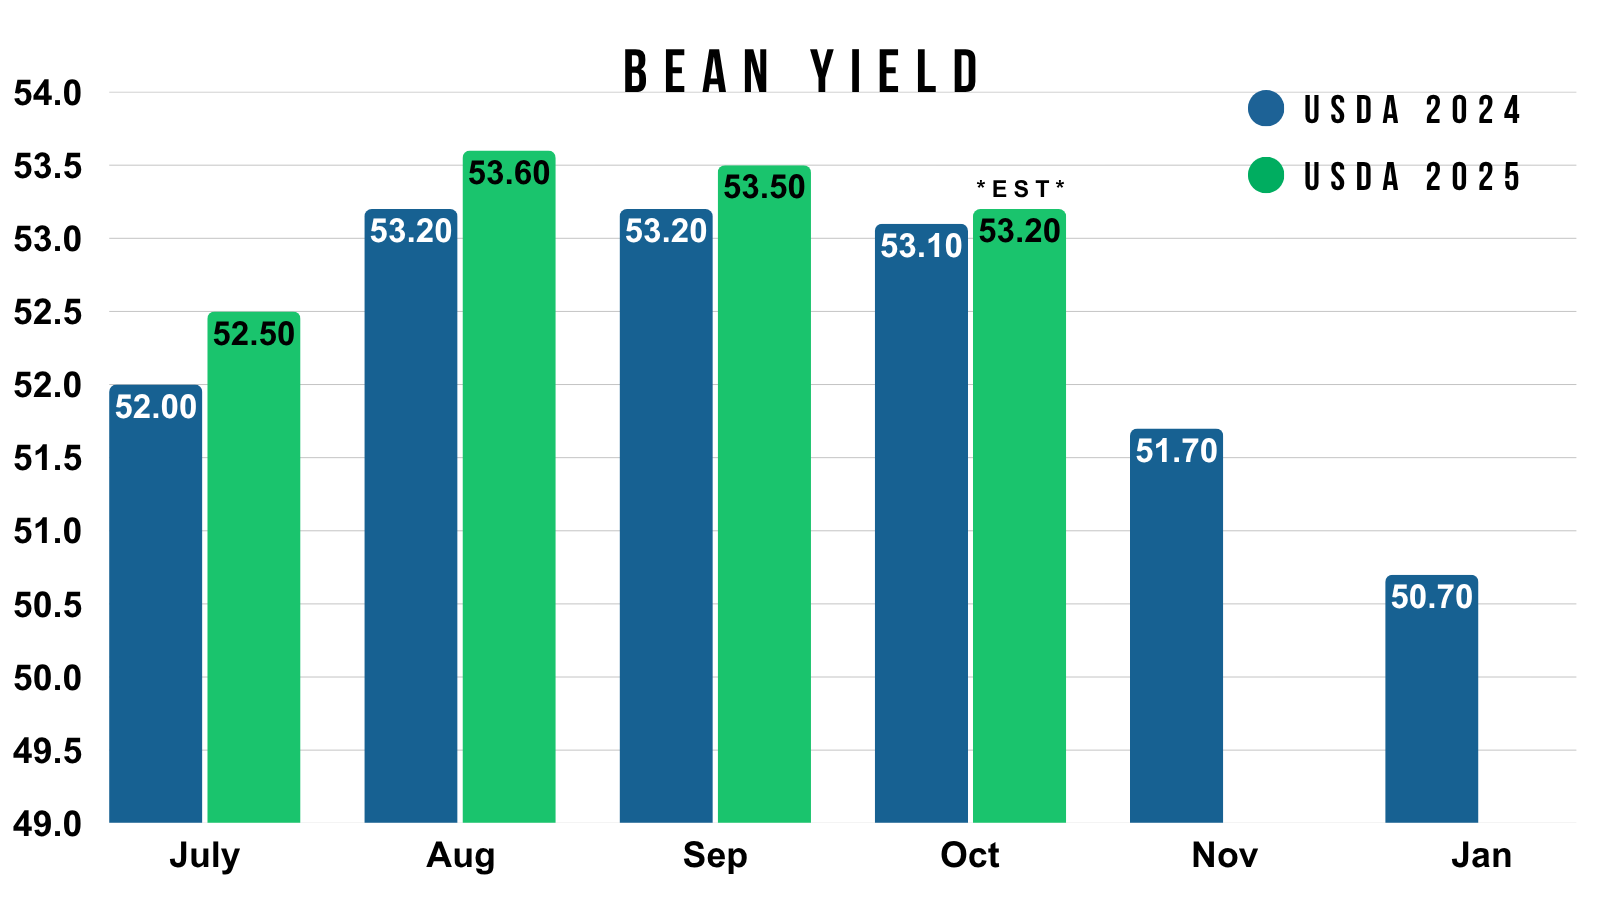
Bottom line, this is great news that China is going to buy soybeans.
I mean Chinese demand was by far the biggest concern in this market.
China is only buying about half of what they did last year, but the concern was China wouldn’t be buying at all.
They aren’t buying a crazy amount of soybeans this year, but it should be enough to prevent the balance sheet from getting heavy. While at the same time locking in future sales for the next 3 years.
The next big factors are going to be Brazil's crop. Do they have any production issues? We are soon entering their weather season.
Then where does US yield ultimately come in at?
This market certainly has upside potential.
However, we do still like managing some risk up here if you have not done so yet on our sell signal & hedge alert on Monday.
We have been extremely patient on our soybean sell signals this year. So rewarding a $1.00 rally in some sort of manner makes sense.
Preferably something that keeps your upside open such as puts, or selling your grain then re-owning with a call.
If you don’t have a hedge account, like we said on Monday, we simply like making a few sales up here.
It depends on your situation, so give us a call or text if you want to talk specifics.
(605)295-3100
Regardless, I am definitely still keeping ammo in case this market continues higher. But don’t do nothing on a $1.00 rally and the highest prices we've seen in over a year.
Technicals:
Jan Beans
For starters, we did break out of a year range we'd been trapped in for over a year. Which is a pretty big deal.
My targets are subject to change as this is such a headline driven market right now.
For now, I am eyeing $11.20 then $11.55 if we hit them.
$11.20 gives back 50% of the contract highs from the contract lows.
$11.55 gives back 61.8% of the contract highs from the contract lows.
I think both of those are good spots to further de-risk.
Will we fill that gap we left Sunday?
Hard to say. Rule of thumb is typically that if the gap isn’t filled in 3-4 days then it doesn’t have to be filled.

Continuous Beans
I've been showing this chart for months and talking about how significant a break out of this range could be.
We've been trapped in a small range for nearly 500 days.
We've now broken out of that range.
There is a pretty clear gap of air higher. As on that 2024 sell off, it was hard and fast. Meaning we created zero support between here.

I showed this recently, as well as on social media.
Soybeans absolutely hate trading between $11.00 and $12.00
Does that mean soybeans "have" to go to $12.00? No of course not.
But historically, we very rarely ever trade between these two levels.
Most of the time we run up to $12 or higher, or crash below $11.00.
There have only been a handful of months ever where we've simply traded in the $11.00's.
I think $12.00+ soybeans is a possibility. But I will be managing my risk on the way up as nothing is ever a guarantee.
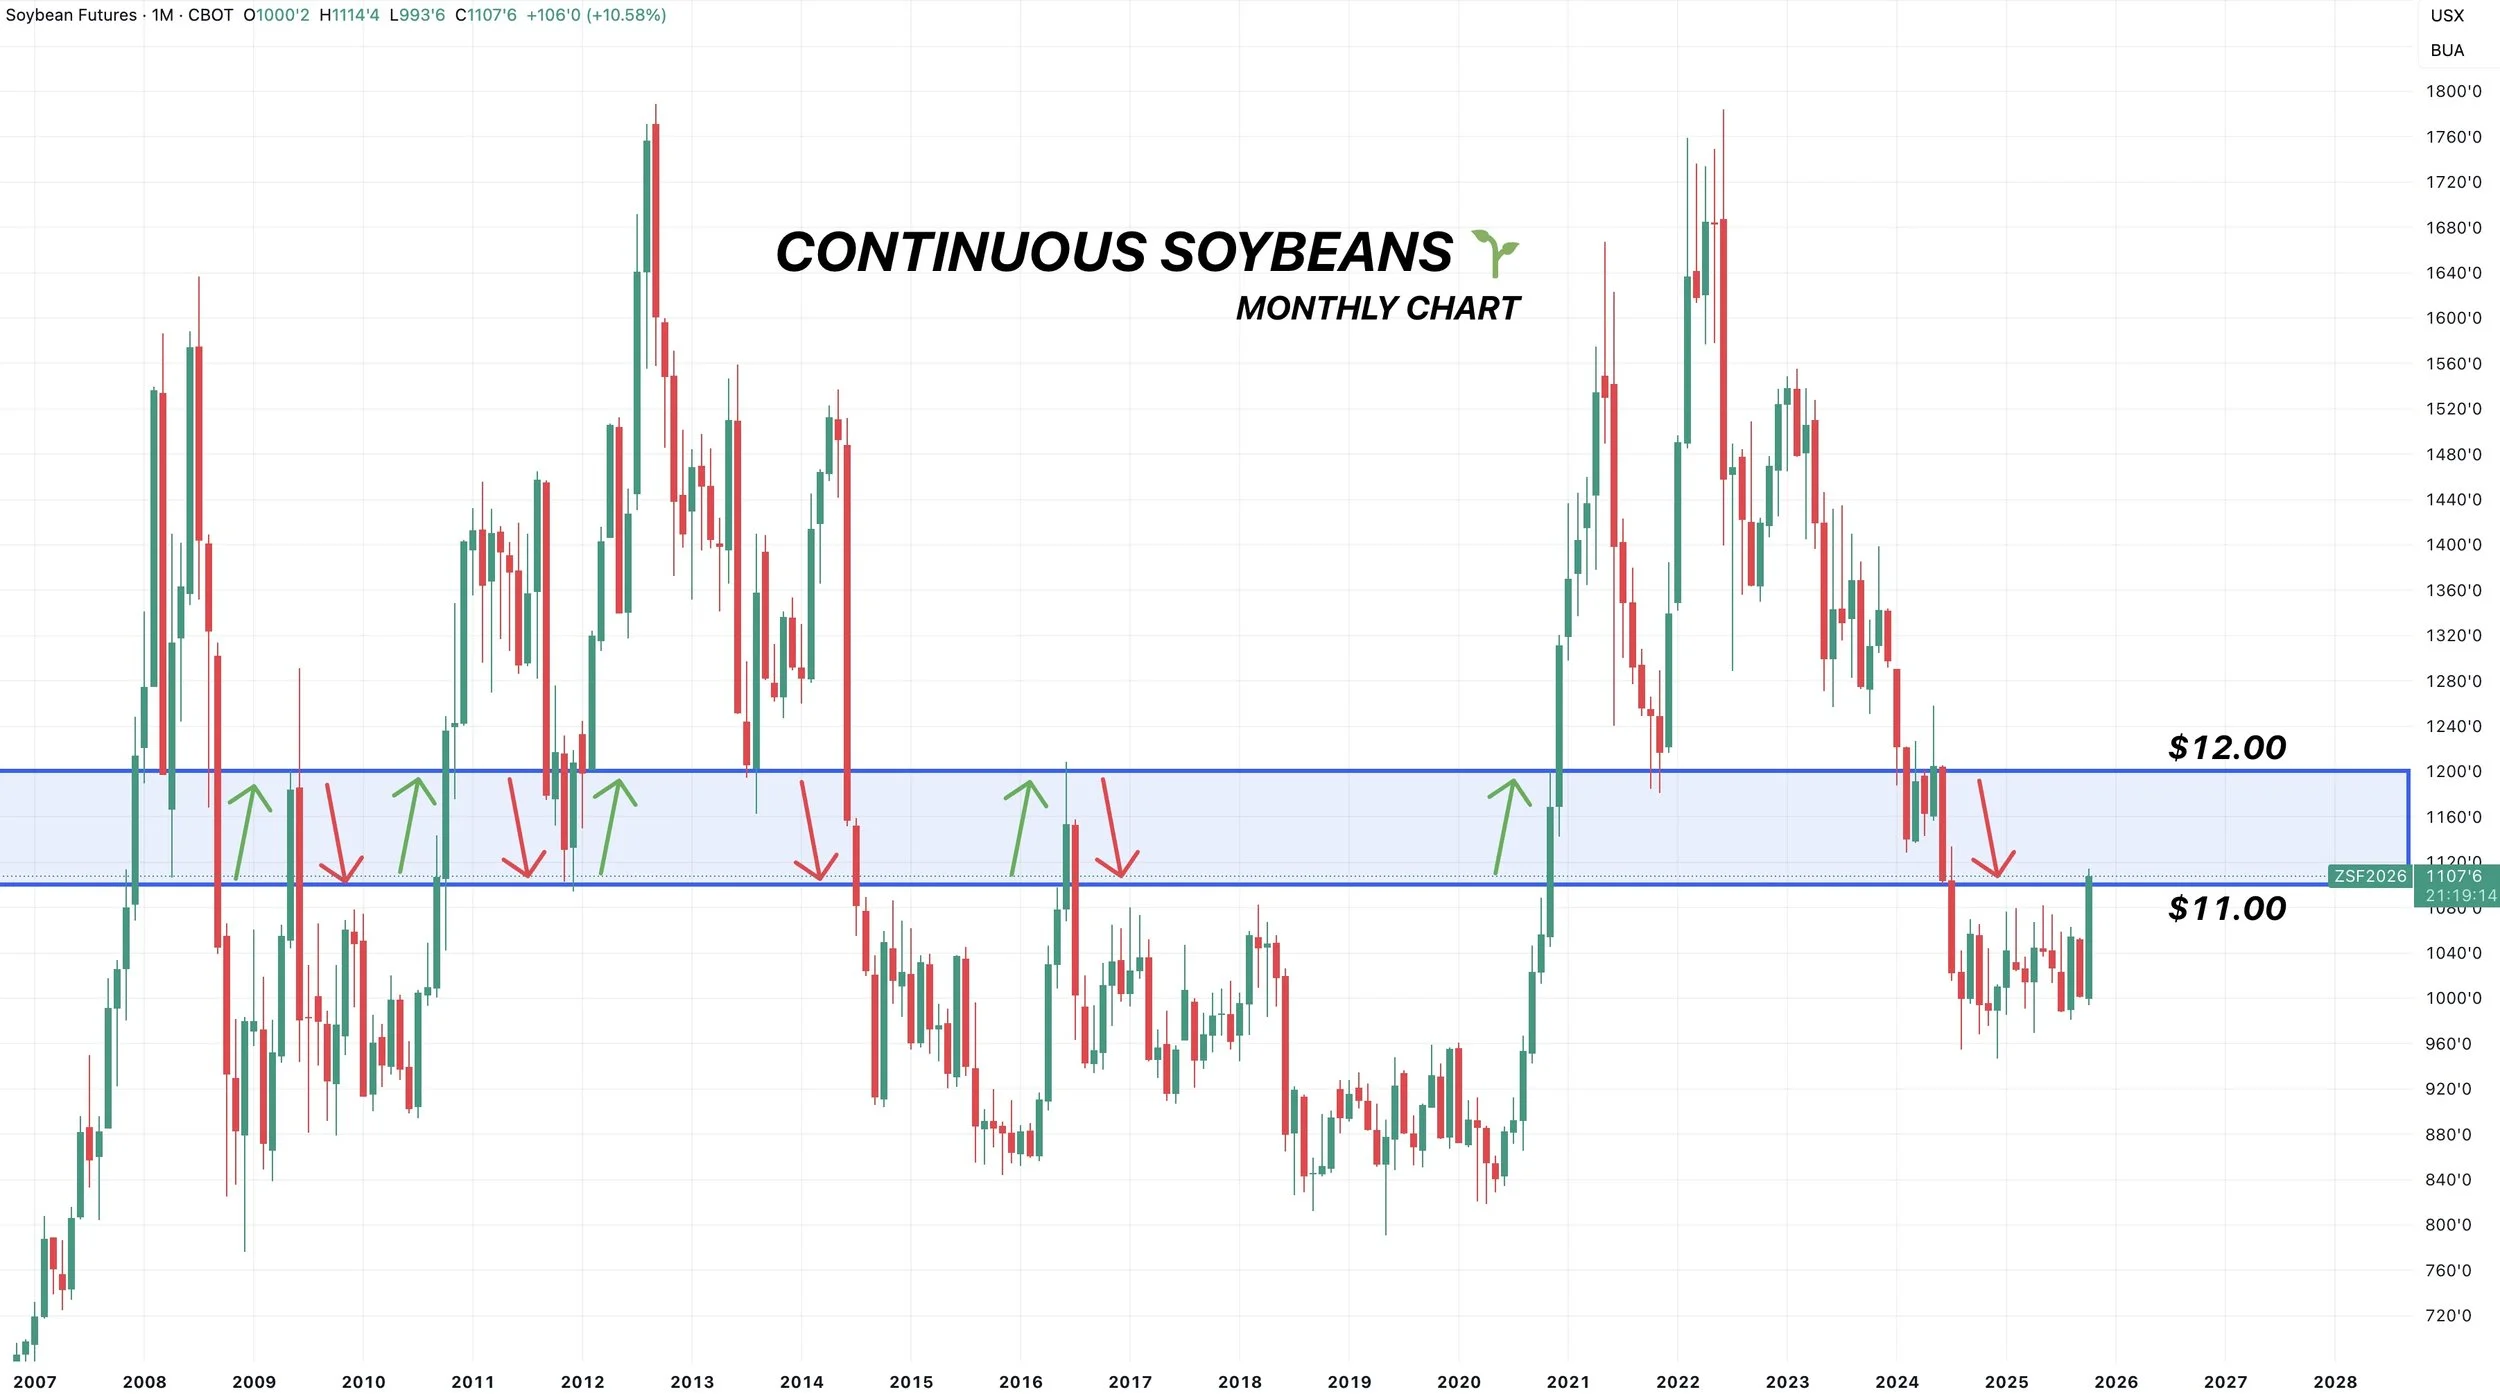
Wheat
Fundamentals:
Nothing new to update in wheat as has been the case recently.
We still don’t have a true catalyst in this market. But relatively speaking I still view the wheat market as being undervalued here long term.
We are entering a seasonally weak time frame similar to corn.
Wheat has traded lower from Nov 1st to Nov 19th the last 13 of 15 years.
We've only traded higher 4 times since 2004.
However, seasonally wheat was suppose to trade higher in September and cleary that didn’t happen either.
Just something to be aware of here.
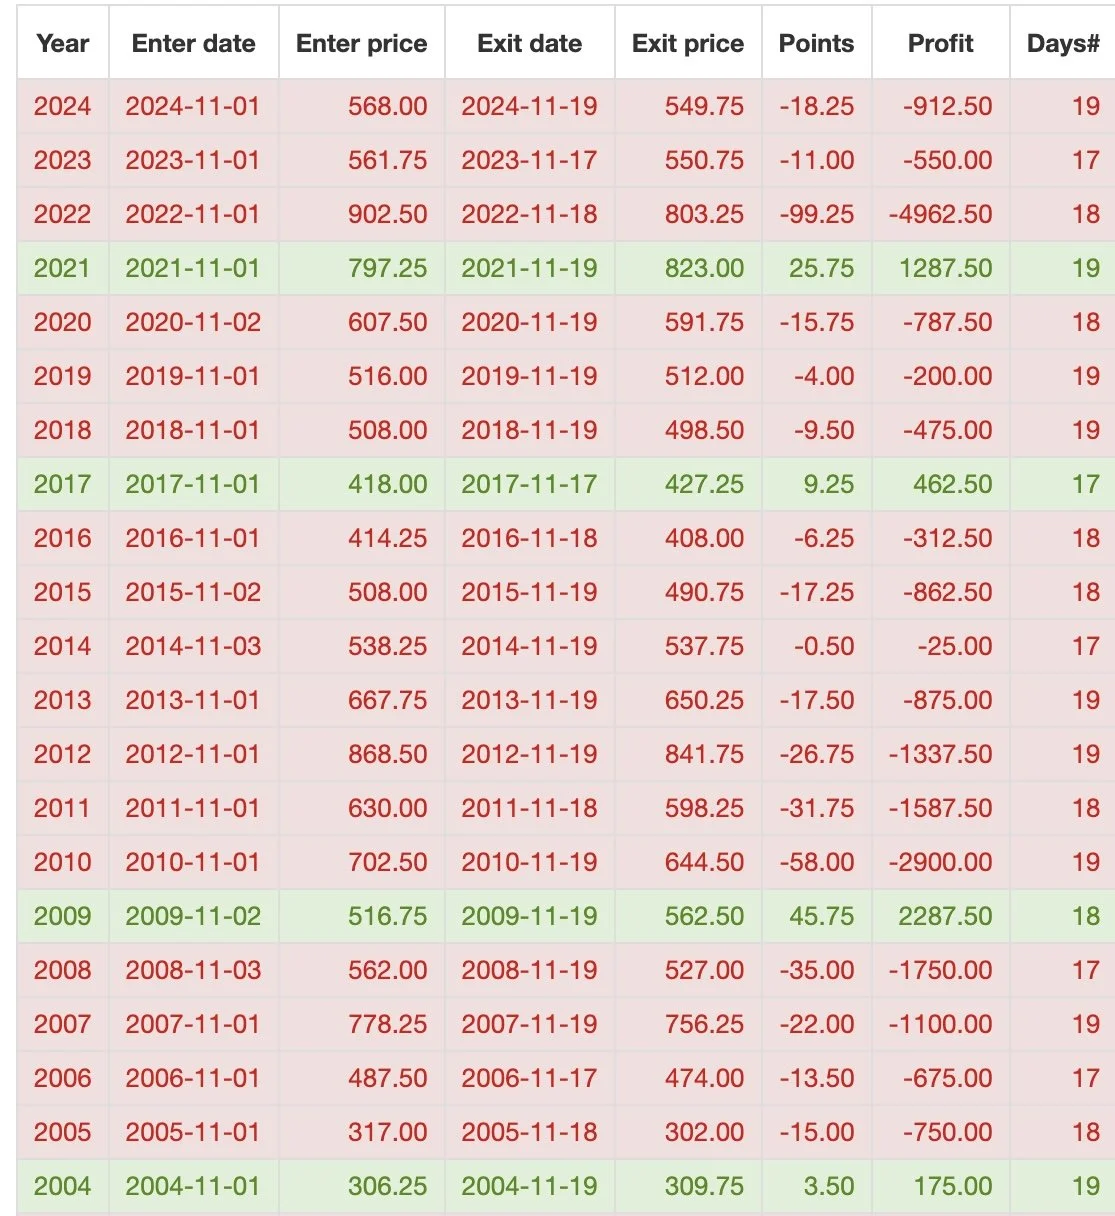
Technicals:
Dec Wheat
Outside down today. As we took out yesterday’s highs then closed below yesterday’s lows.
We rejected right at those Sep highs.
That is going to be a big level to break above.
If we can break above, I think we could have room to run towards $5.55-70. Which is where I want to de-risk if we get there.
To the downside, a standard correction would take us as low as $5.09. That is the level we want to hold or it could create more downside.

Dec KC Wheat
Very similar chart to Chicago.
Outside down day today, which is bearish short term.
We rejected right at the Sep highs.
We did just break out of a multi-month downtrend, so that’s nothing to scoff at.
If we can take out the Sep highs, I think we have room to go to $5.45-60
Which gives back 50-61.8% of the June highs.
To the downside, we need to hold $4.95 to keep bias remaining higher.
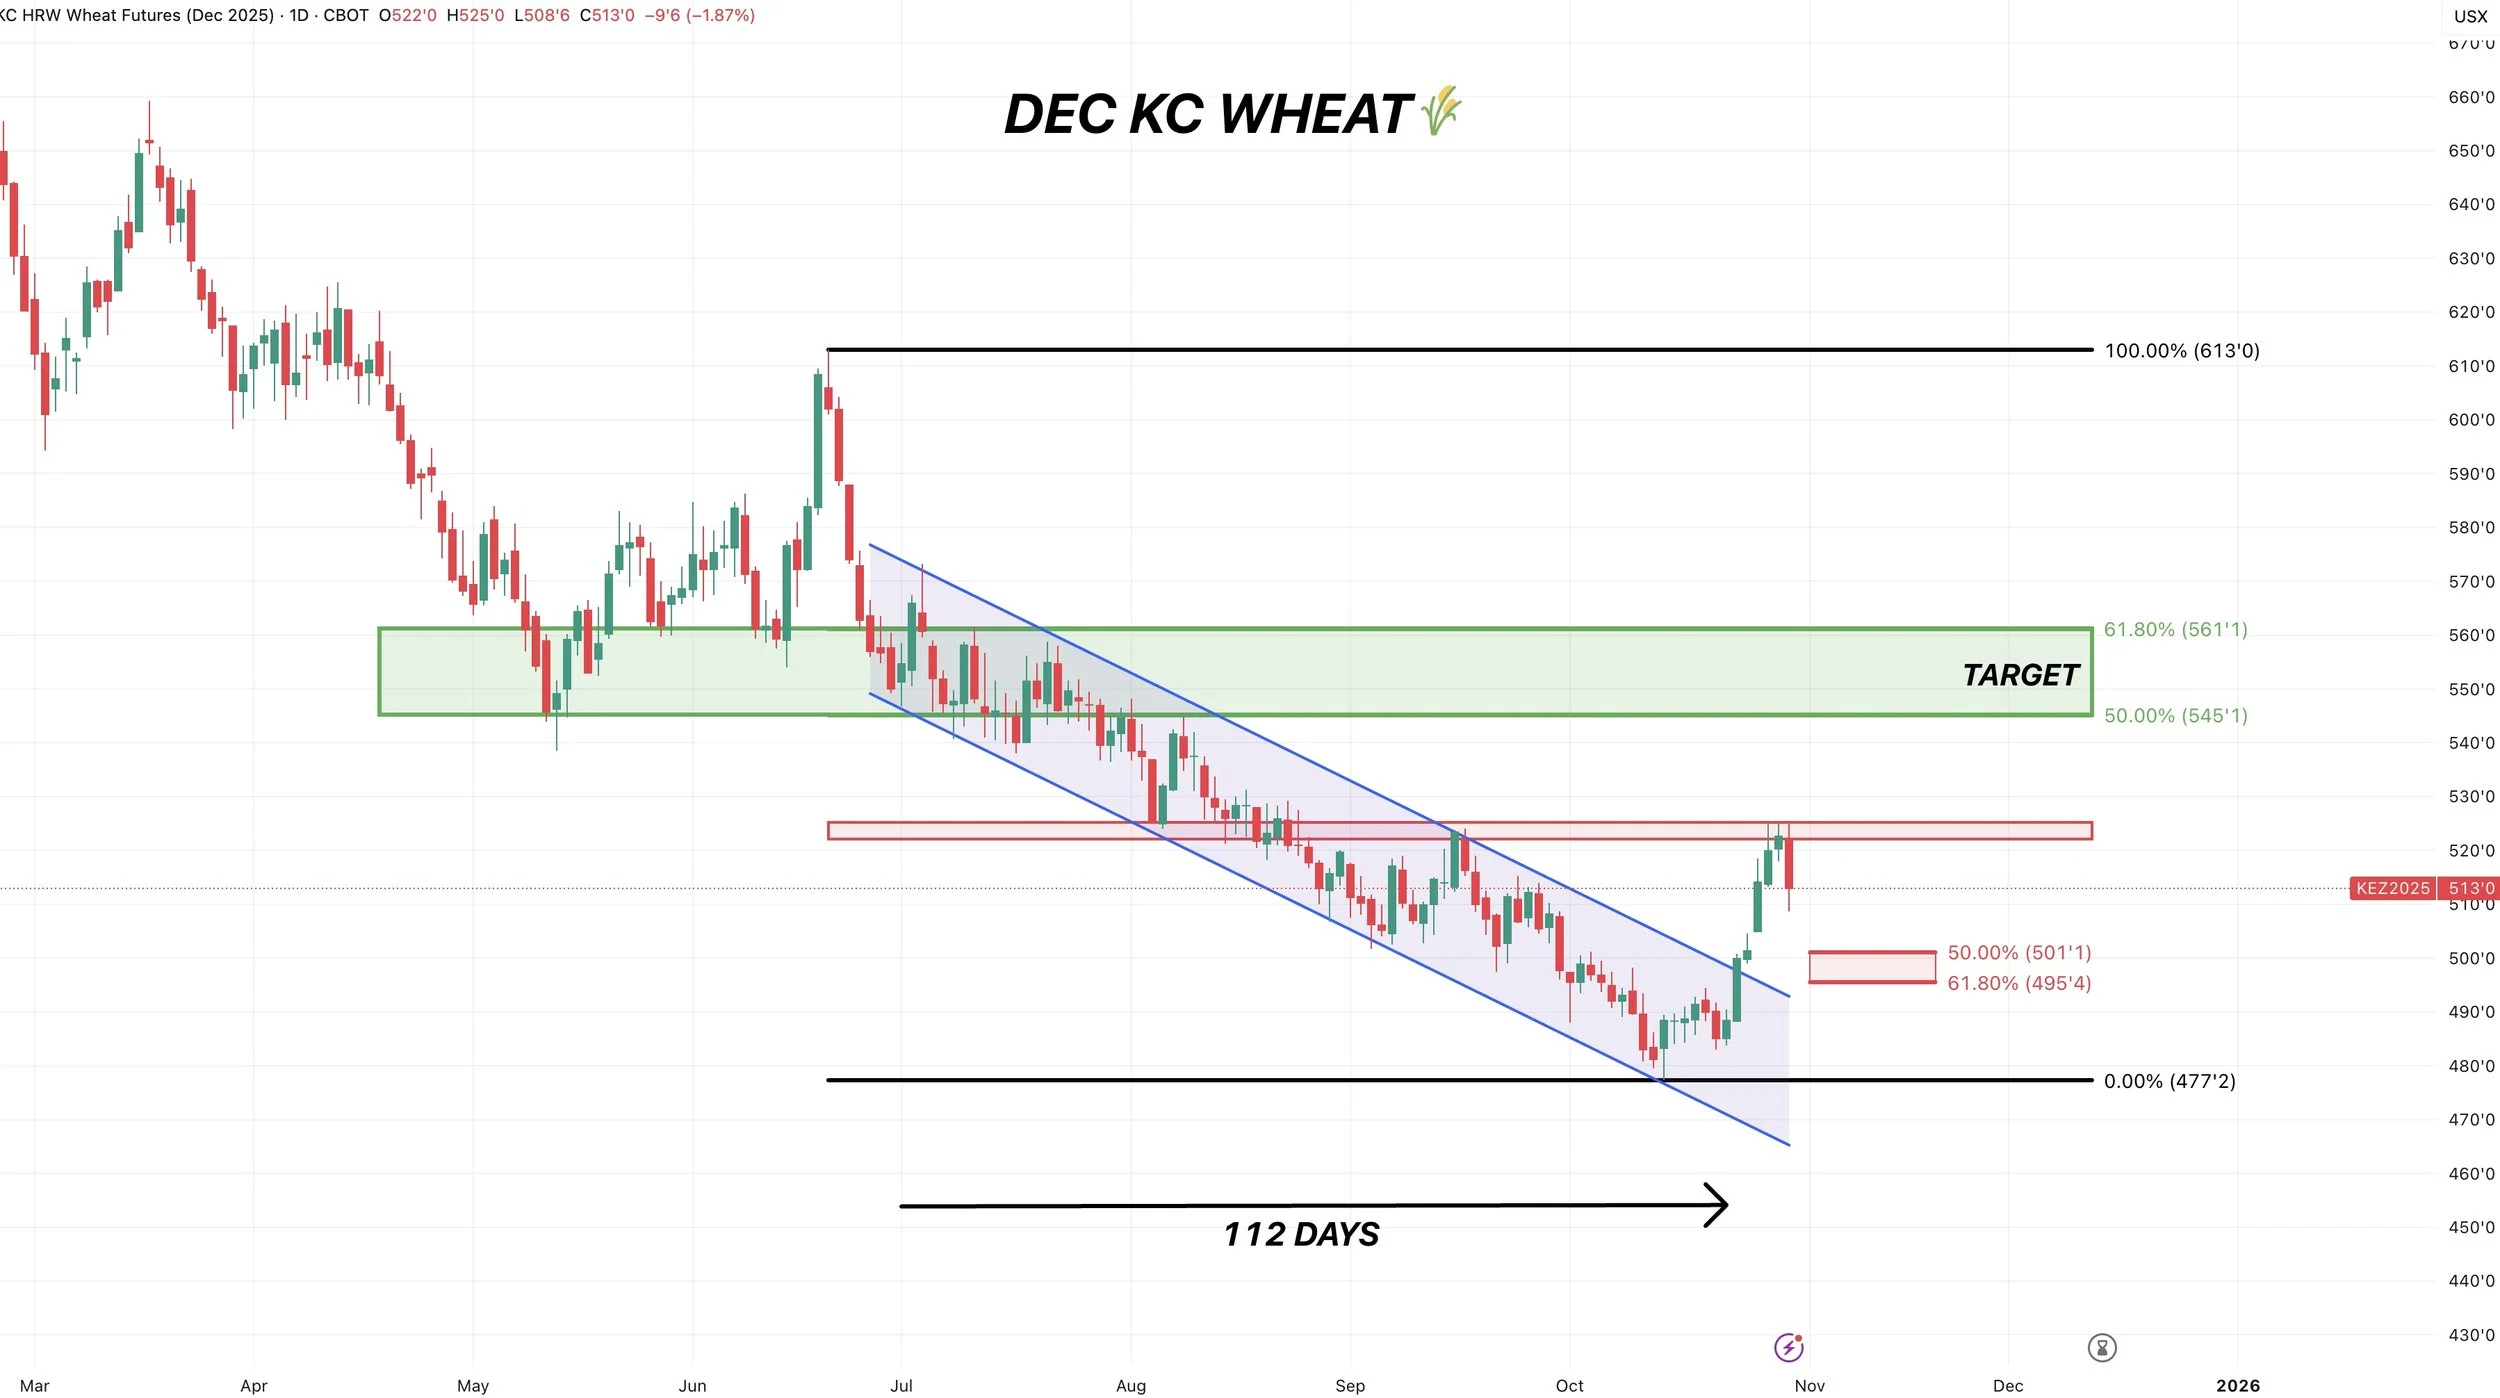
Cattle
Dec Live Cattle
Inside day for both live and feeders, as the market is pausing searching for a direction.
Remember how massive of support the 50-day had been all year long?
That is now going to be our upside point of interest if we get a bounce.
Since it was incredible support, it could offer pretty stiff resistance.
So that is where we are going to wanting to be looking to reward if we get a rally.
To the downside, I added some retracement levels.
All these are is I measured the top down to where we previously bounced off the 50-day MA at before that big rally.
Earlier this week we touched the 161.8% level before bouncing. If that level fails the next levels of support are on the chart.
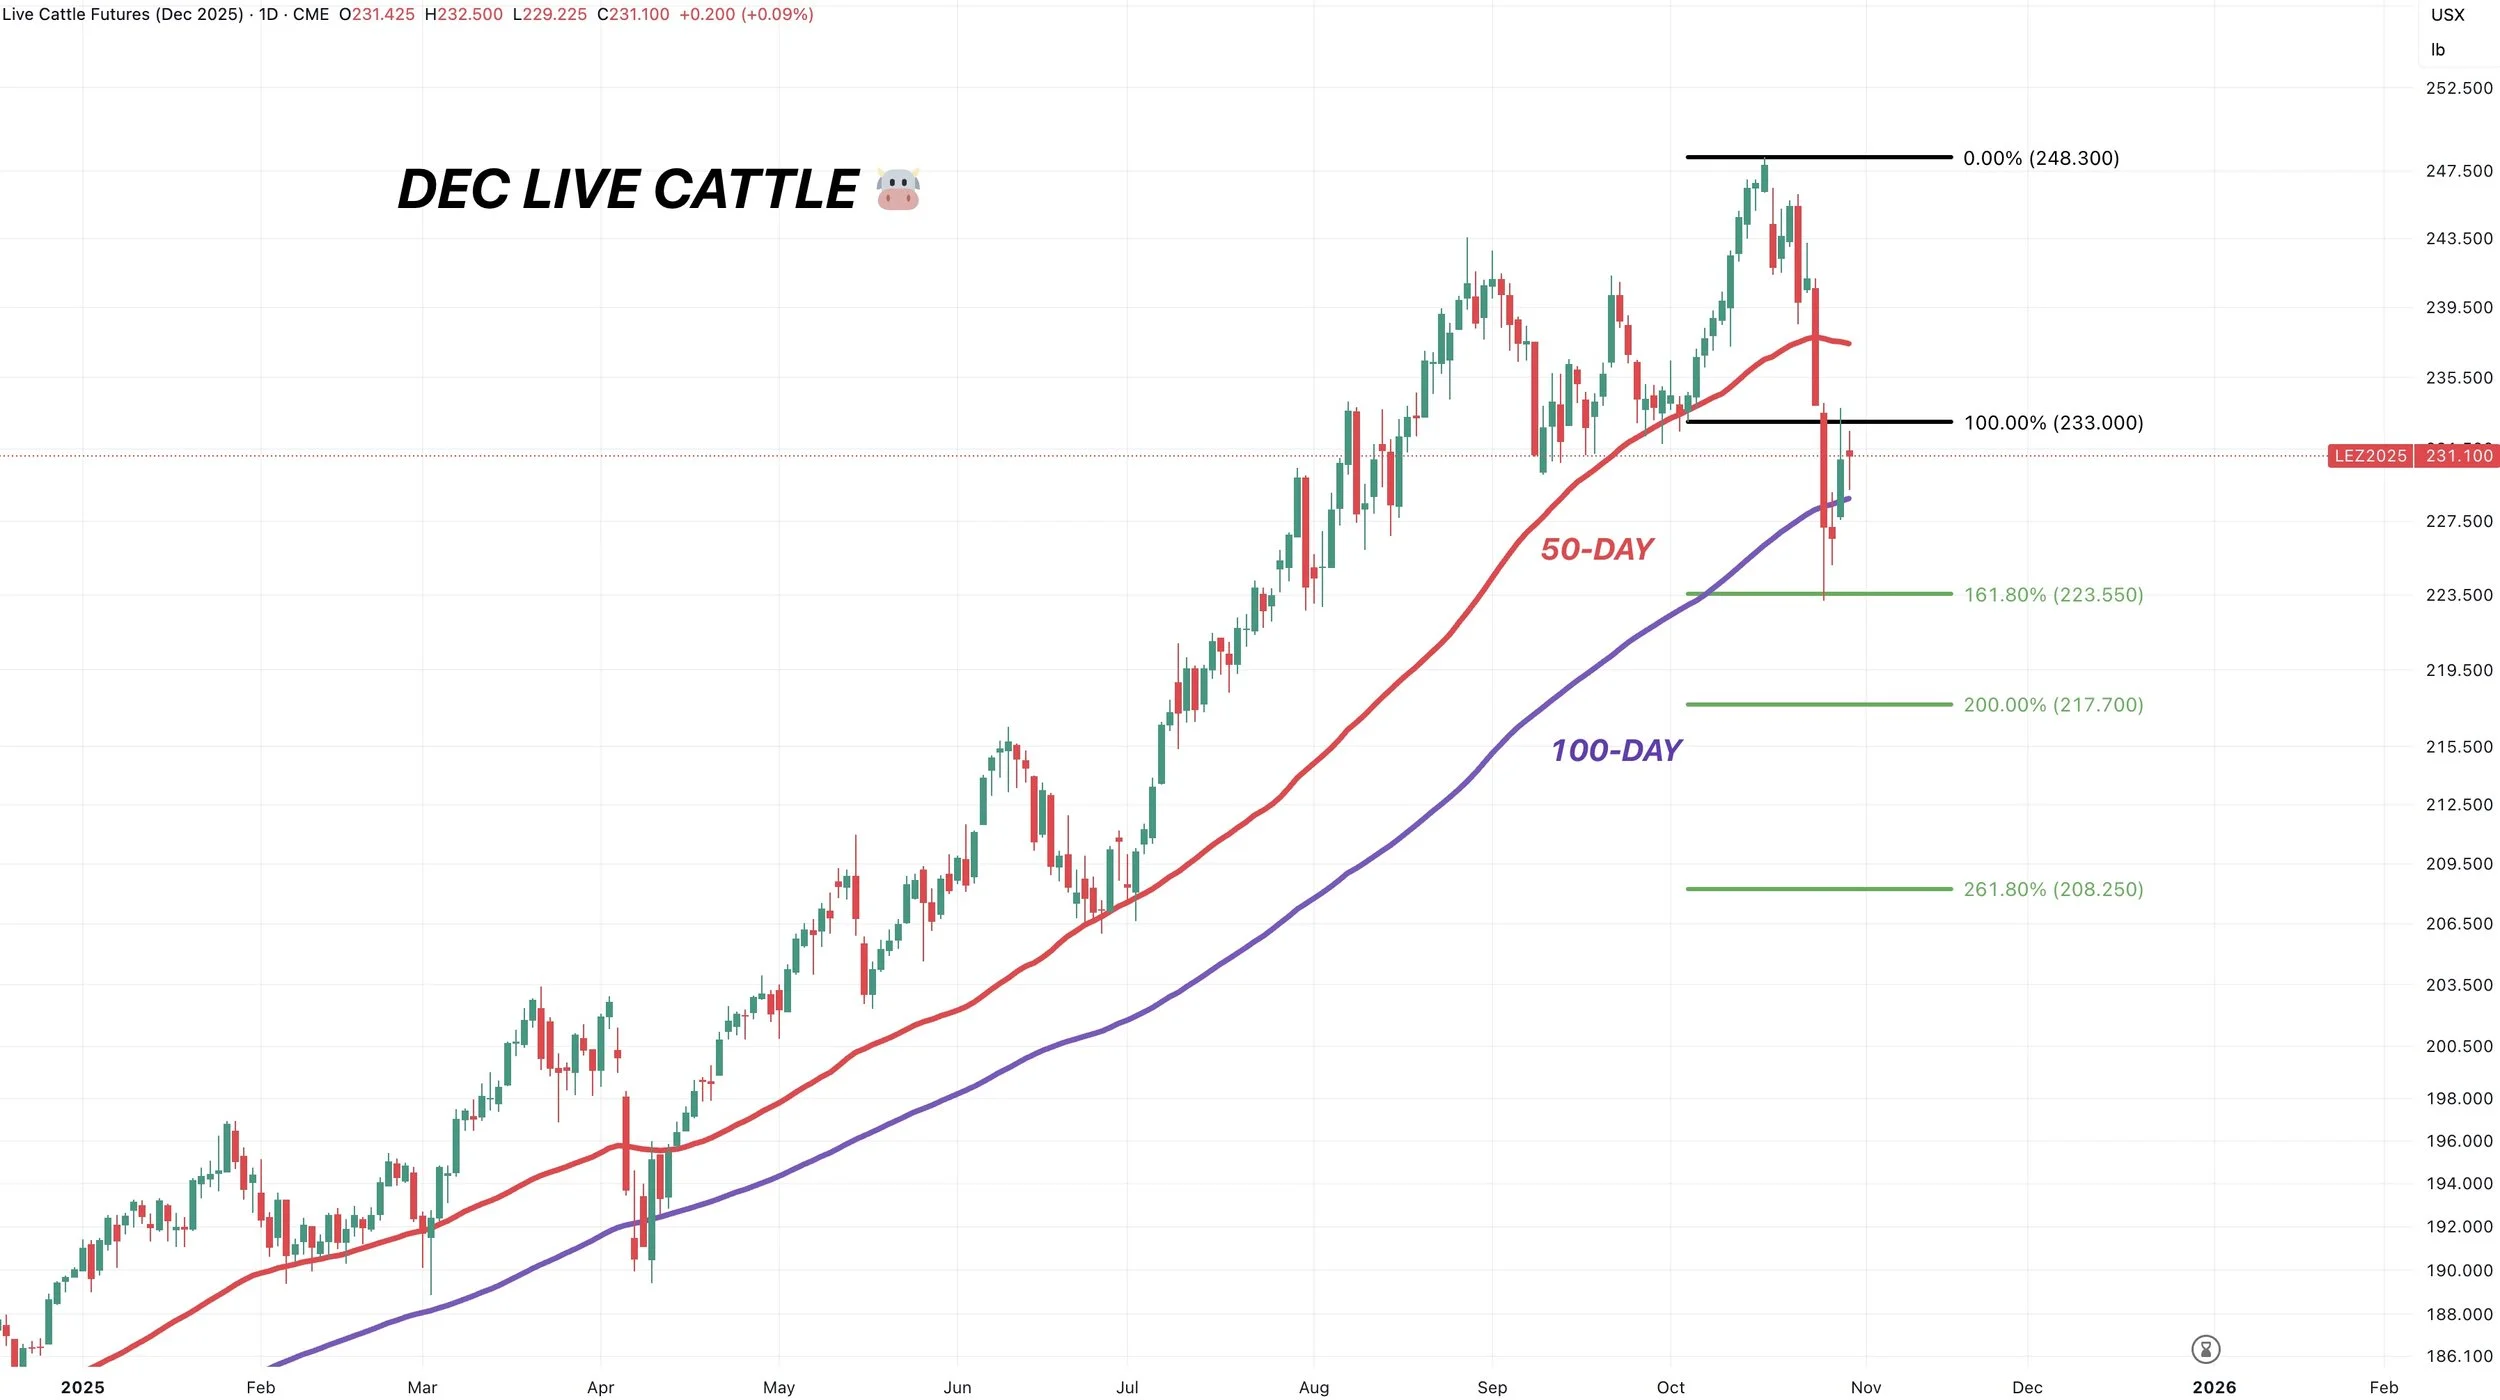
For reference, here is a zoomed out look of the 50-day.
Was a floor all year long.
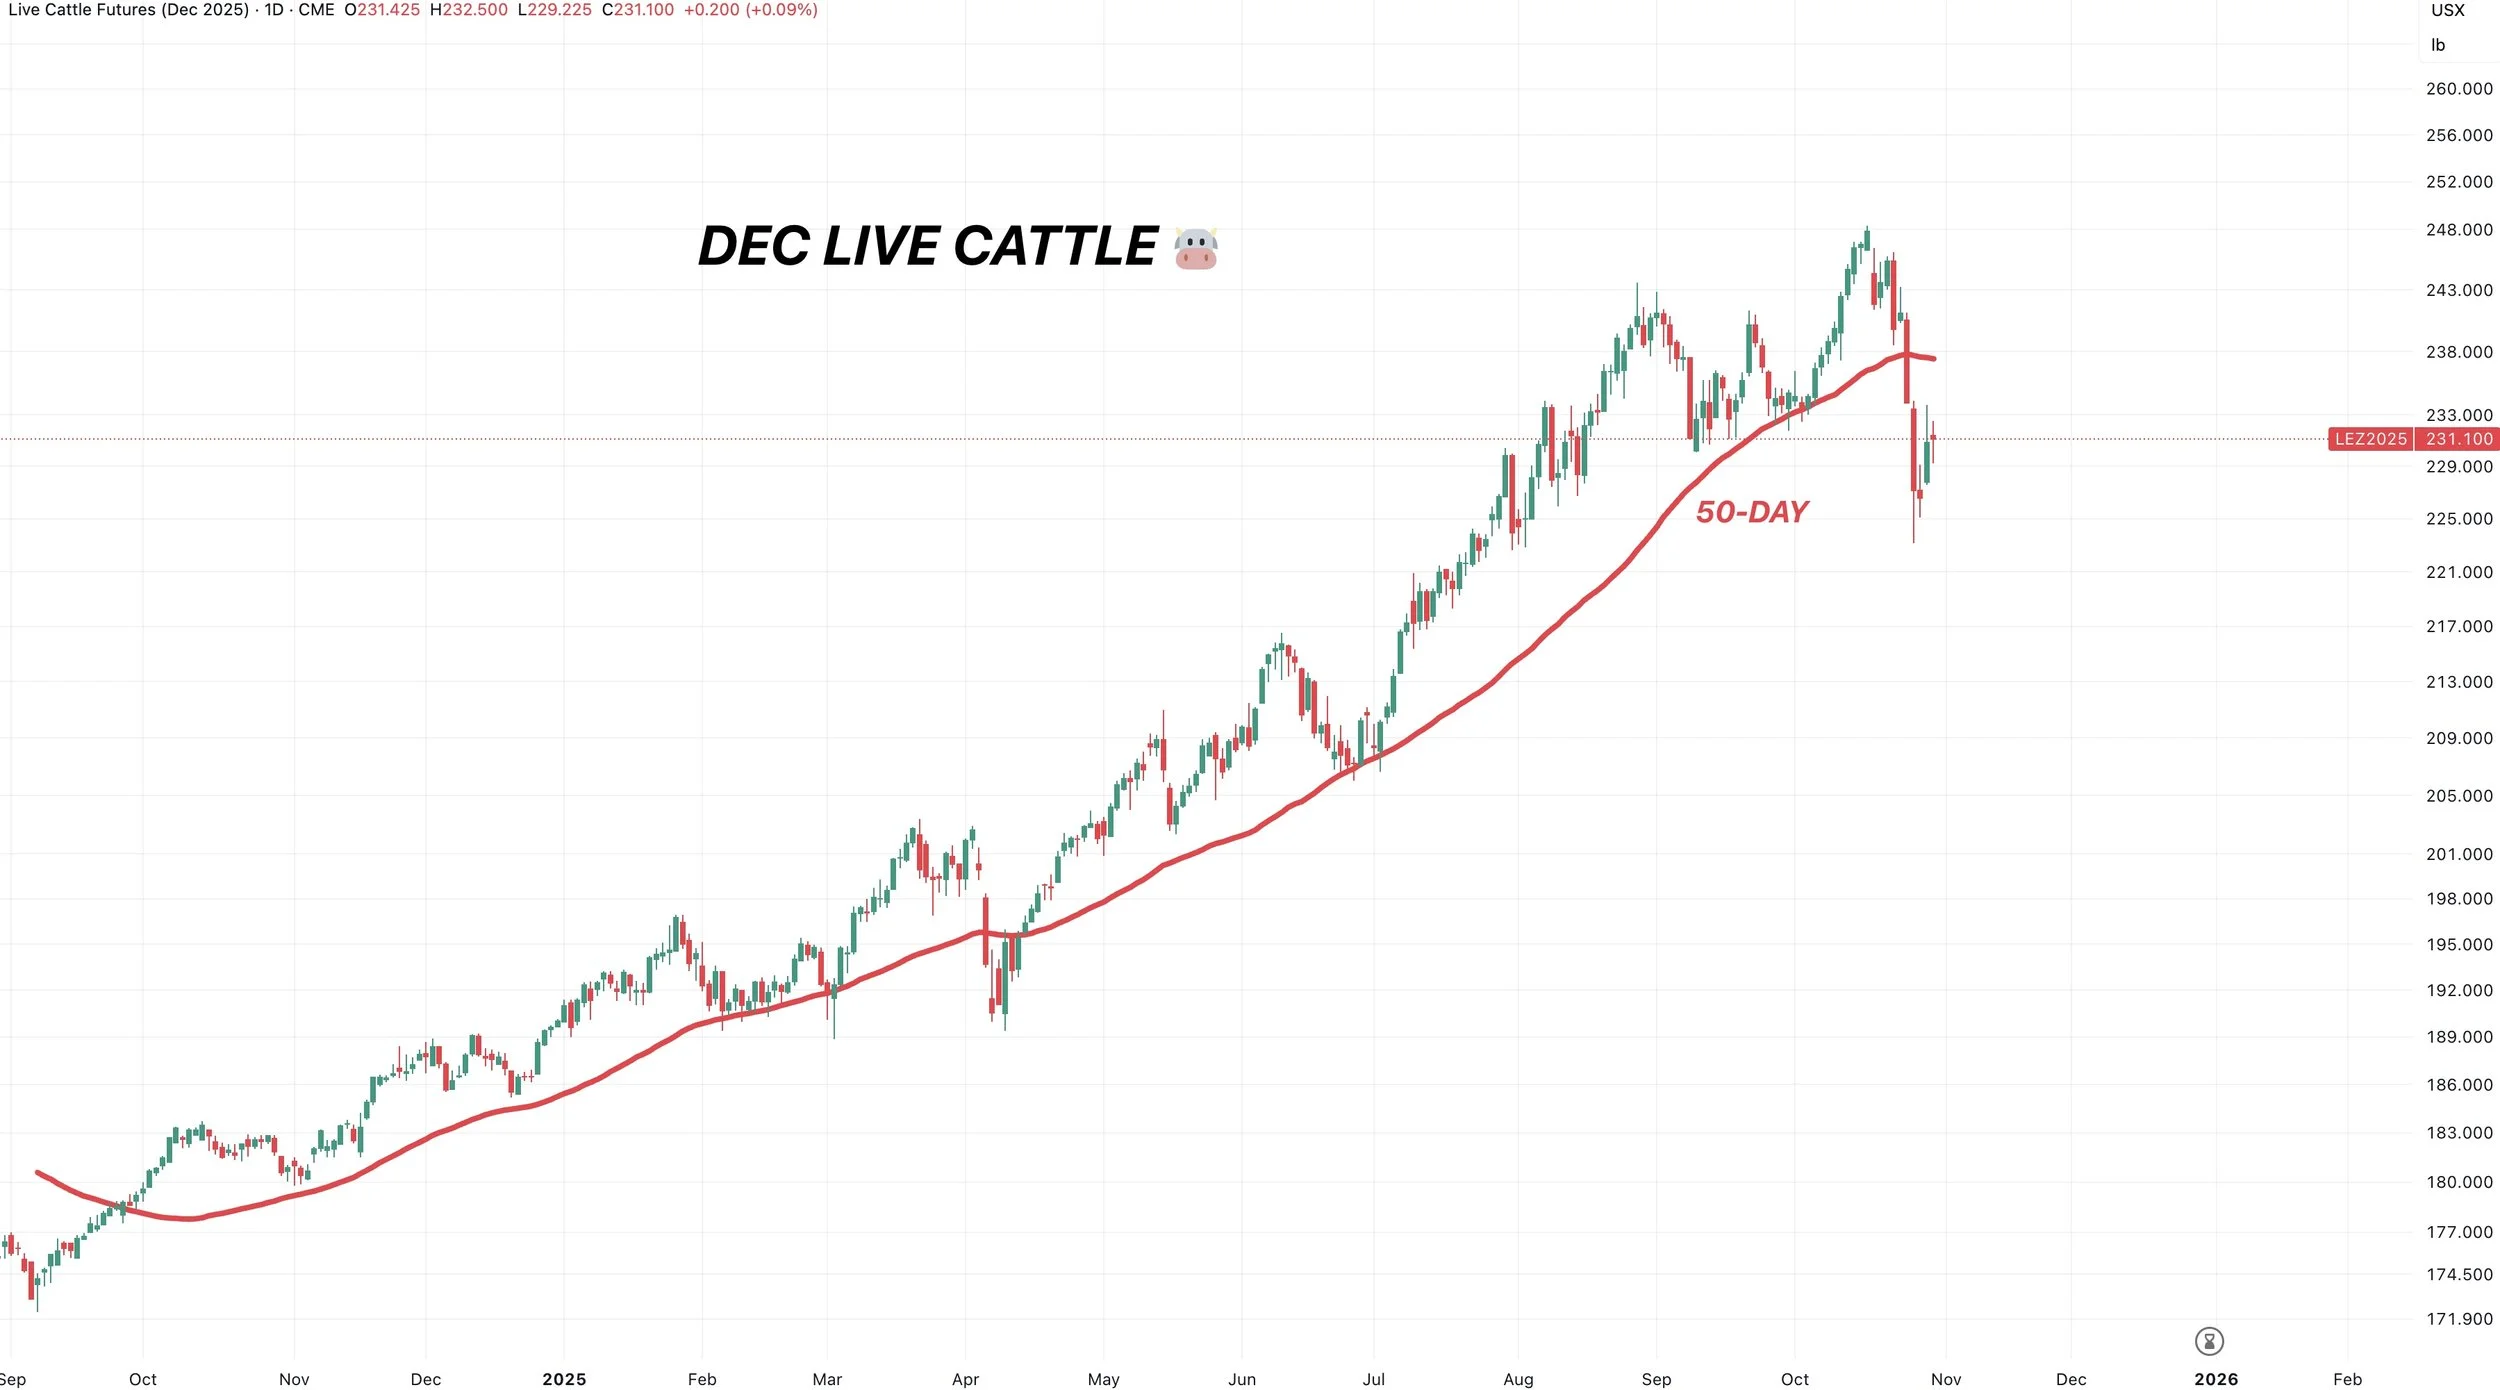
Jan Feeder
We left a massive gap on Monday.
If we are able to crawl up and fill that gap, we should be rewarding the bounce. That is going to be out point of interest if it fills. Gaps do not have to fill, but that is an area to reward if we do.
It is possible that that gap does not get filled, as open interest yesterday indicates that yesterday’s rally was not met with fresh buying.
Similar to live cattle, we bounced at the 161.8% retracement. Failure to hold could drop us to the next levels.

Continuous Feeder
Fundamentally, nothing has actually changed in this market.
We did get reassurance that the border would remain closed for the time being.
But with the government clearly trying to get prices lower, there is still risk in this market.
If the top is truly in, where could we expect to find a bottom?
This is my big picture thinking; it could be months or even years. It won’t happen right away, and doesn’t have to happen at all.
But historically, cattle has found a bottom where it previously found resistance.
The highs from the 90's turned into the floor during the 2000's.
The highs from the 2000's turned into the floor during the 2010's.
So perhaps we find a floor at those highs from last year. Or maybe those highs from 2014.
Testing that level would make sense.
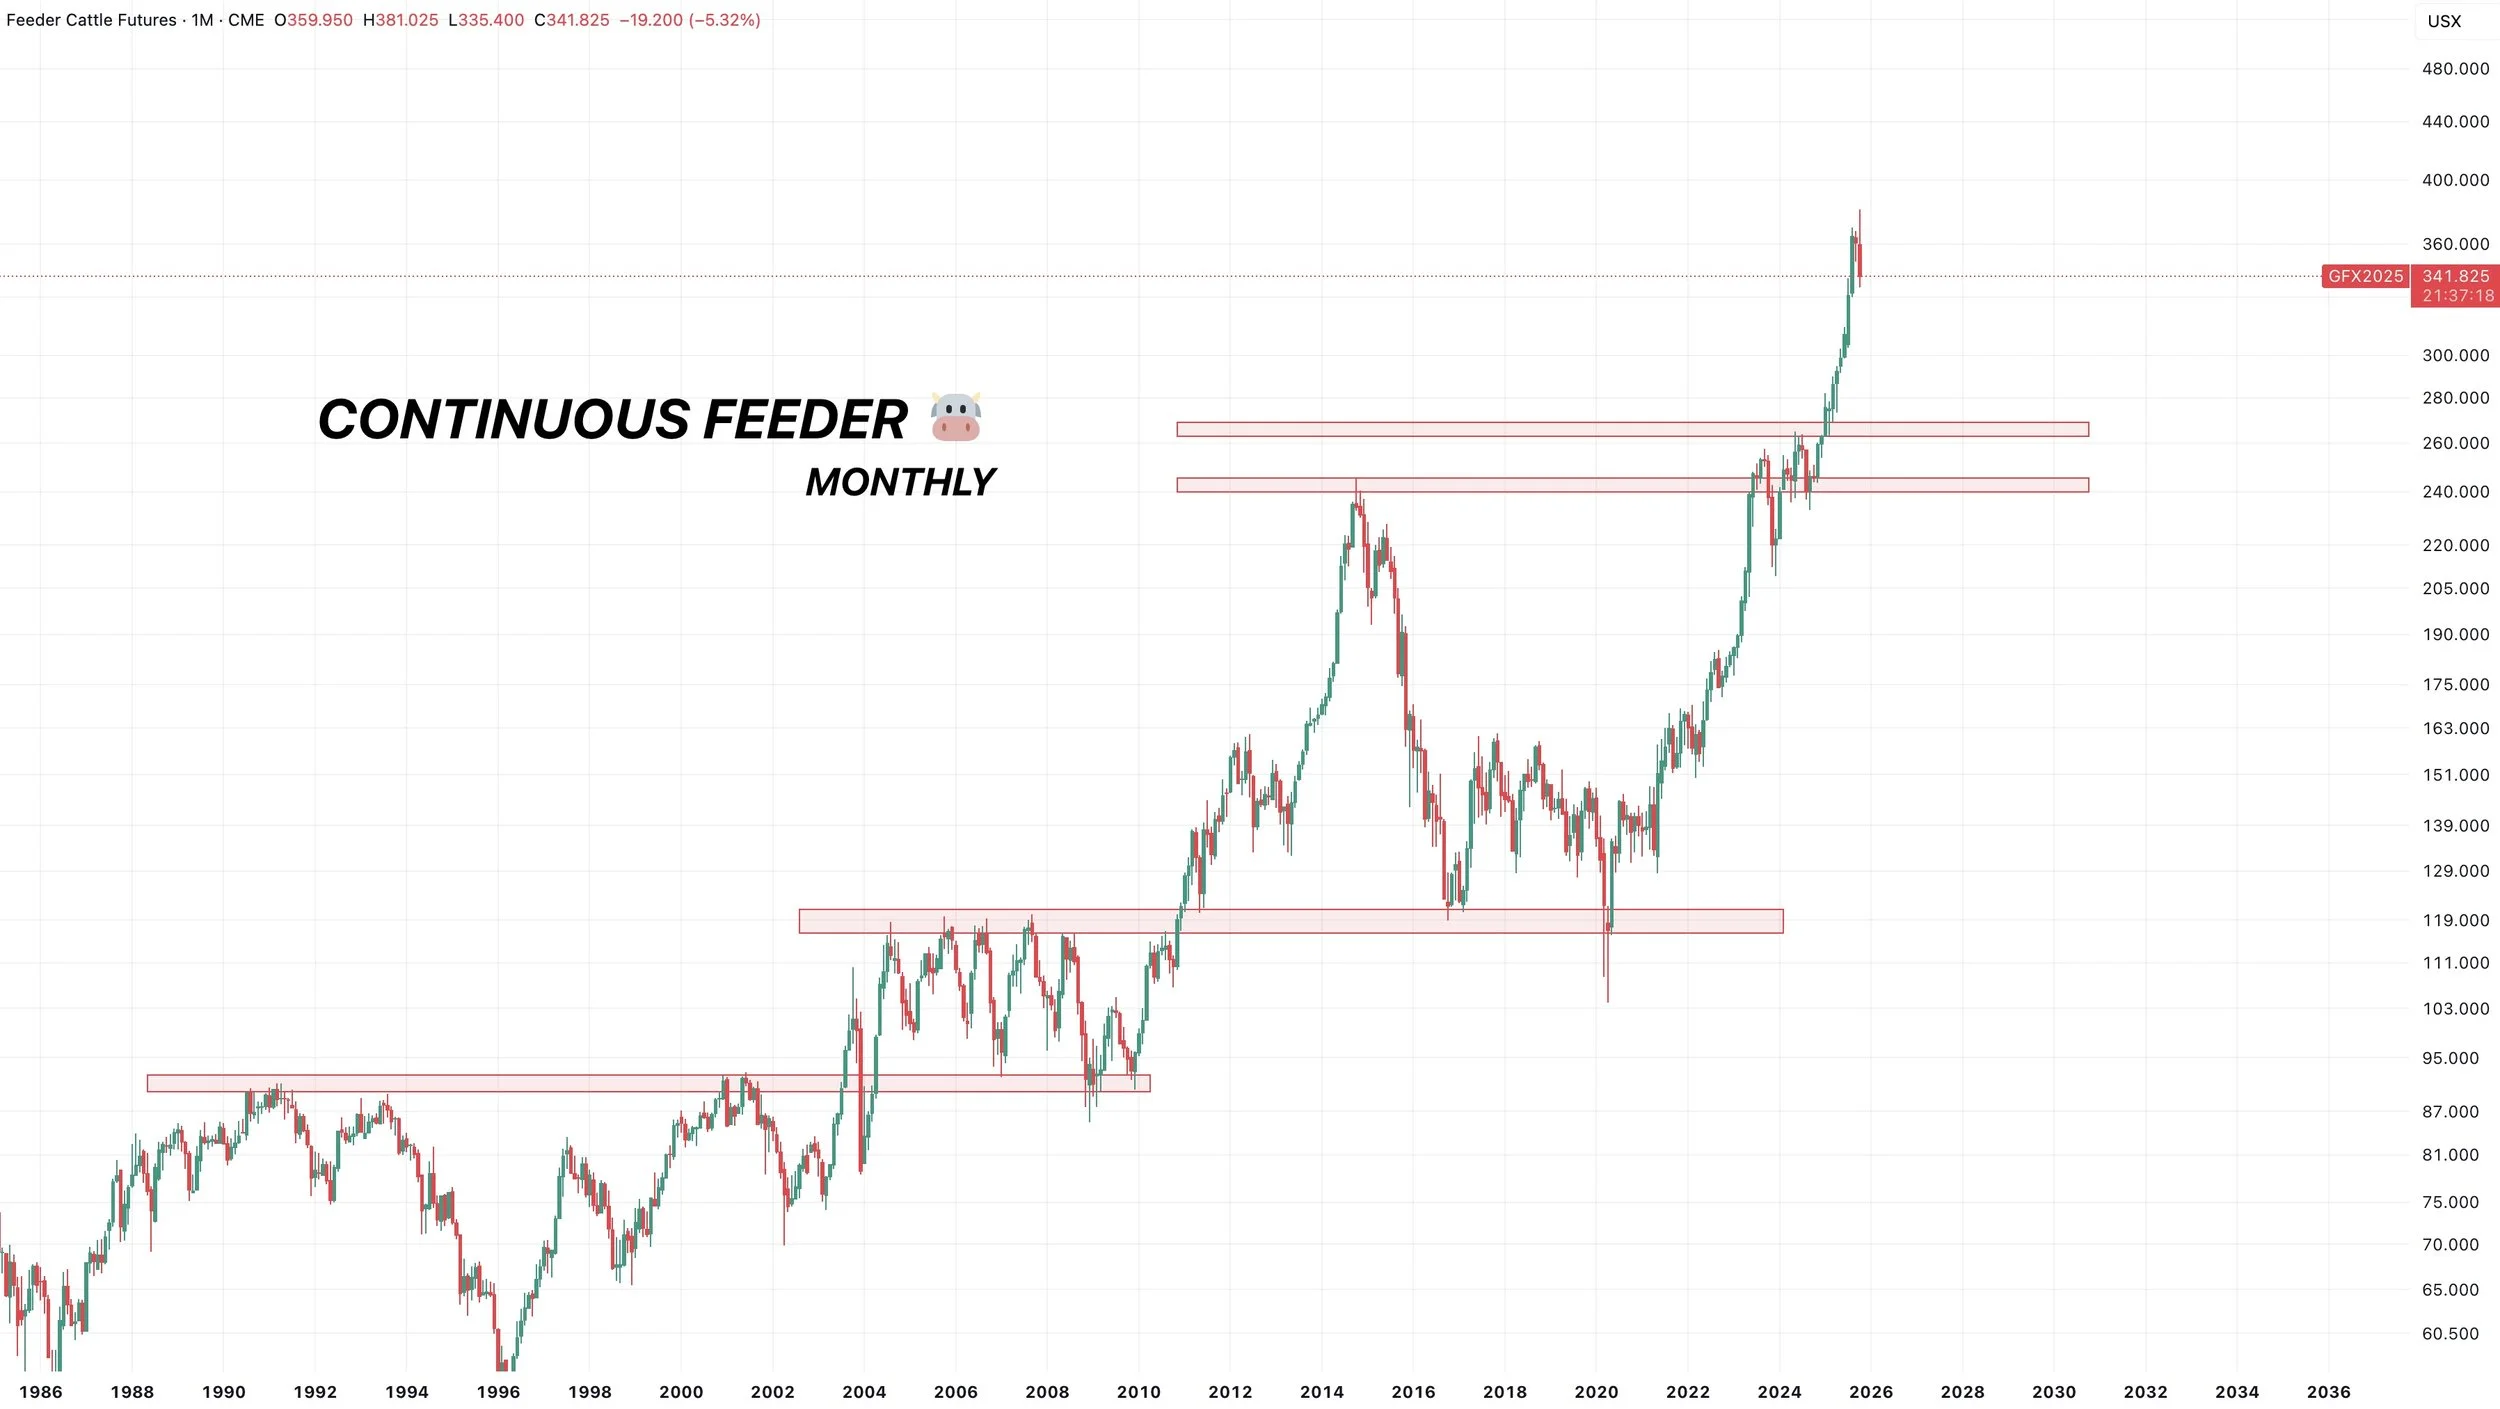
Past Sell or Protection Signals
Oct 28th: 🌽
Corn sell signal & hedge alert.
Oct 27th: 🌱
Soybean sell signal & hedge alert.
Oct 13th: 🐮
Cattle sell signal & hedge alert.
Aug 22nd: 🌱
Soybean sell signal & hedge alert.
July 31st: 🐮
Cattle sell signal & hedge alert.
July 10th: 🐮
Cattle sell signal & hedge alert.
CLICK HERE TO VIEW
June 5th: 🐮
Cattle sell signal & hedge alert.
June 2nd: 🌾
MPLS wheat sell signal.
April 10th: 🌽
Old crop corn sell signal.
March 19th: 🐮
Cattle hedge & sell signal.
Feb 18th: 🌽 🌾
Old crop KC wheat & old crop corn signal.
Jan 23rd: 🌽 🌱
Corn & beans old crop sell signal.
CLICK HERE TO VIEW
Jan 15th: 🌽 🌱
Corn & beans hedge alert/sell signal.
Jan 2nd: 🐮
Cattle hedge alert at new all-time highs & target.
Dec 11th: 🌽
Corn sell signal at $4.51 200-day MA
CLICK HERE TO VIEW
Oct 2nd: 🌾
Wheat sell signal at $6.12 target
Sep 30th: 🌽
Corn protection signal at $4.23-26
Sep 27th: 🌱
Soybean sell & protection signal at $10.65
Sep 13th: 🌾
Wheat sell signal at $5.98
May 22nd: 🌾
Wheat sell signal when wheat traded +$7.00
Want to Talk?
Our phones are open 24/7 for you guys if you ever need anything or want to discuss your operation.
Hedge Account
Interested in a hedge account? Use the link below to set up an account or shoot Jeremey a call at (605)295-3100.