
CHINA & SOYBEAN WHIPSAW
MARKET UPDATE
You can scroll to read the usual update as well. As the written version is the exact same as the video.
Timestamps for video:
Overview: 0:00min
Corn: 2:20min
Beans: 5:35min
Wheat: 12:20min
Cattle: 14:00min
Want to talk about your situation?
(605)250-3863
Black Friday Sale
Your Free Trial Has Ended
Subscribe so you don’t miss future updates or signals
Futures Prices Close

Overview
Grains higher across the board following Friday's post-USDA blood bath.
We had some rollercoaster action in soybeans the last few days.
Friday we closed down -22 cents.
Overnight today, we gapped open lower.
Trading as much as -10 cents lower.
We then went on to rally a massive +45 cents off the lows today.
Closing the day up +33 cents. Which is the largest daily gain of the entire year.
Soybean 15 Minute Chart

So what happened?
Like we talked about Friday, the USDA itself wasn’t bearish. If anything it was neutral to perhaps even a tad friendly.
Production came in lower than expected. US and world carryout both came in lower than expected as well. Yet.. we sold off.
The reason we sold off on Friday was because we received export sales data.
That data disappointed.
As it showed that China had not been buying.
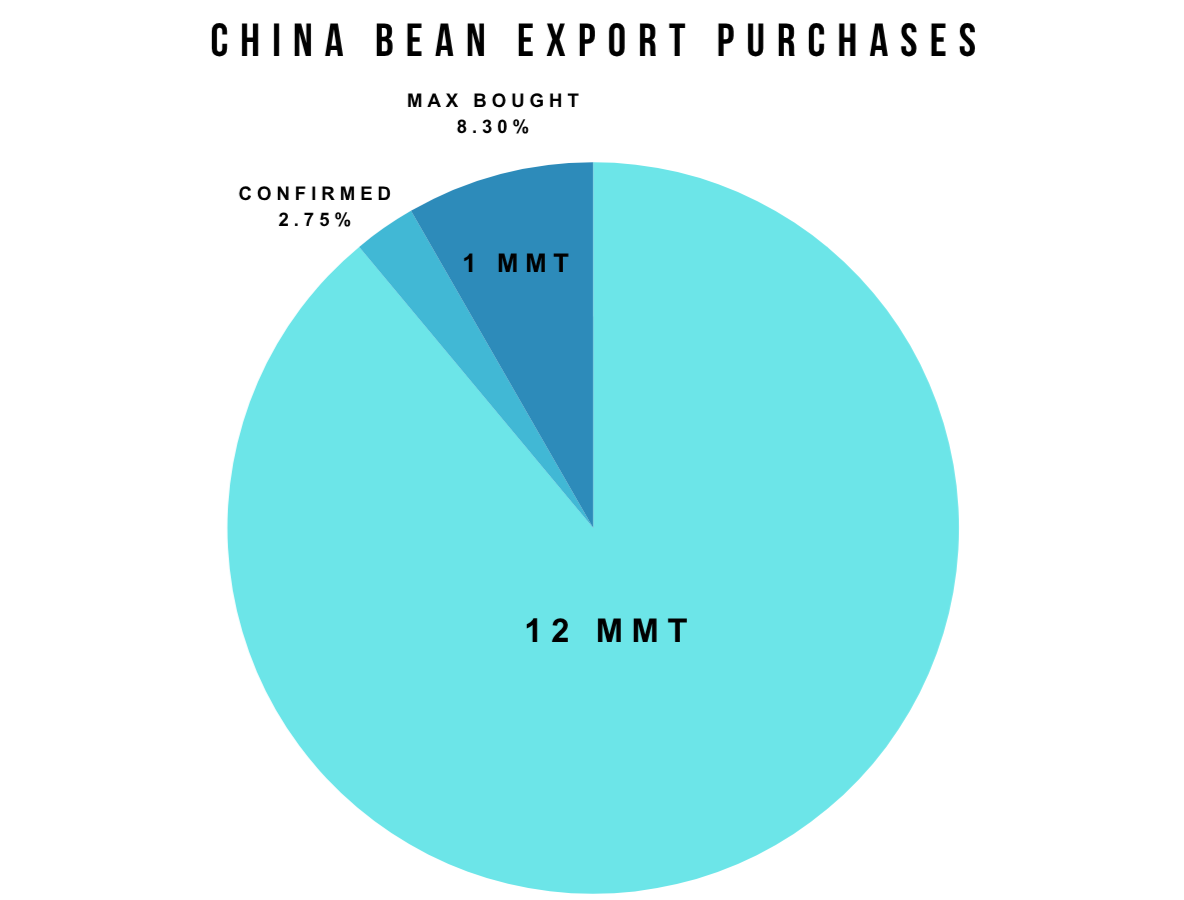
China agreed to buy 12 million metric tons.
The export sales showed that China had only bought a confirmed 332k metric tons.
Which is less than 3% of what they agreed to buy this year with time running out.
There was 616k metric tons to unknown, which "could" be China but isn’t a confirmed number. Which means the maximum number of soybeans China could’ve possibly bought was right arounf 1 million metric tons.
Which is only 8.3% of the 12 million they agreed to buy.
Why did we rally today?
We had a few pieces of news come out.
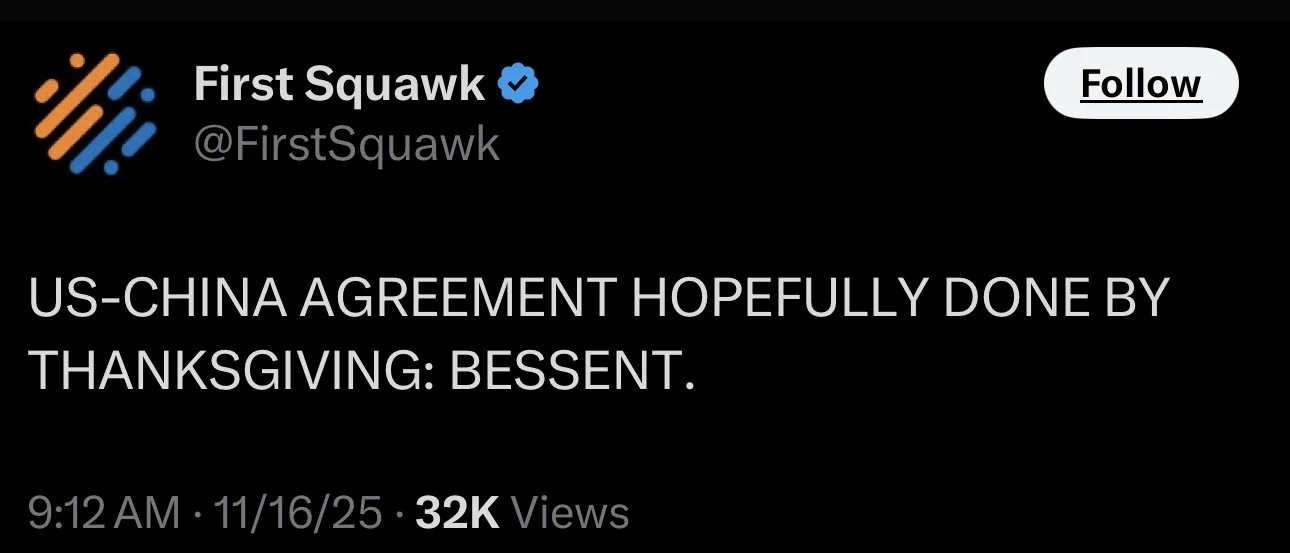
Last night, Bessent said that we would hopefully have a US and China agreement by Thanksgiving.
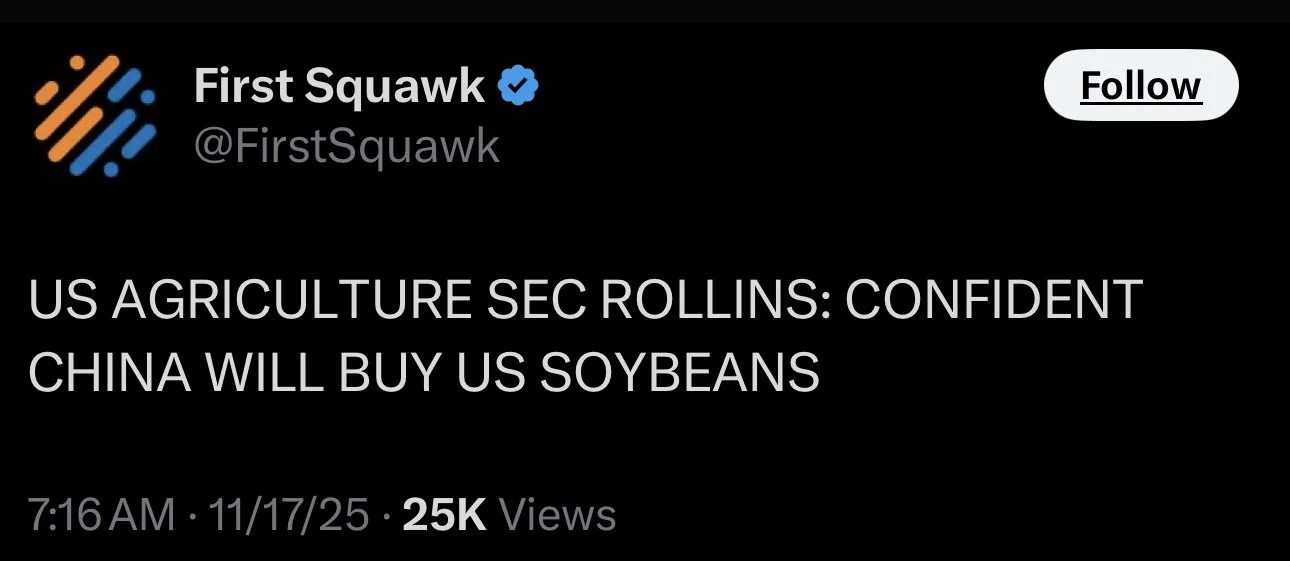
This morning, US Ag Secretary Rollins said she was:
"Confident China will buy US soybeans."
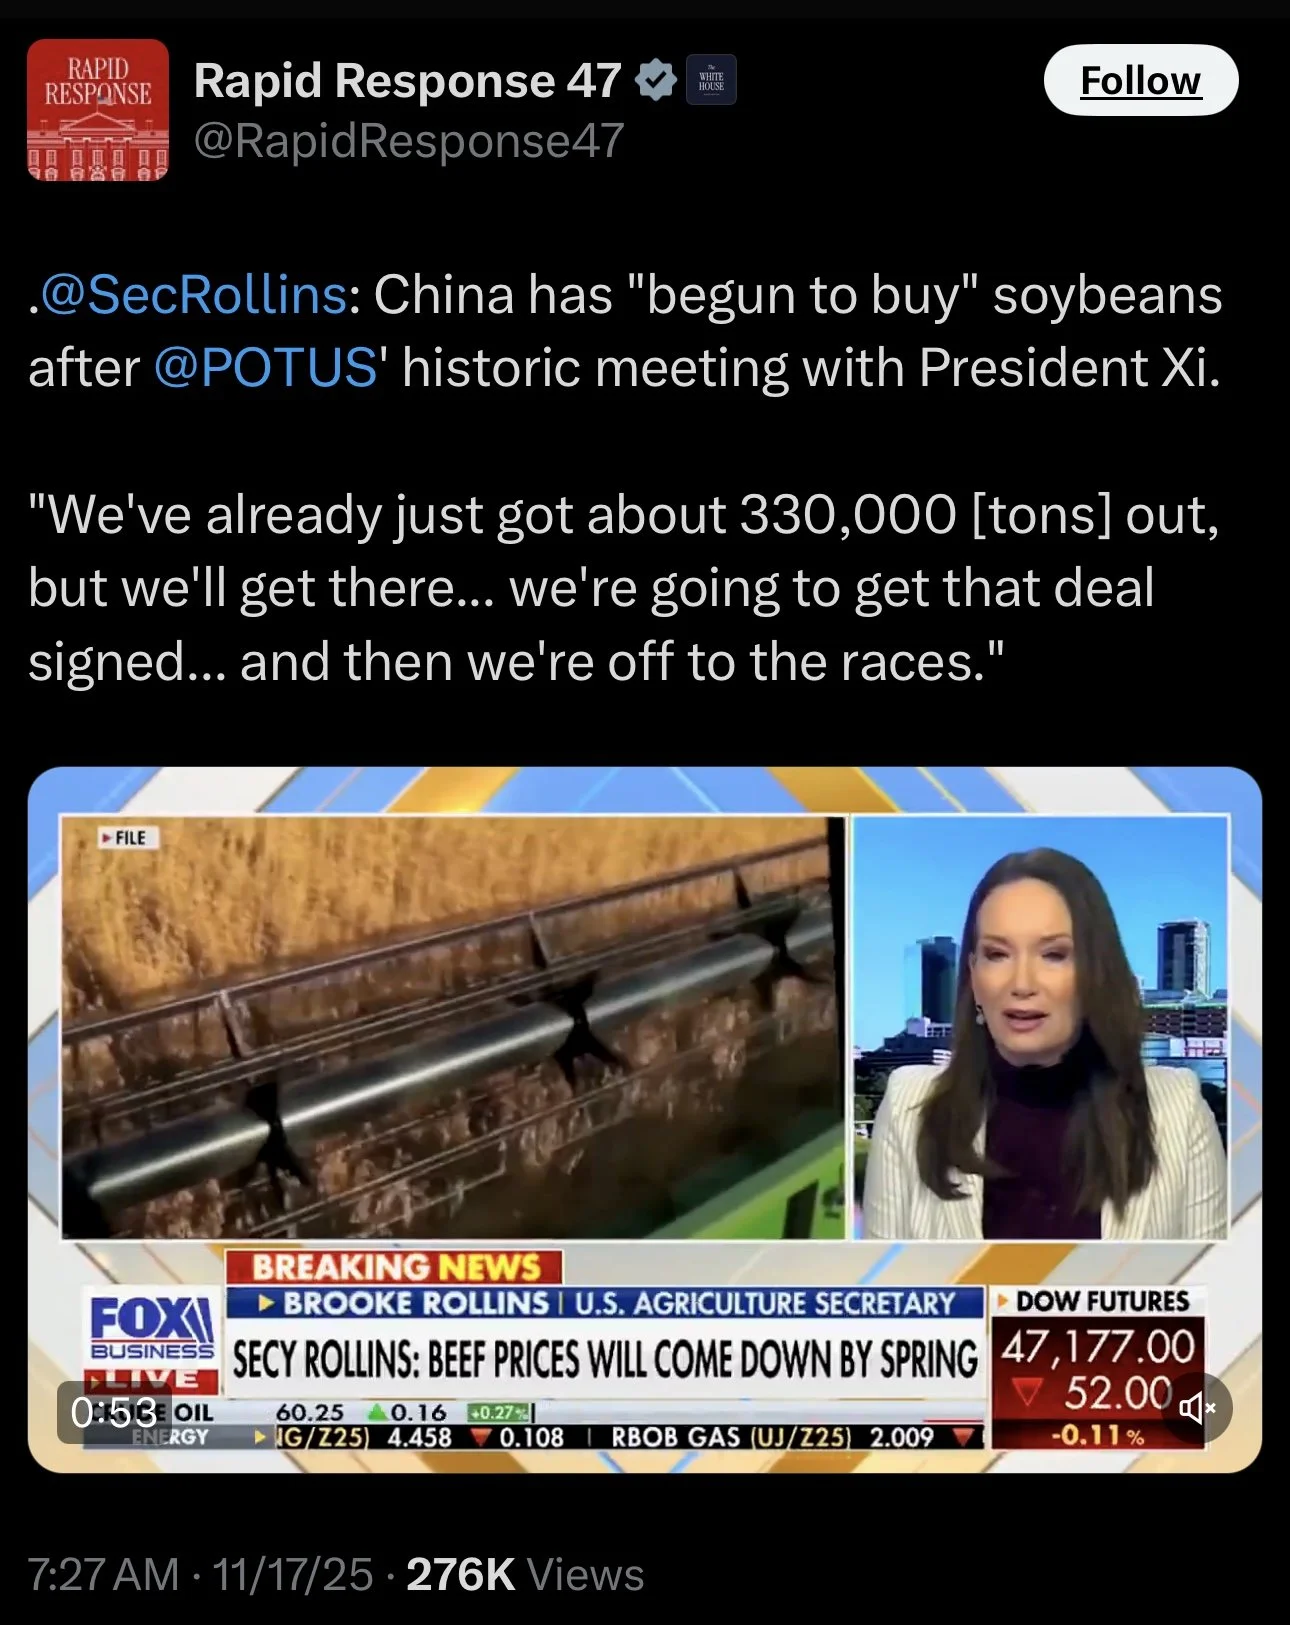
She also said:
"We've already just got about 330k tons out, but we'll get there.. we're going to get that deal signed.. and then we're off to the races."
So Friday we sold off because it looked like China hadn’t been buying and traders were worried they wouldn’t be able to meet that 12 million metric tons.
Today we are rallying because optimism of China buying soybeans has returned.
Today we also saw a -100k metric ton sale of soybeans to China cancelled.
The market seems to not care because 100k isn’t really that much when they are suppose to buy 12 million.
Today's Main Takeaways
Corn
Fundamentals:
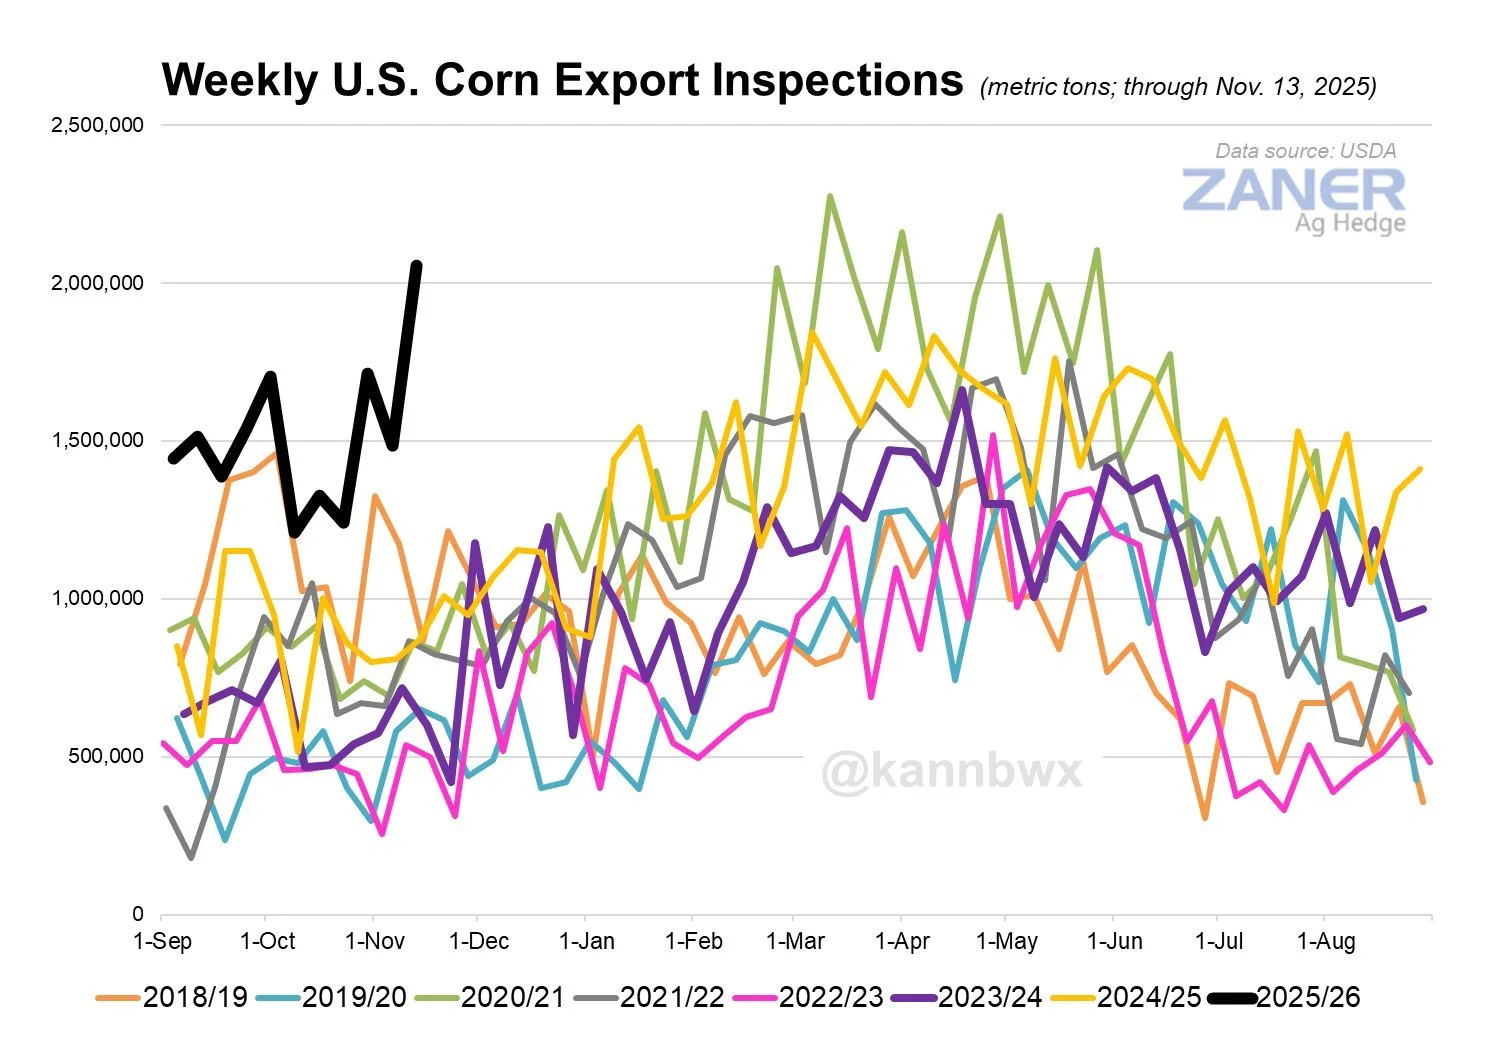
Today we saw some monster corn export inspections.
This is the 6th best week on record, and the best since 2021.
With zero business to China.
Cleary, corn demand isn’t slowing down.
Here is a seasonal chart from Karen Braun.
We are well above previous years.
Here is another great graphic from the Brock Report.
Corn export inspections are up +72% vs last year.
They are up a massive +116% vs the 5-year average.
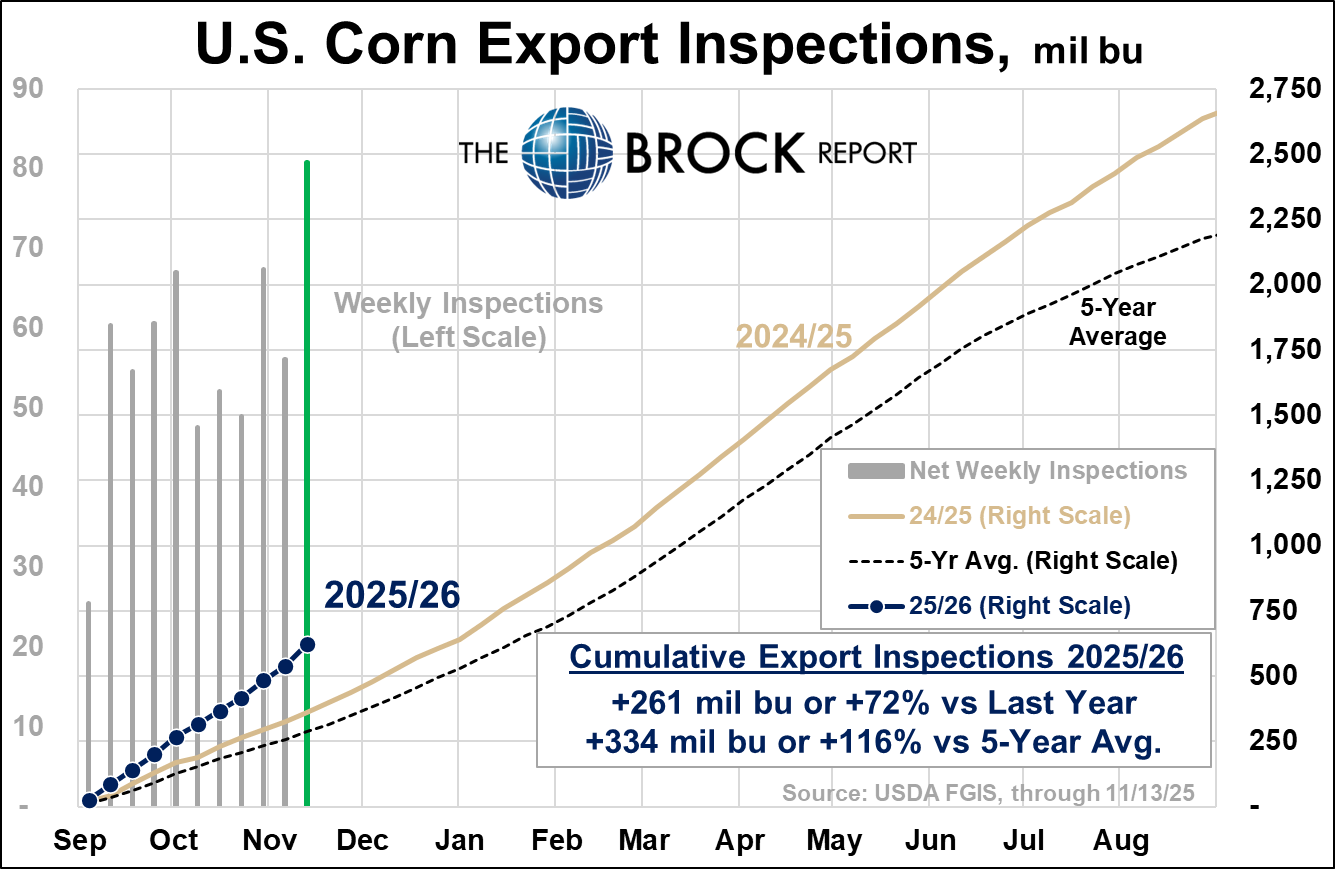
Demand is the number one reason you can’t get bearish on the corn market.
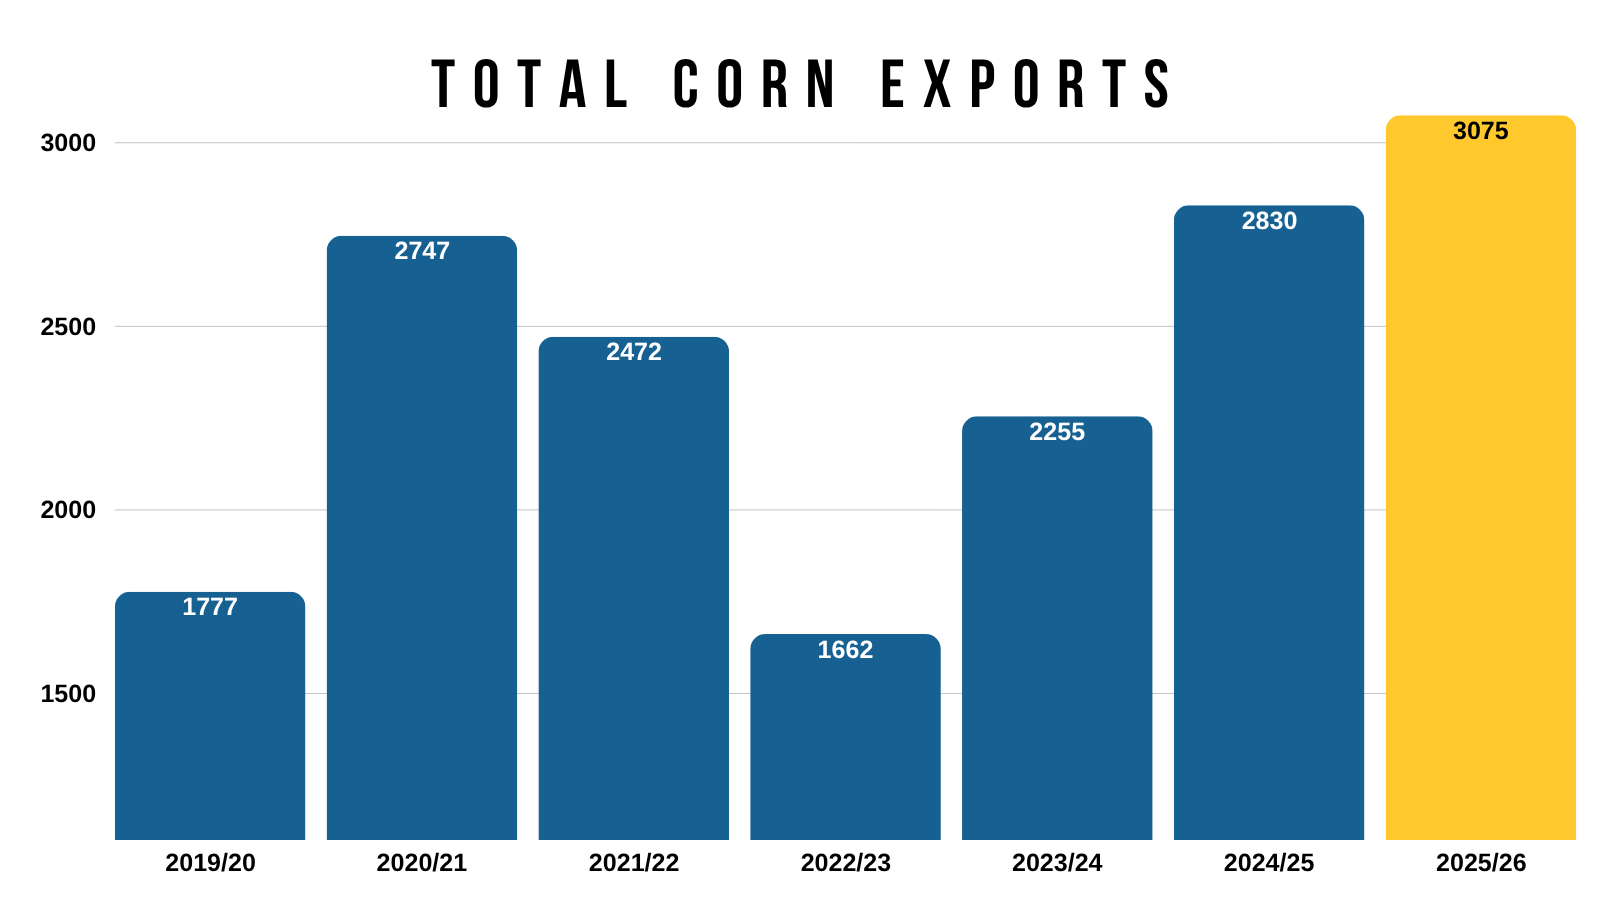
We are going to have record production no matter where yield comes in at.
However, export projections are up over +30% compared to the last time we saw record production back in 2023.
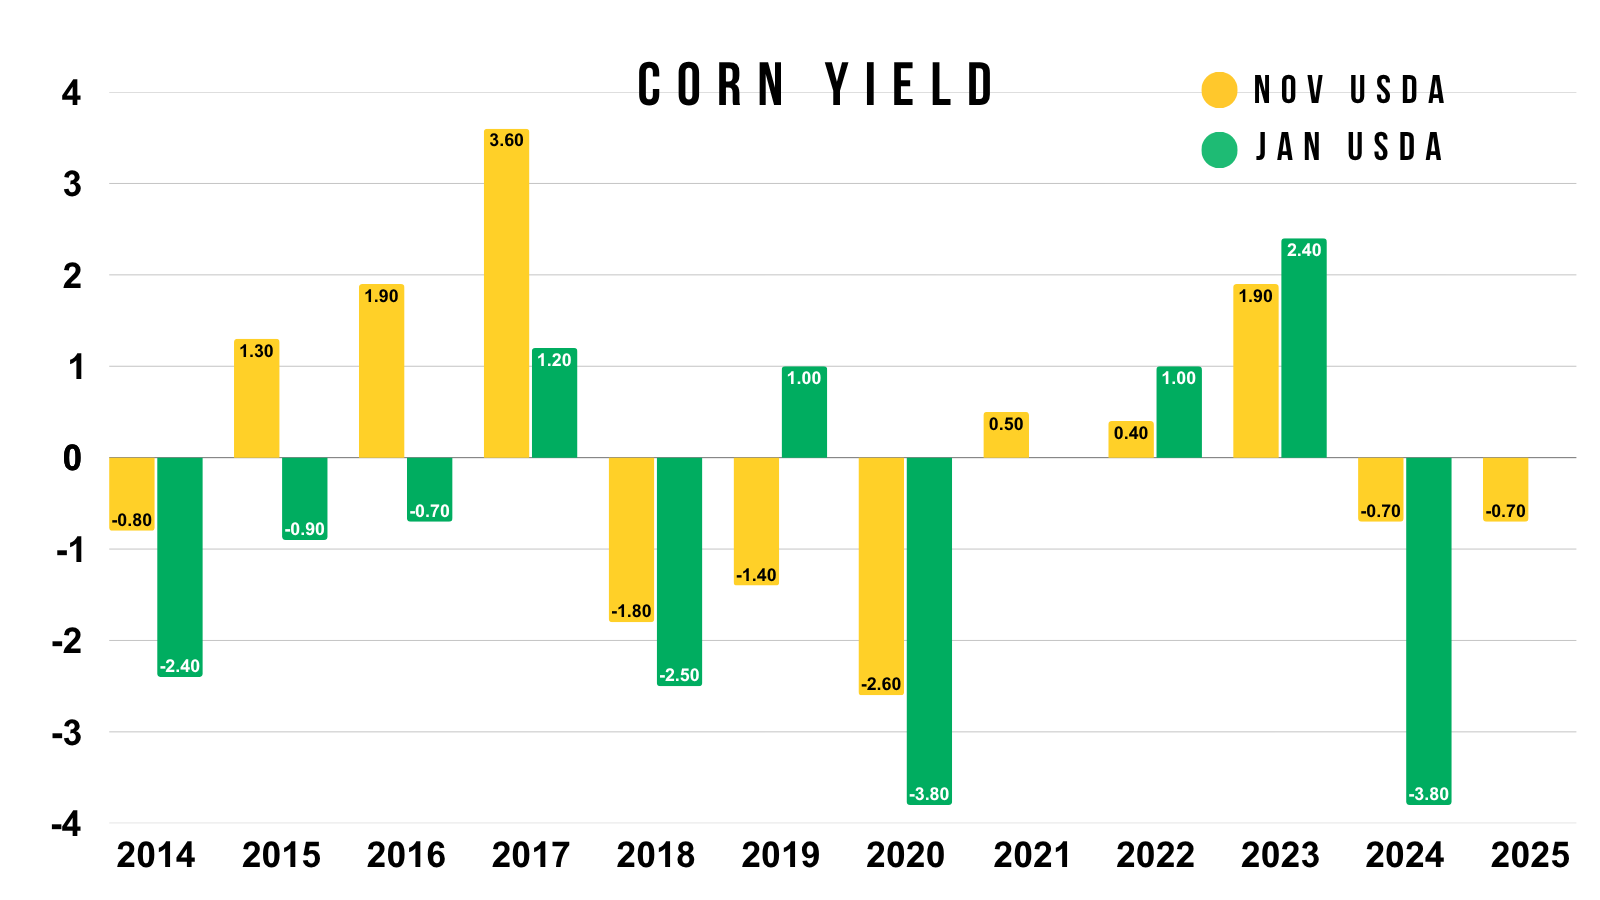
I don’t think there is any chance we don’t see yield fall further in January.
Outside of 2019, every time we've seen a yield cut in November it was followed by an even bigger yield cut in January.
The average cut in January the past decade is -3.12 bpa.
The largest we've seen this decade was 2020 and last year. Both saw -3.80 bpa cuts.
The issue is that for us to get a 180 yield, we'd have to see a -6 bpa cut. Which doesn’t usually happen.
As the average cut puts us at 183.
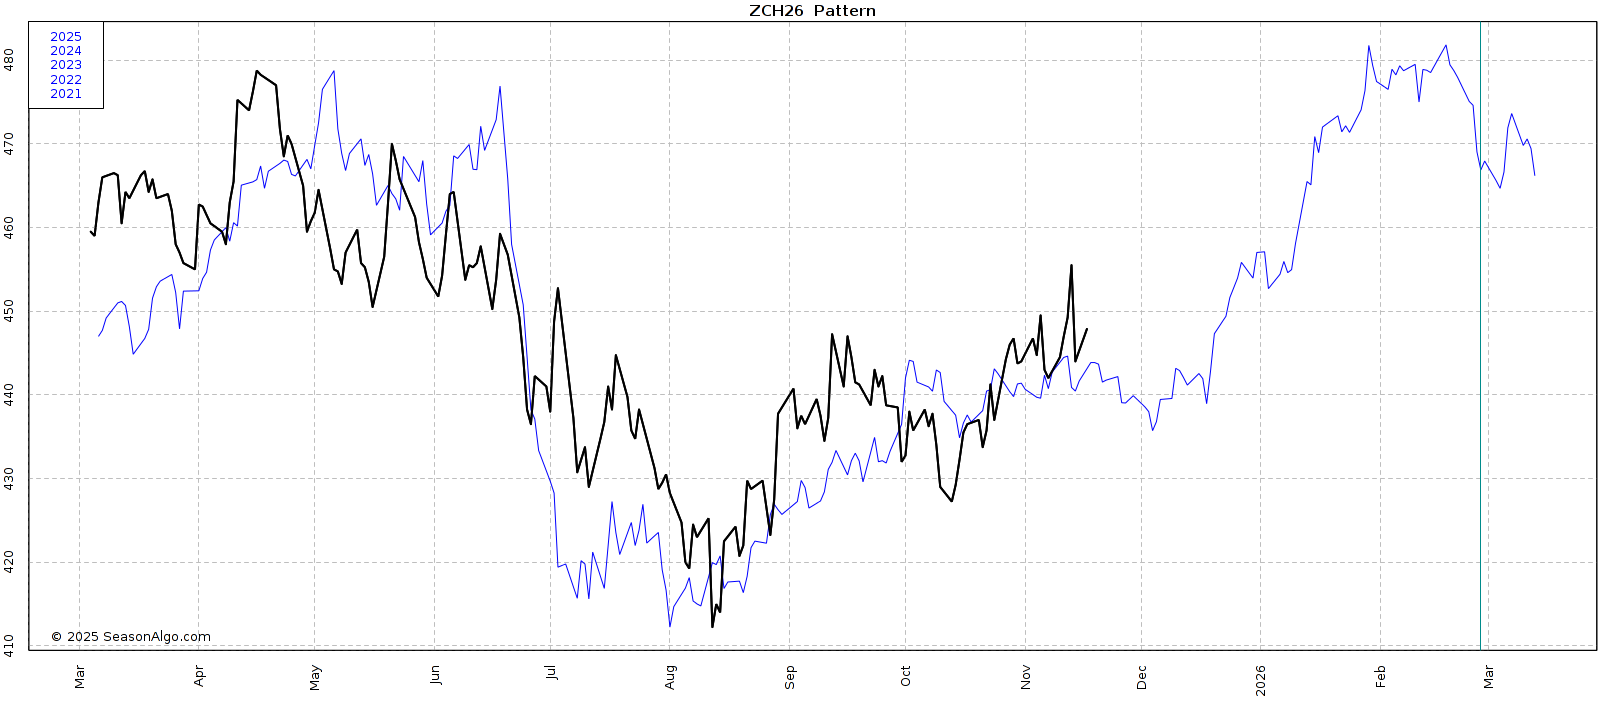
I've shown this chart countless times but I'm still watching this pattern of March-25 vs March-26 corn.
The two years are still tracking pretty closely.
Last year, the real run started in December.

Here is the 5-year seasonal for March corn.
This suggests higher into next year as well.
This seasonal has the top at around $4.80 in February.
We topped at $5.04 in February last year.
For those that think we will continue to track last year's price action, give Jeremey a call as he some options strategies that will perform very well if we do.
Jeremey: (605)250-3863
Technicals:
Dec Corn
The USDA spoiled the breakout we had.
Ultimately, bulls want to hold the red box to keep the short term bias remaining higher. As that would be a standard correction from the recent rally (50-61.8%).
The September correction bottomed at that same 50-61.8% level (orange box).
If we get consective closes above the 200-day, it could spark further upside.
Since we alerted a sell signal and hedge alert at that $4.35 resistance a few weeks ago, our next target to take risk off the table is $4.55
That is 161.8% of the contract low to September rally. Known as the golden fib and a common spot for a 2nd rally to stall.

March Corn
Same story in March corn.
Need to hold the red box ideally.
Break above the 200-day MA and I'd like to think we see further upside.
The next target is $4.73, which is 161.8% of the original rally off contract lows.

Soybeans
Today's Sell Signal & Hedge Alert:
Today we did offically alert our first sell signal since we tapped those yearly highs +80 cents or so ago.
We have been very very patient on selling soybeans this year. This was only our 3rd sell signal since January.
The last two were at the August highs and then a few weeks ago when we hit yearly resistance.
Here is the link in case you missed it: CLICK HERE
Below is a visual of our signals:

Do I think soybeans have more upside? Yes I do.
It simply makes sense to take a little risk off the table following the size of rally we've seen.
Especially if you have DP, basis contracts, or know you are going to have to move soybeans by the end of the year.
If you have more time on your hands, you have more flexibility and do not have to be as proactive as someone who is in one of those scenarios.
Our advice was to do one of the following:
Buy a put. This protects you and gives you a floor while keeping your upside open. If prices go lower, your put makes money. If prices go higher, you only lose out on the cost of your put.
Sell some grain and buy a call. This gives you a worst case scenario while also keeping your upside open. If we go lower, you only lose the cost of your call. If we go higher, your call makes money.
If you do not have a hedge account, you could simply make an incremental sale.
We prefer to use options. Because both of these strategies keep our upside open in the event that prices continue to go higher. My personal bias leans higher so I want to keep my upside open.
I don’t think the top is in. It simply makes sense for most to have some downside protection following a $1.50 rally.
I am not getting carried away here at all. I do not want to be oversold if soybeans go to $12 or higher like I've been stating on each of these signals.
Fundamentals:
Some people are bearish because China hasn’t bought many beans. They think that they won’t.
Some people are bullish because China hasn’t bought many beans. What happens if they do?
If they really are going to buy the amount they agreed to, that means they have a lot of catching up to.
Soybeans have rallied this much on the "rumor" and perception of China buying beans. You can only imagine what happens if they do.
Bears argue, "Why would China buy US soybeans if Brazil's beans are cheaper?"
Which is a valid question. But in the grand scheme of things, soybeans are a small fraction of the deals they are going for. Essentially a drop in the bucket compared to the other deals. Soybeans are a bargaining chip for them to reach other deals.
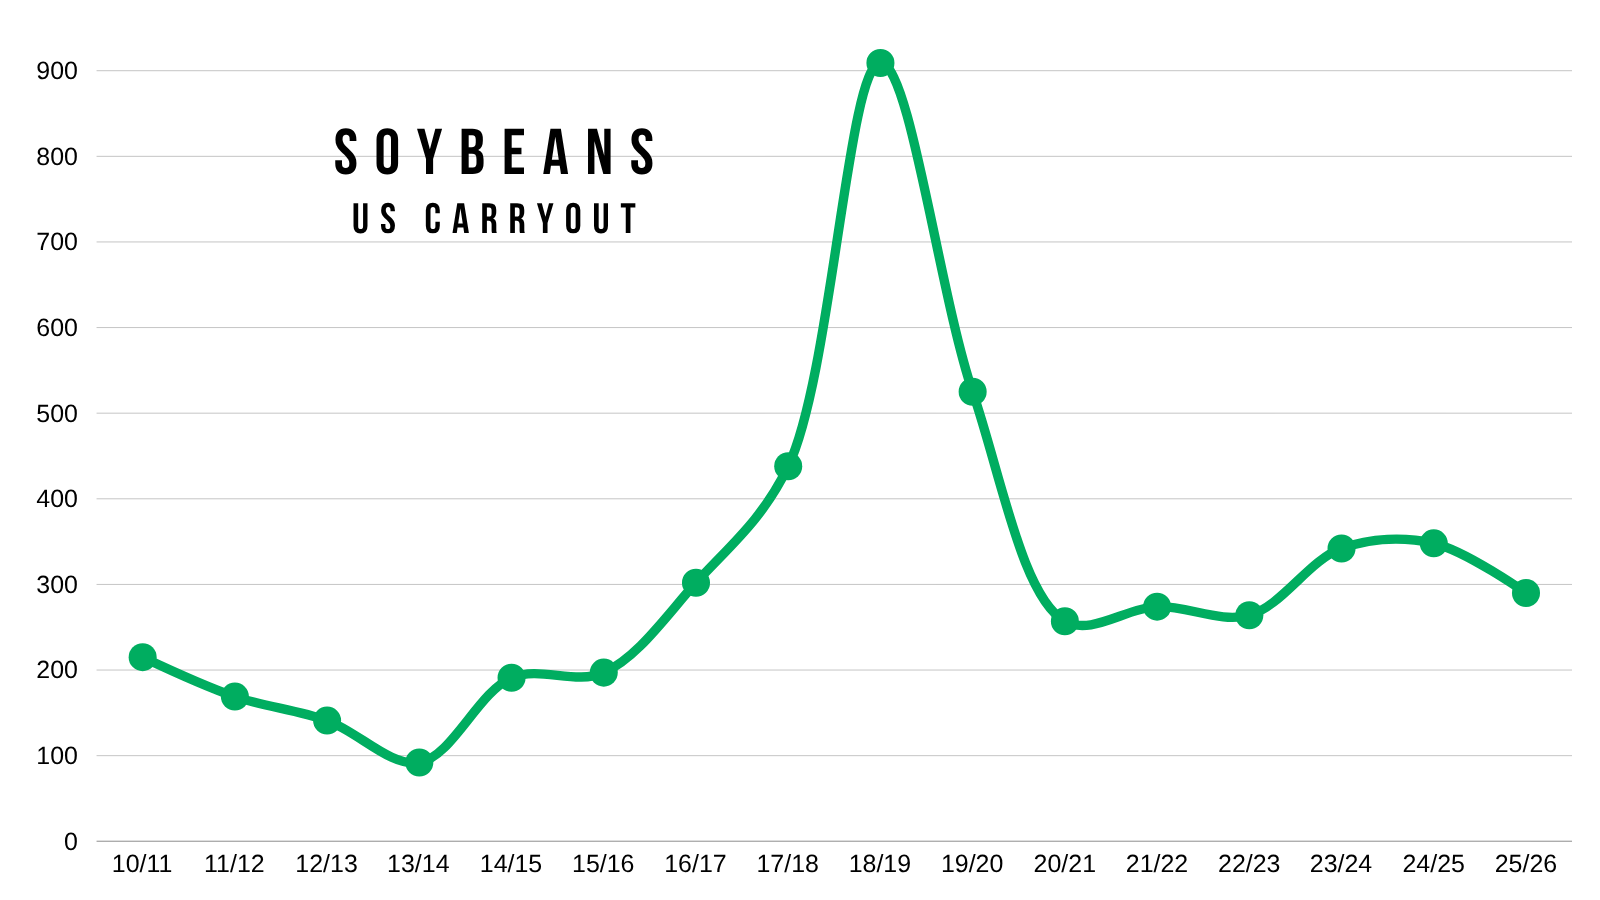
Then we also have the US supply situation.
If demand is fine, we aren’t swimming in soybeans.
Even with a 53 bpa yield, our carryout is the tightest it's been in 3 years.
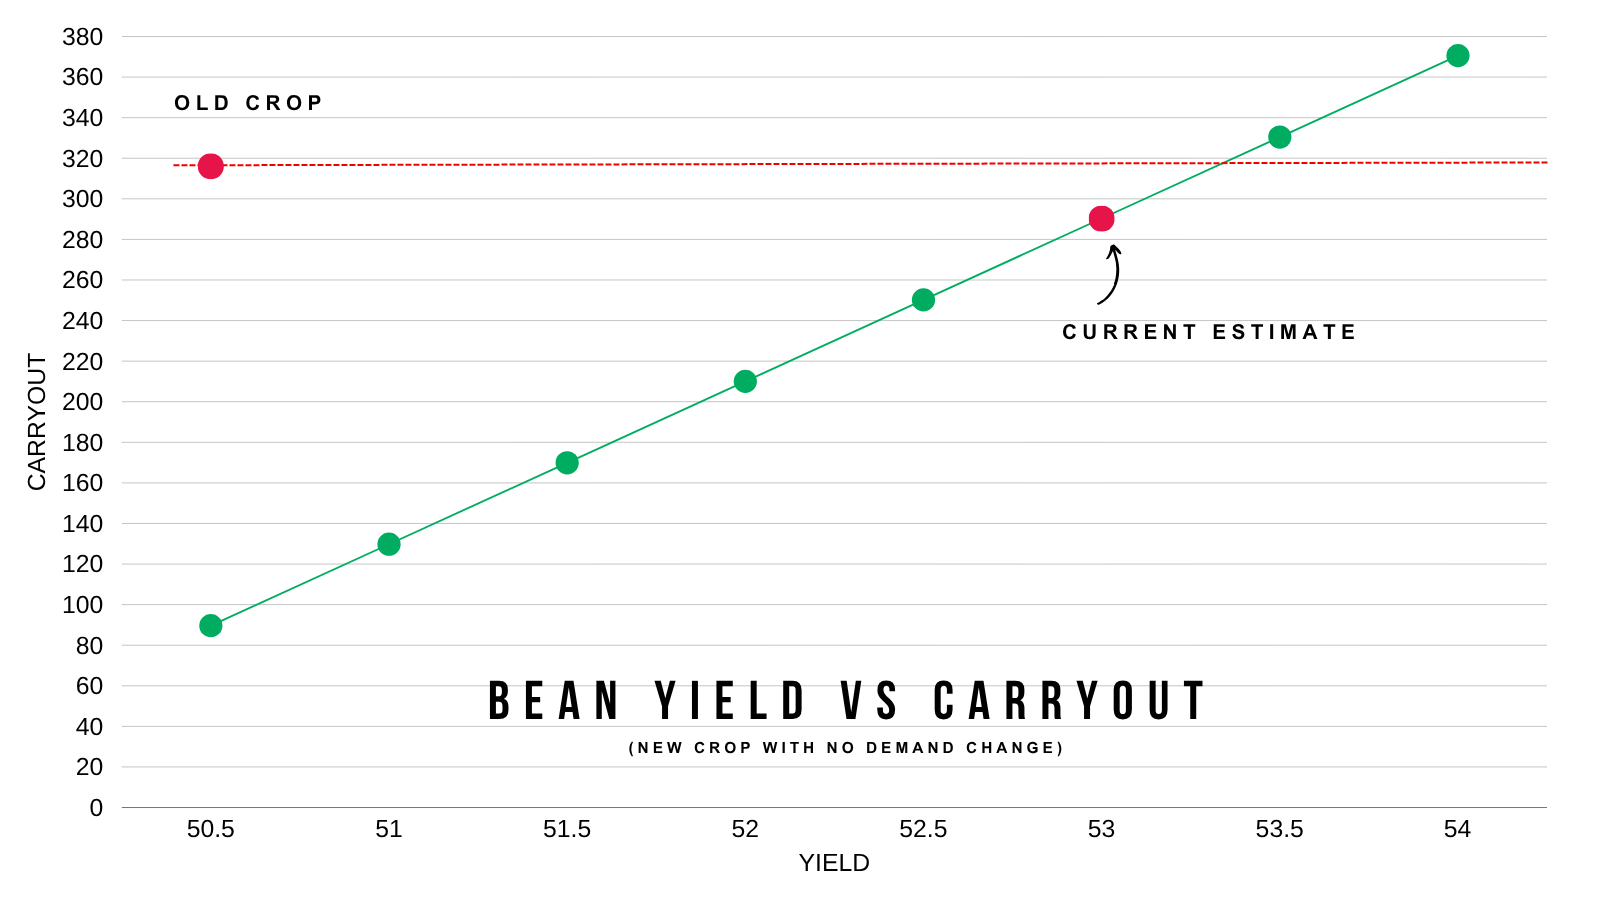
Here is a chart that shows you how yield effects carryout.
This uses the current demand projections and does not take into account changes to demand. If supply drops, the USDA will offset some of that loss by cutting demand. It won’t actually be linear.
But this gives you a clear picture at just how tight the room for error really is like we've been talking about all year long.
The other big factor is Brazil.
What happens if they run into a weather issue?
An issue with their crop would have a much larger impact on the world soybean situation than if we had an issue in the US.
If Brazil runs into an issue, that could also force China to have to buy even more soybeans from the US.
A problem in Brazil is one of the ways you could run into an extremely bullish market. Such as $13 to $14 beans. I am not saying that will happen. I am saying that is the possibility IF Brazil has an issue.
We already have the 2nd lowest acres of the last decade here in the US. Things would get very interesting if Brazil ran into a production hiccup.
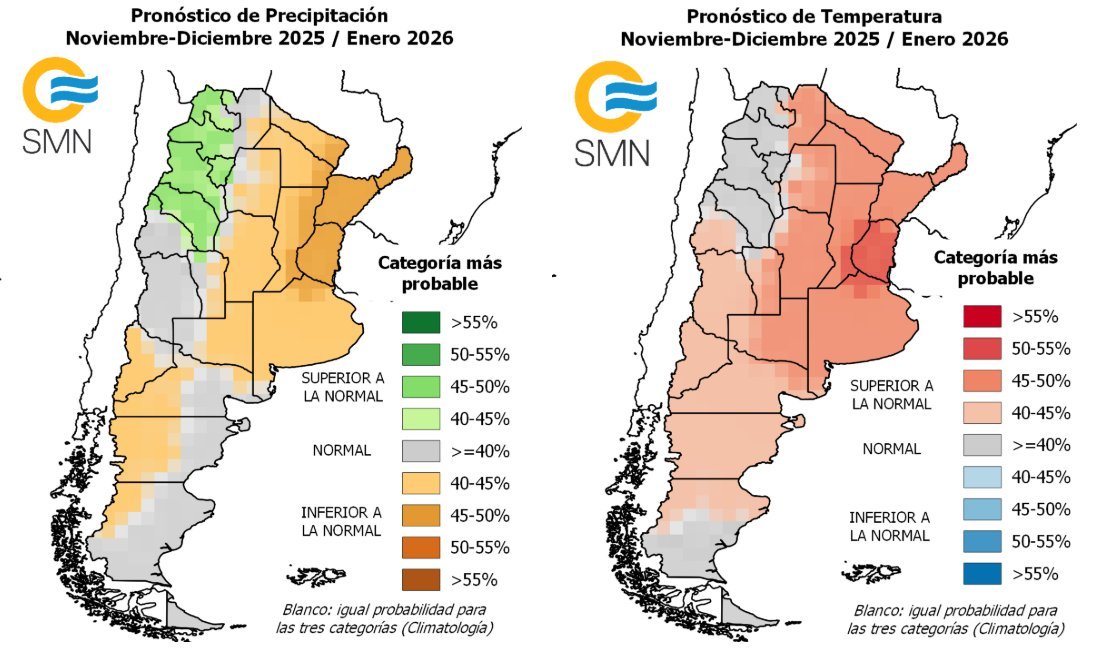
Here is their outlook for November and December. It does appear to be slightly on the dry and warm side, but too early to call for any sort of scare.
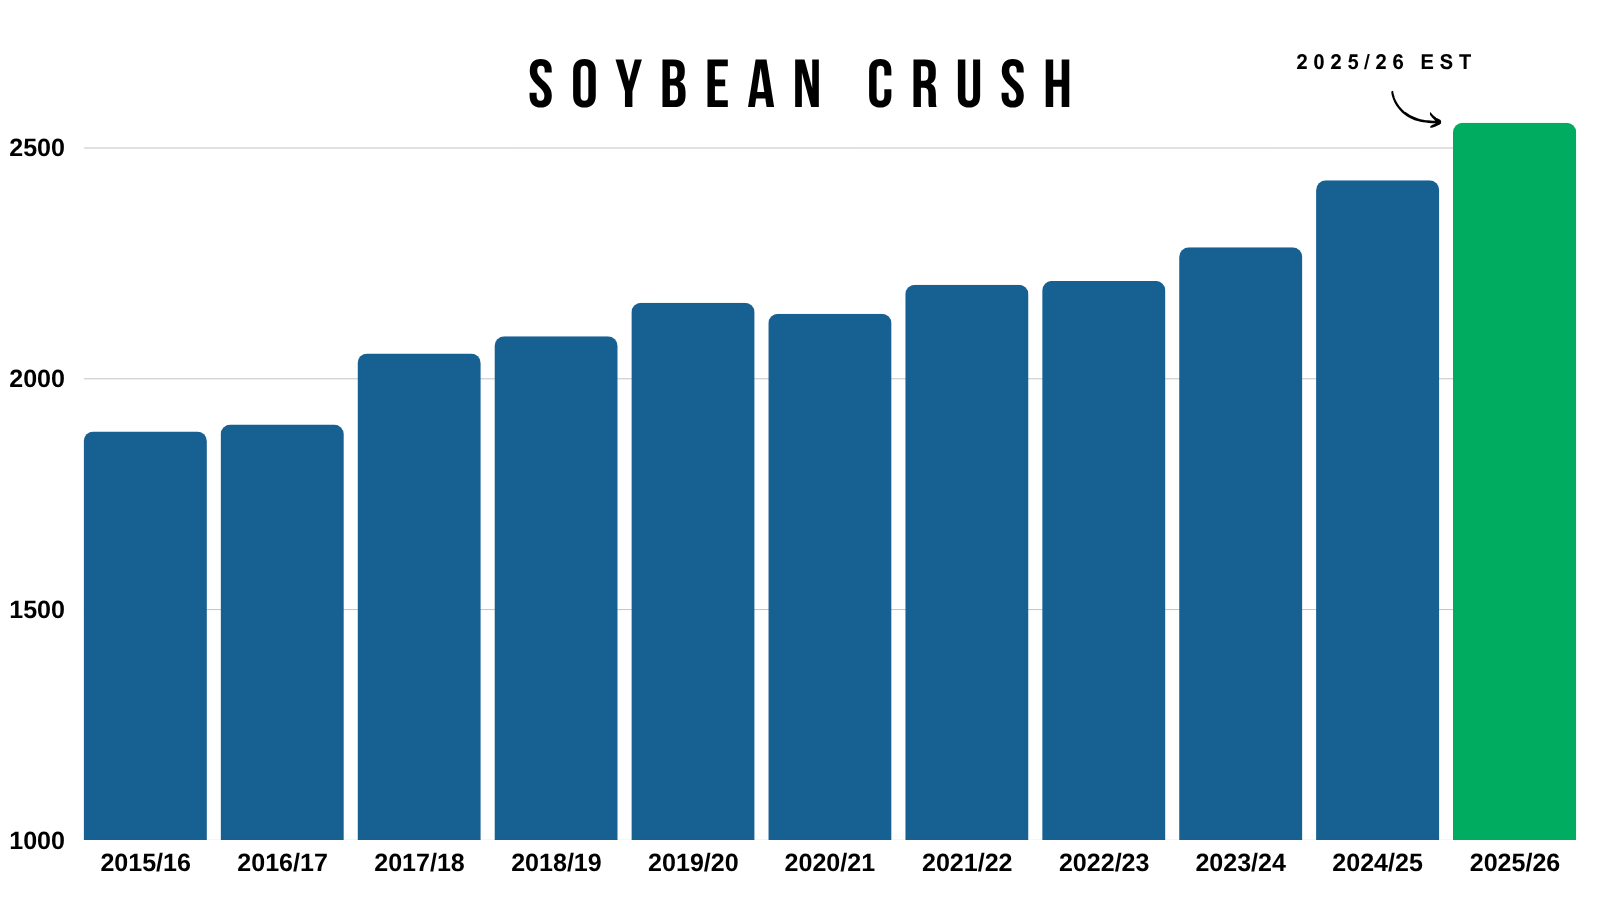
Domestic crush demand is also one of the friendliest factors that seems to be flying under the radar.
Crush demand is +200-300 million bushels more than the last time China bought as many soybeans as they've agreed to buy.
Meaning we have an extra +200-300 million bushels of demand compared to the last time China bought as many soybeans as they've agreed to buy over the next few years.
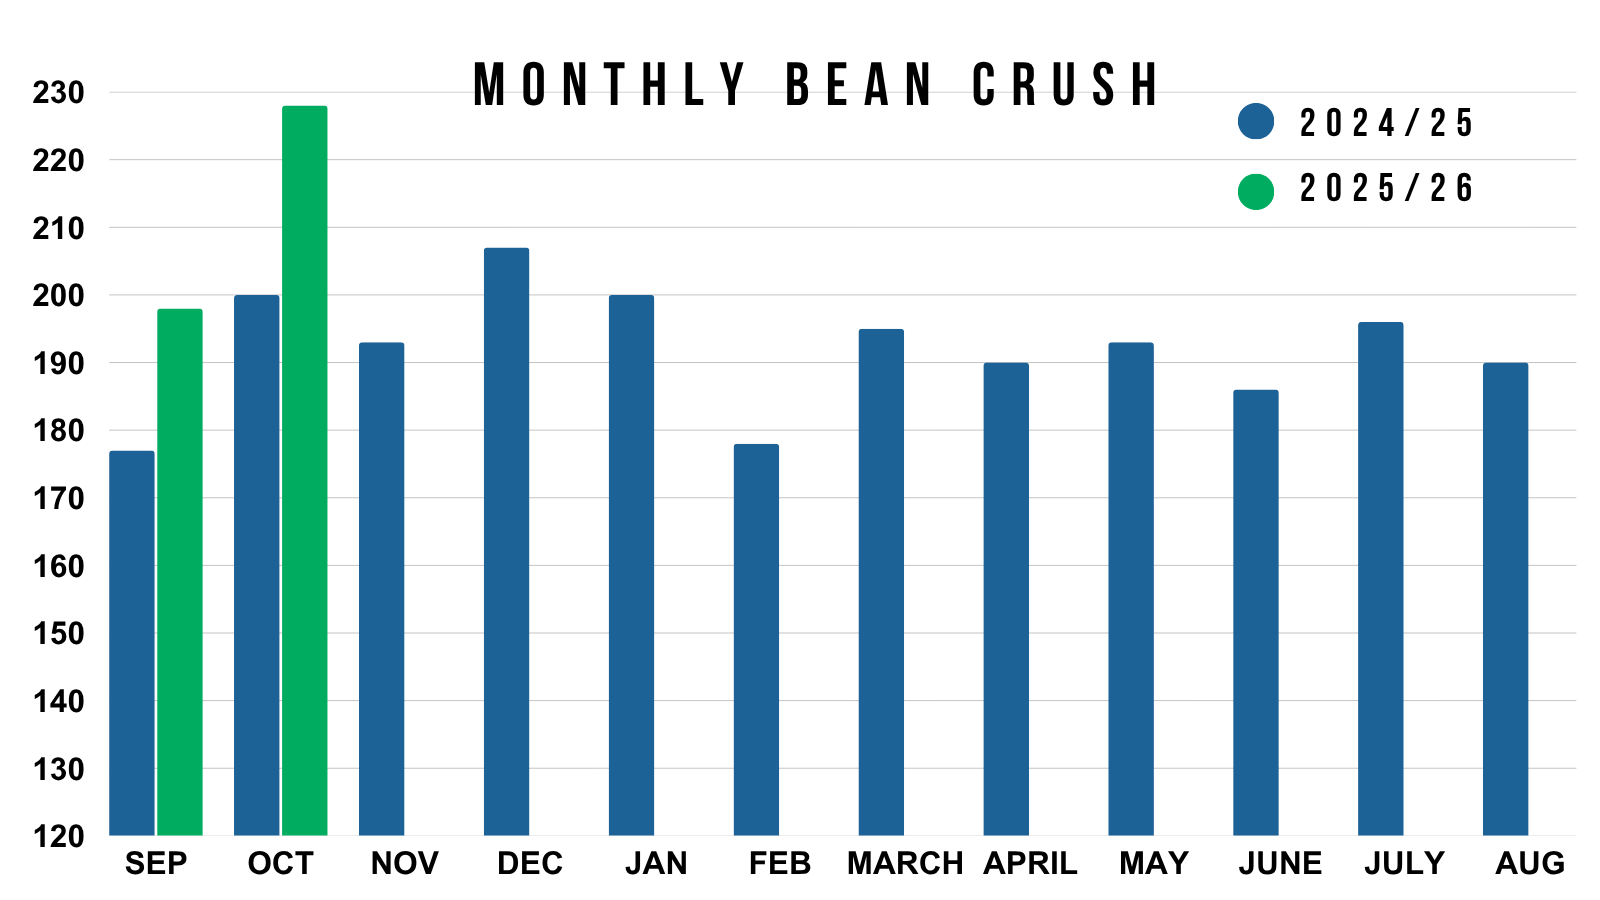
NOPA crush was phenomenal today.
The October number shattered the record for any month by +10 million bushels.
It was the best October by +28 million bushels. Which is a +12% record for the month.
Technicals:
Jan Beans
The chart looks good.
The reason for the sell signal & hedge alert today was that we hit our first target.
That target was $11.55 as it reclaimed 61.8% of the contract highs.
Our next target is right around $12.00
As the next fib level is the 78.6% level at $12.05
Friday we posted an outside down day. Today we posted an outside up day. Trading below Friday's lows but closing above the highs.
That signal and hedge alert is not us saying to go and try to speculatively short soybeans. I would not speculatively short this market as I see the potential for further upside.

I personally think we have a very solid chance at seeing $12.00.. perhaps even higher.
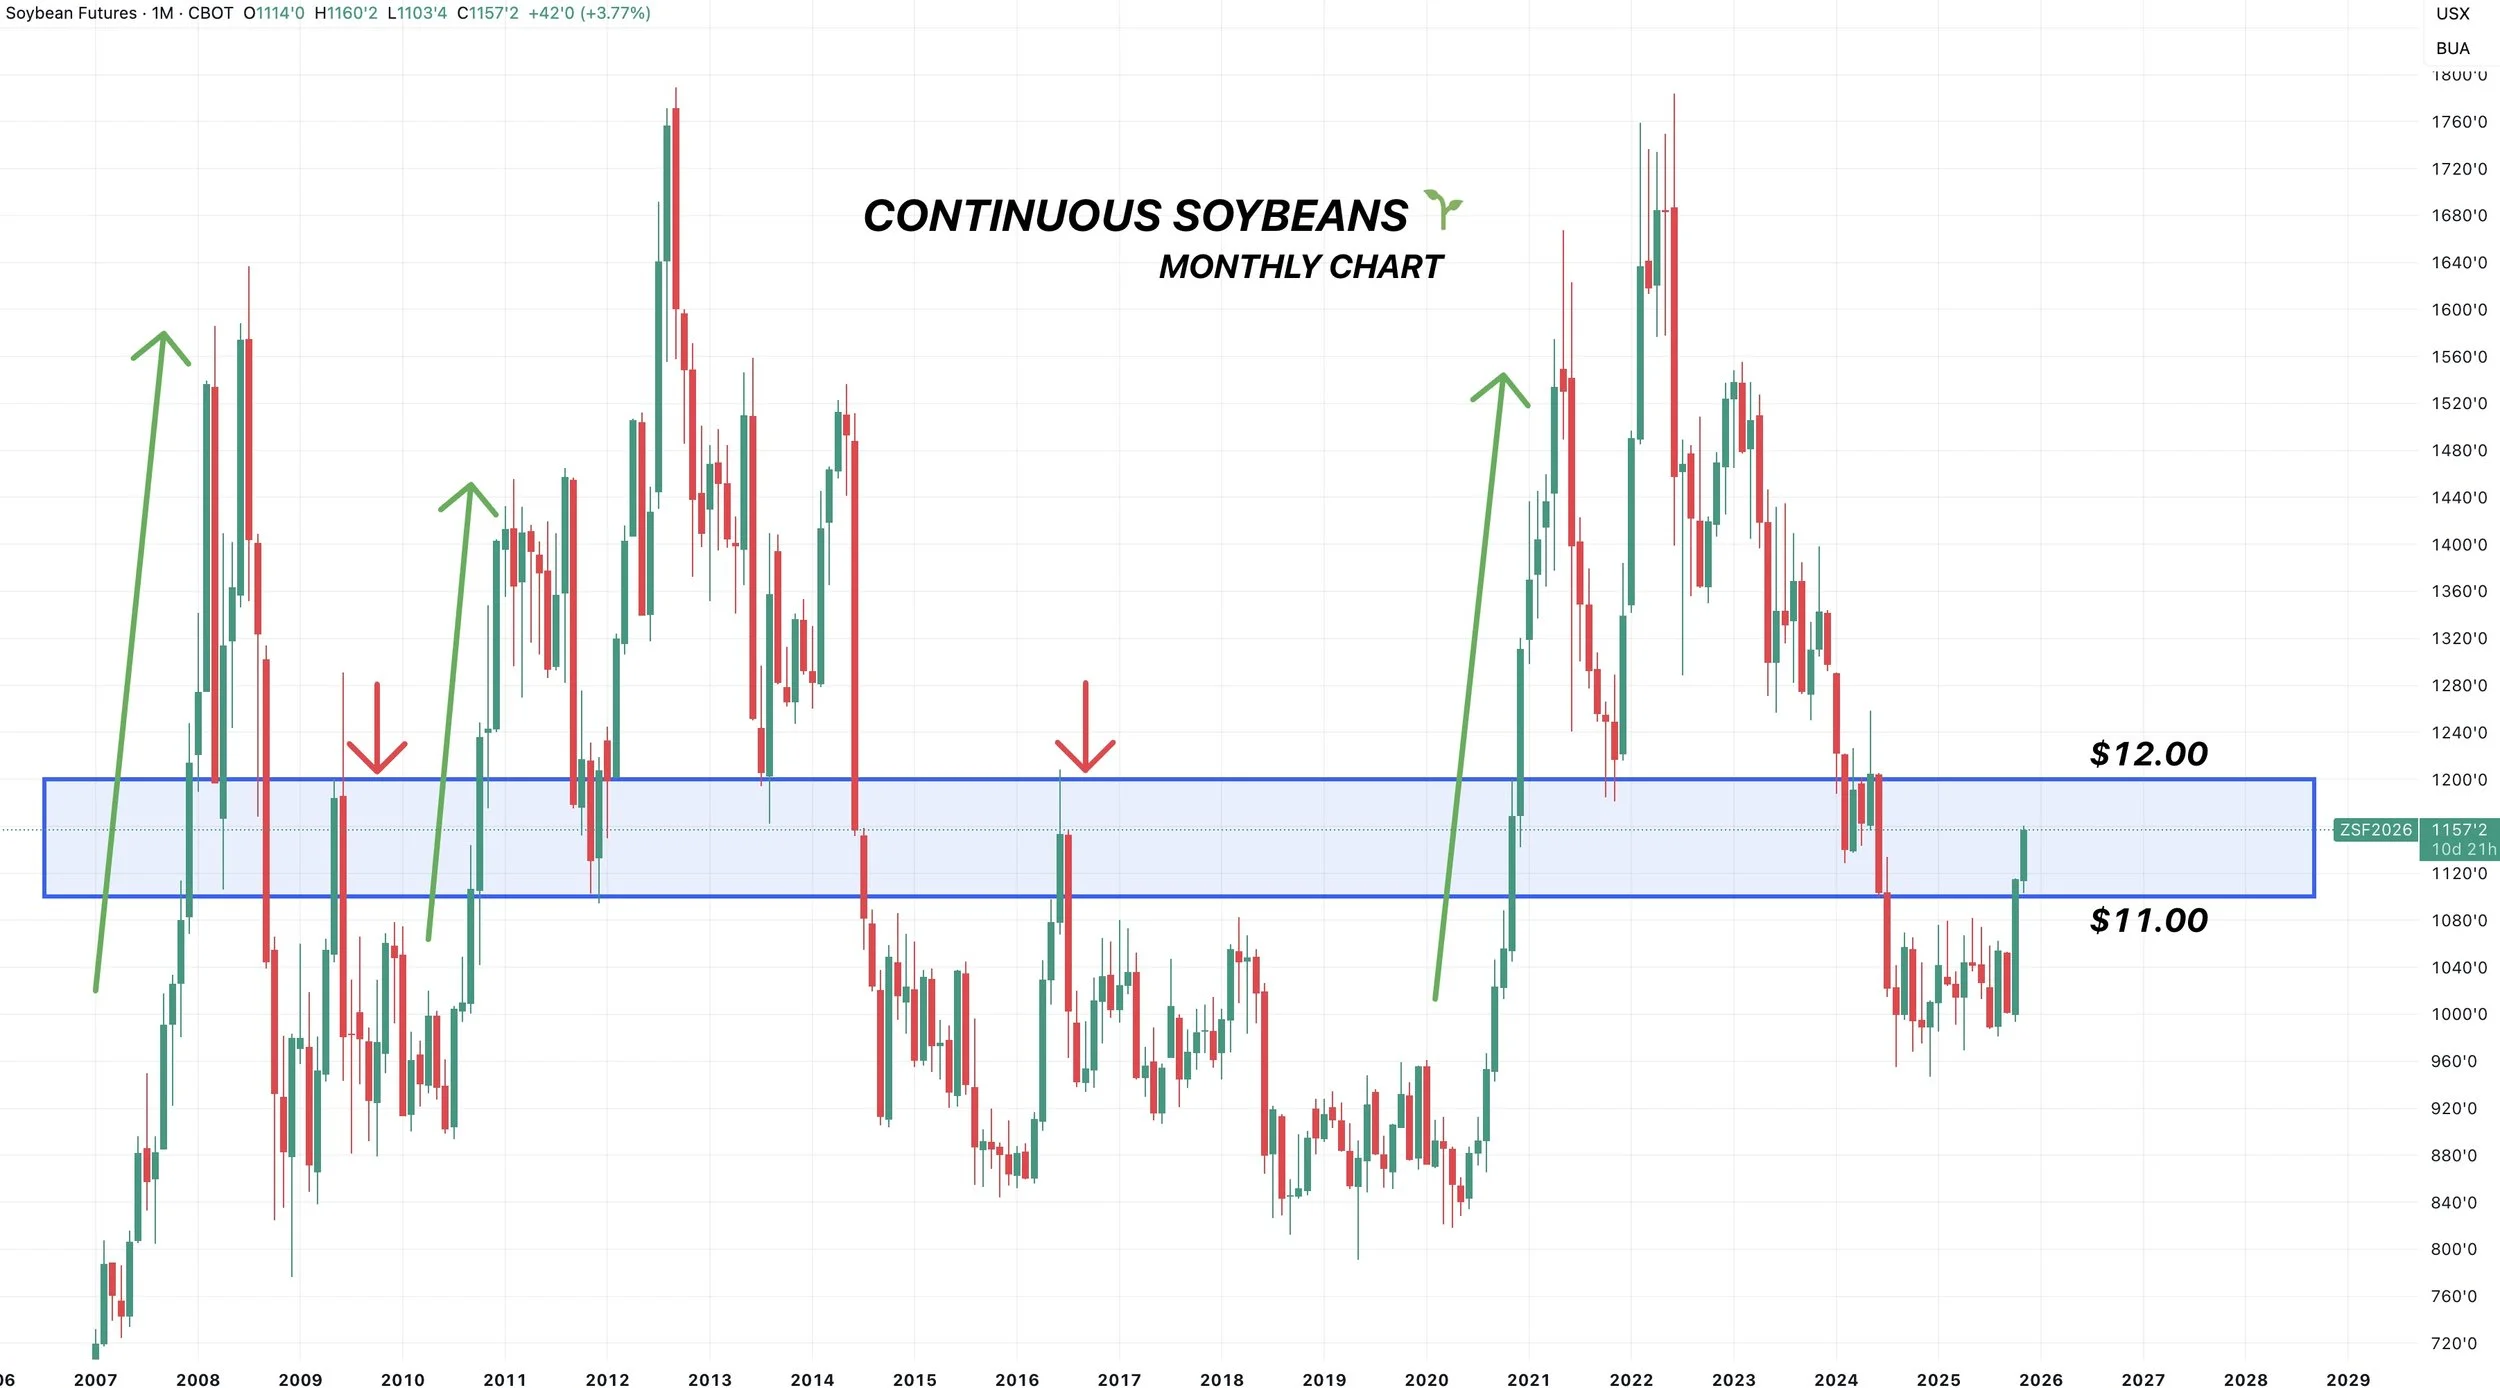
Here are a few other charts as to why I think $12.00 is very possible.
If you take the entire $1.14 range we were trapped in this year.
Then you add that on top of the point of breakout at $10.87 and our resistance this year.
You get $12.01
($1.14 + $10.87 = $12.01)

We were trapped under that $10.80 to $11.00 resistance for over a year.
When it broke, we had some clear air to the upside.
In the past decade, we've only broken that resistance twice until now.
2016: we ran right to $12.00
2020: we went much higher
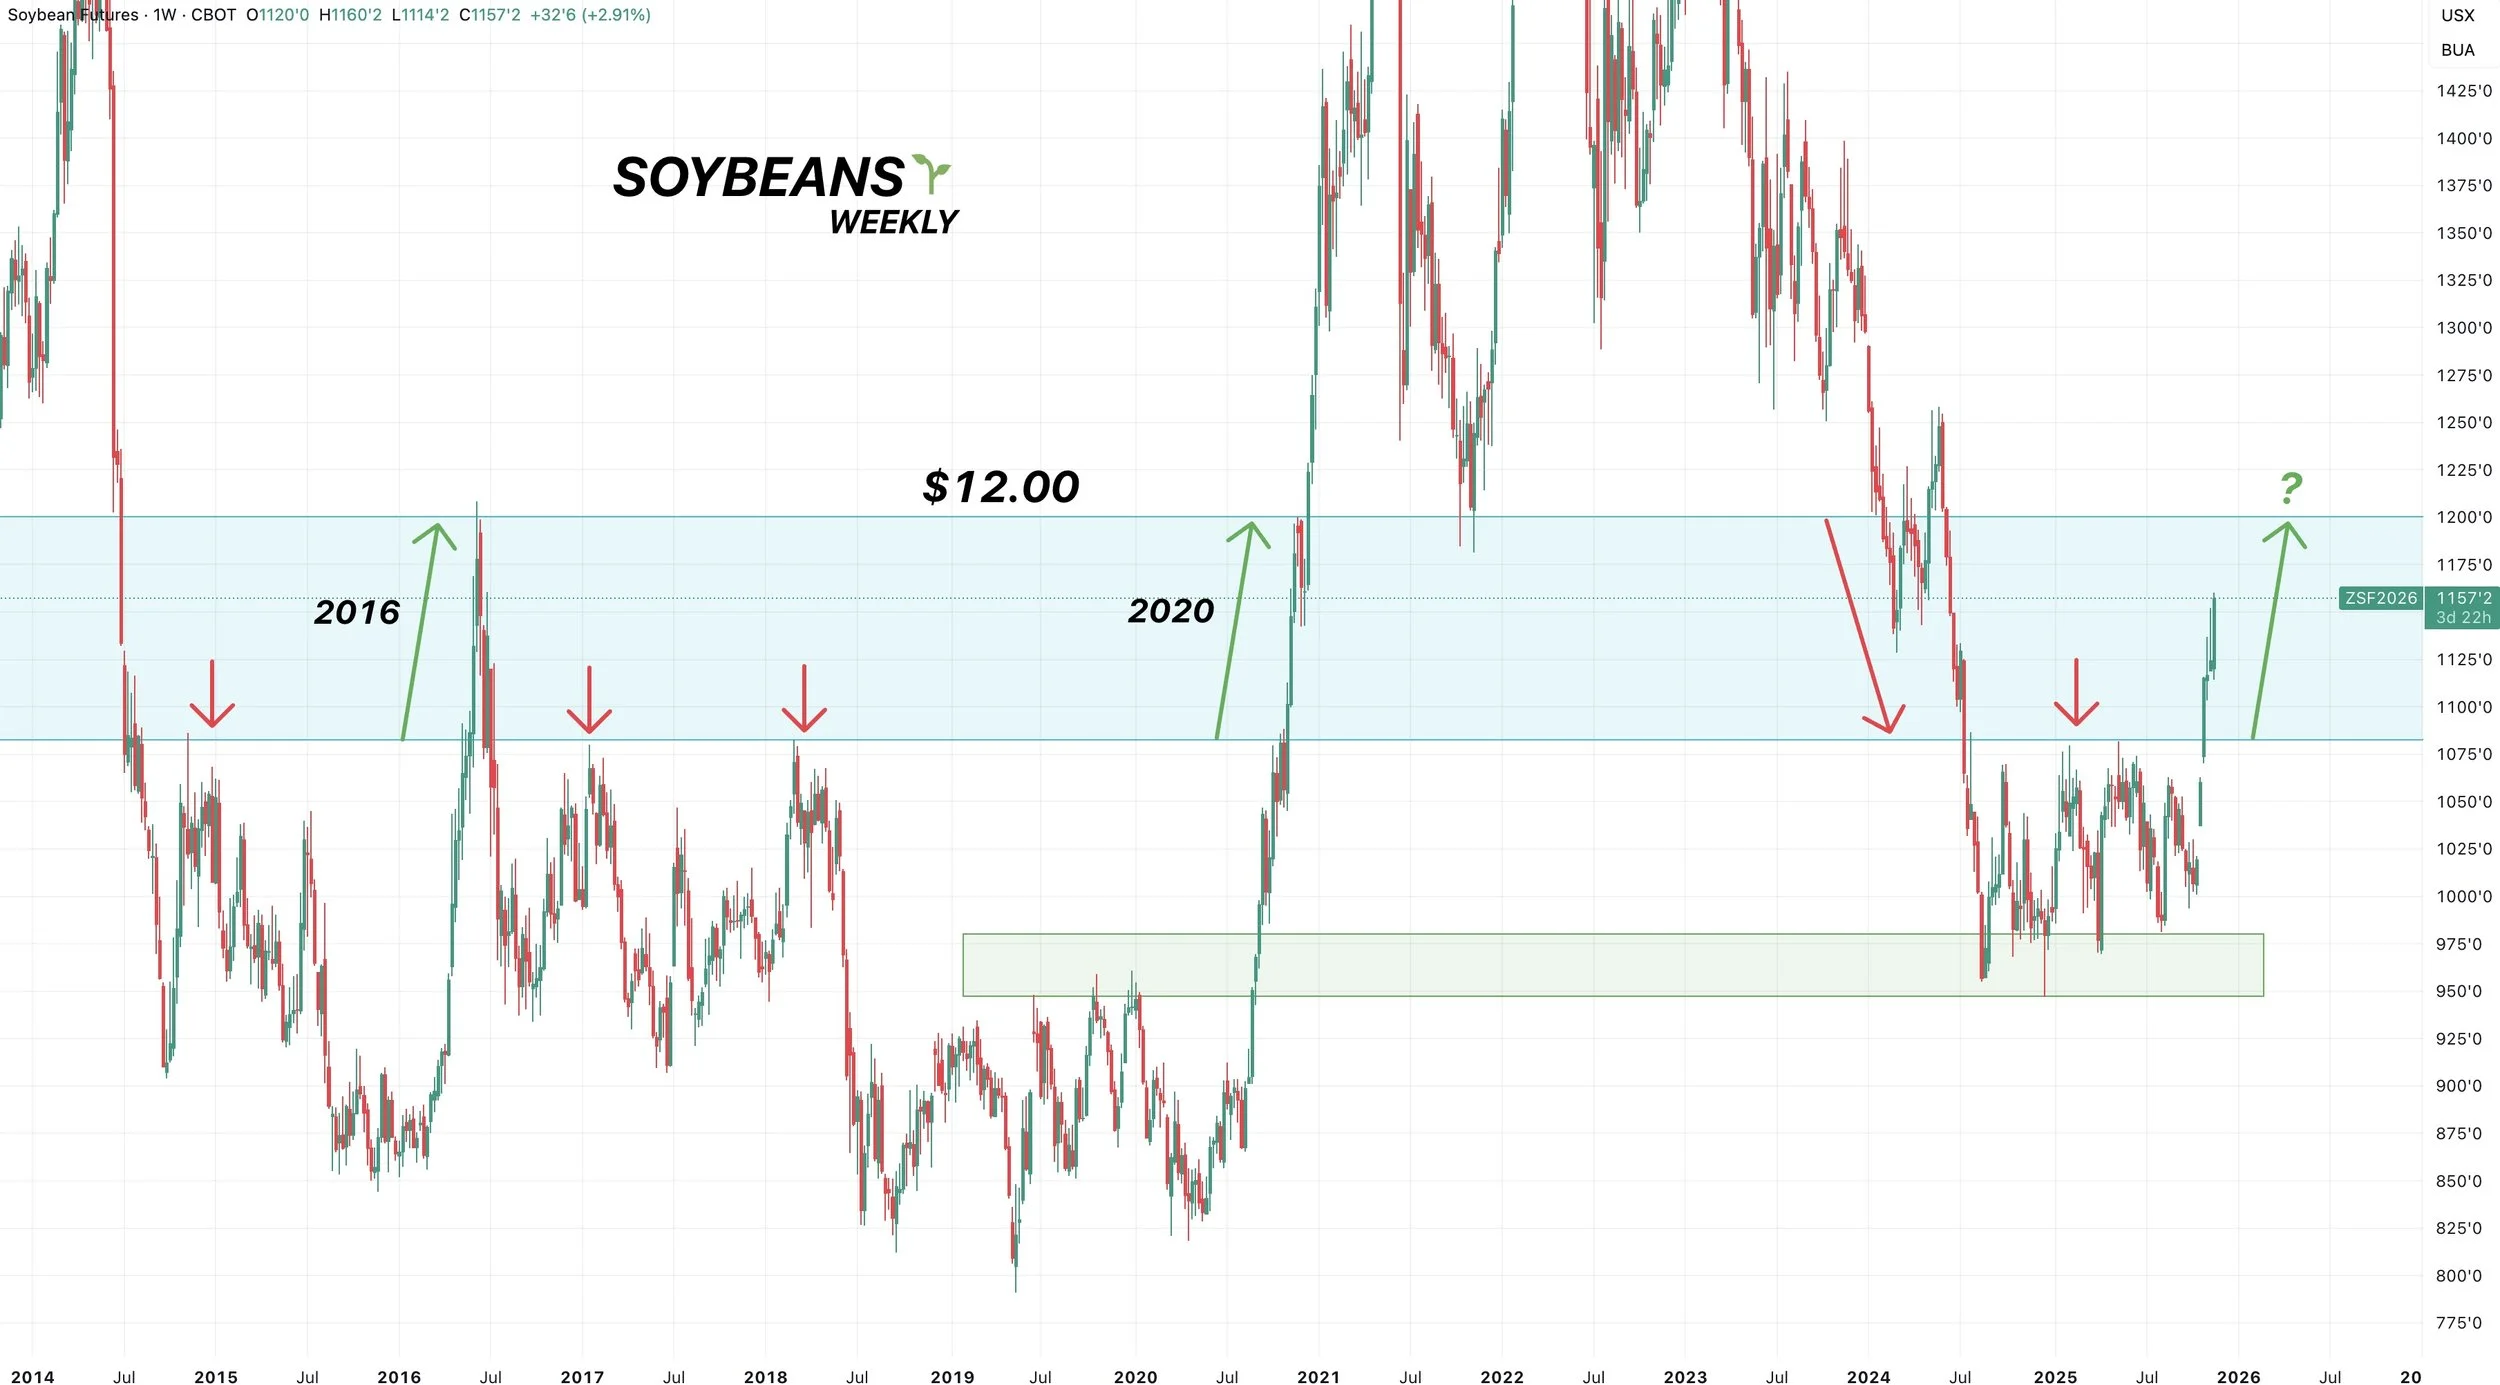
If you look at the monthly chart, soybeans really just hardly trade in the $11.00's
We've created virtually zero support or resistance in this range because we never trade in it.
Every time we either run to $12.00 or fall below $11.00
As a matter of fact, every single time soybeans have been below $11.00 and then broke above.. we have never stopped in the $11.00's
We have always went to $12.00 or higher. Every time.
Does it have to happen this time? No of course not, but it is a very compelling argument and I personally think it happens again.
Wheat
Fundamentals:
Wheat caught a nice bid higher today. Erasing the losses from the USDA report.
Fundamentally, there still isn’t much to update here.
We lack a catalyst to go dramatically higher. As ample global production is keeping a lid on us.
But I can’t get bearish at 5-year lows either.
Simply waiting to seize an opportunity.
In the wheat market, that opportunity usually only comes a handful of times a year and doesn’t last long.
India announced they would start exporting wheat again. Which is bearish. As they’ve had restrictions for the last 3 years. They are considering exporting due to ample supplies.
We need a catalyst for some short covering.
Maybe that comes from a technical breakout. Maybe it comes from a fundamental factor.
Some speculate that a brutally cold December forecast could be the spark we need. As it could offer potential winter kill damage with a lack of snow cover. I guess we will have to wait and see.
Regardless, I am not in a hurry to sell a bunch of wheat down here.
Technicals:
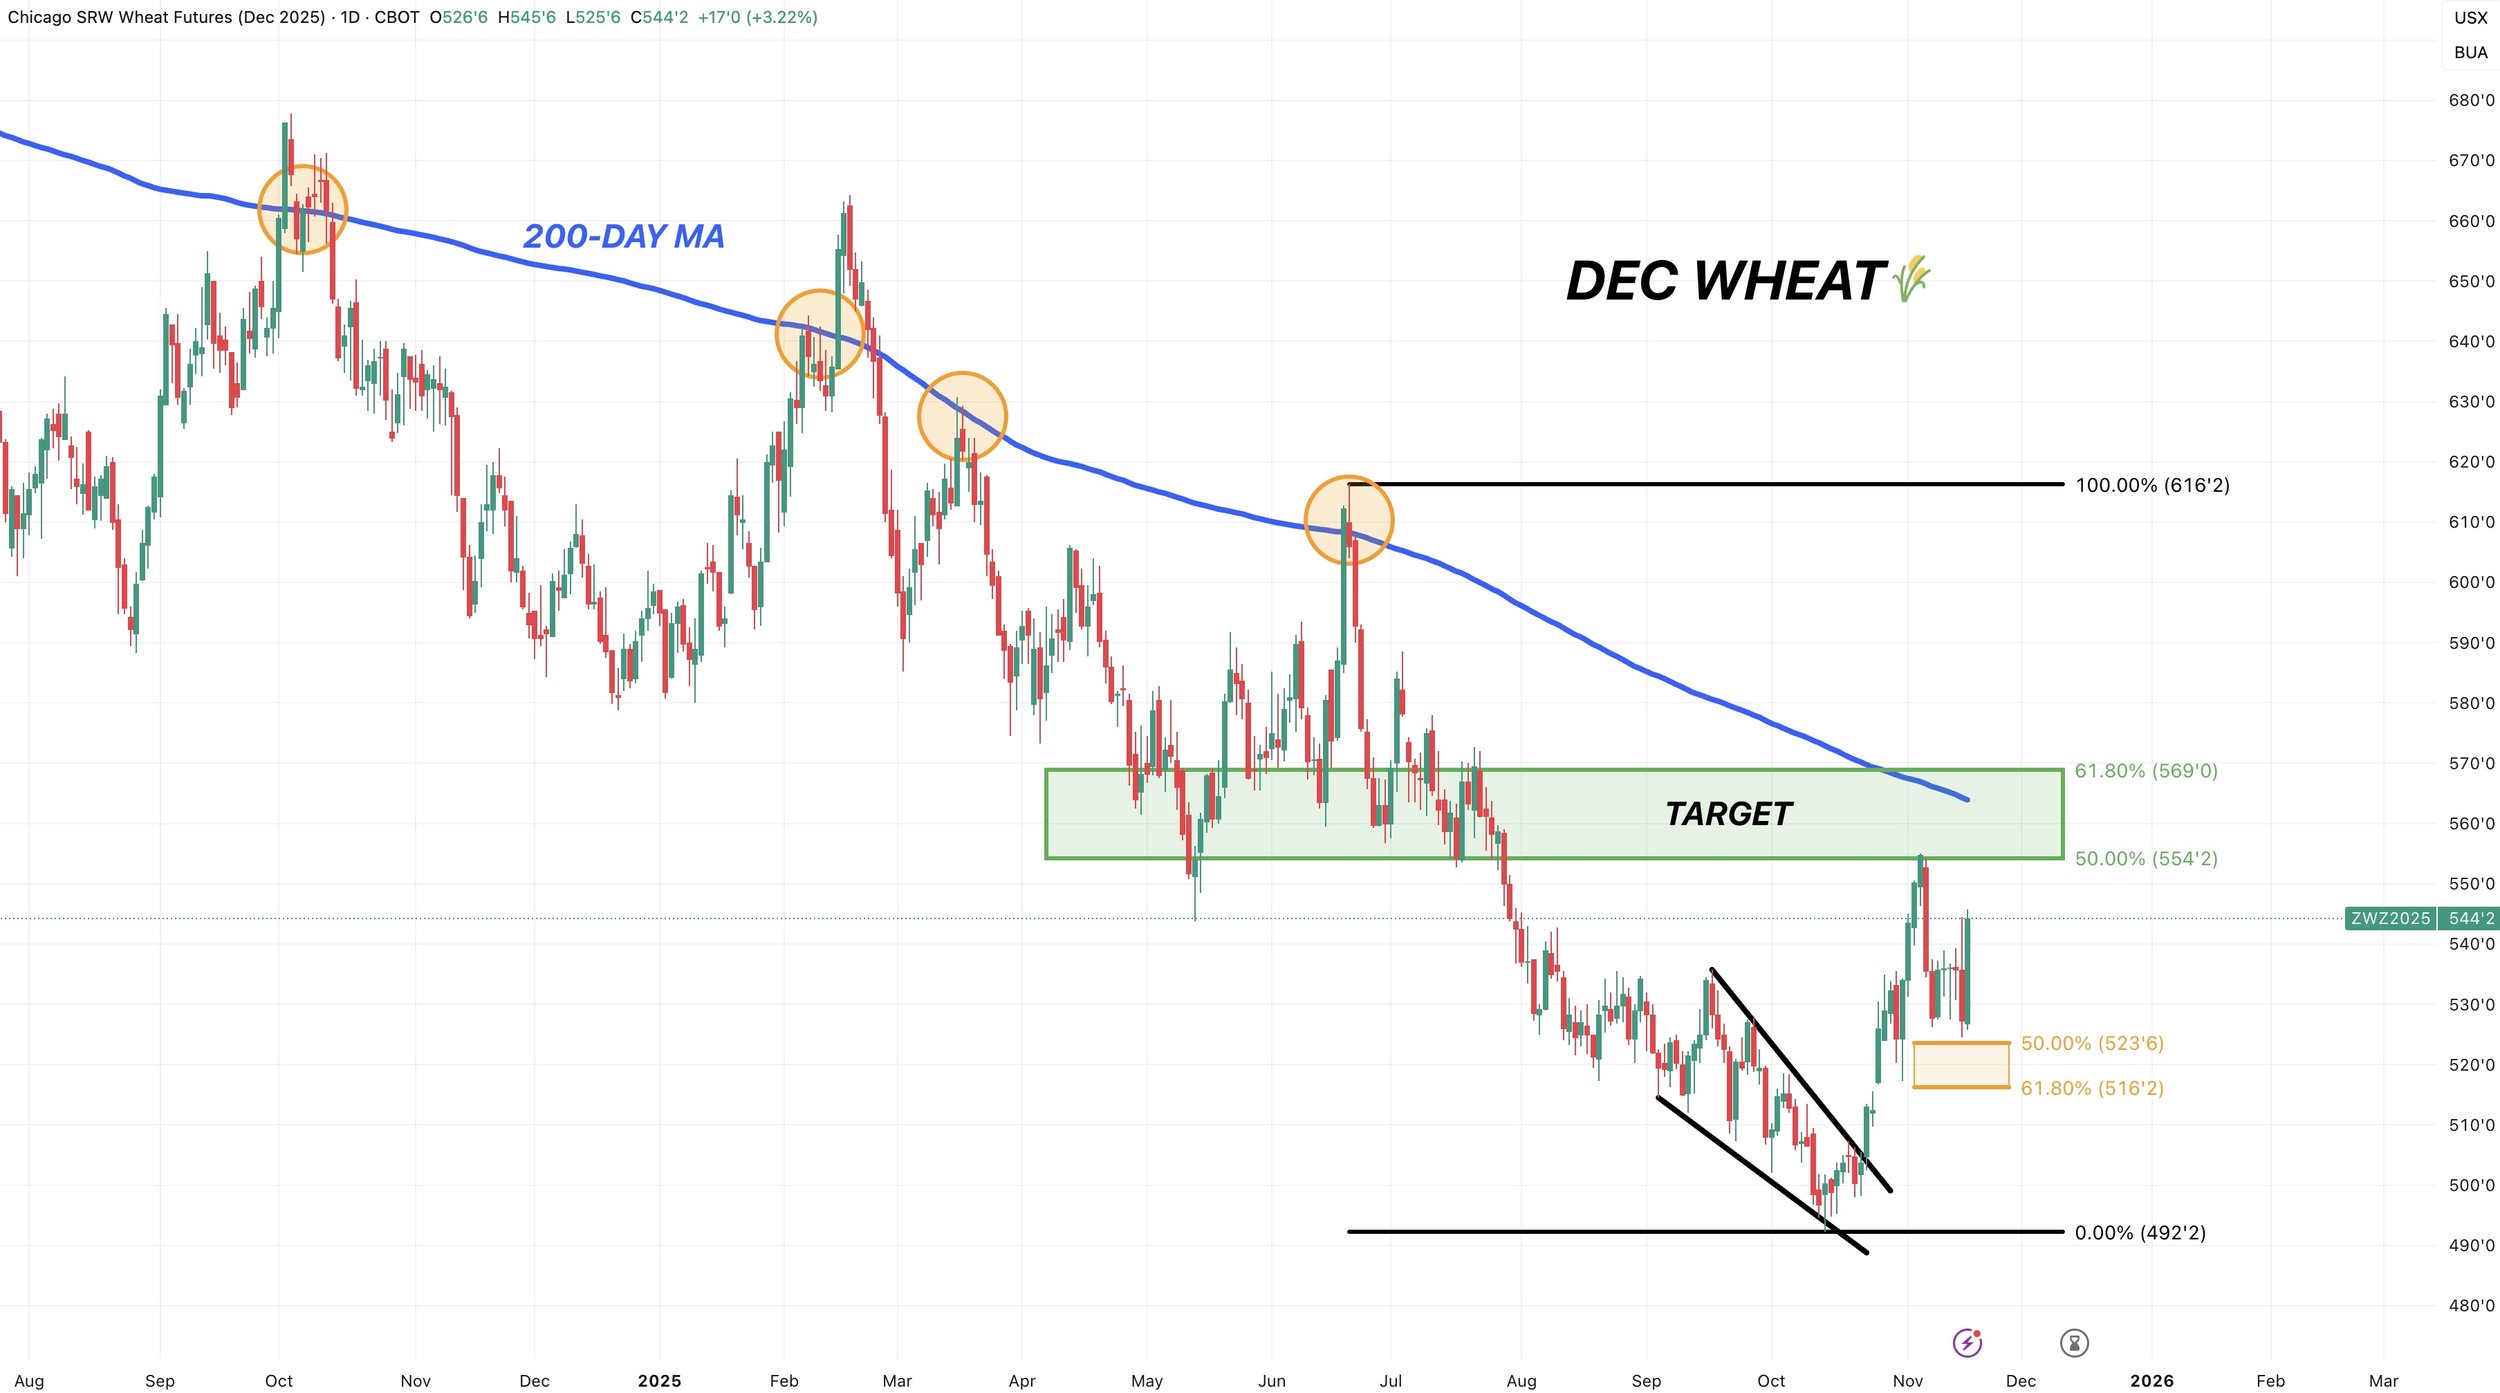
Dec Wheat
I still like taking a little risk off the table in the green box.
As that claws back 50-61.8% of the June highs.
The 200-day MA also sits in that box.
The wheat market has really struggled to stay above the 200-day MA for very long.
It's been above it just 3 times since Sep 2024. Each time did not last very long at all.
To the downside, bulls want to hold the orange box.
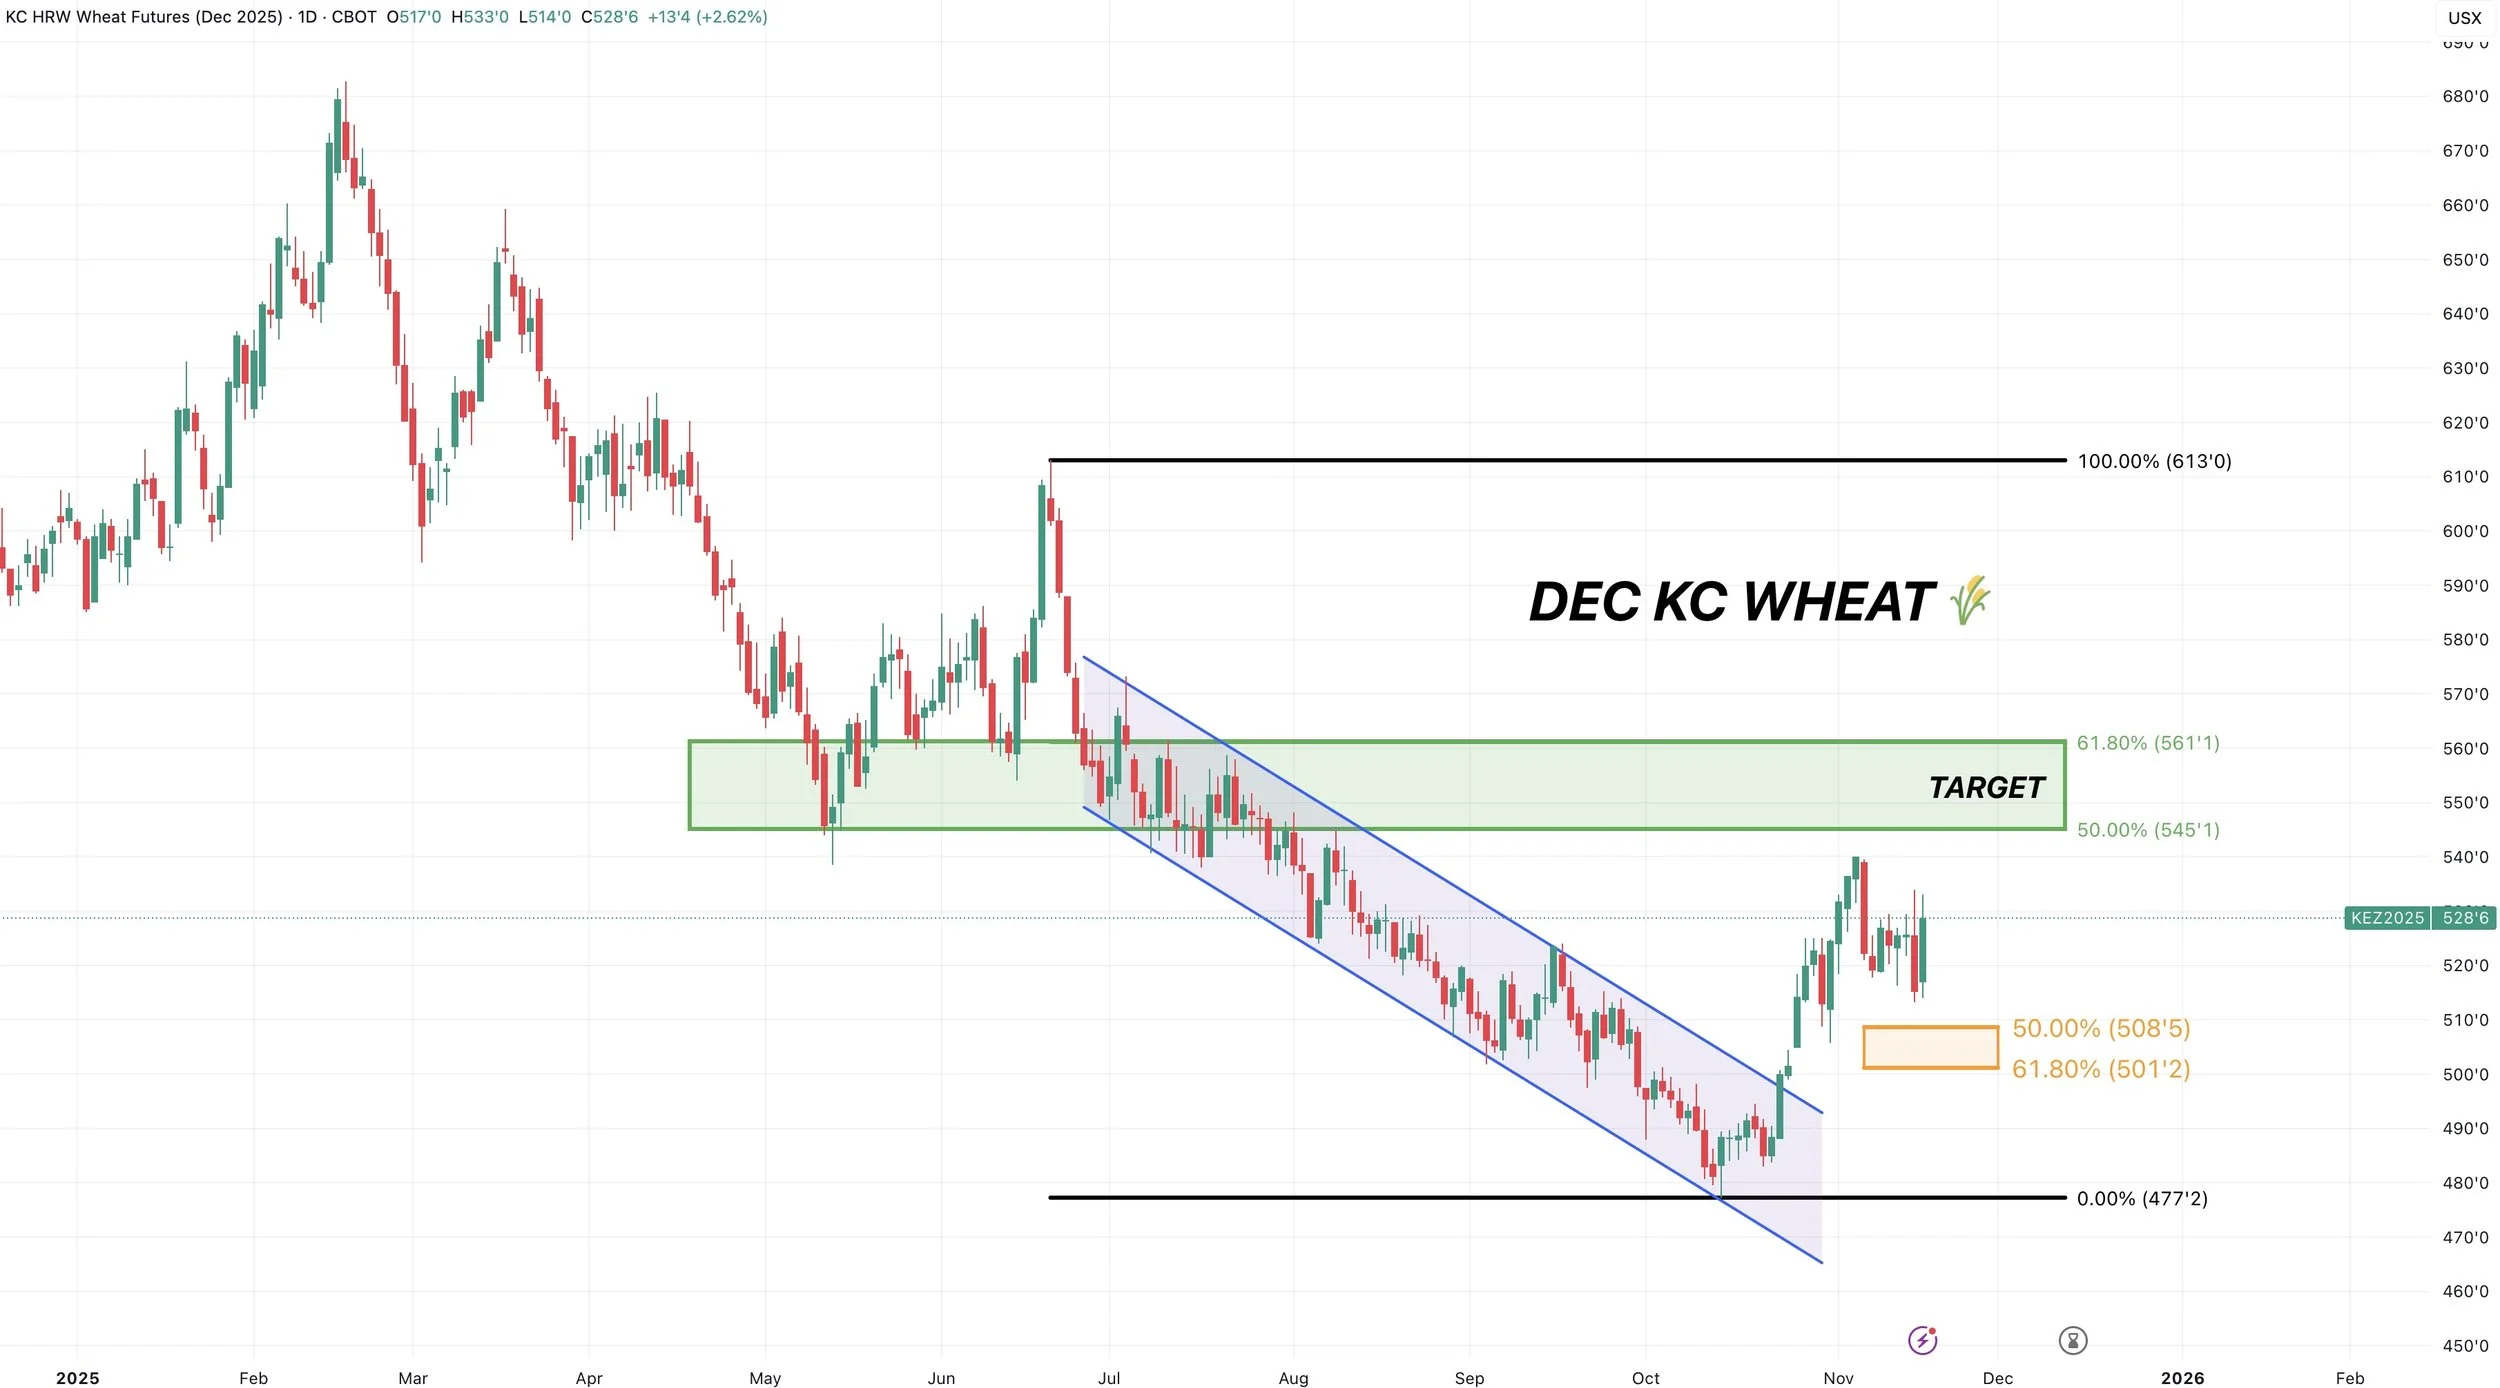
Dec KC Wheat
For KC our upside target is still that green box to look at taking some risk off the table.
As it gives back 50-61.8% of the June highs.
Cattle
The headlines in cattle are bearish.
We just had Rollins say that beef prices will come down by spring.
As cattle continues to make the headlines and grab attention.

Despite the cleary bearish headlines, the market has held up the last few days and seemed to shrug off the news.
We gapped open lower then got bought strongly today.
So perhaps we could find some support down here and be due for a corrective bounce.
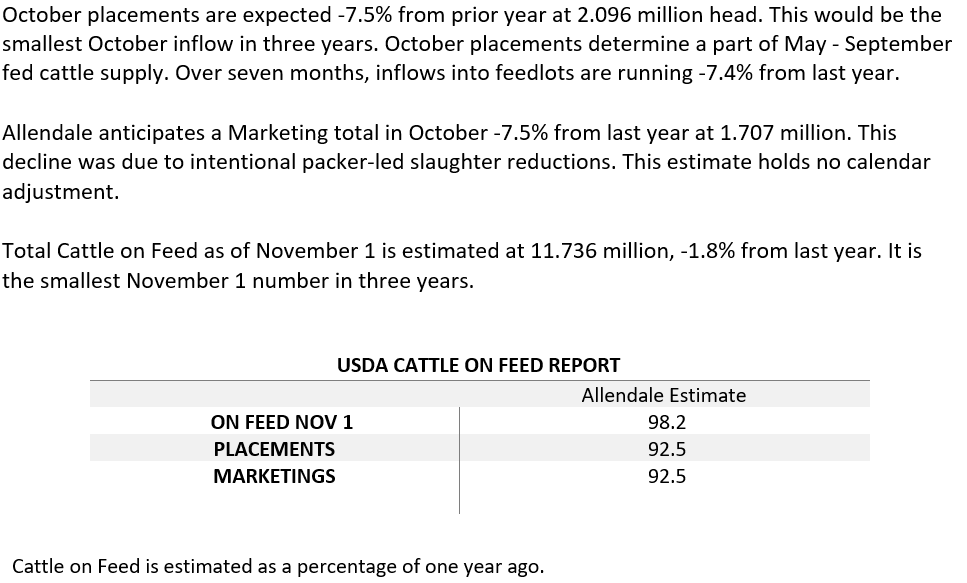
We have a cattle on feed report on Friday.
The estimates have placements down -7.5% vs last year, and the smallest in 3 years.
With marketing also down -7.5% vs last year.
Then they have on feed down -1.8% from last year. At the smallest level in 3 years.
Dec Live Cattle
So far we are finding life at this 200-day MA.
This is a very crucial spot to hold if we want to prevent further downside. As a break below probably sparks more algo selling.
If we do get a corrective bounce, we want to be rewarding the bounce.
If we can reclaim 50-61.8% of the green box that would be a very good place to reward the rally if it comes.
The 50-day MA currently sits in that box as well.

Jan Feeders
We are also hovering and finding support right above the 200-day MA.
I apologize that it's hard to see the 200-day MA. As it just received enough data to become available a few days ago on Jan feeders.
But essentially that is the big spot to hold like in live cattle.
To the upside, if we somehow get a bounce up towards the green box we want to be rewarding the rally if it comes.
As the government is telling you they are actively trying to lower prices.

Past Sell or Protection Signals
Nov 13th: 🌽 🌱
Managing risk in corn & beans ahead of USDA report.
Oct 28th: 🌽
Corn sell signal & hedge alert.
Oct 27th: 🌱
Soybean sell signal & hedge alert.
Oct 13th: 🐮
Cattle sell signal & hedge alert.
Aug 22nd: 🌱
Soybean sell signal & hedge alert.
July 31st: 🐮
Cattle sell signal & hedge alert.
July 10th: 🐮
Cattle sell signal & hedge alert.
CLICK HERE TO VIEW
June 5th: 🐮
Cattle sell signal & hedge alert.
June 2nd: 🌾
MPLS wheat sell signal.
April 10th: 🌽
Old crop corn sell signal.
March 19th: 🐮
Cattle hedge & sell signal.
Feb 18th: 🌽 🌾
Old crop KC wheat & old crop corn signal.
Jan 23rd: 🌽 🌱
Corn & beans old crop sell signal.
CLICK HERE TO VIEW
Jan 15th: 🌽 🌱
Corn & beans hedge alert/sell signal.
Jan 2nd: 🐮
Cattle hedge alert at new all-time highs & target.
Dec 11th: 🌽
Corn sell signal at $4.51 200-day MA
CLICK HERE TO VIEW
Oct 2nd: 🌾
Wheat sell signal at $6.12 target
Sep 30th: 🌽
Corn protection signal at $4.23-26
Sep 27th: 🌱
Soybean sell & protection signal at $10.65
Sep 13th: 🌾
Wheat sell signal at $5.98
May 22nd: 🌾
Wheat sell signal when wheat traded +$7.00
Want to Talk?
Our phones are open 24/7 for you guys if you ever need anything or want to discuss your operation.
Hedge Account
Interested in a hedge account? Use the link below to set up an account or shoot Jeremey a call at (605)295-3100.