
USDA RECAP. NOW WHAT?
MARKET UPDATE
You can scroll to read the usual update as well. As the written version is the exact same as the video.
Timestamps for video:
Overview: 0:00min
Corn: 2:10min
Beans: 10:10min
Wheat: 12:35min
Cattle: 15:10min
Want to talk about your situation?
(605)250-3863
Your free trial has ended
Don’t miss future updates or signals
Subscribe to keep full access
Here is extended access to our Black Friday sale
Futures Prices Close
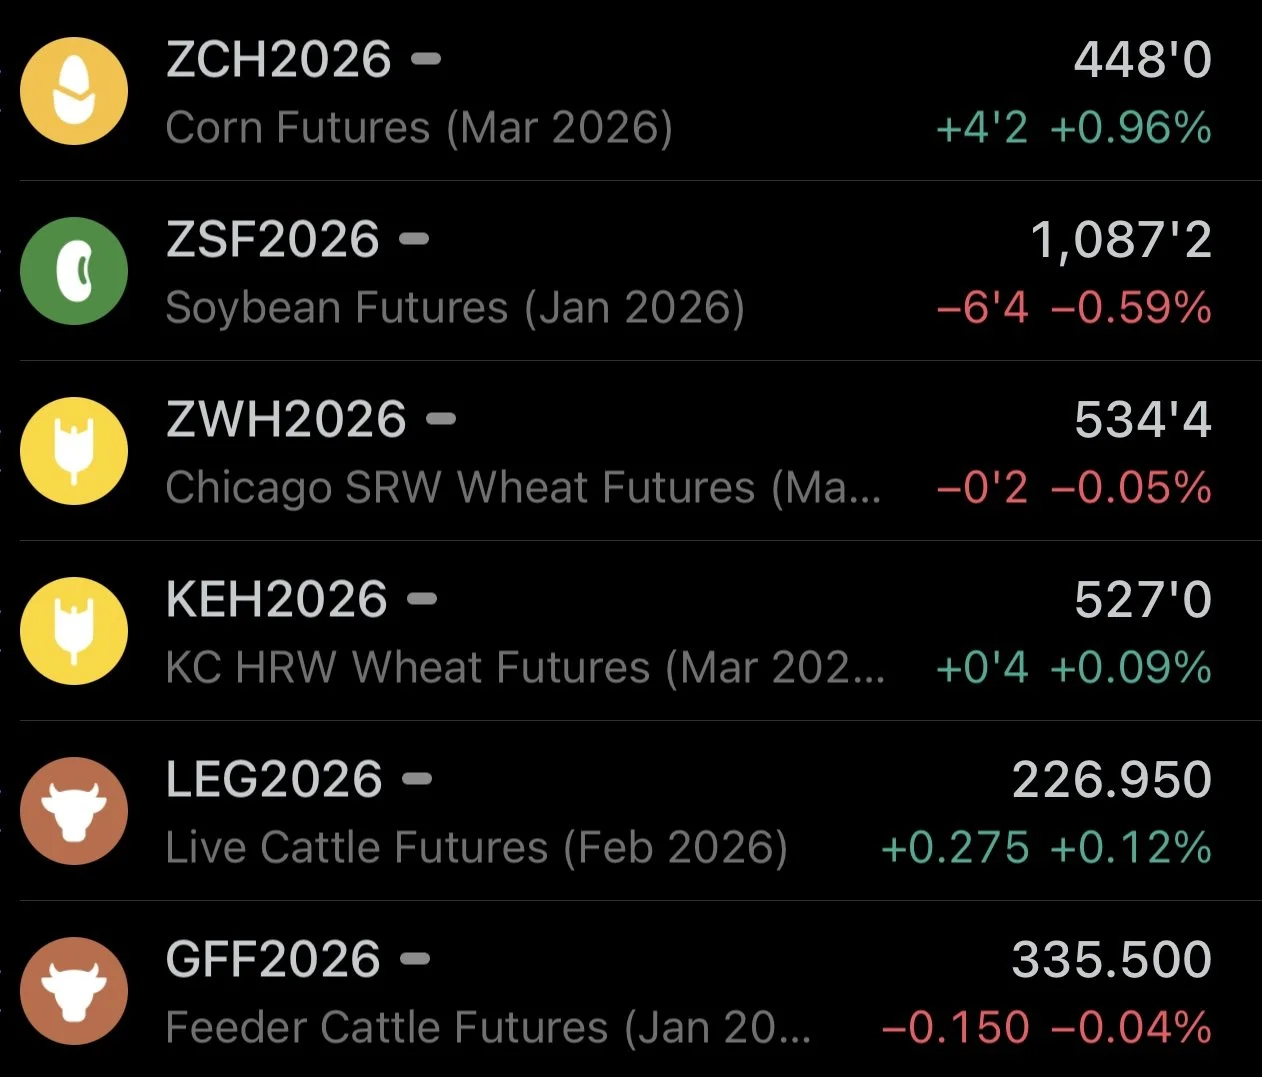
Overview
Grains mixed following the USDA report. With corn leading the way higher and soybeans leading the way lower.
As soybeans have now traded lower the last 6 of 7 days.
Not a ton of fresh news aside from the USDA report, so let's jump right in.
USDA Recap
As expected, this report was on the boring side. With no changes to the supply side of the balance sheet.
As for US carryout, we saw corn drop by -125 million to 2.03 billion due to a bump in exports.
This drop was about -100 million more than expected.
Meanwhile, soybeans and wheat were both left completely unchanged from last month. The trade was not looking for big changes to begin with.

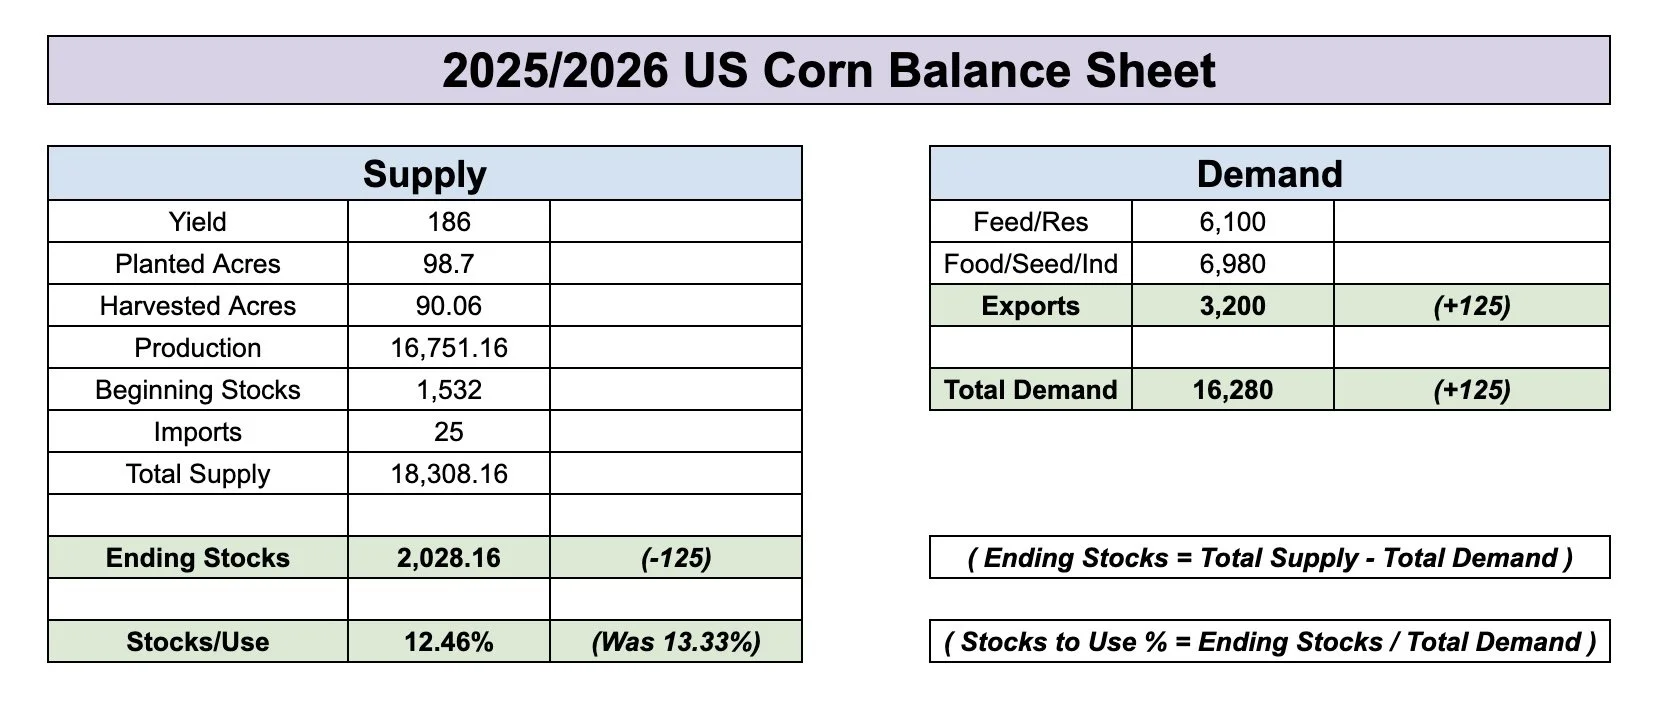
Here is the updated balance sheet for corn.
The only change we saw was corn exports being raised by +125 million.
So this resulted in our carryout dropping by -125 million.
We still have a carryout of just over 2 billion bushels.
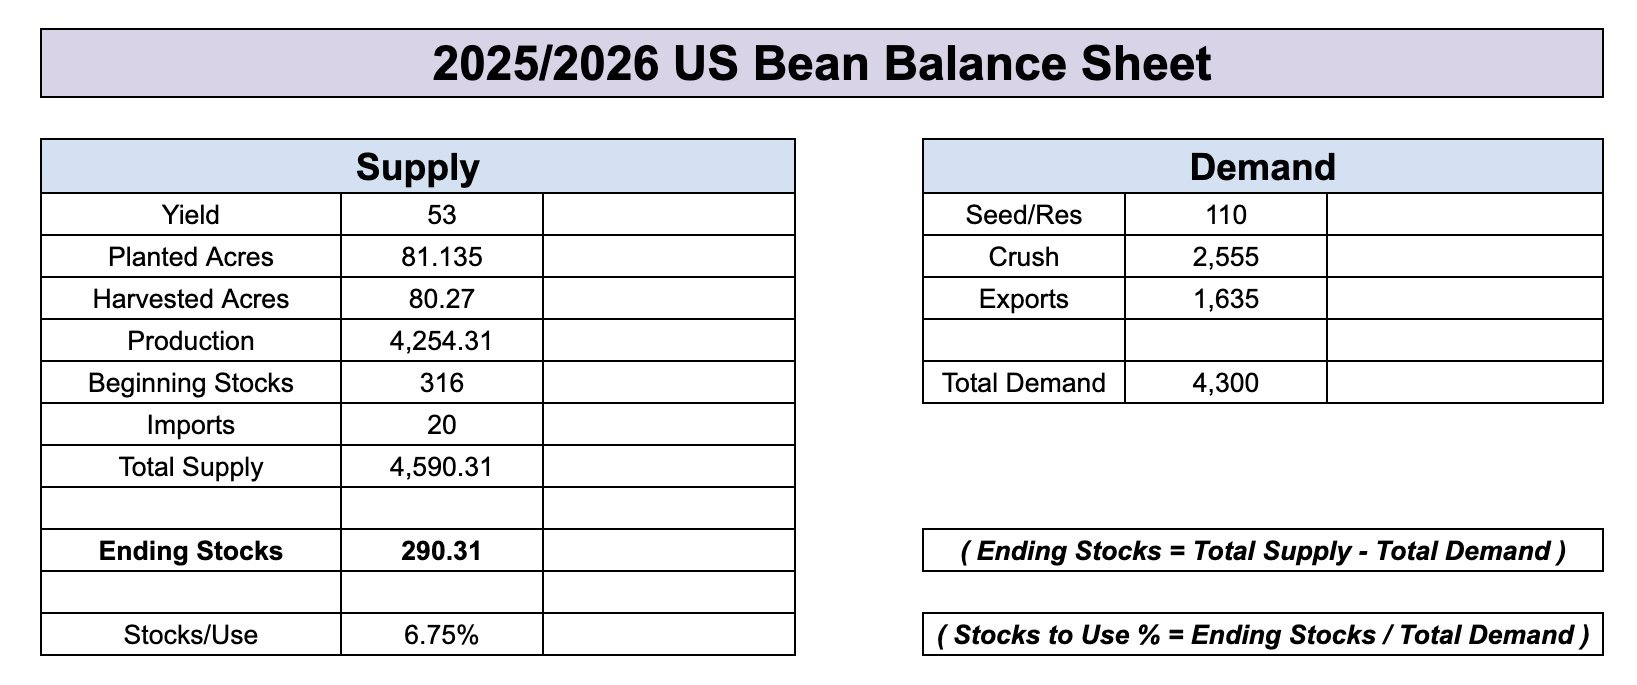
Here is the balance sheet for beans.
Completely left unchanged.
Carryout remains at 290 million.
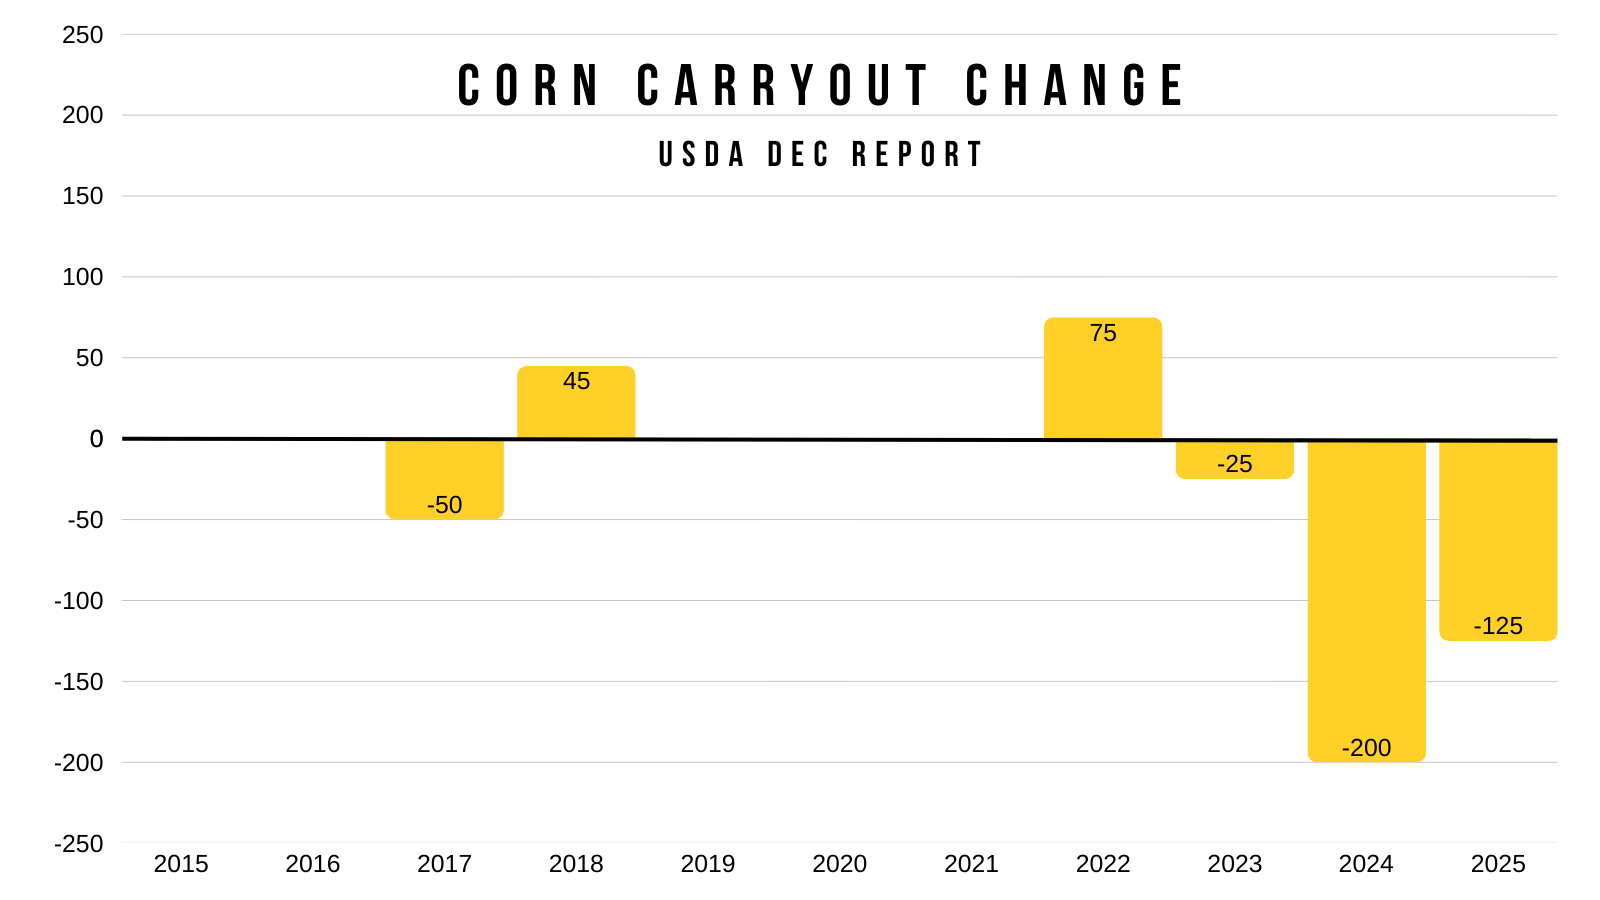
Despite not seeing "massive" changes.
This was the 2nd largest drop we've seen to corn carryout for the Dec report in the last decade. Only behind last year's -200 million drop.
5 of the last 10 years the USDA left the carryout completely unchanged.
It's no surprise we didn’t see any changes to soybeans.
They've only changed the soybean balance sheet 3 times in the last decade.
With the last one being back in 2020.

World Carryout
The world numbers did provide somewhat of a surprise.
Corn surprised slightly lower than expected.
Soybeans came in right about as expected.
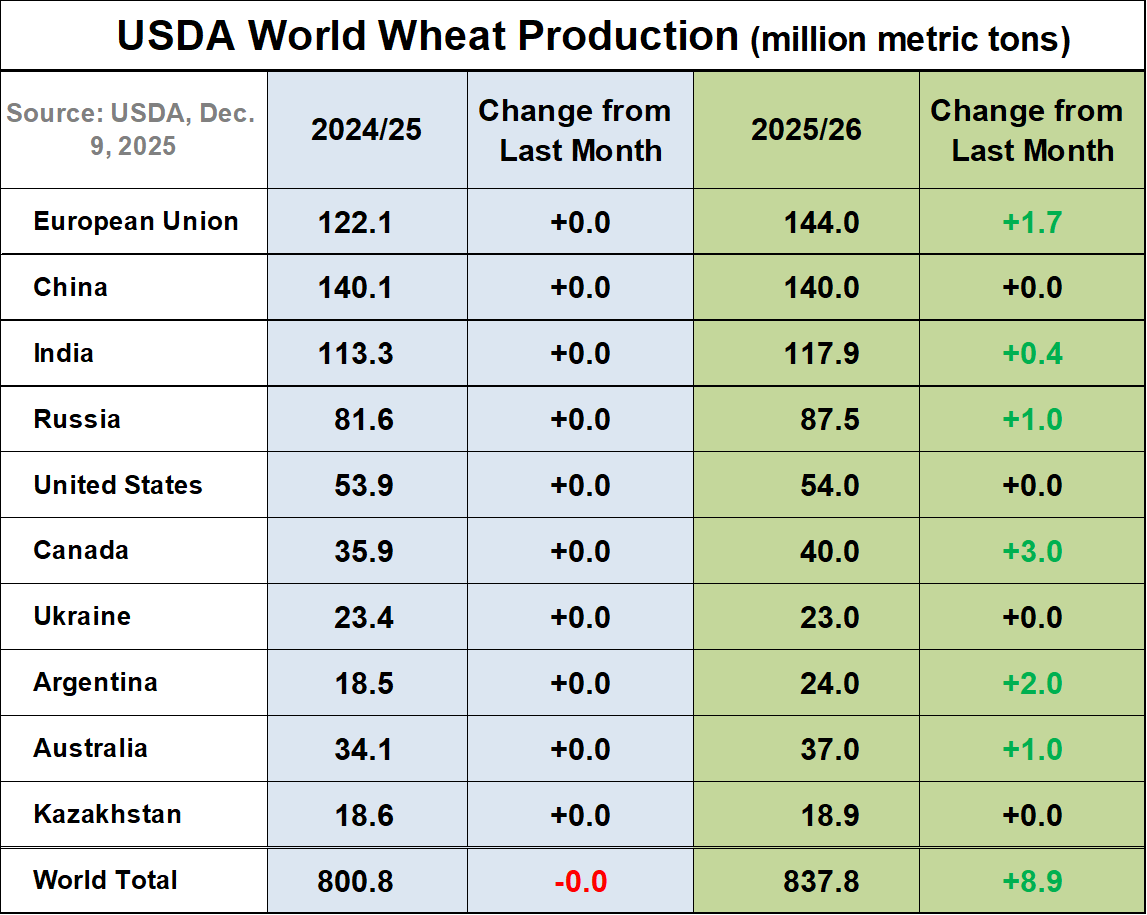
However wheat surprised above the expectations.
As the USDA bumped a lot of countries wheat estimates.
Here are the changes they made:
Austraila (+1 MMT)
Argy (+2 MMT)
Canada (+3 MMT)
EU (+1.7 MMT)
Russia (+1 MMT)

South America Numbers
The South America numbers were left completely unchanged.

Today's Main Takeaways
Corn
Fundamentals:
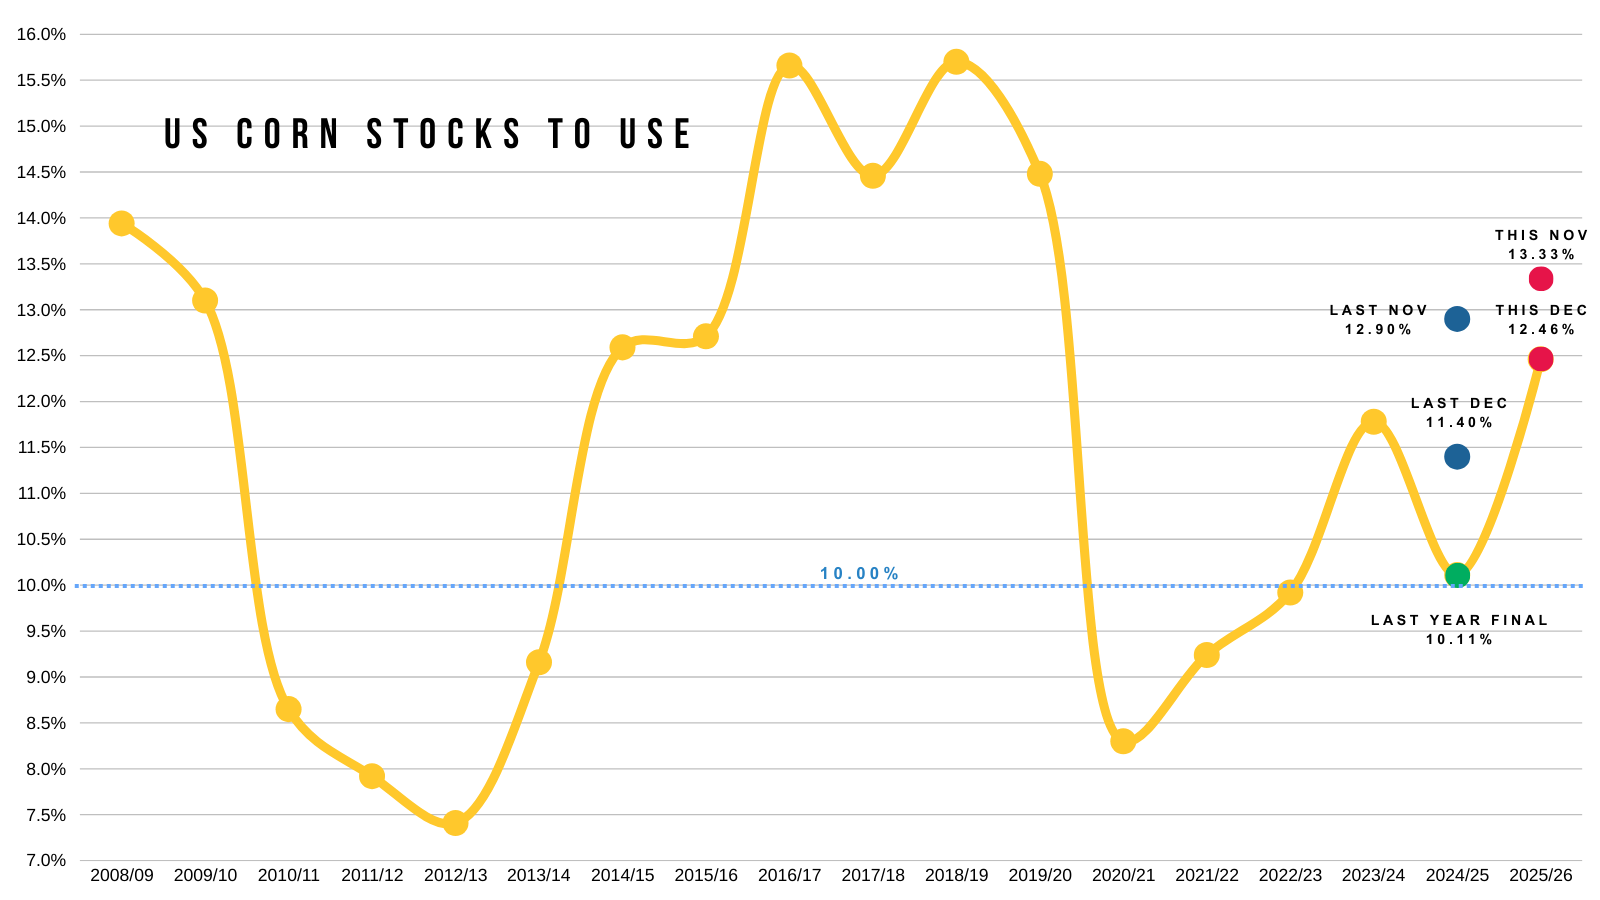
Here is an updated visual of our stocks to use ratio.
We went from 13.33% last month to 12.45% today.
On this chart, I put where our stocks to use ratio was pegged at during the Nov and Dec reports for both this year and last year.
Last Nov: 12.90%
This Nov: 13.33%
Last Dec: 11.40%
This Dec: 12.45%
Last Year Final: 10.11%
So currently, it does appear that we were in a "more bullish" scenario last year when compared to this year.
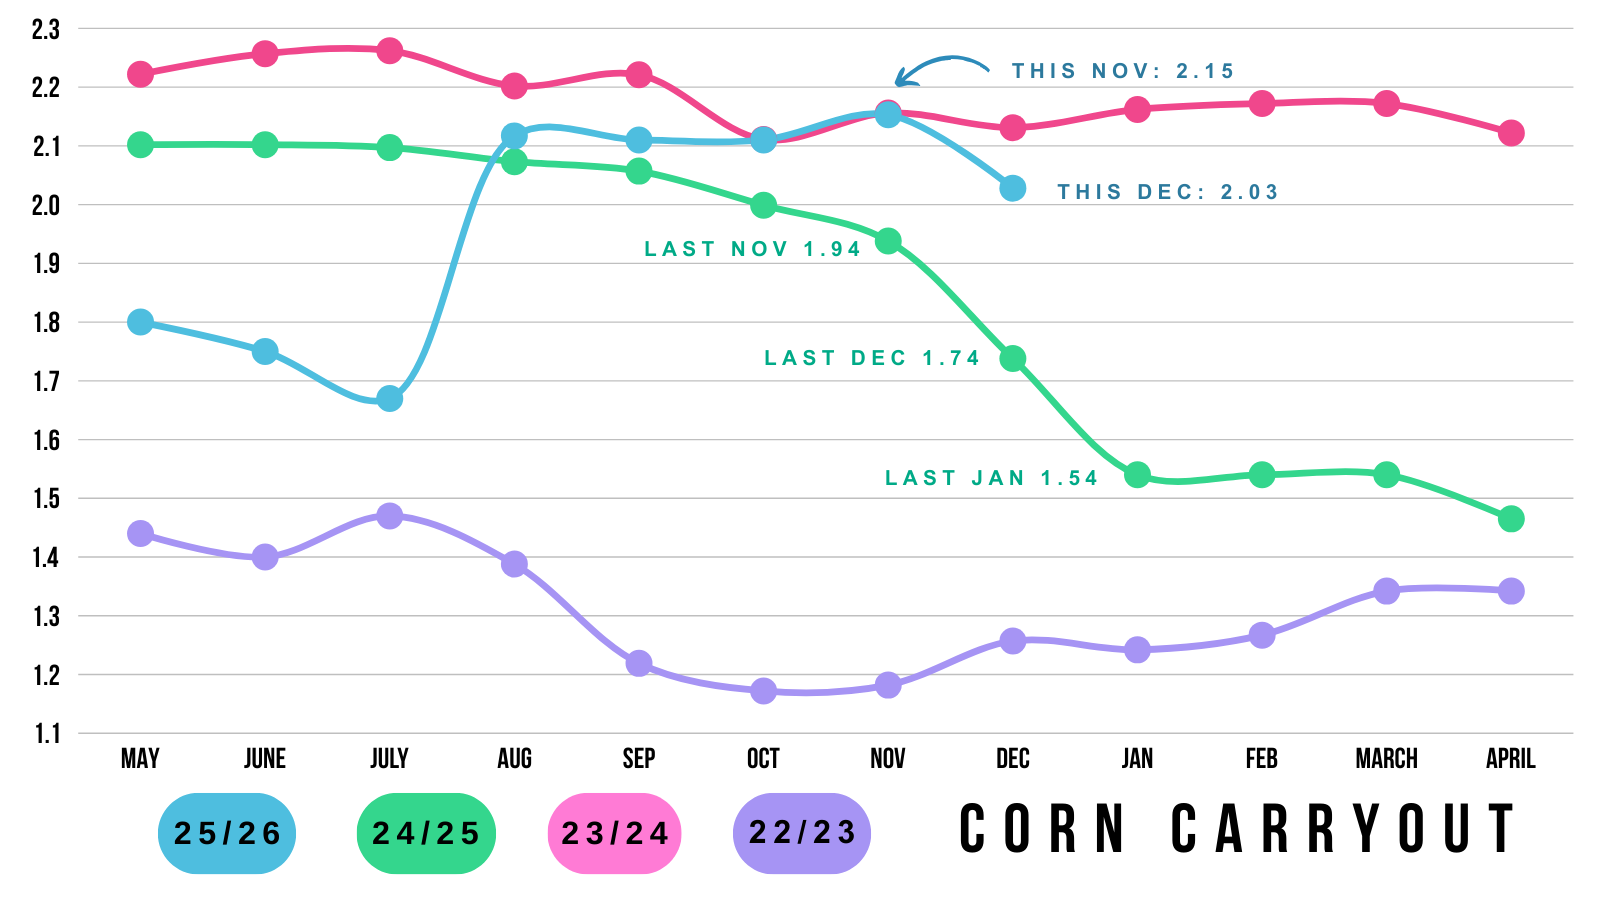
Here is a visual of our carryout changes over the year.
Blue line = this year
Green line = last year
Last year we started to drop pretty sharply after November.
Last Nov: 1.94
This Nov: 2.15
Last Dec: 1.74
This Dec: 2.03
Last Jan: 1.54
Again, it appears that the corn situation isn’t quiet as friendly as it was last year barring some major change in Jan. Which is something we saw last Jan.
As the USDA dropped carryout by -200 million in both the Dec and Jan report's last year.
Bringing carryout from 1.94 to 1.54 billion. A massive change.
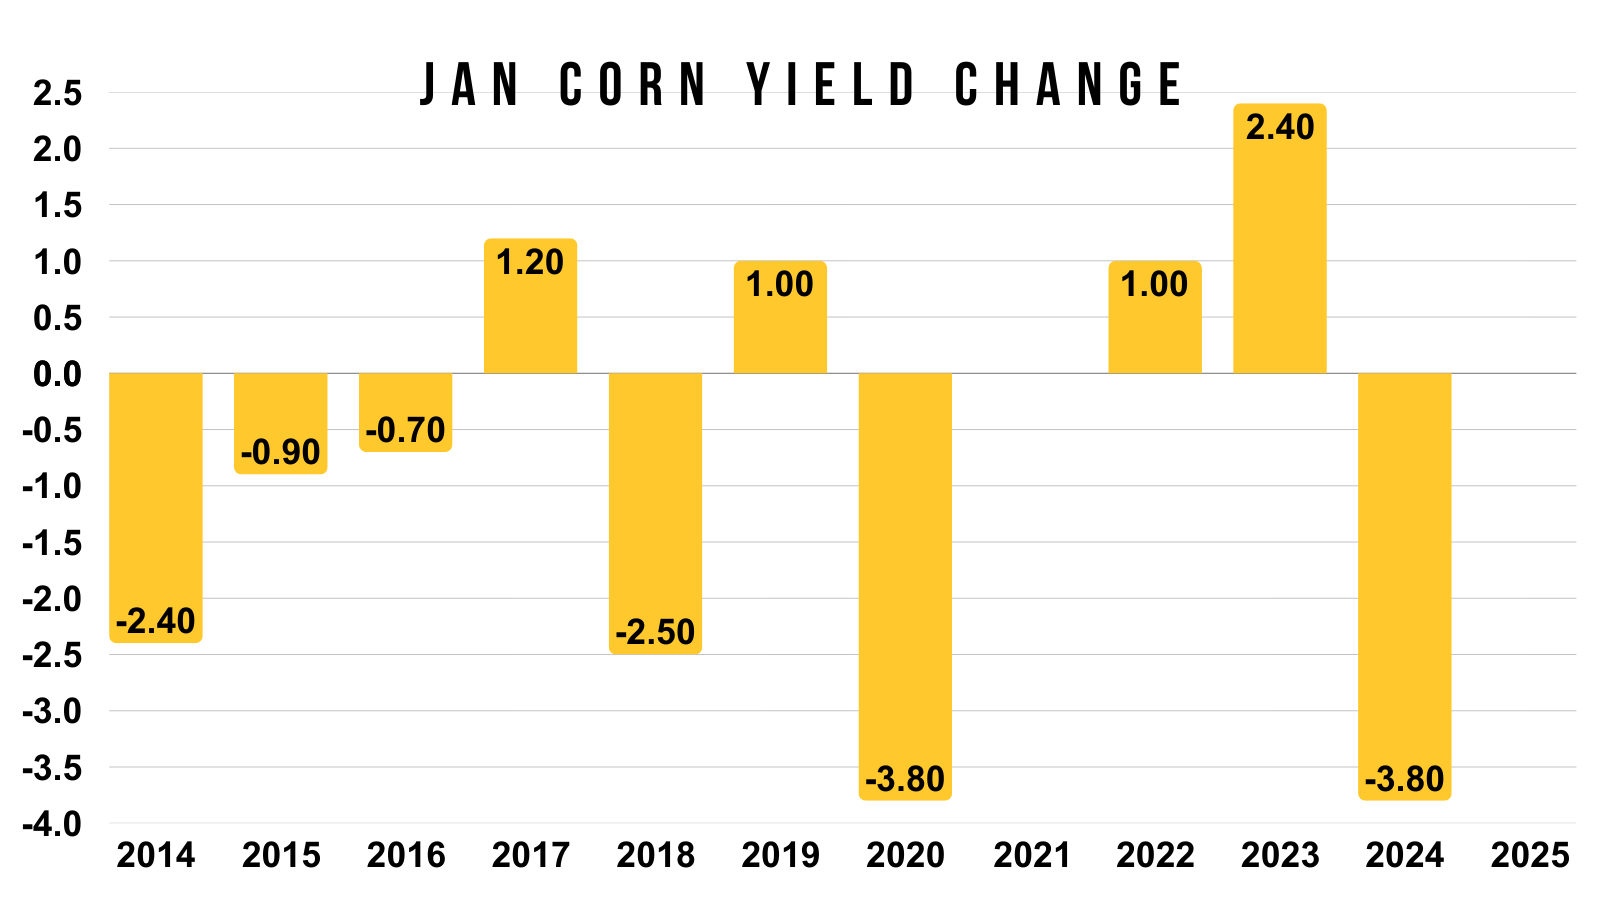
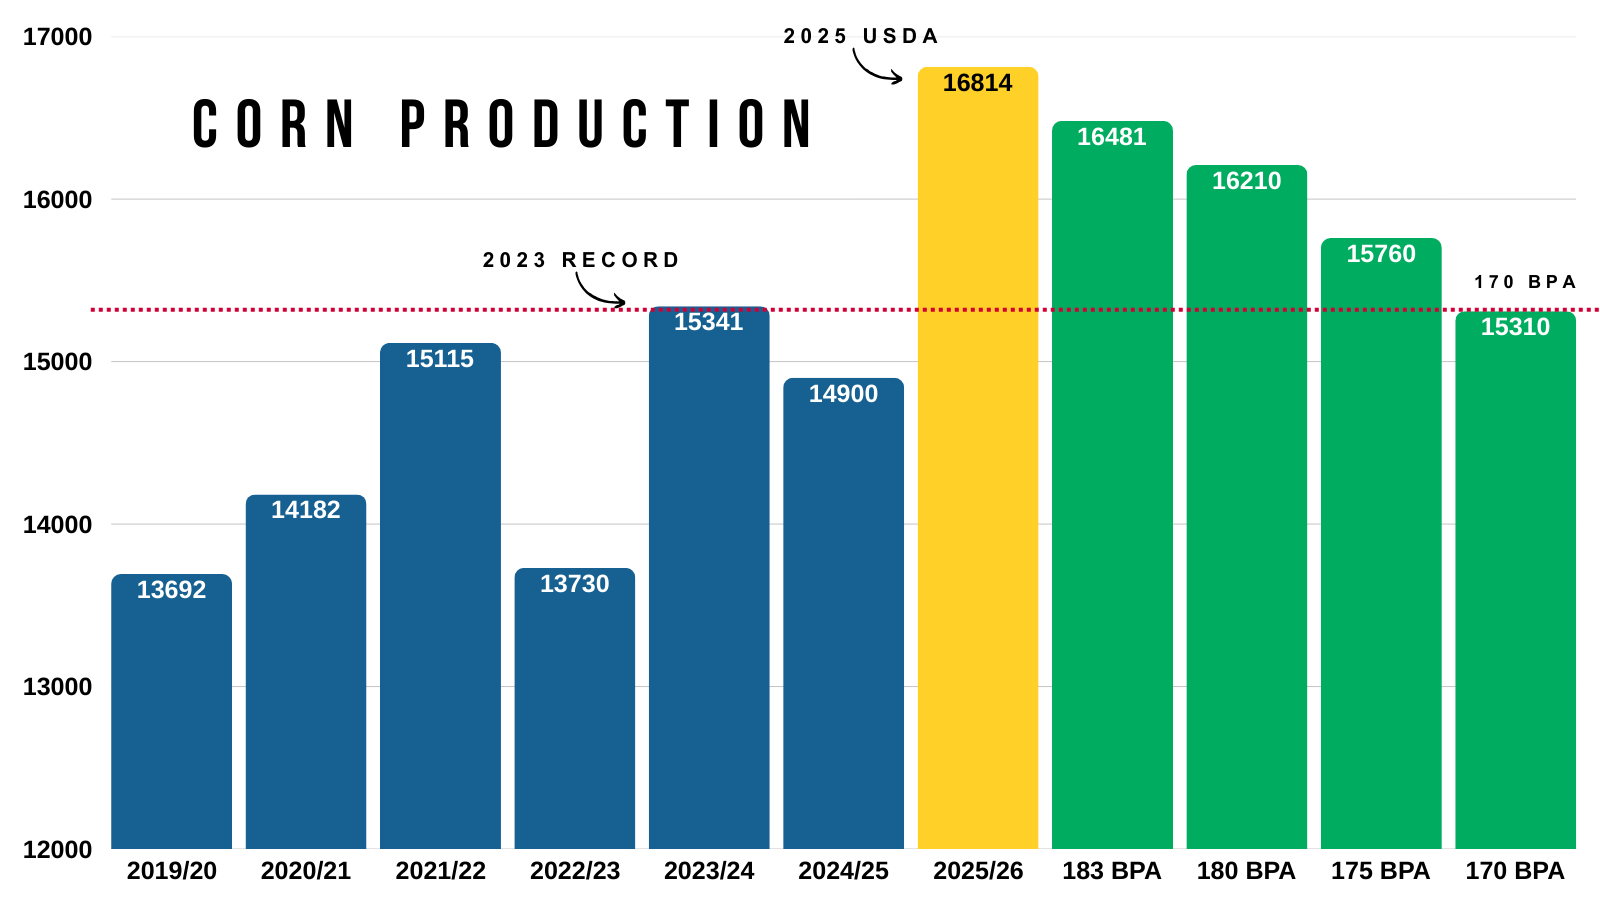
Looking towards the Jan report, I've shown this chart before.
We have a yield of 186.
The biggest drop we've seen in the Jan report in recent memory was -3.80 bpa back in both 2020 and 2024.
Which would put us in that 182-183 range if we saw that same size of drop.
So it's probably more reasonable to think we see them peg yield around there rather than 180 or lower. It could happen, but we've never seen a yield drop of that magnitude before.
We did just go a few months without having a report, and some of their data might not have been the best. So perhaps we do see a bigger change than normal. But it would take the biggest drop we've ever seen to get down to 180.
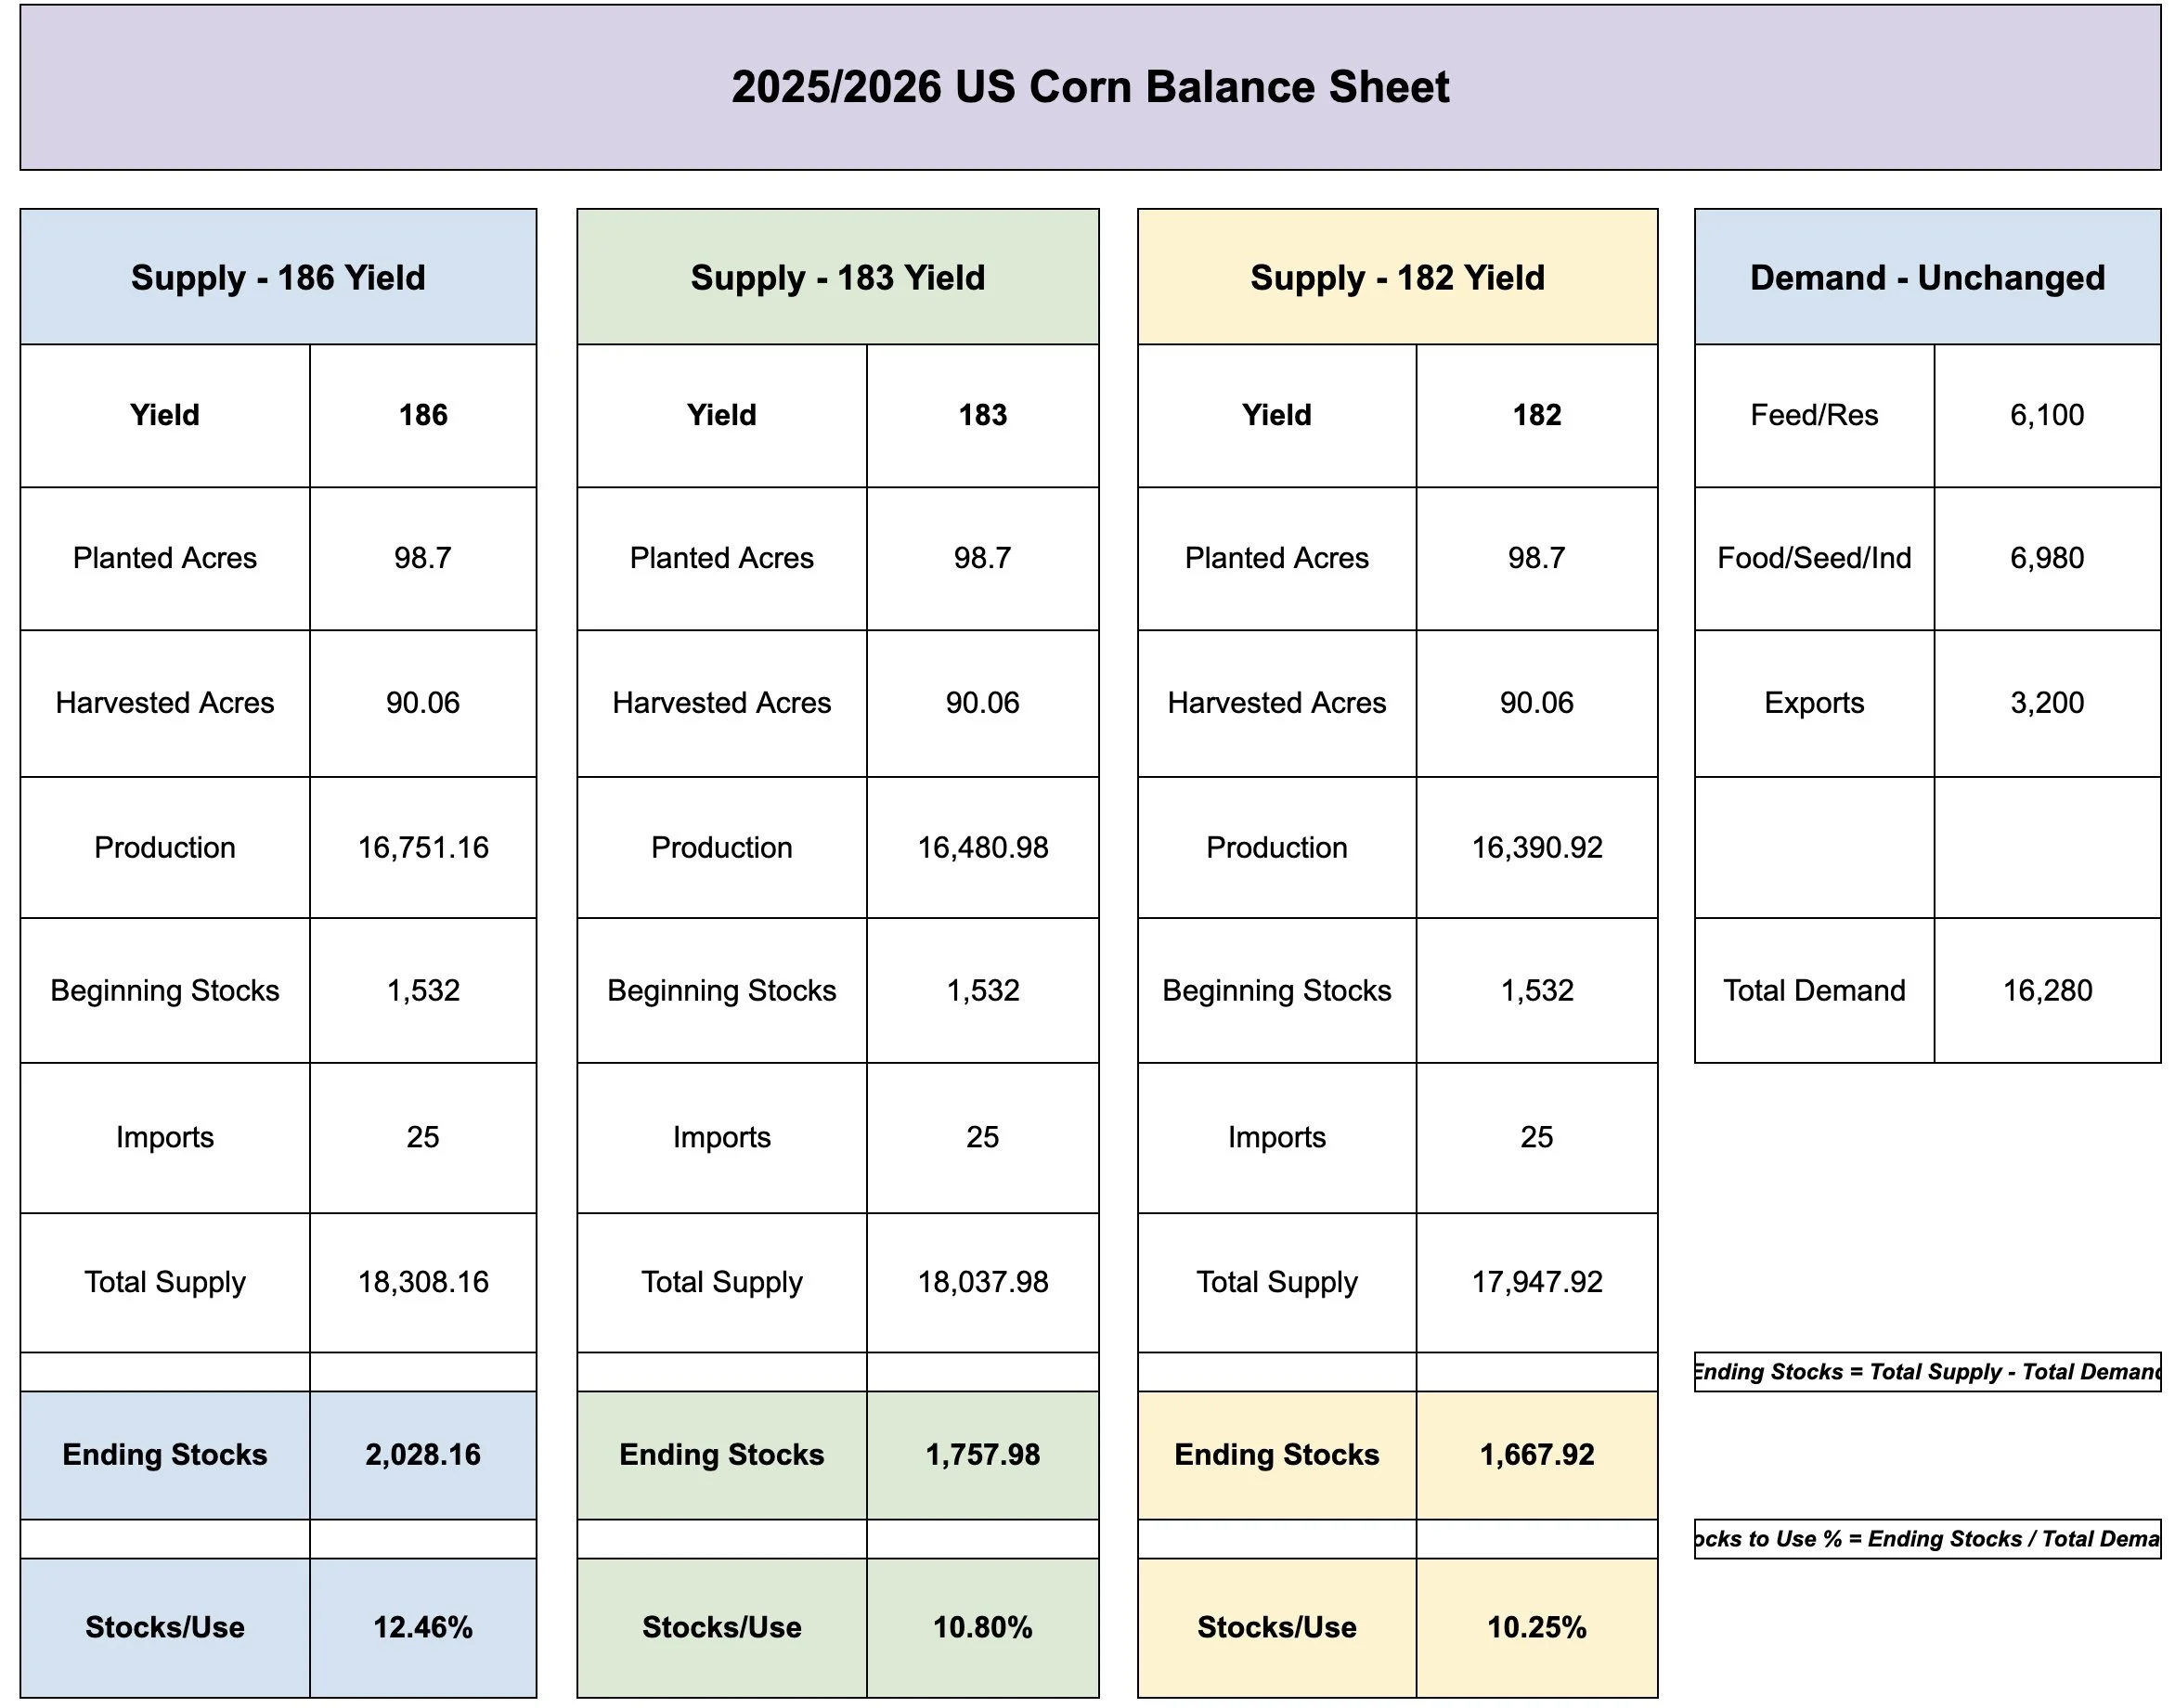
What would it take to get a situation similar to last year?
Where our stocks to use ratio climbs into that 10% range?
Here are balance sheet scenarios for a 183 and 182 yield, without changing the demand side at all.
A 183 yield without touching demand, puts the corn market in a situation that isn’t "super" bullish but not overly bearish either.
A 182 yield puts you almost where we were at last year. Creeping towards that 10% level.
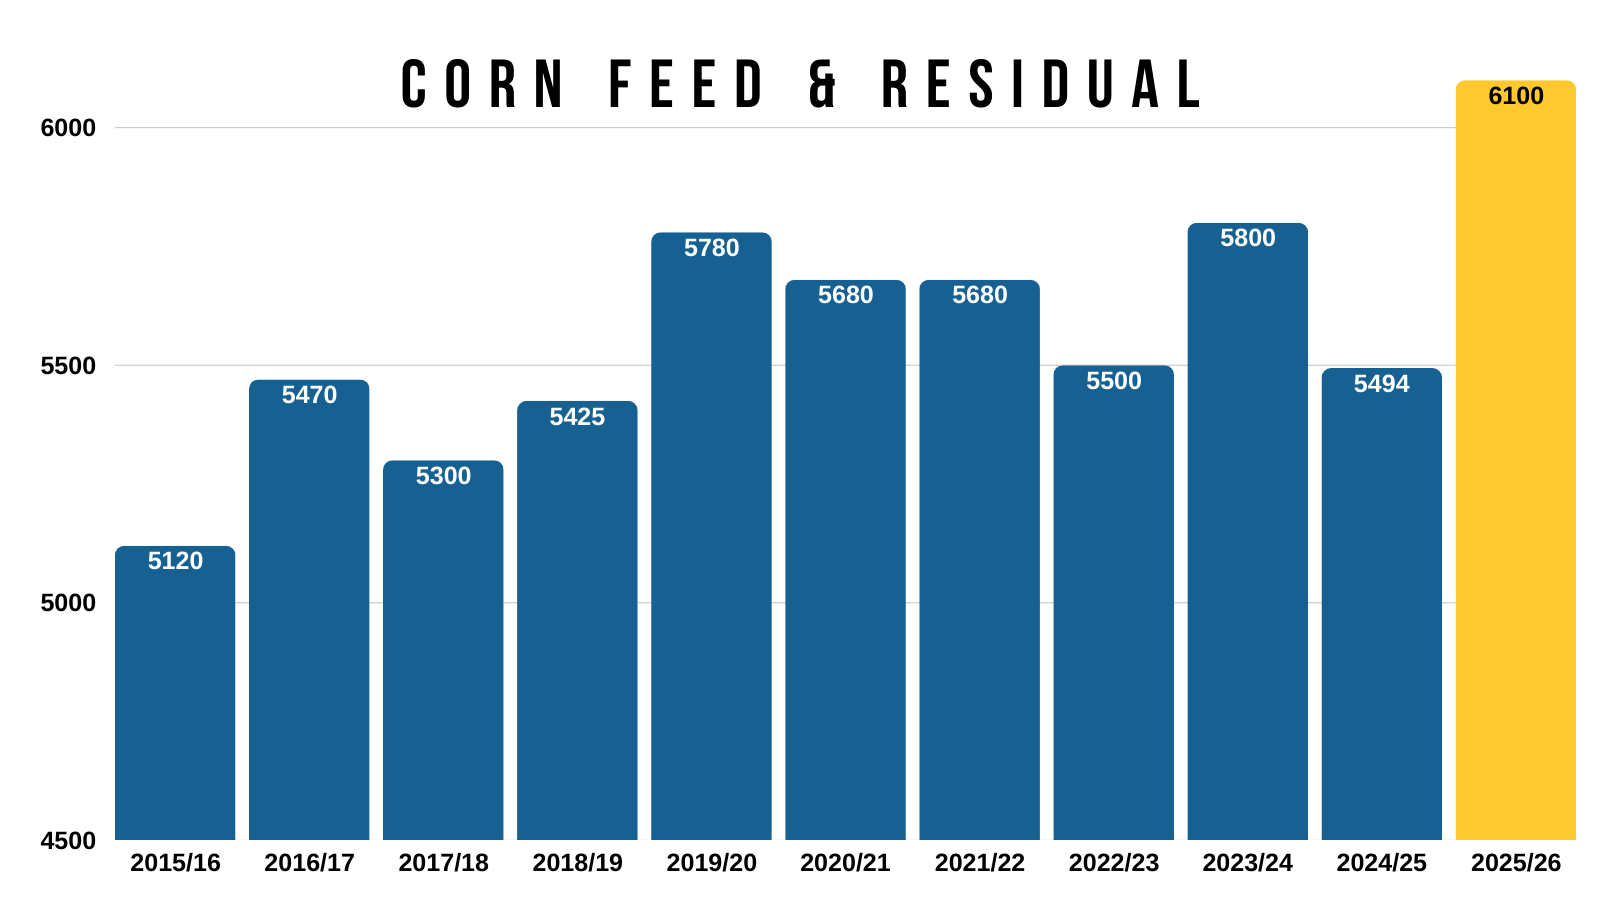
But again.. this is without touching demand. If the USDA drops yield, I am pretty confident they will drop feed and residual demand to offset some losses.
The other question is do exports continue to be bumped higher?
(Pinch to zoom in on the numbers)
As there is a very good arguement to be made that feed and residual is too high to begin with.
As it's projected to be up over +600 million vs last year, despite animal units being roughly the same.
Consensus agrees that this number isn’t really justified.
So what probably happens is we get that yield cut in January, but they then offset some of that supply loss by cutting feed demand.
They did this on purpose to give themselves some wiggle room on the balance sheet. As they know yield will come down to some extent.
Exports on the other hand are justified.
Export demand is phenomenal for corn.
It is the sole reason you can’t get too bearish on corn.
We are selling and shipping more corn than ever before.
With the increase today, the USDA export projection is up +13% vs last year. Which was a record year for demand.
The last time we had a record large crop was 2023.
We will break that record this year.
However.. export demand is projected to be up a massive +42% from 2023.
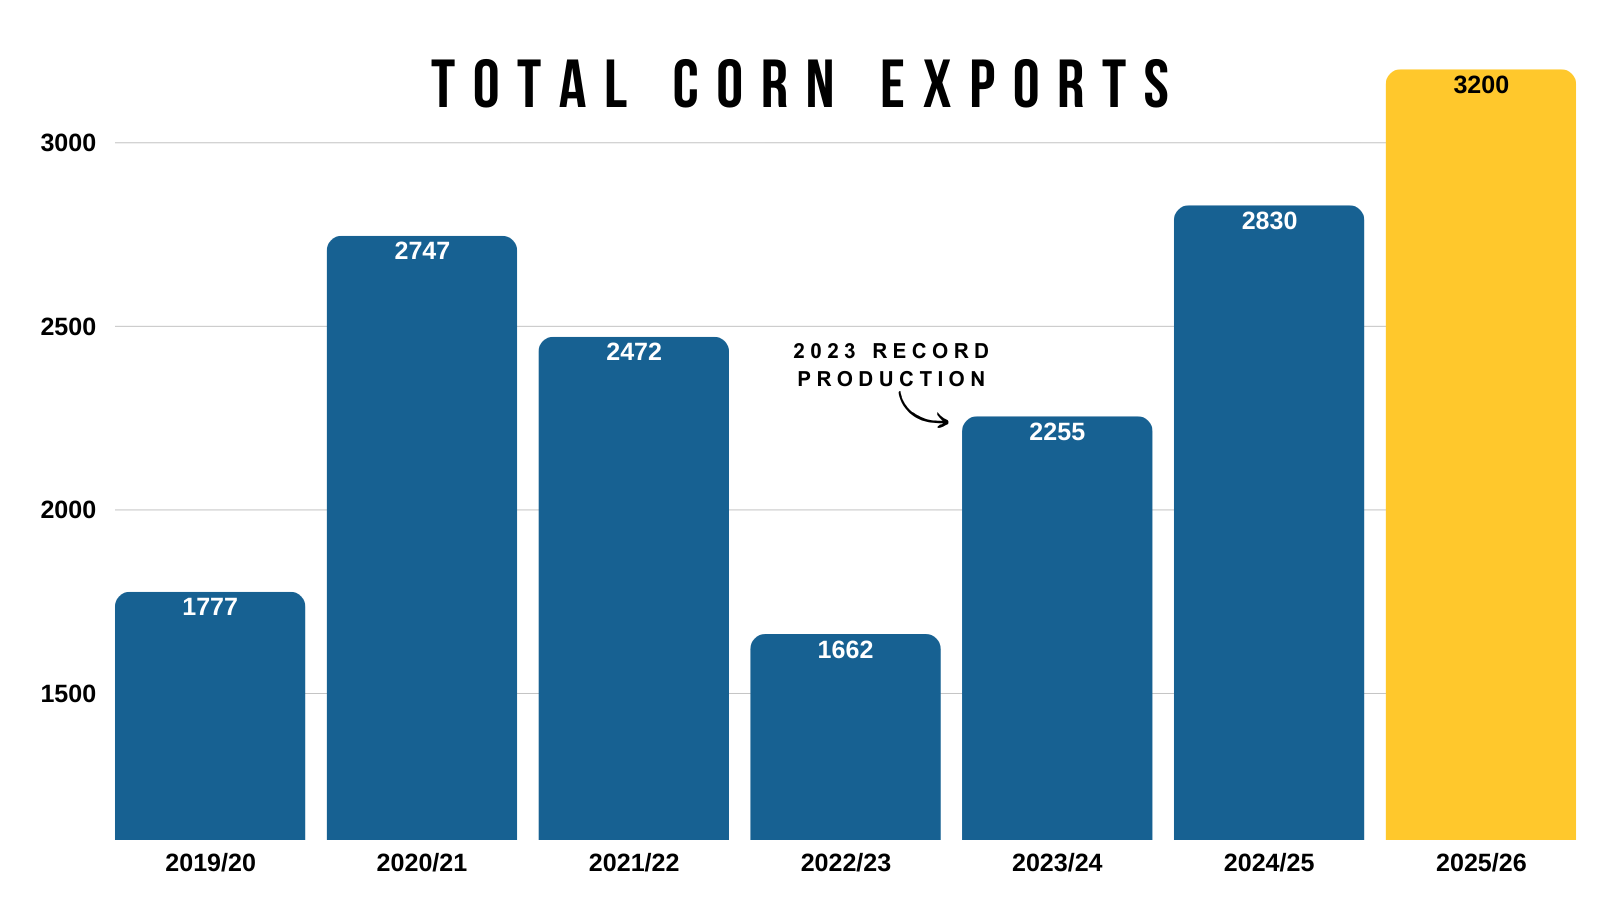
You can’t doubt the USDA's choice to raise exports once again.
Our export inspections are up +70% vs last year.
They are up a whopping +210% compared to the 5-year average.
Absolute monster demand for corn.

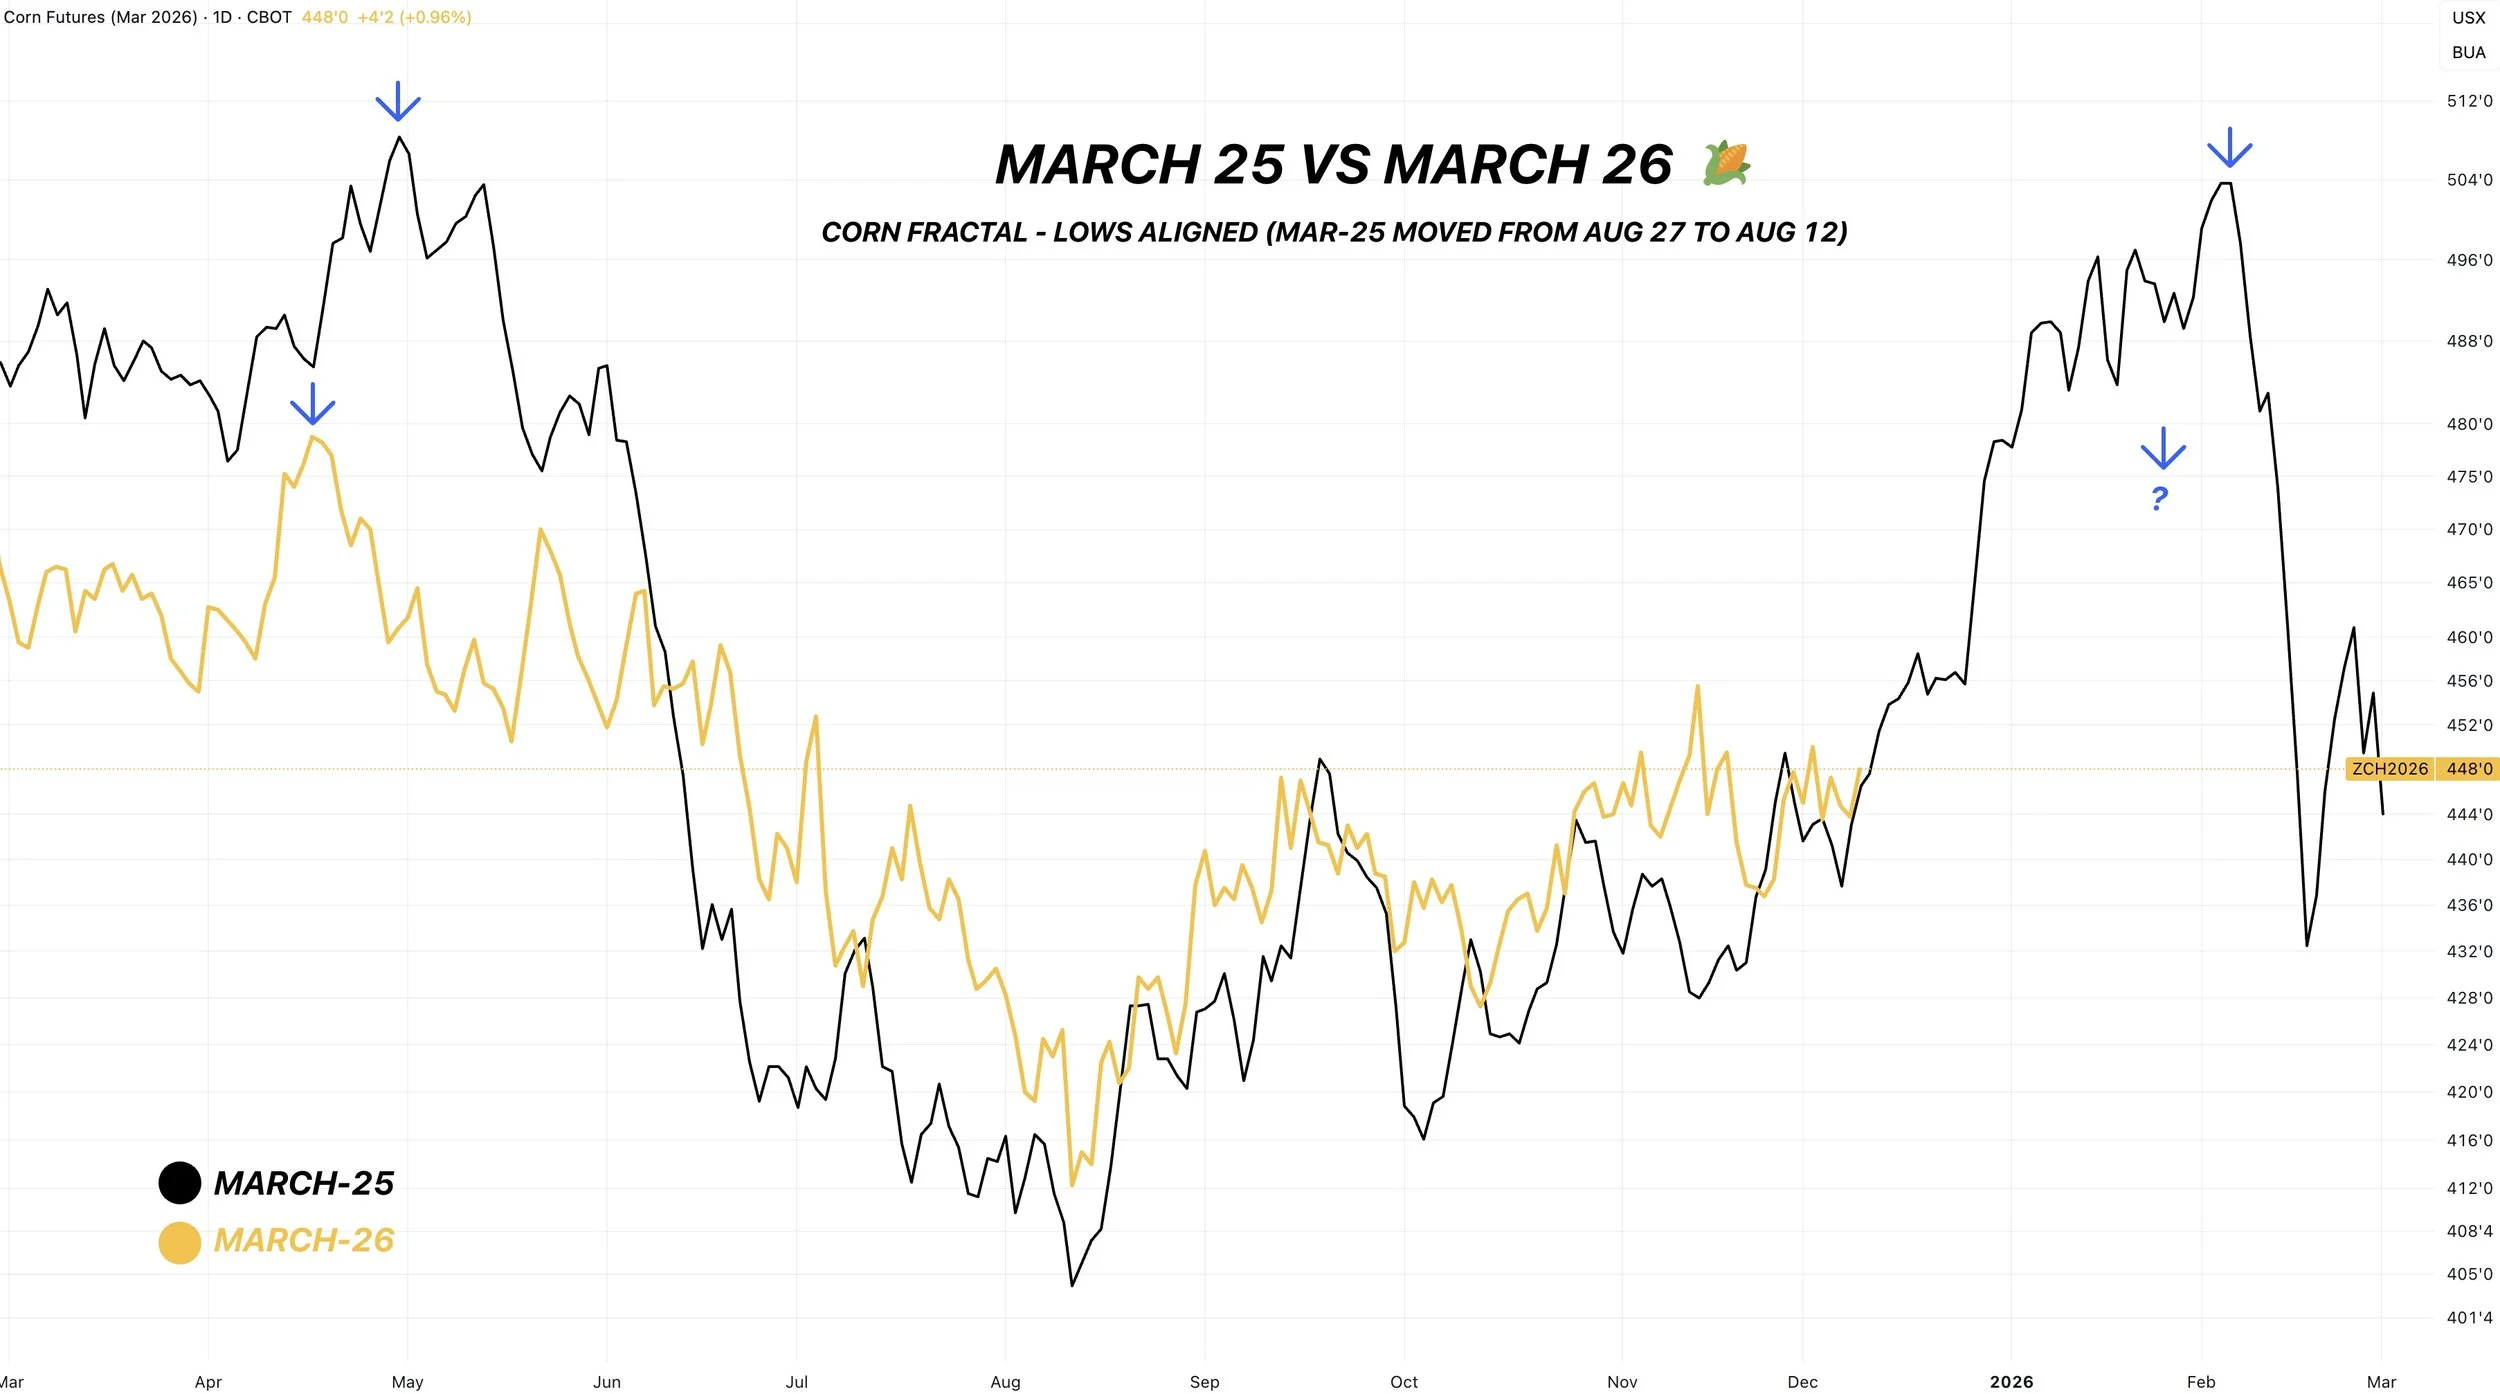
Based on the current fundamentals and record large acres, last year's situation heading into the end of the year was viewed as more friendly than the current situation we are in today.
Last year March corn ran from $4.04 in August up to $5.04 in February. An entire +$1.00 rally.
Last year, we essentially just revisted our highs from spring.
If we were to do that again this year, and revisit our April highs, it would put corn in that $4.70 to $4.80 range.
But another thing to keep in mind is that last year's rally did somewhat get muted as focus started shifting to the utterly massive acres we would eventually see.
Then you do always have the possibility of a weather scare in the summer, which is something we haven’t seen since 2023.
But based on the current fundamentals and what we know, it is reasonable to think that the $4.70 to $4.80 range is very attainable.
World Corn Situation
This is the last thing I wanted to touch on today.
Our world stocks to use ratio is the tightest in over a decade.
Does this matter today?
No not exactly.. as the US currently has plenty of supply given our record crop.
What does this mean?
It means the world as a whole is the tightest it's ever been on corn. This is with the record US crop and big Brazil crop.
The world needs our corn.
If the US (or Brazil) ever run into a production issue, or if China ever ends up buying US corn, this could end up being a game changer.
None of those have to happen.
But if the world is the tightest it's been on corn in over a decade.. and the world's largest producer (the US) runs into even just a weather scare, this chart right here could flip this market drastically.
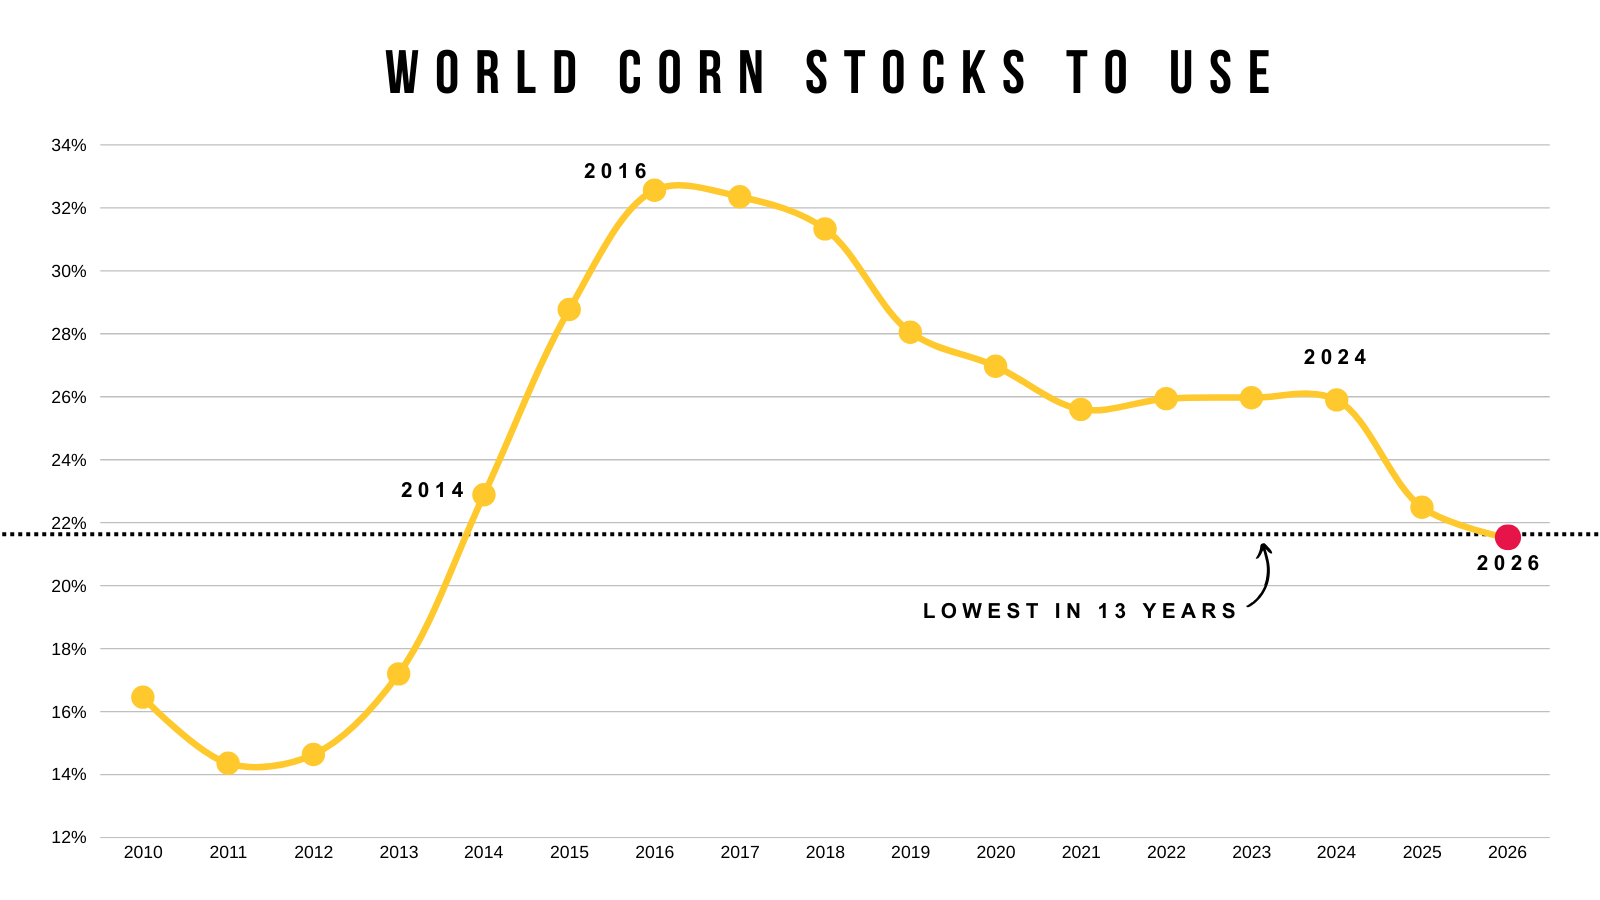
But for now, the tight world situation doesn’t matter that much.
As the US has a record crop.
I've shown this plenty of times, but it would take a yield of 170 for us to NOT see a record crop.
That is a big crop.
Technicals:
March Corn
Corn is still at some pretty big resistance here.
The $4.50 level has clearly been hard to get through. As we've been trapped under it for the last 40 days.
We are also sitting right at the 200-day MA.
Breaking above the 200-day MA for more than one day in a row would be a very good sign. As we haven’t done that since May really.
But really we need to break that $4.50 level to open the door higher.
Since we took risk off the table and alerted a sell signal at $4.50. Our next target is still $4.73 as that is 161.8% of the rally from contract lows to our September highs.
We still need to hold this red box. As it gives back 50-61.8% of the rally from October.

Soybeans
Fundamentals:
We aren’t going to dive into the fundamentals today in soybeans as the USDA provided zero fresh data or changes.
The biggest thing is going to be South America and whether they run into a weather issue or not. As the next month or so is going to make or break that crop. Currently they don’t seem to be having major issues despite being on the dry side the last month.
I do think China meets their purchase goal of 12 million metric tons. The problem is that Bessent and the government pushed that deadline back to February rather than the end of the year. So that disappointment has been a large part of this sell off.
The soybean situation here in the US isn’t bearish, and I still think this market has "potential". With the small acres and slim room for error on the supply side here in the US.
Bulls just need to be fed to justify more upside.
Whether that is a ton of China purchases or production issues in South America. Neither of which we've seen yet.
Technicals:
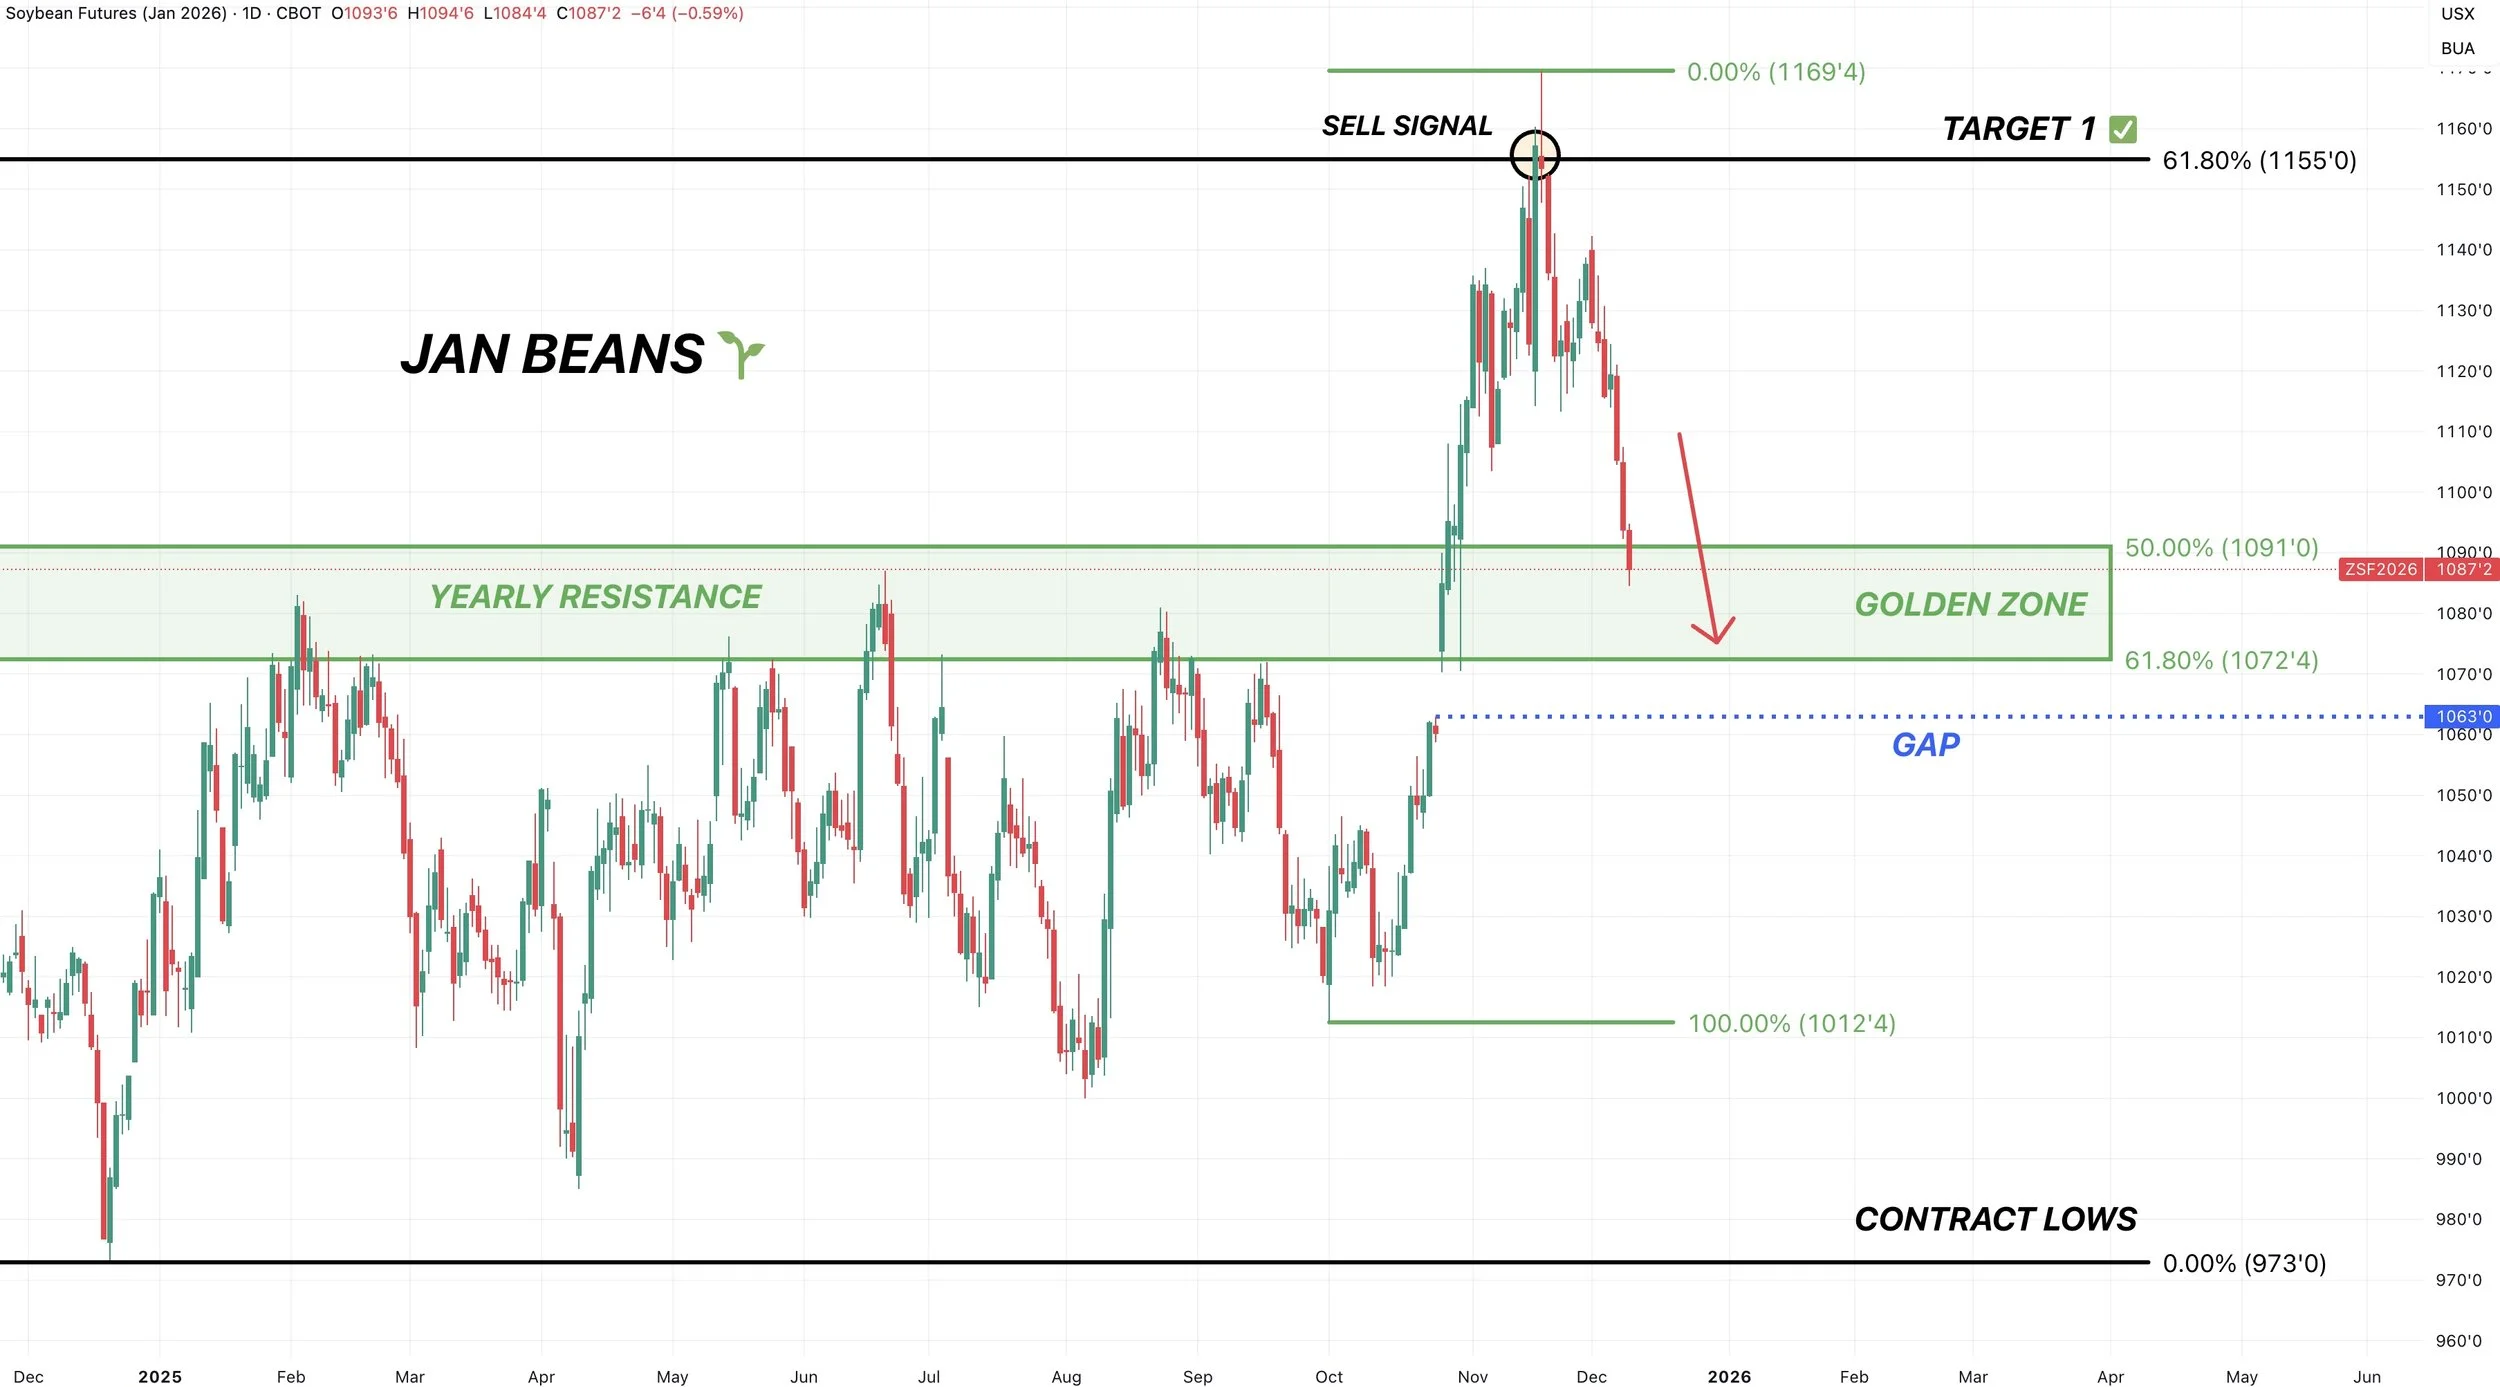
Jan Beans
Soybeans are now down over -80 cents off their highs and our sell signal from November 17th.
Where could the bottom be?
The last few weeks I've been talking about this green box being a point of interest.
50-61.8% of the entire rally we saw (61.8% is the most common level).
That is a normal-sized correction and usually where the market decides if this is simply a correction or if we are truly starting to roll over.
Not only that, the 61.8% level almost perfectly lines up with our yearly resistance, where we rejected countless times this year. It is now viewed as support.
So I'd like to think we can find some footing around there.
Everyone is talking about that gap.
Could we fill it? Very possible.
Do we have to fill it? No we don’t.
This was a break away gap. The typical rule of thumb is that if a gap isn’t filled in a few days it doesn’t have to be filled.
I could easily see a situation where traders wait for that gap fill, then we bounce before hand at that 61.8% level and they get left waiting for a gap that doesn’t fill.
I am not saying it "can’t" happen. I am just saying it does not "have" to happen.
That 61.8% level at $10.72 is very important to hold.
It makes sense to bounce there, but if it breaks, we could go deeper than just the gap. As a lot of times if you break below the 61.8% level, it tells us this is more just than a normal correction.
Wheat
The wheat market probably had the most bearish report.
As world carryout surprised high and let us know once again that the world simply has an ample amount of supply.
Here is the changes the USDA made to the world balance sheets.
They bumped several countries.
Chart from Brock Report
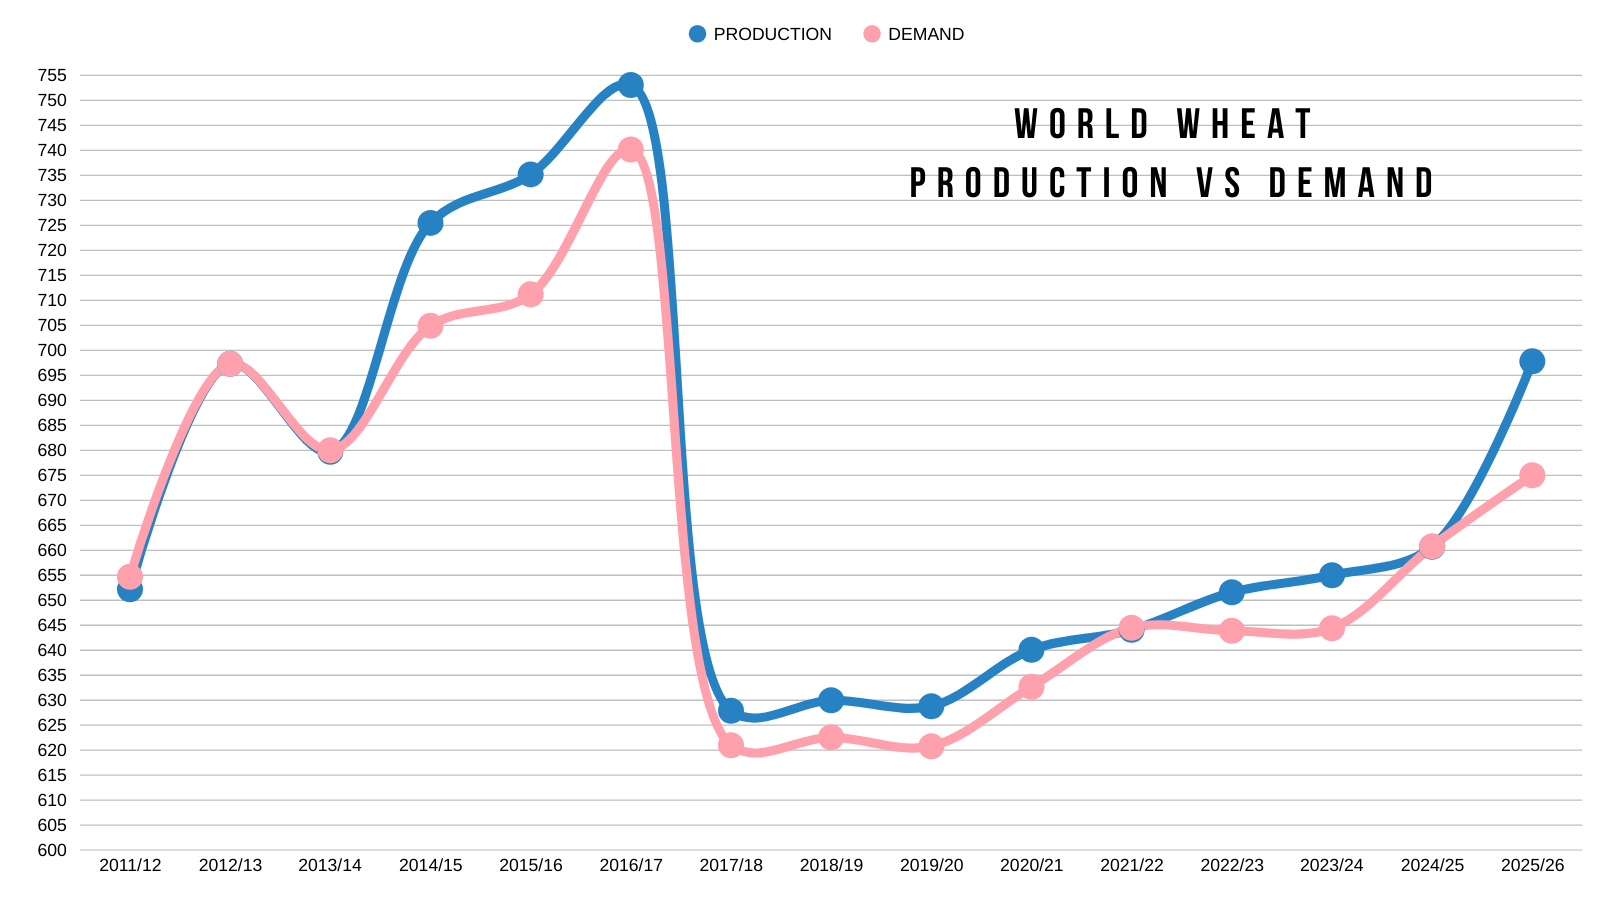
For reference, here is the world wheat production and demand overlaid on top of each other.
Do you notice how production has diverted heavily from the demand number this year?
(Blue = Production & Pink = Demand)
This is a big reason why the wheat market has sucked.
Production has been outpacing demand globally.
The other issue is the US situation.
Here is the US wheat stocks to use ratio.
It's been on a climb for the last few last years.
The current estimate is the highest in 5 years.
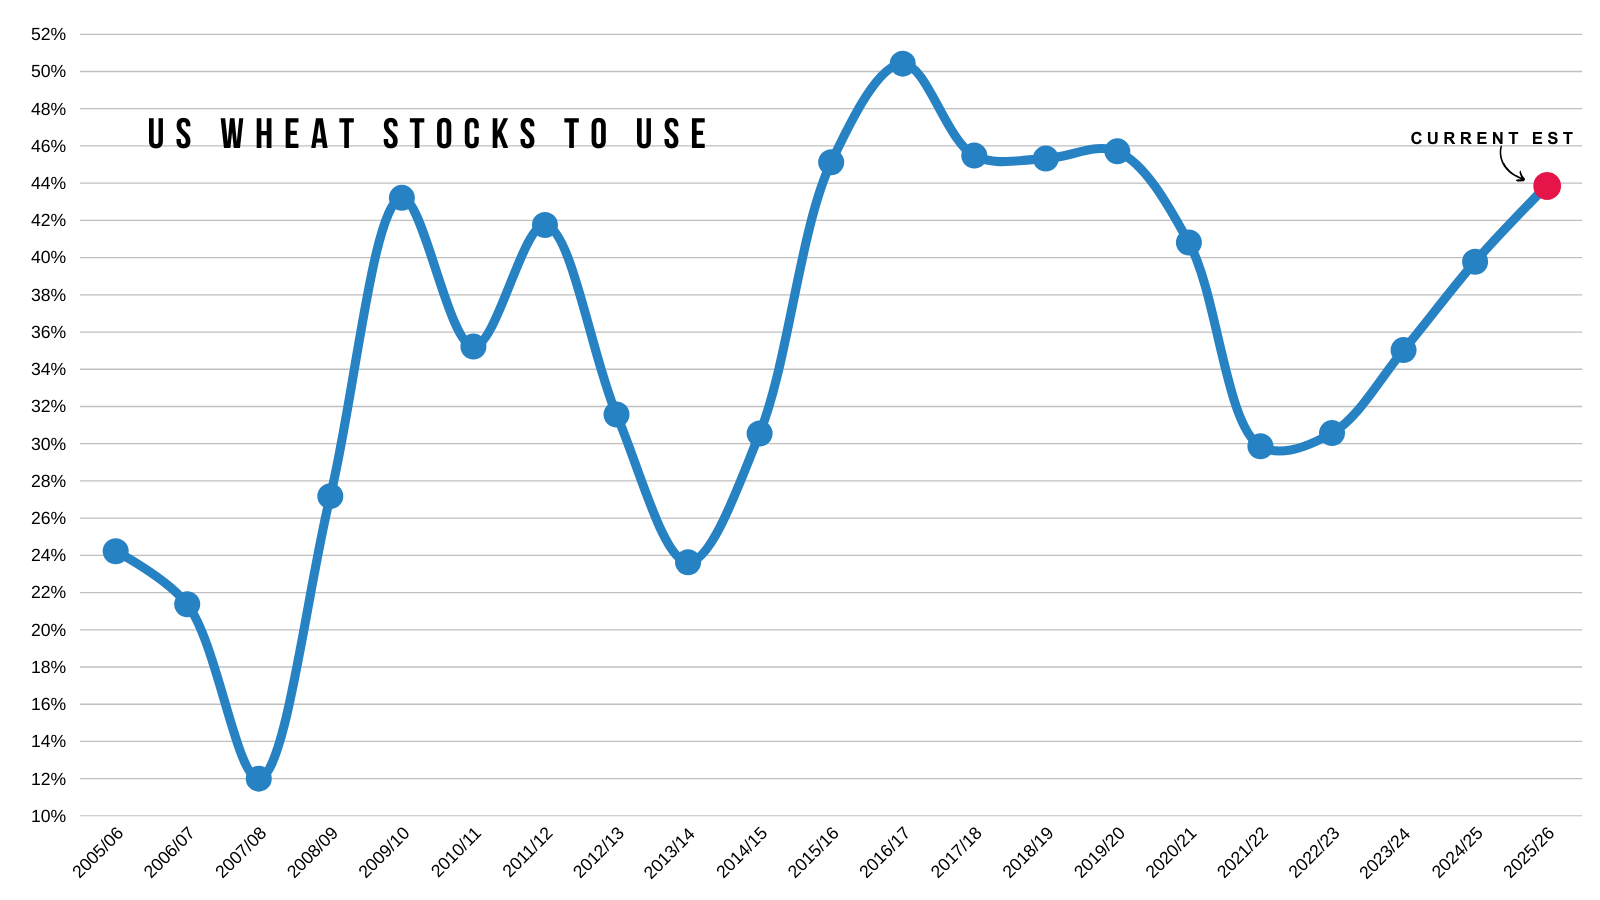
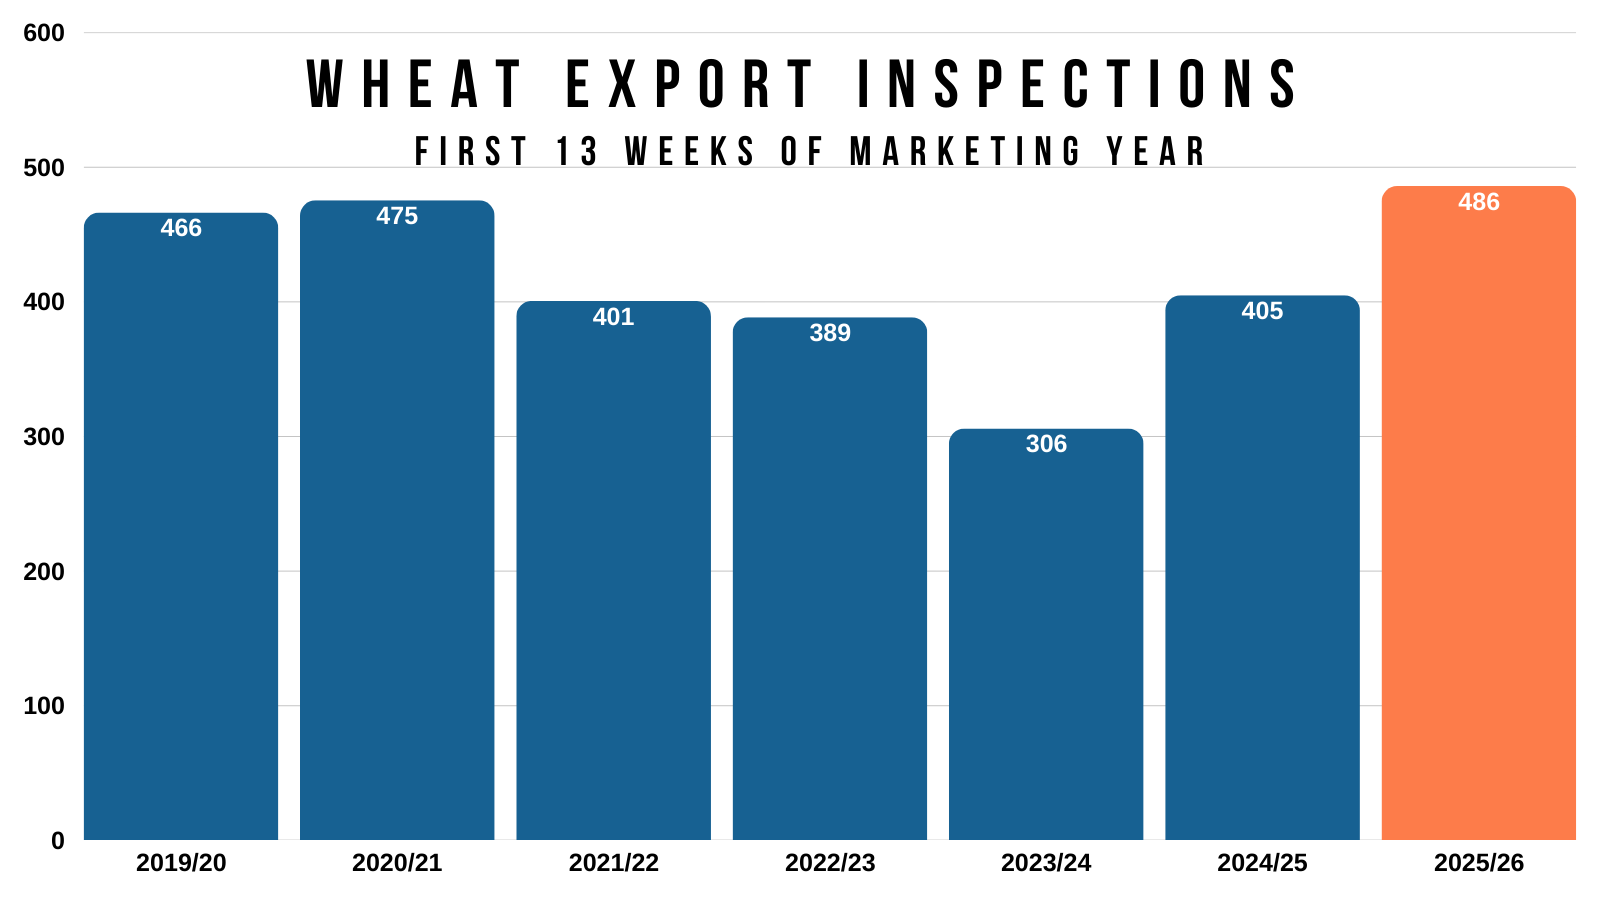
Now on the bright side, exports have continued to be impressive.
Which is one way you can start to tighten up that US situation.
You could make a pretty argument that the USDA is going to need to bump wheat export demand.
Export inspections are up over 20% vs last year.
But overall the wheat market still lacks a true story and catalyst for tremendously higher prices. As there is no concern about supply globally, as there haven’t been any weather issues anywhere really.
Technicals:
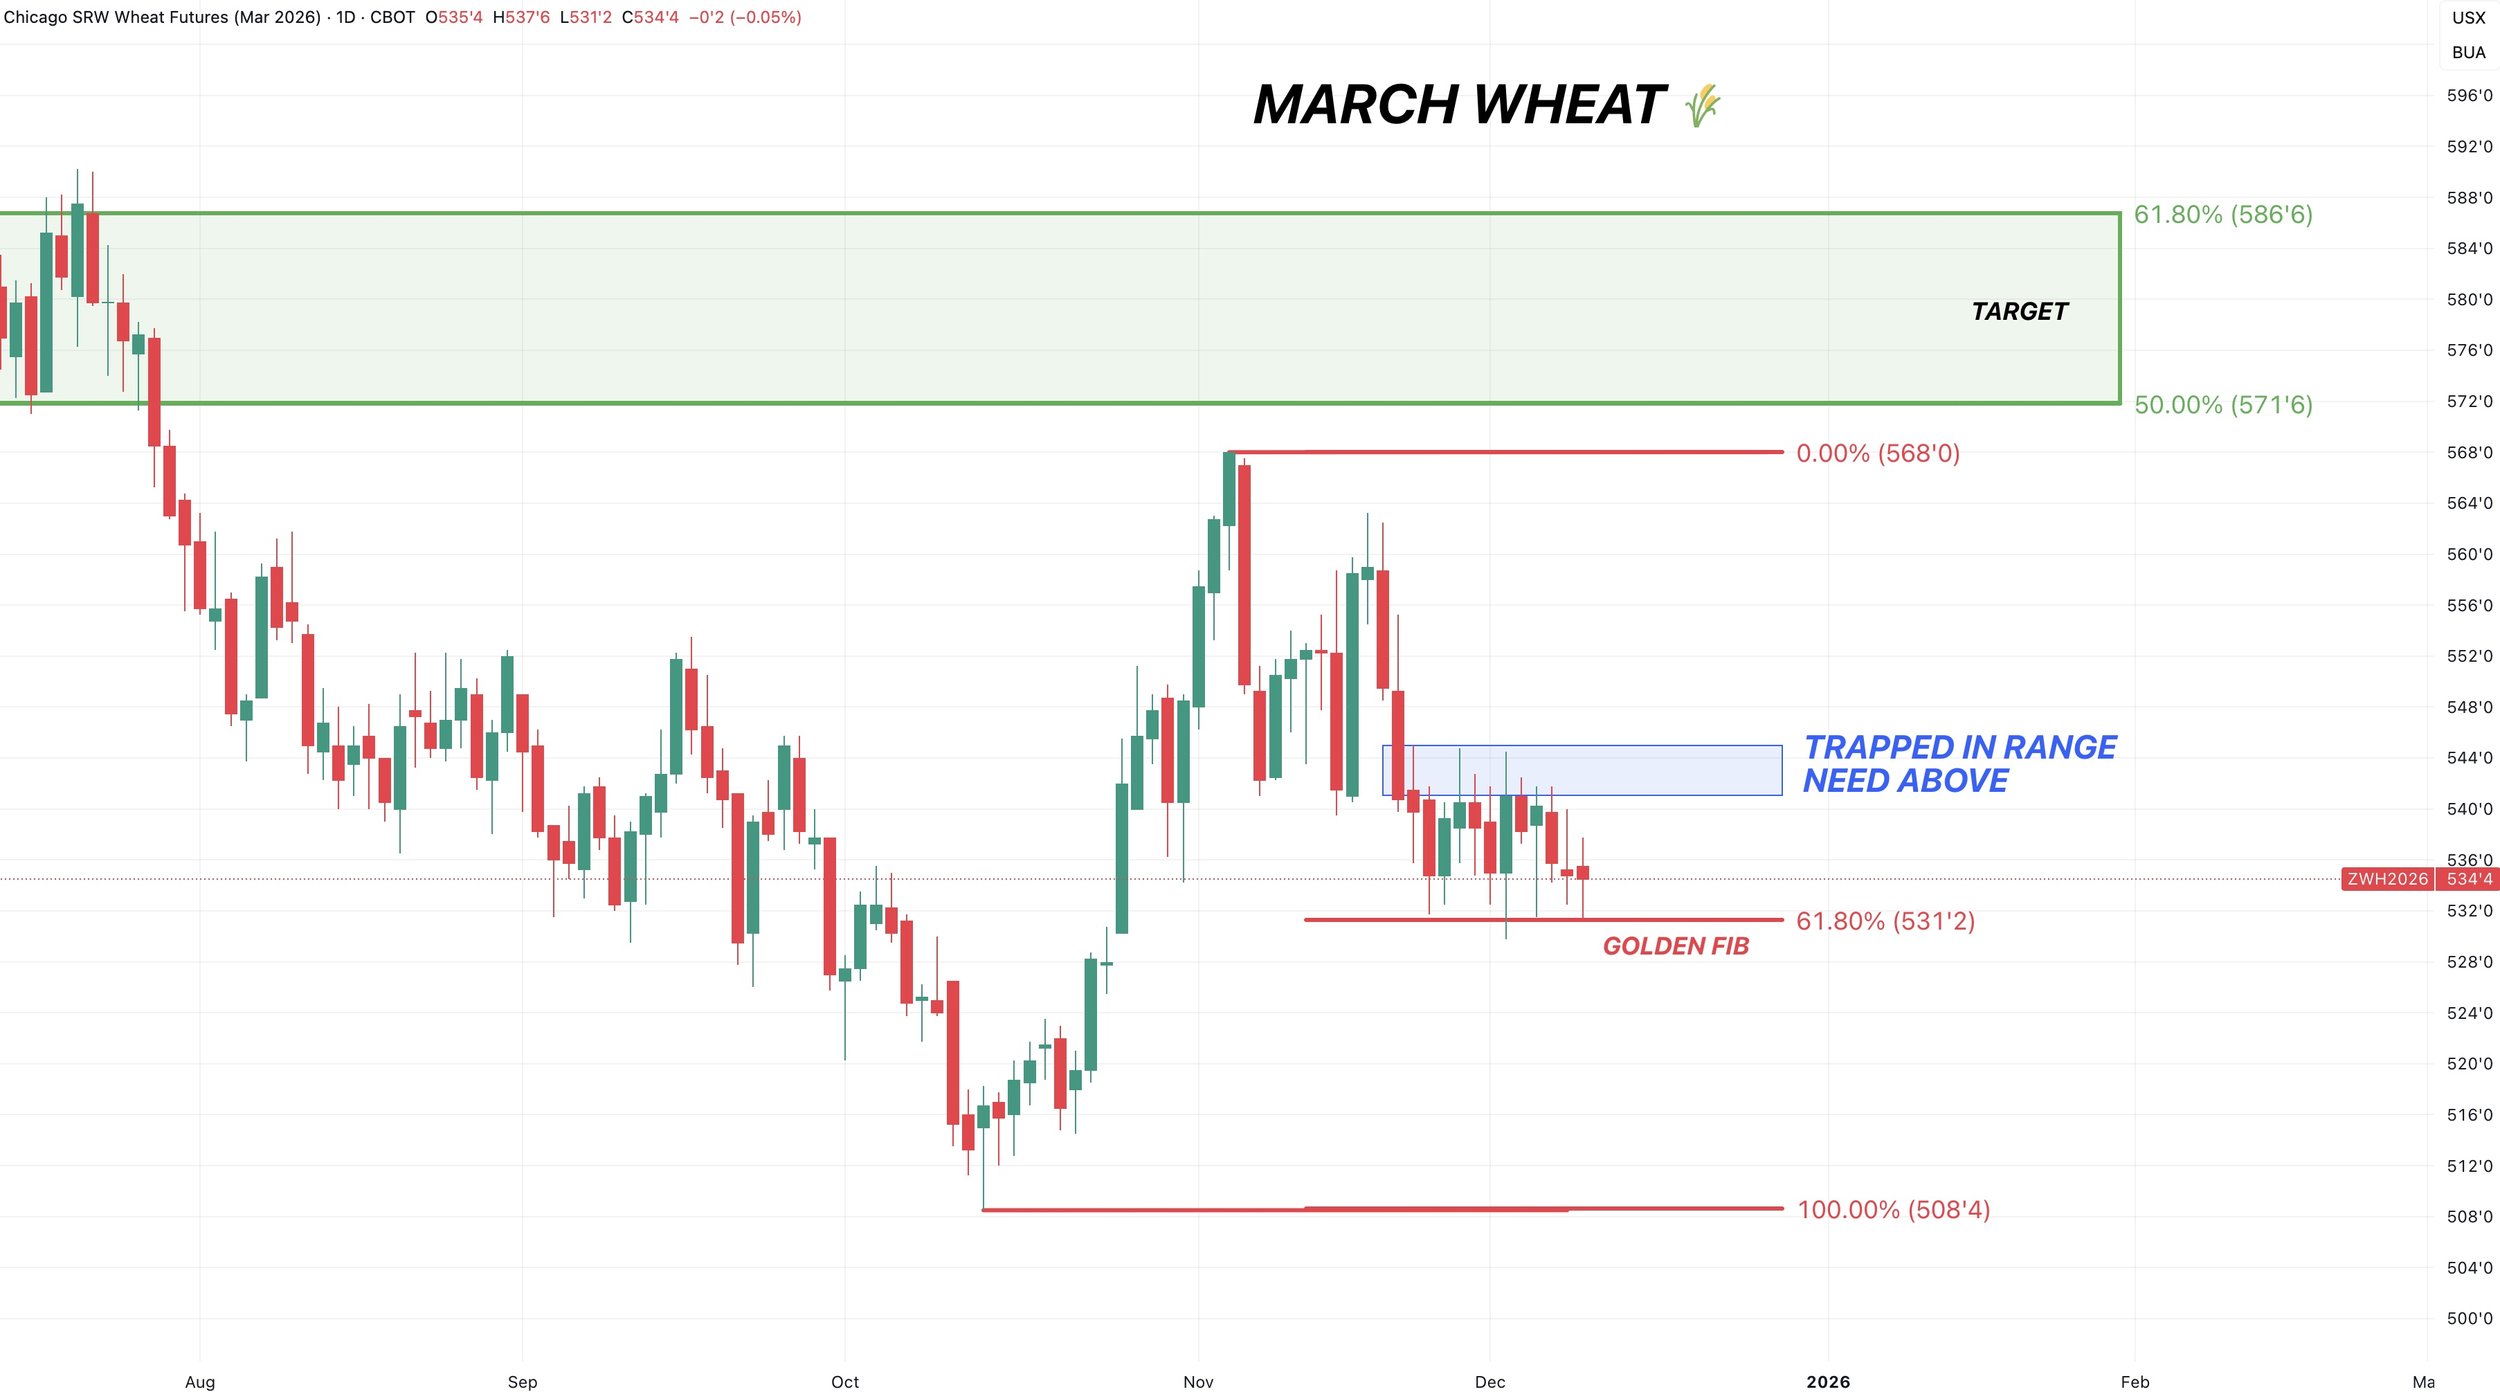
March Wheat
We've been trapped in a very small range for 15 days in a row now.
Trapped under that blue box resistance.
But holding above the golden fib.
(The golden fib gives back 61.8% of the entire rally from contract lows)
So pretty much watching two levels here.
Break above the blue box and our recent highs, we probably get a leg higher.
Break below the golden fib and the door opens lower. Must hold spot.
If we bounce here, it would be a great sign. As bouncing at that 61.8% level means the uptrend is still in tact.
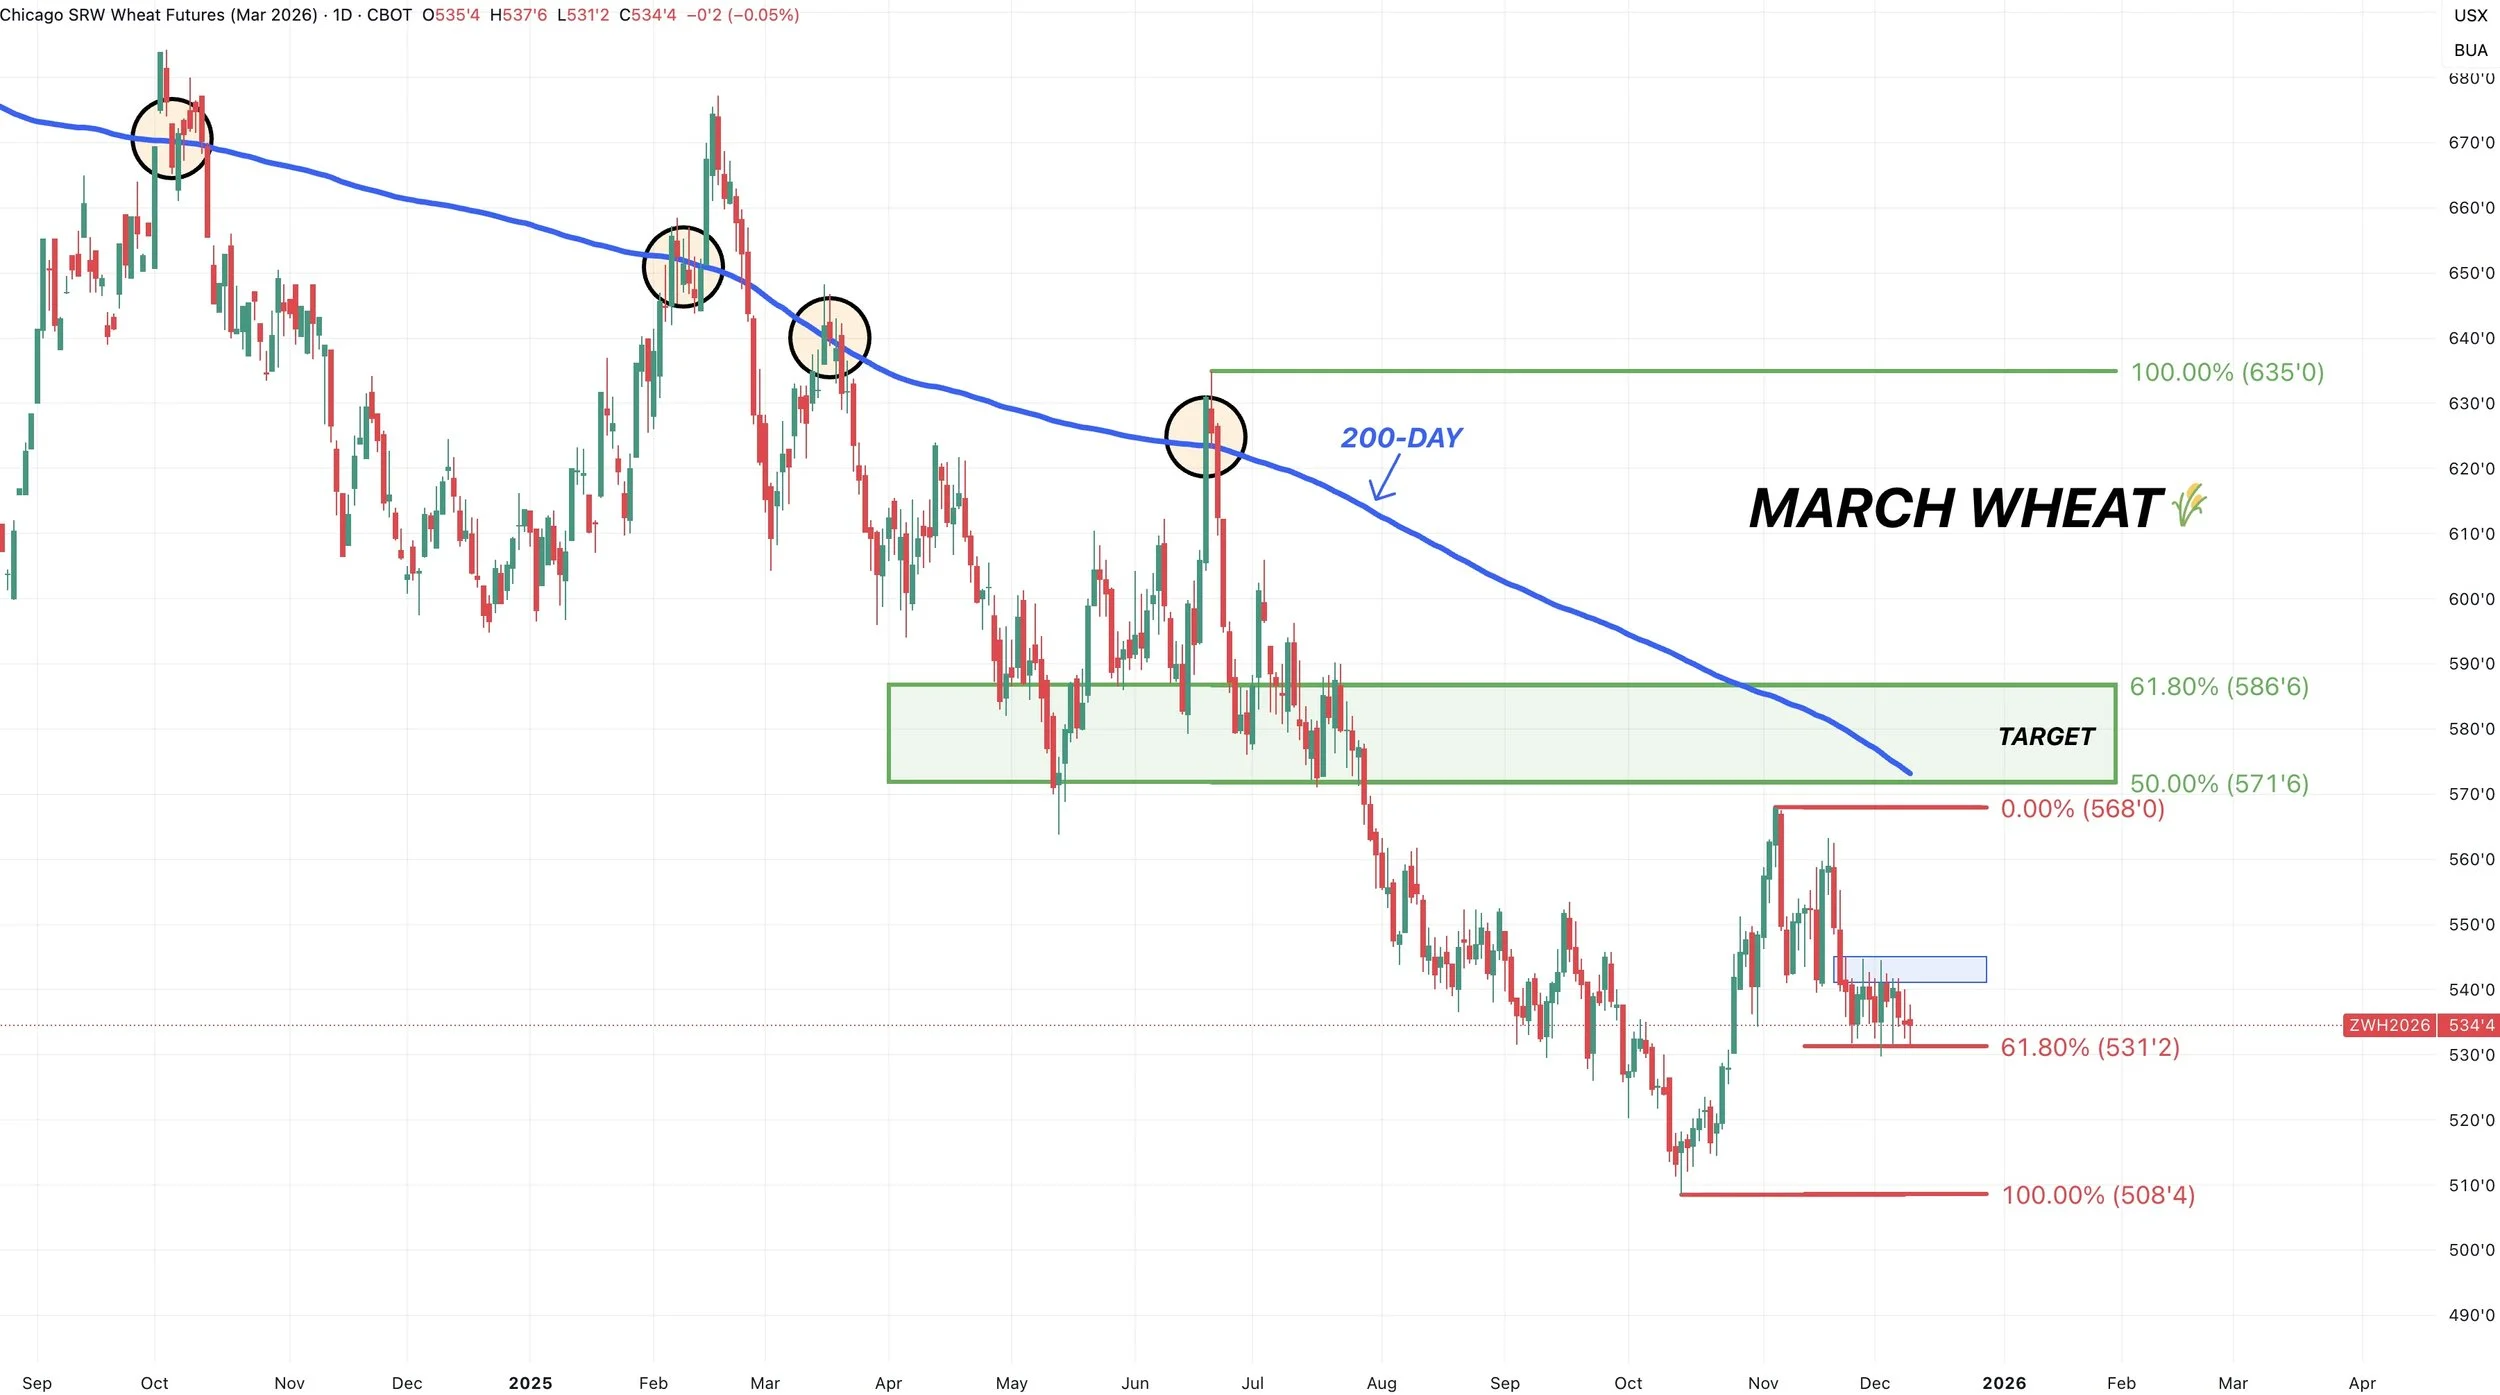
Still looking for the green box to reward this market.
50-61.8% of the June highs.
The 200-day sits there as well. Which the wheat market has struggled to stay above for very long for over a year.
Dec KC Wheat
Very similar chart in KC and Chicago, except we do not have as defined of a range.
Regardless, we just need to hold that 61.8% level at $5.19. That is the must hold spot.
Bounce there and this is seen as a normal correction.
Fail there and this is seen as the start of a bigger sell off.

Cattle
Friday we did alert a cattle sell signal and hedge alert.
We do still like rewarding this rally.
If you missed that alert or want specifics, here is a link to it:
CLICK HERE FOR SIGNAL
Technicals:
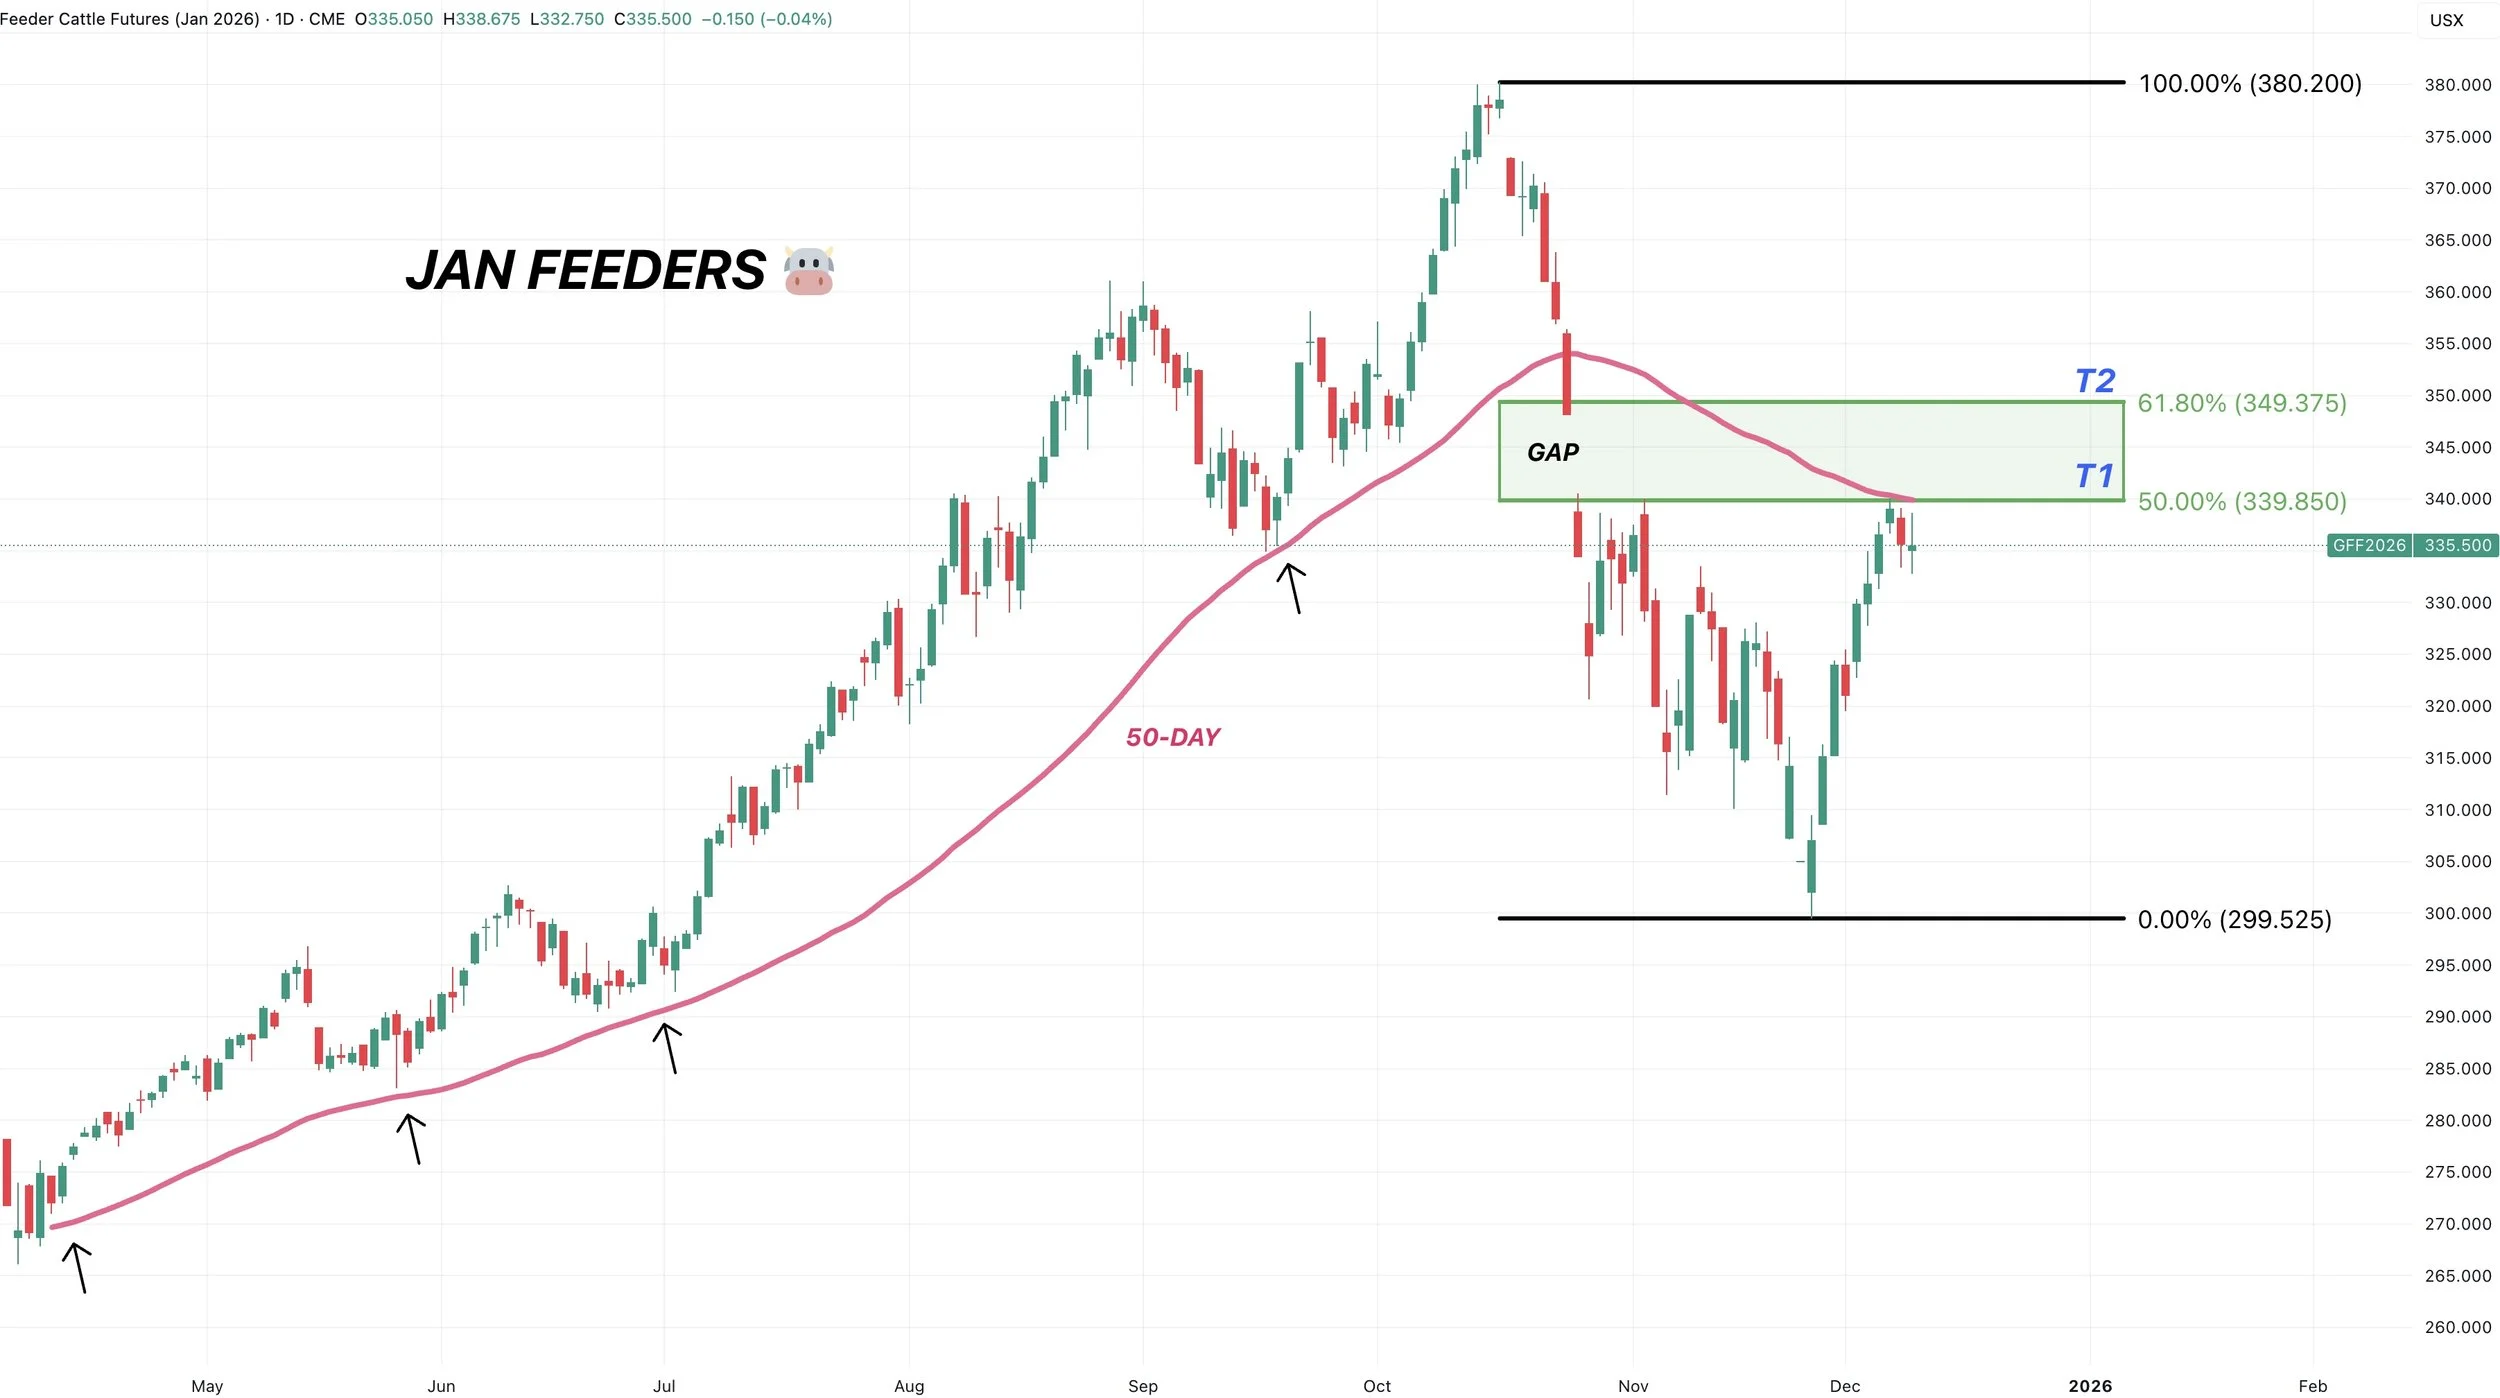
Jan Feeders
So far we are rejecting right at that first target.
As we clawed back exactly 50% of the entire sell off.
Not only that, we tapped the 50-day MA.
The 50-day used to be major support. So it's now resistance.
If this rally were to continue, the secondary target is the 61.8% level. Which lines up with filling that gap. If that hits, we will be looking to further de-risk.
But I am not sure if we have enough juice to get there, hence why we issued an alert on the first target.
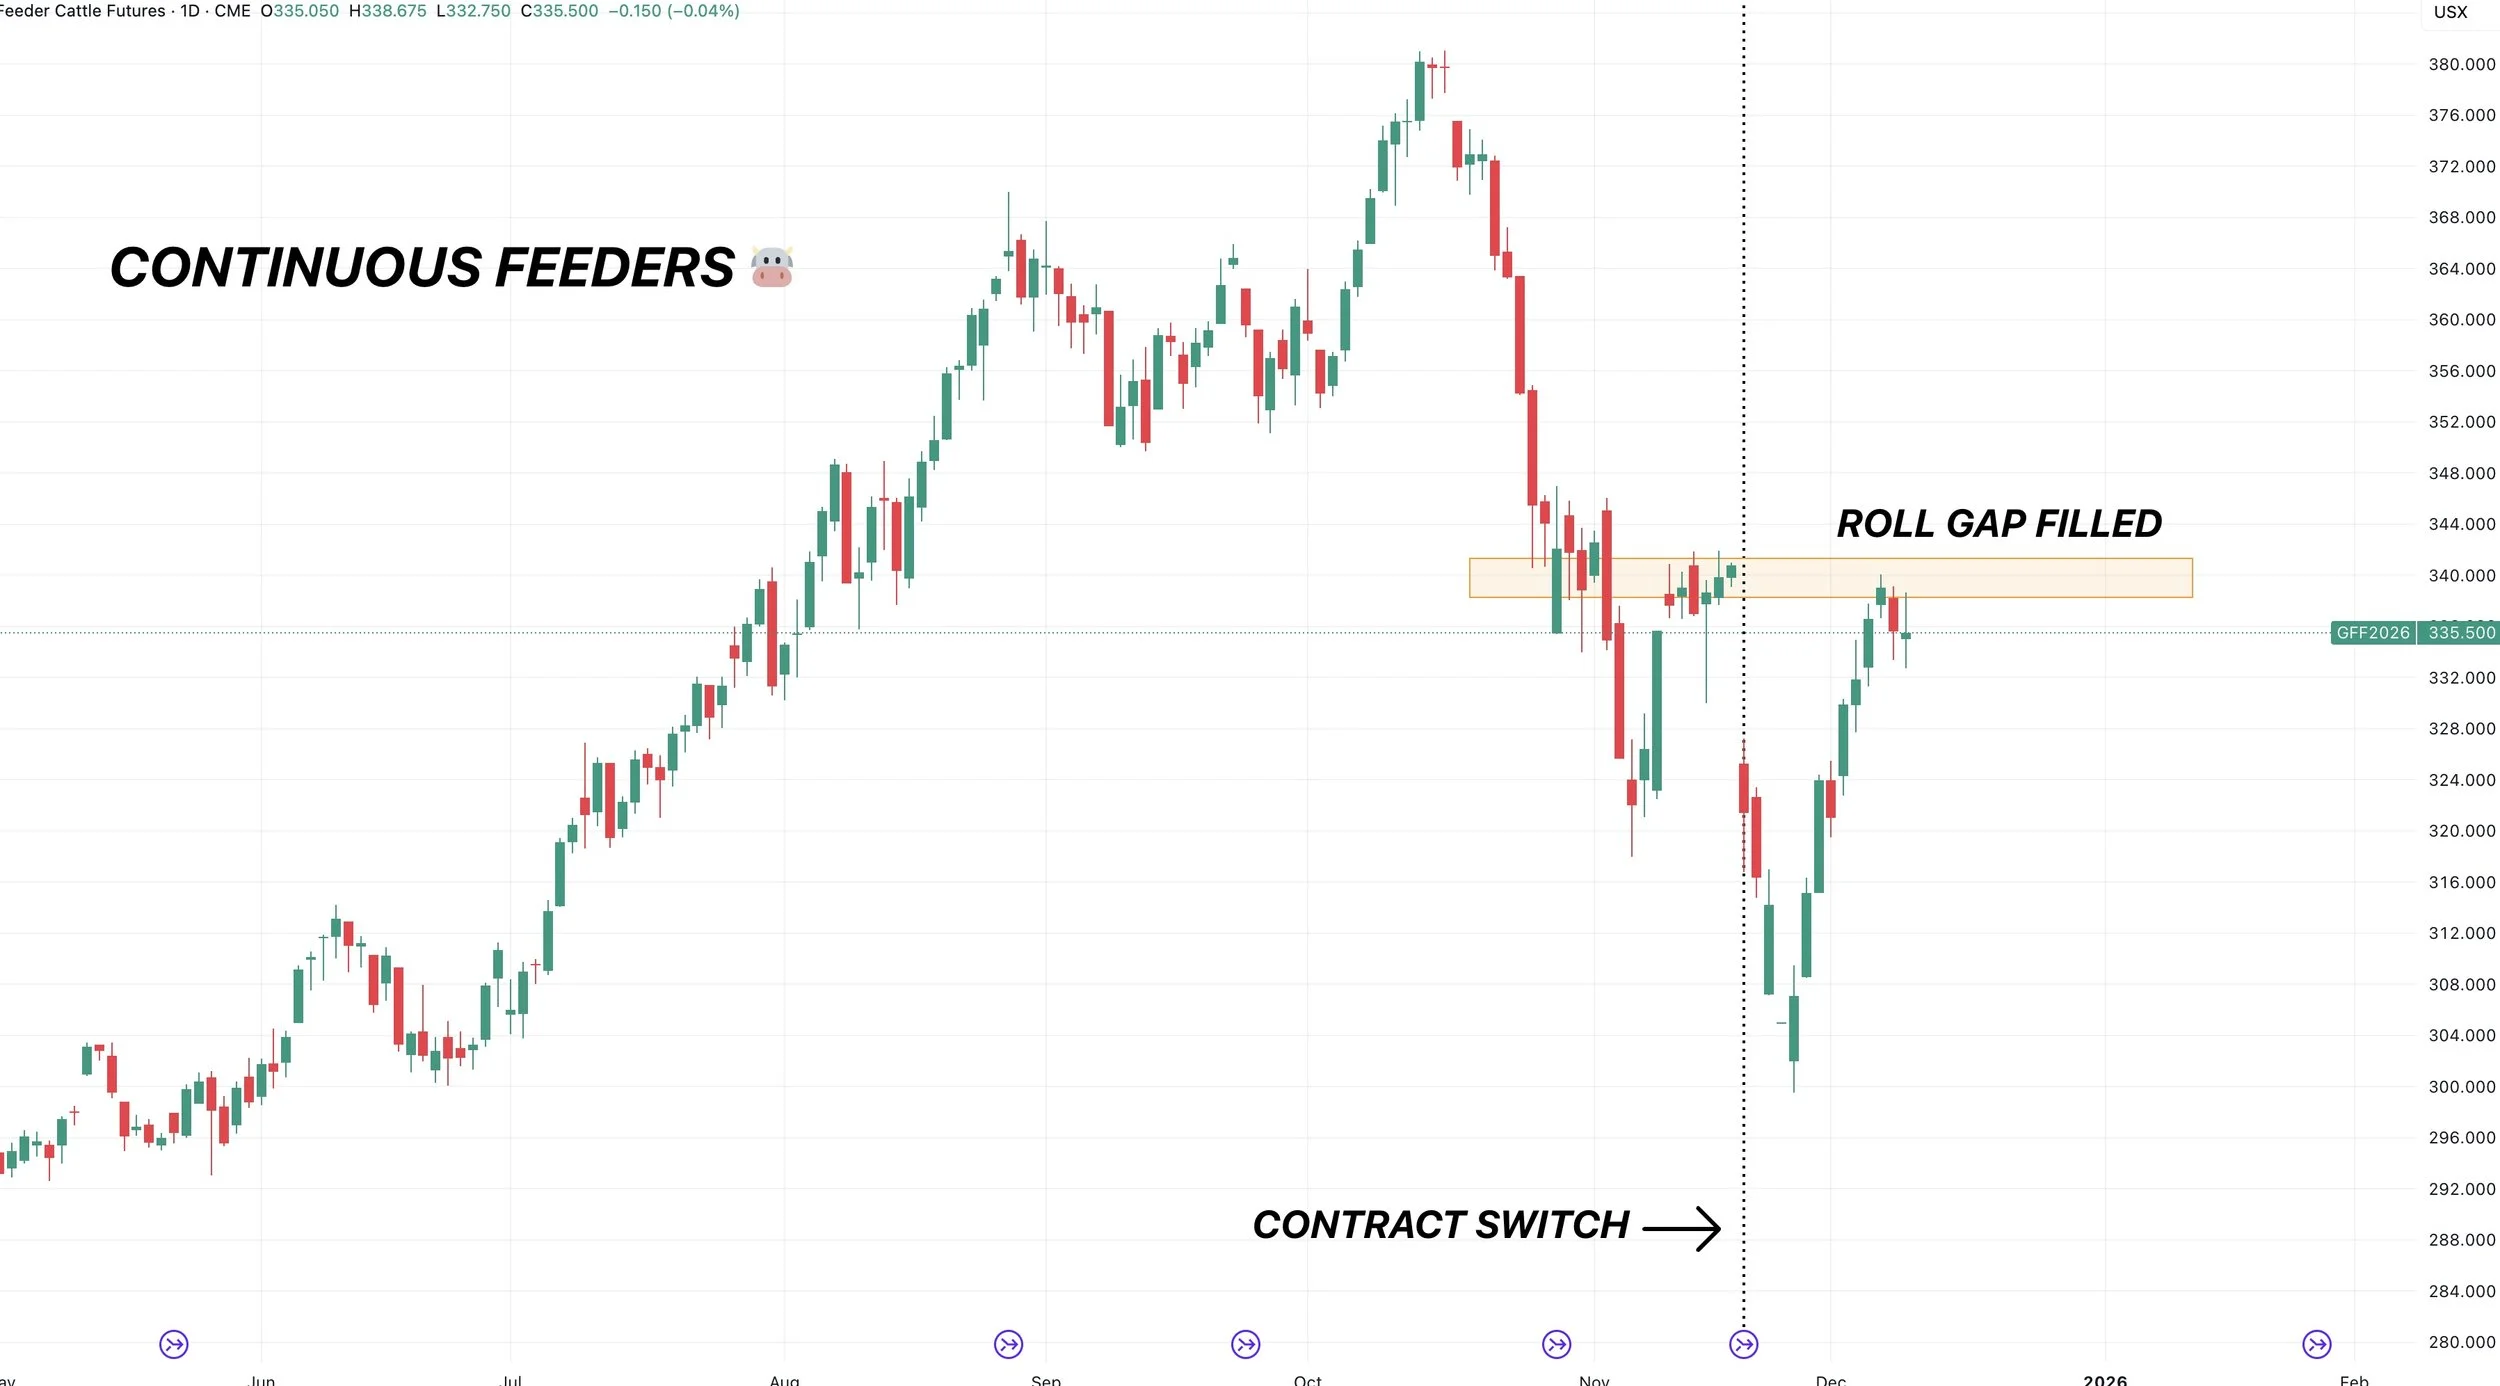
Continuous Feeders
Here is another reason why this level was a point of interest.
This is the continuous chart that shows the active contract.
We left a roll gap when we swtiched from Nov to Jan feeders.
We filled that gap on Friday perfectly.
Overall I still think there is plenty of risk in this market long term.
The most common correction pattern in markets is known as an ABC correction.
You get the first A wave down.
Then you get the B wave up that is a relief bounce.
People think the bottom is in.
Then you get a final C wave lower that marks the actual bottom.
Doesn’t have to shake out this way, but it's something I am being very cautious of up here.
Something to note:
Open interest has been decreasing on this rally. Not increasing.
This means that shorts are leaving the market. This rally is not fresh new longs entering the market.
Seeing this usually makes it hard to go and post new highs in a market.
So I like rewarding the rally we've had.

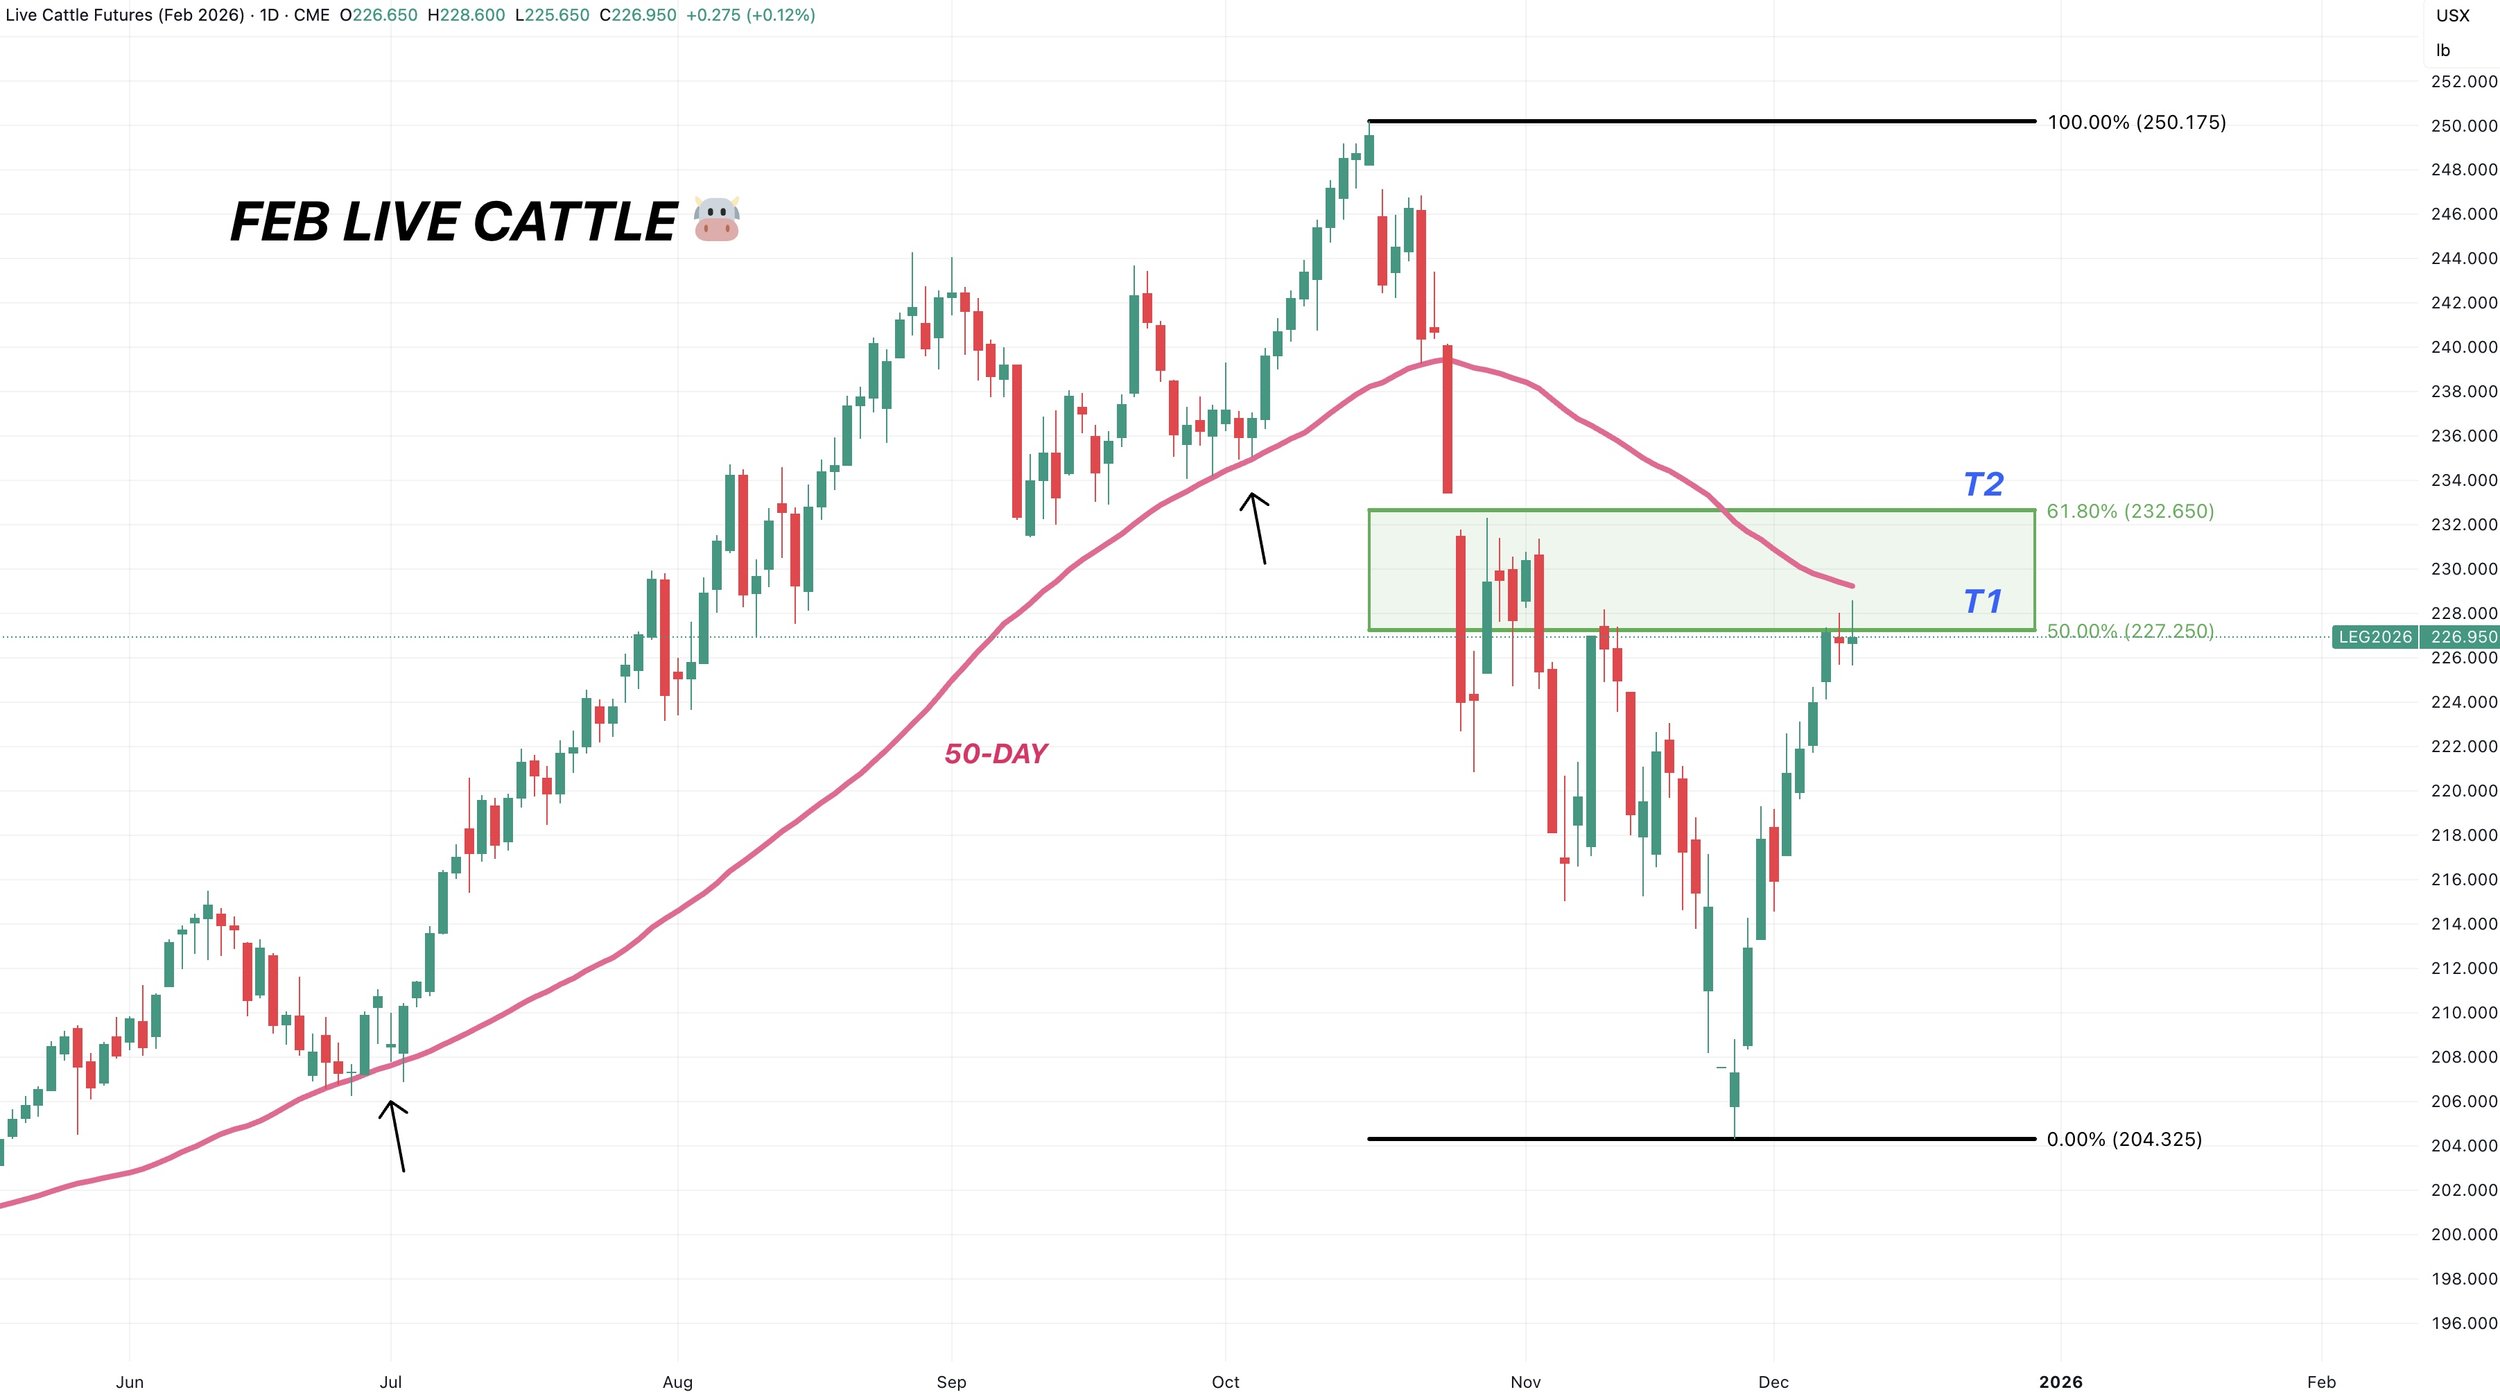
Feb Live
Very similar chart to feeders.
We tapped that 50% retracement and nearly hit the 50-day MA today.
If we work our way higher we want to look to de-risk further.
Past Sell or Protection Signals
Dec 5th: 🐮
Cattle sell signal & hedge alert.
Nov 17th: 🌱
Soybean sell signal & hedge alert.
Nov 13th: 🌽 🌱
Managing risk in corn & beans ahead of USDA report.
Oct 28th: 🌽
Corn sell signal & hedge alert.
Oct 27th: 🌱
Soybean sell signal & hedge alert.
Oct 13th: 🐮
Cattle sell signal & hedge alert.
Aug 22nd: 🌱
Soybean sell signal & hedge alert.
July 31st: 🐮
Cattle sell signal & hedge alert.
July 10th: 🐮
Cattle sell signal & hedge alert.
CLICK HERE TO VIEW
June 5th: 🐮
Cattle sell signal & hedge alert.
June 2nd: 🌾
MPLS wheat sell signal.
April 10th: 🌽
Old crop corn sell signal.
March 19th: 🐮
Cattle hedge & sell signal.
Feb 18th: 🌽 🌾
Old crop KC wheat & old crop corn signal.
Jan 23rd: 🌽 🌱
Corn & beans old crop sell signal.
CLICK HERE TO VIEW
Jan 15th: 🌽 🌱
Corn & beans hedge alert/sell signal.
Jan 2nd: 🐮
Cattle hedge alert at new all-time highs & target.
Dec 11th: 🌽
Corn sell signal at $4.51 200-day MA
CLICK HERE TO VIEW
Oct 2nd: 🌾
Wheat sell signal at $6.12 target
Sep 30th: 🌽
Corn protection signal at $4.23-26
Sep 27th: 🌱
Soybean sell & protection signal at $10.65
Sep 13th: 🌾
Wheat sell signal at $5.98
May 22nd: 🌾
Wheat sell signal when wheat traded +$7.00
Want to Talk?
Our phones are open 24/7 for you guys if you ever need anything or want to discuss your operation.
Hedge Account
Interested in a hedge account? Use the link below to set up an account or shoot Jeremey a call at (605)295-3100.