
CORN CONDITIONS DISAPPOINT & JUNE OUTLOOK IMPROVES
MARKET UPDATE
You can scroll to read the usual update as well. As the written version is the exact same as the video.
Timestamps for video:
Overview & Weather: 0:00min
Corn: 4:20min
Beans: 9:00min
Wheat: 11:50min
Miss yesterday’s sale?
Yesterday we had our biggest offer of the year for our updates & signals. Make sure you take advantage before your free trial ends so you don’t miss future ones.
Want to talk about your situation?
(605)295-3100
Futures Prices Close

Overview
Grains mostly lower following the 3-day weekend.
The wheat market took the hardest hit, down double digits across the board seeing some pressure from good rains over the weekend in winter wheat regions.
Here is past 3-days of precip:
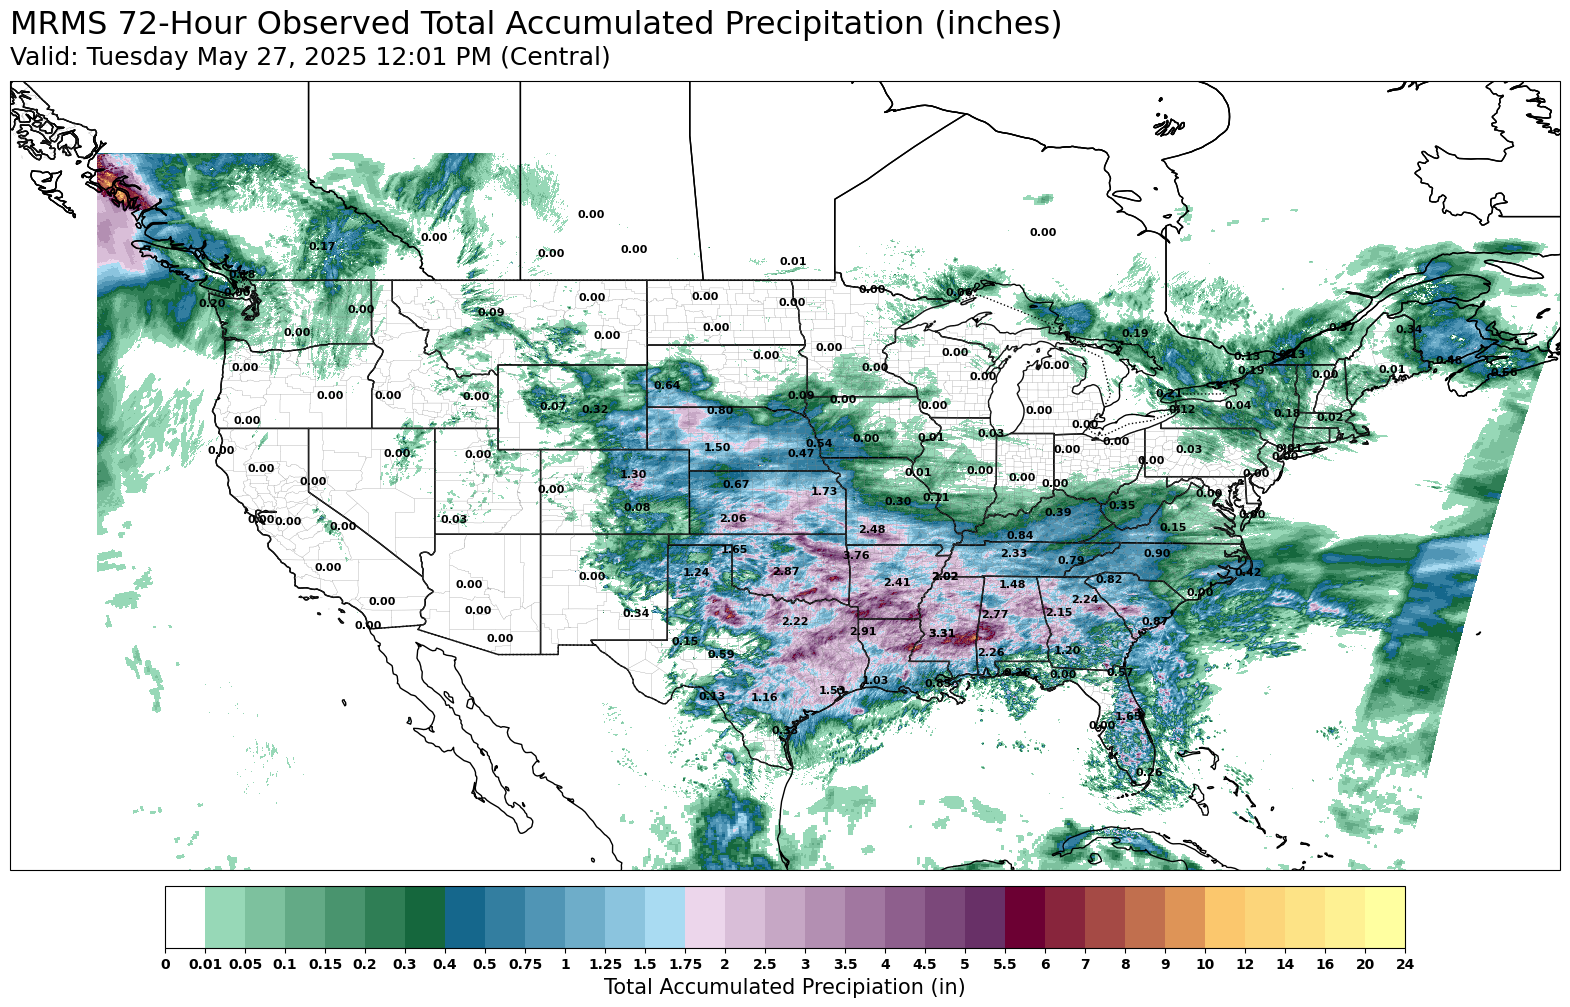
Soybeans were relatively strong in comparison to corn & wheat.
Could’ve saw a little relief from news that Trump would be delaying the 50% tariffs on the EU until July 9th.
Friday is when he orginally announced that threat, so it only took 3 days for that threat to be delayed.
Now the EU isn’t a big market for soybeans. China is really the only country that matters when it comes to the trade war and soybeans. However, it just feels like soybeans react the most to any trade war news. As overall optimism of trade deals (or lack there of) impacts beans the most.
Weather
The corn market followed the wheat market lower. Dec-25 corn fell a lot harder than July-25 corn today. It feels like the downside move was led by weather shifting a little friendly here to begin June.
Weather doesn’t seem like much of a threat at all right now. No threat means corn could struggle to find a reason to go higher.
If we look at the GFS vs Euro weather forecasts. They show big differences. So it's hard to pin point exactly how weather is going to shape up here the next few weeks.
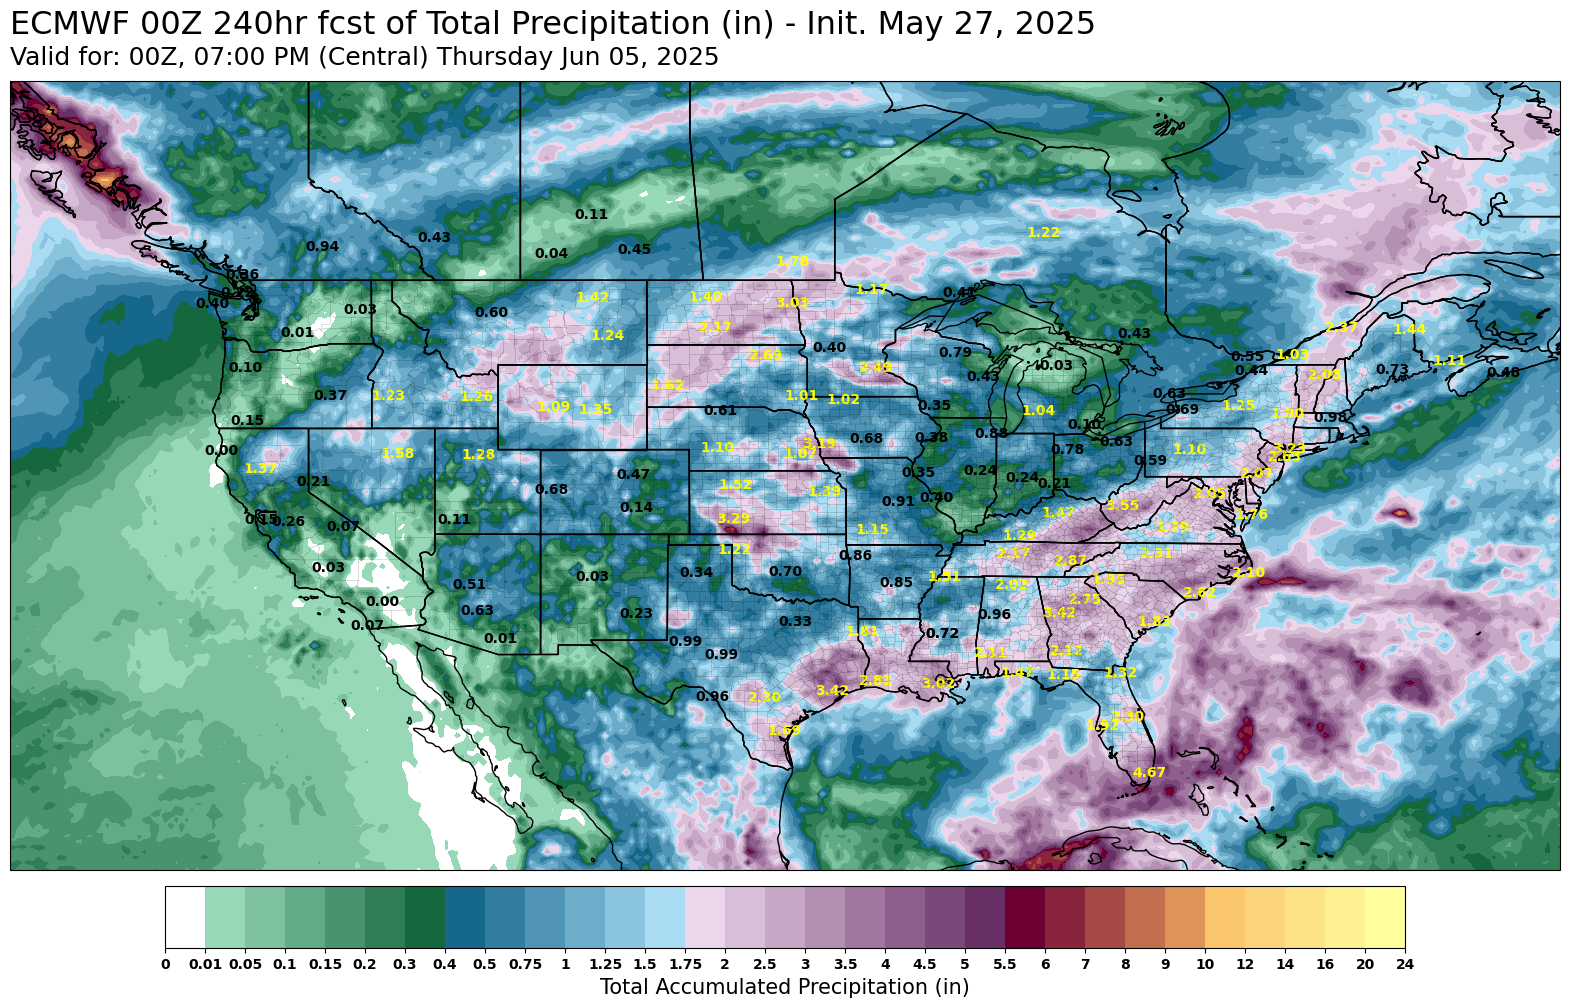
First here is the Euro model. In the 10-day outlook it shows good rains for the western corn belt, while the heart of the corn belt remains dry (The I-states).
Euro 10-Day
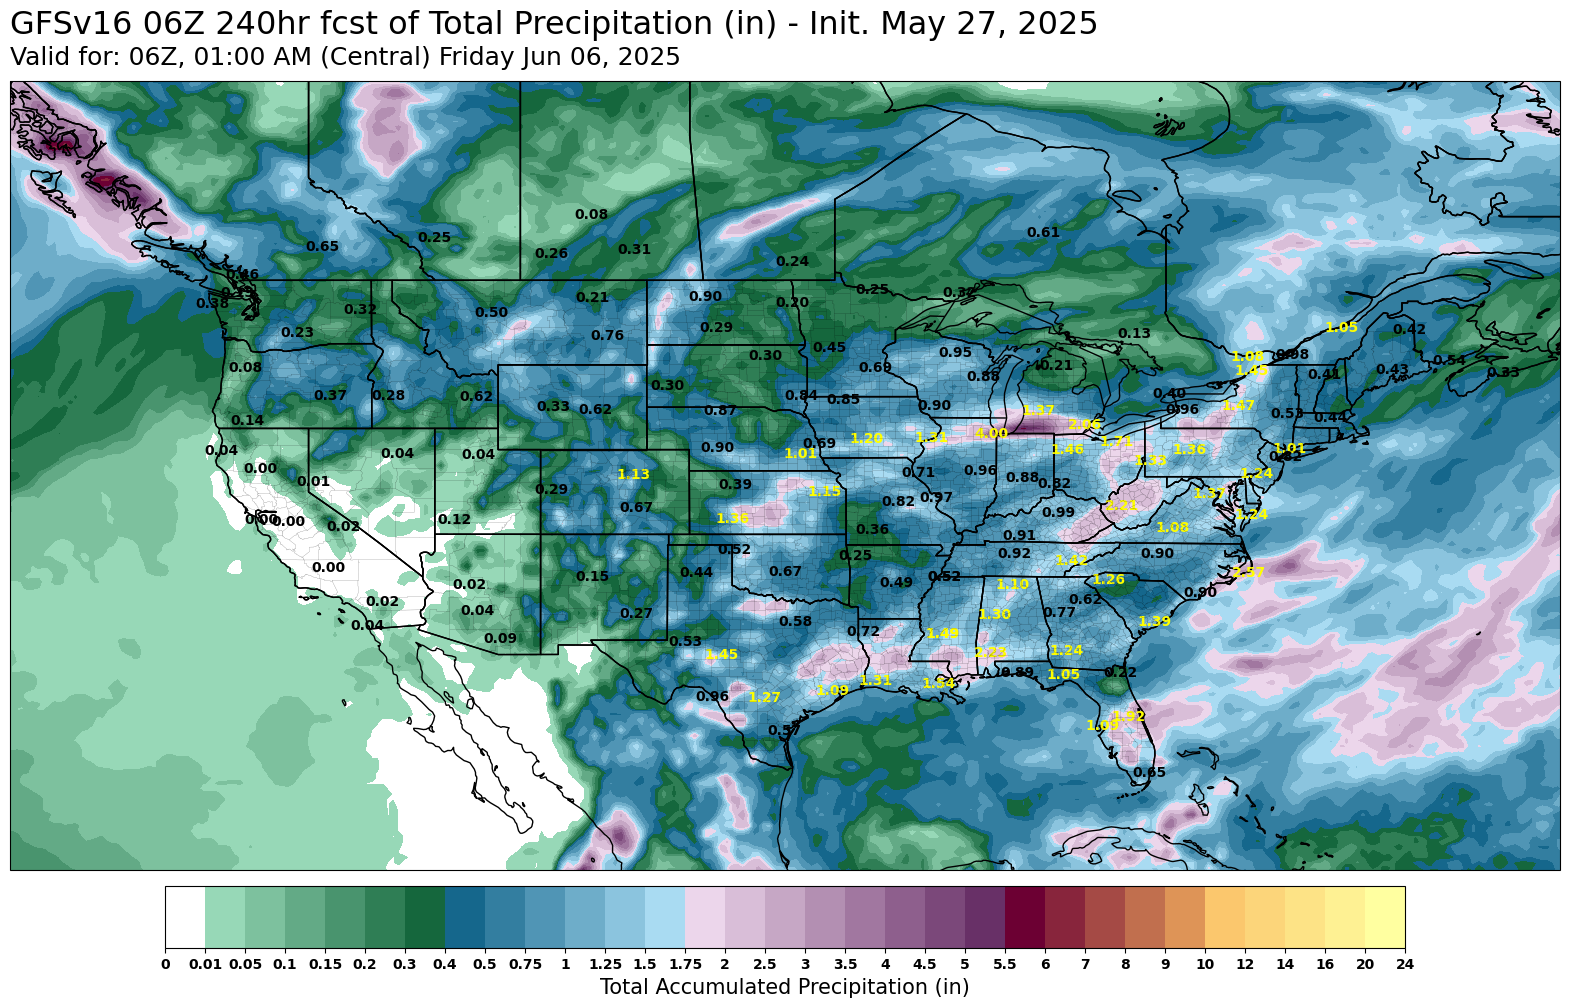
The GFS tells a completely different story.
It has the western corn belt being dry, while having the heart of the corn belt getting good rain. With some areas of northern Illionois and Indiana getting up to +4 inches of rain.
GFS 10-Day
Here is a side by side view of the 8-14 precip anomalies to give you a good visual of the differences.
Euro = Wet West & Dry I-States
GFS = "Drier" West & Wet I-States
Euro 8-14 Day
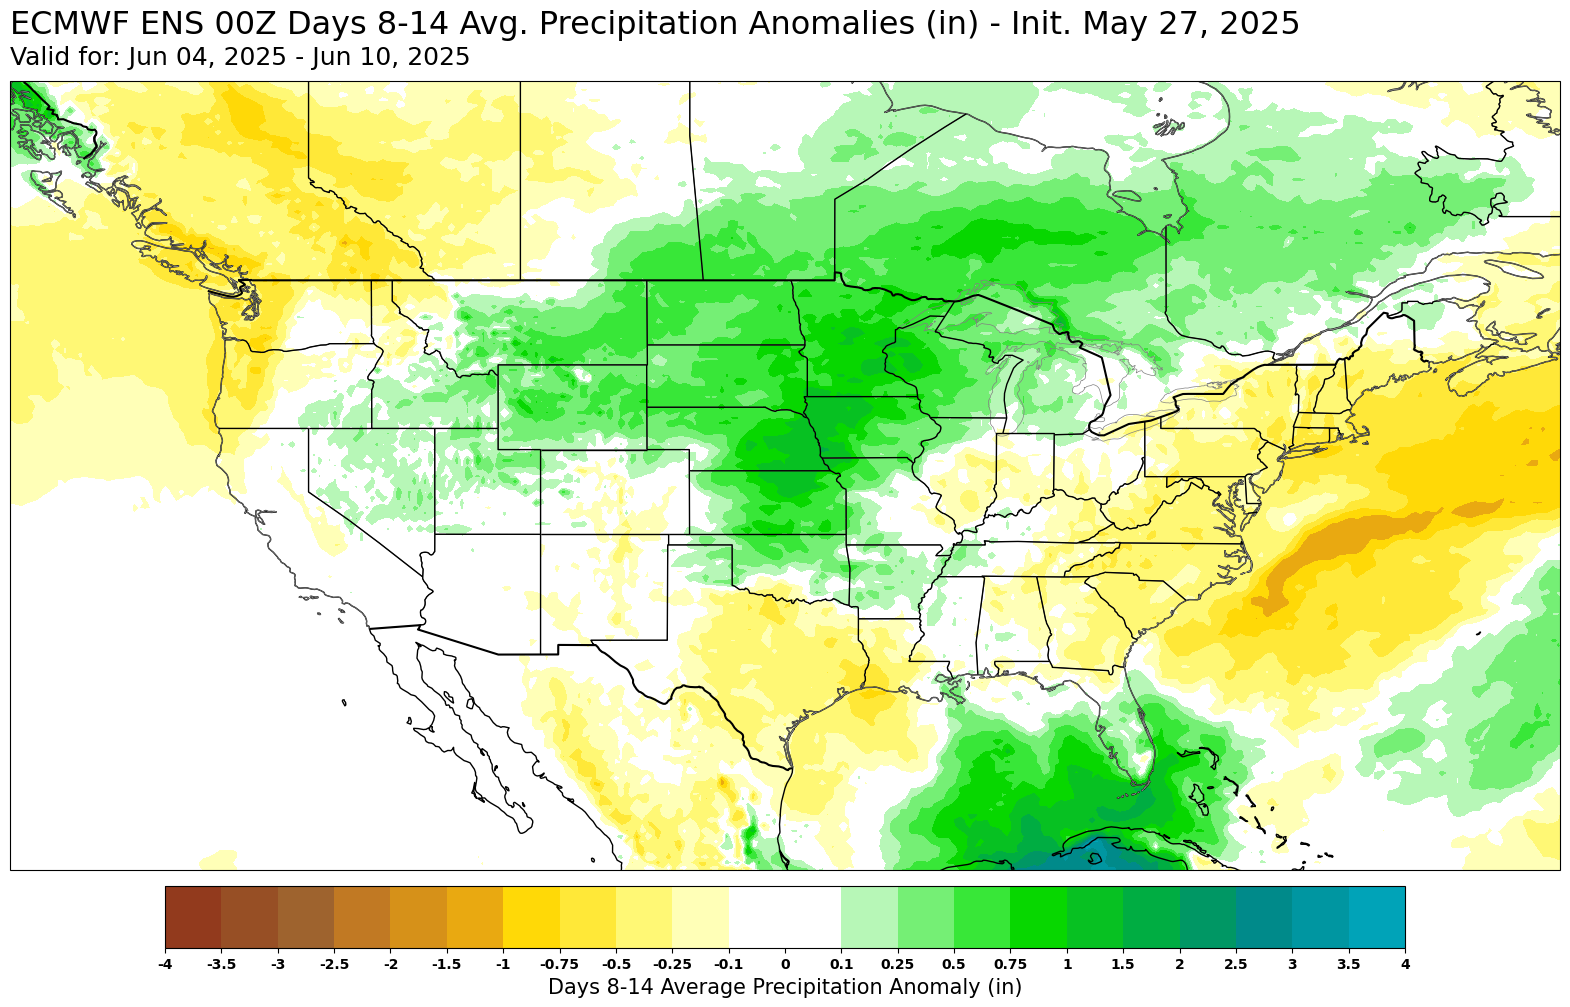
GFS 8-14 Day
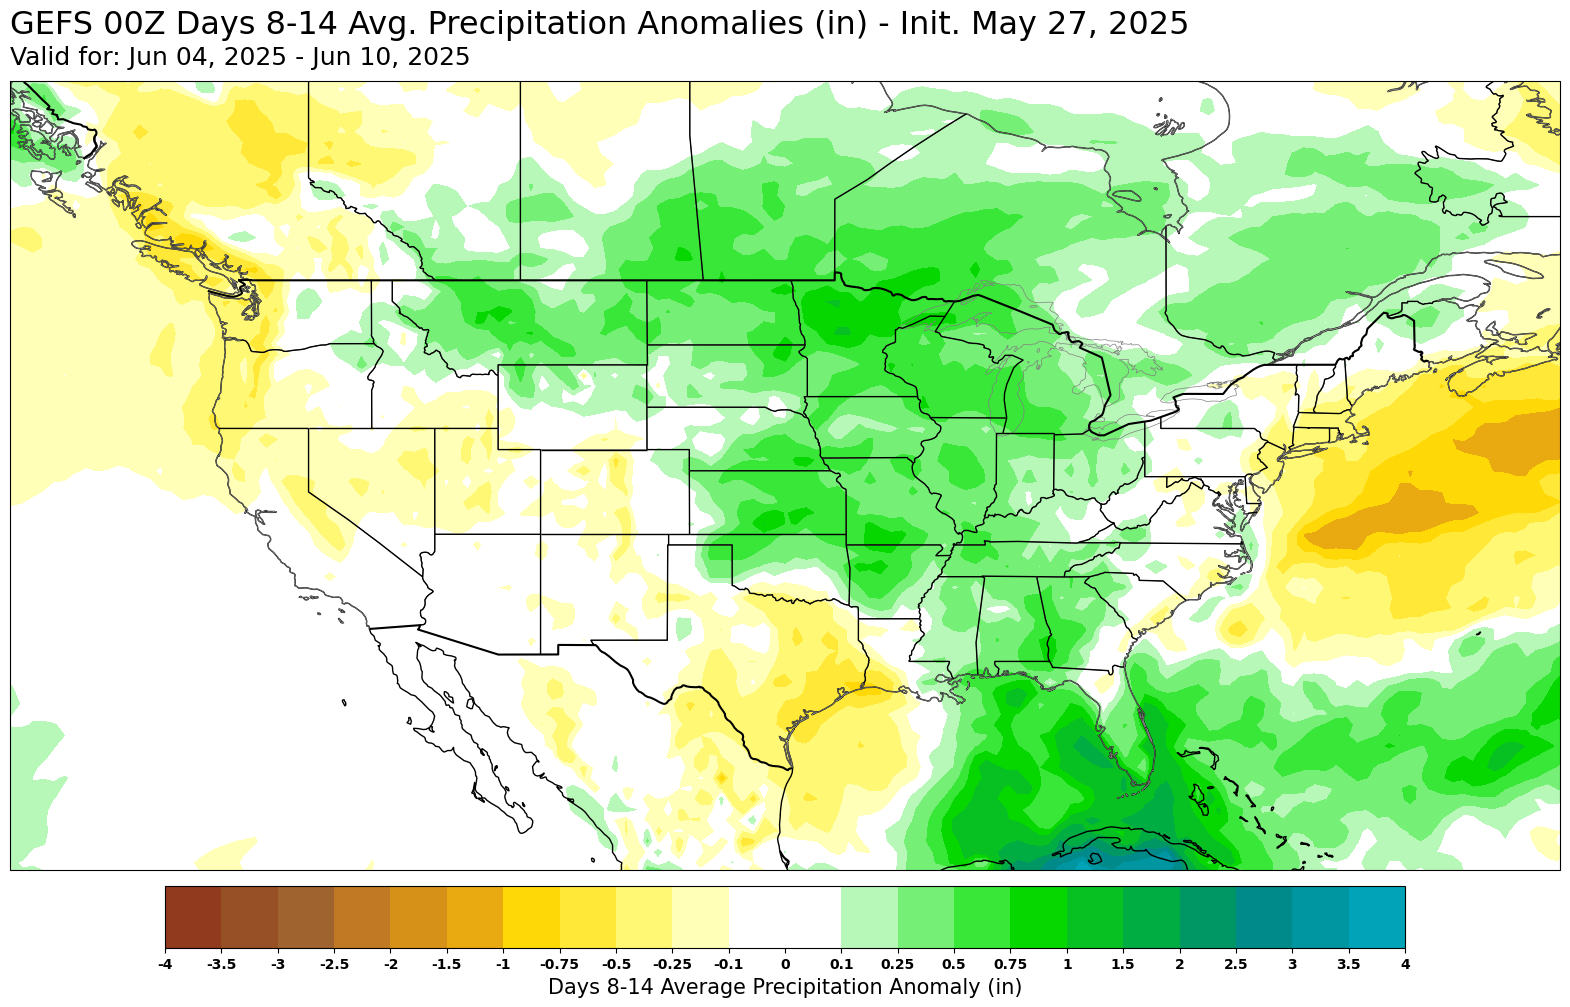
Overall, neither of these forecasts scream weather threat yet.
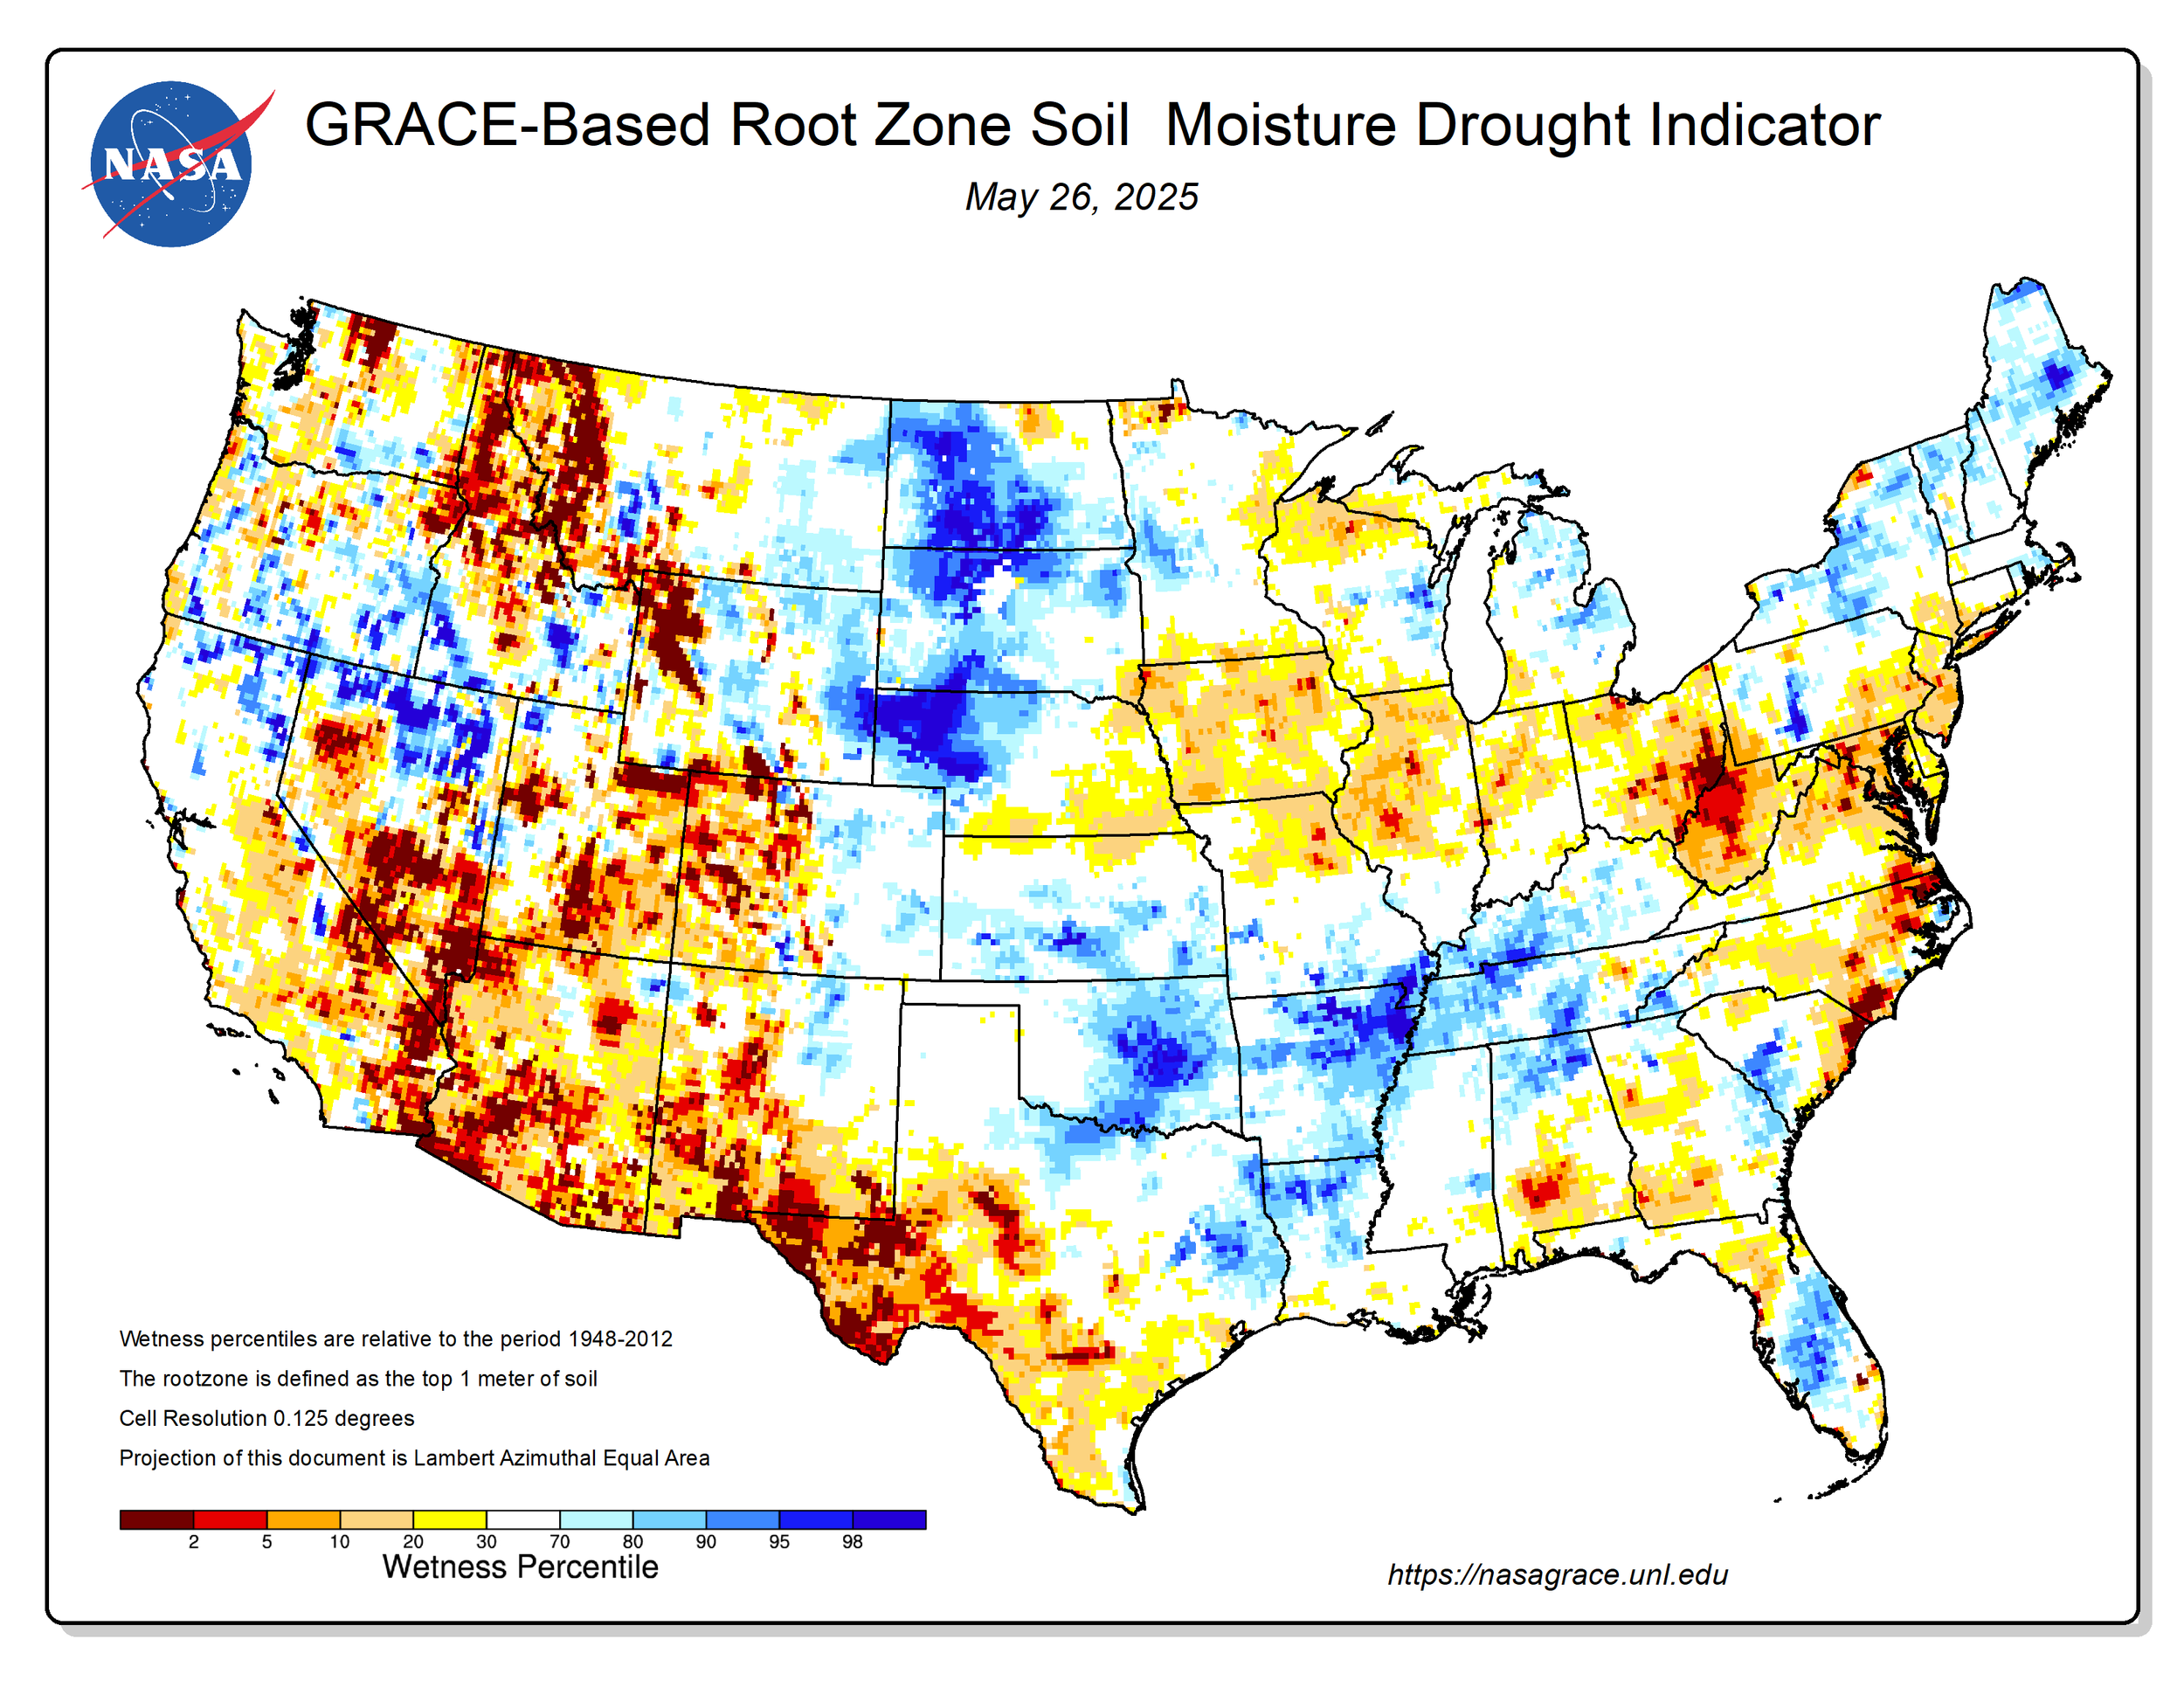
If we look at the Root Zone Soil Moisture, it is the I-States who currently lack the most.
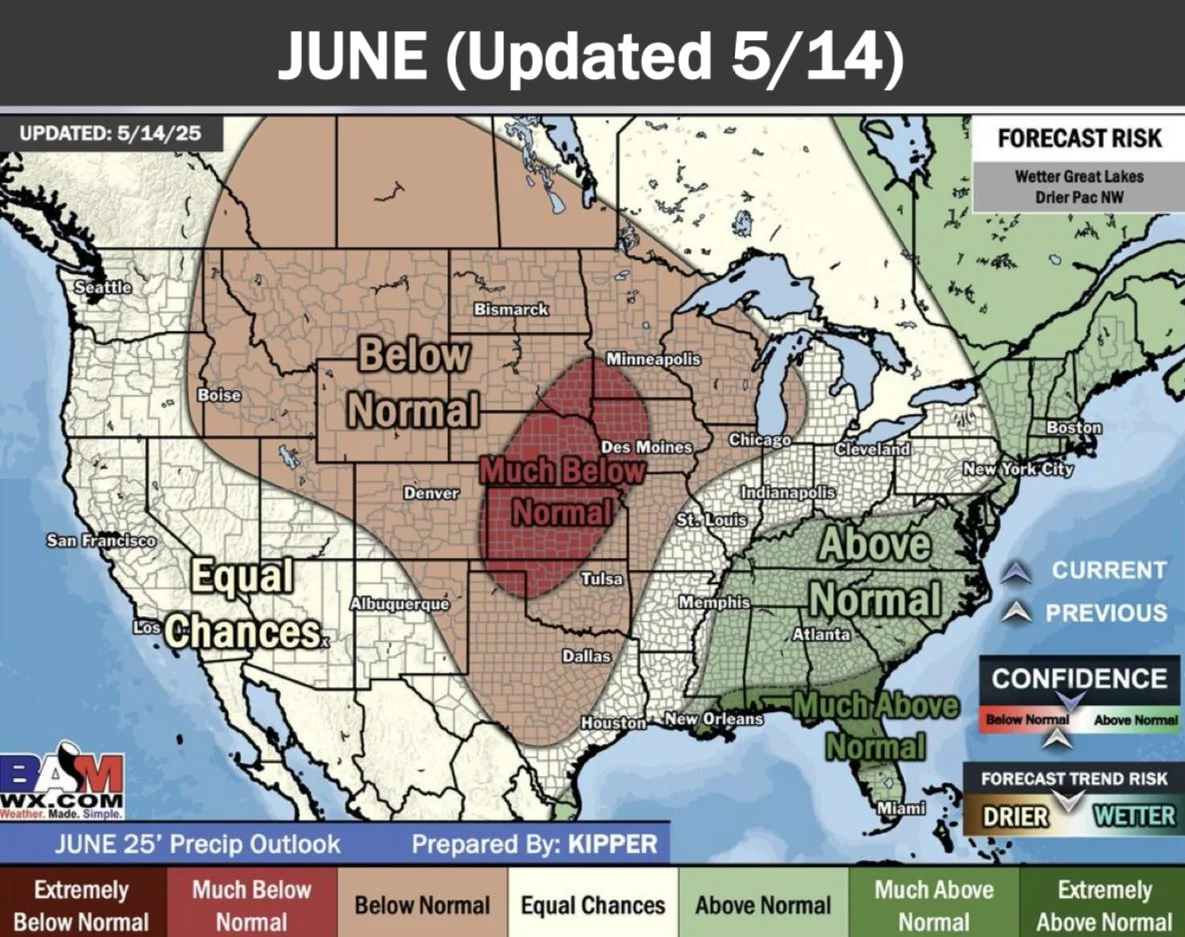
Here is the Goverment outlook for June.
Looks like a mixed mag. Might be drier than normal, might not be.
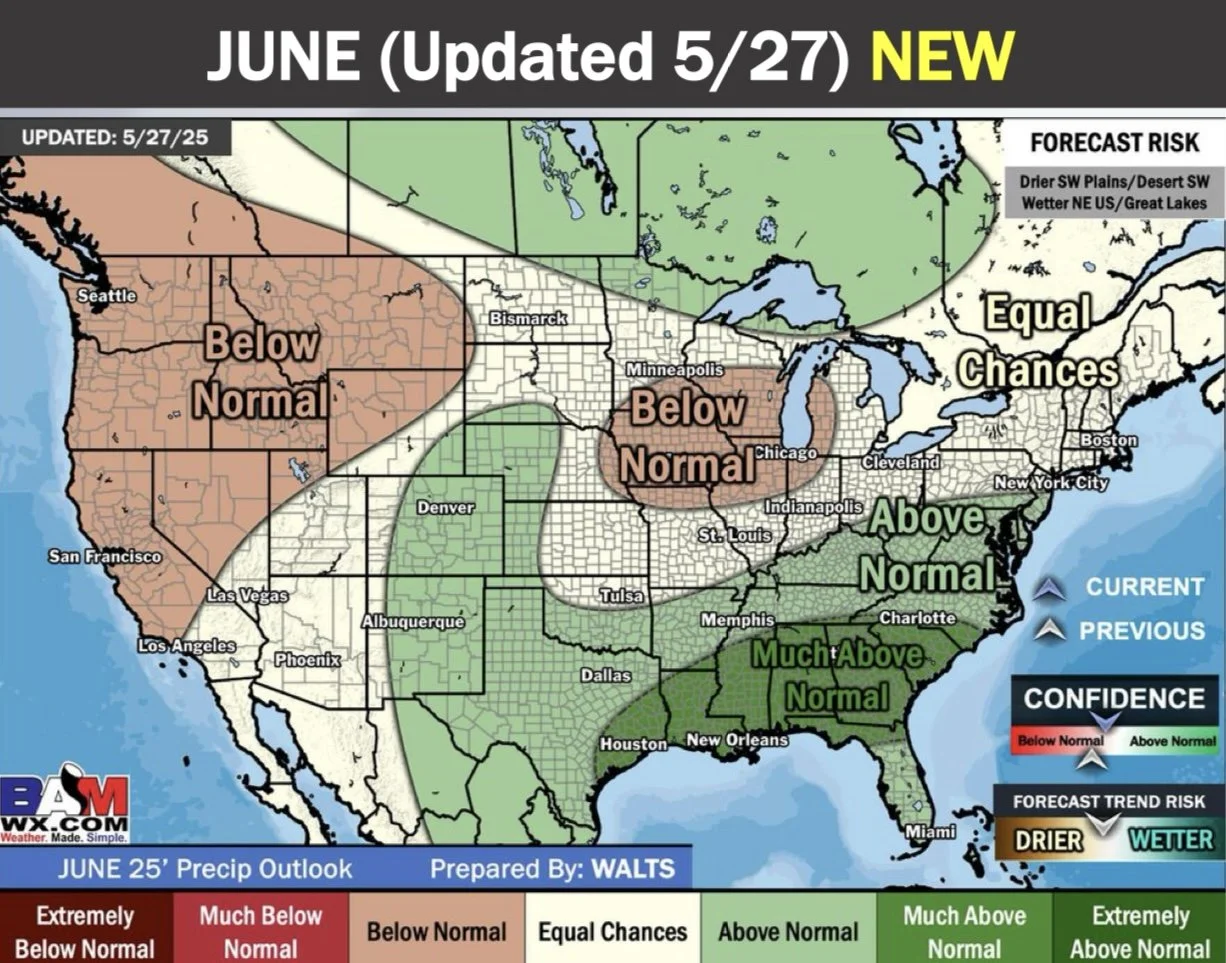
Here is BAM Weather's June outlook today vs a few weeks ago.
The June outlook has shifted less dry.
If we look out to July, that is where the risk is going to be for this crop.
July is corn's key pollination period as you all know.
Usually, it is not an actual drought that results in a rally. It is merely the thought of drought.
Here is BAM Weather's July outlook.
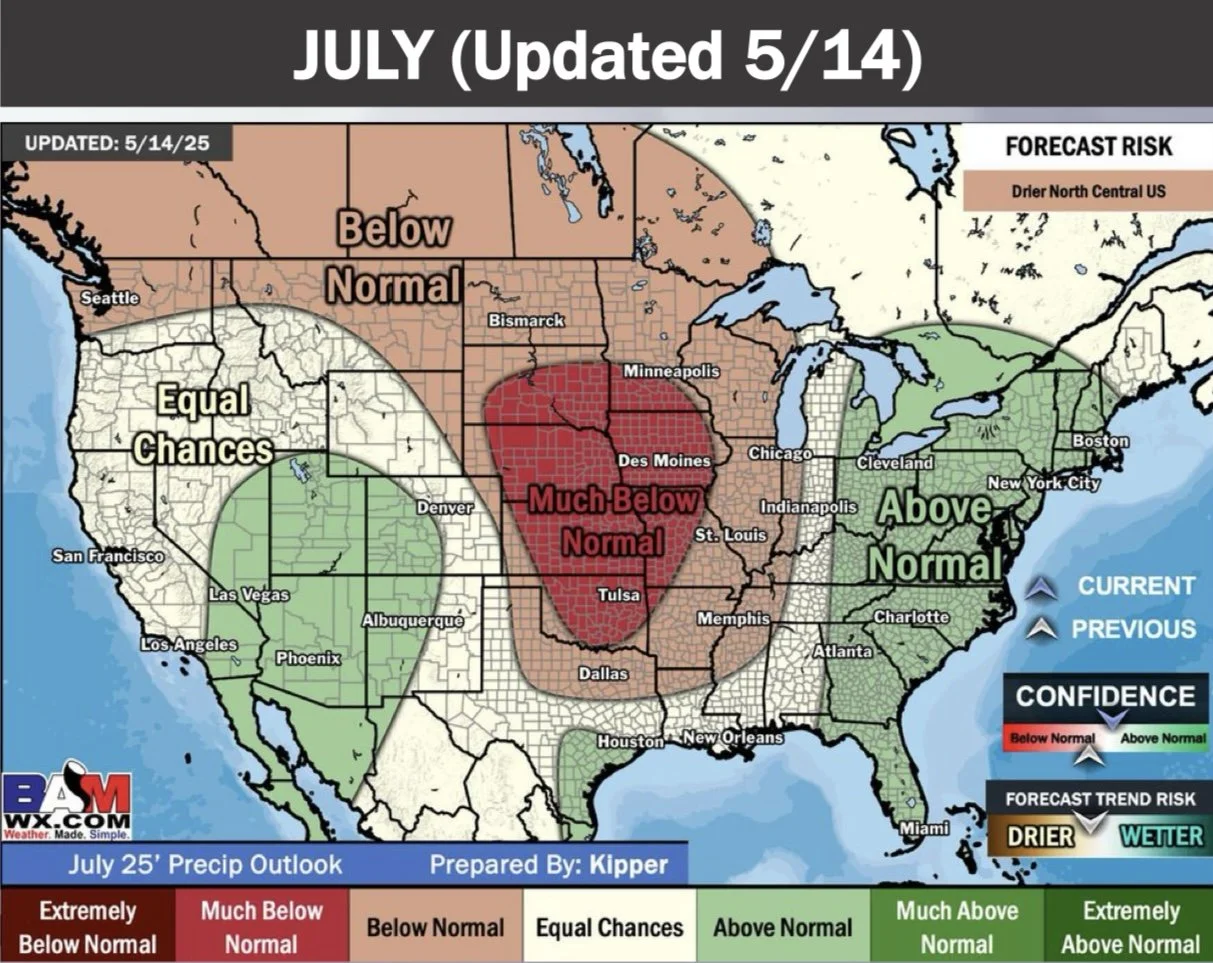
The Goverment's outlook leans dry as well.
Here is their outlook for June-July-Aug and July-Aug-Sep.
Both still relatively dry for the key corn areas.
Jun-Jul-Aug
Jul-Aug-Sep
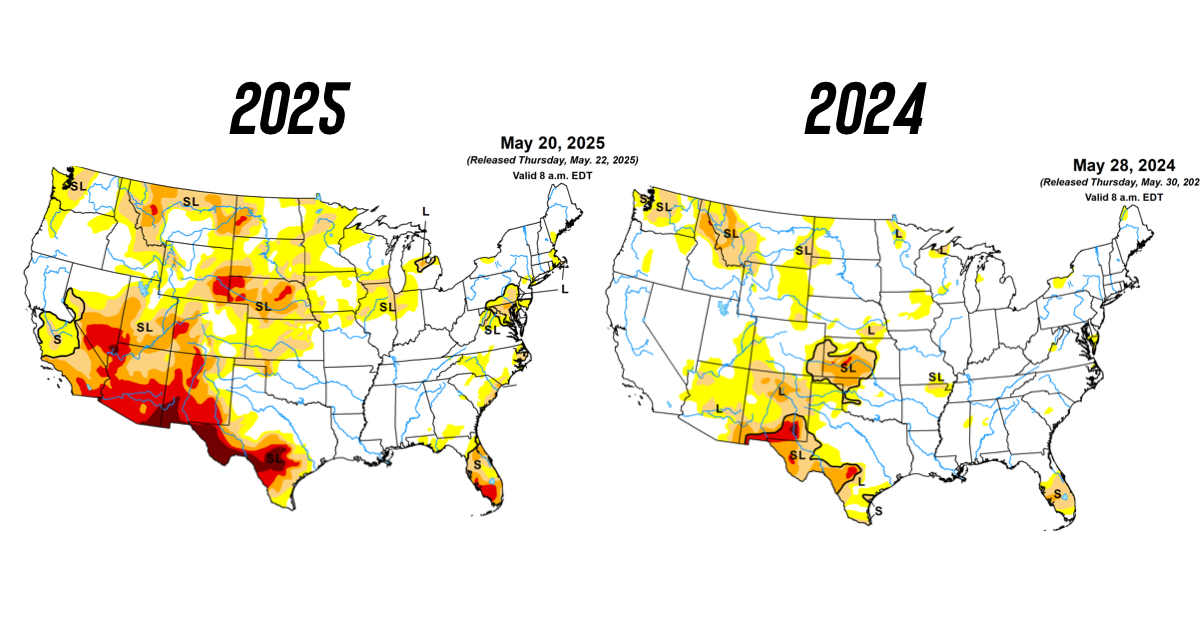
Drought Comparisons
Let's take a quick look at how 2025 stacks up vs other years.
First 2025 vs 2024.
2024 is one of those few years where we saw zero weather premium or rally.
2025 is a lot drier in comparison. So obviously more concern for drought to progress.
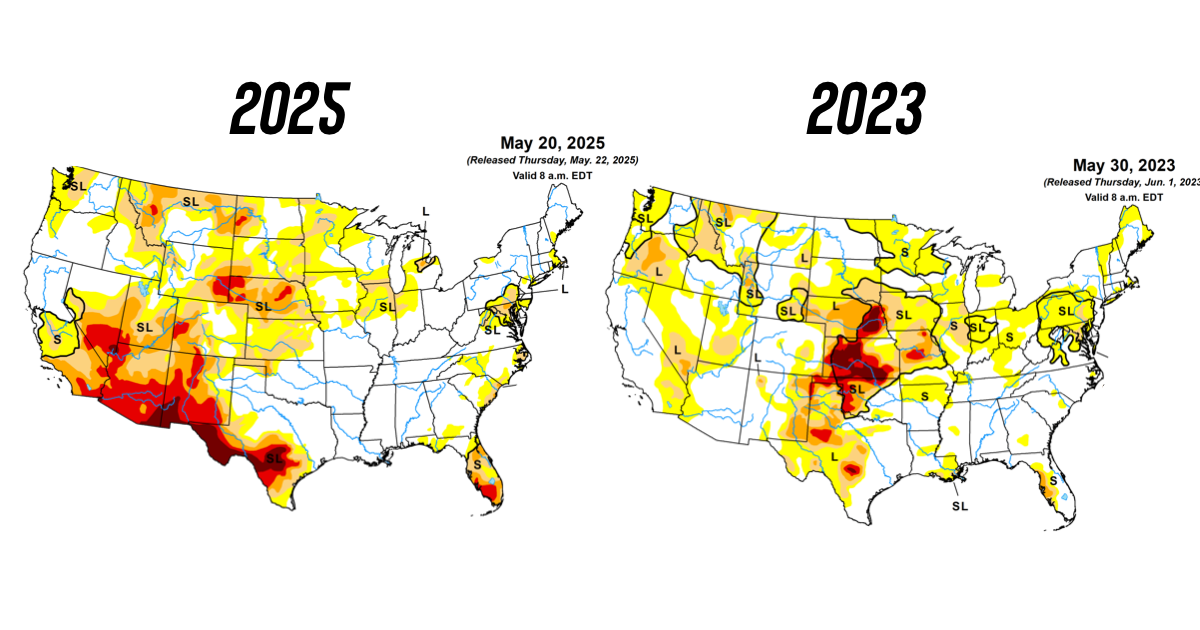
Here is 2025 vs 2023.
2023 was decently worse at this point in the year.
Which led to a rally in June.
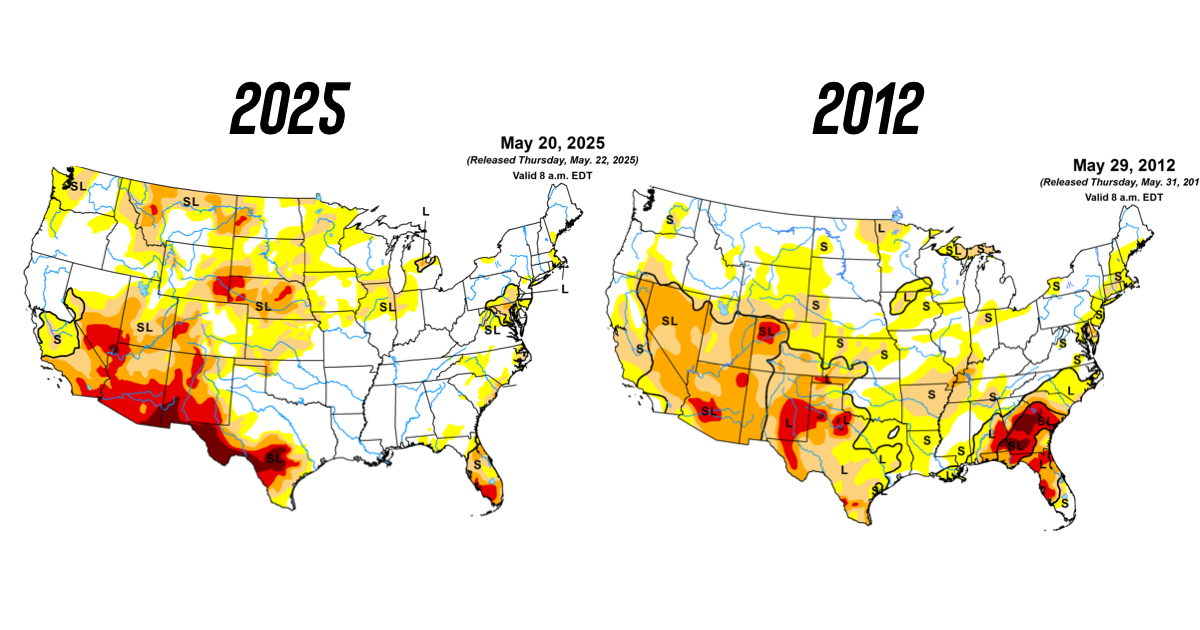
Lastly, here is the inevitable 2012 comparison.
I am NOT saying we will remotely see anything close to 2012. I am NOT calling for a material drought.
But if you look at 2012 at this same date, drought wasn’t really an issue.
The point is, the market still has time to build in weather premium.
Todays Main Takeaways
Corn
Fundamentals:
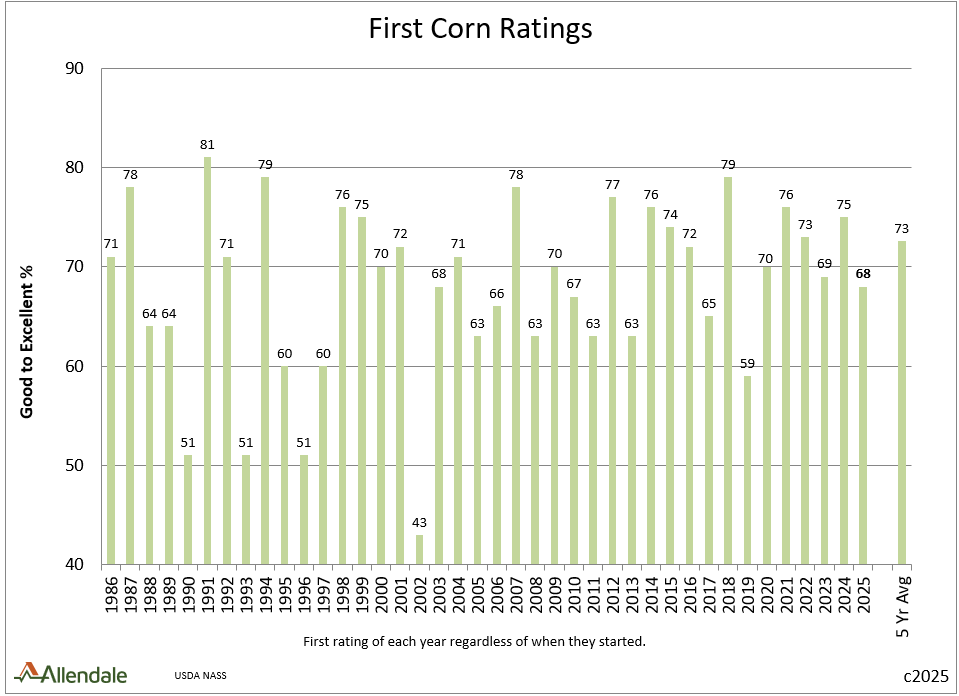
Before we get into anything else, we had our first crop conditions out today for corn.
Corn was rated 68% G/E.
That was below the trade estimates of 73%. A big miss by the analysts.
This was the lowest start in 6 years since 2019.
Since 2014, it is our 3rd lowest starting rating only behind 2019 and 2017.
Chart from Allendale
For corn it really is going to come down to weather.
If we get timely rains, this market doesn’t have to go higher.
If we get a scare, we go higher. It is that simple.
All we can do is be prepared if we get the opportunity.
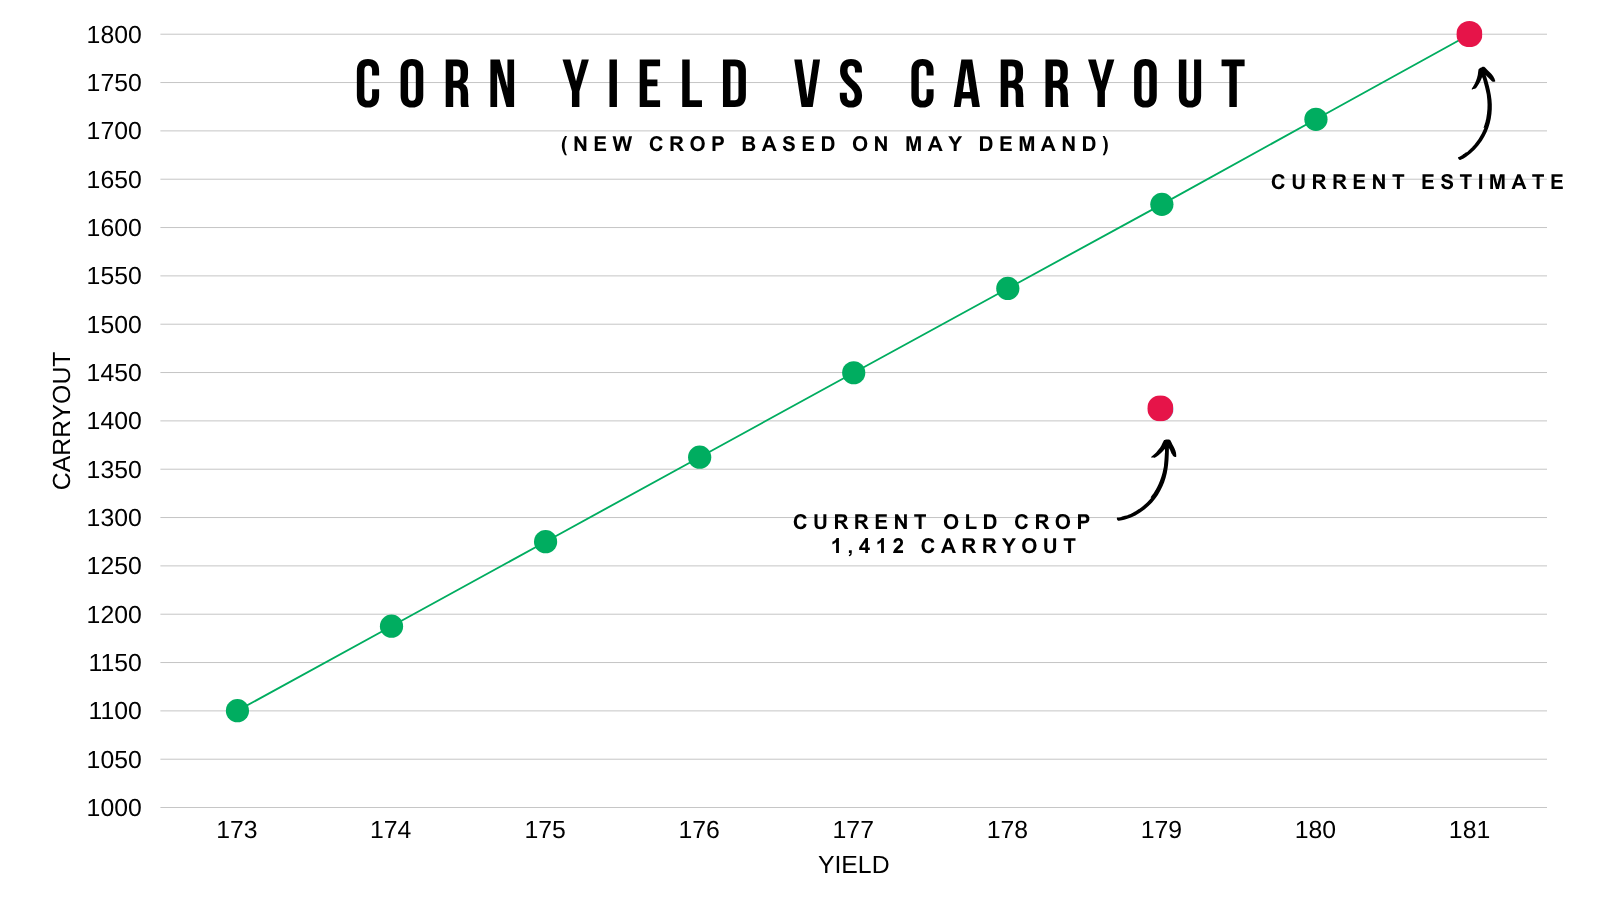
Here is a simple view of how yield could impact our carryout.
This only uses the demand numbers from May. It does not include any changes to demand. If supply gets tighter, demand will naturally be lowered which will offset some of this. So this is not an entirely accurate chart of how yield will change.
But the point is weather still matters and we have an entire growing season. And this chart shows how important of a factor yield is on the balance sheet.
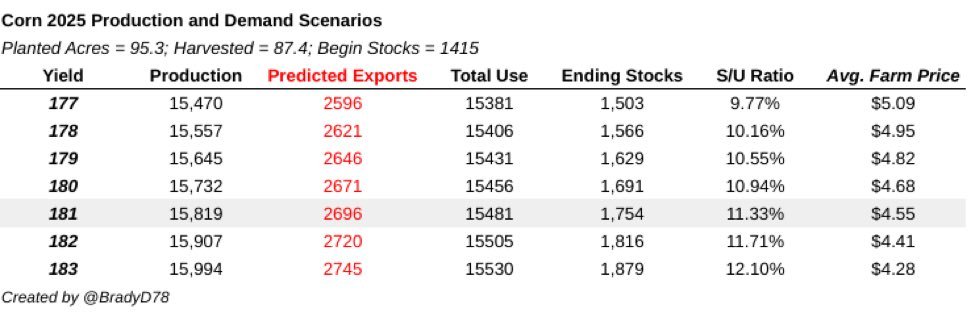
Here is a fantastic chart from @BradyD78 on X.
He complied carryout scenarios that also include adjustments to demand.
Based on his projections, it would take a 177-178 yield to get a bullish new crop corn market. (I am considering a stocks to use ratio at or below 10% bullish).
Seasonal Updates
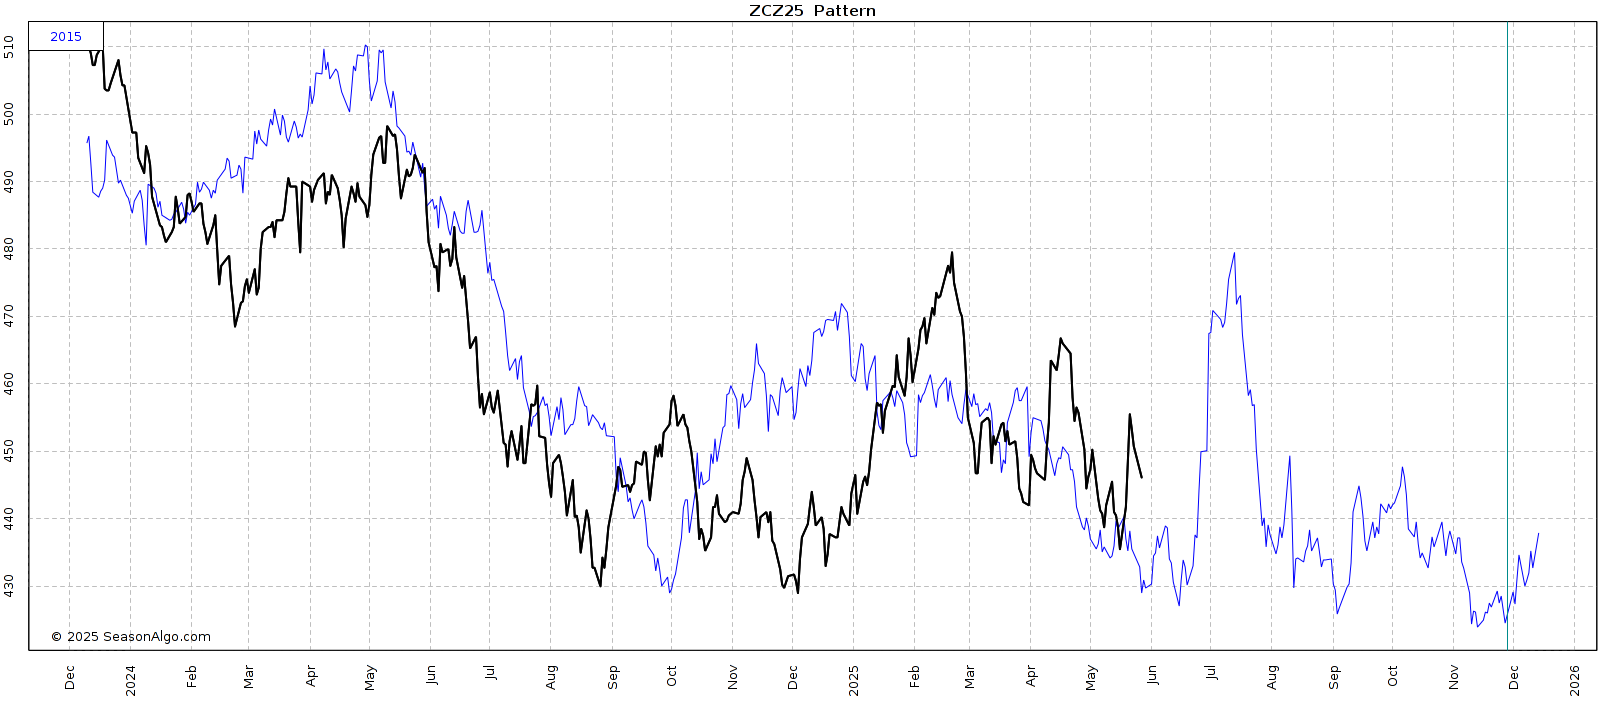
Here is an update on the 20-year seasonal.
Now starting to lag behind.
Seasonally we make our highs here in a few weeks.

2017 is the year that has the highest pattern correlation to 2025.
They are 68% correlated.
2017 we had a later seasonal rally and topped in July, but we sold off hard in June beforehand.

2015 is our 2nd most correlated year to 2025.
They are only 46% correlated though.
Interesting, 2015 we also topped in July.
We did not find a bottom until the middle of June.
Lastly, here is 2023 vs 2025.
2023 only has a 19% correlation to 2025.
But both did bottom on the exact same day.
In 2023 we started the rally in a few weeks.

Technicals:
July corn still struggling to break above this resistance level.
If we can bust above here, we will be looking to de-risk around $4.80 to $4.90

Dec corn exactly rejected the 61.8% retracment up the April highs.
I am looking for a bounce between $4.43 to $4.45
That is a standard retracement and would give back 50-61.8% of this recent rally. That is the level I want to see us hold to keep upwards bias here short term.
As for targets, I am still looking at $4.60-62 for my first target. That is 78.6% of the April high and also past resistance back from last fall.
Then looking at $4.70-80 to be more aggresive if we can climb up there.

I do not know how the weather will play out. I do not know if we will get a weather scare. And if we do, how large of a rally it will bring.
That is why I have these targets out there. To make sure we are taking risk off the table on any opportunity.
If we see weather cooperate, a +20-30 cent rally might be all we get and could be a great pricing opportunity. It is all about managing risk where it makes sense.
Soybeans
Fundamentals:
Like corn, weather is going to play a big role.
But soybeans also have other factors at play.
Do we get a deal done with China?
How does the biofuel situation pan out?
Those are both simply unknowns. With the potential to push us significantly higher or lower.
Make a deal with China, our demand likely improves long term.
If we don’t make a deal with China by harvest, then we have tremendous downside because our exports will take a dump.
Aside from these unknowns, I still think soybeans have potential upside.
Soybeans are +30 cents higher than where they before the whole trade war fiasco started.
The market has already traded a big Brazil crop.
The market has already traded the China trade war.
Yet beans continue to grind higher.
I know I keep beating a dead horse about the US soybean situation. But I do think that is our most realistic path higher.
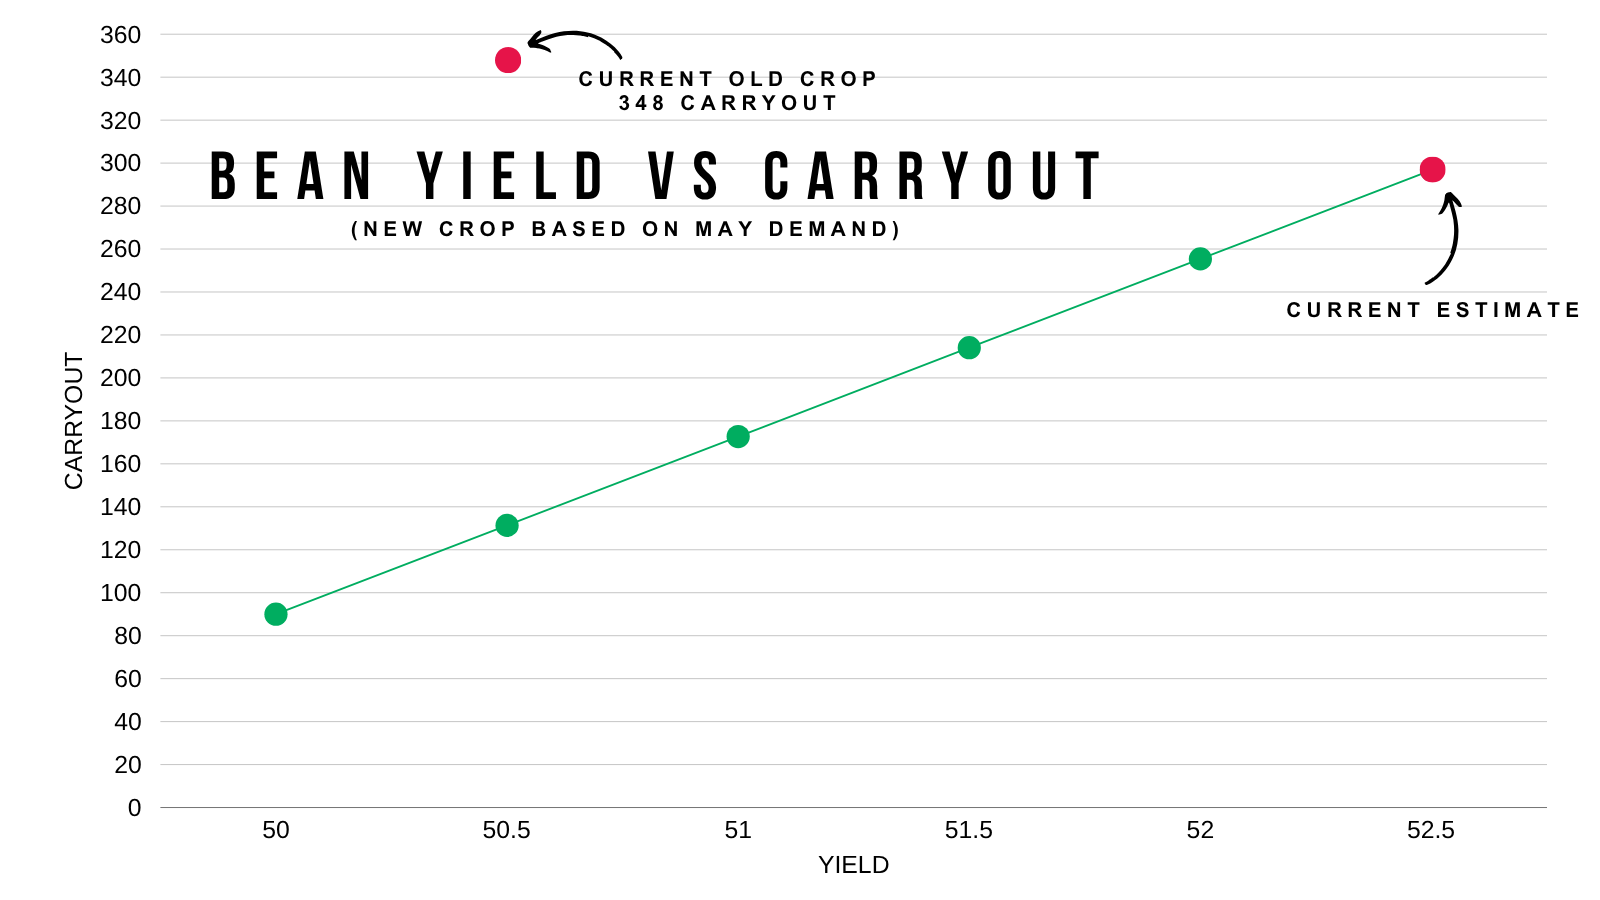
Here is a simple view of how yield could impact our carryout.
Again this uses the May demand numbers. Demand numbers will change. But you get the idea. There is a possible path tighter.
This chart also shows how carryout is tighter than year, even if yield is 2 bpa higher than last year.
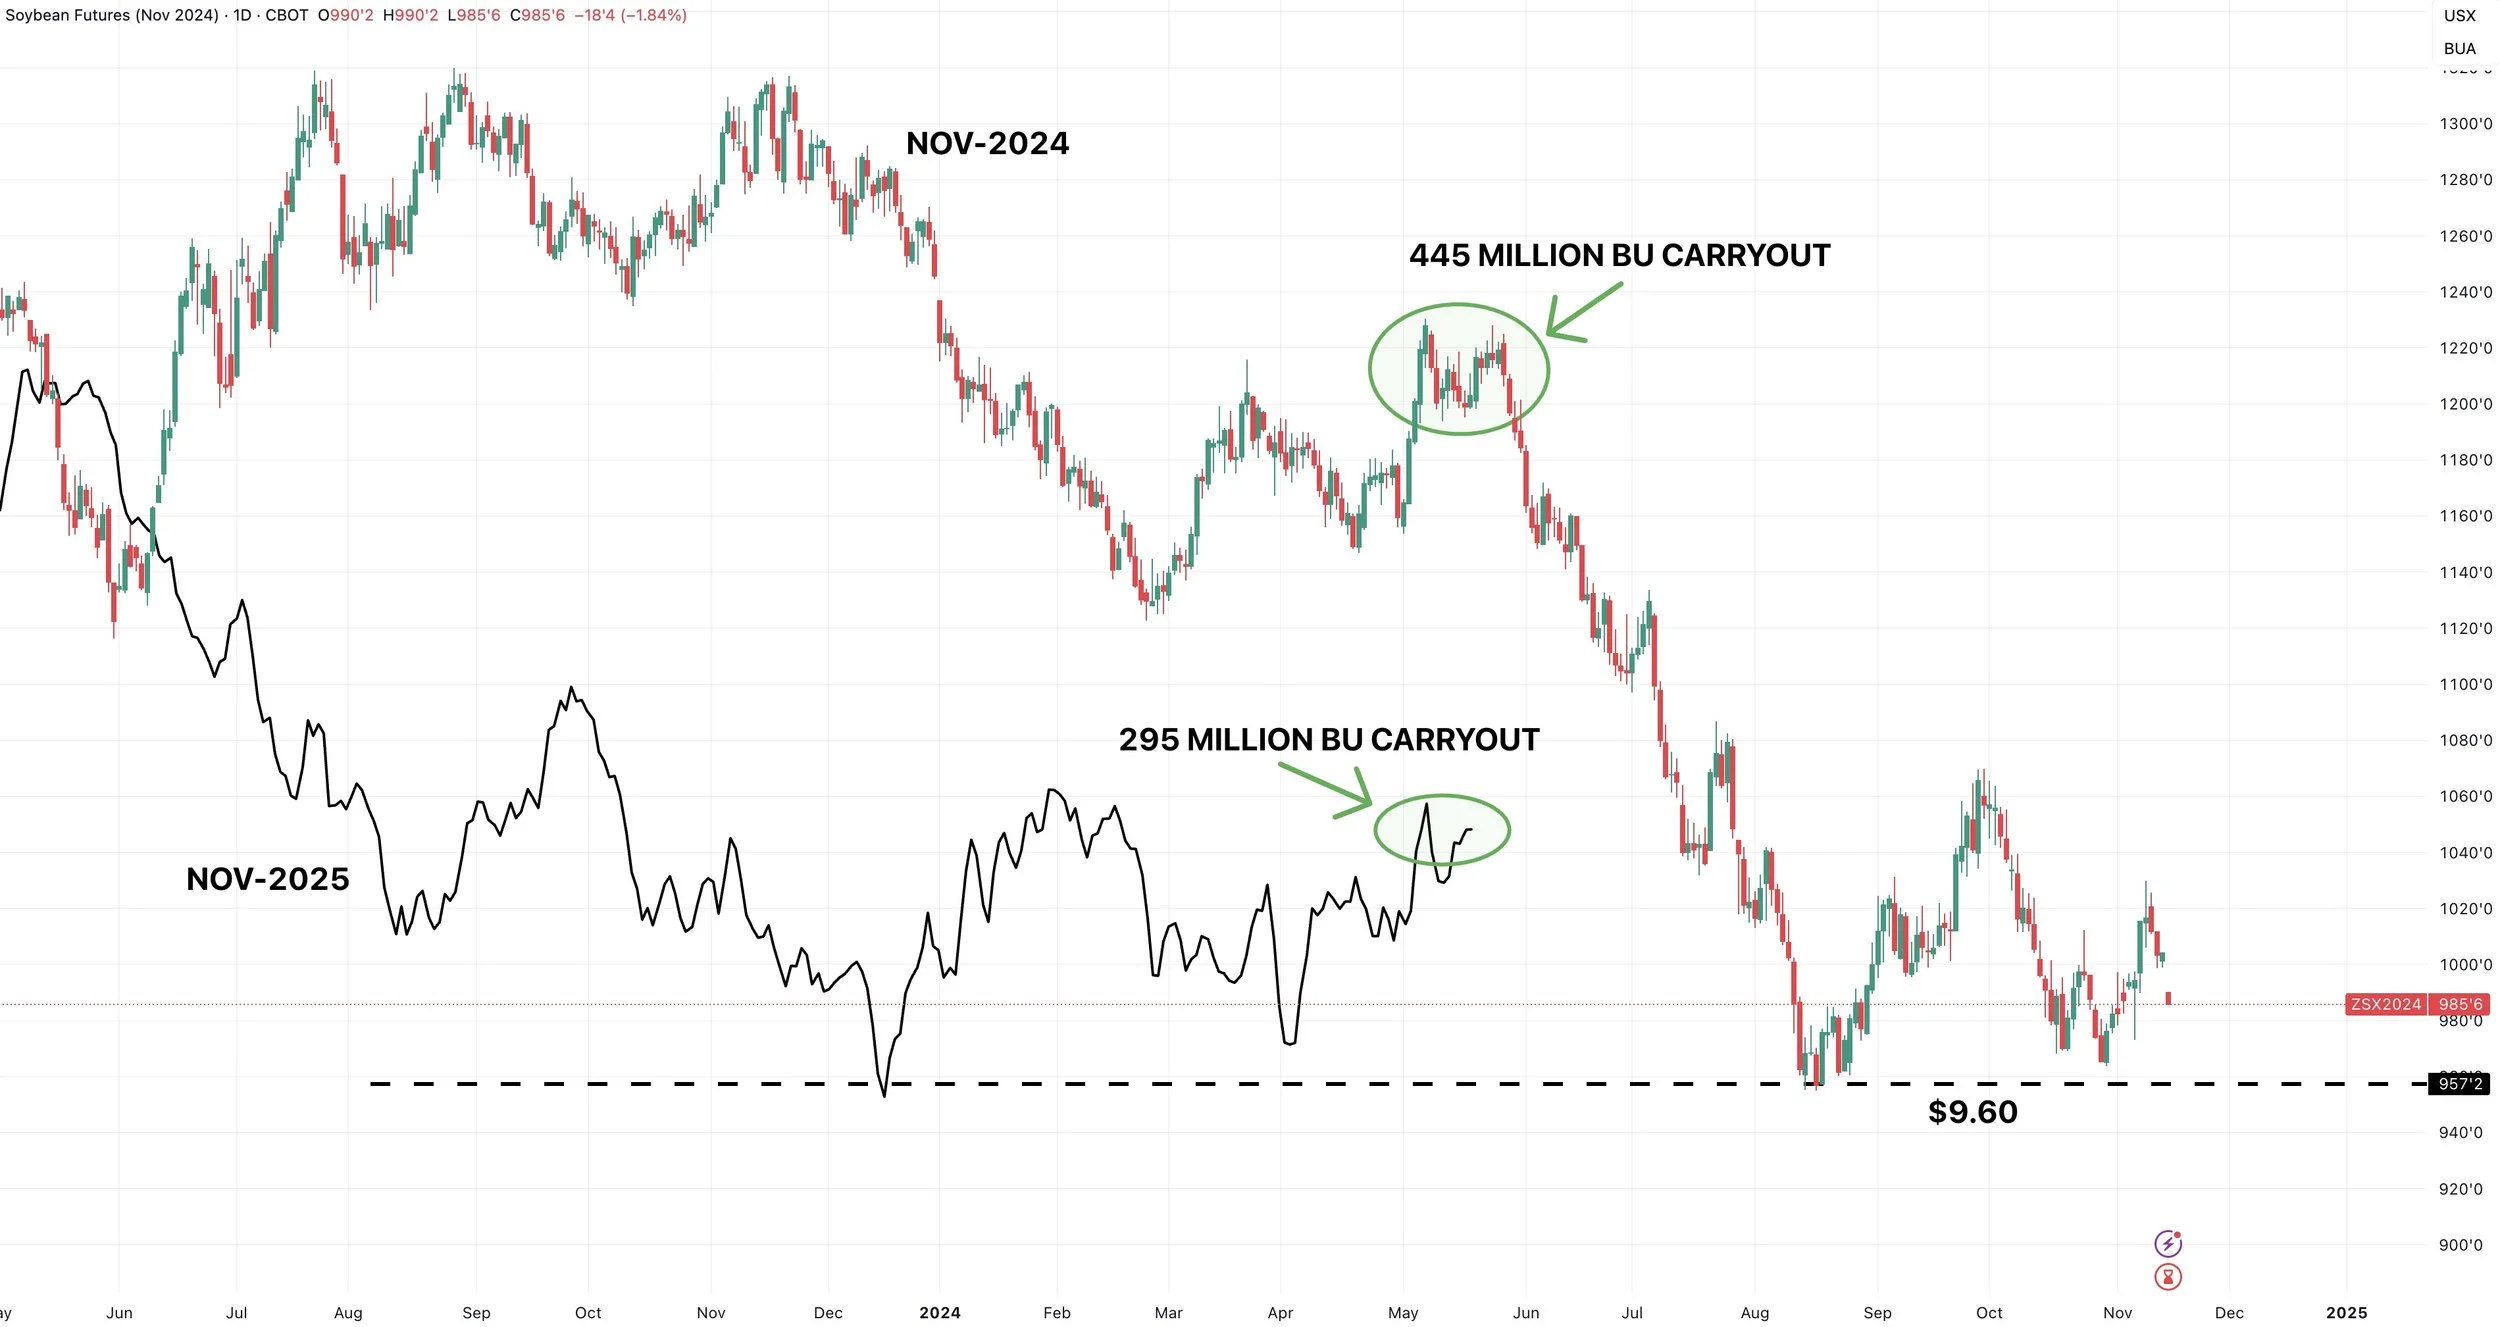
To put things into perspective, exactly a year ago Nov soybeans were trading around $12.00
Our carryout at the time was 445 million bu.
Today our new crop carryout is 295 million bu.
Yes there are other factors such as Brazil's monster crop, but to me it feels like soybeans could be slightly undervalued simply based on how much tighter the US situation is.
Technicals:
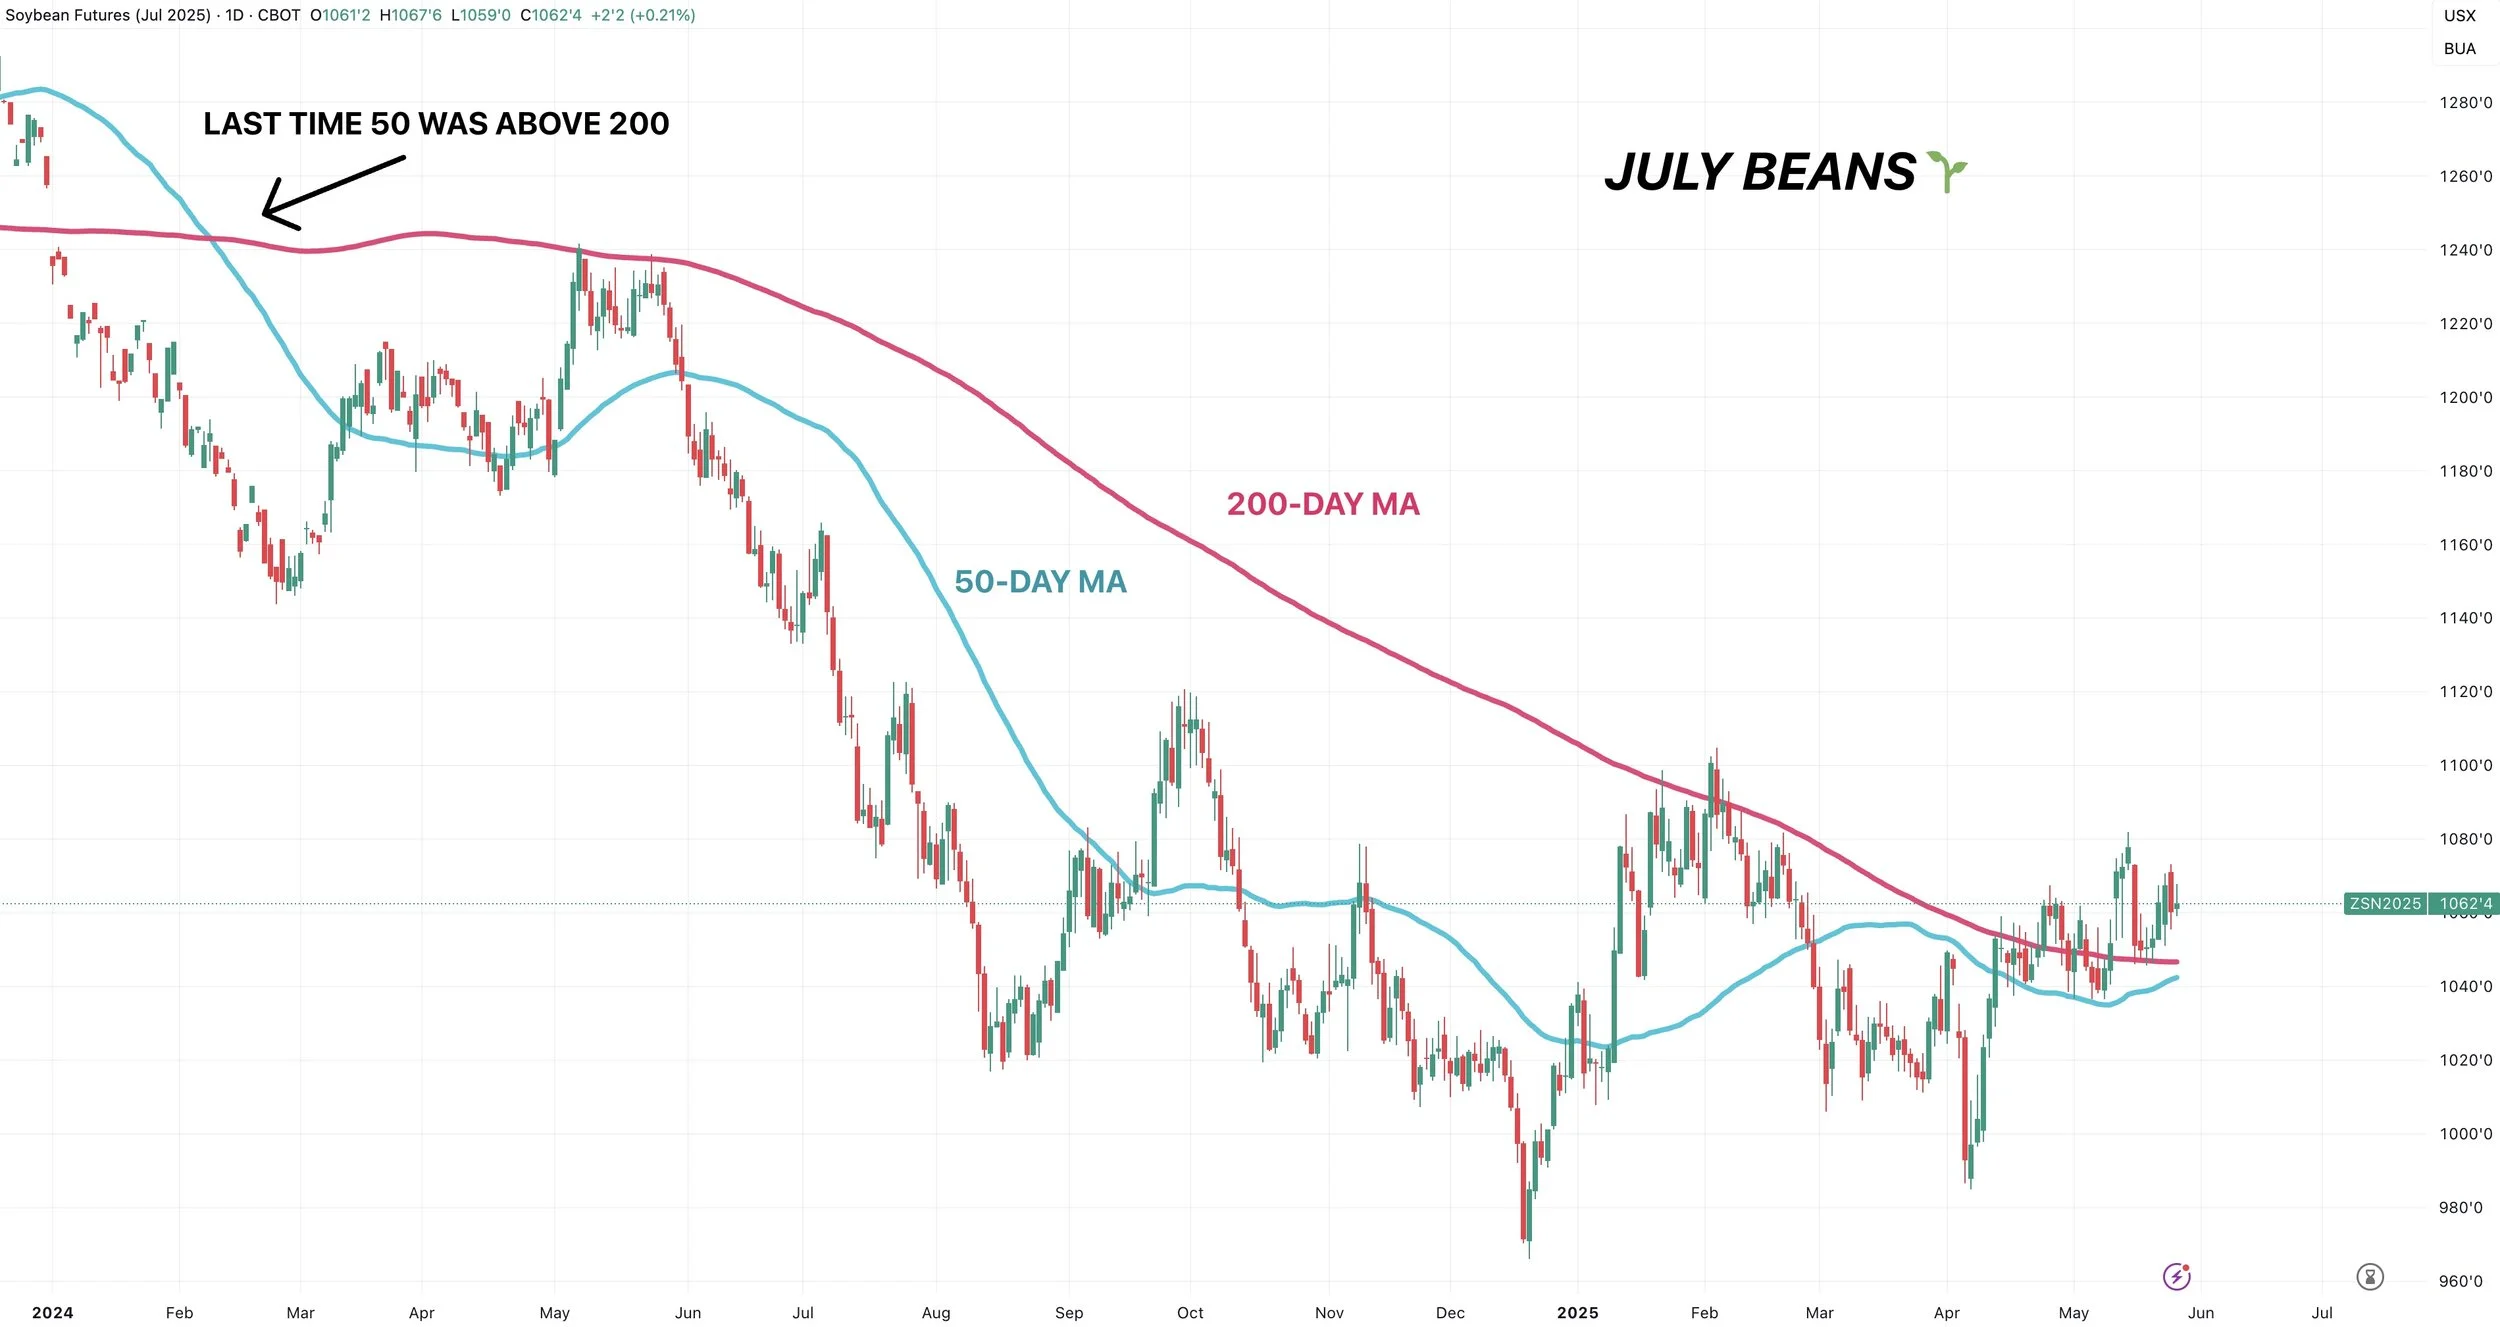
Here is July soybeans.
This just shows the 200-day (pink) and the 50-day MA (blue).
When the 50-day crosses above the 200-day it known as a "golden cross".
It is the textbook standard that suggests that long term momentum is shifting from bearish to bullish.
Soybeans are very close to seeing this happen, but not quiet yet.
Of course, it is not a guarantee. Nothing ever is. But it indicates a potential uptrend coming if it happens.
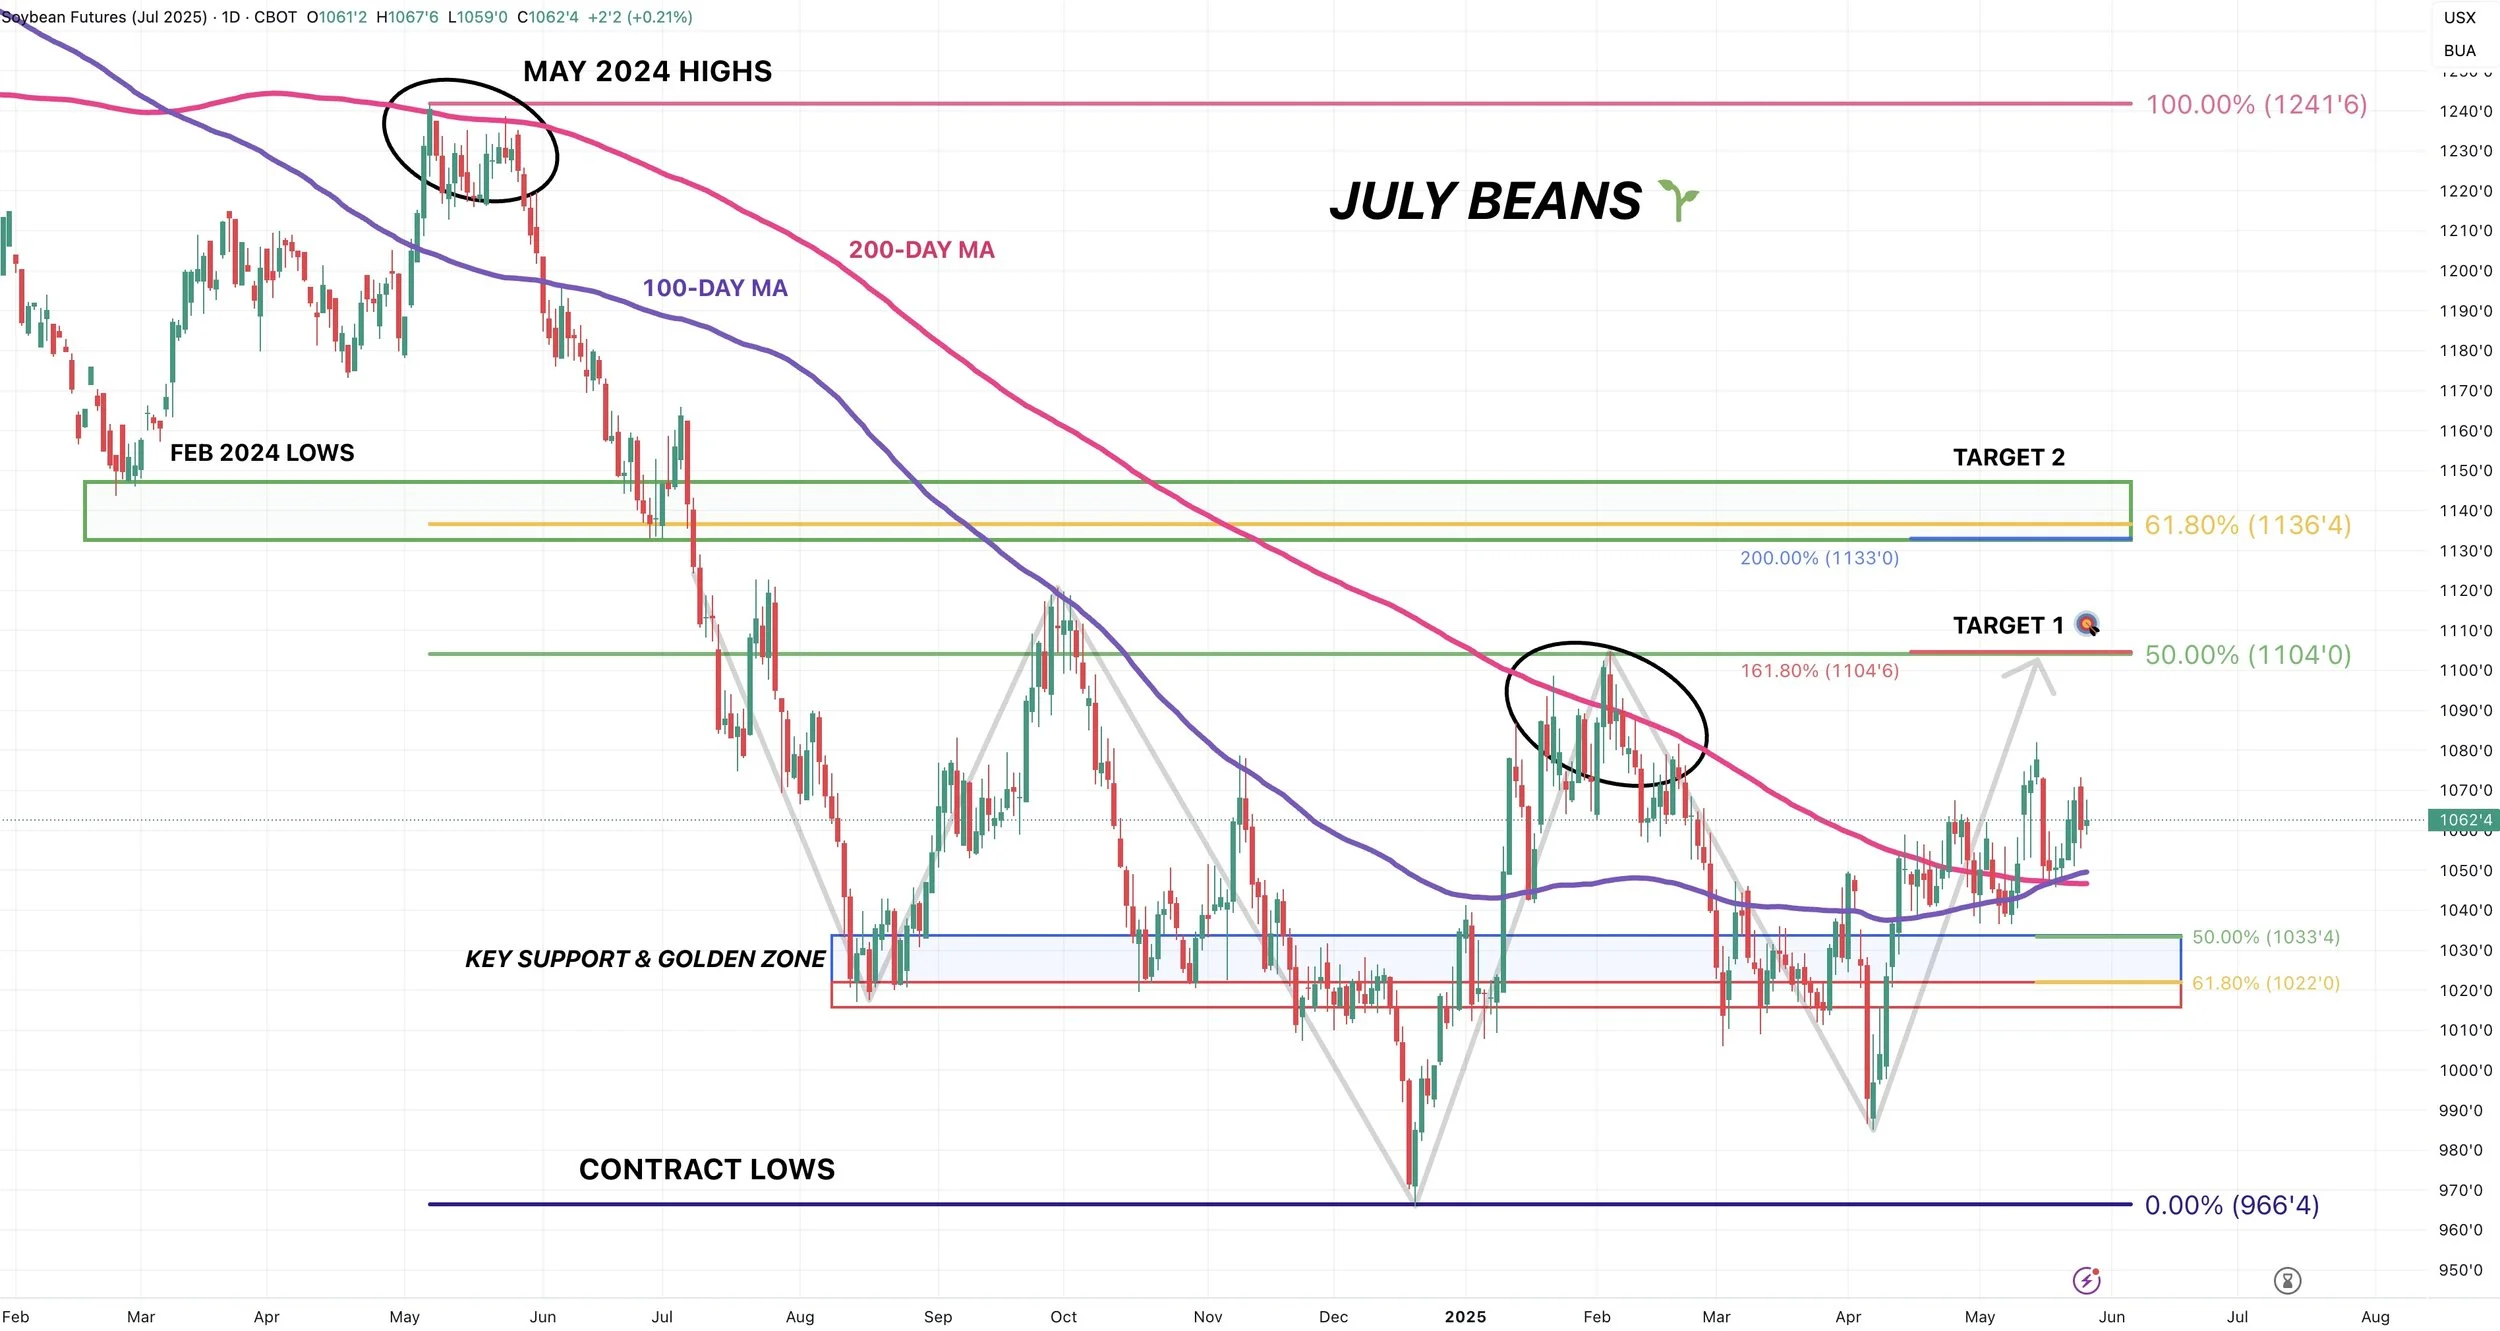
For July beans, I still have my eyes set on $11.04 to take risk off the table.
It claws back 50% of the May 2024 highs and is our highs from Feb.
Downside risk: Need to hold the 200-day MA. If we break it, we have around -40 cents of downside from here.
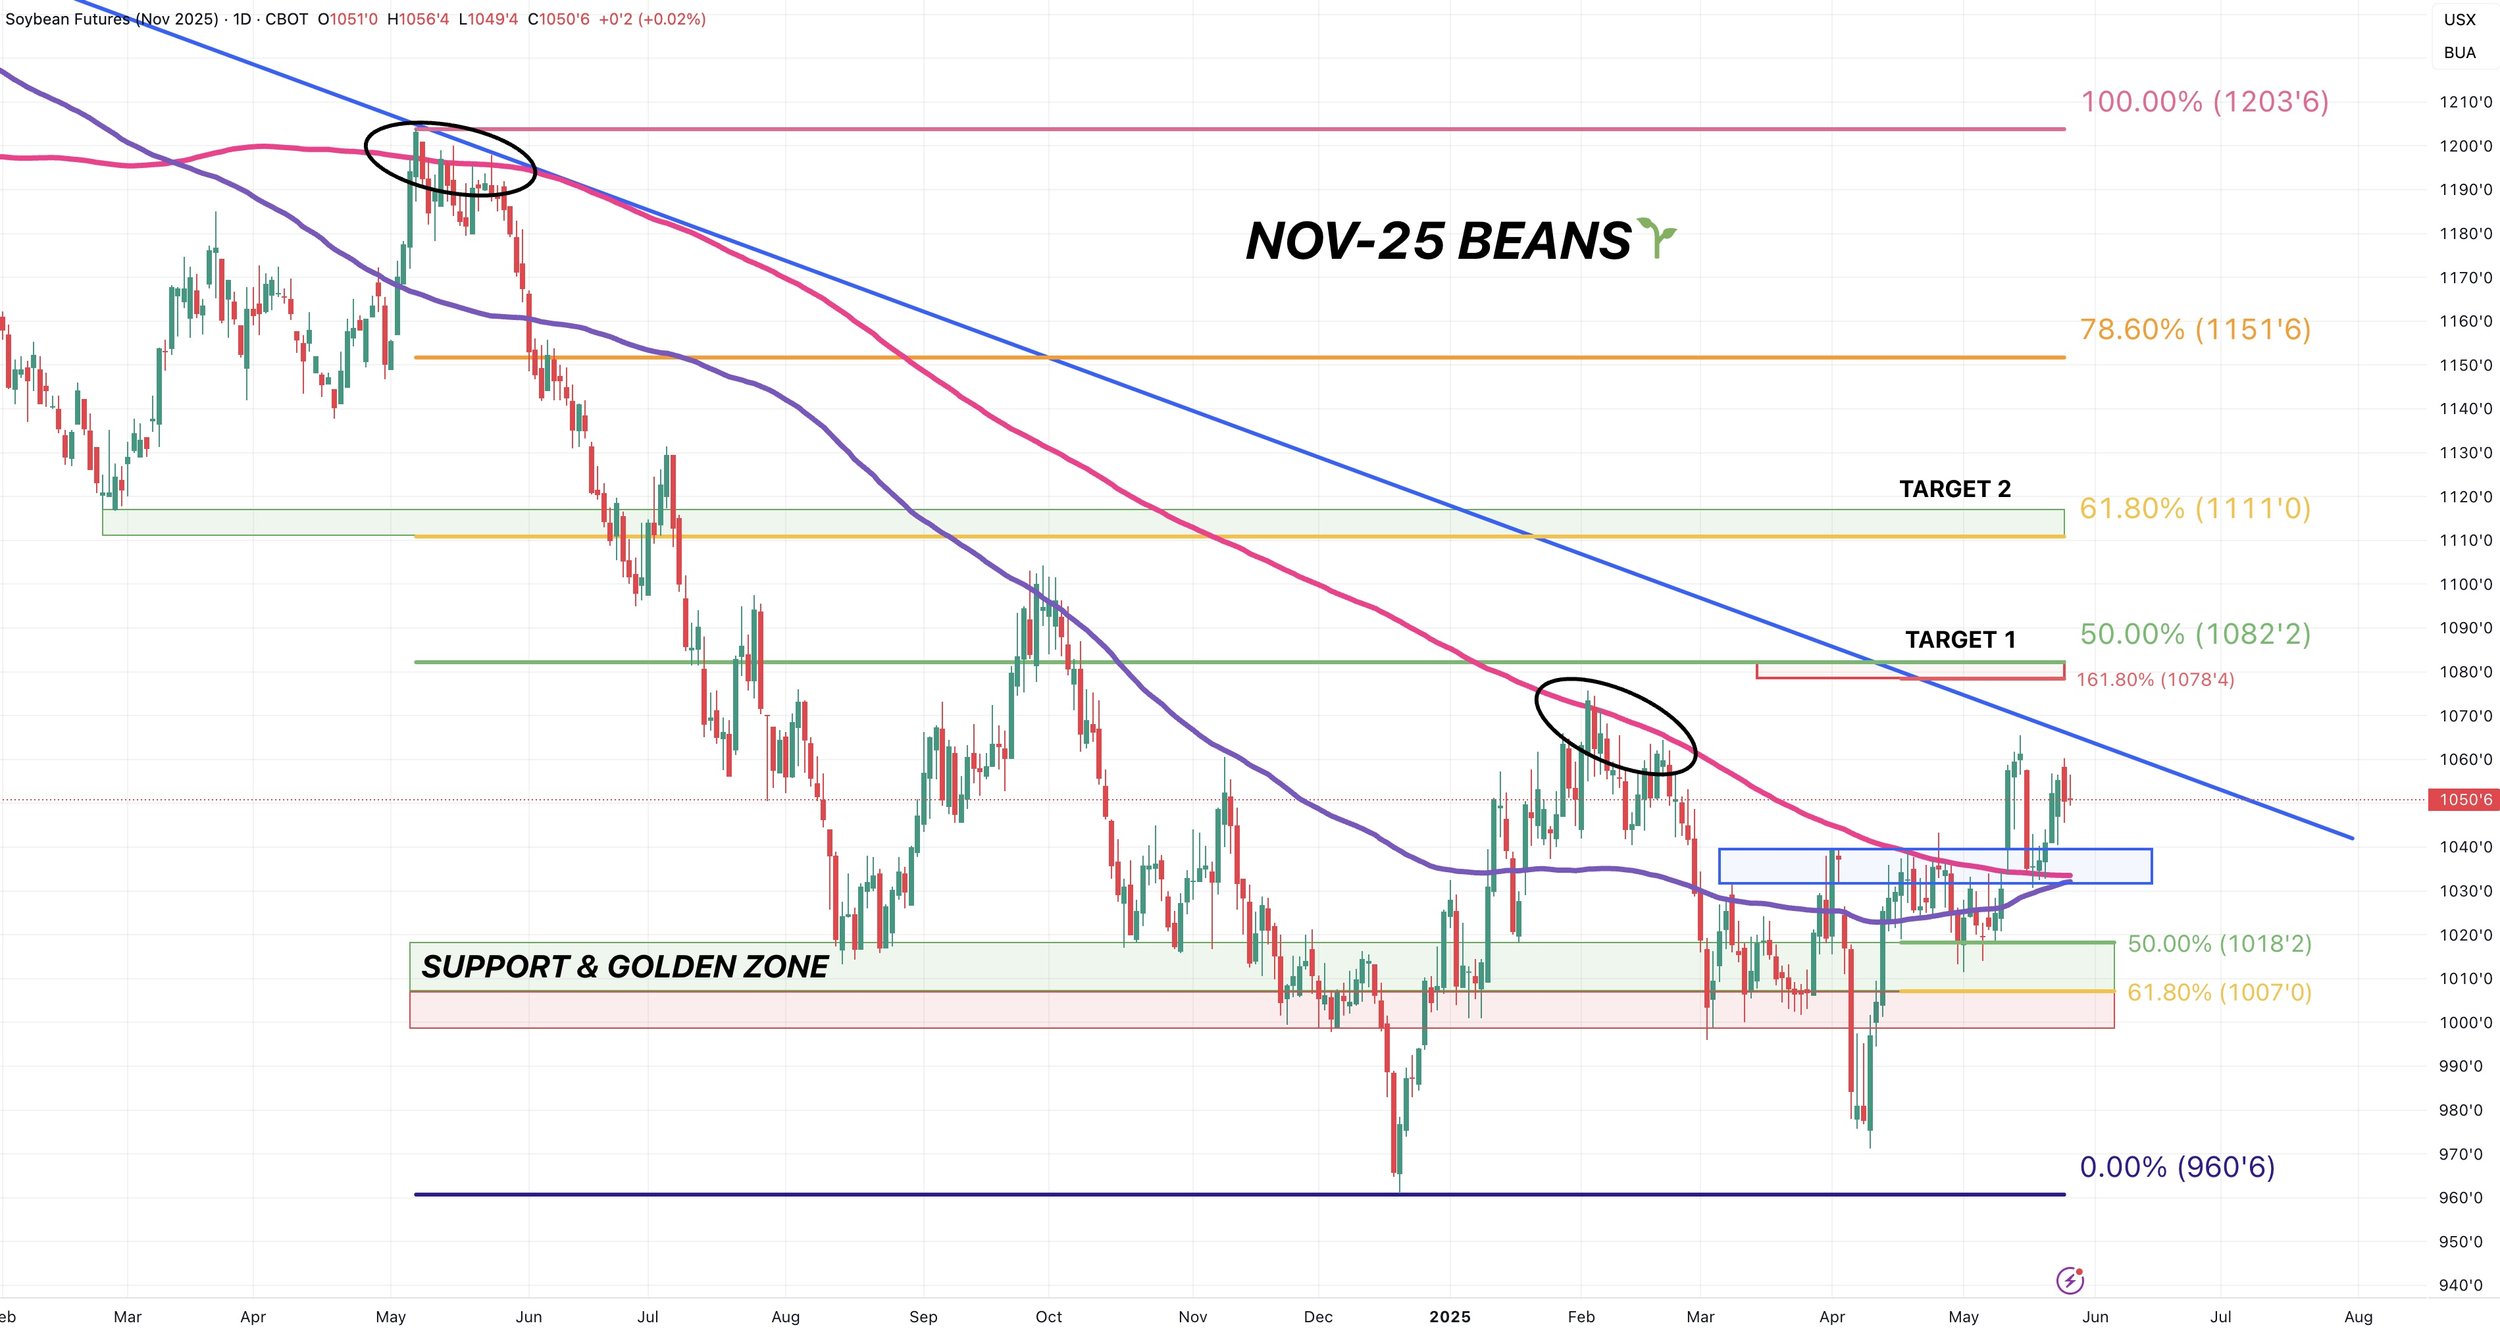
For Nov beans, eyes still set on $10.78-82.
I will be taking risk off here.
It will depend on your situation, but generically speaking probably a 10% sale or so.
Downside risk: Still need to hold 200-day MA. If we fail to hold, we have a good -40 cents of possible downside.
Wheat
Fundamentals:
We saw a drone Russia/Ukraine drone attack over the weekend but the market doesn’t care about war news anymore.
Bulls argue that Russia and China weather is getting worse.
At the same time, winter wheat conditions continue to drop after starting off the year with their best ratings in years.
We also have funds record short the wheat market.
I don’t see the logic in getting overly bearish wheat here at these levels. I'm justing waiting for an opportunity if it comes.
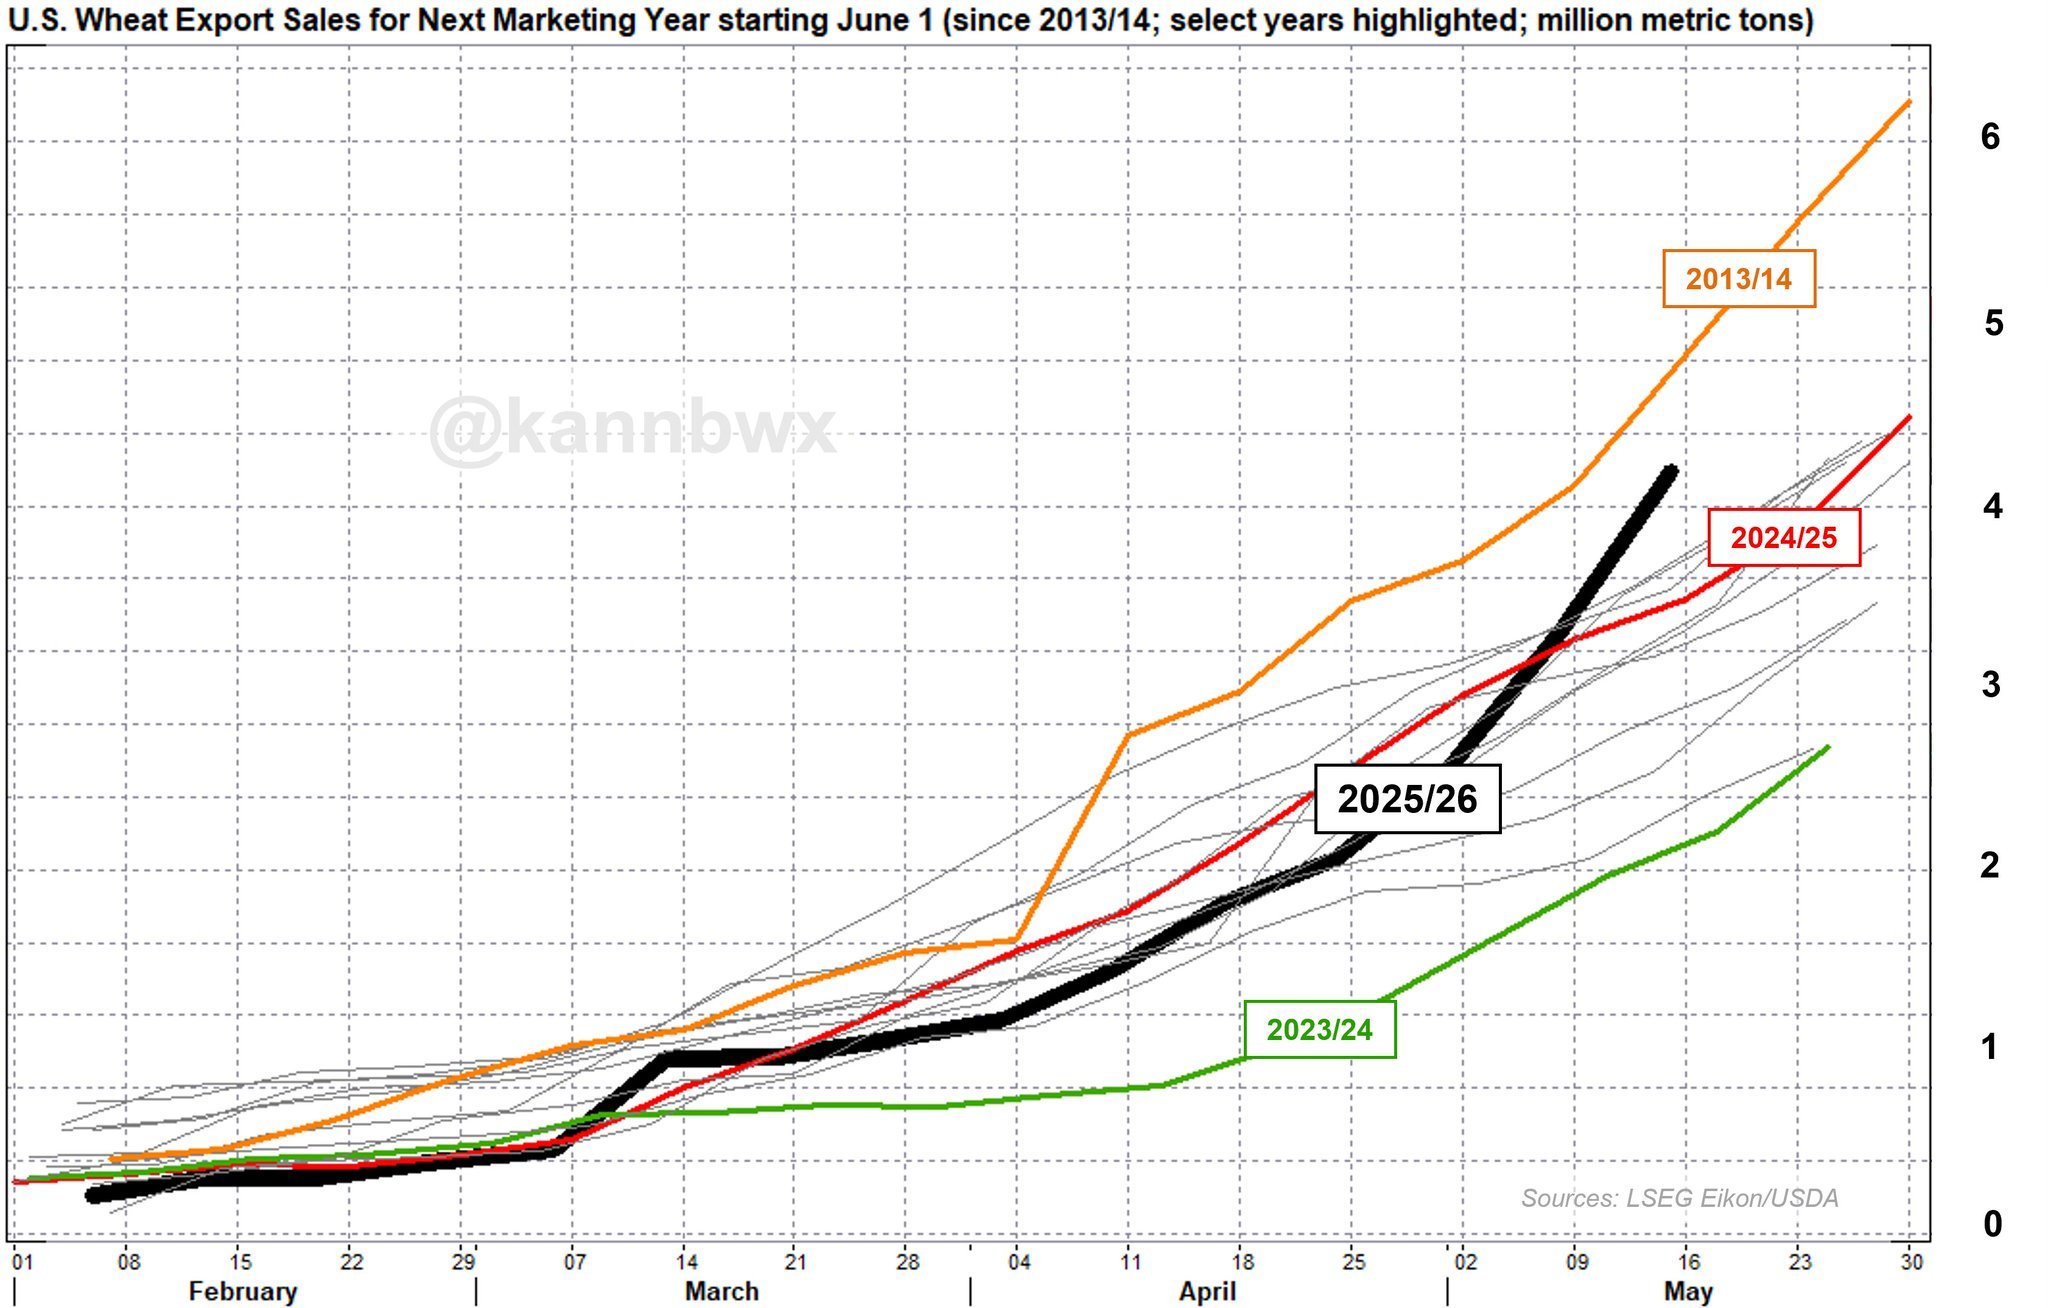
2025/26 export sales for wheat are at 12-year highs.
Meanwhile the USDA currently forecasts exports down -2.4% vs last year.
Seems like bulls have a pretty solid demand arguement building as exports are far ahead of USDA pace.
Chart from Karen Braun
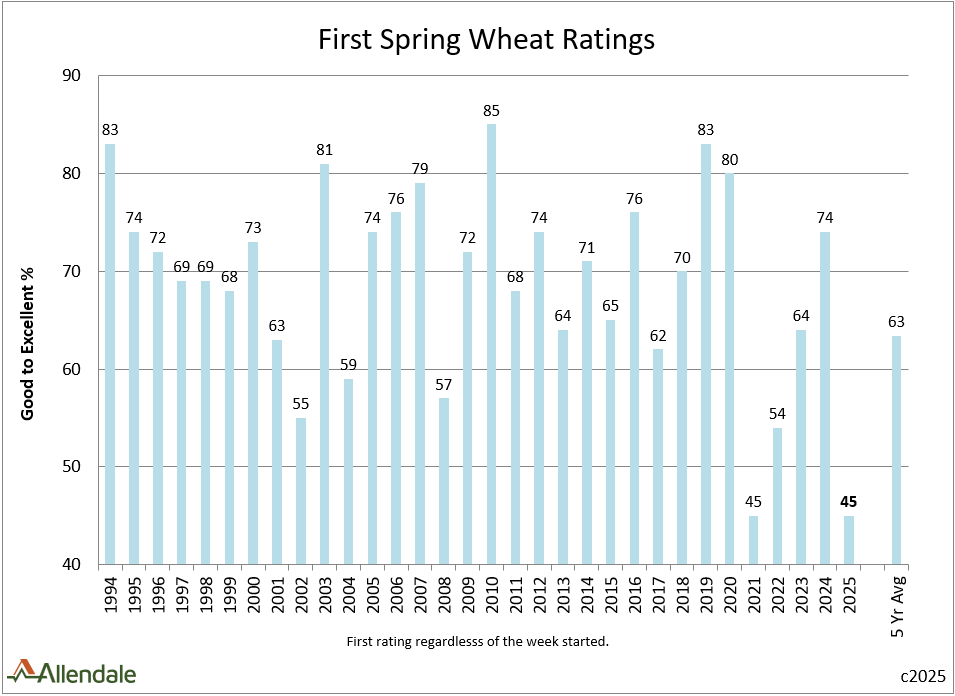
We saw our first spring wheat crop condtions out today.
It was a huge surprise. As they came in at 45% G/E.
That is the worst start since 1994.
Would like to think this sparks a little life in the market.
Chart from Allendale
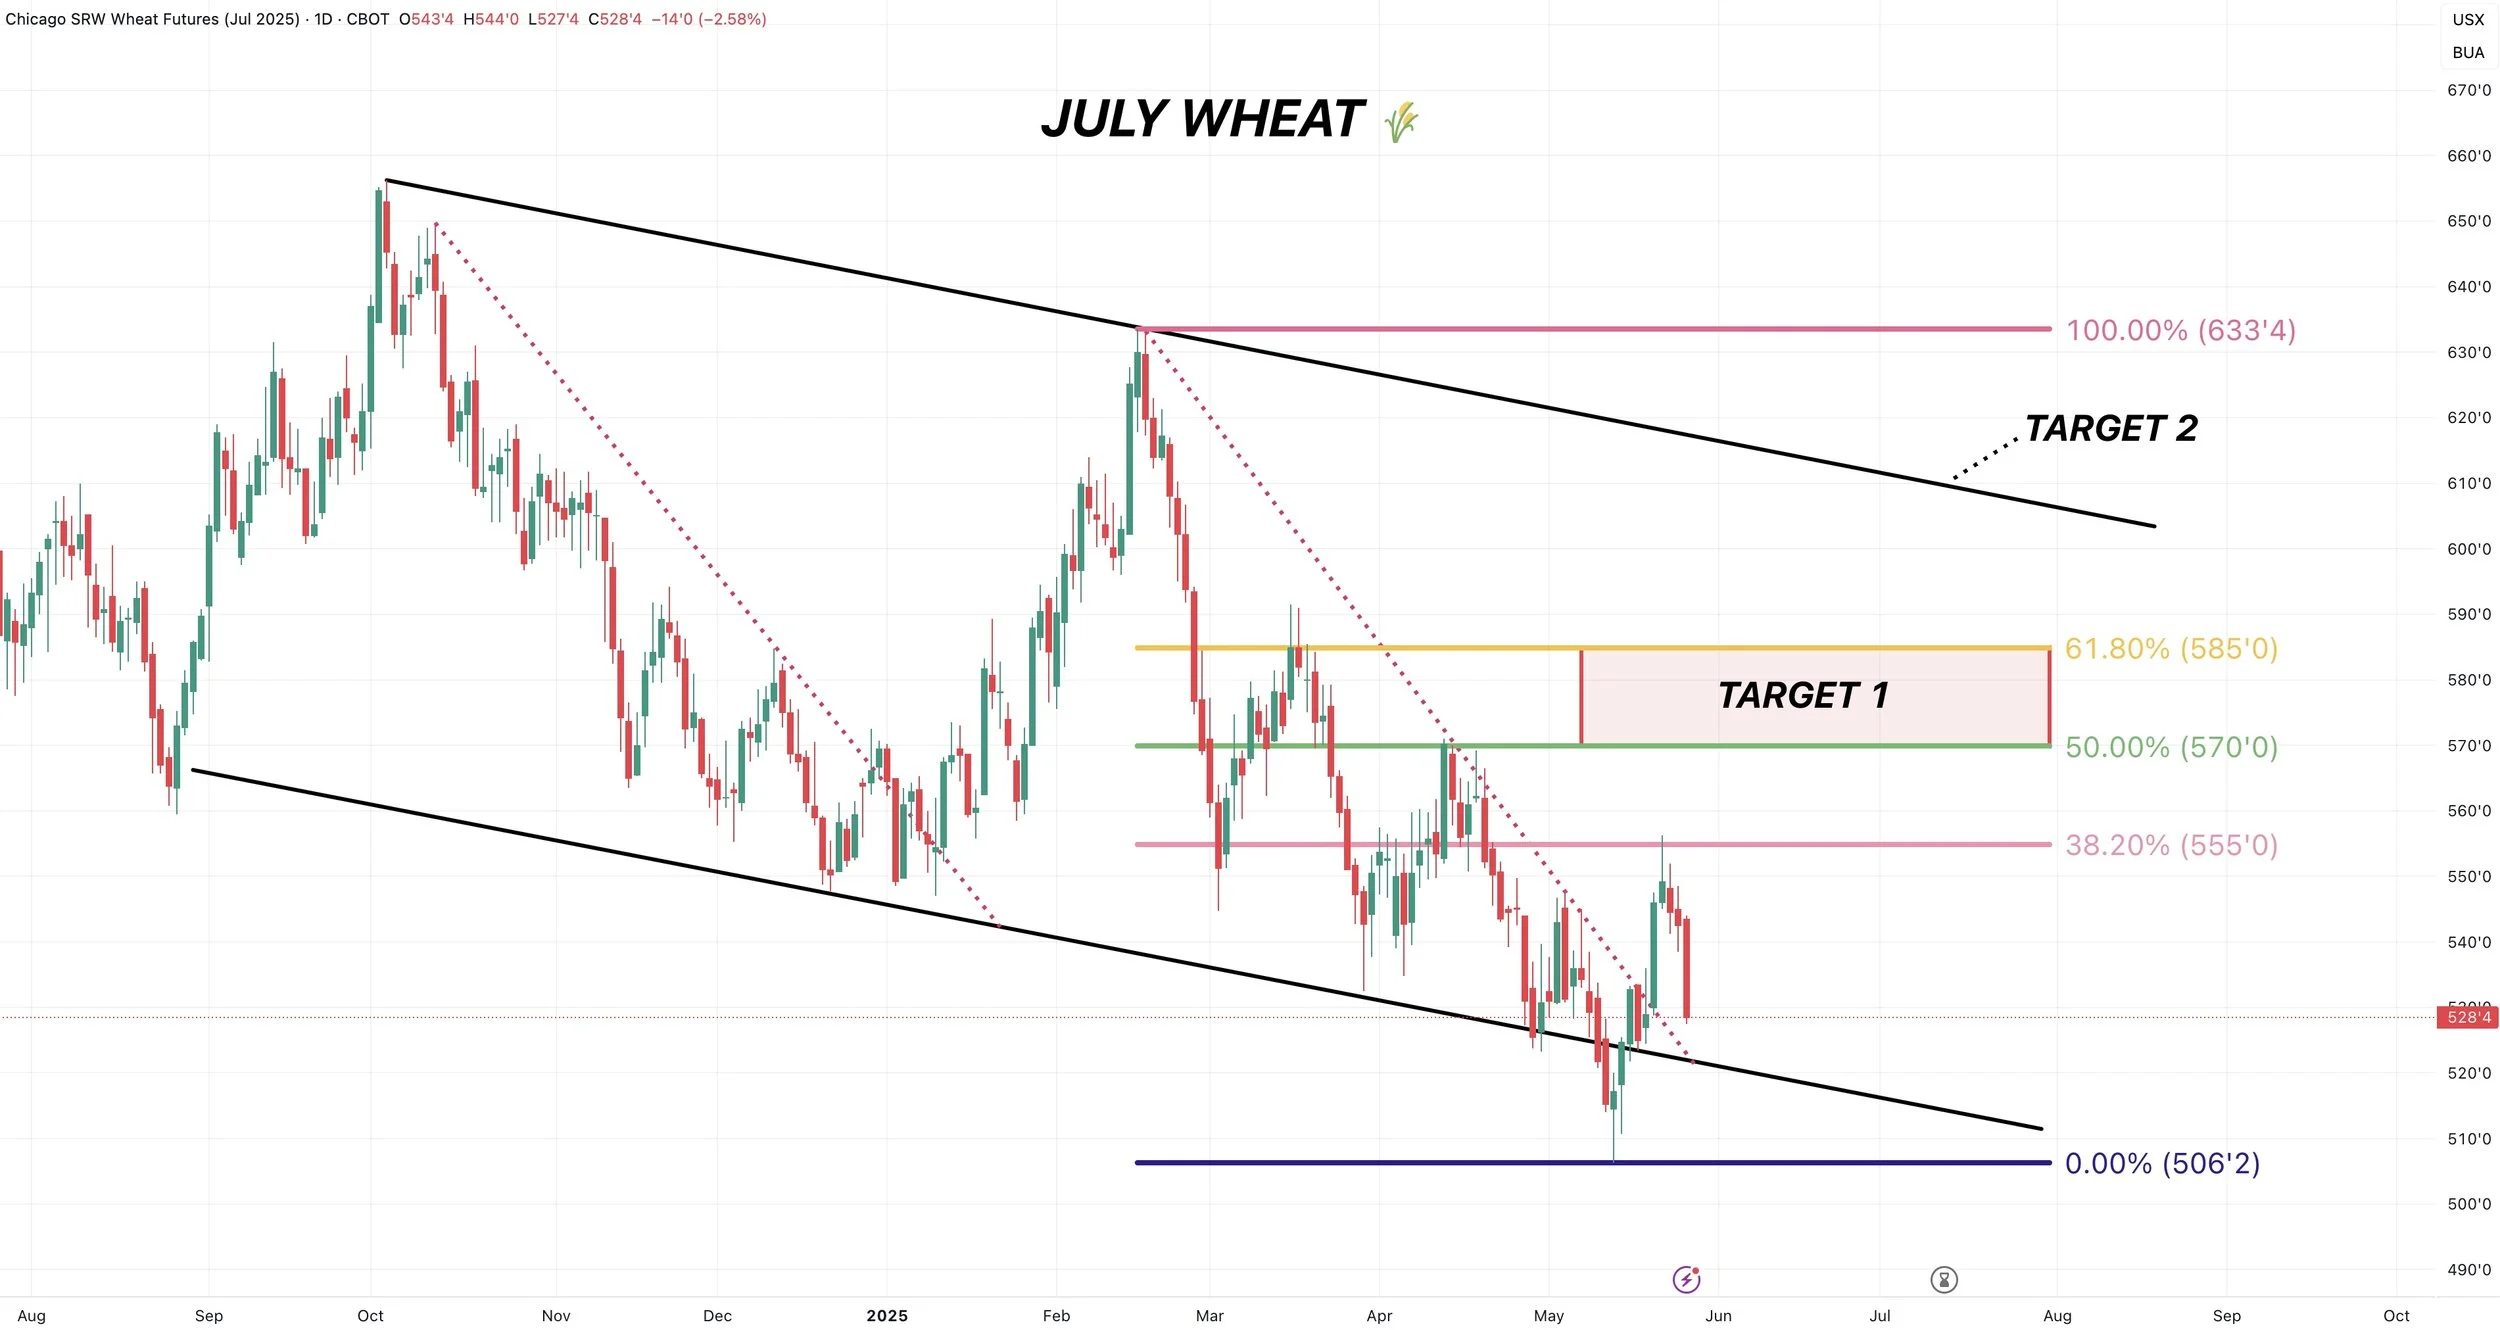
Technicals:
For July Chicago, I'm looking to de-risk if we get a rally up to $5.70 to $5.85 which claws back 50-61.8% of the Feb highs.
Bigger picture target is the top of the channel.
For July KC, the first target is $5.75 to $5.94 which is 50-61.8% of the Feb highs.
It feels like a long ways away, but I don’t have interest in selling $5.20 wheat.
We rejected right off that old support trendline (which is now resistance). I want to see us break above that to confirm more upside.

Past Sell or Protection Signals
We recently incorporated these. Here are our past signals.
April 10th: 🌽
Old crop corn sell signal.
March 19th: 🐮
Cattle hedge & sell signal.
Feb 18th: 🌽 🌾
Old crop KC wheat & old crop corn signal.
Jan 23rd: 🌽 🌱
Corn & beans old crop sell signal.
CLICK HERE TO VIEW
Jan 15th: 🌽 🌱
Corn & beans hedge alert/sell signal.
Jan 2nd: 🐮
Cattle hedge alert at new all-time highs & target.
Dec 11th: 🌽
Corn sell signal at $4.51 200-day MA
CLICK HERE TO VIEW
Oct 2nd: 🌾
Wheat sell signal at $6.12 target
Sep 30th: 🌽
Corn protection signal at $4.23-26
Sep 27th: 🌱
Soybean sell & protection signal at $10.65
Sep 13th: 🌾
Wheat sell signal at $5.98
May 22nd: 🌾
Wheat sell signal when wheat traded +$7.00
Want to Talk?
Our phones are open 24/7 for you guys if you ever need anything or want to discuss your operation.
Hedge Account
Interested in a hedge account? Use the link below to set up an account or shoot Jeremey a call at (605)295-3100.
Check Out Past Updates
5/23/25
TARIFFS SPOOK MARKET. GAME PLAN MOVING FORWARD
5/22/25
CHART BREAKDOWNS & TARGETS
5/21/25
RISK TO THE UPSIDE WITH WEATHER?
5/20/25
WHEAT SHORT COVERING & HISTORY OF YIELD CHANGES
5/19/25
ANYONE LEFT TO SELL WHEAT? 181 CORN YIELD POSSIBLE?
5/16/25
FUNDS SHORT CORN. MARKETS WAITING ON WEATHER
5/15/25
BEANS HAMMERED ON RUMOR & WHEAT FINDING LIFE
5/14/25
DECISIONS & POSSIBILITIES IN GRAINS
5/13/25
GRAINS RALLY OFF LOWS
5/12/25
USDA REPORT. HOW THIS CHANGES THINGS
5/9/25
BIGGEST RISKS IN USDA REPORT
5/8/25
USDA MONDAY & HISTORY OF WEATHER RALLIES
5/7/25
NEW 2025 LOWS FOR CORN
5/6/25
WHAT’S A SUMMER RALLY LOOK LIKE?
5/5/25
CORN ERASES ENTIRE APRIL RALLY
5/2/25
SELL INTO UNCERTAINTY. NOT KNOWN FACTORS
5/1/25
THE CASE AGAINST A FEB TOP IN CORN
4/30/25
APPROACHING KEY TIME PERIOD FOR GRAINS
4/29/25
PLANTING & FIRST NOTICE DAY PRESSURE. CORN CLOSE TO BOTTOM?
4/28/25
CAPTURING INVERSE & SEASONAL PREPARATION
4/25/25
HOW OFTEN DOES CORN NOT BREAK APRIL HIGHS?
4/24/25
KNOW WHEN TO SELL. BEANS BREAK 200-DAY FIRST TIME IN 483 DAYS
4/23/25
MONEY FLOW & DROUGHT CARDS
4/22/25
CRUCIAL SPOT FOR CORN & BEANS
4/21/25
NO PLANTING THREAT YET
4/18/25
POTENTIAL OPPORTUNITIES, BASIS CONTRACTS & STRATEGIES
4/16/25
HOW YIELD IMPACTS CARRYOUT. MAJOR SPOT FOR SOYBEANS
4/15/25
TOTAL CHART BREAKDOWNS & TARGETS
4/14/25
TECHNICAL SELLING IN GRAINS
4/11/25
SPECIFIC GRAIN MARKETING DECISIONS
4/10/25
USDA REPORT. HOW THIS IMPACTS CORN
4/9/25
TARIFFS GIVE. TARIFFS TAKE
4/8/25
CORN’S DIVERGING STRENGTH
4/7/25
SOLID PRICE ACTION DESPITE OUTSIDE FEAR
4/4/25
CORN PRICE ACTION SPEAKS VOLUME. ANY HOPE LEFT FOR SOYBEANS?
4/3/25
WHAT IS LEFT FOR CORN BEARS? TRADE WAR: CHARTS HOLDING SUPPORT
4/2/25
SHOULD UNKNOWNS KEEP A FLOOR UNDER GRAIN PRICES?
4/1/25
HOW DO ACRES IMPACT FUTURE OF THE GRAINS?
3/31/25
USDA REPORT: NOW WHAT?
3/28/25
ALL EYES ON USDA
3/27/25
PRE-USDA POSITIONING. DON’T GIVE GRAIN AWAY
3/26/25
HISTORY OF MARCH INTENTIONS. SOYBEANS UNDERVALUED?
3/25/25
6 DAYS UNTIL MAJOR USDA REPORT
3/24/25
HOW TO POSITION YOURSELF BEFORE PLANTING
3/21/25
REASONS TO BE OPTIMISTIC IN GRAINS?
3/20/25
WAS THAT THE BOTTOM IN CORN?
3/19/25
THE PATH HIGHER & THE DOWNSIDE RISKS IN GRAINS
3/18/25
SEASONALS, CATTLE HEDGE, CHARTS & DROUGHT?
3/17/25
WHEAT RALLIES. DON’T GET BACKED INTO A CORNER
3/14/25
MARCH 31ST REPORT THOUGHTS & WHAT’S NEXT FOR GRAINS
3/13/25
EXPLAINING RE-OWNERSHIP VS COURAGE CALLS
3/12/25
TARIFF FEARS. EU, CANADA, & ETHANOL
3/11/25
USDA SNOOZE. RECORD FUND SELLING A CONCERN?
3/10/25
USDA TOMORROW. GETTING COMFORTABLE IN MARKETING
3/7/25
HOW TIGHT IS THE WORLD & US SITUATION?
3/6/25
TARIFFS PUSHED BACK. FUTURE OPPORTUNITIES?
3/5/25
IS GRAINS BIGGEST RISK WEAK CRUDE & DEFLATION?
3/4/25
TRADE WAR BEGINS. 8TH DAY OF PAIN FOR GRAINS
3/3/25
TARIFFS ON TOMORROW. BUY SIGNAL
3/3/25
BUY SIGNAL
2/28/25
WHEN WILL THE BLEEDING STOP?
2/27/25
CORN AT CRITICAL SPOT. USDA ACRE REPORT. WAY TOO EARLY DROUGHT TALK
2/26/25
HISTORY SUGGESTS CORN TOP ISN’T IN? ACRE OUTLOOK TOMORROW
2/25/25
POSITIVE CLOSE. WHAT TO KNOW ABOUT USDA OUTLOOK
2/24/25
USDA OUTLOOK, FIRST NOTICE DAY & BRAZIL
2/21/25
WHAT TO EXPECT MOVING FORWARD IN GRAINS
2/20/25
FIRST NOTICE DAY CONCERNS. MASSIVE CORN ACRES OR NOT?
2/19/25
HOW TIGHT IS THE CORN SITUATION?
2/18/25
MORE DETAILS ON TODAYS SELL SIGNAL
2/18/25
OLD CROP KC WHEAT & CORN SELL SIGNAL
2/14/25
WHEAT BREAKING OUT ON WEATHER RISK. TECHNICALS & FUNDAMENTALS
2/12/25
GLOBAL GRAIN SITUATION, ACRE TALK, CHARTS & MORE
2/11/25
USDA: NOT A BEARISH REPORT. DISAPPOINTING PRICE ACTION
2/10/25
USDA TOMORROW. LONG TERM PATH FOR SUB 10% CORN STOCKS TO USE?
2/7/25
WHY WOULD THE FUNDS EXIT THEIR LONGS?
2/6/25
WHEAT FINALLY CATCHING A BID
2/5/25
COMPLETE THOUGHTS ON MARKETS: BACK & FORTH DISCUSSION
2/4/25
STRONG JANUARY LEAD TO STRONG YEAR? TARIFFS, CHARTS & MORE
2/3/25
TARIFFS PUSHED BACK
1/31/25
TARIFF NEWS ALL OVER THE PLACE. ARE YOU PREPARED FOR POSSIBILITIES?
1/30/25
WHEAT BULL ARGUMENT. TRUMP ADDS TARIFFS
1/29/25
CORN APPROACHES $5.00
1/28/25
TARIFFS, CORN FUNDS, SOUTH AMERICA & MORE
1/27/25
HEALTHY CORRECTION WE TALKED ABOUT & TARIFF NEWS
1/24/25
GRAINS DUE FOR SHORT TERM CORRECTION?
1/23/25
OUR ENTIRE NEW CROP SALES THOUGHTS & OLD CROP SELL SIGNAL
1/22/25
GRAINS TAKE A BREATHER. IS CORN IN A BULL OR BEAR MARKET?
1/21/25
HUGE DAY IN GRAINS. WHAT TO DO WITH OLD CROP VS NEW CROP
Read More
1/20/25
VIDEO CHART UPDATE
1/17/25
TRUMP, CHINA, ARGY & USING THE SPREADS INVERSE
1/16/25
OLD CROP LEADS US LOWER. MARKETING THOUGHTS
1/15/25
SIGNAL & HEDGE ALERT QUESTIONS EXPLAINED. IS $6 CORN EVEN POSSIBLE?
1/14/25
MORE DETAILS ON TODAYS HEDGE ALERT & SELL SIGNAL
1/14/25
CORN & SOYBEANS HEDGE ALERT/SELL SIGNAL
1/13/25
USDA GAME CHANGER OR NOT?
1/10/25
BULLISH USDA FOR CORN & BEANS
1/9/25
USDA OUT TOMORROW
1/8/25
2 DAYS UNTIL USDA. BE PREPARED
1/7/25
THE HISTORY OF THE JAN USDA & MORE
1/6/25
MAJOR USDA REPORT FRIDAY
Read More
1/3/25
UGLY DAY ACROSS THE GRAINS
1/2/25