
GRAINS COLLAPSING AHEAD OF JUNE REPORT
MARKET UPDATE
You can scroll to read the usual update as well. As the written version is the exact same as the video.
Timestamps for video:
History of June Report: 0:00min
Corn: 5:35min
Beans: 10:30min
Wheat: 13:40min
Want to talk about your situation?
(605)295-3100
Futures Prices Close

Overview
Capitulation continues across the grains as the blood shed continues across the board with corn posting contract lows.
Next week is all about the USDA acres & stocks report.
Here is the acre & stocks estimates.
We have a massive trade range of estimates for acres.
Corn: 93.8 to 96.8
Beans: 82 to 85
Big ranges can lead to big surprises.


History of June Acres
This report is arguably the biggest report of the year. If we look at how prices have changed on the day of this report that is pretty clear.
Price Change Average for This Report:
Corn: +/- 20 cents
Beans: +/- 33 cents
Wheat: +/- 20.5 cents
Those are some big moves for our "average" price change.
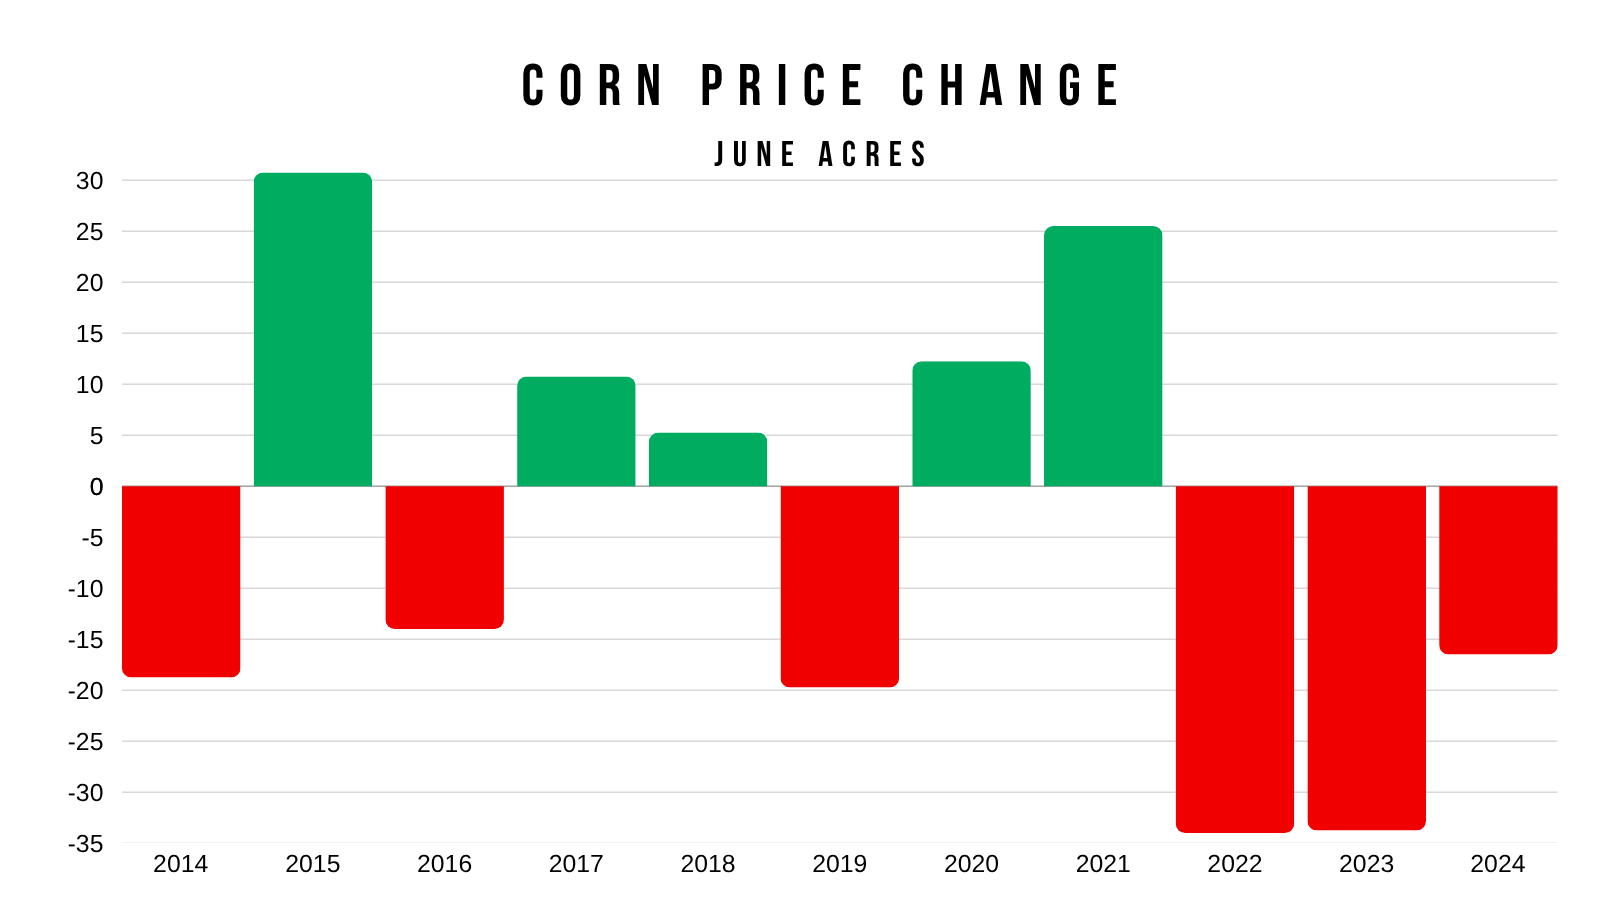
For corn, this report has been very negative 3 years in a row.
Last year we dropped almost -17 cents, then in 2022 and 2023 we saw losses of around -34 cents.
The last time this report was bullish for corn was 2021.
This report has been bullish 5 times and bearish 6 times for corn.
The corn market has not had a day where it changed less than 5 cents, up or down.
Fun fact:
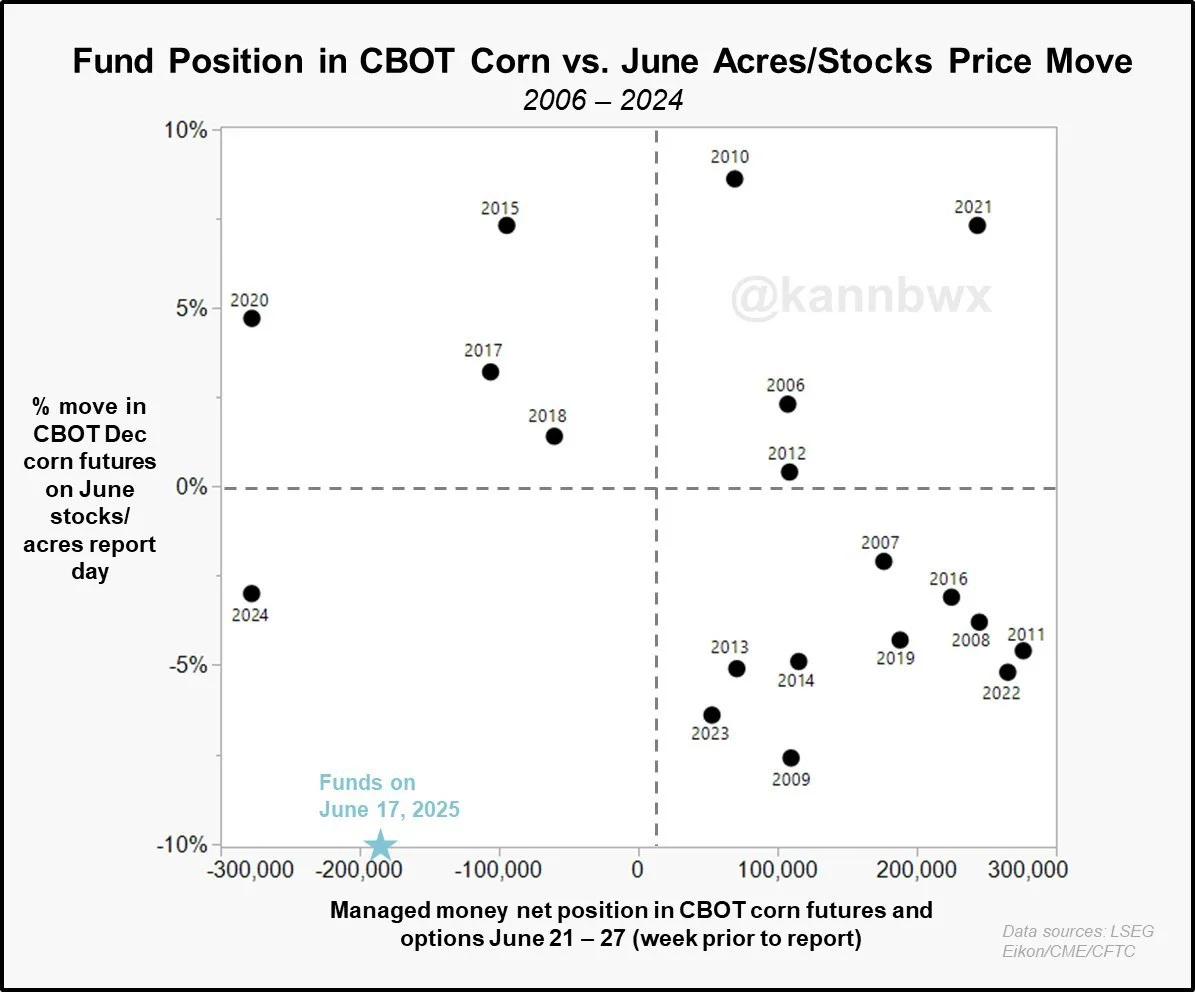
4 of those 5 years that corn traded higher on this report, the funds were short going into the report. 2021 was the only year the funds were long and we traded higher.
There has also only been 5 times that the funds were short heading into the report.
2015, 2017, 2018, 2020, and 2024.
The only year prices did not rally the day of the report when the funds were short was last year.
Here is a chart from Karen Braun on Twitter showing the funds positon vs how prices changed the day of the report.
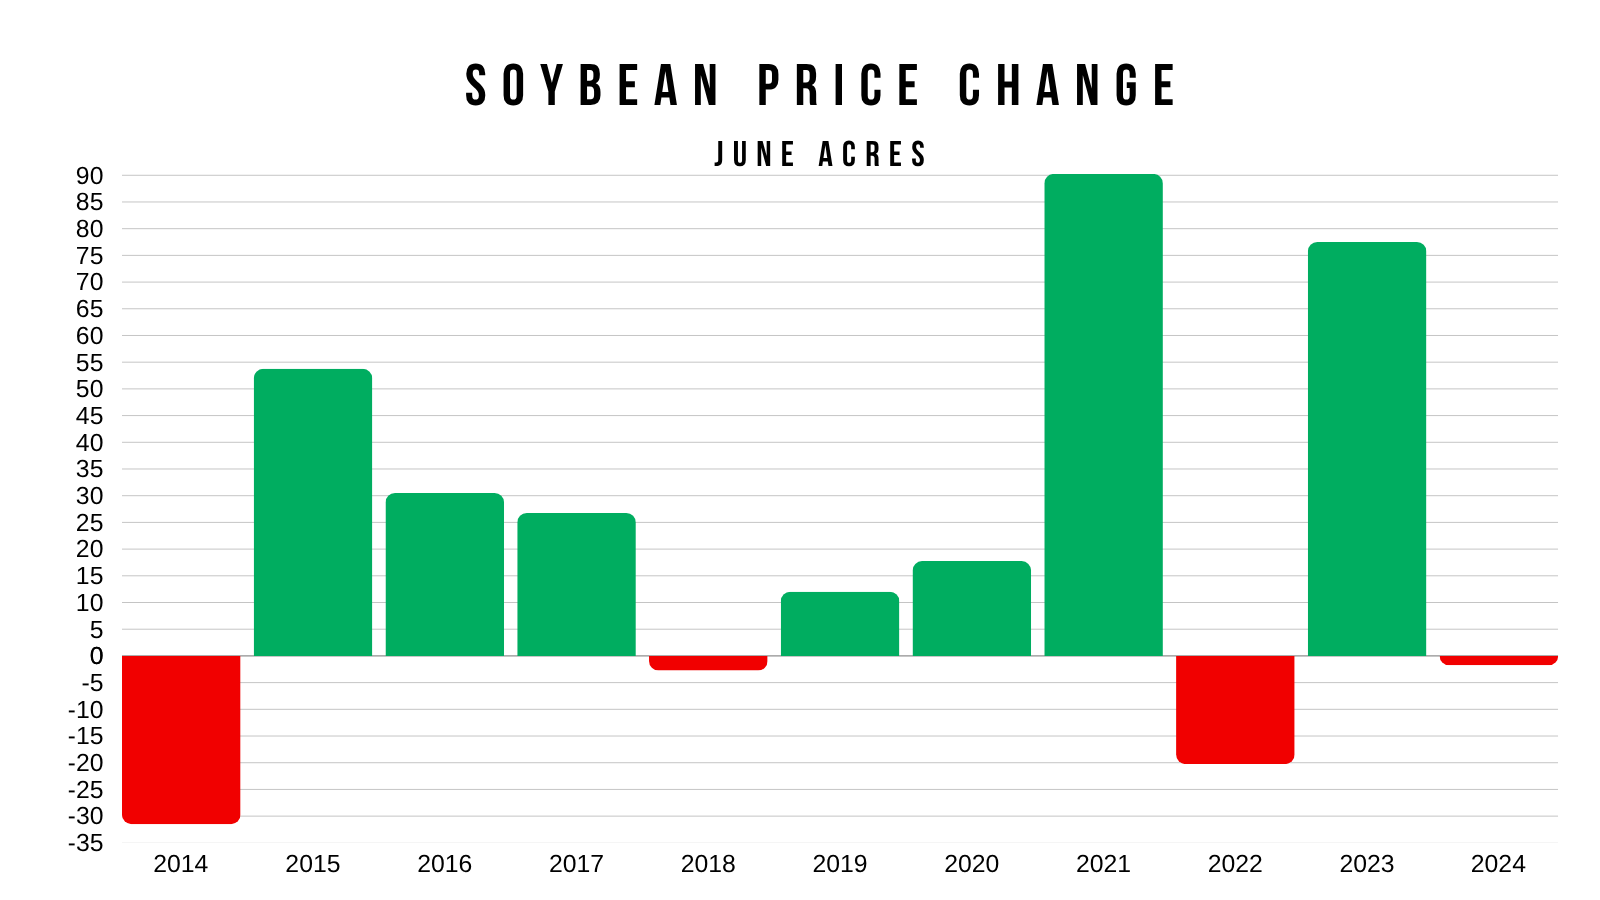
Soybeans are a different story for this report.
Soybeans have only taken it on the chin really two times in the past decade on the day of the report.
2014 (-31 cents) and 2022 (-20 cents).
2 of the 4 years we traded lower we had very minor losses of -2 to -3 cents.
More often than not, this report causes a bullish reaction in soybeans. As we have traded higher 7 of the past 11 years.
In 2023 we rallied +77 cents. In 2021 we rallied +90 cents.
The soybean market has seen just 2 years that resulted in a price change of less than 10 cents.
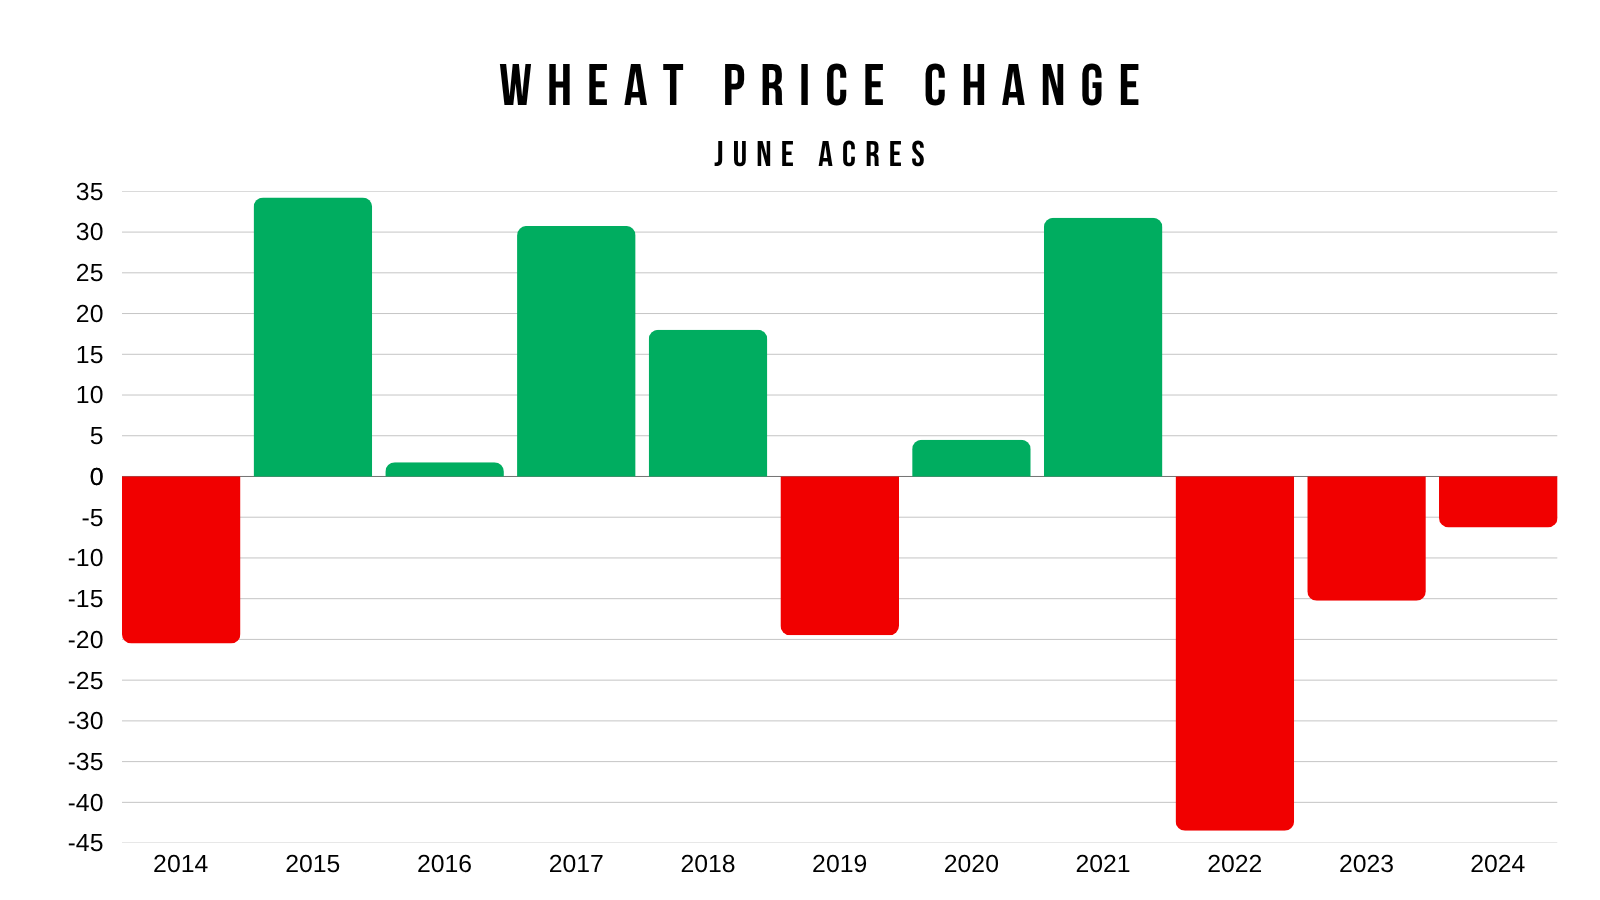
Just like corn, the wheat market has seen a bearish reaction 3 years in a row.
2022 was the only year we saw a loss of over -20 cents, where we dropped -44 cents.
Only two years saw a price change of less than 5 cents.
Now let's look at actual acres.
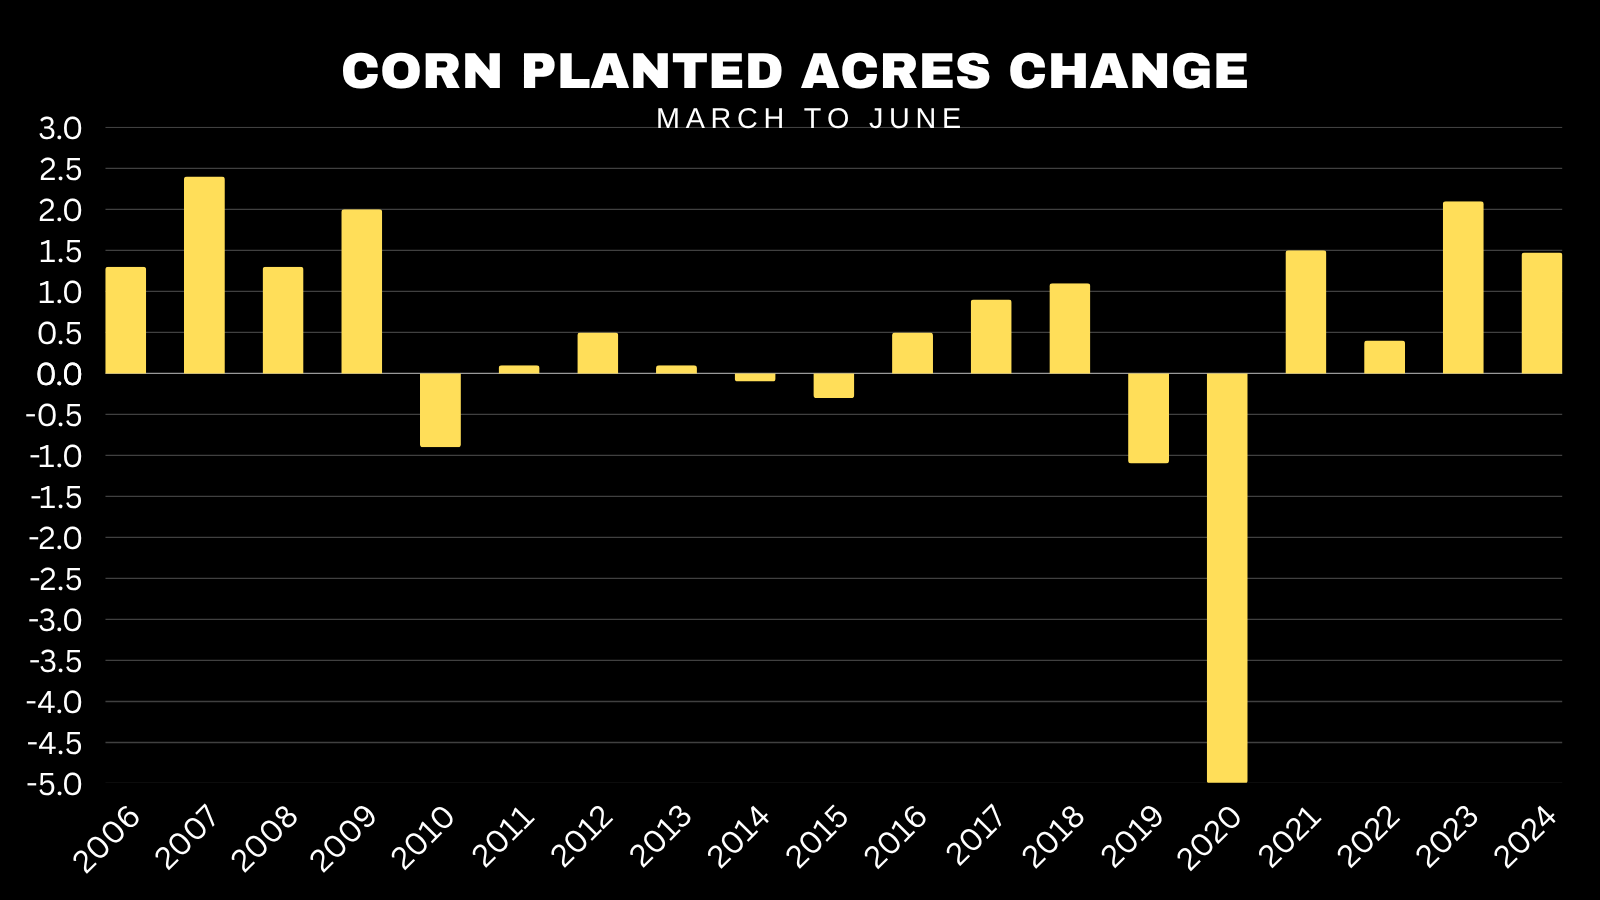
Historically, corn acres tend to rise from March intentions to the June report.
Corn acres have gotten bigger 4 years in a row, and in 7 of the last 9 years.
2019 and 2020 are the only years we saw corn acres drop by more than 1 million.
On the other hand, 8 of the last 19 years saw corn acres jump by more than 1 million. 50% of the time.
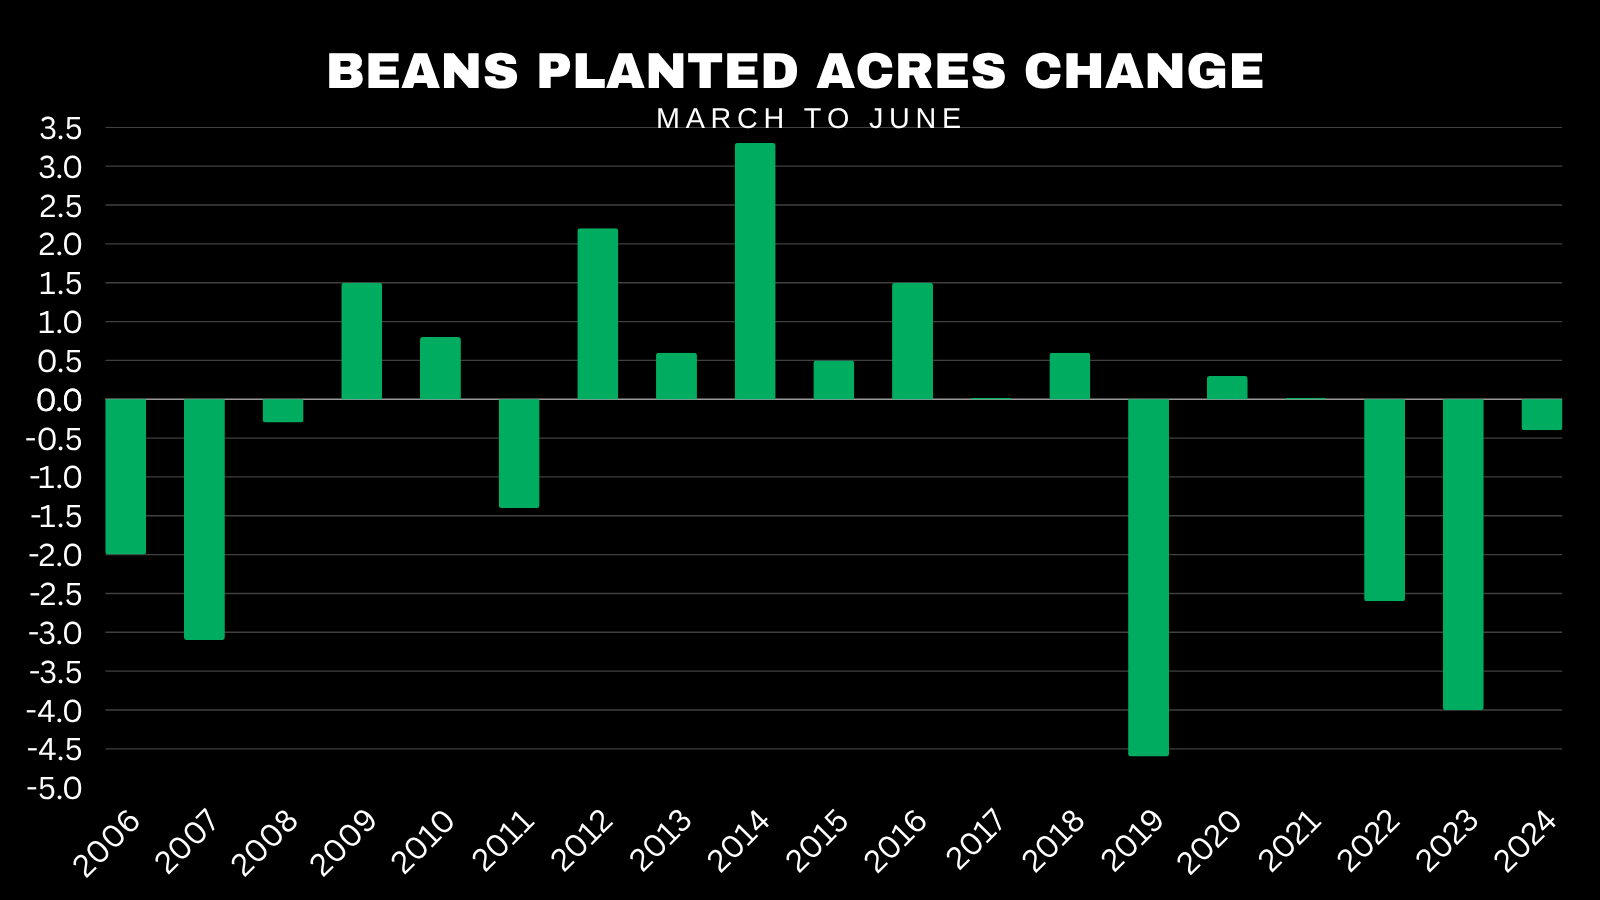
Soybeans on the other hand tend to lose acres from March to June as of recent.
Having dropped 3 years in a row.
We have not seen bean acres increase by more than 1 million since 2016.
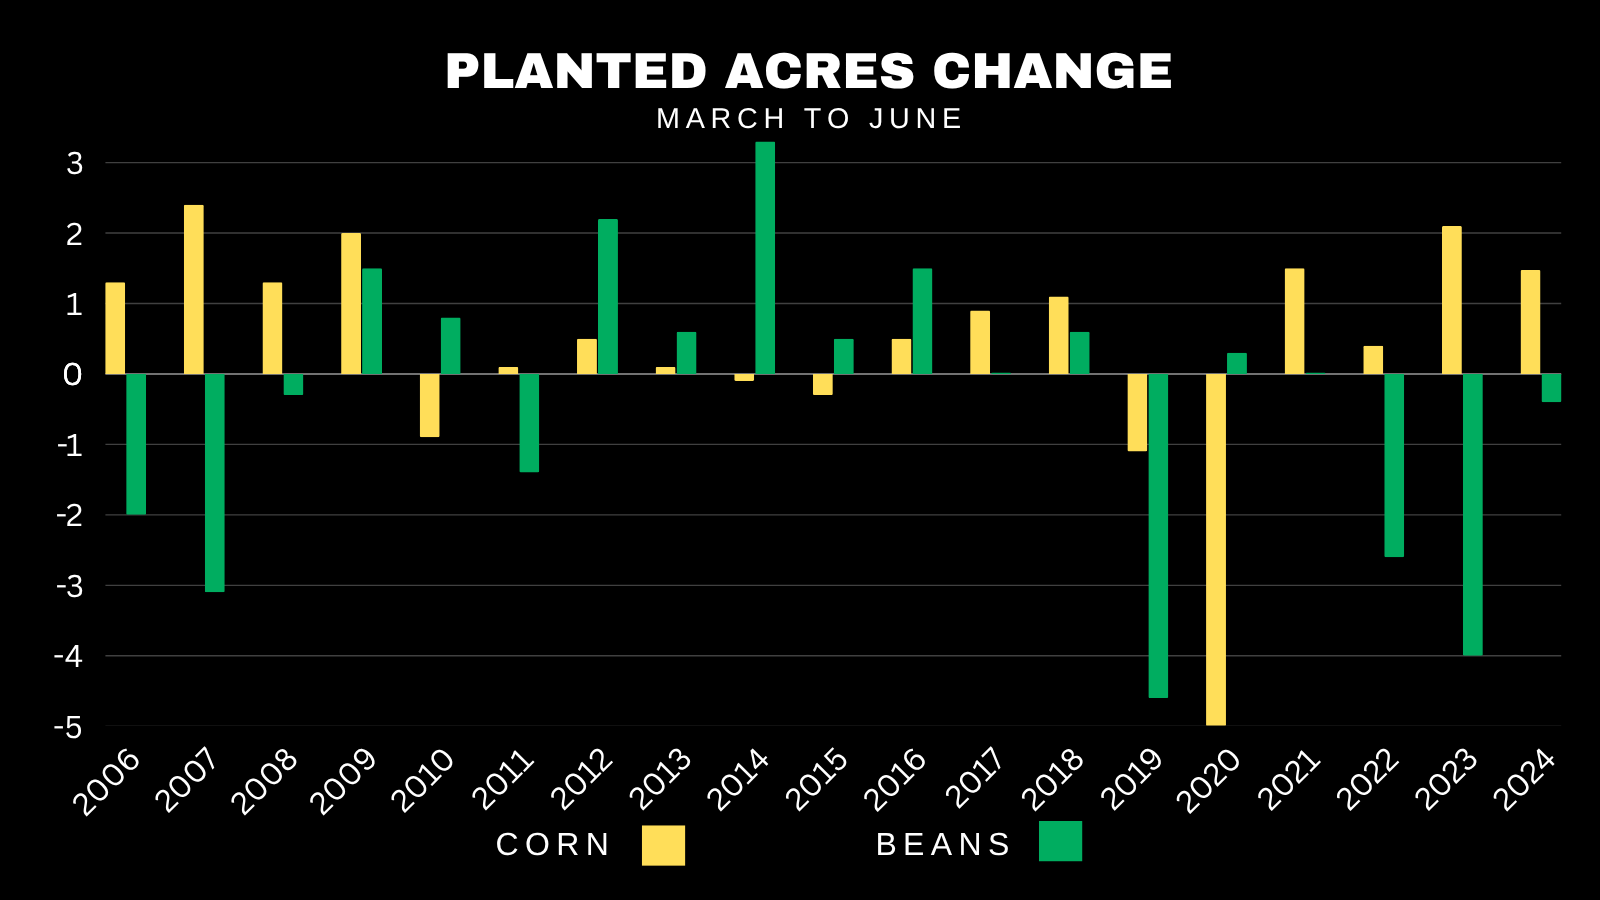
Here is a combined view.
Typically we see one higher and one lower from March to June.
The last time we saw both come in higher was 2018.
It has happened 5 times since 2006.
The last time both came in lower was 2019.
That is the only time it has happened in 20 years.
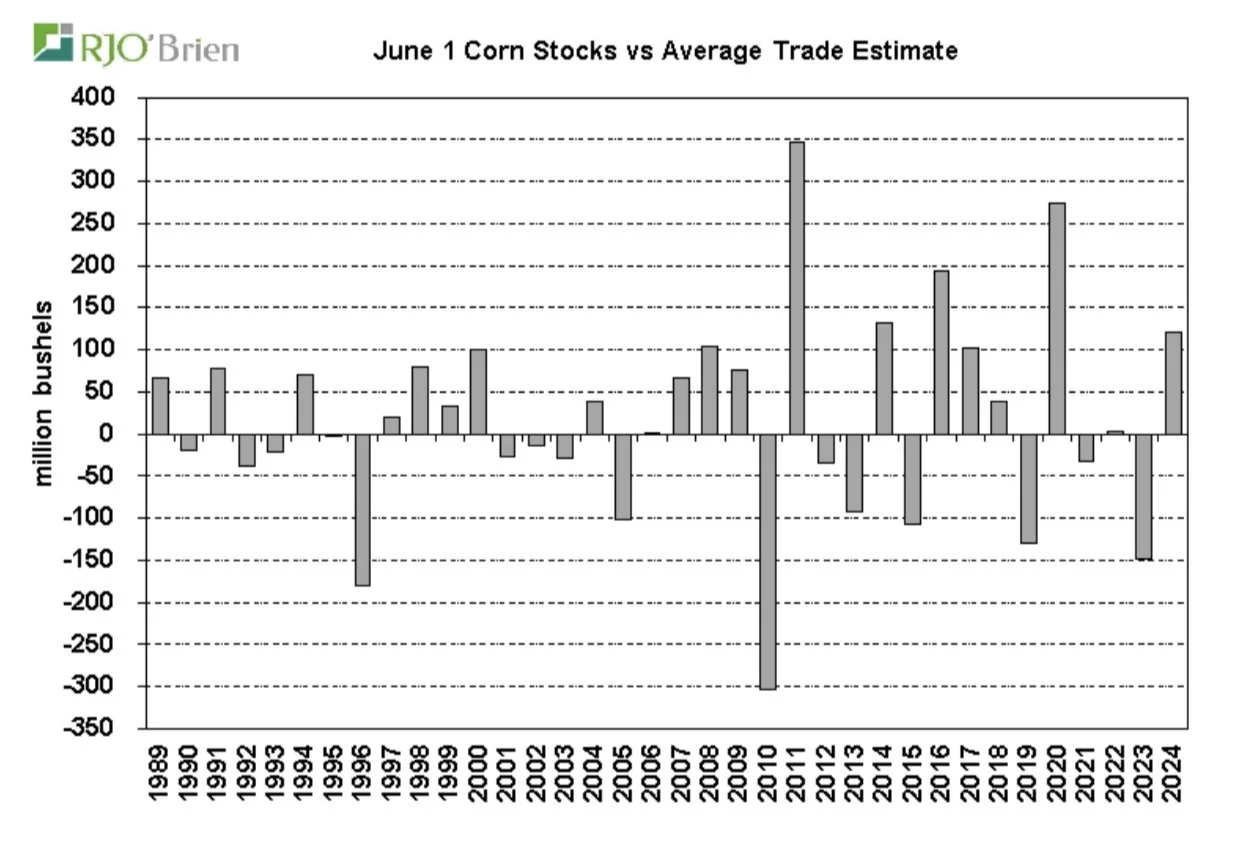
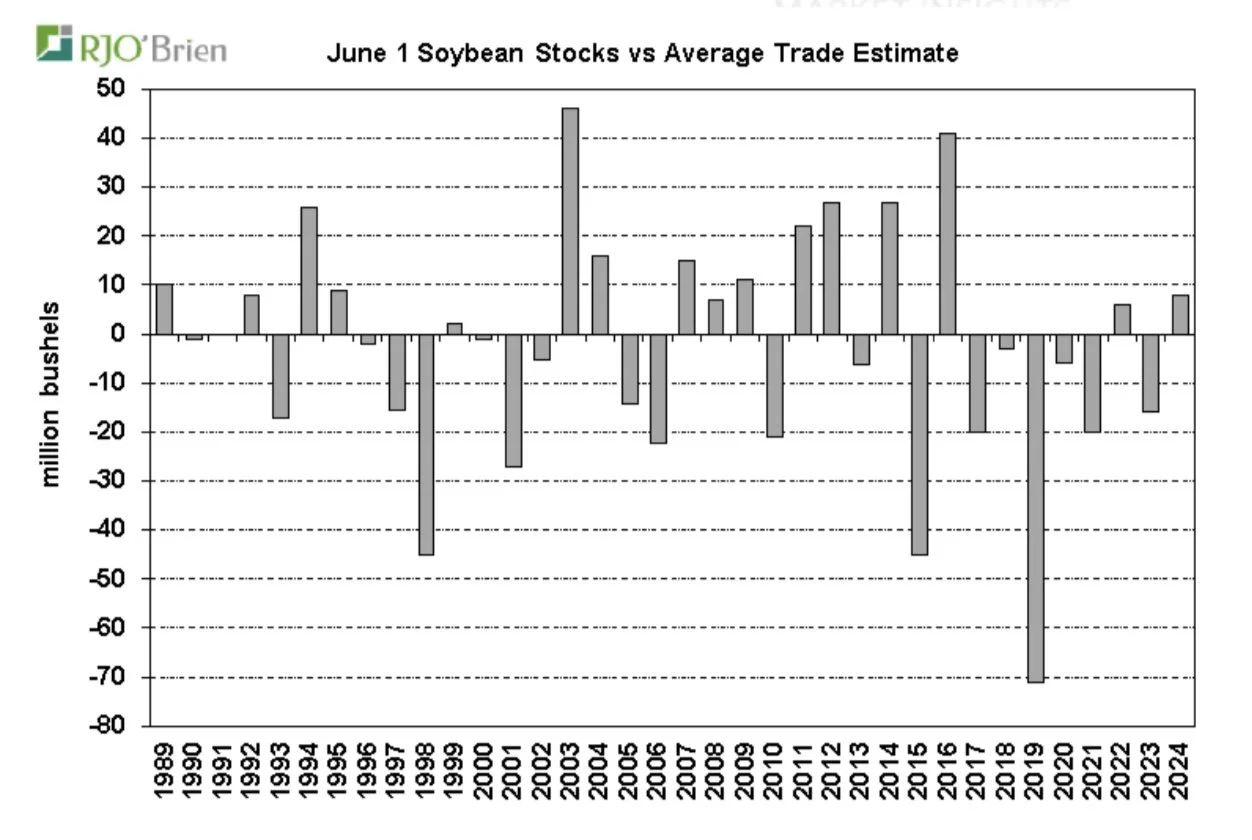
Stocks vs Estimates
A surprise on stocks can be just as important as acres.
Hhere is how the quarterly stock numbers have came in vs the pre-report estimates.
For corn the report has missed the estimates by over 100 million bushels the past 8 of 11 years.
Meaning there is often a surprise.
For soybeans, the estimates are typically pretty close. As the estimates have been within 20 million bushels for the past 5 years in a row. Stocks have only surprised high twice since 2016.
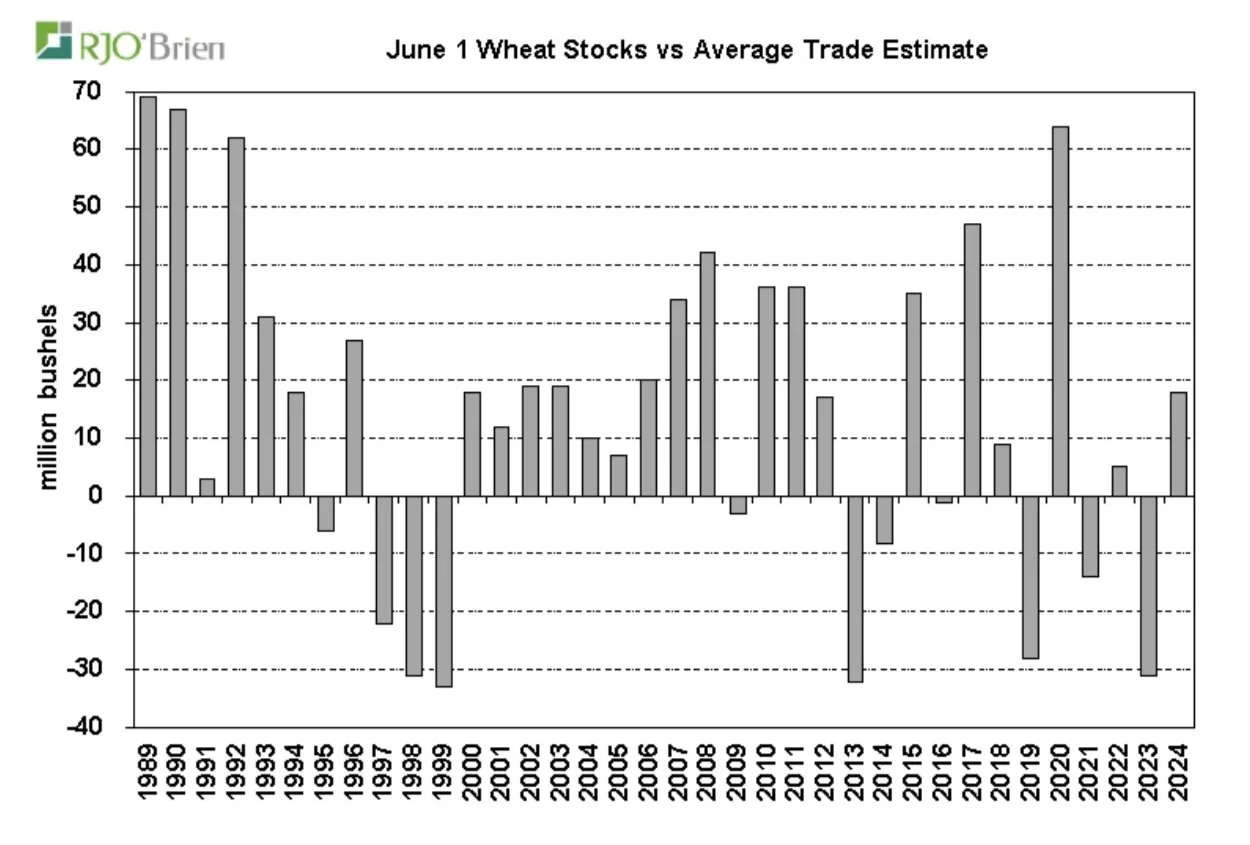
Wheat used to always surprise high in the 2000's, but has been 50/50 the last few years.
Charts from RJO
First Notice Day
First notice day is next Monday.
We have been selling off hard into first notice day.
This is a common theme in the grain markets.
Because anyone that has to sell or roll their contracts has to do it this week before first notice day.
Often times once we get through first notice day, the market can finally catch it breath because it gets rid of that natural sell pressure.
So perhaps we will see a classic first notice day bottom where the market finally finds some footing.
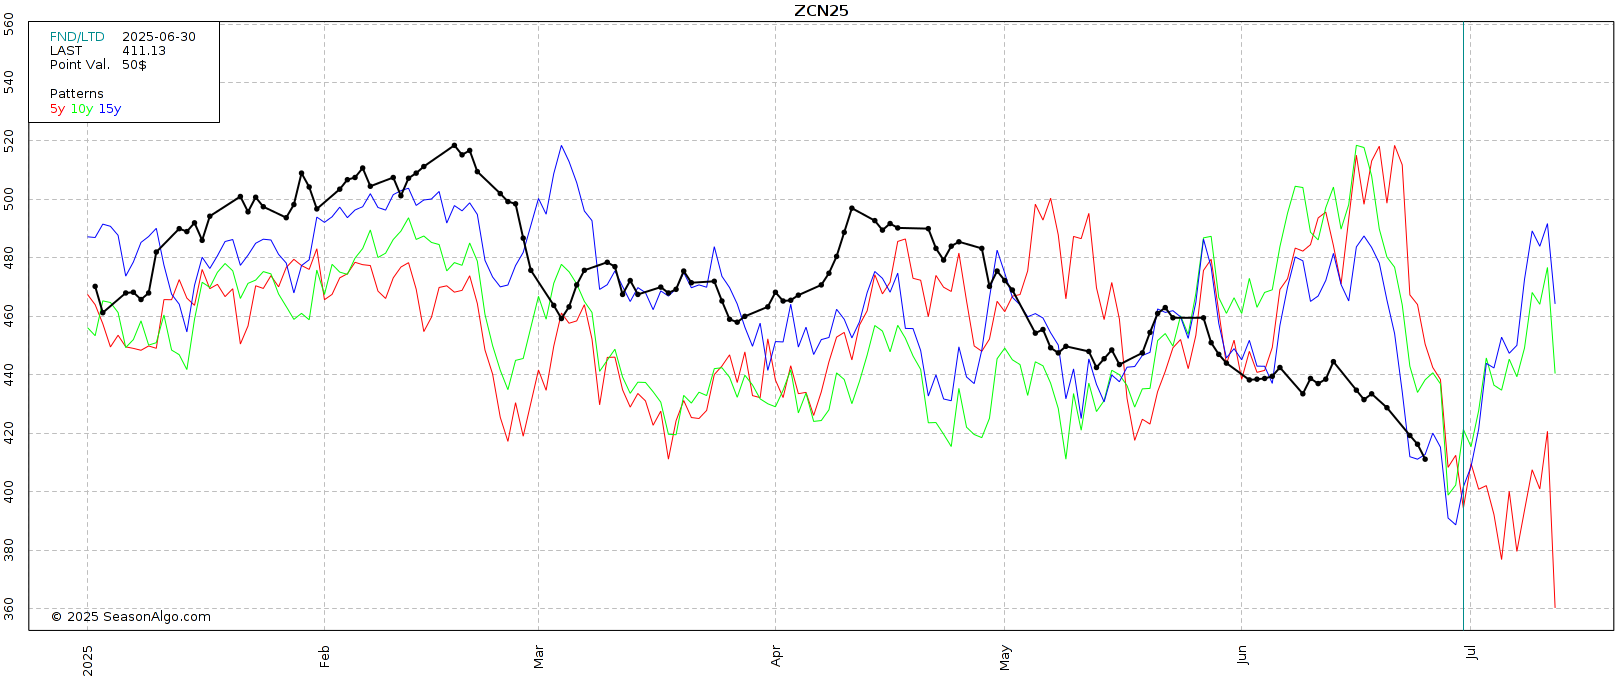
Here is the seasonal pattern for July corn.
First notice day seasonally marks the low for this contract in the 10 and 15 year seasonals.
Todays Main Takeaways
Corn
Fundamentals:
On the surface, one would think corn should be trading above $5.00 based on the fundamentals.
US old crop stocks to use is below 9%..
The last time this happened corn was trading $7.
This is the 5th tightest our stocks to use has been.
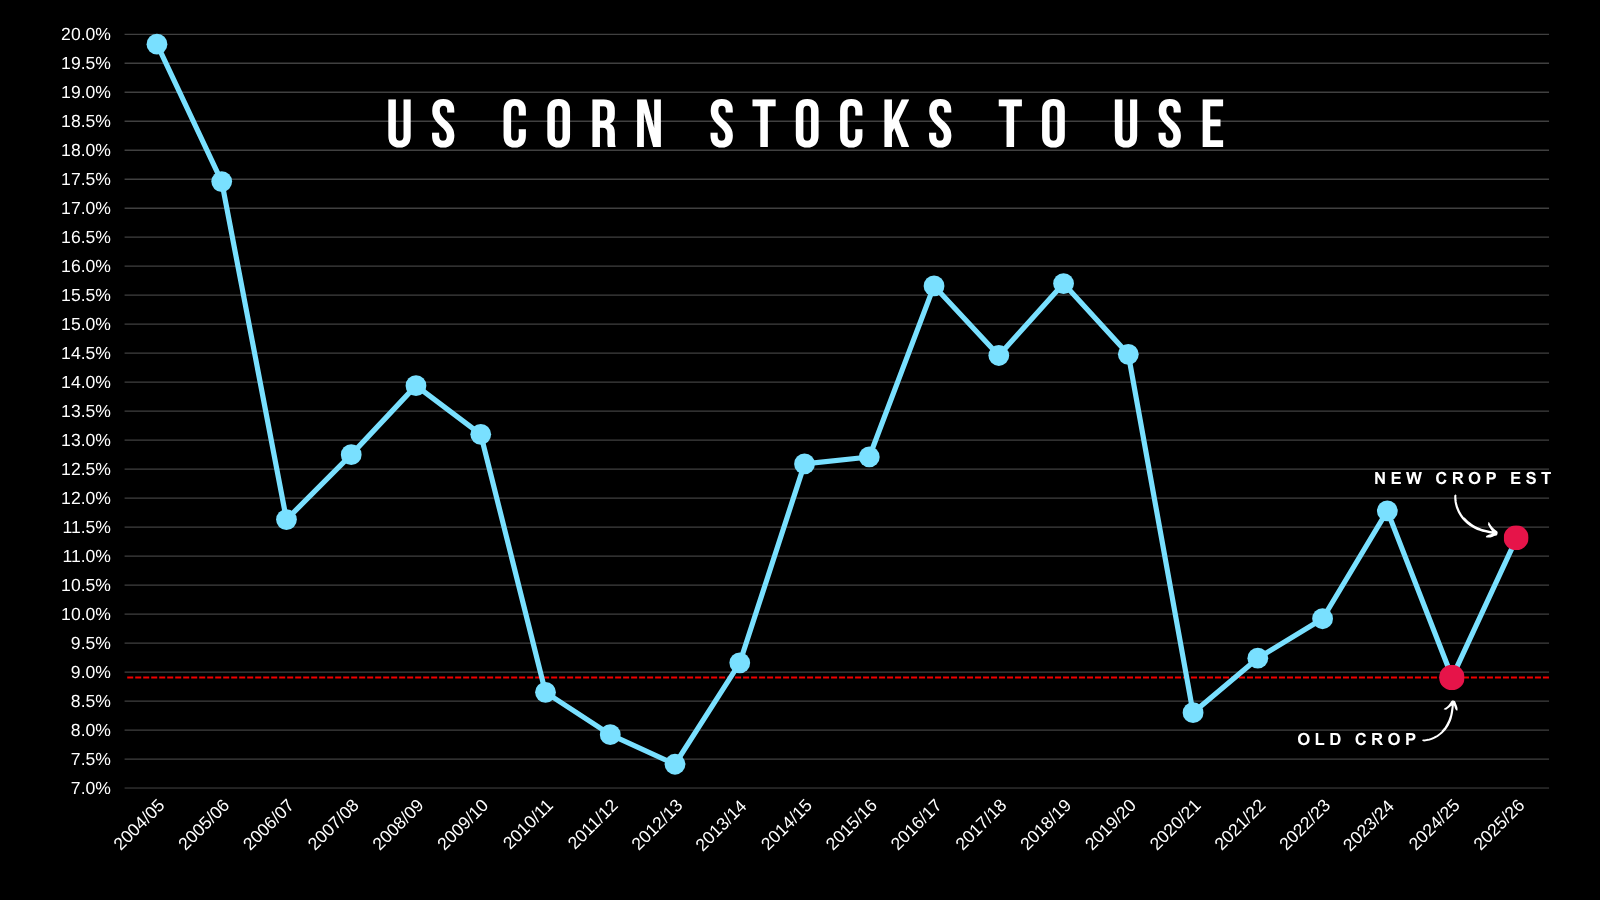
But that hasn’t mattered.
The market is looking at one thing only today. Weather.
And weather has been pretty ideal on a national scale (yes there are areas with issues) but overall there has not been any threat whatsover.
We've seen all of these long term hot and dry forecasts but they always wind up throwing in rain.
The market is saying we have a record yield and big crop until proven otherwise.
And the funds have ran away with this market and said they are going to keep on selling until it doesn’t work and until something changes. Because they see zero threat to production.
Since February, the funds have sold -550k contracts of corn.
A massive amount and the largest selling in that amount of time frame we have ever seen.
They aren’t going to cover until something makes them want to. Today we simply don’t have that reason.

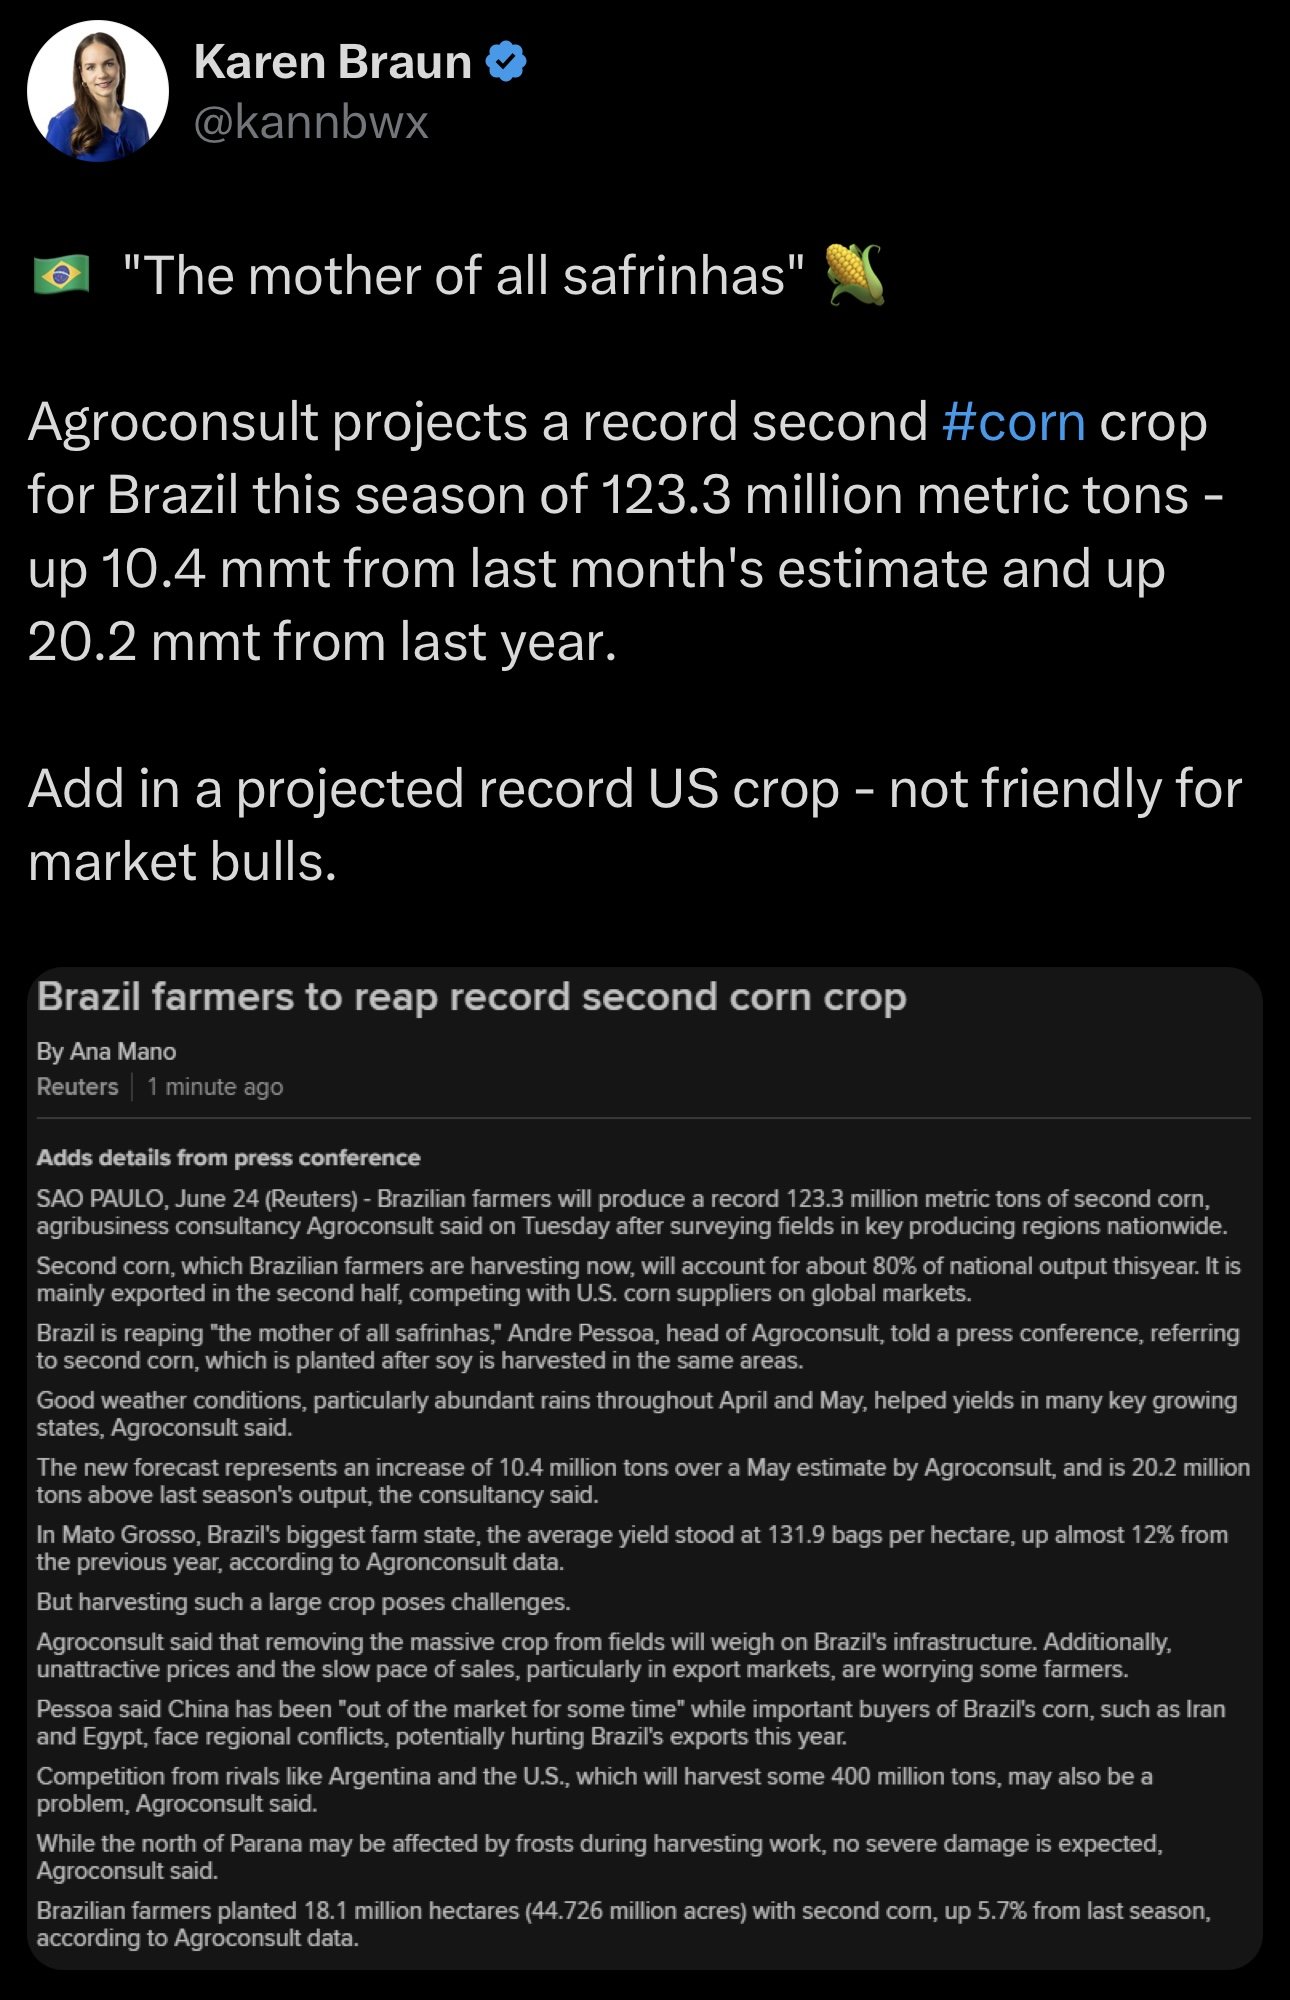
Not only do we have zero weather threat, but talk is that Brazil's 2nd corn crop is only getting bigger.
Agroconsult out of Brazil claimed they have "the mother of all corn crops".
They raised their estimates for this crop to 123.3 MMT.
Up from their estimate of 112.9 MMT just last month. This is a huge +9% increase.
This number is also up from 103 MMT last year, which is a +20% more than last year's crop.
So you throw this on top of projected record production and the market screaming record yields and that is why corn has struggled despite the old crop balance sheet being the 5th tightest of the century.
We could still get some sort of weather scare or perhaps a surprise in the acre report, but if not we are likely not going to see much of an opportunity until after harvest.
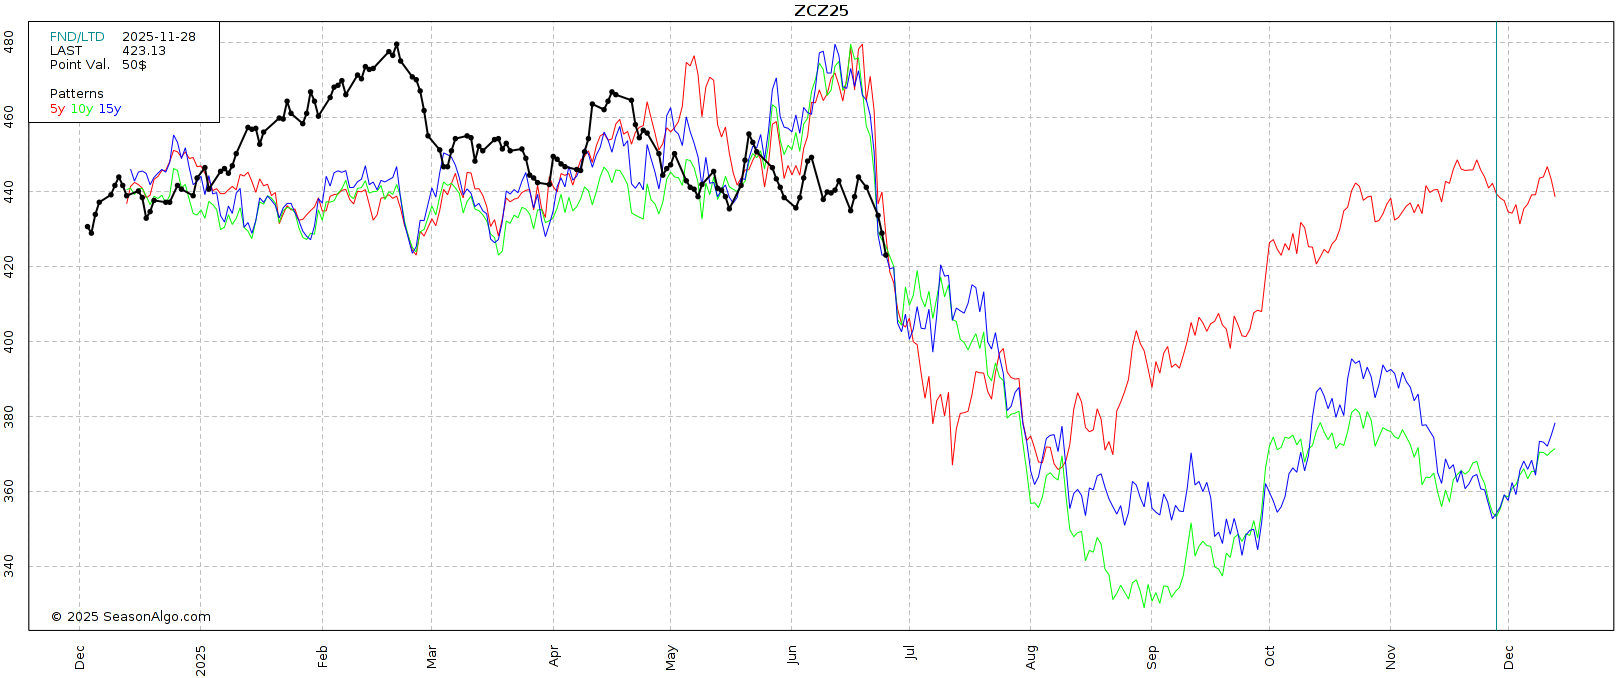
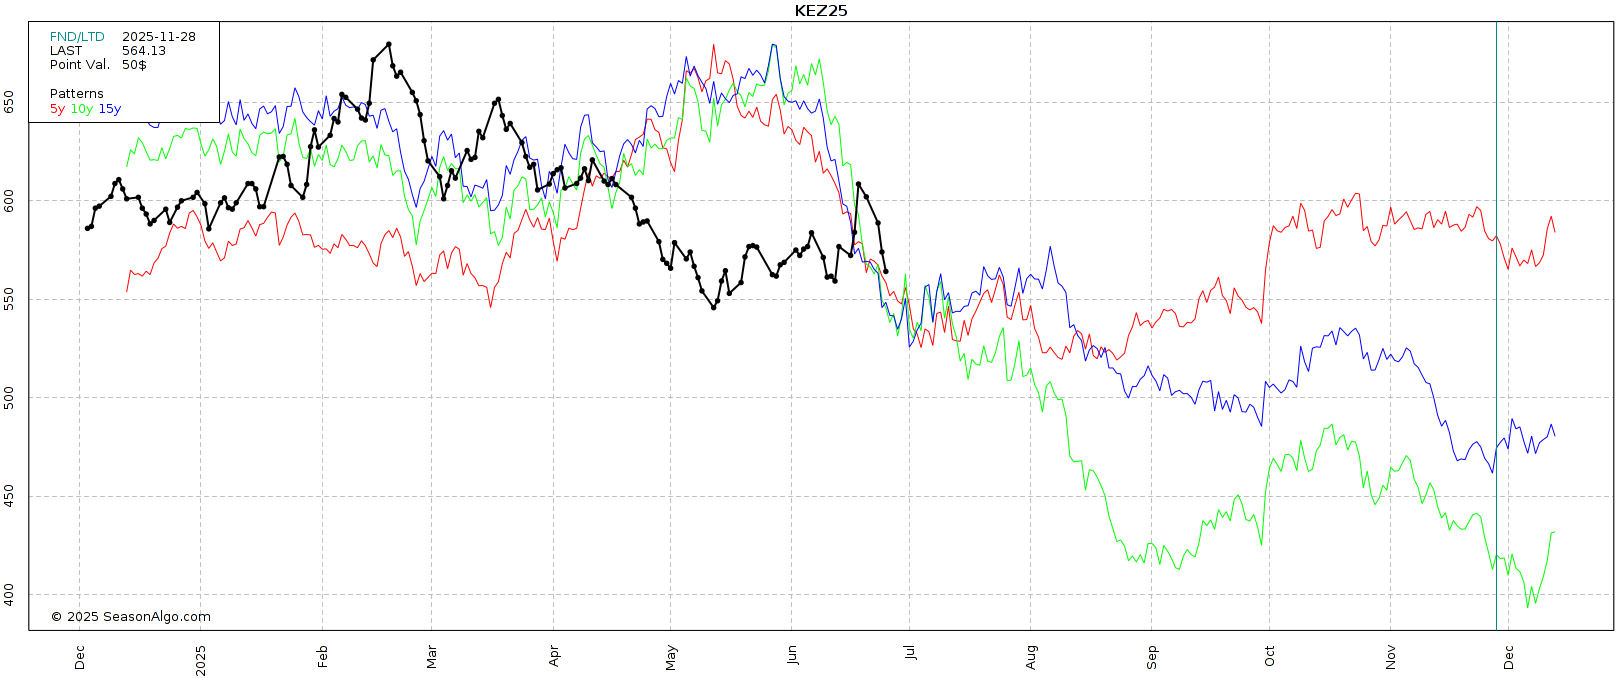
Here is an updated new crop corn seasonal.
We typically continue to fall until around August. So we might have another 2 months until we start to head back higher.
We can fall lower, and odds say we do. But does it make a ton of sense to price a bunch of new crop corn this far below the cost of production?
Seasonals say:
5 Year (Red Line): We bottom in mid-July to early August
10 Year (Green Line): We bottom late August
15 Year (Blue Line): We bottom late Sep
The last few years we've found our bottom earlier than in the past, closer to August rather than October.
We might get an opportunity in between, but all of them say we haven’t found our bottom for the year yet.
Meaning we could still get a rally at some point, but by August chances are we will be lower.
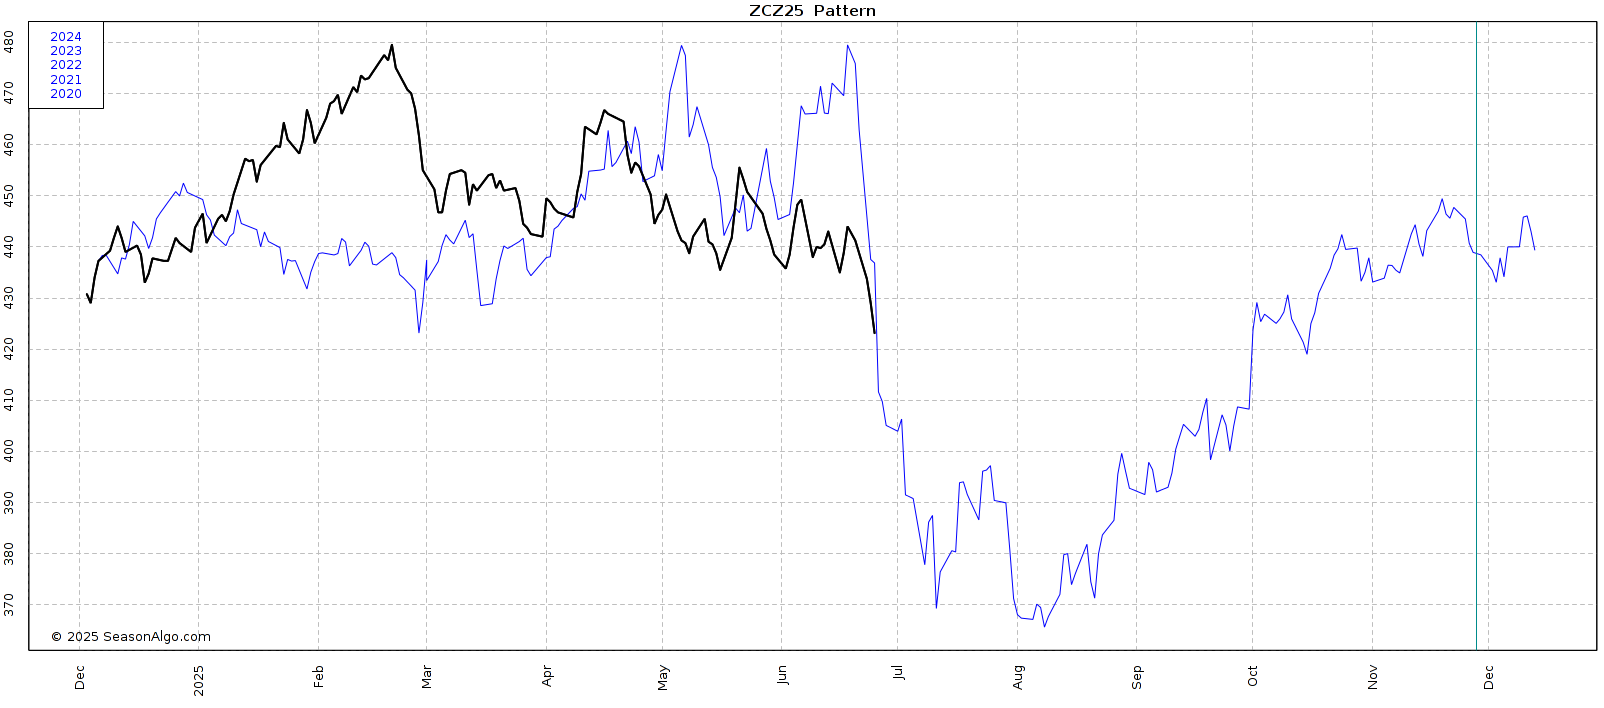
5 Year Seasonal
10 Year Seasonal
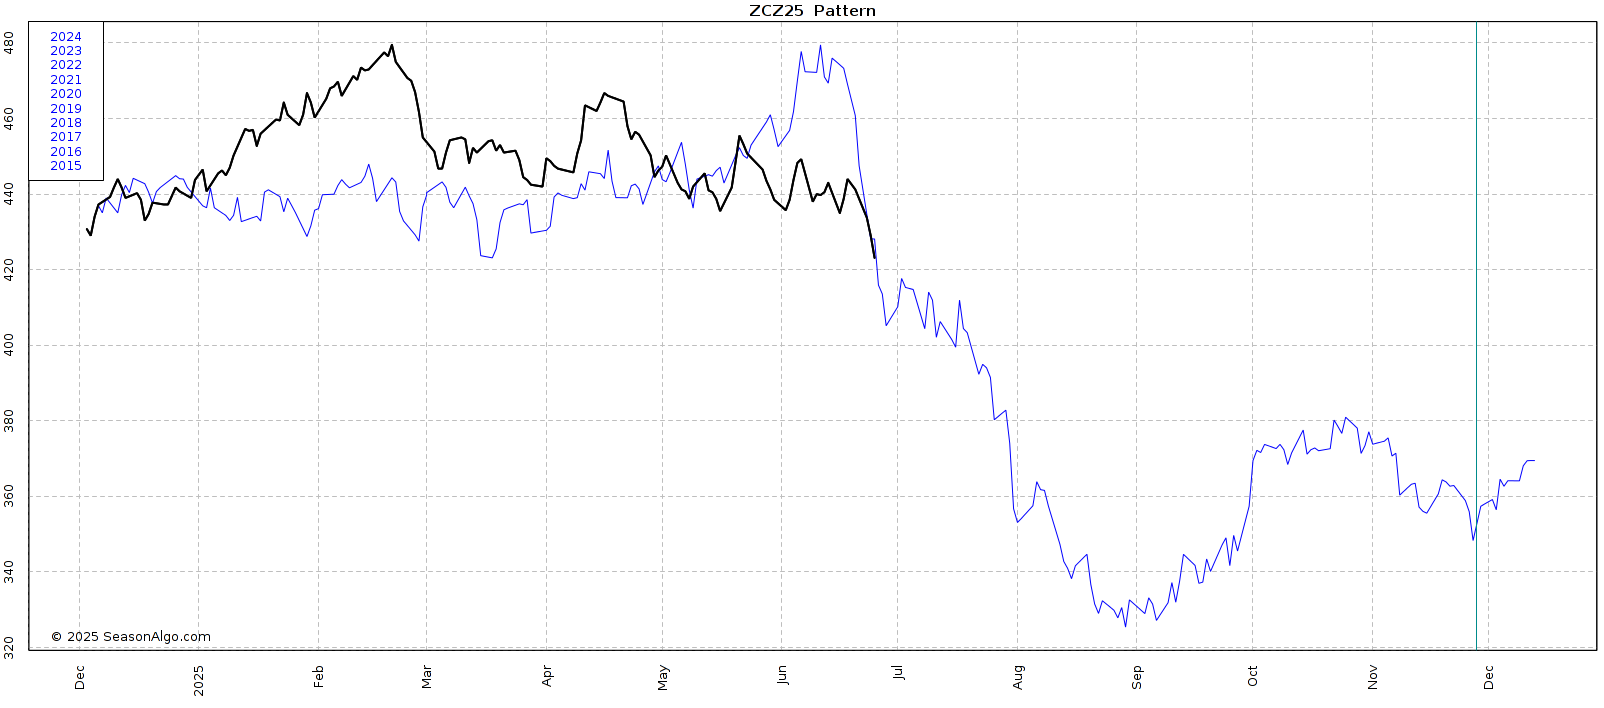
15 Year Seasonal

This market sucks, and might continue to suck.
But the bright side around all of this is looking long term.
What do low prices and a falling dollar create?
Demand.
Demand is what "should" turn this market around after harvest.
We already just saw Mexico buy over +550k MMTs of new crop corn. Mexico must think this is a pretty good deal if they are already buying that much corn for future delivery.
At the end of the day, you want a demand led market. Not a supply scare driven one. That is how higher prices last. I know it sucks, but higher prices will come. It just might not be as soon as any of us would like.
Keep in mind, the tariff deadline is July 9th. Not bad timing if we were going to get some trade deals with grains already at a discount.
I don’t love spending a ton of money on downside protection at contract lows, but if you know you will have to move something soon or off the combine for whatever reason, your best bet is to grab some puts.
For the rest of you that can hold on, I like being as patient as we can heading into the new marketing year.
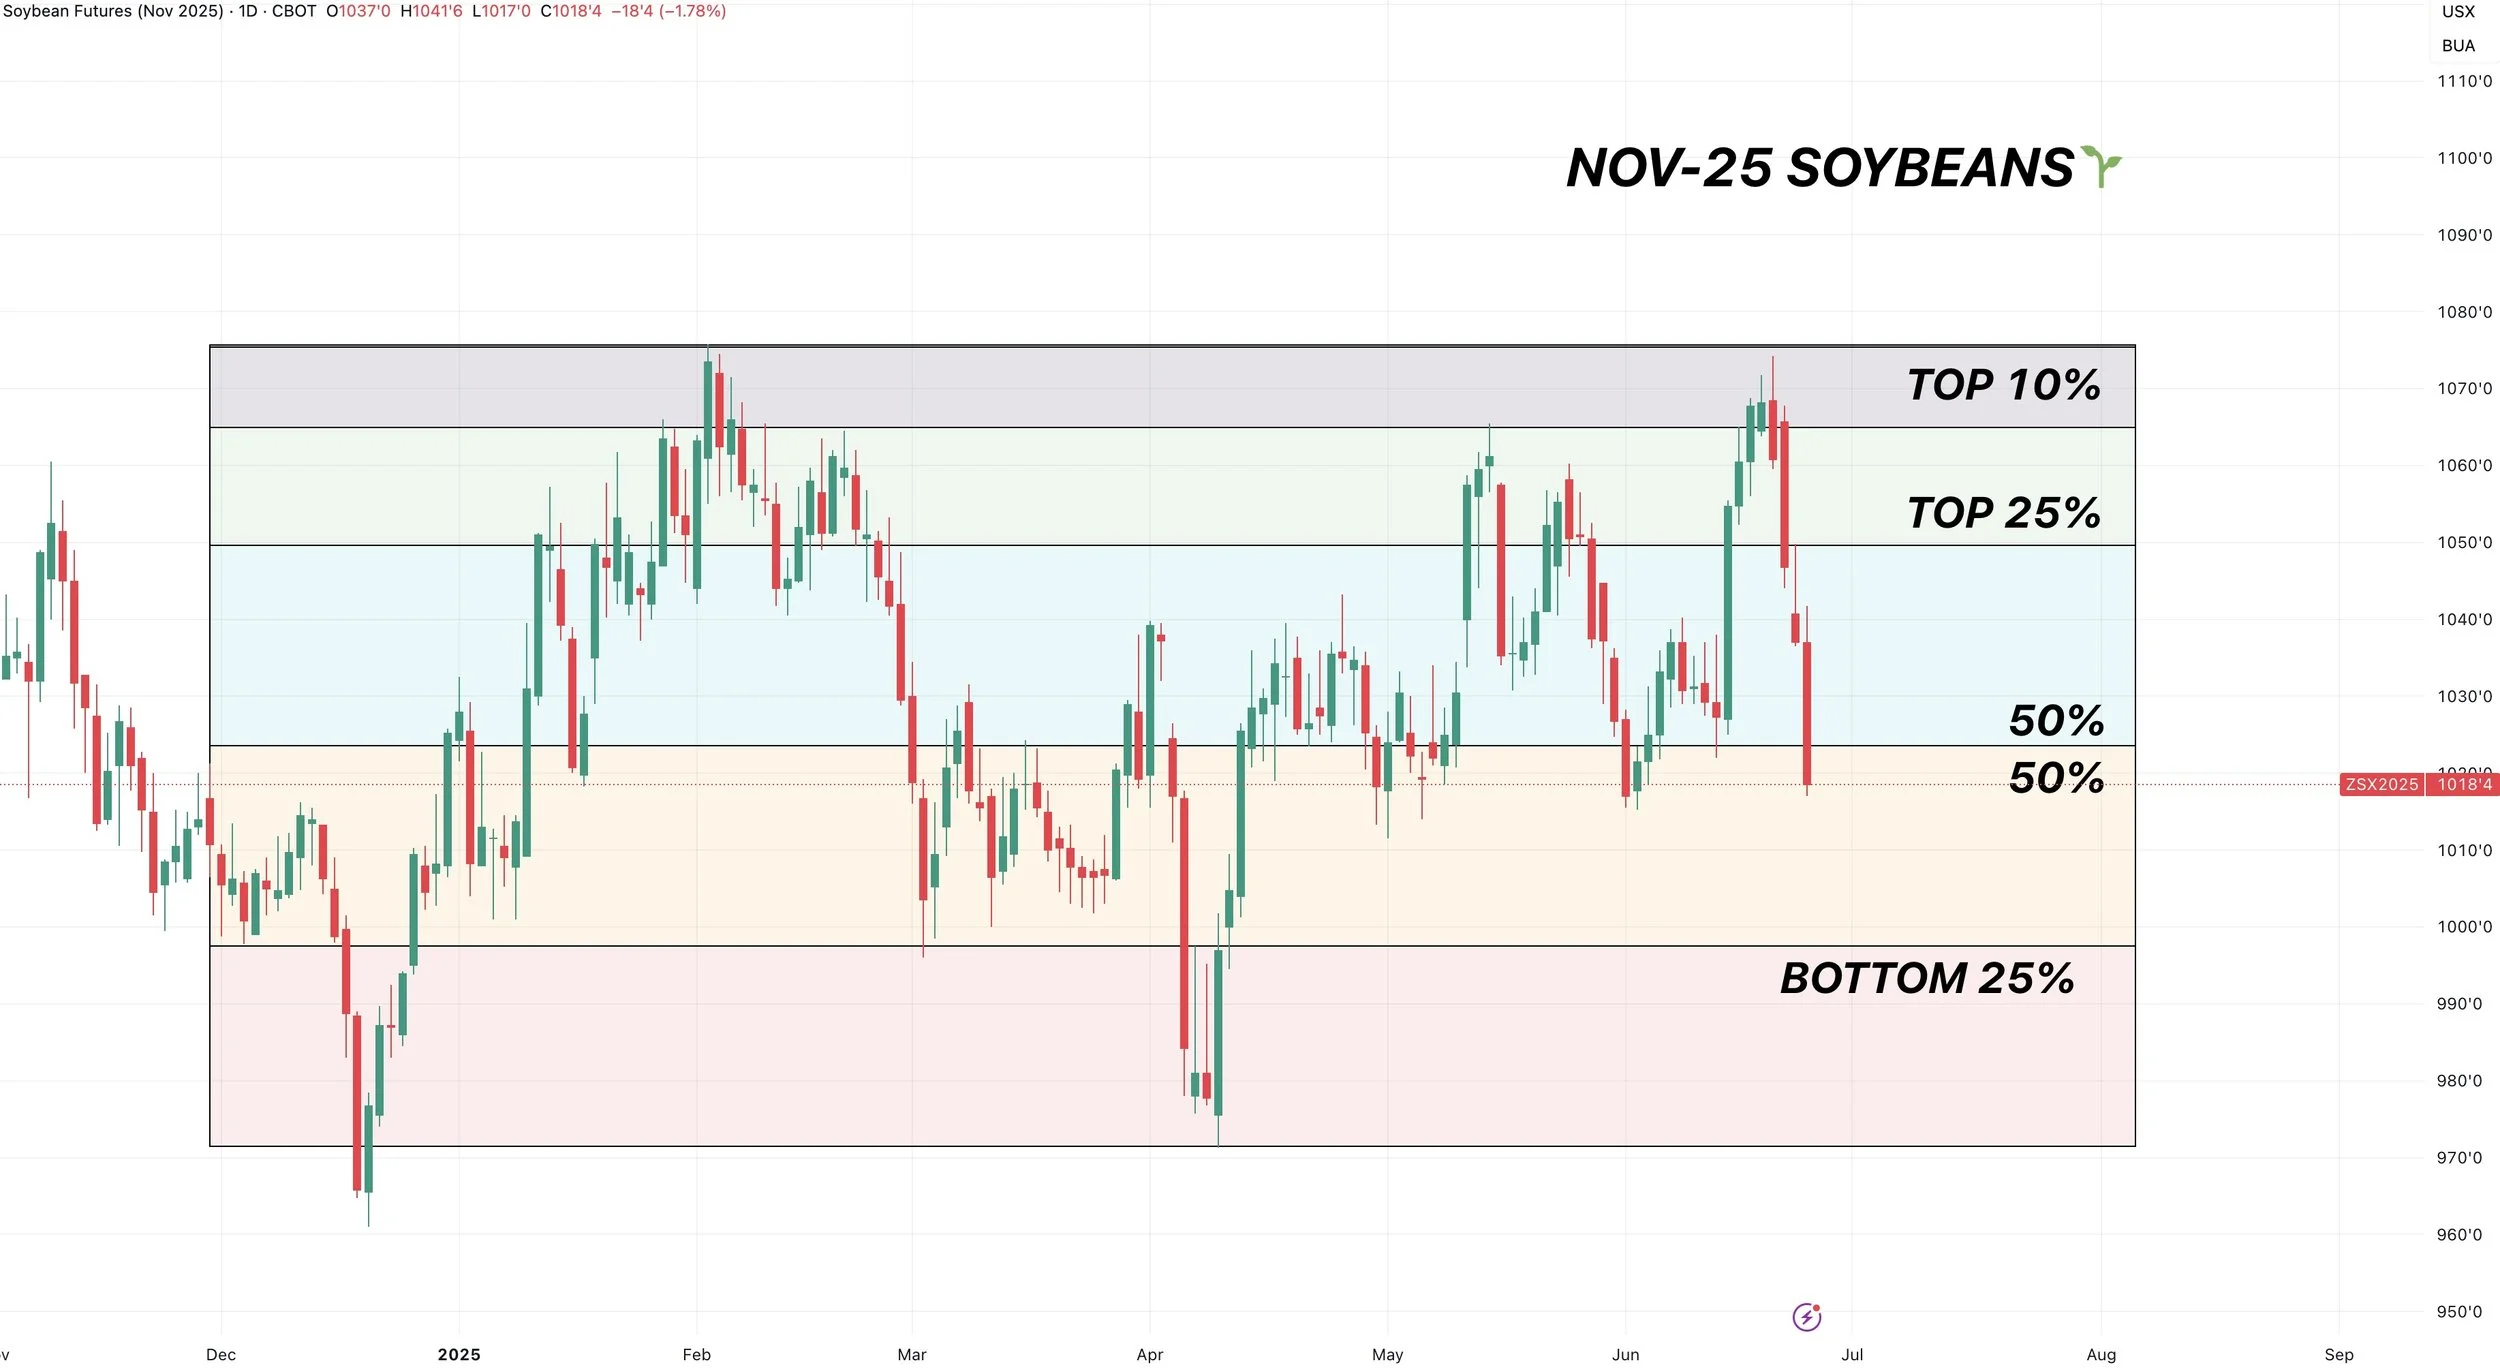
Here is a chart showing July corn's calendar year prices broken down by percentages.
We had just 3 days to sell in the top 10% of this market for 2025.
Out of 252 trading days.
To hit the top 25% of prices in 2025, we had only 26 days.
That is how fast these markets move and how small the window of opportunities can be.
Yes we had a sell signal during those 3 days back on Feb 18th. But of course I wish we would’ve been more aggressive looking back.

Technicals:
The chart looks awful. New contract lows. If you tried timing this bottom you would simply be trying to catch a falling knife.
For Dec corn, we lost key support I talked about last week.
Not a great sign for bulls.
This pattern is a desending triangle.
We do not have to go all the way down to the implied move, but the implied downside move is right around $4.00. Which is something to be aware of. Even if it doesn’t happen that is the risk.
This implied move is calculatated by taking the range from the top to the bottom of the triangle, then subtracting that same range from the bottom of the triangle.

Soybeans
Fundamentals:
Soybeans are now down -50 cents in just 4 days.
The story for soybeans isn’t "dead".
There is still a lot of growing season left in this market. Soybeans are made in August.
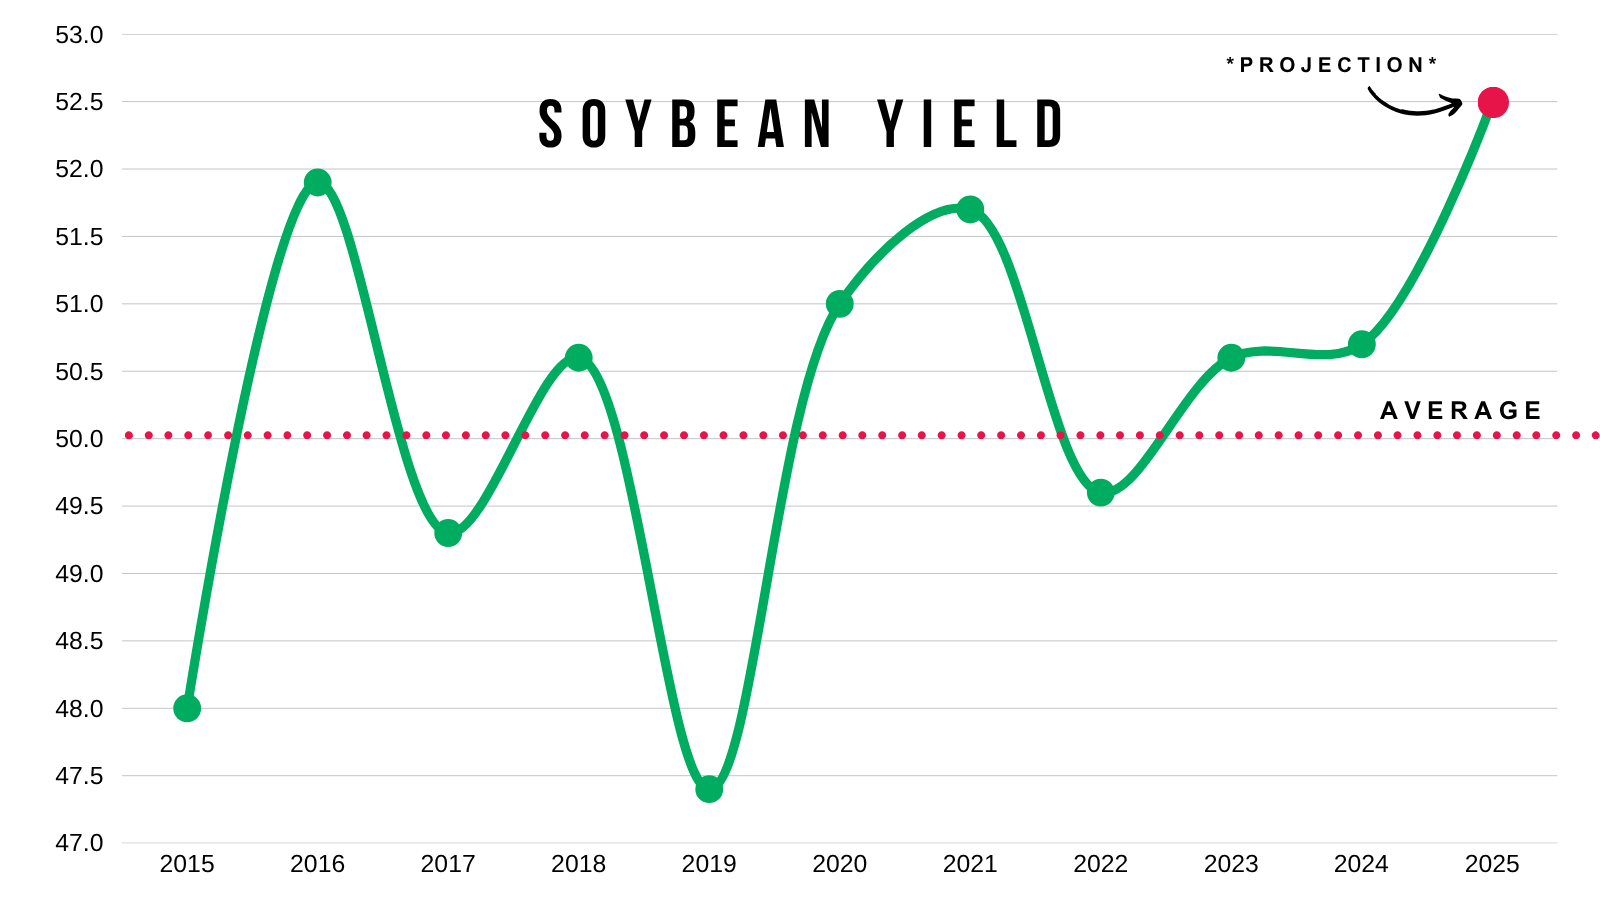
A 52.5 bpa yield could happen, but it seems pretty optimistic given that we haven’t seen a record yield since 2016 and that wasn’t enough crack 52 bpa (2016 was 51.9)
There is still just not a ton of wiggle room for this crop.
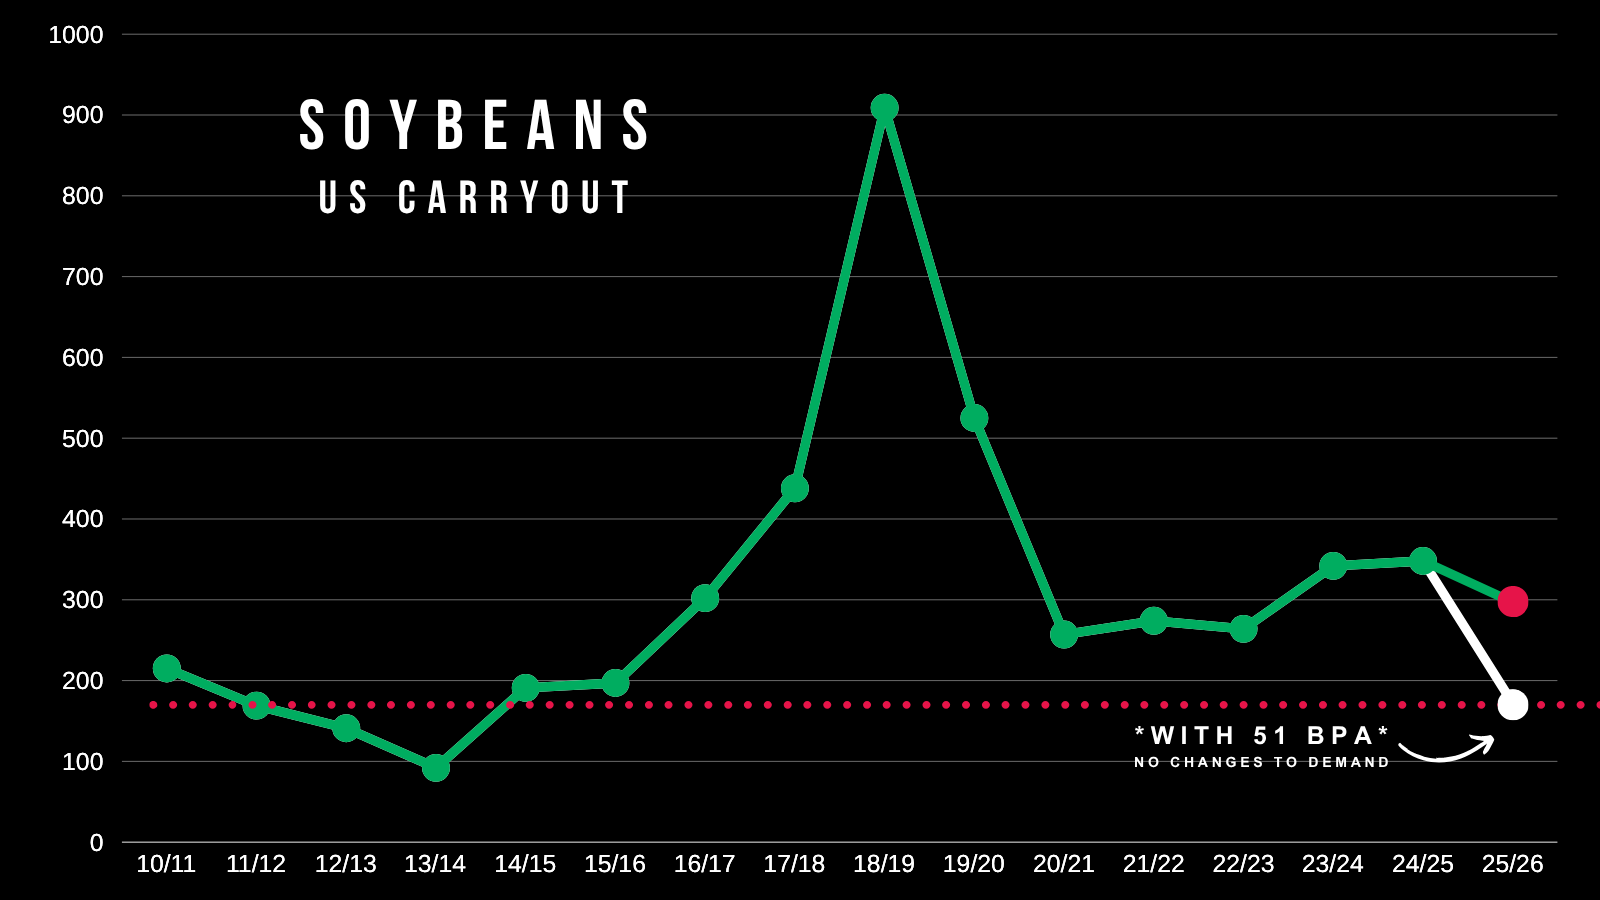
Even with a record yield, our carryout is at 3 year lows.
IF yield slips to just 51 bpa, which is not a disaster of a crop at all, if you leave demand unchanged this cut to yield would result in our carryout dropping to the lowest in over a decade.
Odds of that happening aren’t very high unless we also lose acres, because the USDA would offset some of the production losses with cuts to demand.
But you get the idea, even small changes to yield can change the bean situation drastically.
Technicals:
The soybean chart took some damage the last few days, but not all hope is lost.
We are now approaching VERY important levels.
Both July and Nov beans are currently sitting right in the golden zone retracements from their recent highs down to the April lows.
Which means we have given back 50-61.8% of the entire rally since April.
This is a very crucial spot bulls want to hold. This level is seen as a decision point in the market.
We either bounce here or it triggers more downside.
Not only is this the golden zone, it was also key support on several occasions. We do not have much support if we break below.
Last time we dropped in this box, we bounced. Hopefully we can do it again.


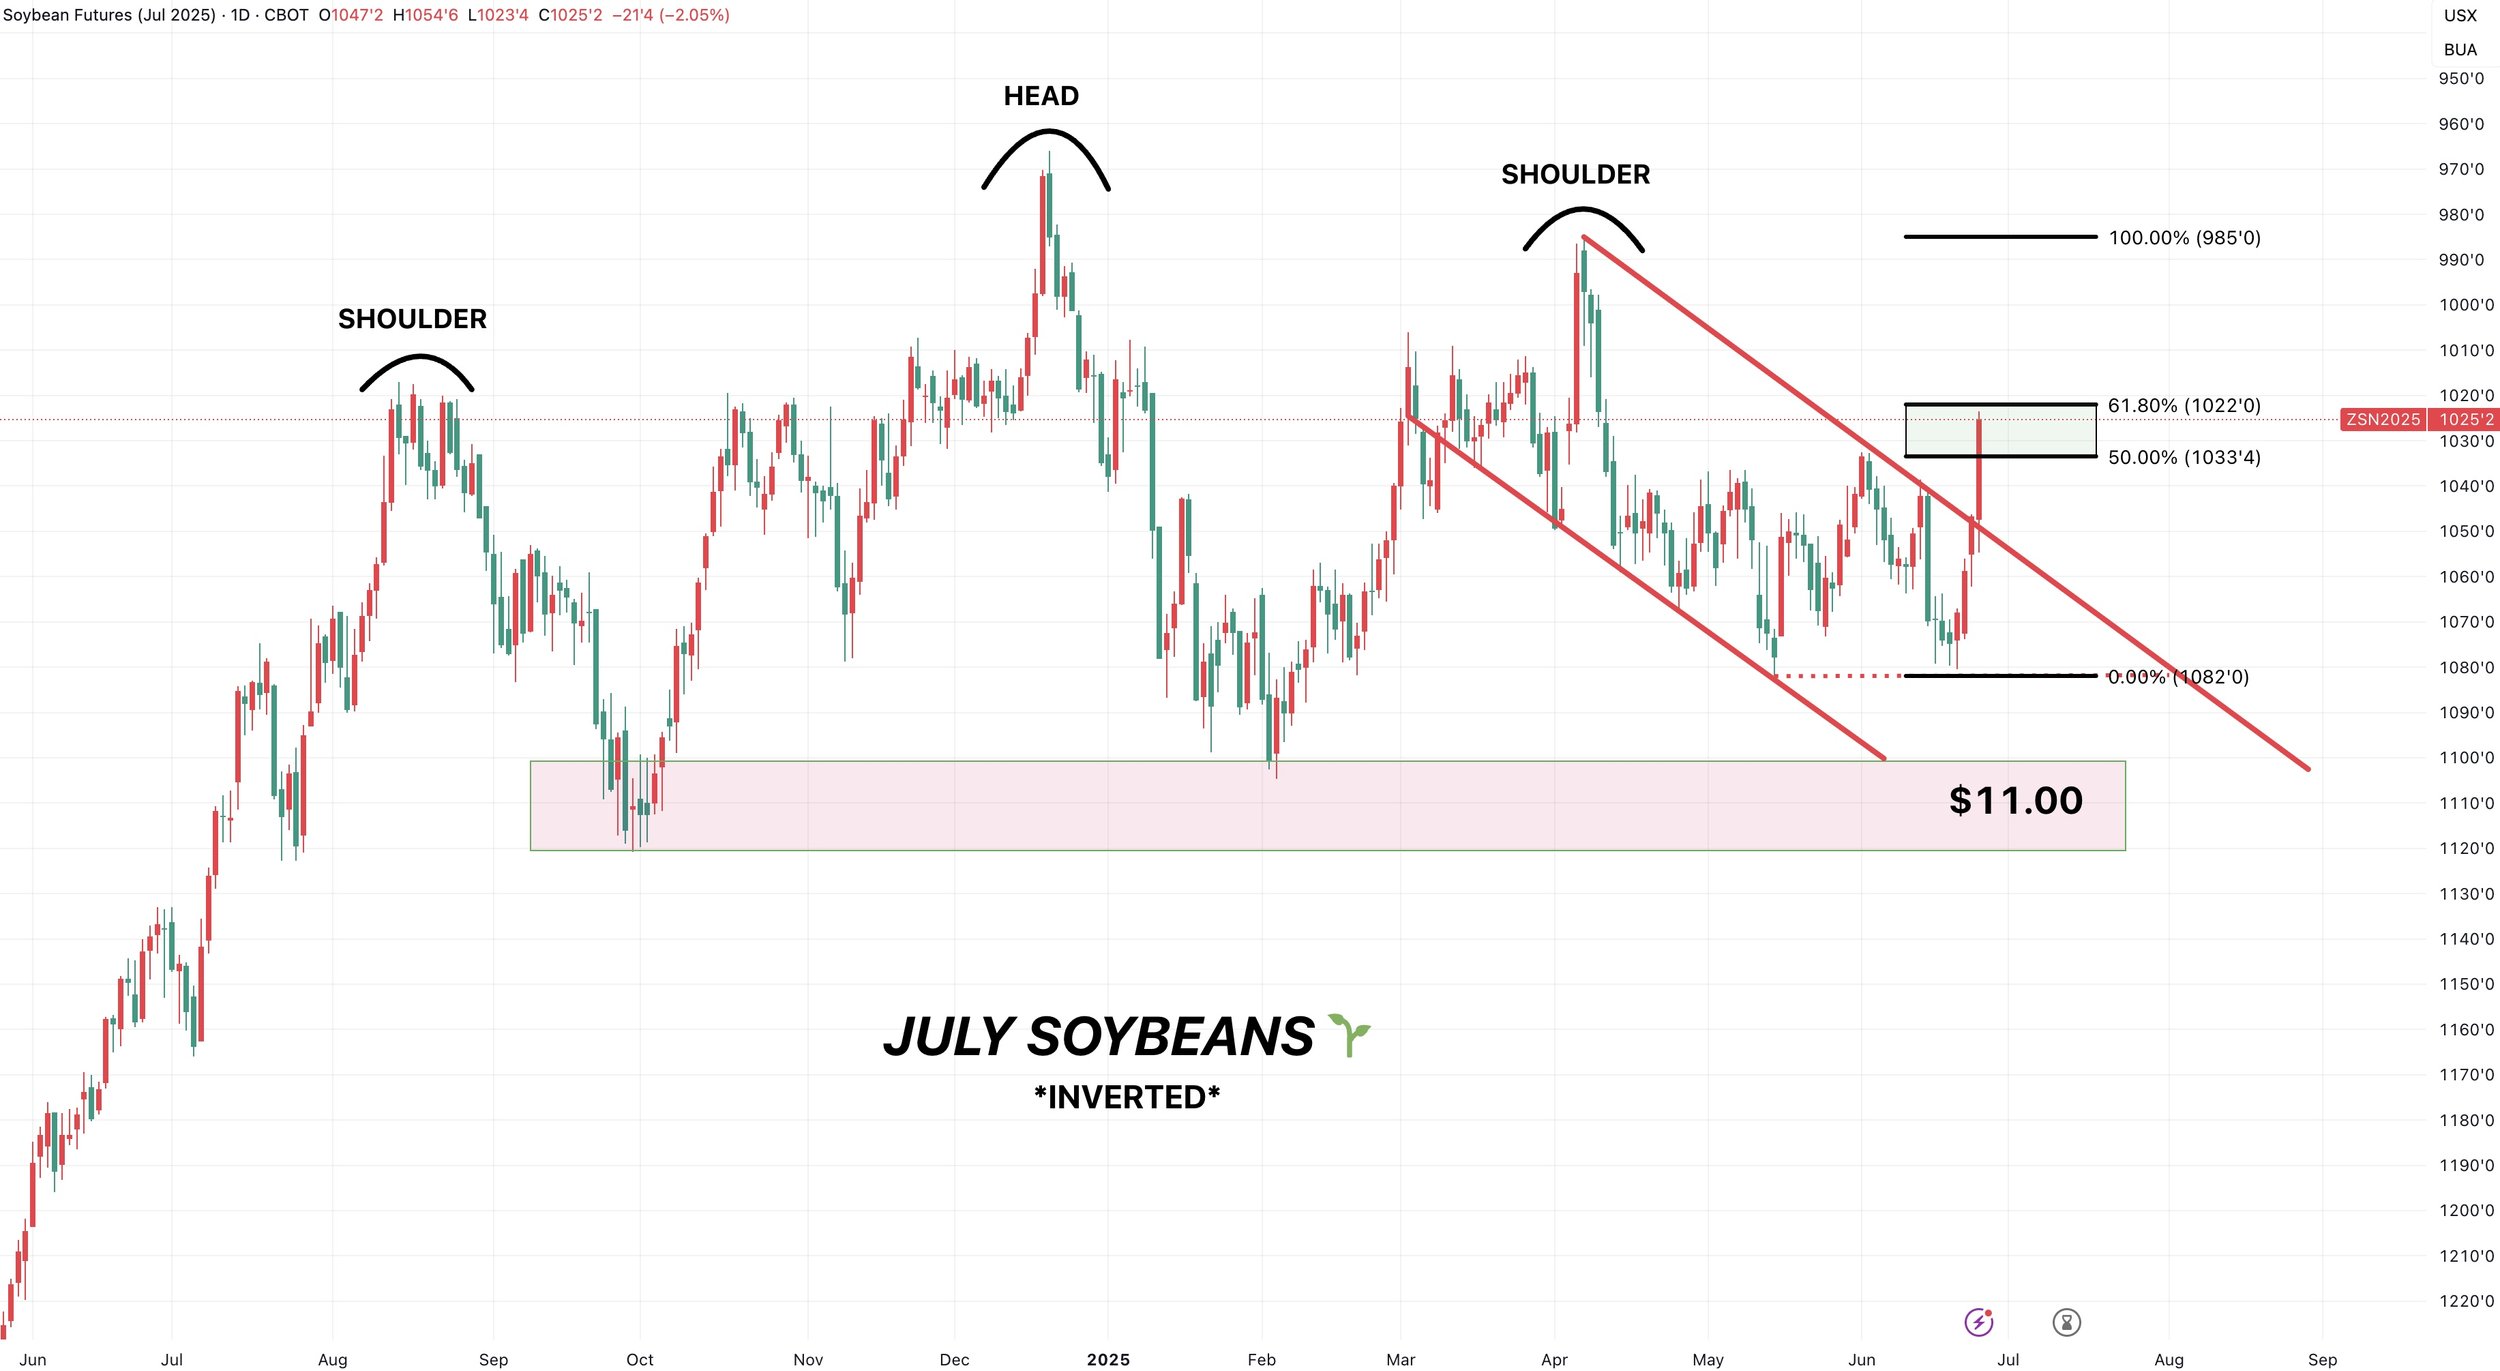
Here is inverted July beans.
Doesn’t look too hot.
We perfectly rejected those prior highs around $10.80
We now failed to hold this channel and took out those early June lows, and it looks like an upside breakout.
But again, we are right in that golden zone.
If this market is going to find some life, this "should" be the spot we do so.
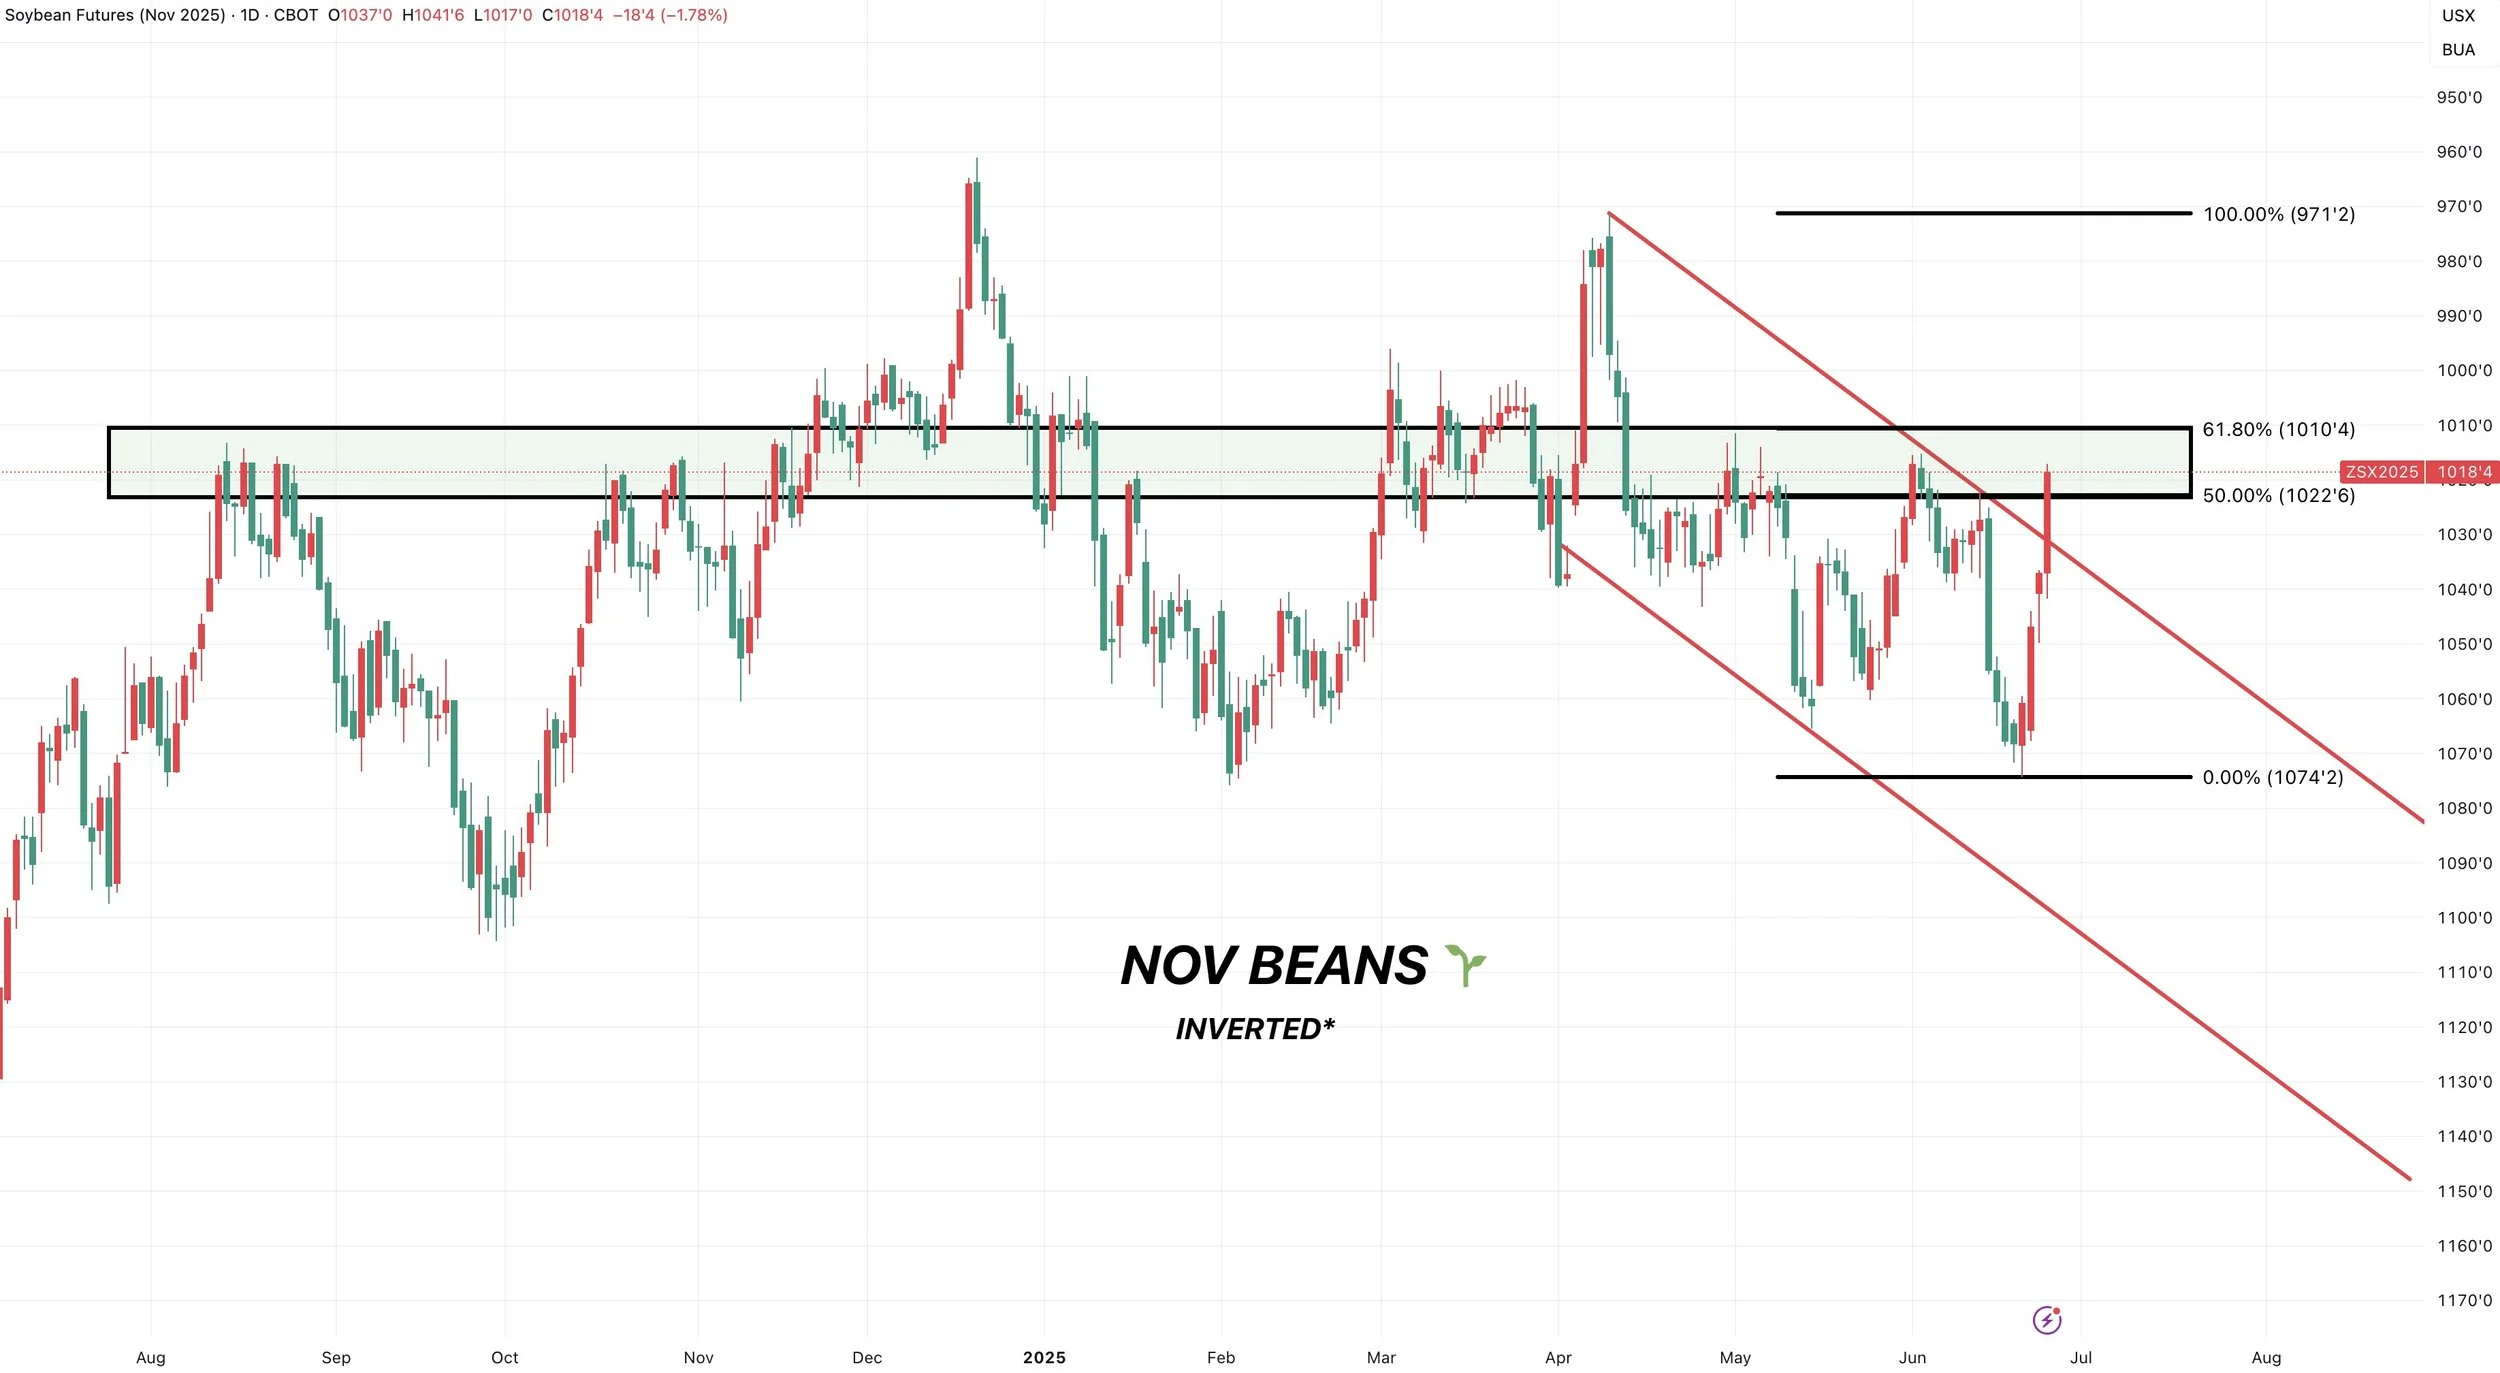
Inverted Nov beans look a lot more friendly than July. As we did not take out those early June lows.
Again, these green box is the golden retracement zone.
It is also where this market has turned several times.
If this market is going to turn around, it needs to be here. Because if we break above this box, the next point of interest is those lows.
If you are wondering what the point of flipping a chart upside down is, it is to simply give a different perspective on the chart*
Last week I mentioned several times about taking risk off the table in Nov beans if you were nervous or undersold given the fact that were in the top 10% of prices we had seen all year long.
We actually nearly posted new calender year highs on Friday.
Just 4 days later we are now in the bottom 50% of prices we've seen this year.
That is how fast these markets can turn either way.
Wheat
Fundamentals:
The wheat market has followed the rest of the grains lower and has now given back pretty much the entire recent rally.
The funds covered a small amount recently, but overall continue to pound this pound this market, as they still hold far and away their largest short postion of all-time in KC wheat.

Typically wheat doesn’t rally into harvest.
But winter wheat harvest is well behind average, sitting at 19% complete vs 38% last year and 28% on average so that's supportive.
We still might have to wait until after the harvest pressure before we get a real opportunity unless the funds decide they want to cover before hand.
Once we get through harvest, there isn’t a major reason to continue pushing wheat into the ground.
Technicals:
We hit my 1st target in July Chicago wheat last week.
We did not alert a full blown sell signal, but mentioned that this is a good spot to take risk off the table if you were someone who needed or wanted to do so.
As we re-claimed 50% of the Feb highs.
We are currently sitting at support where we bounced a few times. Bulls need to hold here or we likely go test the lows.

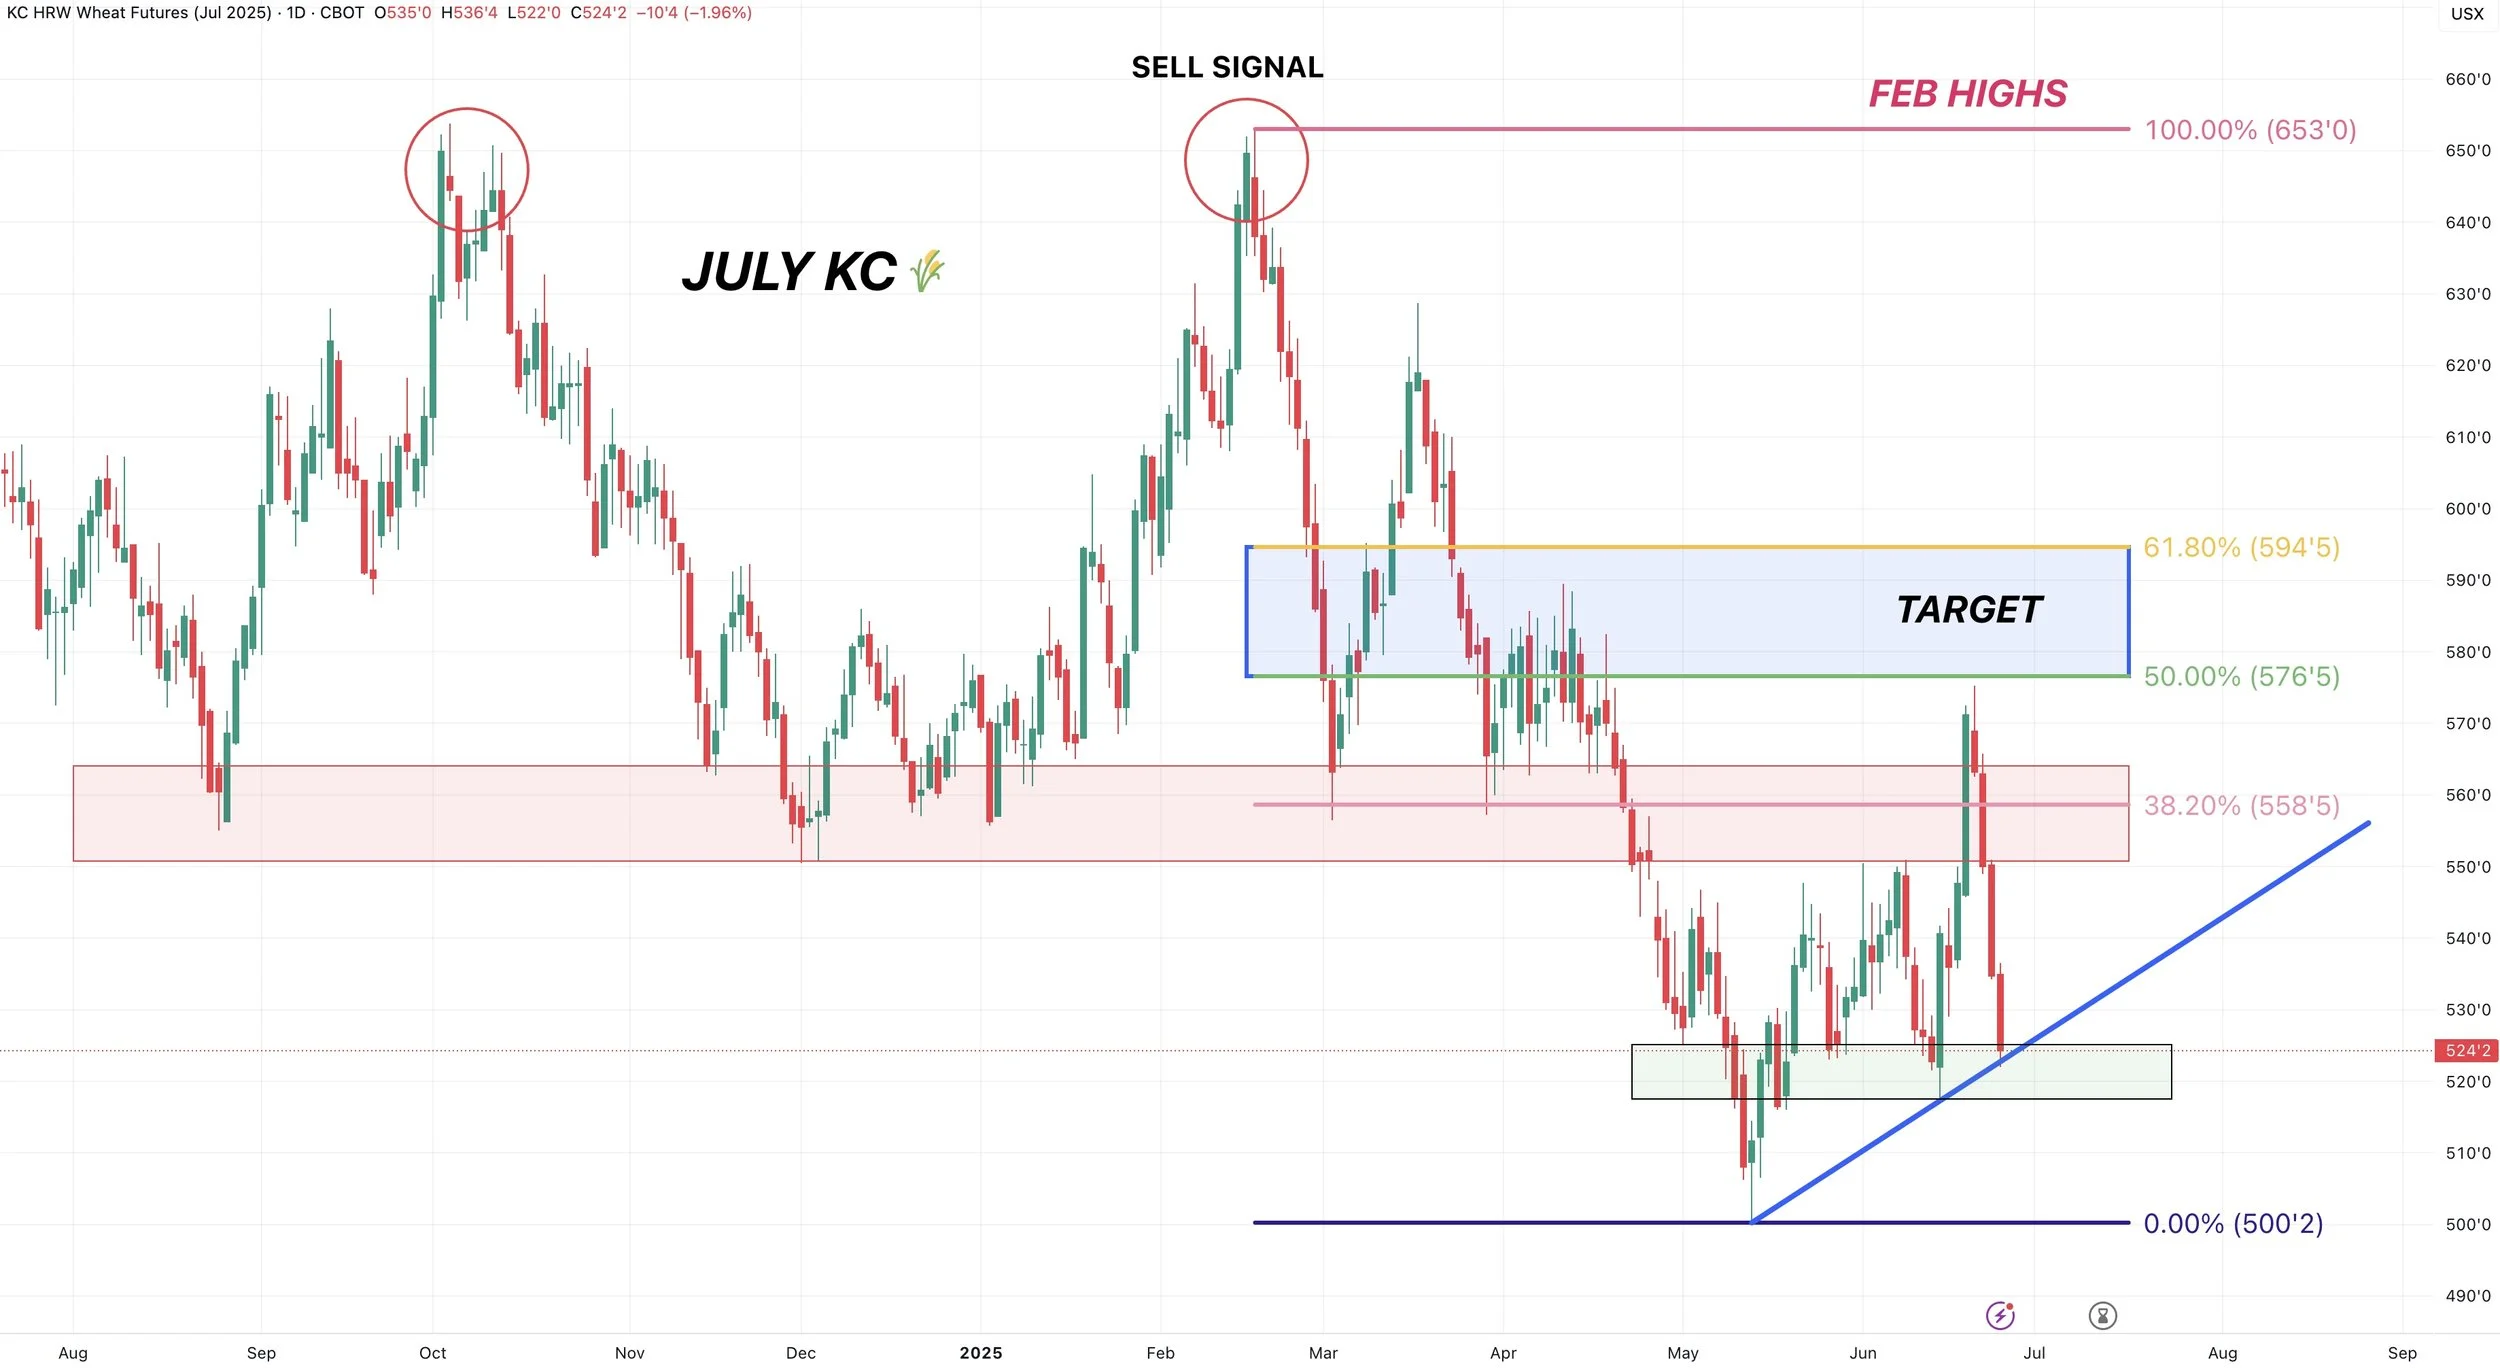
On KC wheat we fell literally 1 penny shy of my target.
But that is why I said in our update last week, if we hit a target in once class of wheat it is usually a green light to take risk off in the others as well. Because if one target hits, it does not mean the other has to. And that is sadly exactly what happened this time.
KC now at a big spot. Bulls want to hold here or we likely go test the lows.
Past Sell or Protection Signals
We recently incorporated these. Here are our past signals.
June 5th: 🐮
Cattle sell signal & hedge alert.
June 2nd: 🌾
MPLS wheat sell signal.
April 10th: 🌽
Old crop corn sell signal.
March 19th: 🐮
Cattle hedge & sell signal.
Feb 18th: 🌽 🌾
Old crop KC wheat & old crop corn signal.
Jan 23rd: 🌽 🌱
Corn & beans old crop sell signal.
CLICK HERE TO VIEW
Jan 15th: 🌽 🌱
Corn & beans hedge alert/sell signal.
Jan 2nd: 🐮
Cattle hedge alert at new all-time highs & target.
Dec 11th: 🌽
Corn sell signal at $4.51 200-day MA
CLICK HERE TO VIEW
Oct 2nd: 🌾
Wheat sell signal at $6.12 target
Sep 30th: 🌽
Corn protection signal at $4.23-26
Sep 27th: 🌱
Soybean sell & protection signal at $10.65
Sep 13th: 🌾
Wheat sell signal at $5.98
May 22nd: 🌾
Wheat sell signal when wheat traded +$7.00
Want to Talk?
Our phones are open 24/7 for you guys if you ever need anything or want to discuss your operation.
Hedge Account
Interested in a hedge account? Use the link below to set up an account or shoot Jeremey a call at (605)295-3100.
Check Out Past Updates
6/24/25
CORN CONTINUES SELL OFF. MAJOR USDA REPORT COMING
6/23/25
CORN CAN GO LOWER, BUT NOT FOR FOREVER
6/20/25
WHO SHOULD REWARD THE WHEAT & SOYBEAN RALLY?
6/18/25
COMPLETE CHART BREAKDOWNS
6/17/25
SOYBEANS CONTINUE BREAKOUT. NEARING SELL SIGNAL
6/16/25
CORN HAMMERED. EPA GAME CHANGER IN BEANS?
6/13/25
SOYBEANS RALLY, CHARTS, BALANCE SHEETS & MORE
6/12/25
USDA NON-EVENT. WHAT’S NEXT?
6/11/25
DIVERGENCE & SEASONAL SELL OFF?
6/10/25
BEING PATIENT VS BALANCING YOUR RISK
6/9/25
WHAT IF WE DON’T GET A WEATHER SCARE?
6/5/25
CORN & BEANS HOLDING CRUCIAL SPOTS
6/5/25
CATTLE SELL SIGNAL & HEDGE ALERT
6/4/25
HOW UNKNOWNS IMPACT MARKETING DECISIONS
6/3/25
KEY SPOTS ON THE CHARTS FOR CORN & BEANS
6/2/25
NEW LOWS IN CORN. DE-RISKING MPLS WHEAT
6/2/25
SPRING WHEAT SELL SIGNAL
5/30/25
SEASONAL RALLY STILL IN THE CARDS?
5/29/25
WHAT IS YOUR PLAN IF WE DO NOT RALLY?
5/28/25
ZERO PREMIUM IN THE GRAIN MARKETS
5/27/25
CORN CONDITIONS DISAPPOINT & JUNE OUTLOOK IMPROVES
5/23/25
TARIFFS SPOOK MARKET. GAME PLAN MOVING FORWARD
5/22/25
CHART BREAKDOWNS & TARGETS
5/21/25
RISK TO THE UPSIDE WITH WEATHER?
5/20/25
WHEAT SHORT COVERING & HISTORY OF YIELD CHANGES
5/19/25
ANYONE LEFT TO SELL WHEAT? 181 CORN YIELD POSSIBLE?
5/16/25
FUNDS SHORT CORN. MARKETS WAITING ON WEATHER
5/15/25
BEANS HAMMERED ON RUMOR & WHEAT FINDING LIFE
5/14/25
DECISIONS & POSSIBILITIES IN GRAINS
5/13/25
GRAINS RALLY OFF LOWS
5/12/25
USDA REPORT. HOW THIS CHANGES THINGS
5/9/25
BIGGEST RISKS IN USDA REPORT
5/8/25
USDA MONDAY & HISTORY OF WEATHER RALLIES
5/7/25
NEW 2025 LOWS FOR CORN
5/6/25
WHAT’S A SUMMER RALLY LOOK LIKE?
5/5/25
CORN ERASES ENTIRE APRIL RALLY
5/2/25
SELL INTO UNCERTAINTY. NOT KNOWN FACTORS
5/1/25
THE CASE AGAINST A FEB TOP IN CORN
4/30/25
APPROACHING KEY TIME PERIOD FOR GRAINS
4/29/25
PLANTING & FIRST NOTICE DAY PRESSURE. CORN CLOSE TO BOTTOM?
4/28/25
CAPTURING INVERSE & SEASONAL PREPARATION
4/25/25
HOW OFTEN DOES CORN NOT BREAK APRIL HIGHS?
4/24/25
KNOW WHEN TO SELL. BEANS BREAK 200-DAY FIRST TIME IN 483 DAYS
4/23/25
MONEY FLOW & DROUGHT CARDS
4/22/25
CRUCIAL SPOT FOR CORN & BEANS
4/21/25
NO PLANTING THREAT YET
4/18/25
POTENTIAL OPPORTUNITIES, BASIS CONTRACTS & STRATEGIES
4/16/25
HOW YIELD IMPACTS CARRYOUT. MAJOR SPOT FOR SOYBEANS
4/15/25
TOTAL CHART BREAKDOWNS & TARGETS
4/14/25
TECHNICAL SELLING IN GRAINS
4/11/25
SPECIFIC GRAIN MARKETING DECISIONS
4/10/25
USDA REPORT. HOW THIS IMPACTS CORN
4/9/25
TARIFFS GIVE. TARIFFS TAKE
4/8/25
CORN’S DIVERGING STRENGTH
4/7/25
SOLID PRICE ACTION DESPITE OUTSIDE FEAR
4/4/25
CORN PRICE ACTION SPEAKS VOLUME. ANY HOPE LEFT FOR SOYBEANS?
4/3/25
WHAT IS LEFT FOR CORN BEARS? TRADE WAR: CHARTS HOLDING SUPPORT
4/2/25
SHOULD UNKNOWNS KEEP A FLOOR UNDER GRAIN PRICES?
4/1/25
HOW DO ACRES IMPACT FUTURE OF THE GRAINS?
3/31/25
USDA REPORT: NOW WHAT?
3/28/25
ALL EYES ON USDA
3/27/25
PRE-USDA POSITIONING. DON’T GIVE GRAIN AWAY
3/26/25
HISTORY OF MARCH INTENTIONS. SOYBEANS UNDERVALUED?
3/25/25
6 DAYS UNTIL MAJOR USDA REPORT
3/24/25
HOW TO POSITION YOURSELF BEFORE PLANTING
3/21/25
REASONS TO BE OPTIMISTIC IN GRAINS?
3/20/25
WAS THAT THE BOTTOM IN CORN?
3/19/25
THE PATH HIGHER & THE DOWNSIDE RISKS IN GRAINS
3/18/25
SEASONALS, CATTLE HEDGE, CHARTS & DROUGHT?
3/17/25
WHEAT RALLIES. DON’T GET BACKED INTO A CORNER
3/14/25
MARCH 31ST REPORT THOUGHTS & WHAT’S NEXT FOR GRAINS
3/13/25
EXPLAINING RE-OWNERSHIP VS COURAGE CALLS
3/12/25
TARIFF FEARS. EU, CANADA, & ETHANOL
3/11/25
USDA SNOOZE. RECORD FUND SELLING A CONCERN?
3/10/25
USDA TOMORROW. GETTING COMFORTABLE IN MARKETING
3/7/25
HOW TIGHT IS THE WORLD & US SITUATION?
3/6/25
TARIFFS PUSHED BACK. FUTURE OPPORTUNITIES?
3/5/25
IS GRAINS BIGGEST RISK WEAK CRUDE & DEFLATION?
3/4/25
TRADE WAR BEGINS. 8TH DAY OF PAIN FOR GRAINS
3/3/25
TARIFFS ON TOMORROW. BUY SIGNAL
3/3/25
BUY SIGNAL
2/28/25
WHEN WILL THE BLEEDING STOP?
2/27/25
CORN AT CRITICAL SPOT. USDA ACRE REPORT. WAY TOO EARLY DROUGHT TALK
2/26/25
HISTORY SUGGESTS CORN TOP ISN’T IN? ACRE OUTLOOK TOMORROW
2/25/25
POSITIVE CLOSE. WHAT TO KNOW ABOUT USDA OUTLOOK
2/24/25
USDA OUTLOOK, FIRST NOTICE DAY & BRAZIL
2/21/25
WHAT TO EXPECT MOVING FORWARD IN GRAINS
2/20/25
FIRST NOTICE DAY CONCERNS. MASSIVE CORN ACRES OR NOT?
2/19/25
HOW TIGHT IS THE CORN SITUATION?
2/18/25
MORE DETAILS ON TODAYS SELL SIGNAL
2/18/25
OLD CROP KC WHEAT & CORN SELL SIGNAL
2/14/25
WHEAT BREAKING OUT ON WEATHER RISK. TECHNICALS & FUNDAMENTALS
2/12/25
GLOBAL GRAIN SITUATION, ACRE TALK, CHARTS & MORE
2/11/25
USDA: NOT A BEARISH REPORT. DISAPPOINTING PRICE ACTION
2/10/25
USDA TOMORROW. LONG TERM PATH FOR SUB 10% CORN STOCKS TO USE?
2/7/25
WHY WOULD THE FUNDS EXIT THEIR LONGS?
2/6/25
WHEAT FINALLY CATCHING A BID
2/5/25
COMPLETE THOUGHTS ON MARKETS: BACK & FORTH DISCUSSION
2/4/25
STRONG JANUARY LEAD TO STRONG YEAR? TARIFFS, CHARTS & MORE
2/3/25
TARIFFS PUSHED BACK
1/31/25
TARIFF NEWS ALL OVER THE PLACE. ARE YOU PREPARED FOR POSSIBILITIES?
1/30/25
WHEAT BULL ARGUMENT. TRUMP ADDS TARIFFS
1/29/25
CORN APPROACHES $5.00
1/28/25
TARIFFS, CORN FUNDS, SOUTH AMERICA & MORE
1/27/25
HEALTHY CORRECTION WE TALKED ABOUT & TARIFF NEWS
1/24/25
GRAINS DUE FOR SHORT TERM CORRECTION?
1/23/25
OUR ENTIRE NEW CROP SALES THOUGHTS & OLD CROP SELL SIGNAL
1/22/25
GRAINS TAKE A BREATHER. IS CORN IN A BULL OR BEAR MARKET?
1/21/25
HUGE DAY IN GRAINS. WHAT TO DO WITH OLD CROP VS NEW CROP
Read More
1/20/25
VIDEO CHART UPDATE
1/17/25
TRUMP, CHINA, ARGY & USING THE SPREADS INVERSE
1/16/25
OLD CROP LEADS US LOWER. MARKETING THOUGHTS
1/15/25
SIGNAL & HEDGE ALERT QUESTIONS EXPLAINED. IS $6 CORN EVEN POSSIBLE?
1/14/25
MORE DETAILS ON TODAYS HEDGE ALERT & SELL SIGNAL
1/14/25
CORN & SOYBEANS HEDGE ALERT/SELL SIGNAL
1/13/25
USDA GAME CHANGER OR NOT?
1/10/25
BULLISH USDA FOR CORN & BEANS
1/9/25
USDA OUT TOMORROW
1/8/25
2 DAYS UNTIL USDA. BE PREPARED
1/7/25
THE HISTORY OF THE JAN USDA & MORE
1/6/25
MAJOR USDA REPORT FRIDAY
Read More
1/3/25
UGLY DAY ACROSS THE GRAINS
1/2/25