
ALL EYES ON MONDAY
MARKET UPDATE
You can scroll to read the usual update as well. As the written version is the exact same as the video.
Timestamps for video:
Overview: 0:00min
Corn: 6:20min
Beans: 10:00min
Wheat: 14:10min
Want to talk about your situation?
(605)295-3100
Futures Prices Close

Overview
Grains rally across the board ahead of Monday's USDA report.
Today was the first day this week we traded higher.
Monday is going to be a major data dump.
Not only do we have the USDA report. But this is also the end of the quarter and first notice day.
Funds square off their positions at the end of the month.
First notice day means that anyone with basis contracts had to either roll or price them.
First notice day more often than not, can create natural pressure in the markets. We have sold off very hard going into first notice day.
This is a theme time and time again. To sell off going into it, then find some relief once it's out of the way.
So finding some life here wouldn’t be surprising because that natural sell pressure is gone.
But Monday is going to be all about the report. It is one of the biggest reports of the entire year.
Corn and wheat on average both move +/-20 cents on this report.
Soybeans on average move +/- nearly 35 cents. That alone speaks on how big of a mover this can be.
In case you missed the estimates in our last update, here they are again.
Acre estimates have a very wide range of estimates.
Corn is 93.8 to 96.8
Beans are 82 to 85
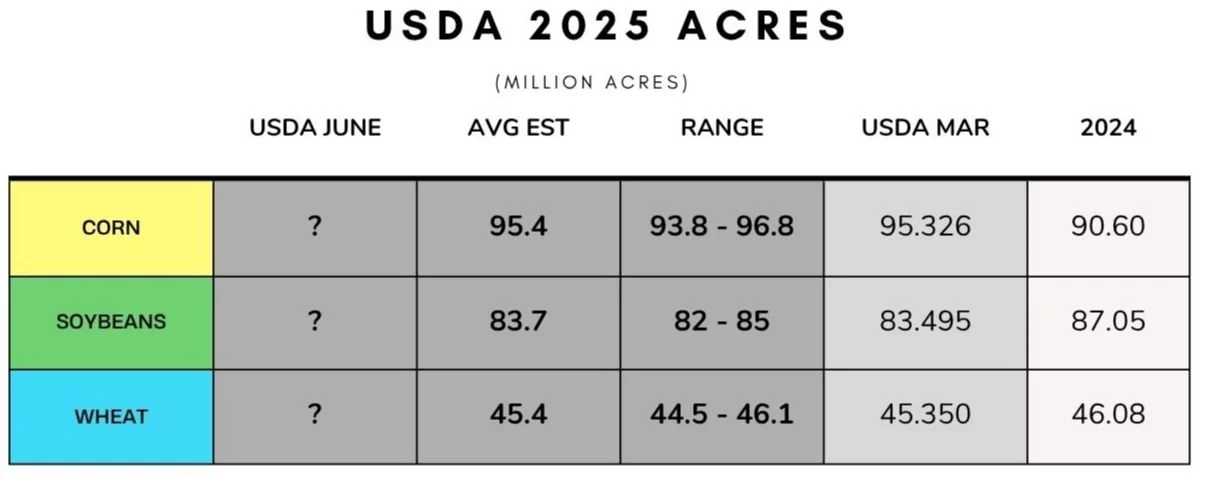
It feels like most are expecting corn acres to come in higher vs the March intentions.
Why? The farmer likes planting corn. Seed company sales suggest more corn.
And if we look at the soybean to corn ratio, this might tell the entire story.
Back in spring, the ratio was at it's lowest levels in 2 years.
Meaning corn was overvalued compared to soybeans.
People want to plant what makes them more money. At the time, it was corn.
These planting decisions were made earlier this year. Not today. If a producer was deciding on if they should plant corn or beans, they probably chose corn due to the difference in price performance at the time.
Now that corn stole some acres, this ratio is naturally correcting itself. Meaning soybeans are now of equal value to corn.
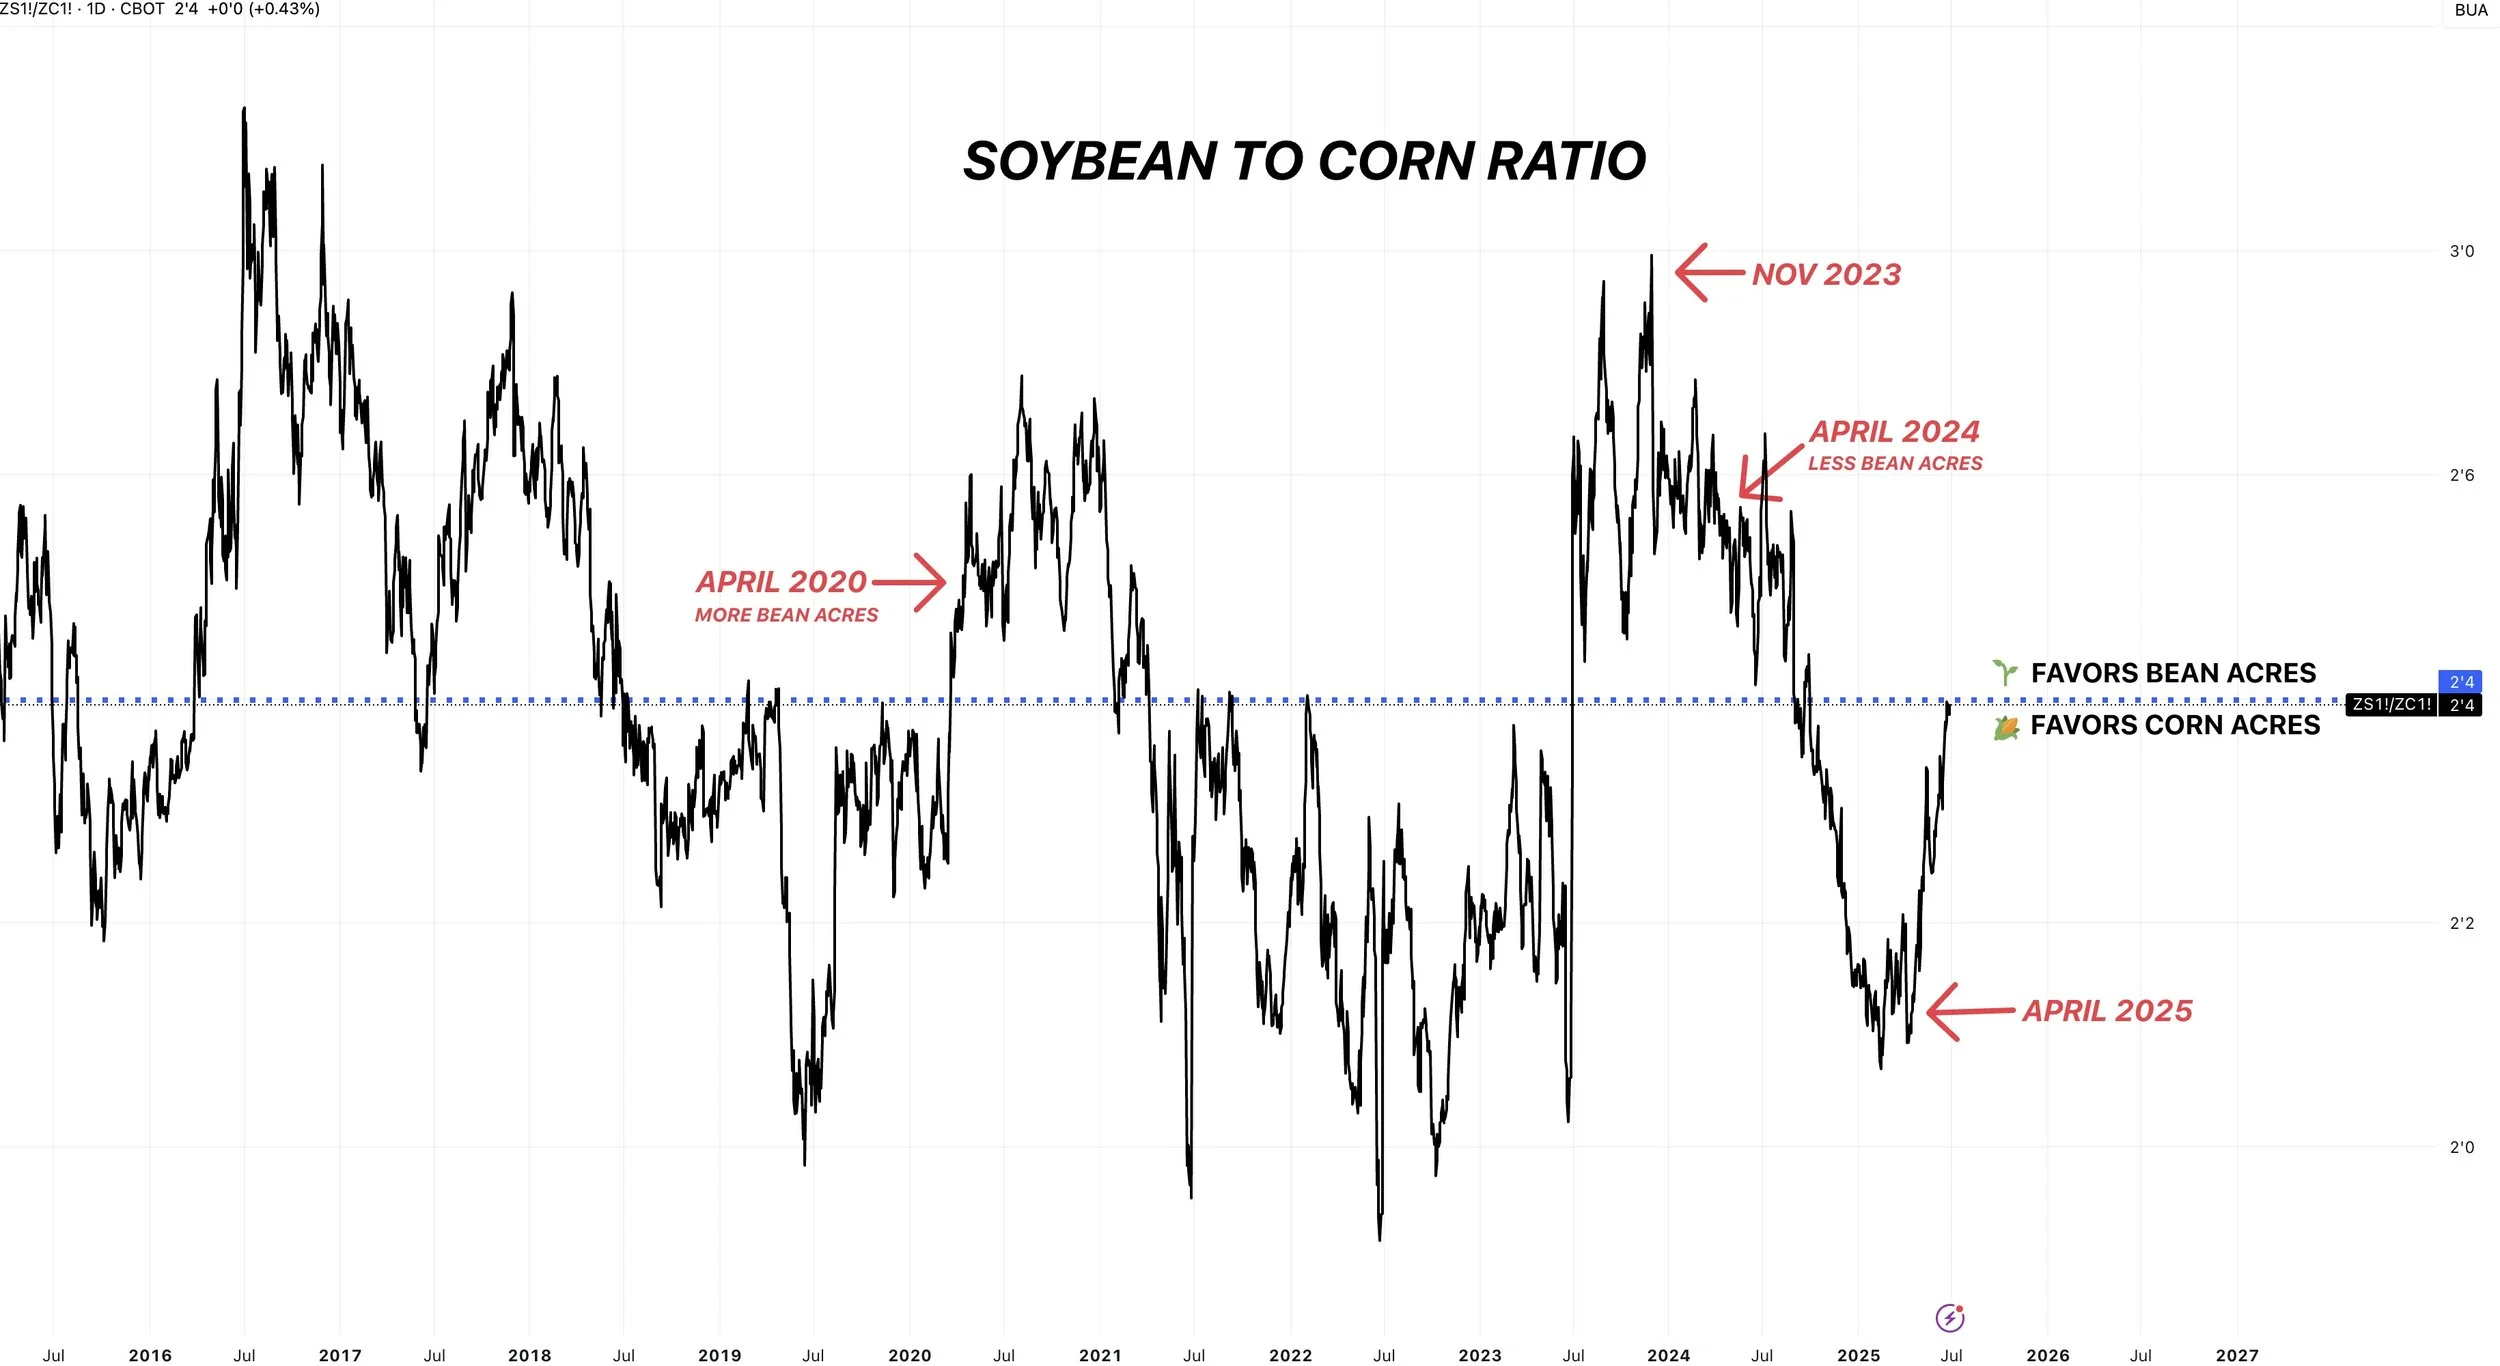
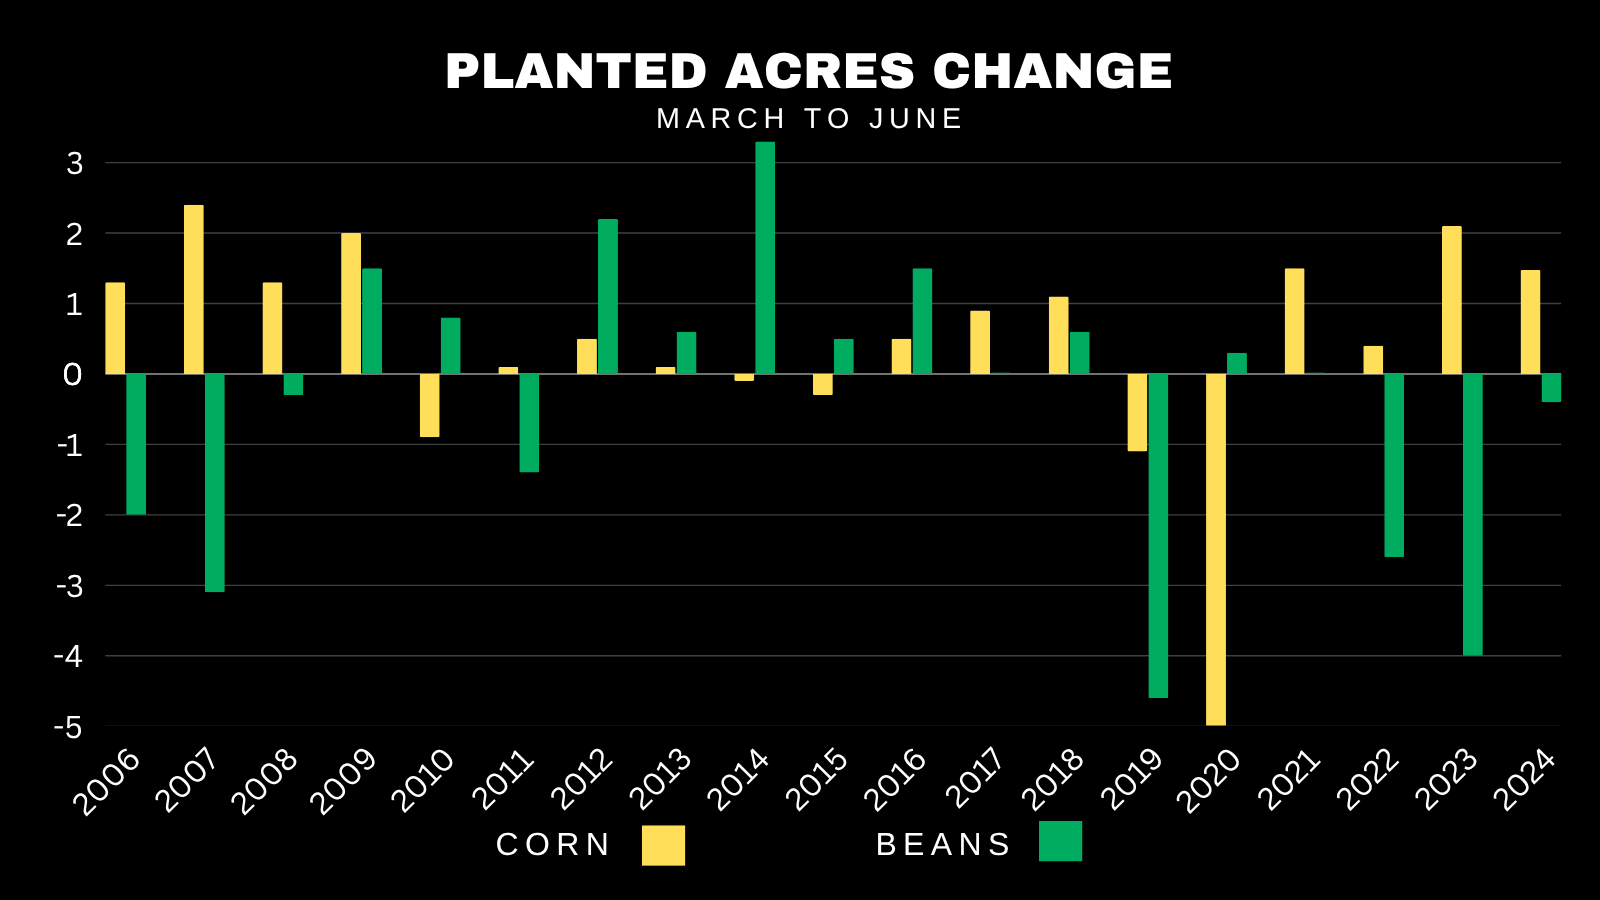
If we look at the past data, the last time soybean acres rose from March to June was 2020.
At this same time, corn acres fell hard from March to June in 2020.
If you refer back to the chart above, soybeans were gaining on corn in spring of 2020 at a rapid pace. In result, a record amount of acres shifted from corn to soybeans.
You might be asking "what about 2023-2024 when the ratio was high?"
The ratio was high in Nov 2023. But after fall, going into spring of 2024 the ratio was in a constant fall. Resulting in more corn acres and less bean acres in 2024.
On Monday, chances are we will see one acre rise and one acre fall.
The last time both acres increased was in 2018. It has only happened 5 times in the past 20 years.
The one and only time both acres fell was 2019. That was an anomaly due to the wet planting. So odds say we will not see both fall.
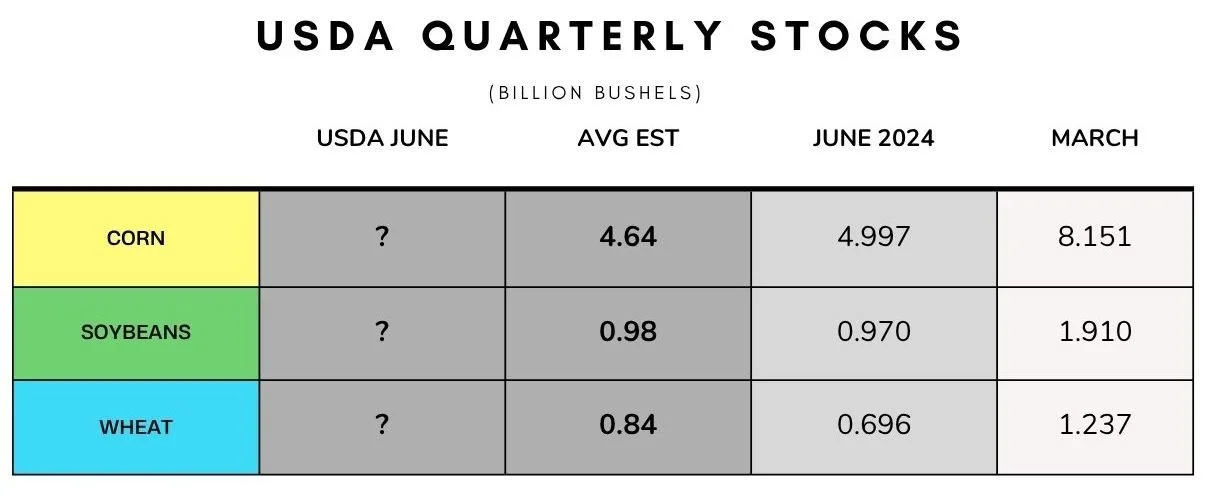
This report isn’t just about acres.
The stock numbers are the one that can provide a massive shock to the market and shake up the balance sheet in a big way.
This is where the USDA can magically find bushels, or lose them.
Most seem to think that the USDA is going to show a reduction in feed demand for corn, and that our carryout isn’t as tight as currently projected. Because traders are looking for an explanation as to why July corn is in a free fall if our old crop carryout is one of the tightest ever.
Most think this report will give us that explanation. Because spreads and the cash market both suggest that there is more corn bushels out there than originally perceived.
Now altough consensus is that we see higher corn acres and perhaps some extra bushels, at the same time we just sold off extremely hard into this report.
The market is pricing some of this in. Meaning that if the numbers fall within expectations it could "potentially" lead to a sell the rumor buy the fact event.
Which is exactly what we saw on the March intentions report.
We sold off going into that report because everyone saw the big acres coming. Then once it was confirmed, the market found life and rallied.
Now if acres come in crazy high or if stocks surprise crazy high then yes we will sell off. But the market has done some damange ahead of this report. So it should take a real bearish surprise to sell this corn market off further.
China Deal
Last night it was announced that a trade deal between the US and China was signed earlier this week.
US tariffs on China are 30% (down from 145%), while China tariffs on the US are 10% (down from 125%).
In depth details of the deal have not been announced. No ag details were mentioned or expected to be mentioned in this.
The deal is expected to be mostly about rare earth exports and easing of tech restrictions.
This deal more so just reaffirms that truce they made in May.
Trump announced he terminatied all discussions on a trade deal with Canada. This doesn’t impact grains directly, but can harm ethanol dermand as Canada is our leading buyer.
The EU and US said they think they will reach an agreement by the July 9th deadline.

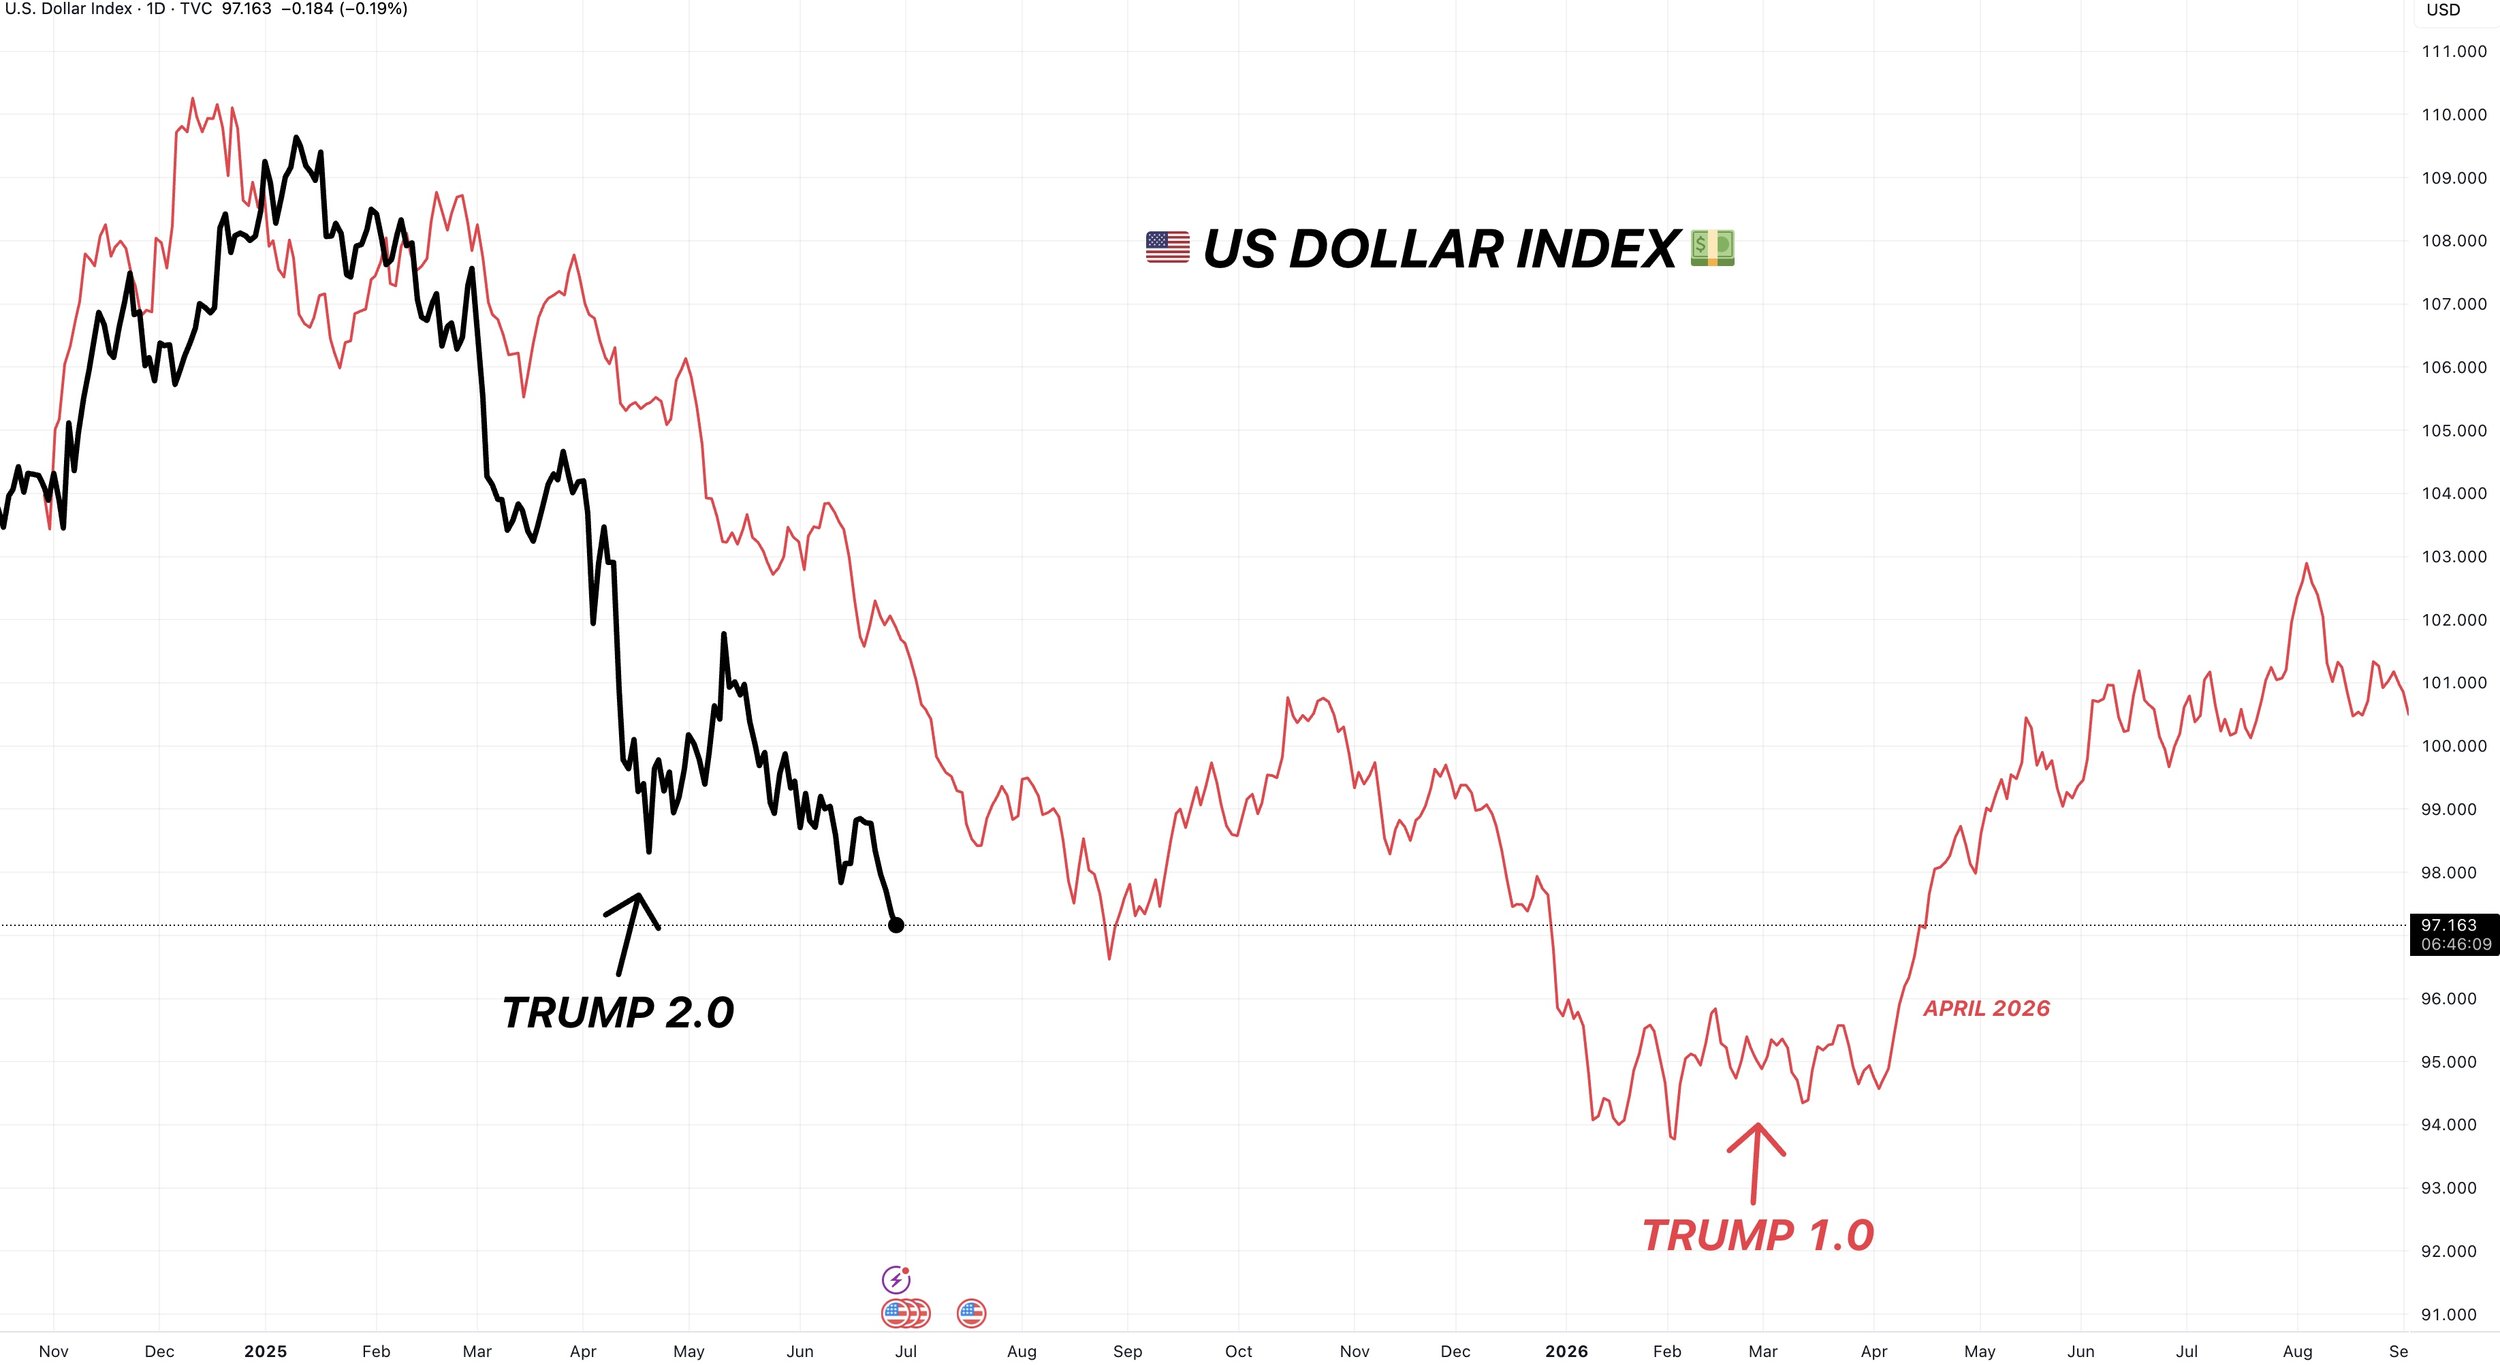
US Dollar
The US dollar is already down -11% on the year.
It is at it's lowest levels since 2022.
Here is the current dollar overlayed on top of how the US dollar performed vs the last time Trump stepped into office his first year.
Up to this point, the comparison is identical.
Last time, the dollar fell -15%.
It continued to fall until April of the following year (would be April 2026 in this case).
This is a factor that has not yet been priced into the grain markets.
If grain prices stay cheap and the US dollar continues to fall.. that is a recipe for even more demand.
What do you think happens to demand if our currency is not only -15% cheaper.. but prices also remain at cheap levels?
Brazilian Real
The Real vs the US Dollar is rallying to it's highest levels since Oct 2024.
The Real rallying is hurting Brazil producers for the first time in a while.
This hurts Brazil's export competitiveness.
The results of their currency rallying vs ours is that they have less incentive to export.
It is bullish for US exports. If Brazil is less competitive, the US picks up that demand.

Todays Main Takeaways
Corn
Fundamentals:
Not much to add today. It's all about the report.
Here is a few possible scenarios for this report:
1) It is flat out bullish and we rally. Which means weather becomes even more important.
2) The report is neutral to maybe even slightly bearish, but we sold off hard going into this report. We have first notice day out of the way. There isn’t going to be any farmer selling. So prices shouldn’t tank. Or maybe the report is super friendly beans and beans drag corn higher even if corn has a neutral report.
3) A no doubt bearish report. Acres come in at 96.5 million or we find a bunch of bushels on the stocks. We continue lower.
Here is a few scenarios going into harvest:
1) This report provides a rally and selling opportunity.
2) We get some sort of weather scare.
The funds are still very short. So if we do run into dryness, we could still see an opportunity.
There is also the chance dry weather might not give an actual scare that leads to a rally.
Dryness in Aug and Sep can still impact the balance sheets long term. Take last year for example. We got zero rally on weather. Dryness set in come August and the trade realized it damaged yield months later. The outlook for the next 45 days is dry. But the forecasts have proved to be anything but reliable.
3) We do not get any rally at all. Prices continue later into harvest.
This scenario would suck. But very possible. If this does happen, it could create a demand monster. Which is the silver lining long term. As low prices will cure low prices via demand.. the problem is higher prices might not happen as soon as any of us would like.
Whether we get a rally before harvest or not, chances are prices will be lower by harvest time. Meaning we can rally, but our low for the year is probaby not in yet. Seasonally we don’t bottom until harvest.
Here is the last 10 years seasonal.

Prices rarely find their lowest prices we will see all year in June or July.
When it happens in June, it is usually off the back of a weather rally that propels us high the entire year.
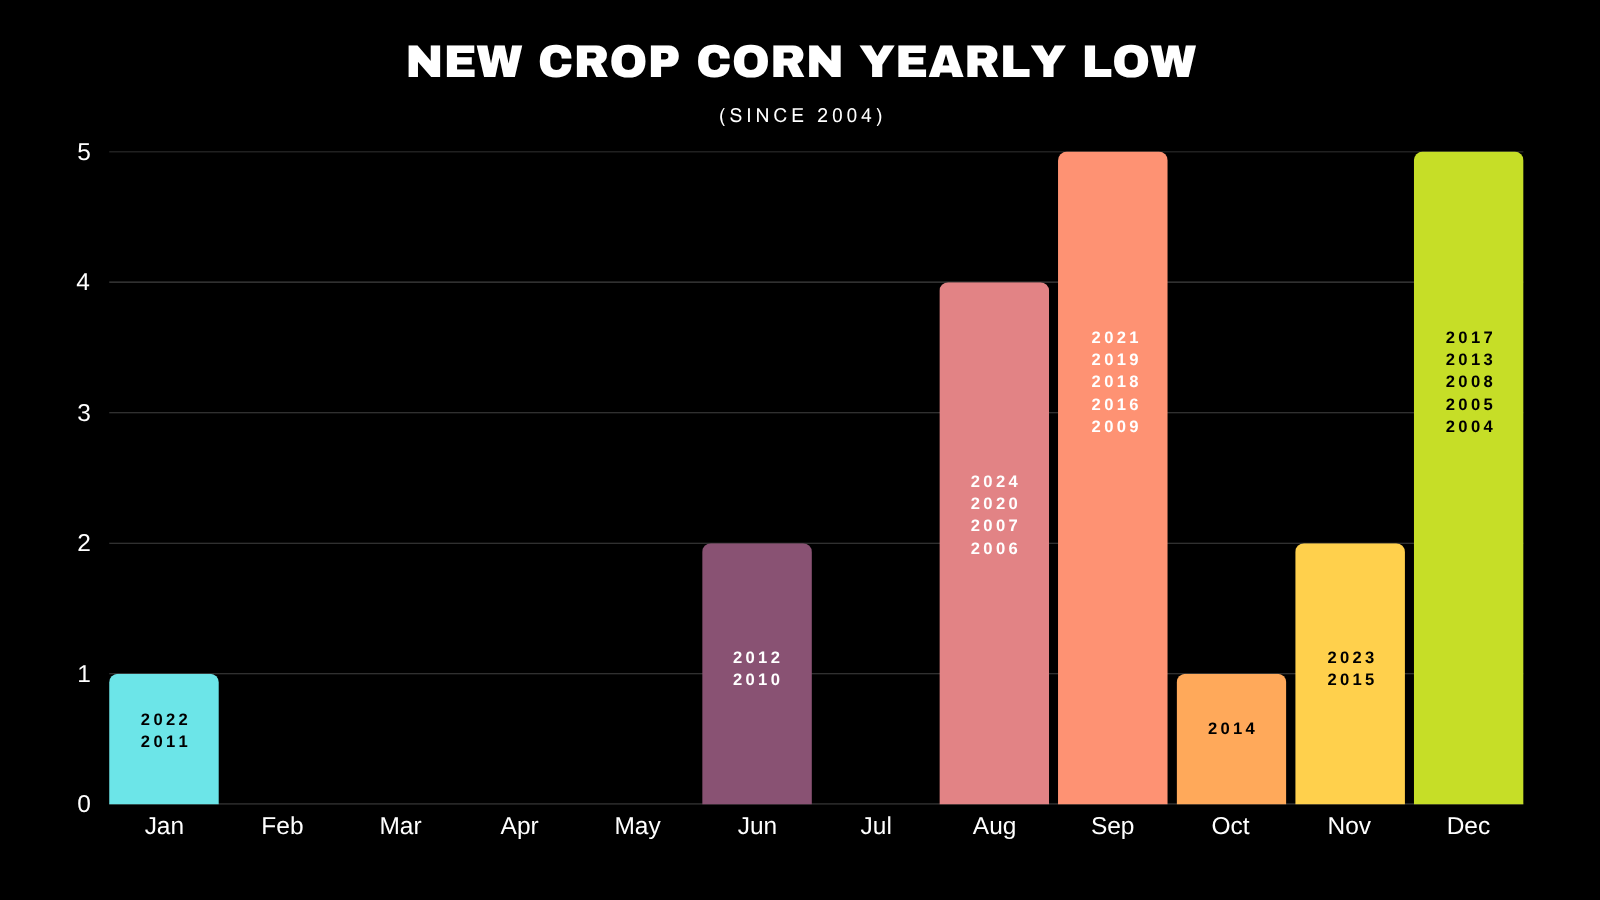
Here is a chart that shows Dec corns lowest prices by month.
Typically, it is around August to September. Then sometimes we will get that sell off that simply goes until the end of the year.
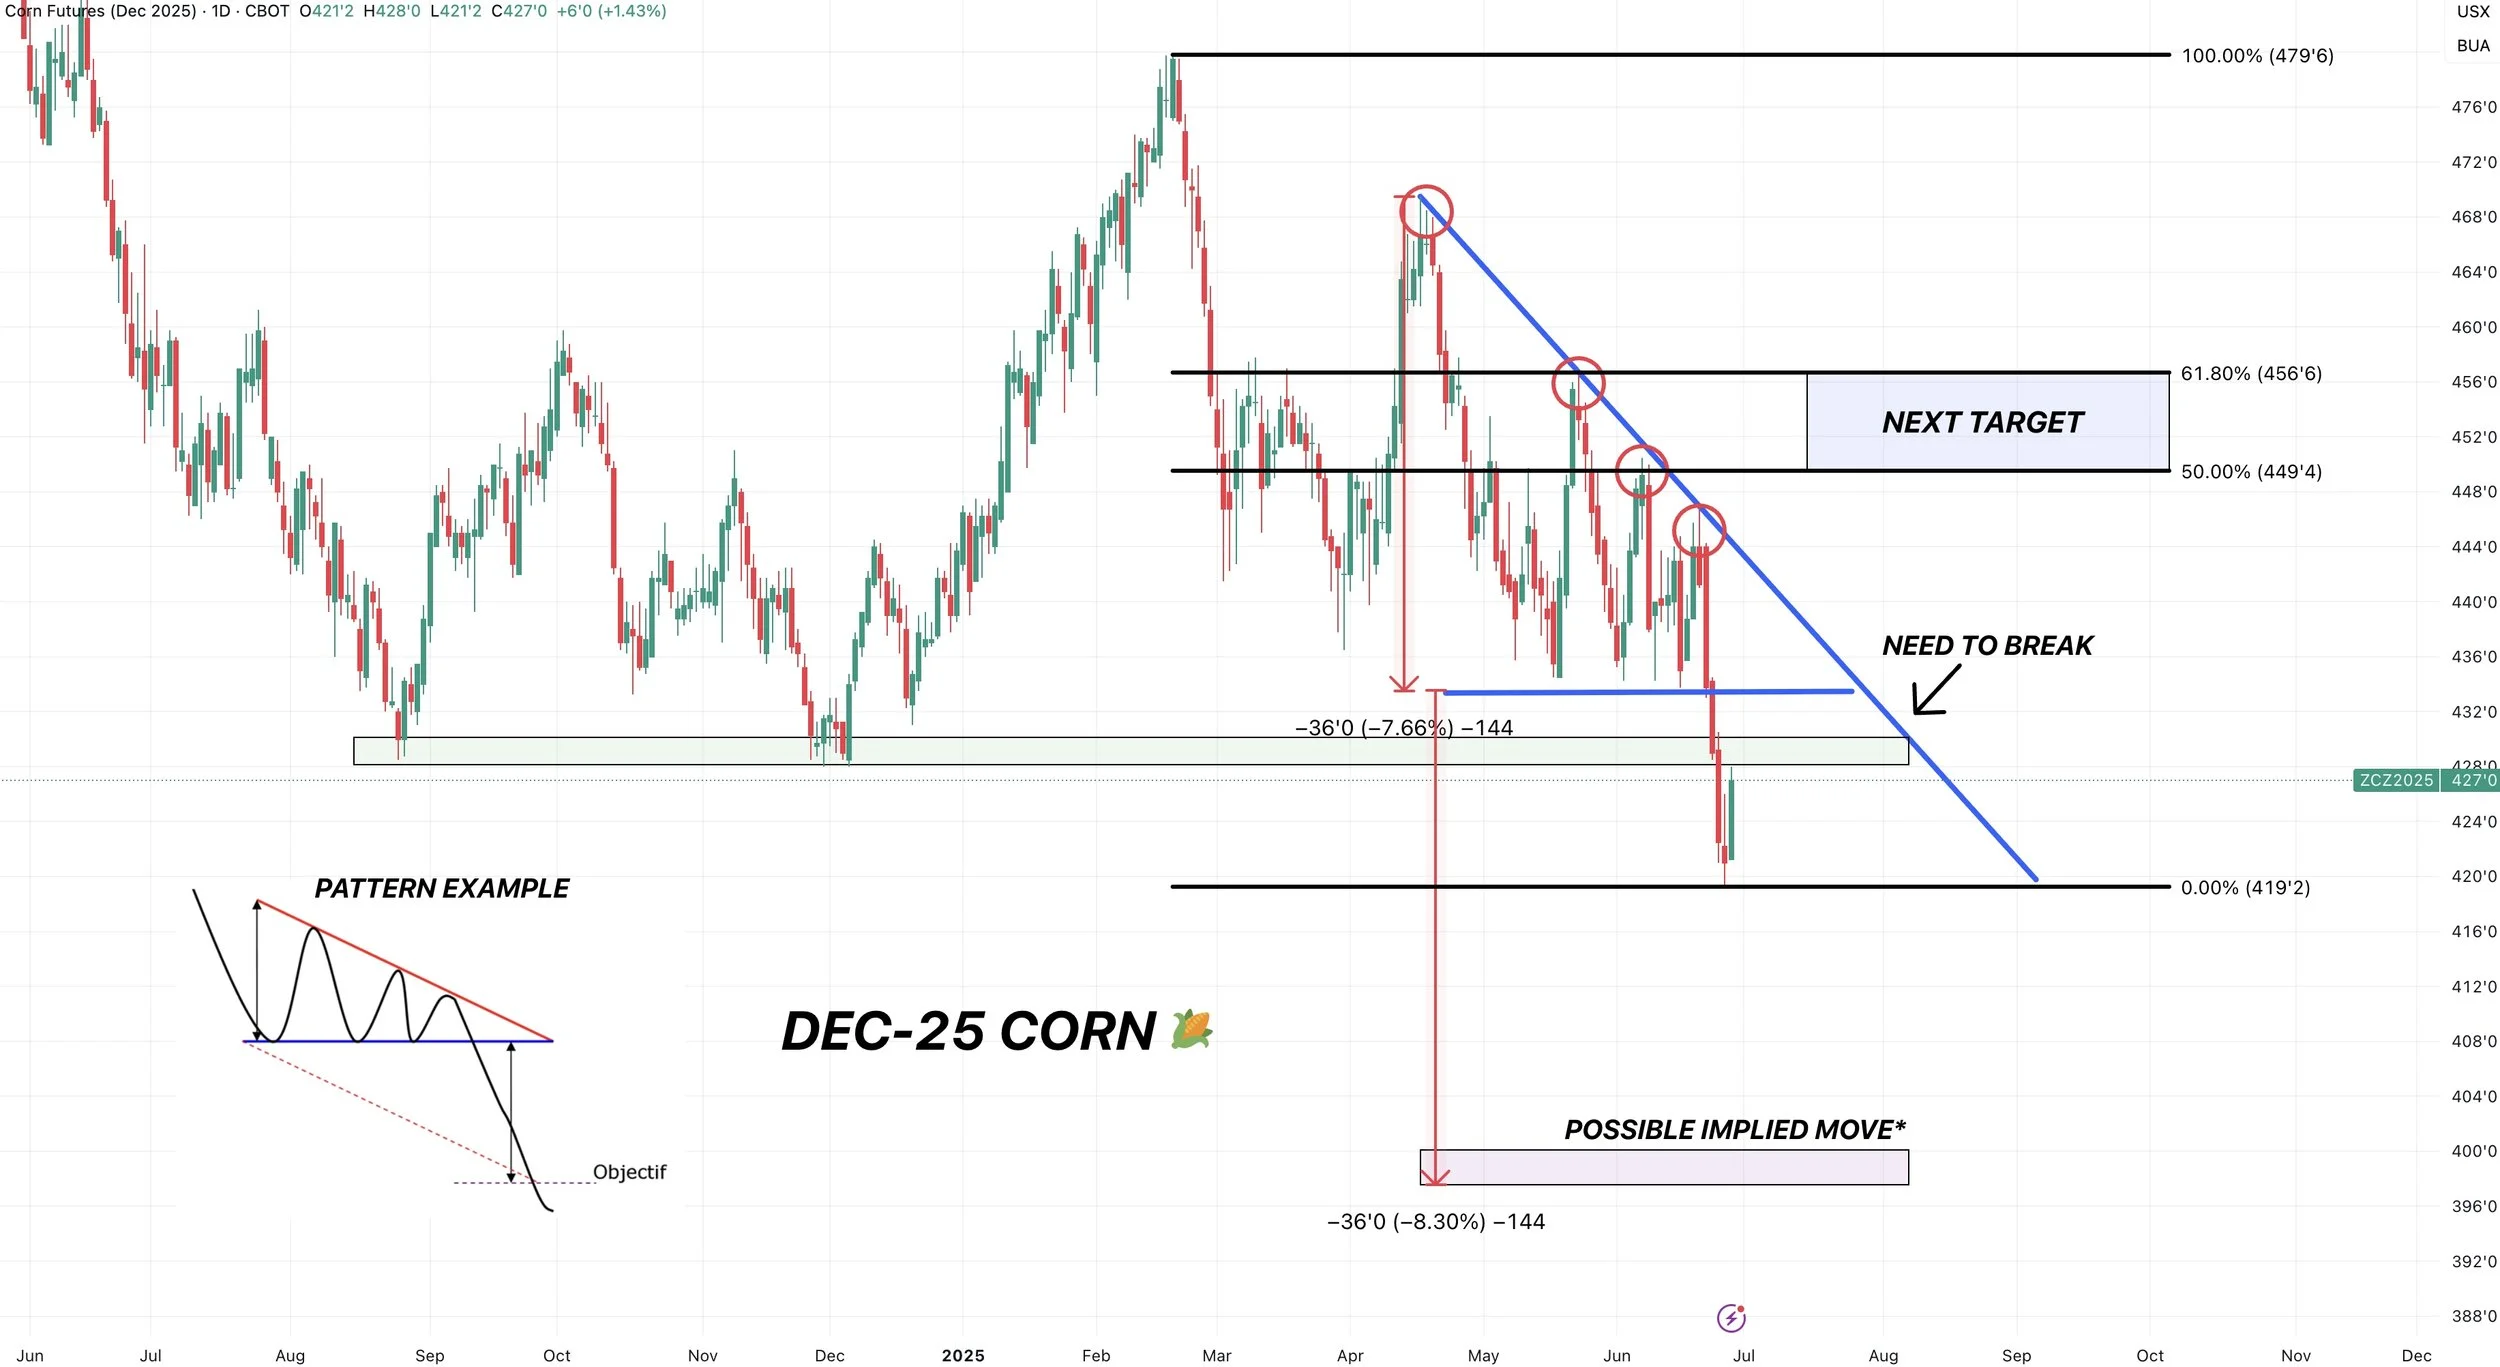
Technicals:
First day higher all week.
If this report gives an opportunity, we are looking for $4.49 to $4.56. Which gives back 50-61.8% of the Feb highs.
We still have a bearish desending triangle pattern in place which we broke below the bottom of. This is known as a bearish pattern I talked about before we broke. The implied move is around $4.00. We need to bust that downward trend to negate this pattern.
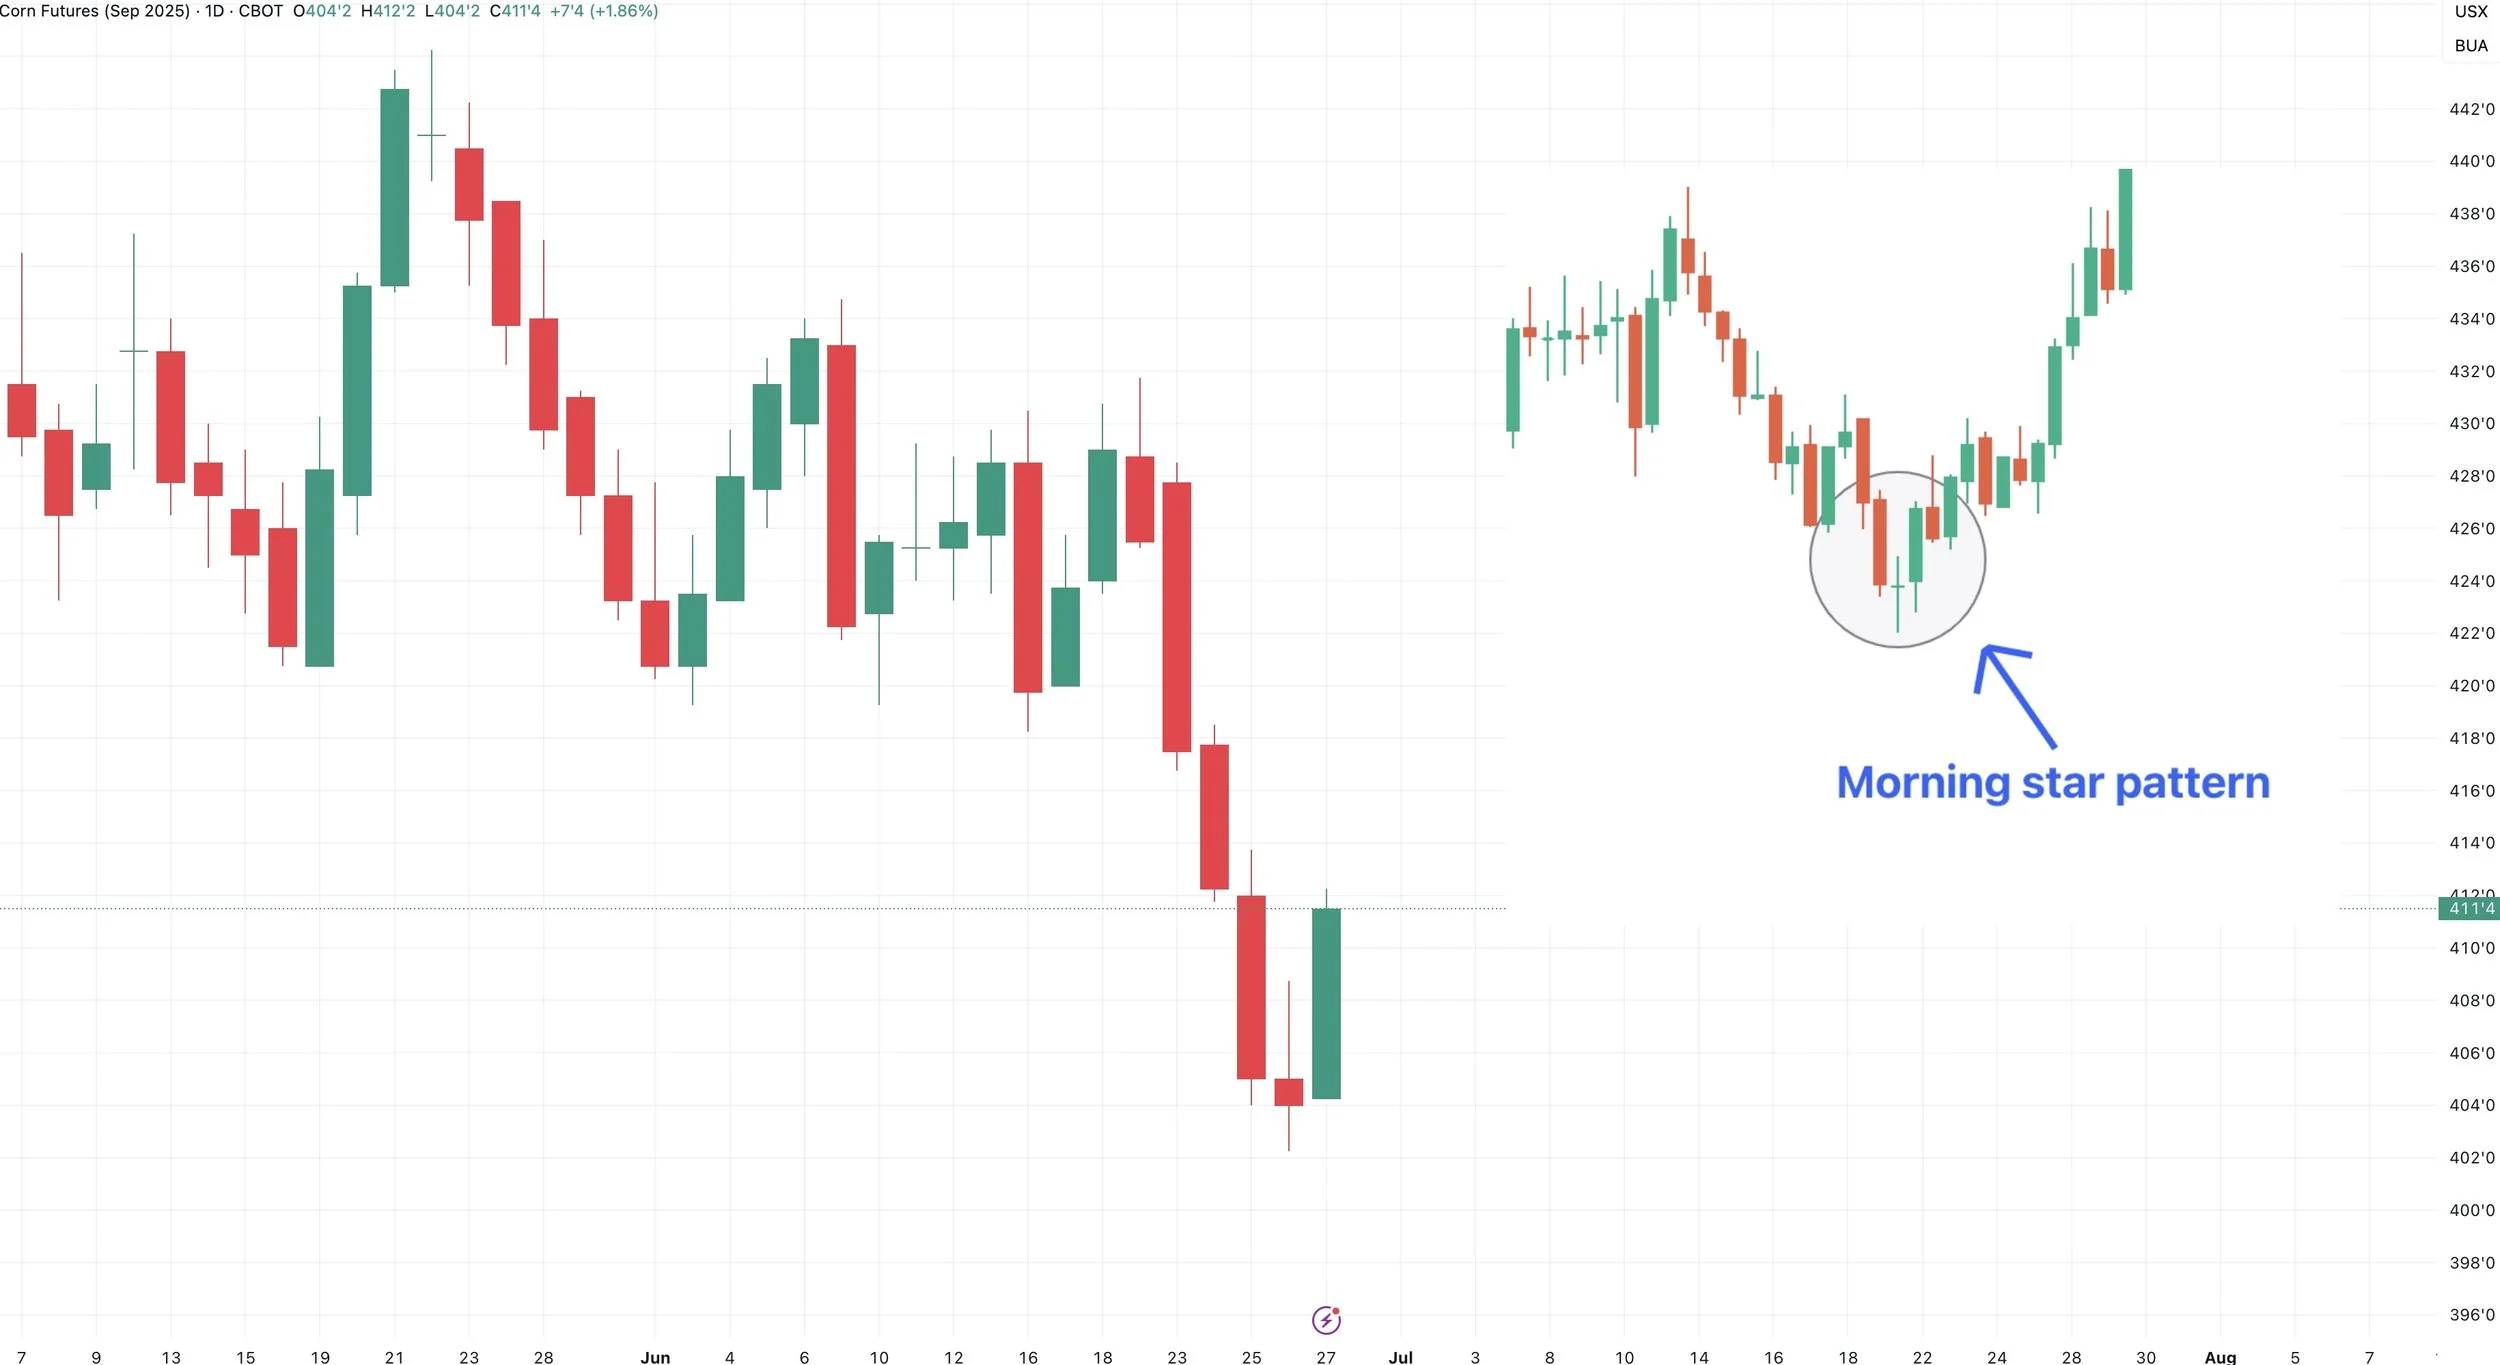
Here is Sep corn.
If you still have old crop bushels I have $4.42 to $4.52 as our next upside target. Which is 50-61.8% of the Feb highs.
If we can bust above the red box, could spark some upside.
Targets do not have to hit. They are simply there to let you know it is time to de-risk if they do hit.

Corn did post a bullish morning star pattern today.
This is a reversal pattern.
This pattern needs follow through for confirmation.
So IF we get a friendly report, maybe this sets up the stages for a small opportunity.
Soybeans
Fundamentals:
All eyes on the report.
In the past decade, soybeans have only sold off twice.
Doesn’t mean it can’t happen this year, but either way it can be a huge mover.

Barring the USDA report, I still think soybeans could be seen as being undervalued here.
We have an entire growing season ahead. With zero wiggle room on the new crop balance sheet.
I'll be diving into the updated balance sheets next week after the report, but our new crop carryout is down -15% vs last year even if we raise a record 52.5 bpa yield (we've never even hit 52). Yet prices are cheaper than last year.
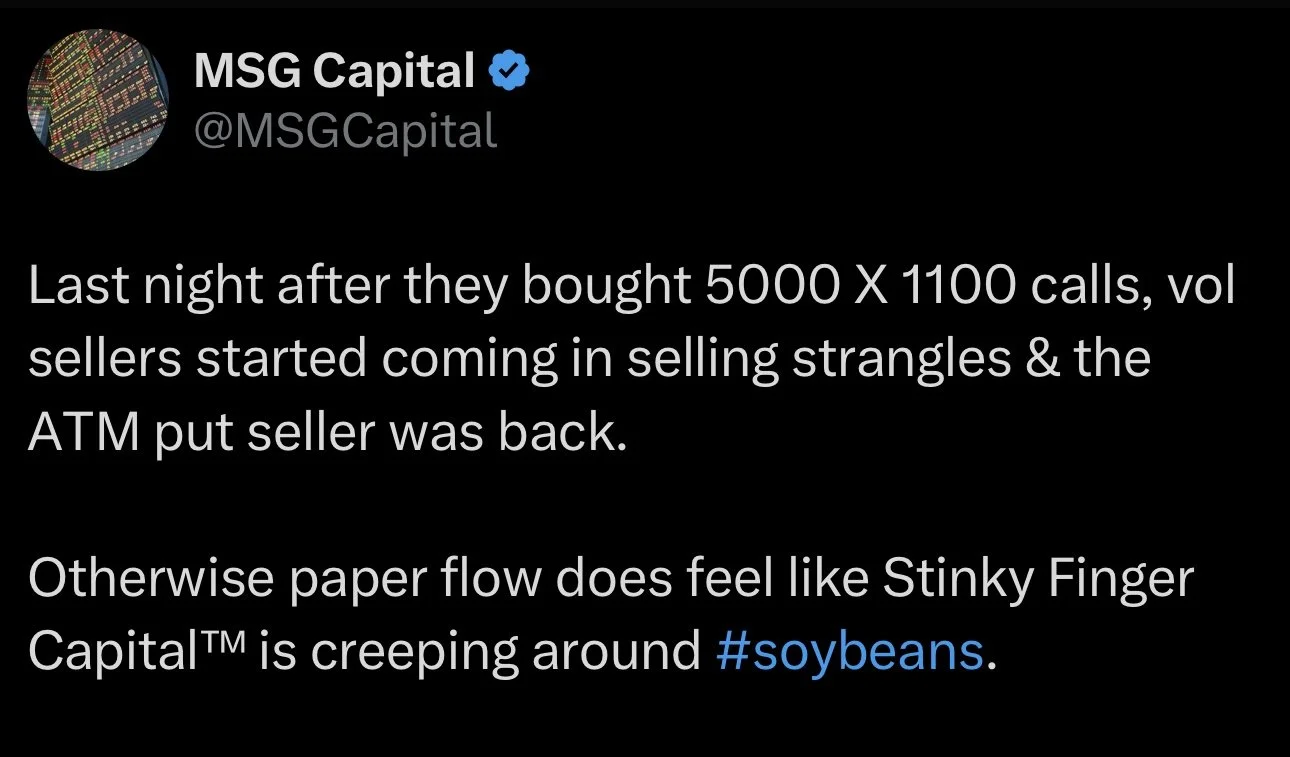
Options Flow
Thousands of traders are selling ATM puts on soybeans.
When you sell a put, you expect it to expire worthless or you are comfortable owning soybeans if your sold put gets assigned.
(When you sell a put you collect the premiuim of the put. Then iif prices drop below your strike price, you are forced to buy soybeans at that strike)
Does big money know something..?
Why would they be doing this? They expect the puts to be worthless or they want to own beans here. Either way, they think soybeans are going higher. Interesting..
Shoutout to MSG Capital on X
Technicals:
Remember how I've been talking about that both July and Nov soybeans were at a decision point in the market?
It is not a coincidence that big money pinned us right in the golden zone retracments ahead of a major report.
The golden zone (green box) is the 50% to 61.8% retracements from the top of the recent rally, all the way down to the April lows.
This is a turning point in the markets. You get confirmation that prices are reversing higher, or falling apart.
This is a must hold level for soybeans.
This report is either going to solidify that soybeans are reversing where they should, or we are going lower.
As a spec, this is where you buy. At support. You don’t chase a rally. You buy when everyone is scared in the golden zone. (Not financial advice)
As a producer, if you sold near the highs when we talked about de-risking, you may consider selling puts as a re-ownership strategy. Call us with questions, as that is not for everyone. (605)295-3100.

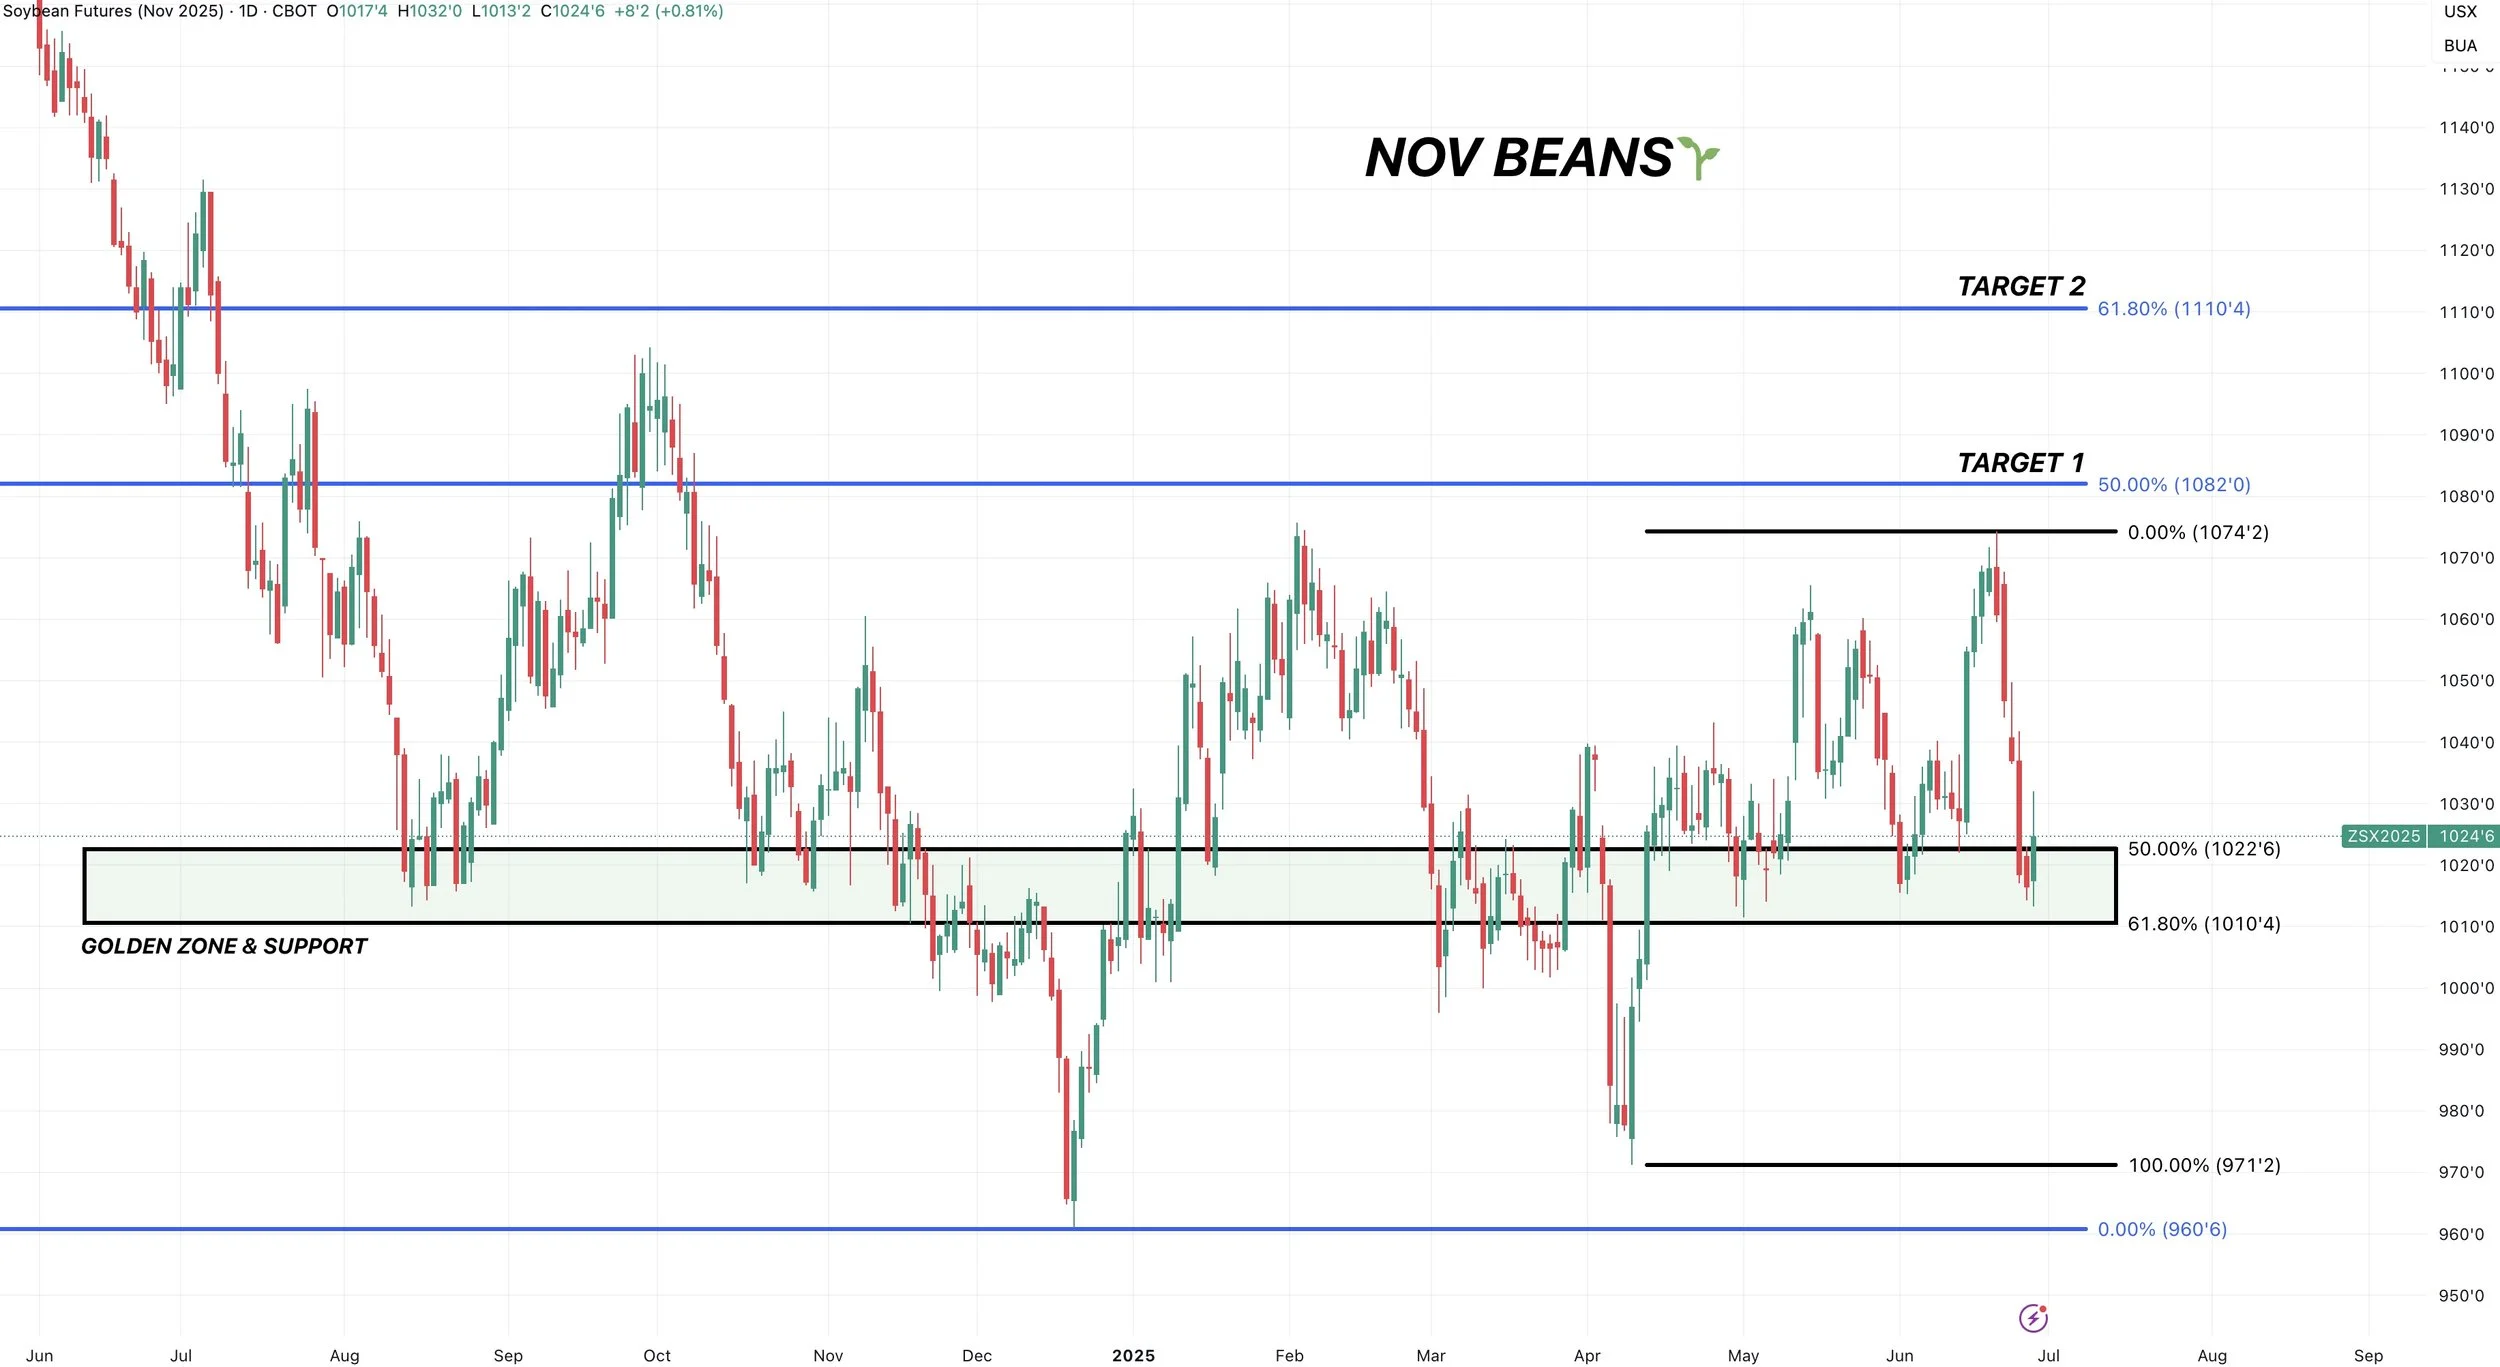
Here is Nov beans.
Right in the golden zone.
Right at old key support.
If this market is going to turn around, this is the spot.
If we fail here, there is very little support beneath us.
Nov beans also posted a reversal (outside up day).
Where we posted new lows, took out yesterday’s lows, but then closed above yesterday’s highs. Good sign as long as the USDA doesn’t spoil things.
1st target still $10.82 for now.
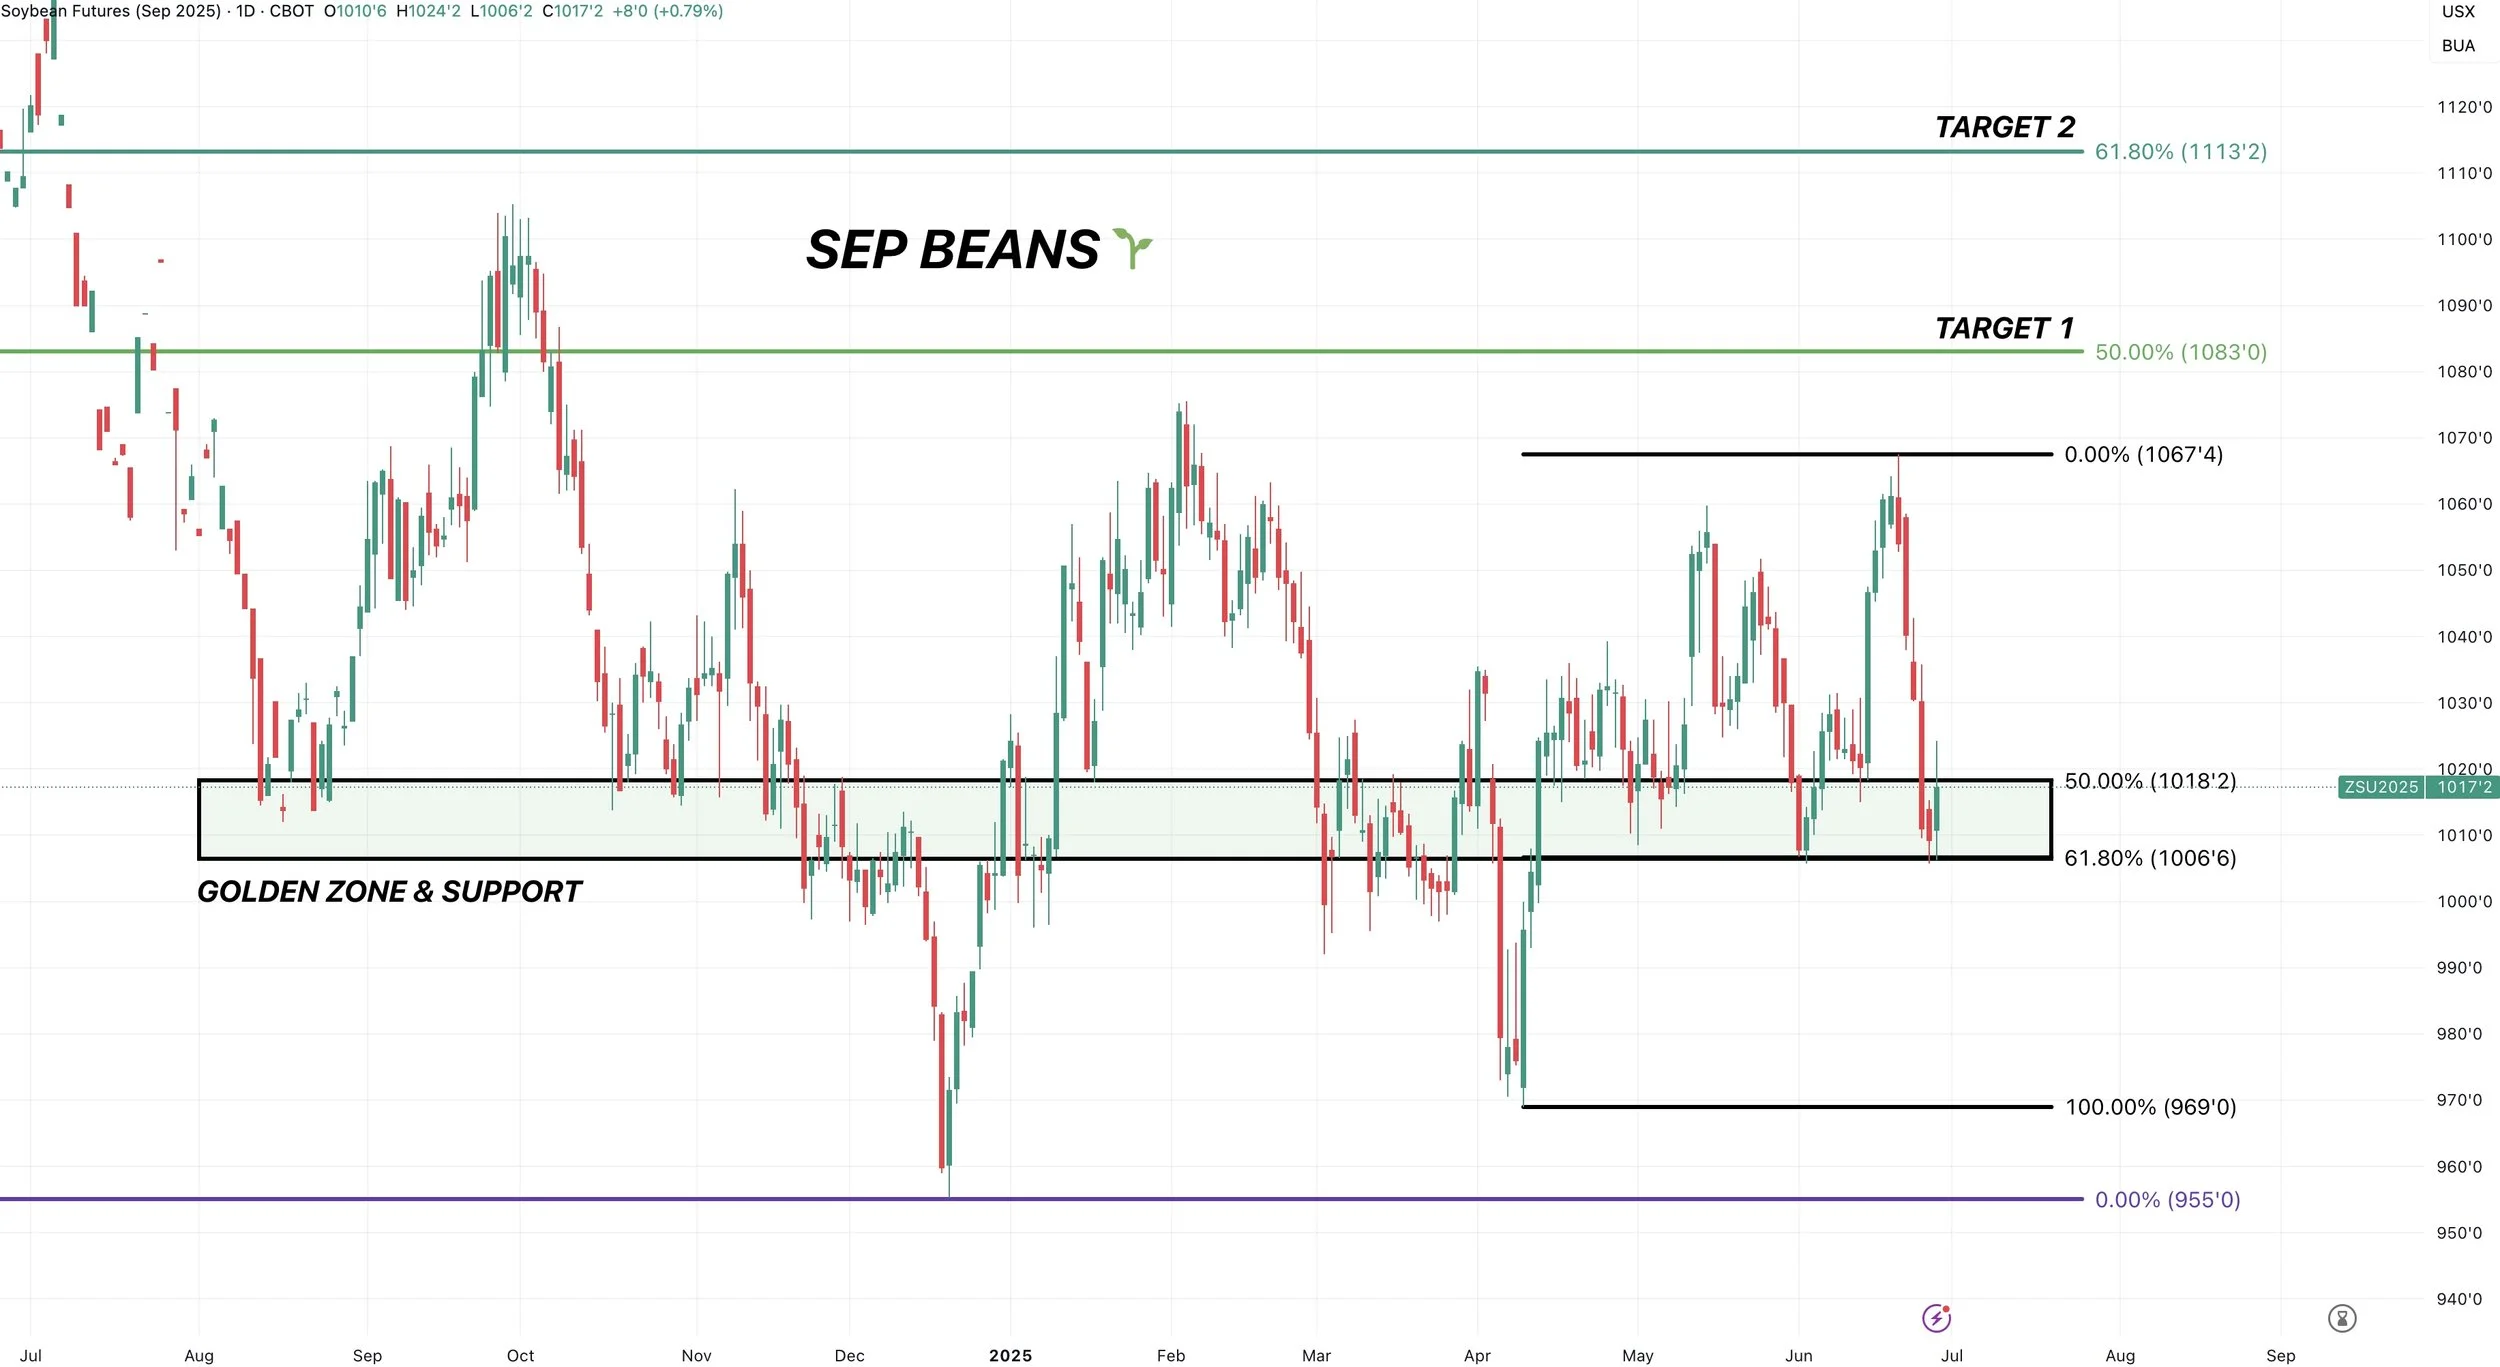
Here is Sep beans.
Exact same set up as July and Nov. In the golden zone.
First target is $10.83
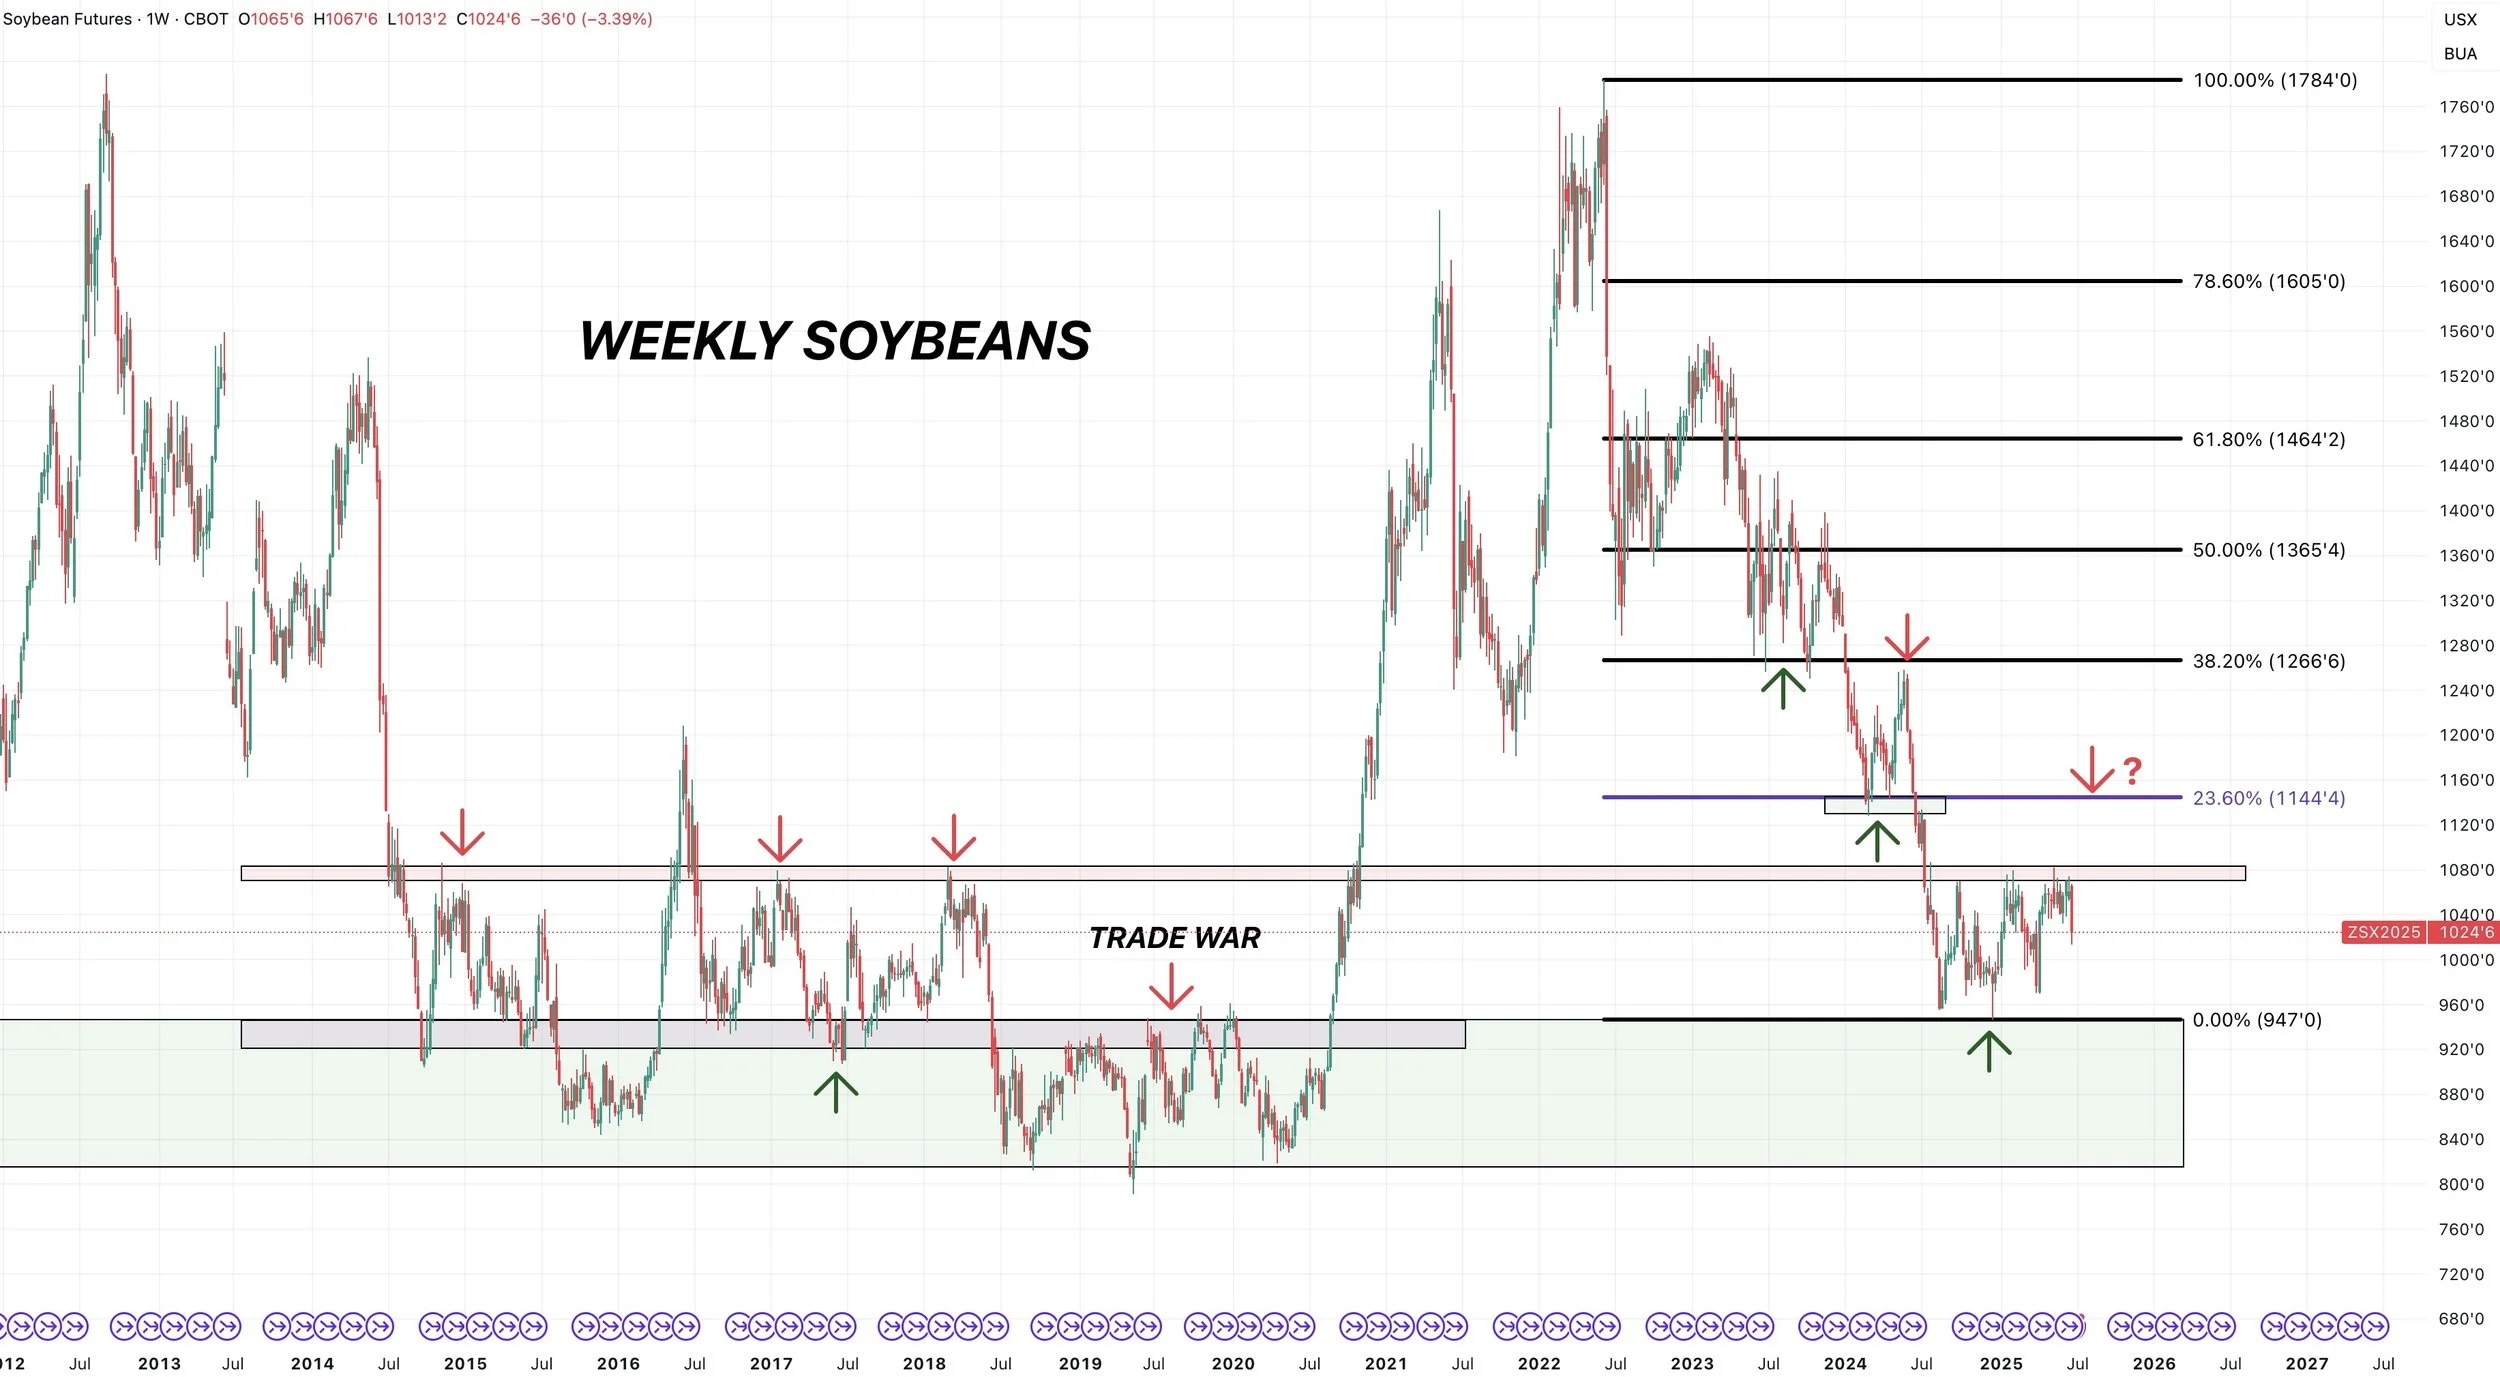
Big Picture Soybean Chart
This chart shows several examples of a simple resistance turning into support (and vice versa).
From 2014-2018 our support turned into resistance during the trade war.
On the May 2024 rally, it stopped at the harvest lows from 2023.
Our recent lows were our resistance during the trade war.
Our recent highs were exactly where we found resistance from 2014-2018.
IF we can bust above that level, the next stop would be around $11.40
$11.40 is our support from 2024. (now resistance).
$11.44 is also the first fib level retracement (38.2%) up to those 2022 highs of $17.84.
We will be taking risk off well before hand. This does not mean beans have to rally to $11.40. But if we do get some big rally for whatever reason, this is another spot where we would want to de-risk.
I might be getting way ahead of myself, but just wanted to share the long term big picture outlook if we do happen to break the recent highs.
Wheat
Fundamentals:
Nothing new to add on wheat today as my thought process hasn’t changed.
Will have to see what the report holds.
The funds are still heavily short but did just cover half of their short position in KC wheat. Going from short -80k to now short -43k. Which is still one of their biggest shorts ever depsite covering half of it.
Once winter harvest pressure is behind us, the funds shouldn’t have as many reasons to continue holding the huge short position.
We are the time period where wheat isn’t suppose to rally.
Technicals:
Chicago wheat is still holding the bottom of this channel.
Need to continue to do so.

KC at support here. Need to hold or next stop is contract lows.
Want to hold contract lows or we will be trying to catch a falling knife.
If you did not de-risk by the recent target, you could eye the green box as our point of interest.

Past Sell or Protection Signals
We recently incorporated these. Here are our past signals.
June 5th: 🐮
Cattle sell signal & hedge alert.
June 2nd: 🌾
MPLS wheat sell signal.
April 10th: 🌽
Old crop corn sell signal.
March 19th: 🐮
Cattle hedge & sell signal.
Feb 18th: 🌽 🌾
Old crop KC wheat & old crop corn signal.
Jan 23rd: 🌽 🌱
Corn & beans old crop sell signal.
CLICK HERE TO VIEW
Jan 15th: 🌽 🌱
Corn & beans hedge alert/sell signal.
Jan 2nd: 🐮
Cattle hedge alert at new all-time highs & target.
Dec 11th: 🌽
Corn sell signal at $4.51 200-day MA
CLICK HERE TO VIEW
Oct 2nd: 🌾
Wheat sell signal at $6.12 target
Sep 30th: 🌽
Corn protection signal at $4.23-26
Sep 27th: 🌱
Soybean sell & protection signal at $10.65
Sep 13th: 🌾
Wheat sell signal at $5.98
May 22nd: 🌾
Wheat sell signal when wheat traded +$7.00
Want to Talk?
Our phones are open 24/7 for you guys if you ever need anything or want to discuss your operation.
Hedge Account
Interested in a hedge account? Use the link below to set up an account or shoot Jeremey a call at (605)295-3100.
Check Out Past Updates
6/26/25
FIREWORKS OR BLOOD BATH MONDAY?
6/25/25
GRAINS COLLAPSING AHEAD OF JUNE REPORT
6/24/25
CORN CONTINUES SELL OFF. MAJOR USDA REPORT COMING
6/23/25
CORN CAN GO LOWER, BUT NOT FOR FOREVER
6/20/25
WHO SHOULD REWARD THE WHEAT & SOYBEAN RALLY?
6/18/25
COMPLETE CHART BREAKDOWNS
6/17/25
SOYBEANS CONTINUE BREAKOUT. NEARING SELL SIGNAL
6/16/25
CORN HAMMERED. EPA GAME CHANGER IN BEANS?
6/13/25
SOYBEANS RALLY, CHARTS, BALANCE SHEETS & MORE
6/12/25
USDA NON-EVENT. WHAT’S NEXT?
6/11/25
DIVERGENCE & SEASONAL SELL OFF?
6/10/25
BEING PATIENT VS BALANCING YOUR RISK
6/9/25
WHAT IF WE DON’T GET A WEATHER SCARE?
6/5/25
CORN & BEANS HOLDING CRUCIAL SPOTS
6/5/25
CATTLE SELL SIGNAL & HEDGE ALERT
6/4/25
HOW UNKNOWNS IMPACT MARKETING DECISIONS
6/3/25
KEY SPOTS ON THE CHARTS FOR CORN & BEANS
6/2/25
NEW LOWS IN CORN. DE-RISKING MPLS WHEAT
6/2/25
SPRING WHEAT SELL SIGNAL
5/30/25
SEASONAL RALLY STILL IN THE CARDS?
5/29/25
WHAT IS YOUR PLAN IF WE DO NOT RALLY?
5/28/25
ZERO PREMIUM IN THE GRAIN MARKETS
5/27/25
CORN CONDITIONS DISAPPOINT & JUNE OUTLOOK IMPROVES
5/23/25
TARIFFS SPOOK MARKET. GAME PLAN MOVING FORWARD
5/22/25
CHART BREAKDOWNS & TARGETS
5/21/25
RISK TO THE UPSIDE WITH WEATHER?
5/20/25
WHEAT SHORT COVERING & HISTORY OF YIELD CHANGES
5/19/25
ANYONE LEFT TO SELL WHEAT? 181 CORN YIELD POSSIBLE?
5/16/25
FUNDS SHORT CORN. MARKETS WAITING ON WEATHER
5/15/25
BEANS HAMMERED ON RUMOR & WHEAT FINDING LIFE
5/14/25
DECISIONS & POSSIBILITIES IN GRAINS
5/13/25
GRAINS RALLY OFF LOWS
5/12/25
USDA REPORT. HOW THIS CHANGES THINGS
5/9/25
BIGGEST RISKS IN USDA REPORT
5/8/25
USDA MONDAY & HISTORY OF WEATHER RALLIES
5/7/25
NEW 2025 LOWS FOR CORN
5/6/25
WHAT’S A SUMMER RALLY LOOK LIKE?
5/5/25
CORN ERASES ENTIRE APRIL RALLY
5/2/25
SELL INTO UNCERTAINTY. NOT KNOWN FACTORS
5/1/25
THE CASE AGAINST A FEB TOP IN CORN
4/30/25
APPROACHING KEY TIME PERIOD FOR GRAINS
4/29/25
PLANTING & FIRST NOTICE DAY PRESSURE. CORN CLOSE TO BOTTOM?
4/28/25
CAPTURING INVERSE & SEASONAL PREPARATION
4/25/25
HOW OFTEN DOES CORN NOT BREAK APRIL HIGHS?
4/24/25
KNOW WHEN TO SELL. BEANS BREAK 200-DAY FIRST TIME IN 483 DAYS
4/23/25
MONEY FLOW & DROUGHT CARDS
4/22/25
CRUCIAL SPOT FOR CORN & BEANS
4/21/25
NO PLANTING THREAT YET
4/18/25
POTENTIAL OPPORTUNITIES, BASIS CONTRACTS & STRATEGIES
4/16/25
HOW YIELD IMPACTS CARRYOUT. MAJOR SPOT FOR SOYBEANS
4/15/25
TOTAL CHART BREAKDOWNS & TARGETS
4/14/25
TECHNICAL SELLING IN GRAINS
4/11/25
SPECIFIC GRAIN MARKETING DECISIONS
4/10/25
USDA REPORT. HOW THIS IMPACTS CORN
4/9/25
TARIFFS GIVE. TARIFFS TAKE
4/8/25
CORN’S DIVERGING STRENGTH
4/7/25
SOLID PRICE ACTION DESPITE OUTSIDE FEAR
4/4/25
CORN PRICE ACTION SPEAKS VOLUME. ANY HOPE LEFT FOR SOYBEANS?
4/3/25
WHAT IS LEFT FOR CORN BEARS? TRADE WAR: CHARTS HOLDING SUPPORT
4/2/25
SHOULD UNKNOWNS KEEP A FLOOR UNDER GRAIN PRICES?
4/1/25
HOW DO ACRES IMPACT FUTURE OF THE GRAINS?
3/31/25
USDA REPORT: NOW WHAT?
3/28/25
ALL EYES ON USDA
3/27/25
PRE-USDA POSITIONING. DON’T GIVE GRAIN AWAY
3/26/25
HISTORY OF MARCH INTENTIONS. SOYBEANS UNDERVALUED?
3/25/25
6 DAYS UNTIL MAJOR USDA REPORT
3/24/25
HOW TO POSITION YOURSELF BEFORE PLANTING
3/21/25
REASONS TO BE OPTIMISTIC IN GRAINS?
3/20/25
WAS THAT THE BOTTOM IN CORN?
3/19/25
THE PATH HIGHER & THE DOWNSIDE RISKS IN GRAINS
3/18/25
SEASONALS, CATTLE HEDGE, CHARTS & DROUGHT?
3/17/25
WHEAT RALLIES. DON’T GET BACKED INTO A CORNER
3/14/25
MARCH 31ST REPORT THOUGHTS & WHAT’S NEXT FOR GRAINS
3/13/25
EXPLAINING RE-OWNERSHIP VS COURAGE CALLS
3/12/25
TARIFF FEARS. EU, CANADA, & ETHANOL
3/11/25
USDA SNOOZE. RECORD FUND SELLING A CONCERN?
3/10/25
USDA TOMORROW. GETTING COMFORTABLE IN MARKETING
3/7/25
HOW TIGHT IS THE WORLD & US SITUATION?
3/6/25
TARIFFS PUSHED BACK. FUTURE OPPORTUNITIES?
3/5/25
IS GRAINS BIGGEST RISK WEAK CRUDE & DEFLATION?
3/4/25
TRADE WAR BEGINS. 8TH DAY OF PAIN FOR GRAINS
3/3/25
TARIFFS ON TOMORROW. BUY SIGNAL
3/3/25
BUY SIGNAL
2/28/25
WHEN WILL THE BLEEDING STOP?
2/27/25
CORN AT CRITICAL SPOT. USDA ACRE REPORT. WAY TOO EARLY DROUGHT TALK
2/26/25
HISTORY SUGGESTS CORN TOP ISN’T IN? ACRE OUTLOOK TOMORROW
2/25/25
POSITIVE CLOSE. WHAT TO KNOW ABOUT USDA OUTLOOK
2/24/25
USDA OUTLOOK, FIRST NOTICE DAY & BRAZIL
2/21/25
WHAT TO EXPECT MOVING FORWARD IN GRAINS
2/20/25
FIRST NOTICE DAY CONCERNS. MASSIVE CORN ACRES OR NOT?
2/19/25
HOW TIGHT IS THE CORN SITUATION?
2/18/25
MORE DETAILS ON TODAYS SELL SIGNAL
2/18/25
OLD CROP KC WHEAT & CORN SELL SIGNAL
2/14/25
WHEAT BREAKING OUT ON WEATHER RISK. TECHNICALS & FUNDAMENTALS
2/12/25
GLOBAL GRAIN SITUATION, ACRE TALK, CHARTS & MORE
2/11/25
USDA: NOT A BEARISH REPORT. DISAPPOINTING PRICE ACTION
2/10/25
USDA TOMORROW. LONG TERM PATH FOR SUB 10% CORN STOCKS TO USE?
2/7/25
WHY WOULD THE FUNDS EXIT THEIR LONGS?
2/6/25
WHEAT FINALLY CATCHING A BID
2/5/25
COMPLETE THOUGHTS ON MARKETS: BACK & FORTH DISCUSSION
2/4/25
STRONG JANUARY LEAD TO STRONG YEAR? TARIFFS, CHARTS & MORE
2/3/25
TARIFFS PUSHED BACK
1/31/25
TARIFF NEWS ALL OVER THE PLACE. ARE YOU PREPARED FOR POSSIBILITIES?
1/30/25
WHEAT BULL ARGUMENT. TRUMP ADDS TARIFFS
1/29/25
CORN APPROACHES $5.00
1/28/25
TARIFFS, CORN FUNDS, SOUTH AMERICA & MORE
1/27/25
HEALTHY CORRECTION WE TALKED ABOUT & TARIFF NEWS
1/24/25
GRAINS DUE FOR SHORT TERM CORRECTION?
1/23/25
OUR ENTIRE NEW CROP SALES THOUGHTS & OLD CROP SELL SIGNAL
1/22/25
GRAINS TAKE A BREATHER. IS CORN IN A BULL OR BEAR MARKET?
1/21/25
HUGE DAY IN GRAINS. WHAT TO DO WITH OLD CROP VS NEW CROP
Read More
1/20/25
VIDEO CHART UPDATE
1/17/25
TRUMP, CHINA, ARGY & USING THE SPREADS INVERSE
1/16/25
OLD CROP LEADS US LOWER. MARKETING THOUGHTS
1/15/25
SIGNAL & HEDGE ALERT QUESTIONS EXPLAINED. IS $6 CORN EVEN POSSIBLE?
1/14/25
MORE DETAILS ON TODAYS HEDGE ALERT & SELL SIGNAL
1/14/25
CORN & SOYBEANS HEDGE ALERT/SELL SIGNAL
1/13/25
USDA GAME CHANGER OR NOT?
1/10/25
BULLISH USDA FOR CORN & BEANS
1/9/25
USDA OUT TOMORROW
1/8/25
2 DAYS UNTIL USDA. BE PREPARED
1/7/25
THE HISTORY OF THE JAN USDA & MORE
1/6/25
MAJOR USDA REPORT FRIDAY
Read More
1/3/25
UGLY DAY ACROSS THE GRAINS
1/2/25