
SOYBEANS RALLY, CHARTS, BALANCE SHEETS & MORE
MARKET UPDATE
You can scroll to read the usual update as well. As the written version is the exact same as the video.
Timestamps for video:
Overview: 0:00min
Corn Fundamentals: 1:30min
Corn Charts: 5:35min
Bean Fundamentals: 7:40min
Bean Charts: 9:00min
Wheat: 11:15min
Want to talk about your situation?
(605)295-3100
Futures Prices Close

Overview
Grains higher across the board as soybeans and the wheat market soar off the back of a few headlines.
Israel & Iran
First, we had Israel strike Iran last night. Iran said they are preparing to strike back. So we have a full blown war happening in the middle east.
Altough no, war in the middle east does not effect grains directly.
It adds uncertainty and commodities can be seen as a safe play for money to flow into. So this helped add some support to the wheat market.
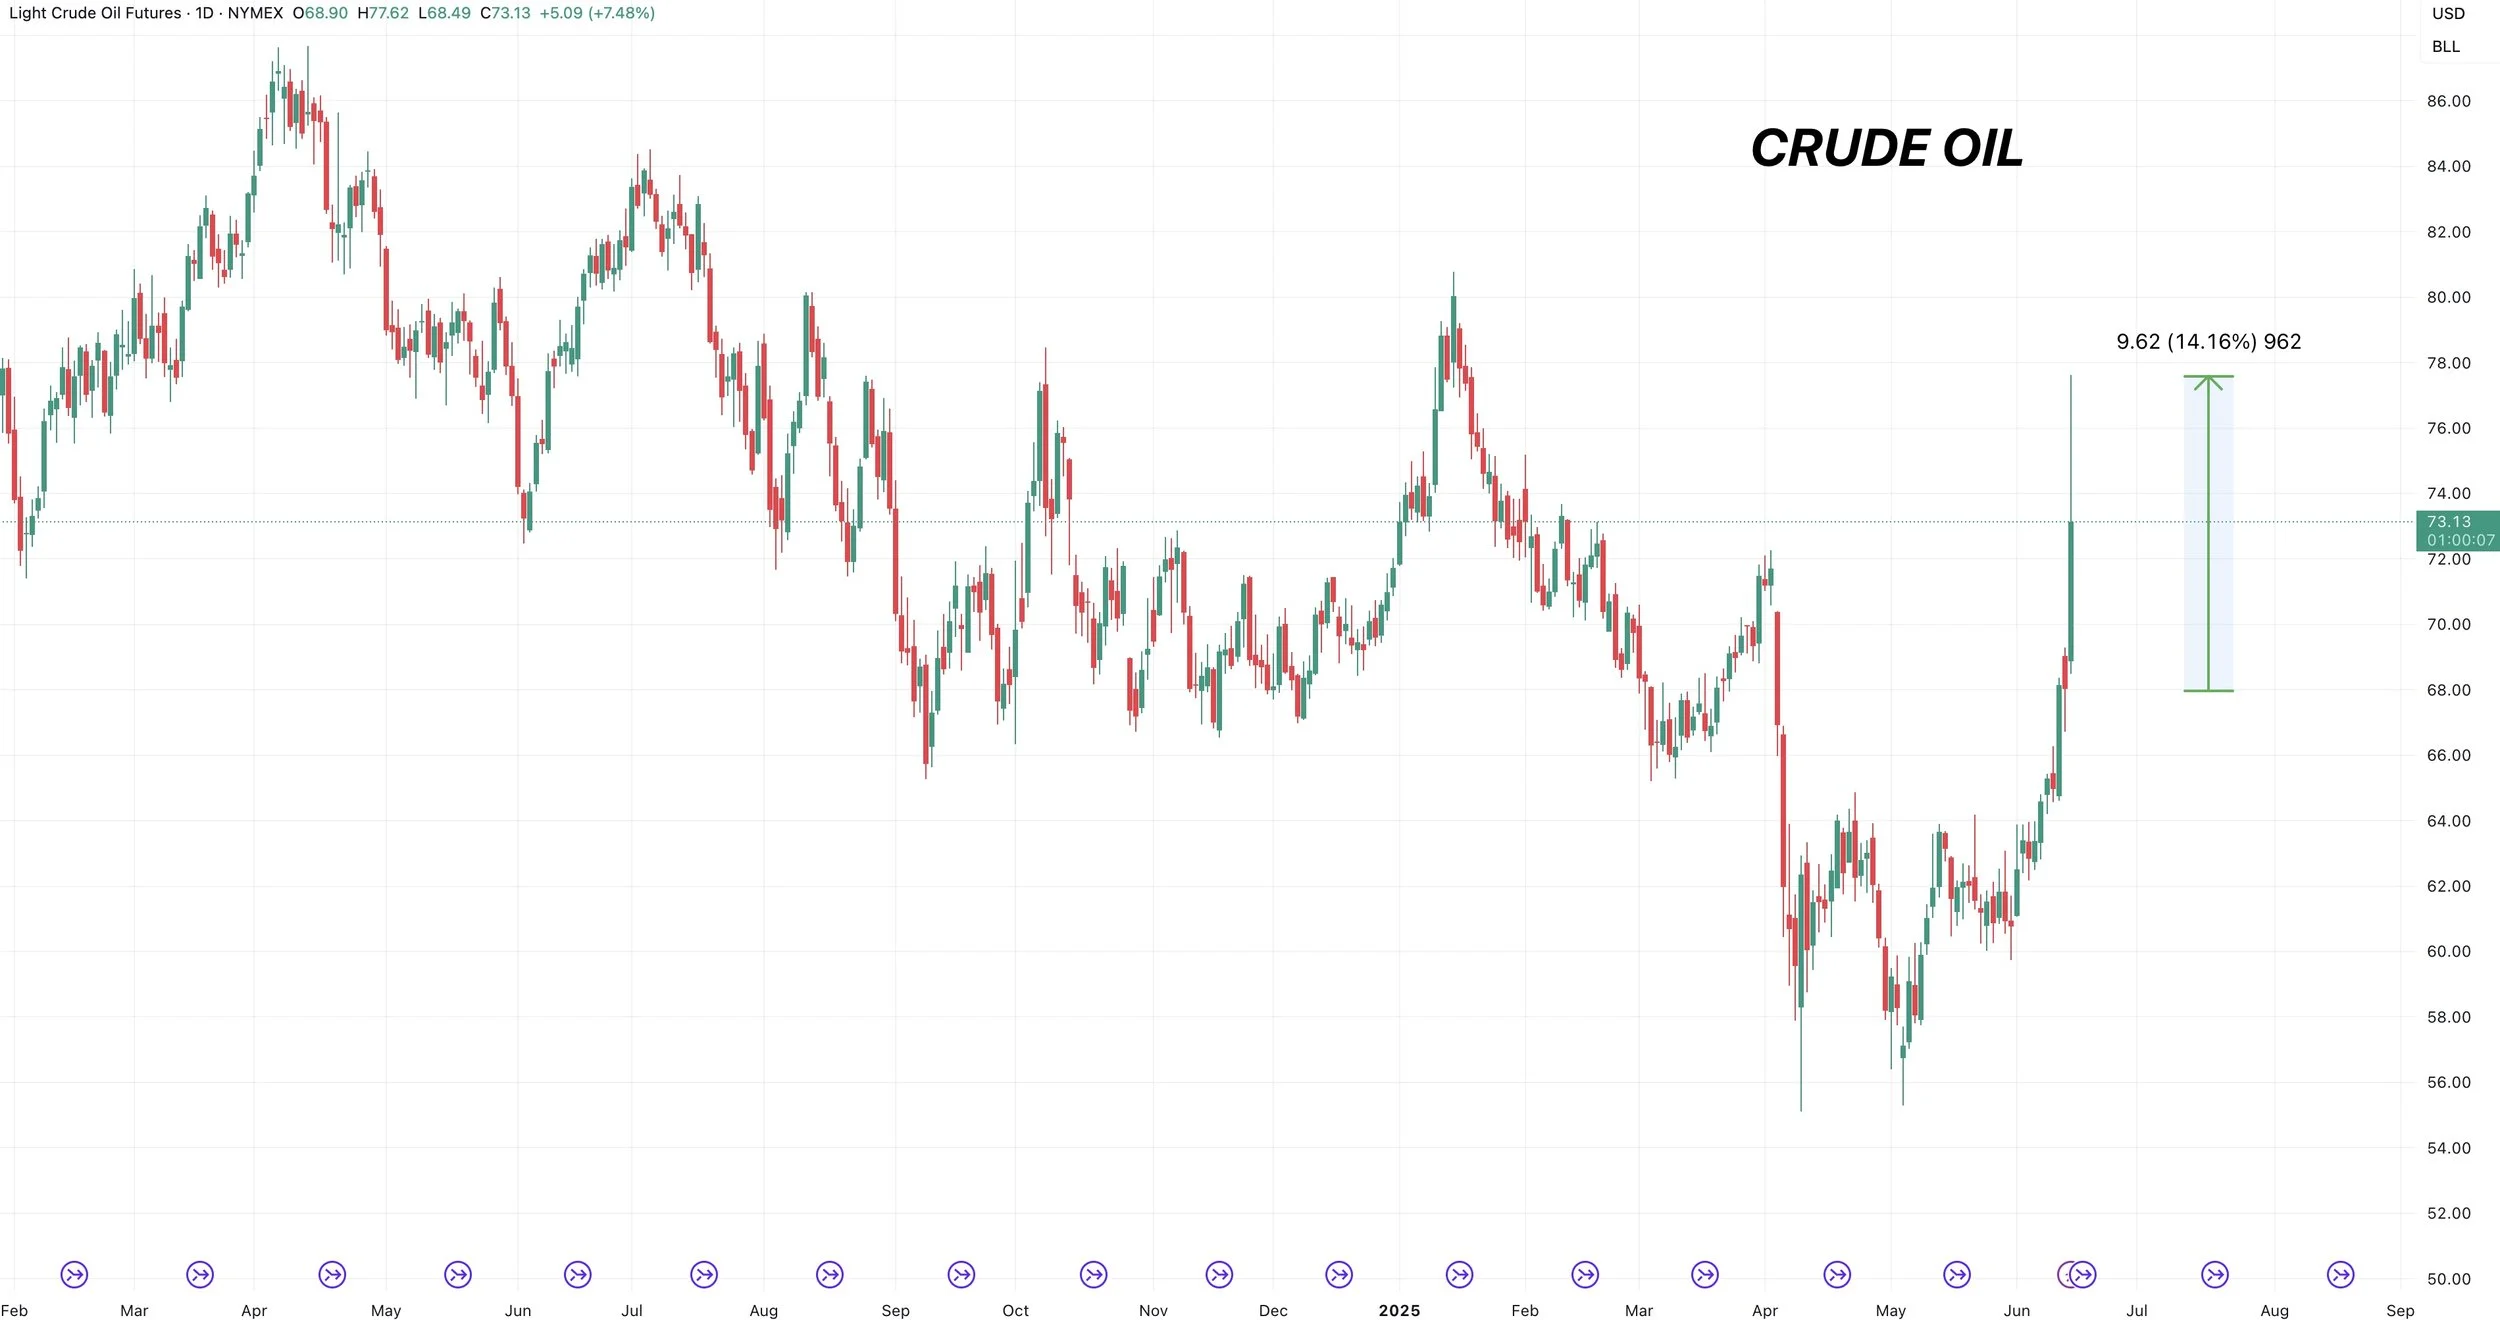
This also led to crude oil spiking up to as much as +14% overnight. Now up over +30% in a month.
RVO News
Soybeans just posted their best day since January.
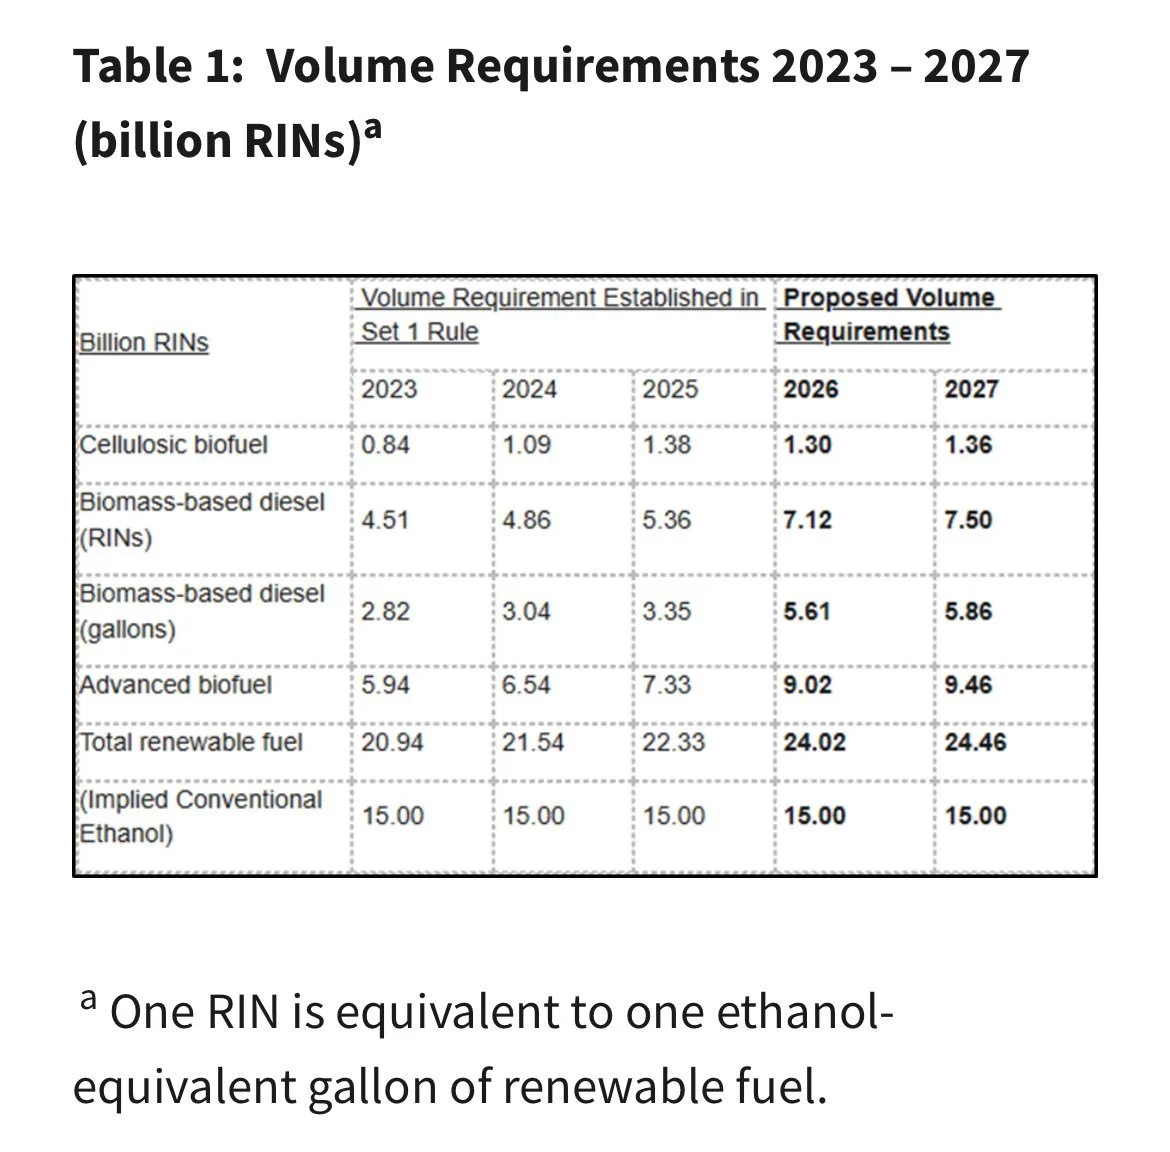
The reason for the rally was that the EPA released it's proposed biofuel blending requirements for 2026 and 2027.
Reports say that they set the number at 5.61 billion gallons for 2026. This was above the industry requests for 5.25 billion.
That is a massive number. Above the current 3.35 billion gallons this year.
Remember the rumors that just made soybeans sell off?
The rumor was that the number would be 4.65 billion gallons.
So the rumor was pretty much completely false.
Solid news for the soybean market.
Here was the rumor from yesterday:

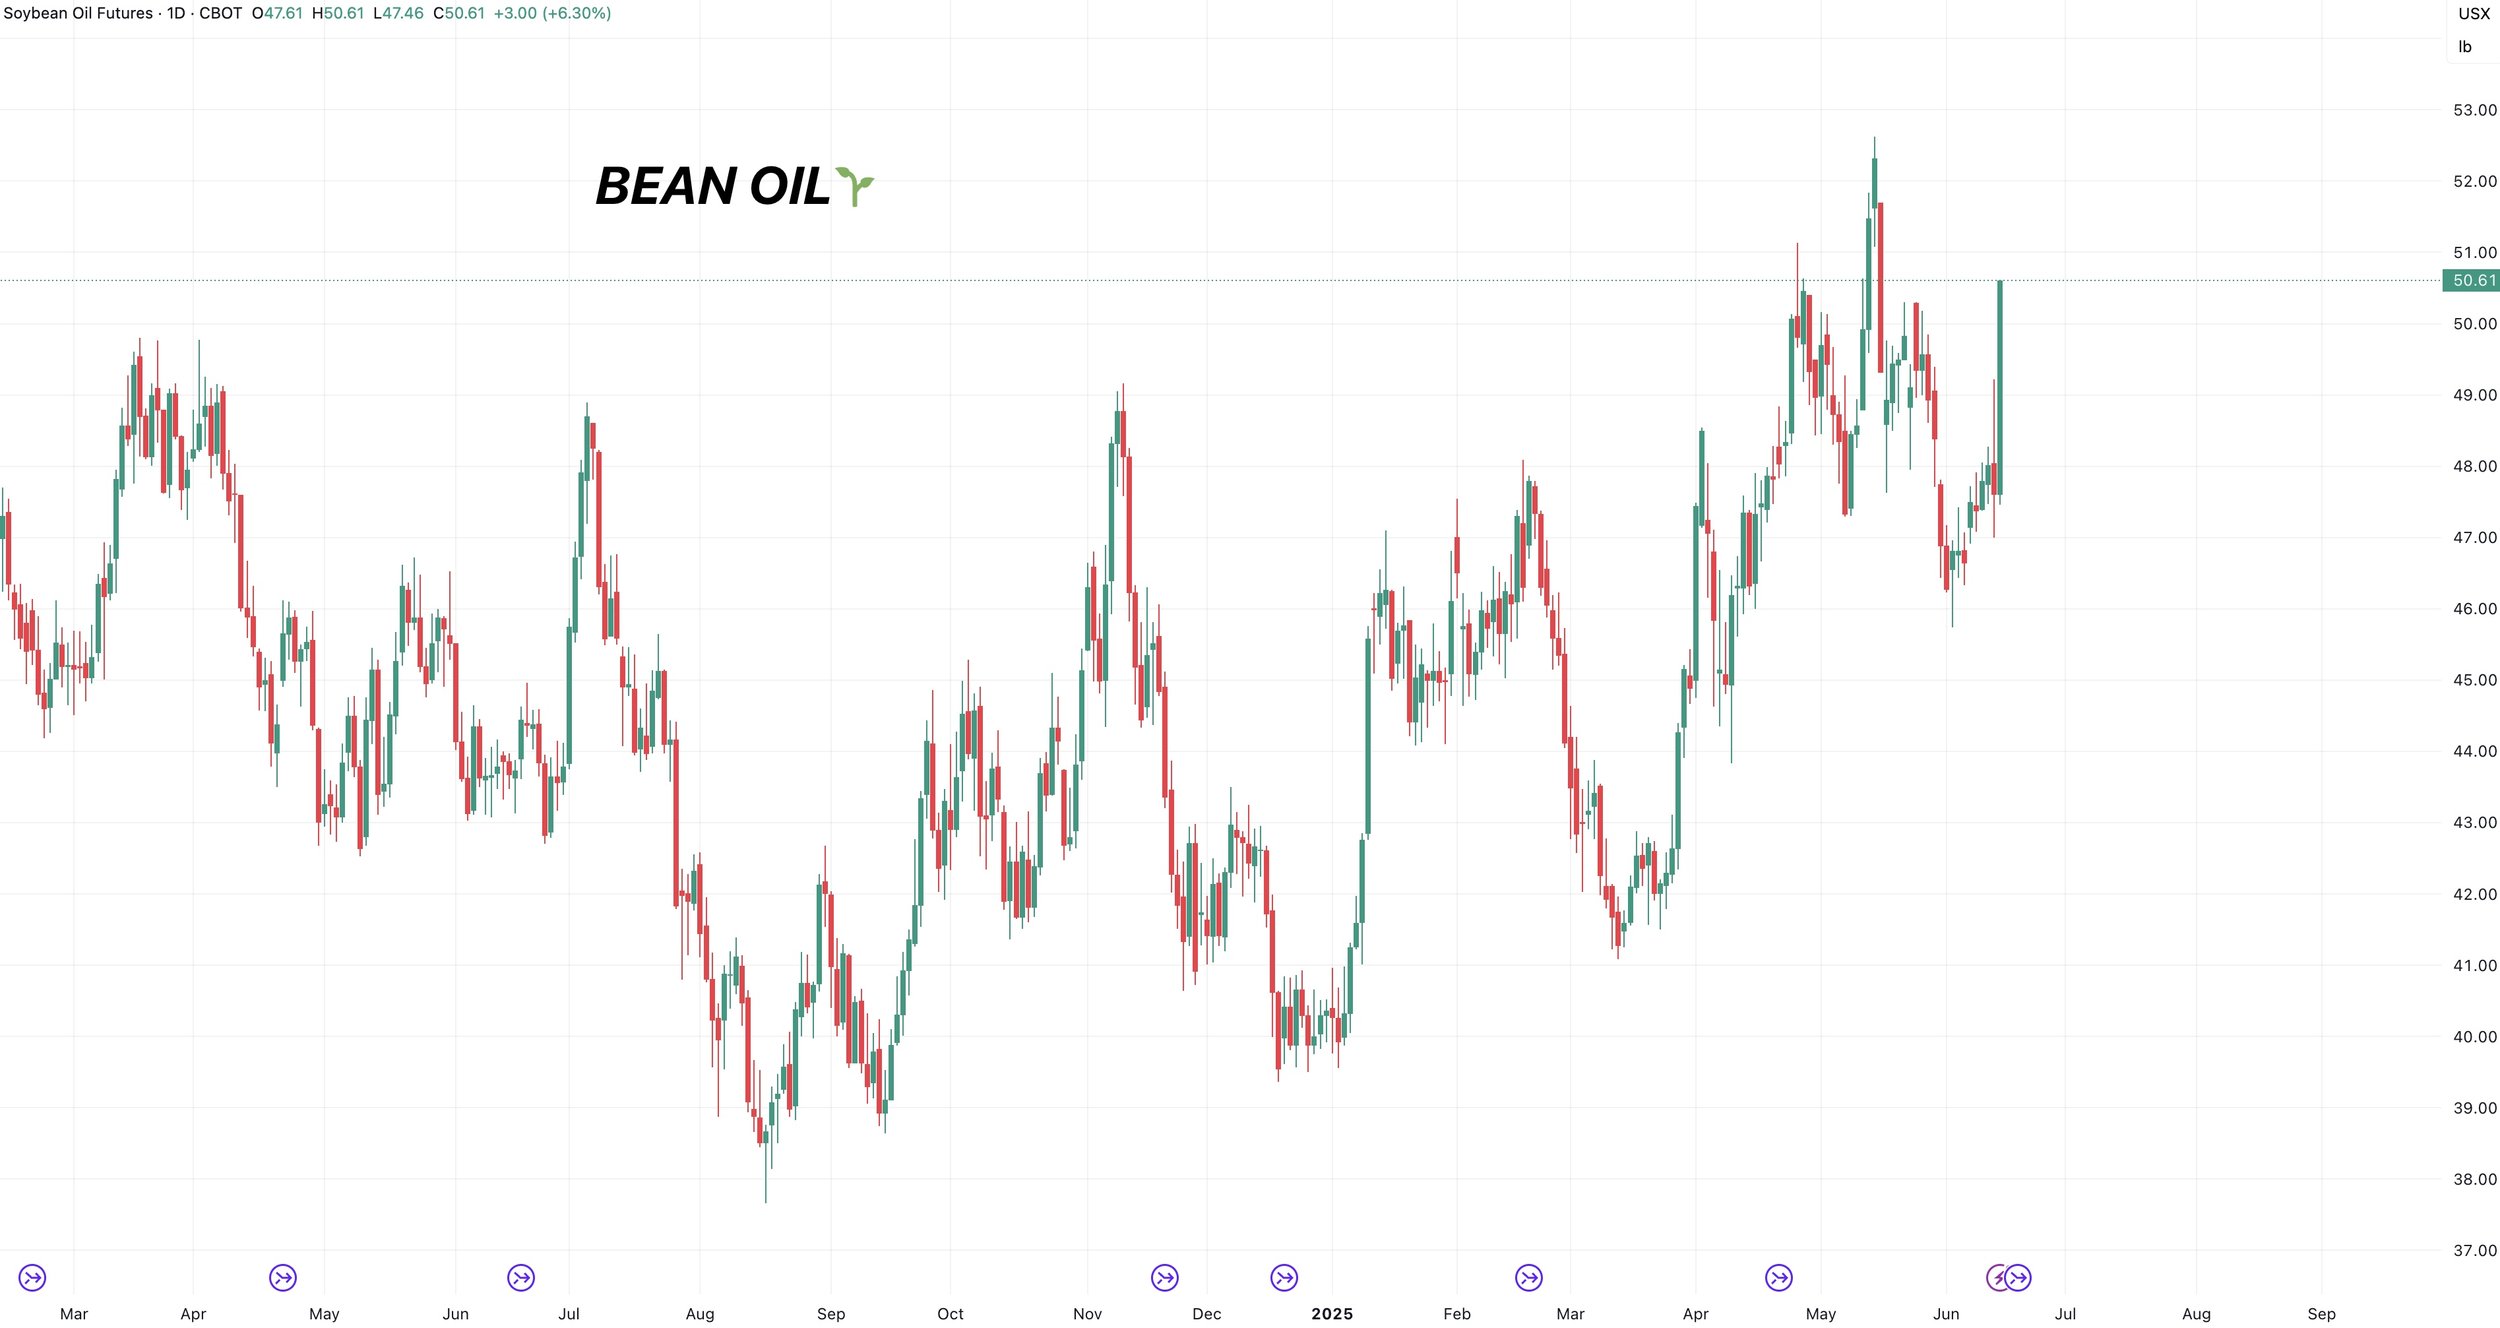
This led to soybean oil trading limit up today.
Up +6.30% on the day.
Todays Main Takeaways
Corn
Fundamentals:
We have world war III, crude oil rallying, soybeans & wheat rallying.
Meanwhile.. Dec corn closed just 2 cents higher.
Most would consider this disappointing. Especially after the USDA gave us some friendly numbers yesterday.
Let's dive into the USDA report and fundamental situation for corn.
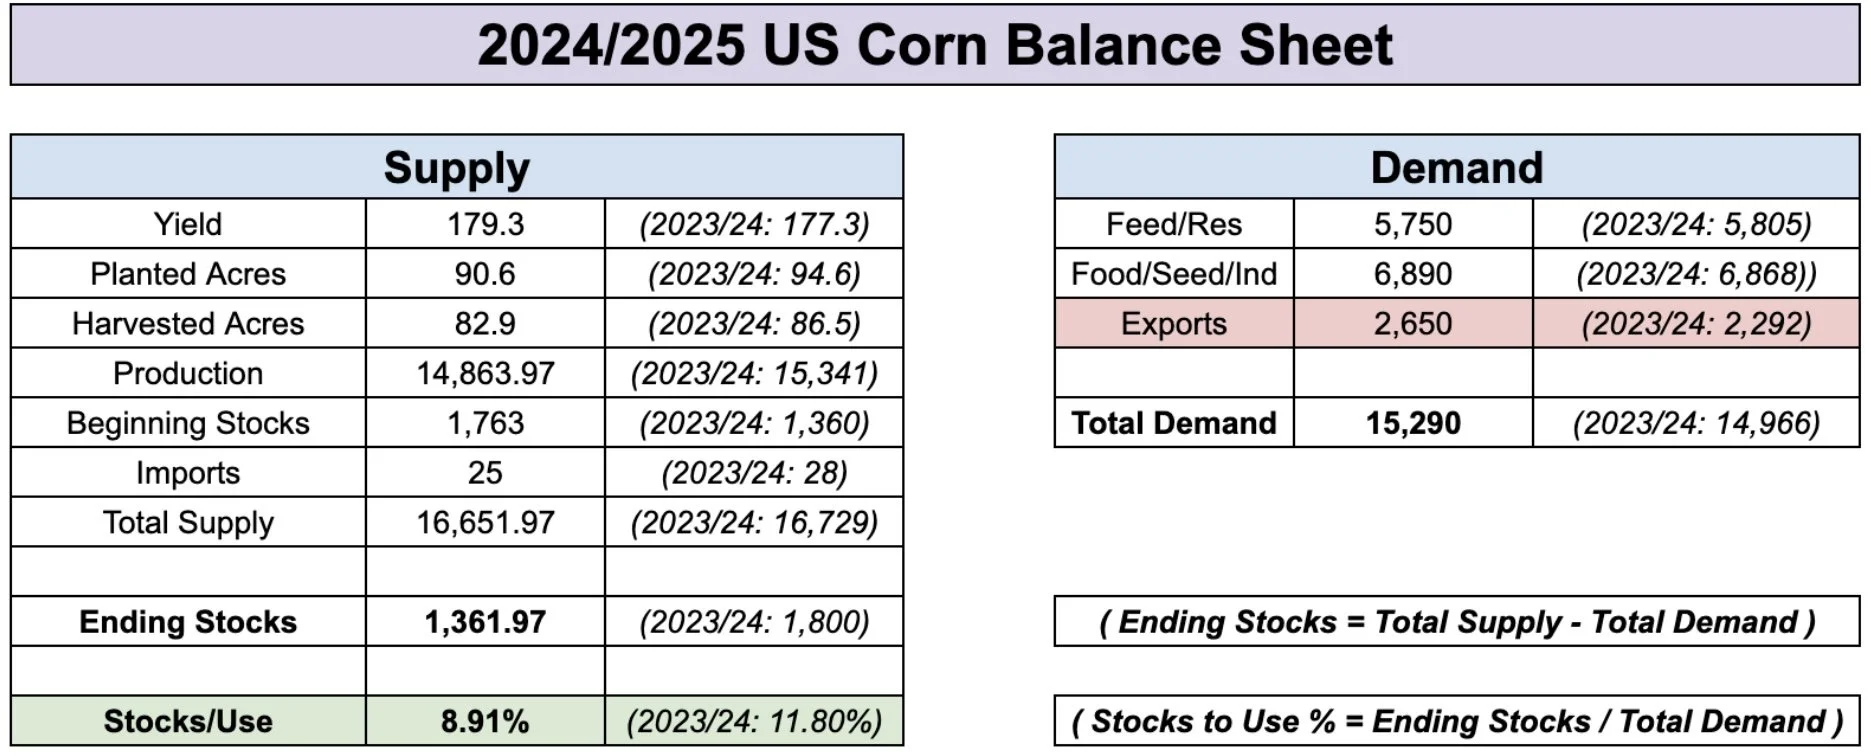
First, the USDA raised exports for old crop (+50 million bu).
This dropped old crop carryout to 1.36 billion bu and dropped out stocks to use ratio down to 8.9%.
Here is the balance sheet comparisons from the May to June report.
Old Crop - June
Old Crop - May
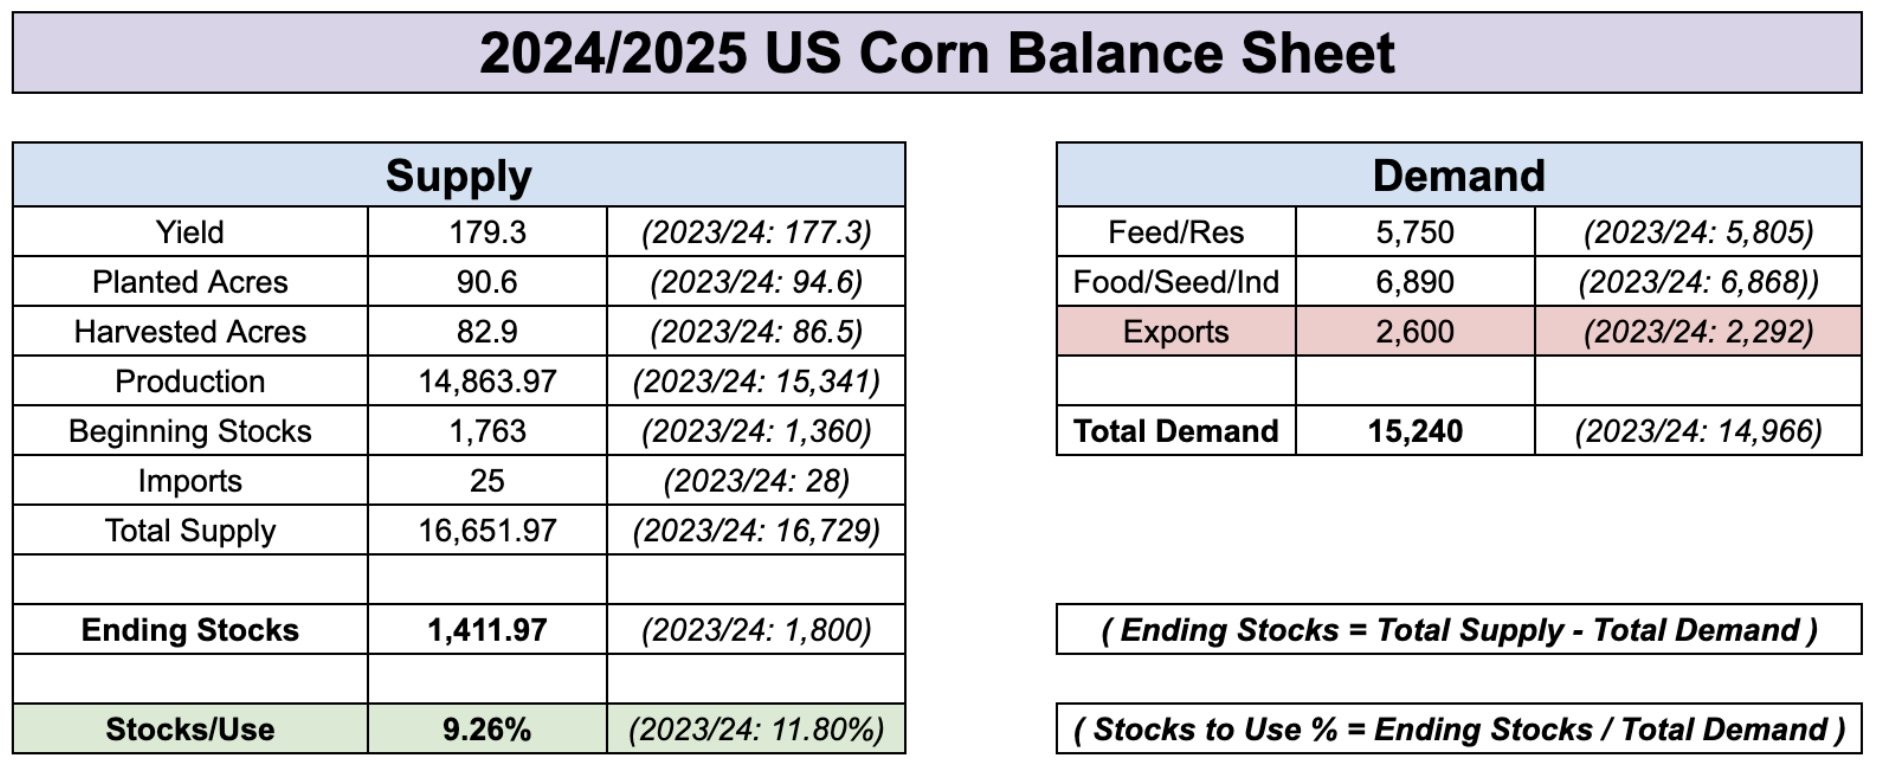
New Crop - June
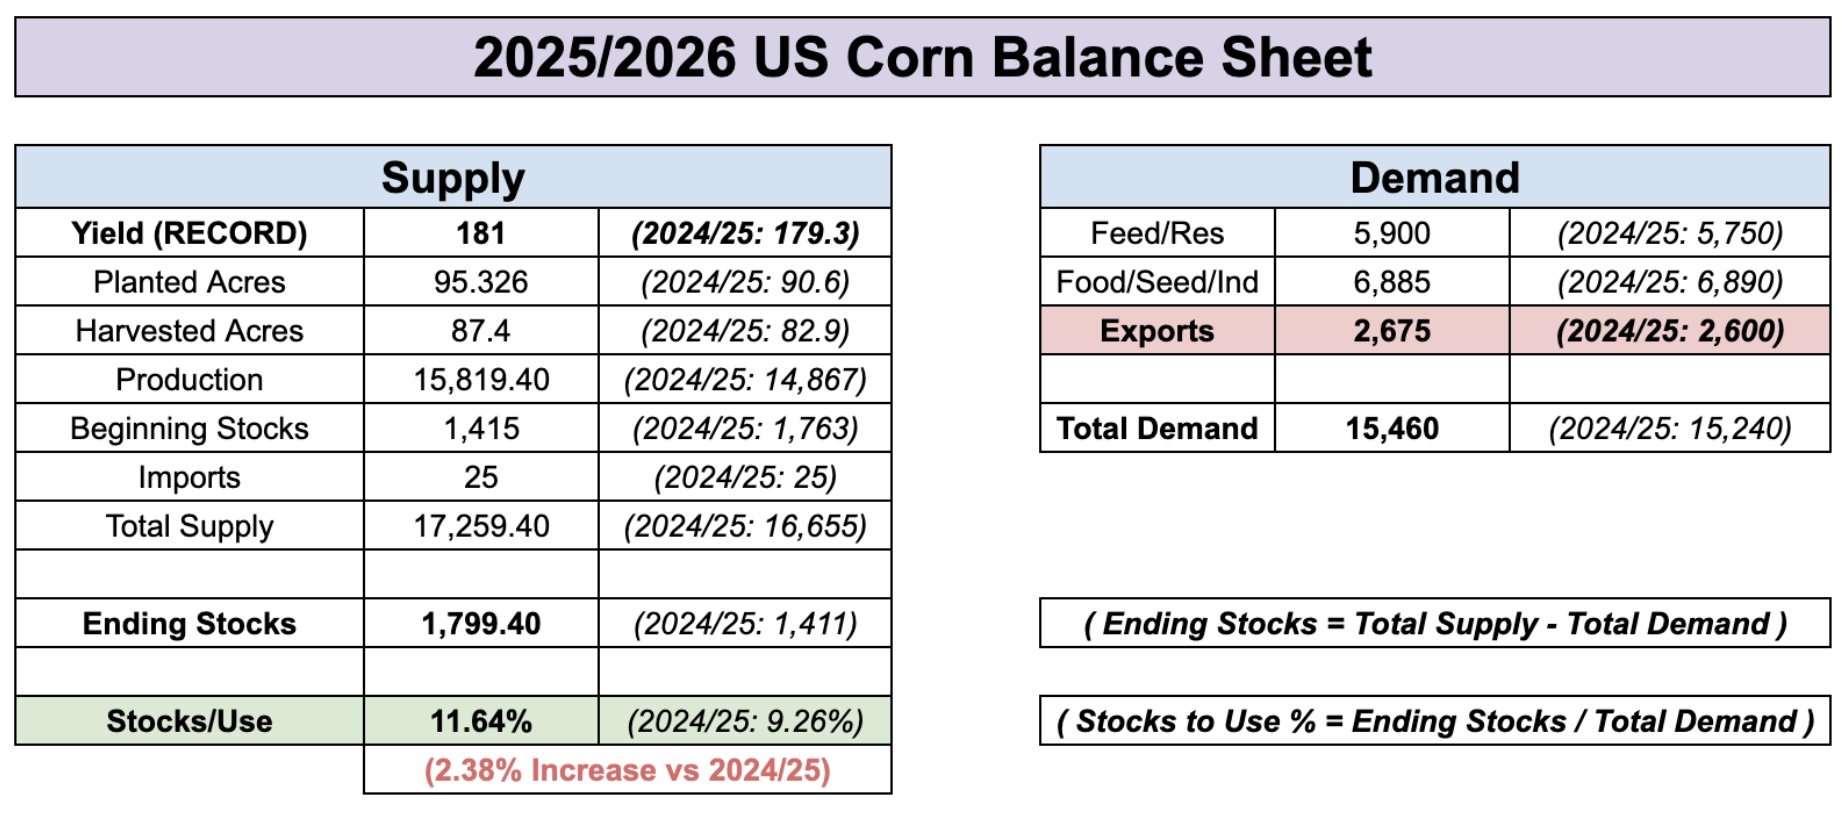
New Crop - May
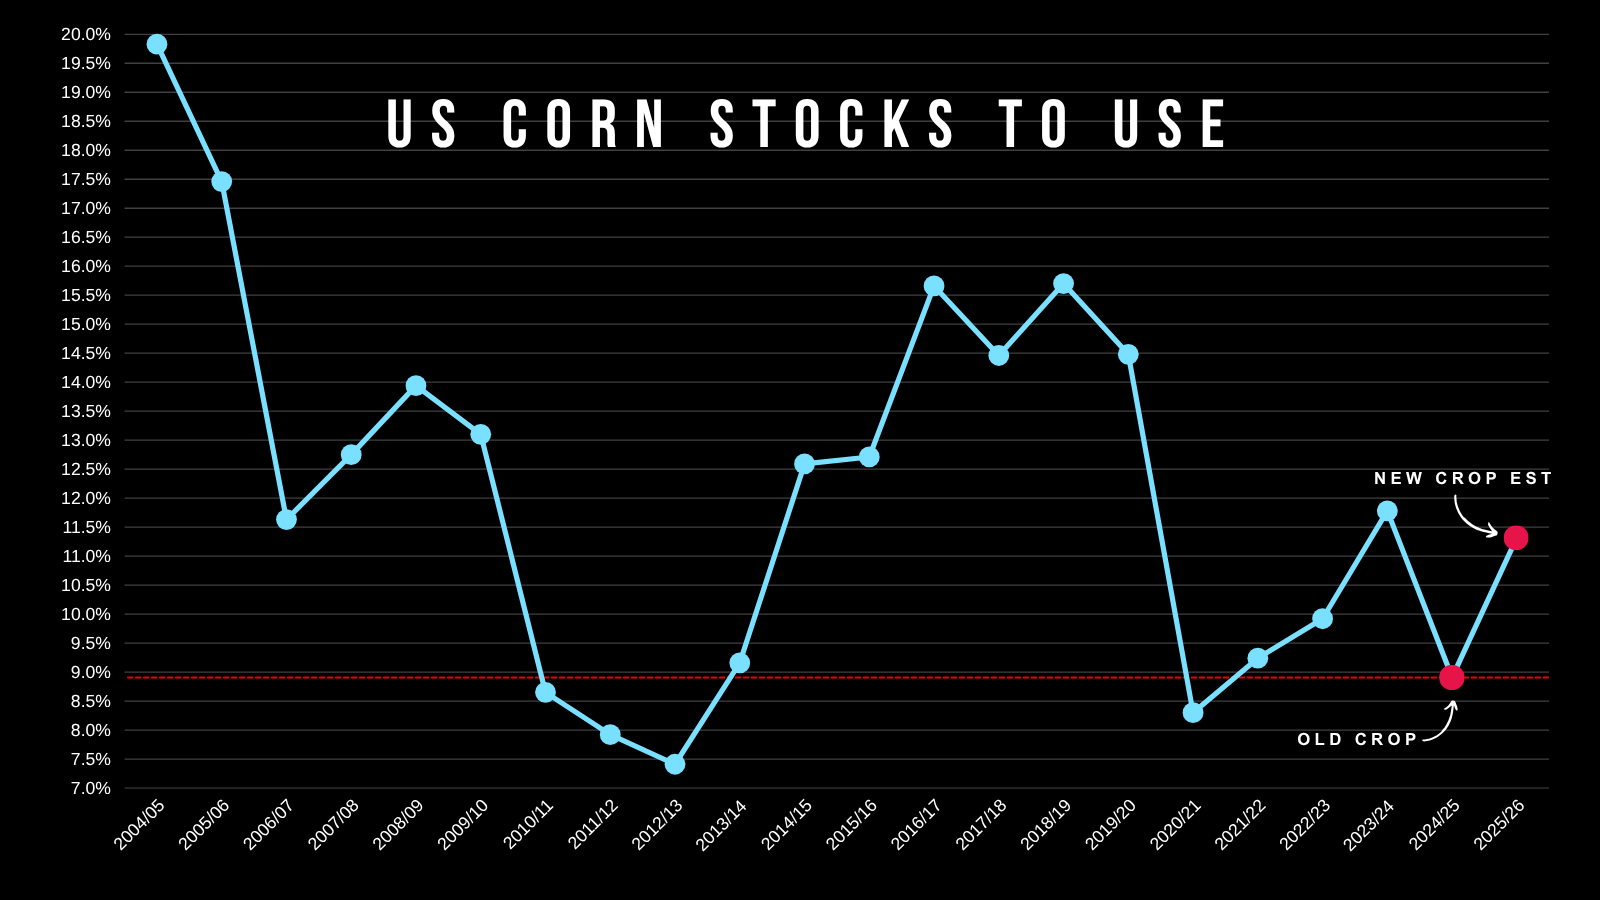
An 8.9% stocks to use ratio is the tightest since 2020/21.
On the surface, if you looked at this number corn "should" be trading much higher.
Our old crop situation is tighter than times where we have seen $6 to $7 corn.
That is how bullish corn "should" be. If corn was trading higher, everyone would be talking about how bullish old crop is.
A stocks to use below 10% is considered bull market territory.. we are now below 9%.
But the market hasn’t seemed to care about the fundamentals.
The funds just don’t see a reason to buy corn here.
Maybe it's because Brazil has a big crop.
Maybe it's because we have a big crop on the way.
But even with a bigger crop from both of us.. the world situation continues to get tighter.
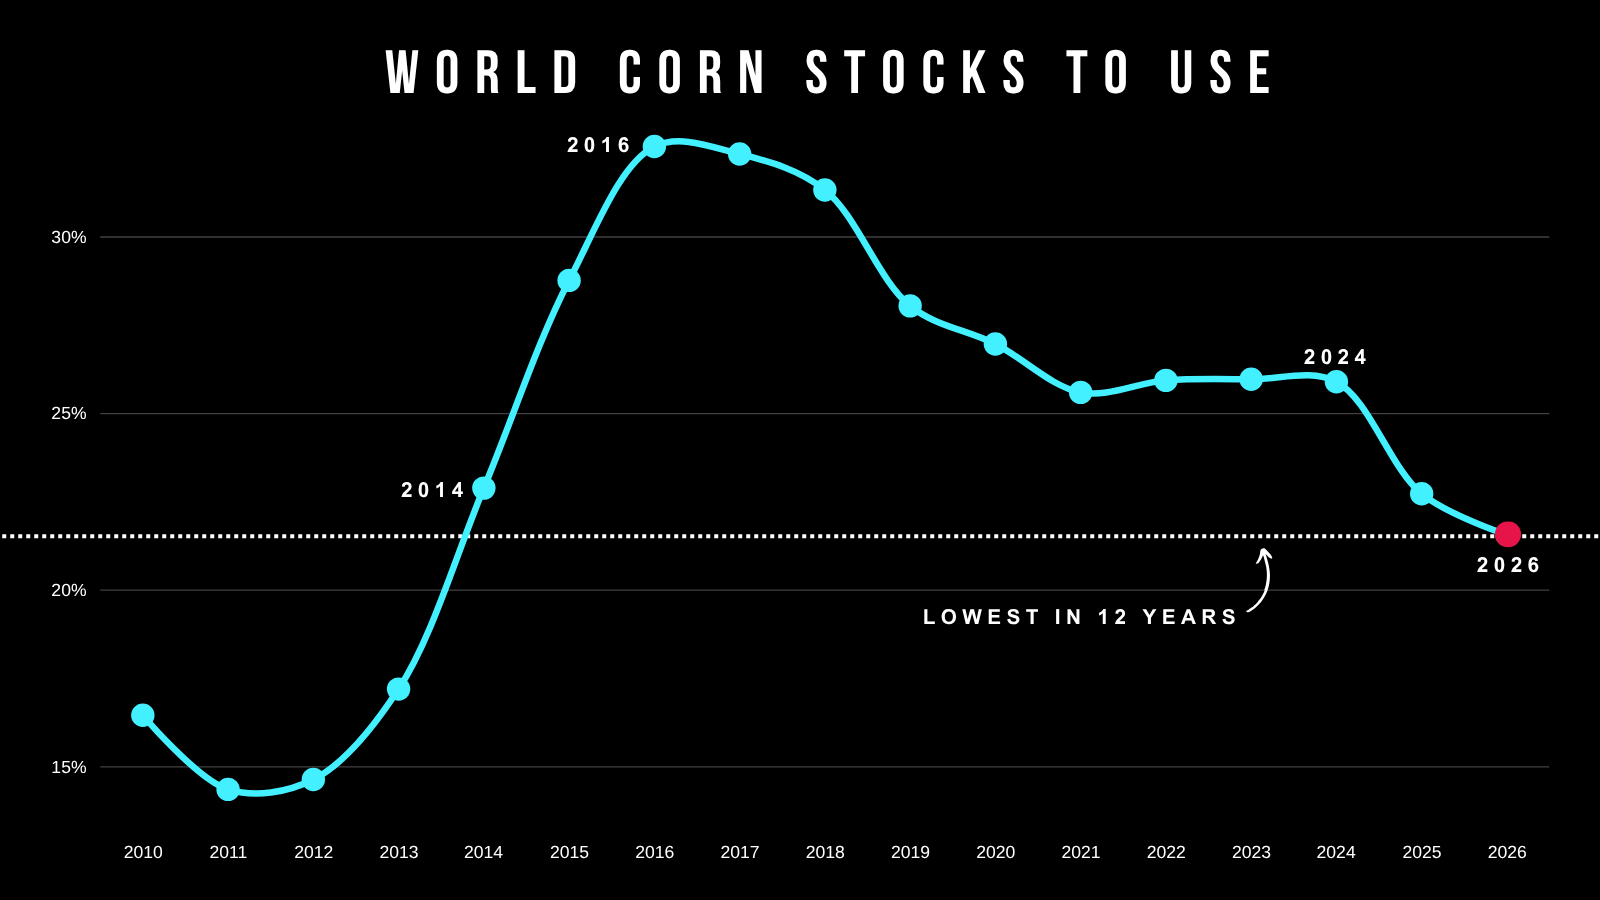
If we look at the world situation, this year was the tightest in over a decade.
The USDA is now projecting next year to be even tighter. The tightest since 2013.
But.. it hasn’t mattered.
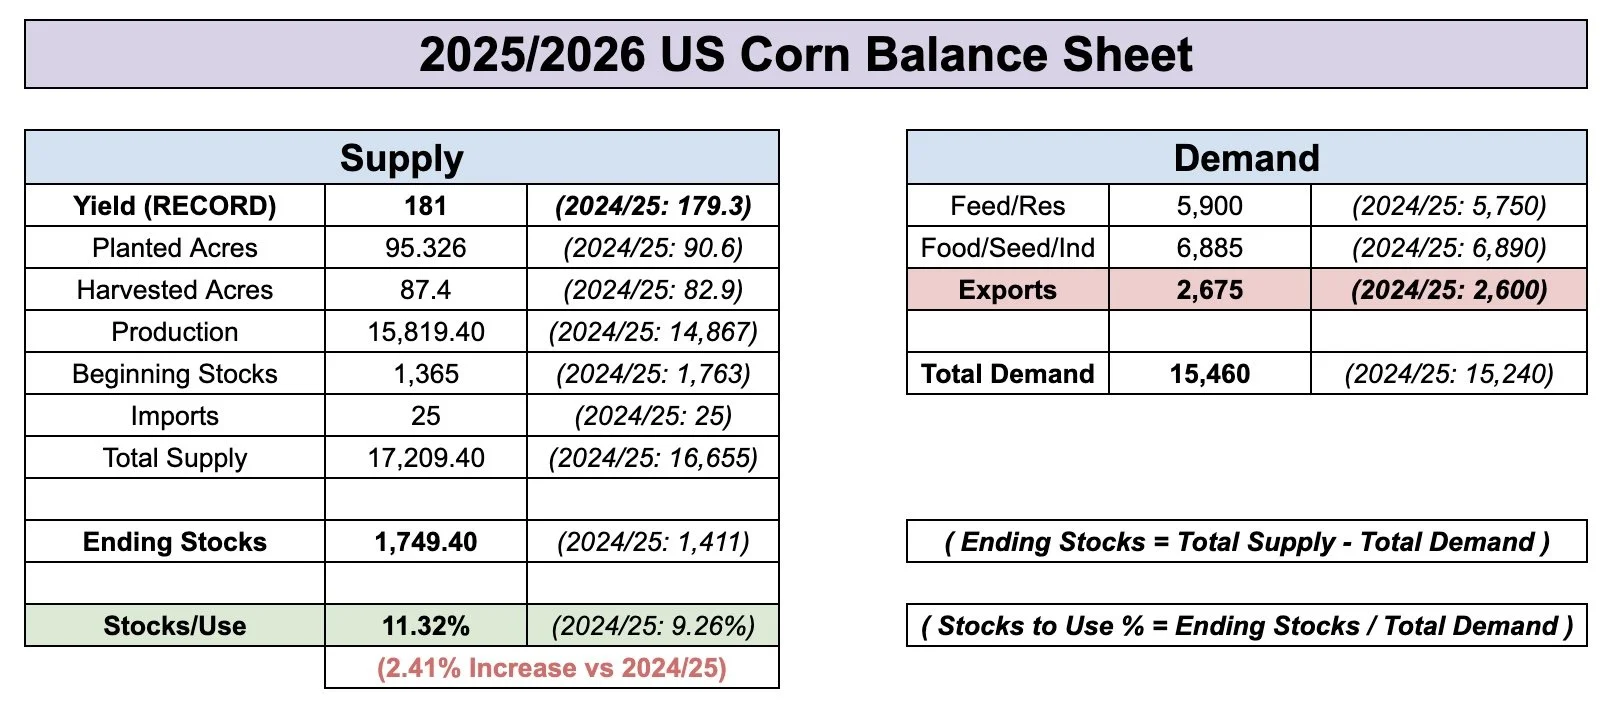
Starting carryout for new crop corn was the lowest in 3 years.
Typically, you can print your biggest carryout at the start. Because it is a starting point.
To get the 1.75 billion bushel carryout the USDA is projecting, we have to see a record yield.
1.75 billion isn’t "bullish" but it's not incredibly bearish like +2 billion we saw throughout the 23/24 marketing year.
We did not see old crop carryout drop to 1.75 billion until last December. Yet, that is the starting point for new crop.

Fundamentally this corn market just hasn’t made sense. We've been talking about how there is a path to a tight situation since last year, and exactly that happened.
But it hasn’t mattered. The funds don’t see a weather threat.
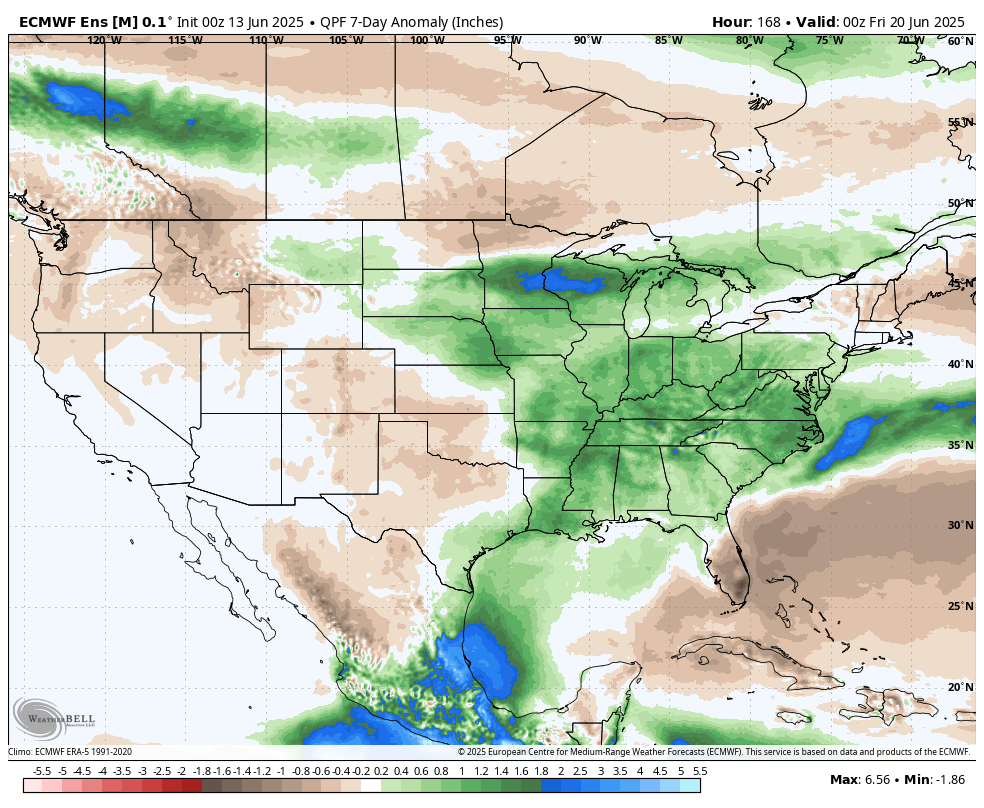
The forecasts are constantly changing, but if we look at forecasts, the next 1-2 weeks look pretty wet for the corn belt.
There is no foreseeable concern. And that's what matters to the market right now.
7-Day Euro Model
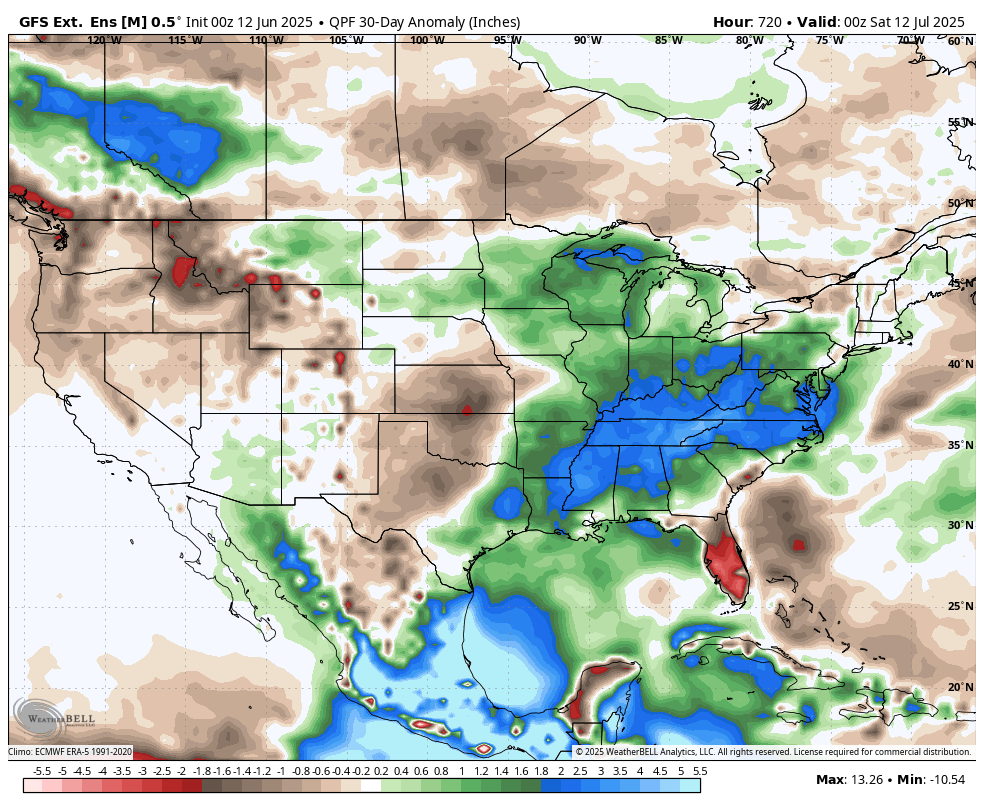
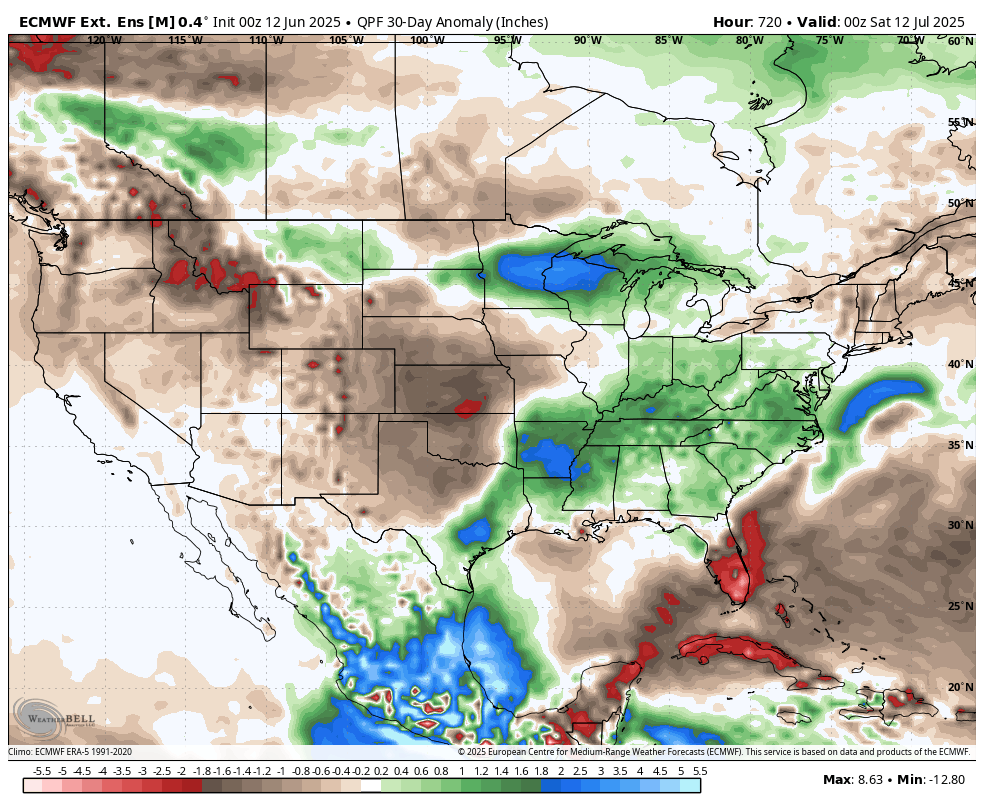
If we look at the 30-day forecasts, the models are mixed.
The GFS has the central corn pretty belt wet.
The Euro has a little less rain and the western corn belt dry.
If the GFS is right, the chances of a weather scare don’t seem that likely.
GFS 30-Day
Euro 30-Day
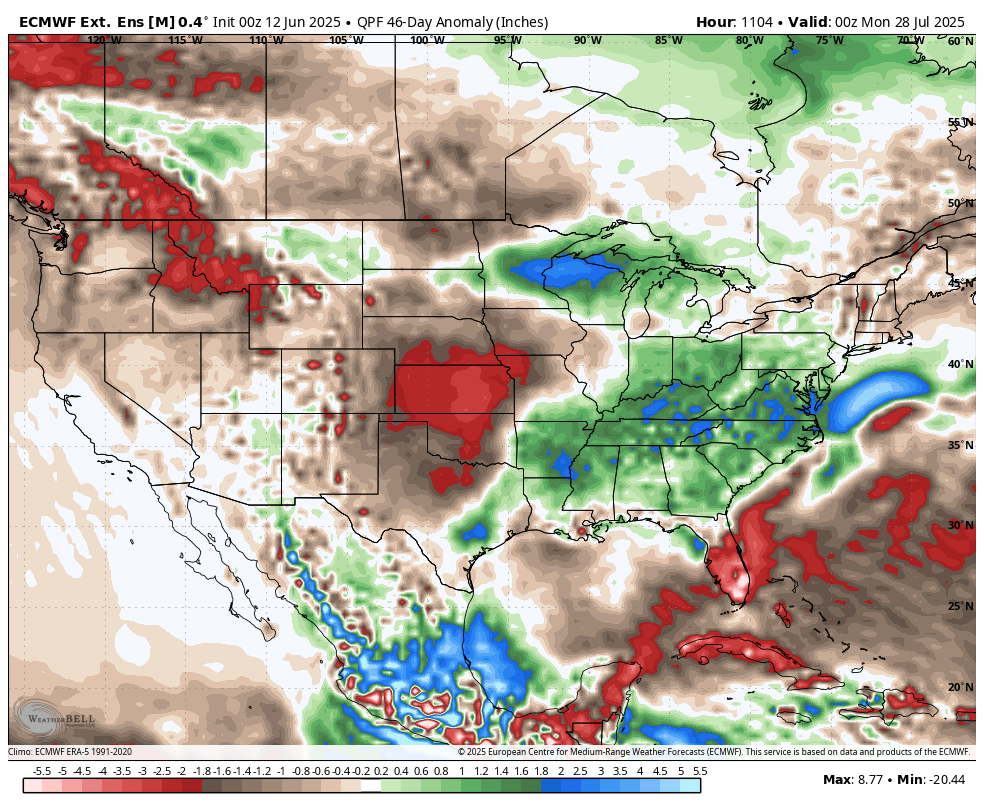
Here is the Euro 46-day.
If this verifies, you could still see a weather scare.
But it is hard to put any faith into these longer term forecasts when they can’t get next week right.
Euro 46-Day
Long term I think there is a real case to be made that corn could go higher.
The fundamentals are bullish despite not mattering.
Most are predicting the US dollar to continue to fall after hitting 3 year lows.
If prices stay cheap, there is no reason demand shouldn’t continue to be solid.
Which "should" result in higher prices. But maybe it doesn’t happen until after harvest.
Charts:
Seasonally we are suppose to go lower from here.
There doesn’t appear to be any weather threat.
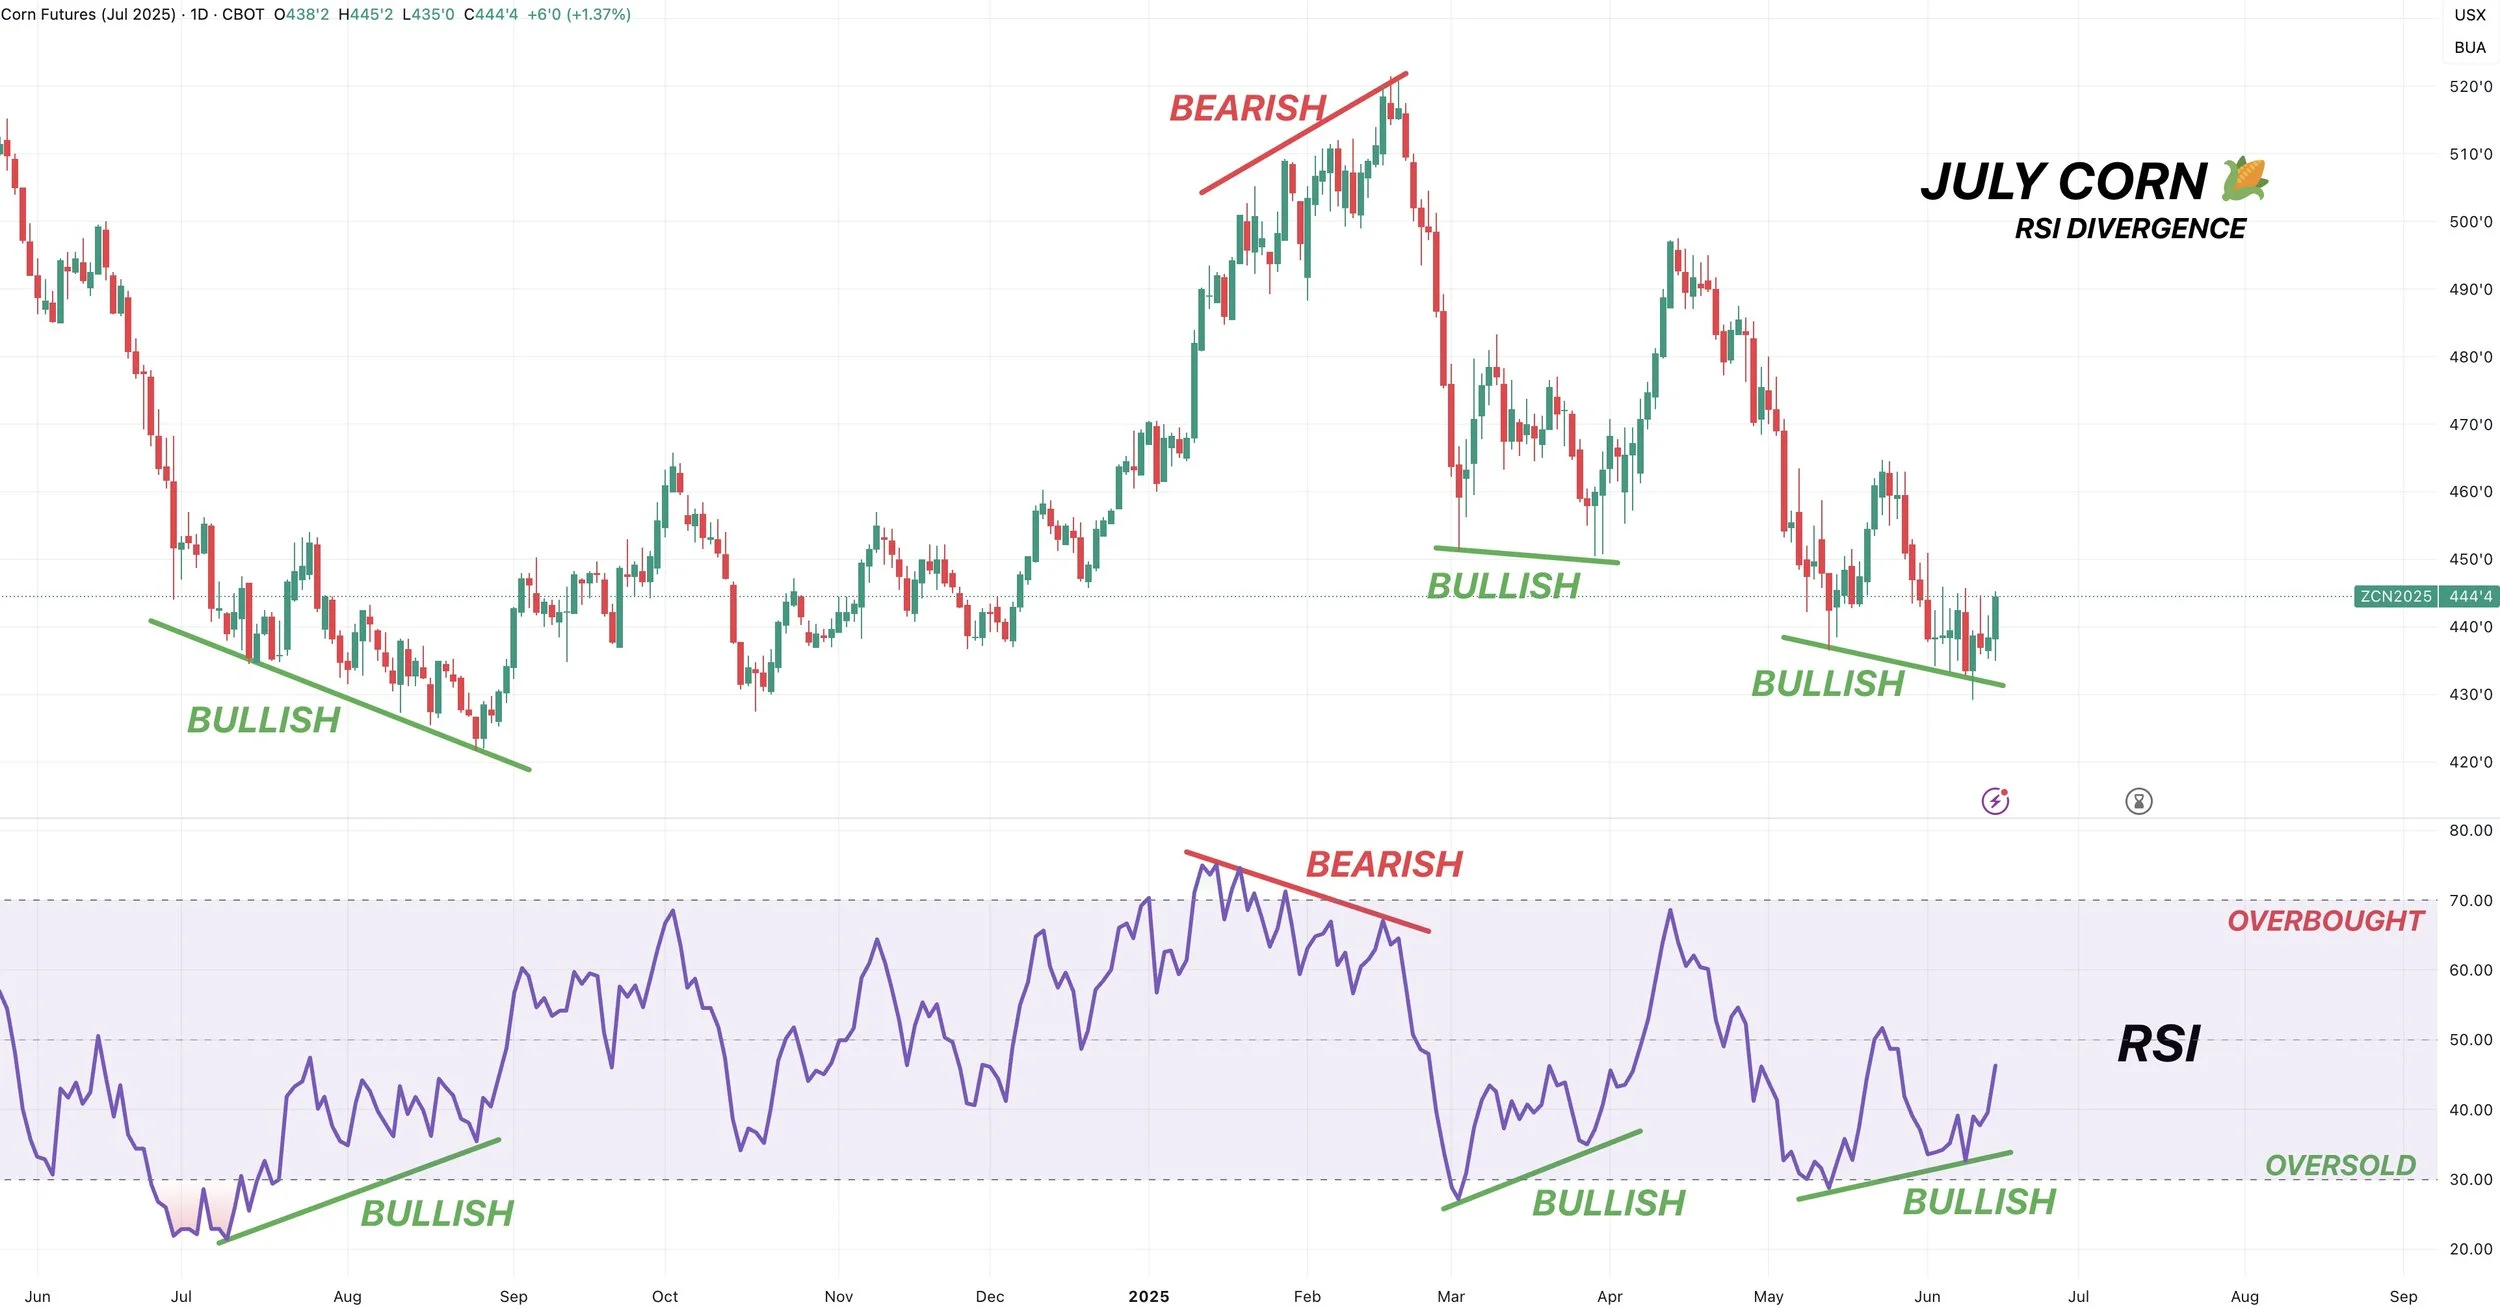
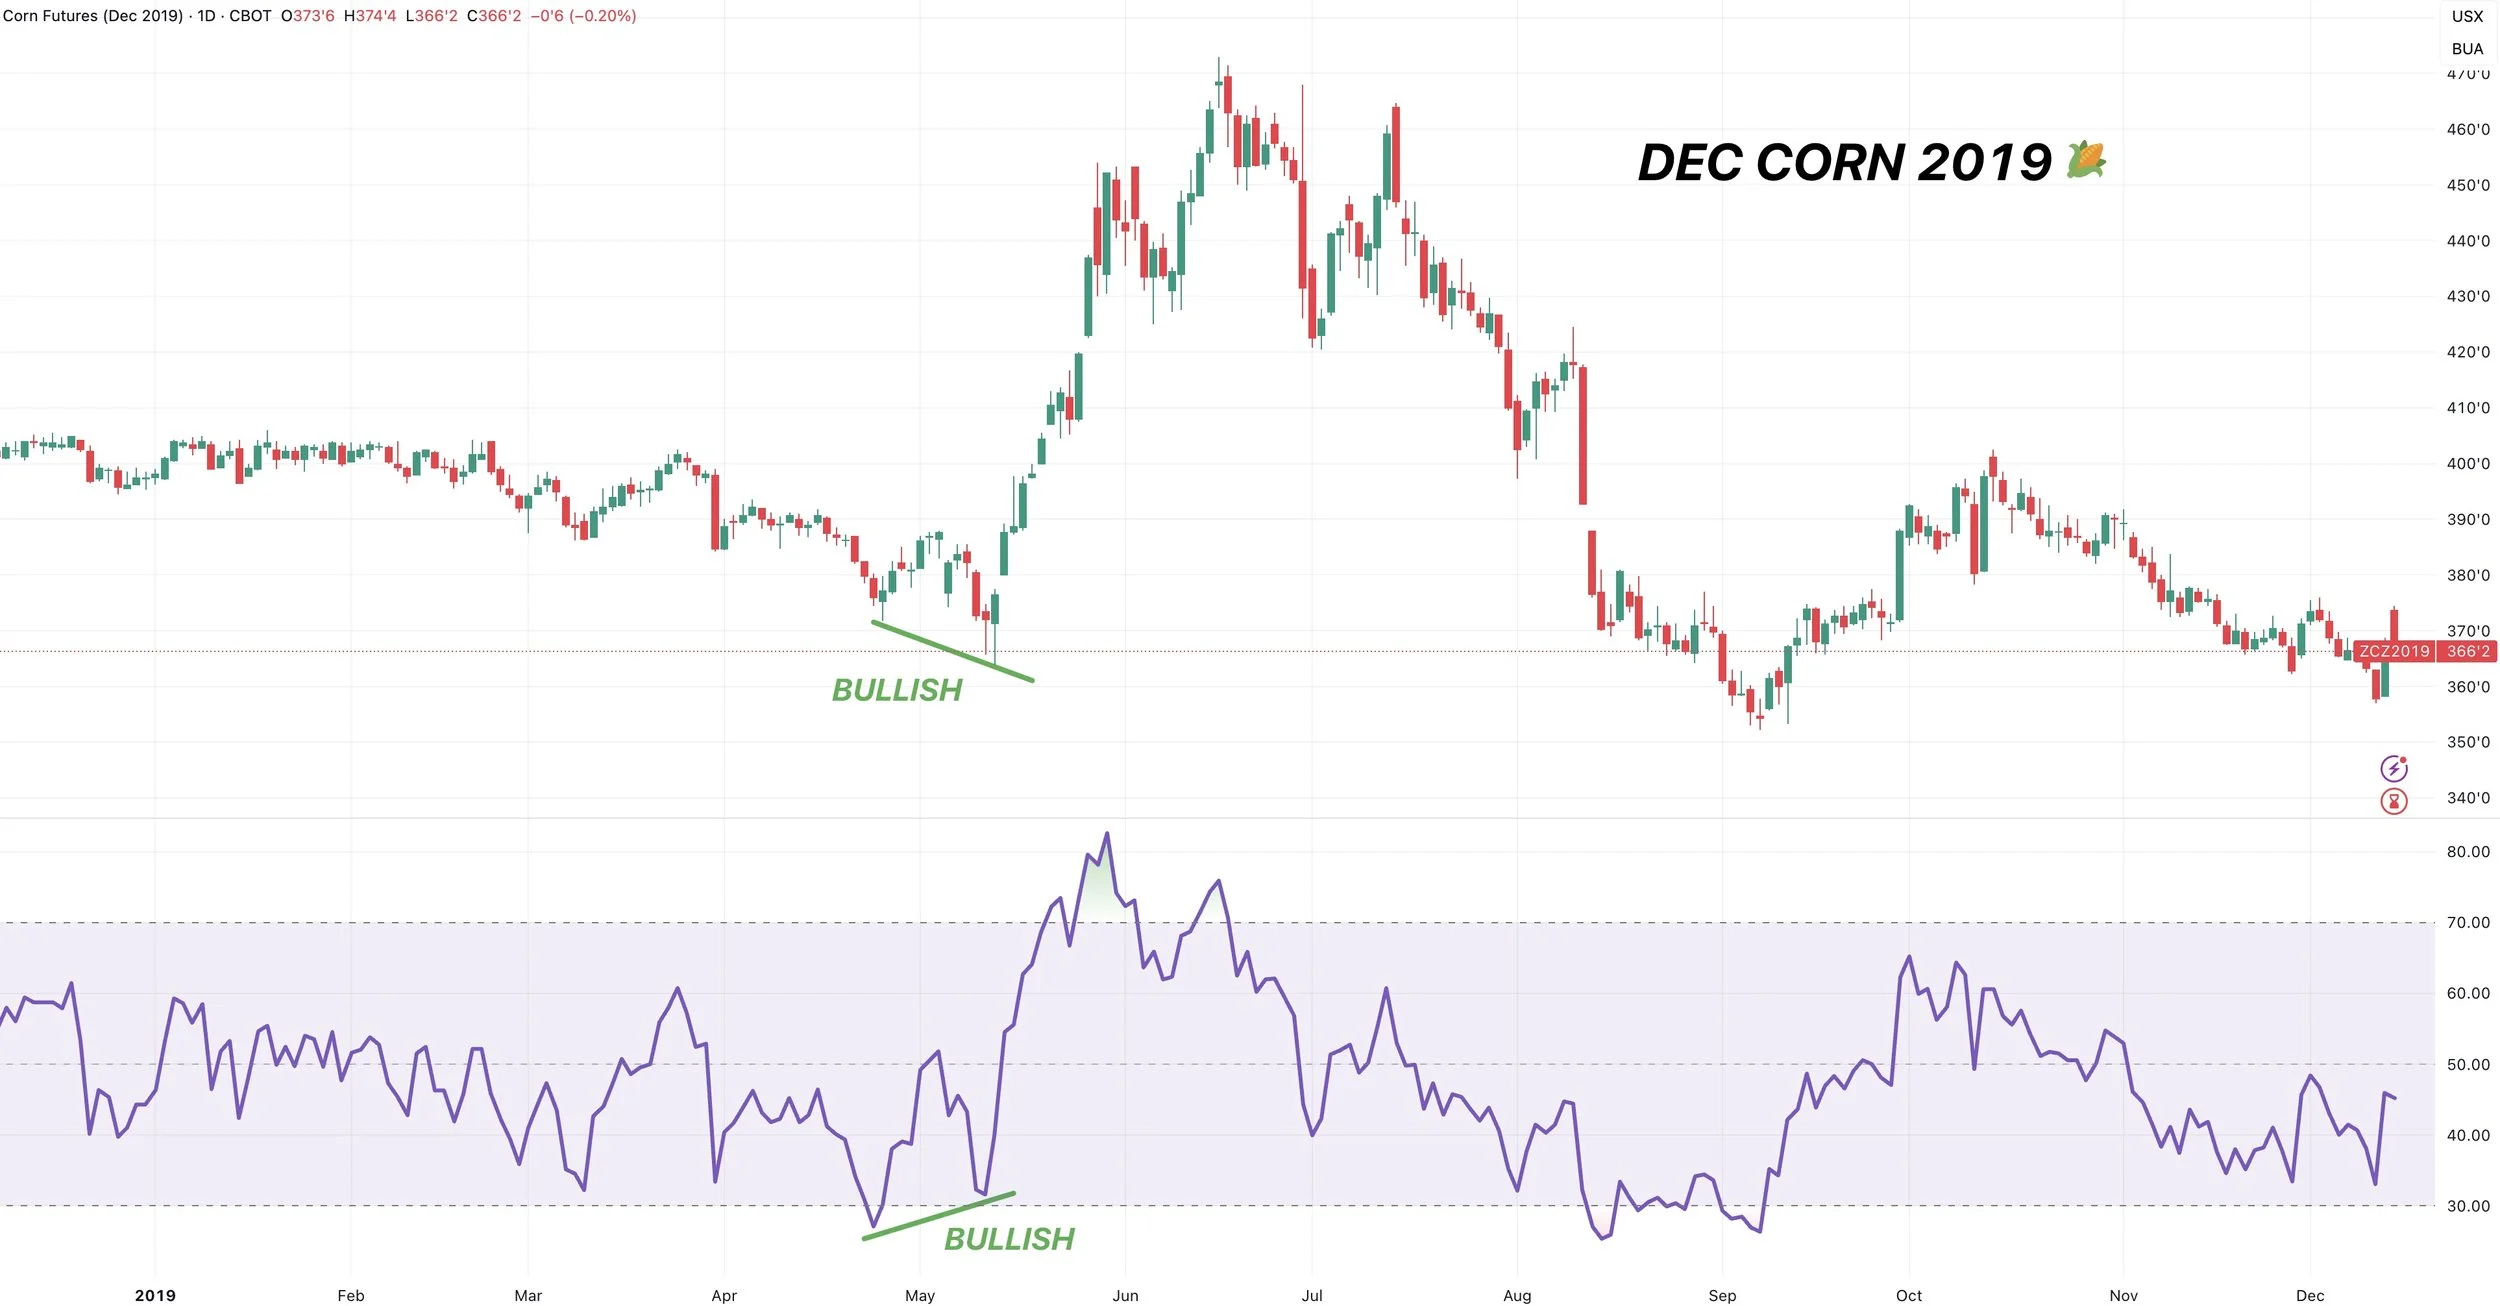
Yet.. as I have been pointing out the last week or so.. corn continues to post bullish divergence on the charts.
This is one of the only things keeping me hopeful in this market.
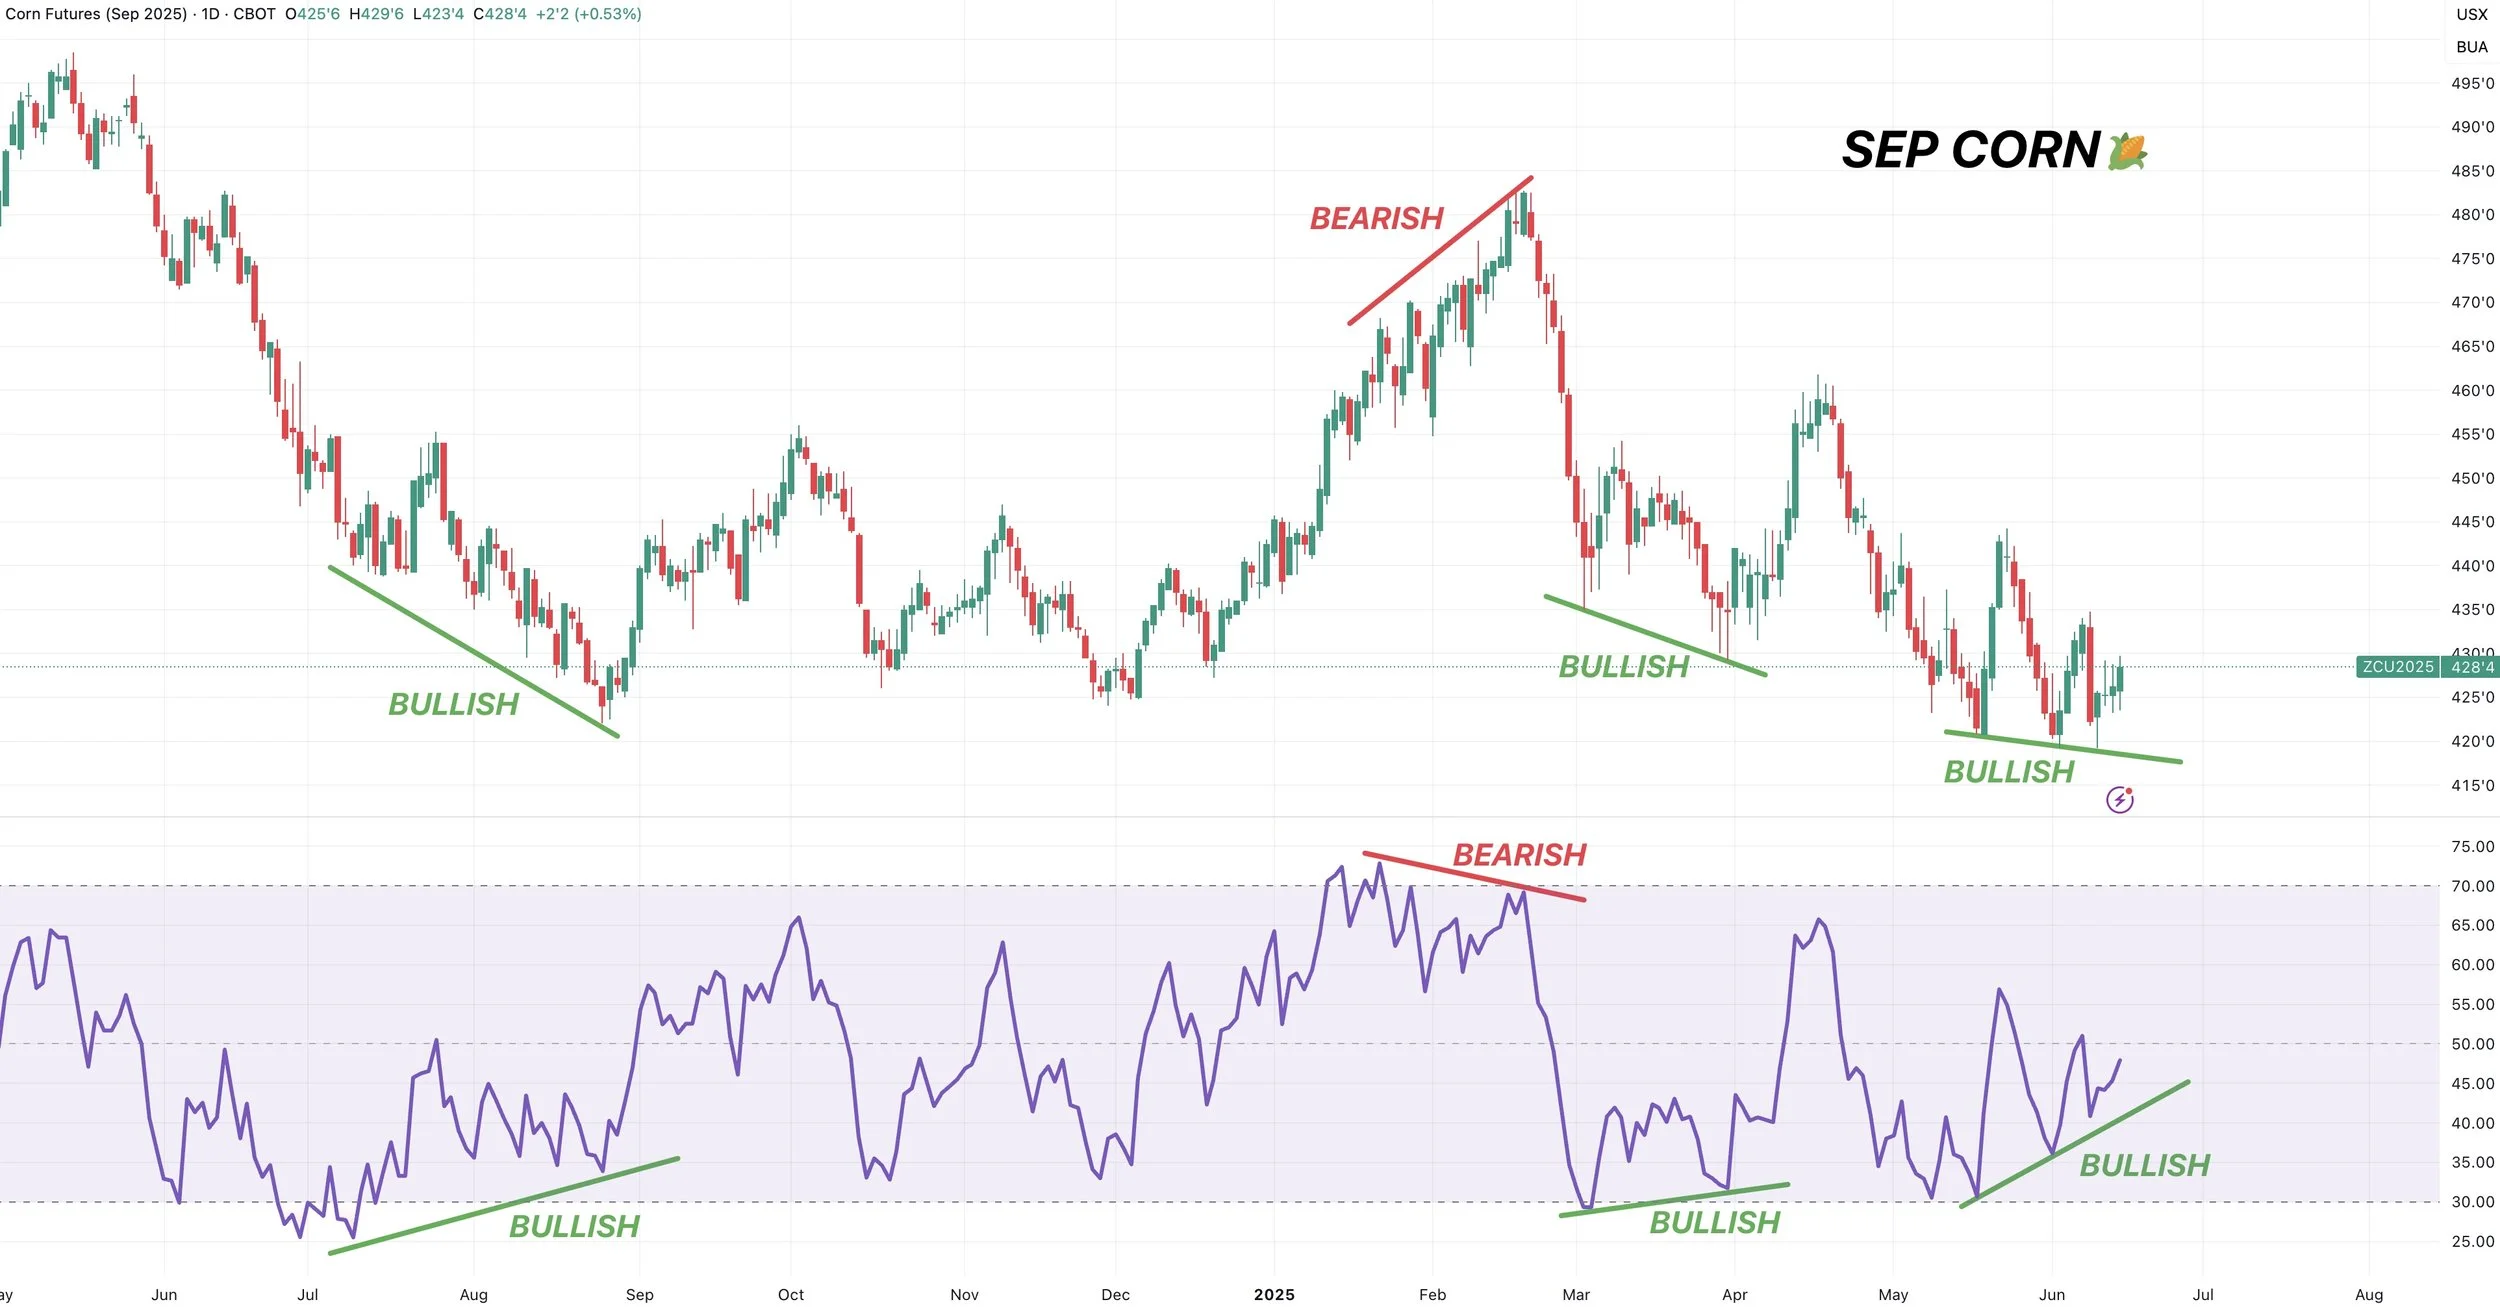
July, Dec, and Sep corn are all showing bullish divergence.
(Happens when prices post new lows, but the RSI does not)
Maybe the charts are telling us a story we don’t know yet.. or maybe it doesn’t mean anything.

This doesn’t mean corn "has" to go higher.
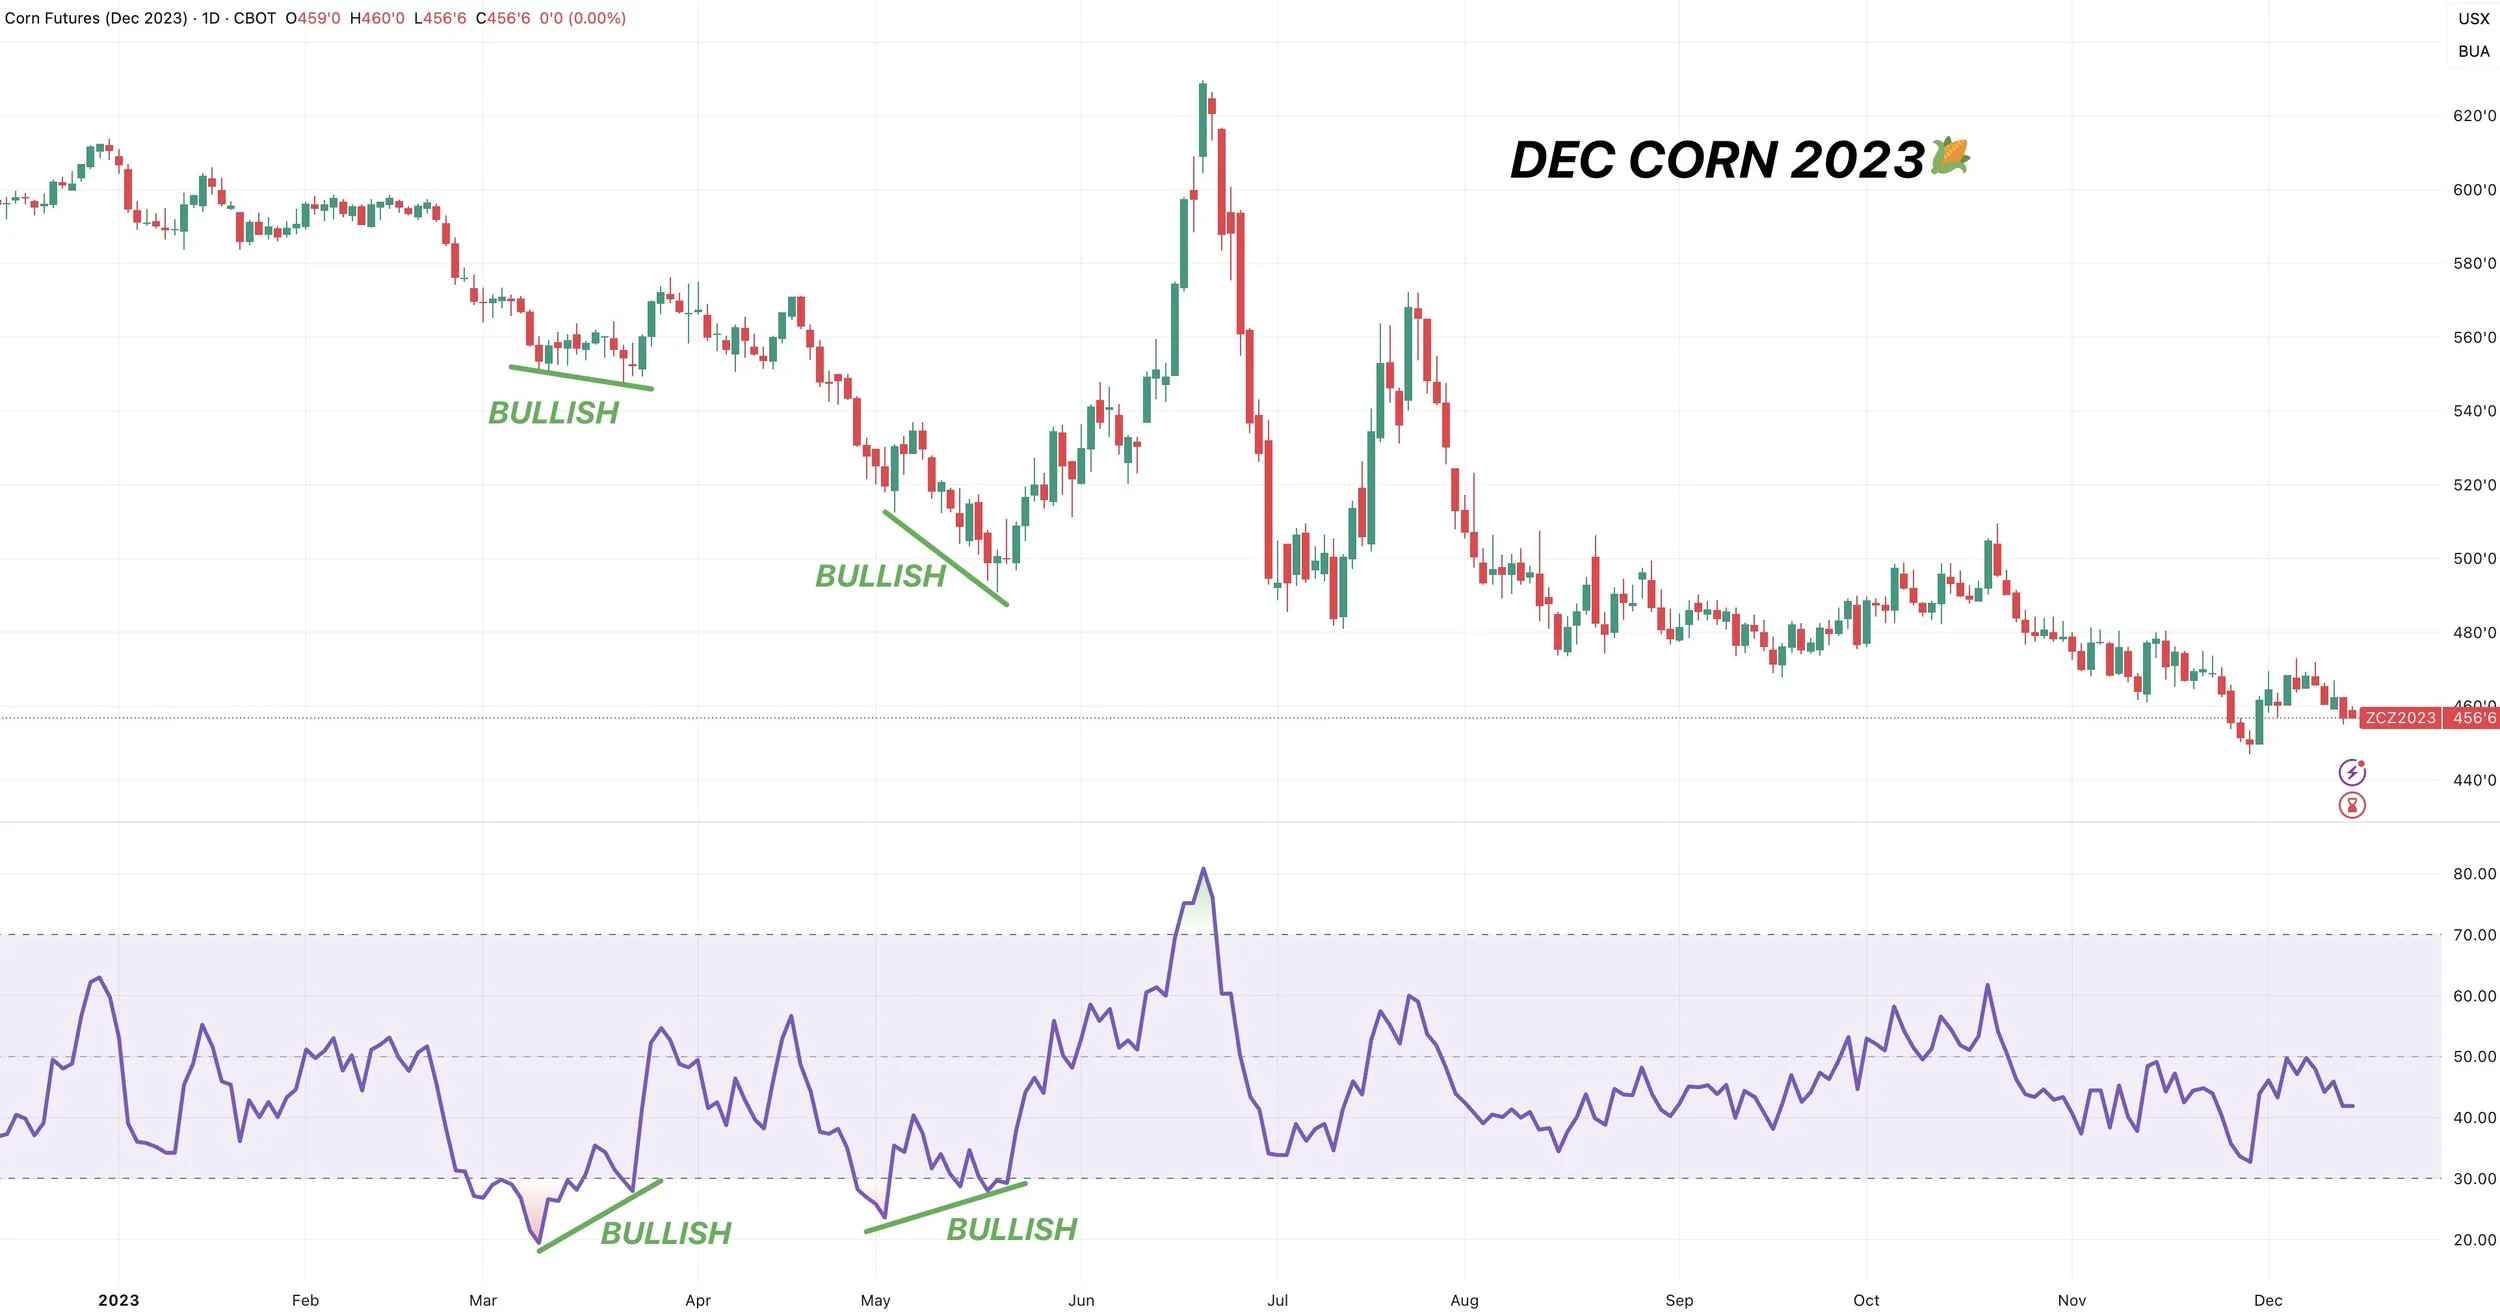
But if you go back and look.. several times before we saw a rally.. corn was also showing bullish divergence.
Here are a few examples I went over earlier this week:
1) 2023
2) 2019
3) 2015
4) 2012


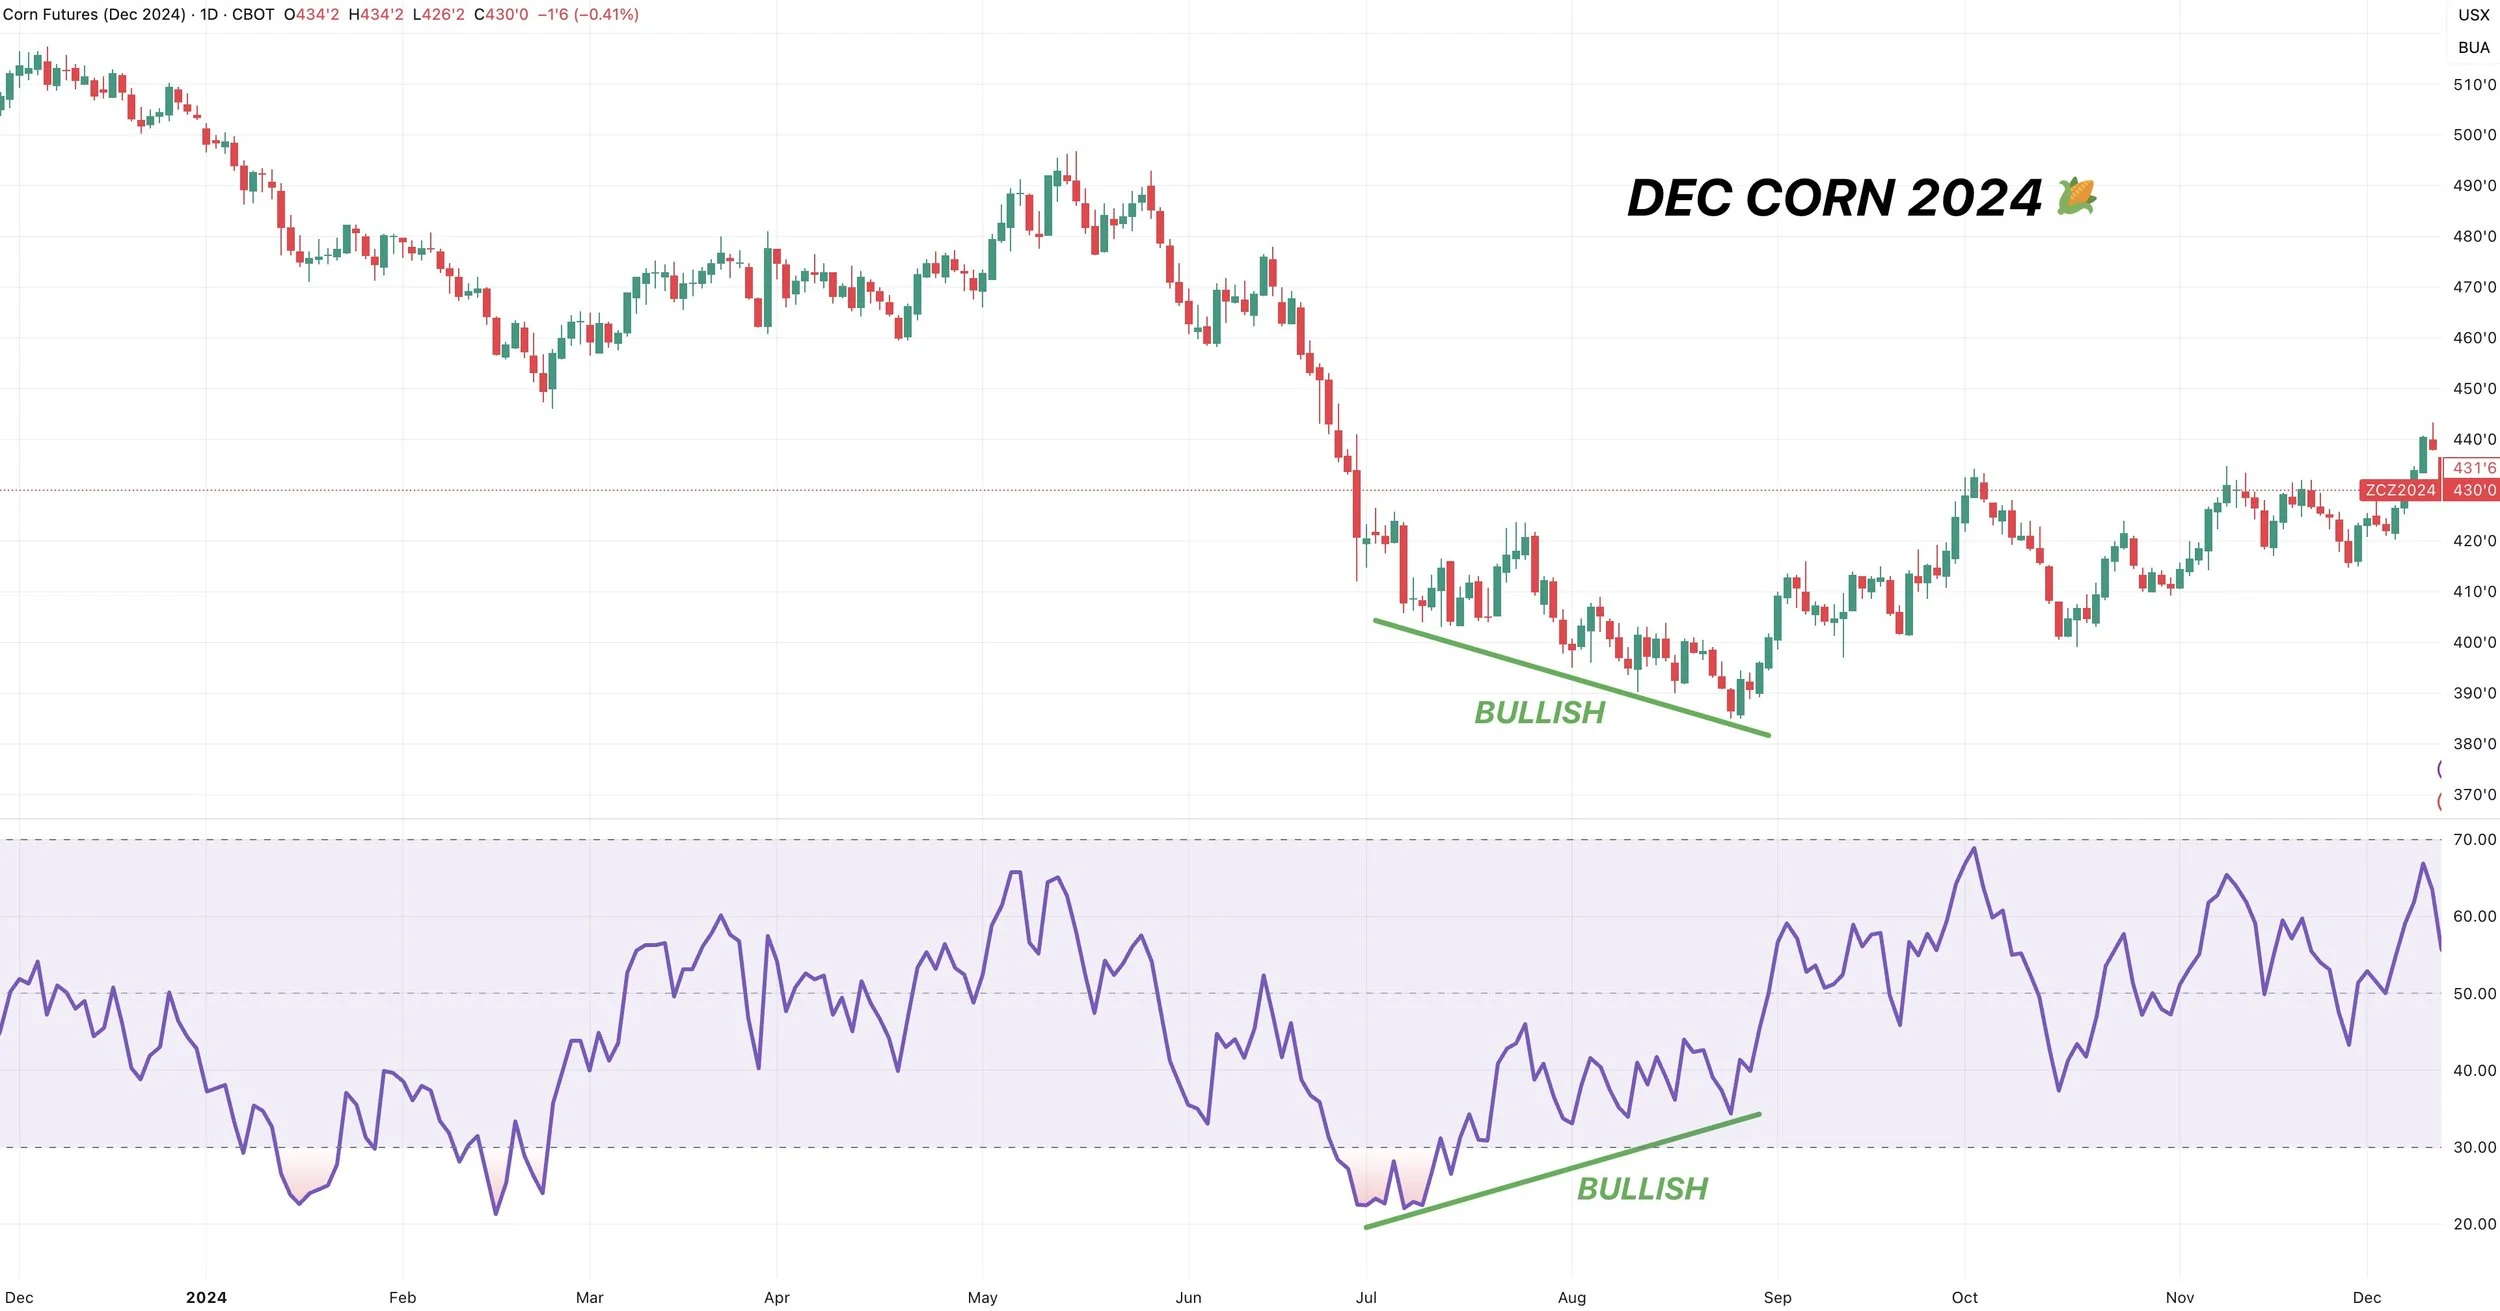
If you look at years where prices did not rally.. there was no bullish divergence.
1) 2024
2) 2014

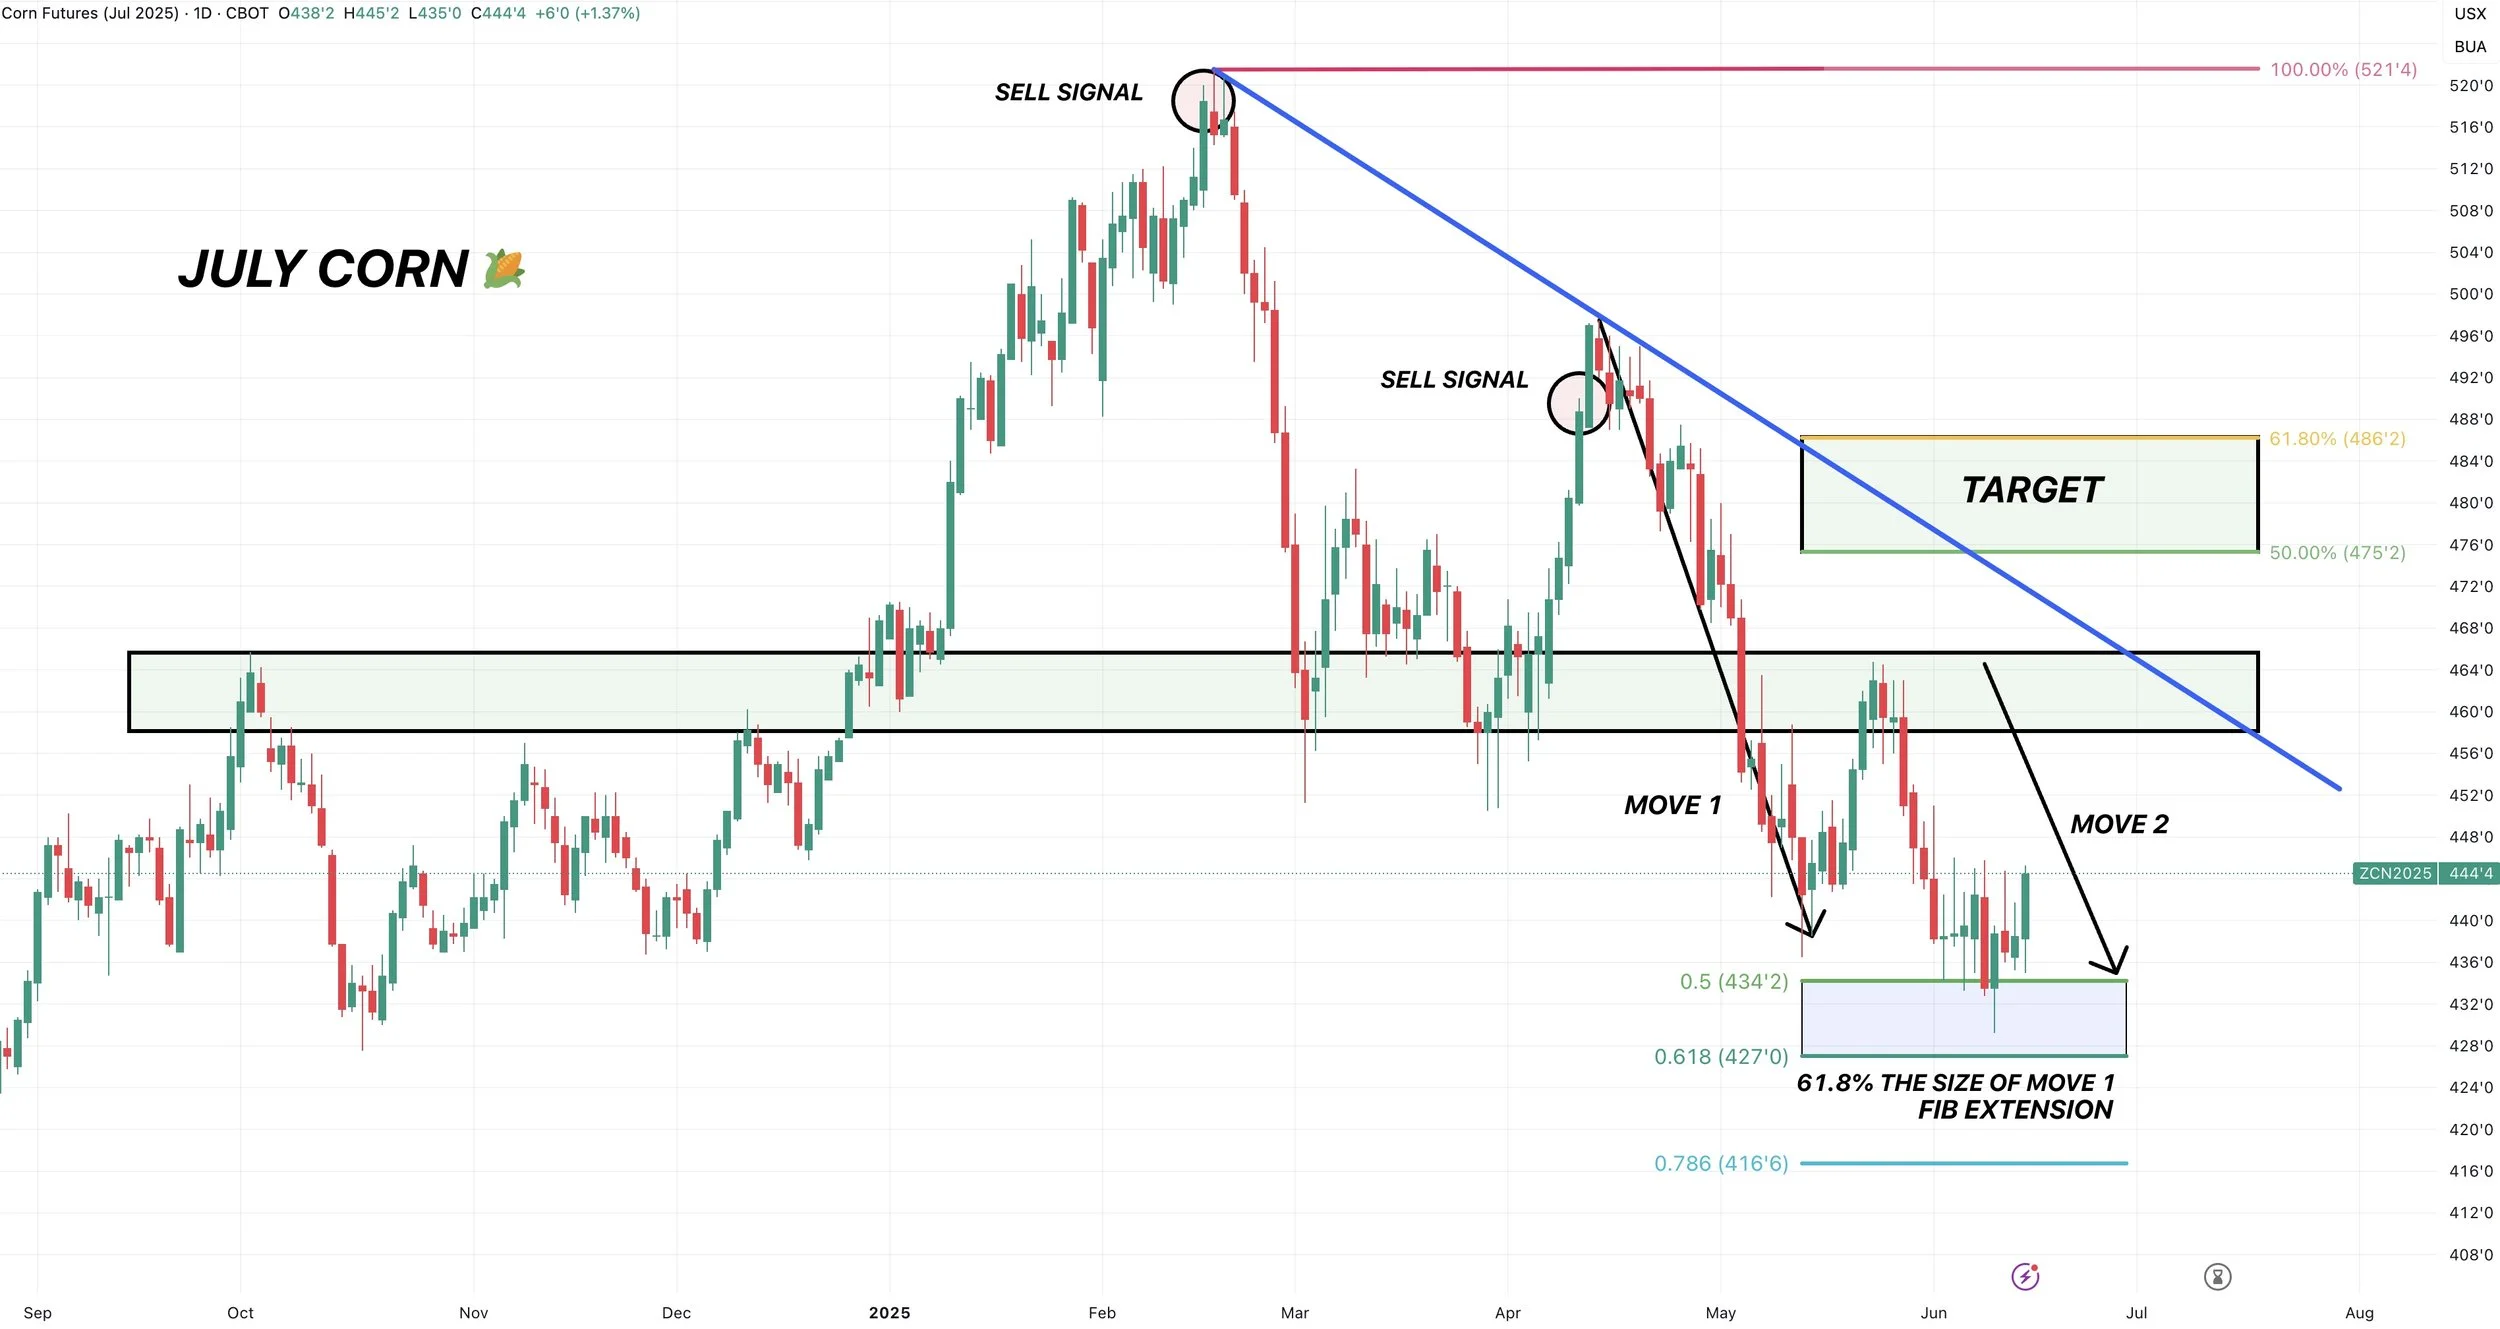
Fib Extension - July
July corn is finding life in this golden fib extension.
This is exactly where we want to see us bounce.
This area is known as a decision point.
We either recover here, or go post contract lows.
This box equals 50-61.8% of the April sell off. Known as the golden fib extension.
Dec Corn
We have a potential triple bottom.
But can’t get excited until we break this newly formed downtrend.
IF we can do so, I am stilll looking for $4.60 to de-risk.

Soybeans
Fundamentals:
I still think soybeans have a potentially friendly story moving forward.
Here is the 2025 vs 2026 balance sheets.
2025 Carryout: 350 million
2024 Carryout: 295 million
Change: 55 million (-16%)
So you are telling me carryout is down -16% vs last year.
We have to raise a record yield to hit this carryout number.
Yet.. prices are cheaper than last year?
Old Crop
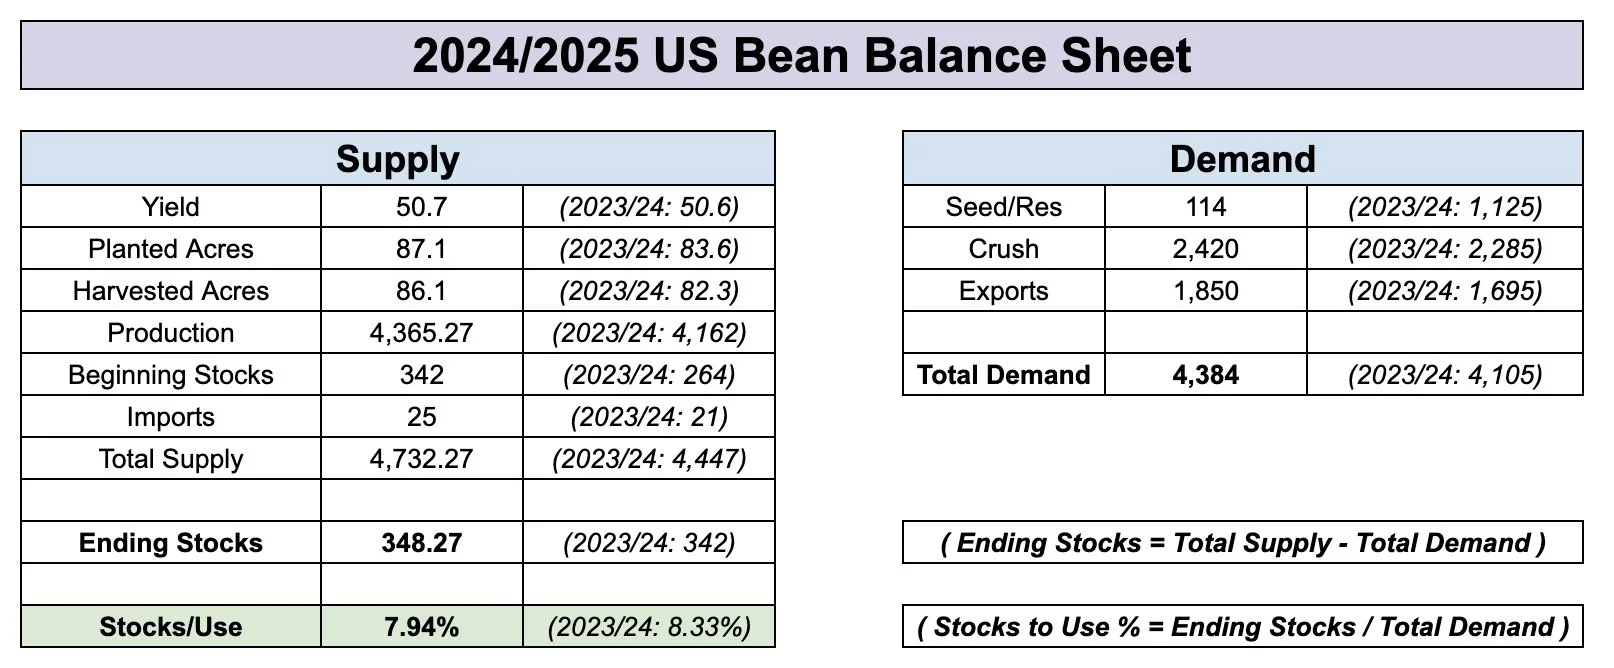
New Crop
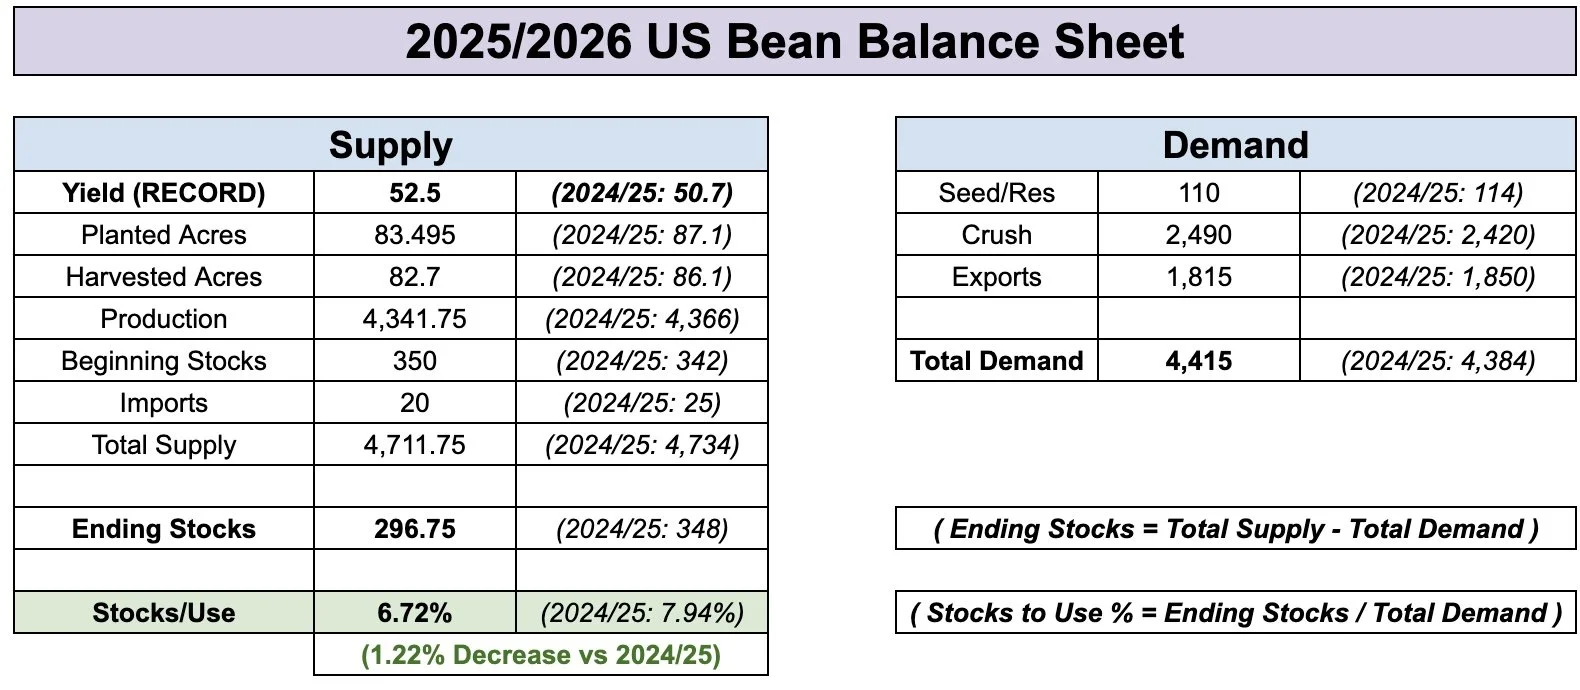
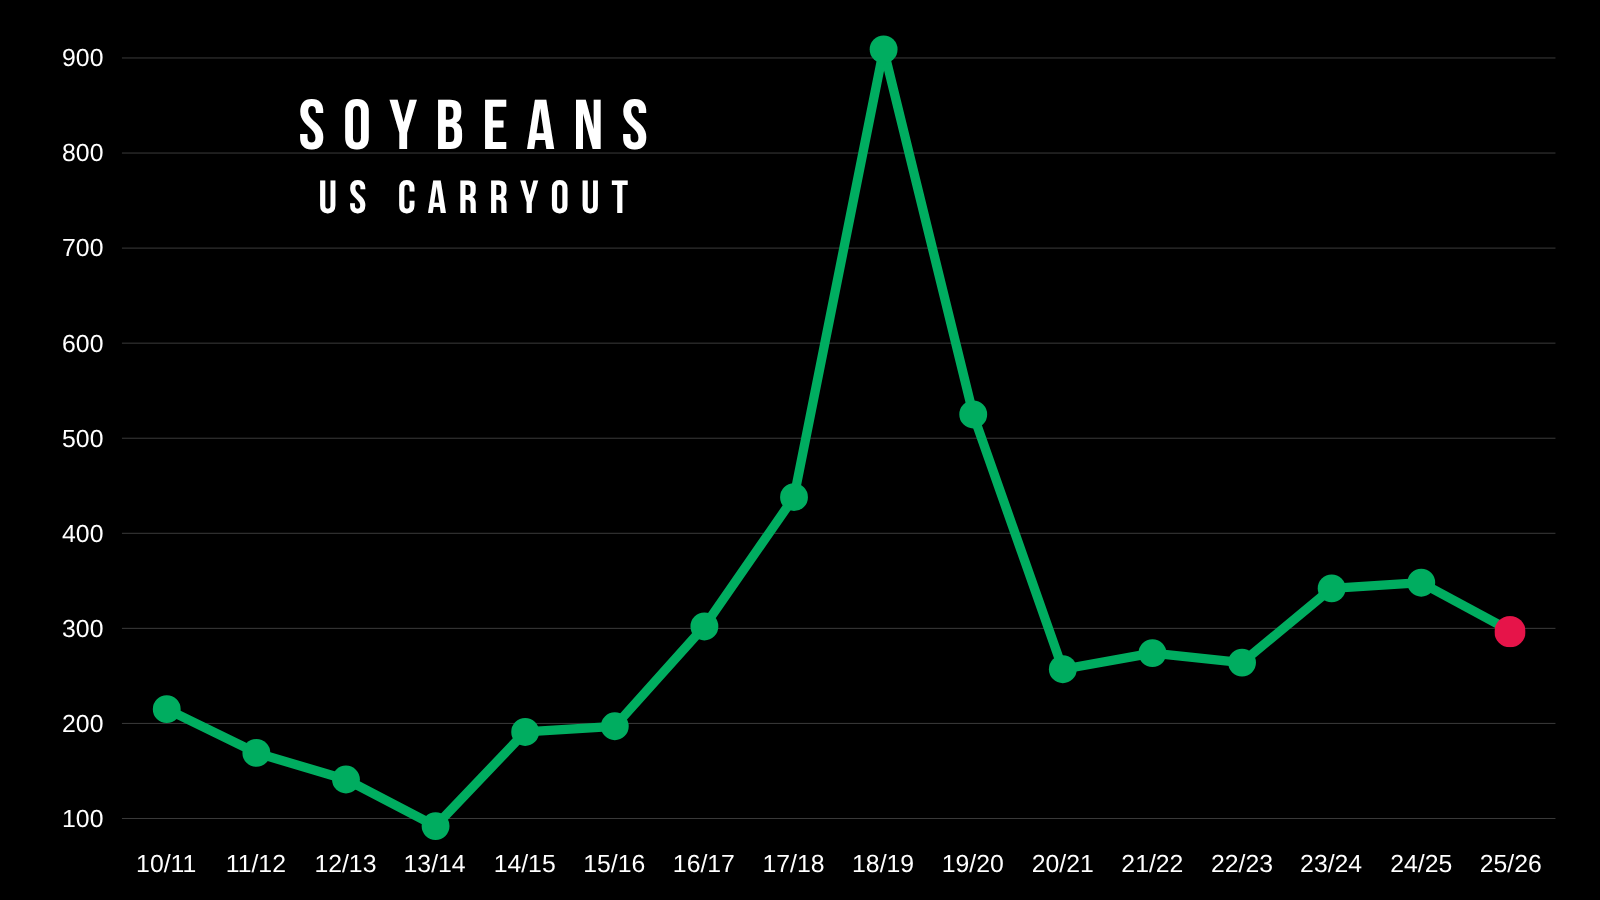
The new crop balance sheet is already under 300 million bushels with a yield we have never seen before.
New crop carryout is at 3 year lows.
Prices are also the lowest they have been since 2020.
That is why I think soybeans have "potential".
Could we raise a record yield? Absolutely.
Do we have a big crop out of Brazil? Yes.
Could things go sideways with China? Yes.
There is still risk in this market.
But there is also a possible pathway to a tighter situation.
Maybe we get a deal done with China that has a great impact on demand. Maybe we don’t.
I am not calling for something crazy like $14 soybeans. But $11 to even as high as $11.50 to $12 soybeans doesn’t feel all that unrealistic given the situation.
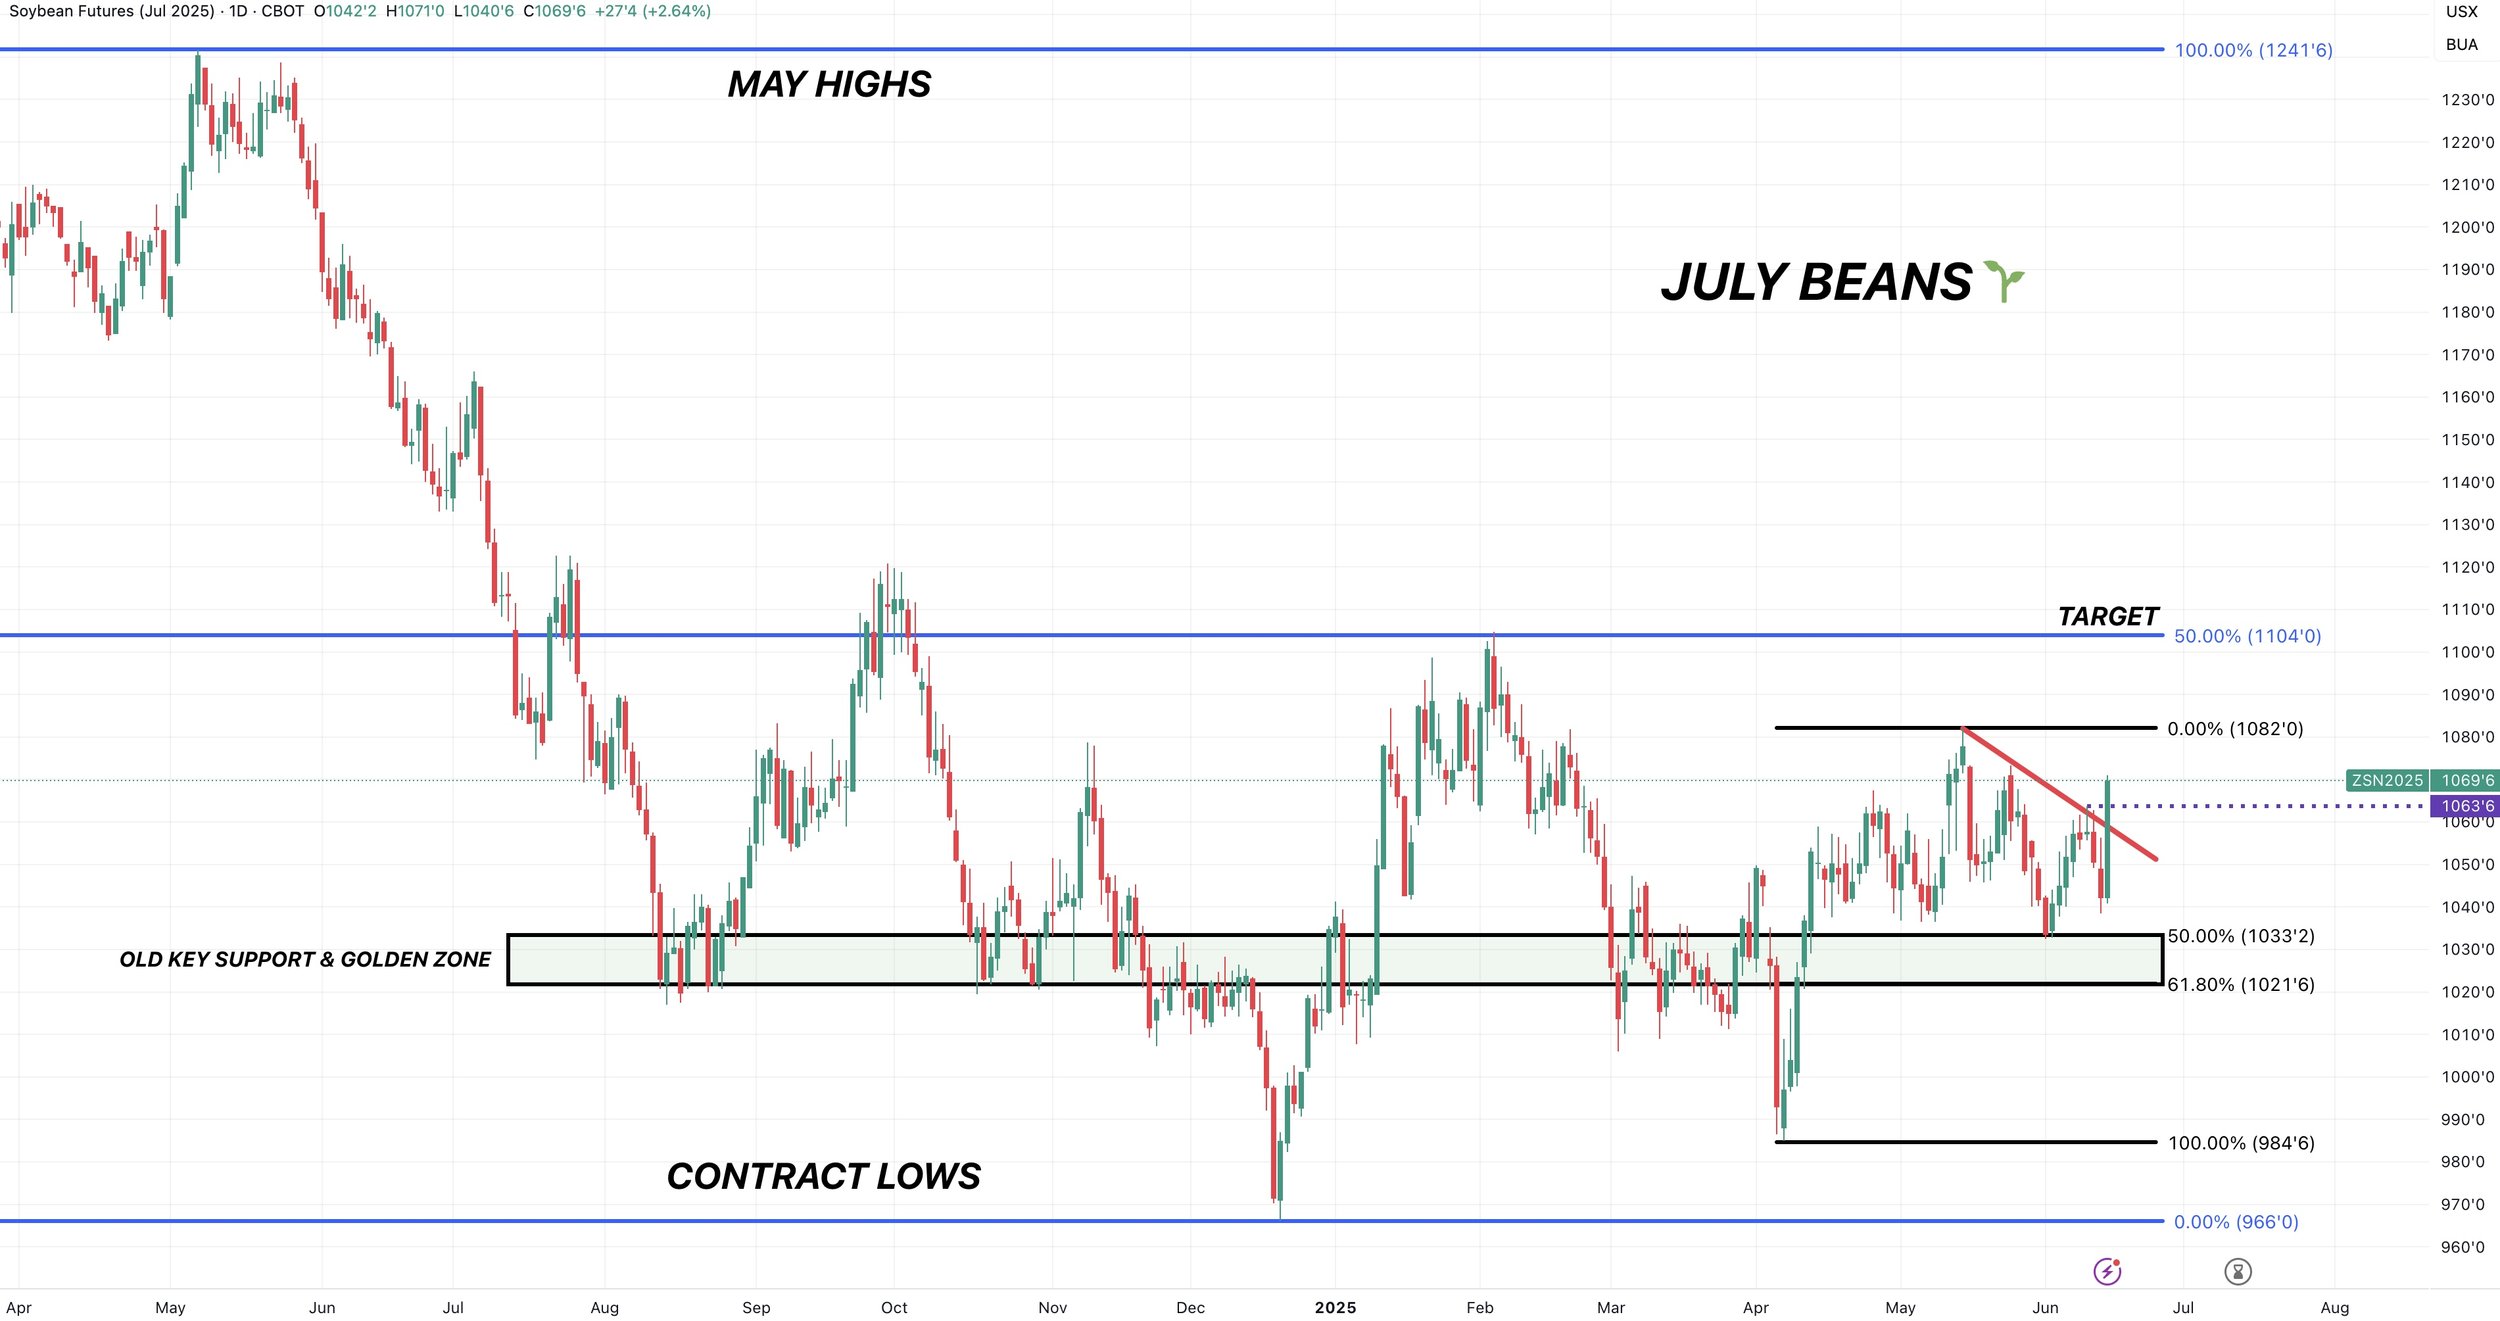
Technicals:
July beans posted their first higher high since the top in May.
We also broke the clear downward trend we had been trapped in.
Next point of interest is going to be those $10.80 highs.
Then if we break $10.80, I think it is a clear path to $11.00 in my opinion.
$11.04 is still our target to start scaling into sales or protection.
(If you have to move something soon then by all means take advantage here after a near +30 cent day).
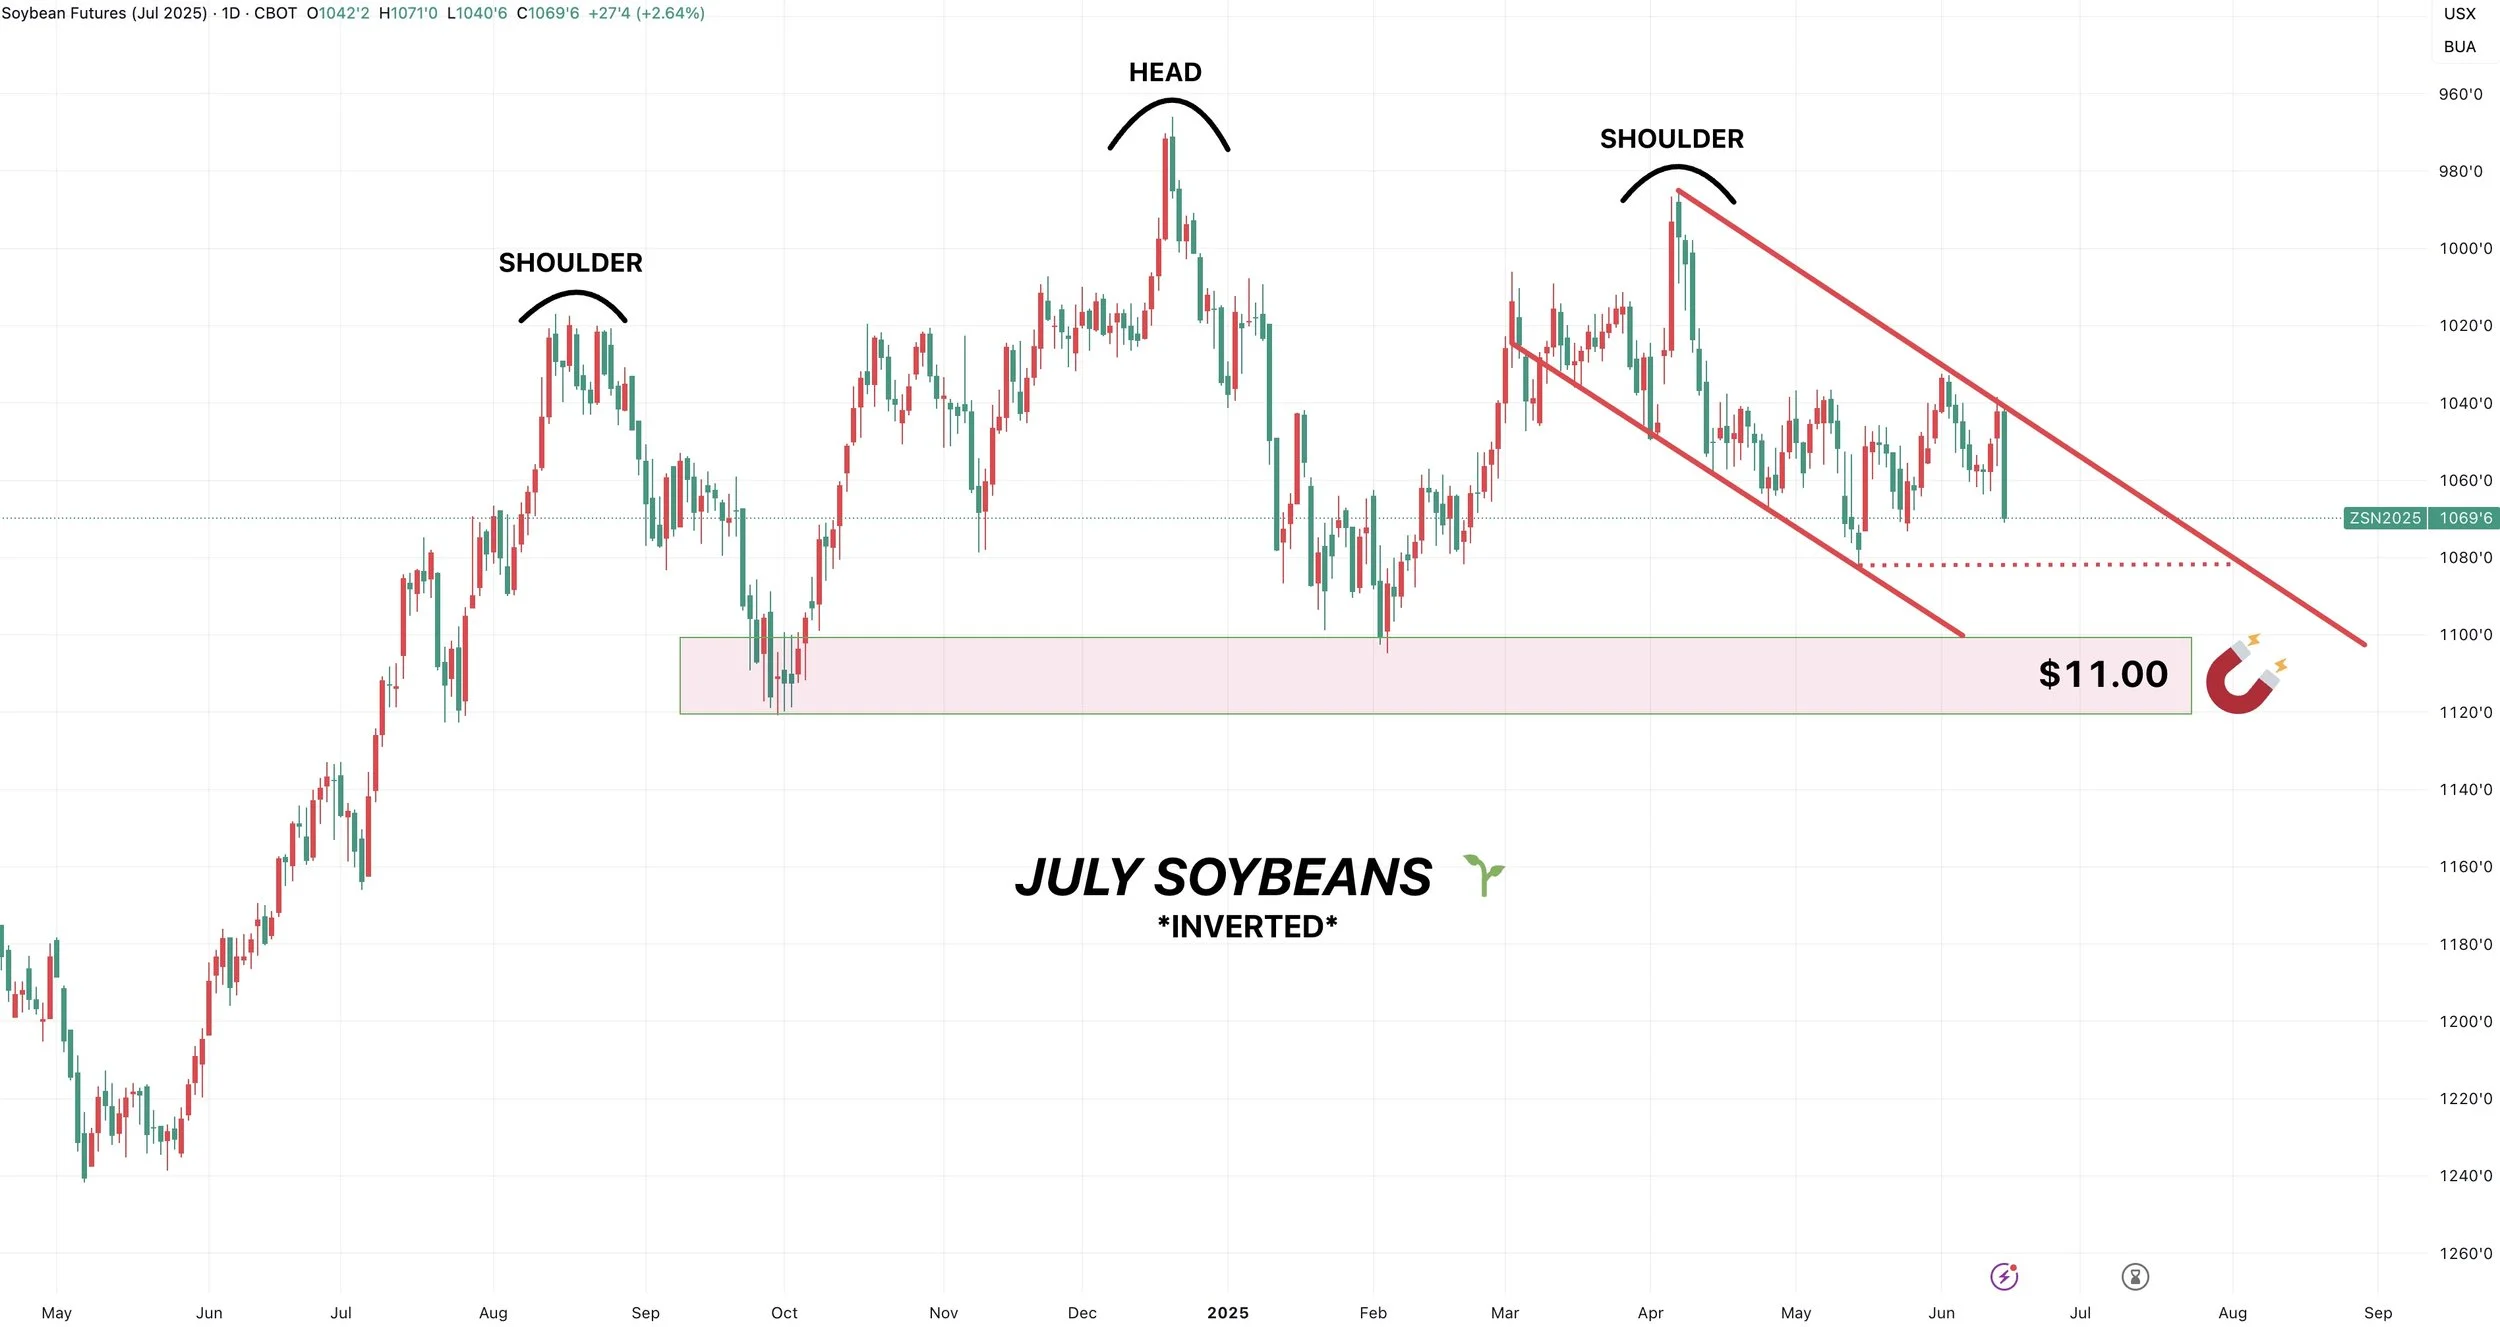
I have shown this chart several times the past few months.
This is inverted soybeans (meaning flipped upside down).
This simply helps give another perspective on the market.
We have a pretty clear downward channel in place.
We rejected right off that simple downward trend. Exactly where we needed to.
The path of least resistance still feels lower unless we take that trend out.
For Nov beans, the next resistance is going to be those $10.65 highs from May.
If we clear that level, I still have my eyes set on $10.80
Which would give us back 50% of the May 2024 highs.

Now altough I have my targets to de-risk sitting +30 cents higher.
If you are someone who is nervous, undersold, etc.
Anytime you are given the ability to make a sale or add protection in the top 25% of prices we have seen this year it is never the worst idea in the world.
Because my targets do not have to hit. They are simply there to let you know it is a good time to de-risk if they do hit.
Here is the July & Nov bean charts broken down in 25% increments.
Nov soybeans are there. July soybeans are just under the threshold.


Wheat
Fundamentals:
The wheat market is driven by the funds here.
What do they want to do?
They are holding a record short position.
Do they cover now? Or do they wait until harvest is over?
They will cover at some point, but when is the big question.
Here is their KC and Chicago wheat positons.


Normallly, it is a difficult task to rally the wheat market going into winter wheat harvest.
So part of me thinks that the funds wait until harvest is over to start covering that short positon.
Because after harvest, what real reason do they have to continue hammering wheat into the ground when they are already incredibly short?
Post harvest I think the wheat market could find a reason to go higher if the funds decide to wait here.
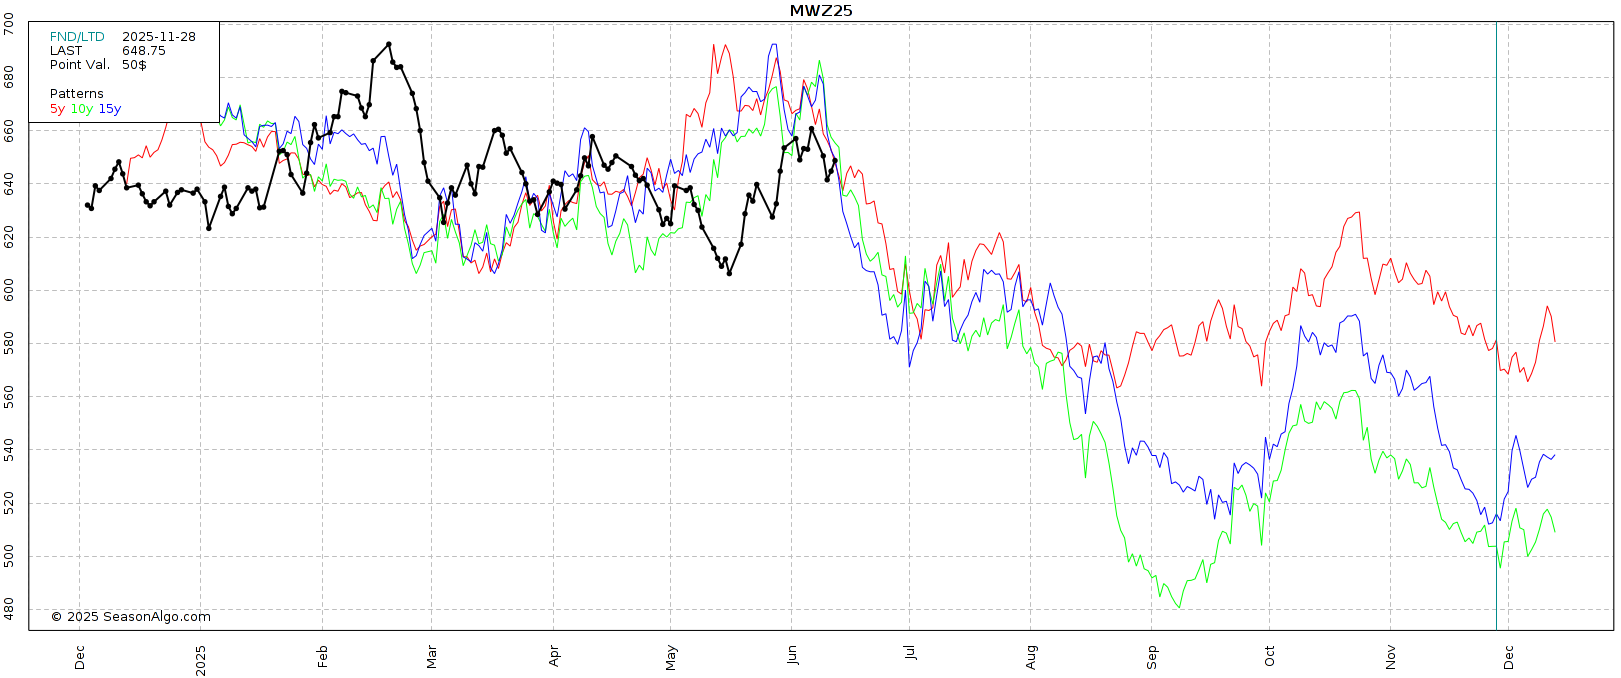
Seasonally, all 3 classes of wheat move lower here and we start to fall apart right about now.
But at the same time, none of them saw the usual seasonal rally into May either.
KC Seasonal
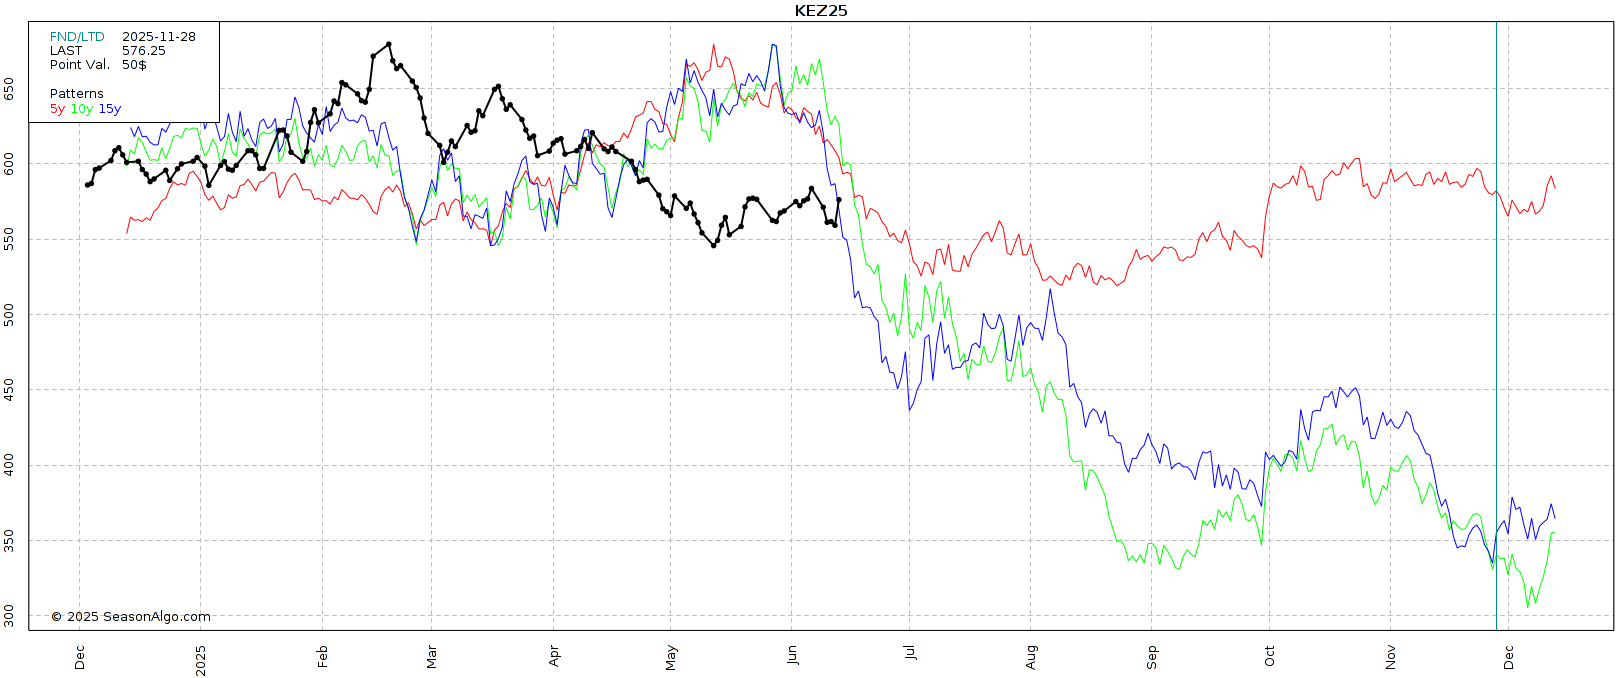
Chicago Seasonal
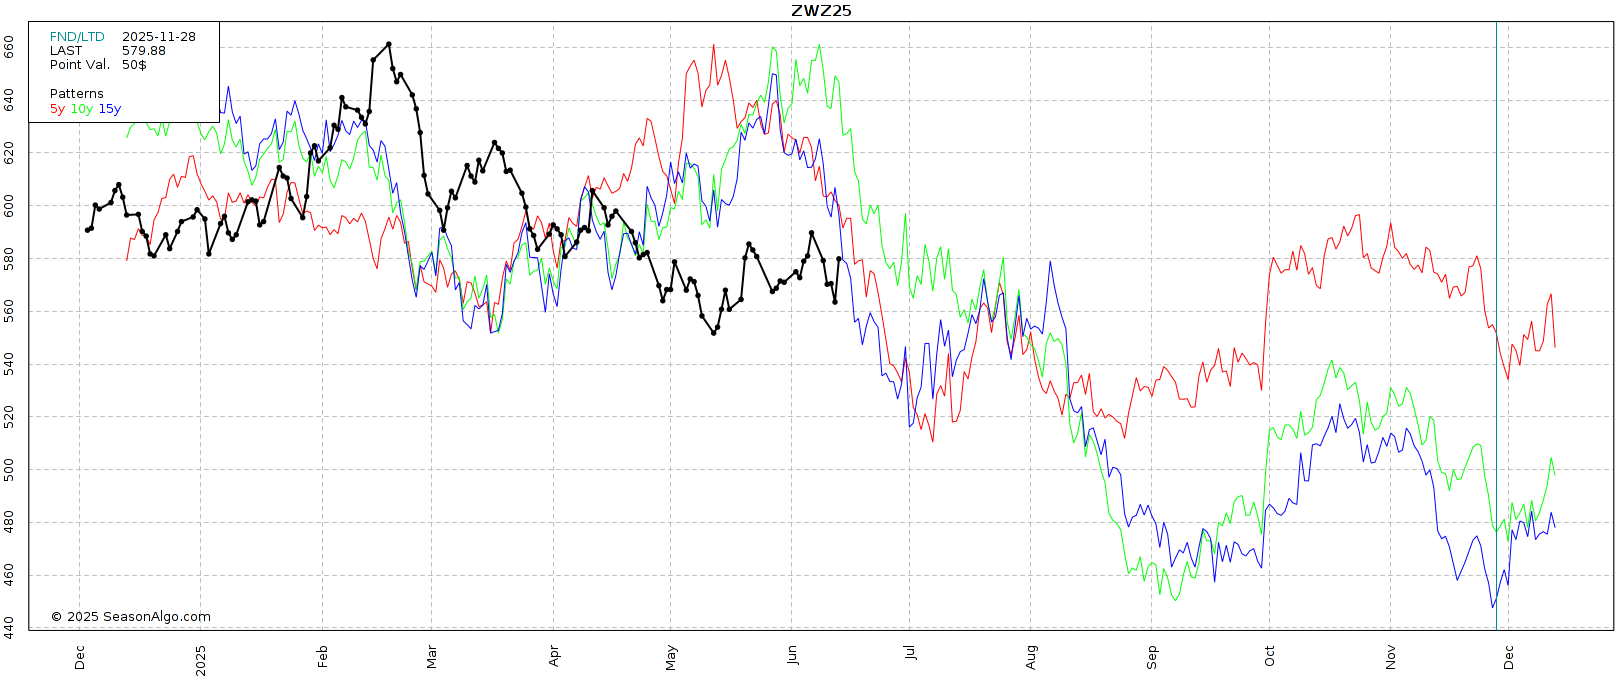
MPLS Seasonal
Technicals:
July Chicago caught a bounce right where bulls needed.
As we held the golden zone retracement (50-61.8% retracement of the entire rally we just posted).
We also posted an outside up day, as we took out yesterday’s low and closed above yesterday's high. That can often be a sign of a reversal.
Area I am looking to start to de-risk is still $5.70 and $5.85.
Those levels claw back 50-61.8% of the Feb highs.
On the recent rally we rejected right off the 38.2% retracment. So if we manage to break above that, the next logical target is 50% at $5.70.
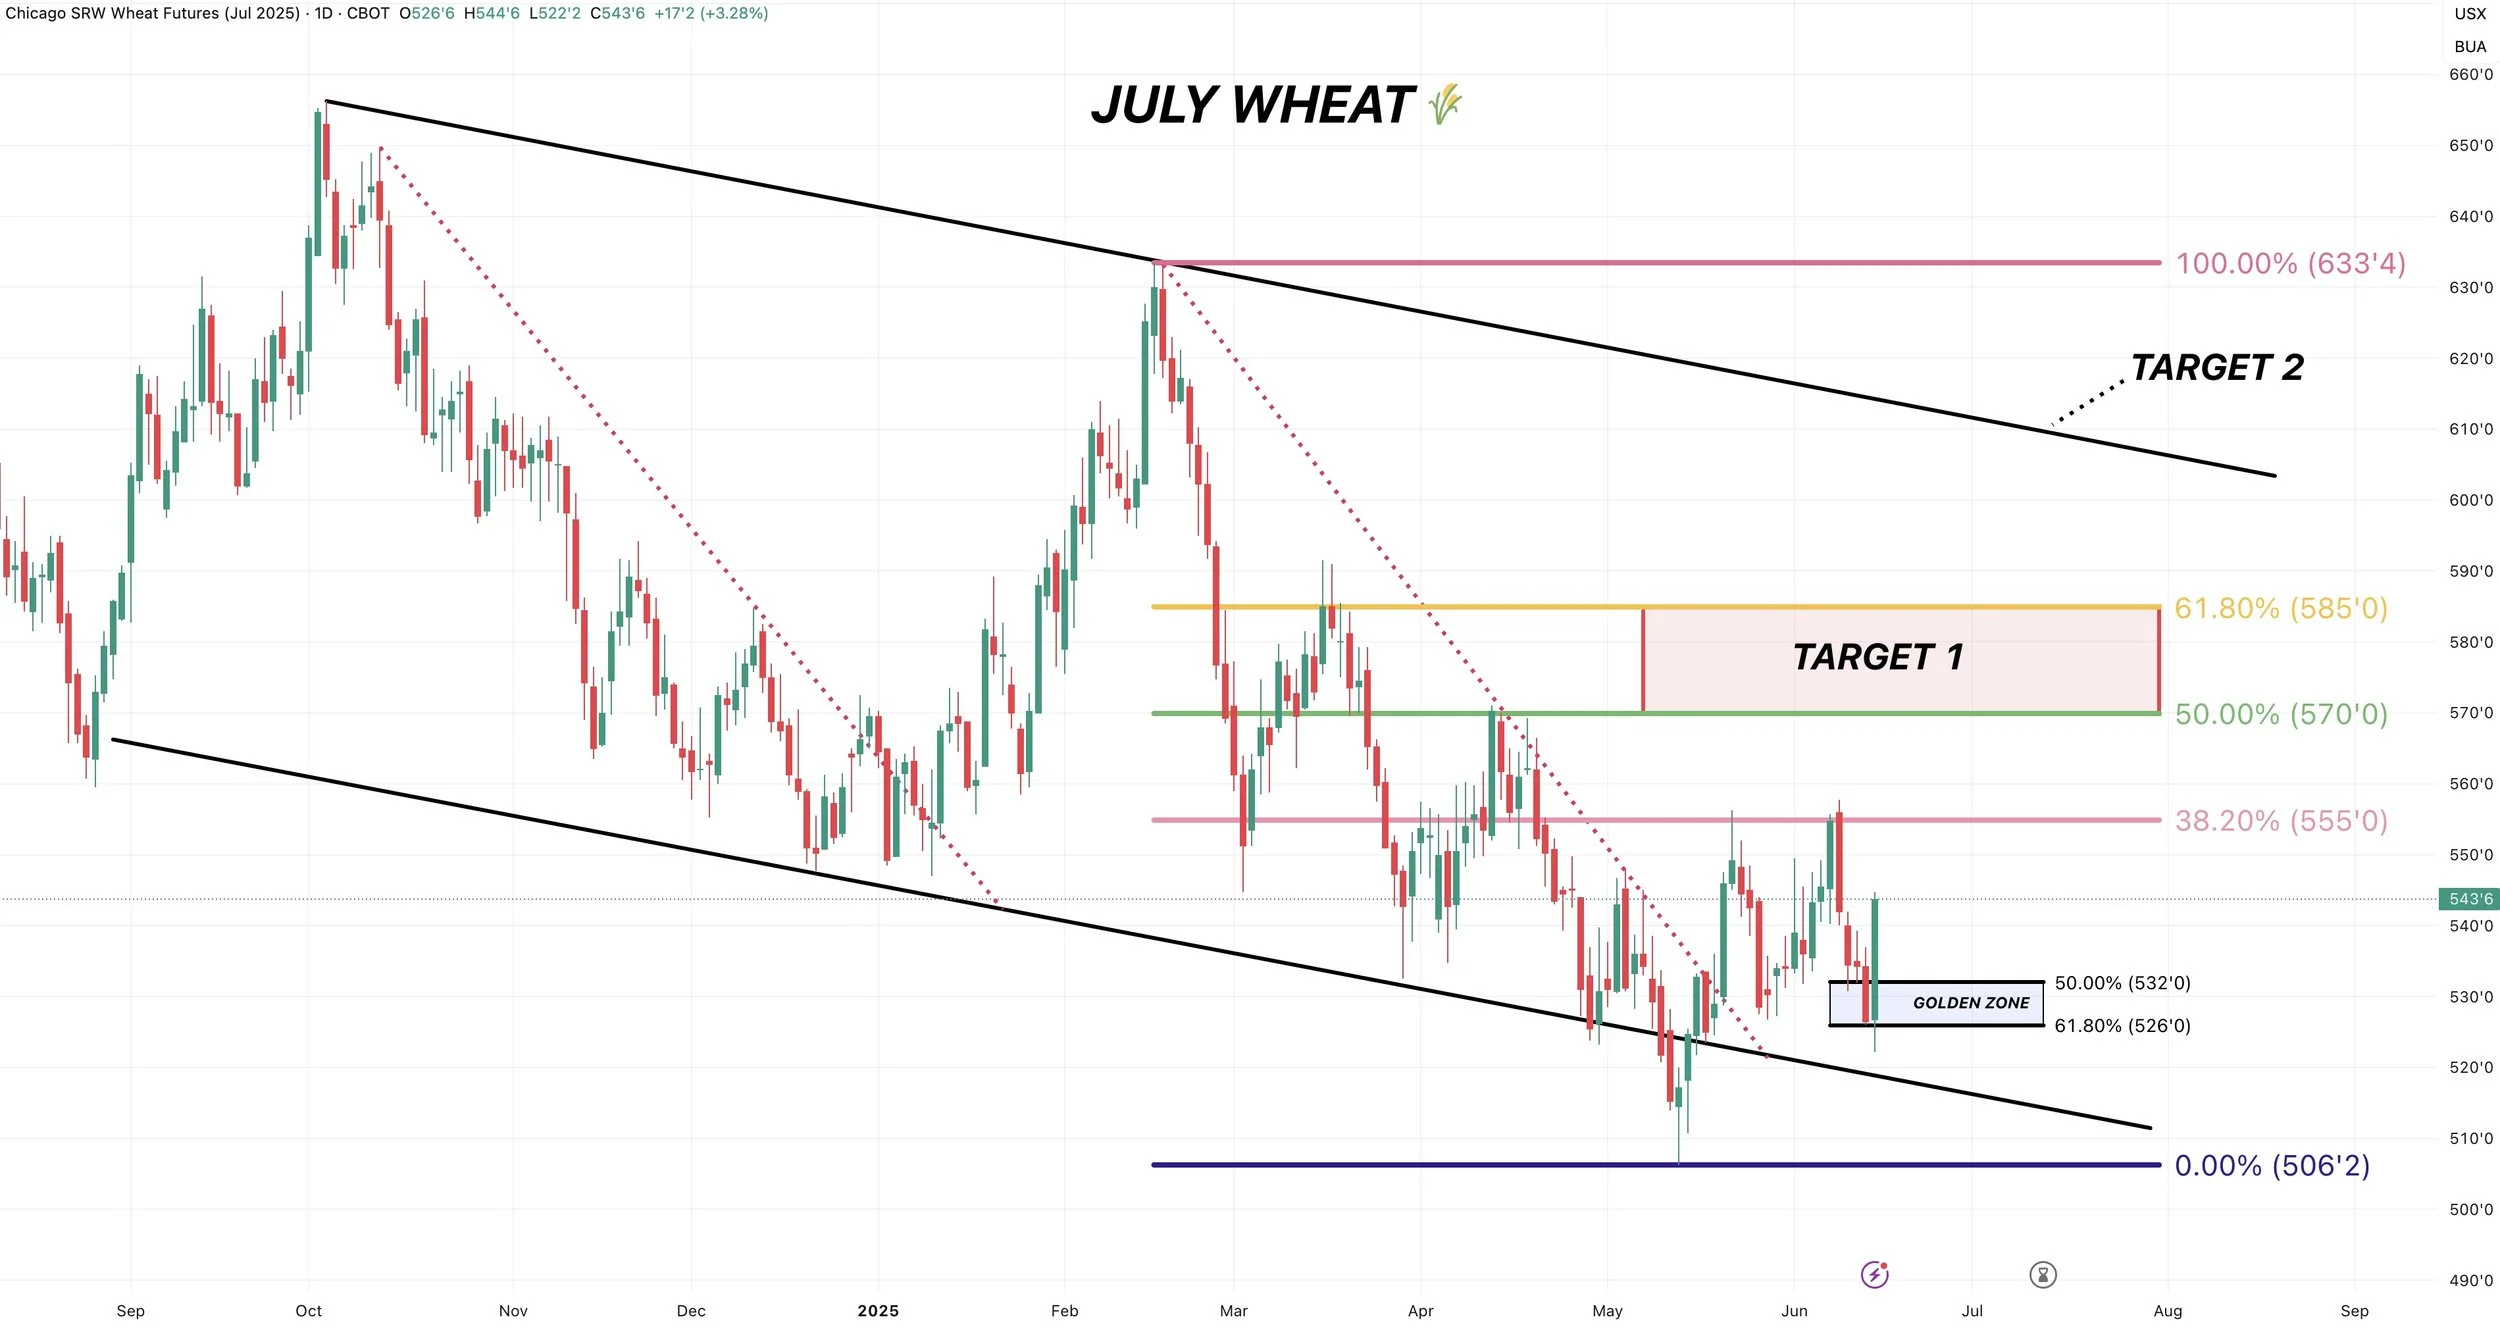
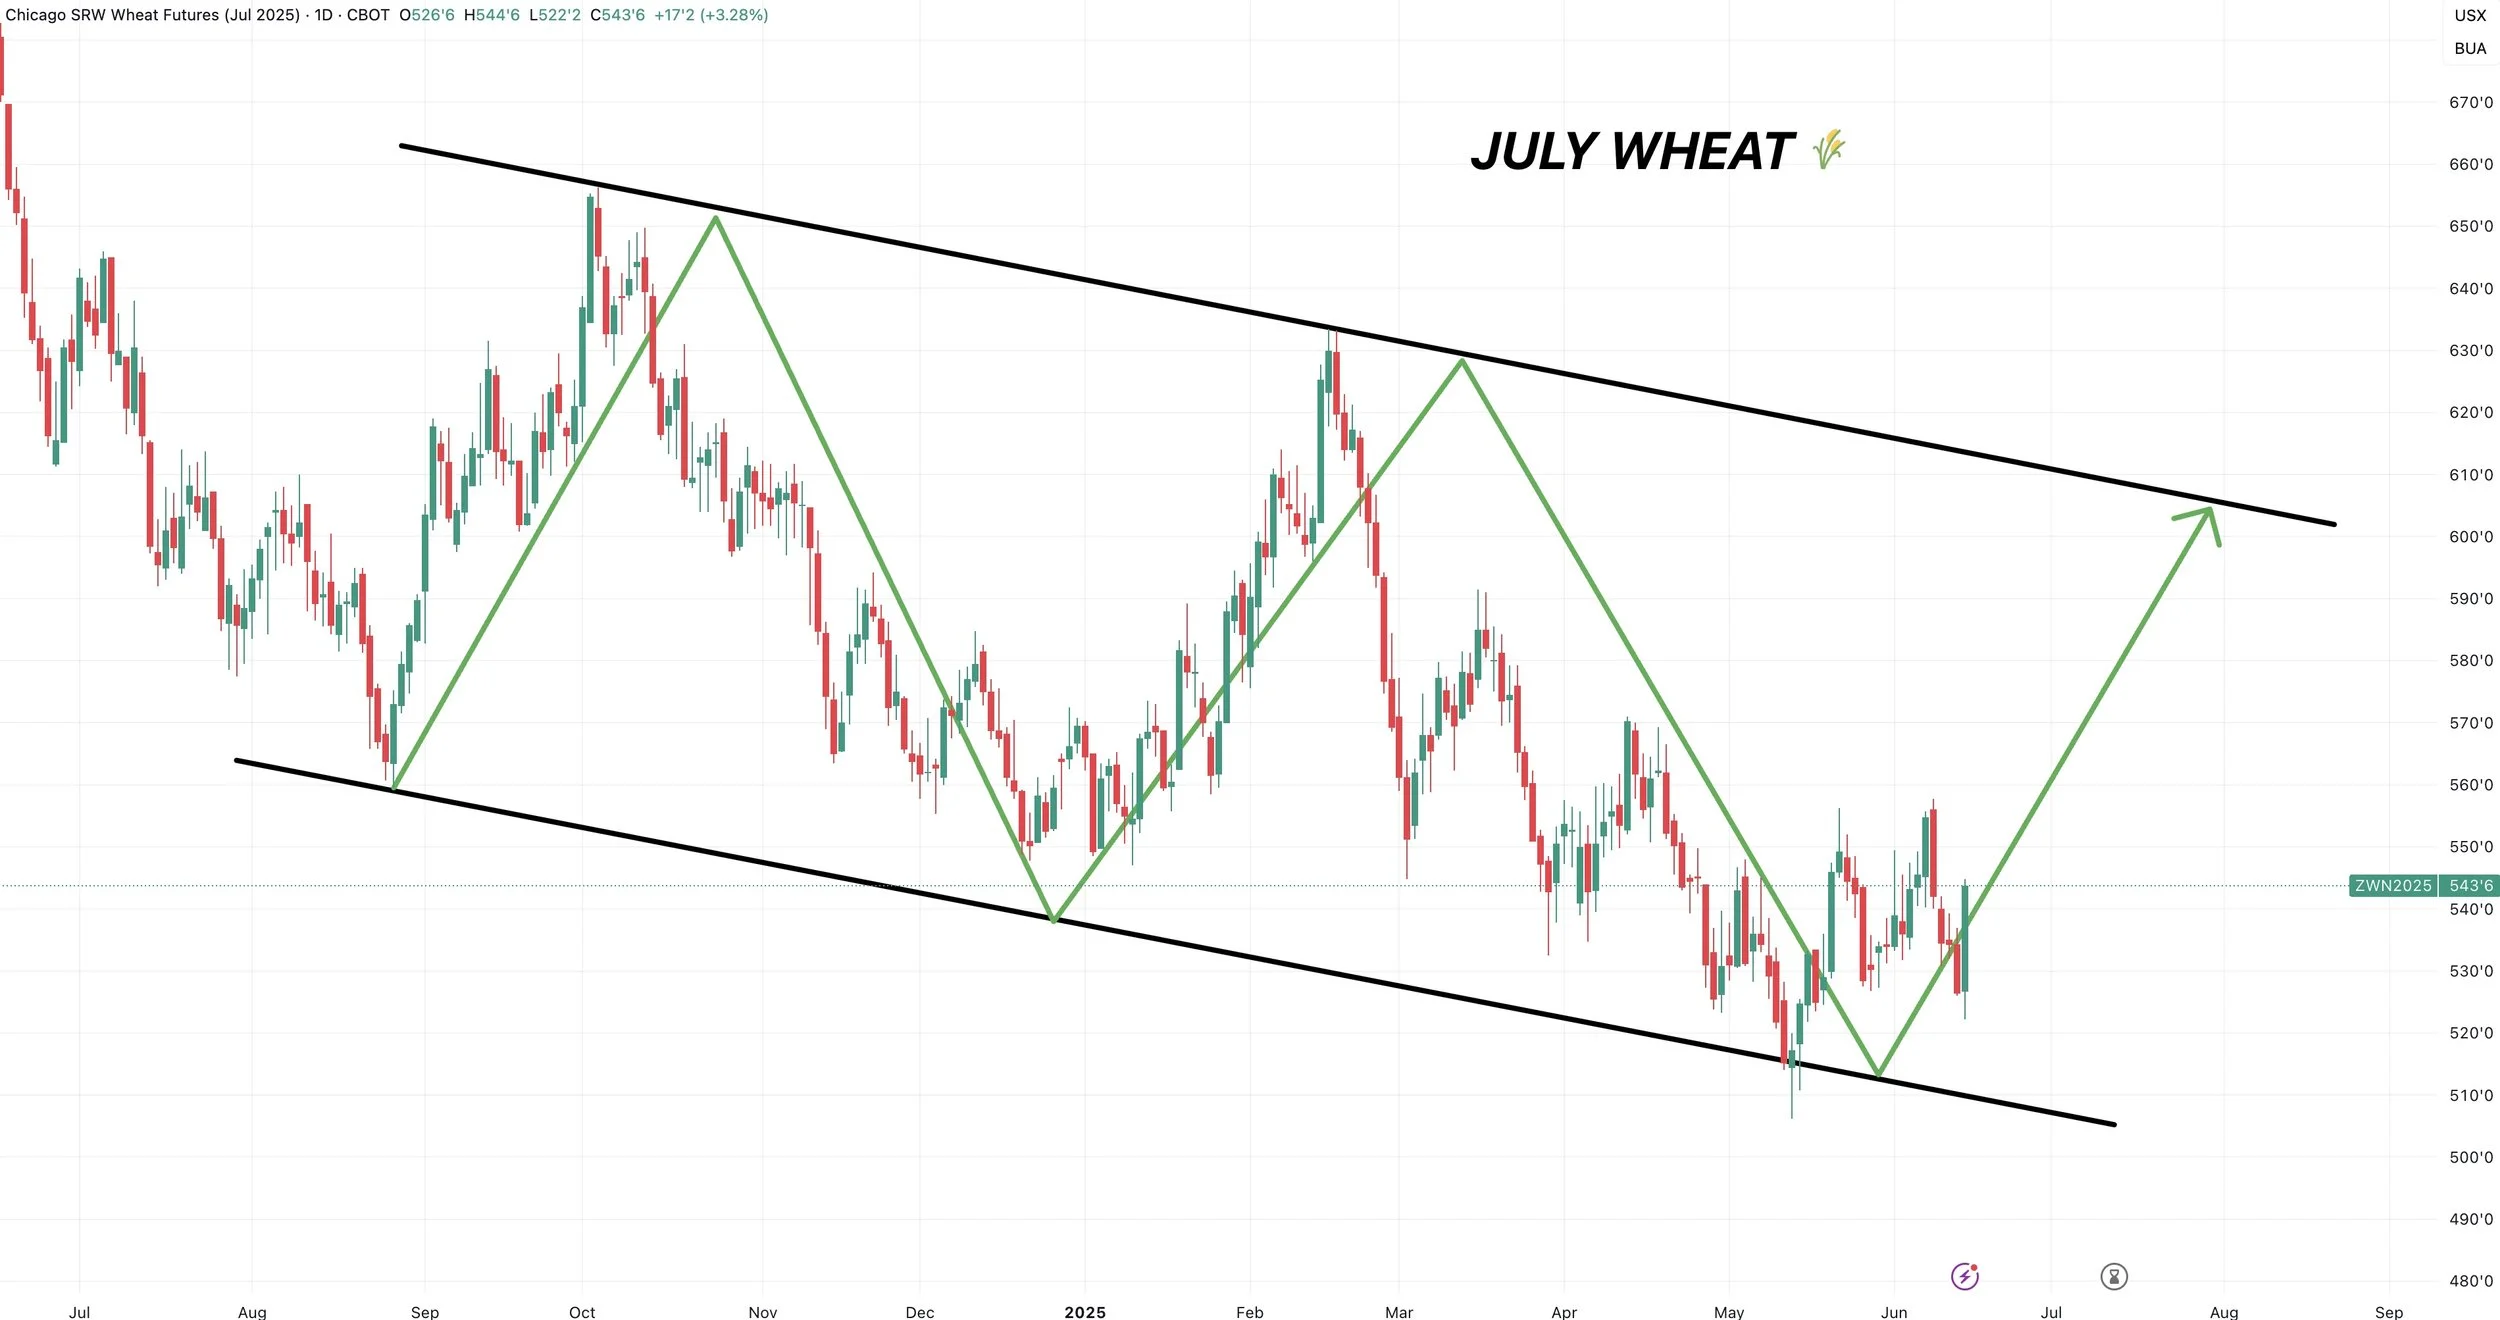
If we take a simple approach, July Chicago wheat is still holding the bottom of this downward channel.
Big picture thinking, the big point of interest would be the top of the channel.
So that is going to be our 2nd target if we somehow managed to break above target 1. ($5.70 to $5.85).
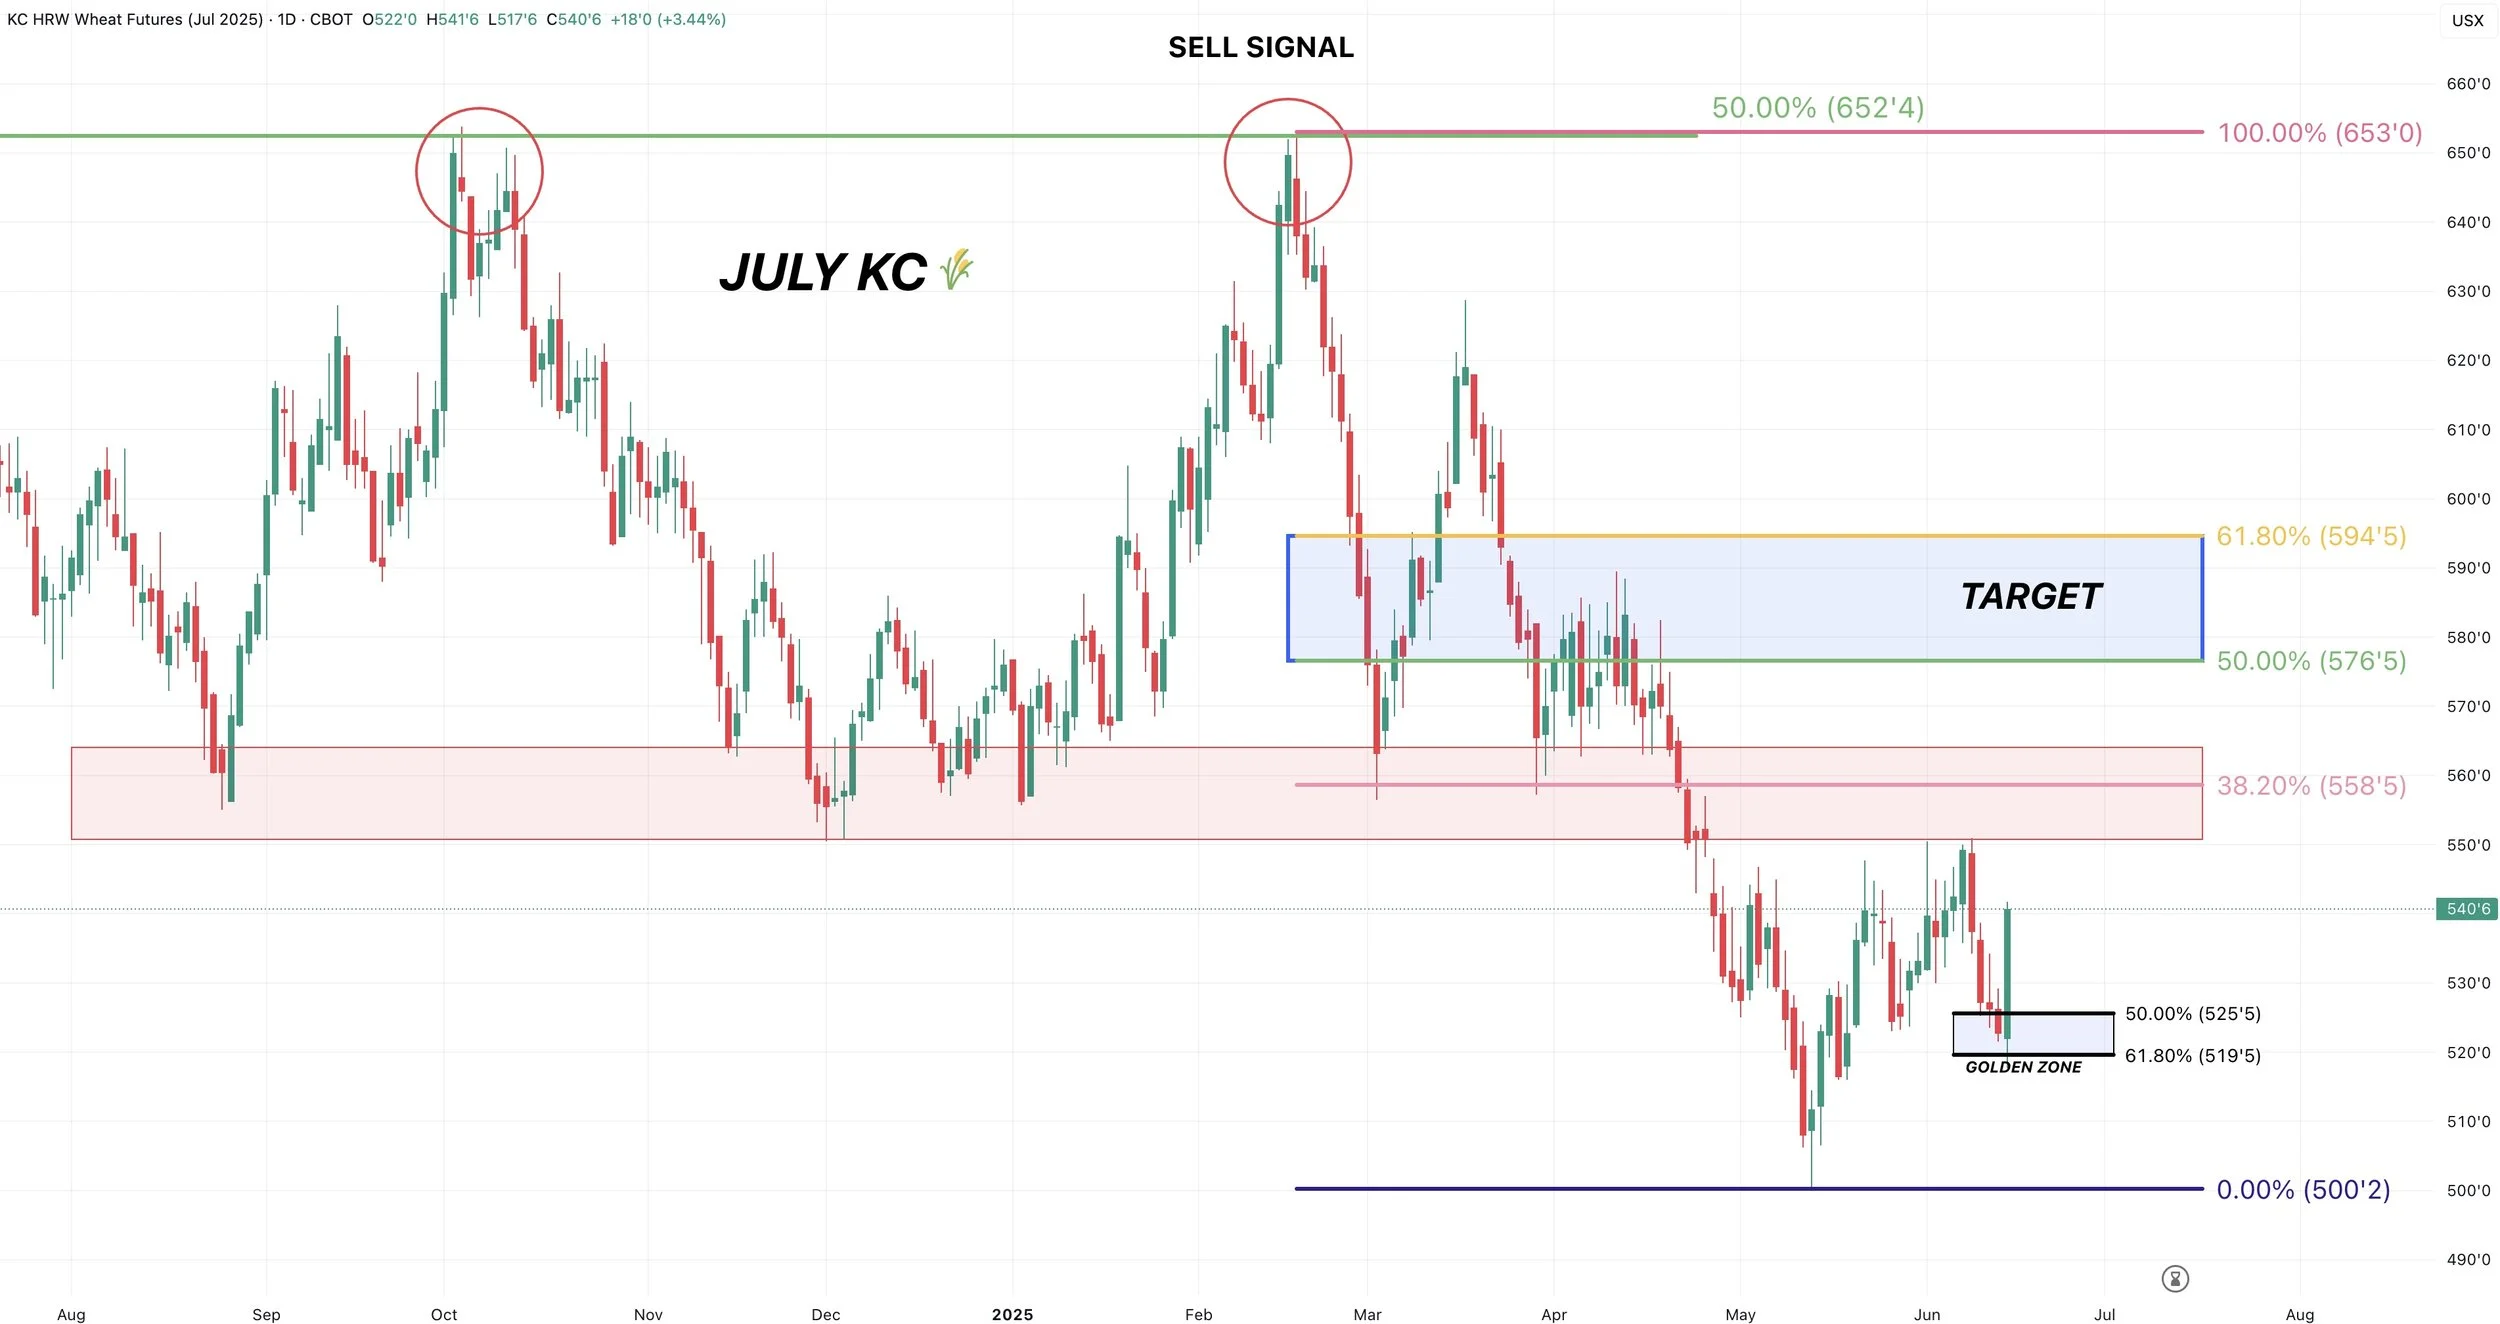
KC wheat also bounced exactly in that golden zone retracement.
That is what bulls wanted to see here to keep the bias remaining higher.
So our bias remains higher unless that box gives out.
Targets are still $5.76 to $5.94.
Past Sell or Protection Signals
We recently incorporated these. Here are our past signals.
June 5th: 🐮
Cattle sell signal & hedge alert.
June 2nd: 🌾
MPLS wheat sell signal.
April 10th: 🌽
Old crop corn sell signal.
March 19th: 🐮
Cattle hedge & sell signal.
Feb 18th: 🌽 🌾
Old crop KC wheat & old crop corn signal.
Jan 23rd: 🌽 🌱
Corn & beans old crop sell signal.
CLICK HERE TO VIEW
Jan 15th: 🌽 🌱
Corn & beans hedge alert/sell signal.
Jan 2nd: 🐮
Cattle hedge alert at new all-time highs & target.
Dec 11th: 🌽
Corn sell signal at $4.51 200-day MA
CLICK HERE TO VIEW
Oct 2nd: 🌾
Wheat sell signal at $6.12 target
Sep 30th: 🌽
Corn protection signal at $4.23-26
Sep 27th: 🌱
Soybean sell & protection signal at $10.65
Sep 13th: 🌾
Wheat sell signal at $5.98
May 22nd: 🌾
Wheat sell signal when wheat traded +$7.00
Want to Talk?
Our phones are open 24/7 for you guys if you ever need anything or want to discuss your operation.
Hedge Account
Interested in a hedge account? Use the link below to set up an account or shoot Jeremey a call at (605)295-3100.
Check Out Past Updates
6/12/25
USDA NON-EVENT. WHAT’S NEXT?
6/11/25
DIVERGENCE & SEASONAL SELL OFF?
6/10/25
BEING PATIENT VS BALANCING YOUR RISK
6/9/25
WHAT IF WE DON’T GET A WEATHER SCARE?
6/5/25
CORN & BEANS HOLDING CRUCIAL SPOTS
6/5/25
CATTLE SELL SIGNAL & HEDGE ALERT
6/4/25
HOW UNKNOWNS IMPACT MARKETING DECISIONS
6/3/25
KEY SPOTS ON THE CHARTS FOR CORN & BEANS
6/2/25
NEW LOWS IN CORN. DE-RISKING MPLS WHEAT
6/2/25
SPRING WHEAT SELL SIGNAL
5/30/25
SEASONAL RALLY STILL IN THE CARDS?
5/29/25
WHAT IS YOUR PLAN IF WE DO NOT RALLY?
5/28/25
ZERO PREMIUM IN THE GRAIN MARKETS
5/27/25
CORN CONDITIONS DISAPPOINT & JUNE OUTLOOK IMPROVES
5/23/25
TARIFFS SPOOK MARKET. GAME PLAN MOVING FORWARD
5/22/25
CHART BREAKDOWNS & TARGETS
5/21/25
RISK TO THE UPSIDE WITH WEATHER?
5/20/25
WHEAT SHORT COVERING & HISTORY OF YIELD CHANGES
5/19/25
ANYONE LEFT TO SELL WHEAT? 181 CORN YIELD POSSIBLE?
5/16/25
FUNDS SHORT CORN. MARKETS WAITING ON WEATHER
5/15/25
BEANS HAMMERED ON RUMOR & WHEAT FINDING LIFE
5/14/25
DECISIONS & POSSIBILITIES IN GRAINS
5/13/25
GRAINS RALLY OFF LOWS
5/12/25
USDA REPORT. HOW THIS CHANGES THINGS
5/9/25
BIGGEST RISKS IN USDA REPORT
5/8/25
USDA MONDAY & HISTORY OF WEATHER RALLIES
5/7/25
NEW 2025 LOWS FOR CORN
5/6/25
WHAT’S A SUMMER RALLY LOOK LIKE?
5/5/25
CORN ERASES ENTIRE APRIL RALLY
5/2/25
SELL INTO UNCERTAINTY. NOT KNOWN FACTORS
5/1/25
THE CASE AGAINST A FEB TOP IN CORN
4/30/25
APPROACHING KEY TIME PERIOD FOR GRAINS
4/29/25
PLANTING & FIRST NOTICE DAY PRESSURE. CORN CLOSE TO BOTTOM?
4/28/25
CAPTURING INVERSE & SEASONAL PREPARATION
4/25/25
HOW OFTEN DOES CORN NOT BREAK APRIL HIGHS?
4/24/25
KNOW WHEN TO SELL. BEANS BREAK 200-DAY FIRST TIME IN 483 DAYS
4/23/25
MONEY FLOW & DROUGHT CARDS
4/22/25
CRUCIAL SPOT FOR CORN & BEANS
4/21/25
NO PLANTING THREAT YET
4/18/25
POTENTIAL OPPORTUNITIES, BASIS CONTRACTS & STRATEGIES
4/16/25
HOW YIELD IMPACTS CARRYOUT. MAJOR SPOT FOR SOYBEANS
4/15/25
TOTAL CHART BREAKDOWNS & TARGETS
4/14/25
TECHNICAL SELLING IN GRAINS
4/11/25
SPECIFIC GRAIN MARKETING DECISIONS
4/10/25
USDA REPORT. HOW THIS IMPACTS CORN
4/9/25
TARIFFS GIVE. TARIFFS TAKE
4/8/25
CORN’S DIVERGING STRENGTH
4/7/25
SOLID PRICE ACTION DESPITE OUTSIDE FEAR
4/4/25
CORN PRICE ACTION SPEAKS VOLUME. ANY HOPE LEFT FOR SOYBEANS?
4/3/25
WHAT IS LEFT FOR CORN BEARS? TRADE WAR: CHARTS HOLDING SUPPORT
4/2/25
SHOULD UNKNOWNS KEEP A FLOOR UNDER GRAIN PRICES?
4/1/25
HOW DO ACRES IMPACT FUTURE OF THE GRAINS?
3/31/25
USDA REPORT: NOW WHAT?
3/28/25
ALL EYES ON USDA
3/27/25
PRE-USDA POSITIONING. DON’T GIVE GRAIN AWAY
3/26/25
HISTORY OF MARCH INTENTIONS. SOYBEANS UNDERVALUED?
3/25/25
6 DAYS UNTIL MAJOR USDA REPORT
3/24/25
HOW TO POSITION YOURSELF BEFORE PLANTING
3/21/25
REASONS TO BE OPTIMISTIC IN GRAINS?
3/20/25
WAS THAT THE BOTTOM IN CORN?
3/19/25
THE PATH HIGHER & THE DOWNSIDE RISKS IN GRAINS
3/18/25
SEASONALS, CATTLE HEDGE, CHARTS & DROUGHT?
3/17/25
WHEAT RALLIES. DON’T GET BACKED INTO A CORNER
3/14/25
MARCH 31ST REPORT THOUGHTS & WHAT’S NEXT FOR GRAINS
3/13/25
EXPLAINING RE-OWNERSHIP VS COURAGE CALLS
3/12/25
TARIFF FEARS. EU, CANADA, & ETHANOL
3/11/25
USDA SNOOZE. RECORD FUND SELLING A CONCERN?
3/10/25
USDA TOMORROW. GETTING COMFORTABLE IN MARKETING
3/7/25
HOW TIGHT IS THE WORLD & US SITUATION?
3/6/25
TARIFFS PUSHED BACK. FUTURE OPPORTUNITIES?
3/5/25
IS GRAINS BIGGEST RISK WEAK CRUDE & DEFLATION?
3/4/25
TRADE WAR BEGINS. 8TH DAY OF PAIN FOR GRAINS
3/3/25
TARIFFS ON TOMORROW. BUY SIGNAL
3/3/25
BUY SIGNAL
2/28/25
WHEN WILL THE BLEEDING STOP?
2/27/25
CORN AT CRITICAL SPOT. USDA ACRE REPORT. WAY TOO EARLY DROUGHT TALK
2/26/25
HISTORY SUGGESTS CORN TOP ISN’T IN? ACRE OUTLOOK TOMORROW
2/25/25
POSITIVE CLOSE. WHAT TO KNOW ABOUT USDA OUTLOOK
2/24/25
USDA OUTLOOK, FIRST NOTICE DAY & BRAZIL
2/21/25
WHAT TO EXPECT MOVING FORWARD IN GRAINS
2/20/25
FIRST NOTICE DAY CONCERNS. MASSIVE CORN ACRES OR NOT?
2/19/25
HOW TIGHT IS THE CORN SITUATION?
2/18/25
MORE DETAILS ON TODAYS SELL SIGNAL
2/18/25
OLD CROP KC WHEAT & CORN SELL SIGNAL
2/14/25
WHEAT BREAKING OUT ON WEATHER RISK. TECHNICALS & FUNDAMENTALS
2/12/25
GLOBAL GRAIN SITUATION, ACRE TALK, CHARTS & MORE
2/11/25
USDA: NOT A BEARISH REPORT. DISAPPOINTING PRICE ACTION
2/10/25
USDA TOMORROW. LONG TERM PATH FOR SUB 10% CORN STOCKS TO USE?
2/7/25
WHY WOULD THE FUNDS EXIT THEIR LONGS?
2/6/25
WHEAT FINALLY CATCHING A BID
2/5/25
COMPLETE THOUGHTS ON MARKETS: BACK & FORTH DISCUSSION
2/4/25
STRONG JANUARY LEAD TO STRONG YEAR? TARIFFS, CHARTS & MORE
2/3/25
TARIFFS PUSHED BACK
1/31/25
TARIFF NEWS ALL OVER THE PLACE. ARE YOU PREPARED FOR POSSIBILITIES?
1/30/25
WHEAT BULL ARGUMENT. TRUMP ADDS TARIFFS
1/29/25
CORN APPROACHES $5.00
1/28/25
TARIFFS, CORN FUNDS, SOUTH AMERICA & MORE
1/27/25
HEALTHY CORRECTION WE TALKED ABOUT & TARIFF NEWS
1/24/25
GRAINS DUE FOR SHORT TERM CORRECTION?
1/23/25
OUR ENTIRE NEW CROP SALES THOUGHTS & OLD CROP SELL SIGNAL
1/22/25
GRAINS TAKE A BREATHER. IS CORN IN A BULL OR BEAR MARKET?
1/21/25
HUGE DAY IN GRAINS. WHAT TO DO WITH OLD CROP VS NEW CROP
Read More
1/20/25
VIDEO CHART UPDATE
1/17/25
TRUMP, CHINA, ARGY & USING THE SPREADS INVERSE
1/16/25
OLD CROP LEADS US LOWER. MARKETING THOUGHTS
1/15/25
SIGNAL & HEDGE ALERT QUESTIONS EXPLAINED. IS $6 CORN EVEN POSSIBLE?
1/14/25
MORE DETAILS ON TODAYS HEDGE ALERT & SELL SIGNAL
1/14/25
CORN & SOYBEANS HEDGE ALERT/SELL SIGNAL
1/13/25
USDA GAME CHANGER OR NOT?
1/10/25
BULLISH USDA FOR CORN & BEANS
1/9/25
USDA OUT TOMORROW
1/8/25
2 DAYS UNTIL USDA. BE PREPARED
1/7/25
THE HISTORY OF THE JAN USDA & MORE
1/6/25
MAJOR USDA REPORT FRIDAY
Read More
1/3/25
UGLY DAY ACROSS THE GRAINS
1/2/25