
WHEAT SHORT COVERING & HISTORY OF YIELD CHANGES
MARKET UPDATE
You can scroll to read the usual update as well. As the written version is the exact same as the video.
Timestamps for video:
Wheat Funds: 0:00min
History of Yield Change: 1:00min
Corn: 5:20min
Beans: 8:30min
Wheat: 11:10min
Want to talk about your situation?
(605)295-3100
Futures Prices Close

Overview
The wheat market leads the grains higher as corn follows higher as well. The soybean market wasn’t as strong but bounced off some important technical support (the 200-day MA) which we will touch on later.
Why was wheat so strong today?
For starters winter wheat crop conditions came in down -2% G/E yesterday (although the crop is still in it's best condition since 2020).
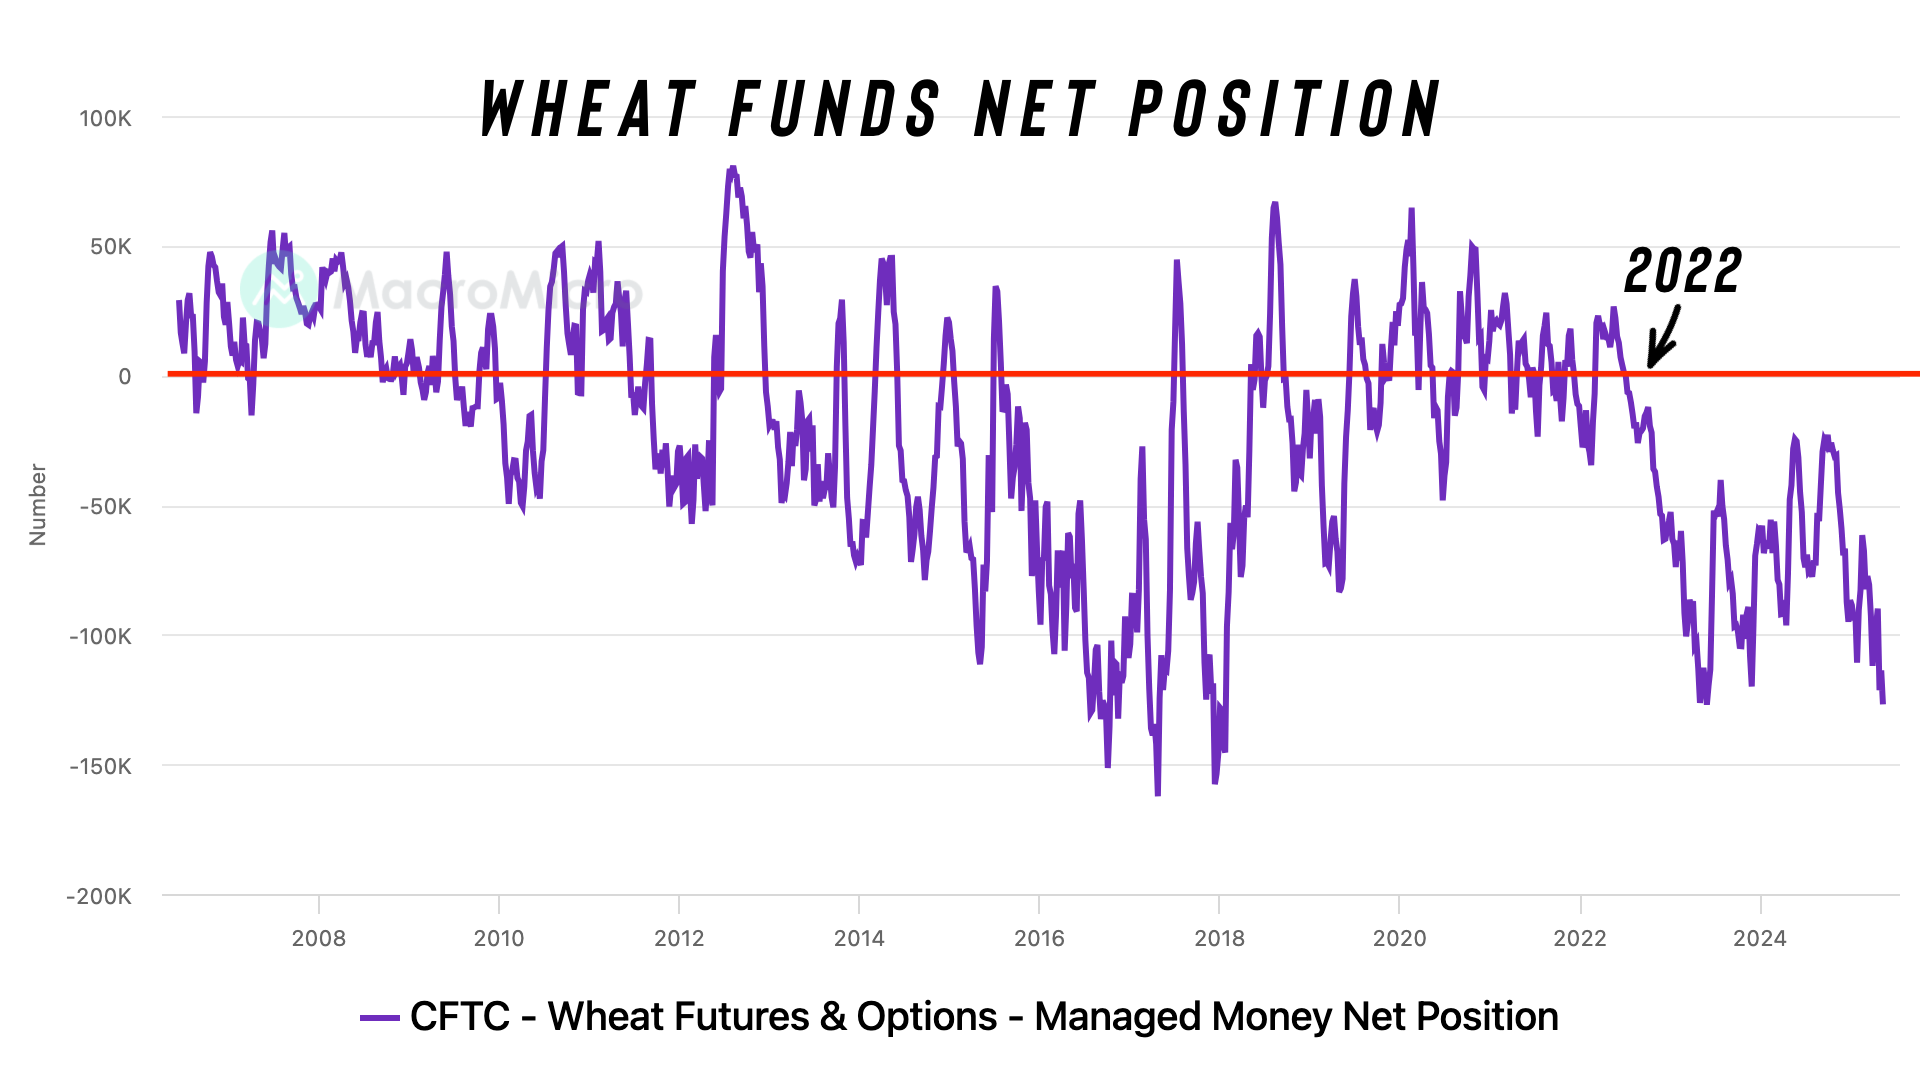
It looks like mostly short covering from the funds.
The recent data showed that the funds were record short across the wheat complex.
At a certain point, with prices down -$1.50 the past few months, it just doesn’t make sense to continue pounding shorts. As the risk to reward simply isn’t there.
For Chicago wheat, the funds have not been long since 2022. This is one of the shortest they have ever been.
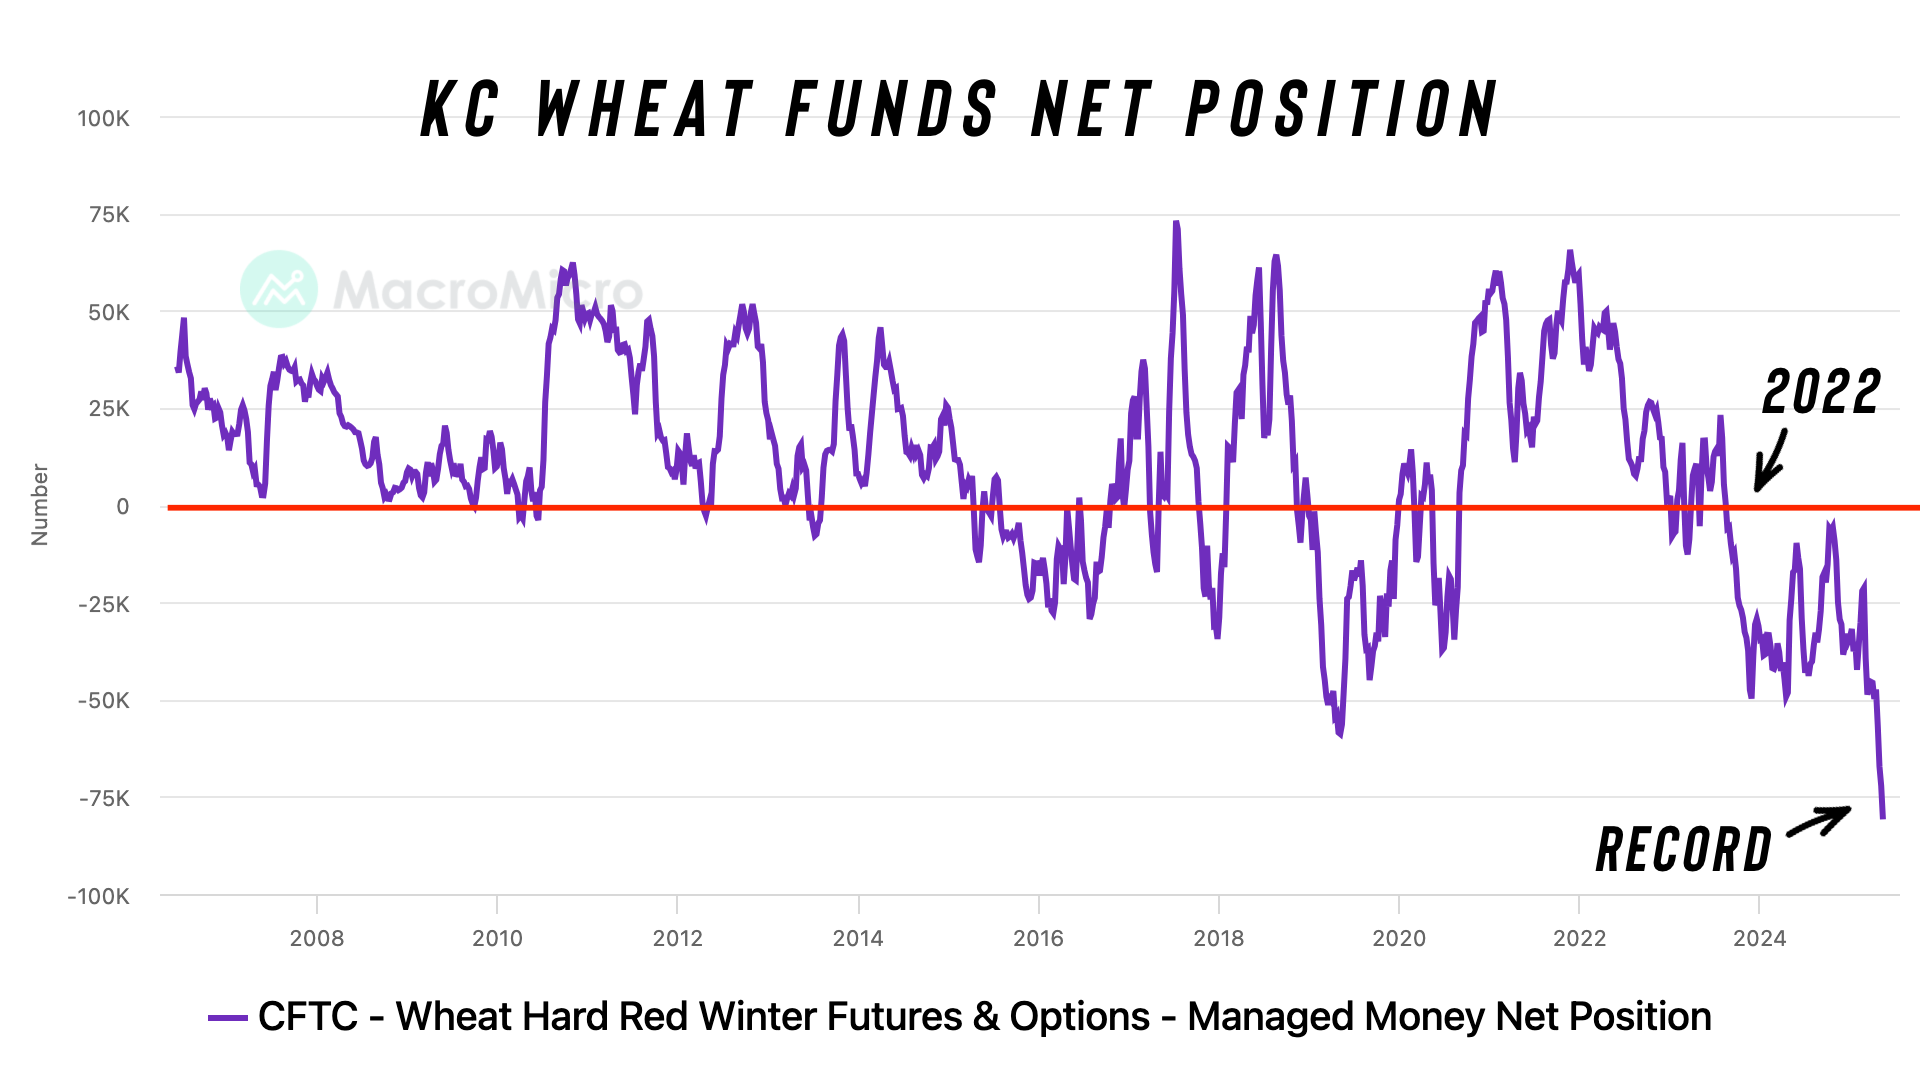
For KC wheat, this is by far the shortest the funds have ever been.
The funds have also not been long since 2022.
One has to imagine what could happen if they decide they want to cover some of this short.
History of Yield Changes
Recently we've went over how changes to yield can impact the balance sheets, but we haven’t went over how yield historically changes.
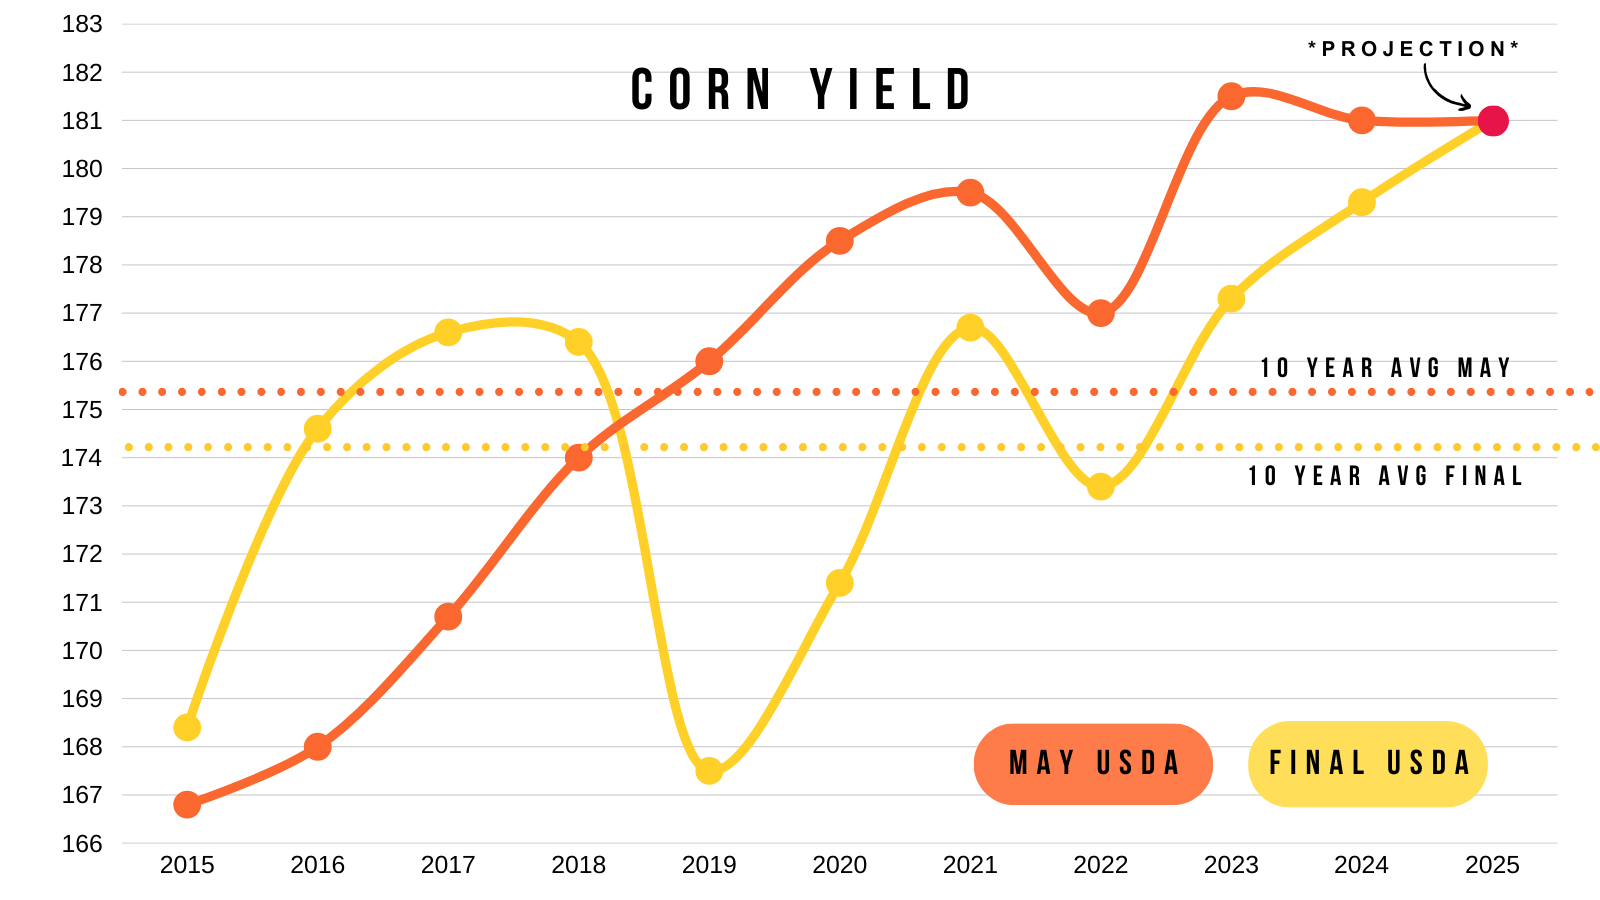
Here is a visual of yield in the May USDA report vs our final yield.
(May Yield = Orange) (Final Yield = Yellow)
We have not seen final yield come in higher than the May numbers since 2018. The trend has been lower and I don’t see any reason why that would not continue this year.
If we take the average change to yield for the past 10 years, we get a net change of -1.15 bpa. Which would put this year's yield at 179.75 bpa.
However, if we take just the past 6 years (since yield has not came in higher in 6 years) the average yield change is a sizeable -4.65 bpa.
Which would put this year's yield at 176.35 bpa.
Here is another visual of this.
This simply shows the yield change from May to the final.
The USDA's May guess has never came within +/- 1 bpa of the final yield.
The closest they got was last year, when they overestimated yield by 2 bpa.
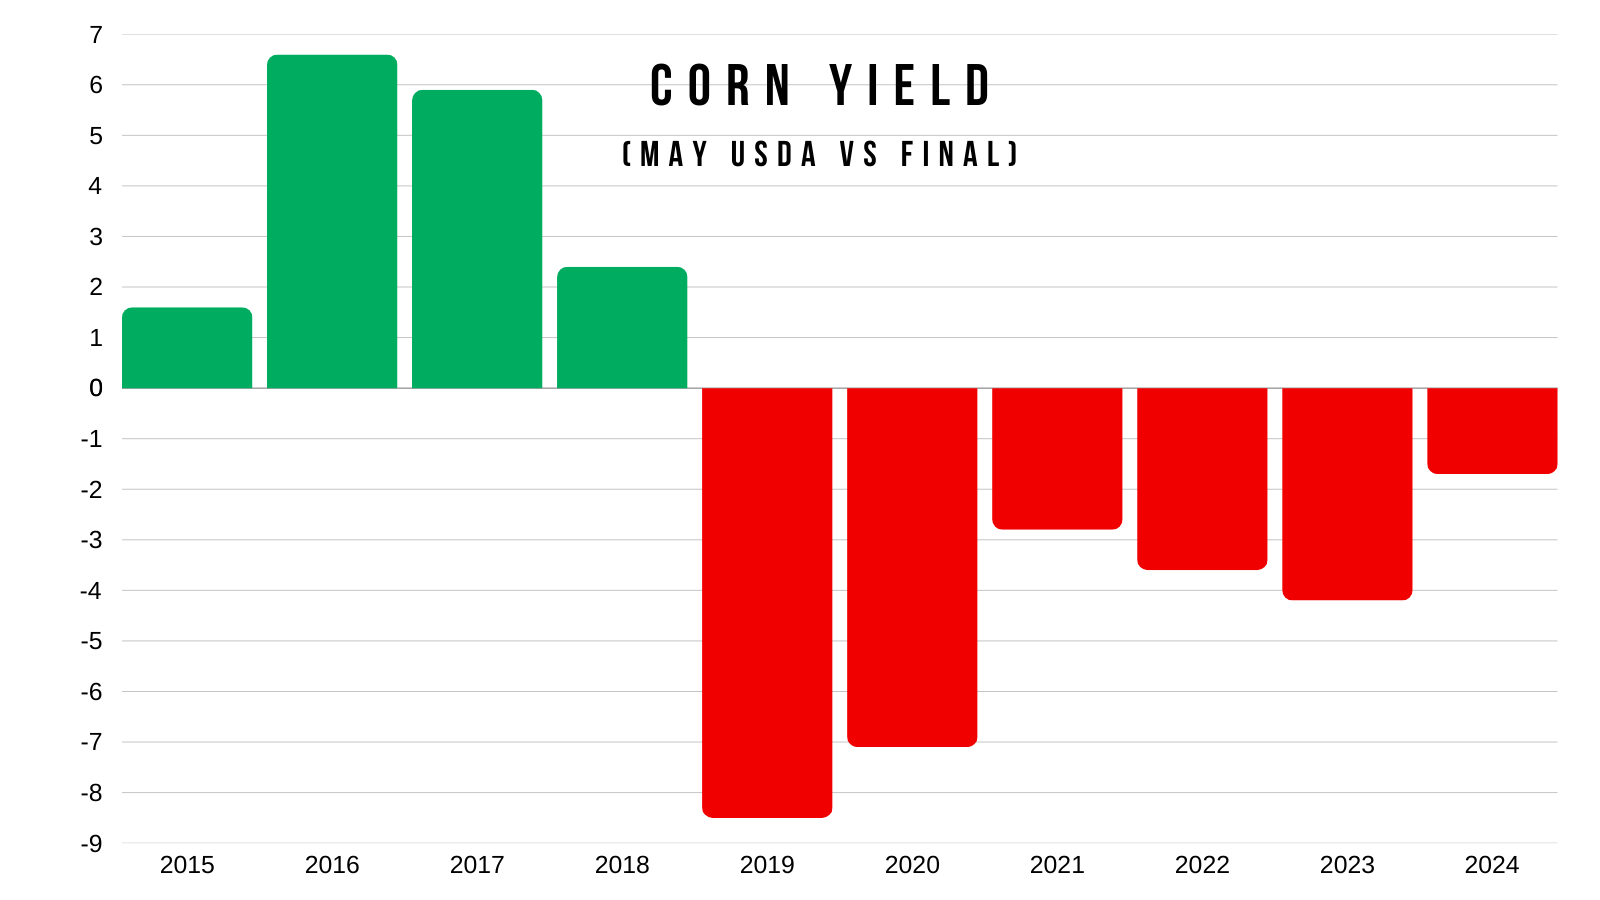
I have a very hard fathoming we are going to see a 181 yield.
Yield hasn’t been higher than the May number since 2018.
We've never even seen a 180 yield, the closest we got was last year's 179 which featured a pretty ideal growing season during the summer months.
Here is the balance sheet scenarios based on those 2 average yield changes we touched on.
*(These scenarios do not include changes to demand)*
Average Change Past 10 Years = -1.15 bpa
Yield: 179.75
Carryout: 1.69 billion bu
Stocks to Use: 10.93%
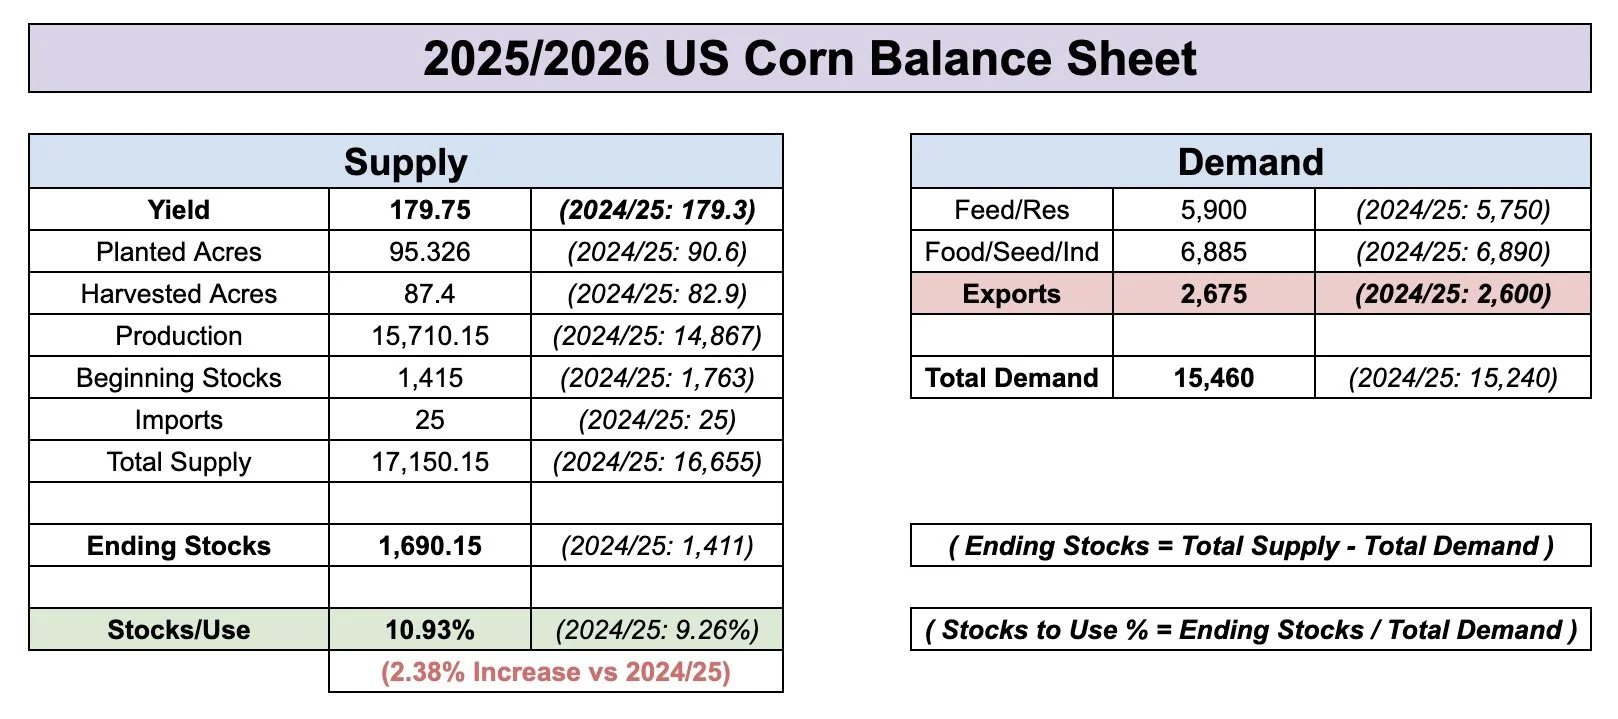
Average Change Since 2018 = -4.65 bpa
Yield: 176.35
Carryout: 1.39 billion bu
Stocks to Use: 9.00%

Current Balance Sheet for Reference
Yield: 181
Carryout: 1.80 billion bu
Stocks to Use: 11.64%

Now let's look at soybean yield.
Average Change Past 10 Years: +0.6 bpa (as we saw unexpected big yields from 2015 to 2018)
Average Change Lower: -1.68 bpa (when we see final yield lower than May yield)
The USDA has been high the past 3 years in a row.
The past 2 years they predicted a 52 bpa yield, neither came in much higher than 50.5 bpa.
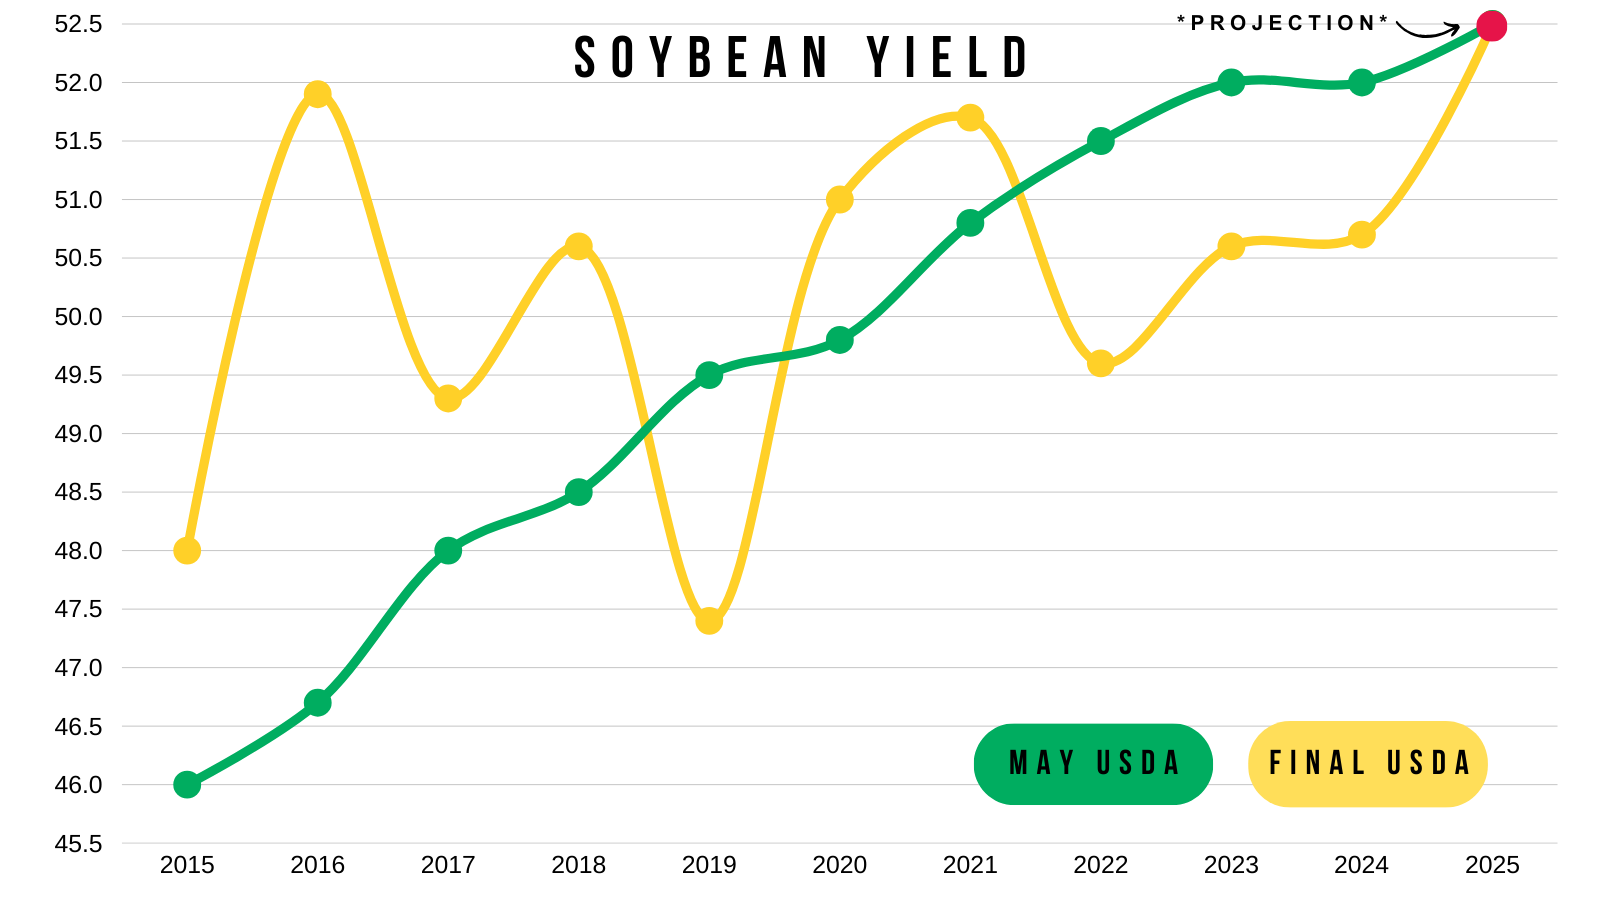
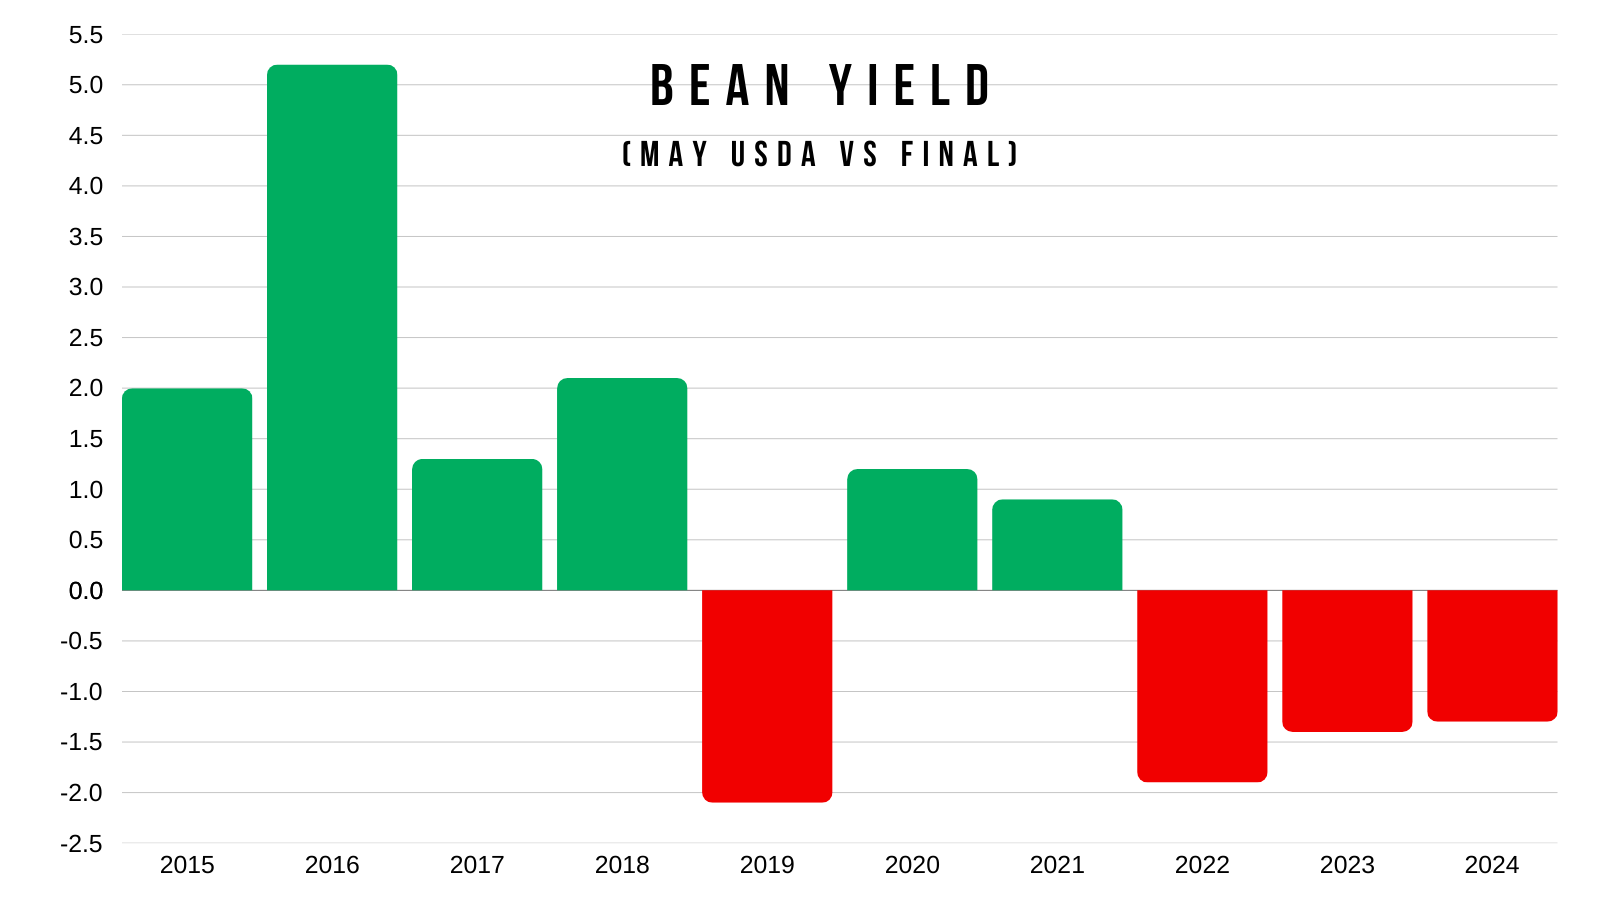
Here is another visual of the May to final yield changes.
For the past 10 years, the USDA's May guess only came within +/- 1 bpa of the final yield one time in 2021 where they missed by 1 bpa. They are always too high or too low.
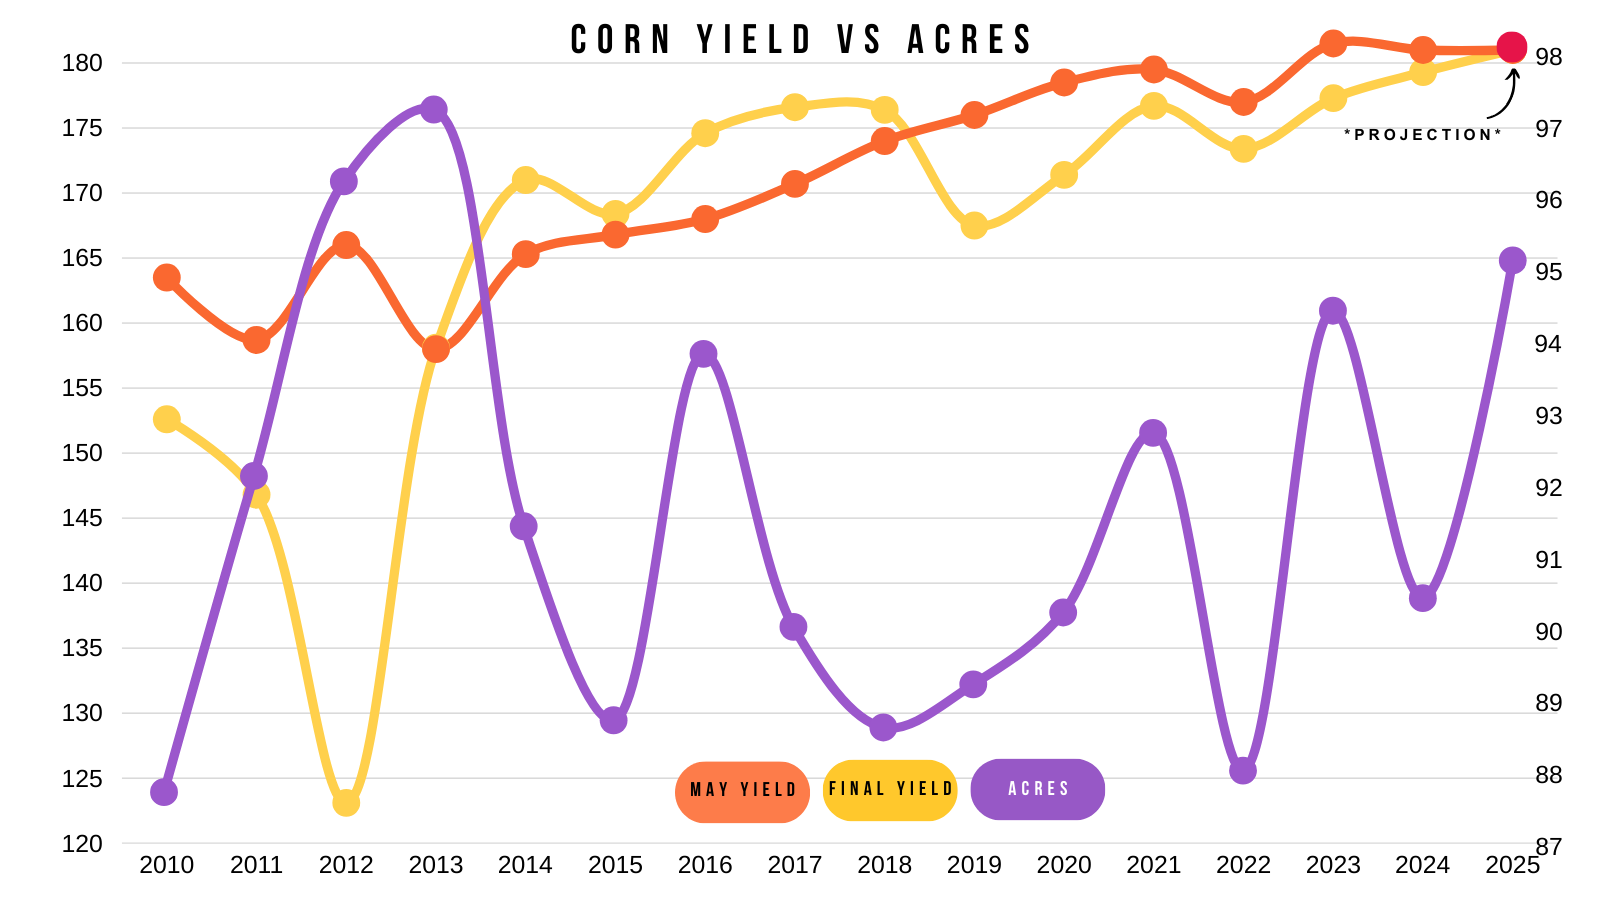
Do High Acres = Less Yield?
There is a real argument to be made that with more acres, it makes it harder to raise a massive yield due to the extra acres coming from fringe areas. Which is true.
However, if we dive into the data, do more acres actually result in a lower yield?
The data says no, not really.
This chart shows May yield (orange), final yield (yellow), and acres (purple).
If we look at years where we saw a big jump in acres, some years yield disappointed such as 2023 and 2021. Then of course you have 2012 but that had nothing to do with acres.
But then you have years such as 2016 and 2013 where we saw acres increase, yet yield was better than expected.
So despite there being an argument to be made, overall more acres does not lead to less yield. It comes down to weather.
Todays Main Takeaways
Corn
Fundamentals:
Great price action the past few days especially in new crop corn.
However, short term weather is too ideal to allow some major rally out of nowhere.
But at the same time, we will need to see ideal weather the rest of the growing season if we want to raise the record production numbers the USDA says we are going to.
To get this market to rally, we will need to see some weather premium built into it.
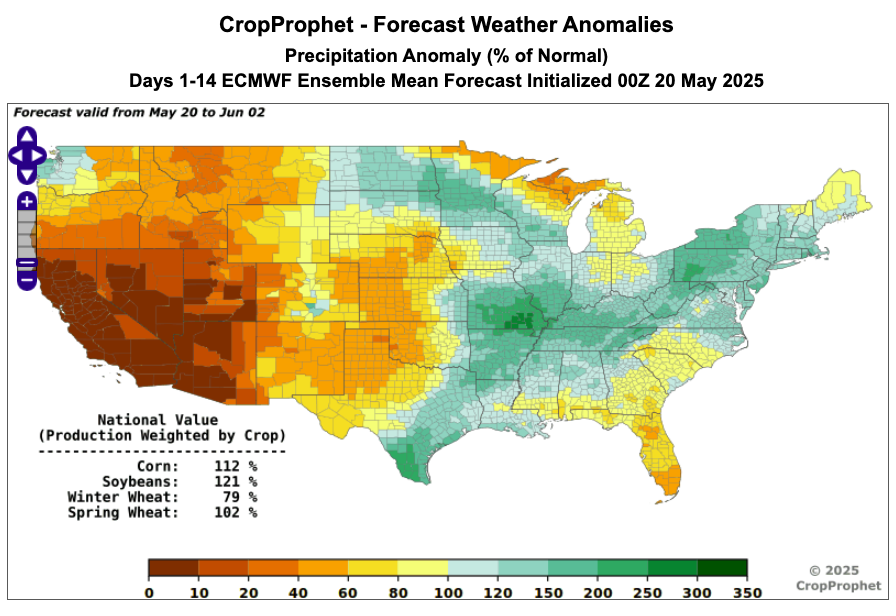
Here is the next 2 weeks. Dryness is mostly going to be seen to the west while the central to eastern belt looks wet.
Map from Crop Prophet
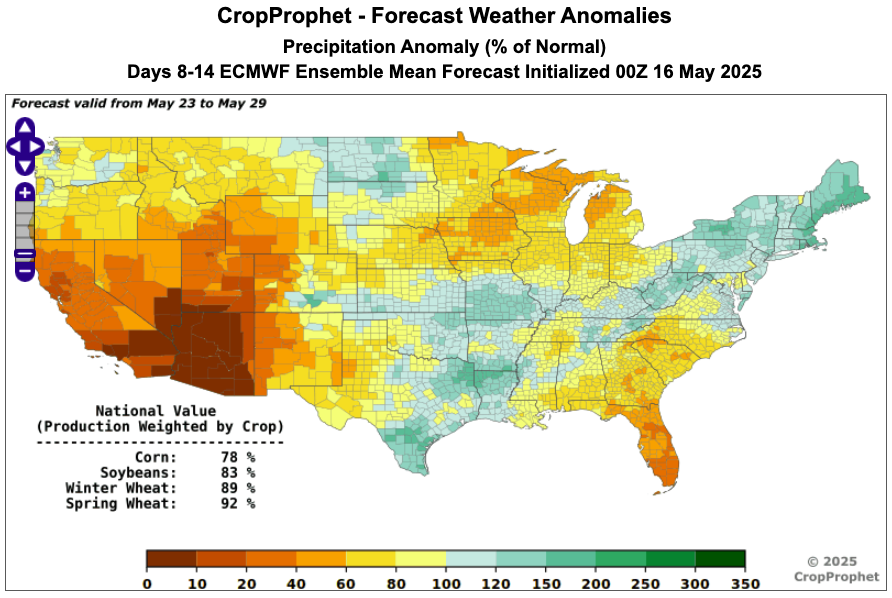
In the 8-14 day outlook most of the belt looks to dry out.
Map from Crop Prophet
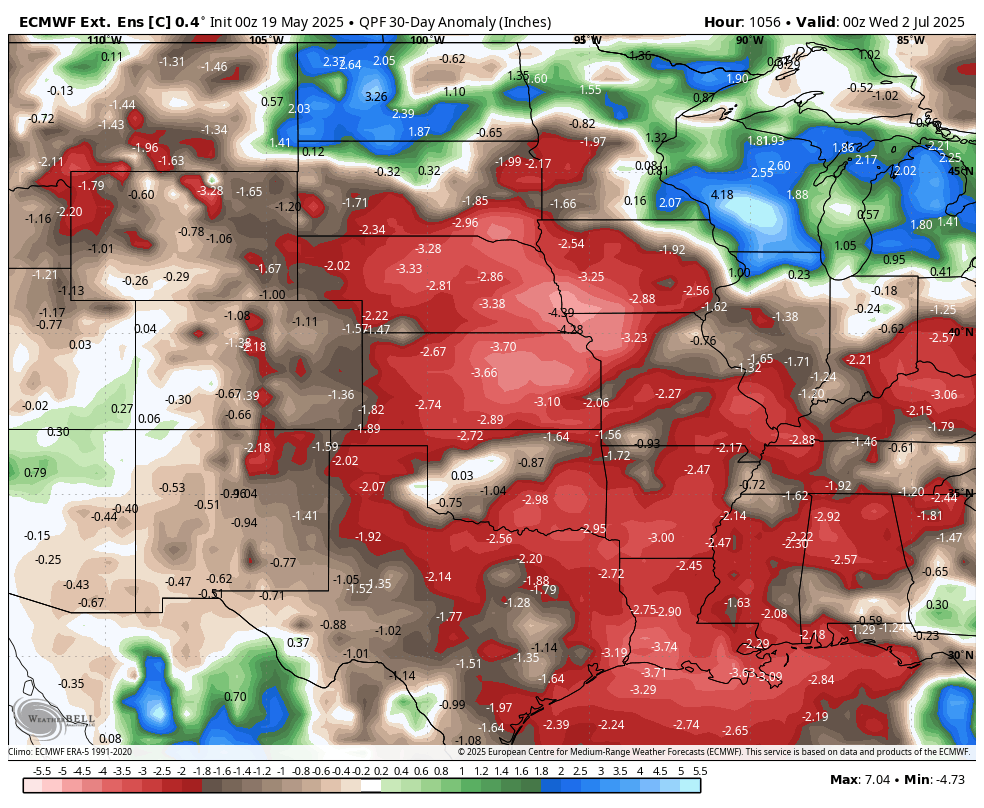
Then here is the precip anomaly for the month of June.
The dry risks remain especially out west.
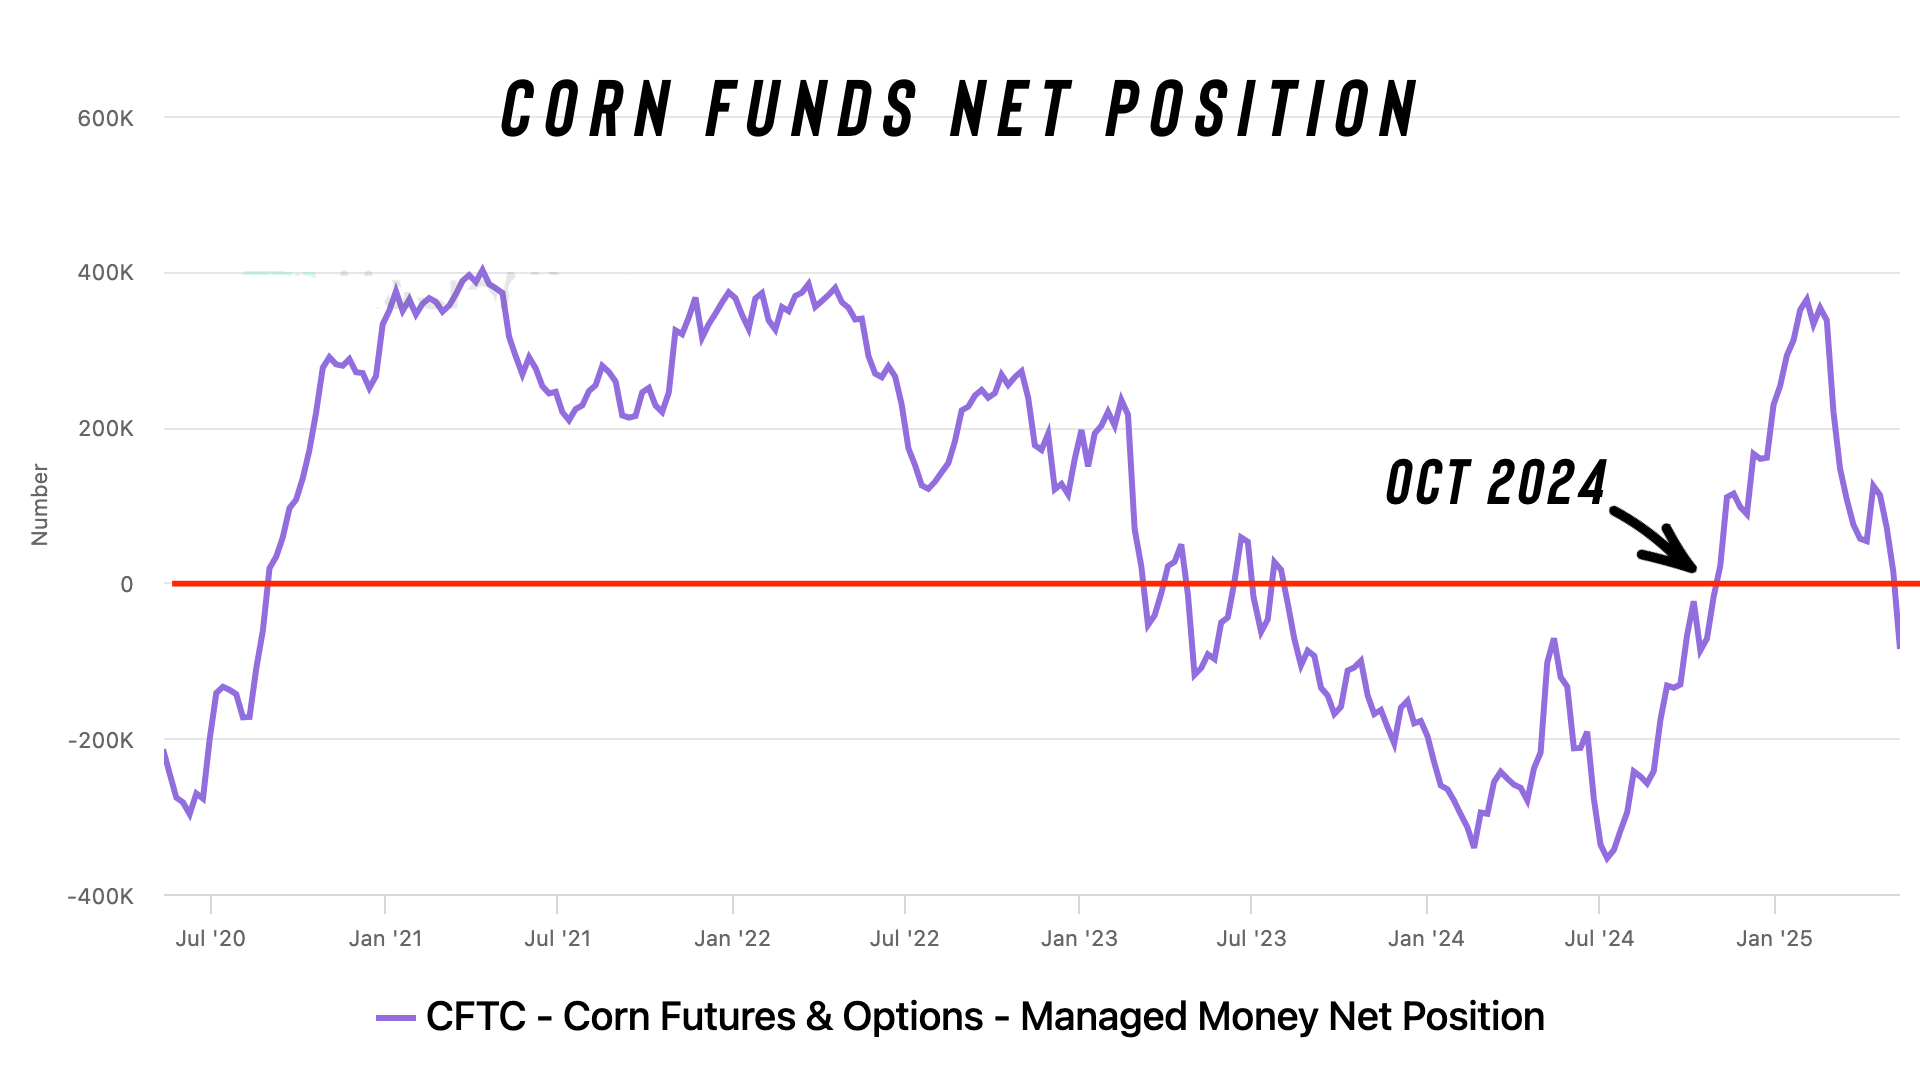
The funds are now short corn for the first time since October.
Holding a -100k contract net short.
Getting short ahead of growing season.. what could possibly go wrong?
The corn market has rallied the past two days and that new short position is already underwater.
Even if we do not see a big drought scare, I think we will at the very least see some weather premium built into this market that should provide an opportunity.
If we look at the Dec corn seasonal, history still says we see an opportunity soon. Before falling apart in mid-June.
Our last weather scare came in 2023.
If we look at the price action, the recent bottom we saw in corn on Friday does line up to the exact day we posted our lows back in 2023.
In 2023 we posted new lows for the year on May 18th before finding a bottom.
Friday we just posted new lows for the year on May 16th.

Technicals:
For July corn, the chart isn’t as friendly as Dec.
A break above $4.60 should open the door to further upside.
Next target is $4.79-4.89 which gives us back 50-61.8% of the Feb highs from the recent lows.

For Dec corn, if we can close above $4.50 it would be our first higher high since the April highs.
(I circled the recent highs in this down trend)
If we can do that, I think we've put in our lows.
Short term target is going to be $4.60
That is our resistance from back in October. It also gives us back 61.8% of the Feb highs.
2nd target is $4.72 (61.8% of the May 2024 highs)
3rd target is $4.84 (78.6% of the May 2024 highs)
Basically looking to de-risk every 10 cents. But I will be looking to be more aggressive between $4.72-4.84 if we get there.

Soybeans
Fundamentals:
Not a ton of fresh news for the soybean market.
The RVO story will play a big role but it's unknown. If that story disappoints soybeans will struggle for a reason to move higher until weather plays a bigger role.
Fundamentally I still think soybeans have upside given that there simply isn’t a ton of room for error in this crop.
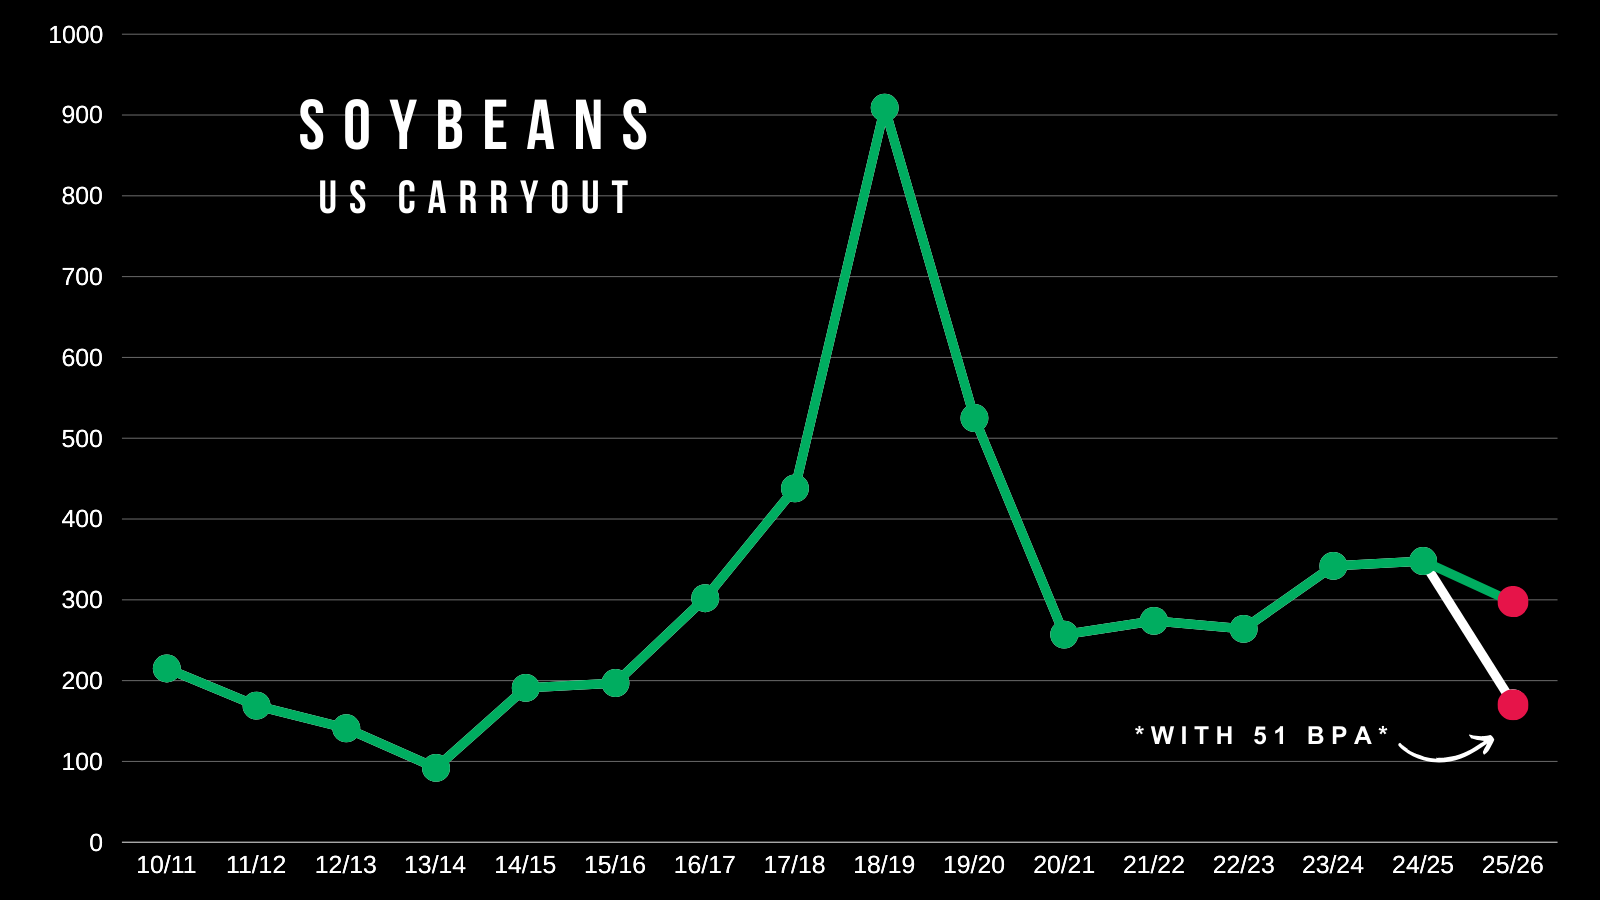
I showed this chart last week, but even if yield falls to just 51 bpa we "could" be looking at the tightest US soybean situation in a decade.
This does not take into account changes to demand.
If this happens, the USDA will likely have to lower demand to prevent the balance sheet from becoming "too tight".
But to ration demand lower, prices typically have to go higher to justify the cut.
Why?
Because lowering demand only makes sense when prices rise enough to slow down exports, crush, feed use etc.
Of course yield could actually wind up being a record. But even with a record yield, our US situation is already 15% tighter than last year.. yet prices are well below their levels from last year.
Technicals:
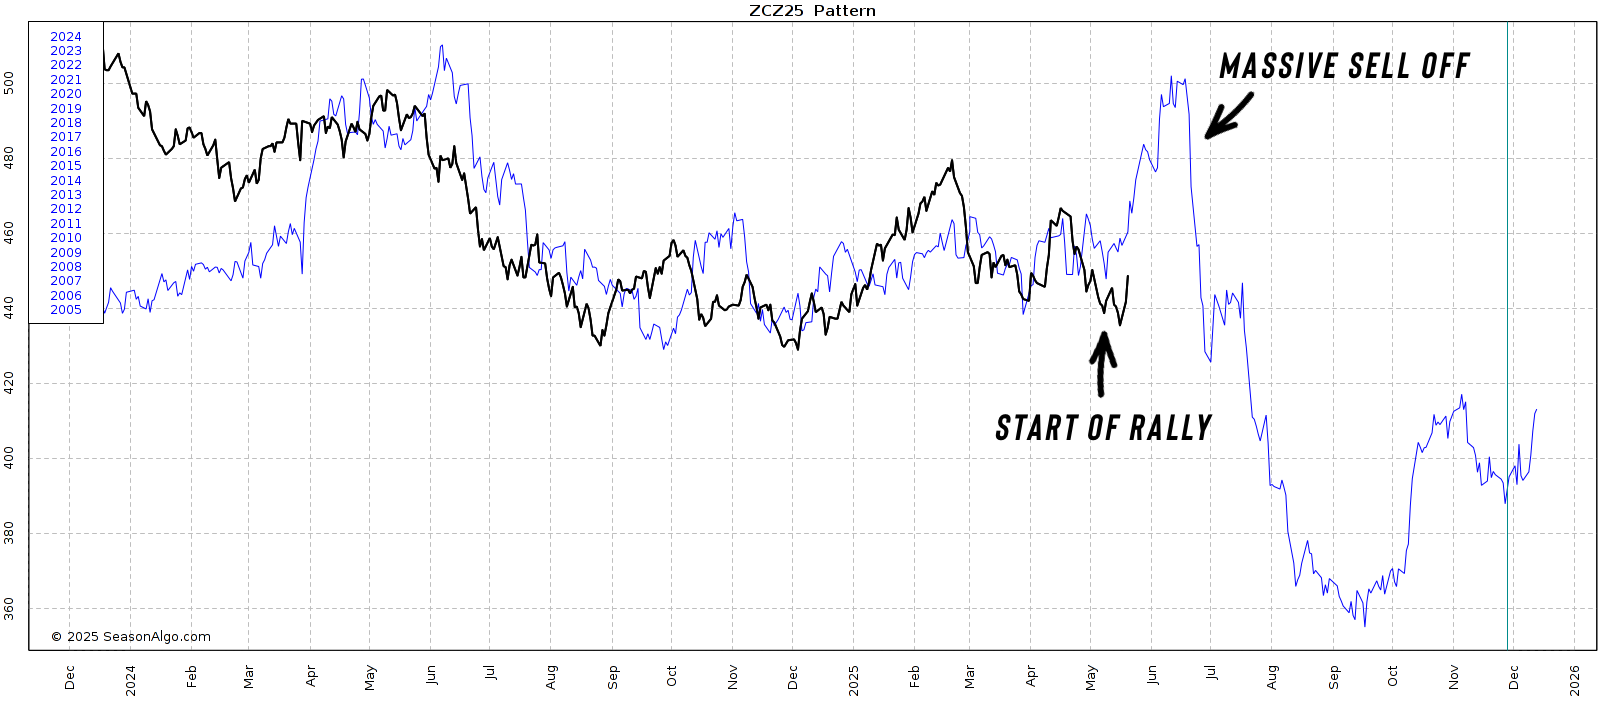
First here is continuous soybeans.
This is another reason why I think soybeans could face some upside in the future.
We broke out of this 3 year downtrend that has been in place since June 2022 and marked some significant tops in this market.
A break above the recent highs and the next real resistance on this chart is $11.28 which was our lows from Feb 2024.

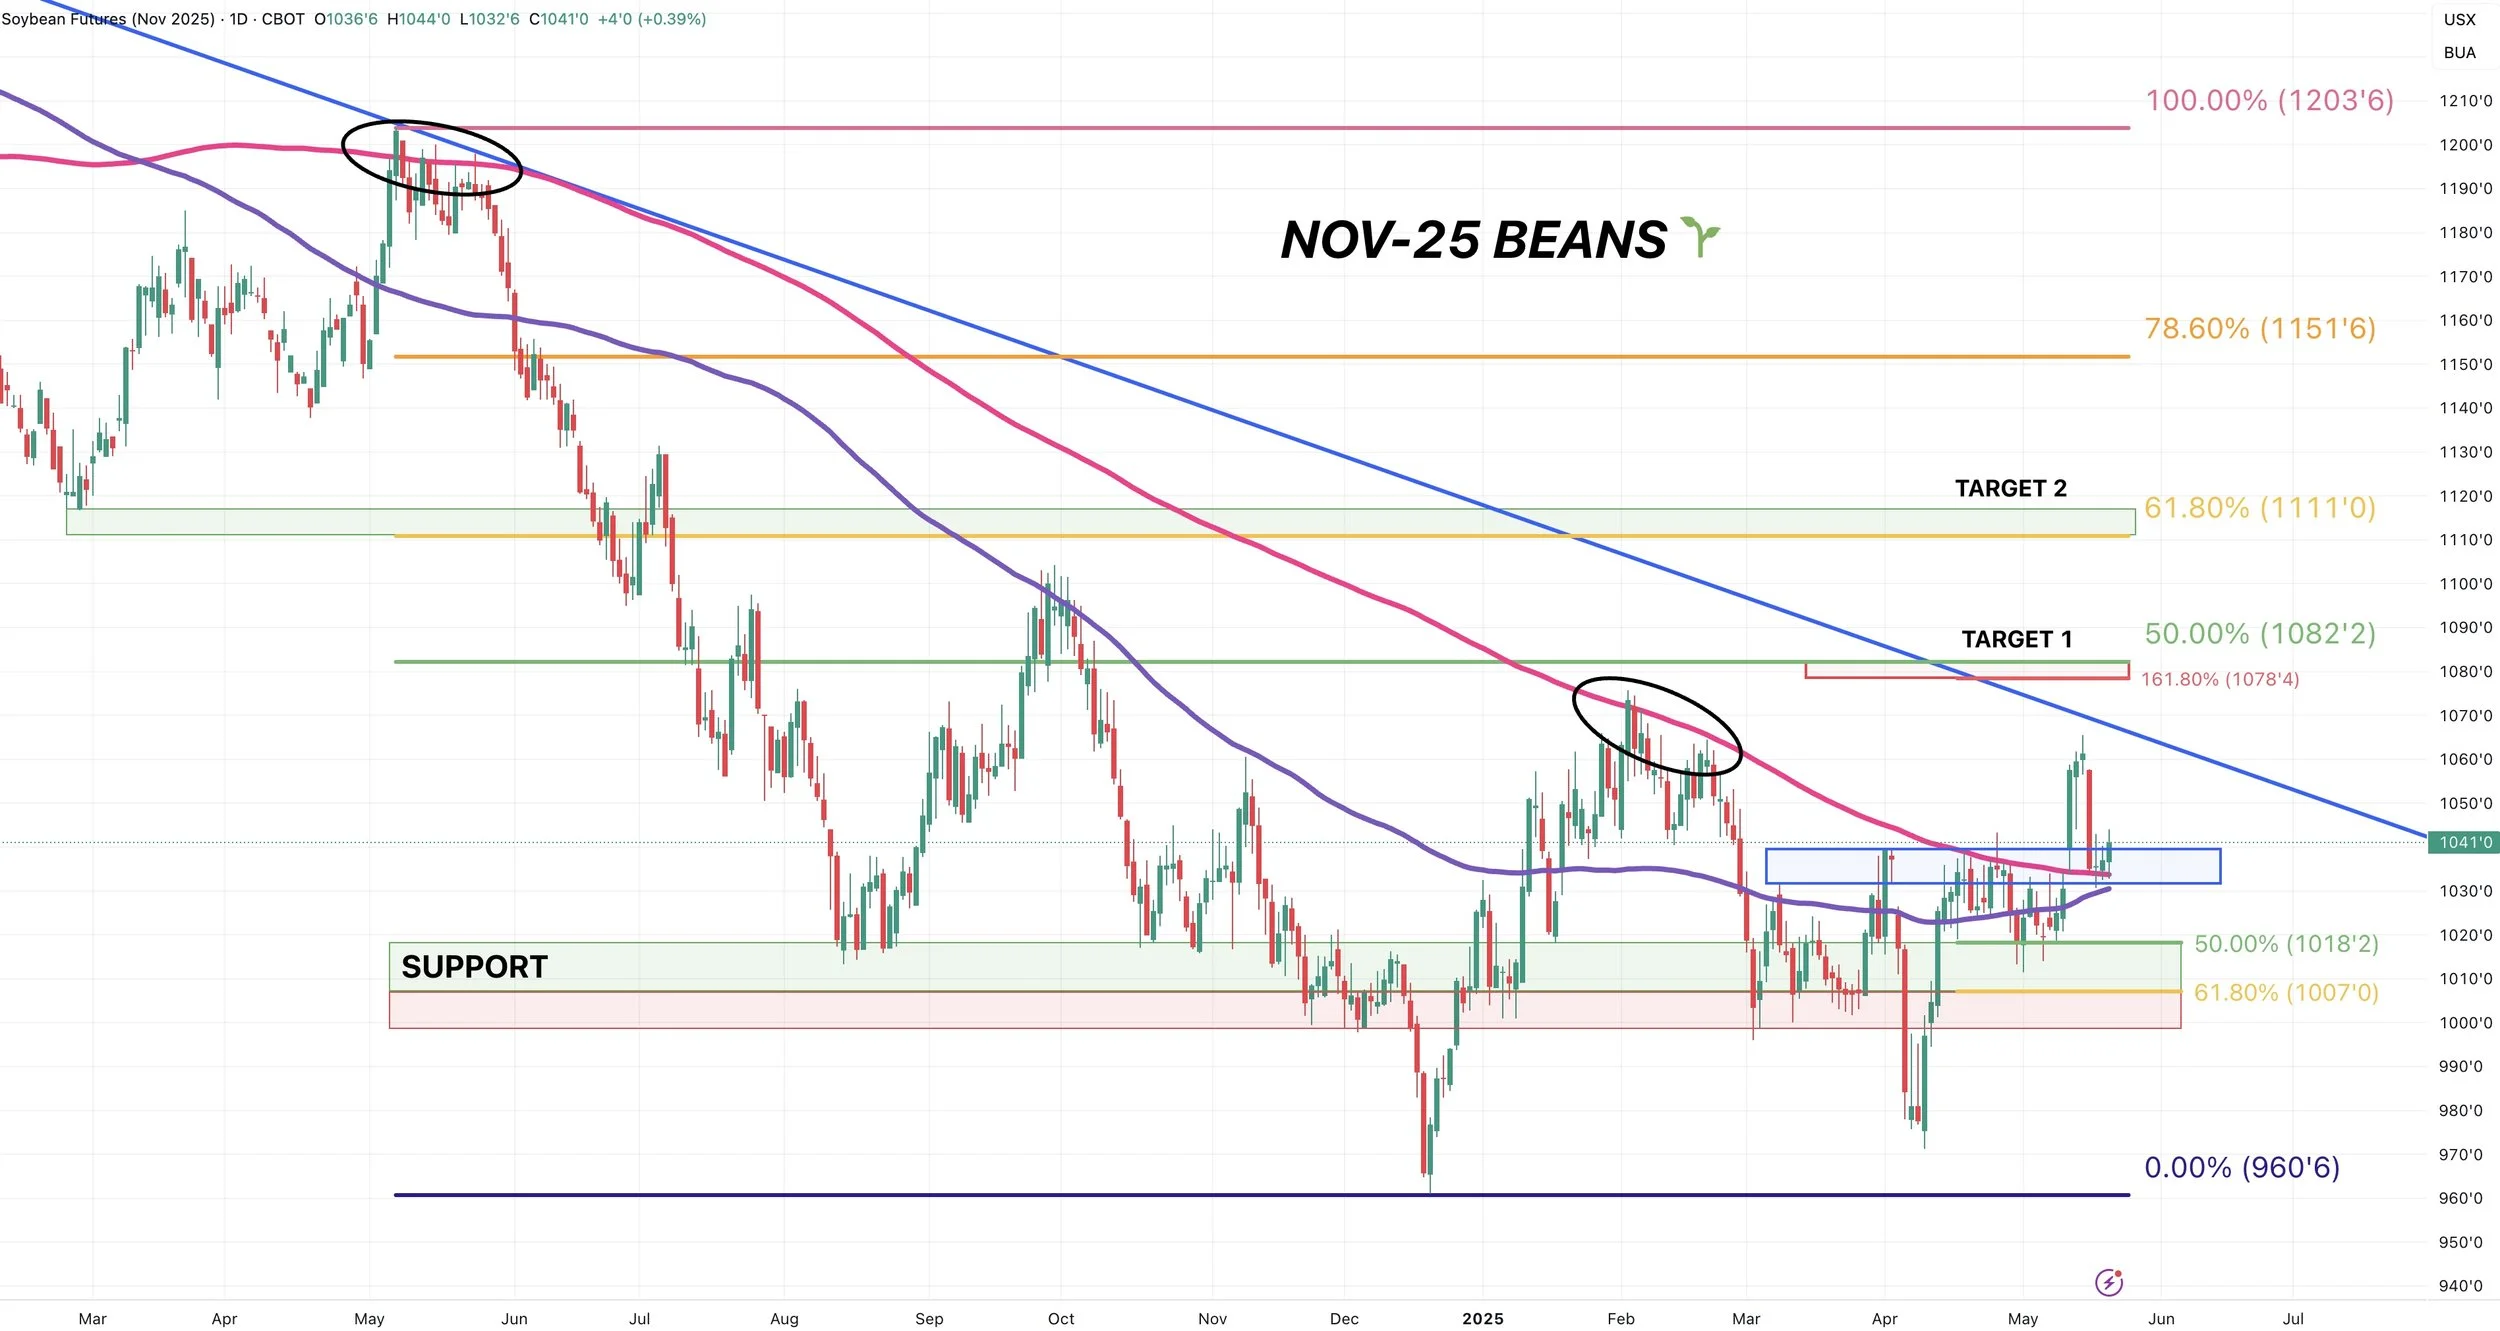
Another reason why I think soybeans have upside potential from a technical standpoint is the fact that Nov beans are above the 200-day MA for the first time since 2023.
This marked our highs in May 20244, Feb 2025, and April 2025.
Being above this is an indication of shifting from a downward trending market to an upward trending one.
If we can build a base here and turn this into our new floor after it was major resistance, it would be a good sign.

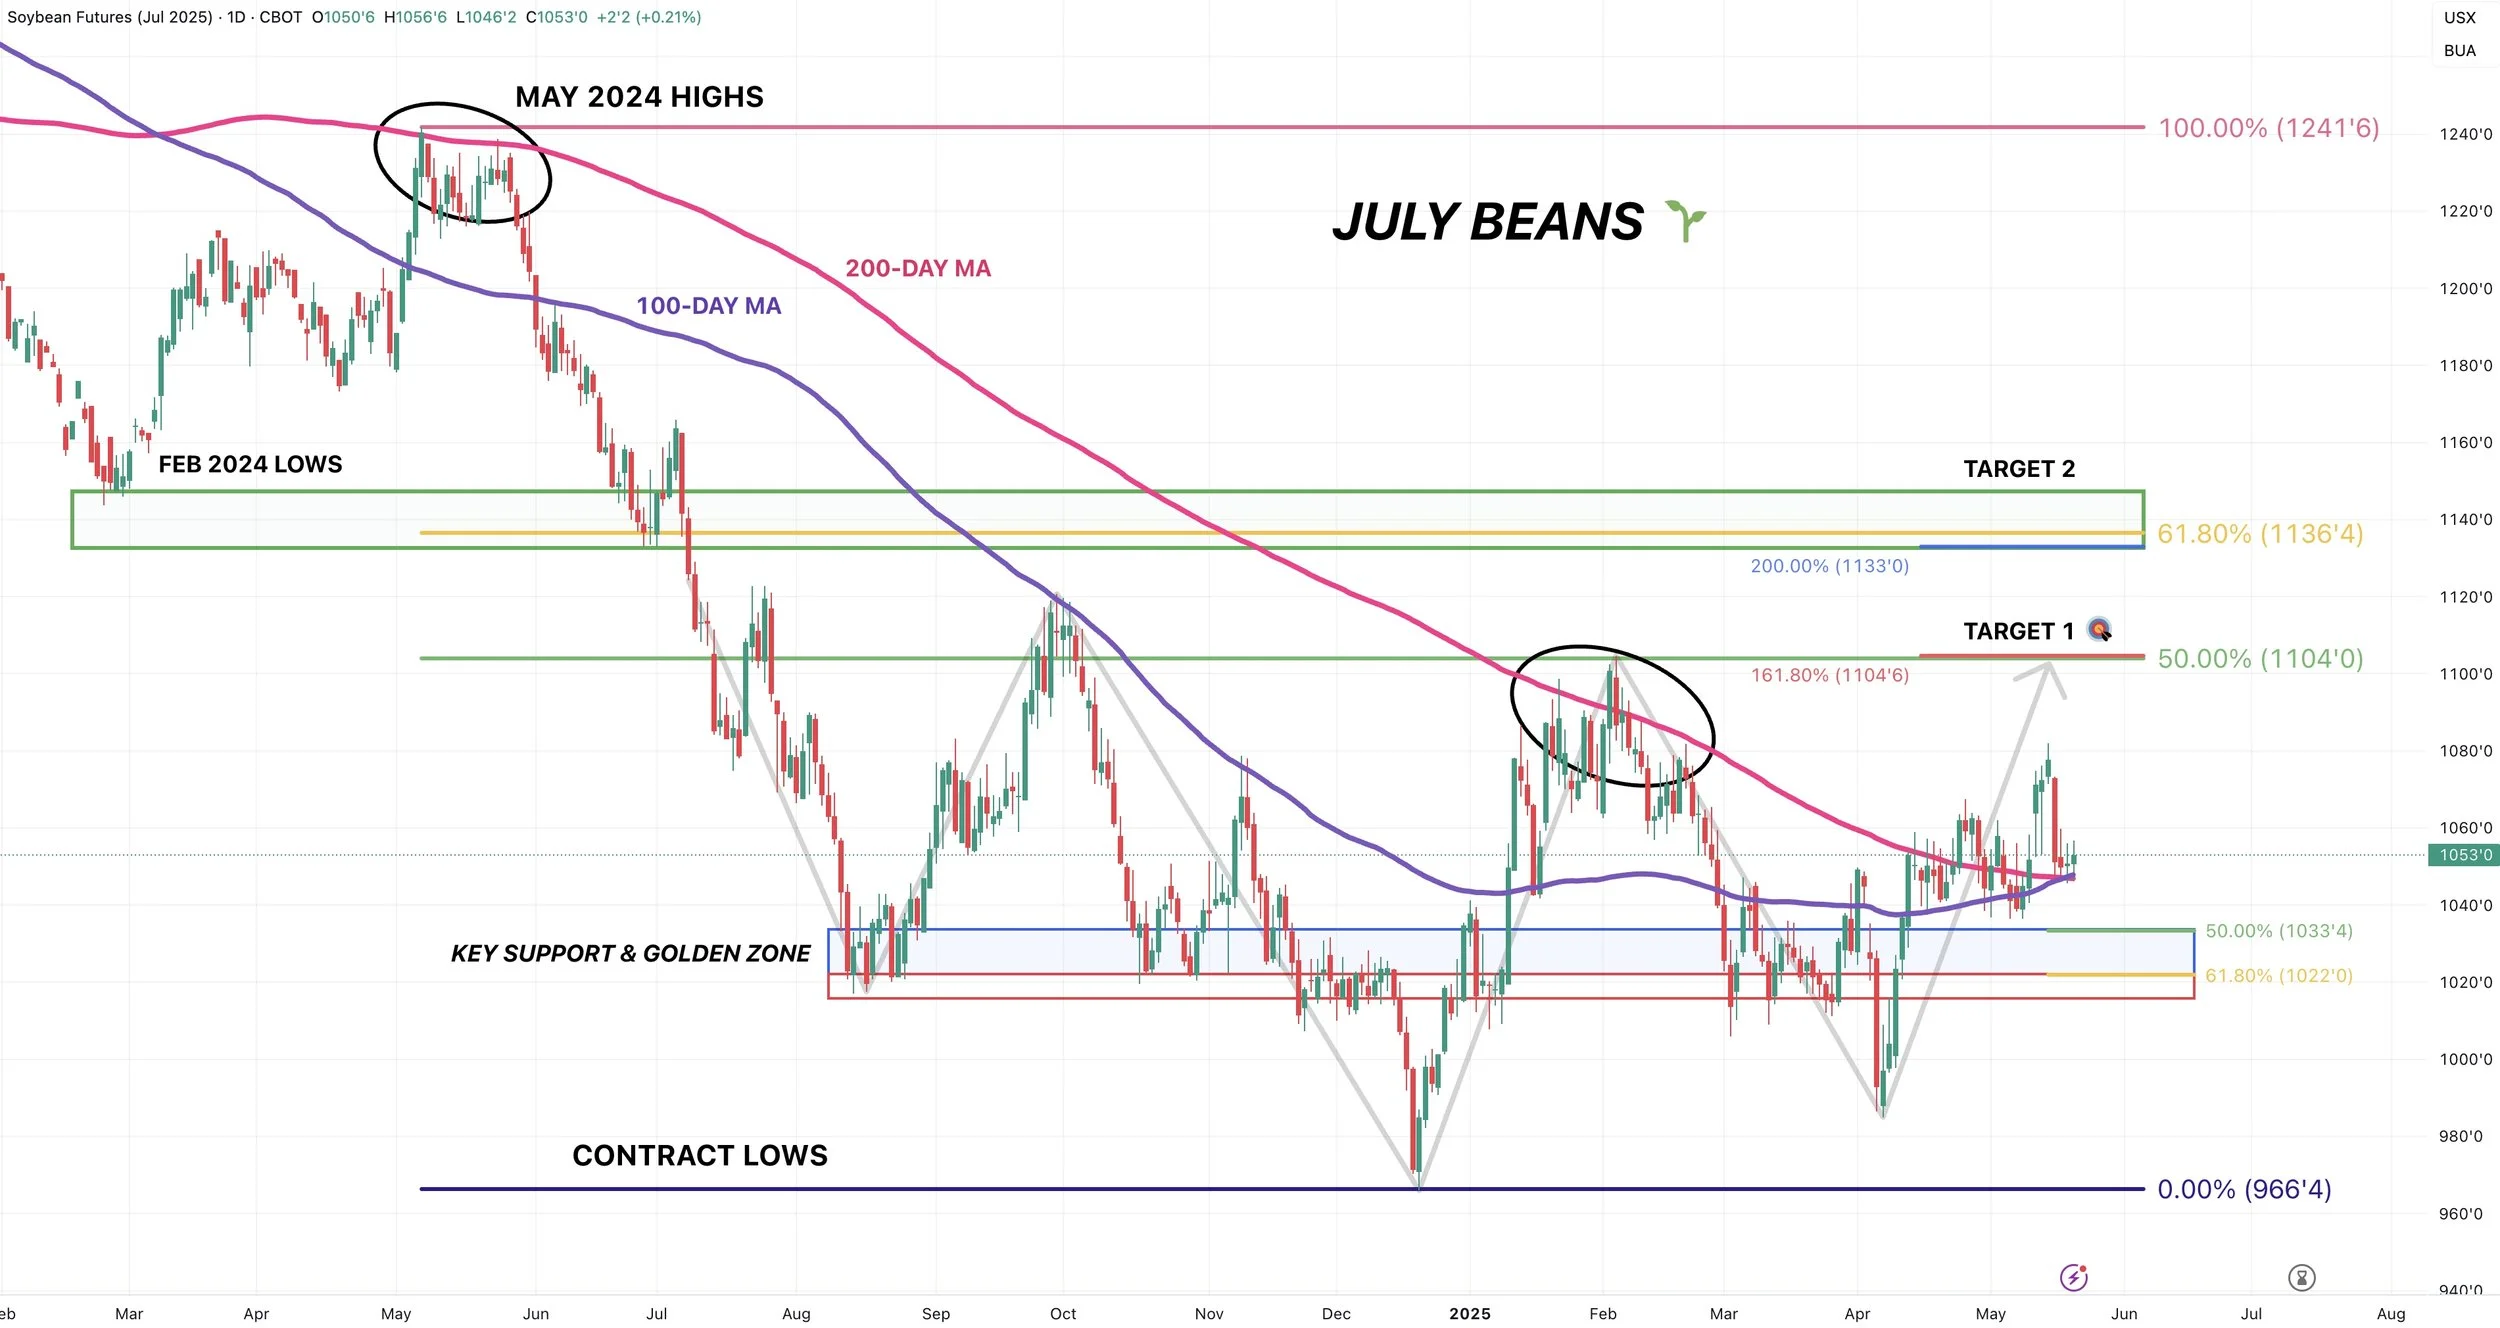
For July beans, need to hold this 200-day and 100-day MA which we have continued to do.
If we break below, it won’t be a good look short term as we likely revisit the blue box.
To the upside, next target is $11.04
Same thing for Nov beans.
Need to hold here. If we can’t, a drop to the green box makes the most sense.
To the upside, next target is $10.78
Wheat
Fundamentals:
Fundamentally not a ton has changed in wheat market.
Yet we are now +40 cents off the lows.
The funds have continued to pound on the wheat market and sometimes it just doesn’t make sense to continue doing it once the risk to reward isn’t there.
Some say part of the rally is from dryness in China, but I doubt it as they irrigate most of their wheat anyways.
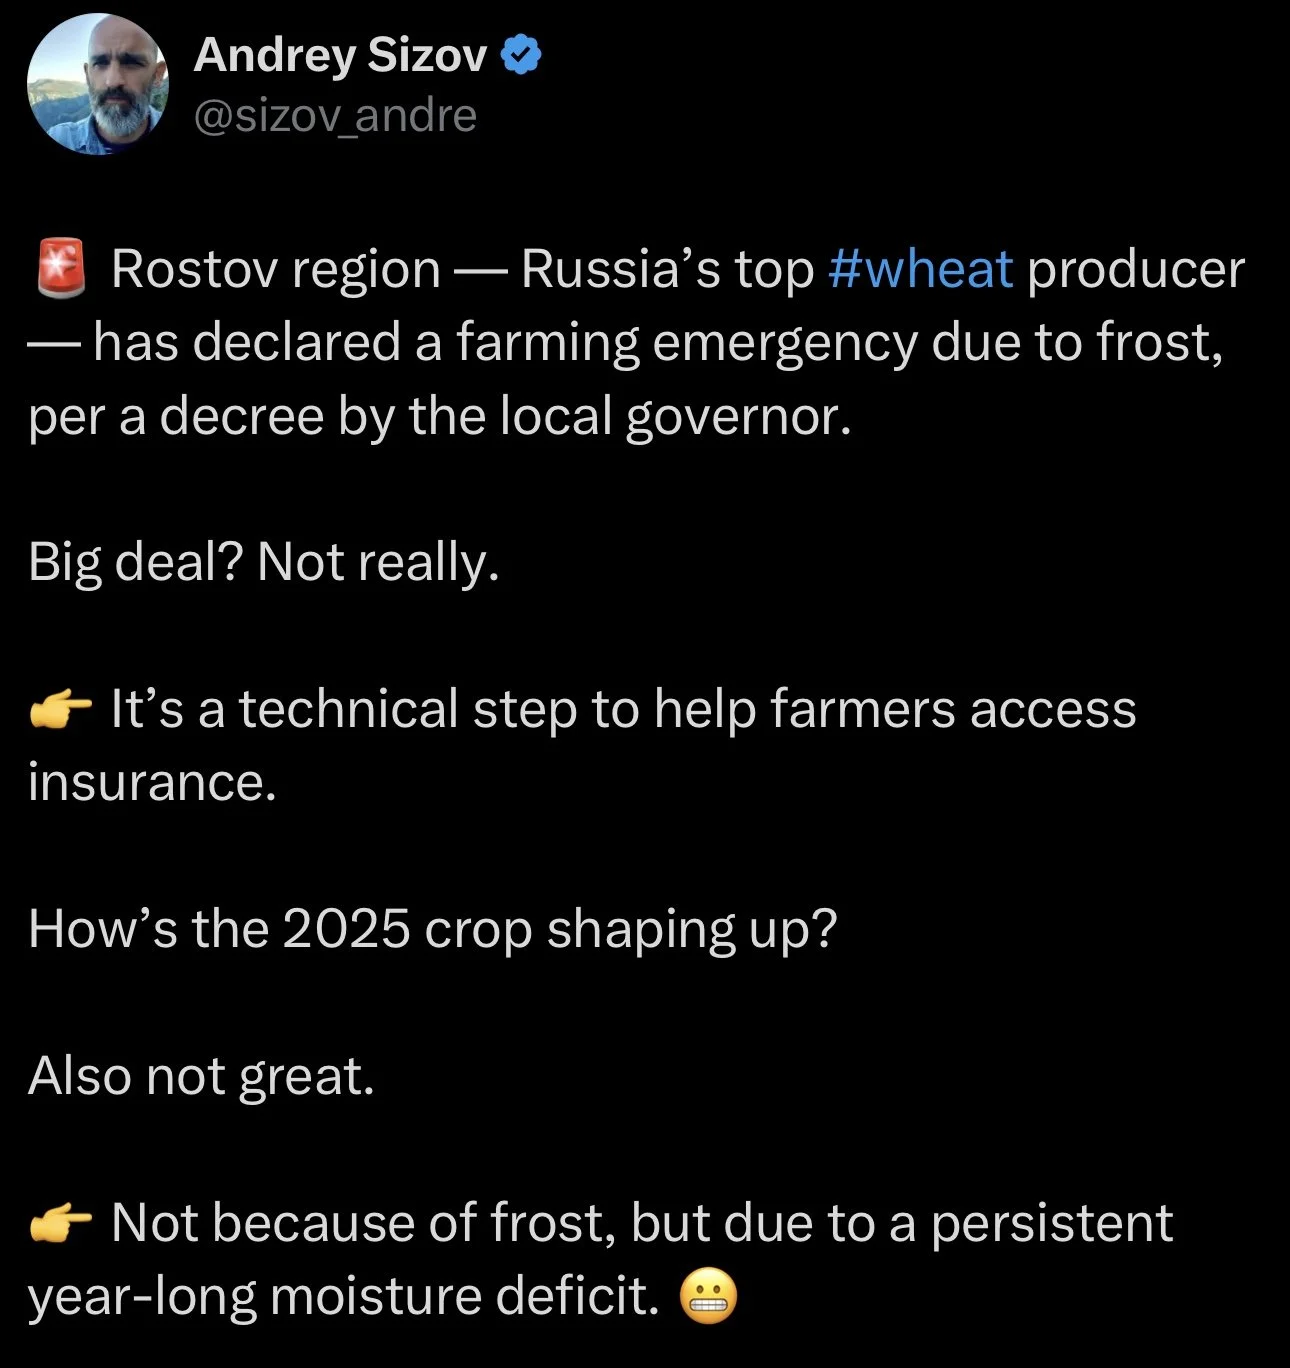
We did see Russia's top wheat producing region declare for emergency due to frost. But Black Sea guru Andrey Sizov doesn’t think it's a big deal. As it's more of a set up to help farmers access insurance.
Bottom line, doesn’t make sense to sell into or get bearish at 5 year lows in wheat and I'm patiently waiting for the next opportunity.
Technicals:
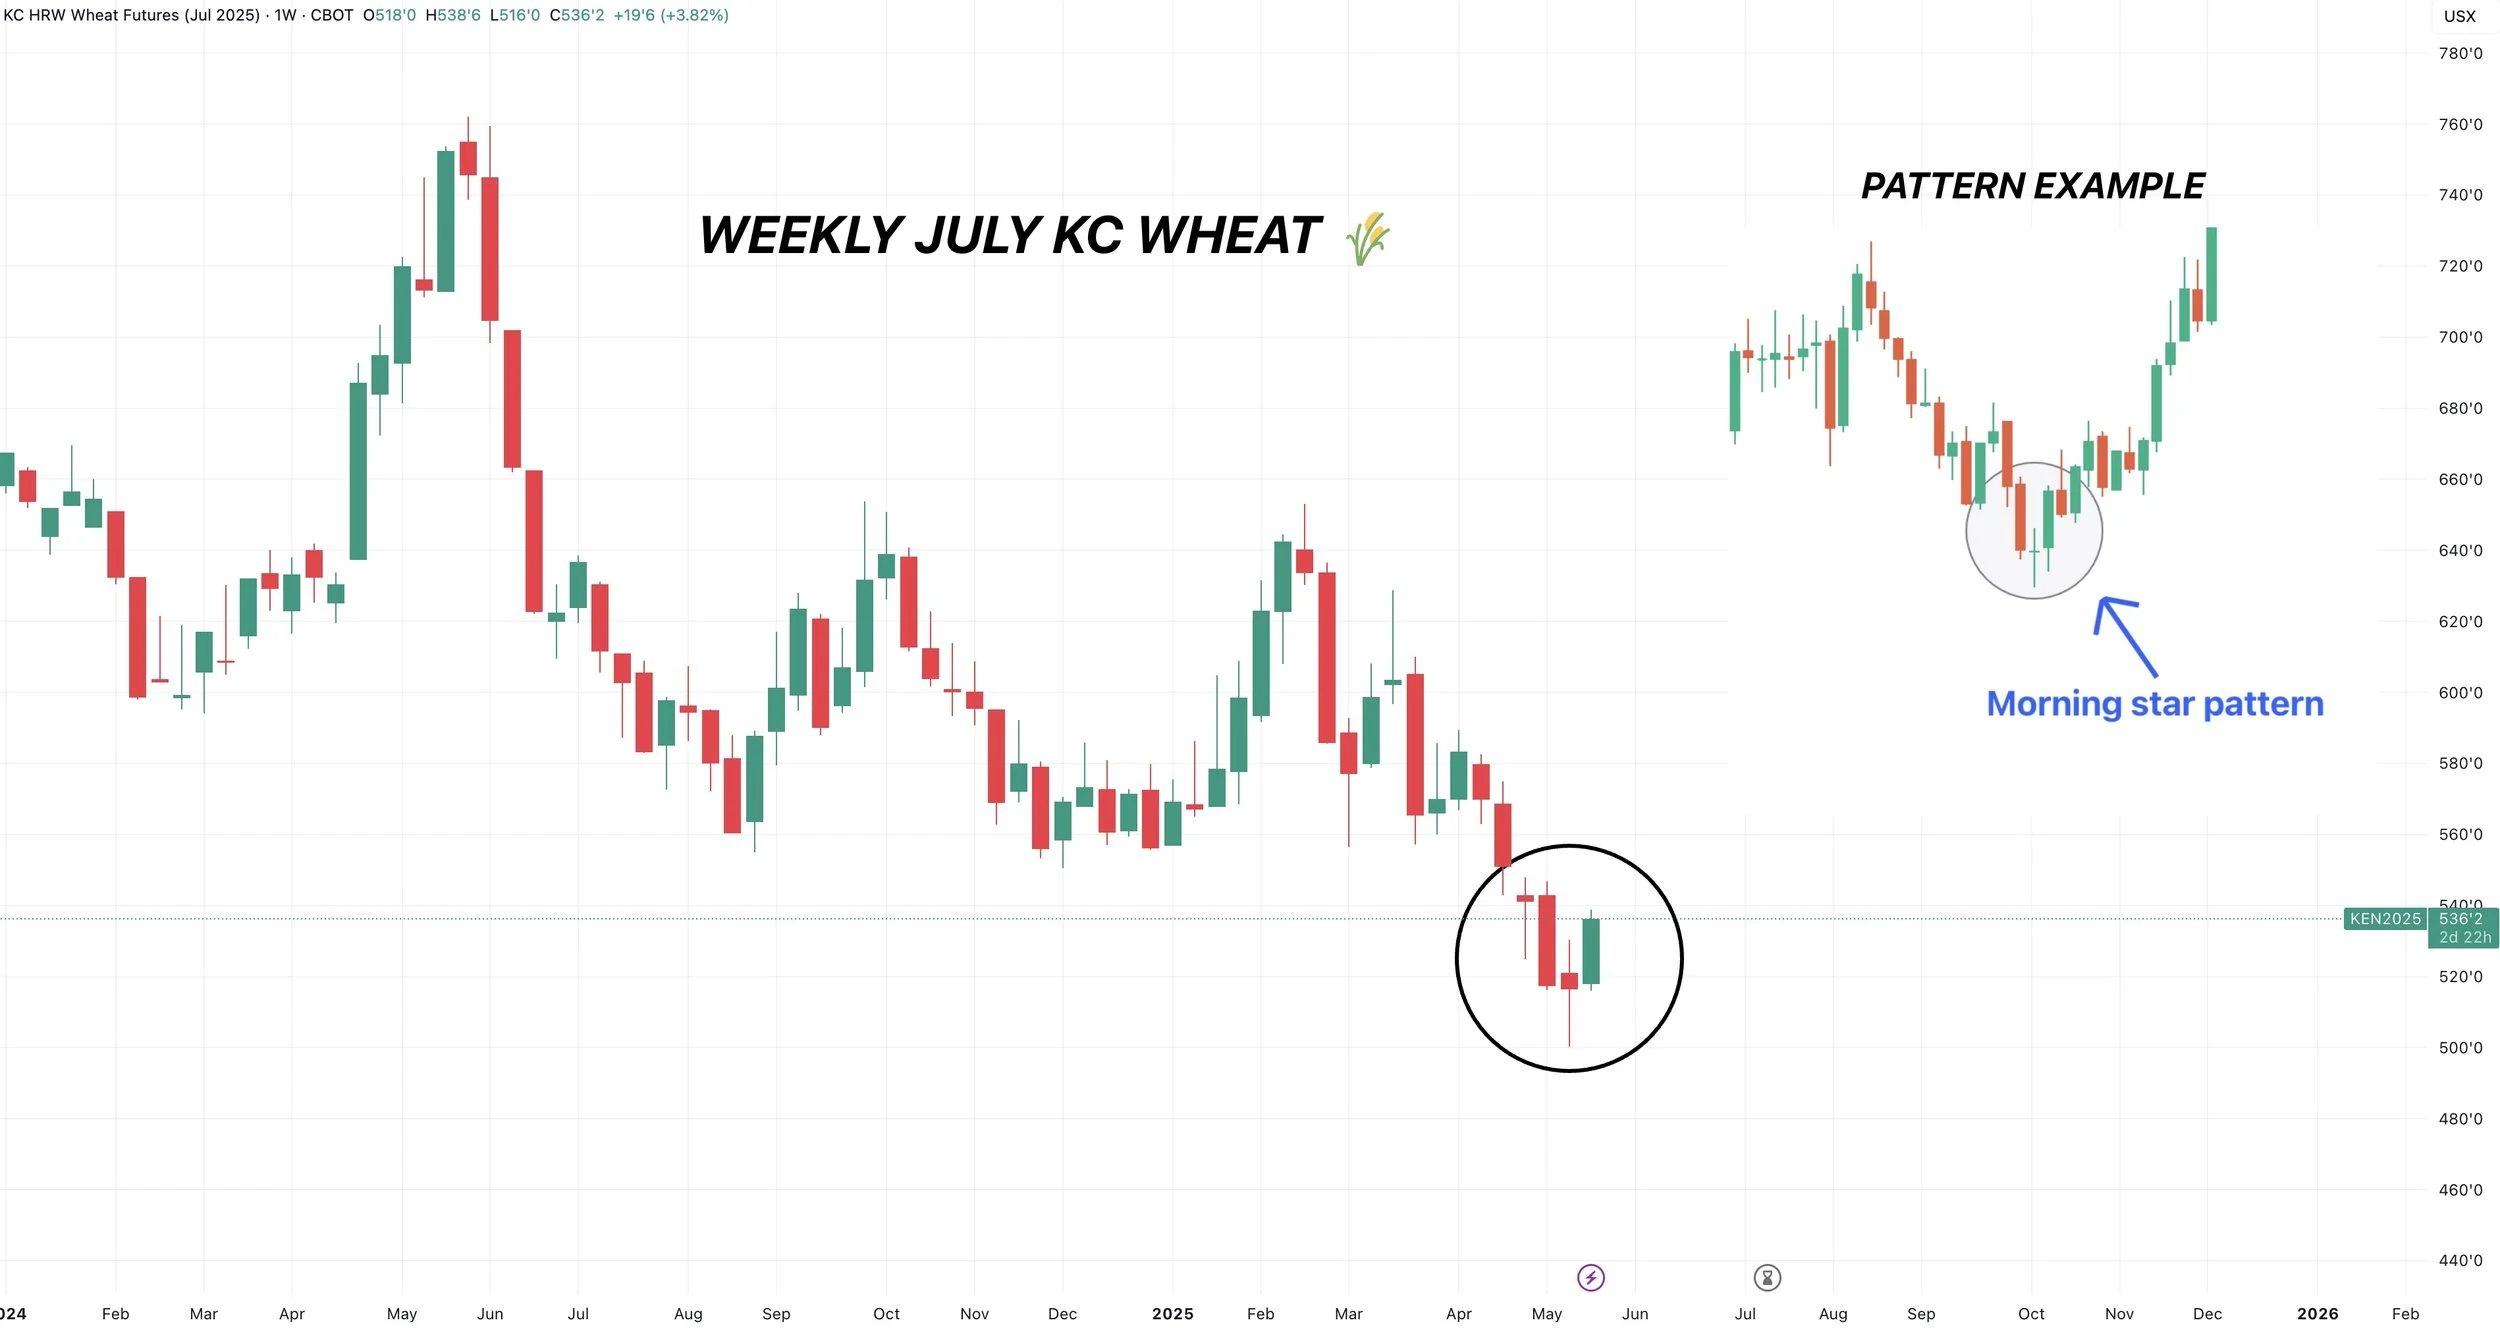
The first chart I have is weekly KC wheat.
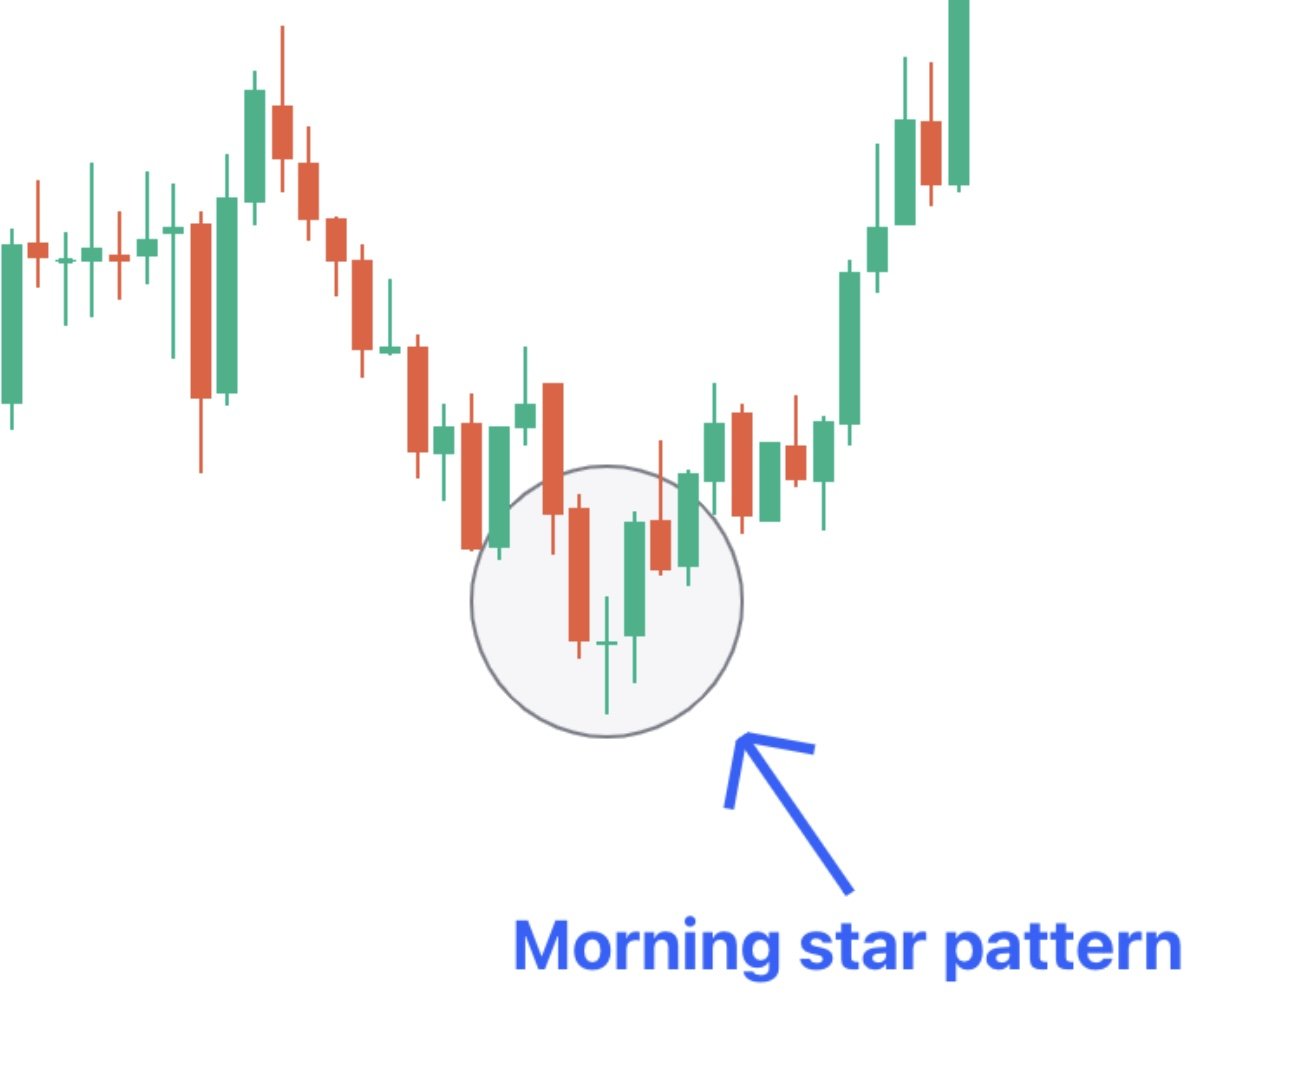
If we can finish the week up at these levels, we have a potential morning star pattern developing.
This is a bullish reversal pattern.
Looking at July Chicago wheat, we are on the verge of posting our first higher high since all the way back in February.
The level we need to break is $5.48 (closed at $5.46 today).
Doing so should open the door to further upside.
We also broke the recent downward trend that has been in place since February.
The wheat market is starting to turn around and show some great signs of life.

Past Sell or Protection Signals
We recently incorporated these. Here are our past signals.
April 10th: 🌽
Old crop corn sell signal.
March 19th: 🐮
Cattle hedge & sell signal.
Feb 18th: 🌽 🌾
Old crop KC wheat & old crop corn signal.
Jan 23rd: 🌽 🌱
Corn & beans old crop sell signal.
CLICK HERE TO VIEW
Jan 15th: 🌽 🌱
Corn & beans hedge alert/sell signal.
Jan 2nd: 🐮
Cattle hedge alert at new all-time highs & target.
Dec 11th: 🌽
Corn sell signal at $4.51 200-day MA
CLICK HERE TO VIEW
Oct 2nd: 🌾
Wheat sell signal at $6.12 target
Sep 30th: 🌽
Corn protection signal at $4.23-26
Sep 27th: 🌱
Soybean sell & protection signal at $10.65
Sep 13th: 🌾
Wheat sell signal at $5.98
May 22nd: 🌾
Wheat sell signal when wheat traded +$7.00
Want to Talk?
Our phones are open 24/7 for you guys if you ever need anything or want to discuss your operation.
Hedge Account
Interested in a hedge account? Use the link below to set up an account or shoot Jeremey a call at (605)295-3100.
Check Out Past Updates
5/19/25
ANYONE LEFT TO SELL WHEAT? 181 CORN YIELD POSSIBLE?
5/16/25
FUNDS SHORT CORN. MARKETS WAITING ON WEATHER
5/15/25
BEANS HAMMERED ON RUMOR & WHEAT FINDING LIFE
5/14/25
DECISIONS & POSSIBILITIES IN GRAINS
5/13/25
GRAINS RALLY OFF LOWS
5/12/25
USDA REPORT. HOW THIS CHANGES THINGS
5/9/25
BIGGEST RISKS IN USDA REPORT
5/8/25
USDA MONDAY & HISTORY OF WEATHER RALLIES
5/7/25
NEW 2025 LOWS FOR CORN
5/6/25
WHAT’S A SUMMER RALLY LOOK LIKE?
5/5/25
CORN ERASES ENTIRE APRIL RALLY
5/2/25
SELL INTO UNCERTAINTY. NOT KNOWN FACTORS
5/1/25
THE CASE AGAINST A FEB TOP IN CORN
4/30/25
APPROACHING KEY TIME PERIOD FOR GRAINS
4/29/25
PLANTING & FIRST NOTICE DAY PRESSURE. CORN CLOSE TO BOTTOM?
4/28/25
CAPTURING INVERSE & SEASONAL PREPARATION
4/25/25
HOW OFTEN DOES CORN NOT BREAK APRIL HIGHS?
4/24/25
KNOW WHEN TO SELL. BEANS BREAK 200-DAY FIRST TIME IN 483 DAYS
4/23/25
MONEY FLOW & DROUGHT CARDS
4/22/25
CRUCIAL SPOT FOR CORN & BEANS
4/21/25
NO PLANTING THREAT YET
4/18/25
POTENTIAL OPPORTUNITIES, BASIS CONTRACTS & STRATEGIES
4/16/25
HOW YIELD IMPACTS CARRYOUT. MAJOR SPOT FOR SOYBEANS
4/15/25
TOTAL CHART BREAKDOWNS & TARGETS
4/14/25
TECHNICAL SELLING IN GRAINS
4/11/25
SPECIFIC GRAIN MARKETING DECISIONS
4/10/25
USDA REPORT. HOW THIS IMPACTS CORN
4/9/25
TARIFFS GIVE. TARIFFS TAKE
4/8/25
CORN’S DIVERGING STRENGTH
4/7/25
SOLID PRICE ACTION DESPITE OUTSIDE FEAR
4/4/25
CORN PRICE ACTION SPEAKS VOLUME. ANY HOPE LEFT FOR SOYBEANS?
4/3/25
WHAT IS LEFT FOR CORN BEARS? TRADE WAR: CHARTS HOLDING SUPPORT
4/2/25
SHOULD UNKNOWNS KEEP A FLOOR UNDER GRAIN PRICES?
4/1/25
HOW DO ACRES IMPACT FUTURE OF THE GRAINS?
3/31/25
USDA REPORT: NOW WHAT?
3/28/25
ALL EYES ON USDA
3/27/25
PRE-USDA POSITIONING. DON’T GIVE GRAIN AWAY
3/26/25
HISTORY OF MARCH INTENTIONS. SOYBEANS UNDERVALUED?
3/25/25
6 DAYS UNTIL MAJOR USDA REPORT
3/24/25
HOW TO POSITION YOURSELF BEFORE PLANTING
3/21/25
REASONS TO BE OPTIMISTIC IN GRAINS?
3/20/25
WAS THAT THE BOTTOM IN CORN?
3/19/25
THE PATH HIGHER & THE DOWNSIDE RISKS IN GRAINS
3/18/25
SEASONALS, CATTLE HEDGE, CHARTS & DROUGHT?
3/17/25
WHEAT RALLIES. DON’T GET BACKED INTO A CORNER
3/14/25
MARCH 31ST REPORT THOUGHTS & WHAT’S NEXT FOR GRAINS
3/13/25
EXPLAINING RE-OWNERSHIP VS COURAGE CALLS
3/12/25
TARIFF FEARS. EU, CANADA, & ETHANOL
3/11/25
USDA SNOOZE. RECORD FUND SELLING A CONCERN?
3/10/25
USDA TOMORROW. GETTING COMFORTABLE IN MARKETING
3/7/25
HOW TIGHT IS THE WORLD & US SITUATION?
3/6/25
TARIFFS PUSHED BACK. FUTURE OPPORTUNITIES?
3/5/25
IS GRAINS BIGGEST RISK WEAK CRUDE & DEFLATION?
3/4/25
TRADE WAR BEGINS. 8TH DAY OF PAIN FOR GRAINS
3/3/25
TARIFFS ON TOMORROW. BUY SIGNAL
3/3/25
BUY SIGNAL
2/28/25
WHEN WILL THE BLEEDING STOP?
2/27/25
CORN AT CRITICAL SPOT. USDA ACRE REPORT. WAY TOO EARLY DROUGHT TALK
2/26/25
HISTORY SUGGESTS CORN TOP ISN’T IN? ACRE OUTLOOK TOMORROW
2/25/25
POSITIVE CLOSE. WHAT TO KNOW ABOUT USDA OUTLOOK
2/24/25
USDA OUTLOOK, FIRST NOTICE DAY & BRAZIL
2/21/25
WHAT TO EXPECT MOVING FORWARD IN GRAINS
2/20/25
FIRST NOTICE DAY CONCERNS. MASSIVE CORN ACRES OR NOT?
2/19/25
HOW TIGHT IS THE CORN SITUATION?
2/18/25
MORE DETAILS ON TODAYS SELL SIGNAL
2/18/25
OLD CROP KC WHEAT & CORN SELL SIGNAL
2/14/25
WHEAT BREAKING OUT ON WEATHER RISK. TECHNICALS & FUNDAMENTALS
2/12/25
GLOBAL GRAIN SITUATION, ACRE TALK, CHARTS & MORE
2/11/25
USDA: NOT A BEARISH REPORT. DISAPPOINTING PRICE ACTION
2/10/25
USDA TOMORROW. LONG TERM PATH FOR SUB 10% CORN STOCKS TO USE?
2/7/25
WHY WOULD THE FUNDS EXIT THEIR LONGS?
2/6/25
WHEAT FINALLY CATCHING A BID
2/5/25
COMPLETE THOUGHTS ON MARKETS: BACK & FORTH DISCUSSION
2/4/25
STRONG JANUARY LEAD TO STRONG YEAR? TARIFFS, CHARTS & MORE
2/3/25
TARIFFS PUSHED BACK
1/31/25
TARIFF NEWS ALL OVER THE PLACE. ARE YOU PREPARED FOR POSSIBILITIES?
1/30/25
WHEAT BULL ARGUMENT. TRUMP ADDS TARIFFS
1/29/25
CORN APPROACHES $5.00
1/28/25
TARIFFS, CORN FUNDS, SOUTH AMERICA & MORE
1/27/25
HEALTHY CORRECTION WE TALKED ABOUT & TARIFF NEWS
1/24/25
GRAINS DUE FOR SHORT TERM CORRECTION?
1/23/25
OUR ENTIRE NEW CROP SALES THOUGHTS & OLD CROP SELL SIGNAL
1/22/25
GRAINS TAKE A BREATHER. IS CORN IN A BULL OR BEAR MARKET?
1/21/25
HUGE DAY IN GRAINS. WHAT TO DO WITH OLD CROP VS NEW CROP
Read More
1/20/25
VIDEO CHART UPDATE
1/17/25
TRUMP, CHINA, ARGY & USING THE SPREADS INVERSE
1/16/25
OLD CROP LEADS US LOWER. MARKETING THOUGHTS
1/15/25
SIGNAL & HEDGE ALERT QUESTIONS EXPLAINED. IS $6 CORN EVEN POSSIBLE?
1/14/25
MORE DETAILS ON TODAYS HEDGE ALERT & SELL SIGNAL
1/14/25
CORN & SOYBEANS HEDGE ALERT/SELL SIGNAL
1/13/25
USDA GAME CHANGER OR NOT?
1/10/25
BULLISH USDA FOR CORN & BEANS
1/9/25
USDA OUT TOMORROW
1/8/25
2 DAYS UNTIL USDA. BE PREPARED
1/7/25
THE HISTORY OF THE JAN USDA & MORE
1/6/25
MAJOR USDA REPORT FRIDAY
Read More
1/3/25
UGLY DAY ACROSS THE GRAINS
1/2/25