
SINK OR SWIM FOR BEANS. 2025 VS 2026 CORN
QUICK VIDEO CHART UPDATE
You can scroll to read the usual update as well. As the written version is the exact same as the video.
Timestamps for video:
Overview: 0:00min
Corn: 1:30min
Beans: 4:20min
Wheat: 6:25min
Cattle: 7:15min
Want to talk about your situation?
(605)250-3863
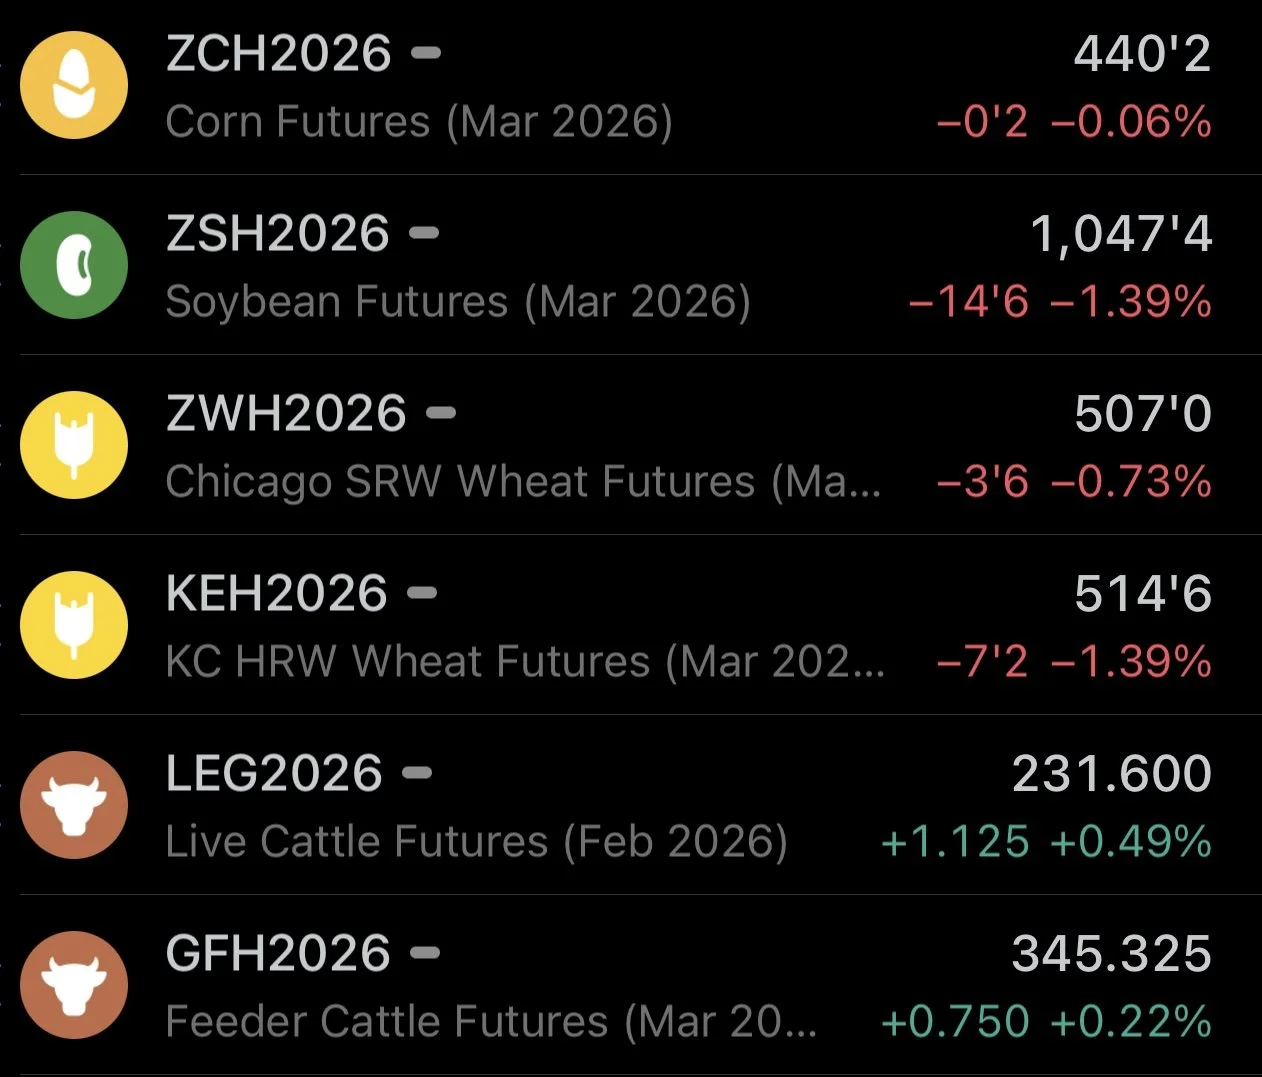
Futures Prices Close
Overview
Today is going to be a rather quick update. As we are just going to be over the charts with the holiday, lack of news, and light volume trading.
In yesterday's update, we covered some seasonals as well as fundamentals, so check that out if you haven’t. We went over data showing how January tends to be a friendly month for the corn market.
Link to Yesterday's Update
The markets will be closed tomorrow, but will have a normal trading day on Friday.
Soybeans are at an important spot to hold. Corn is range-bound but showing some pretty interesting similarities to last year. The cattle market is still in an area where we like keeping hedges in place. The wheat market has given back a large part of the recent bounce.
Today soybeans and wheat were hit by poor export sales. As wheat export sales for the week were the worst on record. Meanwhile, corn export sales were the week's largest ever.
Wheat production estimates around the world continue to rise. Reaffirming that the world has an ample supply. Today we saw Buenos Aires Grain Exchange raise Argentina's wheat crop to a new record. Bumping it to 27.8 MMT (USDA has 24 MMT).
Soybeans were also pressured with some big deliveries. As we saw 1,062 deliveries on the January contract in soybeans. As today was first notice day. Large deliveries typically signal comfortable nearby supply.
Argentina is looking dry for the next 1-2 weeks but temps are set to cool down. The market hasn’t seemed to think this is a big deal. Considering Brazil hasn’t had any issues either.
Corn
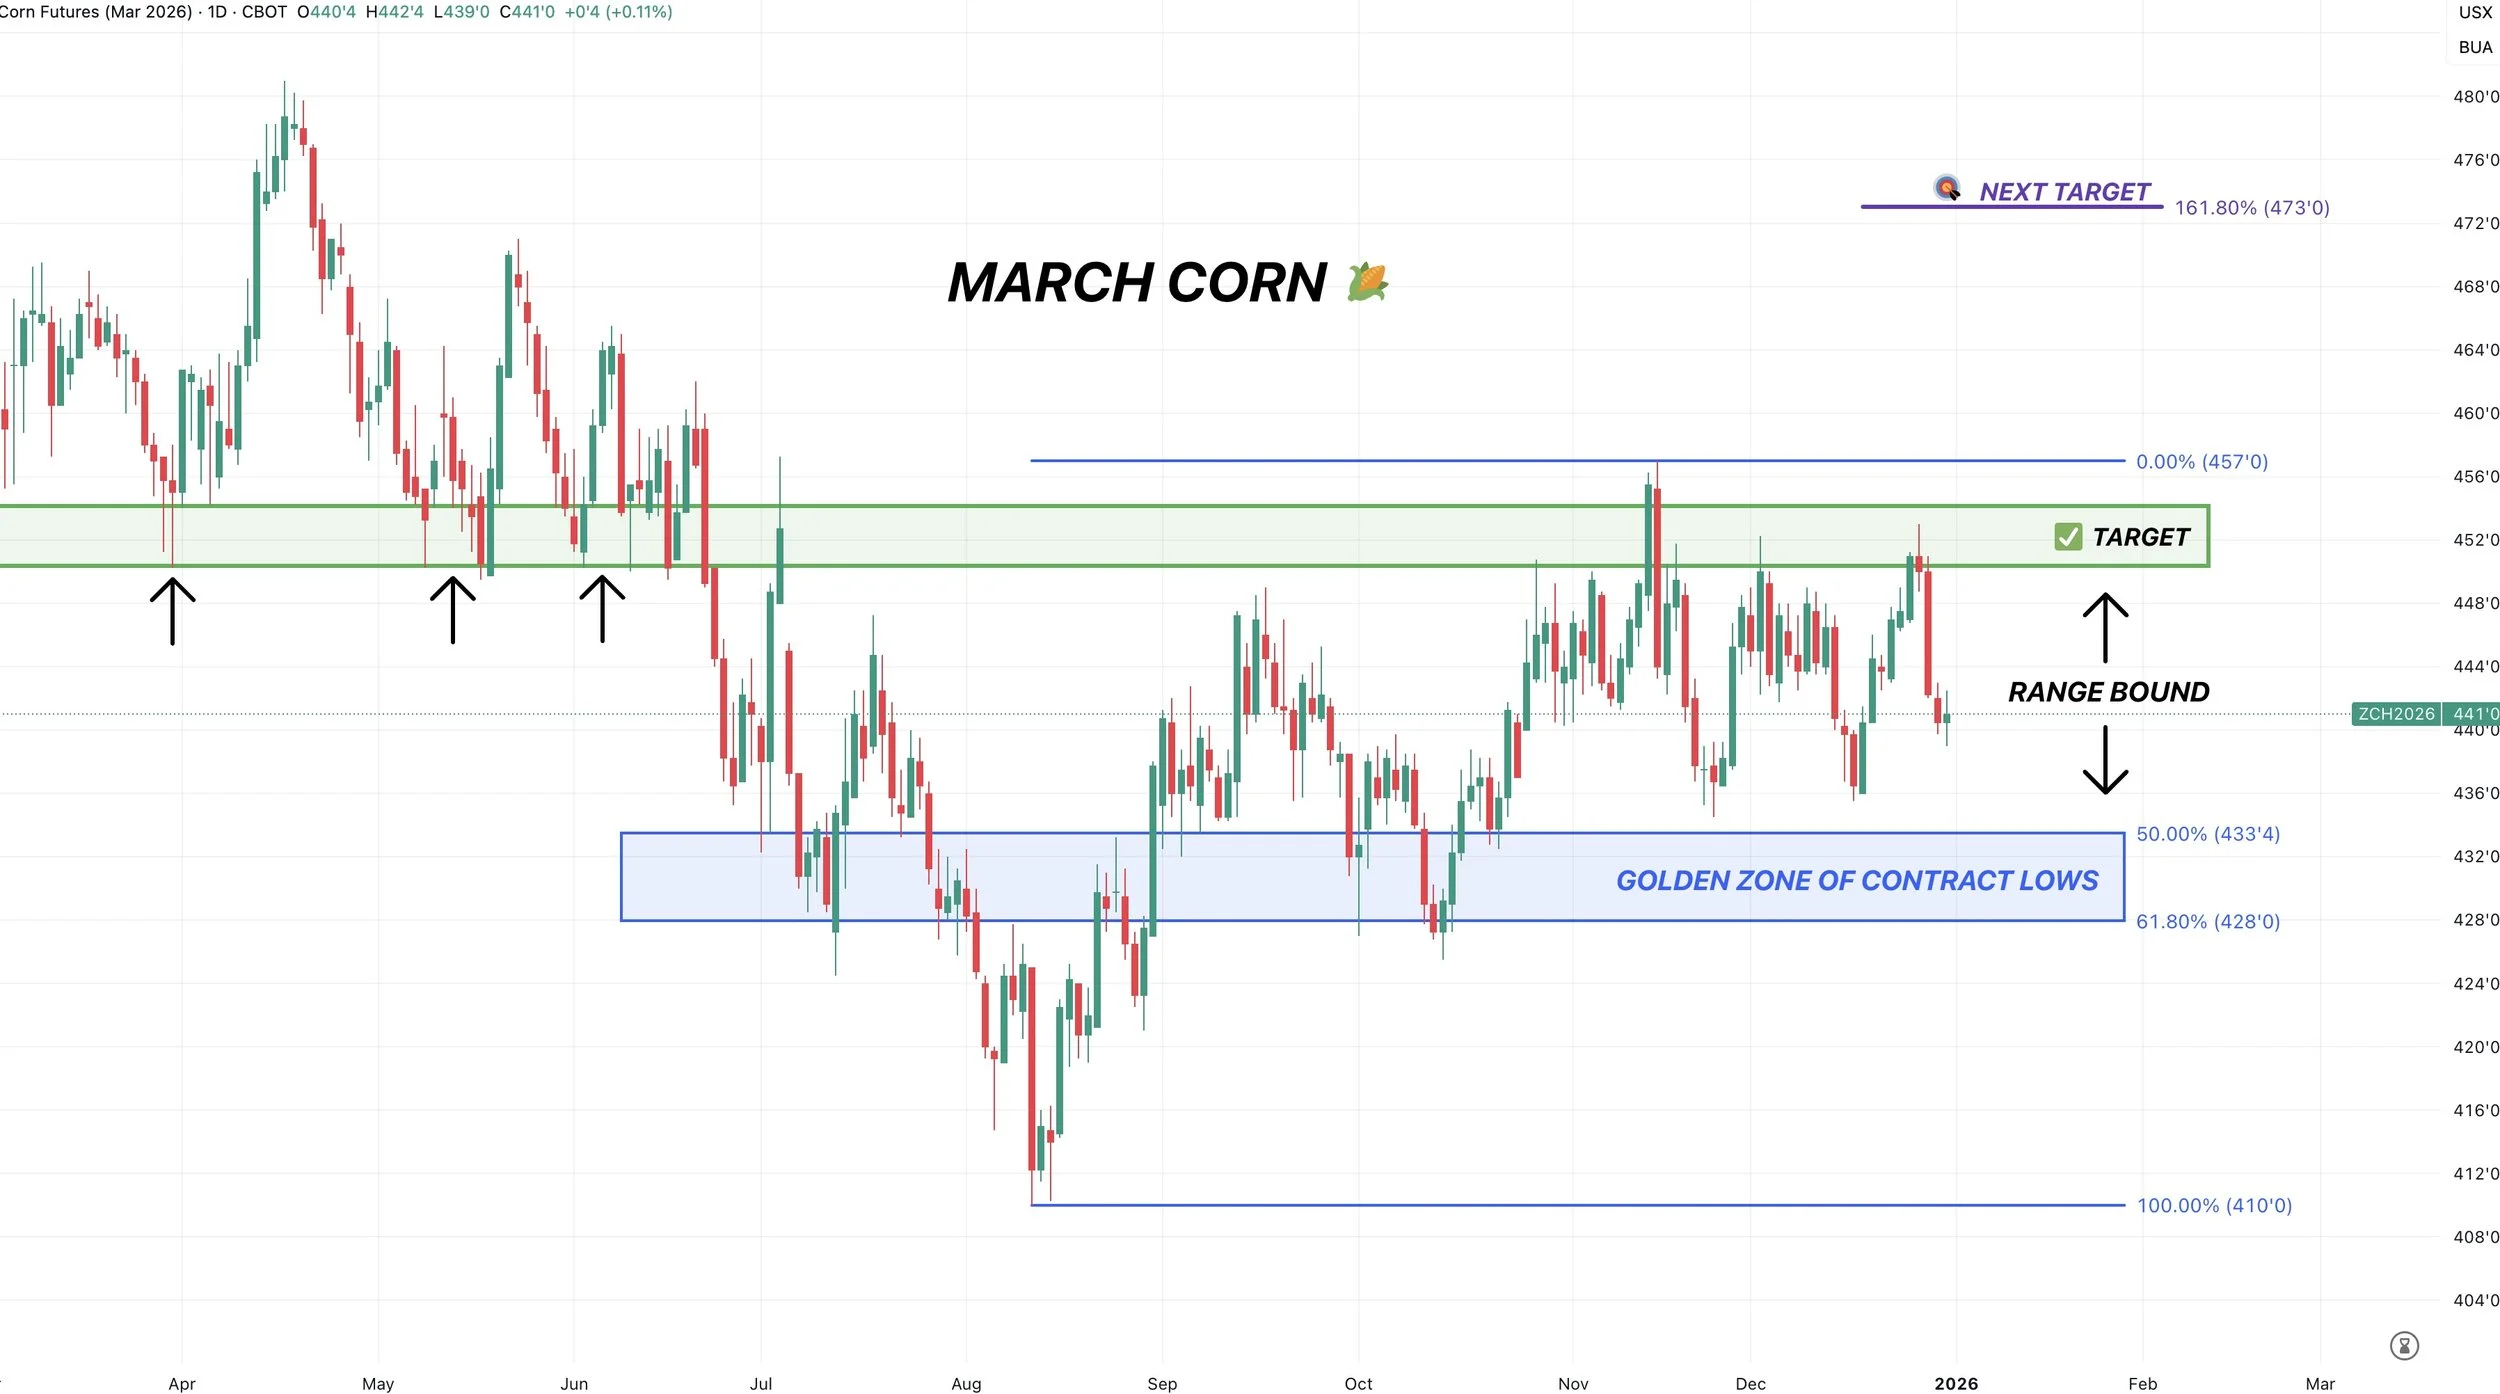
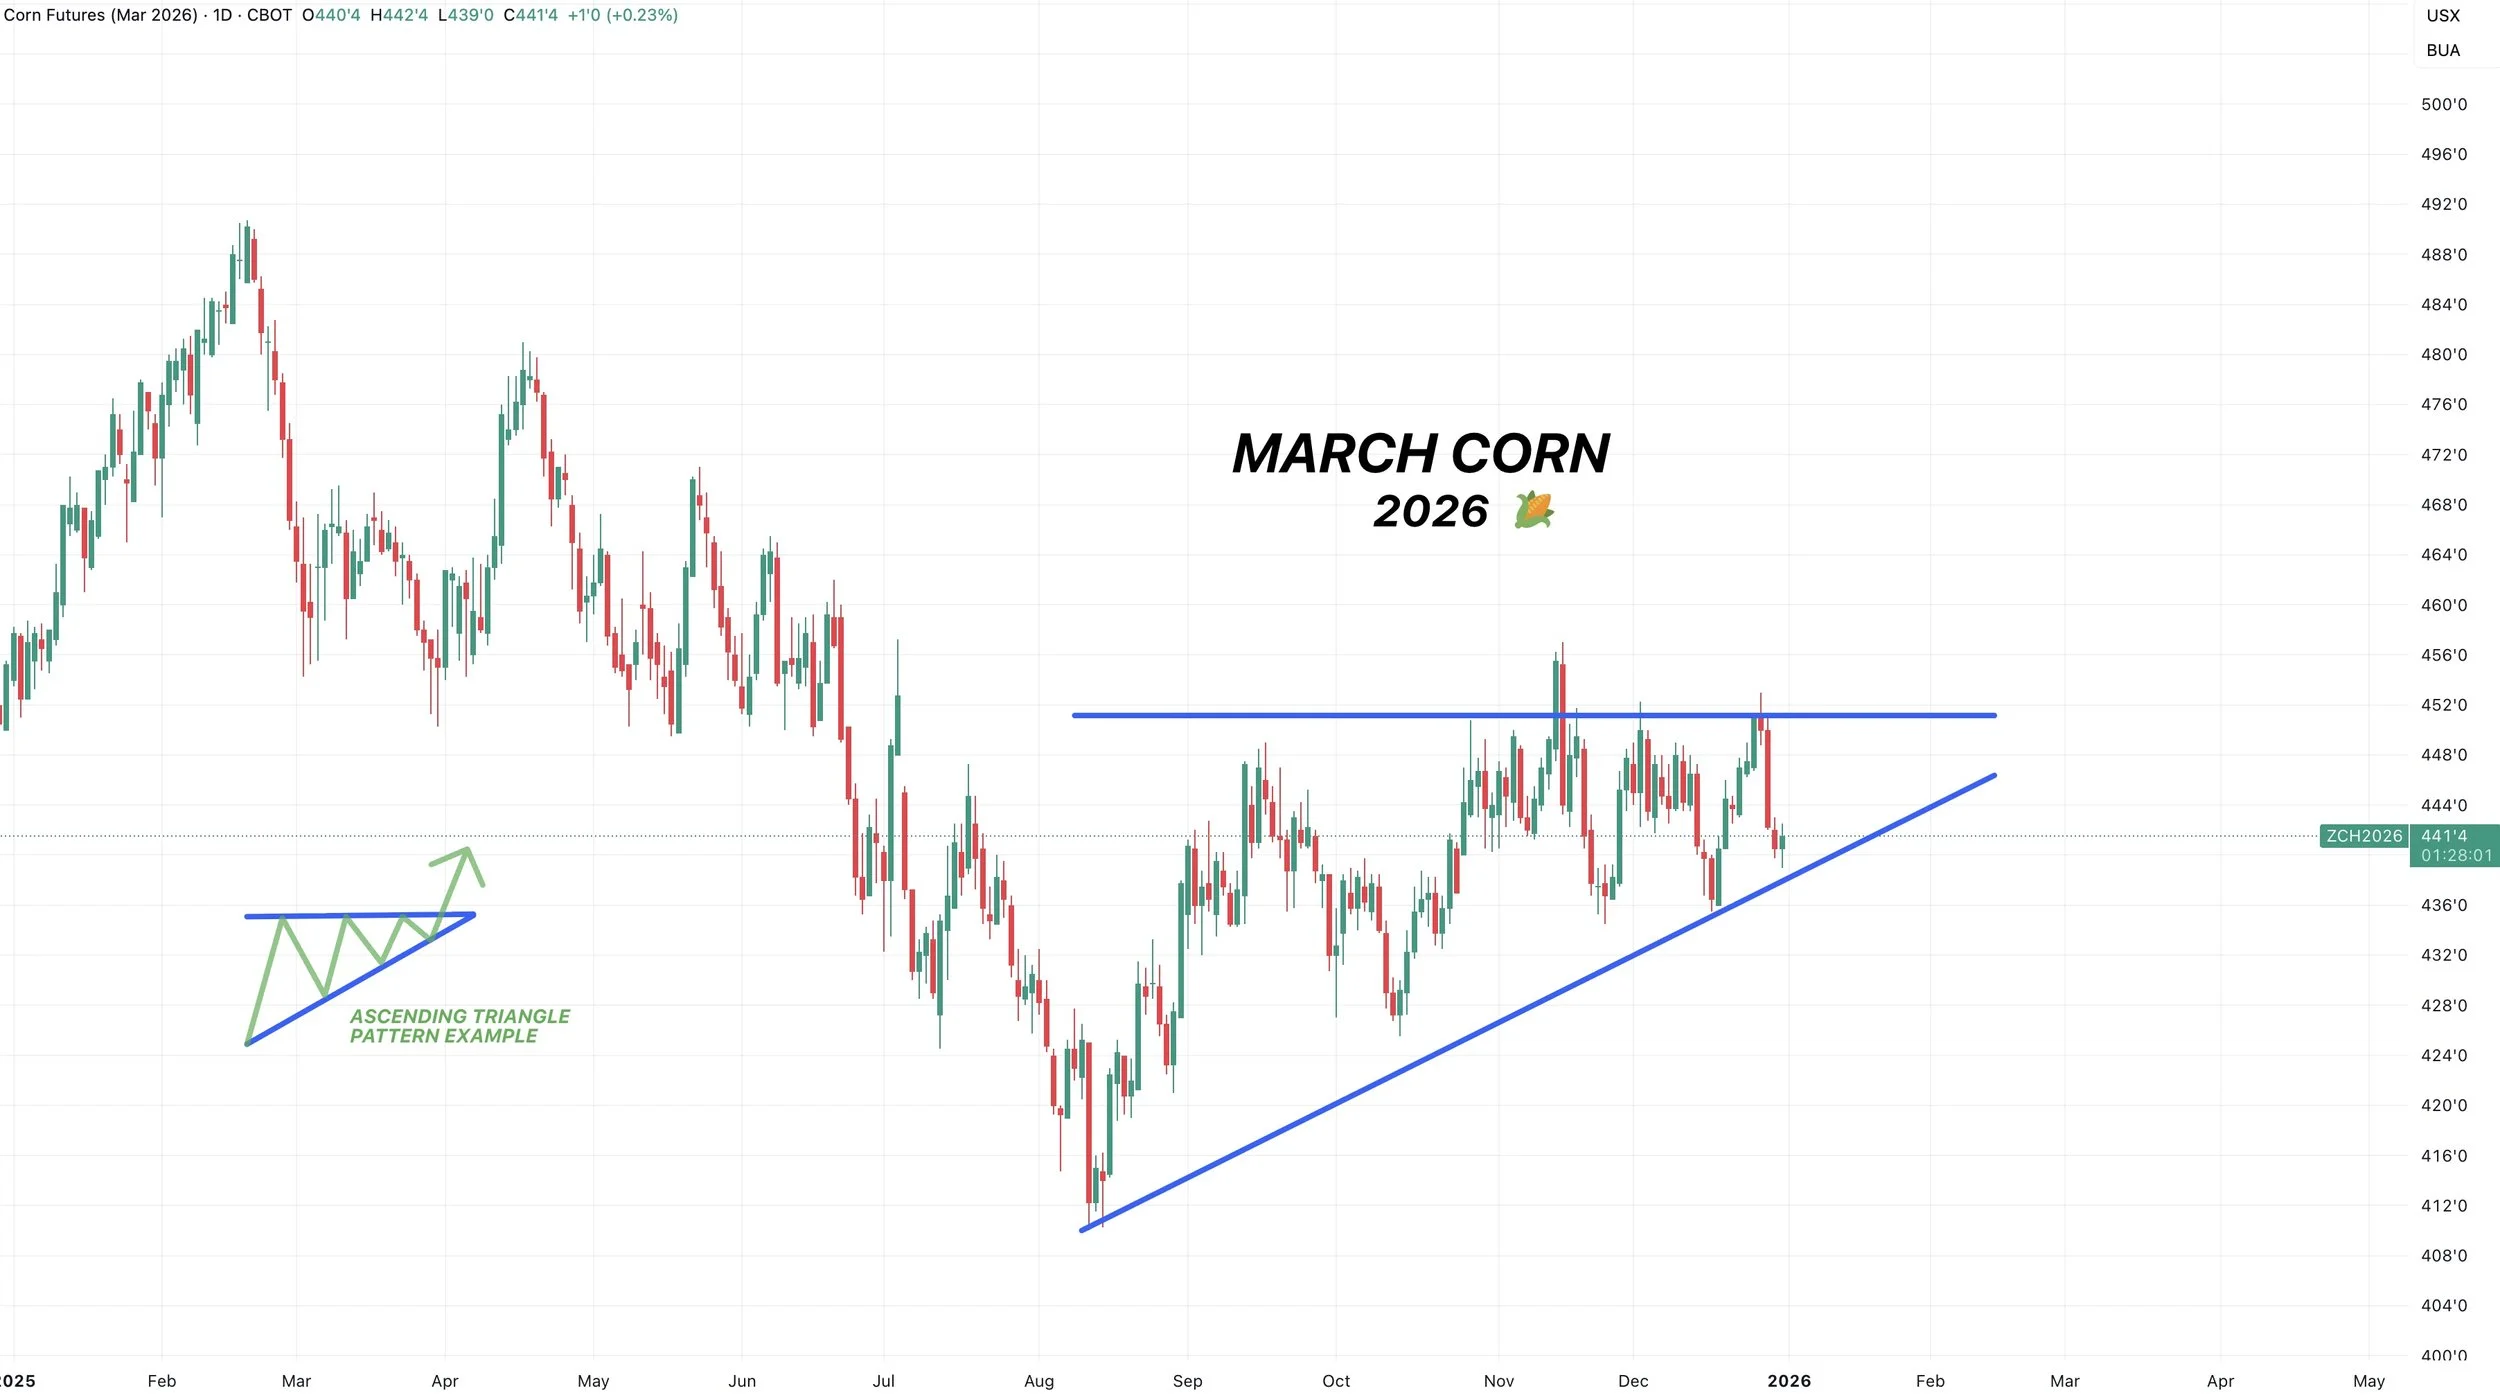
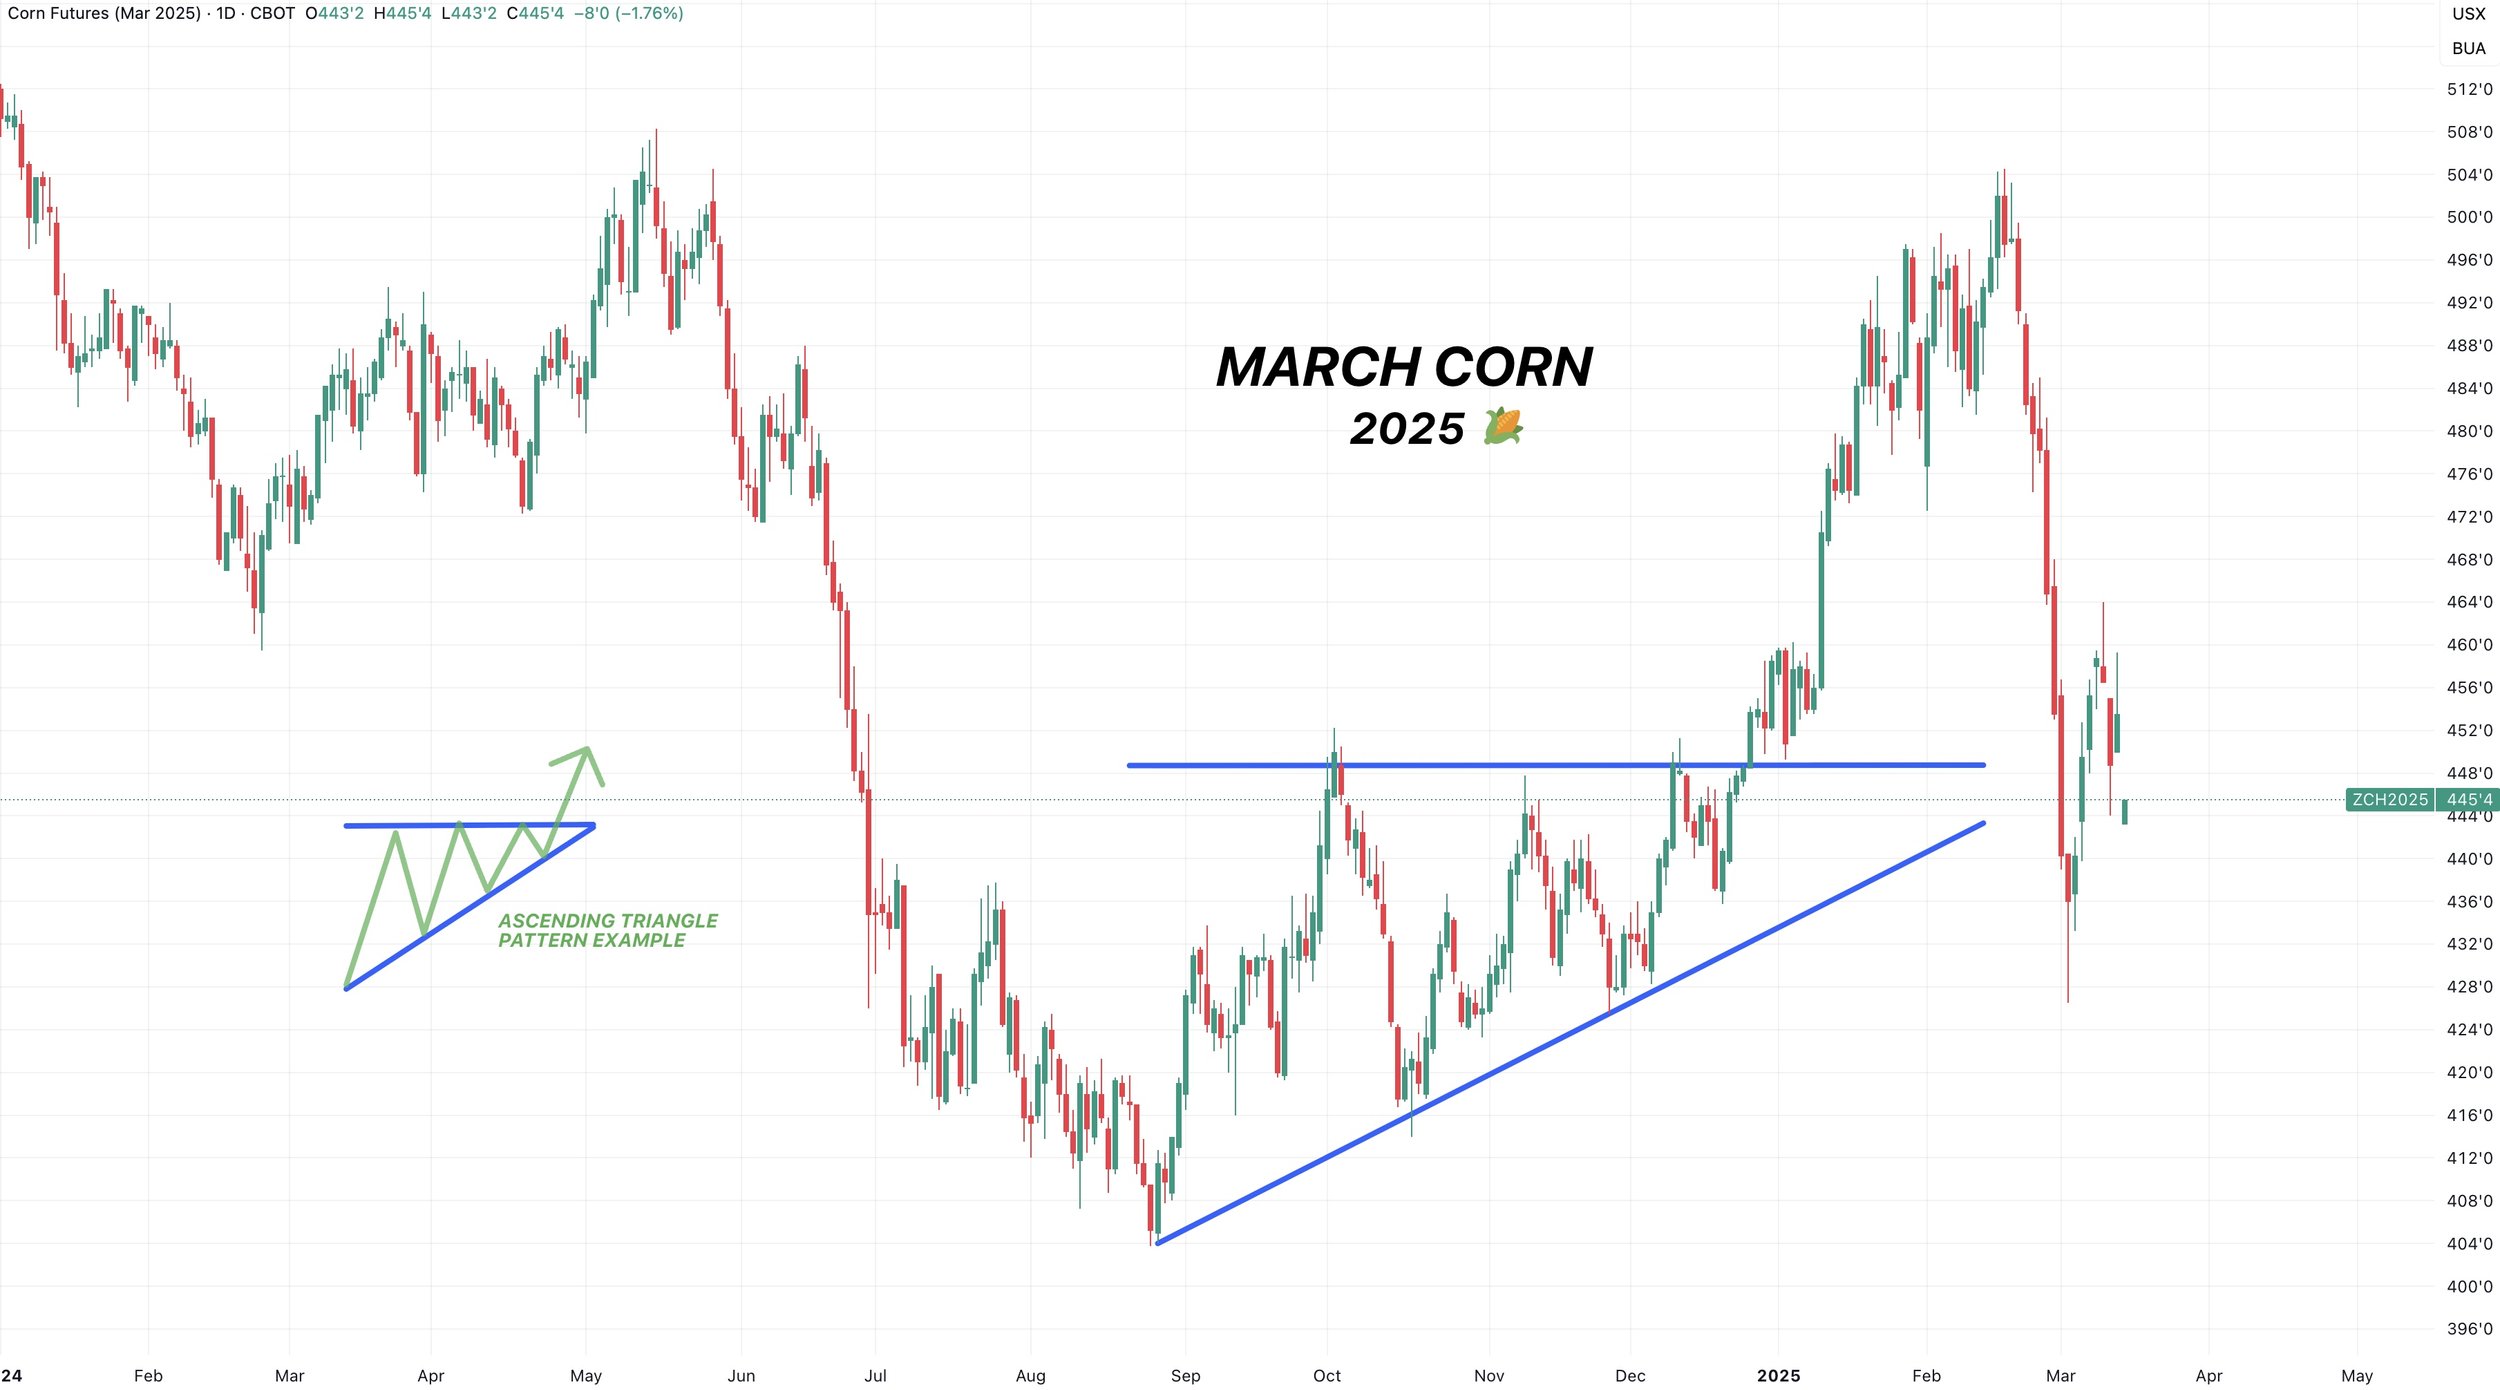
March Corn
Corn is simply range bound here.
We need to break above $4.50 to spark some upside.
If we take out the recent lows, the next point of interest would be the blue box. We don’t have to go there, but that is an area where I'd look at some re-ownership strategies. As that's the golden zone down to contract lows.
Since we orginally alerted a sell signal and took risk off the table at $4.50, our next upside target is around $4.73 for a variety of reasons which we'll discuss if it comes.
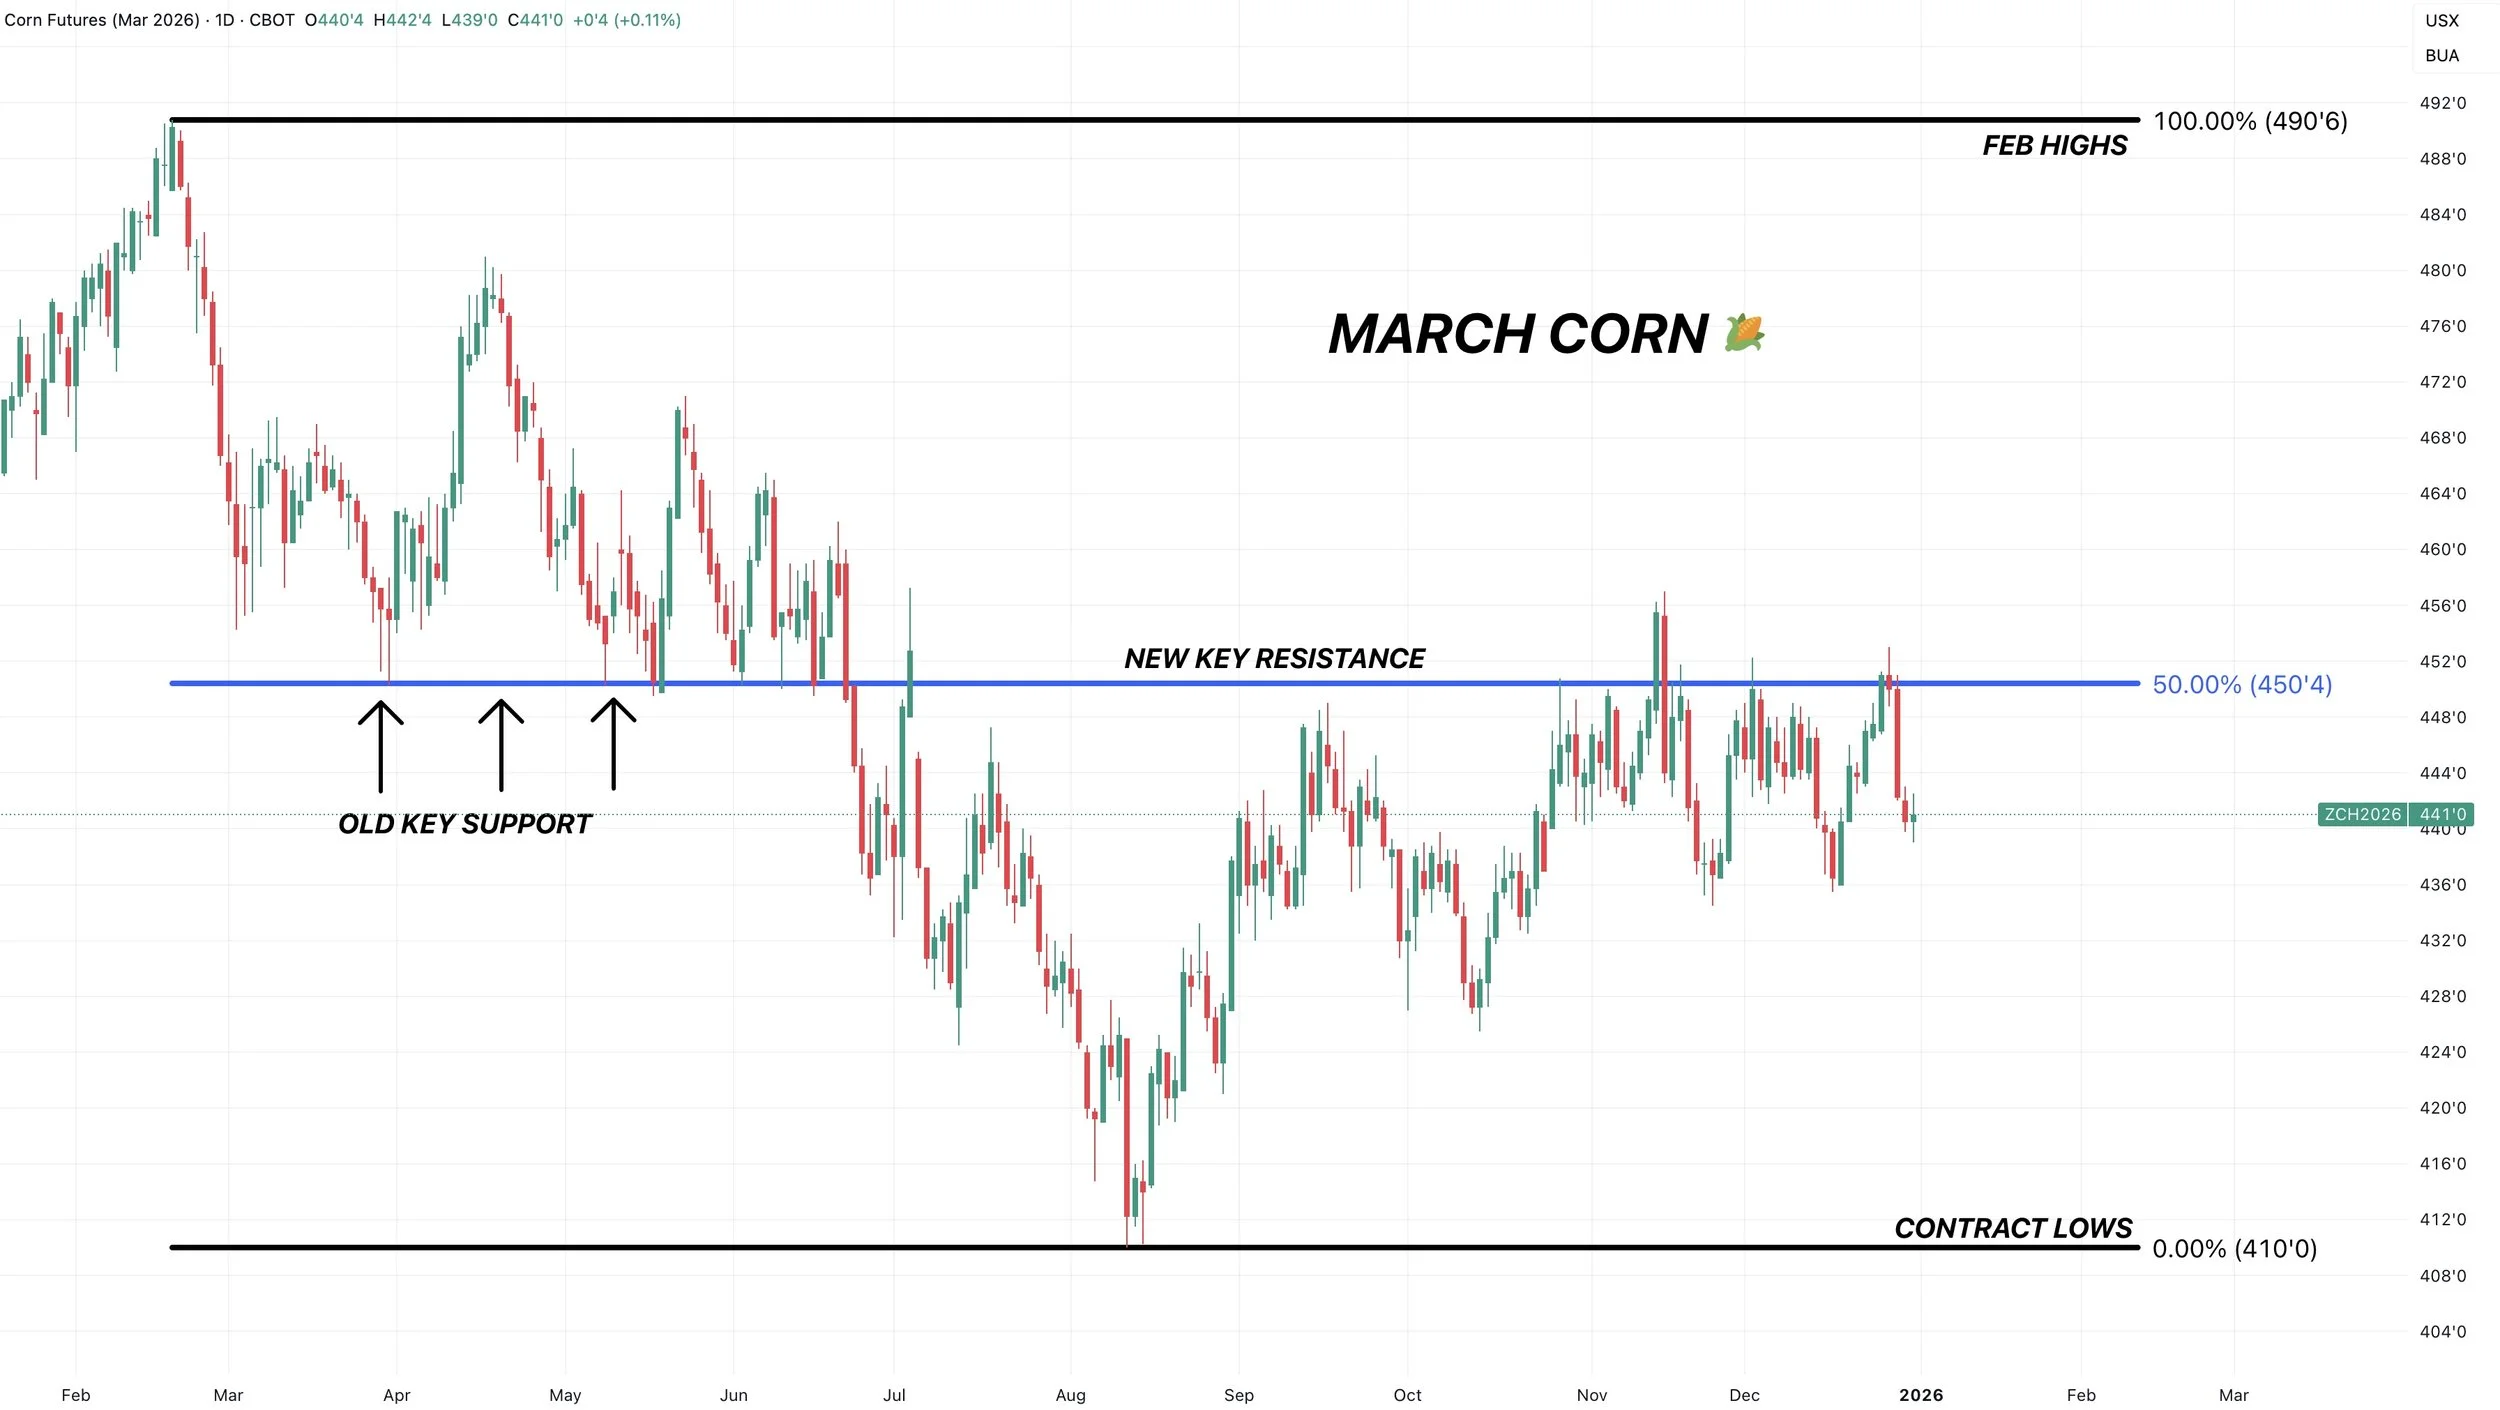
Here is a chart that outlines just how clear of resistance $4.50 is.
We've failed there several times.
We bounced there several times in spring.
It's 50% of the Feb highs like we've talked about 100 times.
It's key resistance.
Break above $4.50 and we should see higher prices.
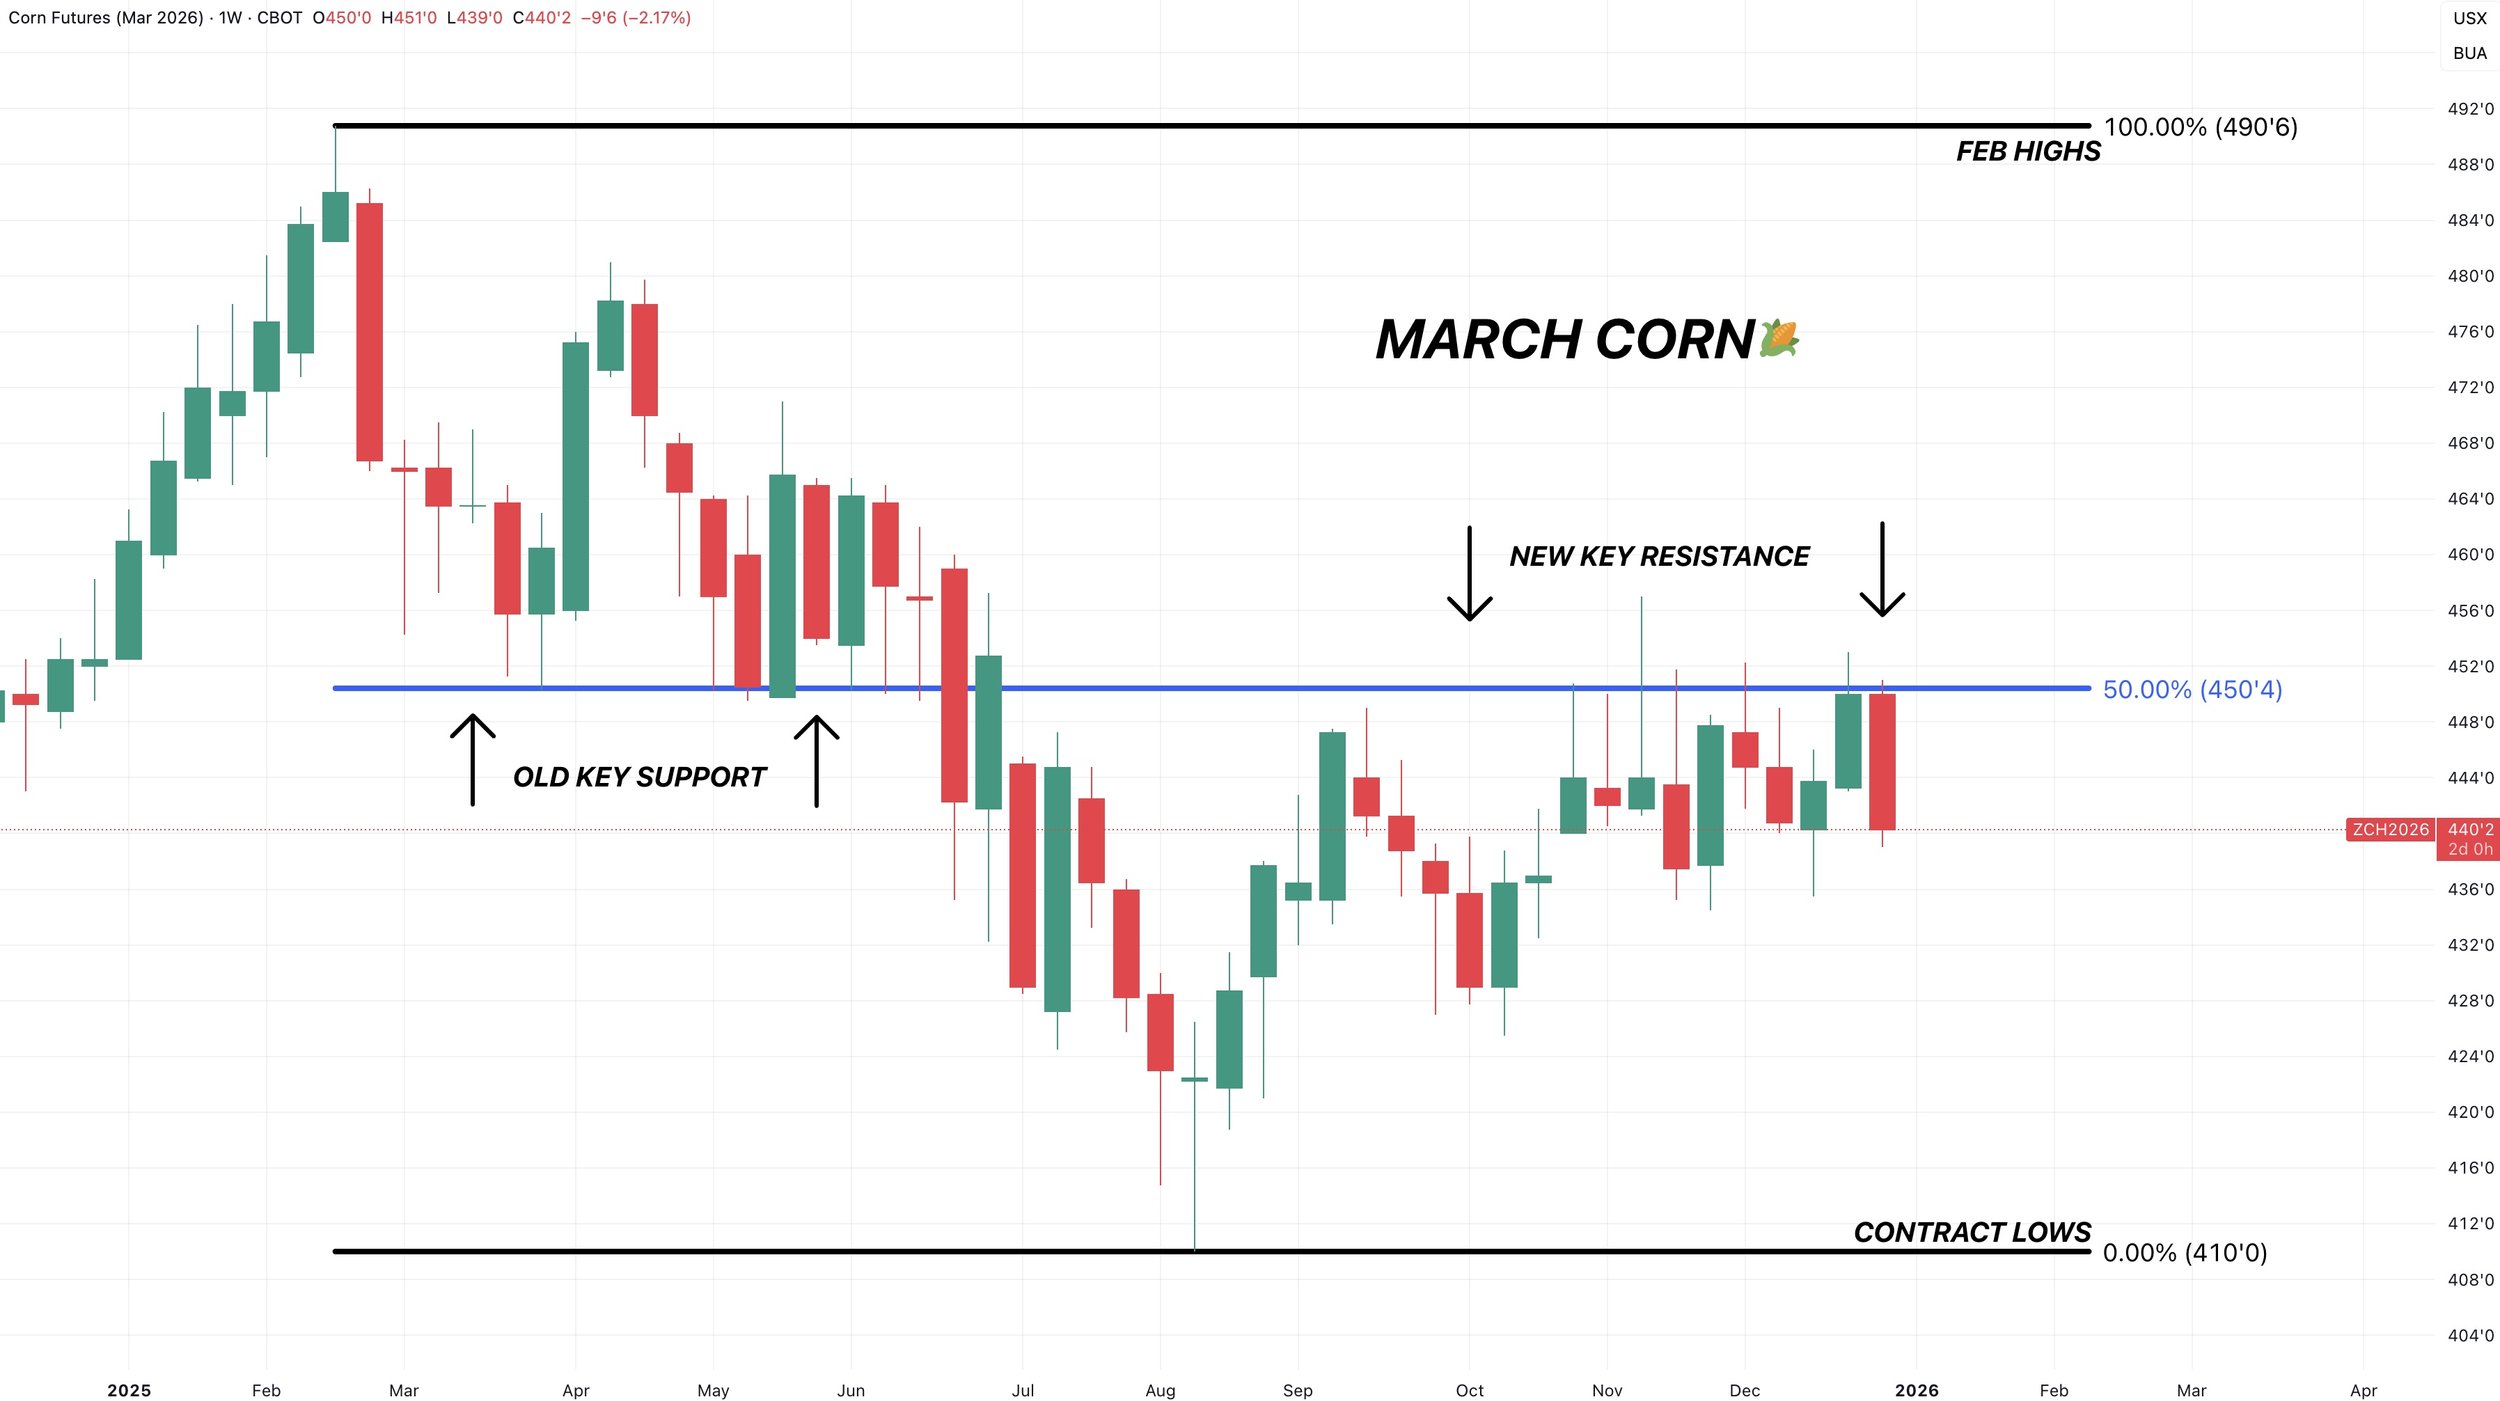
Here is the weekly chart for one last perspective.
We've failed to close above $4.50 and rejected that level nearly every week for the last 10 weeks in a row.
The same level this market bounced at on 7 separate occasions back in spring.
We touched on this yesterday, but corn is showing some very interesting similarities to last year.
Here is a side by side chart comparison.
They are both sitting in a pattern known as an ascending triangle. Which features horizontal resistance in an uptrend.
We won’t follow last year exactly. I don’t think we have quiet as much upside as last year based on the fundamental outlook. Last year featured a 1.50 billion bu carryout in January. We are at 2 billion today.
Regardless, you can’t ignore the similarities.
They have the same pattern. They saw the same exact price action off the lows. All happening at the exact same time in the year.
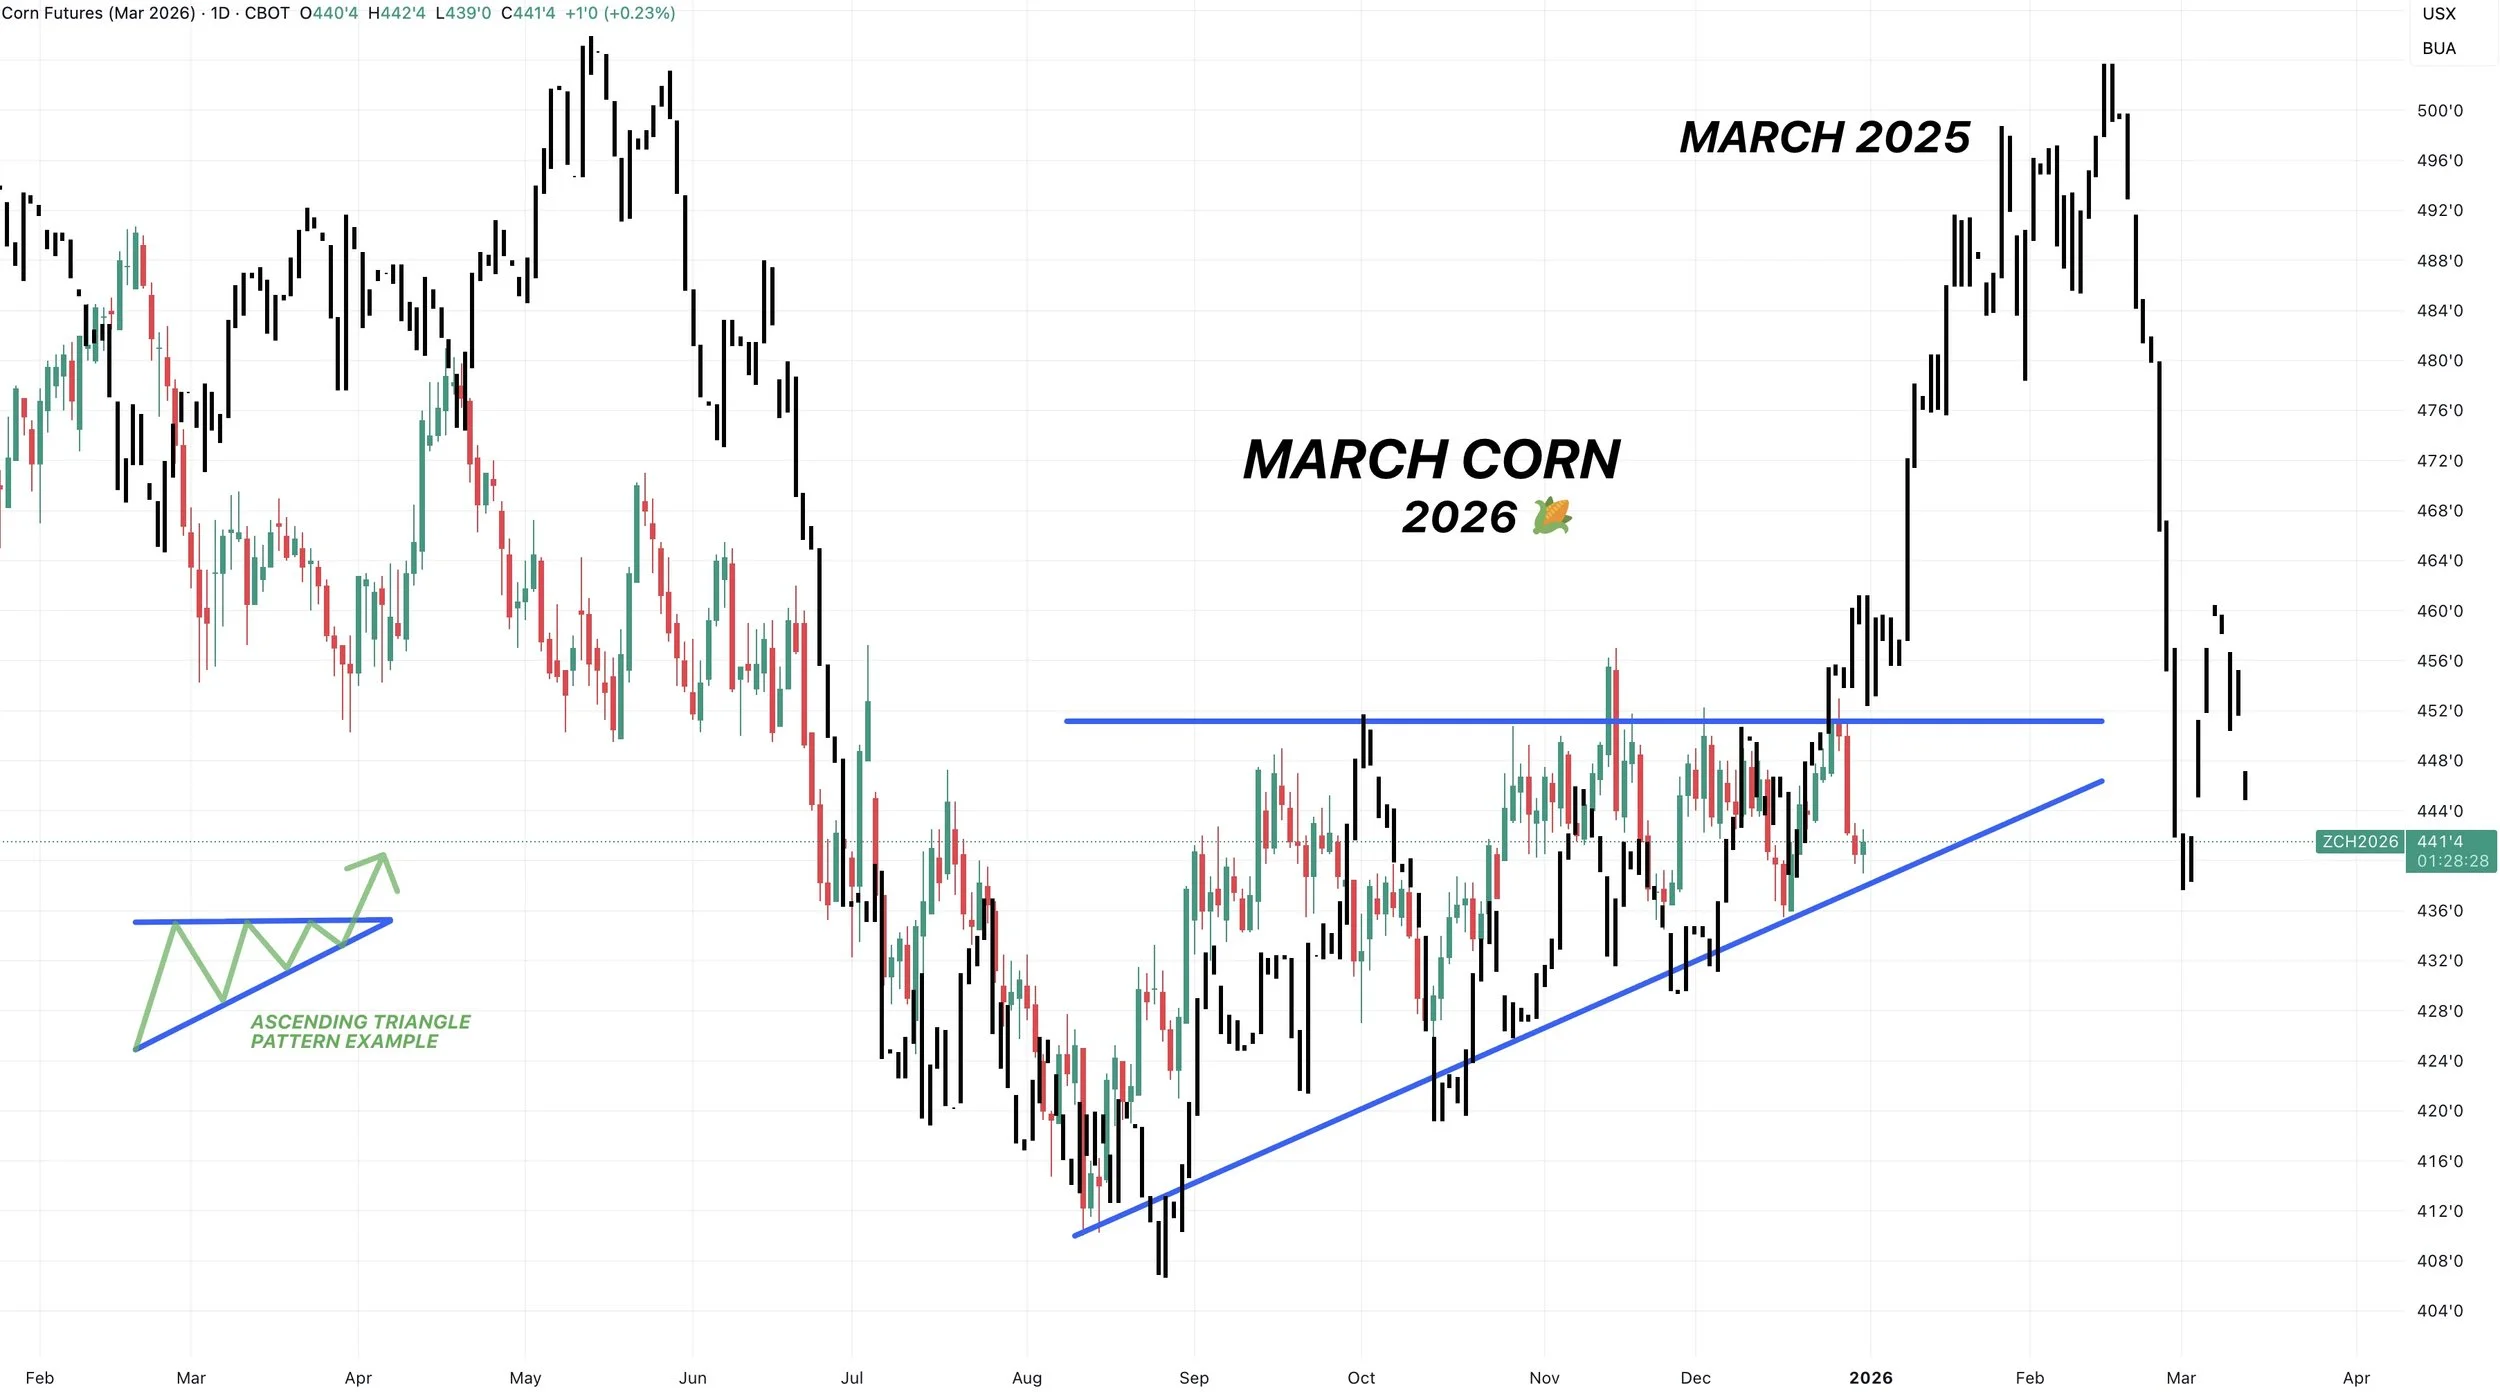
Here is what the two years look like overlayed on top of each other.
The normal bars are this year.
The black bars are last year.
I mean just look at how similar the two years have been off those harvest lows. Almost identical price action.
Last year, we revisted those spring highs.
The spring highs were higher last year, so perhaps we revist the spring highs once again this year and get the same pattern, but not as large of a rally.
Those spring highs come in around $4.80
Soybeans
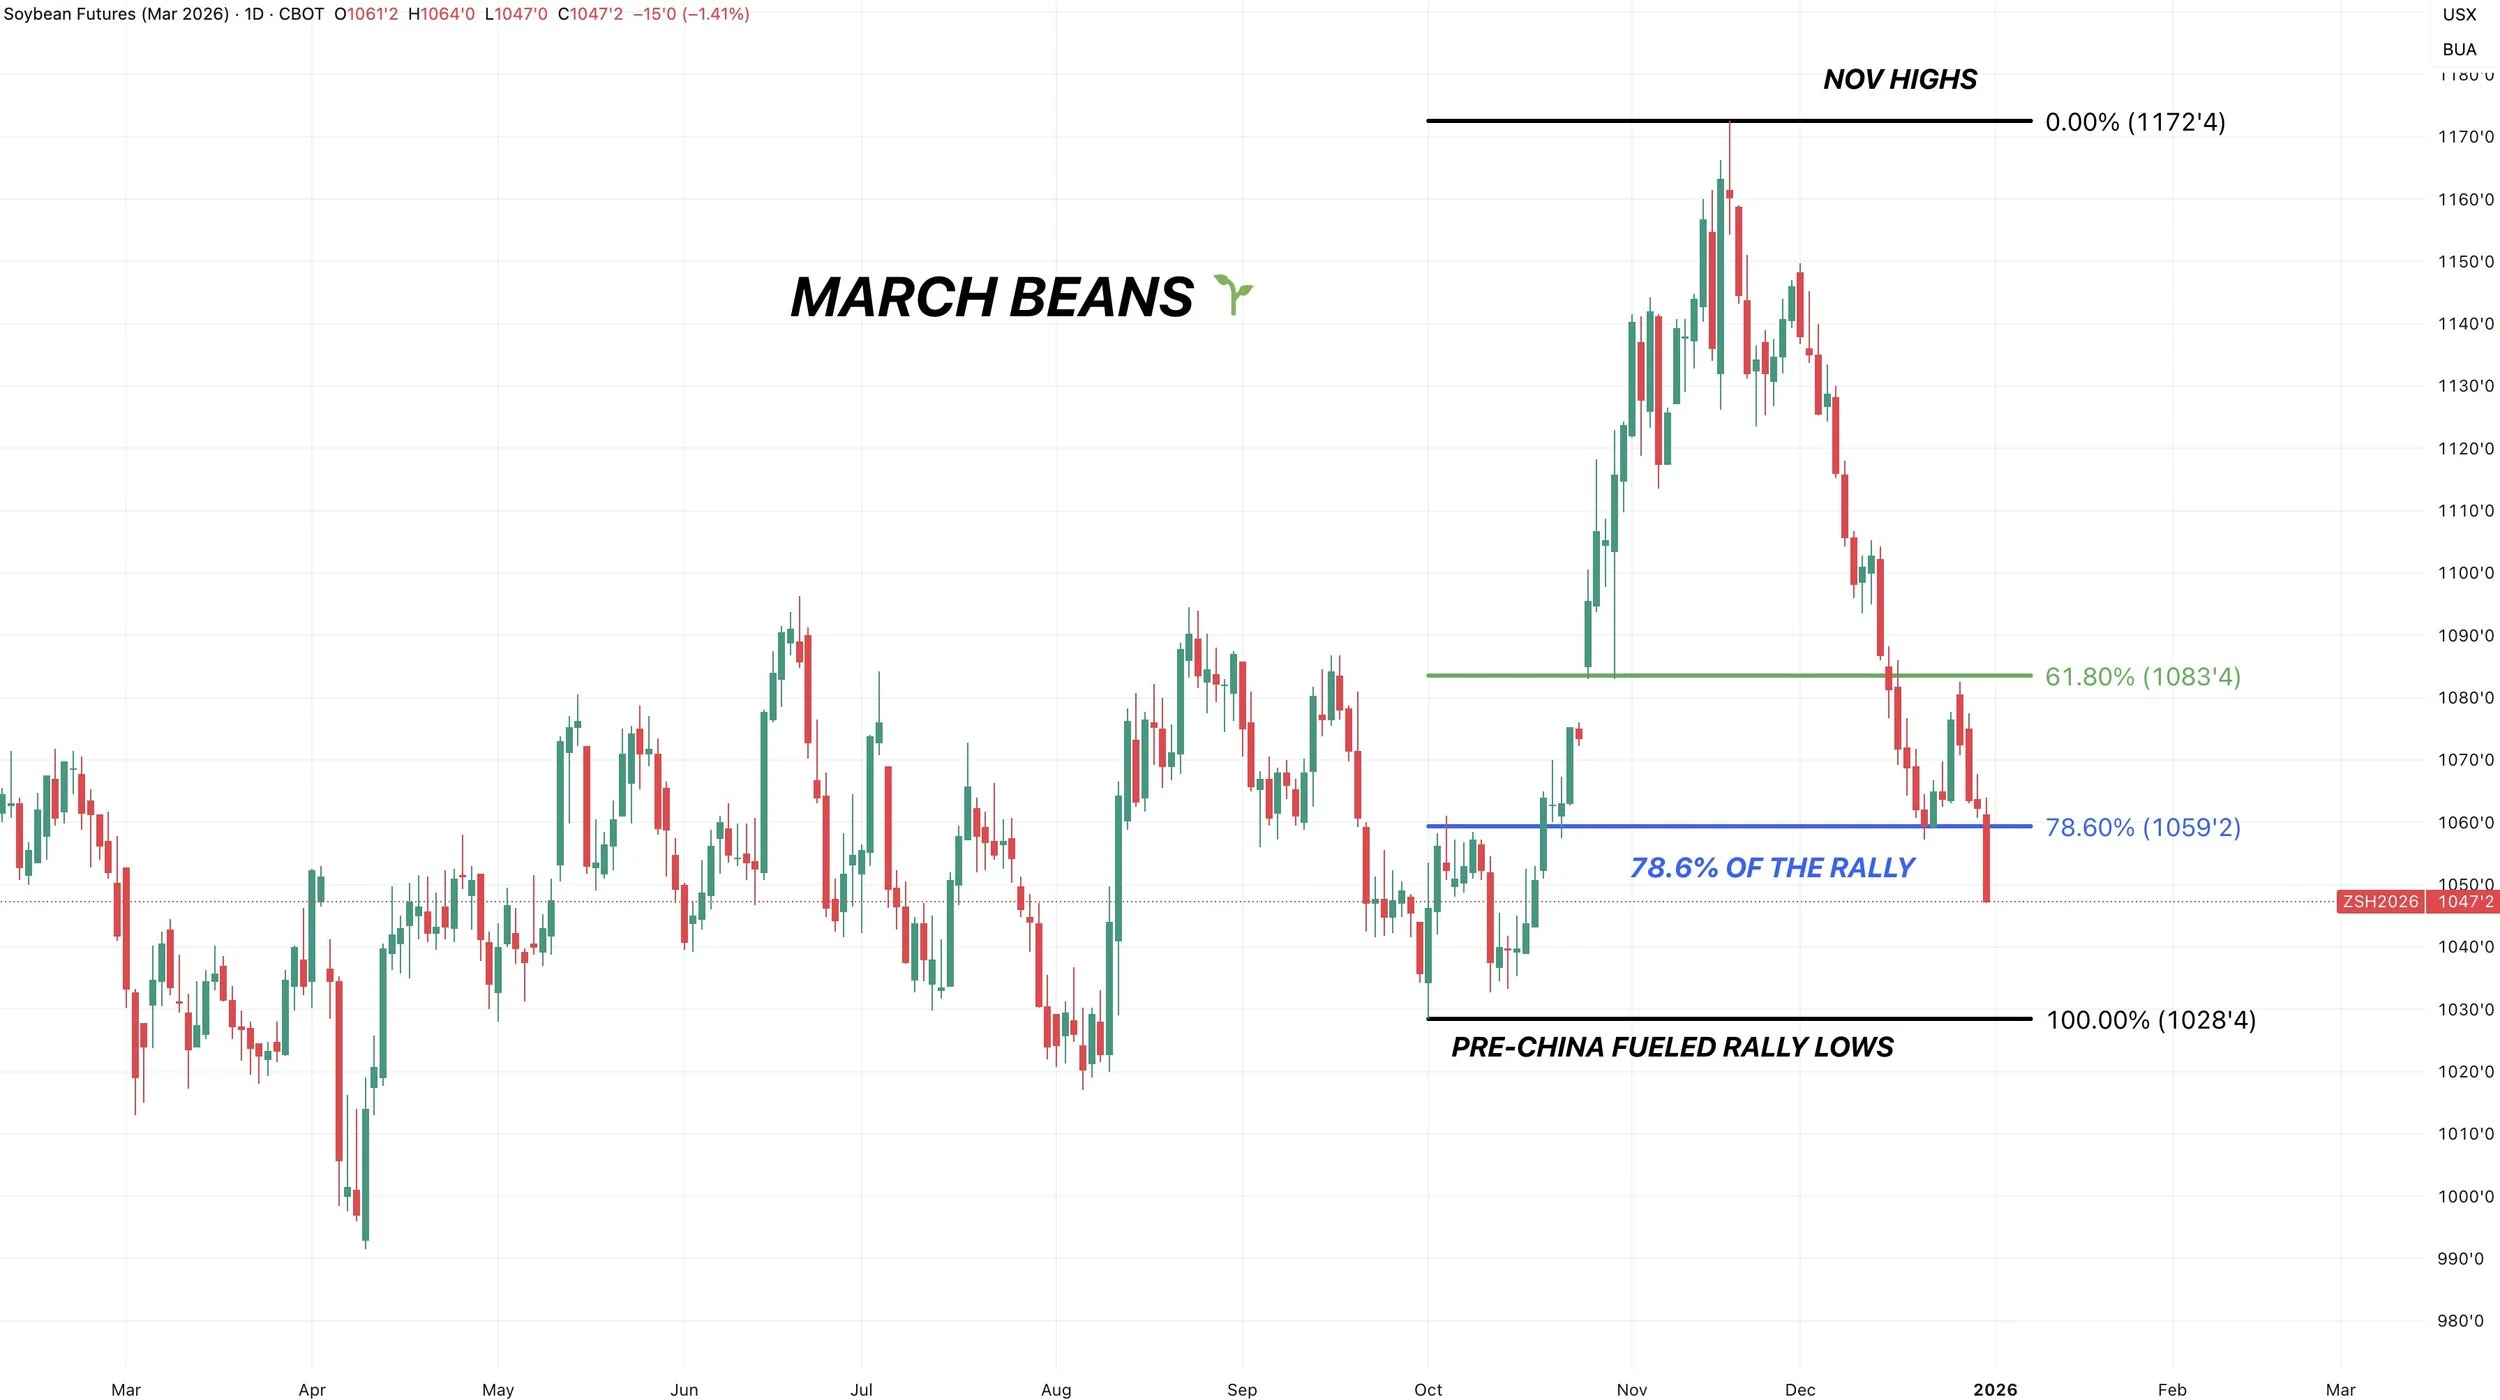
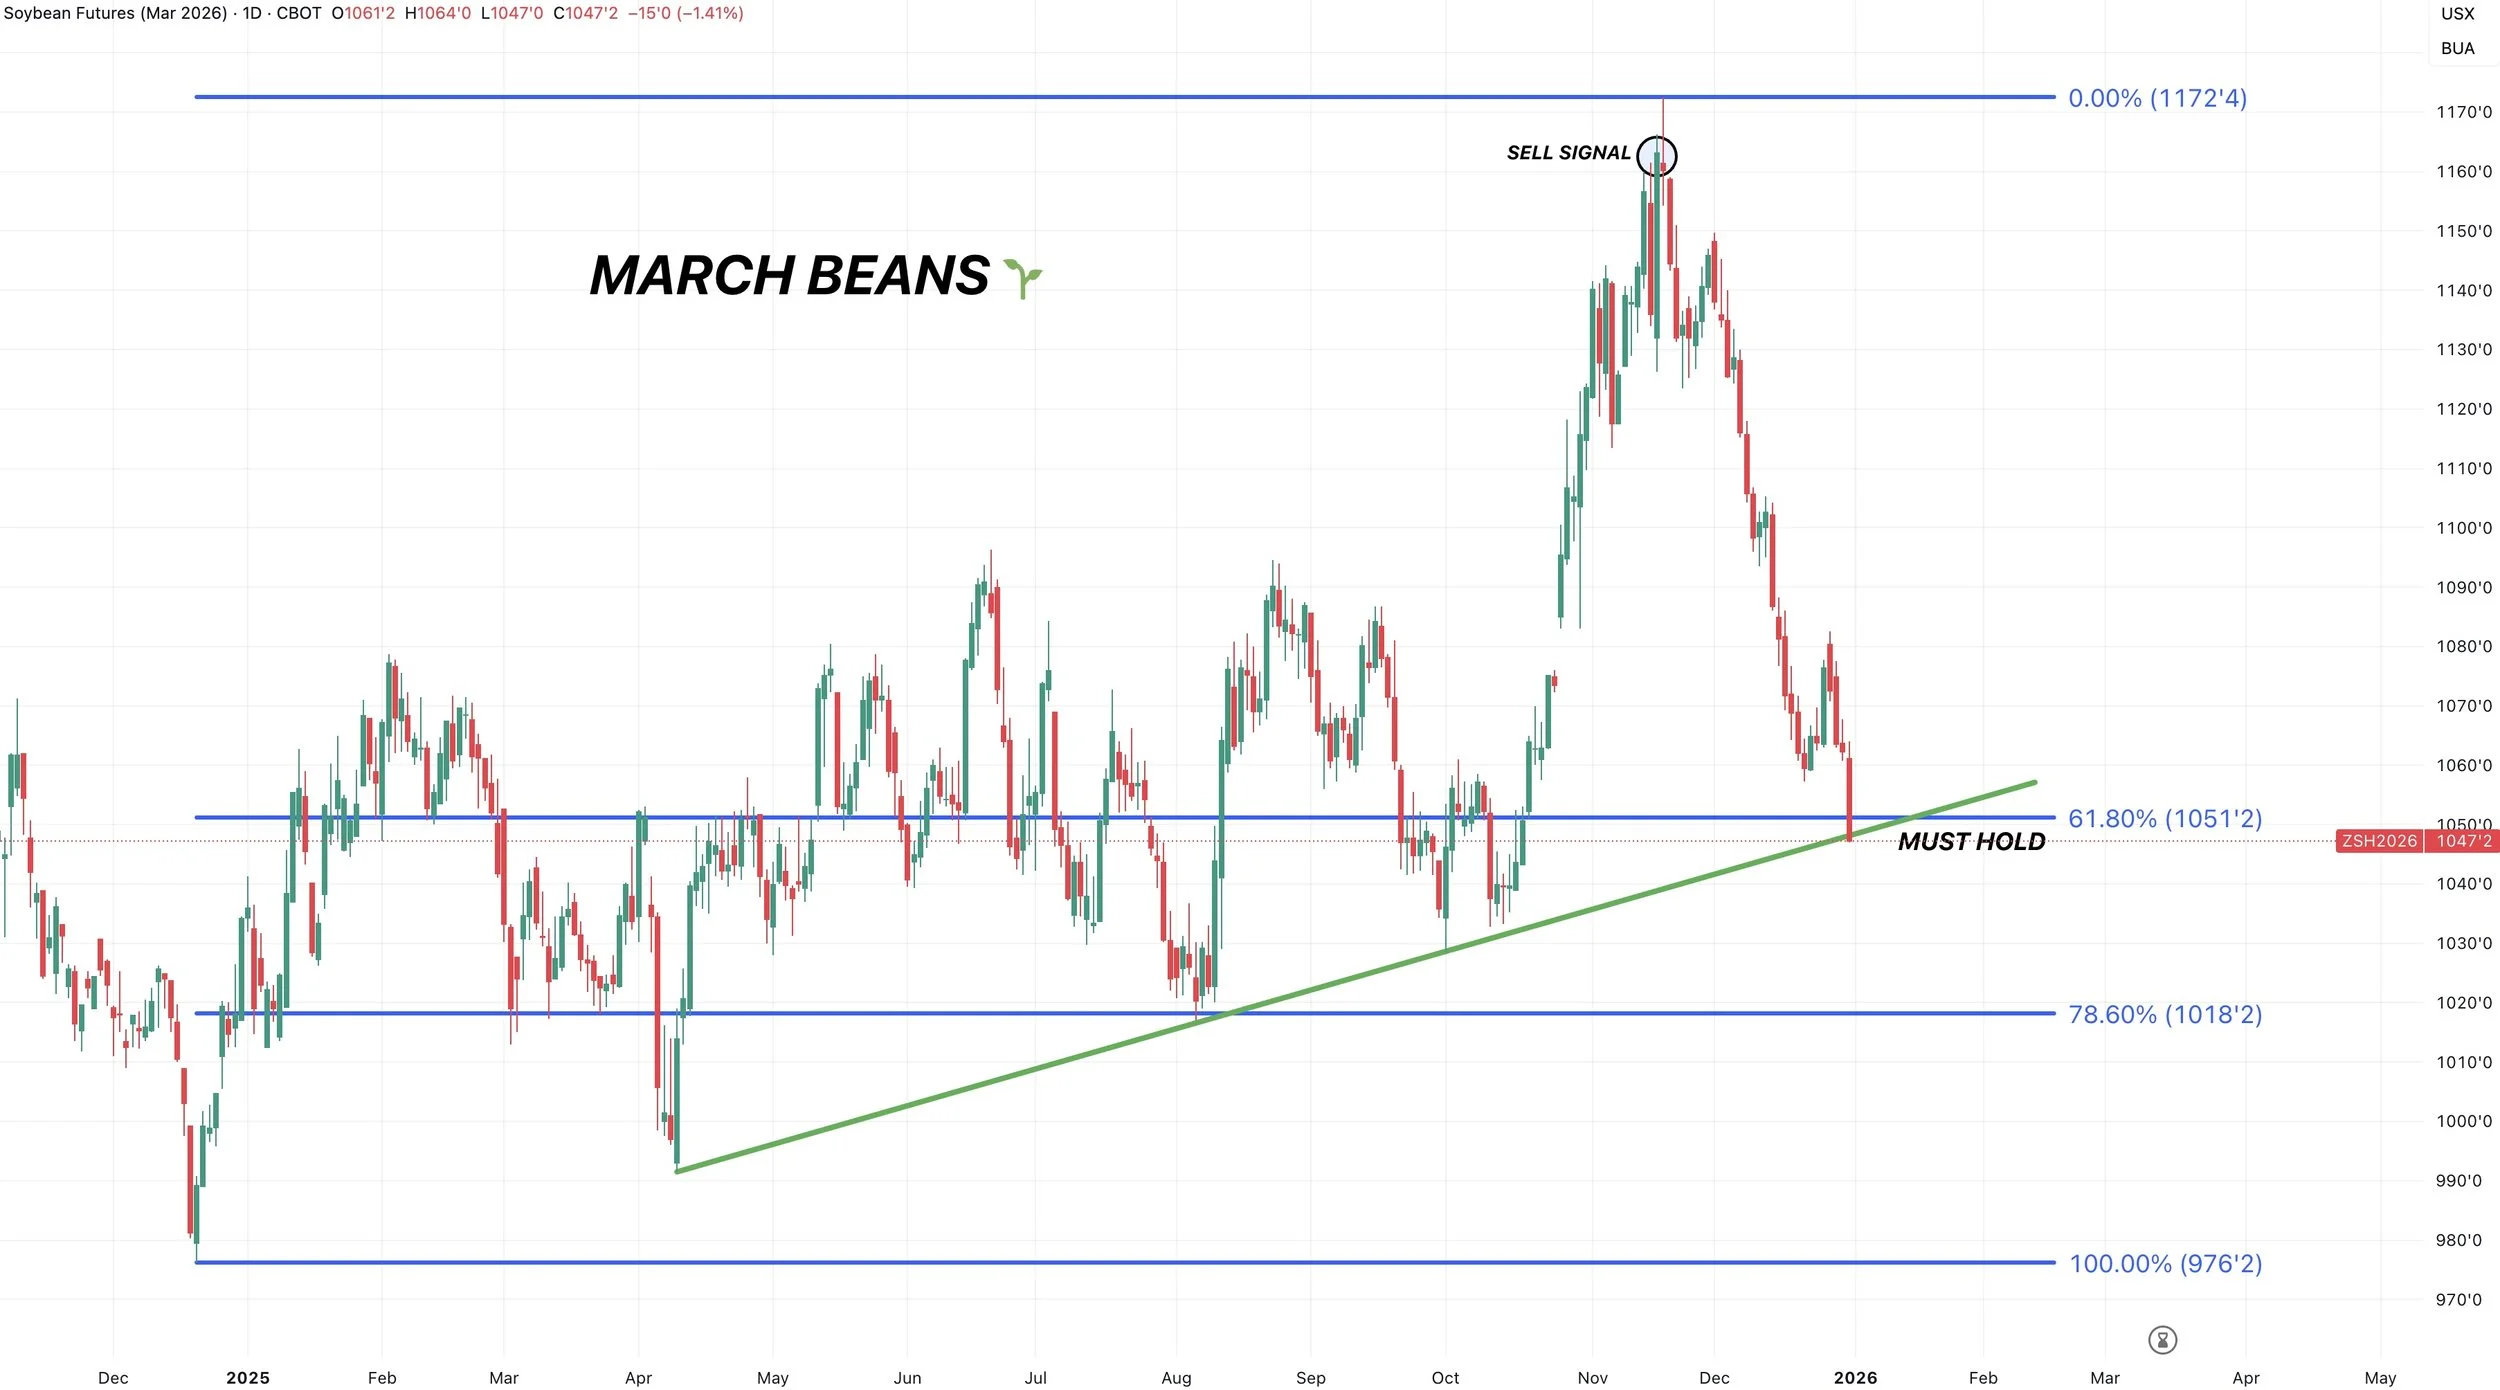
March Beans
We failed to hold that 78.6% level down to the pre-China rally lows along with this recent lows after originally getting a nice reaction off that level.
Not the best look here.
Now what?
Soybeans need to bounce pretty much right now.
Otherwise it could open the door quiet a bit lower.
For starters we are just below the 61.8% level down to contract lows.
We need back above that soon. Rule of thumb is typically you don’t want to see back to back closes below that level. It is called the golden fib after all and where prices usually have a big decision to make.
Otherwise, the next level is the 78.6% level in that $10.18 area
We are also sitting right at some trendline support that we'd like to see hold.
So it's basically bounce or die time for soybeans.
I still think we can find life down here, but it needs to happen soon. Or this chart could easily fall apart even more.
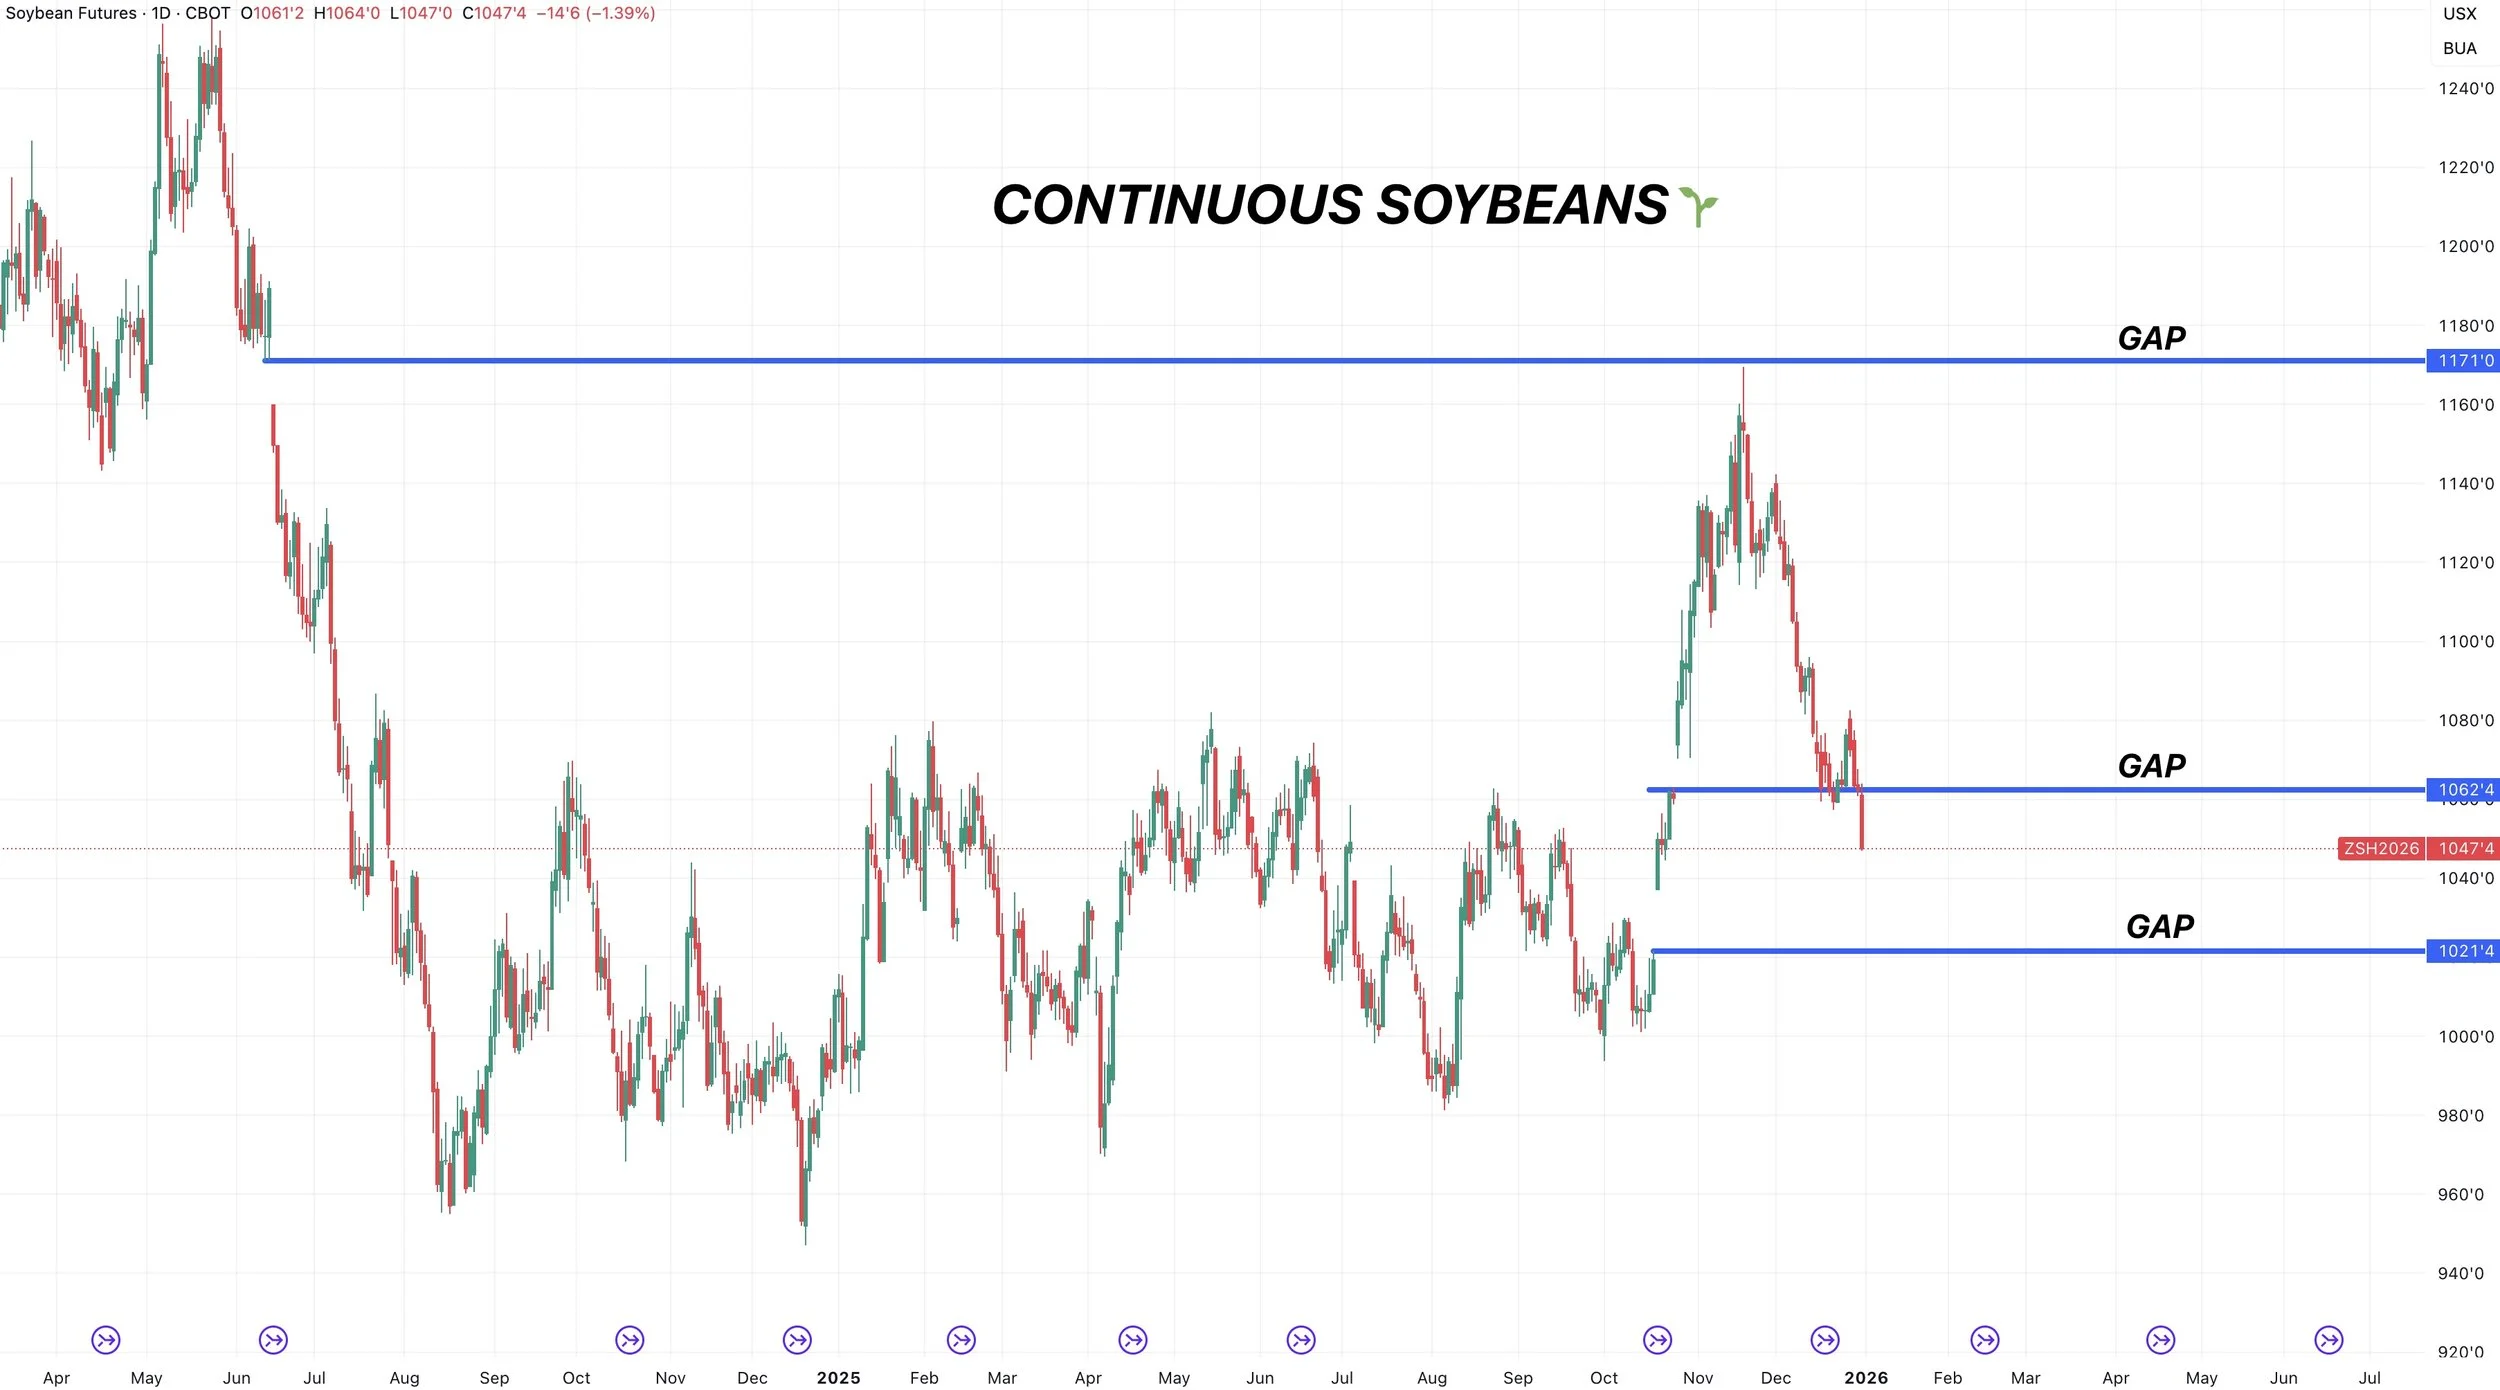
Here is the continuous chart that shows the contract with the most volume.
We filled that first gap then bounced.
We now failed to hold those recent lows.
There is another gap down at $10.20. Which lines up with that other level on the March beans chart.
So we need to bounce soon or that is the downside risk.
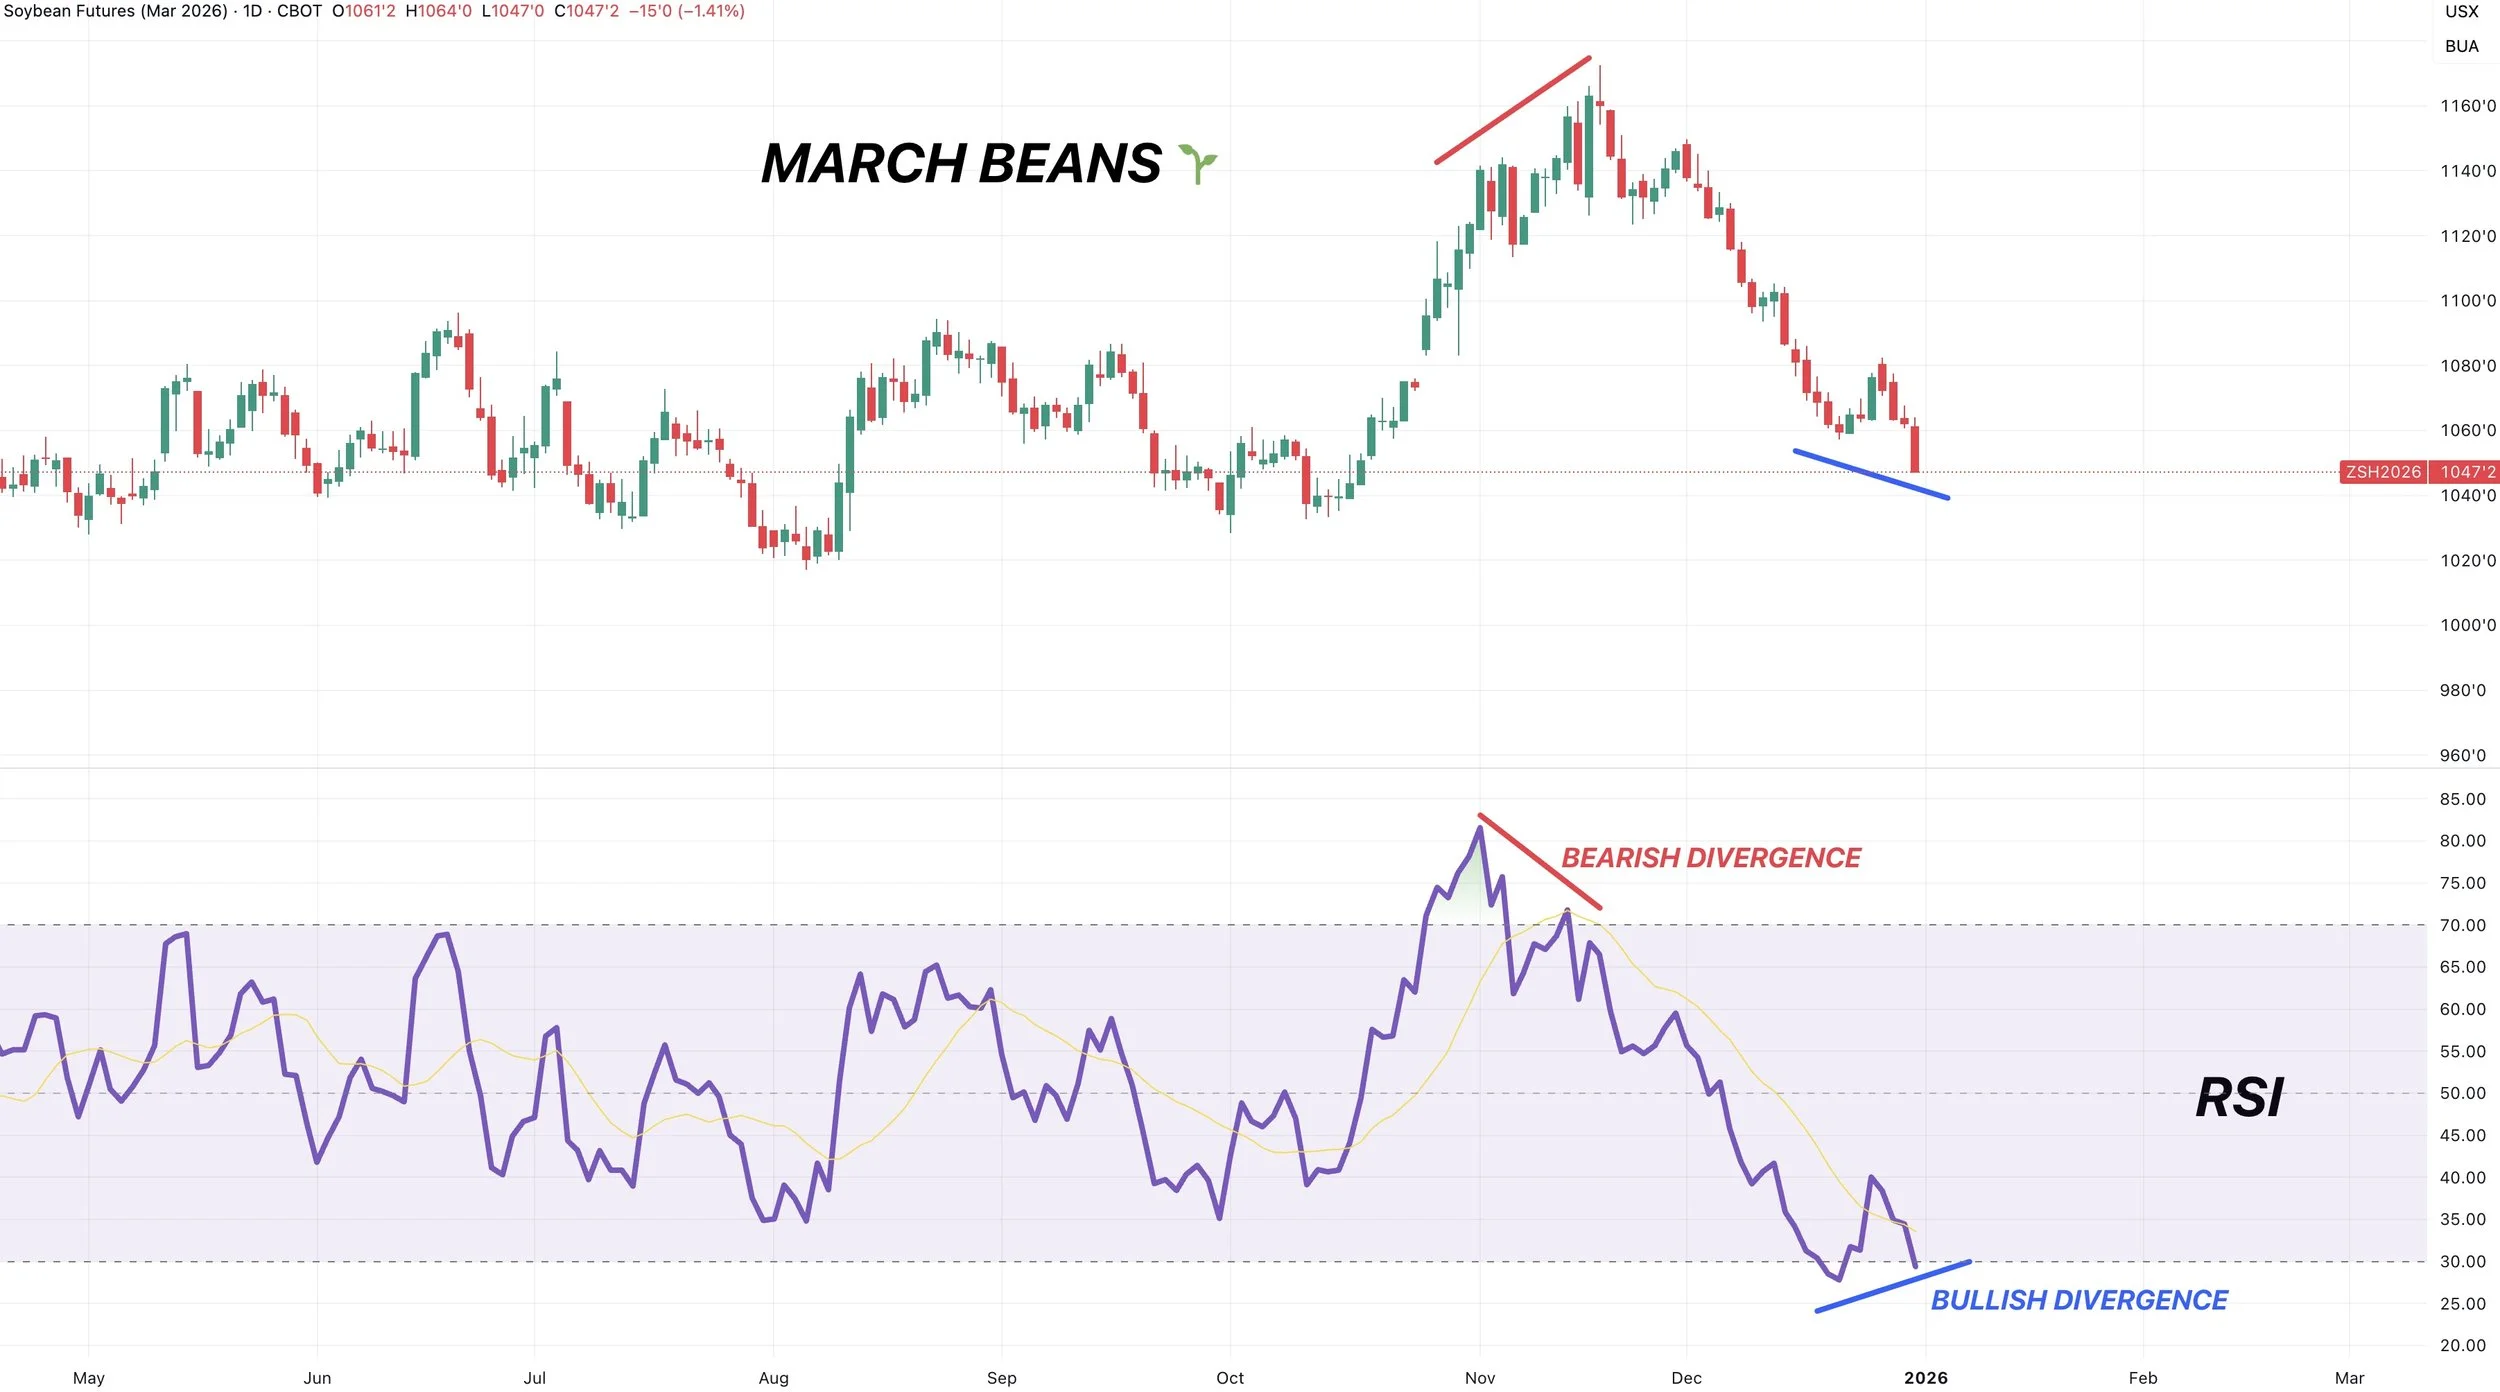
We did see some confirmed bullish divergence today.
As prices made new lows. Yet the RSI did not.
This doesn’t mean we have to go higher, but it tells us downside momentum might start to get weak here.
We also need to bounce pretty much right now to keep this divergence in place and prevent the RSI from posting a new low.
Wheat
March Wheat
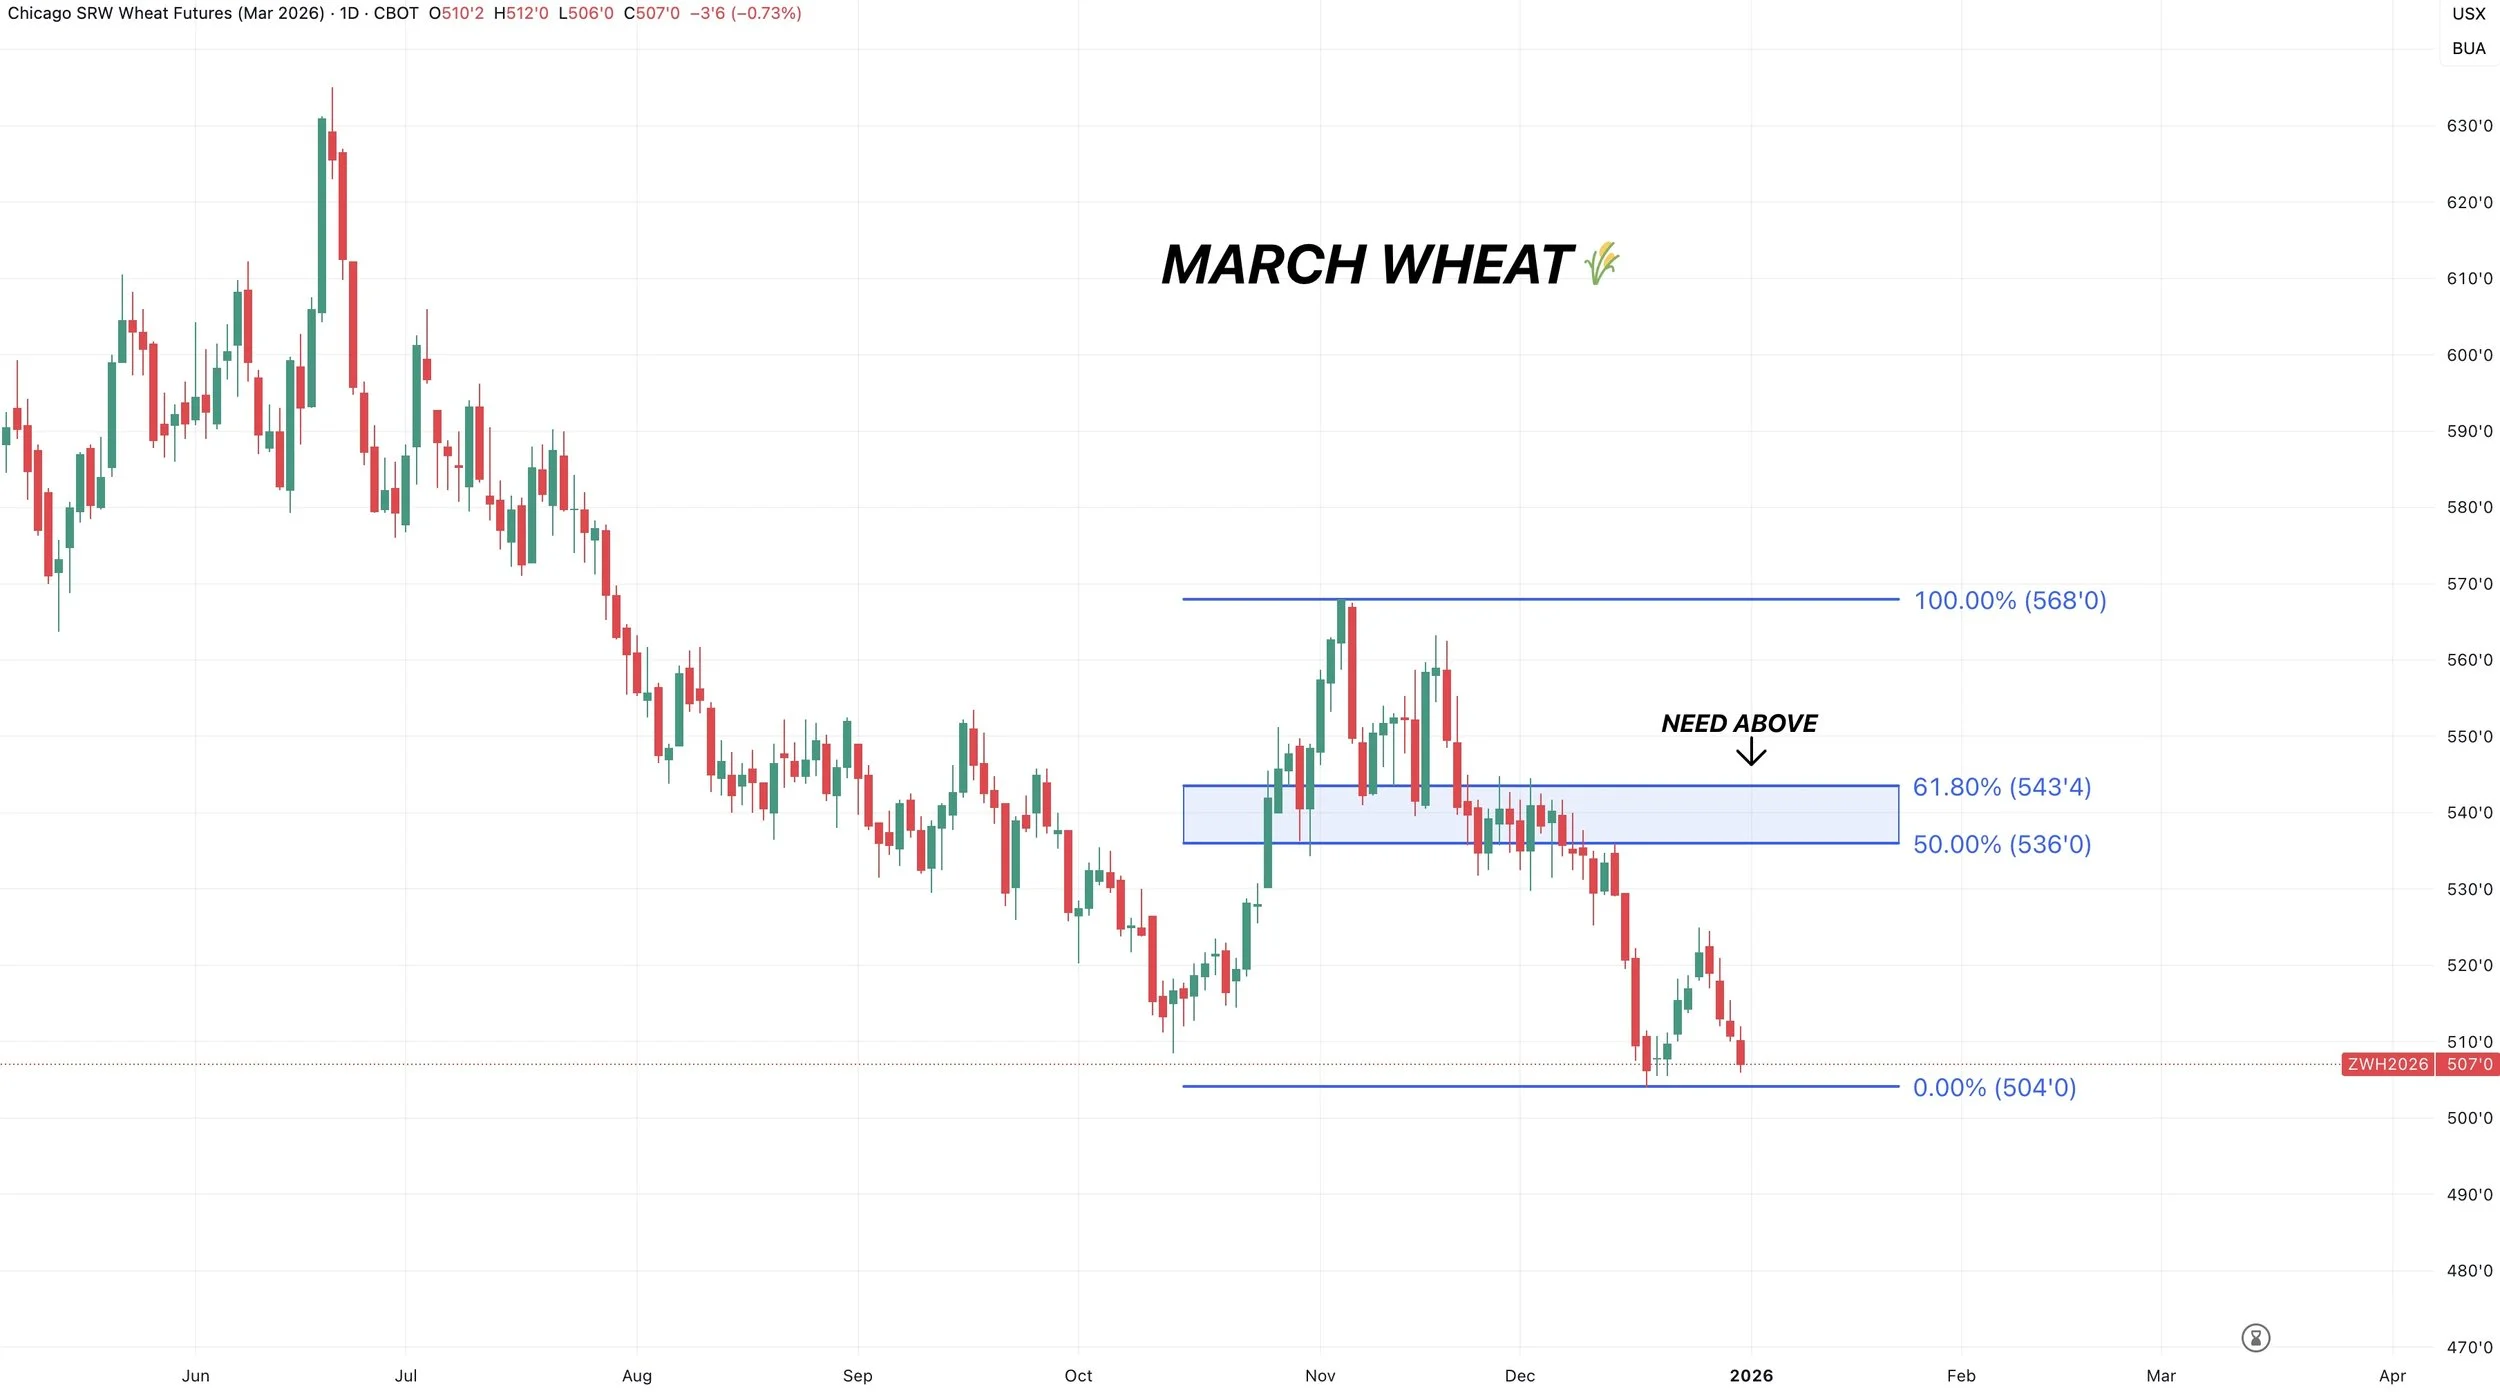
Nothing to update in Chicago.
We'll just have to wait and see if we hold these contract lows or not.
I still haven’t seen anything that would lead me to believe we've posted our lows yet.
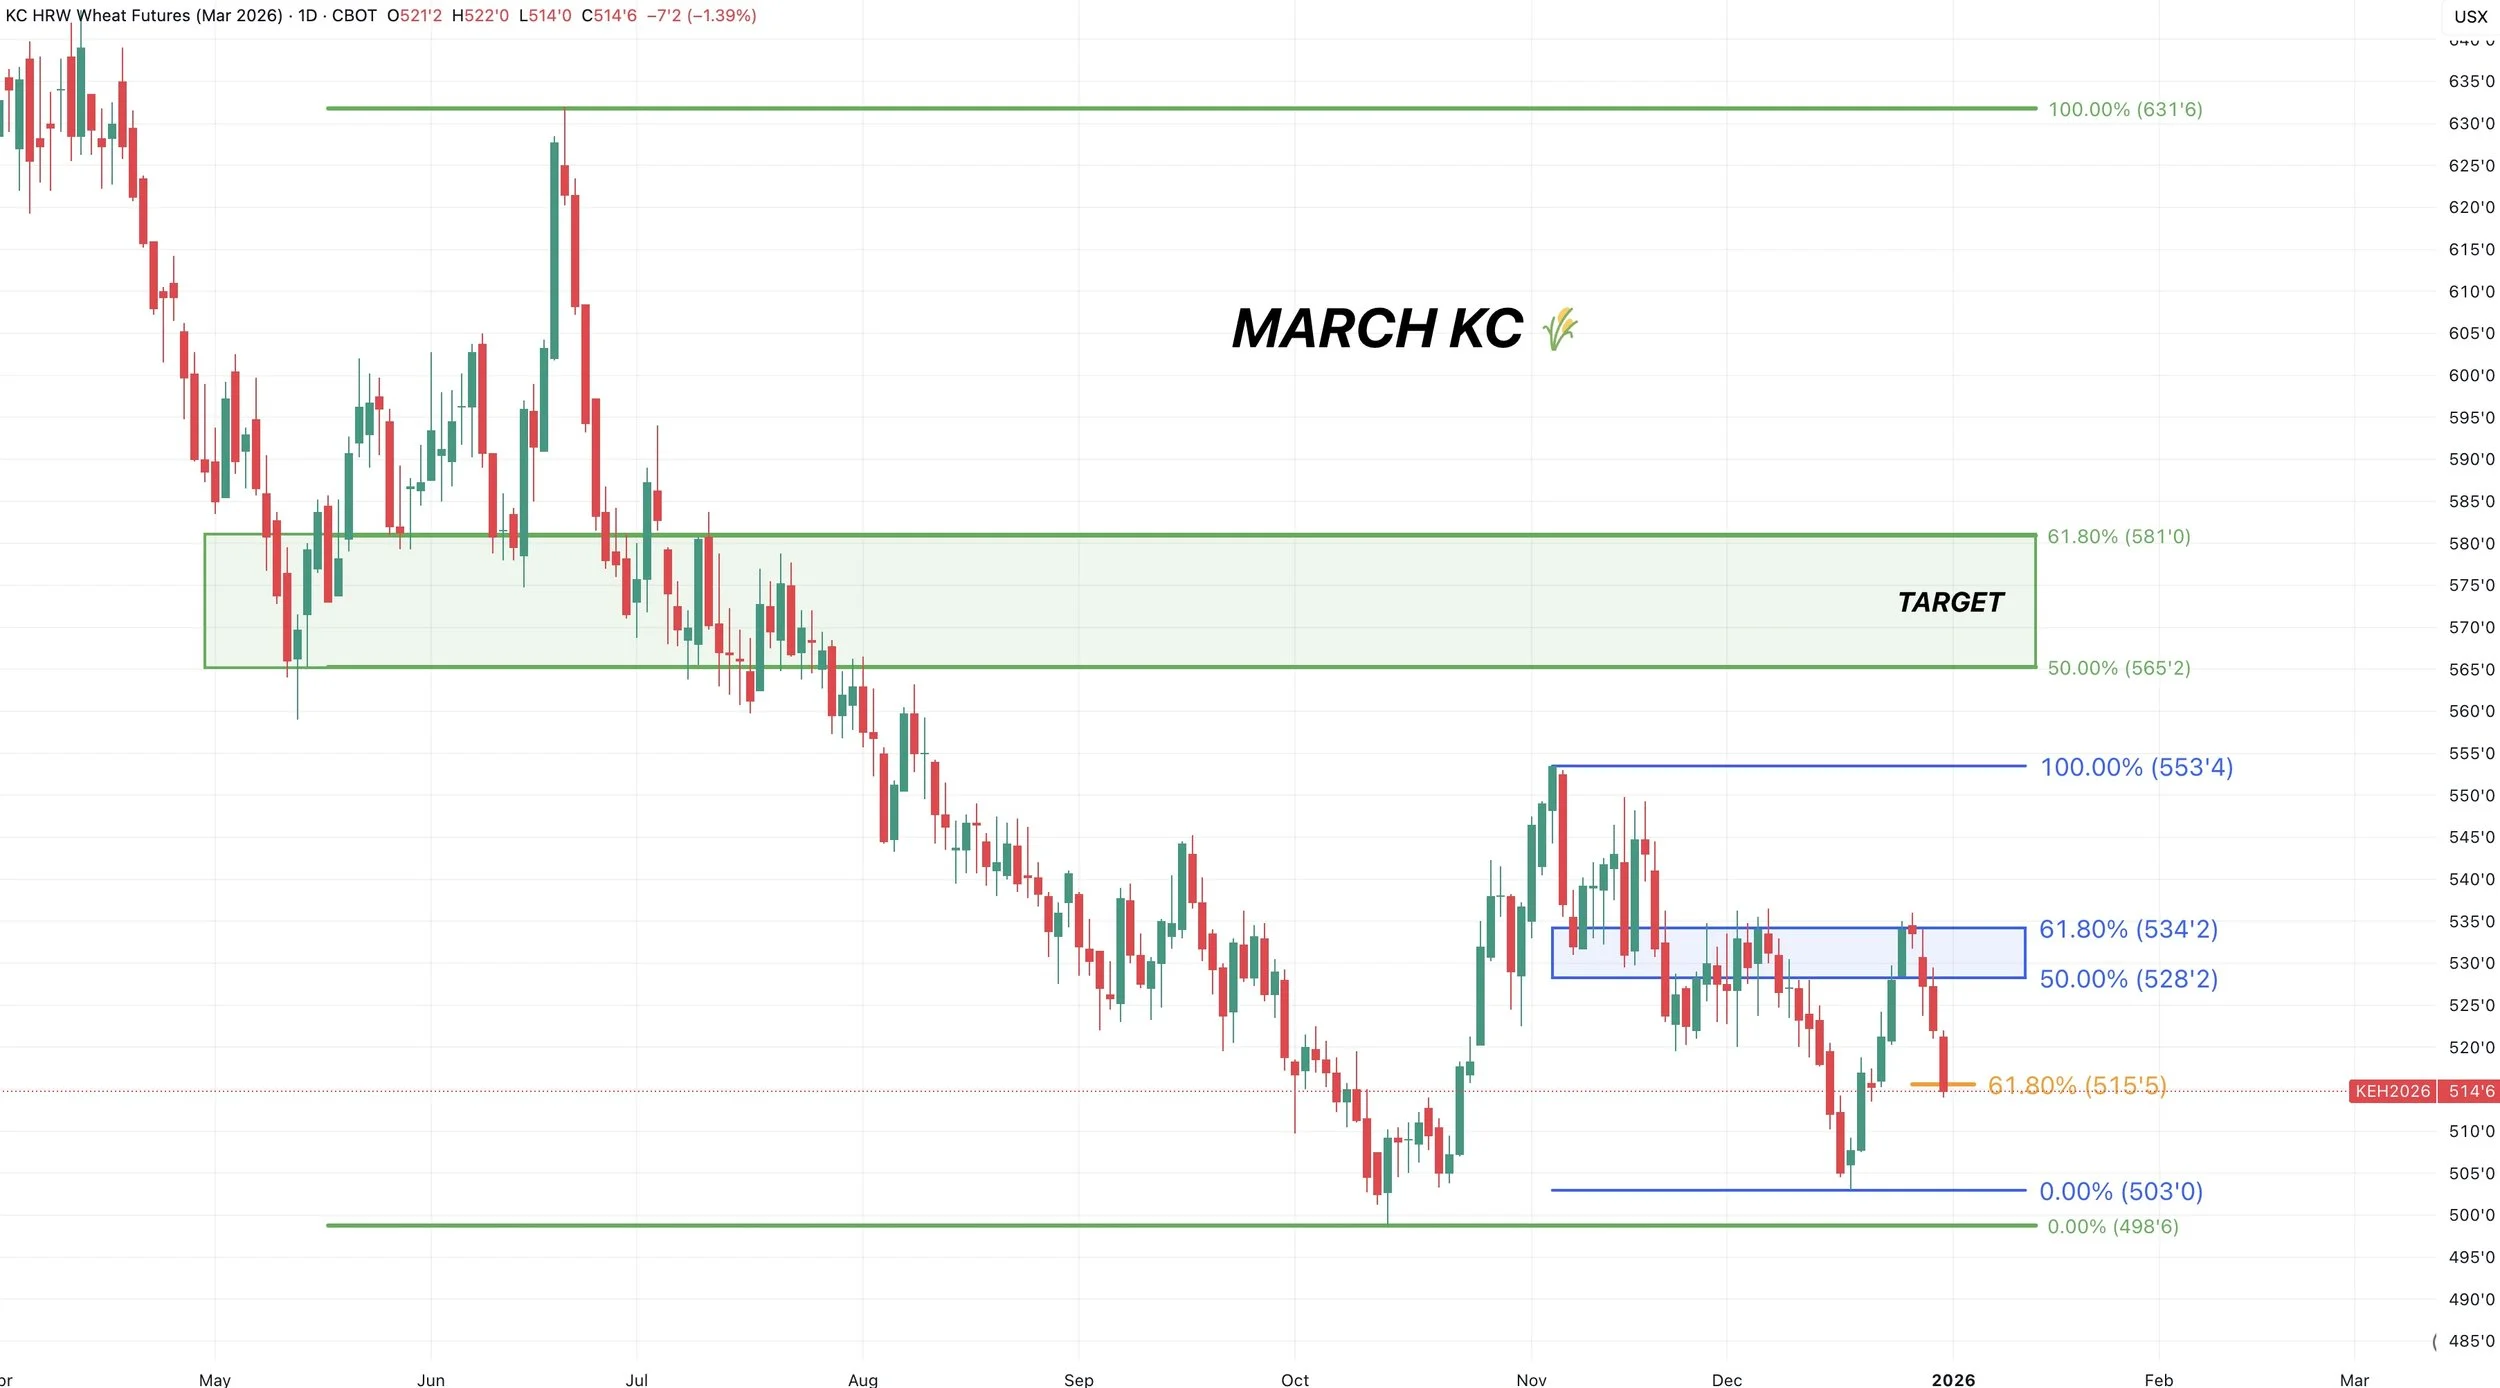
March KC Wheat
The rally in KC failed after clawing back 61.8% of the entire sell off. Which is where most relief bounces fail.
If we break above that level it should bring further upside.
To the downside, we've now given back 61.8% of the entire bounce we just saw. This is where the market decides if this is just a standard sized correction before continuing higher, or this is market is starting to roll over.
So a pretty important spot here for KC to hold or we could revist those lows.
Cattle
Technicals:
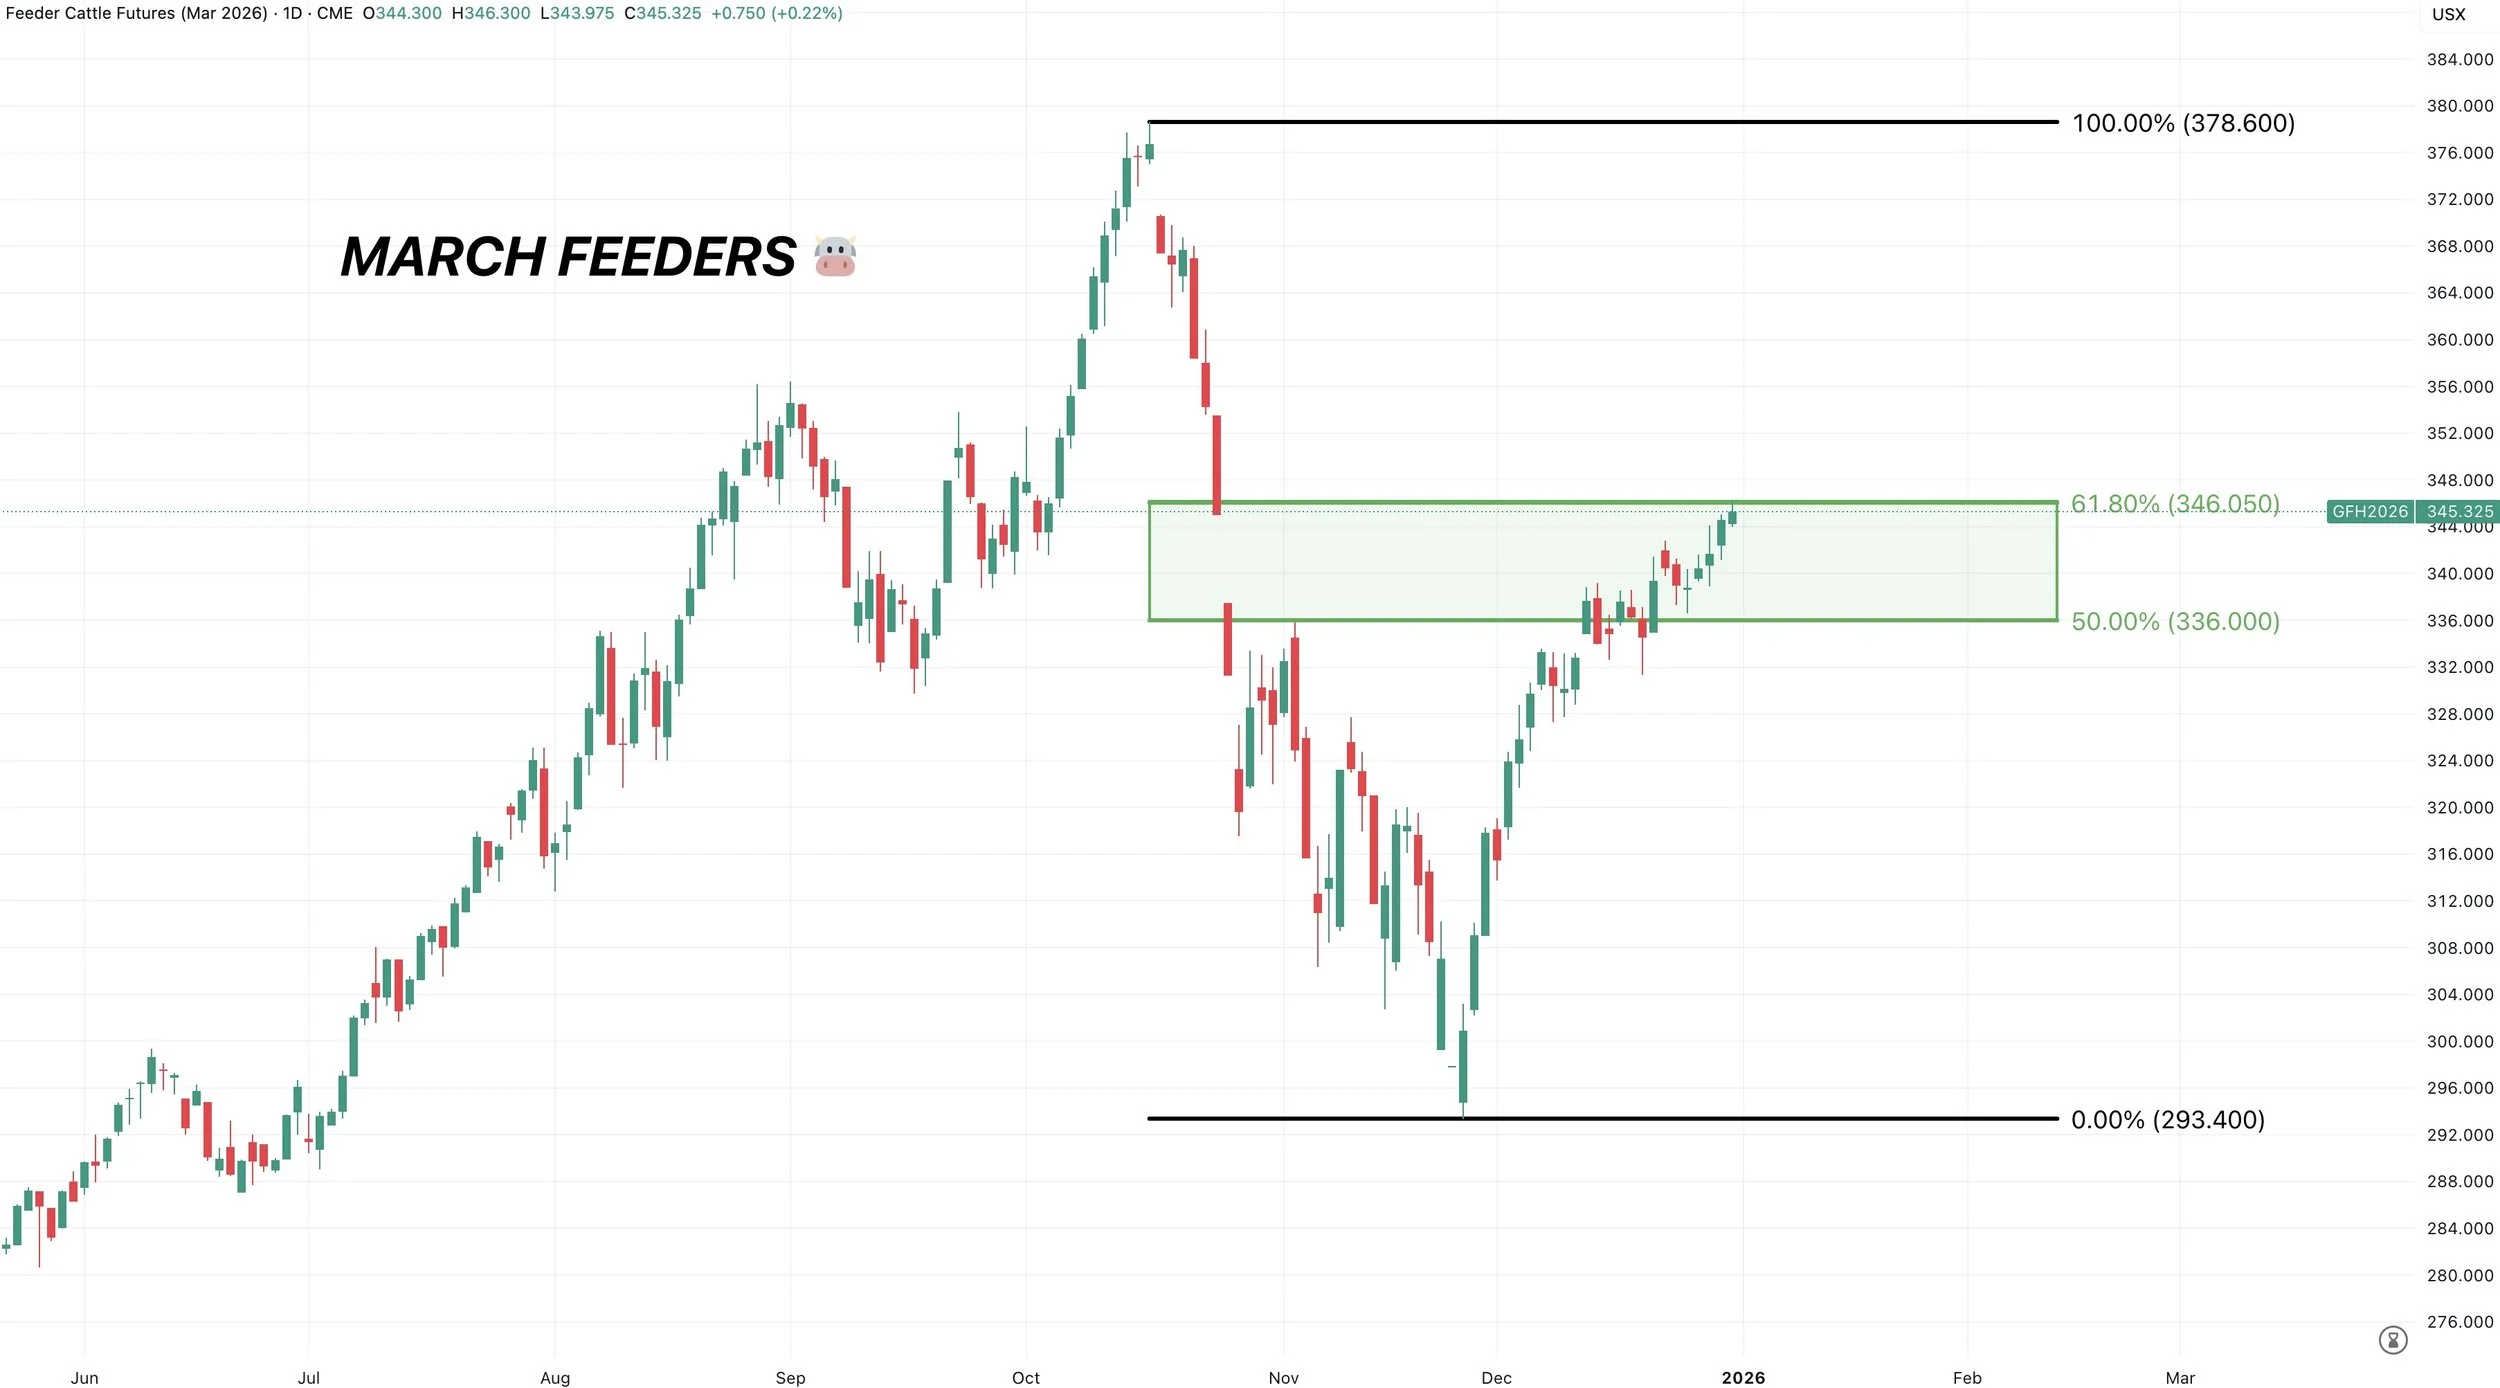
March Feeders
March feeders did fill that gap we left back in October.
We also perfectly clawed back 61.8% of the entire sell off.
That level is where most relief bounces fail.
If we break above that 61.8% level, it could result in further upside.
But I find it hard seeing this market going and posting new highs.
We like being anywhere from 75% to 100% hedged here.
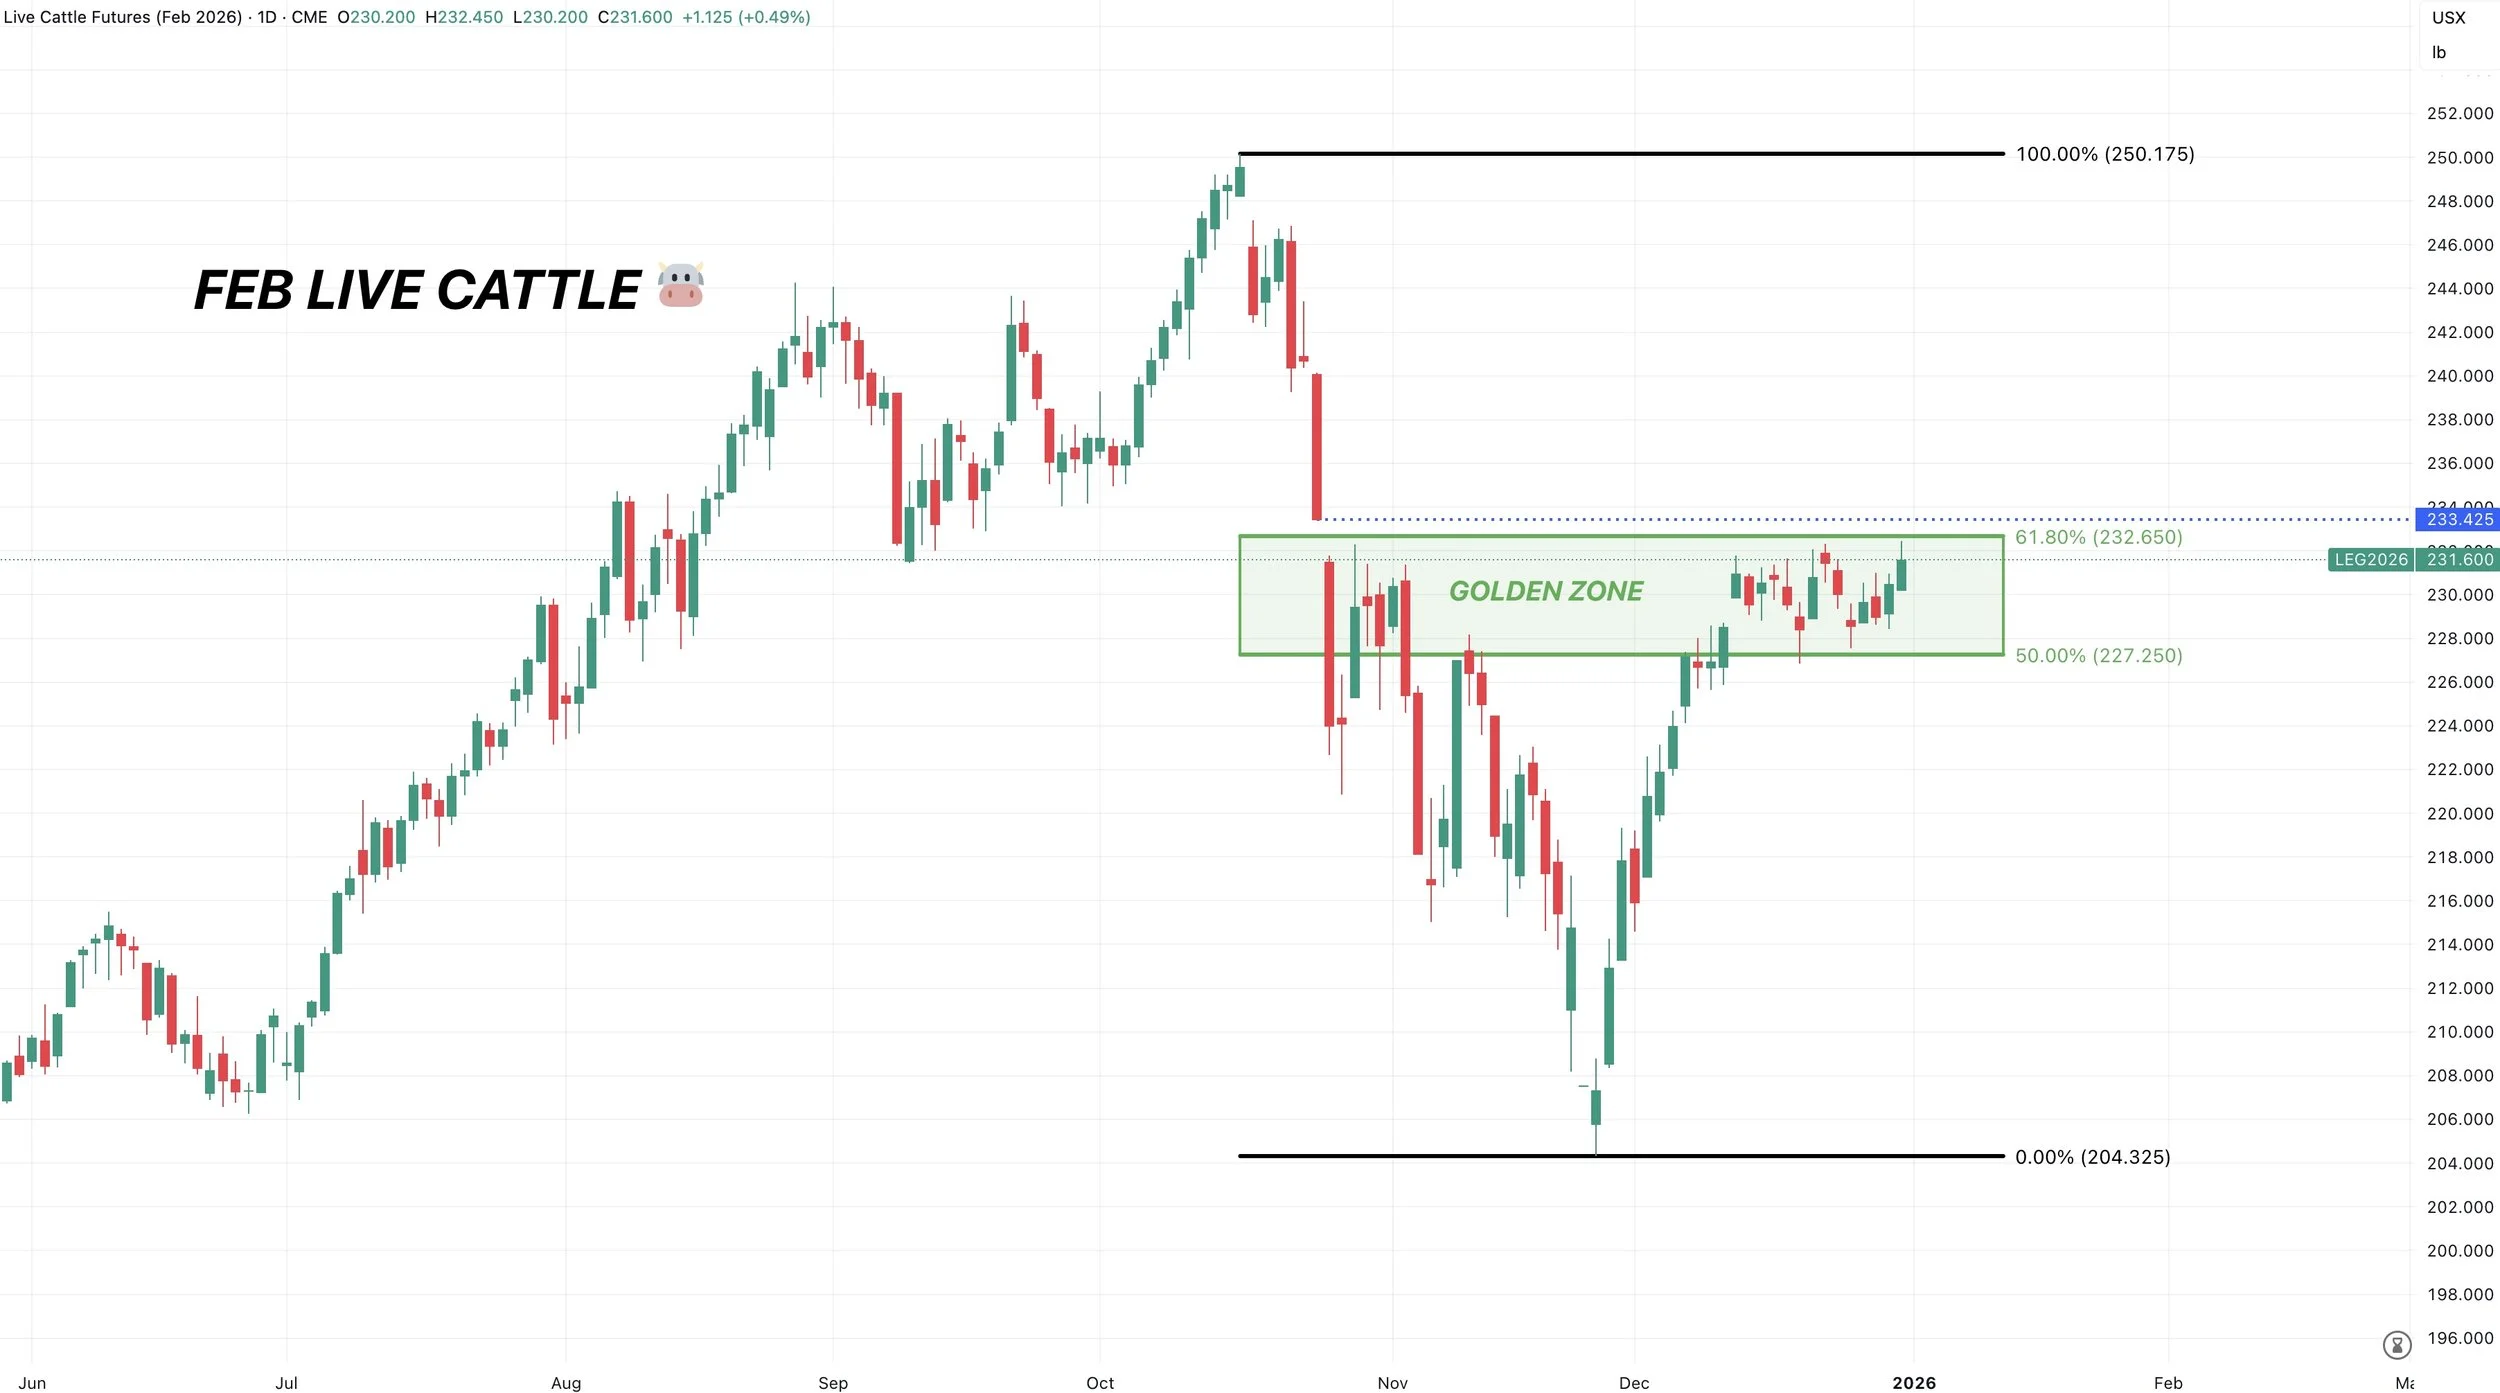
Feb Live
Live cattle is still virtually sideways.
Chopping around in this golden zone.
Just like feeders, this is where bounces tend to struggle and ultimately fail. So we like defending here.
Past Sell or Protection Signals
Dec 11th: 🐮
Cattle sell signal & hedge alert.
Dec 5th: 🐮
Cattle sell signal & hedge alert.
Nov 17th: 🌱
Soybean sell signal & hedge alert.
Nov 13th: 🌽 🌱
Managing risk in corn & beans ahead of USDA report.
Oct 28th: 🌽
Corn sell signal & hedge alert.
Oct 27th: 🌱
Soybean sell signal & hedge alert.
Oct 13th: 🐮
Cattle sell signal & hedge alert.
Aug 22nd: 🌱
Soybean sell signal & hedge alert.
July 31st: 🐮
Cattle sell signal & hedge alert.
July 10th: 🐮
Cattle sell signal & hedge alert.
CLICK HERE TO VIEW
June 5th: 🐮
Cattle sell signal & hedge alert.
June 2nd: 🌾
MPLS wheat sell signal.
April 10th: 🌽
Old crop corn sell signal.
March 19th: 🐮
Cattle hedge & sell signal.
Feb 18th: 🌽 🌾
Old crop KC wheat & old crop corn signal.
Jan 23rd: 🌽 🌱
Corn & beans old crop sell signal.
CLICK HERE TO VIEW
Jan 15th: 🌽 🌱
Corn & beans hedge alert/sell signal.
Jan 2nd: 🐮
Cattle hedge alert at new all-time highs & target.
Dec 11th: 🌽
Corn sell signal at $4.51 200-day MA
CLICK HERE TO VIEW
Oct 2nd: 🌾
Wheat sell signal at $6.12 target
Sep 30th: 🌽
Corn protection signal at $4.23-26
Sep 27th: 🌱
Soybean sell & protection signal at $10.65
Sep 13th: 🌾
Wheat sell signal at $5.98
May 22nd: 🌾
Wheat sell signal when wheat traded +$7.00
Want to Talk?
Our phones are open 24/7 for you guys if you ever need anything or want to discuss your operation.
Hedge Account
Interested in a hedge account? Use the link below to set up an account or shoot Jeremey a call at (605)295-3100.