
WHEN DO PRICES SEASONALLY RALLY & FALL APART?
MARKET UPDATE
You can scroll to read the usual update as well. As the written version is the exact same as the video.
Timestamps for video:
Seasonals: 0:55min
Corn: 5:50min
Beans: 9:30min
Wheat: 13:00min
Cattle: 14:00min
Want to talk about your situation?
(605)250-3863
Futures Prices Close
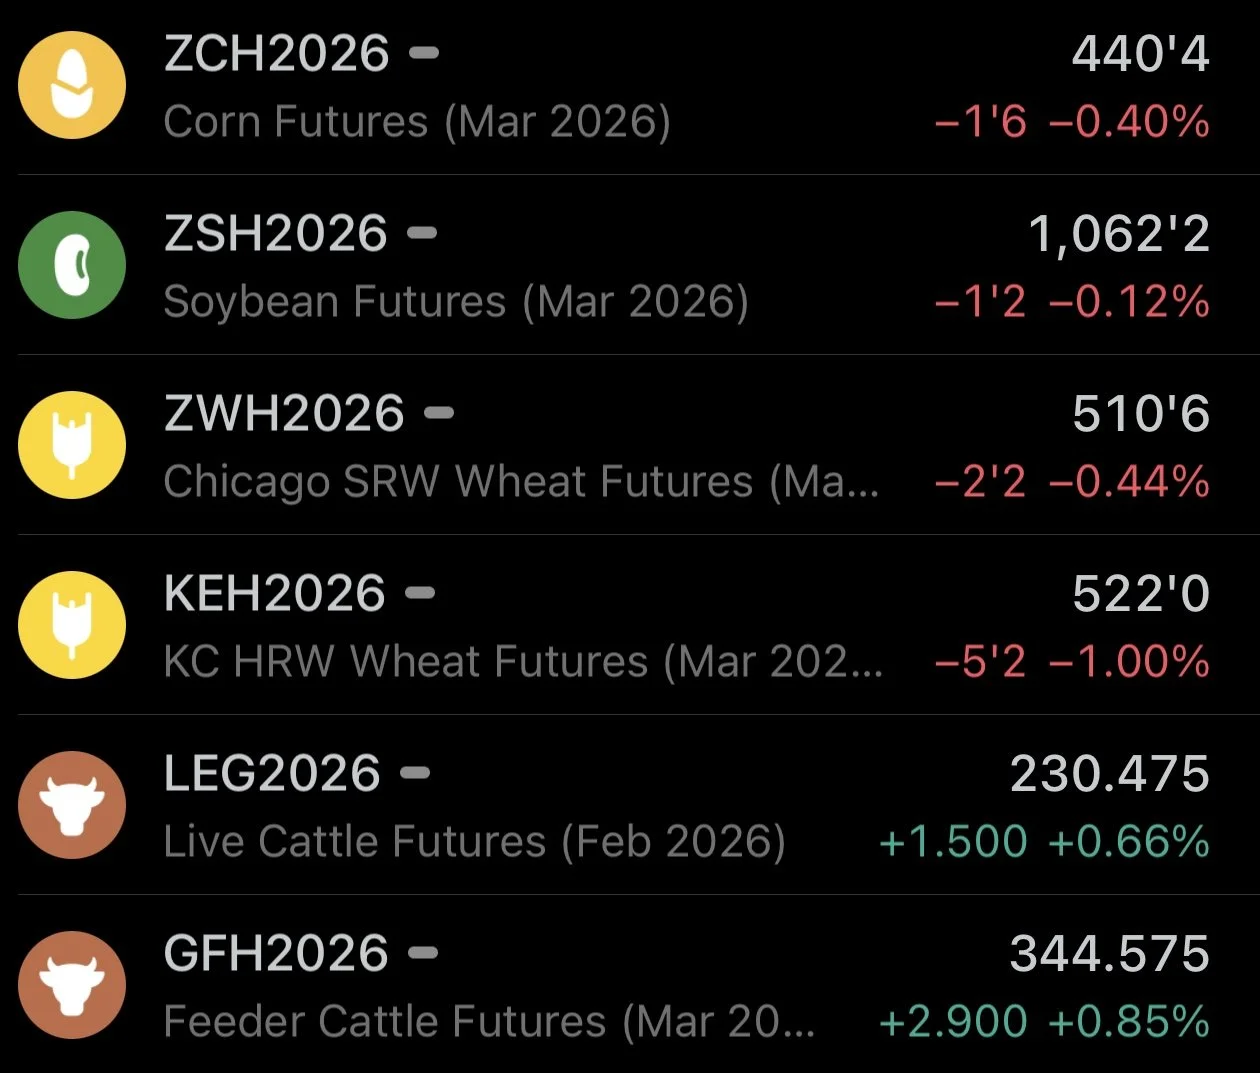
Overview
Grains mostly lower while cattle trades higher today, following yesterday's brutal price action in the grains.
Overall, it's been pretty quiet with the holidays. We haven’t seen much if any major news.
Traders are on holiday mode which means small volume.
Yesterday’s blood bath could’ve easily been a spill-over trade from the weak outside markets, some last minute farmer selling, and or fund re-positioning heading into the new year. When volume is light, it can make moves over exaggerated.
All eyes are set on the USDA report scheduled for January 12th to give us some fresh fundamental news for bulls and bears to chew on.
The markets will be closed on Thursday with the new year. Outside of that, the trading schedule remains completely the same. With normal open and closes tomorrow as well as Friday.
Full Seasonal Pattern Breakdowns
Since there isn’t much news to digest we are going to go over the seasonal patterns for corn, soybeans, wheat, as well as cattle.
When do each of these markets typically catch a bid or sell off based on prior years?
Corn
First for corn.
We are going to go into the most detail for corn, as corn tends to follow seasonal patterns more closely than the rest of the grains.
As it largely follows the US growing season. Whereas soybeans and wheat rely more heavily on growing seasons from other large players, such as Brazil for soybeans.
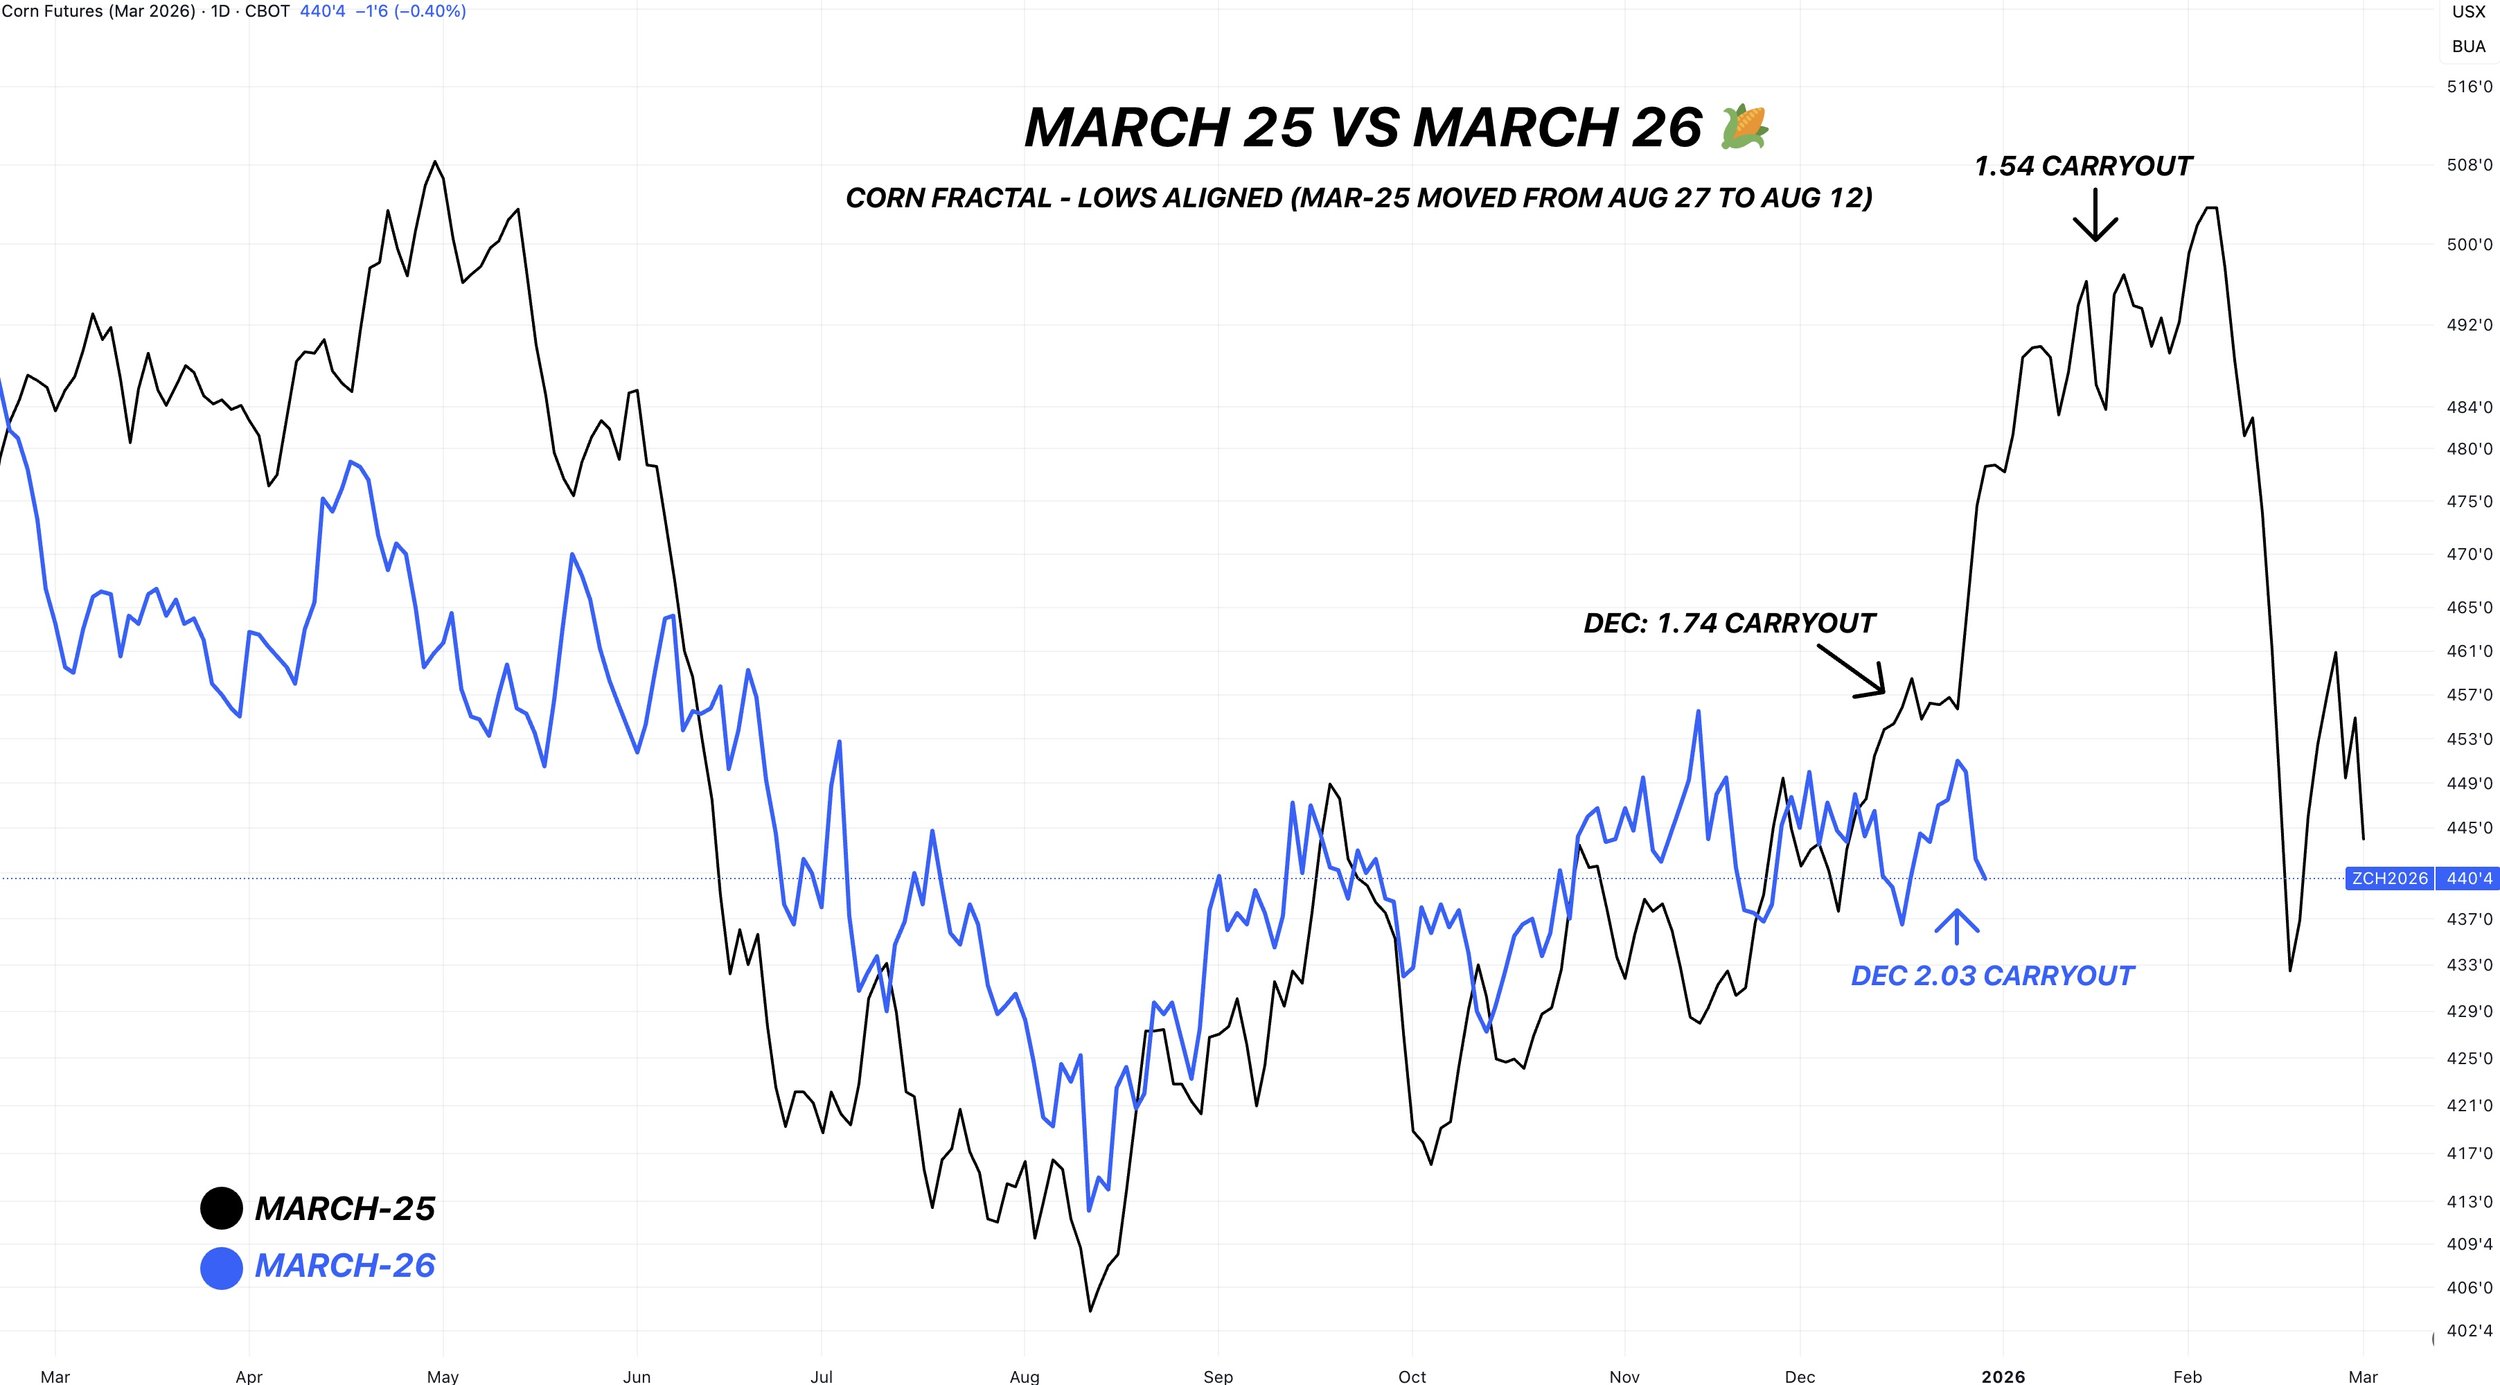
Let's look at March corn.
This first pattern is 2025 (last year) vs 2026 (this year).
We've been tracking very, very close to last year's price action.
Last year we continued higher before topping in February.
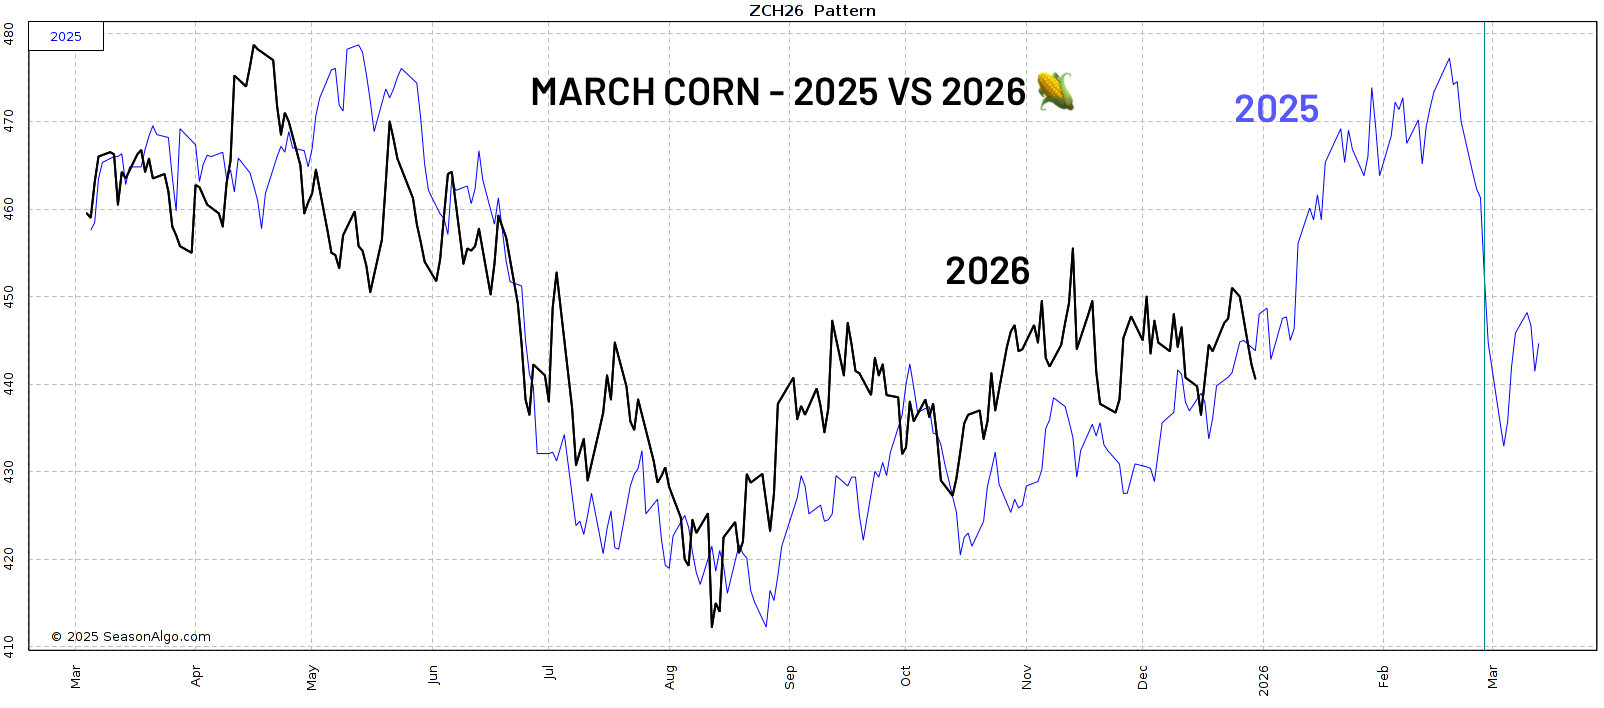
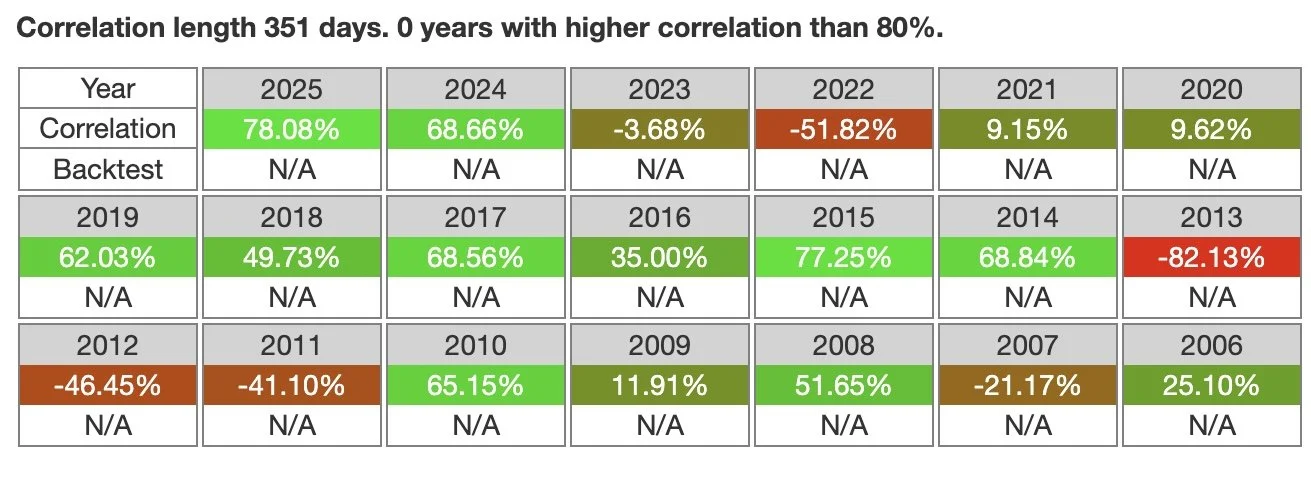
If we dive into the analytics, last year actually does have the highest pattern correlation to this year.
It sits at a near 80% correlation to one another.
These are all the correlations to this year.
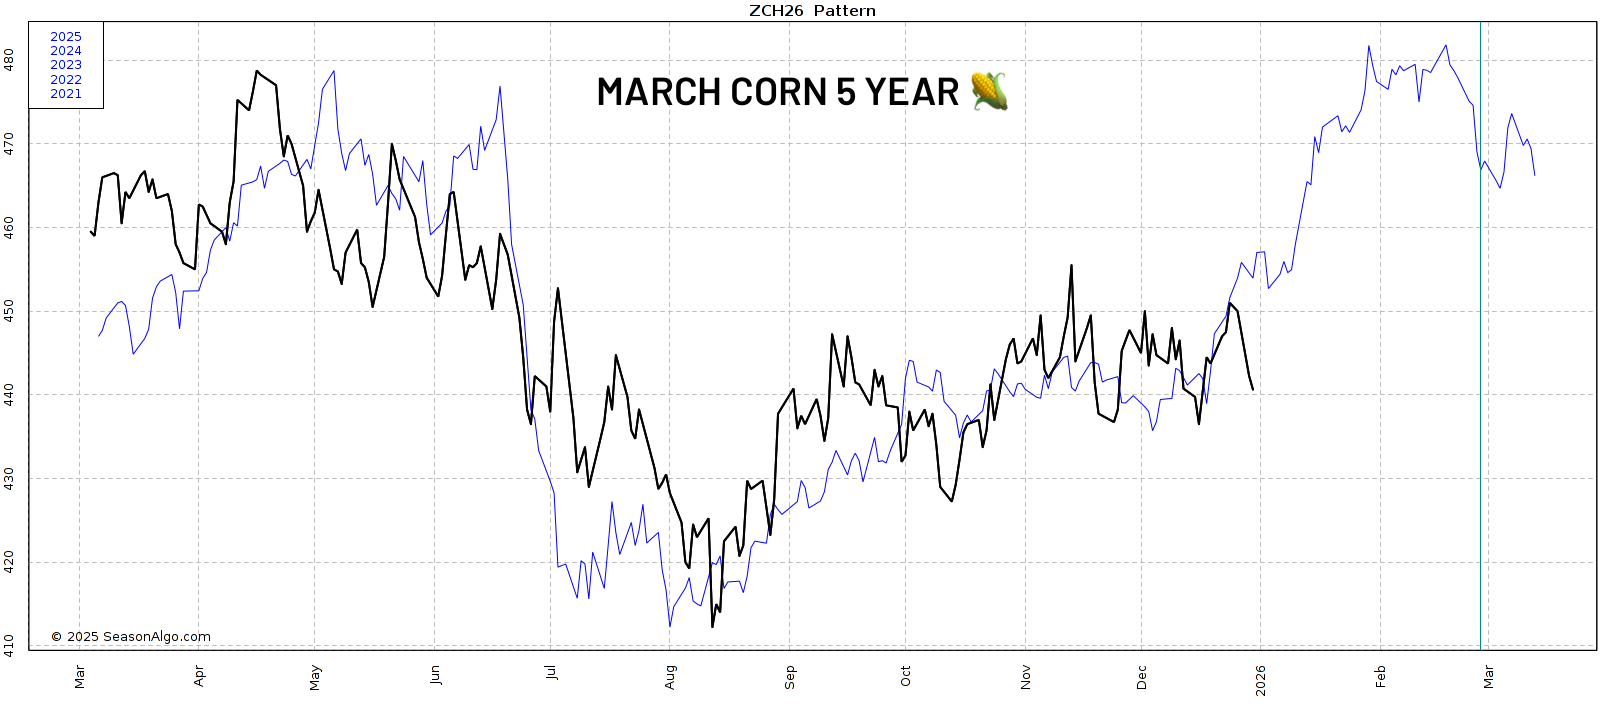
Now here is the March corn 5-year pattern.
This one has tracked very closely as well.
The summer sell off, the August bottom, the rally going into October before trending sideways. All similar.
It too has us climbing higher into February.
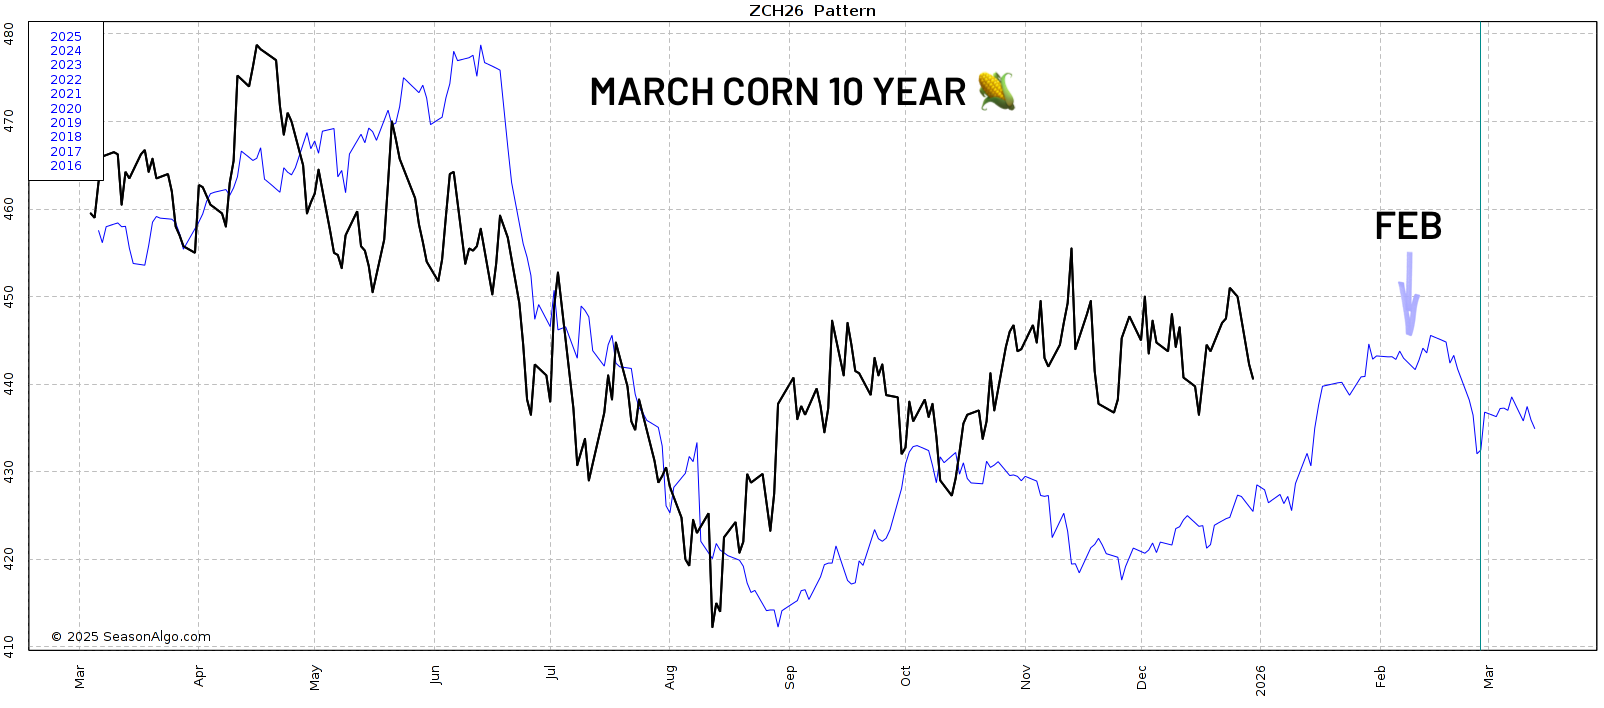
Here is the 10-year seasonal.
We clearly haven’t followed this pattern at all.
But it also has us continuing higher into February.
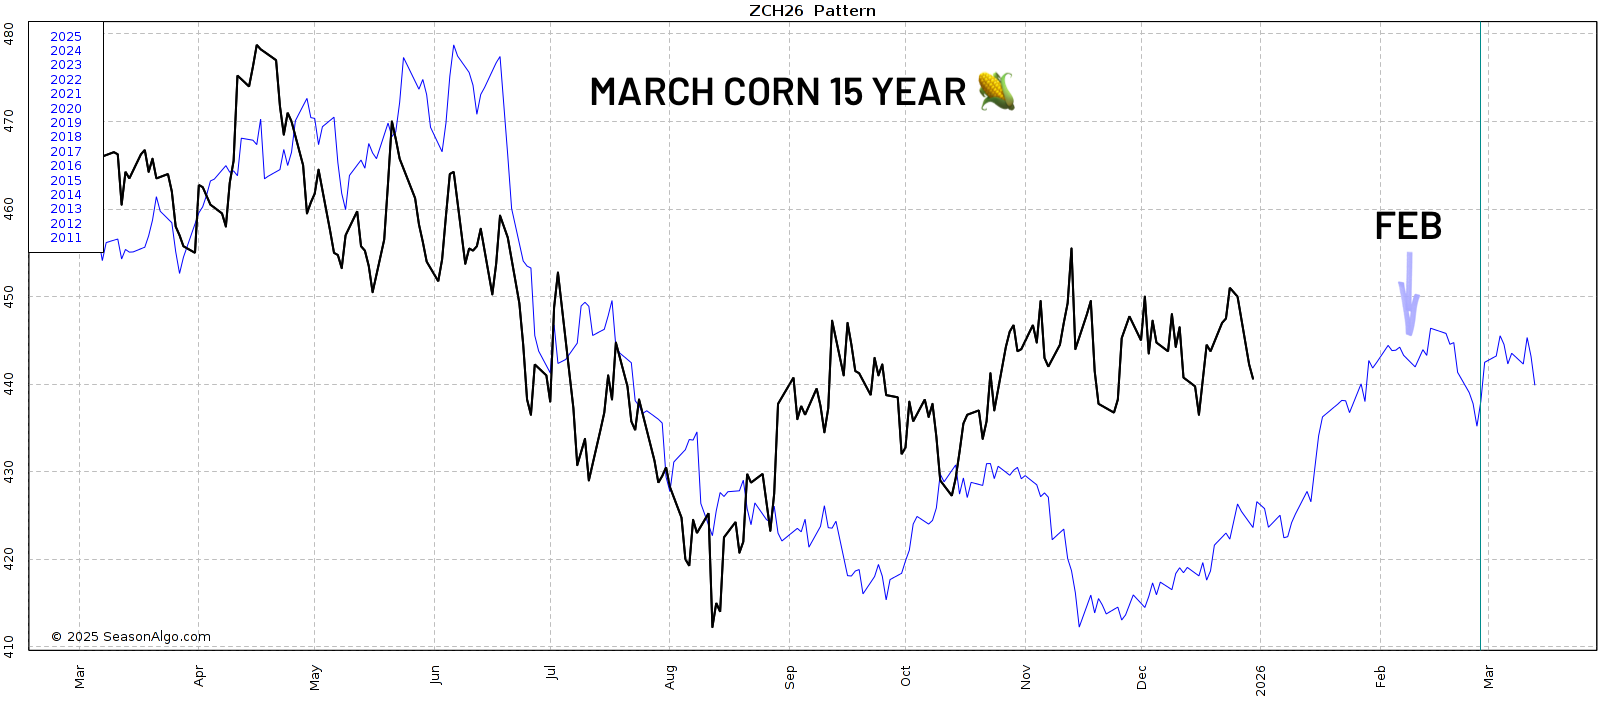
Same story with the 15-year.
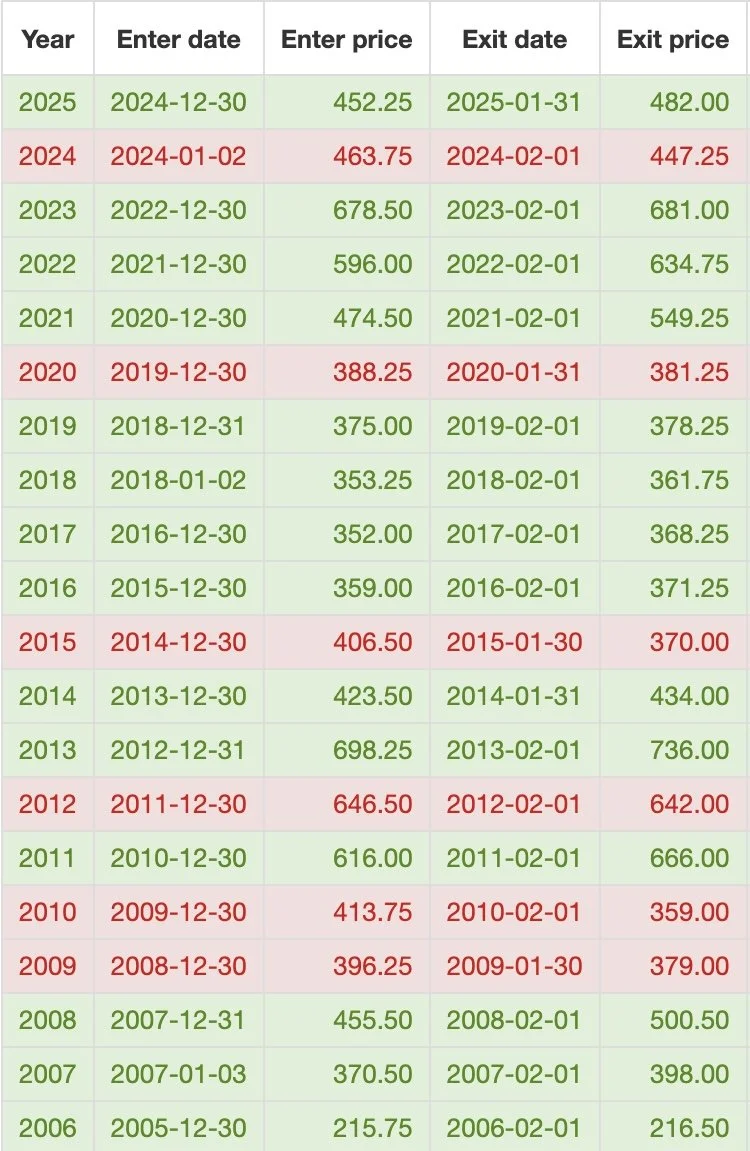
Here is the actual data for March corn's price action from today until February 1st.
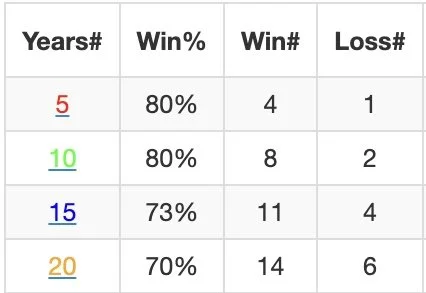
We've traded higher the last:
4 of 5 years (80%)
8 of 10 years (80%)
11 of 15 years (73%)
So January is often a friendly month for the corn market.
We don’t "have" to go higher. But history favors us doing so.
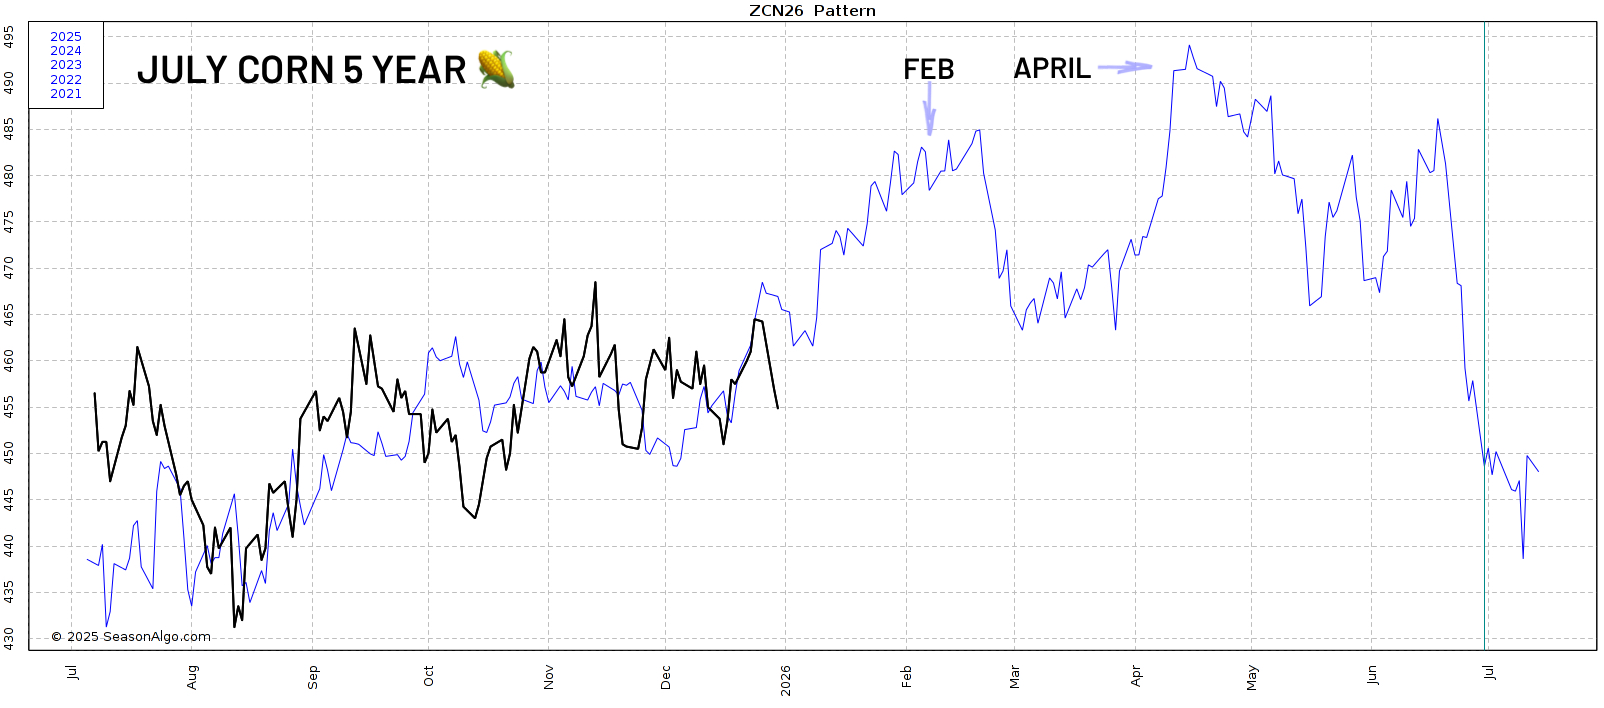
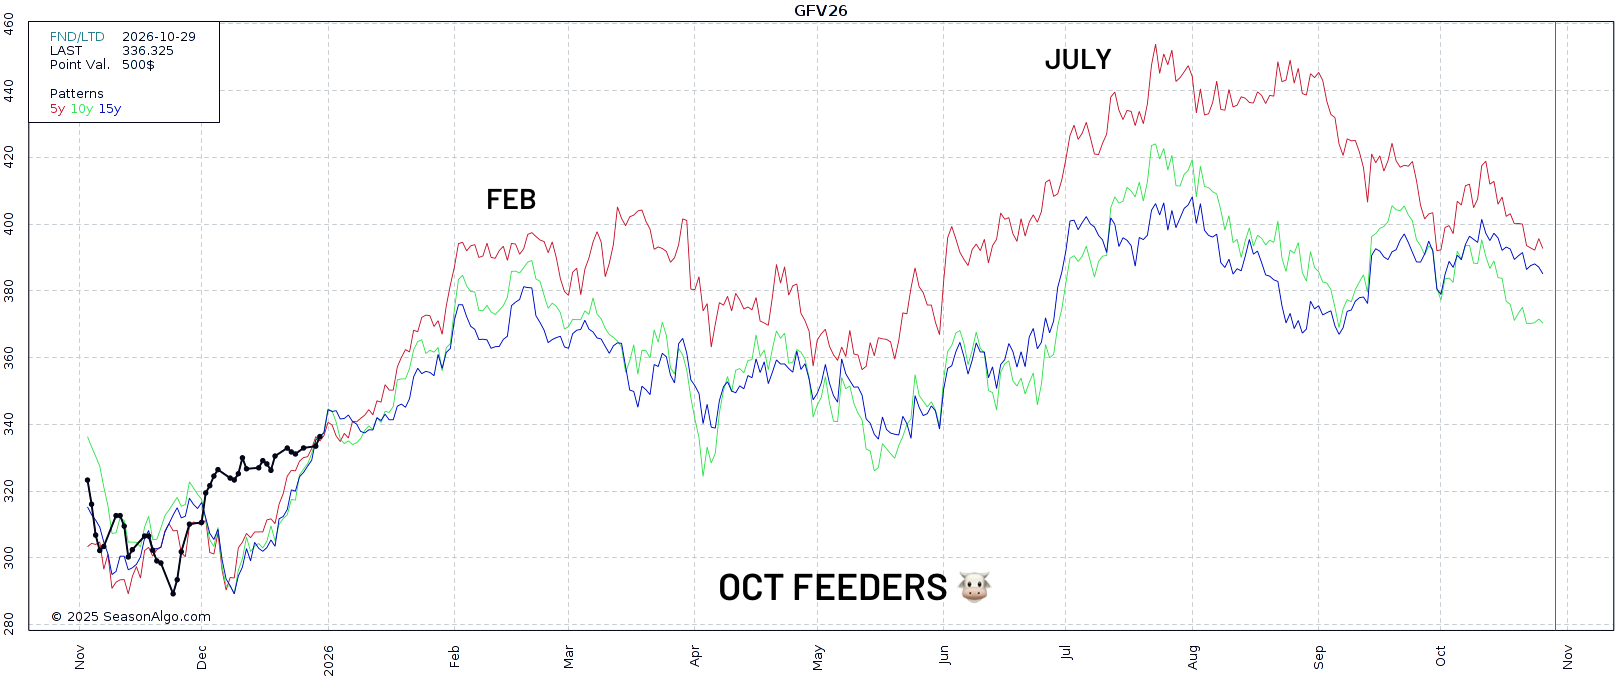
Next let's look at July corn.
First the 5-year pattern.
We typically post two major tops in this market.
Ths 1st is in February.
The 2nd is in April.
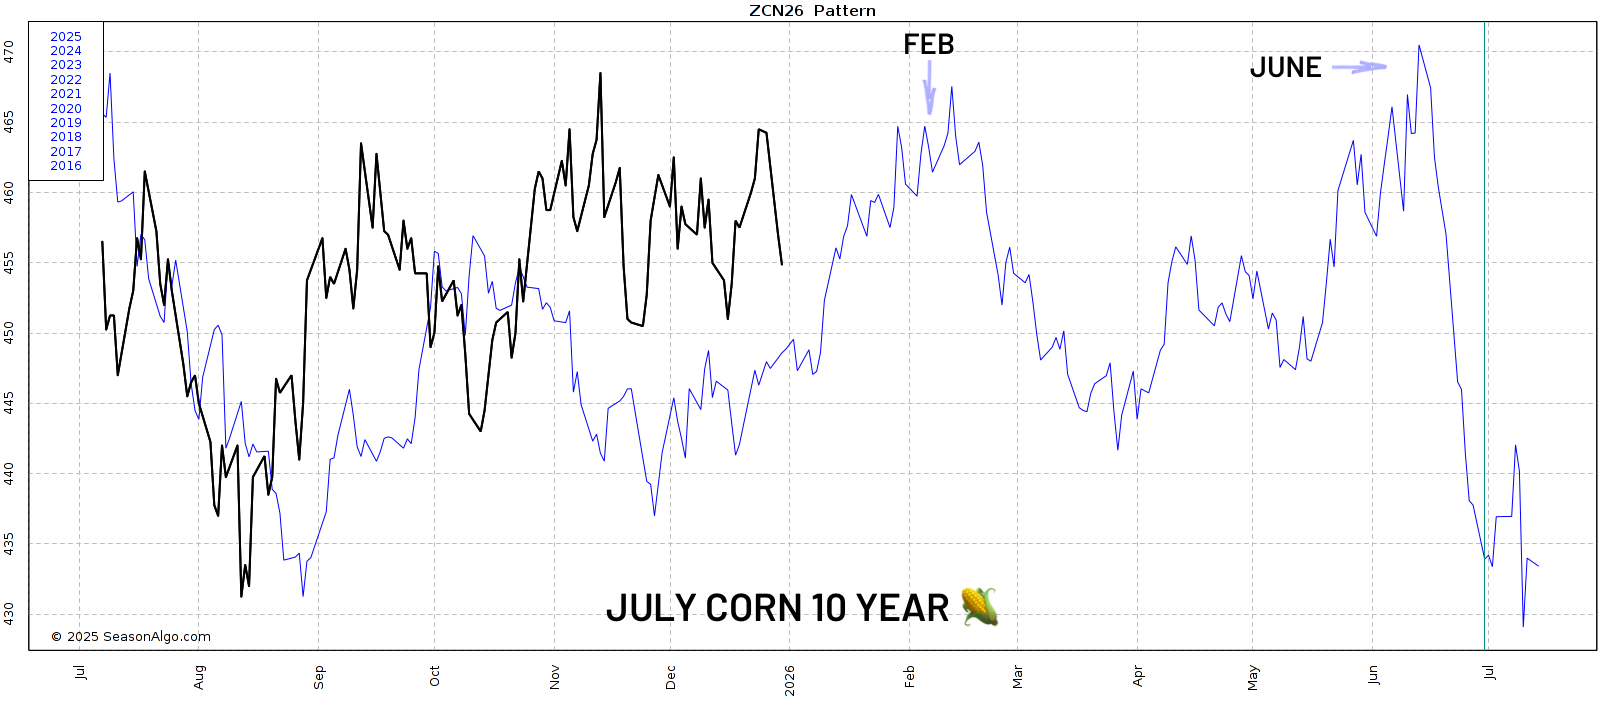
Here is the 10-year.
Again we have two tops that typically form.
February and June.
Seasonal patterns are far from perfect.
But it would be reasonable to think we get that opportunity around February followed by a second opportunity in spring or early summer.
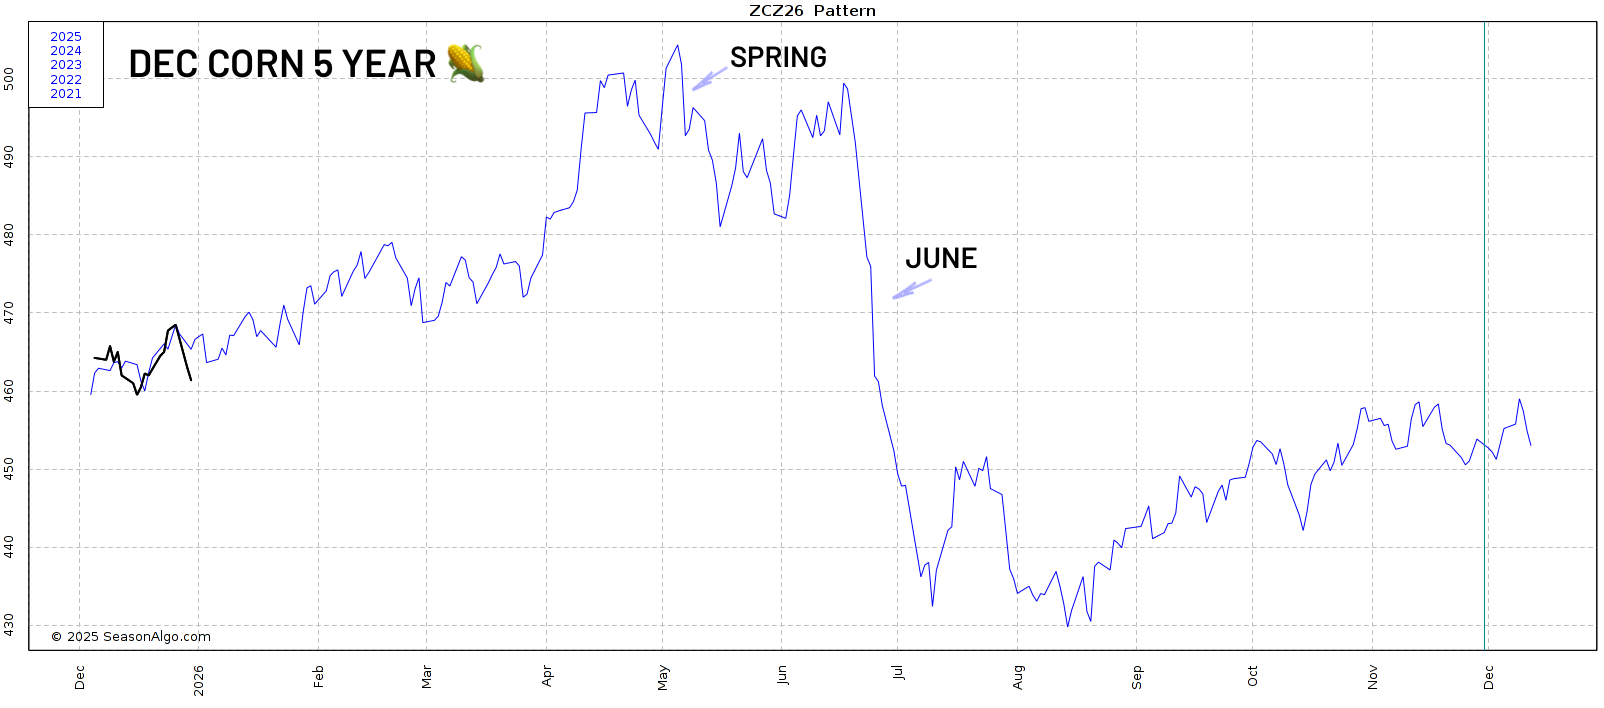
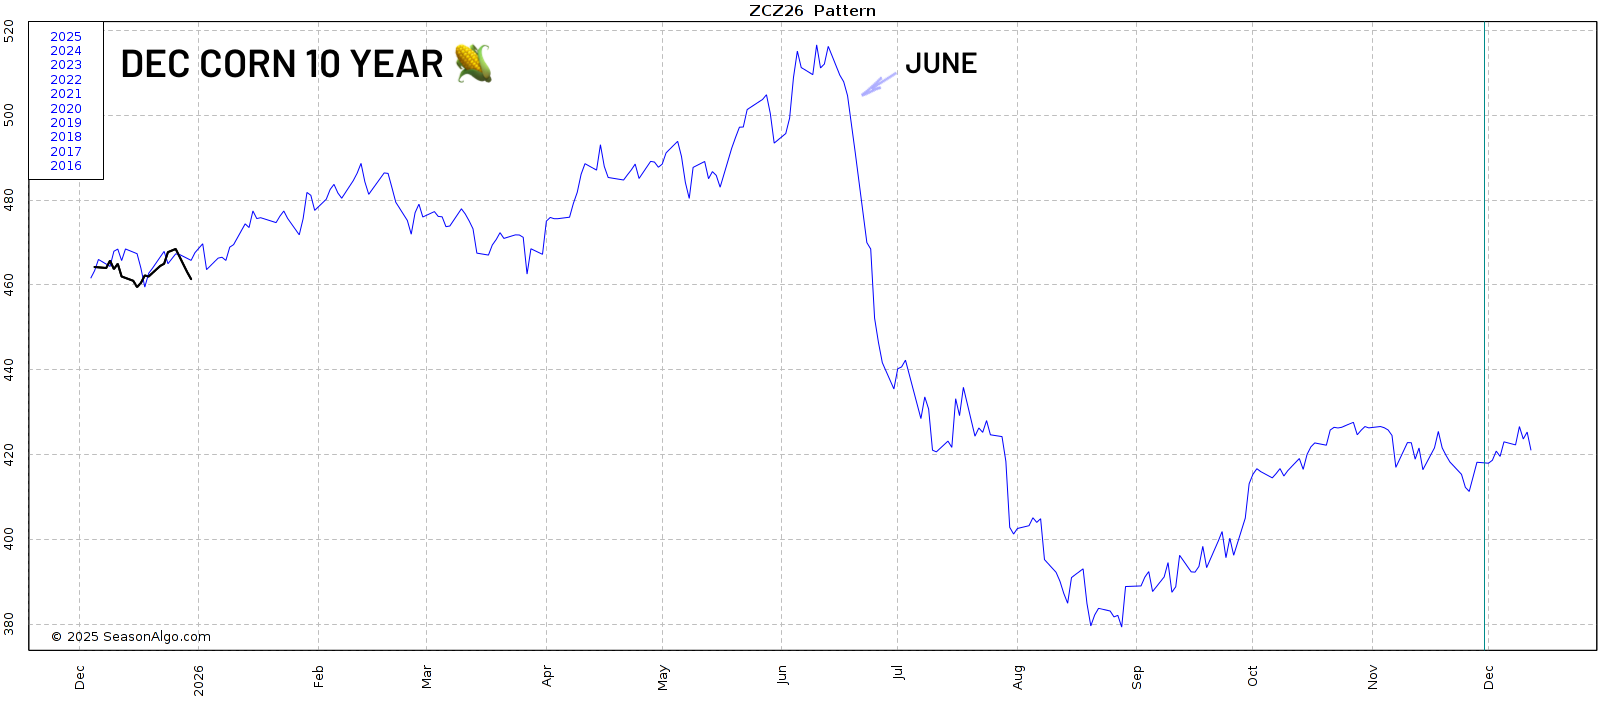
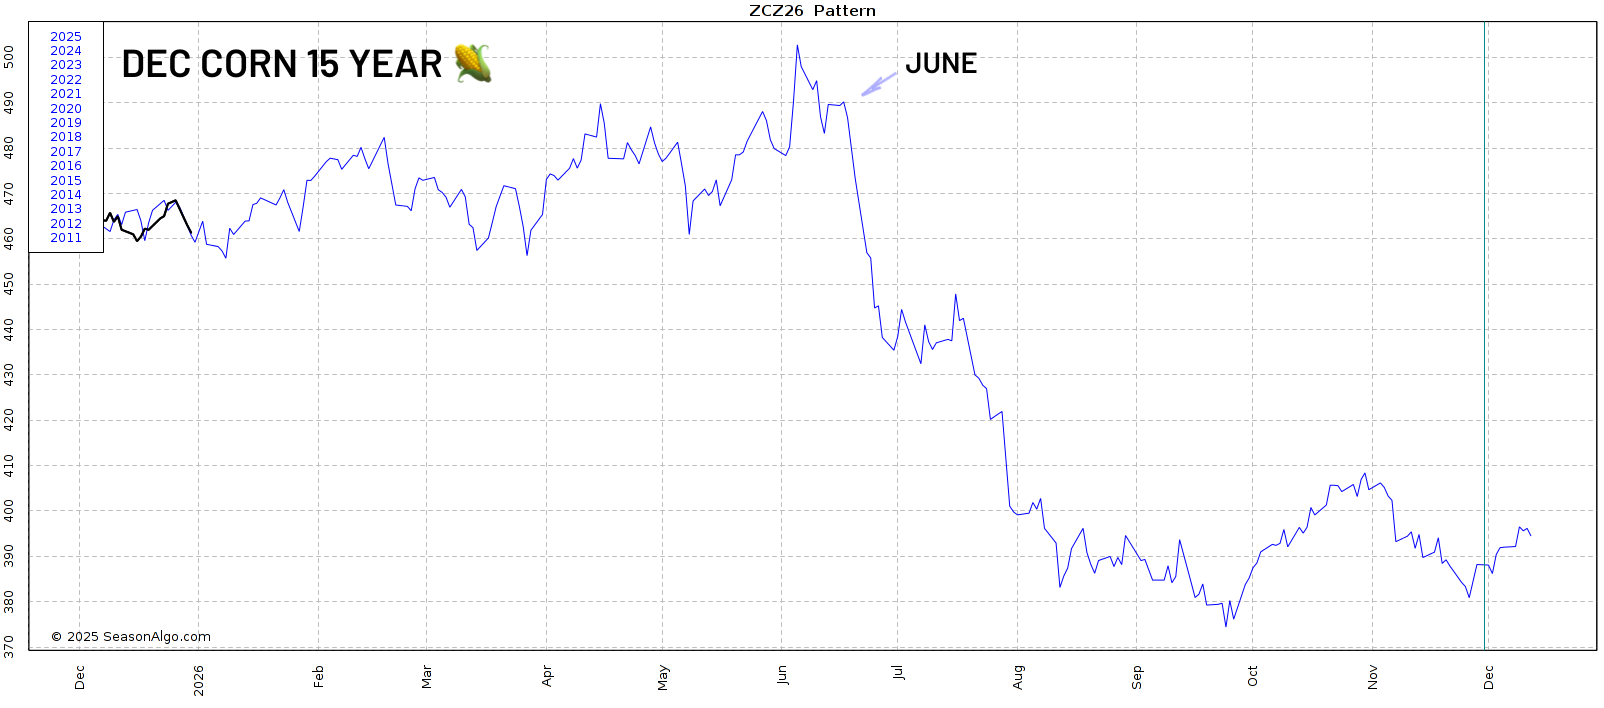
Lastly here is Dec corn.
This is the 5, 10, and 15-year patterns.
Regardless of where the high is.
Every single one of them has us collapsing in June and July.
It happens almost every year without fail. Something to keep in mind for later.
Soybeans
I am not a huge fan of seasonal tendencies in soybeans. As I mentioned, they revolve around more than one growing season so they can be skewed and differ.
However, seasonally soybeans do push higher into February in the 5 (red), 10 (green), and 15 (blue) patterns. Followed by a sell off going into April.
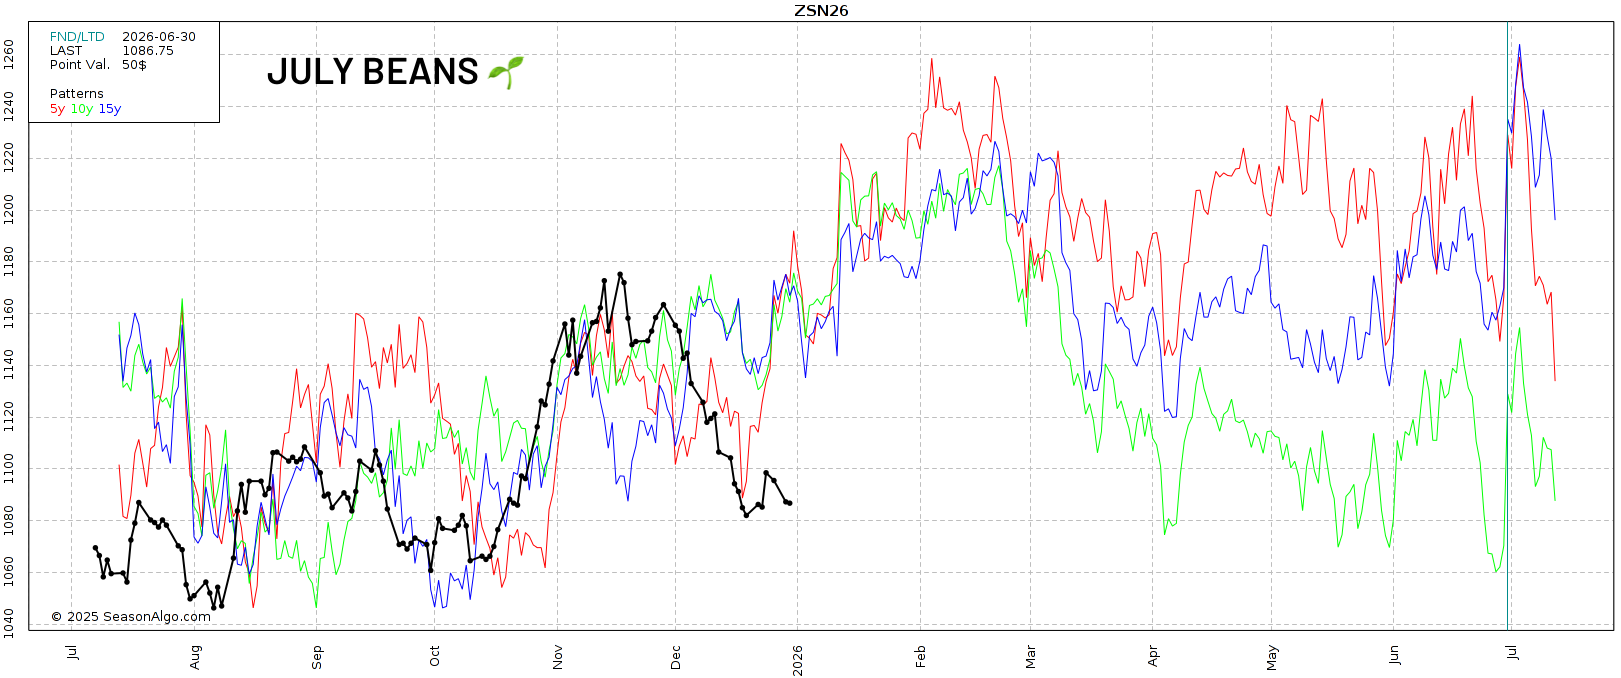
This is July soybeans.
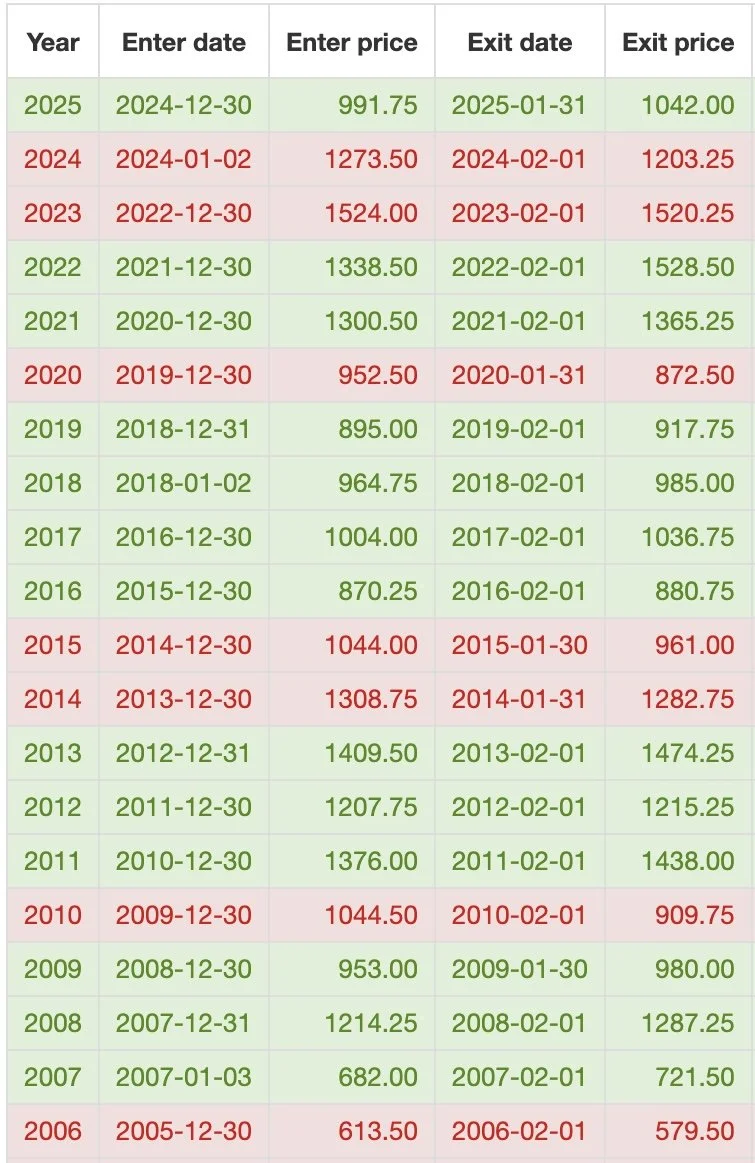
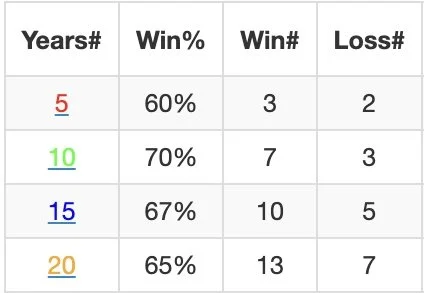
Here is the data for March soybeans from today until February 1st.
The data leans friendly, but not as overly convincing like the corn data.
We've traded higher the last:
3 of 5 years (60%)
7 of 10 years (70%)
10 of 15 years (67%)
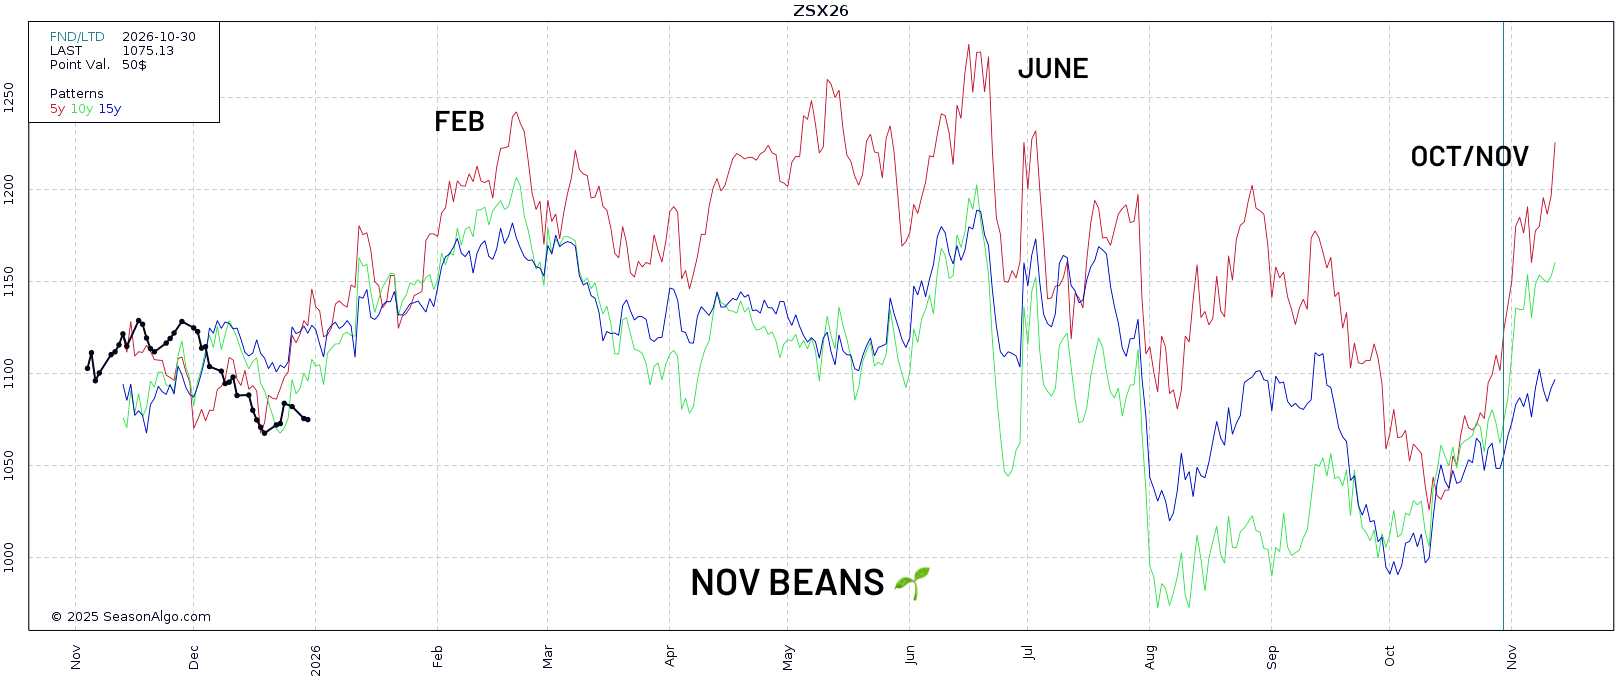
Here is Nov soybeans to give you a bigger picture.
We typically get 3 different rallies.
One going into February, June, and November.
Wheat
July wheat usually sees two opportunities.
We typically head higher in February, get a pullback, then get the final opportunity around May.
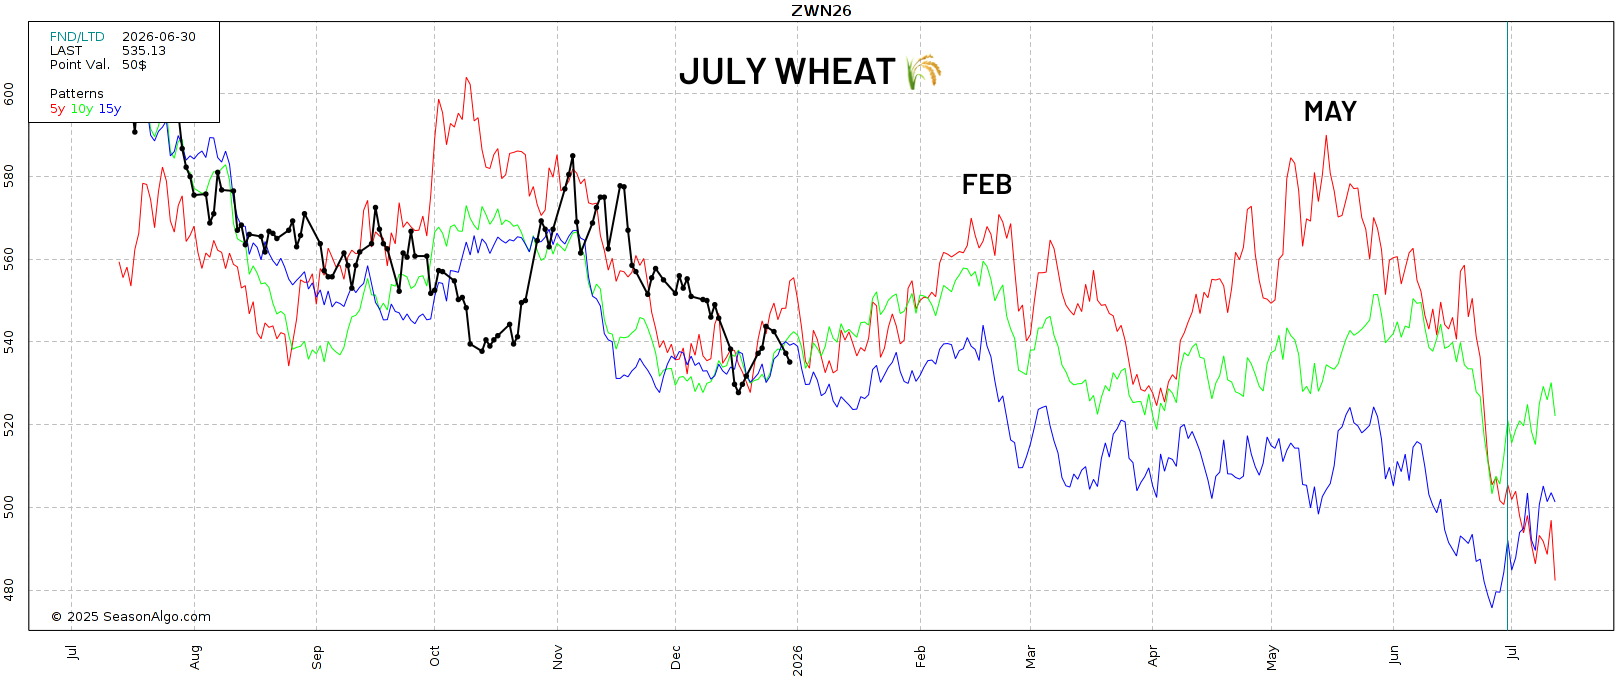
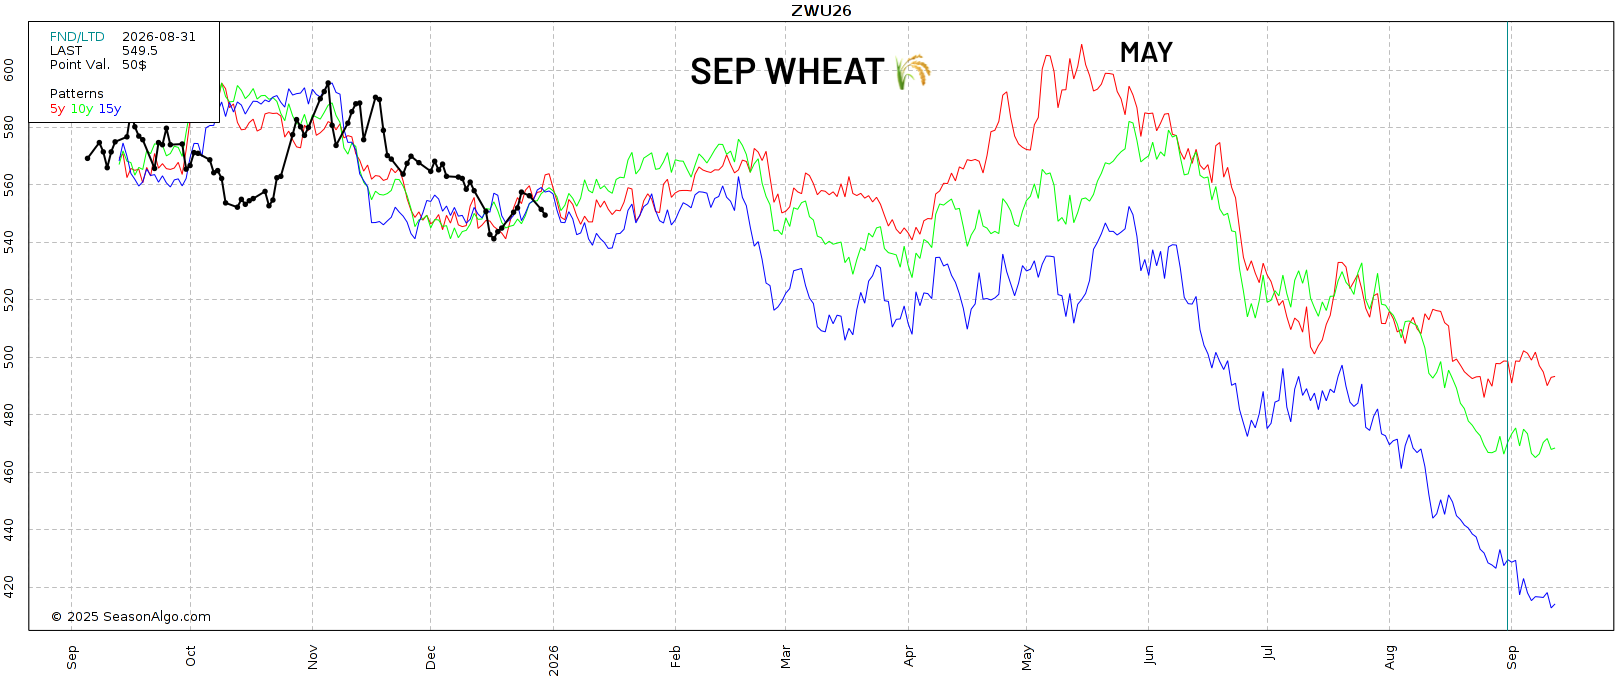
After that May opportunity, the market usually completely falls apart.
Here is Sep wheat to give you a good visual of that collapse we seasonally get.
Feeder Cattle
Here is March feeders.
We got that seasonal low about a month later than usual.
We now do tend to trend higher into February as well like the rest of the grains.
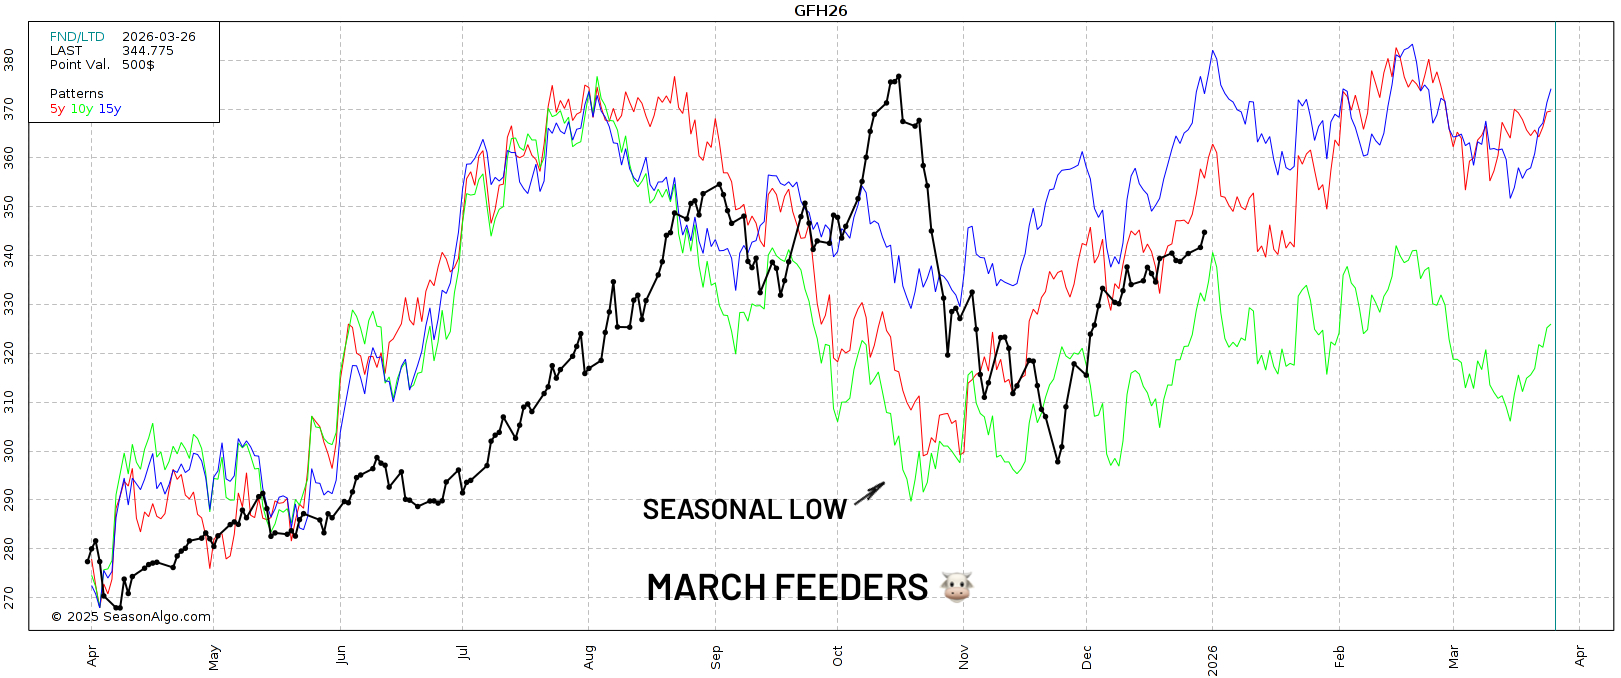
Feeders typically see two tops.
One around February to March. Then a pullback into spring.
Followed by the real top that usually comes in July and August.
Today's Main Takeaways
Corn
Fundamentals:
Yesterday corn posted it's largest daily loss in over a month.
Fundamentally, nothing has changed.
Demand is great. So every break ends up being bought.
We have a ton of supply. So every rally runs out of steam.
Export inspections are up over +65% vs last year.
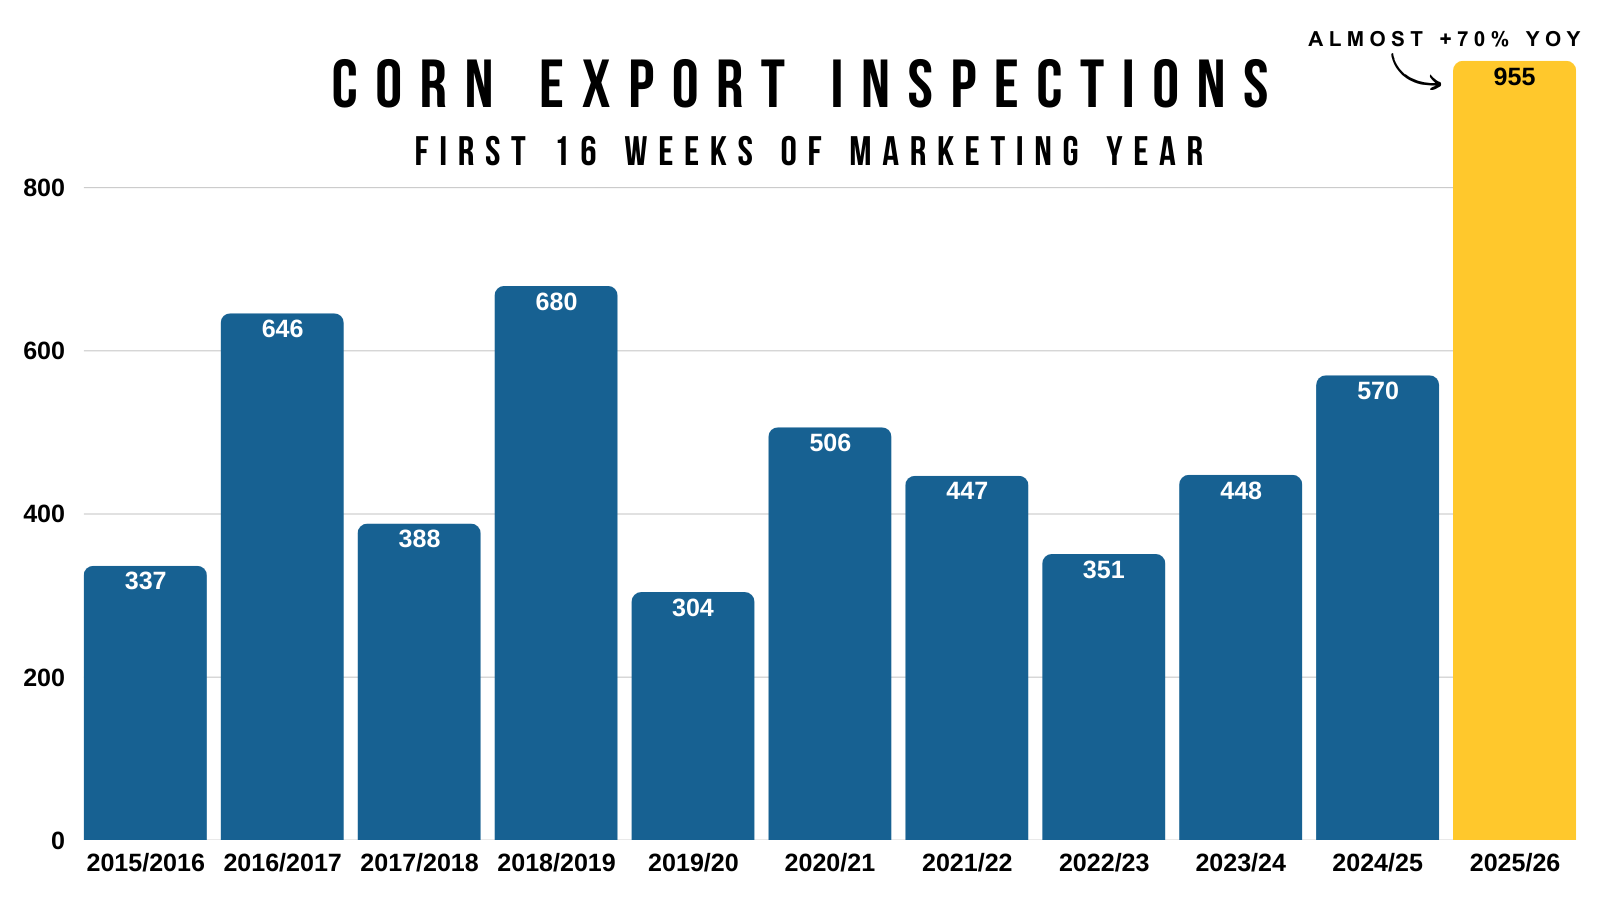
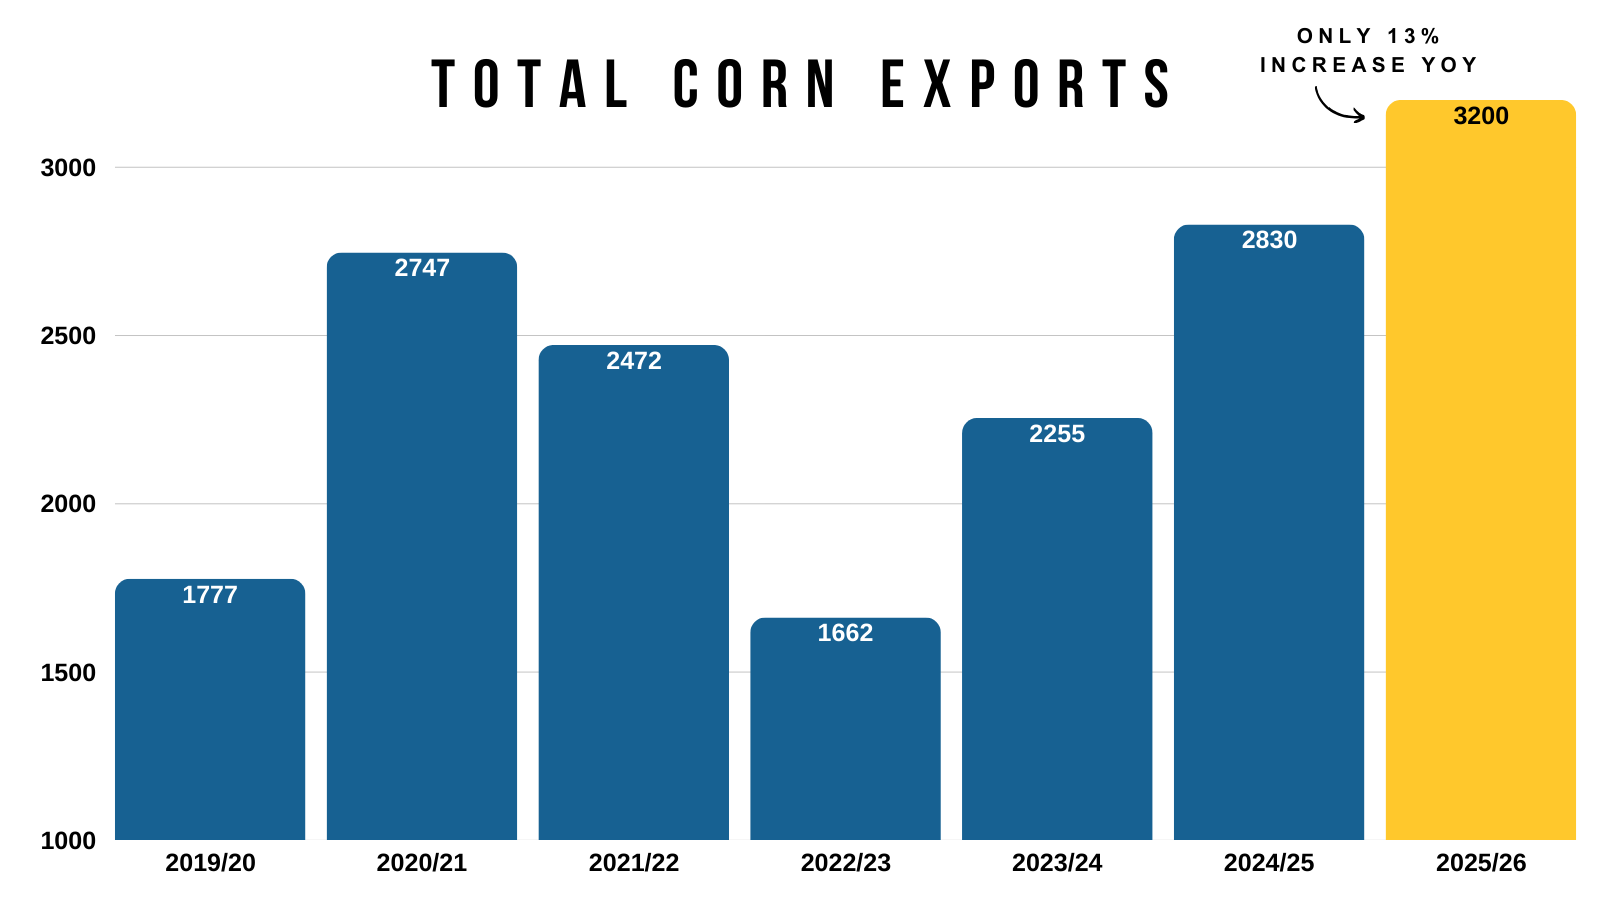
Yet, the USDA is only projecting exports to be up around +13% compared to last year.
So you could easily argue exports are going to need to be bumped further.
Yield should be coming down in January. I think that is pretty clear.
The issue is that most think the USDA is going to offset some of that supply loss by cutting feed demand.
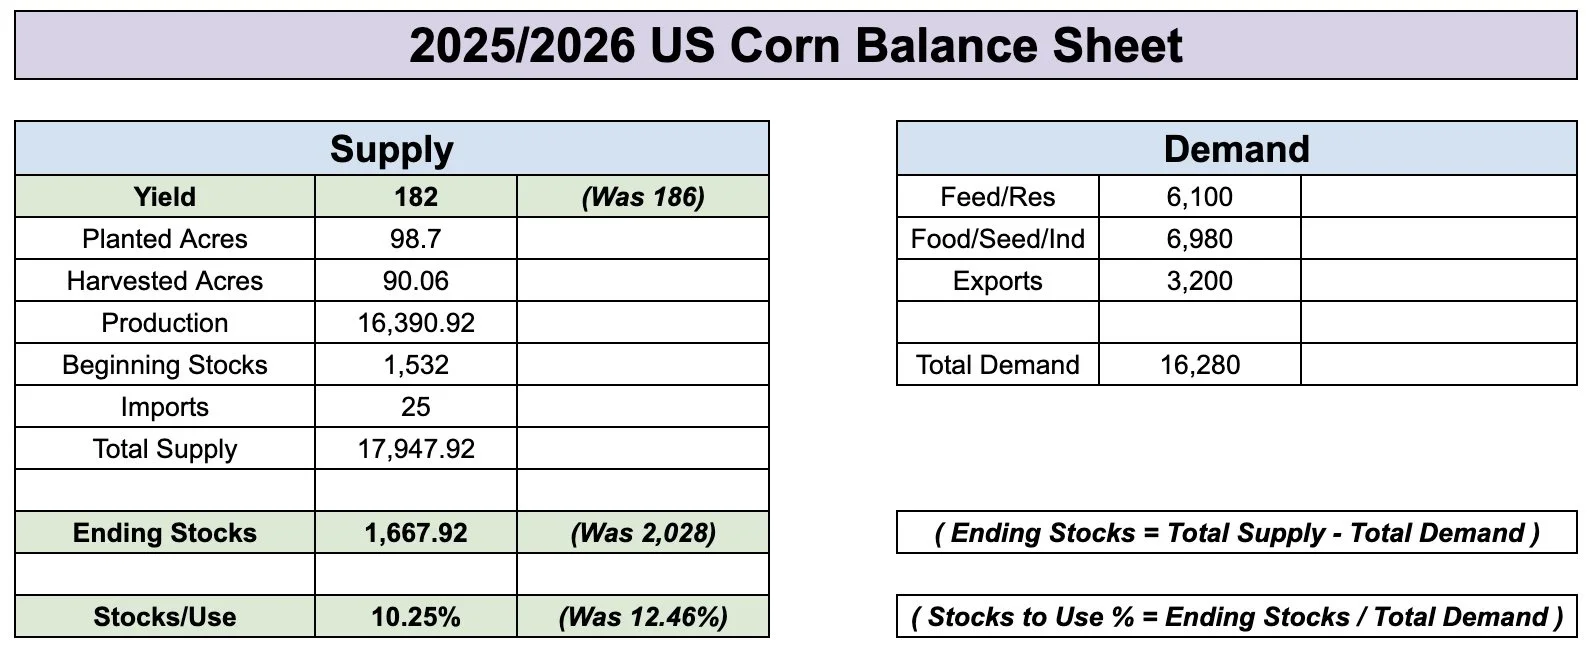
To get a corn balance sheet as tight as last year, it would take yield falling down to 182 while at the same time not touching demand at all.
That would give you a 10.25% stocks to use ratio, about on par with last year.
Altough I think we could follow a similar pattern price action wise.
It is hard to think that corn has more upside than last year based on what we know today.
Simply given that it's harder to create some mega bullish story that is friendlier than last year, unless yield is drastically lower.
Last year, the corn market topped out at just over $5.00 with a 1.54 billion bu carryout in February. Last year, we had a 1.74 billion carryout in December.
We still have a 2 billion bu carryout today.
Record demand should prevent this market from completely falling apart.
Seasonally we trend higher from here.
We should see some sort of yield reduction come January.
The bigger question is how much, and how the USDA responds on the demand side.
Do they bump exports? Do they cut feed demand?
We have to keep in mind that we're coming off a record crop fueled by record acres. This makes it harder for the balance sheet to tighten in a big way. Which makes me think our upside is capped in that $4.70 to $5.00 range for now.
Of course, we could run into a weather scare this summer. The USDA could throw a majorly bullish surprise. China could buy corn. We could go beyond $5.00
But for now, those are all just wild cards.
My bias leans higher from here, but upside feels somewhat limited unless one of those cards is drawn to shake things up.
Technicals:
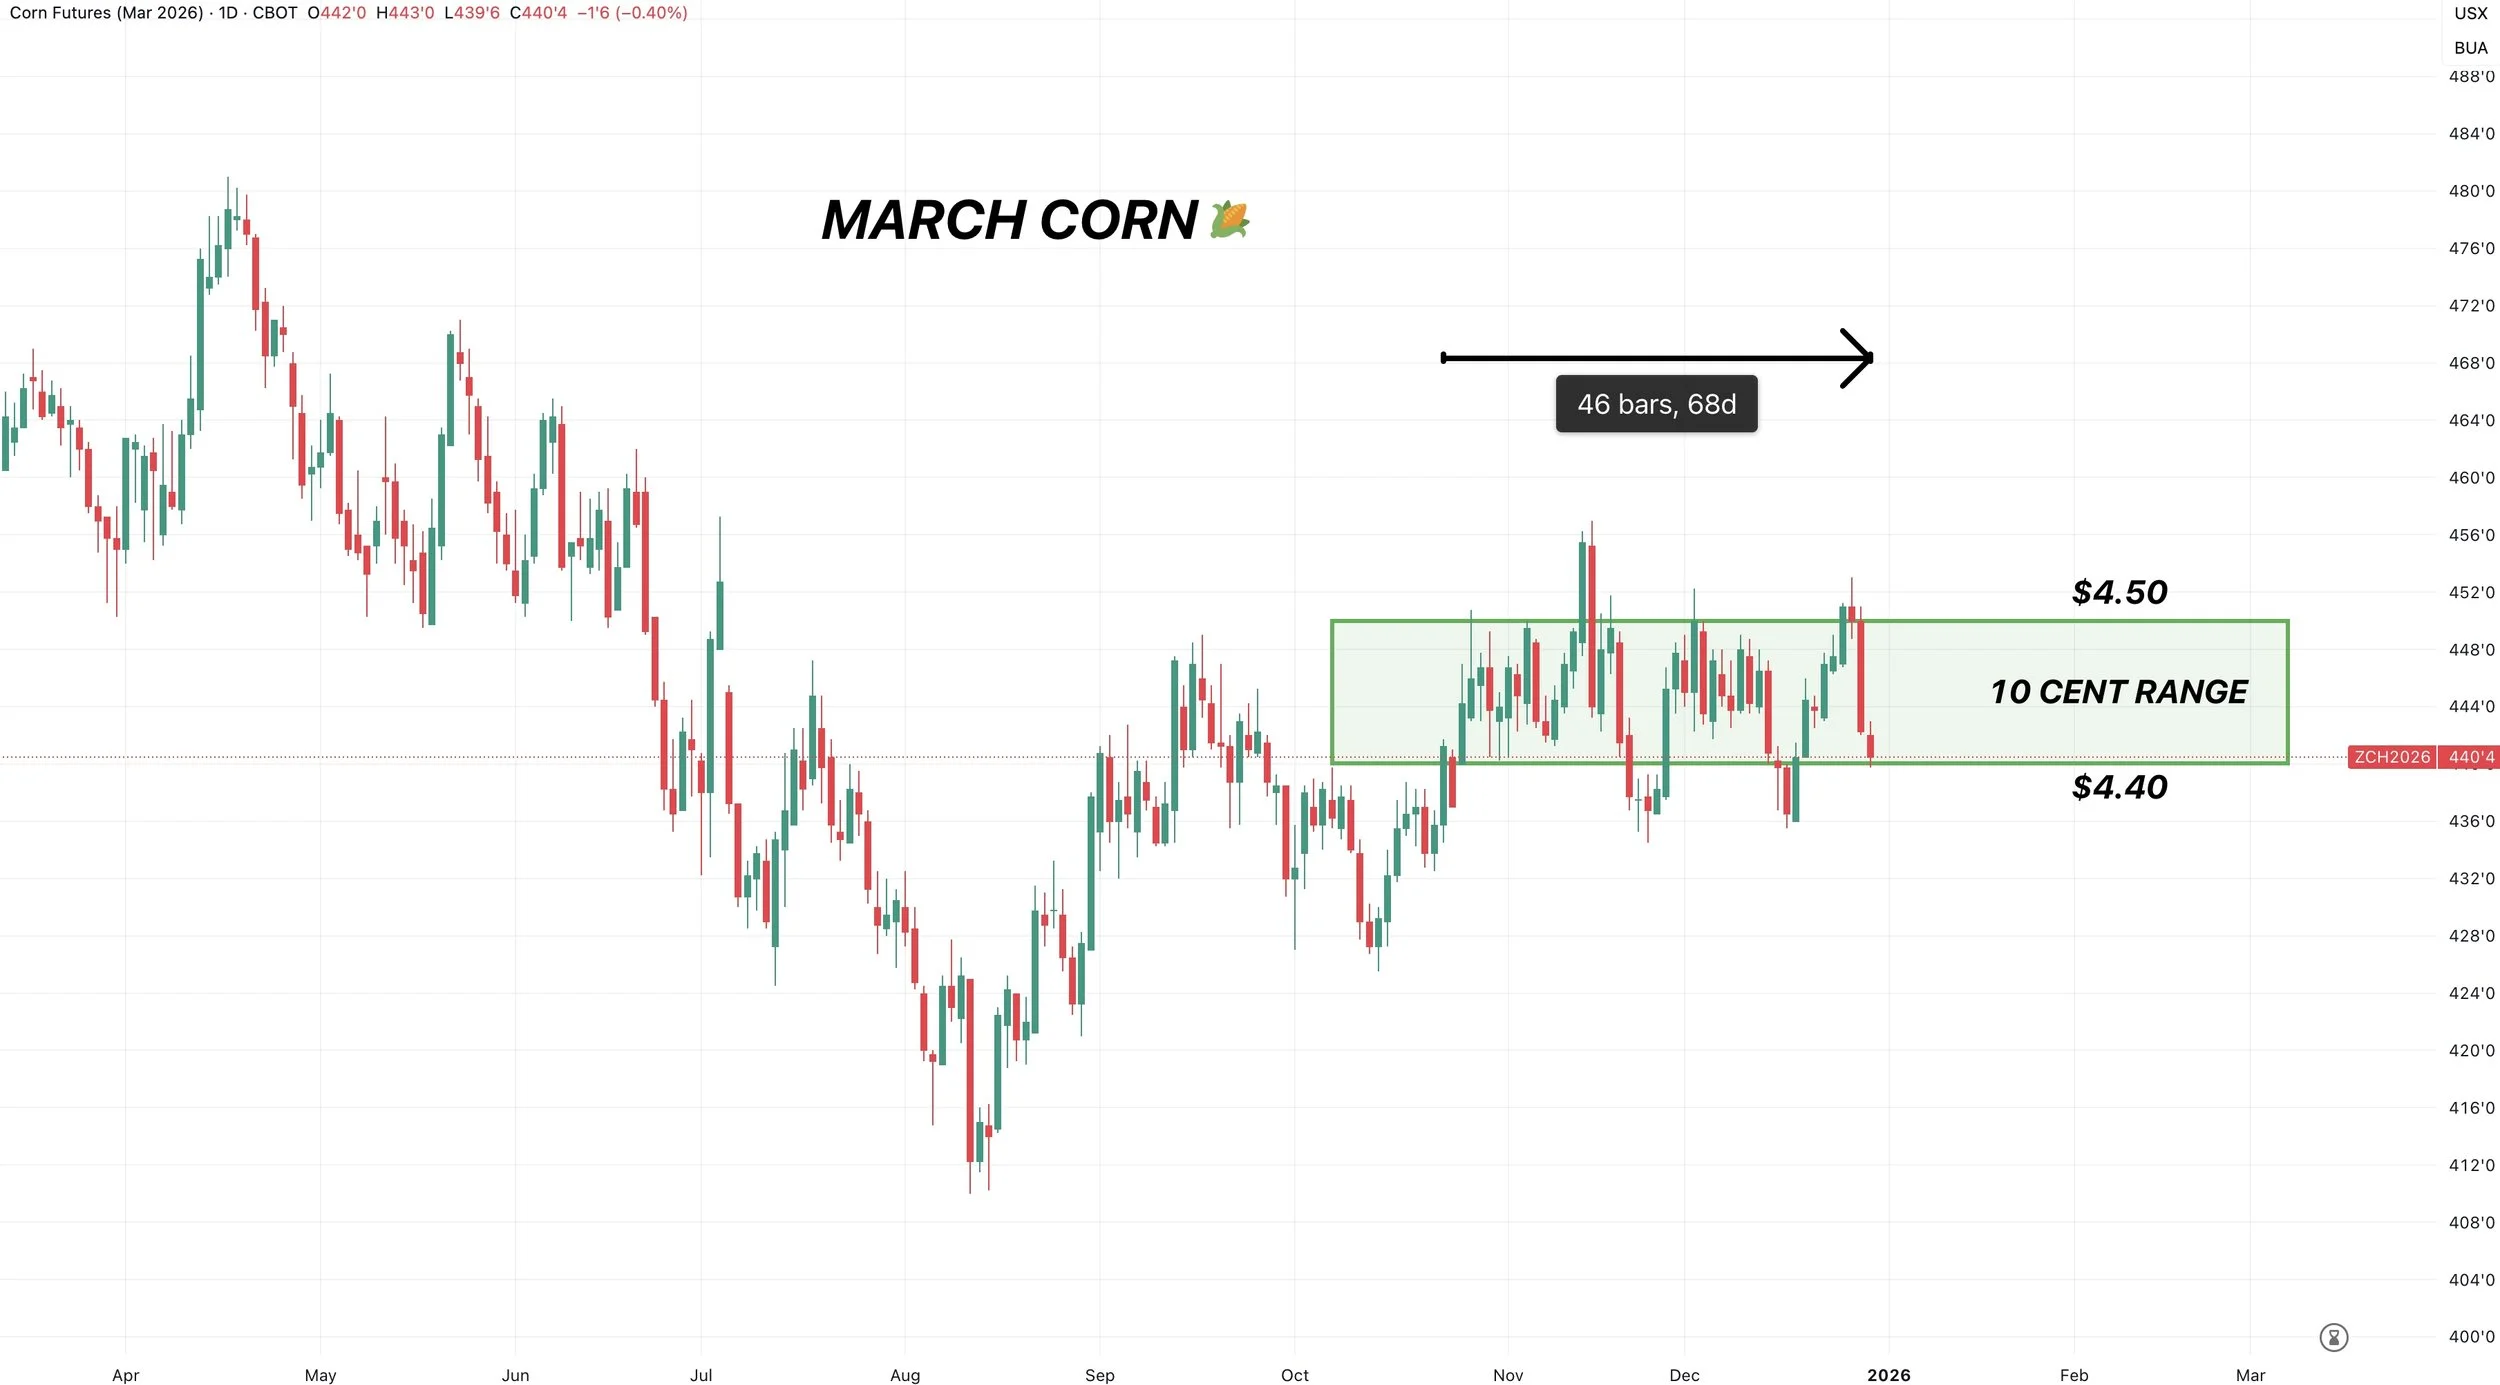
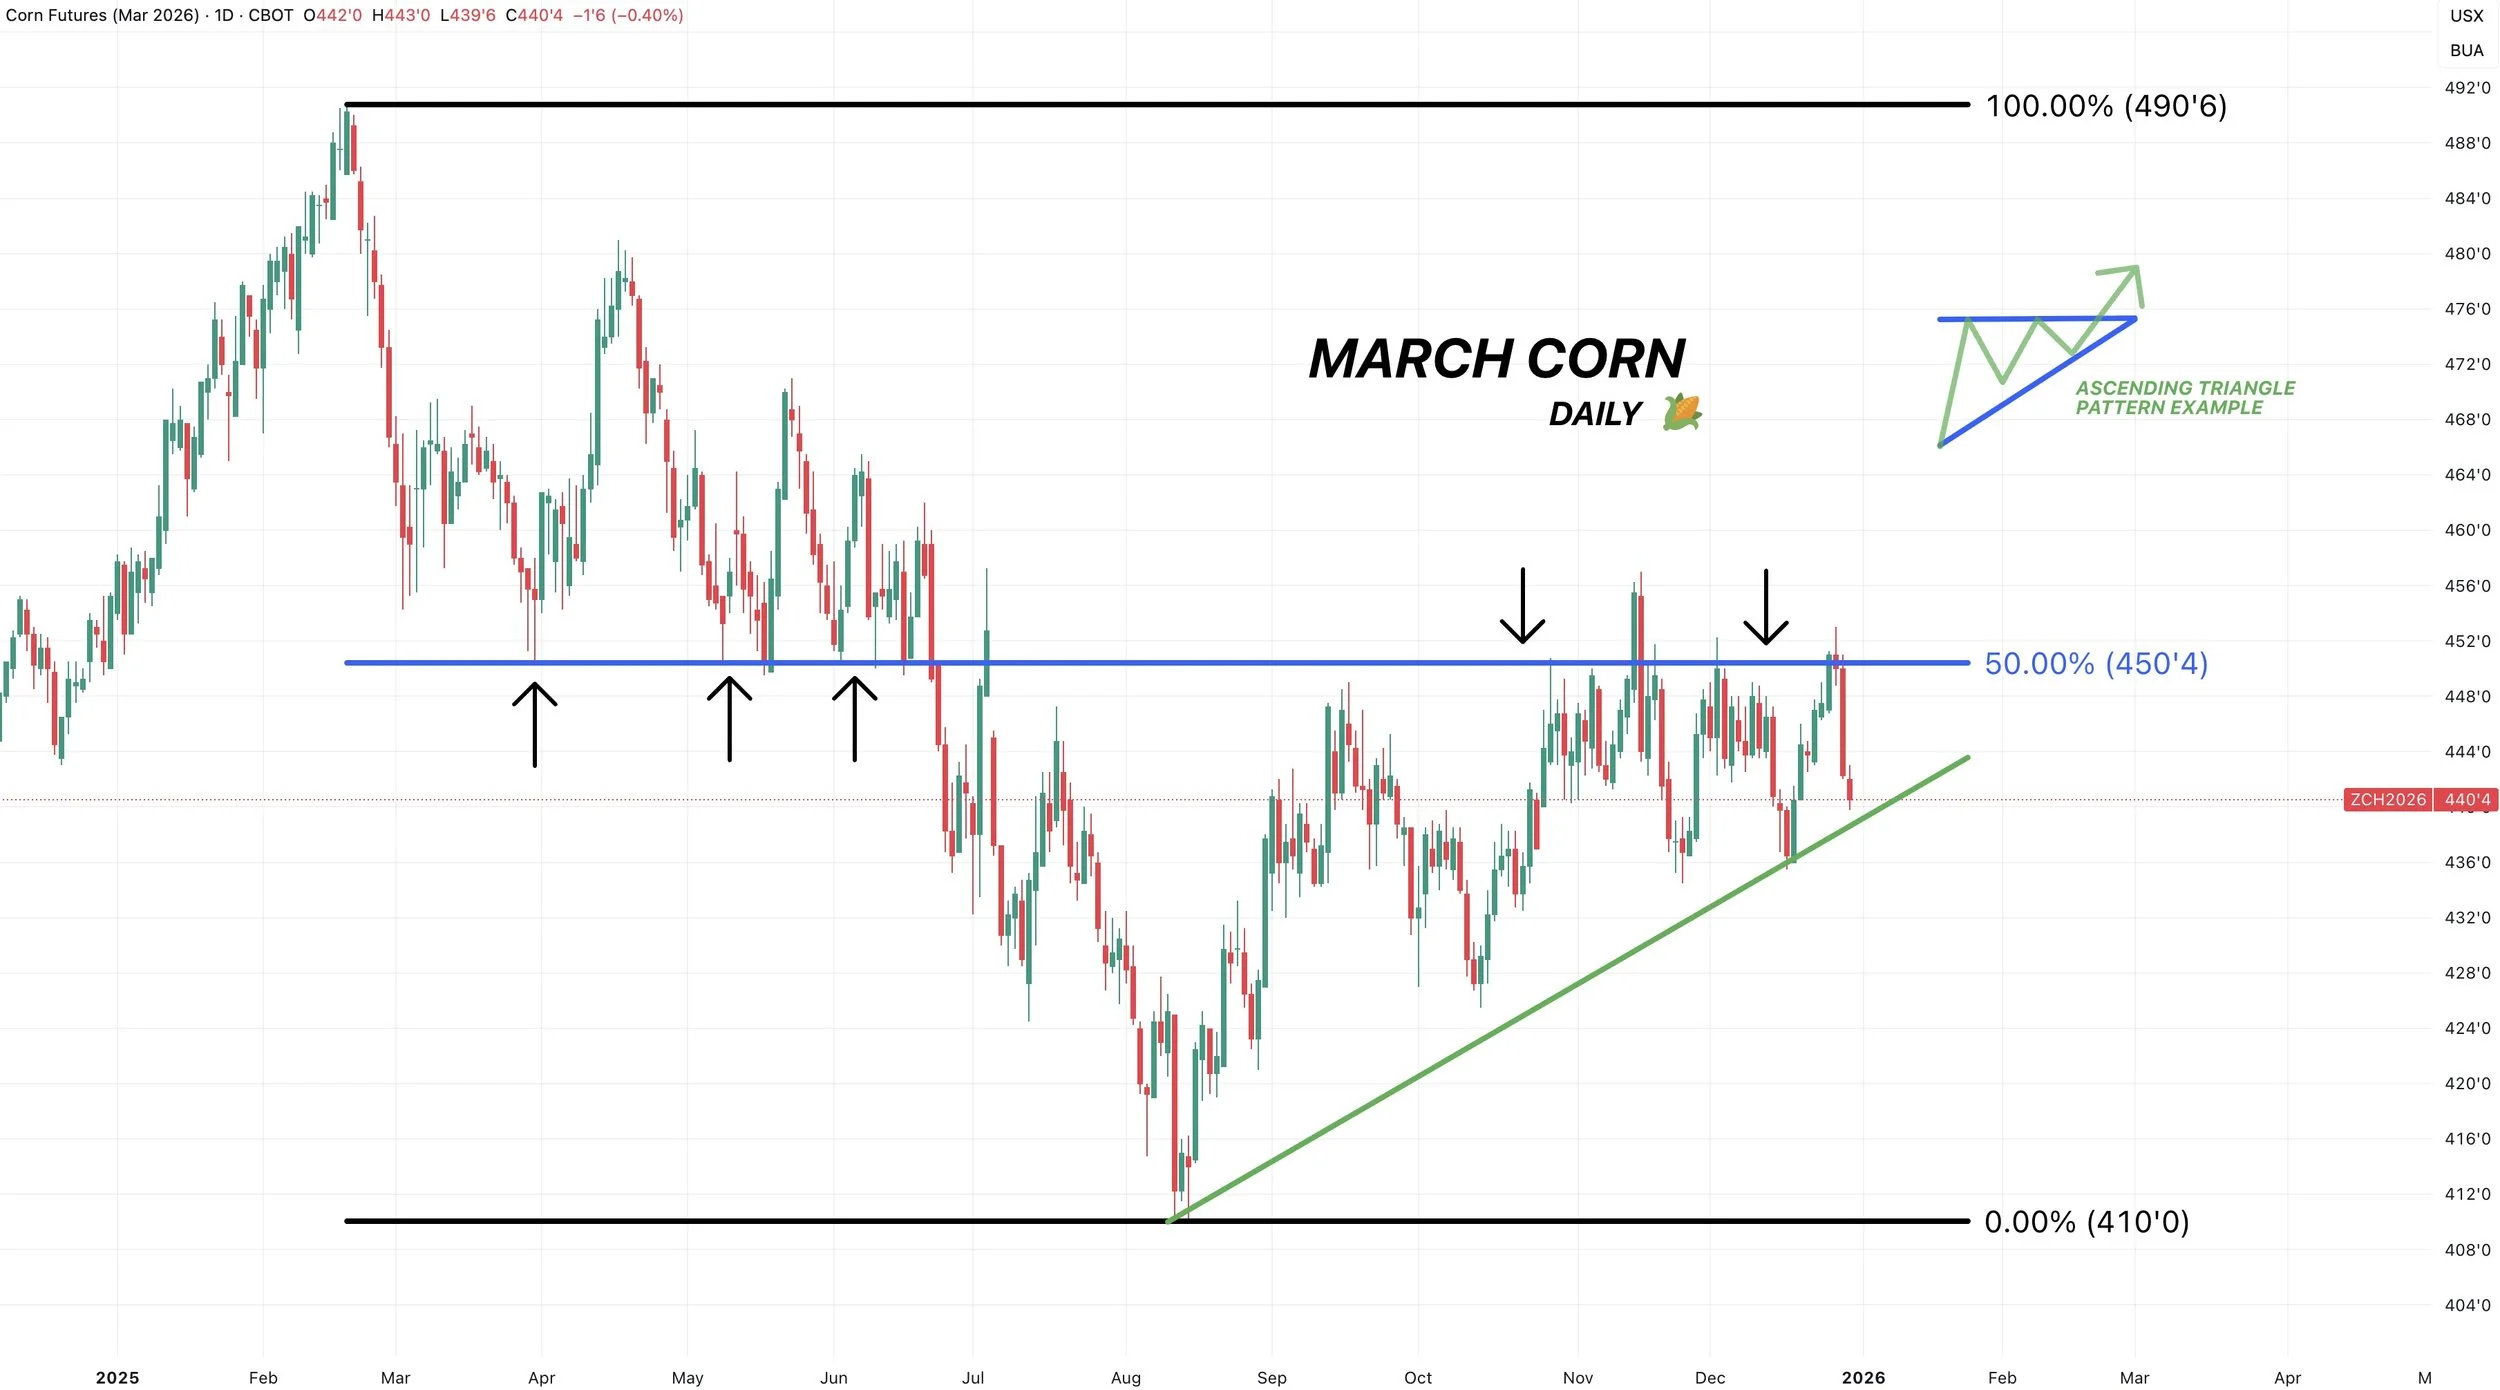
March Corn
Back to the range we go.
We've essentially traded between $4.40 and $4.50 since October.
A very brutal sideways range of just 10 cents for the last 70 days.
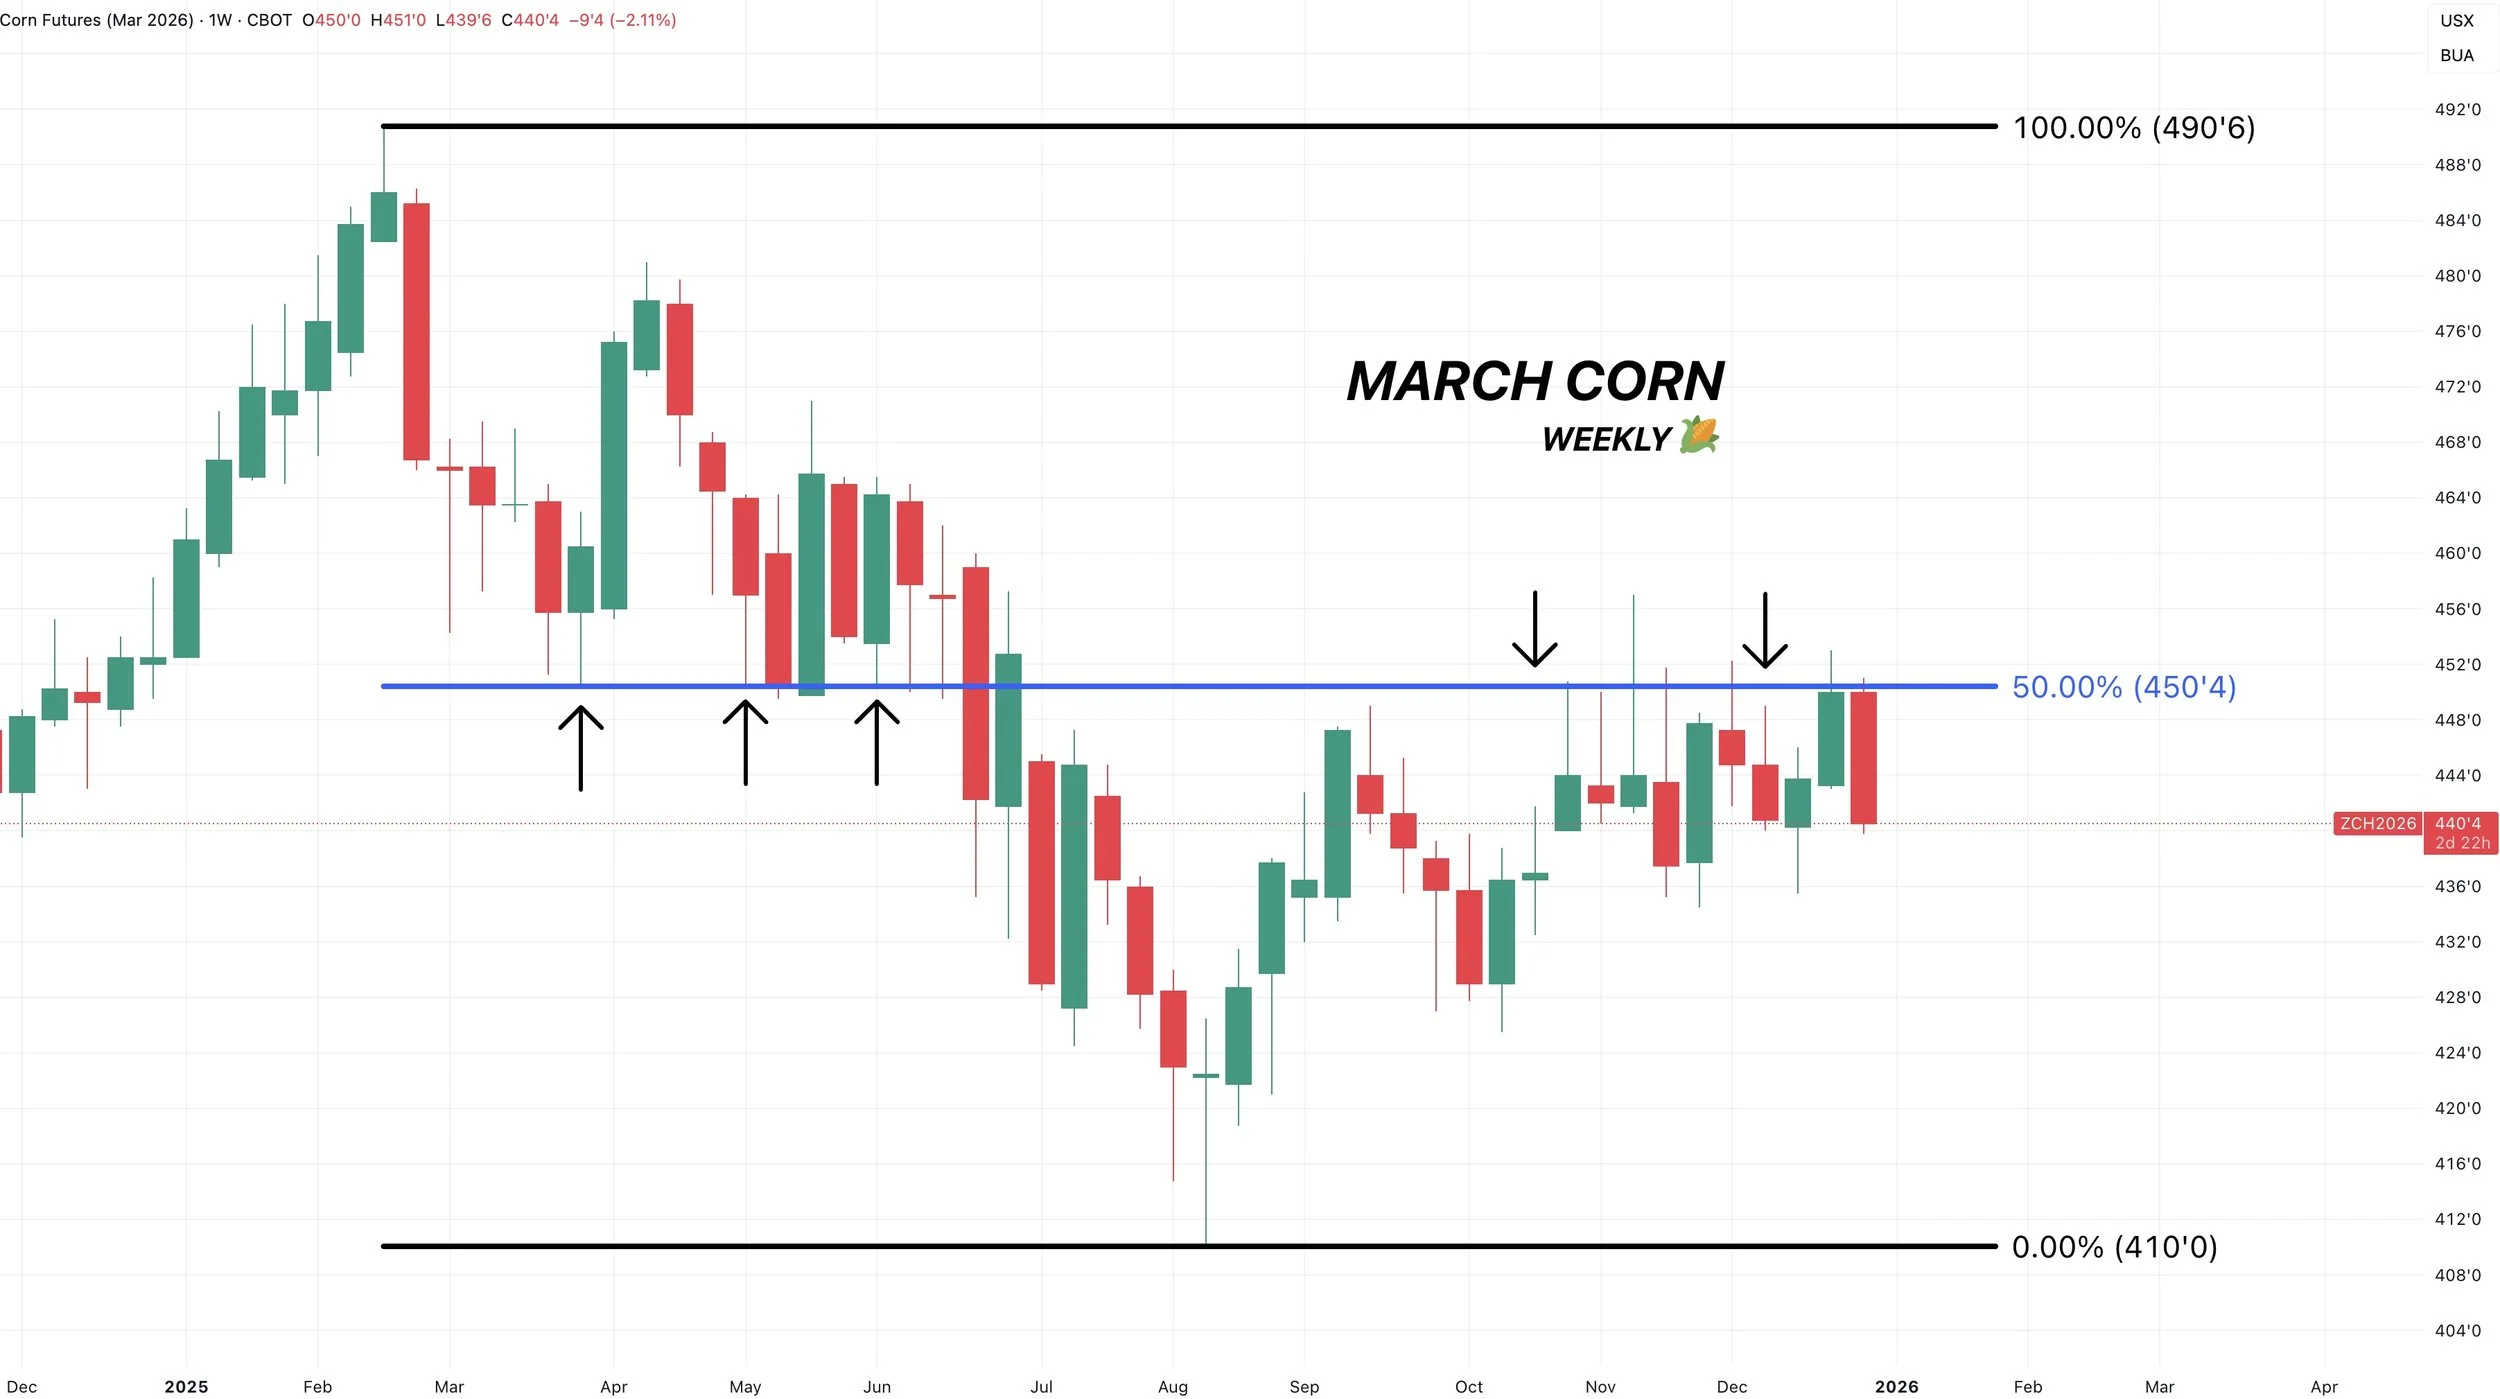
Here is the weekly chart.
$4.50 is the clear level we need to break through to get bulls excited and be confident this market is ready for the next leg higher.
It was key support from spring.
We've failed there the last 7 of 10 weeks.
It claws back 50% of the Feb highs.
Break above and it should spark further upside.
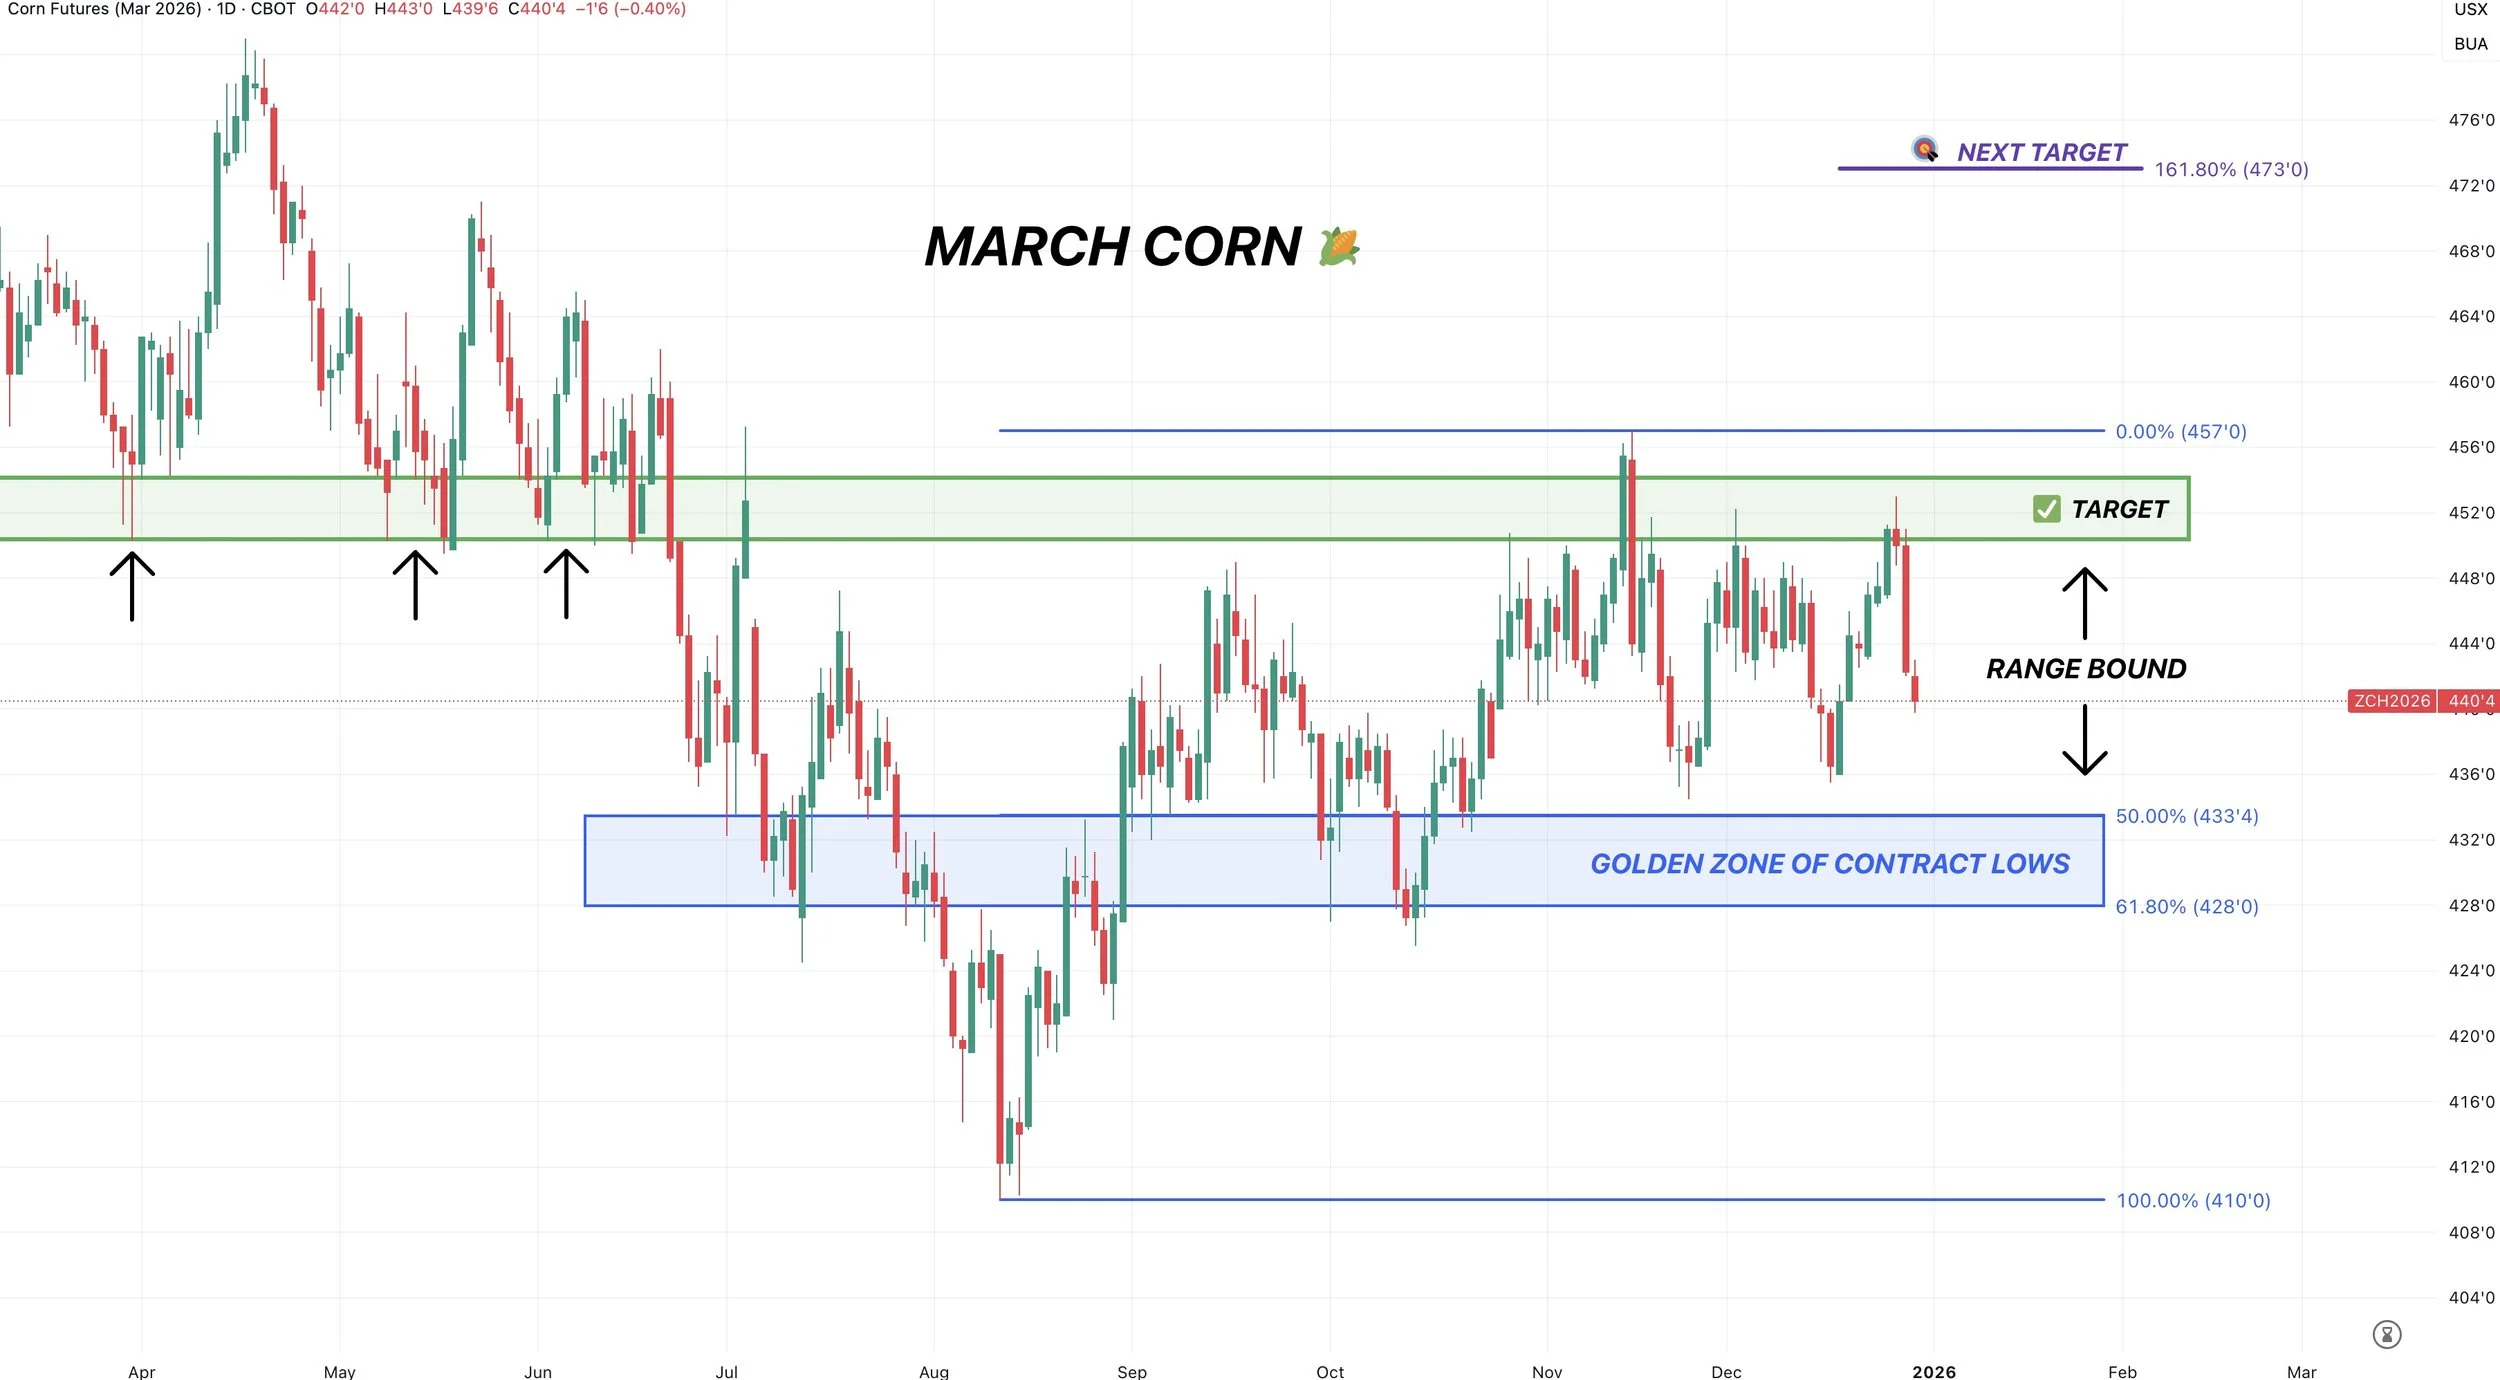
Right now we are simply range bound.
If we take out $4.50, we should go higher.
But if we were to take out those $4.35 lows the next point of interest would be the blue box.
I'd be looking to re-own around that level if it came.
As that is the 50-61.8% level down to contract lows.
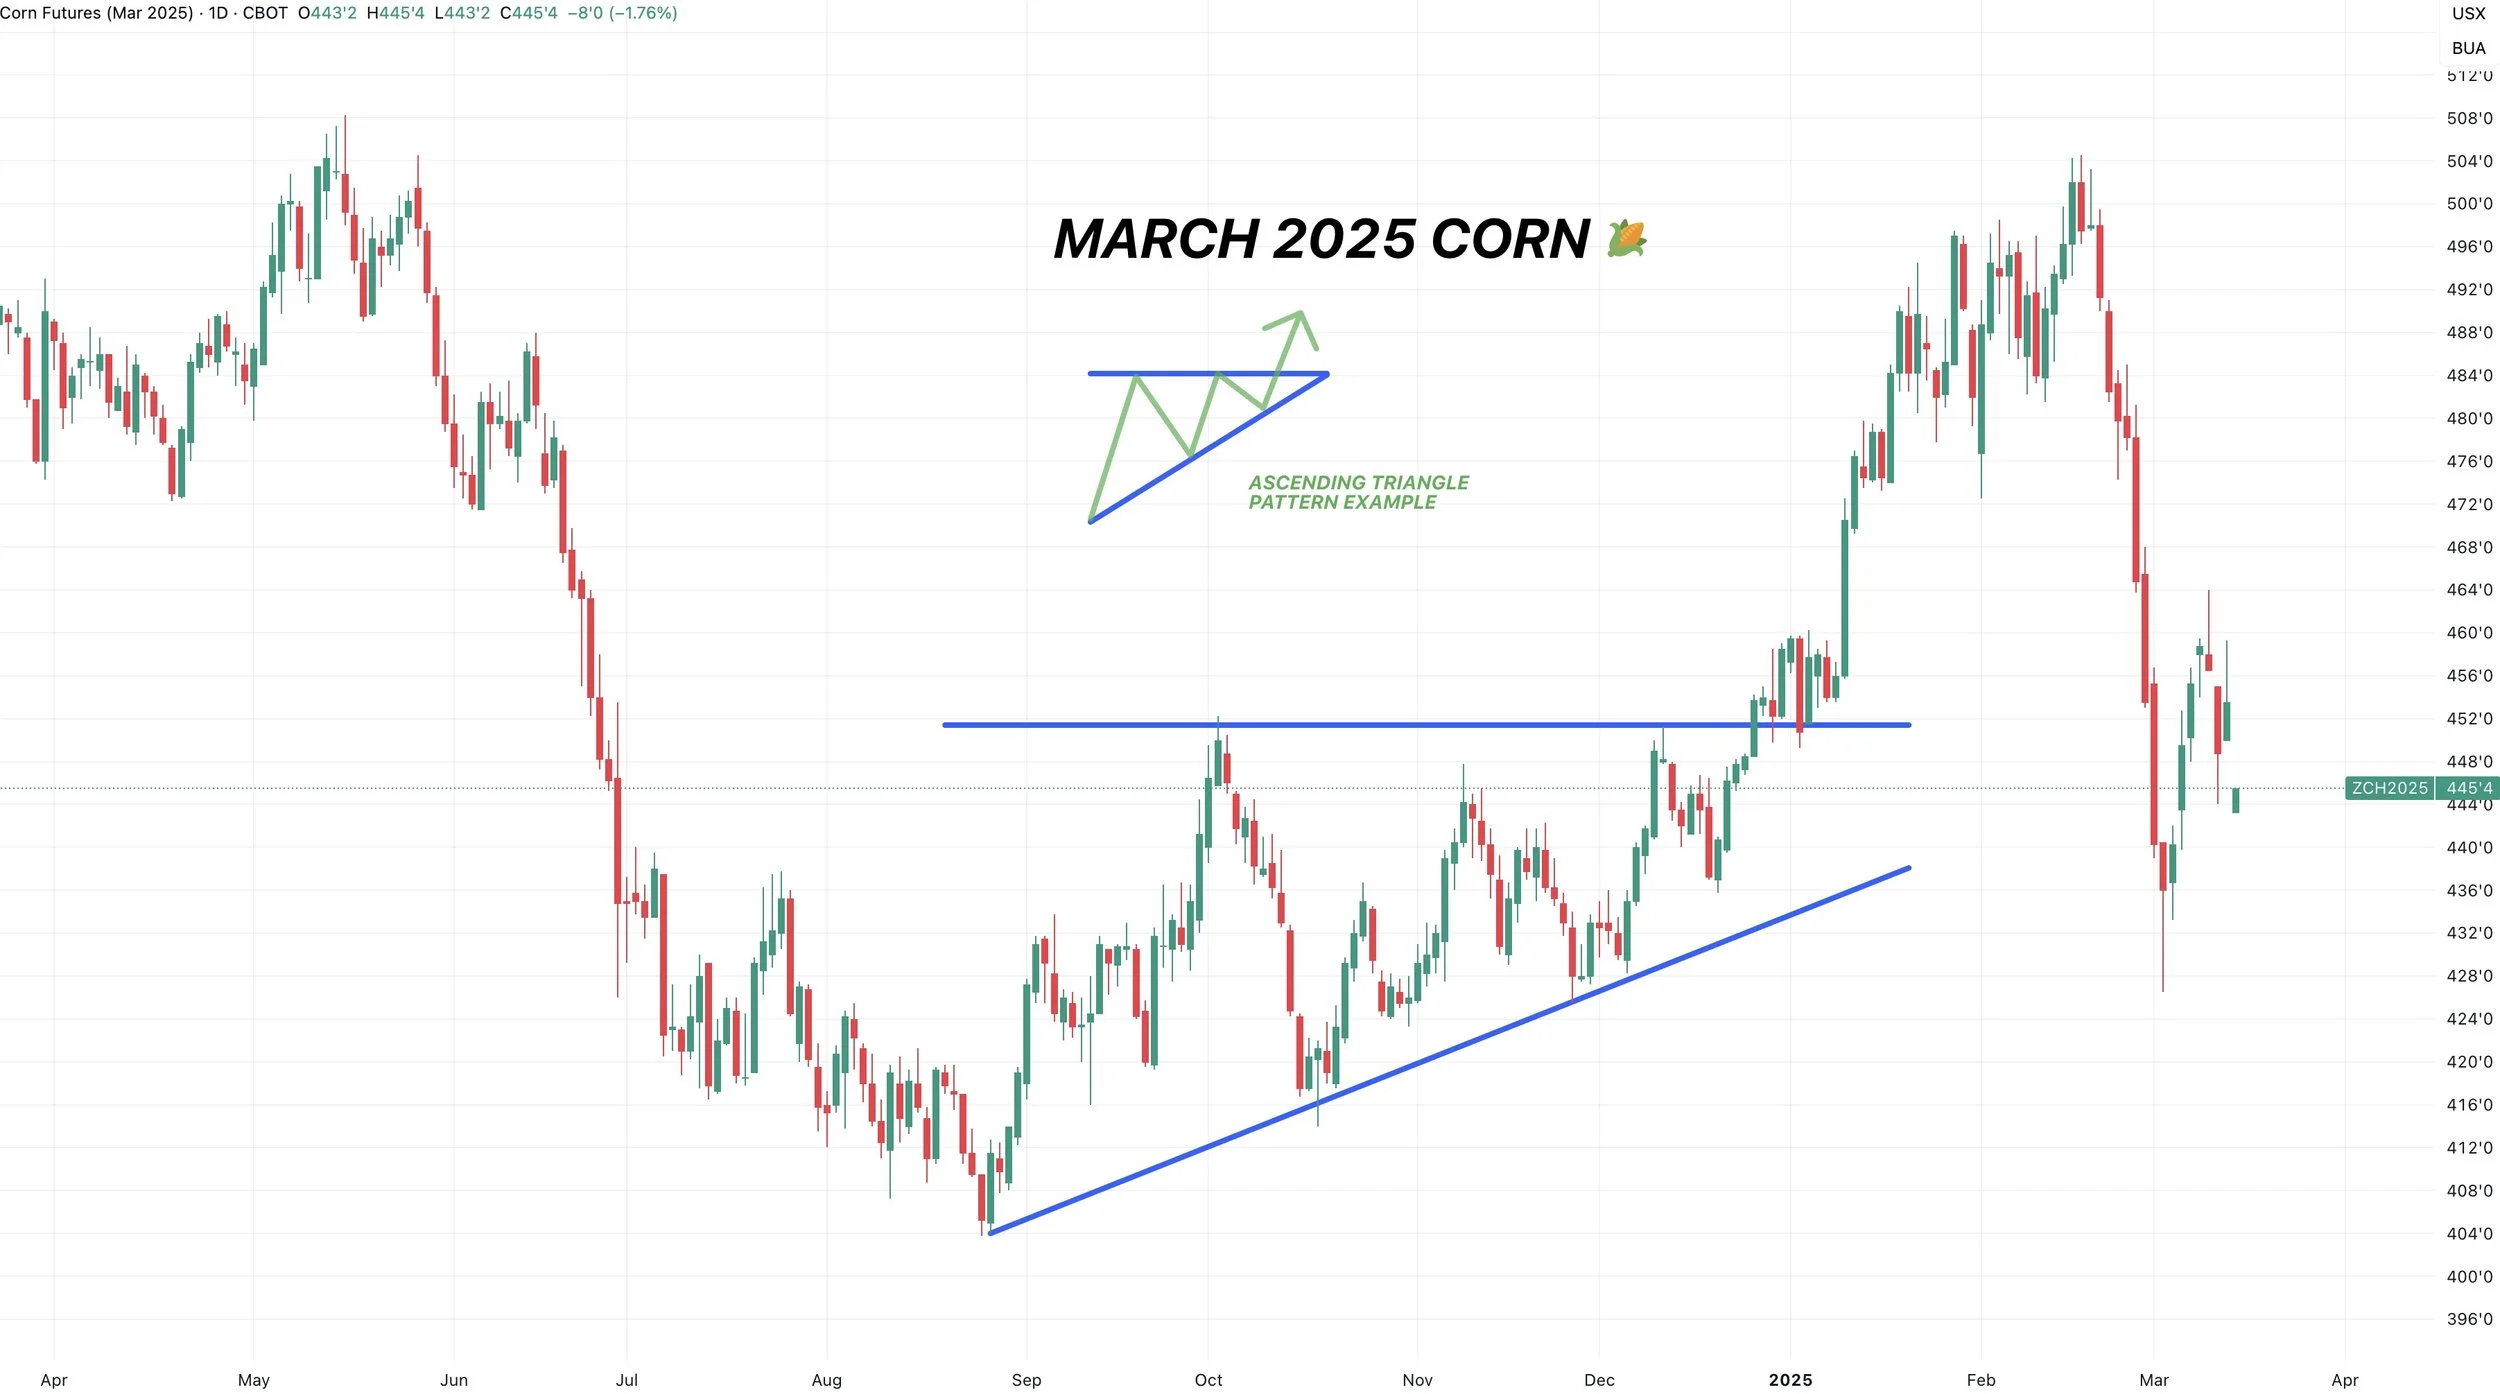
Ascending Triangle: March 2025 & 2026
We have a possible ascending triangle pattern developing on the charts.
Which is where you have horizontal resistance, but an uptrend of support.
This is a very similar pattern to what we saw in March corn last year before we ultimately broke out in January.
Soybeans
Fundamentals:
The biggest thing soybeans have going for them is that we are oversold.
We dropped over -$1.00 over the course of just 30 days.
Outside of being at an area of interest on the charts and being oversold, fundamentally soybeans don’t have many bullish factors going their way.
Yes, the US situation does have a "path" to become tight.
Arguably an easier path than corn does.
For reference, a 52 yield while leaving demand unchanged results in a near 200 million bushel carryout.
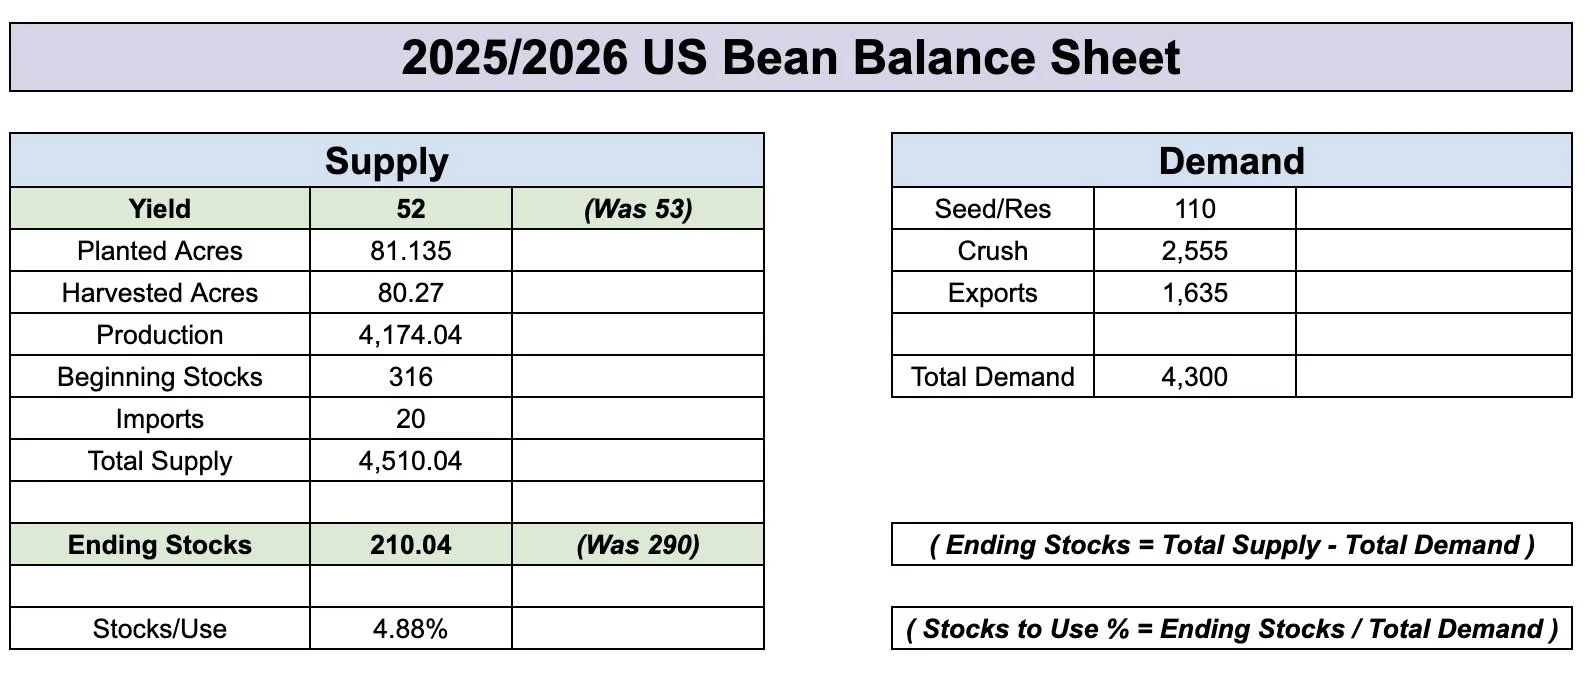
The issue is that you could definitely argue the USDA is going to have to lower export demand.
Which would offset some supply loss if it came.
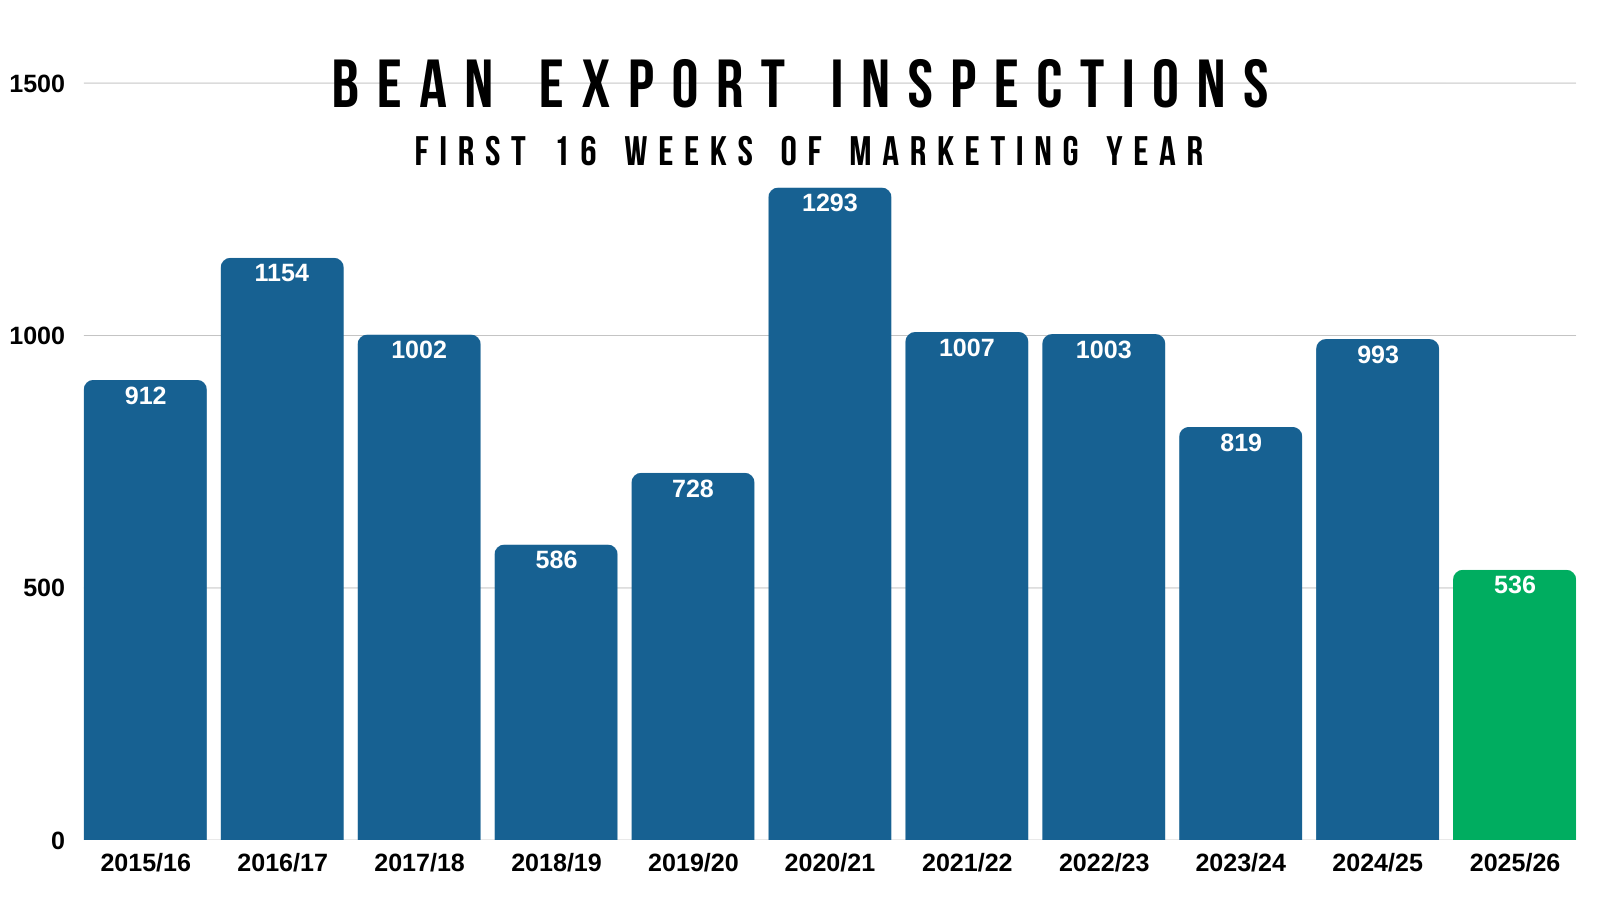
Currently export inspections are down -45% vs last year.
The USDA only expects export demand to be down -13%.
We are already past our prime shipping window.
Who knows if the USDA will lower it, but it’s a concern that the trade is aware of.
At the same time, we've seen virtually zero issues out of Brazil.
We still have not received any sort of trade agreement Rollins claimed we'd be getting several weeks ago.
Bottom line, I do still think we are at an area where soybeans could find some life. But we will want to be looking to reward the relief bounce if it comes. As a major rally might be hard to come by with no issues out of Brazil.
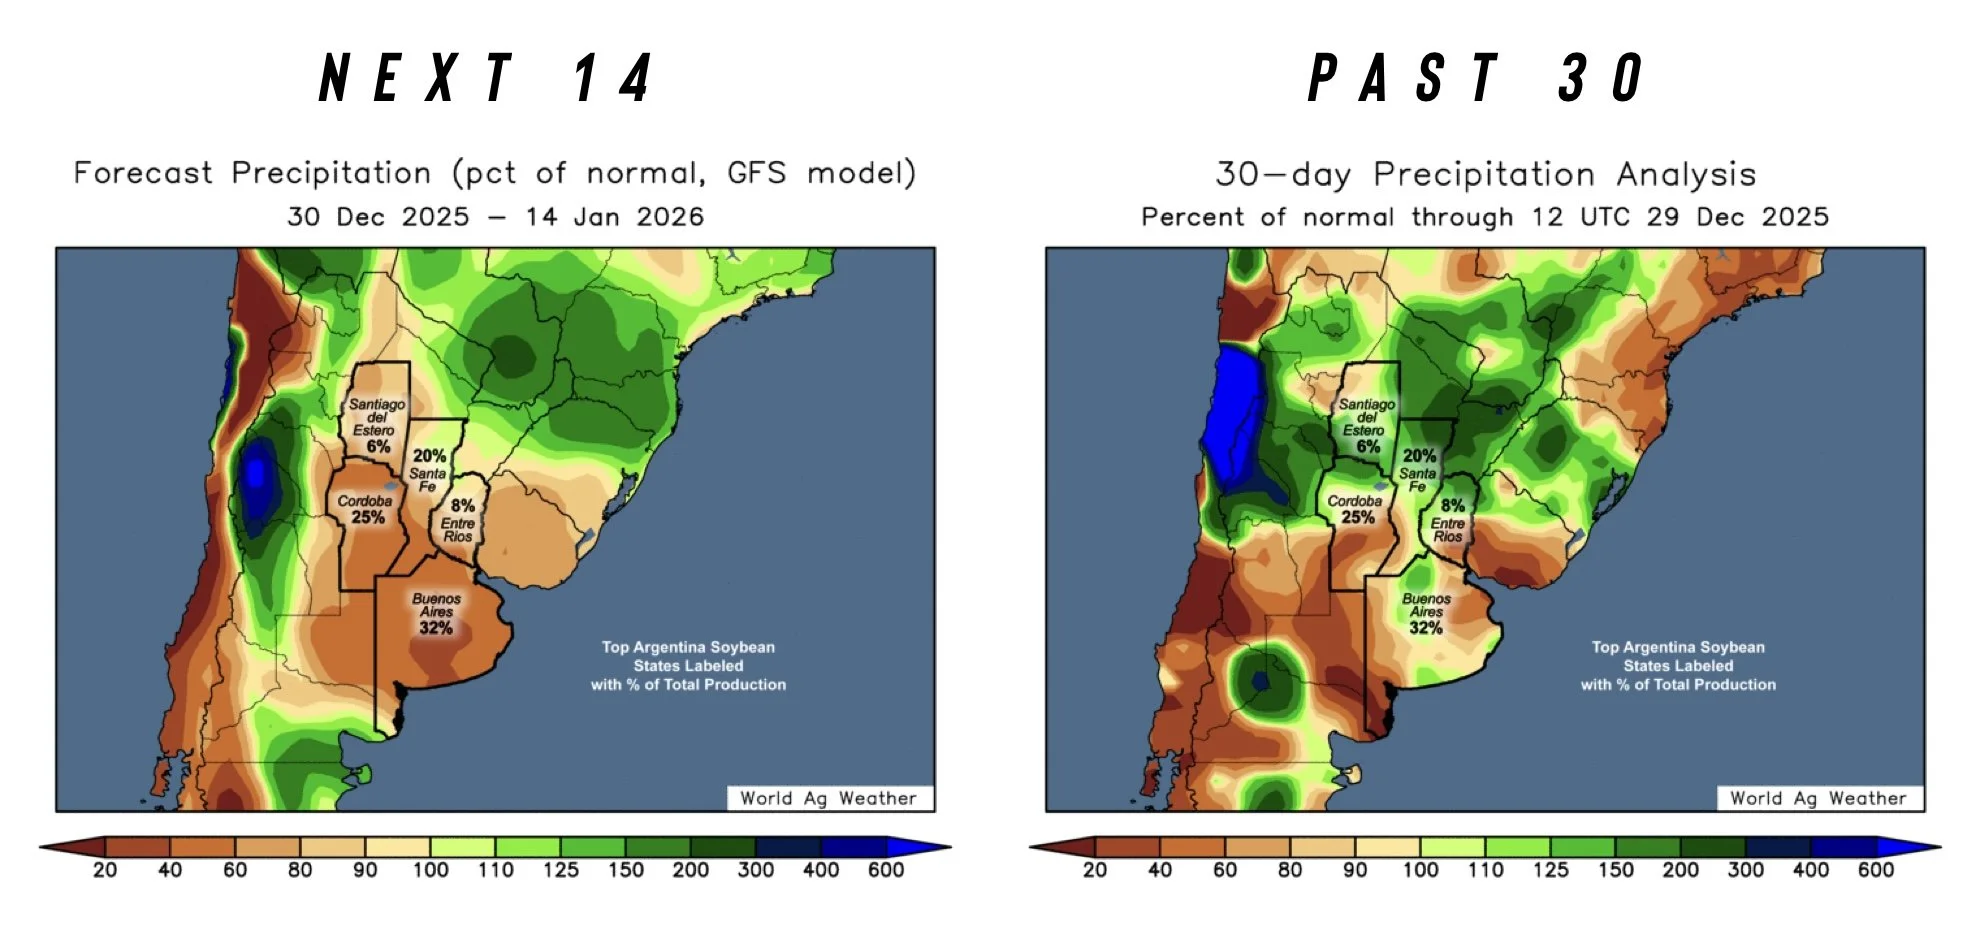
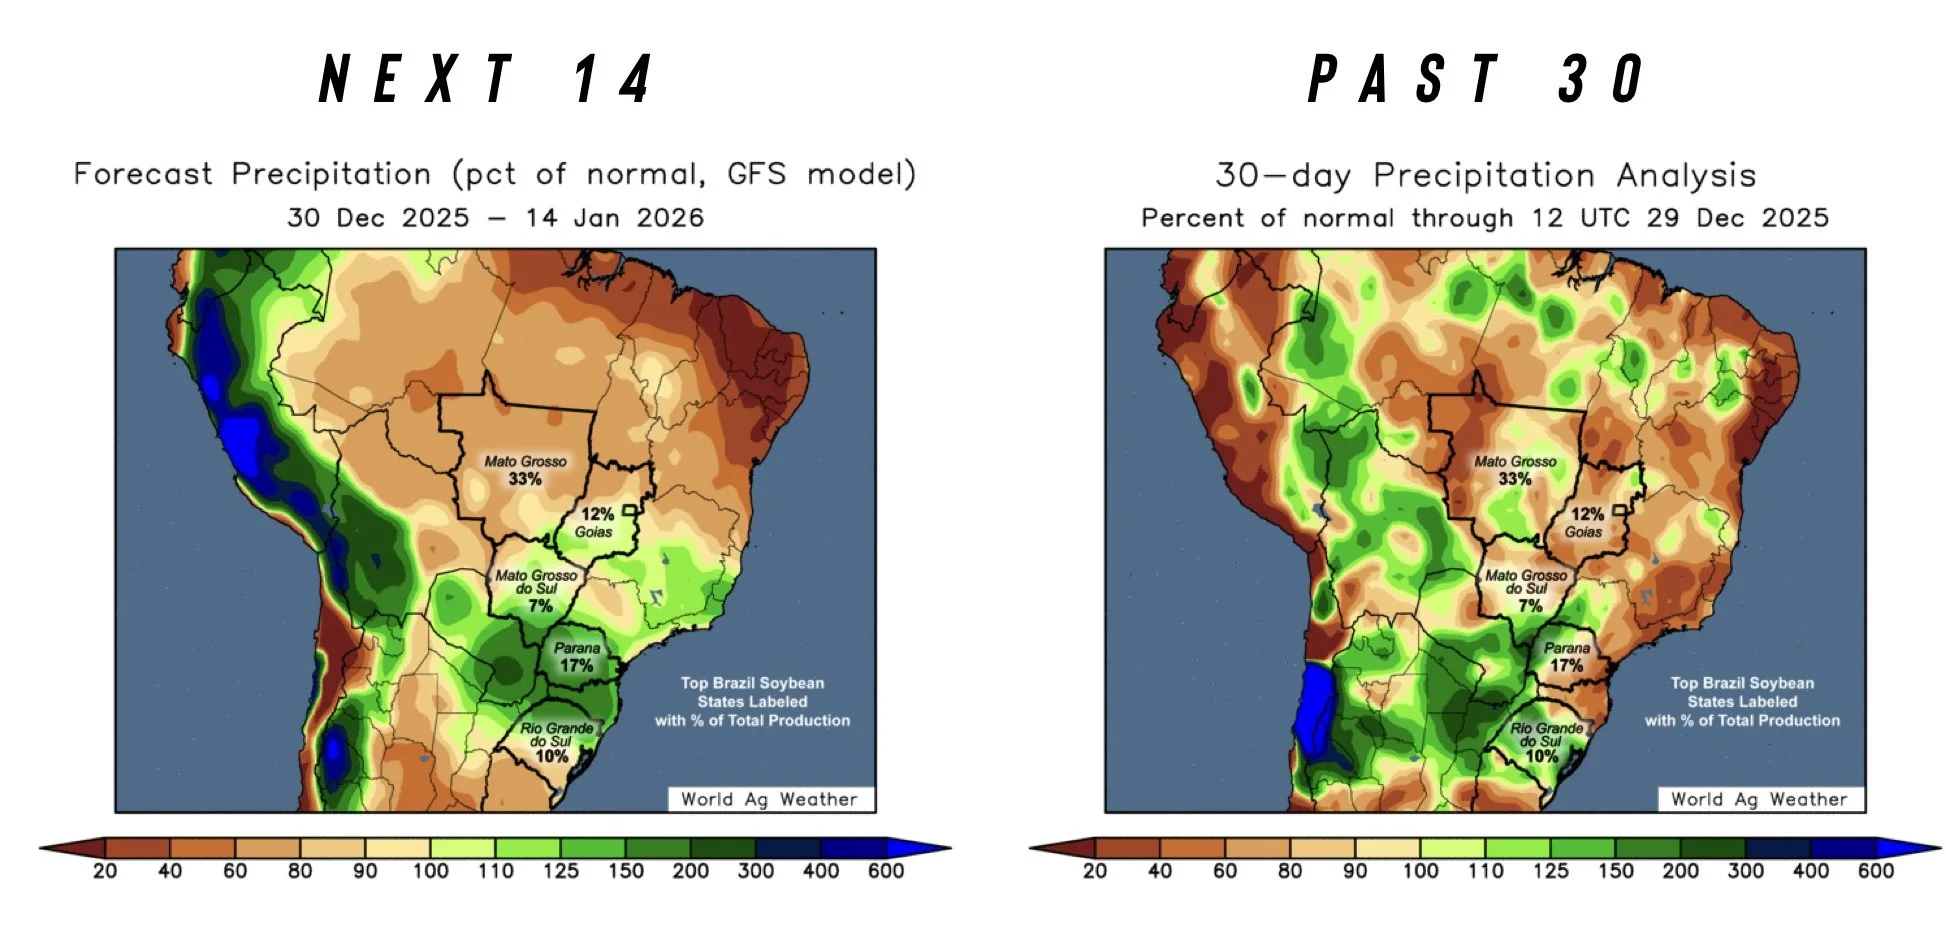
Argentina is supposed to be hot and dry for the next 2 weeks. Only receiving 50% of their normal rainfall. So perhaps that could add some support, but overall not a game changer.
Below is the 2-week forecast vs the last 30 days of precip vs normal.
Argy is dry, but Brazil looks fine for the next 2 weeks.
Neither has had any big concerns the last 30 days.
Technicals:
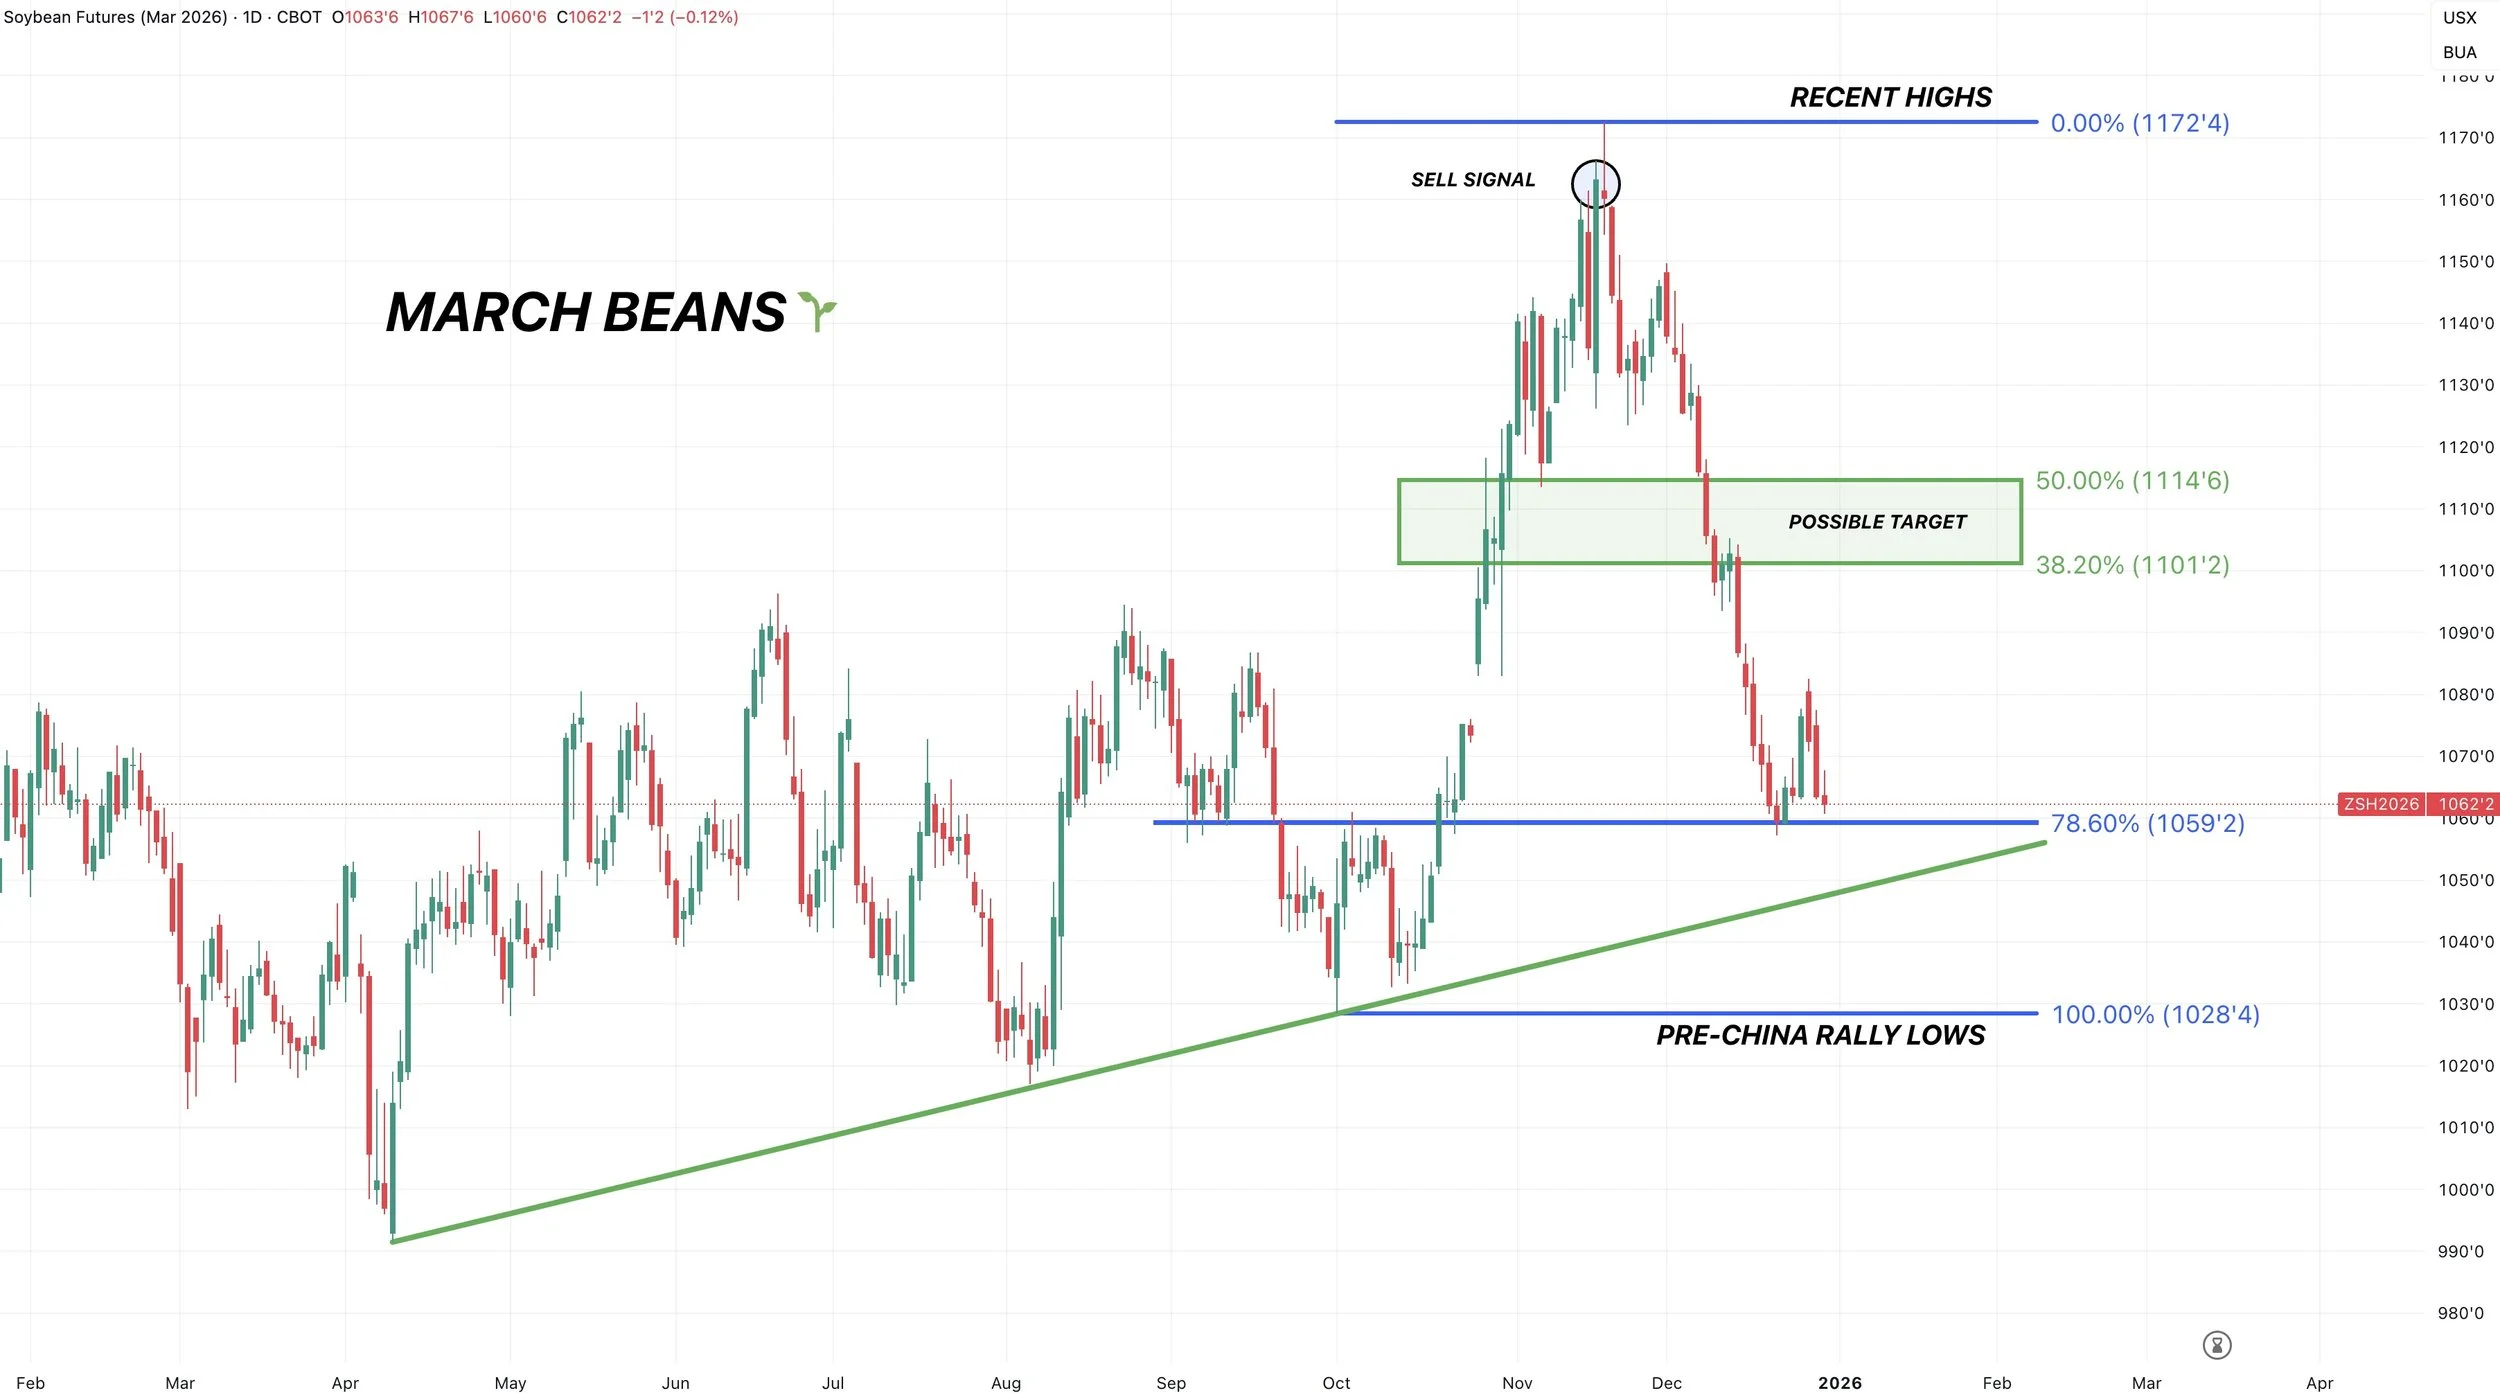
March Beans
We are still right at the 78.6% retracement level down to the pre-China fueled lows.
So finding some life here still makes sense.
If we fail to hold this level, we have some trendline support around that $10.50 area.
To the upside, we want to be looking to reward a move towards $11.00 to $11.15 if it comes. That claws back 38.2% to 50% of the entire sell off.
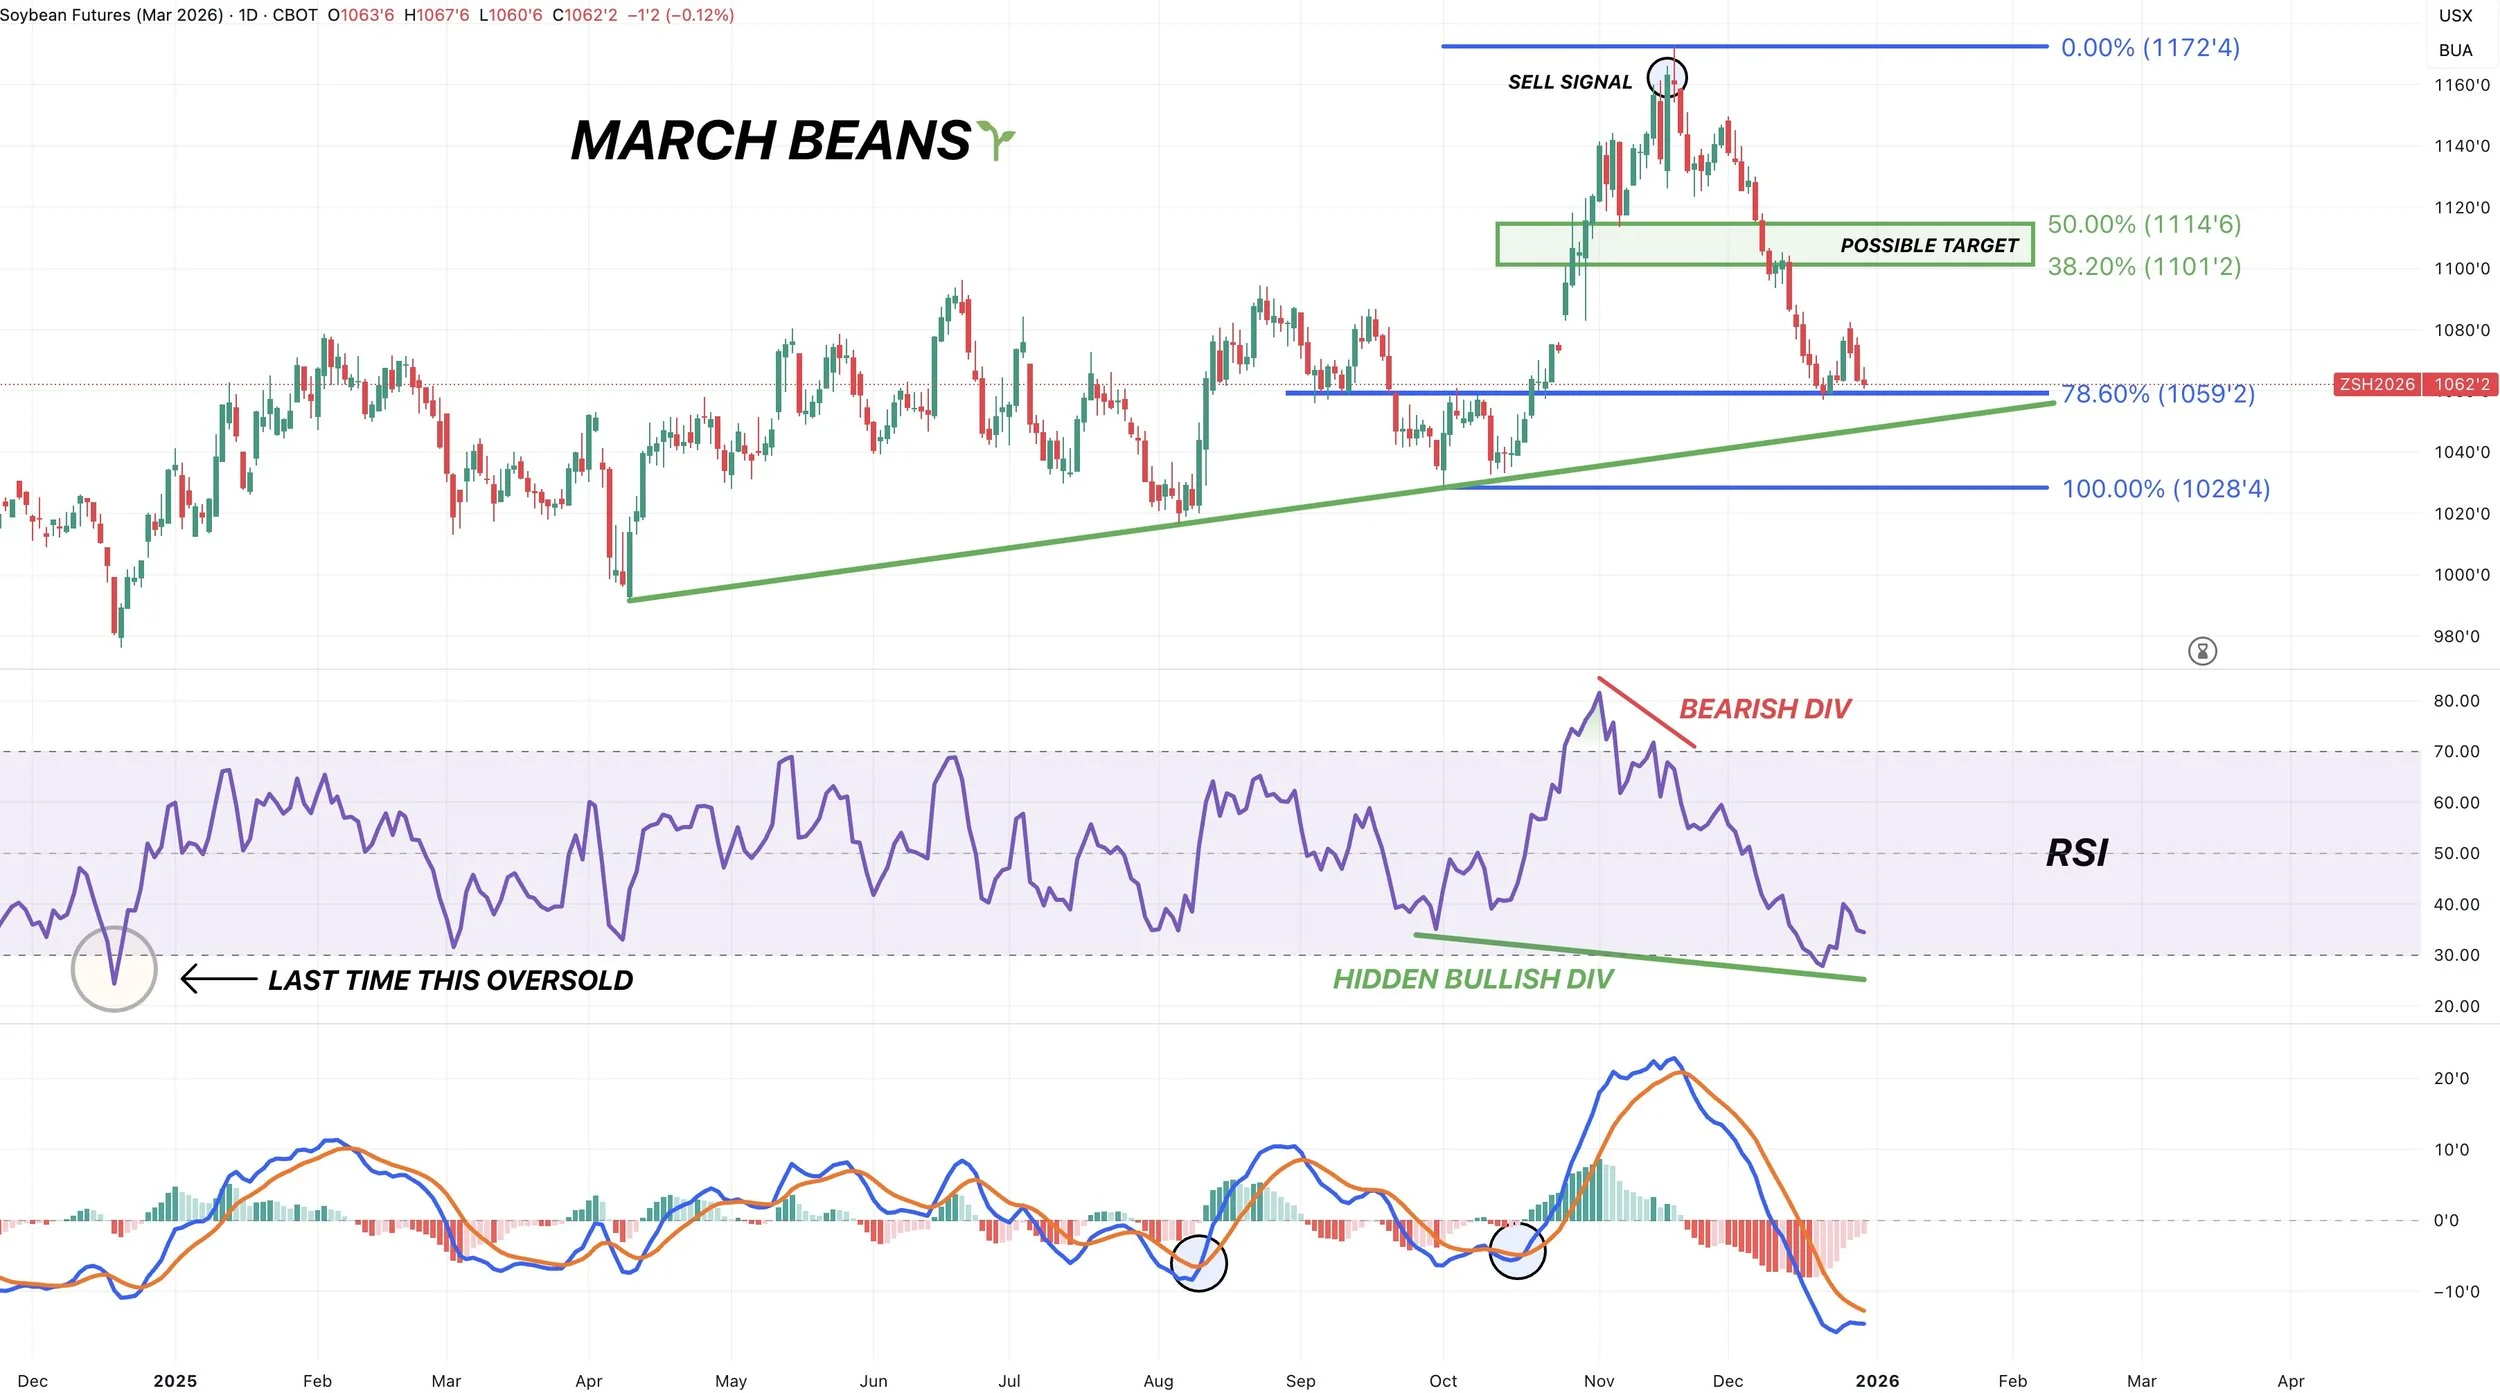
If we look at the indicators.
We had hidden bullish divergence. The RSI was making new lows, yet prices were a lot higher compared to the last time the RSI was this oversold.
If prices make a new low, but the RSI does not. That is called normal bullish divergence. So that could definitely we something we see here if we make new lows over the next few days but the RSI does not.
The MACD indicator is a momentum indicator (on the bottom).
It has not yet flipped bullish, but is close to doing so. The last few times it flipped bullish it did lead to higher prices.
A few other reasons why we could find life down here.
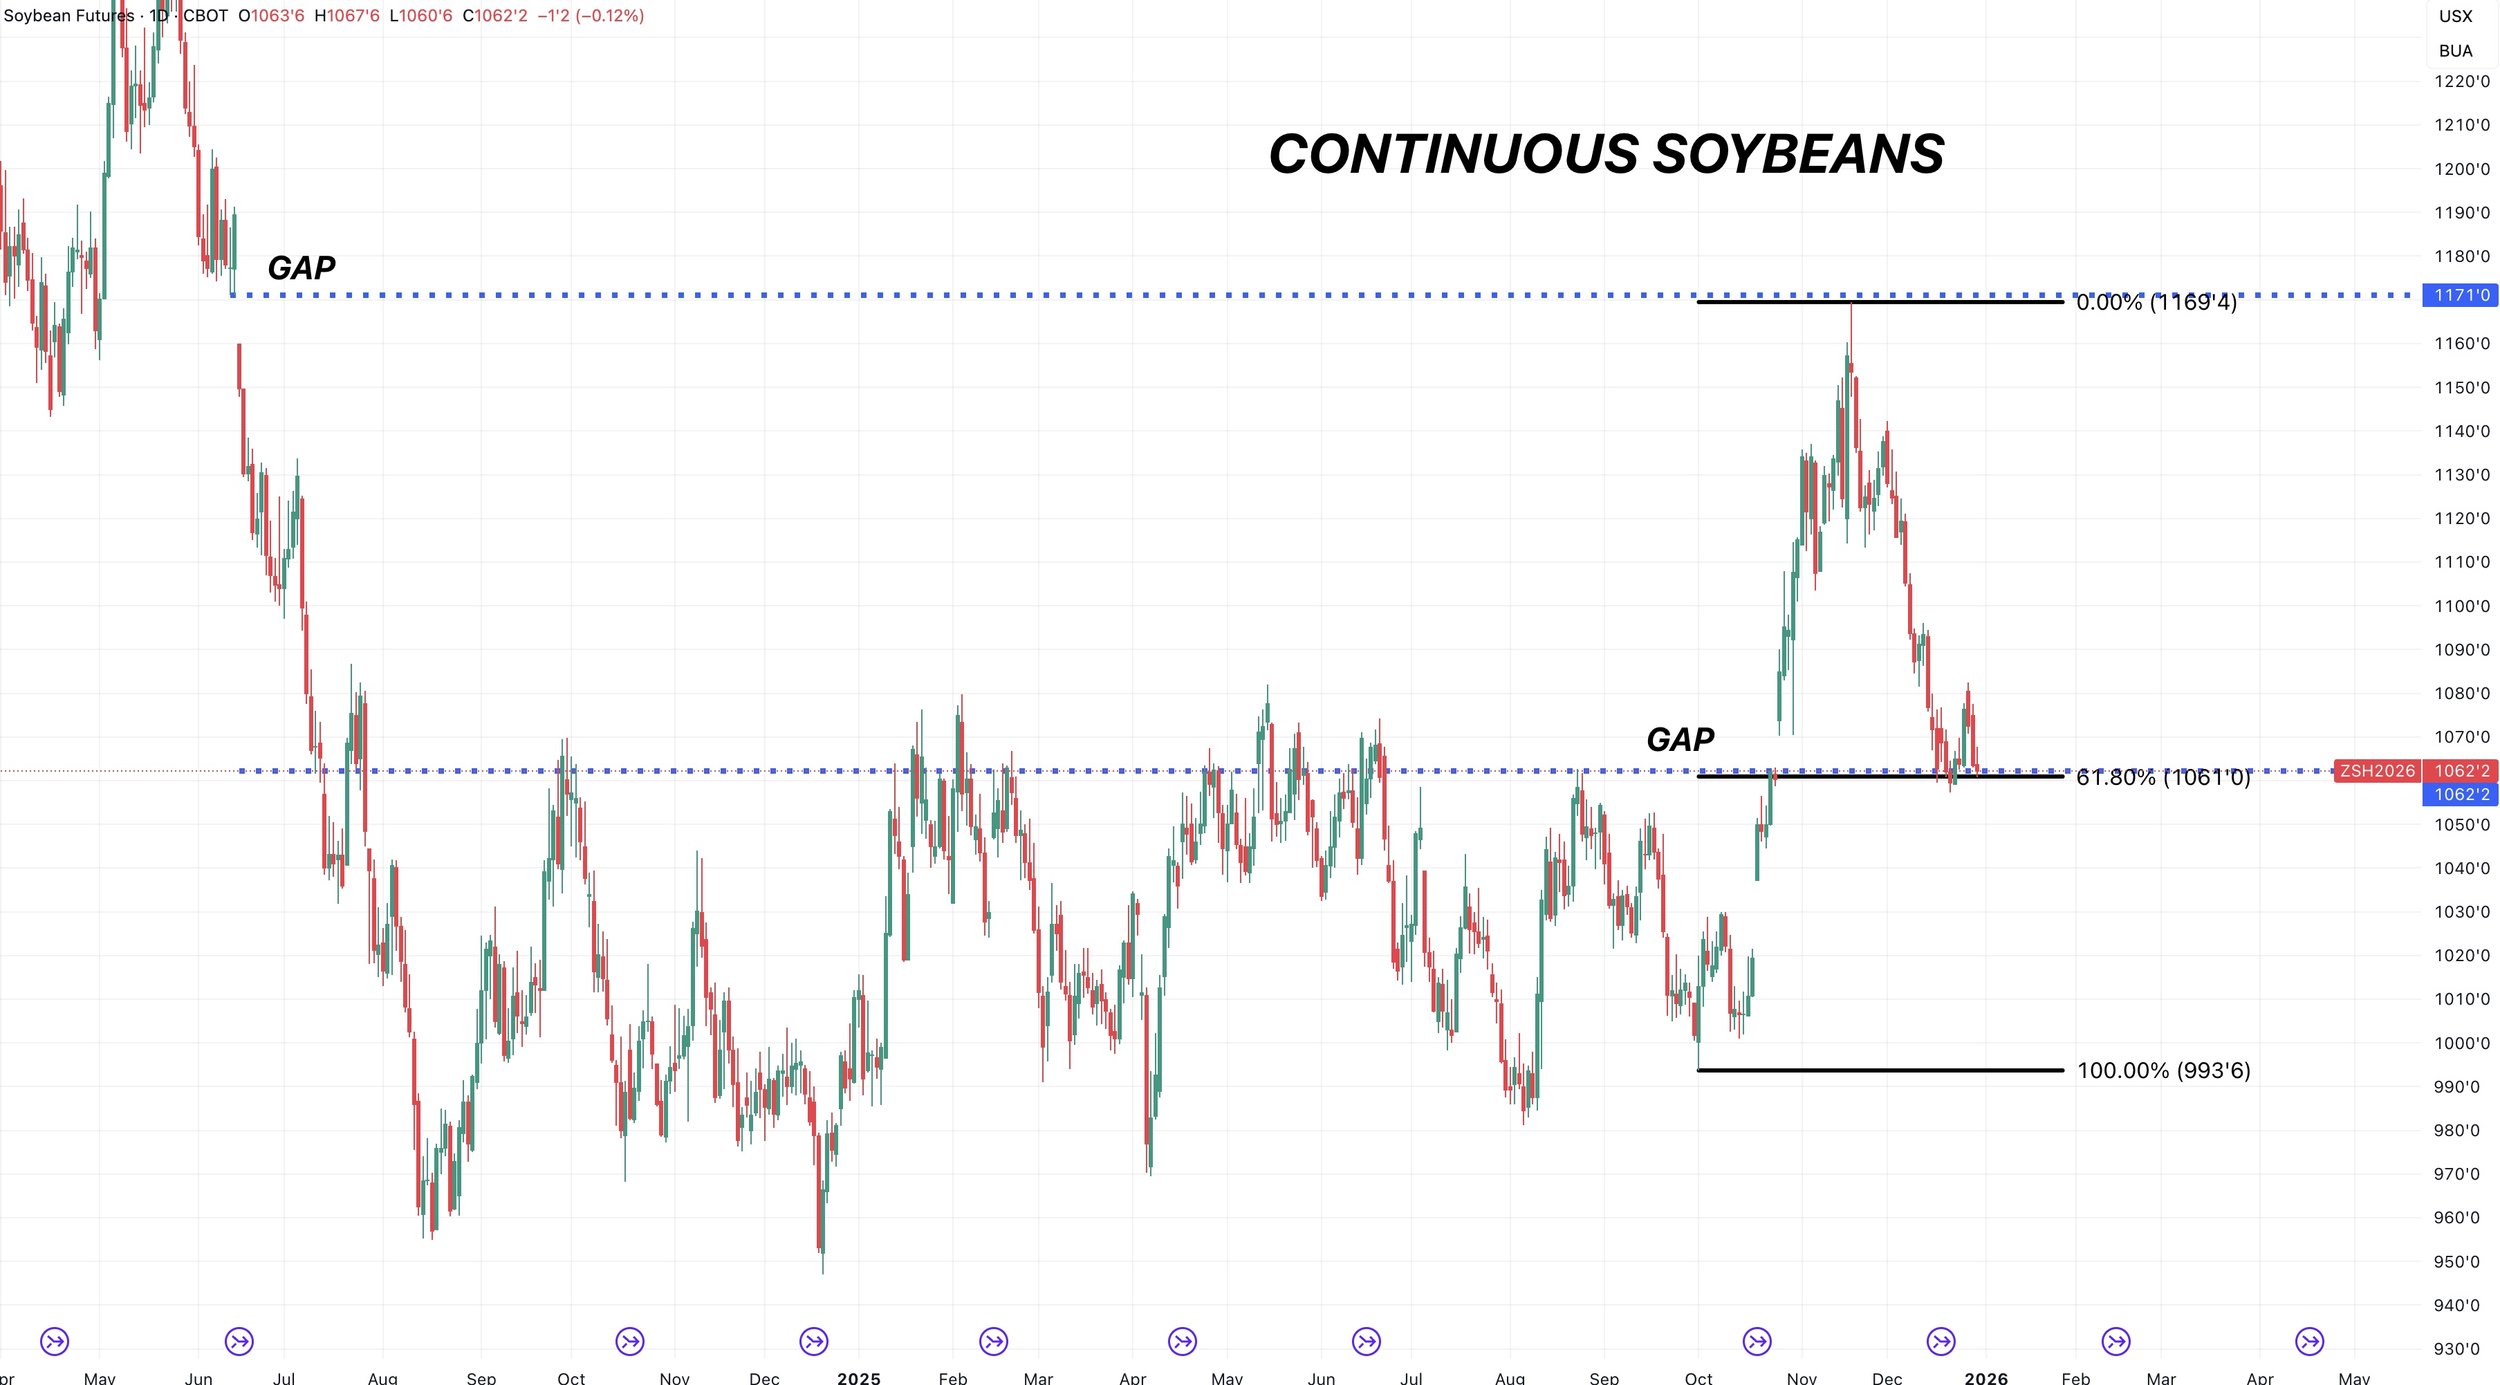
Continuous Chart
Here is the continuous chart.
At the highs, we had a gap left unfilled from 2024.
We almost perfectly filled the gap before going lower.
Now to the downside, we had a gap left open. Which we filled last week.
At the same time, this level gives back 61.8% of the entire rally.
It's also our yearly resistance.
This adds even more reasons to believe this area is a point of interest.
Wheat
Like the rest of the markets, there isn’t much for news.
Wheat demand has been great. Inspections are up over 20% vs last year.
But this market really needs a supply story to get any momentum behind it.
We just don’t have one for now.
Simply remaining patient in wheat for now. Waiting for that rally that only comes a few times a year that typically doesn’t last long.
Technicals:
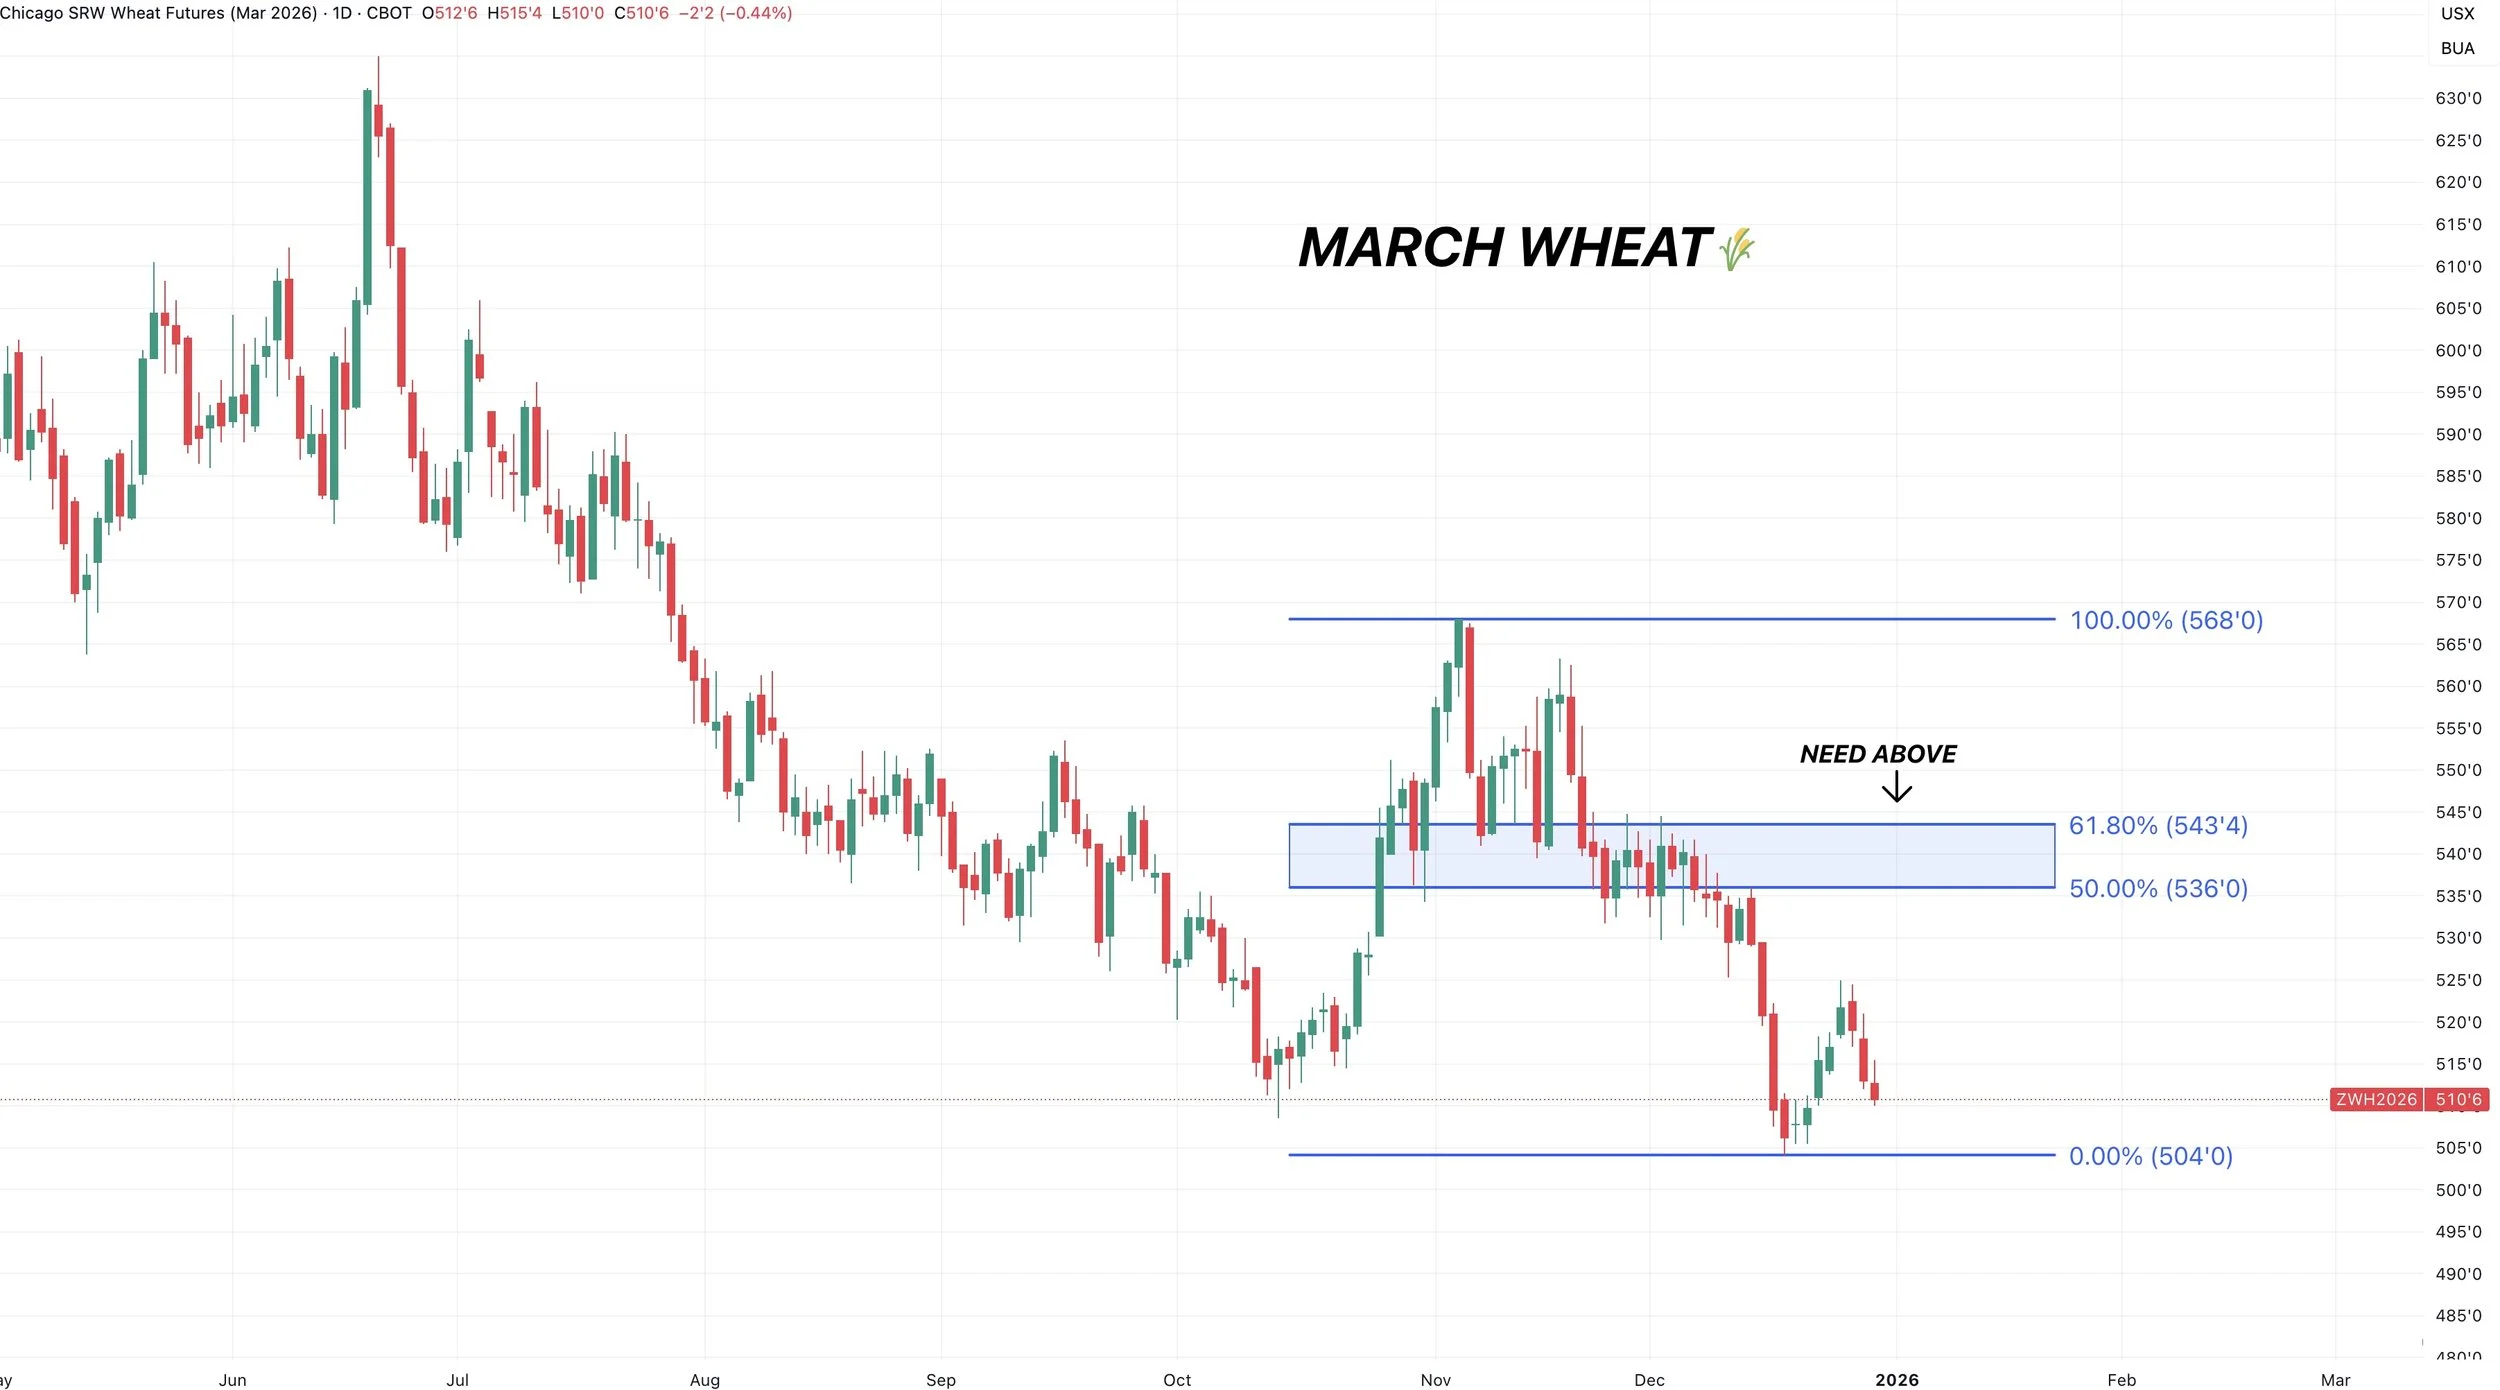
March Wheat
Nothing to update here.
Trying to call a bottom would be like trying to catch a falling knife. As I haven’t seen anything definitive that's made me believe we've put in a bottom yet.
Ultimately we need above the blue box to be confident this market is ready for a real move higher.
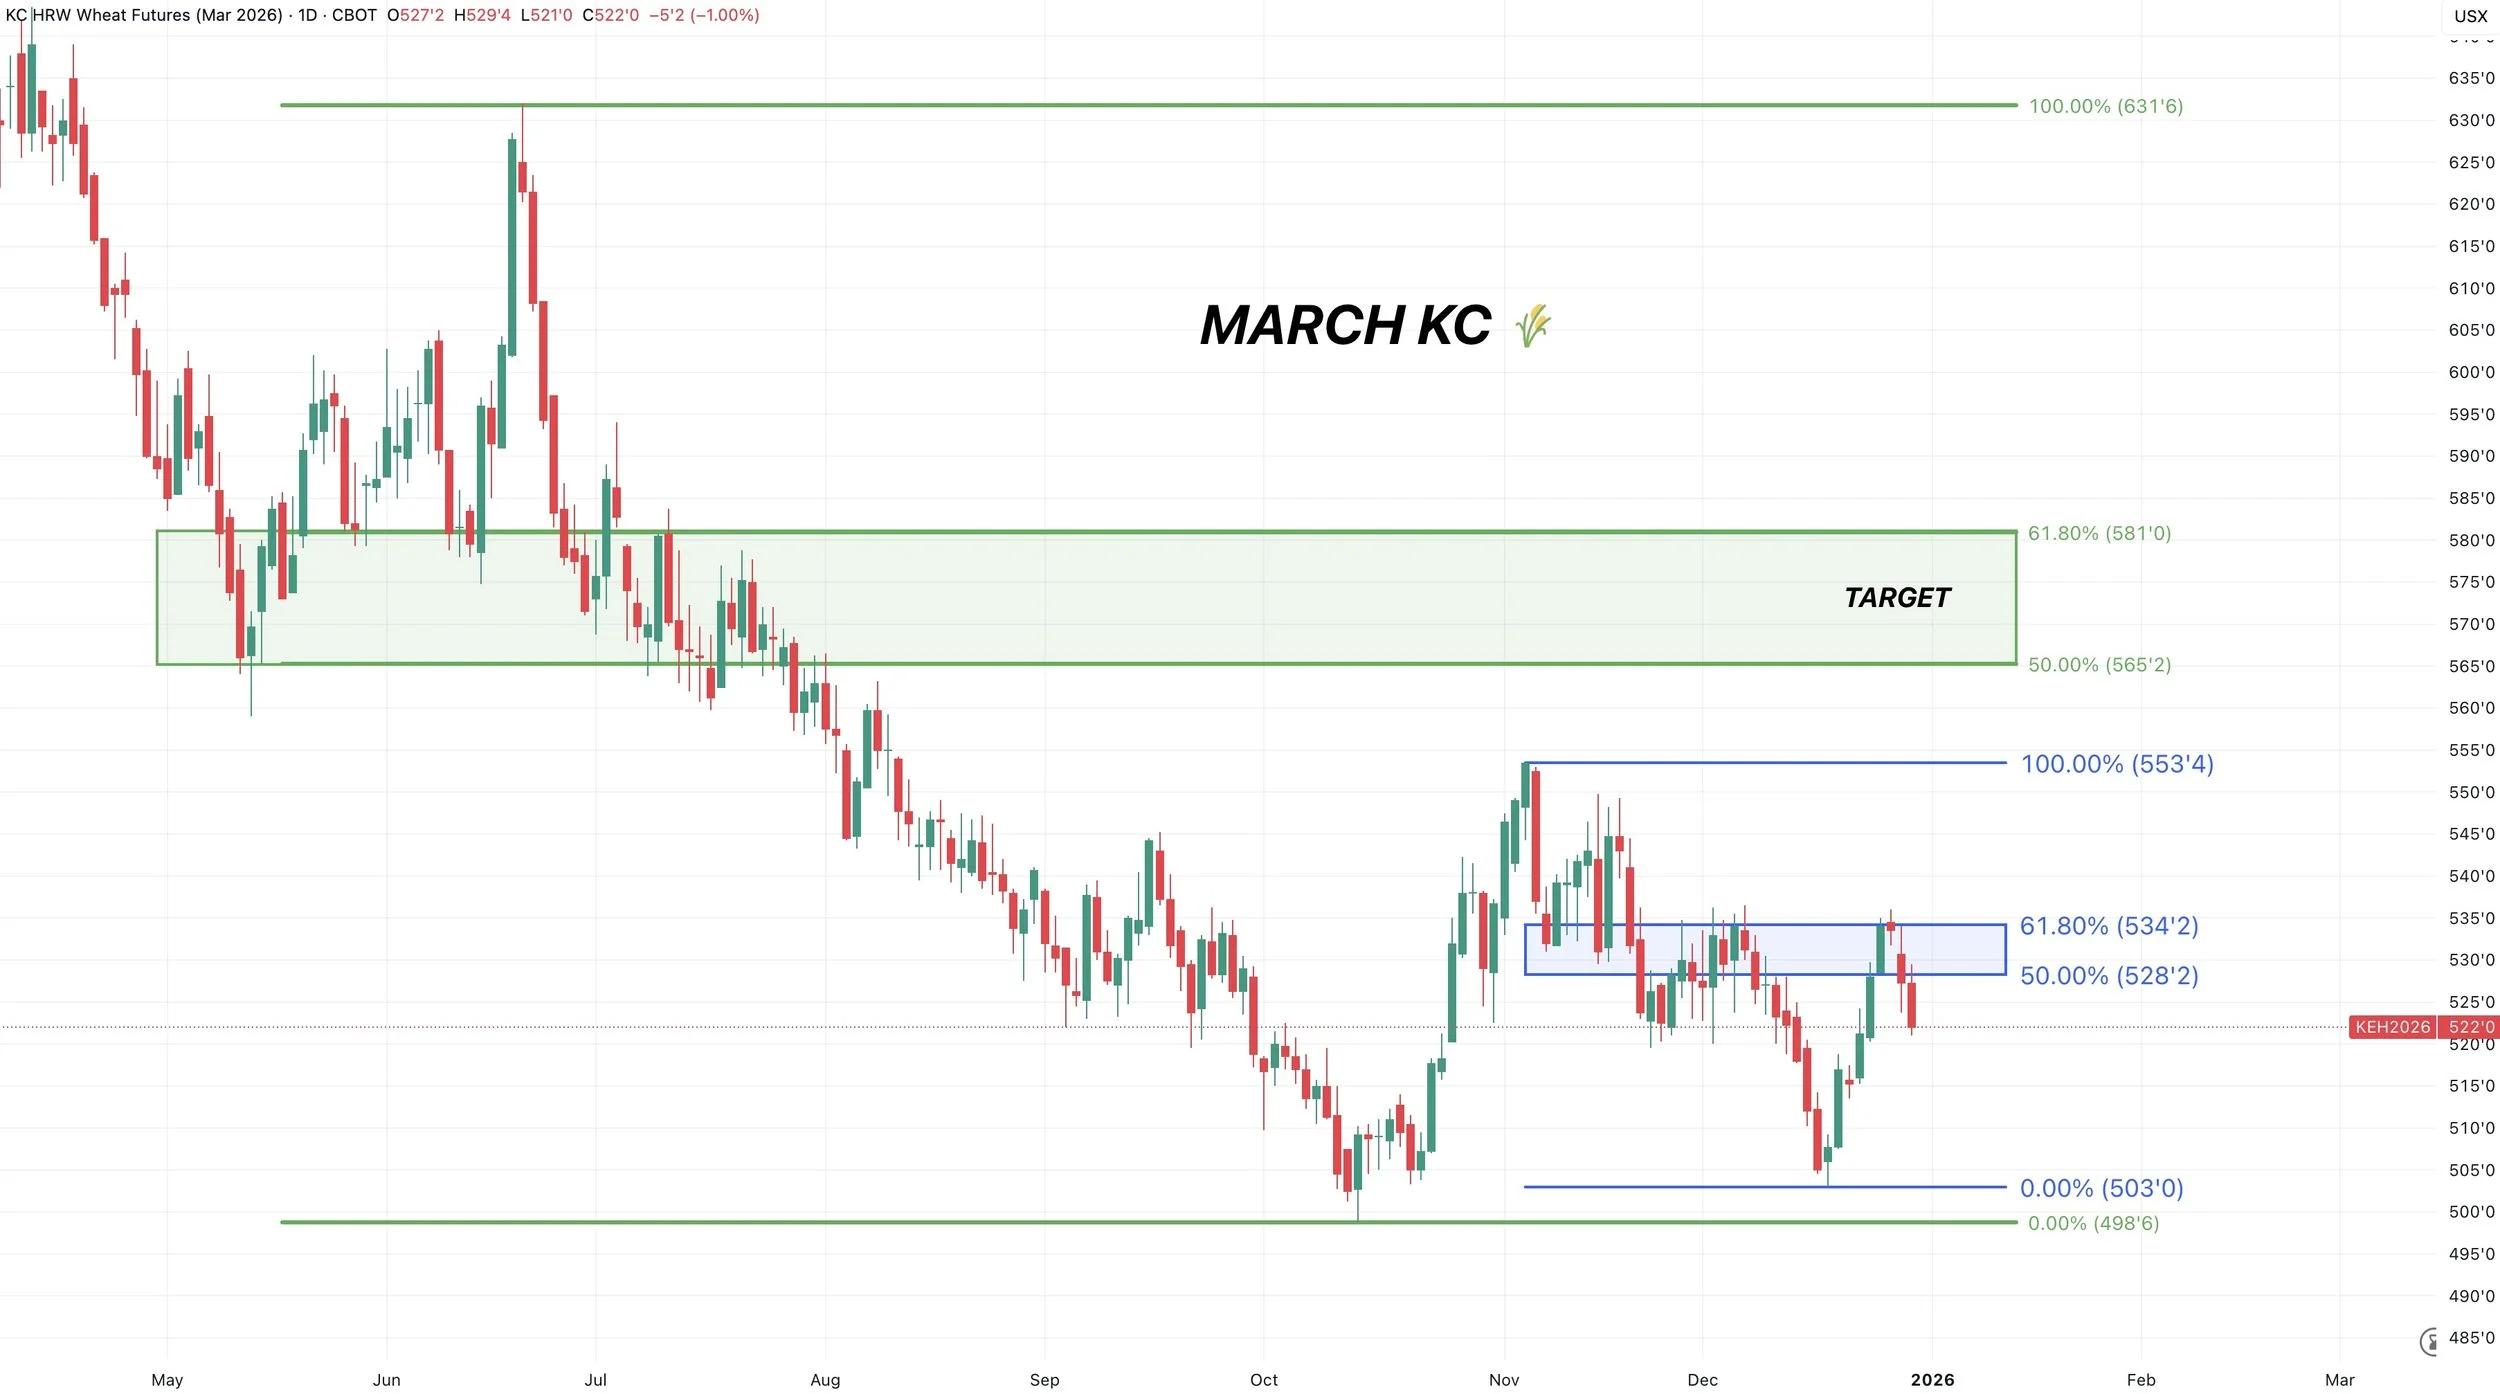
March KC Wheat
KC looks a lot better than Chicago.
We perfectly rejected that golden fib, as we clawed back 61.8% of this sell off.
That is the level we need to break above to be confident this market is going to catch a bid higher.
Like we always talk about, that level is where the market typically decides if this is simply a relief bounce or something bigger.
Cattle
Nothing new in cattle.
Fundamentally, the cattle situation is clearly still tight.
The biggest risk in cattle has to be the government.
I think the government probably keeps big money and the funds from wanting to get too long in this market, because they know a headline could pop out at any moment.
Then we have the Mexican border which could re-open early next year.
Feeder cattle did post a new high today, but live cattle has been trapped in a brutal sideways range.
We still like keeping some downside protection up at these levels.
Technicals:
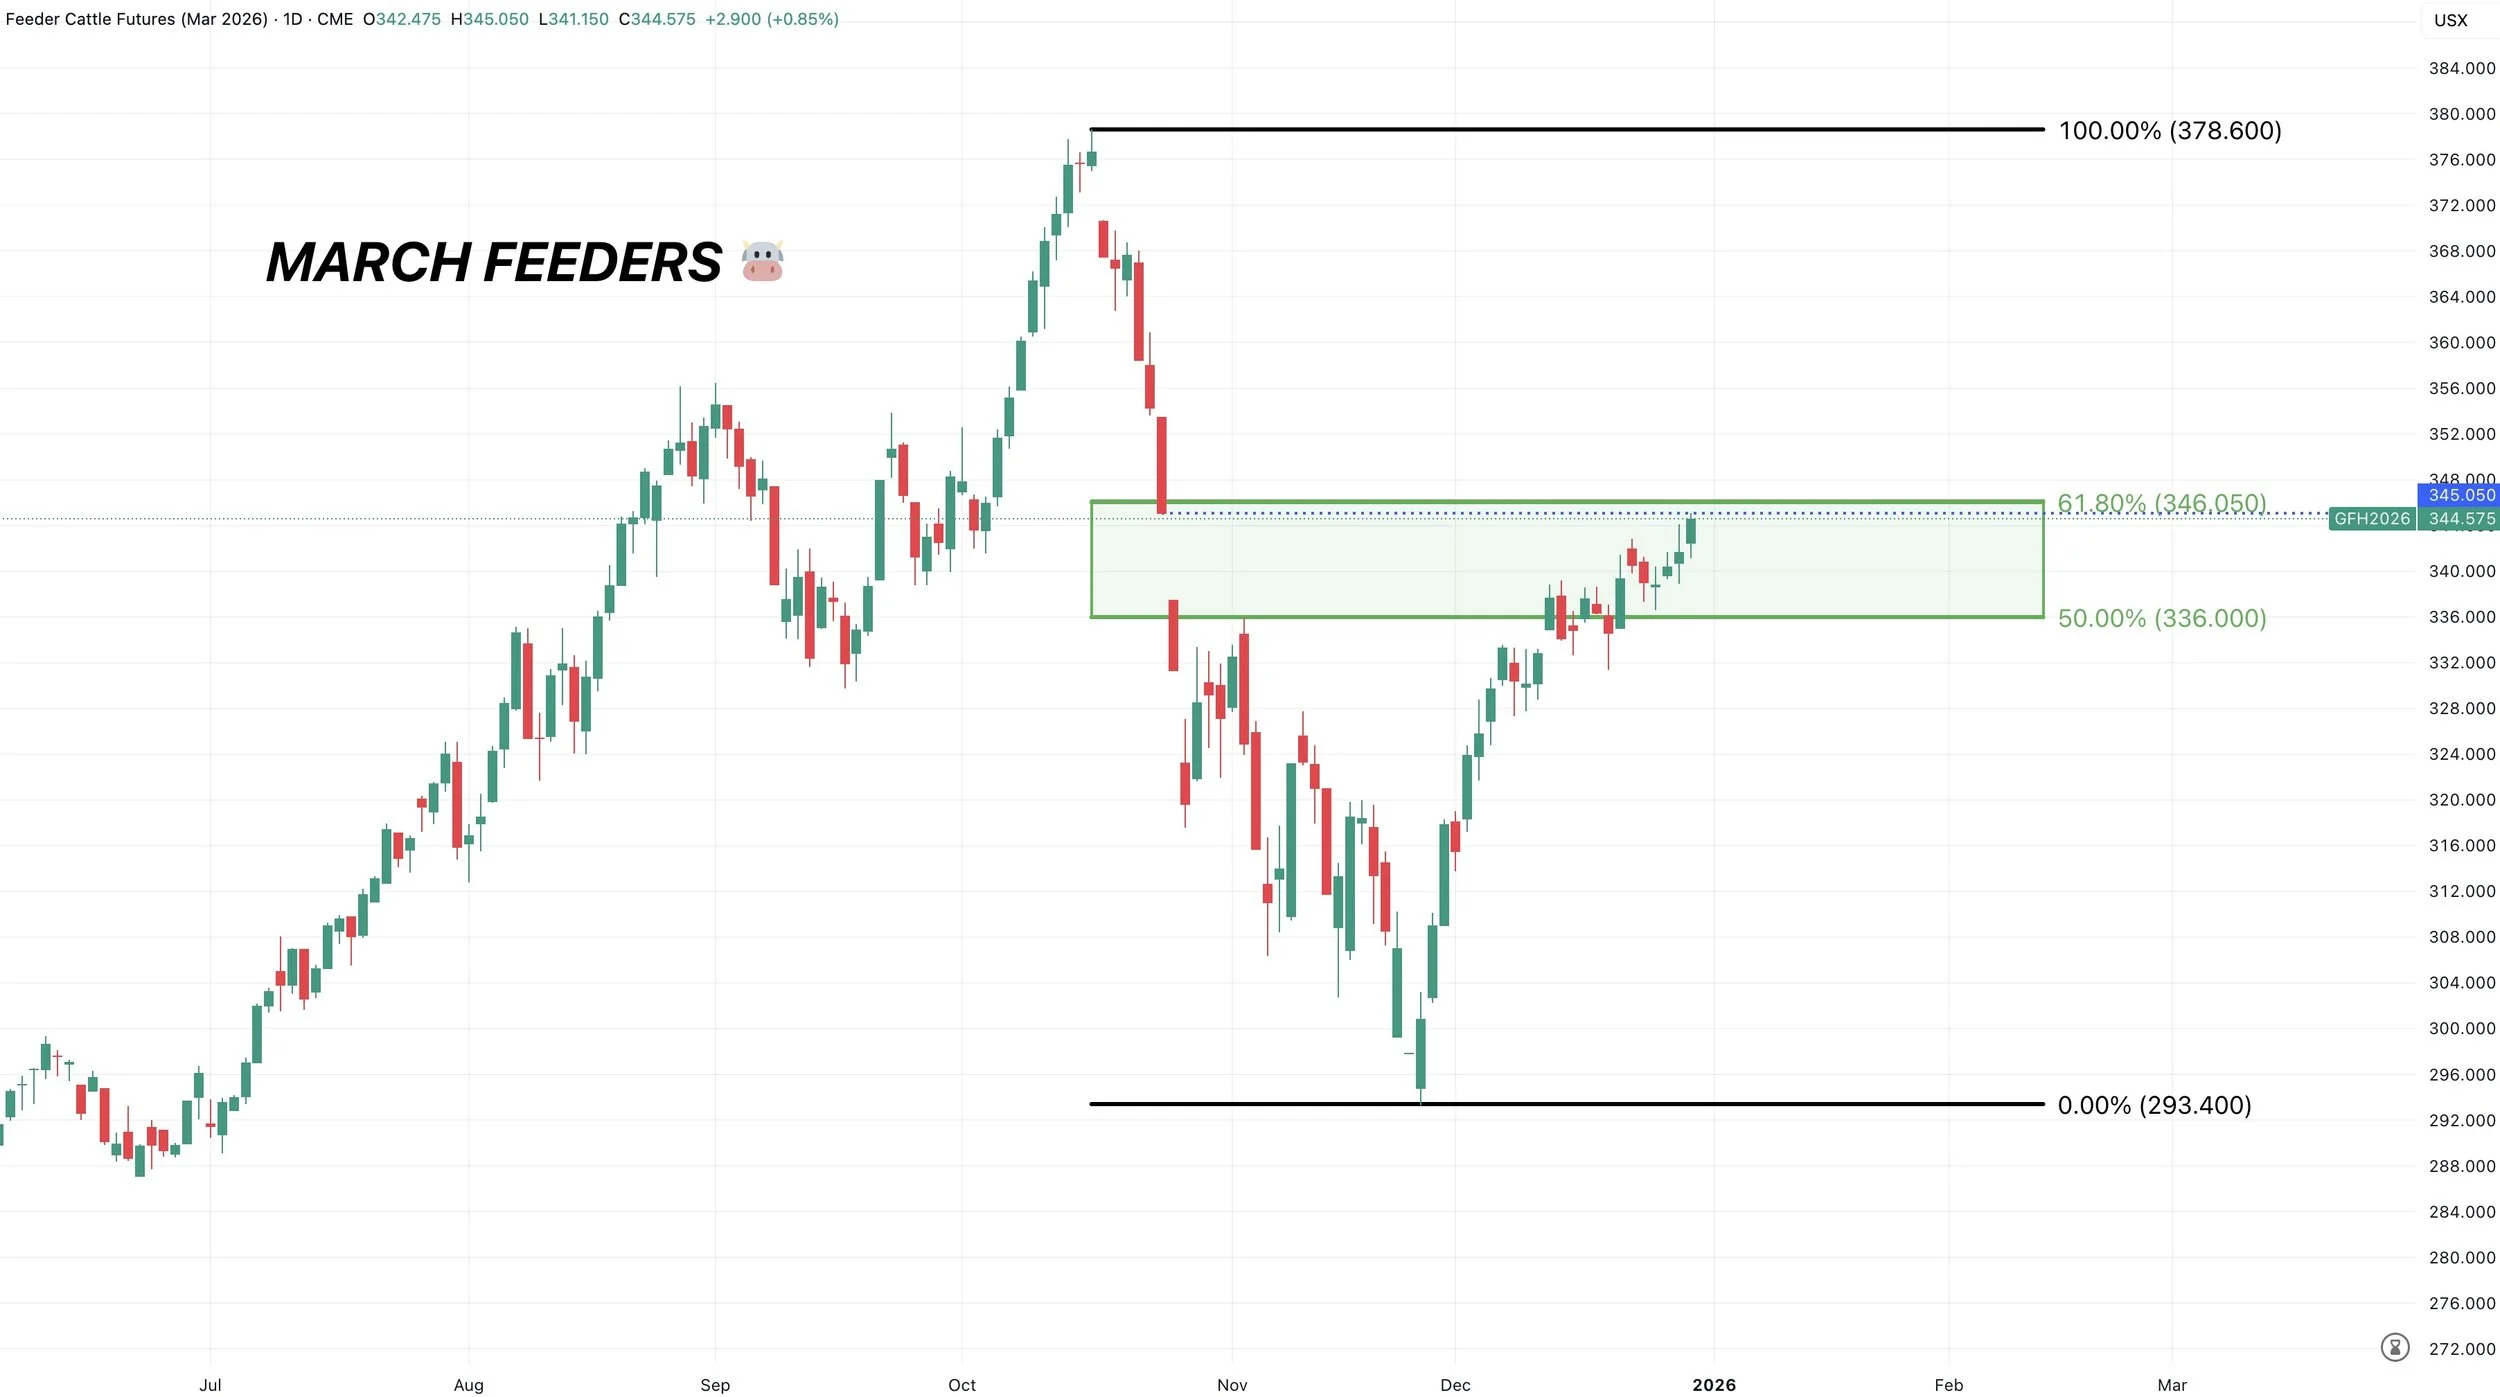
March Feeders
March feeders did offically fill that gap we left back in October.
This level almost perfectly lines up with reclaiming 61.8% of the entire sell off.
Both of these are big points of interest.
So if you haven’t yet, we still like defending this level.
As this is still where most relief bounces can tend to fail.
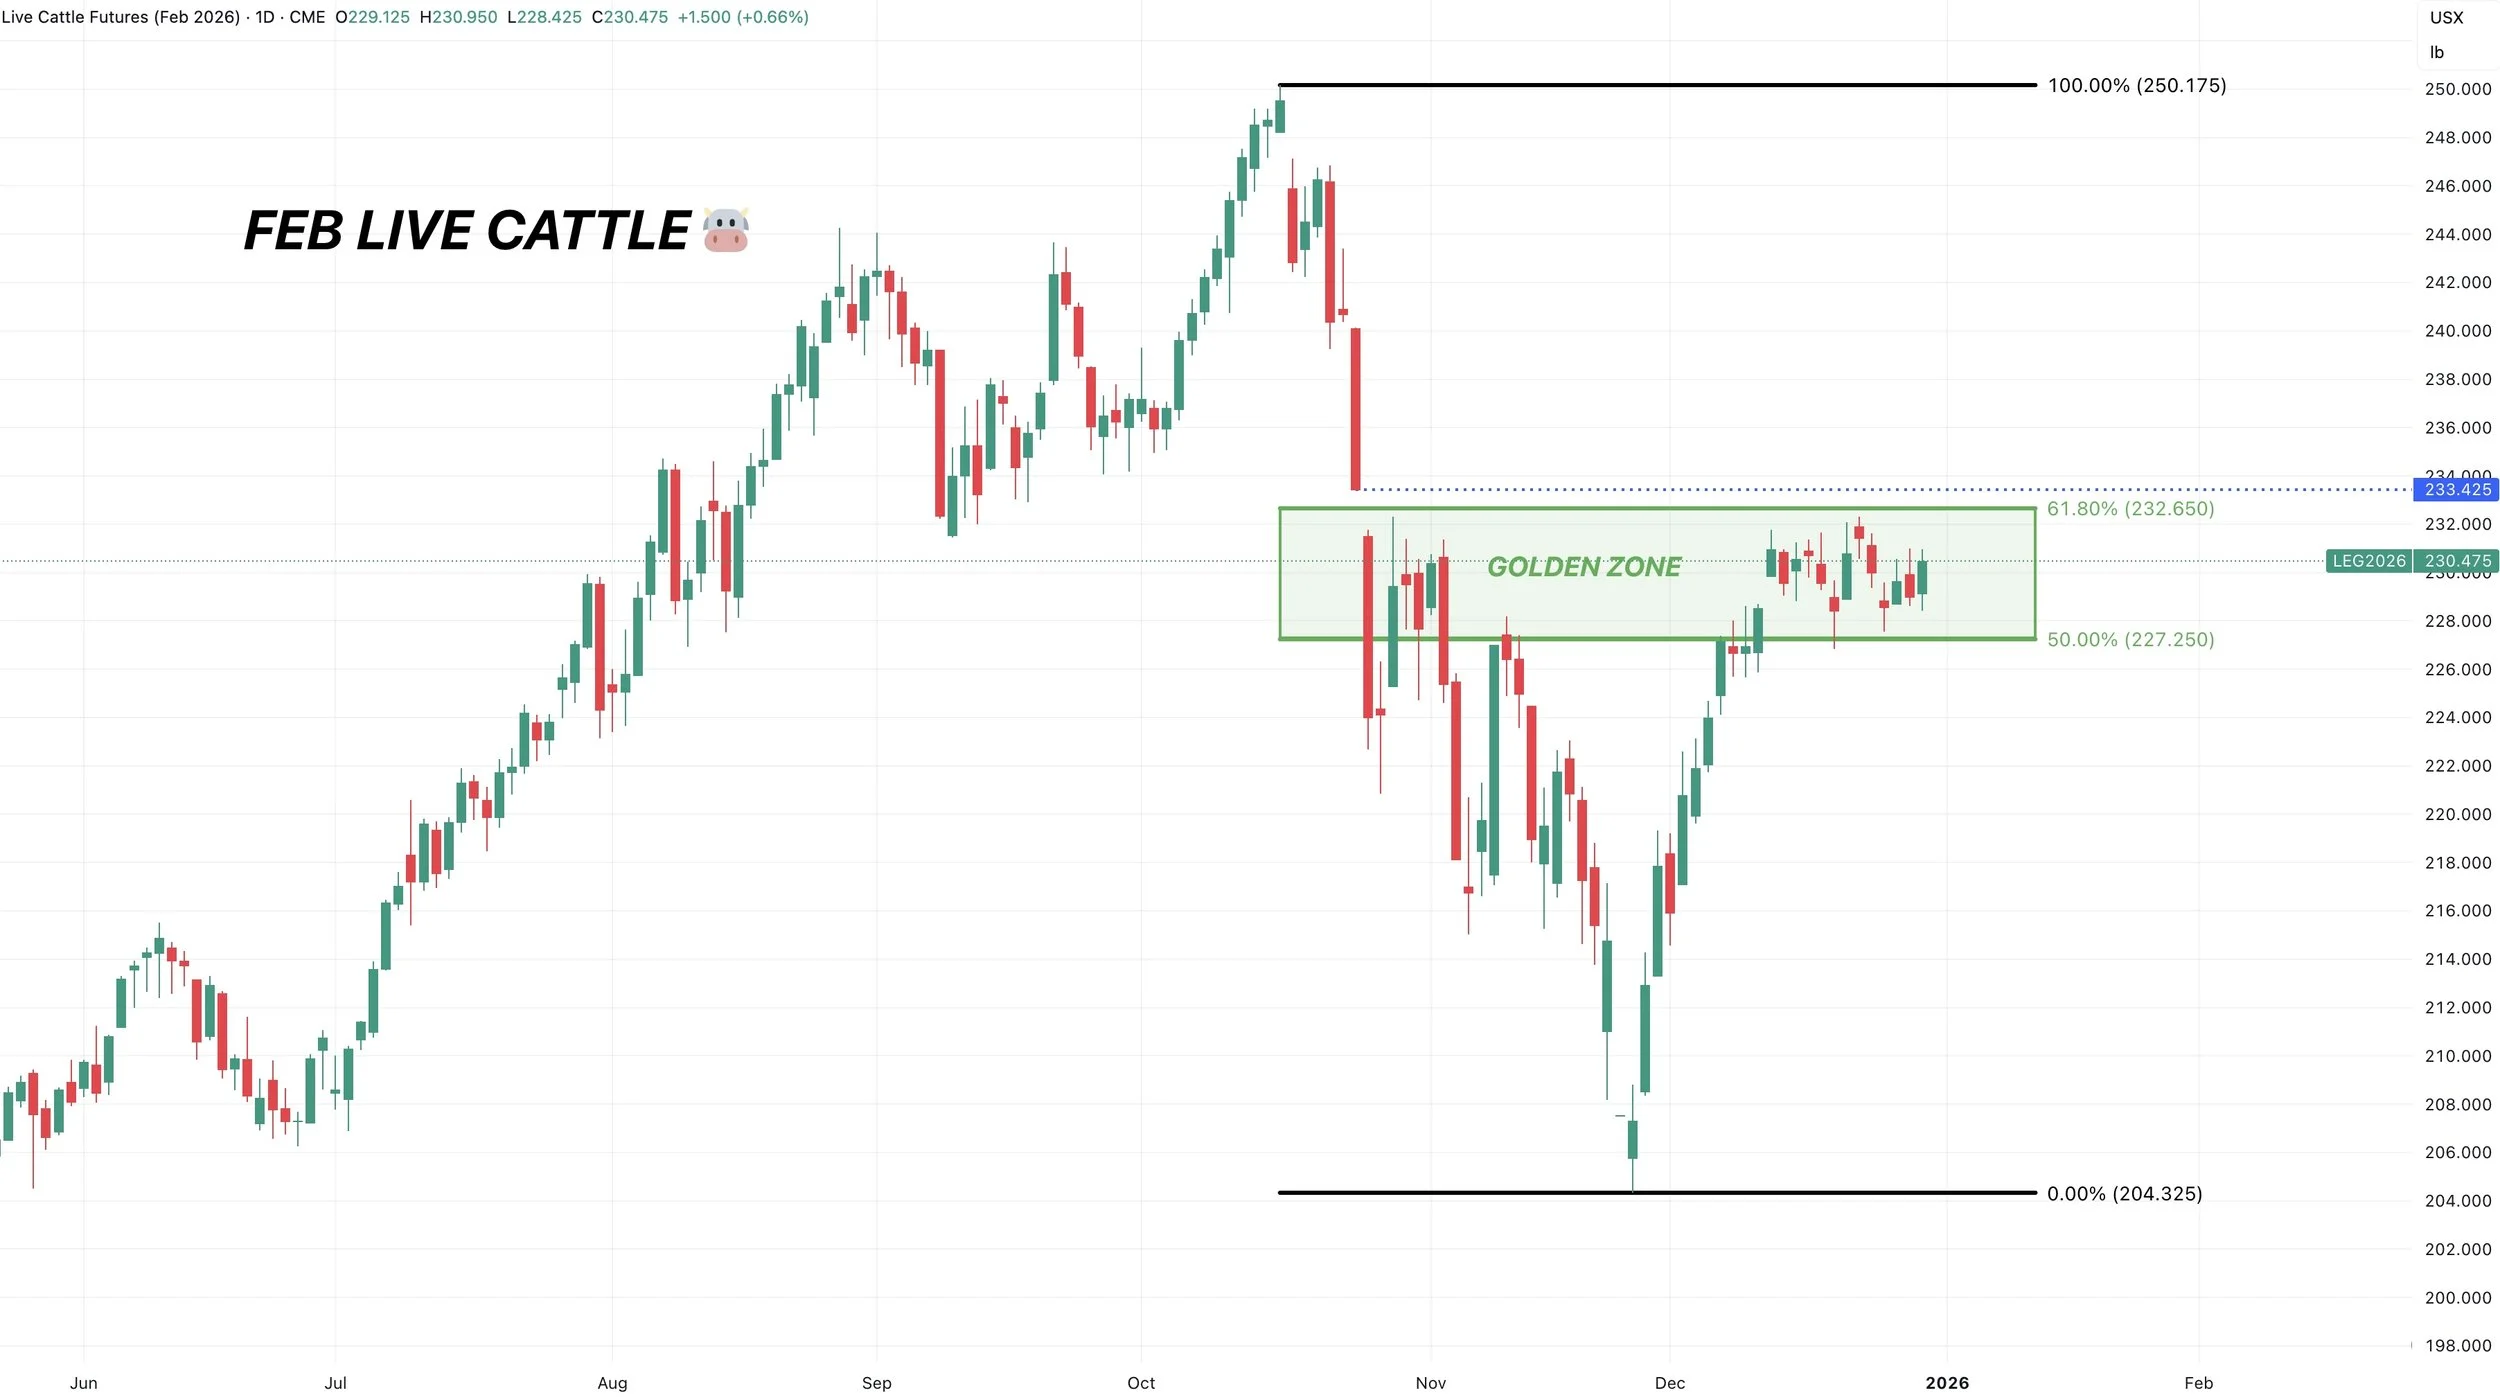
Feb Live
Completely sideways.
Consolidating right in the golden zone.
Same story as feeders. This is where relief bounces can often fail.
We still like defending here.
Past Sell or Protection Signals
Dec 11th: 🐮
Cattle sell signal & hedge alert.
Dec 5th: 🐮
Cattle sell signal & hedge alert.
Nov 17th: 🌱
Soybean sell signal & hedge alert.
Nov 13th: 🌽 🌱
Managing risk in corn & beans ahead of USDA report.
Oct 28th: 🌽
Corn sell signal & hedge alert.
Oct 27th: 🌱
Soybean sell signal & hedge alert.
Oct 13th: 🐮
Cattle sell signal & hedge alert.
Aug 22nd: 🌱
Soybean sell signal & hedge alert.
July 31st: 🐮
Cattle sell signal & hedge alert.
July 10th: 🐮
Cattle sell signal & hedge alert.
CLICK HERE TO VIEW
June 5th: 🐮
Cattle sell signal & hedge alert.
June 2nd: 🌾
MPLS wheat sell signal.
April 10th: 🌽
Old crop corn sell signal.
March 19th: 🐮
Cattle hedge & sell signal.
Feb 18th: 🌽 🌾
Old crop KC wheat & old crop corn signal.
Jan 23rd: 🌽 🌱
Corn & beans old crop sell signal.
CLICK HERE TO VIEW
Jan 15th: 🌽 🌱
Corn & beans hedge alert/sell signal.
Jan 2nd: 🐮
Cattle hedge alert at new all-time highs & target.
Dec 11th: 🌽
Corn sell signal at $4.51 200-day MA
CLICK HERE TO VIEW
Oct 2nd: 🌾
Wheat sell signal at $6.12 target
Sep 30th: 🌽
Corn protection signal at $4.23-26
Sep 27th: 🌱
Soybean sell & protection signal at $10.65
Sep 13th: 🌾
Wheat sell signal at $5.98
May 22nd: 🌾
Wheat sell signal when wheat traded +$7.00
Want to Talk?
Our phones are open 24/7 for you guys if you ever need anything or want to discuss your operation.
Hedge Account
Interested in a hedge account? Use the link below to set up an account or shoot Jeremey a call at (605)295-3100.