
WHAT WOULD IT TAKE TO PAINT BULLISH CORN STORY?
MARKET UPDATE
You can scroll to read the usual update as well. As the written version is the exact same as the video.
Timestamps for video:
Overview: 0:00min
Corn: 3:10min
Beans: 9:30min
Wheat: 12:50min
Cattle: 14:40min
Want to talk about your situation?
(605)250-3863
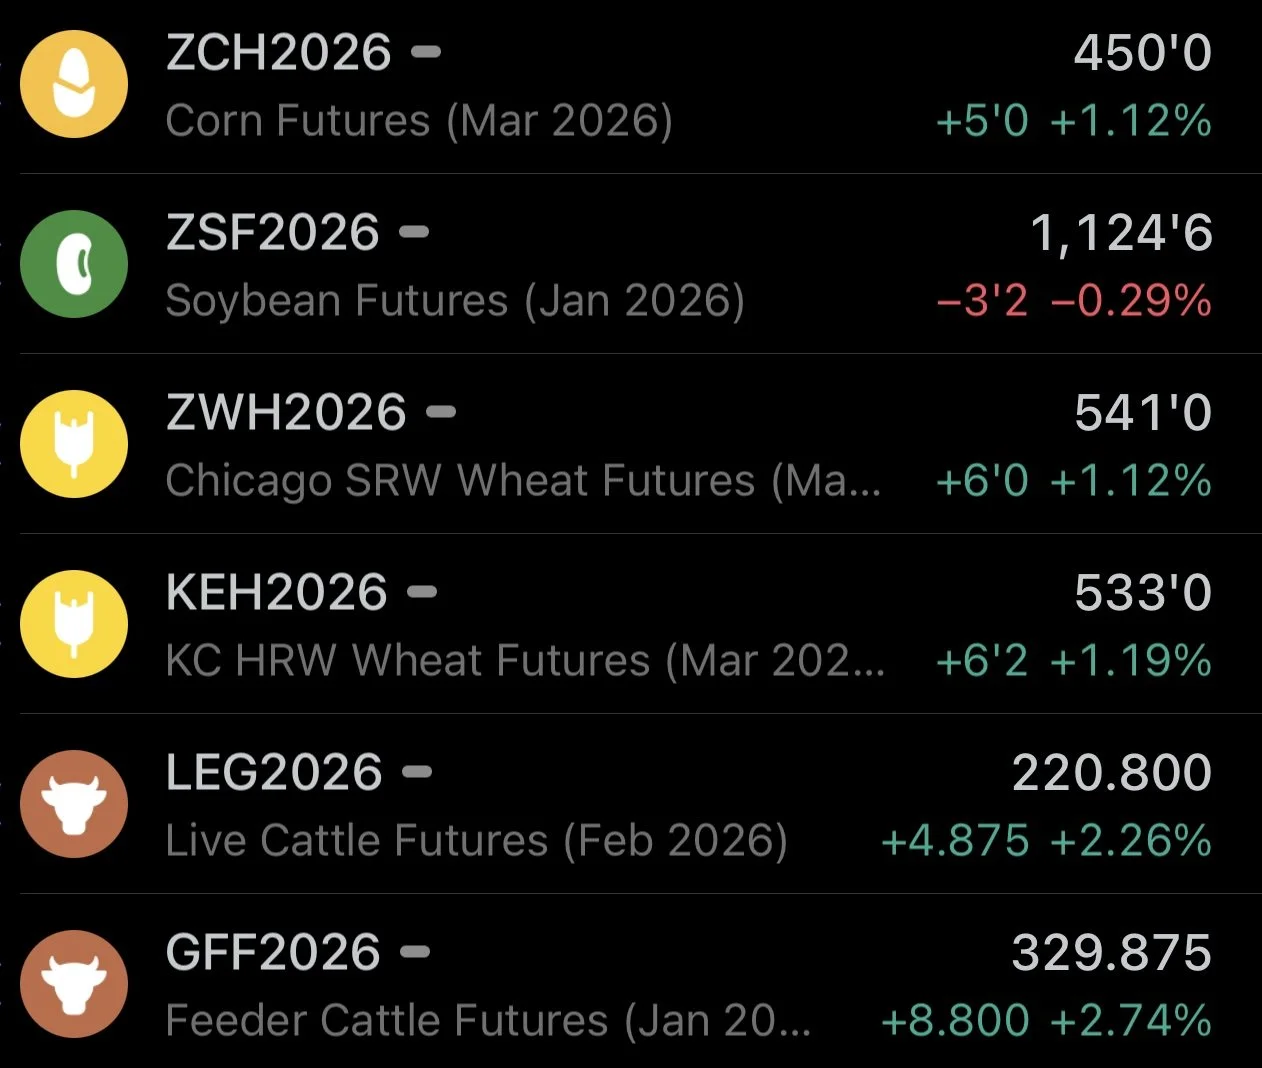
Futures Prices Close
Overview
Grains and cattle mostly higher following the weakness to start the week yesterday.
Today wasn’t a big news day as it was fairly quiet, but we did see some Russia headlines.
Which was part of the reason for the strength in the corn and wheat market today.
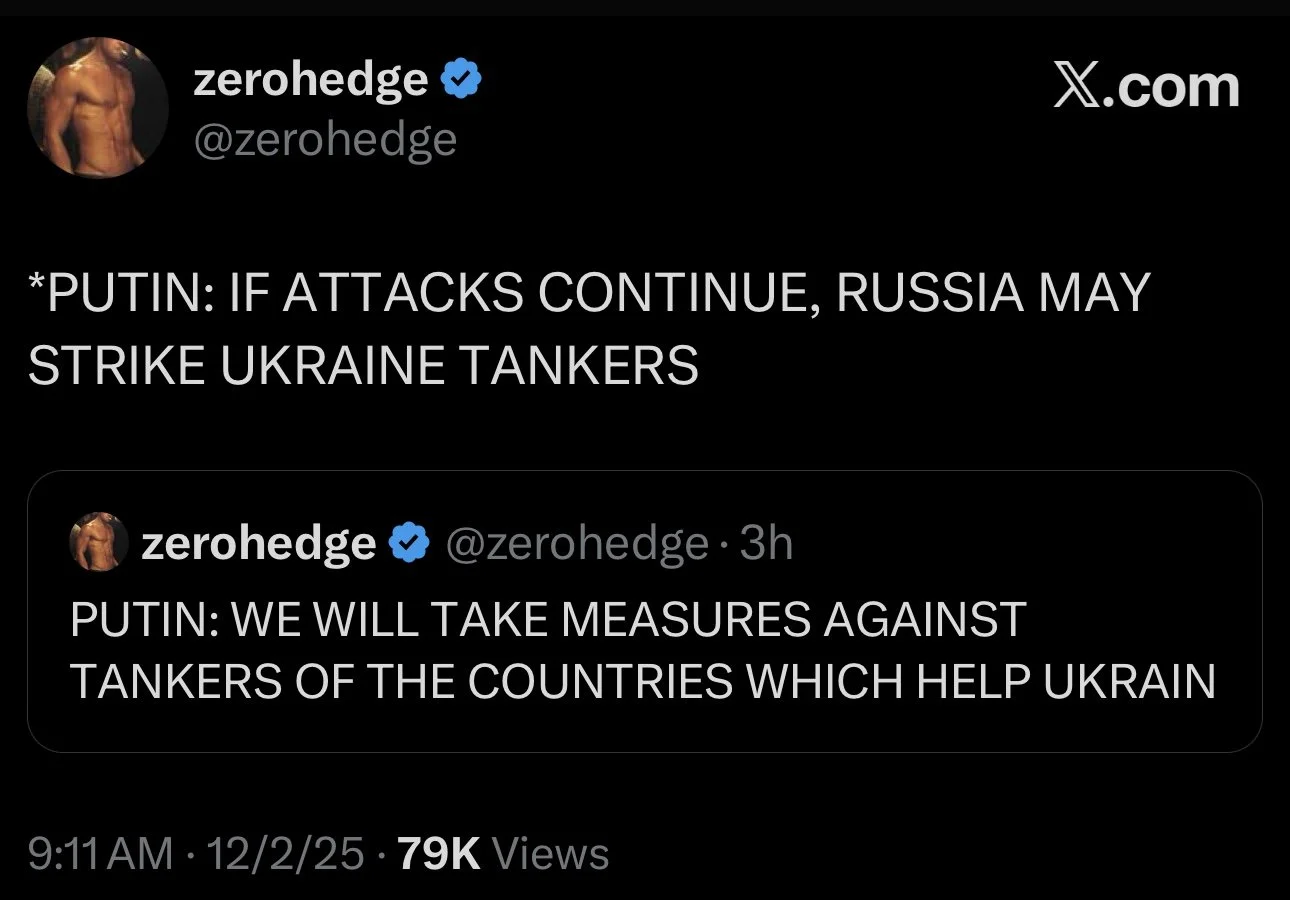
Russia Threats
The corn and wheat market reacted to comments Russia made.
Russia is threatening to attack Ukraine vessels if the attacks on Moscow's tankers continue.
Along with that, he said they would also be attacking any country that helps support Ukraine if the attacks continue.
They are threatening to "cut Ukraine off from the sea". If the attacks on their vessels continue.
So this sparked some buying in corn and wheat today.
We've seen this time and time again.
We get some random headline out of the Black Sea, and everytime for the last few years every single war driven bounce has been sold.
So unless something crazy actually happens, it's probably not some major game changer in the markets.
Trump did say this today:
"I think, hope we're going to end the Russia and Ukraine war".

Of course, if things actually materially escalated, it would support prices.
Russia does have the capability to disrupt things in a big way.
Russia and Ukraine are both top 5 global exporters for both corn and wheat.
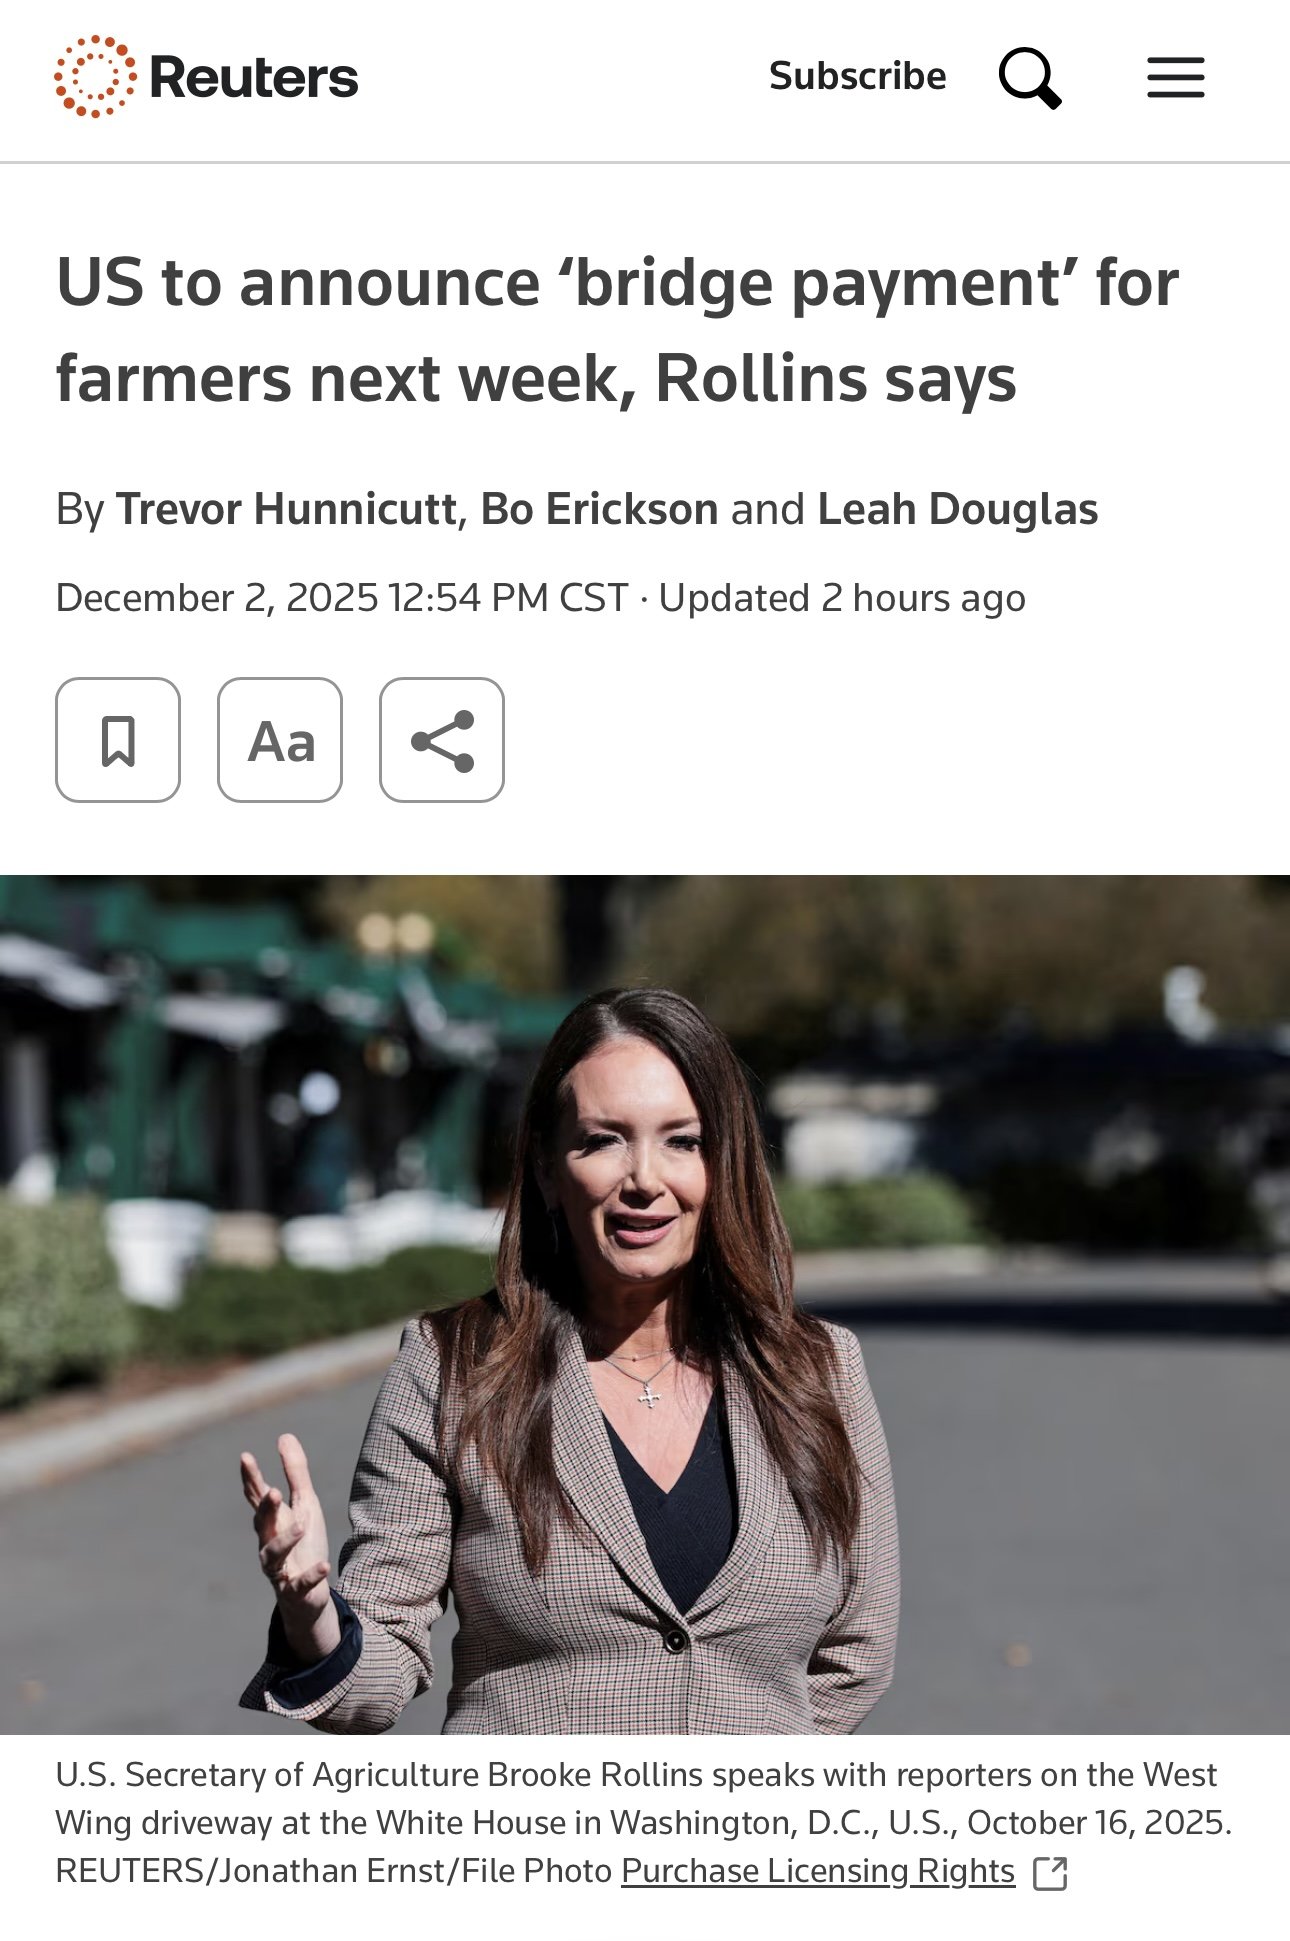
Bridge Payment
Today US Ag Secretary Rollins said that they will be announcing a "bridge payment" for US farmers next week.
They said this is designed to provide short-term relief while the longer aid packages are finalized.
China & Soybeans
Today Trump thanked China's President for the soybean purchases.
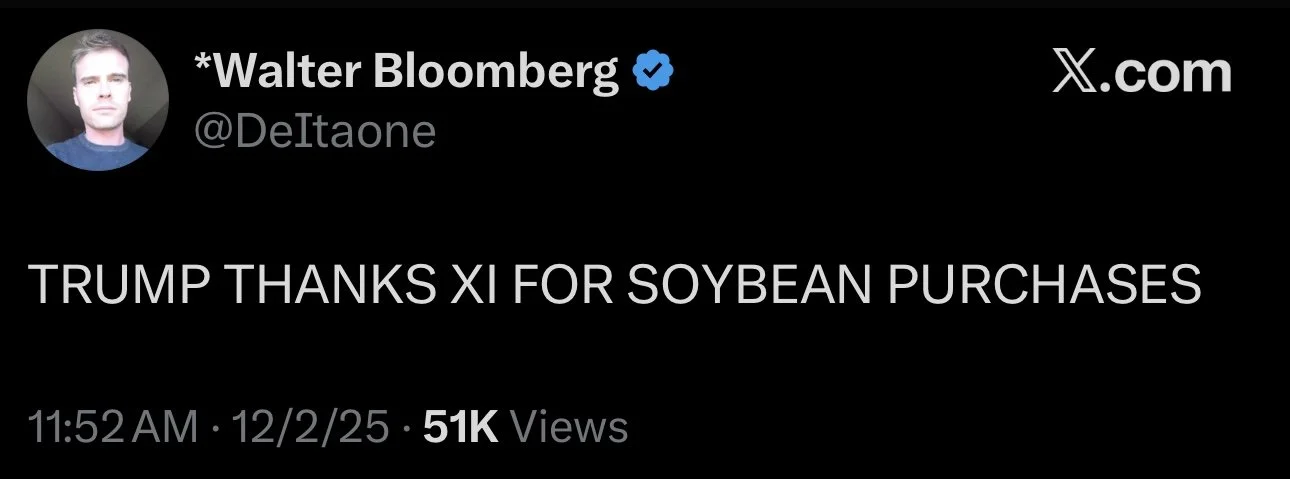
Rollins said we "should" have a deal and the framework between the US and China within the next week or so.
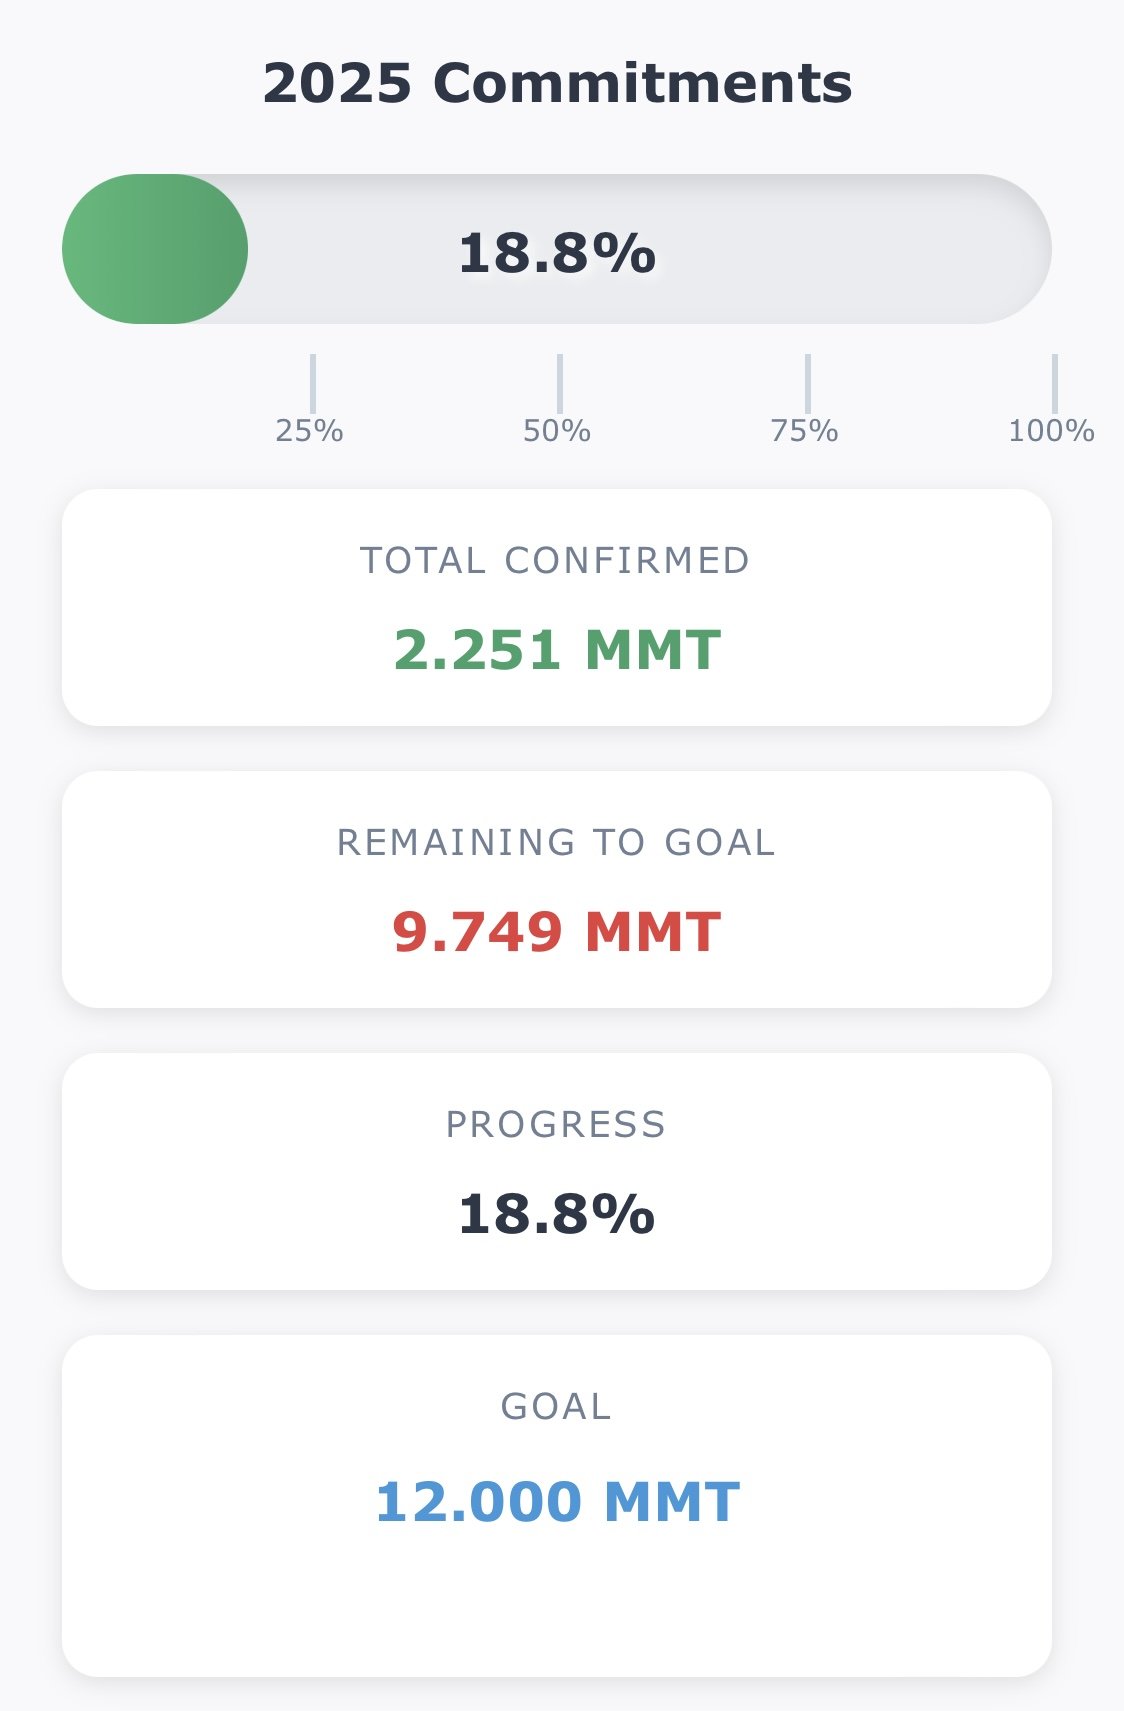
According to Bloomberg, China is still expected to step up and meet that pledge to buy 12 million metric tons by the end of the year.

We haven’t seen a flash sale of soybeans to China since Friday.
We still have not seen any export inspections to China (soybeans actually being shipped).
Currently they have bought about 19% of what they agreed to.
2.25 million of the 12 million tons.
There is only around 21 trading days left in the year.
So that still has traders concerned they won’t be able to meet the number. As if you break down the numbers, it's nearly 500k tons a day to meet it.
Chart from GrainStats
Export Inspections
We are getting the back log of export sales (grain being bought).
They are now caught up to Oct 23rd. So we aren’t even going to go over those.
Corn export inspections continue to shatter records.
Corn inspections are up a massive +71% from last year and +114% vs the 5-year average.
FYI.. last year was a record year.

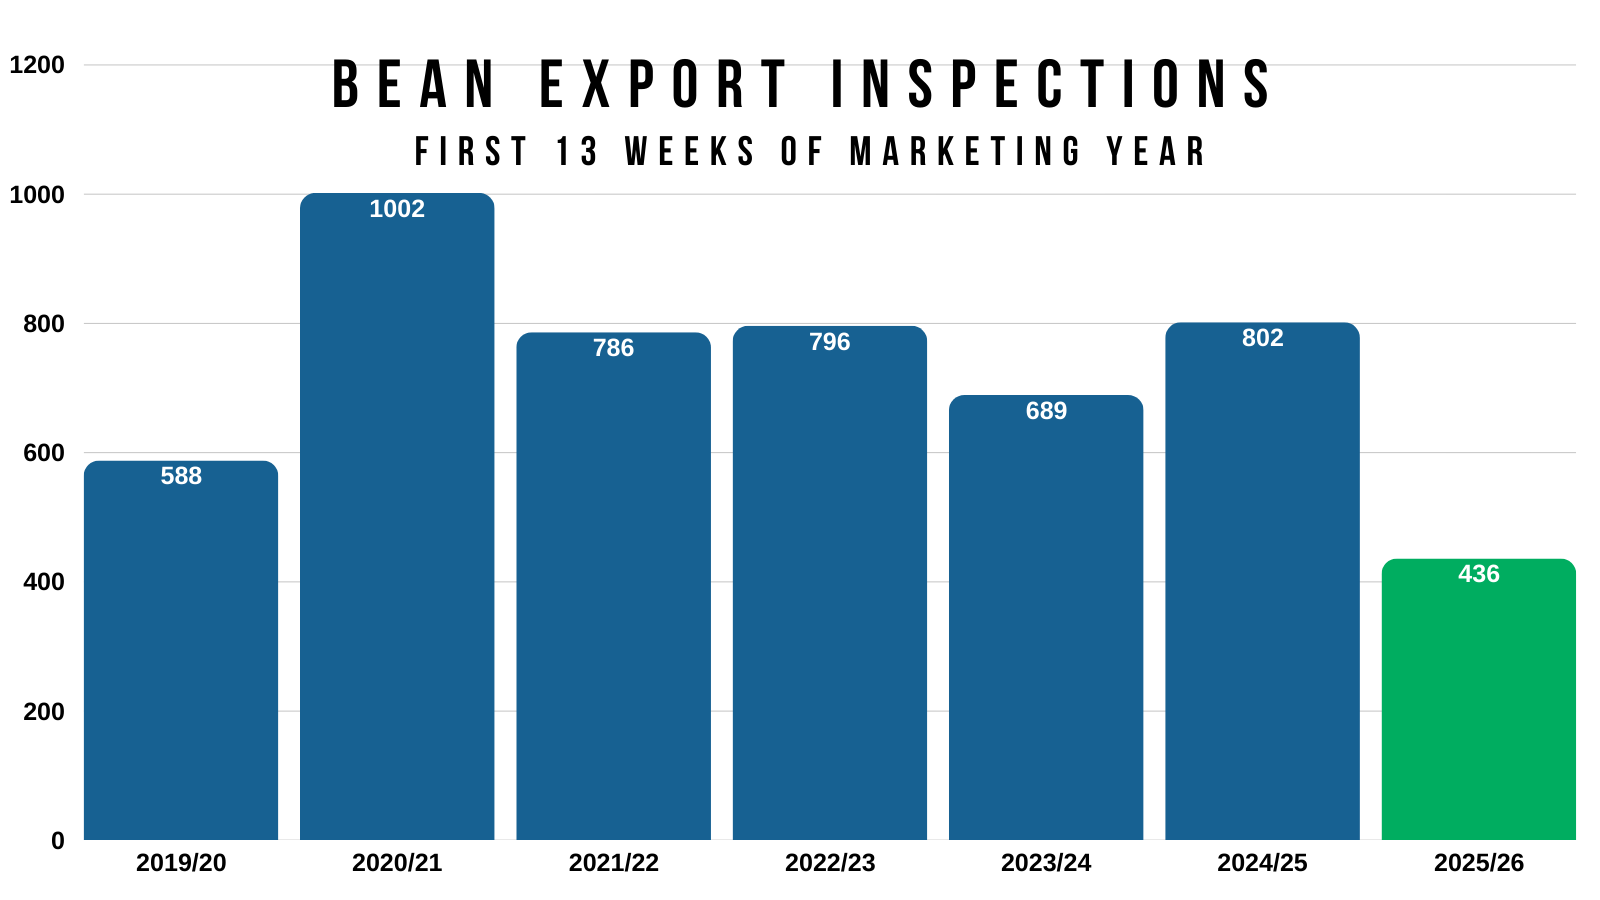
Soybean inspections still stuck.
Down -46% vs last year. Sitting at their lowest levels in 12 years up to this point in the year.
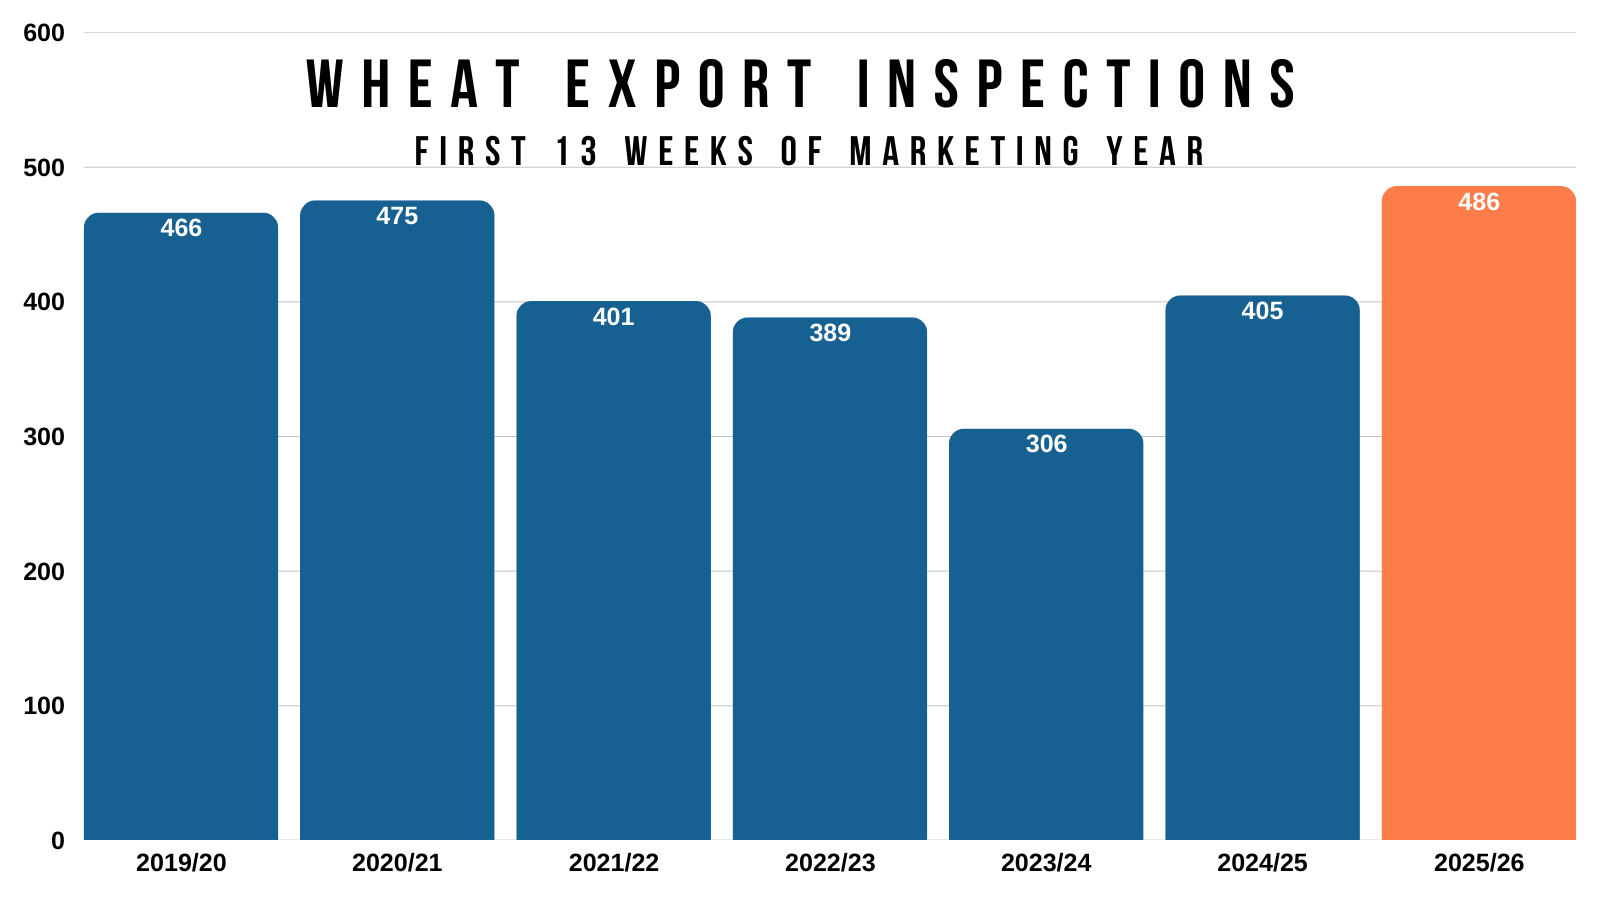
Wheat demand quietly continues to impress.
Still sitting +20% better than last year.
The best numbers we've seen in 11 years.
Today's Main Takeaways
Corn
Fundamentals:
We do have a USDA report on the 9th, which is a week from today.
Normally, the USDA does not change yield in this report. Usually it's a pretty quiet report. However, given that we've just had such a lack of fresh news, this report might catch some additional attention or provide bigger changes than normal.
Today lets just go over what it would take to paint a "bullish" story in the corn market.
I'm talking anything much north of +$5.00
We have a record crop, that should keep a partial lid on us.
Yet we have record demand that should keep a floor under us.
Back in February (last marketing year). March corn traded as high as $5.04.
Up to this point, we have been trading an extremely similar path.
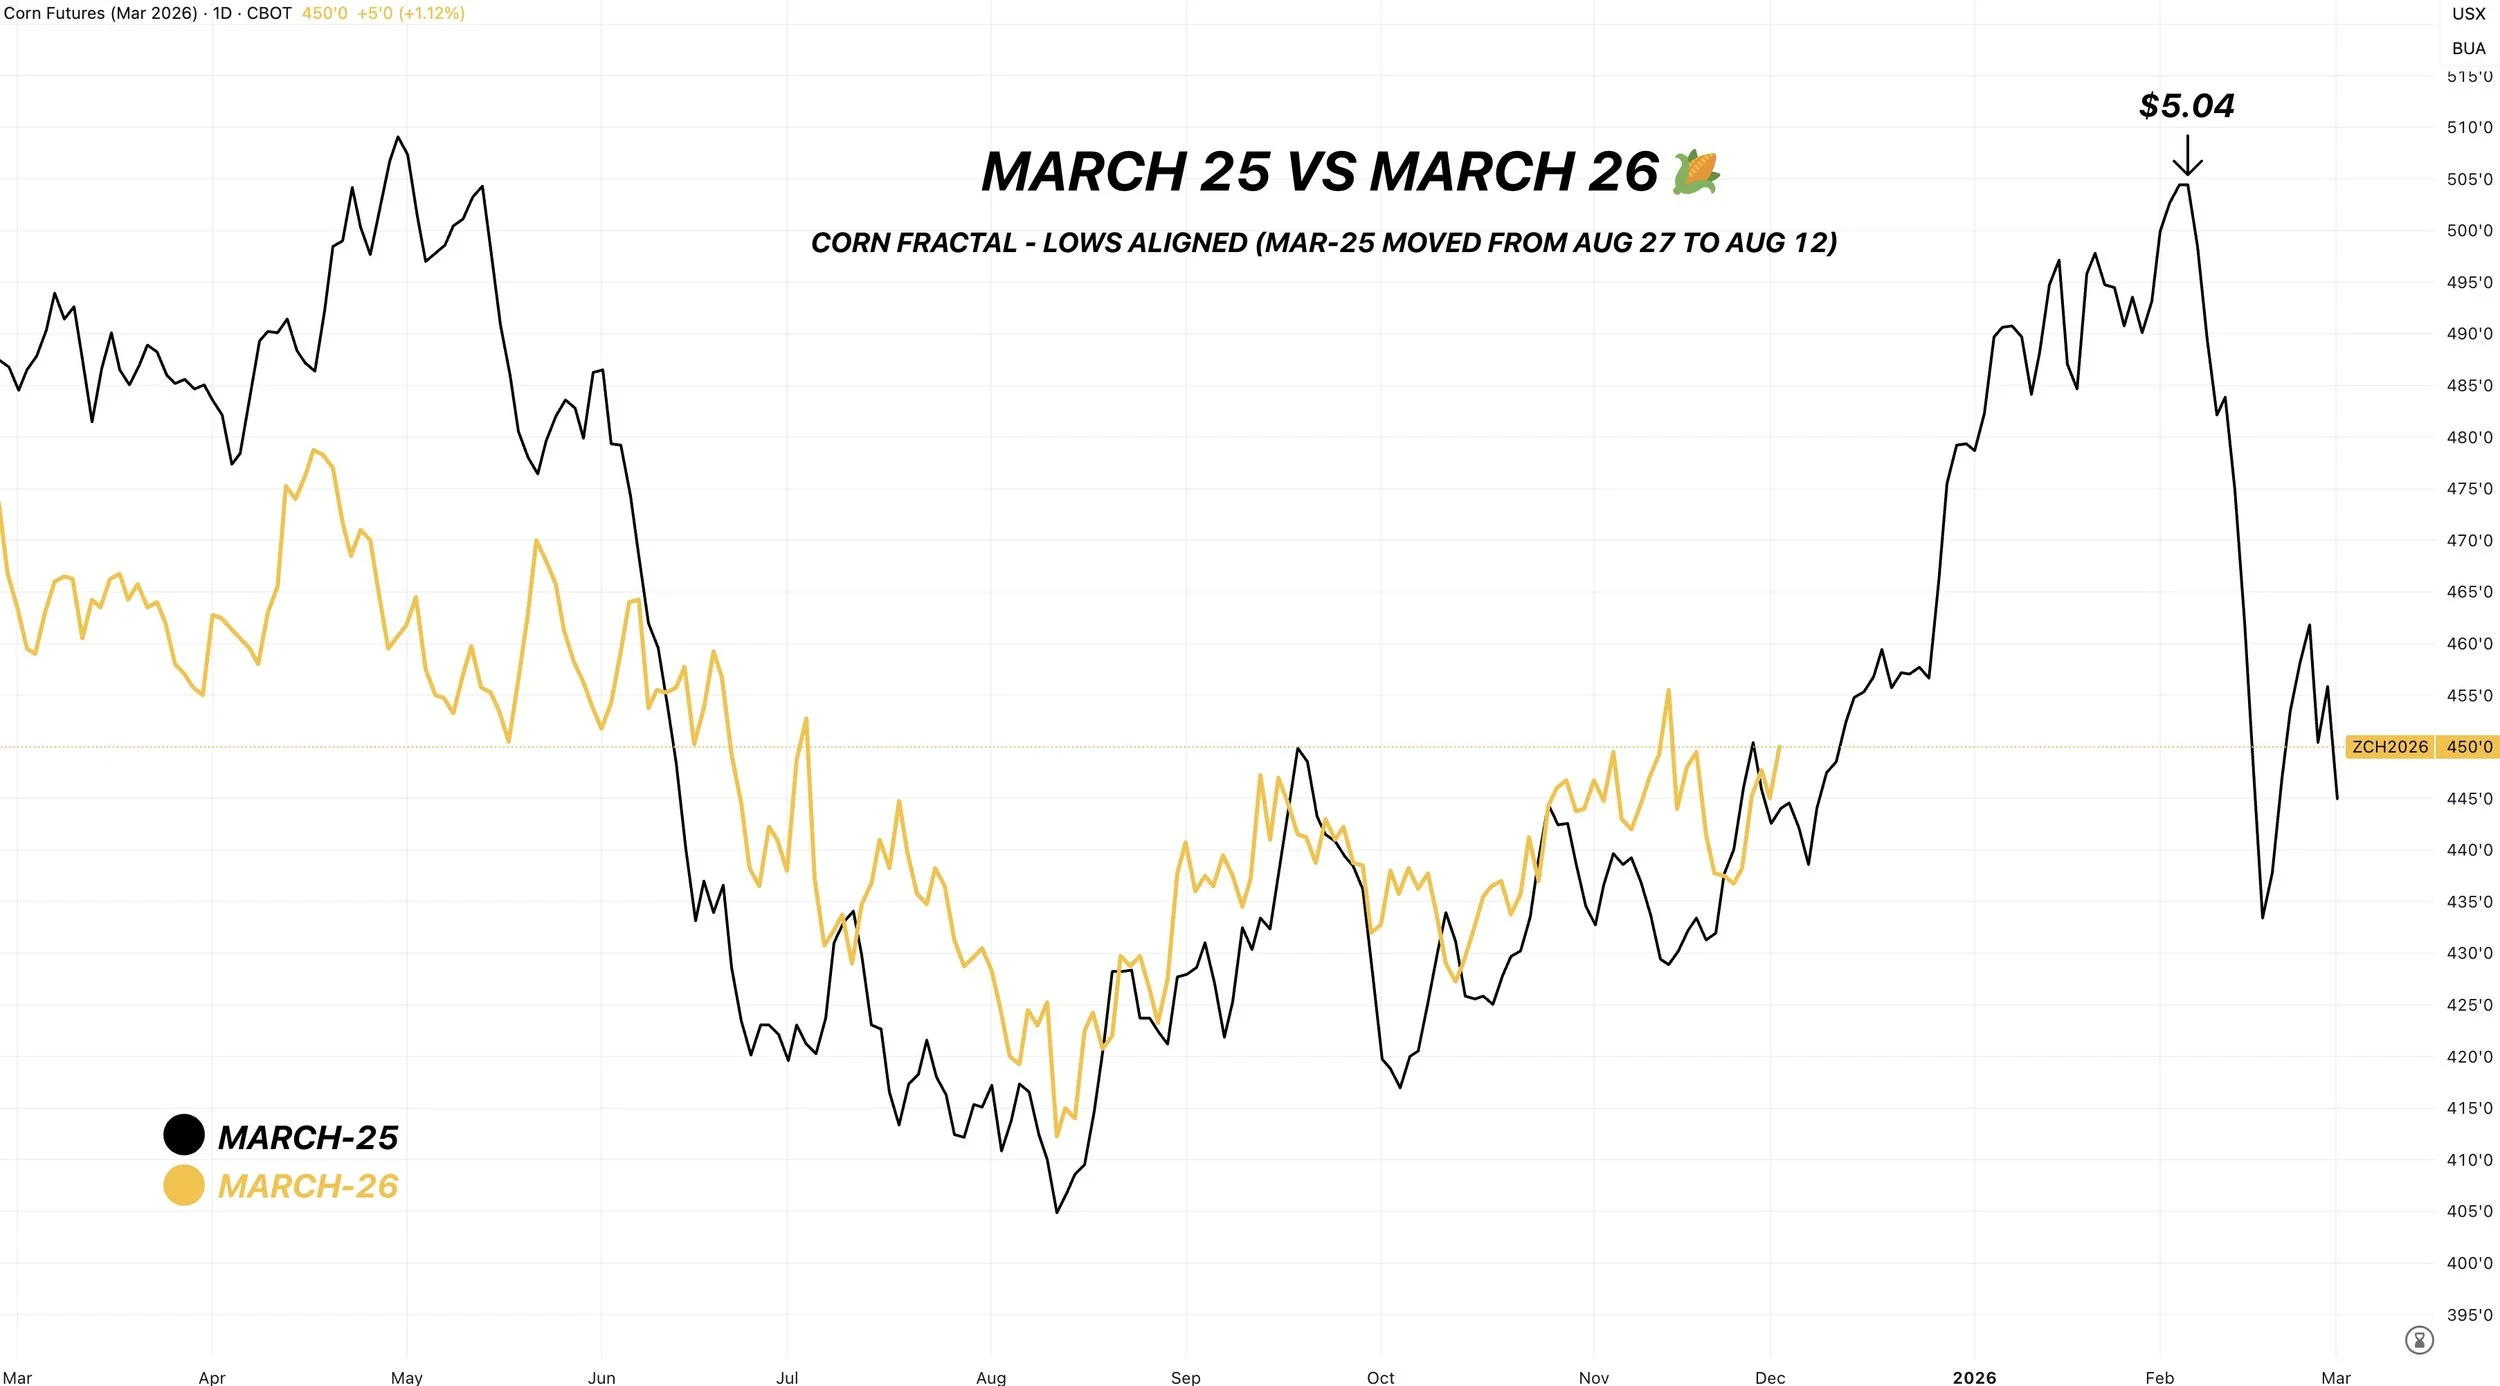
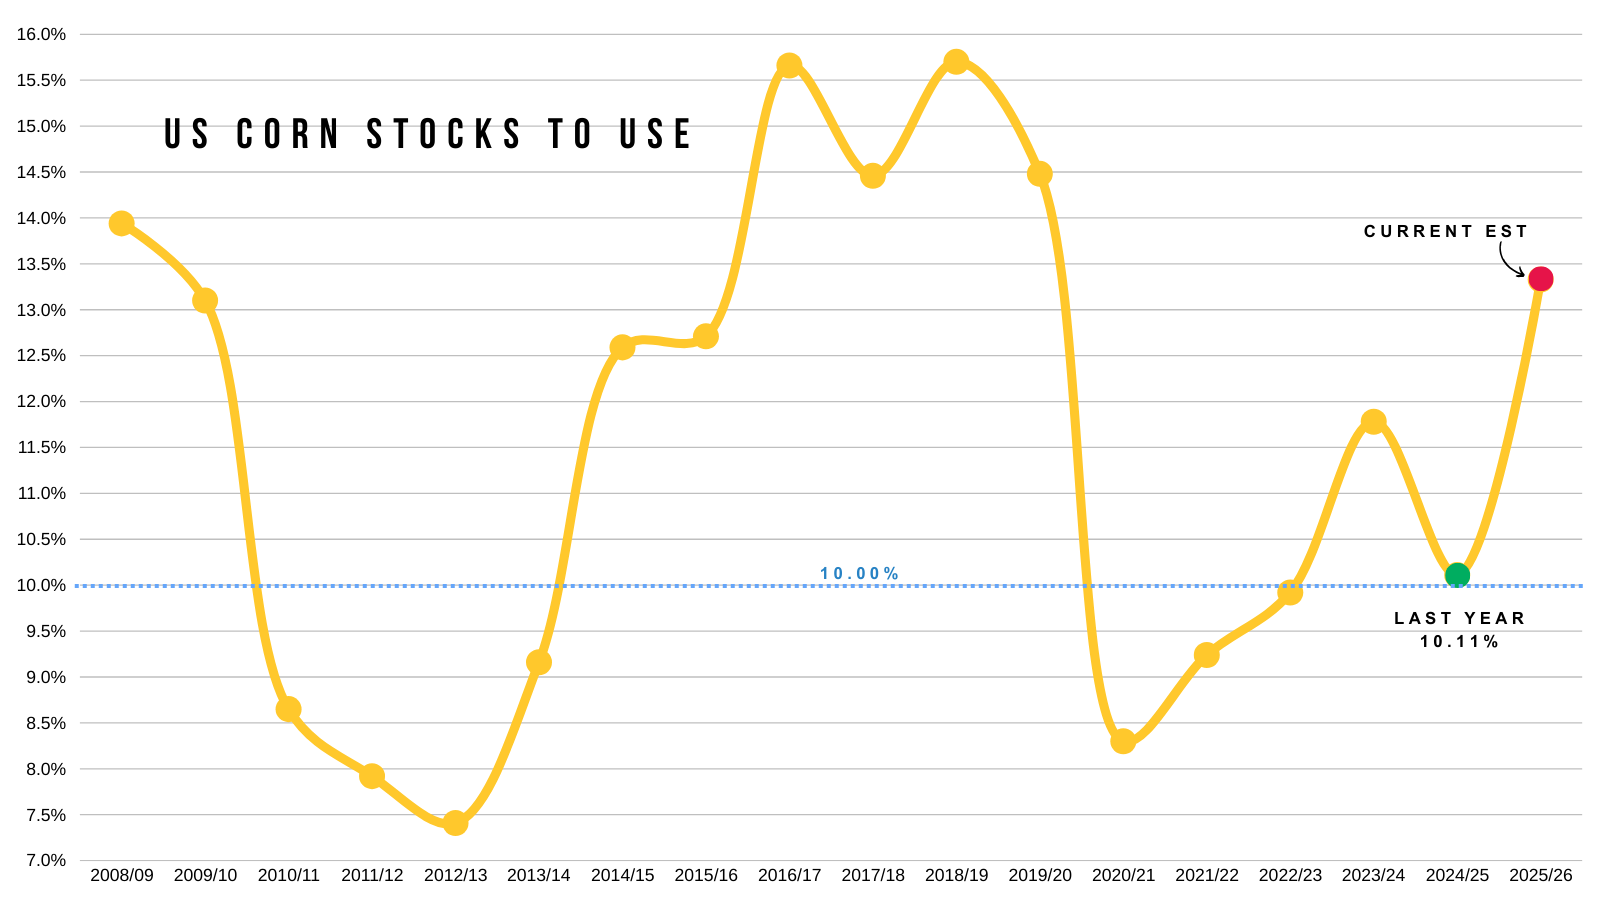
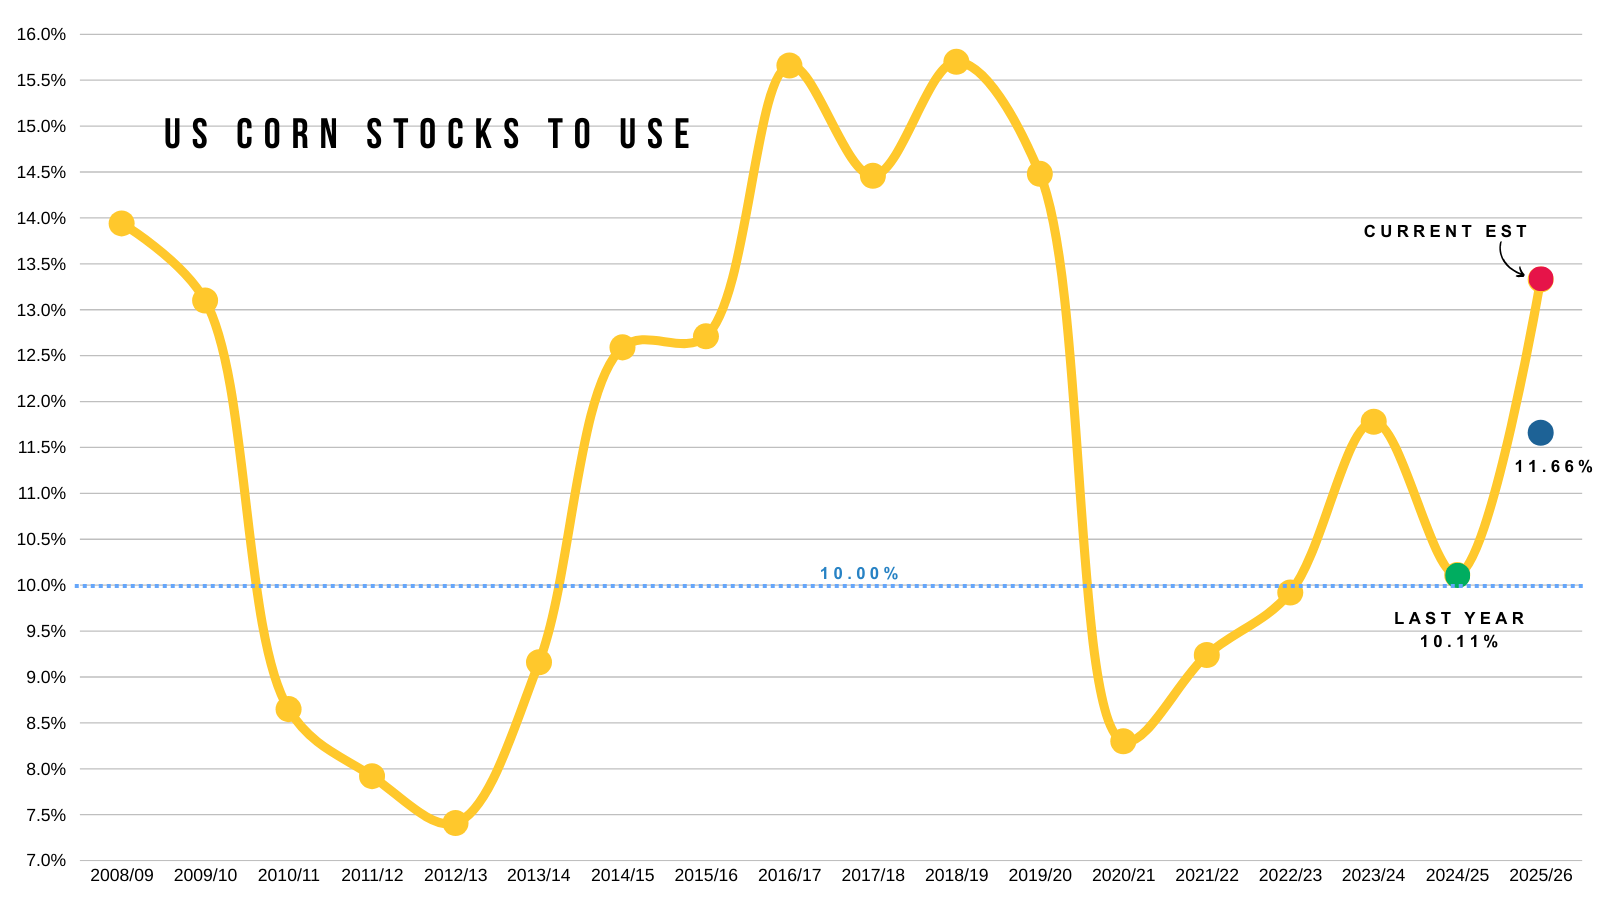
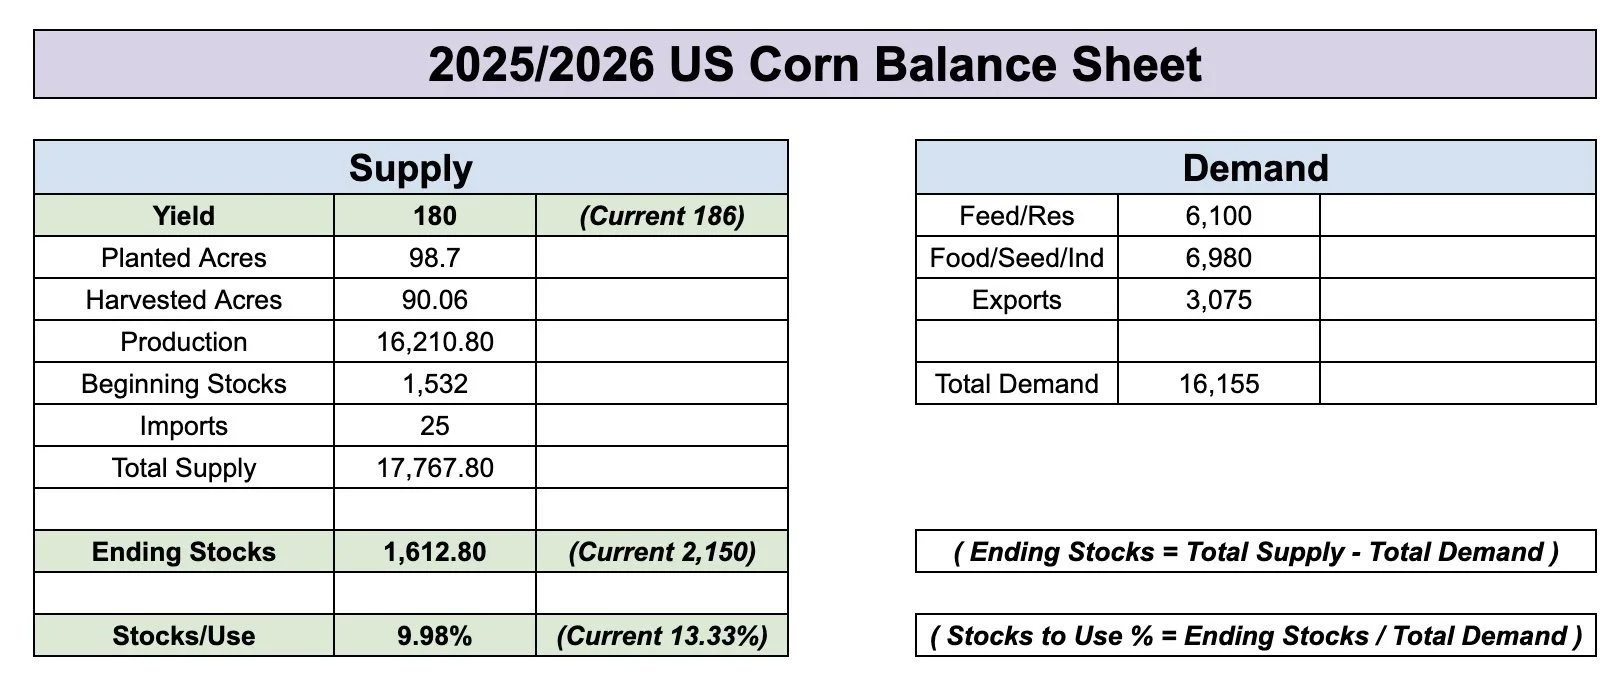
As it currently stands with a 186 yield and the demand numbers as is, our stocks to use ratio is not bullish.
It is at 13.33%.
It's not sub $4.00 bearish like from 2015 to 2020, but it's not bullish at all.
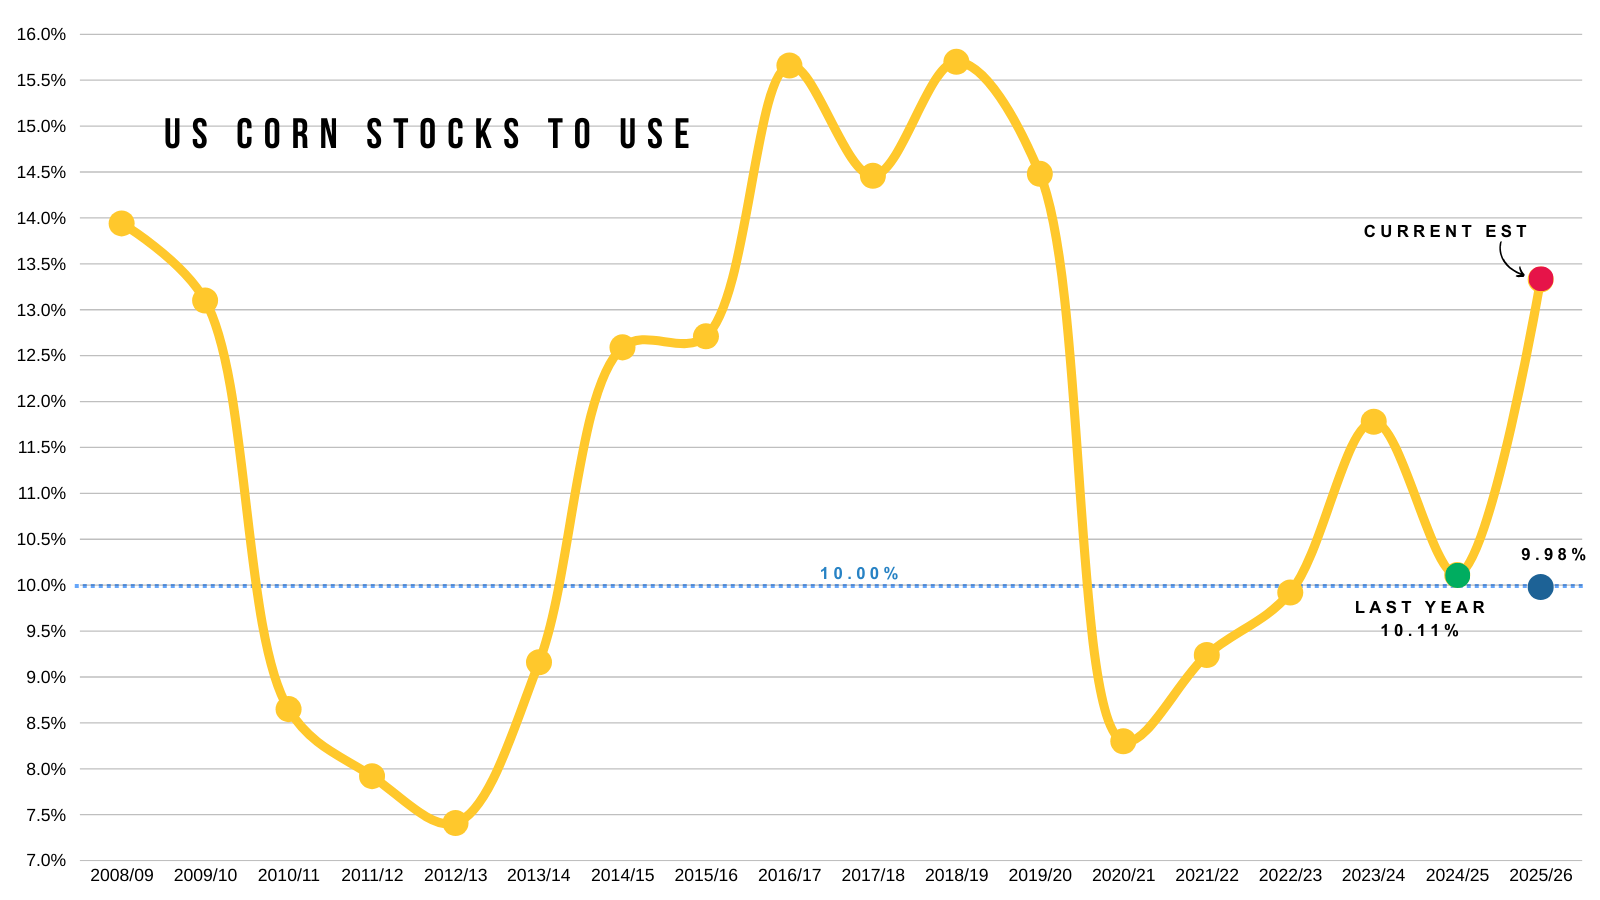
The rule of thumb is usually that anything below 10% is considered "bullish" territory.
Last year we had an 10.11% stocks to use.
Things can always change drastically by January.
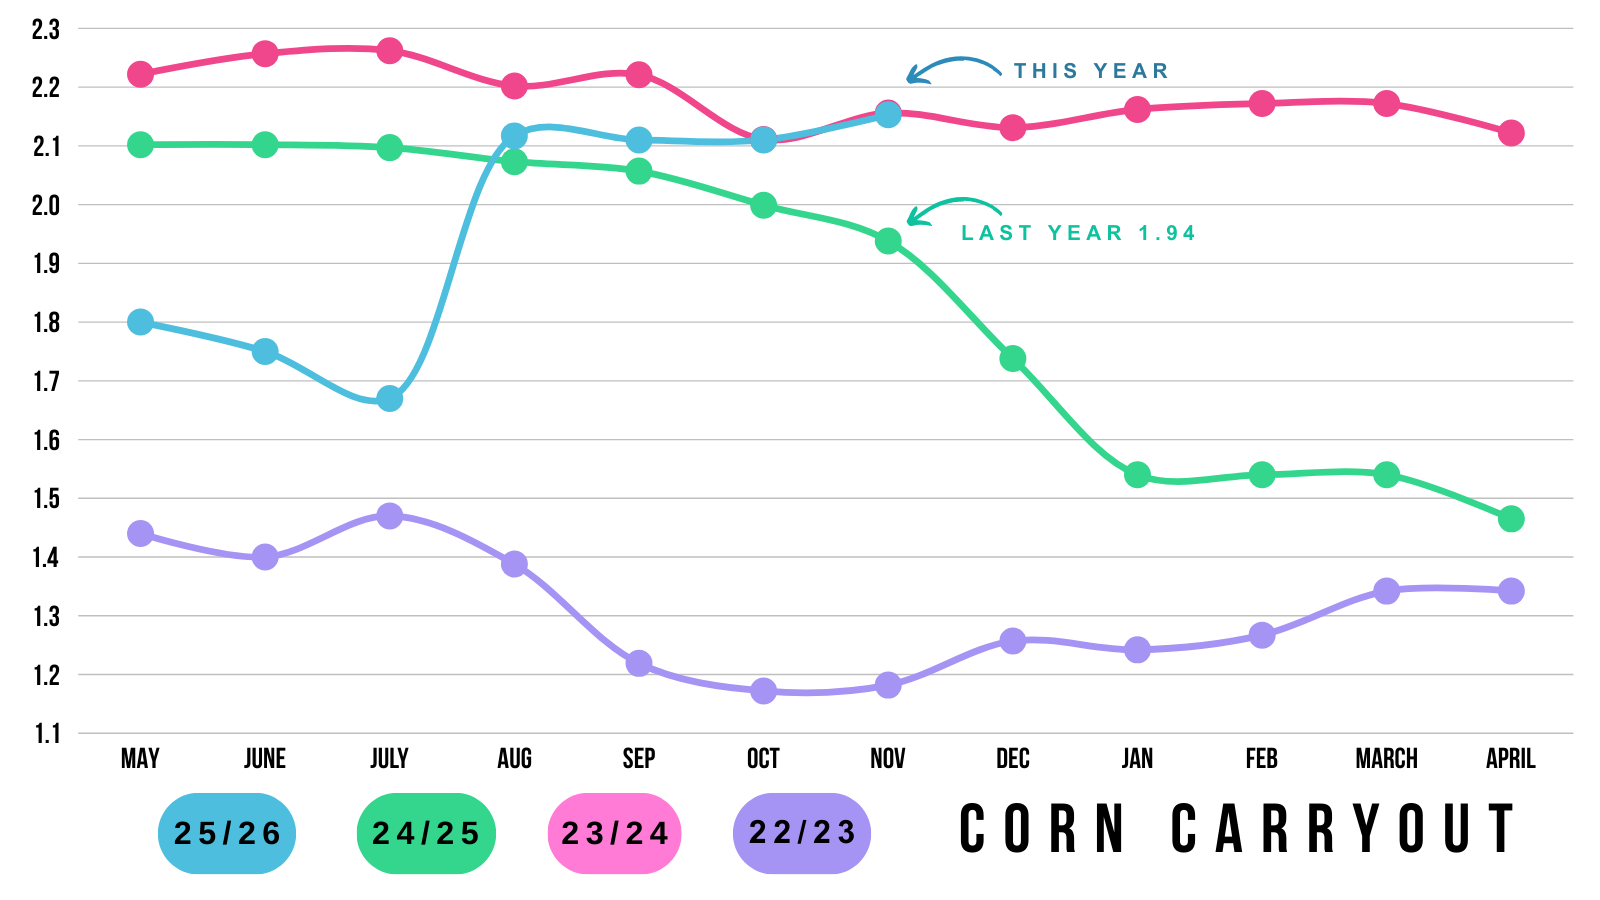
For reference, in the 2024 Nov report, our carryout was 1.94 billion.
It ended at 1.53 billion bushels.
(Current Nov 2025: 2.15 billion)
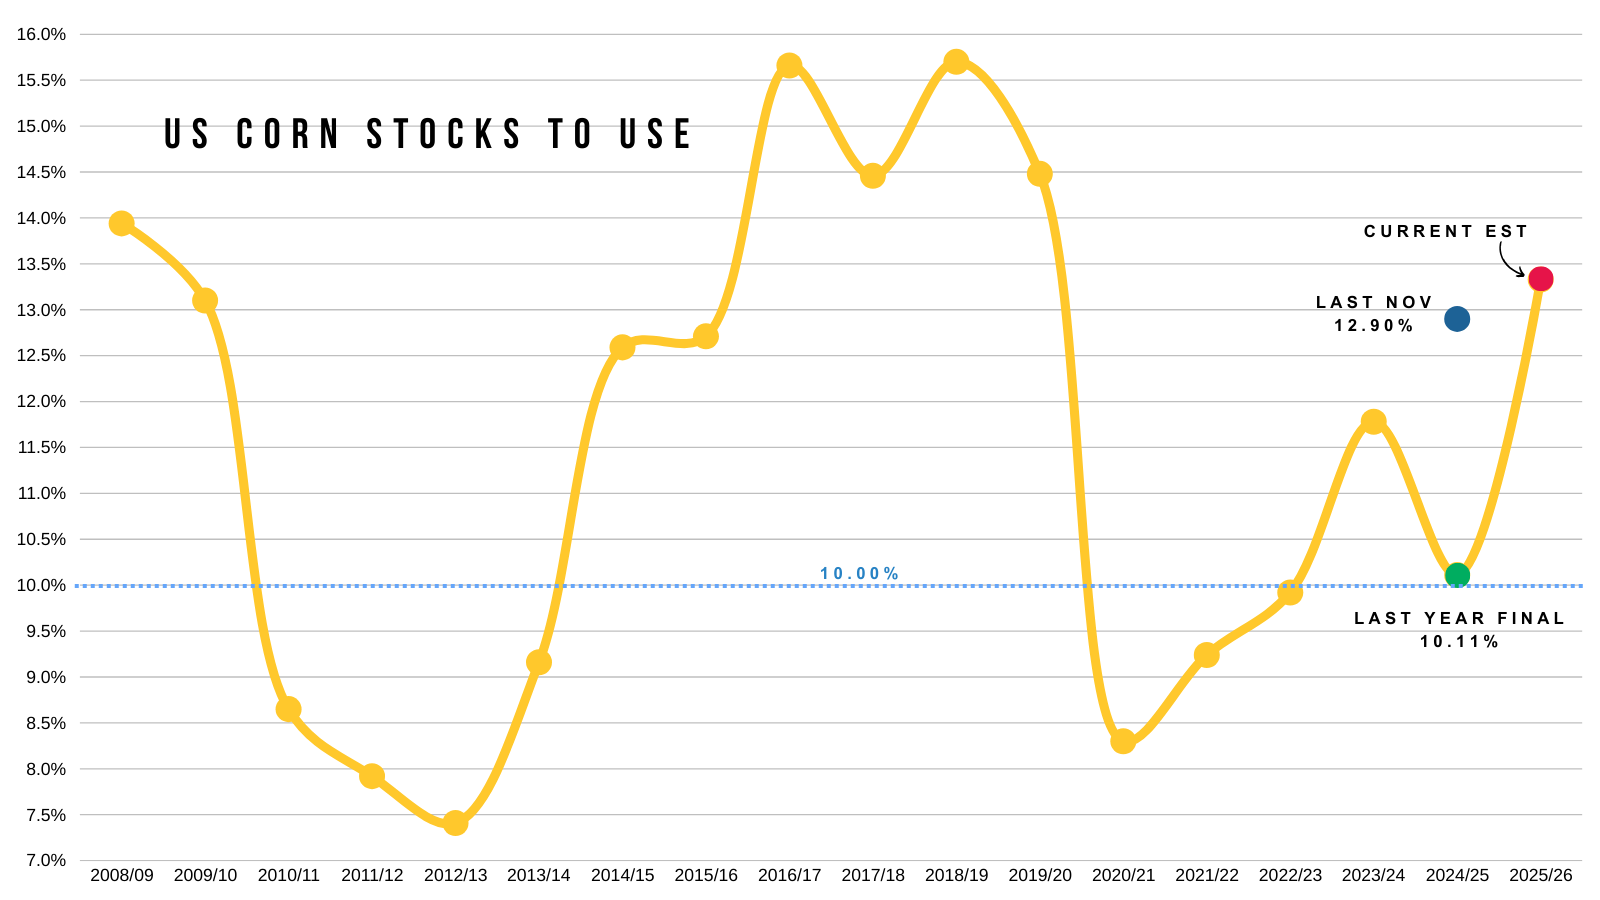
In the 2024 November report, we had a stocks-to-use ratio of 12.9%.
Ultimately, we ended at and 10.11%.
(Current Nov 2025: 13.33%)
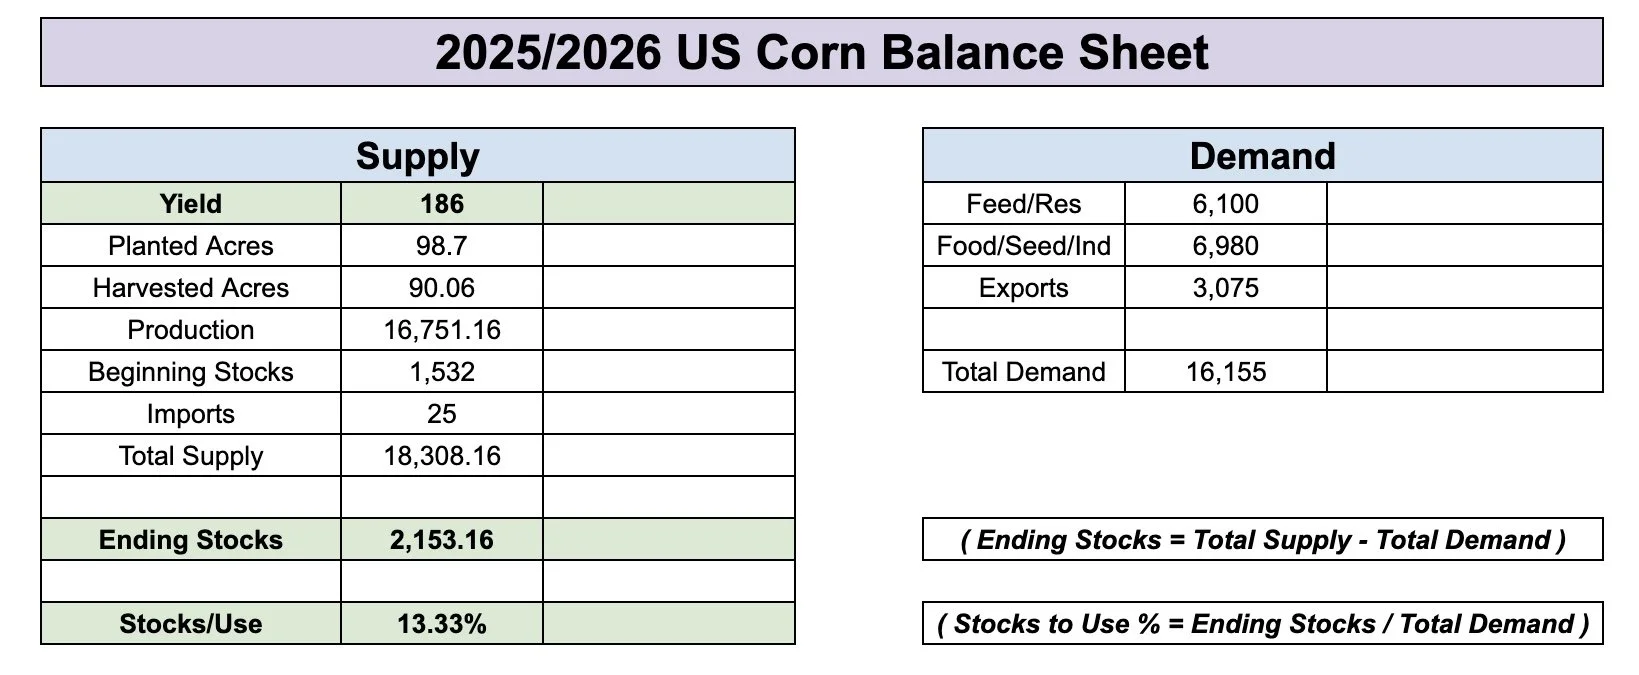
Here is the current balance sheet.
186 yield.
2.15 billion carryout.
13.33% stocks to use.
What would it take to turn this bullish?
Here is how that changes if you drop yield down to 183.
While leaving demand as it currently is.
1.88 billion carryout.
11.66% stocks to use.

That isn’t "bullish" either.
It's on par with 2023/24.
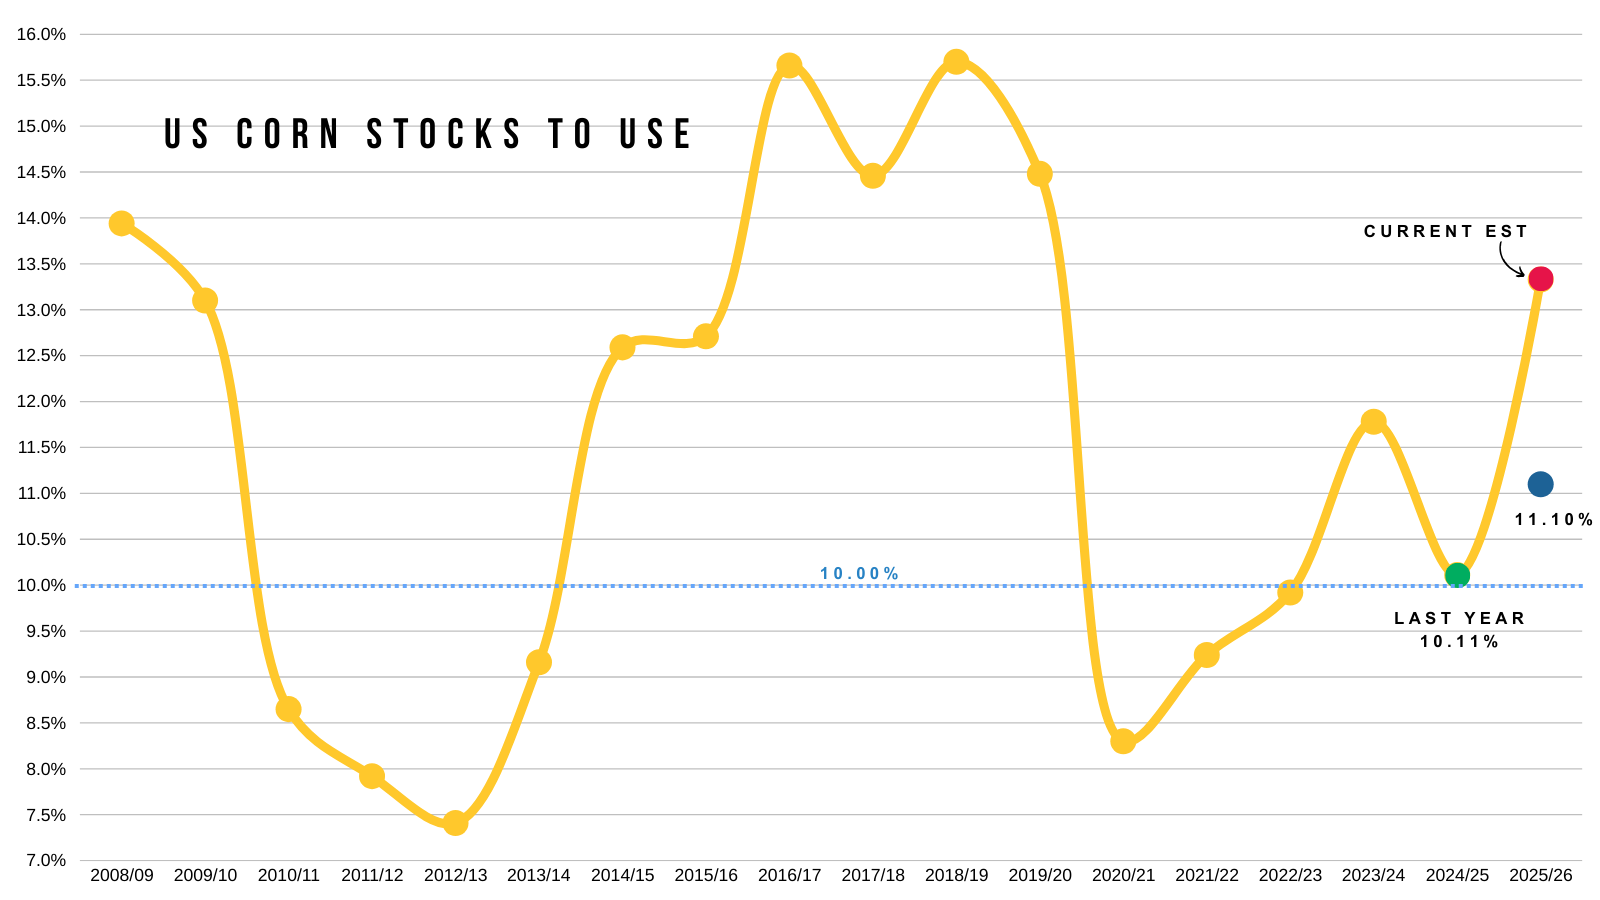
What about a yield of 182?
It gives you:
1.79 billion carryout.
11.10% stocks to use.
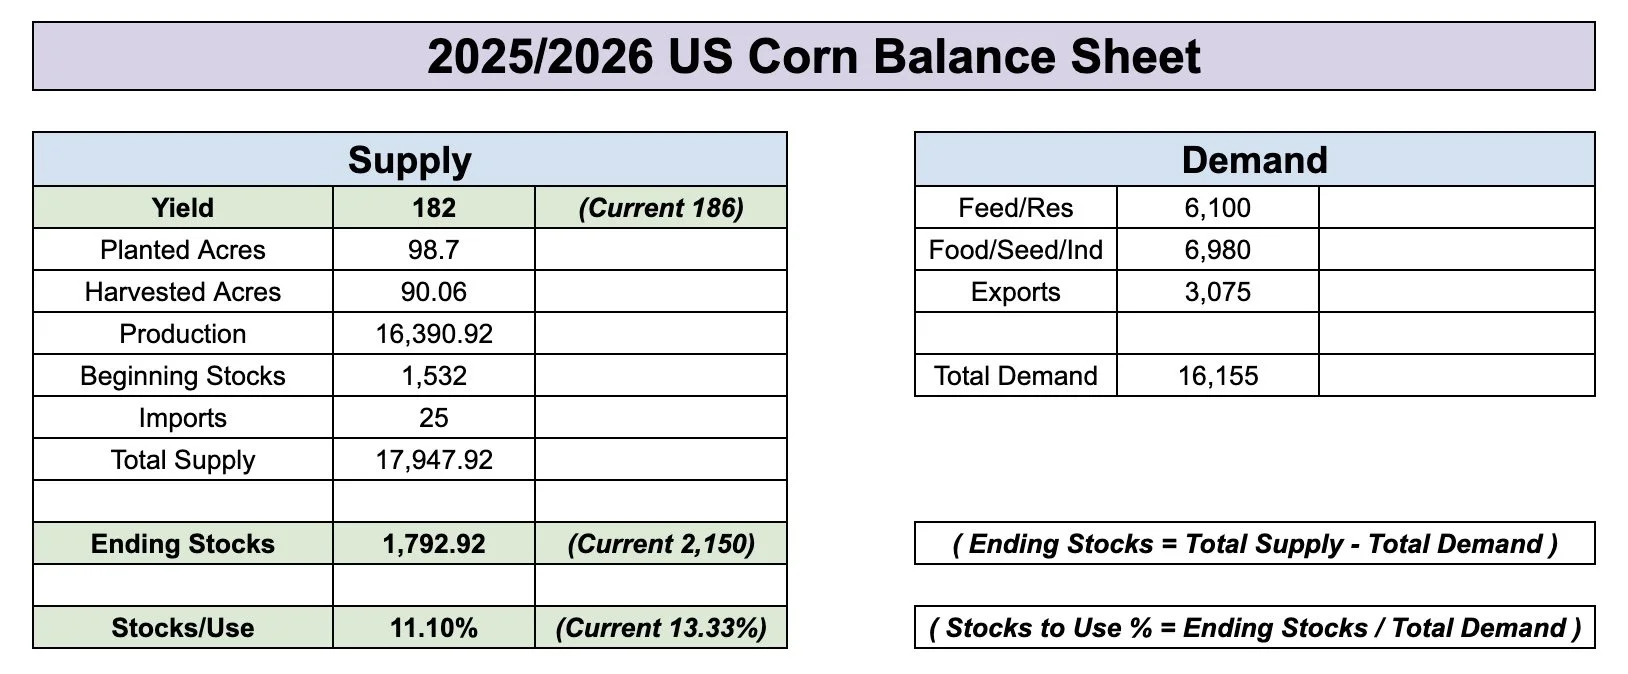
That's not super bearish, but still isn’t really bullish either.
It's the 2nd highest since 2019/20.
181 yield?
1.70 billion carryout.
10.54% stocks to use.
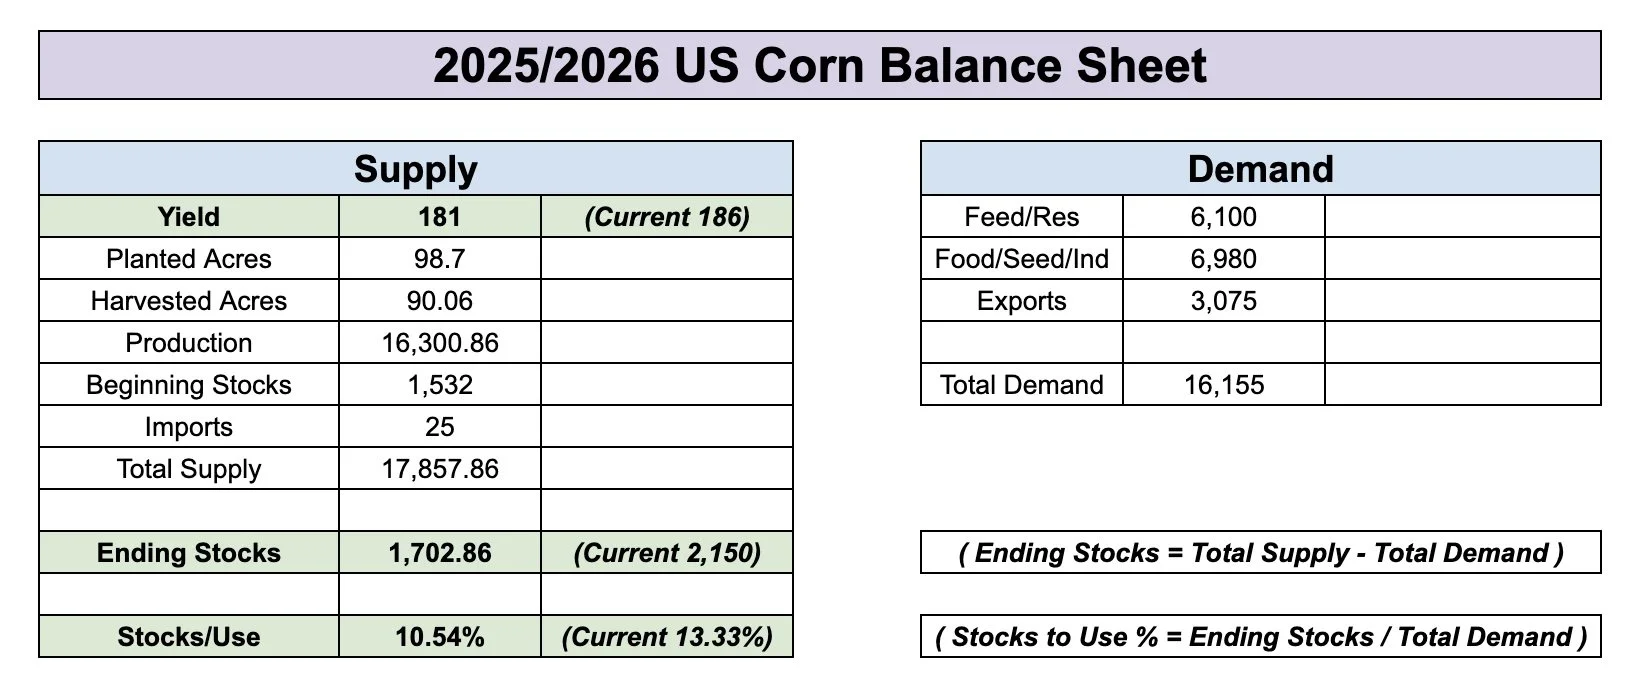
Now that is getting closer to being "bullish" but not out of this world bullish or true bull market territory or anything like that. Almost on par with last year.

A 180 yield?
1.61 billion carryout.
9.98% stocks to use.
A 180 yield finally cracks that 10% threshold.
However.. the problem is that it's not quite this simple.
If the USDA drops yield that drastically, I guarantee they will offset it with lowering demand.
Feed and residual demand is probably too high to begin with. They did that on purpose so they have wiggle room on the balance sheet for when they have to lower yield.
Yes, you could also argue that exports are low and need to be bumped at the same time. Helping offset the losses in feed and residual.
But the point is that based on the current state of the market, it seems like it would take at least a yield of 180 to create a truly "bullish" story in the corn market.
That doesn’t mean prices can’t go higher; in fact, my bias does leans higher.
But this is why we shouldn’t expect anything much beyond $5.00.. for now anyway.
As it's hard to create a really bullish scenario due to the massive production.
This analysis was more medium to short-term.
This has nothing to do with next year. That is a completely different story.
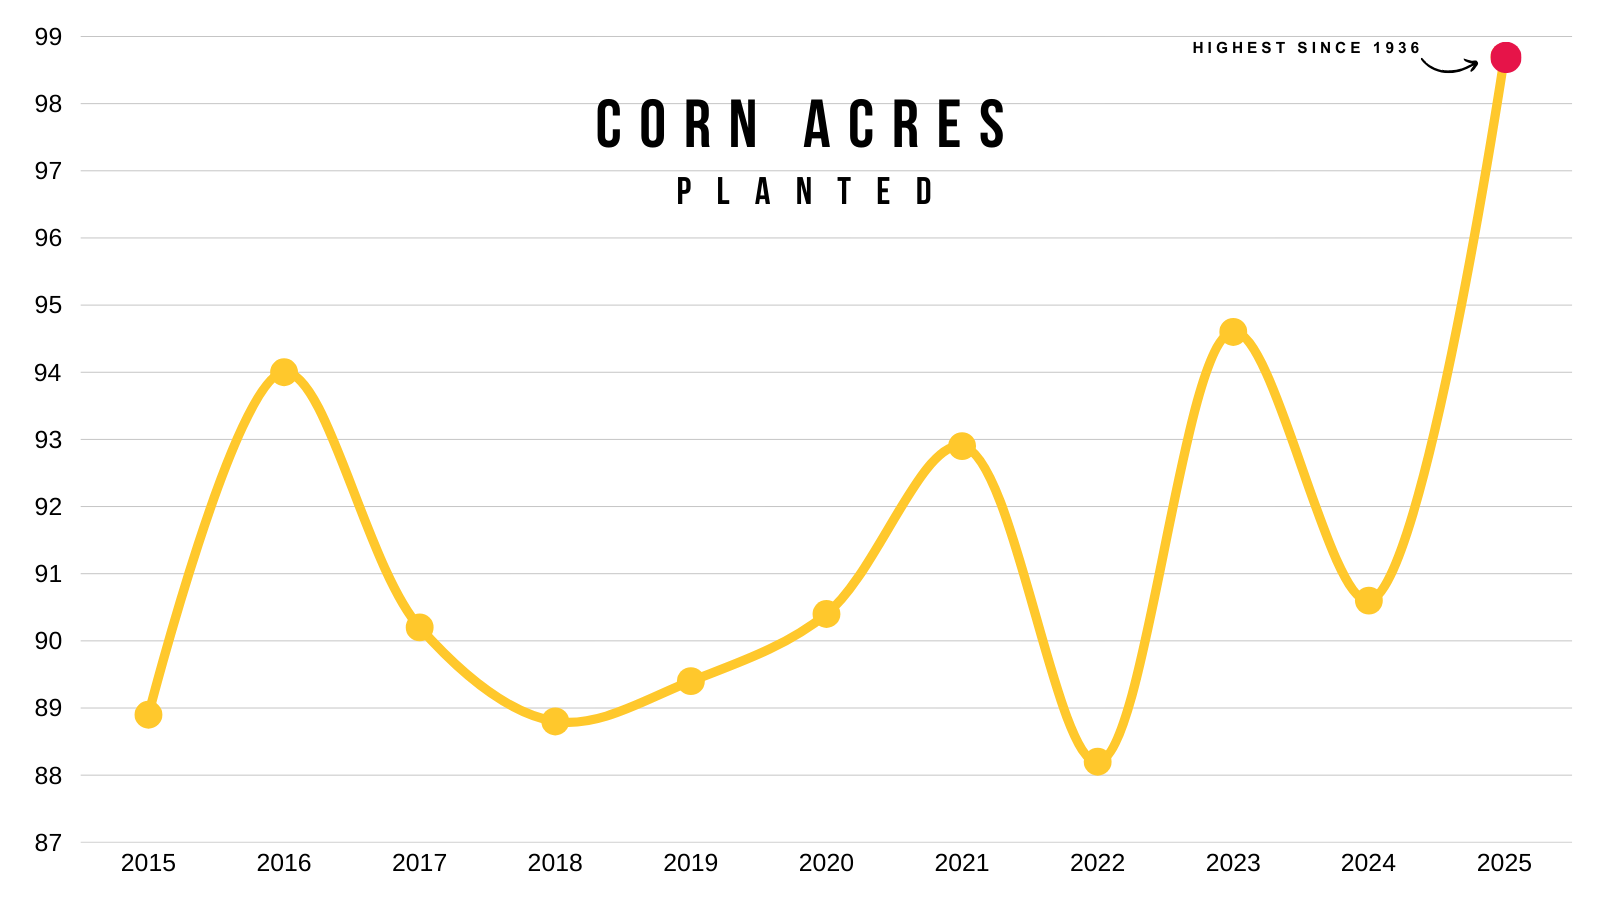
We could very well be looking at acres shifting next year.
Take a look at the soybean to corn price ratio.

We just came off of record corn acres. It might be the markets job to switch some of those back.
So what happens if corn loses acres next year.. this record demand continues.. and or we get a weather scare during the summer?
Demand is already at a record. We can’t get too cheap without creating even more demand.
Overall, I am not "bearish" on corn. I just think our upside is limited based on what we know today.
Technicals:
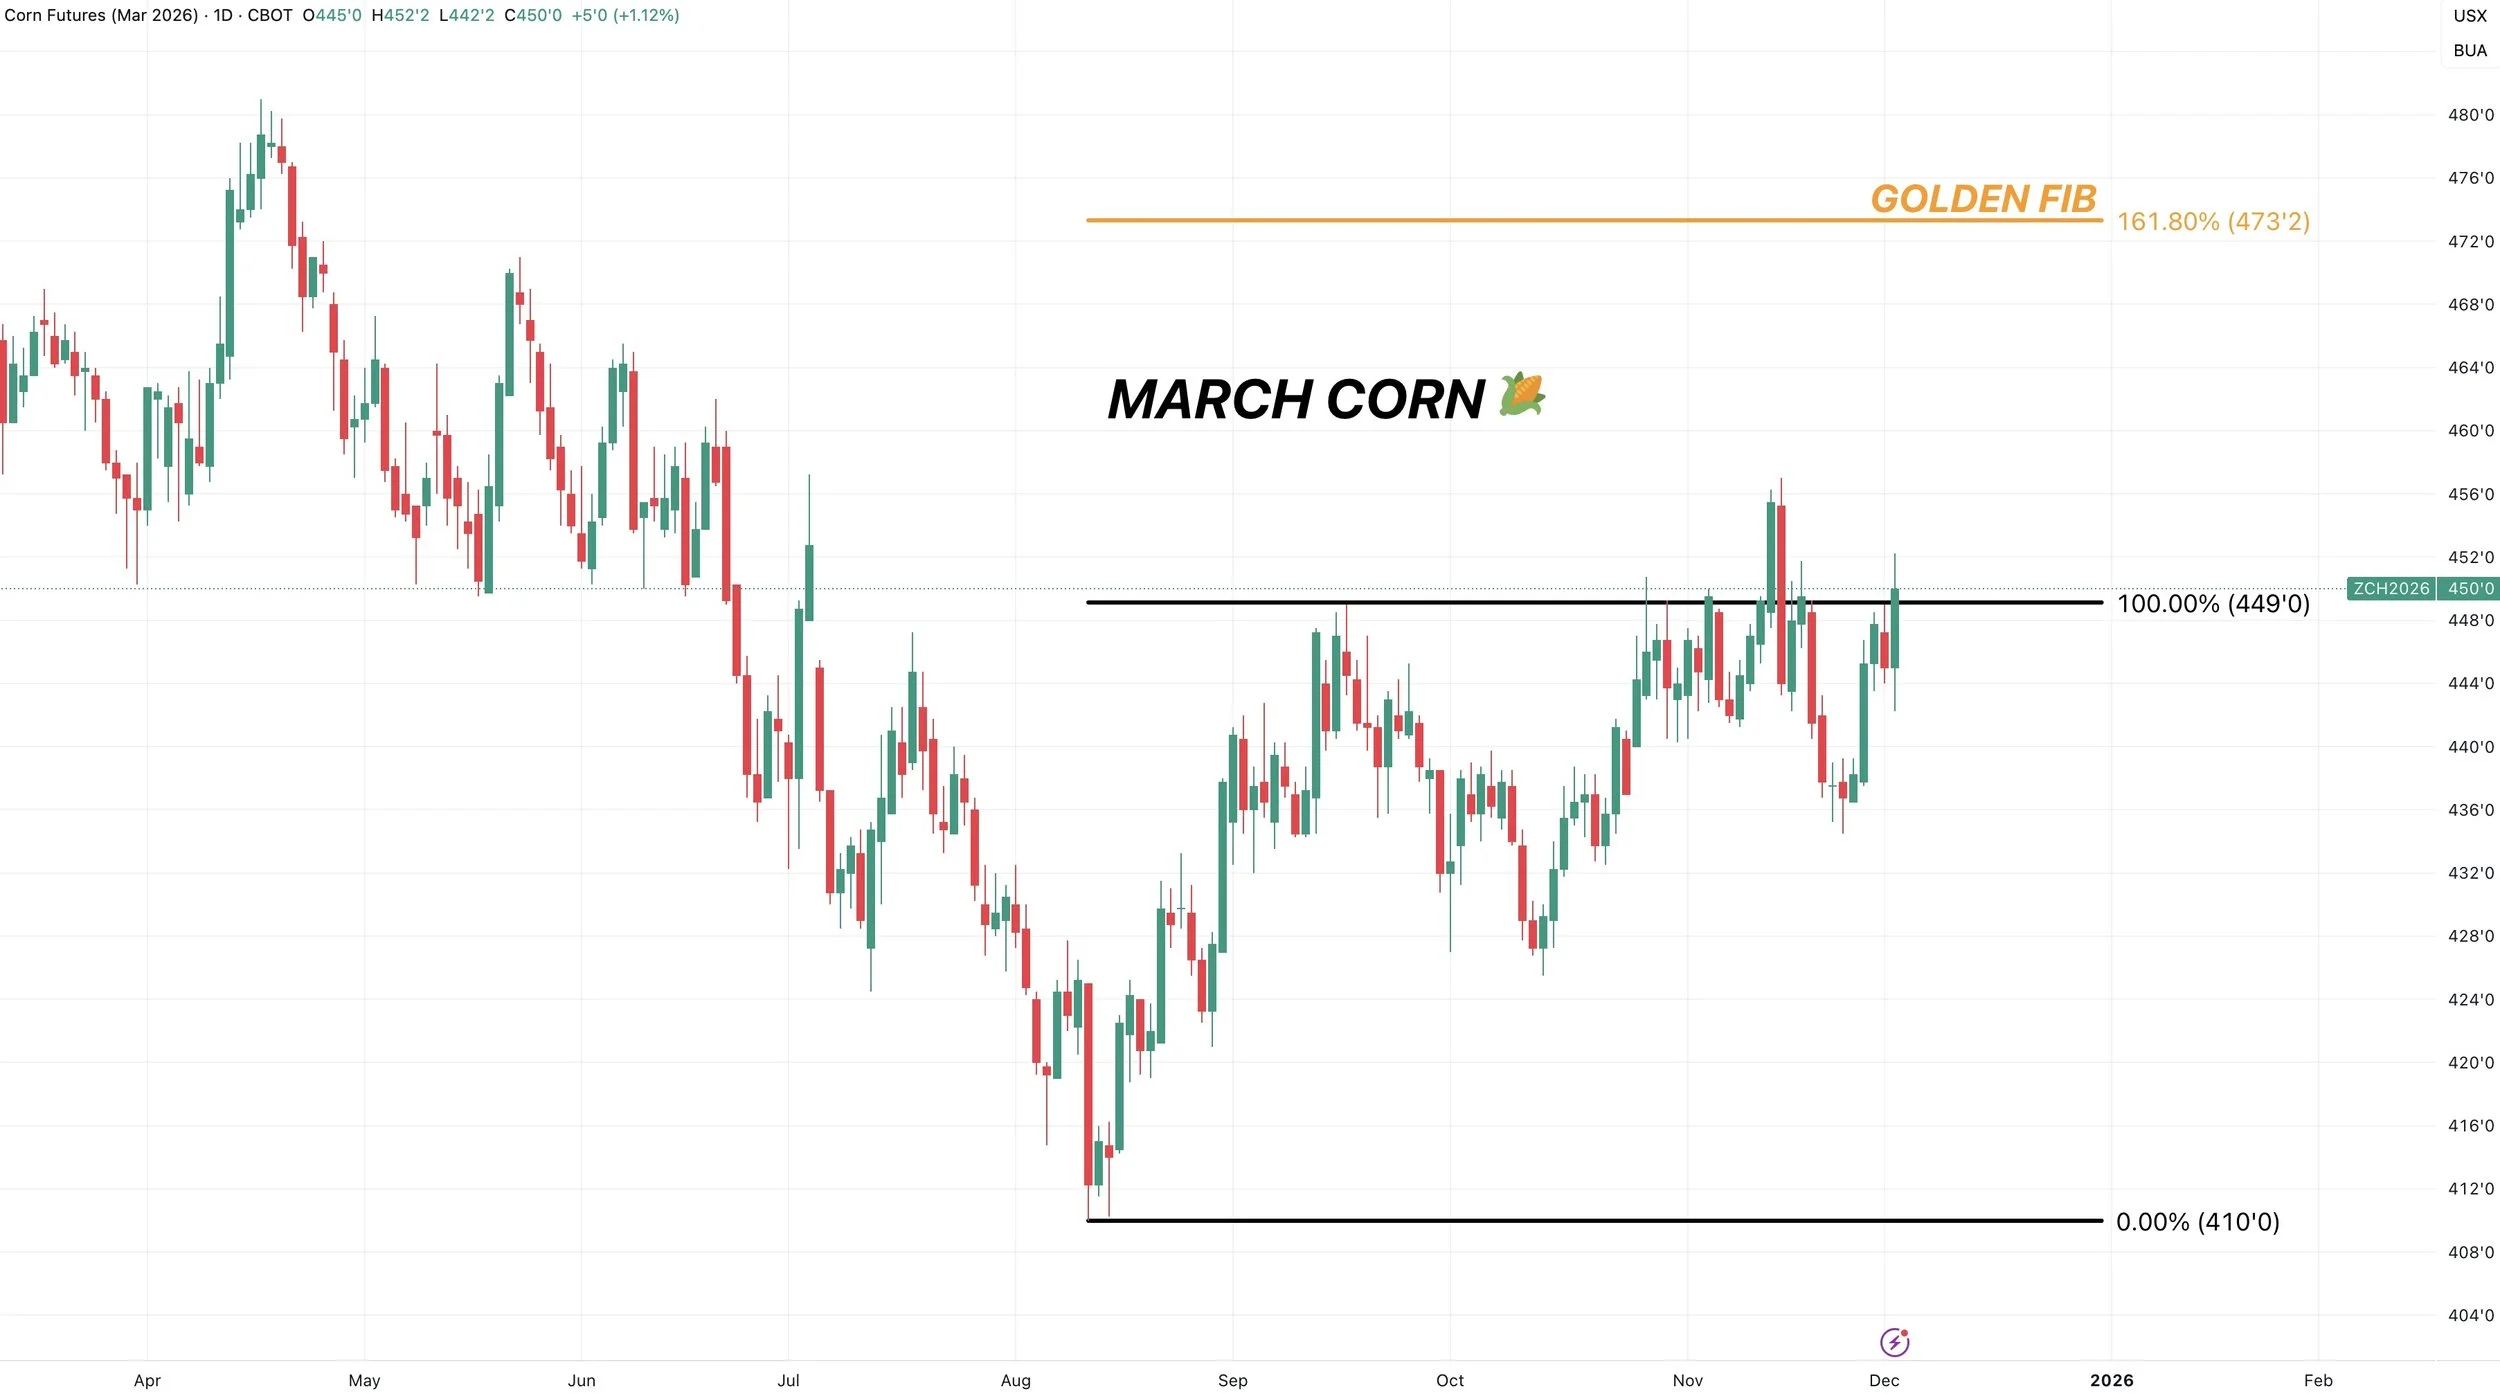
March Corn
Corn bounced exactly in that golden zone we talked about last week.
That is right where we needed to hold.
Like we always talk about, the 61.8% level is where the market usually makes a decision. It's time to bounce and keep the trend higher, or it's time to roll over.
It's the most common spot for a standard correction to end. If we would’ve failed that level, it would’ve opened the door quiet a bit lower.
Looking to the upside, $4.48 clawed back 61.8% of this recent sell off (black lines).
We closed above that today. So that is a great sign. Not always.. but more often than not, when you close above this level it tells us we are in for more upside. As this bounce is no longer viewed as a correctional bounce before heading lower.
We also closed above the 200-day MA for just the 2nd time since June. Last time we were only above it for a day. So stringing together multiple days above would be a good indication of upside.
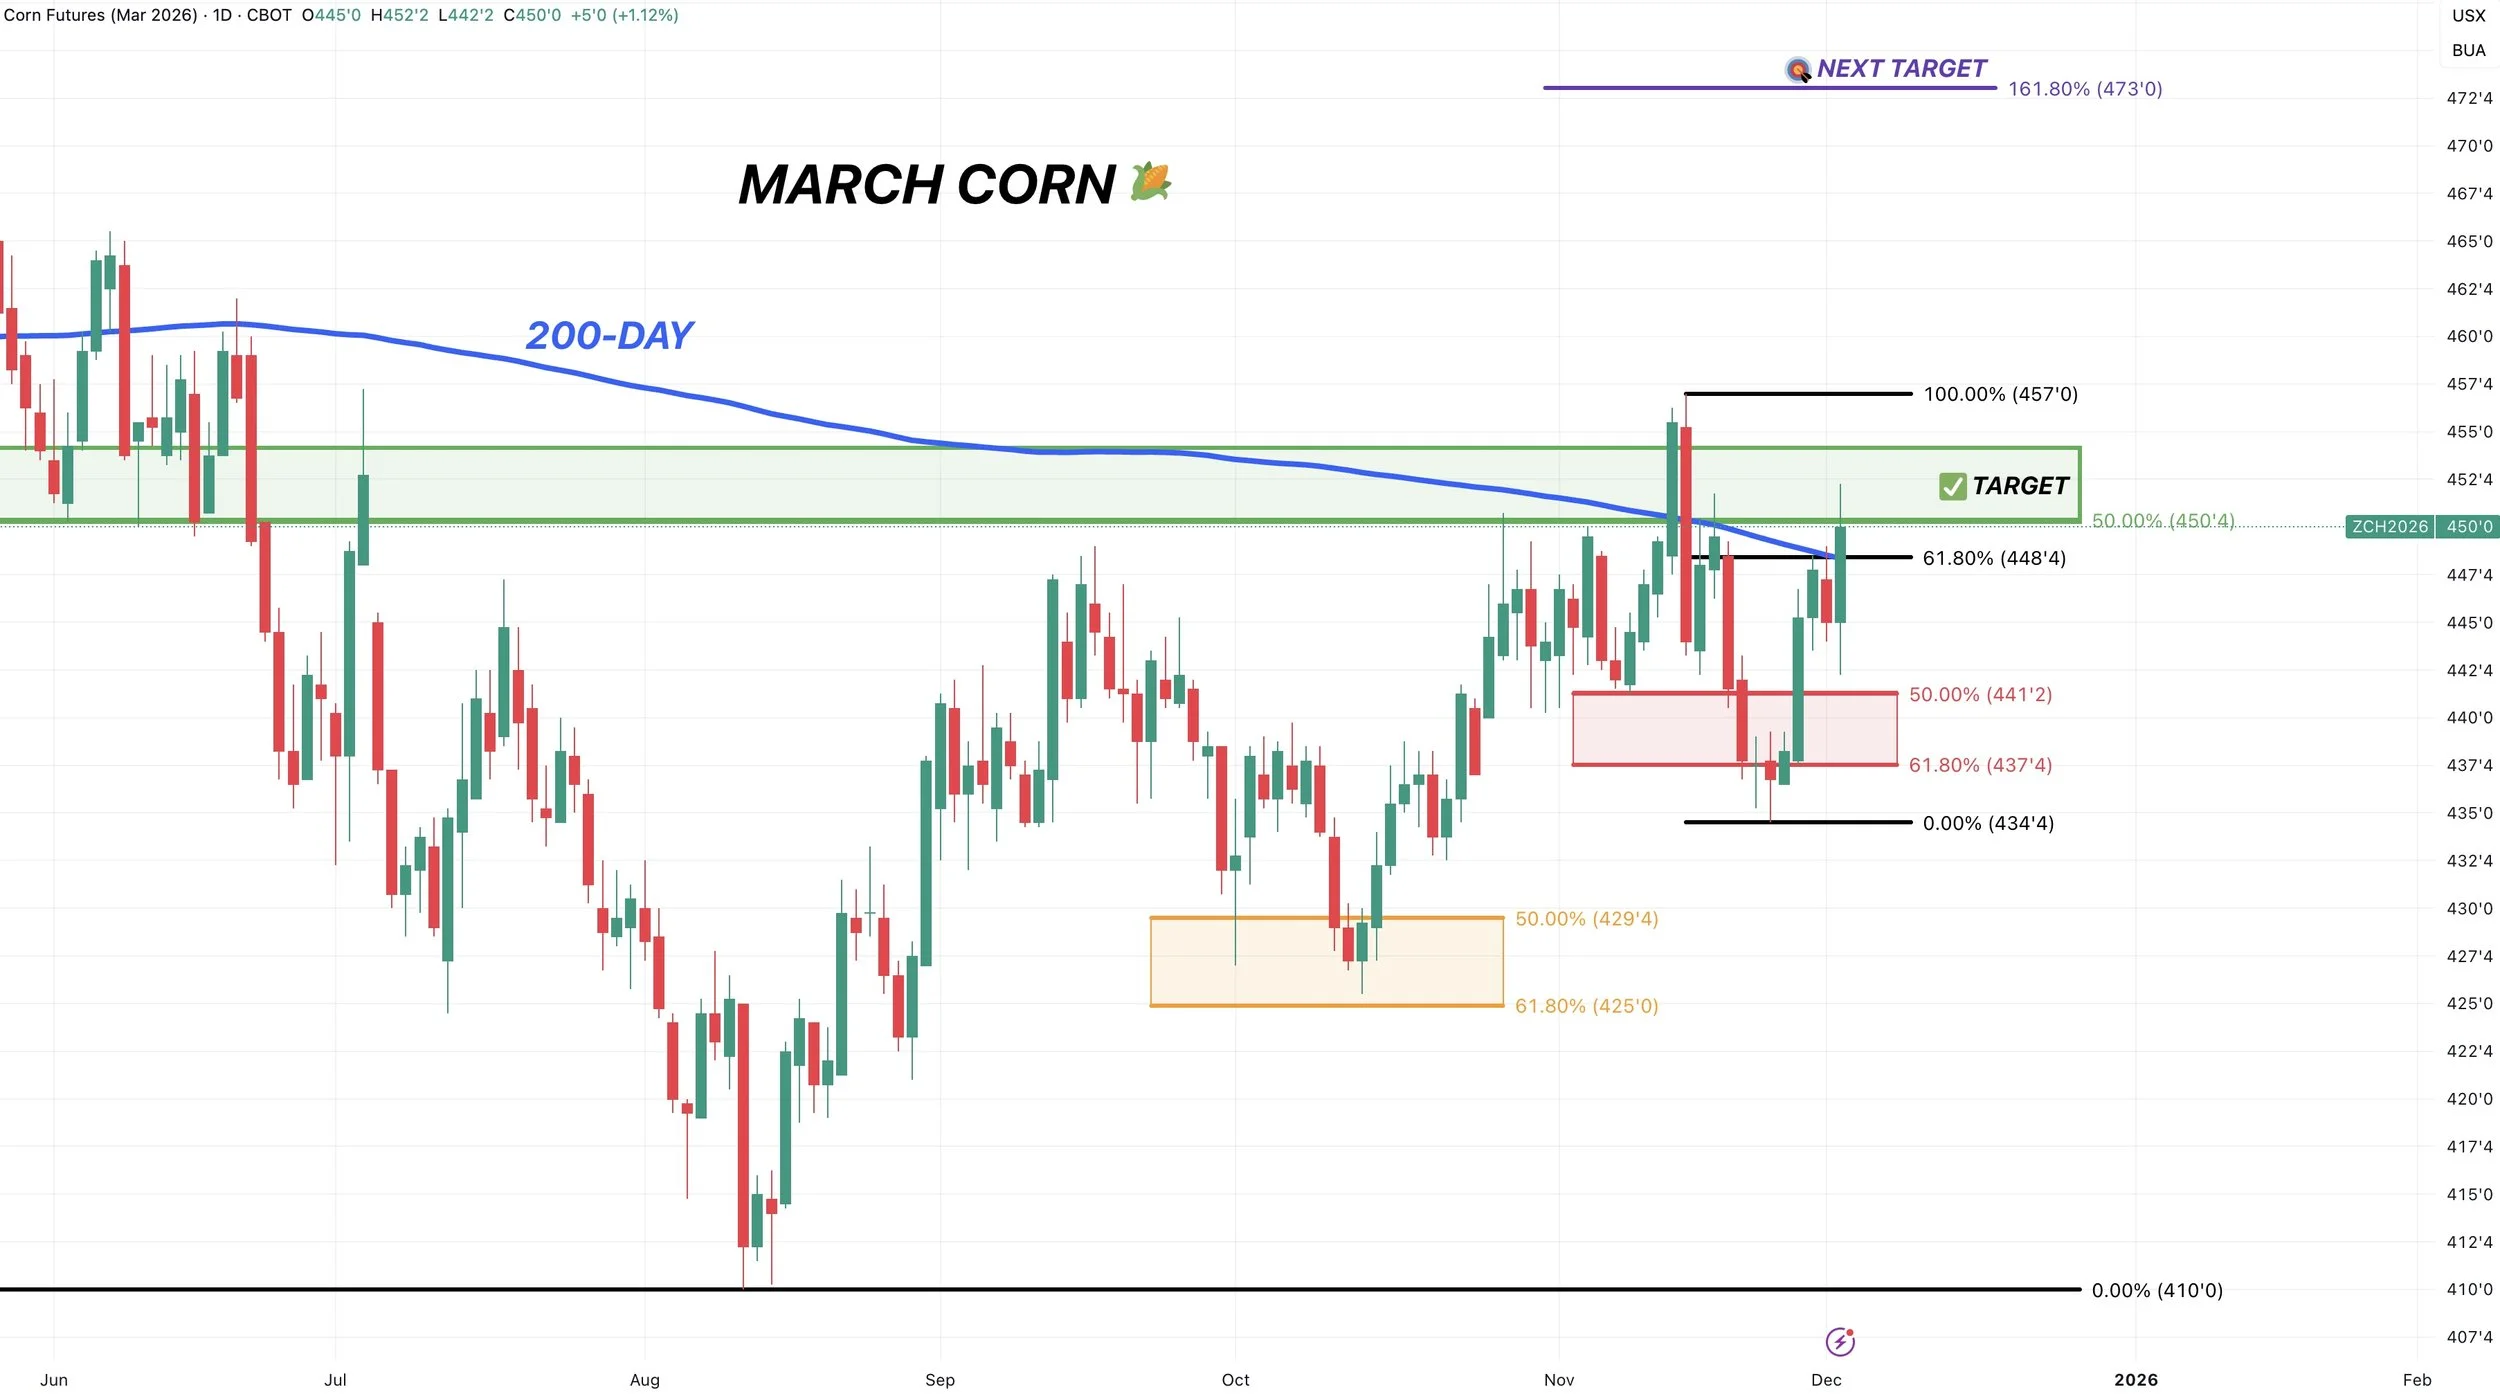
Since we took risk off the table the first time we hit $4.50
Our next target is $4.70-73
That is where I want to further de-risk.
$4.73 is 161.8% of the size of the Sep rally off contract lows.
This is a very common spot for a 2nd rally to pause.
I showed this in my chart video last week.
This is a great example of the 161.8% level.
This is Dec live cattle.
We alerted a sell signal back in October as we were approaching that golden fib.
We ended up hitting it, and that level marked the high.

Soybeans
Fundamentals:
The two biggest factors right now are still China and Brazil.
Will China be able to meet their purchase agreements?
Will Brazil run into any production hiccup?
We have until around February to ship our soybeans to China. Because that is when Brazil takes over.
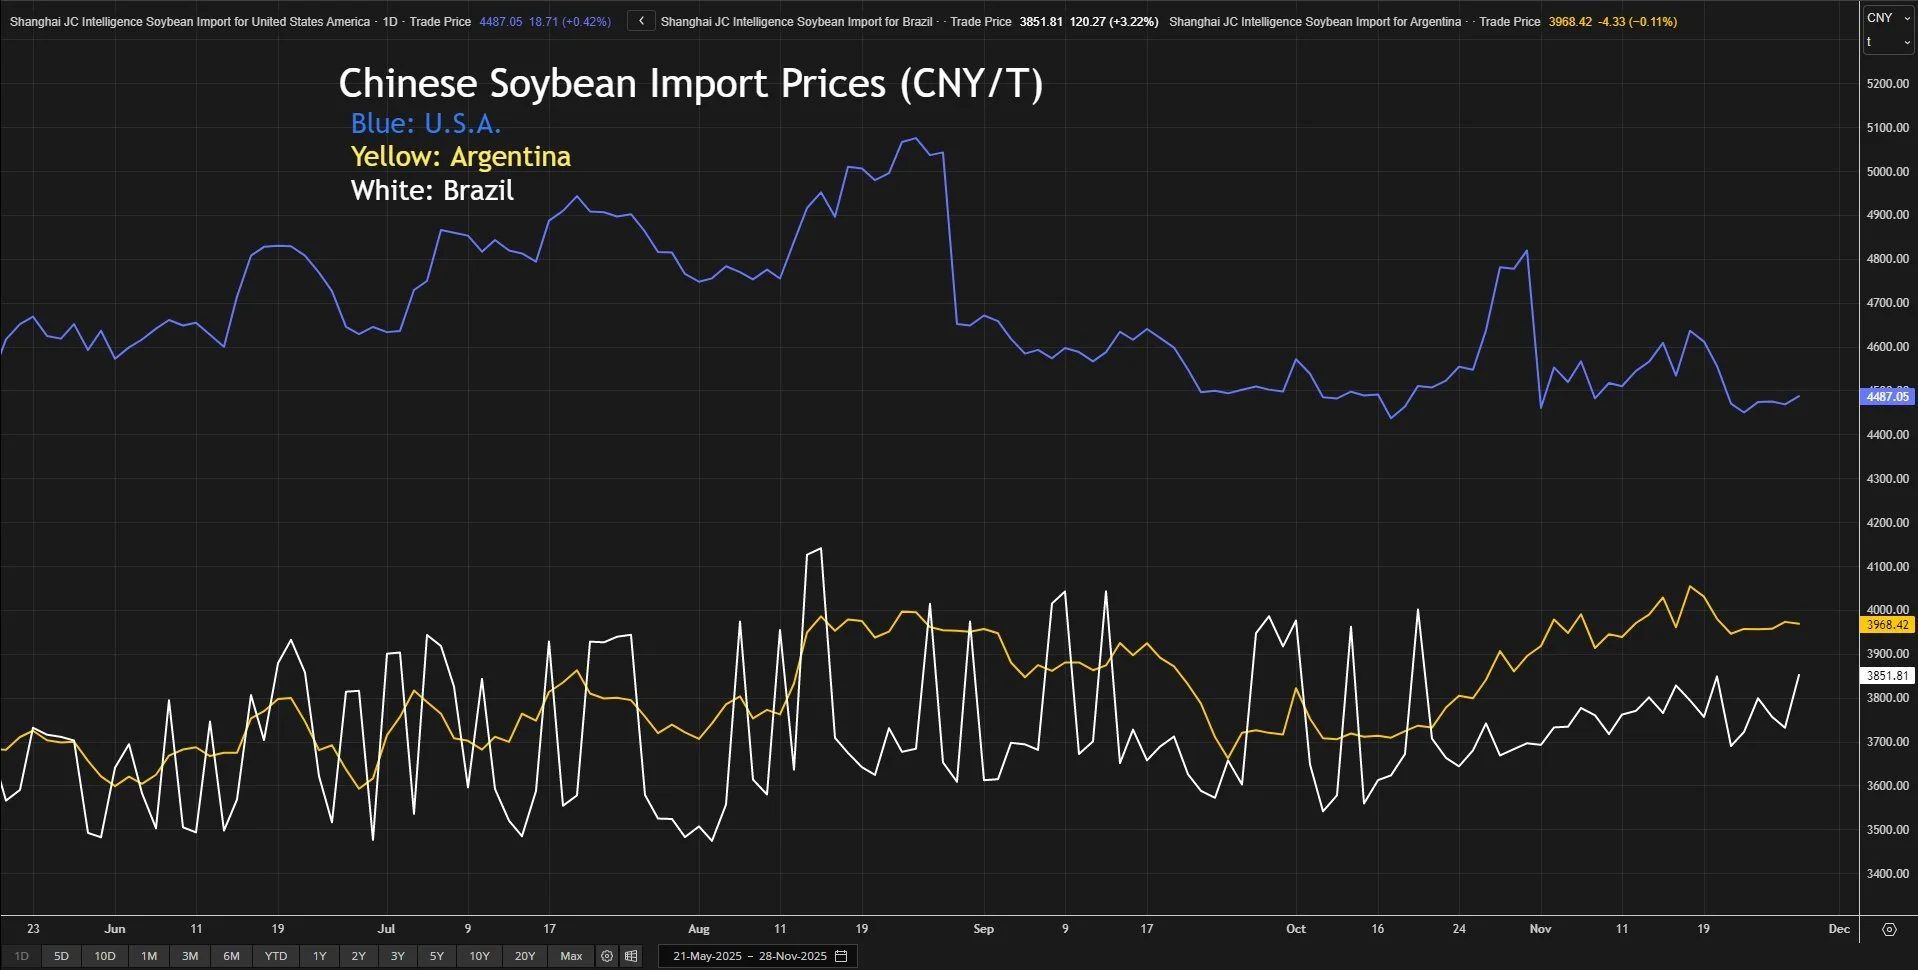
I believe China only has around 30% of their needs for February covered right now.
On one hand, yes Brazil's beans are cheaper than ours for China to buy (chart below).
So why would China buy ours?
It's a great question.
But if you are China, and you are trying to negotiate all of these deals to help your country.
Wouldn’t you just use soybeans as a throw-in into the deal? Essentially a goodwill offering.
Because soybeans are such a small fraction of the deals they are trying to make in the grand scheme of things.
Chart from Matt of Blue Line Futures
If we see actualy details and confirmation of a trade deal, that should help support beans and be enough for some more upside.
However, to get some majorly bullish story in soybeans, it very well could take some issues out of Brazil.
(Unless of course US production surprises low, which we've talked about several times before. You should all know how little room for error is on the US balance sheet).
We already have the low acres here in the US. China is supposedly going to be buying a bunch of soybeans. A weather issue in Brazil would be gas to the fire.
Obviously it doesn’t have to happen. But soybeans have the more "potential" than corn because there is a more clear path.
Brazil is clearly the most dominant player in the global soybean market.
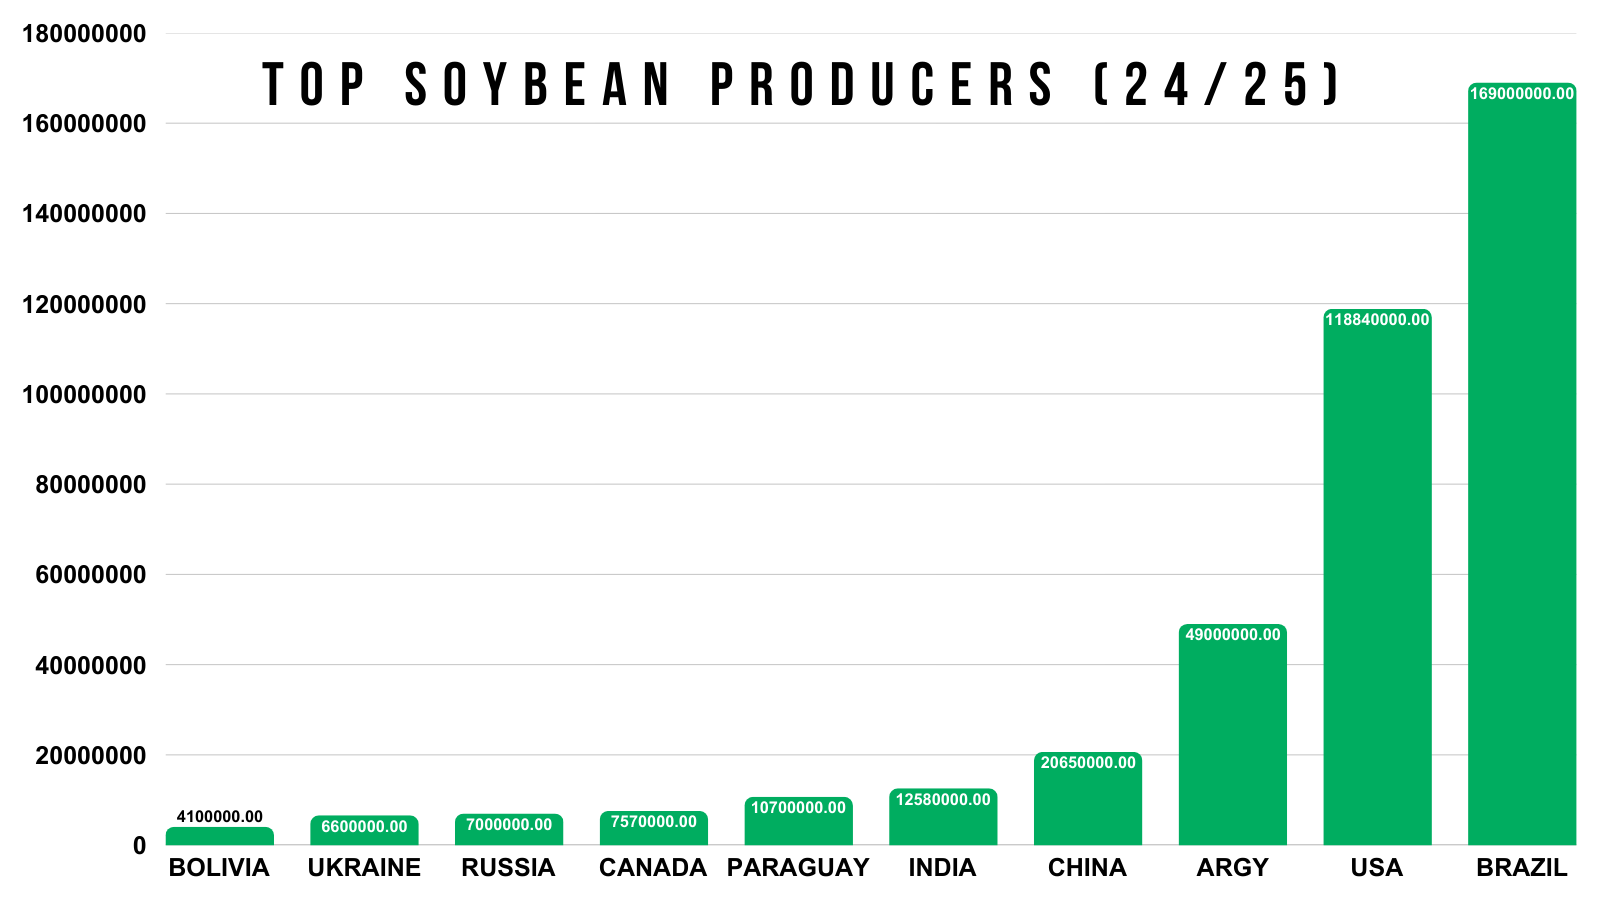
The world is counting on a big crop out of Brazil.
If that doesn’t happen, it shakes up the global trade in a big way.
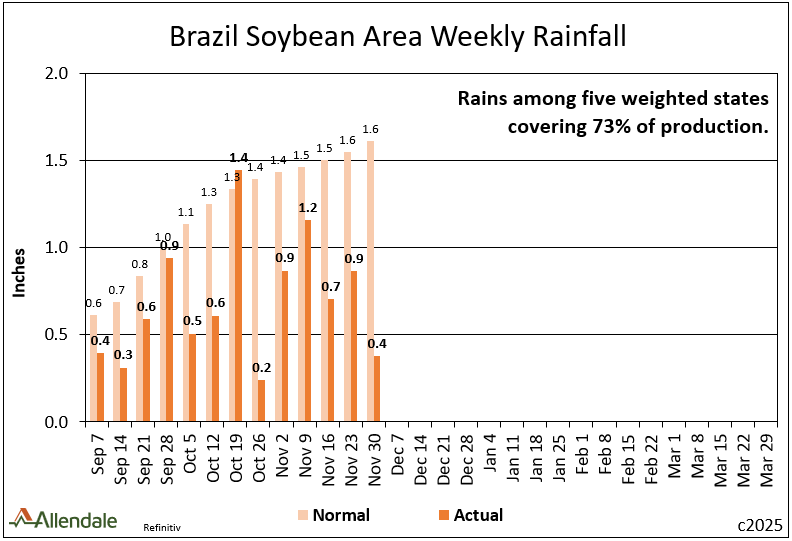
Right now, Brazil has actually been pretty dry.
Over the last month, rain in Brazil has been -49% below normal.
Chart from Rich Nelson of Allendale
Rain in Argentina has also been -33% less than normal the past month.
Chart from Rich Nelson of Allendale
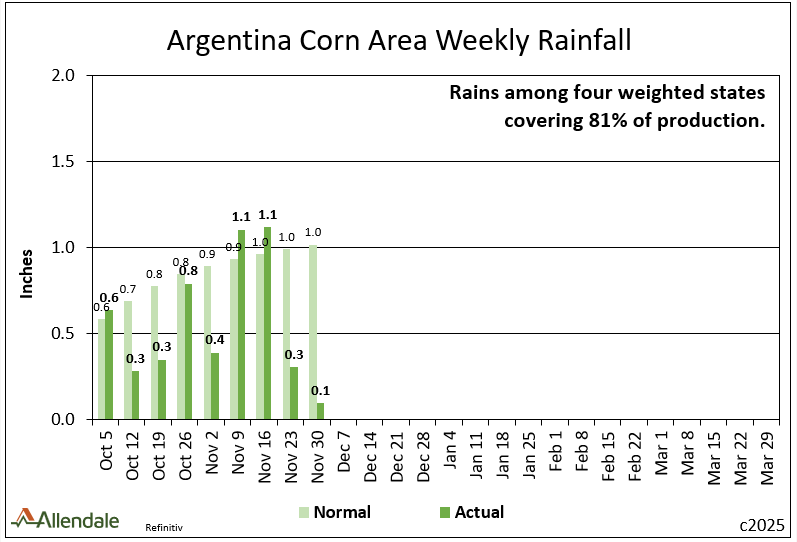
So South America needs rain. However, it is still too early to be calling for any sort of drought or issue there.
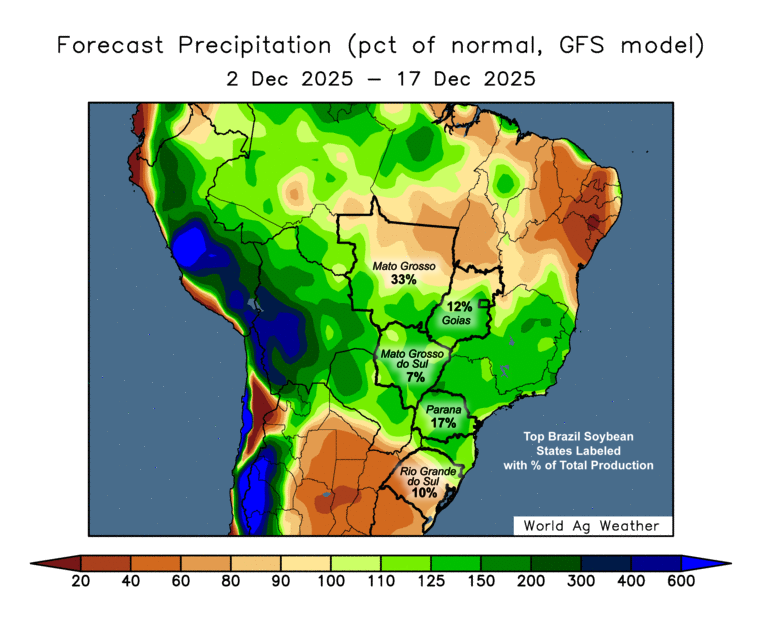
The weather over the next 60 days is what really matters.
They need rain, but the forecasts aren’t super threatening yet either.
As they are expected to see some rain over the next 2 weeks.
The recent dryness was enough for some analysts to start to slightly trim their estimates for the crop however.
For example,
StoneX just lowered their soybean crop by -0.9% (still a record)
While also lowering their corn crop by -0.6%.
So people are taking notice, but the dryness in Brazil isn’t enough to make a substantial impact yet.
Technicals:
Jan Beans
Since we took risk off the table at $11.55
Our next target is still $12.00
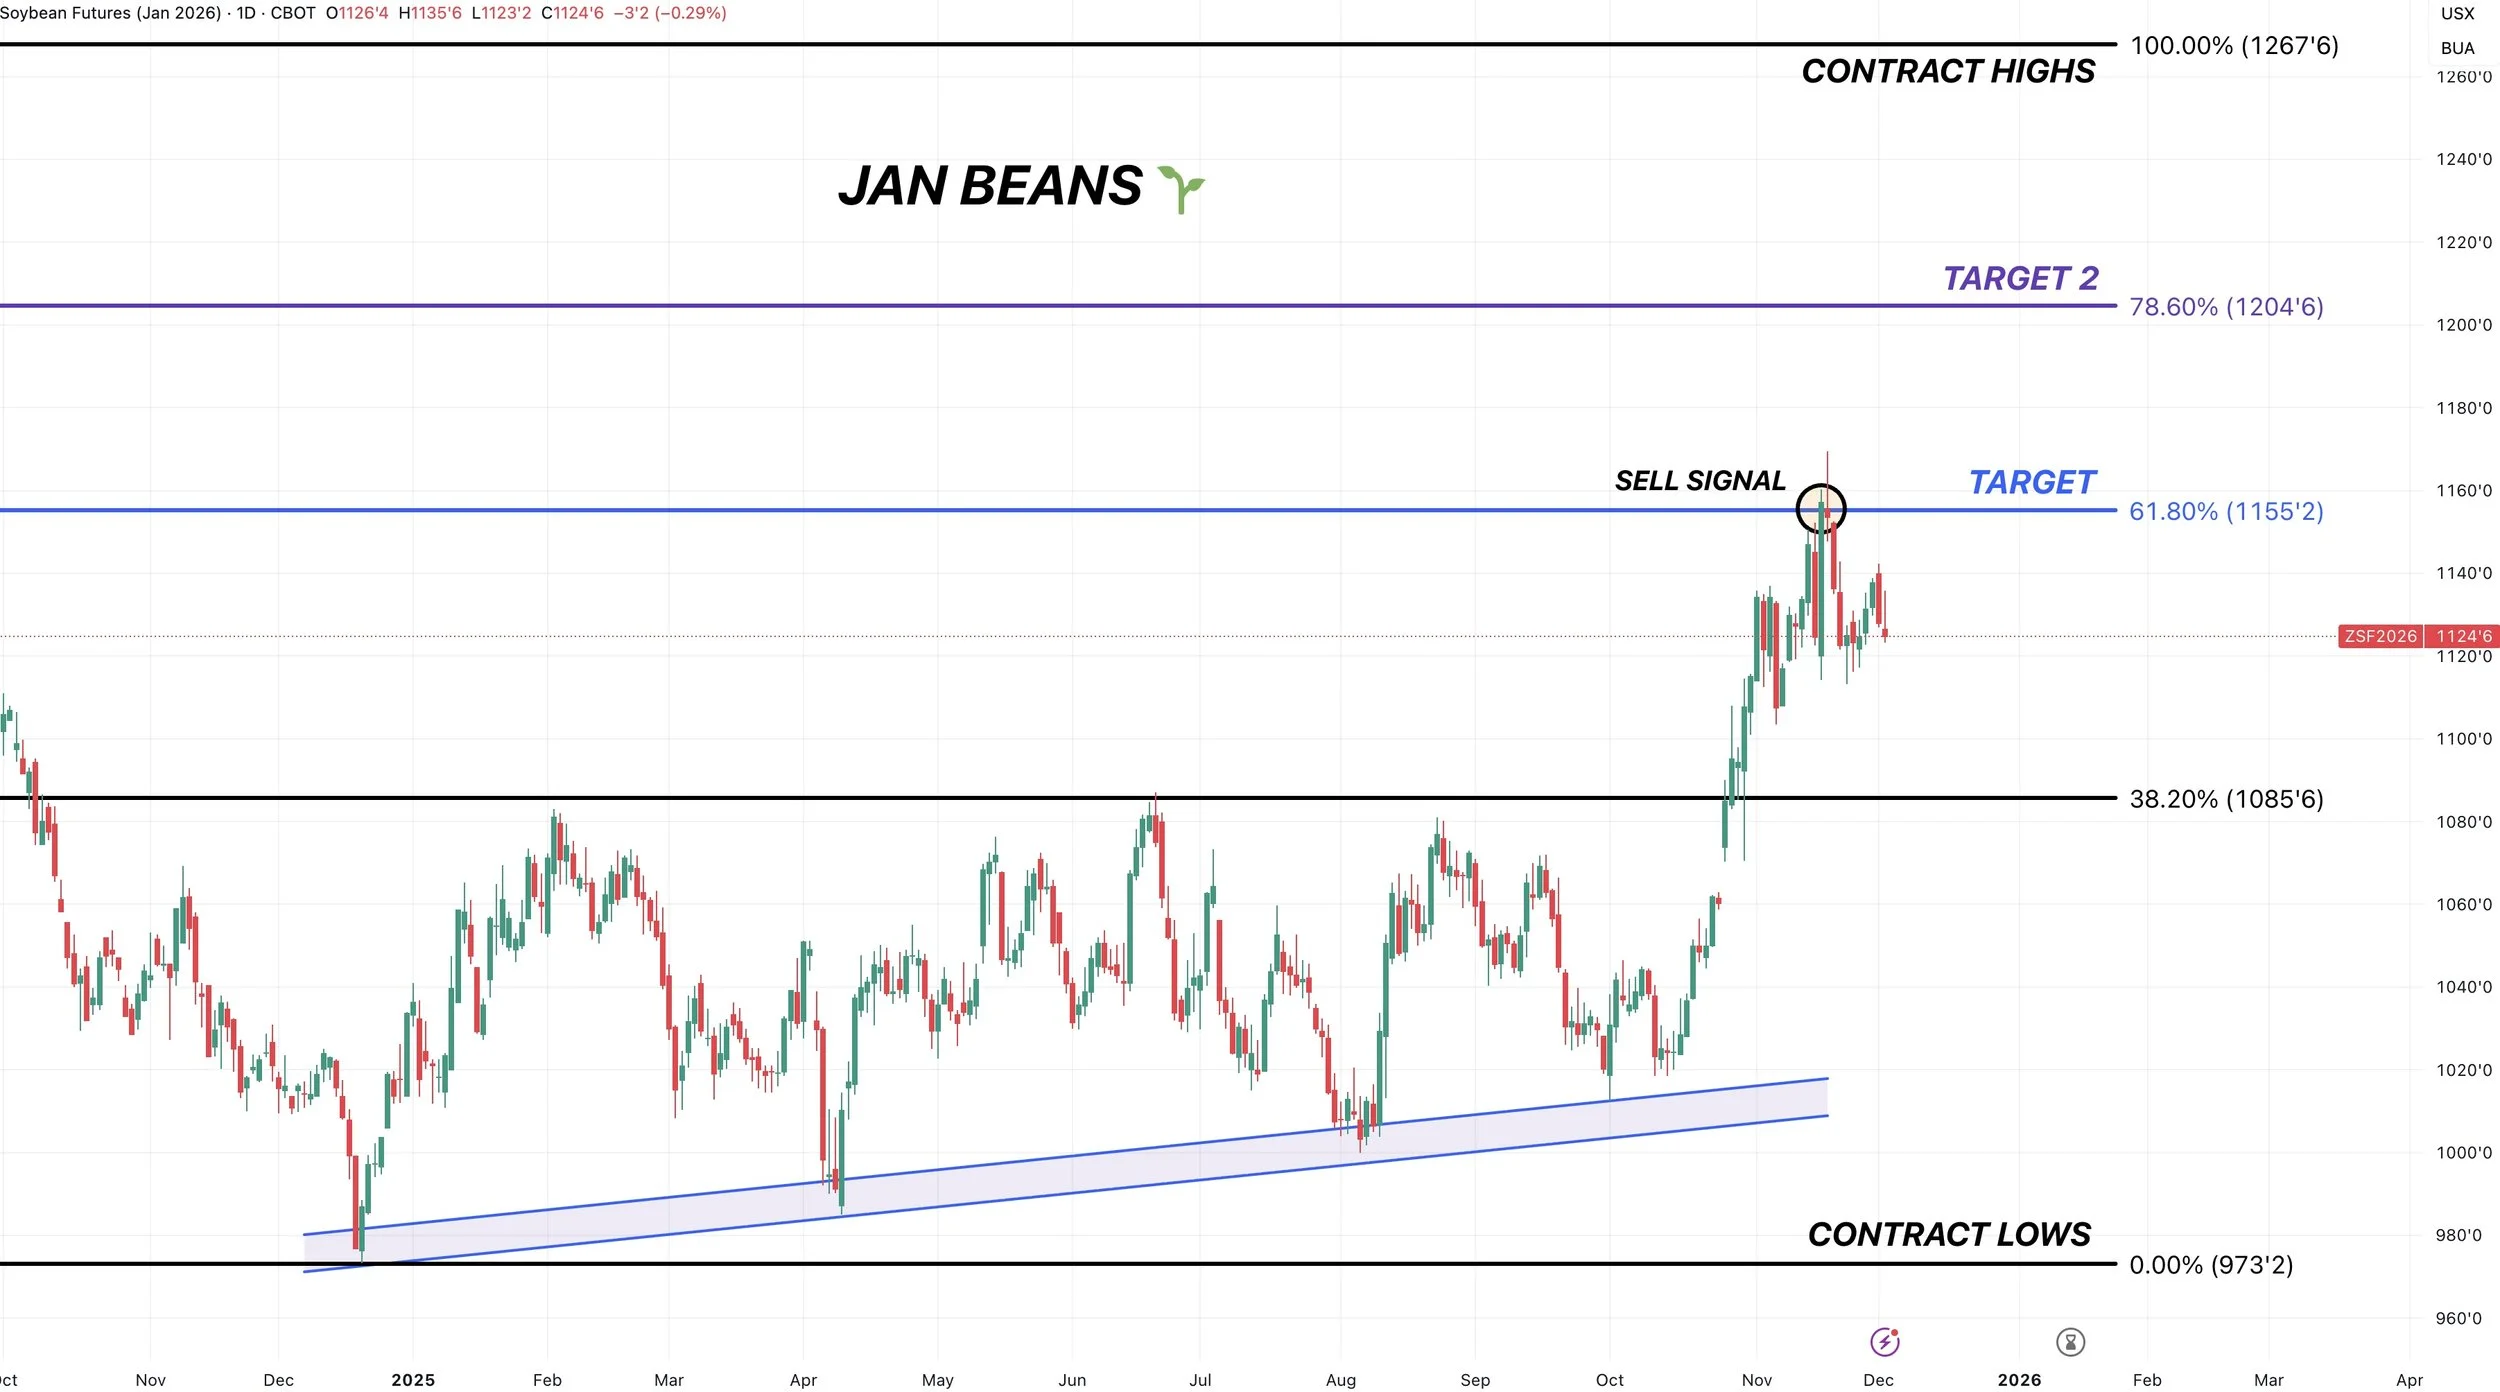
To the downside, ultimately, bulls need to hold $11.08
That gives back 61.8% of where we gapped open higher on the China news (red lines).
Failure to hold that level could create an even bigger leg lower. The next point of interest would be the 50-61.8% retracements of the entire rally (green box).
Which also lines up with a re-test of that old yearly resistance turned to new support.
To be more confident the bottom is in, we want to close above $11.48. As that gives back 61.8% of the sell off (gray box).

We do also have a potential head and shoulders pattern here. Which is viewed as bearish.
These only play out 60% of the time.
If you close above the right shoulder this pattern usually becomes invalid.
Regardless, something to be cautious of.

Wheat
We already talked about the Russia news.
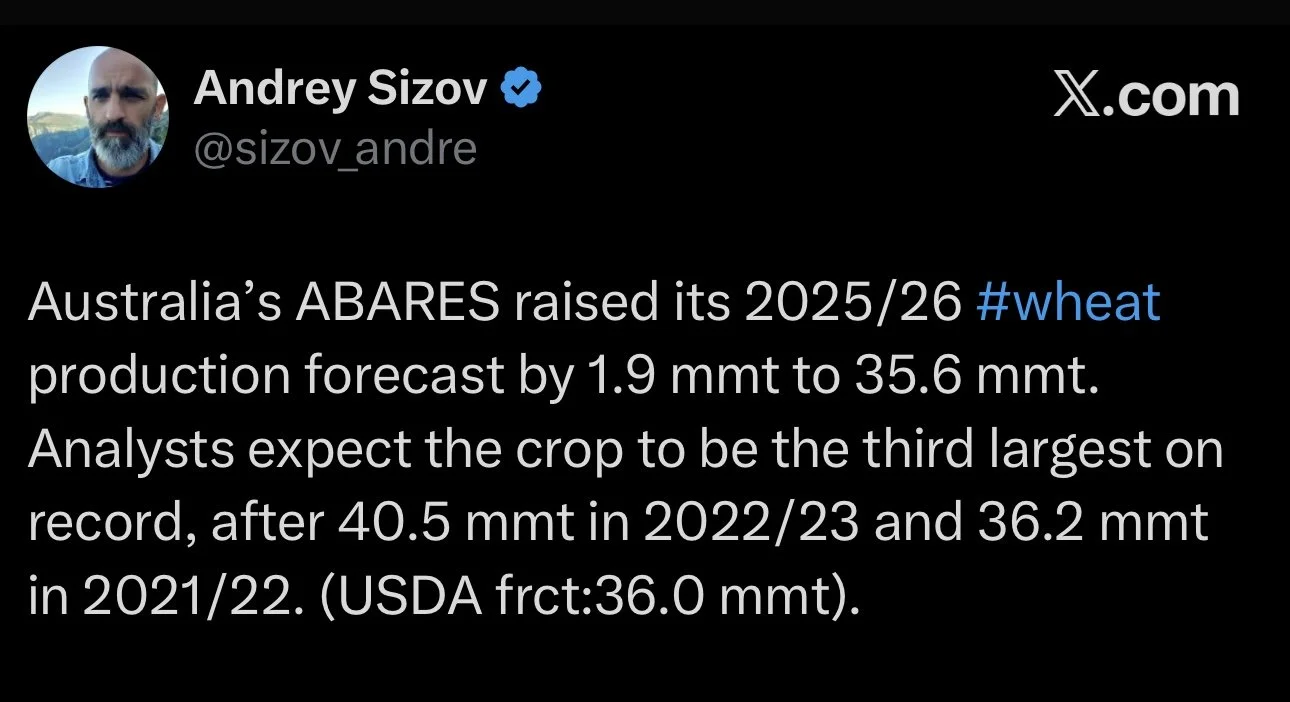
Outside of that, we did have some small headlines out of Australia.
Australia's Department of Ag raised their forecast for their wheat crop by 5.5%.
Which would be nearly 30% bigger than the 10-year average and their 3rd largest crop on record.
Does this matter a whole lot?
It certainly doesn’t help.
But it's not some overly bearish factor as Australia only accounts for 4% of the world's wheat production.
Either way, ample global supplies is what is keeping a lid on the wheat market. There is just too much wheat to go around on a global scale.
US demand for wheat is the bright spot of the market.
Export inspections are the best in over a decade.
We still have too much supply, but if you look at this chart from Pro Farmer that shows the USDA estimates (red line) we could very easily see exports bumped on the balance sheet.
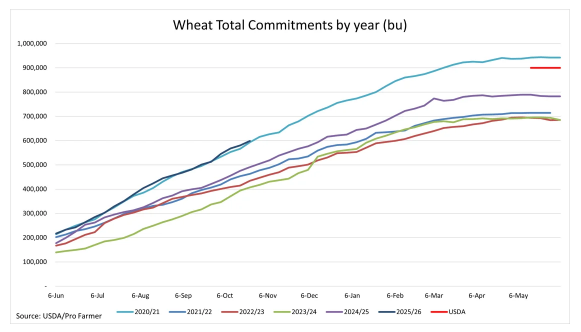
It's great to see demand being the strongest in over a decade.
Because the US wheat situation isn’t exactly bullish currently.
Technicals:
March Wheat
We continue to find life at the must hold spot.
The golden zone, after giving back 61.8% of the entire rally.
If we are going to bounce, this would be the spot.
Failure to hold likely results in a test of contract lows.
Hold here, and the trend is still higher.
Currently still targeting the green box to take some risk off the table.

Dec KC Wheat
Exact same set up in KC.
Bouncing right in the golden zone.
If we are going to bounce and turn this thing around, it should be here.
If we fail to hold this level, it will open the door lower.
Targeting the green box.

Cattle
The cattle market is actually higher than it was before the Tyson foods announcement that resulting in a sell off.
As cattle has traded higher 3 of the last 4 days.
I don’t we are out of the woods yet long term as the government is still vocally trying to lower prices, but I do think we could’ve perhaps found a short term bottom here for now.
Trump is still making comments about cattle. Such as this today:
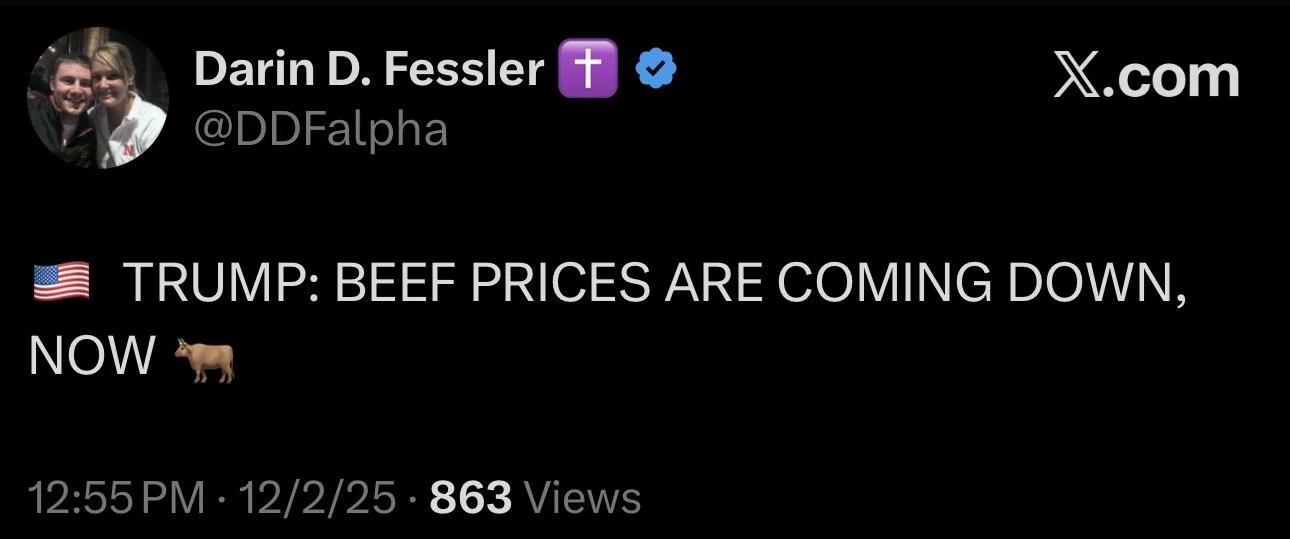
Technicals:
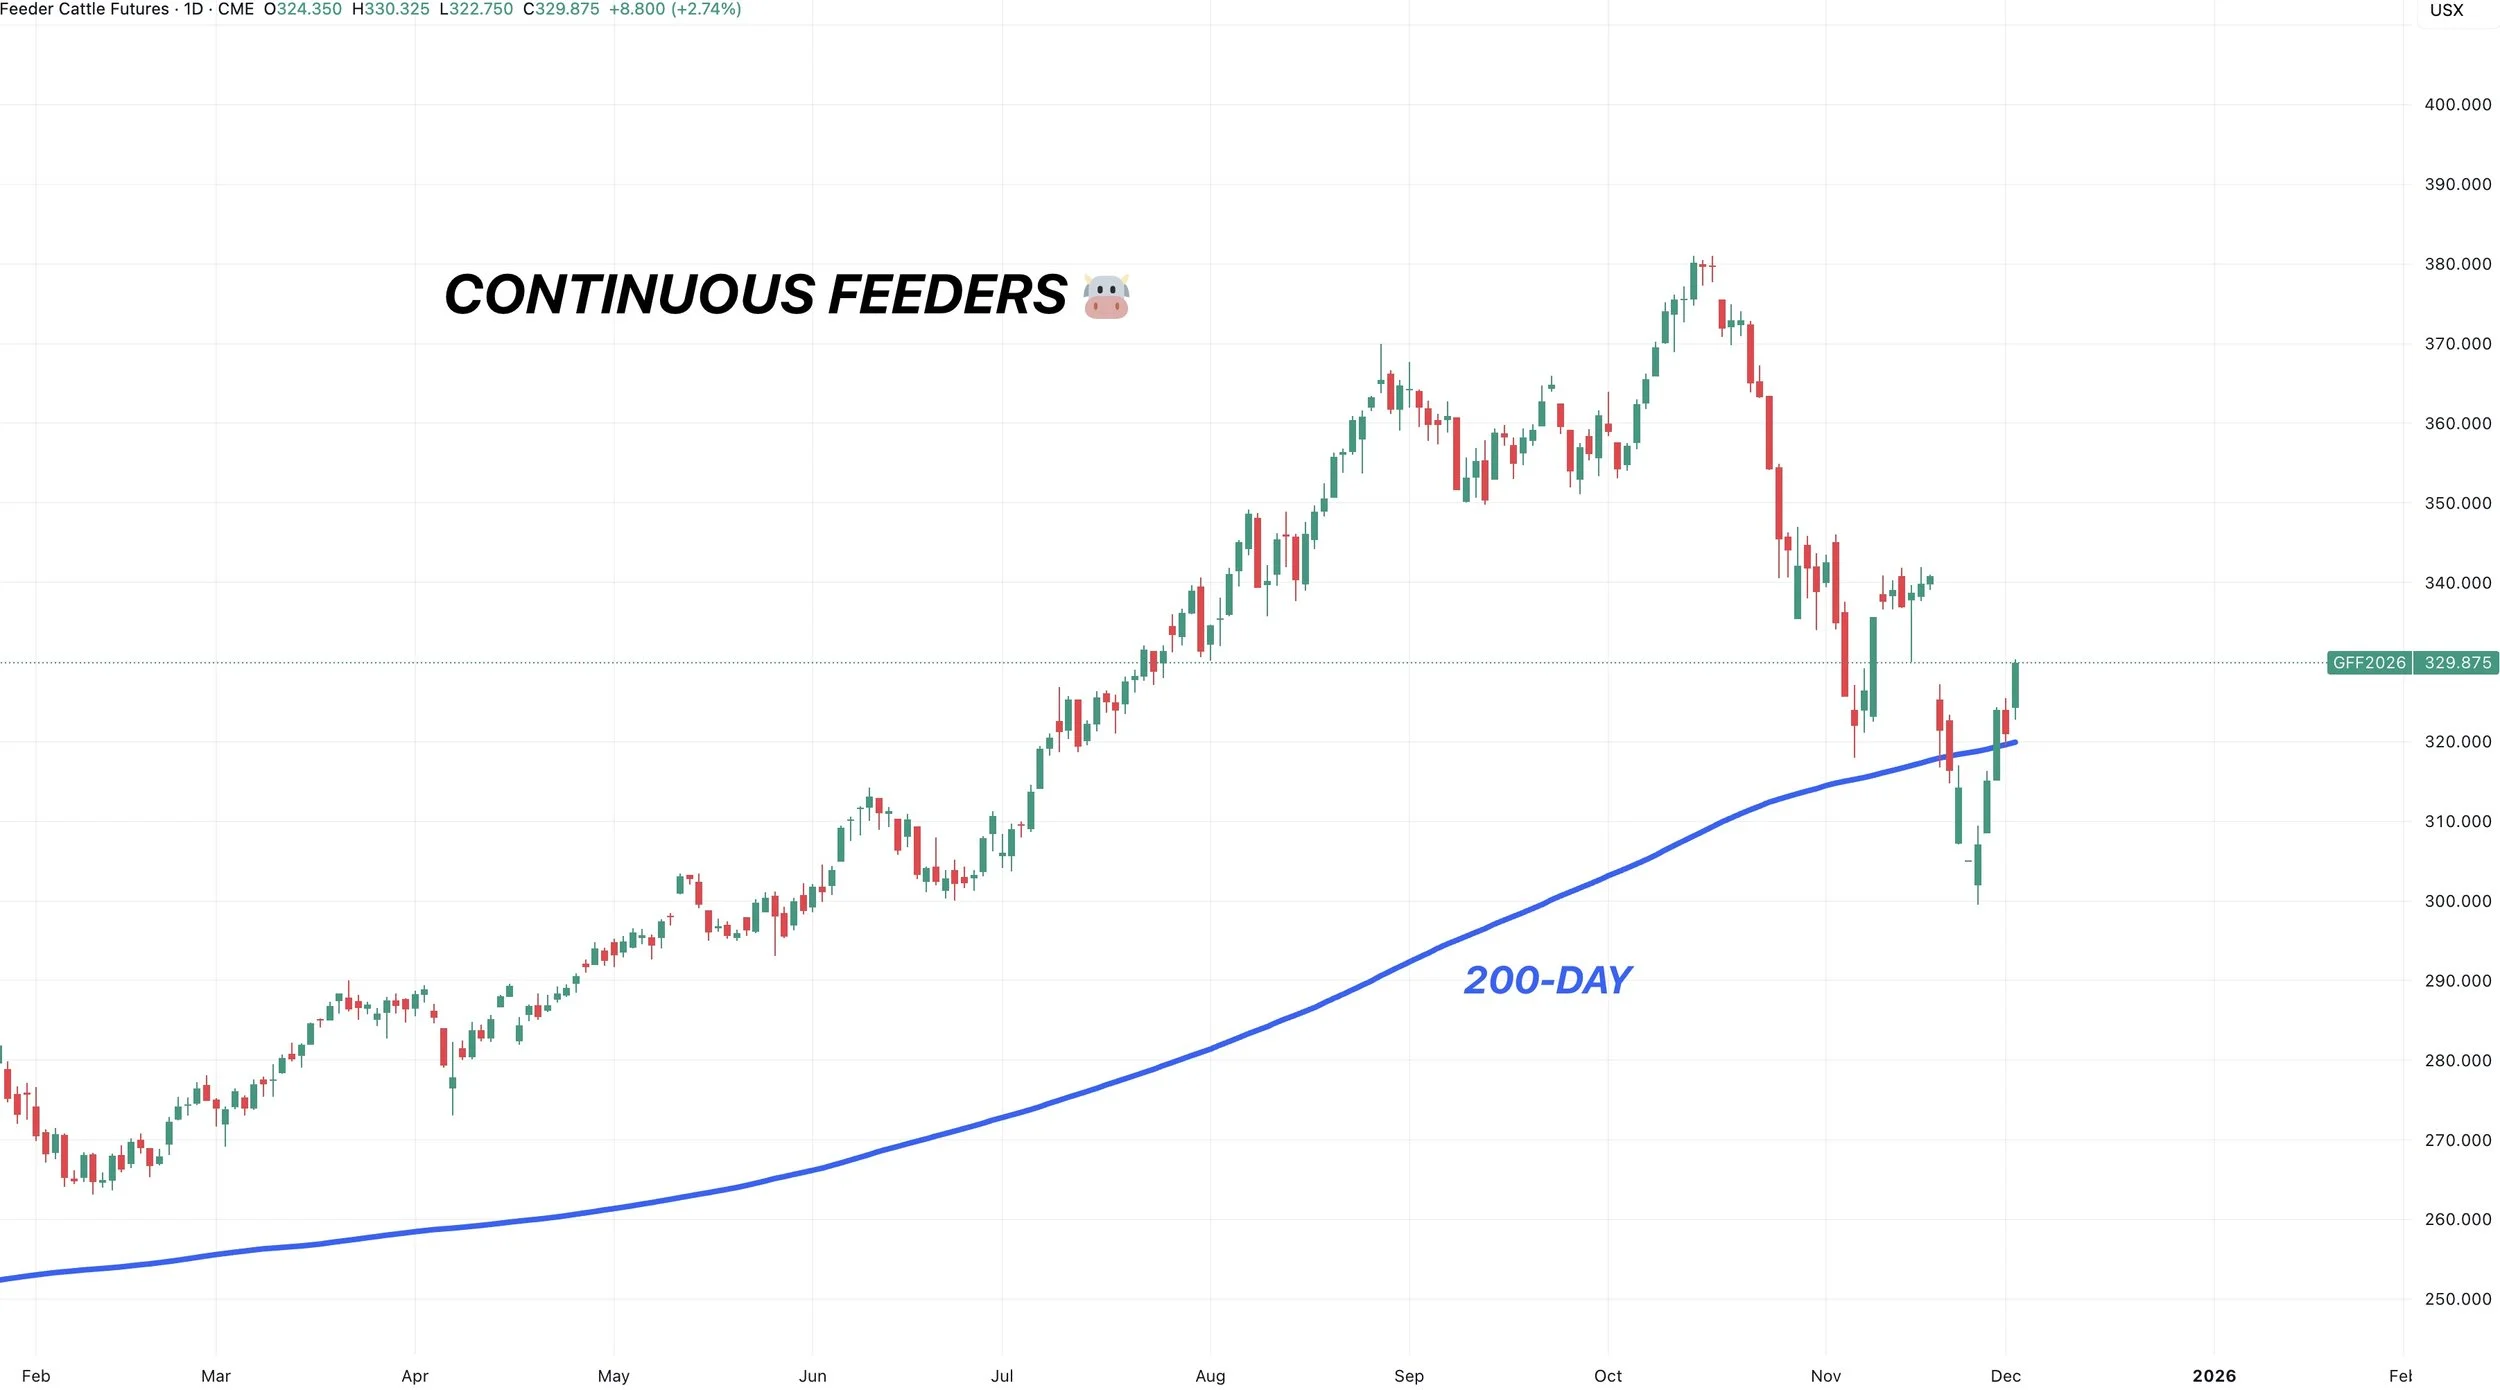
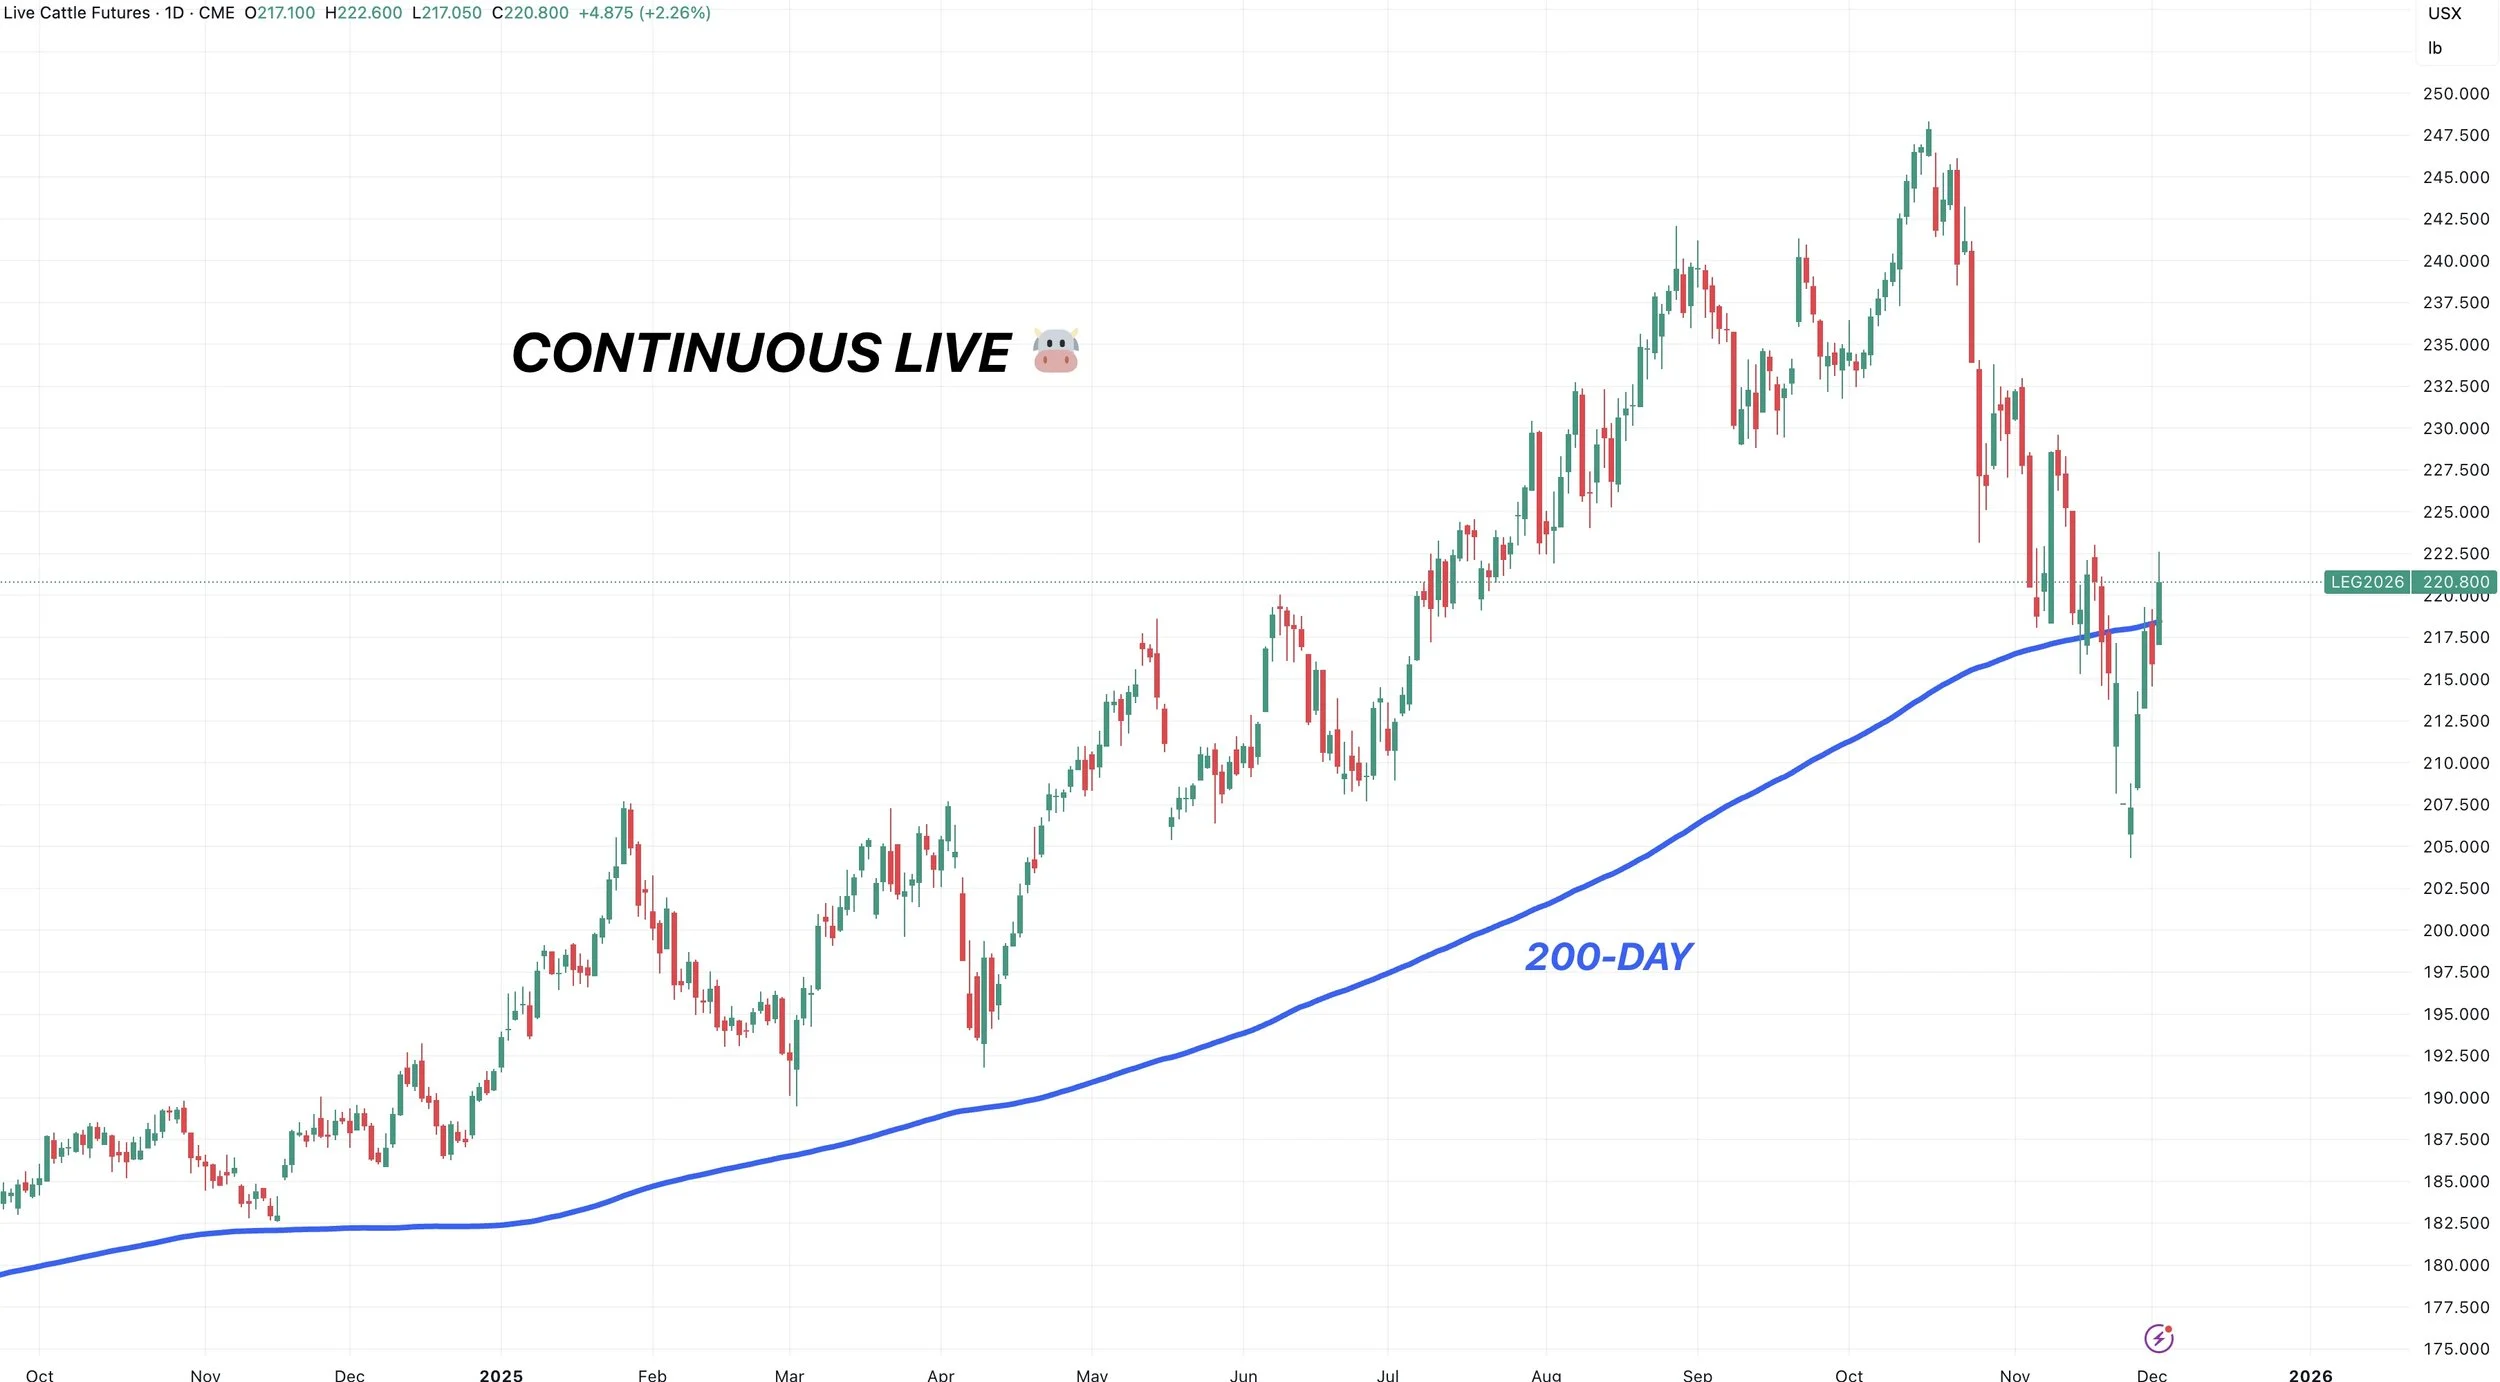
Continuous Feeders & Live
First we are going to take a look at the continuous charts.
If you watched my video last week, we talked about the 200-day MA on these charts being an important spot.
Both feeders and live cattle are above the 200-day MA on the continuous charts.
This tells us that there is a chance we have posted a short term local bottom here.
If this truly is the bottom, where should we be looking to de-risk?
(Scroll for next targets)
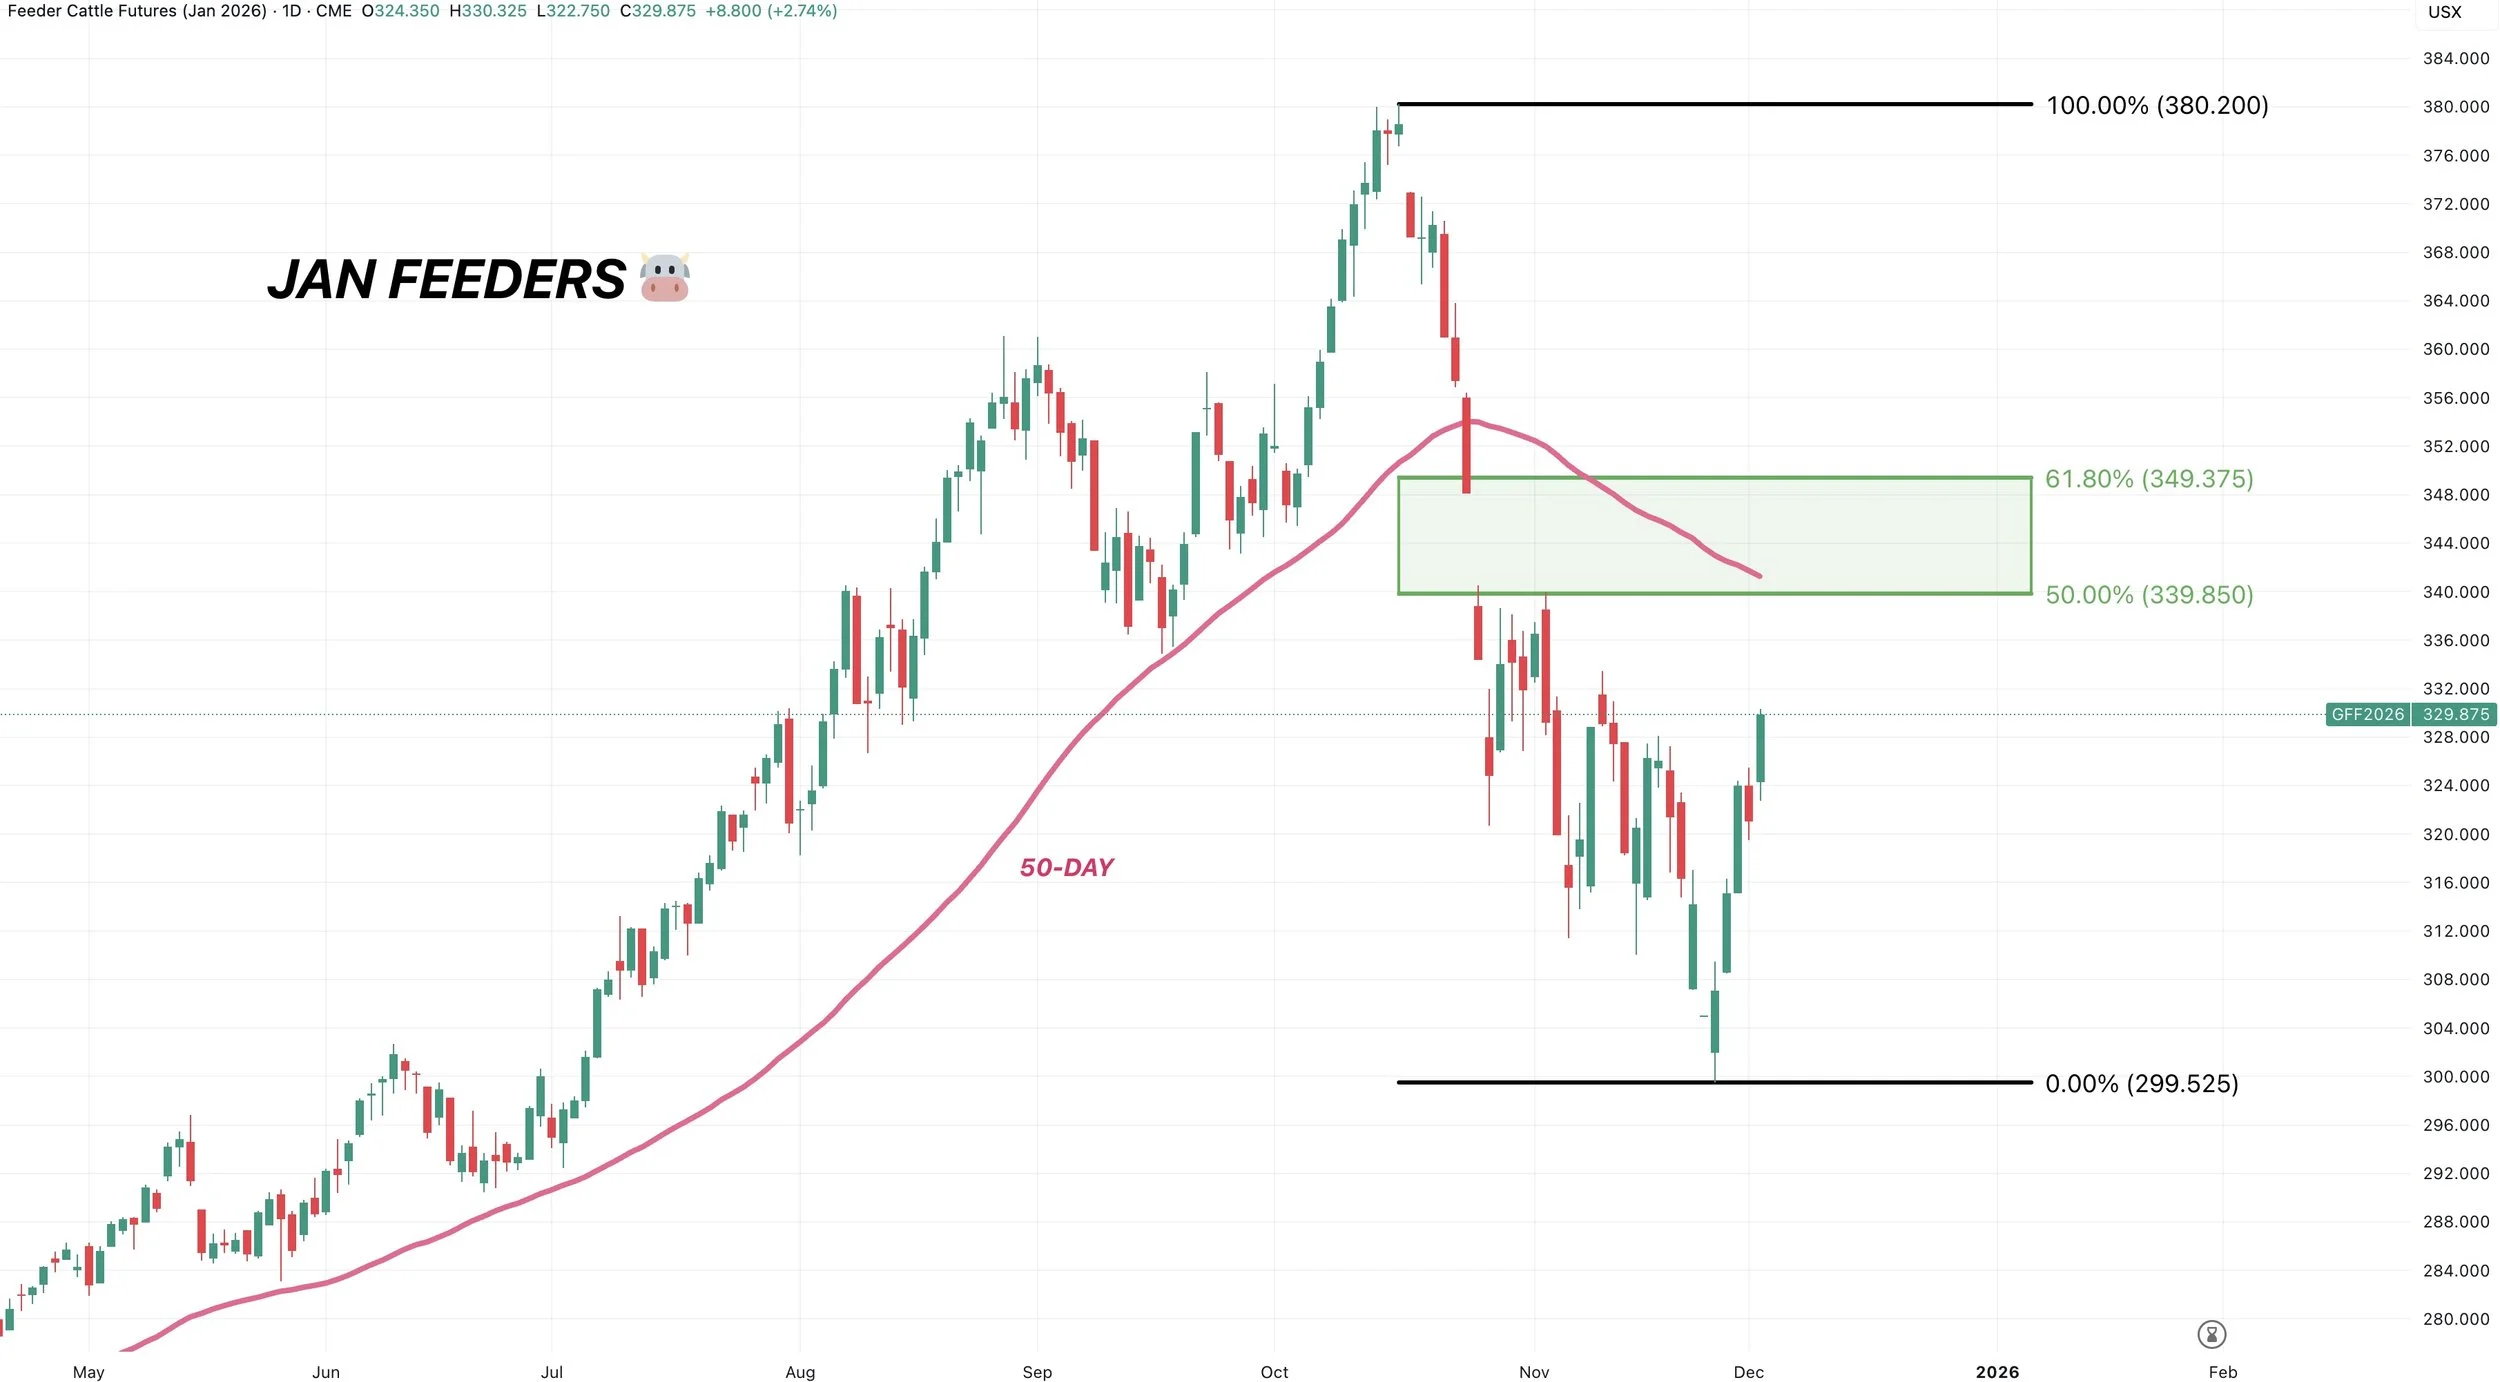
Jan Feeders
339 to 349 claws back 50-61.8% of this entire sell off.
That is going to be a pretty big point of interest if we get up there.
Like we talk about all the time, that is called the golden zone.
The most common place for prices to revert back to before making a decision.
I would be taking advantage of a move there if it comes.
Feb Live
227 to 232.5 reclaims 50-61.8% of the sell off.
That is where we want to take advantage of the rally if it comes.
Not only is it the golden zone, but the 50-day MA sits right in that area as well. The 50-day used to be major support. Since we broke it, it's now resistance.

Past Sell or Protection Signals
Nov 17th: 🌱
Soybean sell signal & hedge alert.
Nov 13th: 🌽 🌱
Managing risk in corn & beans ahead of USDA report.
Oct 28th: 🌽
Corn sell signal & hedge alert.
Oct 27th: 🌱
Soybean sell signal & hedge alert.
Oct 13th: 🐮
Cattle sell signal & hedge alert.
Aug 22nd: 🌱
Soybean sell signal & hedge alert.
July 31st: 🐮
Cattle sell signal & hedge alert.
July 10th: 🐮
Cattle sell signal & hedge alert.
CLICK HERE TO VIEW
June 5th: 🐮
Cattle sell signal & hedge alert.
June 2nd: 🌾
MPLS wheat sell signal.
April 10th: 🌽
Old crop corn sell signal.
March 19th: 🐮
Cattle hedge & sell signal.
Feb 18th: 🌽 🌾
Old crop KC wheat & old crop corn signal.
Jan 23rd: 🌽 🌱
Corn & beans old crop sell signal.
CLICK HERE TO VIEW
Jan 15th: 🌽 🌱
Corn & beans hedge alert/sell signal.
Jan 2nd: 🐮
Cattle hedge alert at new all-time highs & target.
Dec 11th: 🌽
Corn sell signal at $4.51 200-day MA
CLICK HERE TO VIEW
Oct 2nd: 🌾
Wheat sell signal at $6.12 target
Sep 30th: 🌽
Corn protection signal at $4.23-26
Sep 27th: 🌱
Soybean sell & protection signal at $10.65
Sep 13th: 🌾
Wheat sell signal at $5.98
May 22nd: 🌾
Wheat sell signal when wheat traded +$7.00
Want to Talk?
Our phones are open 24/7 for you guys if you ever need anything or want to discuss your operation.
Hedge Account
Interested in a hedge account? Use the link below to set up an account or shoot Jeremey a call at (605)295-3100.