
GRAIN MARKET GAME PLANS
AUDIO COMMENTARY
Cattle hit with screworm news
Get yourself comfortable in cattle
Soybeans not out of woods yet (chart below)*
Selling more and more corn around world
The issues with DP
Where KC needs to break (chart below)*
Keeping control of the grain
Need to watch upcoming acres
Low prices eventually cure low prices
We have massive corn stocks
One weather scare away from a totally different story in corn
Don’t dig the hole deeper
If you have to move corn soon
Less time you have, more active you have to be
What’s your cash goal?
Basis contract do and do nots
Corn, beans & wheat charts below audio*
Listen to today’s audio below
Want to talk? (605)250-3863
A FEW CHARTS
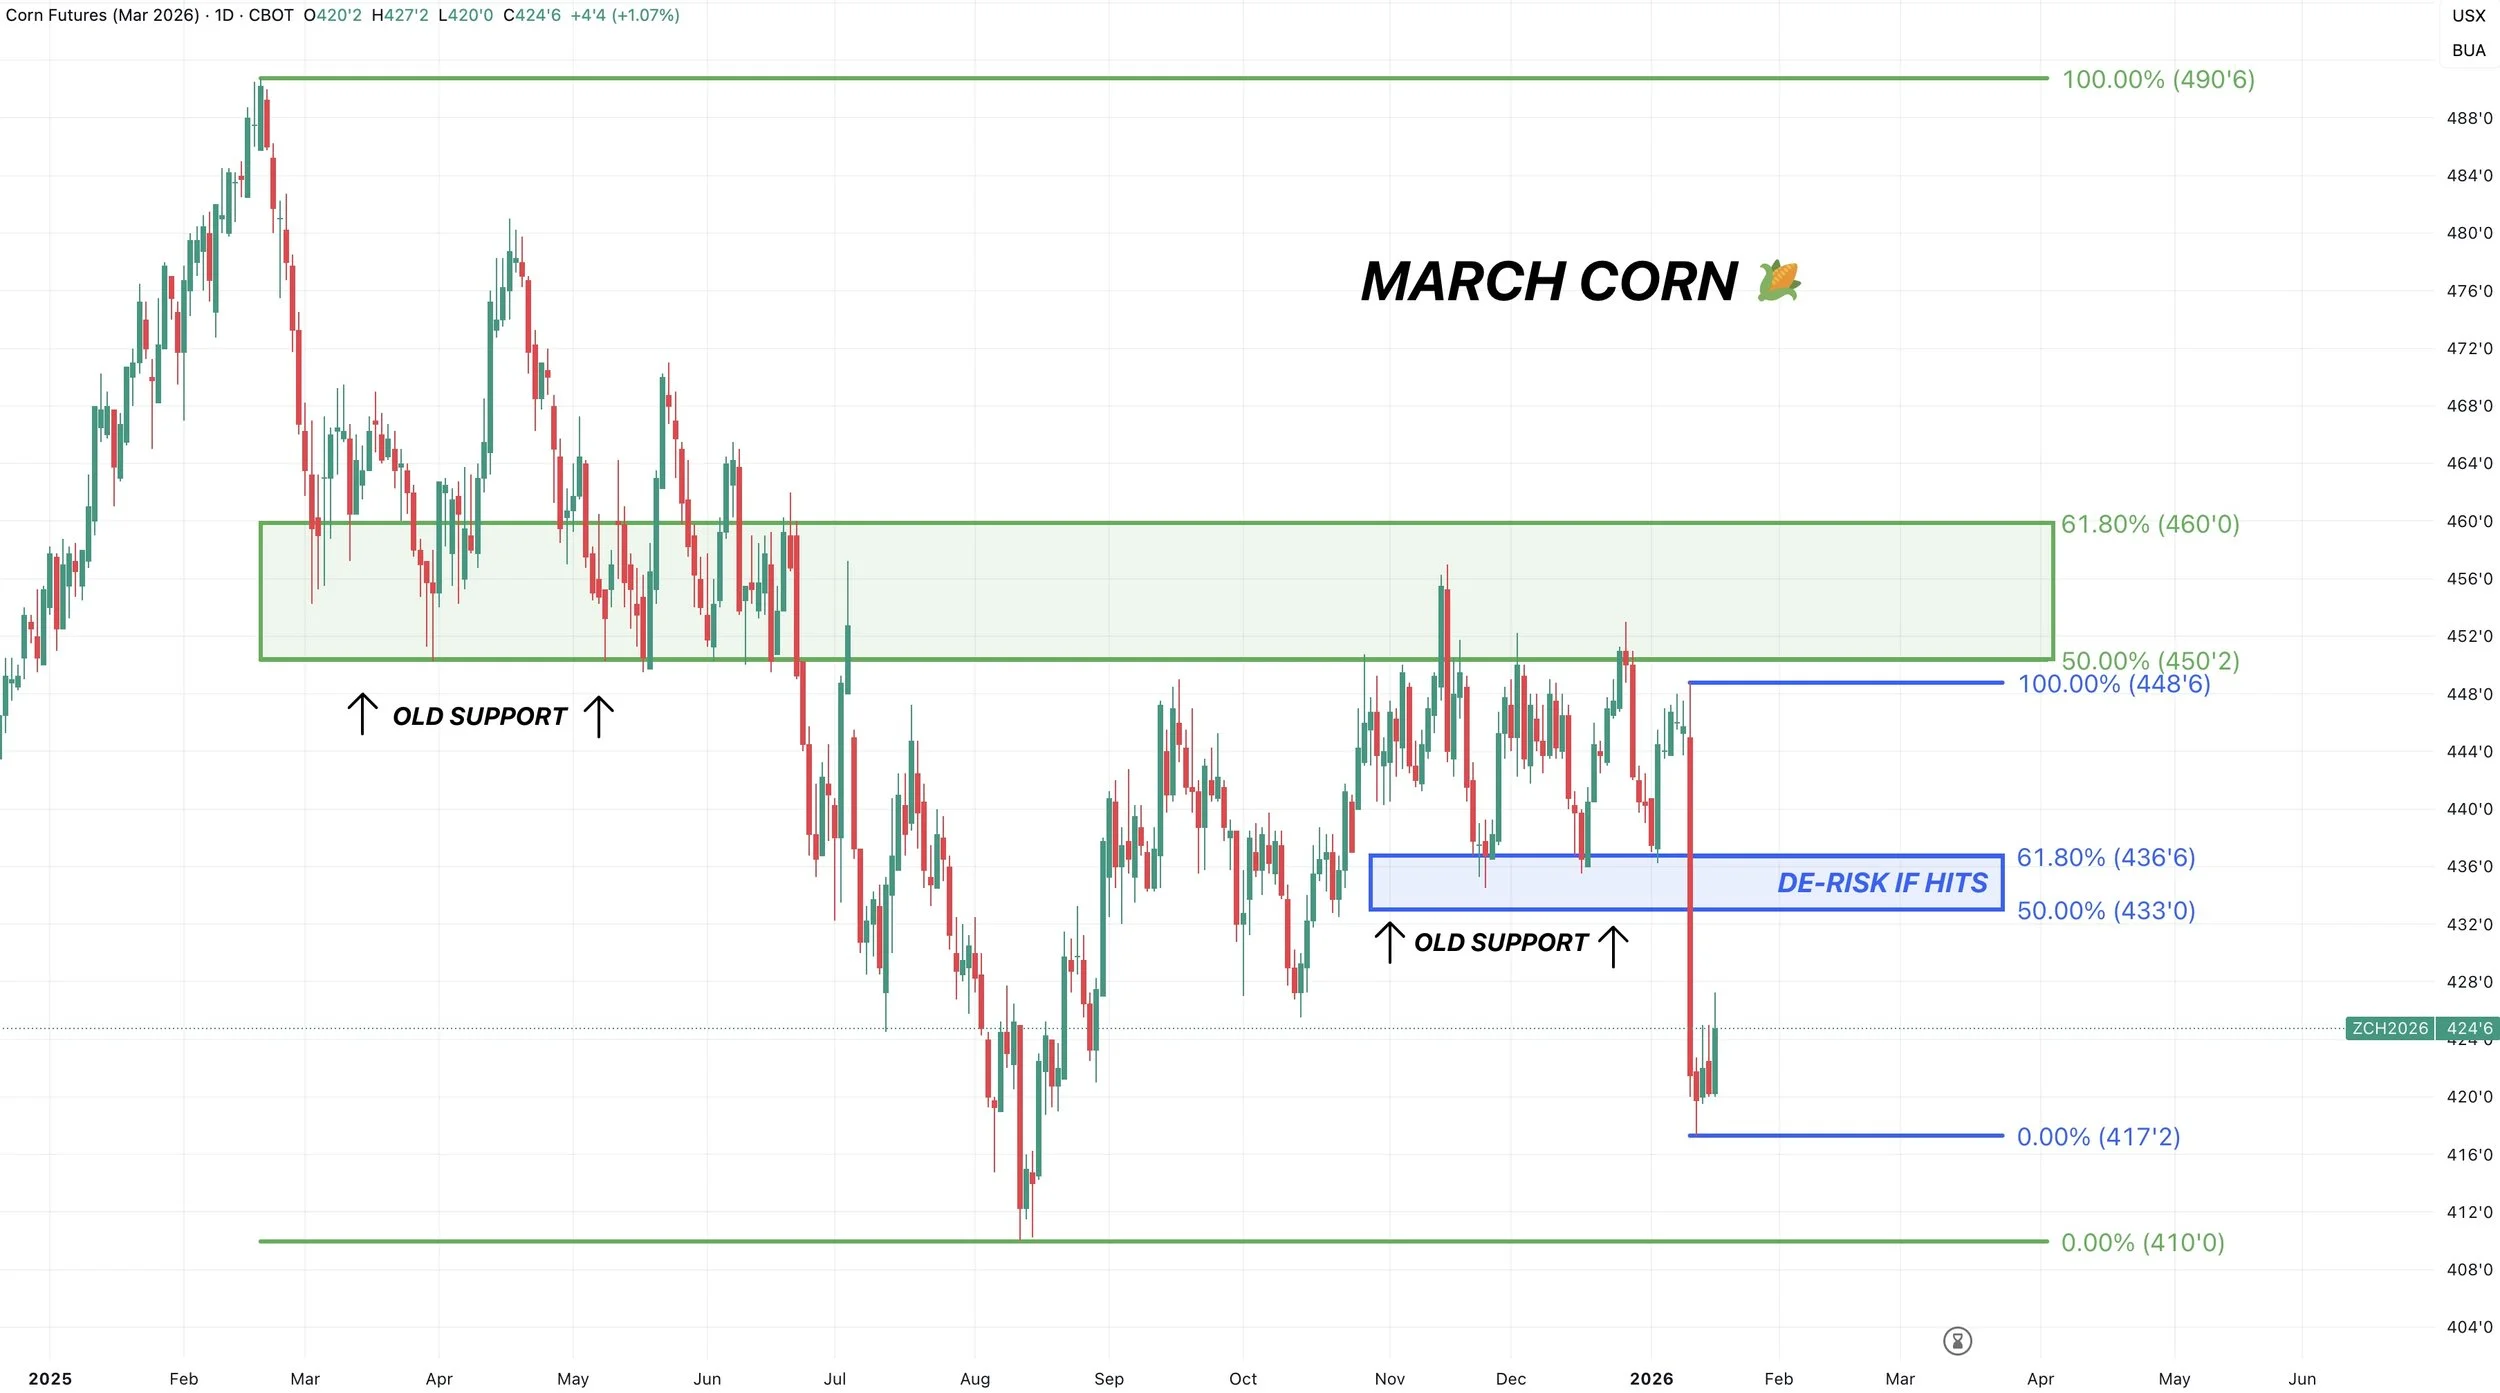
March Corn 🌽
Where should we de-risk if this is truly the bottom?
We can’t confidently say we’ve posted our definitive bottom.
However, if we have, we want to be looking to reward a move towards $4.35.
That claws back 50-61.8% of the entire sell off. It was old support as well.
The last rally off harvest lows? Ultimately failed after clawing back 50-61.8% of the Feb highs. That same level happened to be our support from spring. Hence why we took risk off the table in that green box at $4.50
Essentially the same thought process here but on a smaller time frame.
Again I can’t say we’ve found our lows and targets do not have to hit. But I can say that it would make sense to take risk off if we get up there.
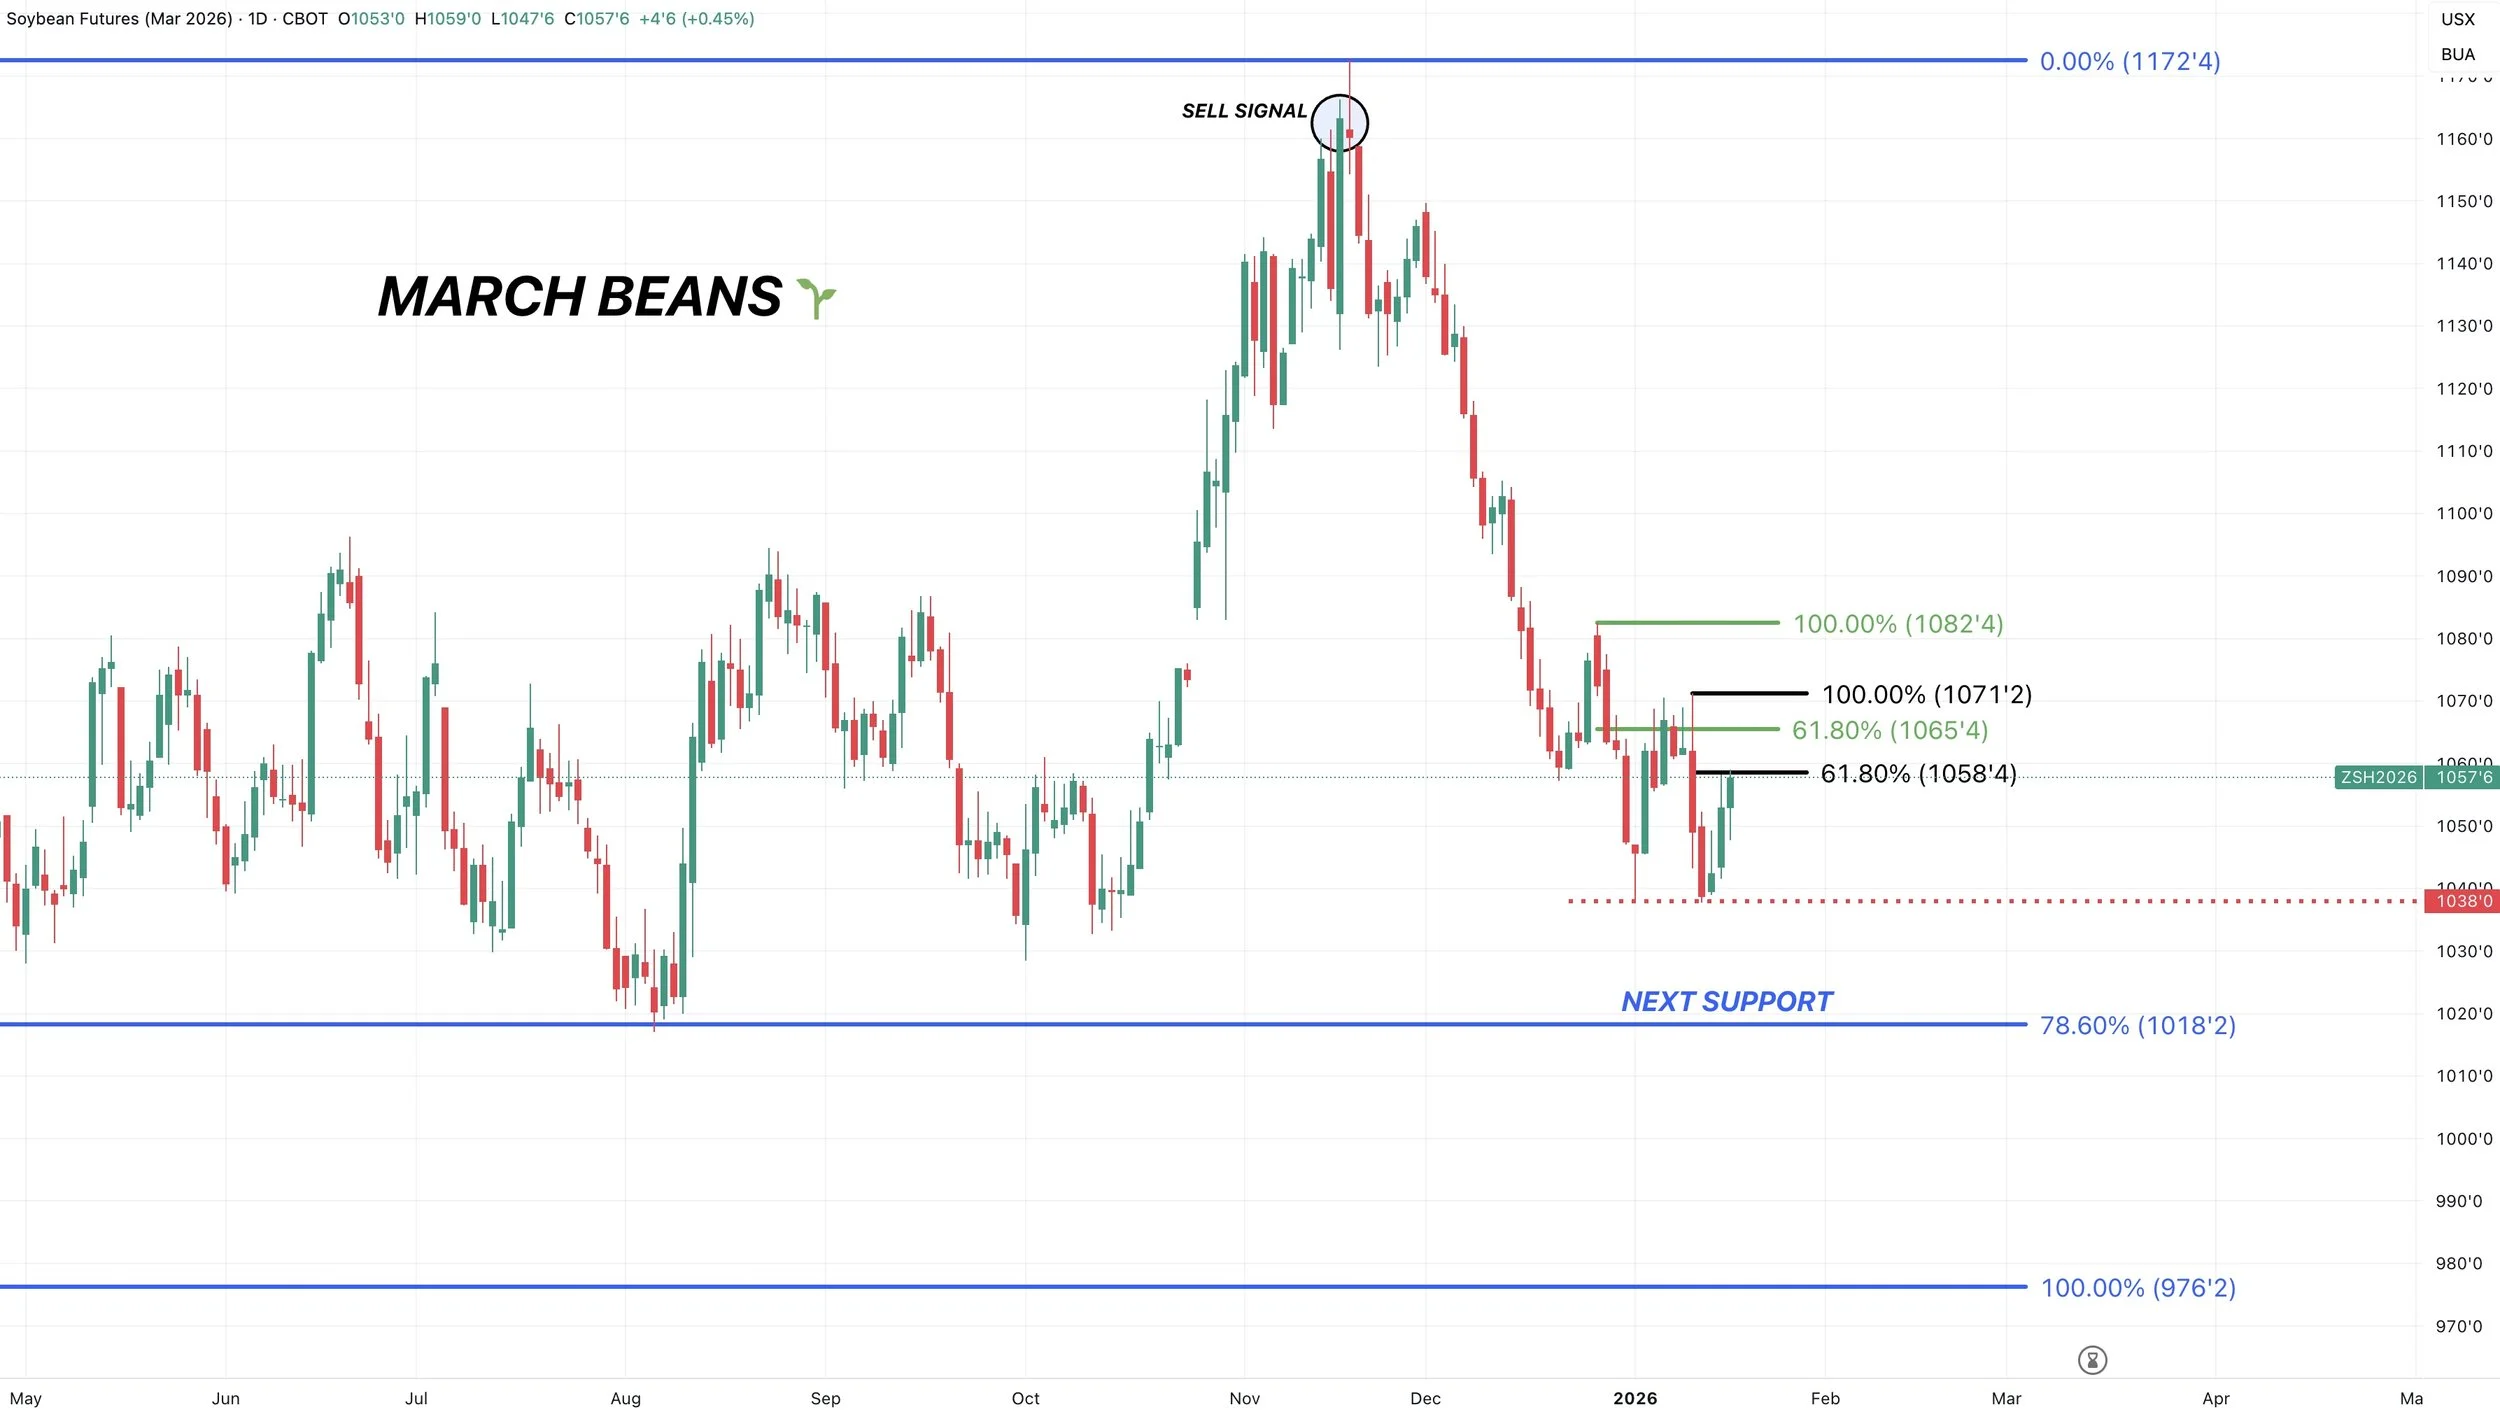
March Soybeans 🌱
Not out of the woods just yet.
There has been 3 separate bounces the last few weeks.
The 2nd one: failed after clawing back 61.8% of the 1st bounce.
We are on the 3rd one right now. So far we have perfectly clawed back 61.8% of the 2nd bounce.
The 61.8% level is the most common relief bounce level.
If we break above it, it often indicates we are in for some further upside.
I will have upside targets out if we get a real bounce going.
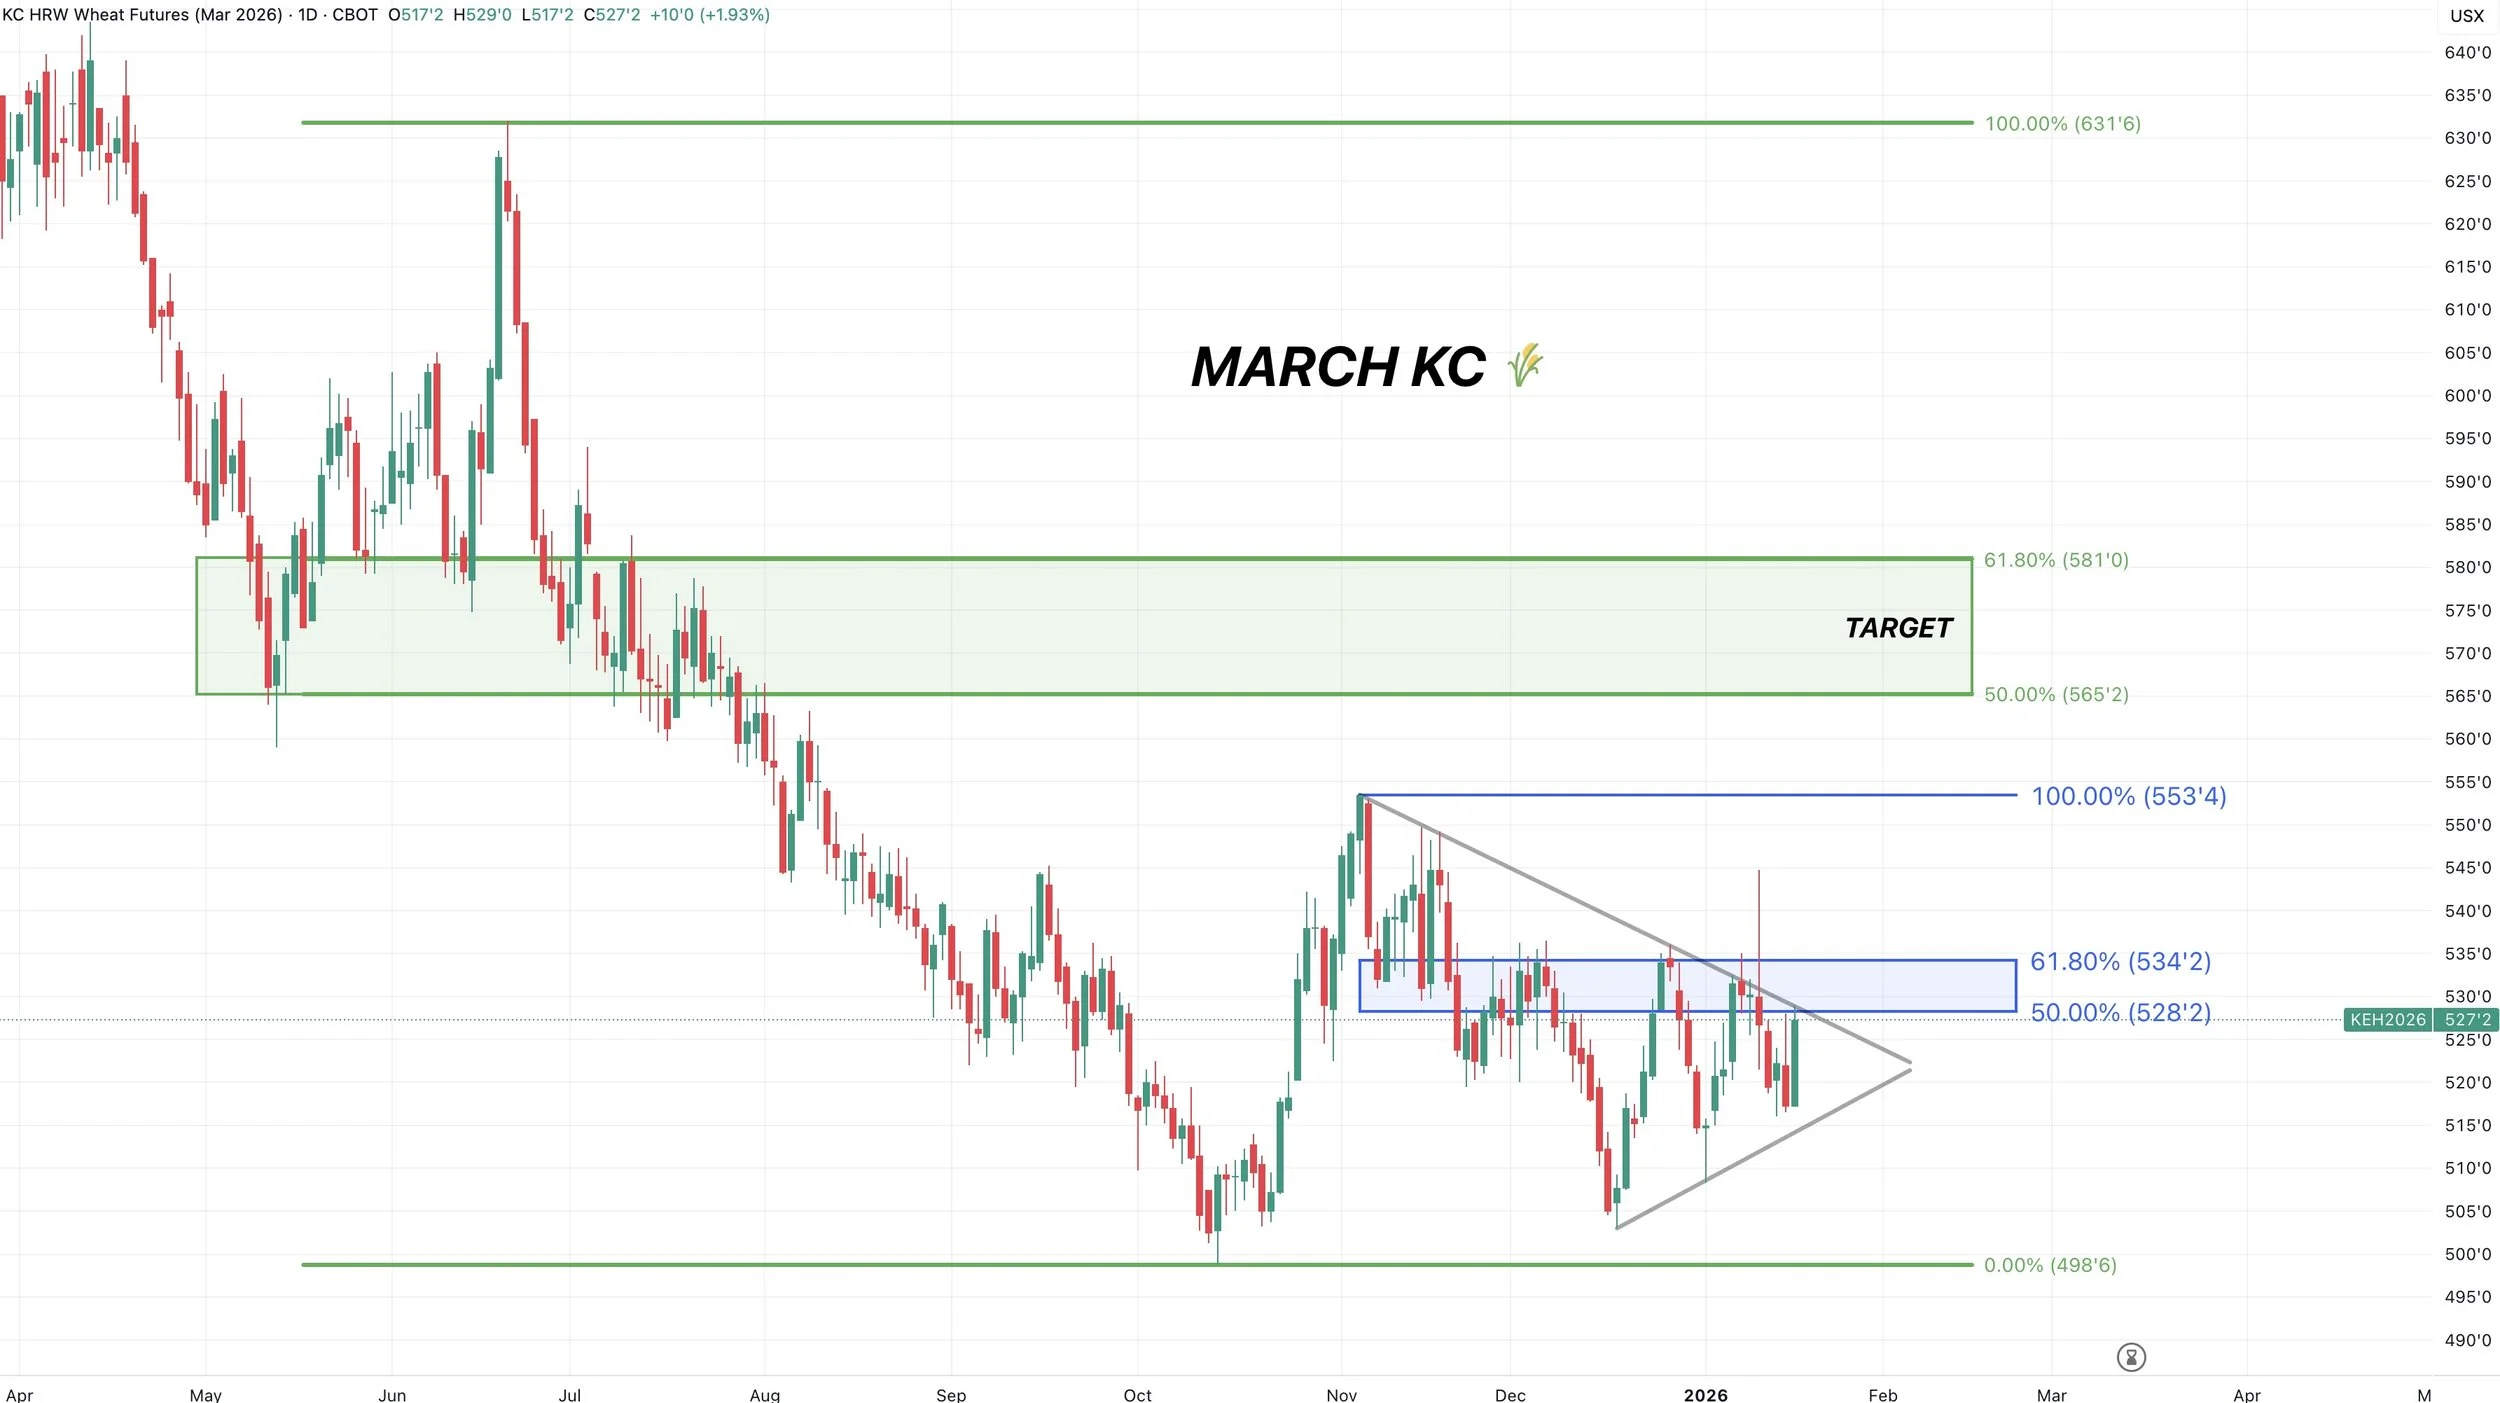
March KC Wheat 🌾
Where do we need to break above to spark a real move?
$5.35
That claws back 61.8% of the Nov highs.
If you notice, we’ve now rejected that level twice.
We also have a potential wedge pattern here we are getting close to breaking out of.
If we get above this blue box, I’d like to think we have some room higher.
Past Sell or Protection Signals
Dec 11th: 🐮
Cattle sell signal & hedge alert.
Dec 5th: 🐮
Cattle sell signal & hedge alert.
Nov 17th: 🌱
Soybean sell signal & hedge alert.
Nov 13th: 🌽 🌱
Managing risk in corn & beans ahead of USDA report.
Oct 28th: 🌽
Corn sell signal & hedge alert.
Oct 27th: 🌱
Soybean sell signal & hedge alert.
Oct 13th: 🐮
Cattle sell signal & hedge alert.
Aug 22nd: 🌱
Soybean sell signal & hedge alert.
July 31st: 🐮
Cattle sell signal & hedge alert.
July 10th: 🐮
Cattle sell signal & hedge alert.
CLICK HERE TO VIEW
June 5th: 🐮
Cattle sell signal & hedge alert.
June 2nd: 🌾
MPLS wheat sell signal.
April 10th: 🌽
Old crop corn sell signal.
March 19th: 🐮
Cattle hedge & sell signal.
Feb 18th: 🌽 🌾
Old crop KC wheat & old crop corn signal.
Jan 23rd: 🌽 🌱
Corn & beans old crop sell signal.
CLICK HERE TO VIEW
Jan 15th: 🌽 🌱
Corn & beans hedge alert/sell signal.
Jan 2nd: 🐮
Cattle hedge alert at new all-time highs & target.
Dec 11th: 🌽
Corn sell signal at $4.51 200-day MA
CLICK HERE TO VIEW
Oct 2nd: 🌾
Wheat sell signal at $6.12 target
Sep 30th: 🌽
Corn protection signal at $4.23-26
Sep 27th: 🌱
Soybean sell & protection signal at $10.65
Sep 13th: 🌾
Wheat sell signal at $5.98
May 22nd: 🌾
Wheat sell signal when wheat traded +$7.00
Want to Talk?
Our phones are open 24/7 for you guys if you ever need anything or want to discuss your operation.
Hedge Account
Interested in a hedge account? Use the link below to set up an account or shoot Jeremey a call at (605)295-3100.