
THE WORLD NEEDS US CORN
MARKET UPDATE
You can scroll to read the usual update as well. As the written version is the exact same as the video.
Timestamps for video:
Overview: 0:00min
Corn: 2:45min
Beans: 9:35min
Wheat: 12:20min
Cattle: 14:10min
Want to talk about your situation?
(605)250-3863
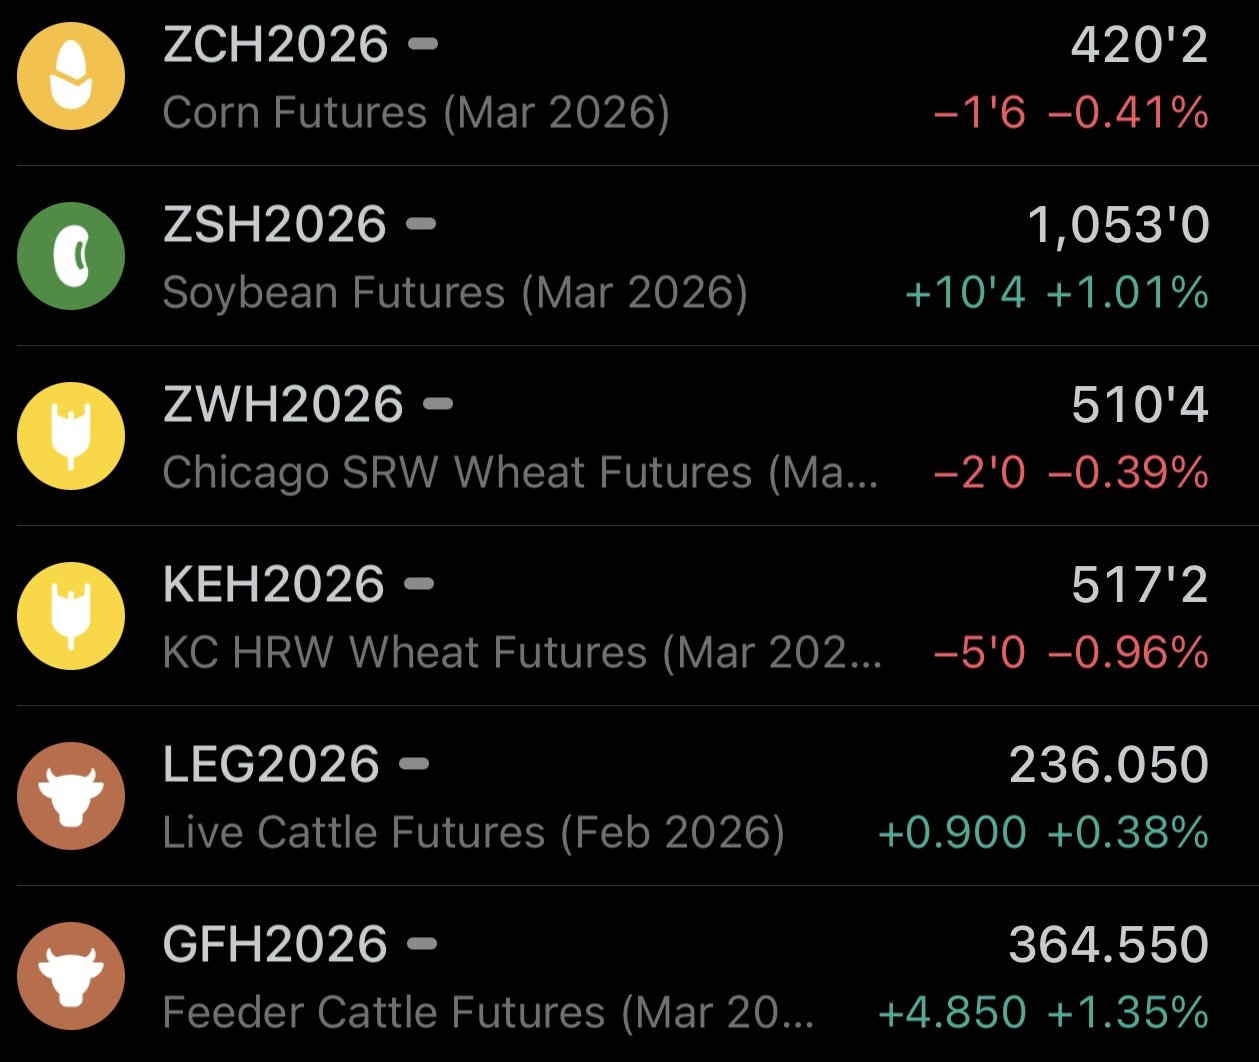
Futures Prices Close
Overview
Grains mixed with soybeans leading the way higher, while the cattle market continues to push along higher.
The markets will be closed on Monday with Martin Luther King Day.
The USDA did announce that farmers who qualify for the bridge payment program should be expecting payments to be released by February 28th.
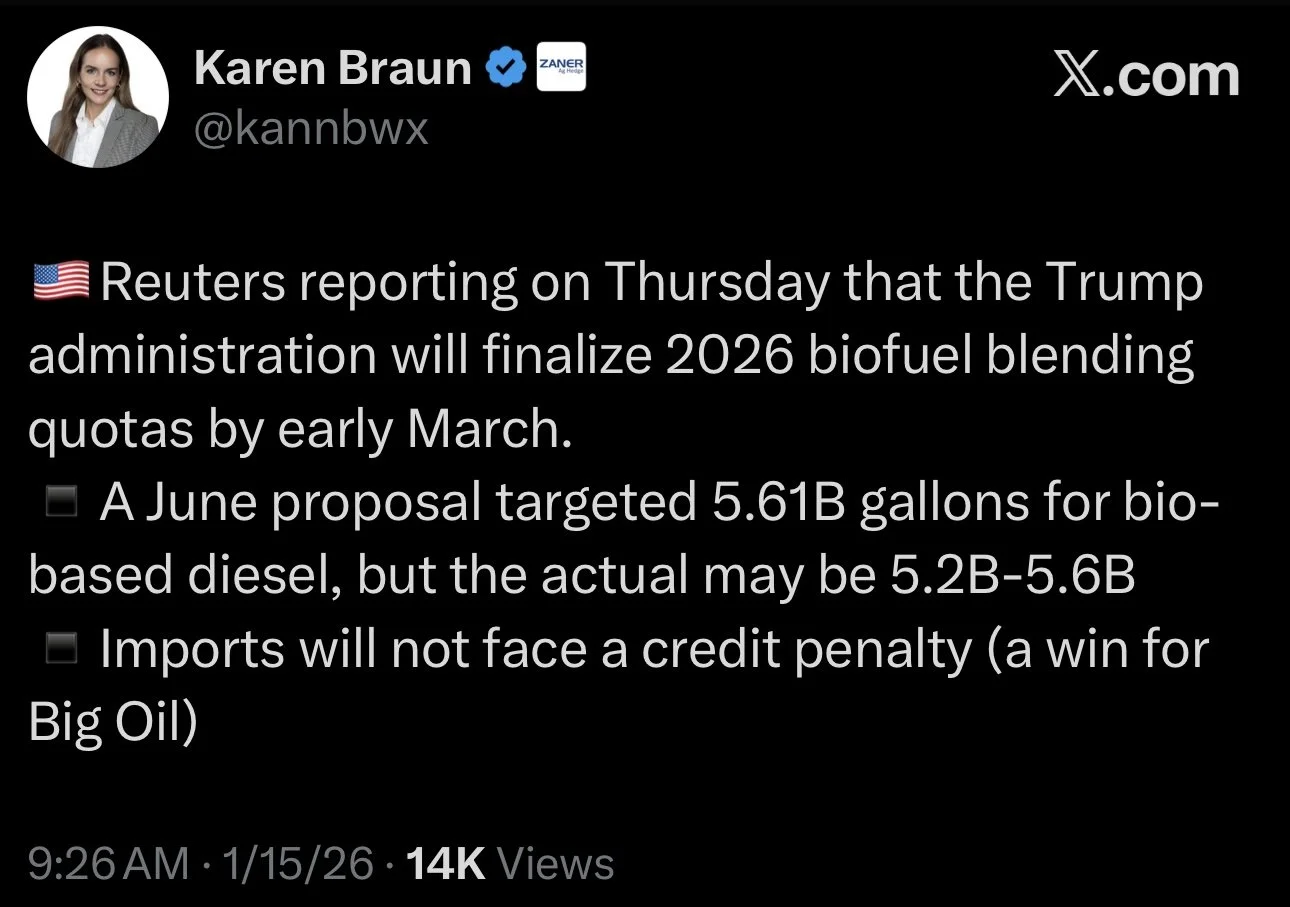
Why the pop in soybeans today?
Partly off the back of some RVO news.
The US is set to finalize 2026 biofuel quotas by early March.
Reuters reports that the EPA is expected to keep the 2026-27 biofuel blending targets near proposed levels.
And importantly, they suggest that the EPA plans to drop the idea of penalizing imported feedstocks, which means imports won’t face a RIN or credit penalty.
Firm biofuel demand and no bearish surprise for RIN economics is friendly for crush and bean oil.
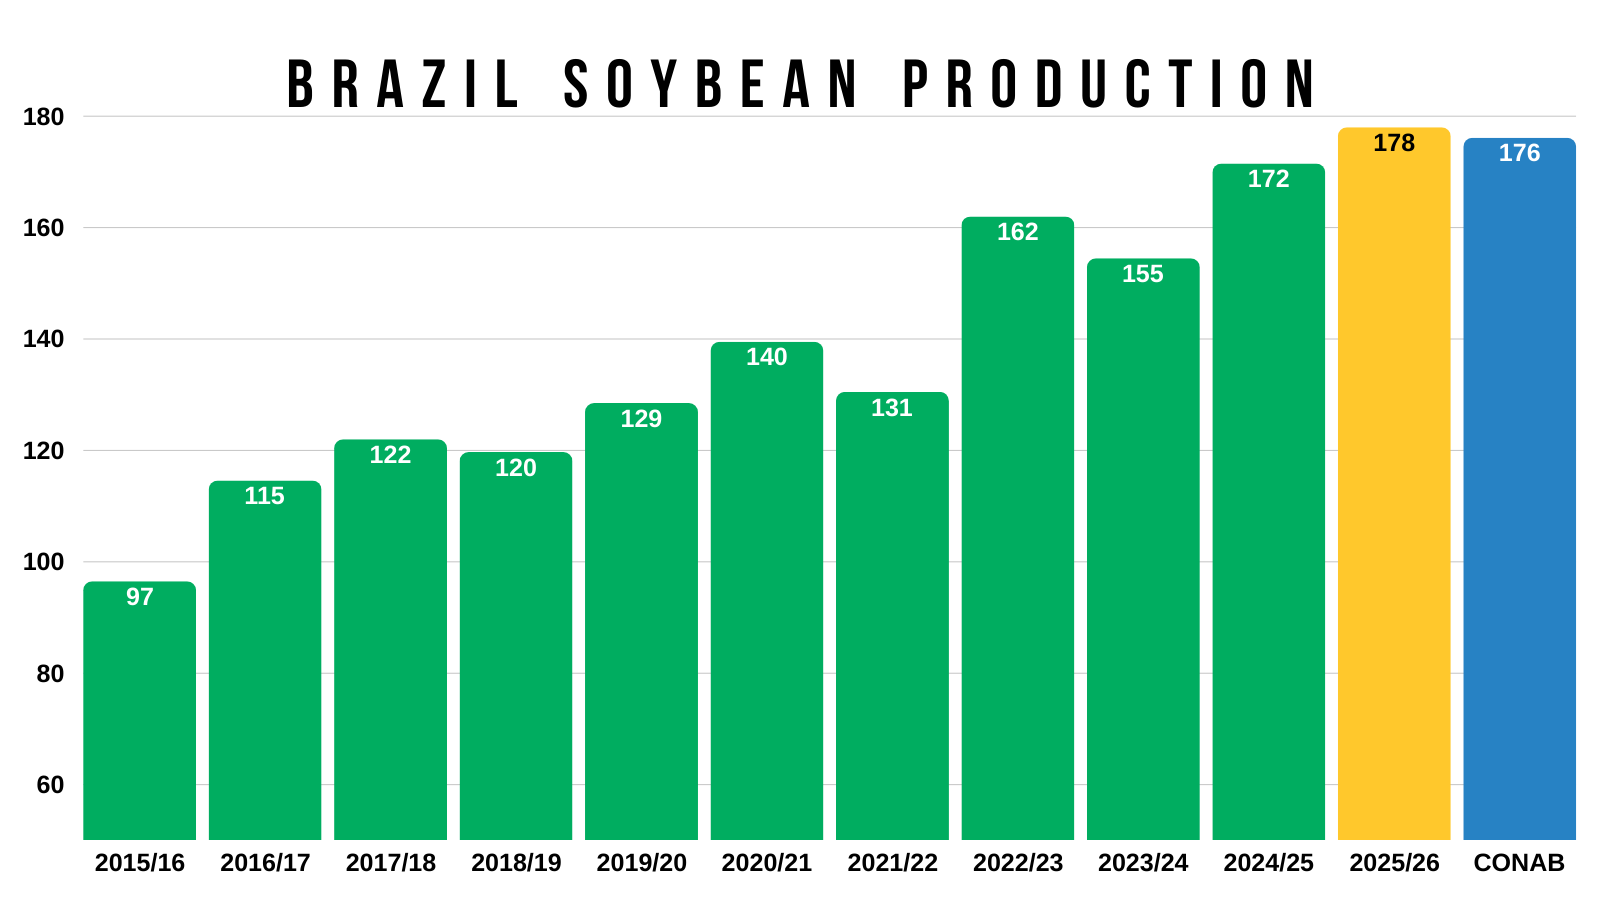
We also had CONAB out today.
They actually lowered their estimate for Brazil soybean production.
They dropped it by -1 MMT from 177 to 176.
176 is still a clear record, but is below the USDA's recent 178 estimate.
Despite weather being mostly favorable, there is some talk that Brazil's crop could end up in the low 170's. Which would still be a record, but positive.
Looks like we are seeing some bargin buying following the sell off.
As we saw a ton of flash sales today for both corn and soybeans.
The job of the market is to put prices at levels that justify demand. So seeing demand here after the sell off is a positive sign.
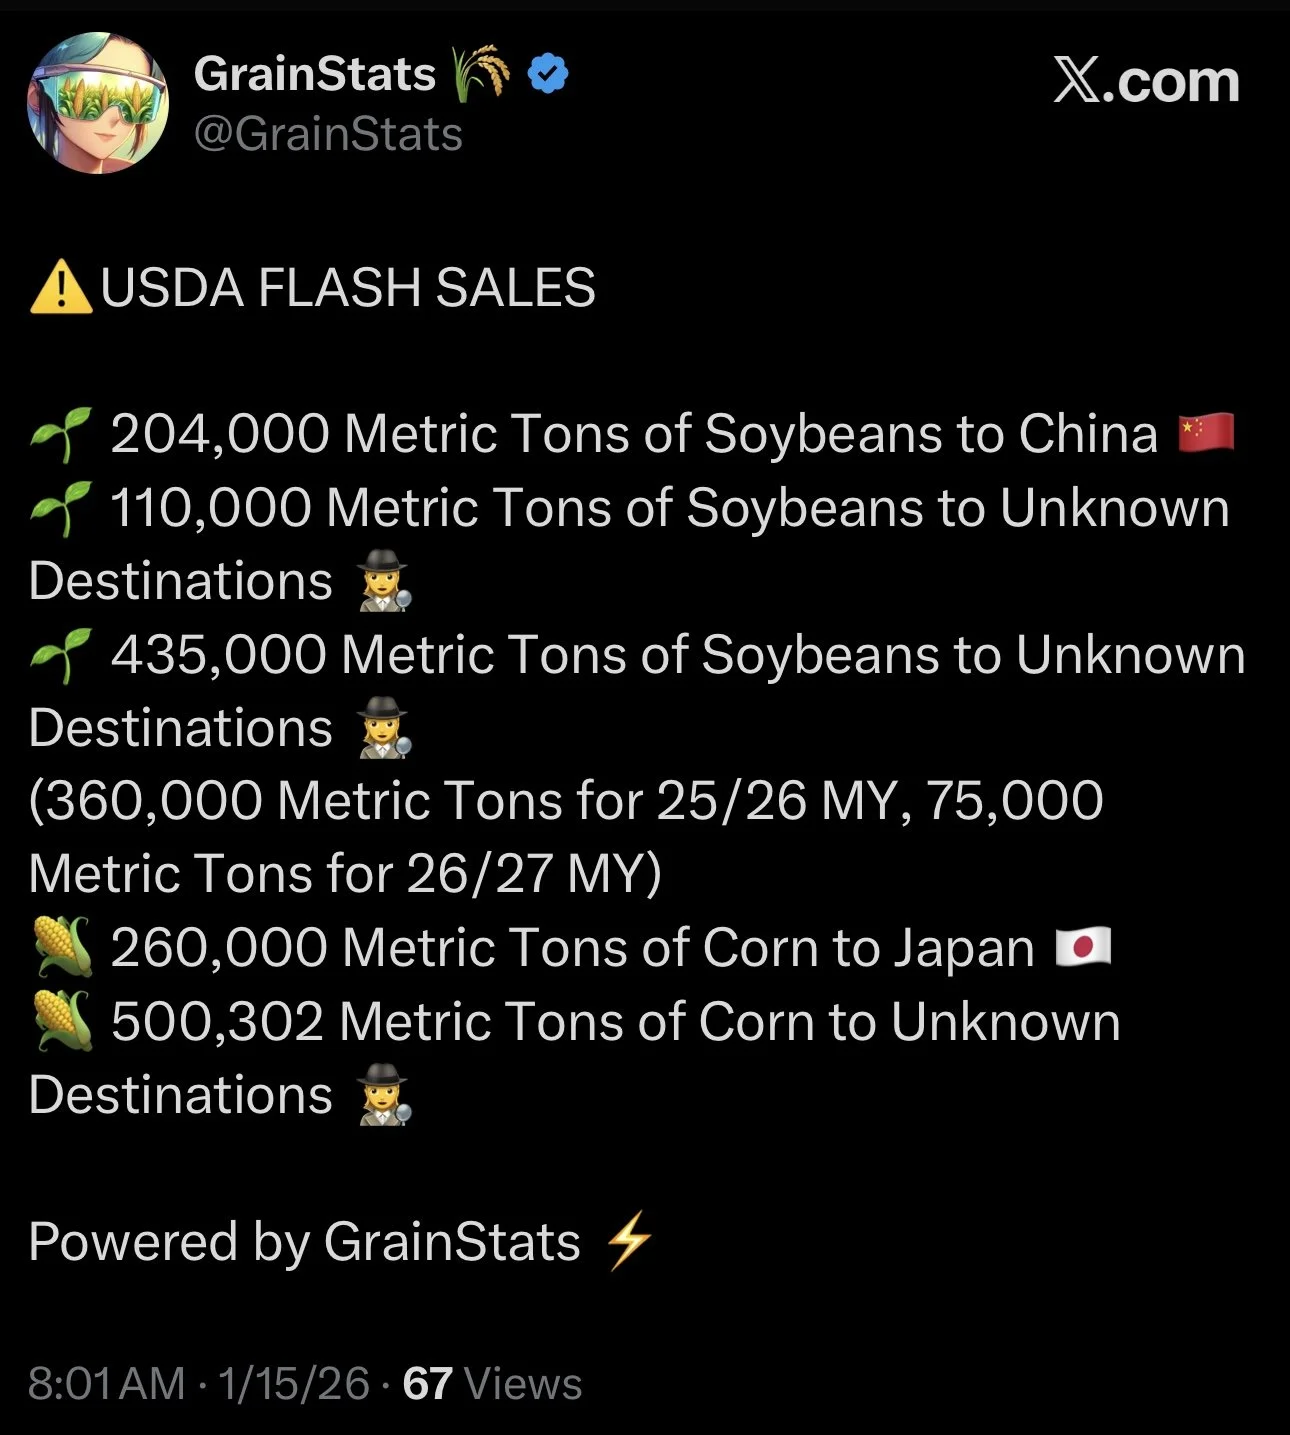
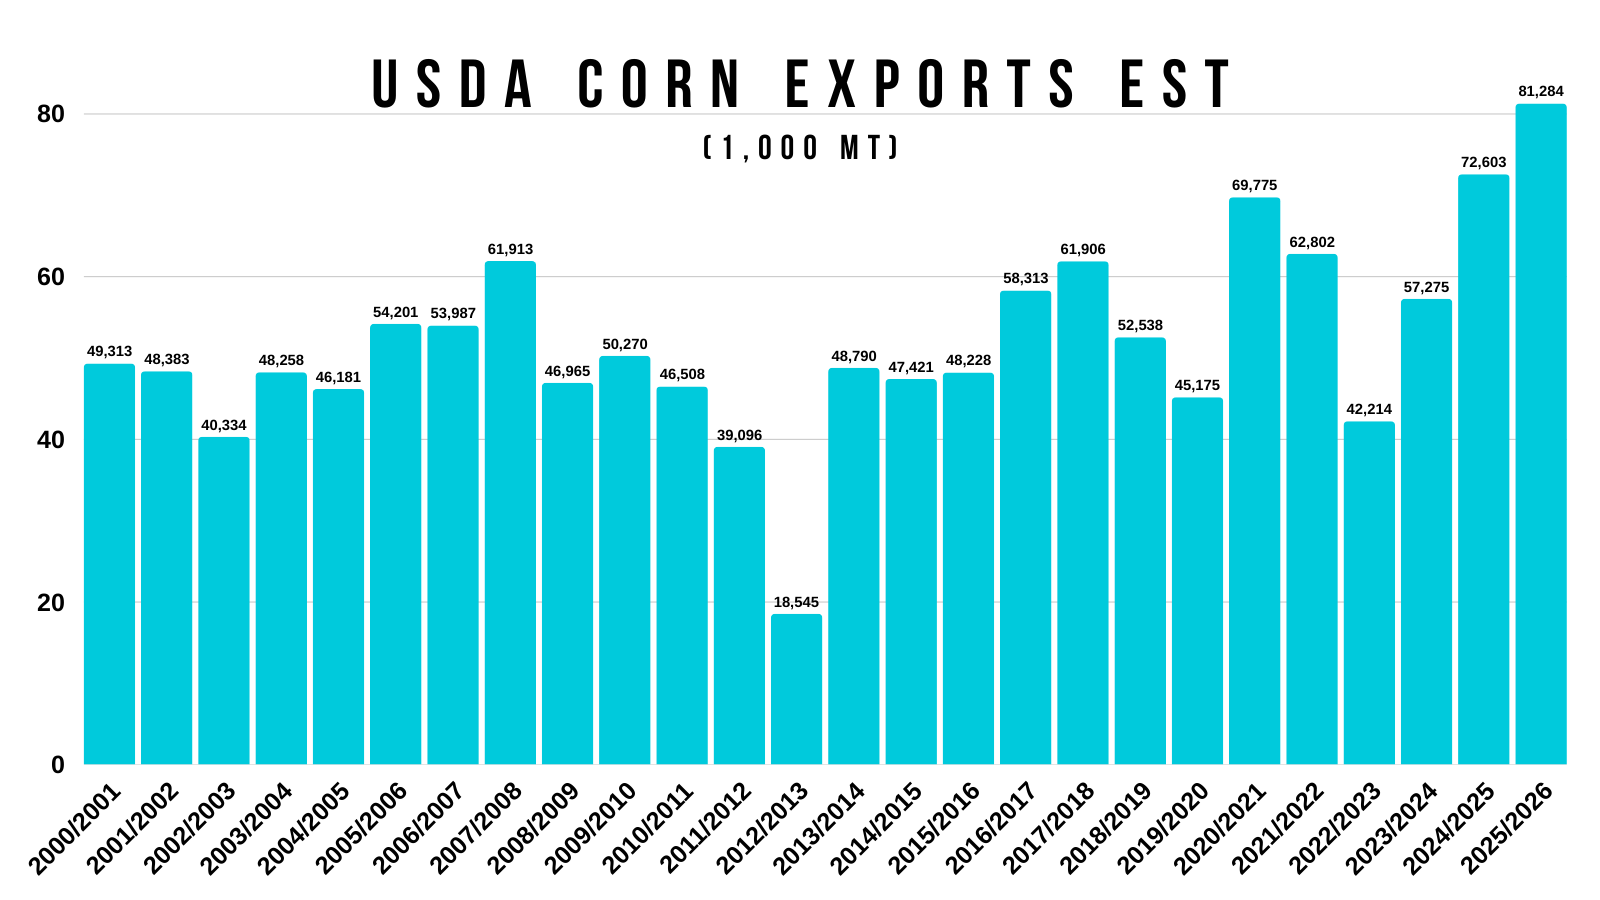
Export sales were phenomenal for corn and soybeans.
For corn it was this week's best week in the last 5 years.
Soybean sales were a record for the week, and the 3rd strongest of the marketing year.
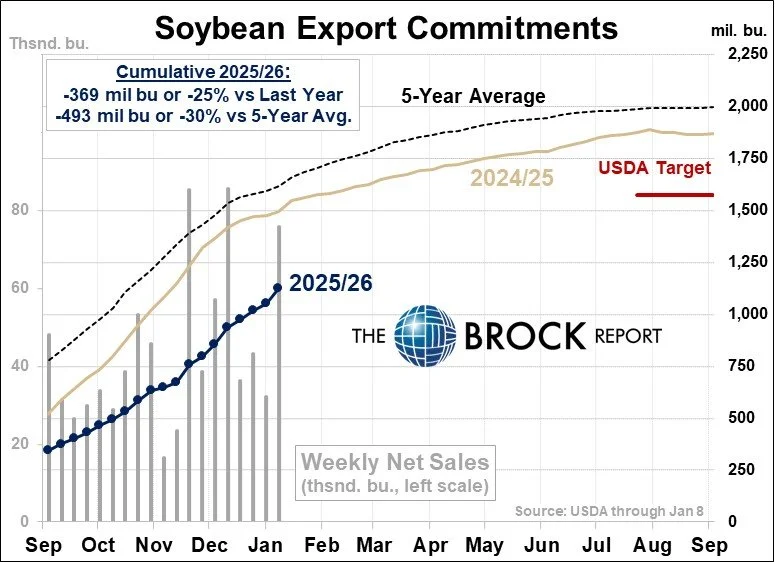
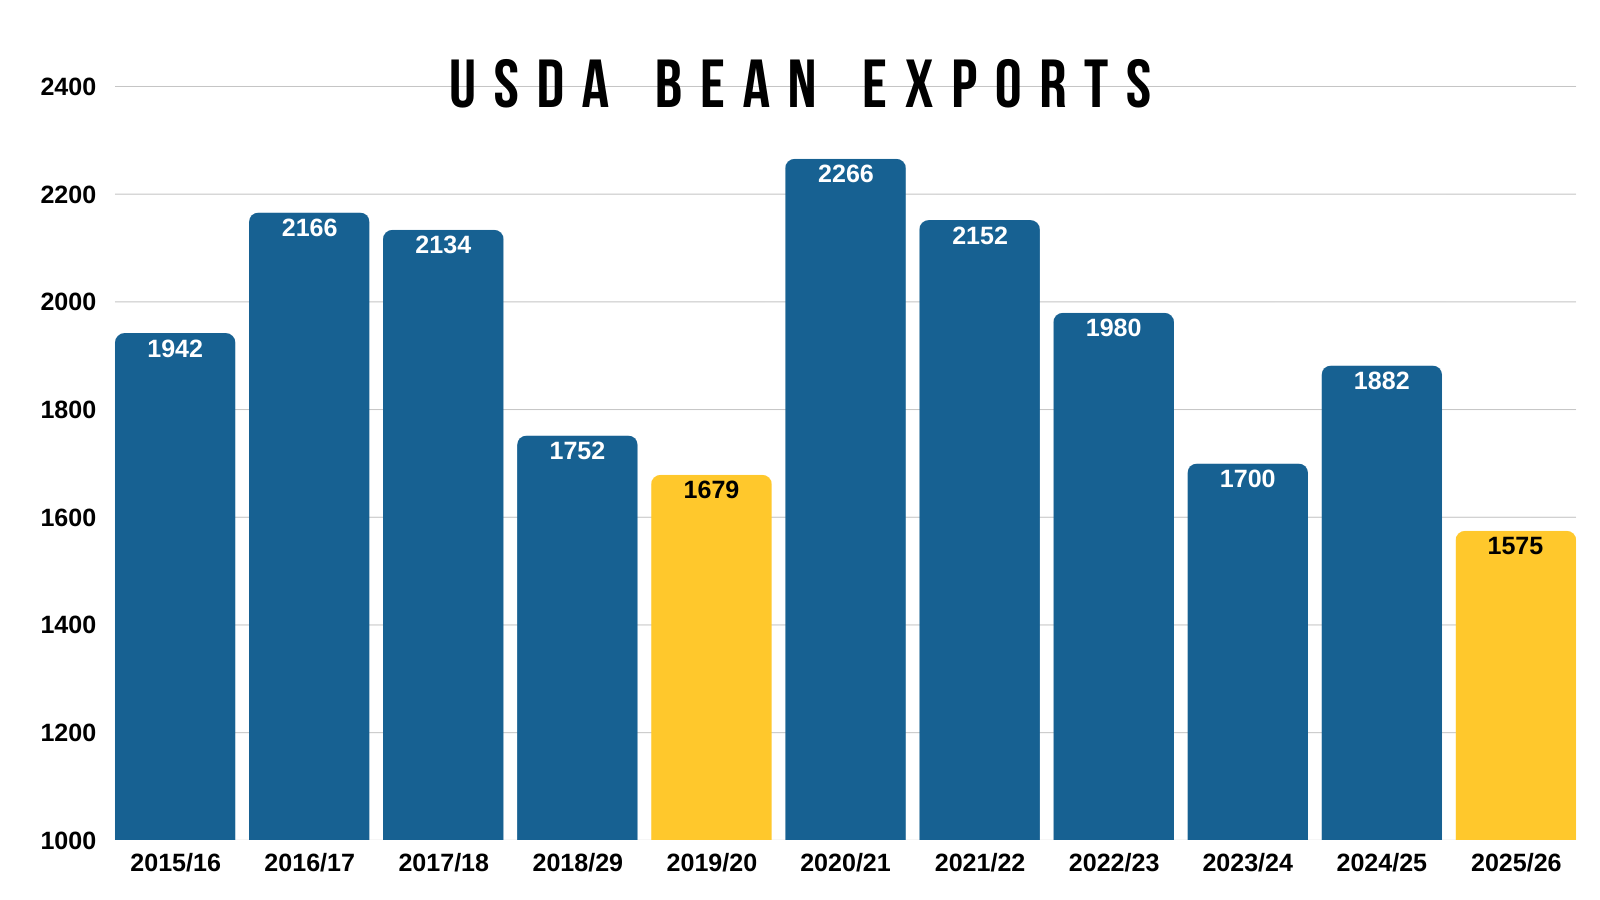
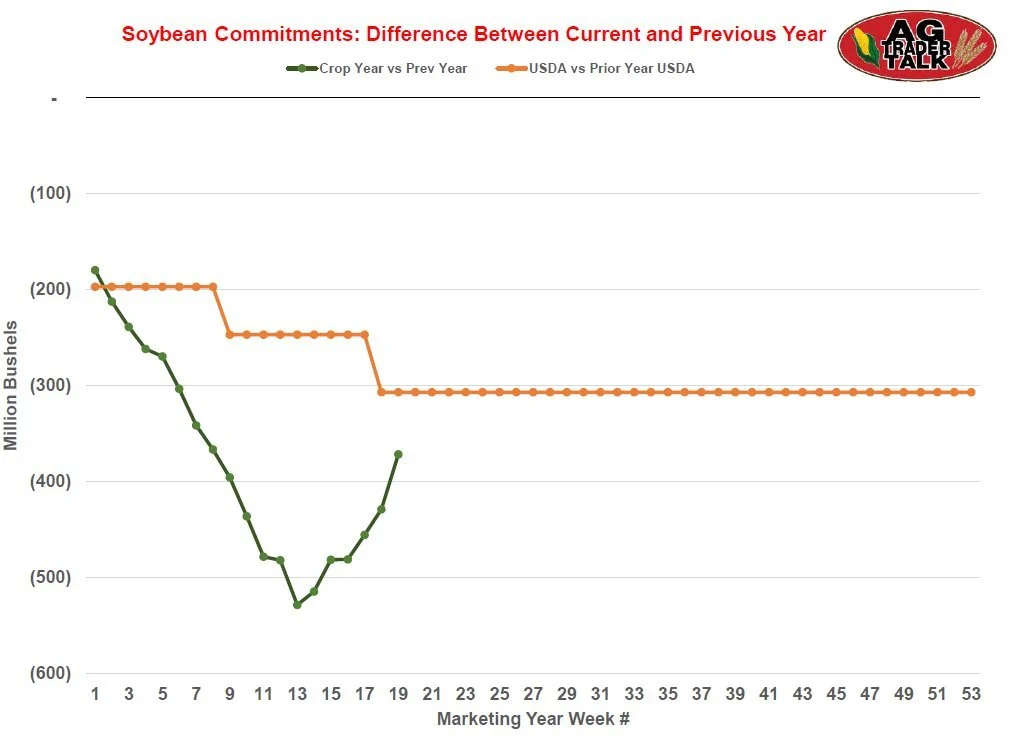
Here is a nice chart from the Brock Report that shows the current exports, last year's exports, and the USDA's target.
Soybean exports are still down -25% or -370 million bushels behind last year.
It's nice that we've seen a nice uptick to soybean sales. It's very much needed to continue to keep some support under this market.
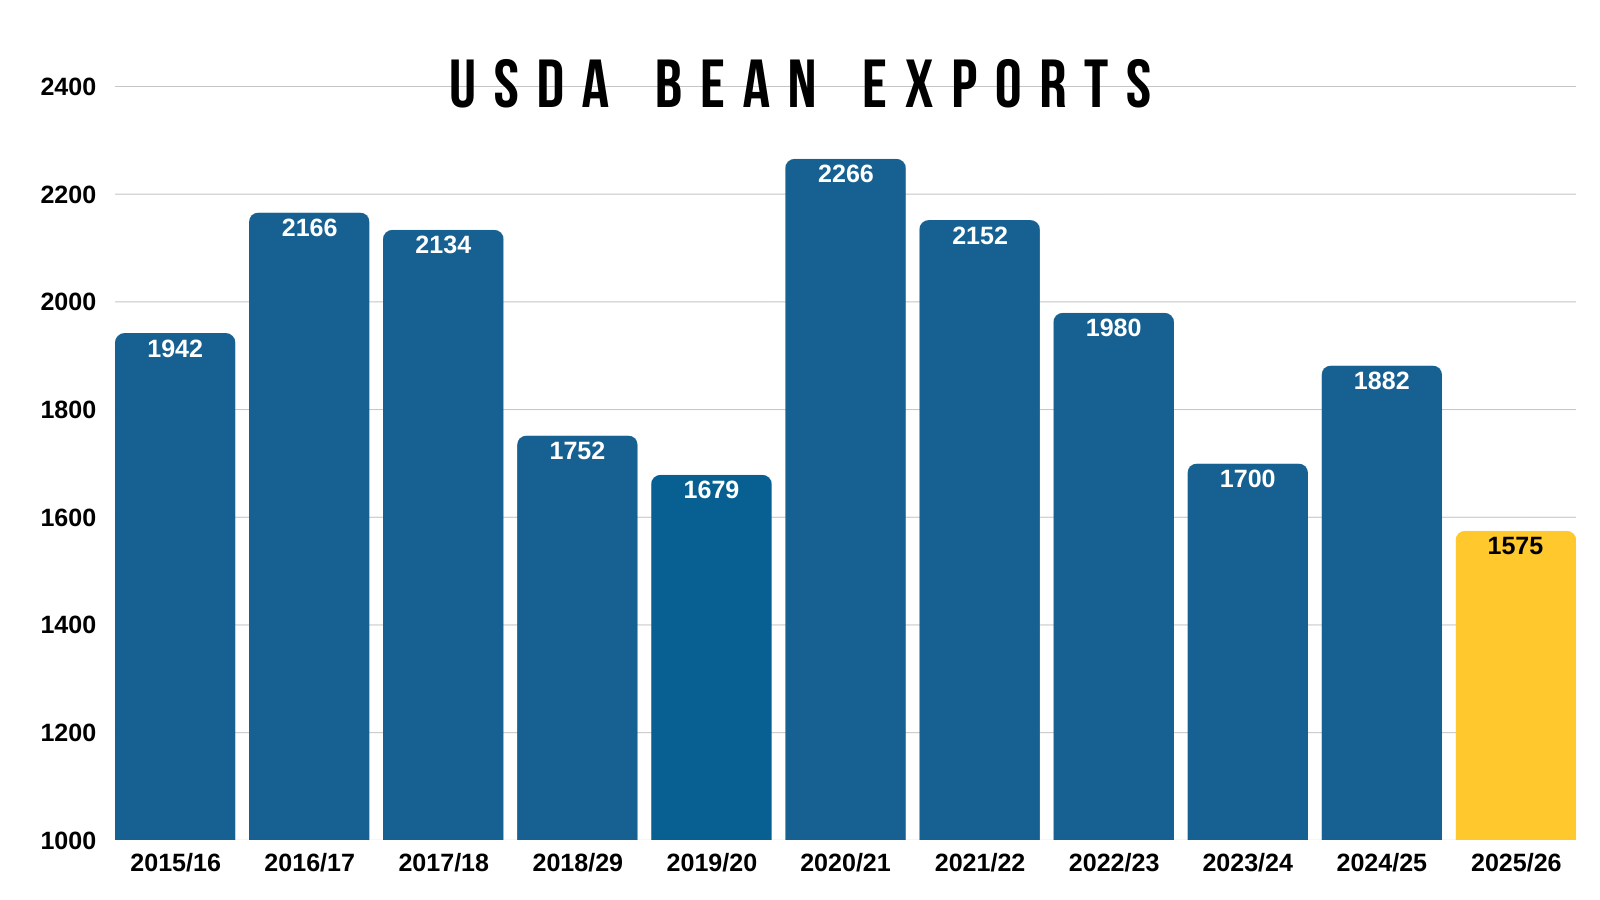
If we look at the USDA's export estimates:
Last Year: 1,882
This Year: 1,575
Change: -307 (-16.30%)
So the USDA has their estimate down -16.30% (307 million) vs last year. Meanwhile exports are currently on pace to be down -25% (370 million).
So even with the recent drop in exports the USDA made, you could still argue they are concern unless we continue to see China step in and buy.
Seasonally, this isn’t our prime window to sell soybeans, but there is of course some politics at play here with China.
We will touch more on this in the bean section.
Today's Main Takeaways
Corn
Fundamentals:
I am going to be real with you, the US situation just got a lot more bearish on Monday and confirmed we have an ample amount of corn here in the US.
Which does make things harder here for the time being.
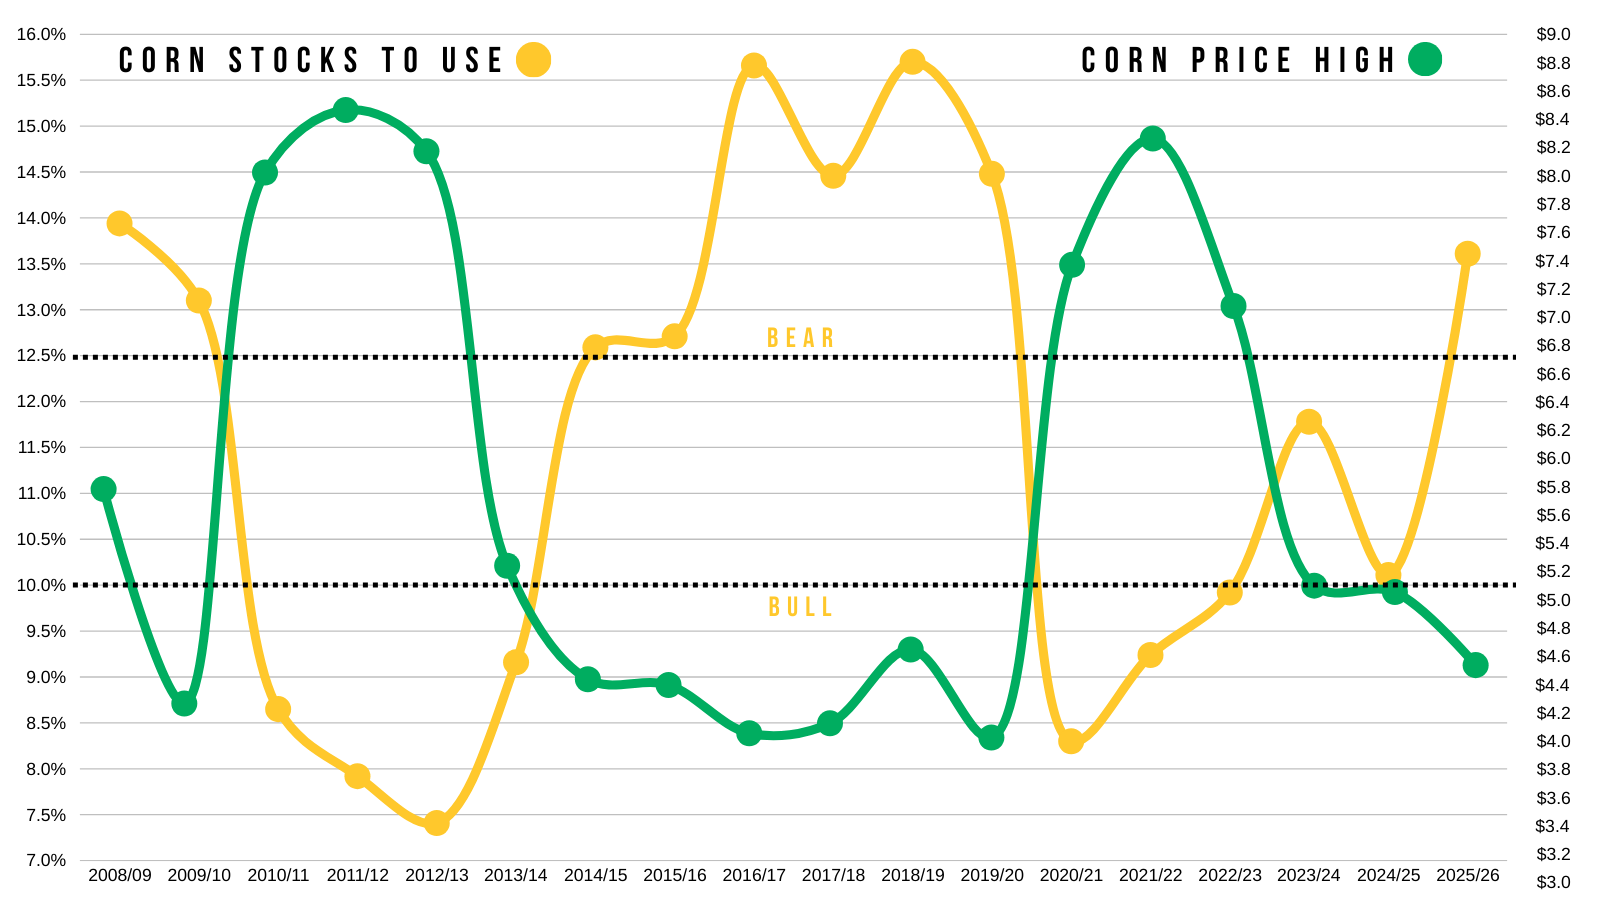
The USDA just bumped our stocks to use ratio to 13.6%.
I shared this graphic on Tuesday as well as on social media.
But this shows our stocks to use (yellow) along with corn's highest price of the year (green).
Usually, when you get a stocks to use this high. Prices do tend to struggle.
As it's almost on par with previous bear market years.
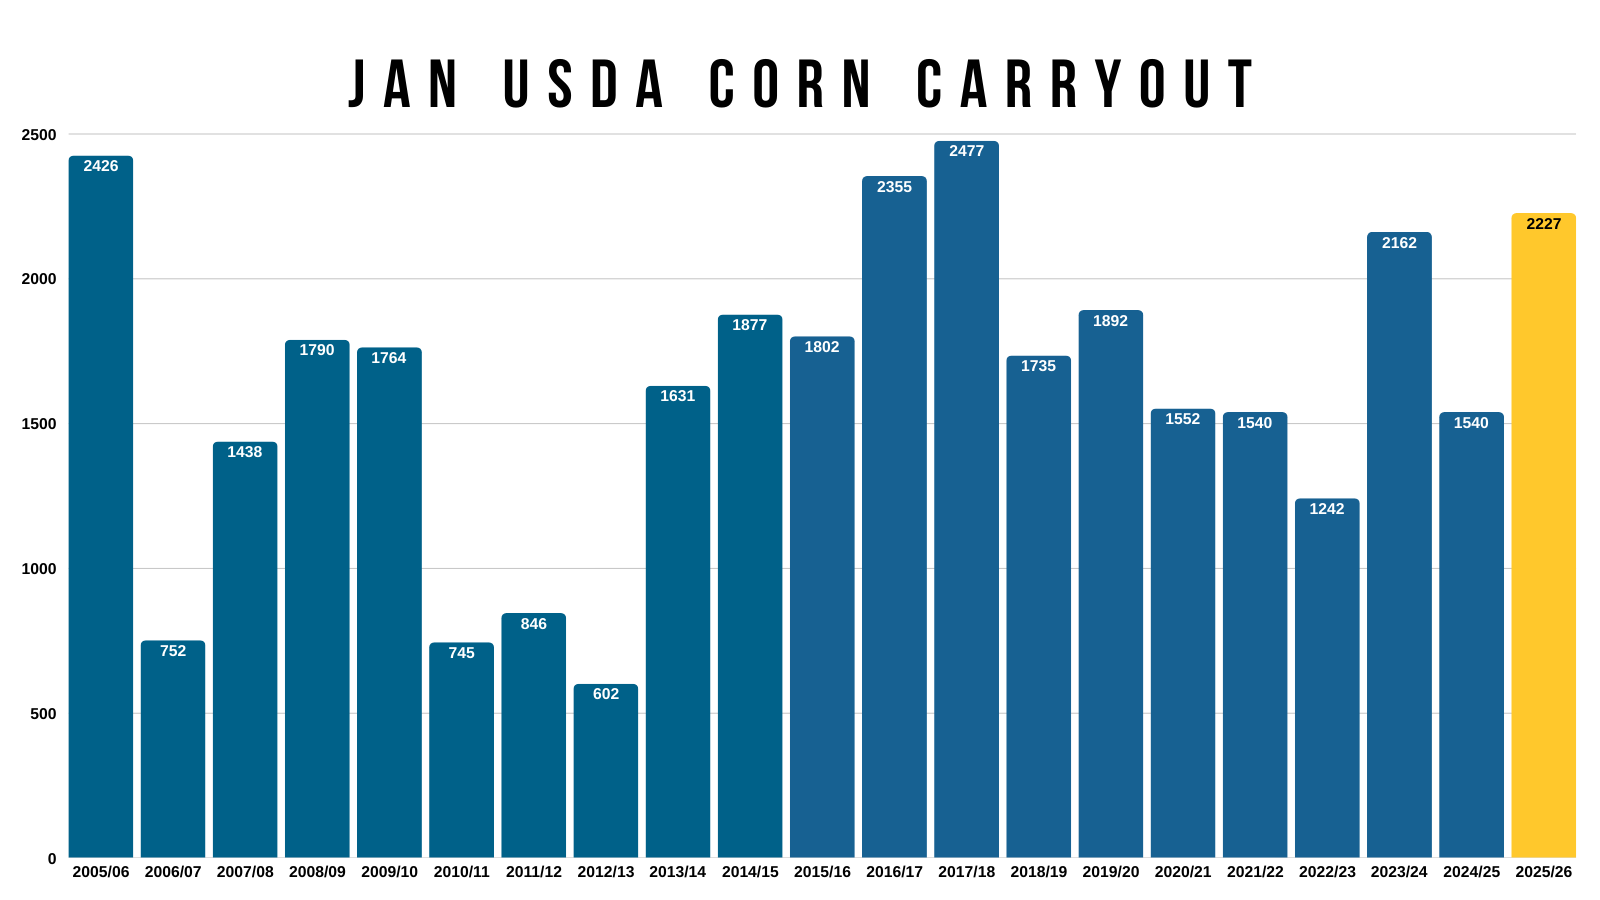
If we just look at corn carryout in the January report.
The current carryout they just printed is one of the largest ever.
We have a ton of corn.
But at the same time, demand is the best it's ever been.
Demand should continue to keep this market supported especially long term.
That doesn’t mean we can’t go lower from here, but you'd like to think it prevents this market from completely collapsing well below $4.00
If prices stay low.. it is going to create even more demand.
So the US cleary has a good amount of supply.
But when you take a look at the world as a whole.. the story shifts.
Like we've talked about several times, the world stocks to use is the tightest in over a decade.
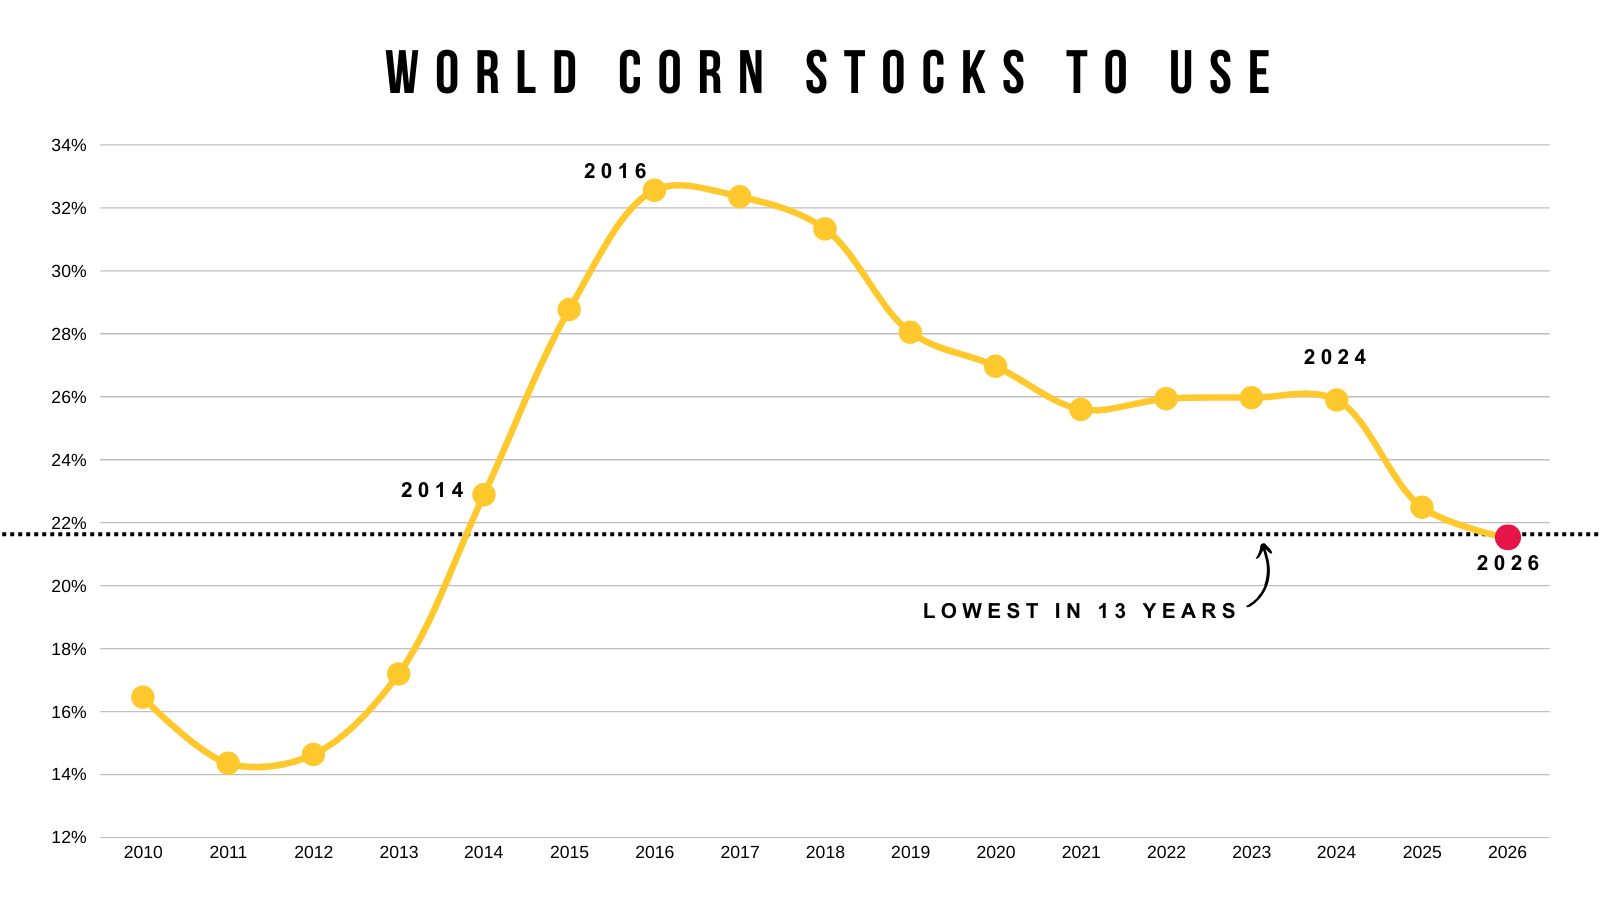
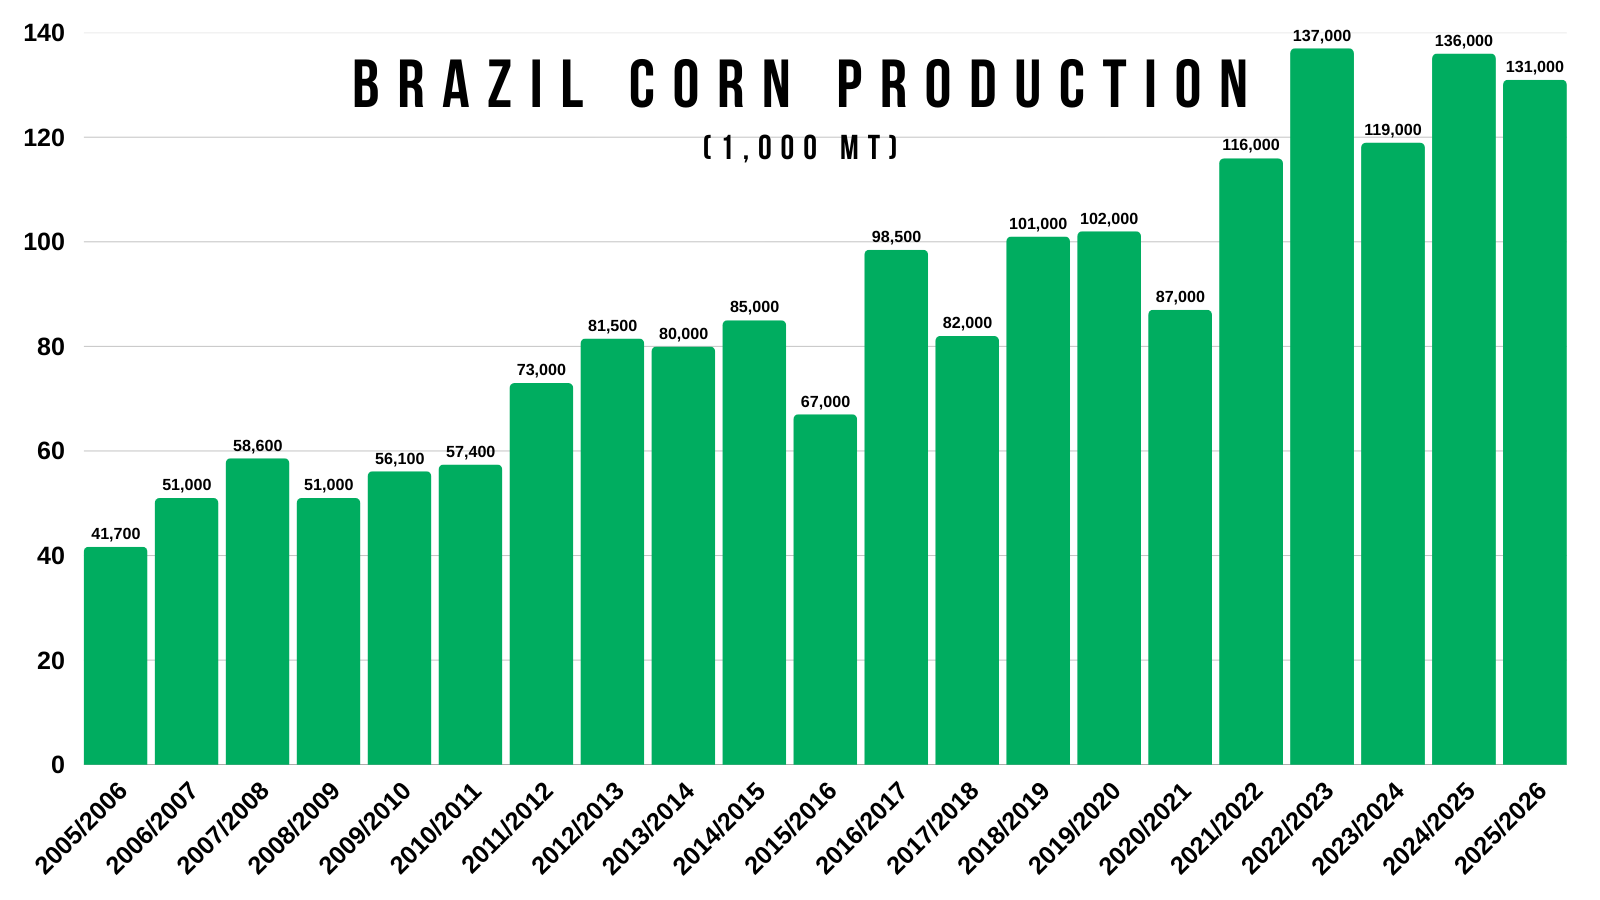
This is with a big Brazil crop.
One of the largest ever.
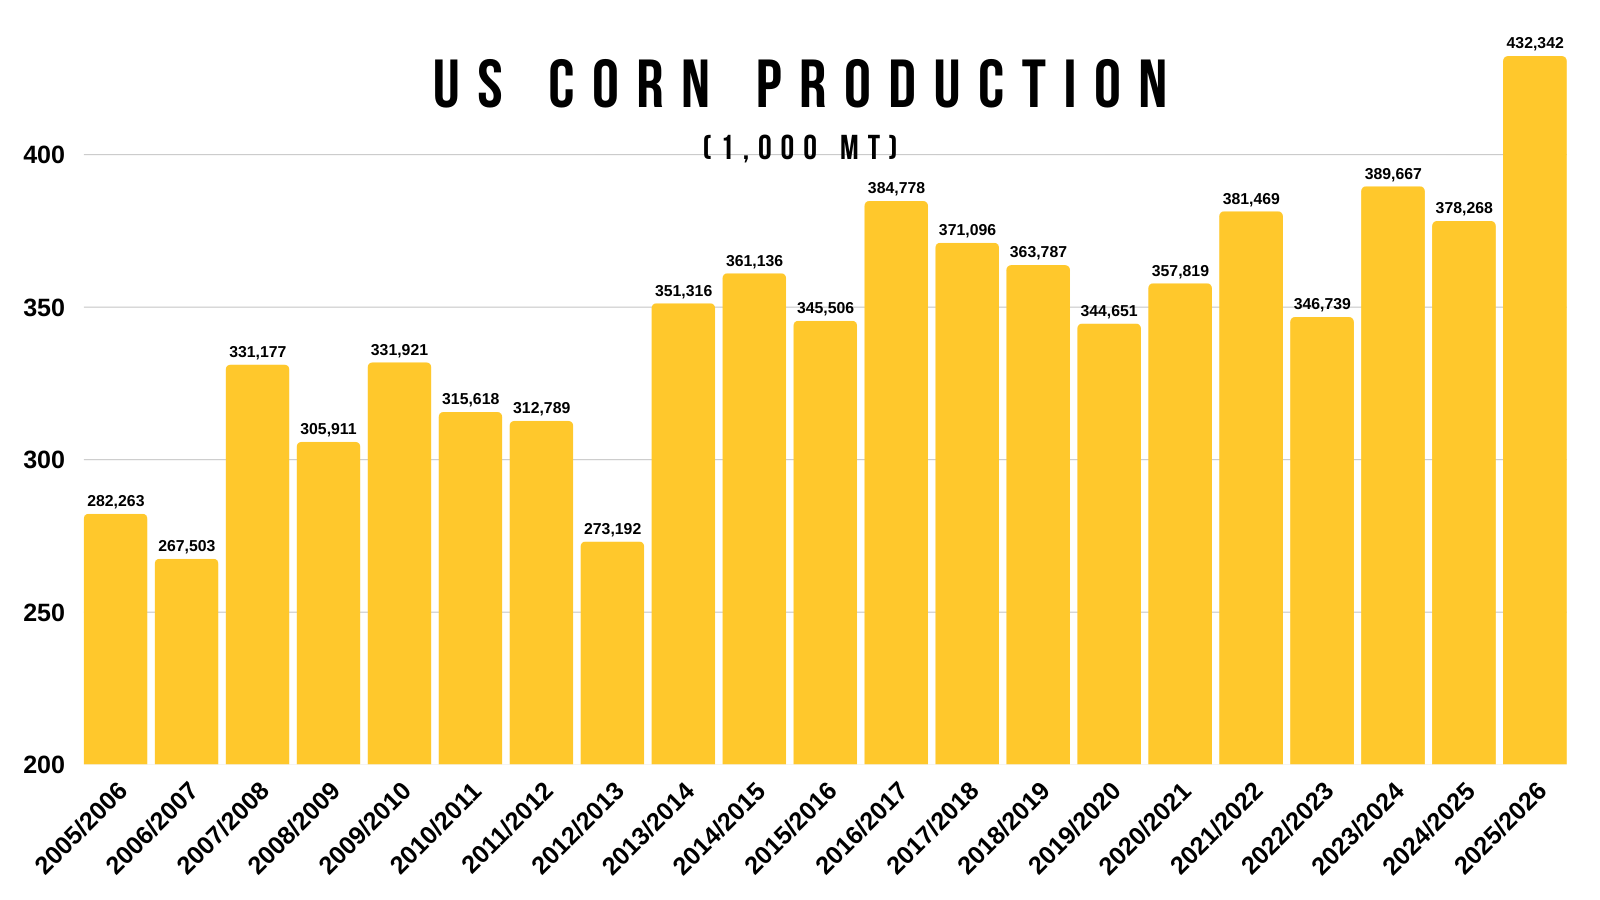
This is with a massive record production out of the US.
By far the largest we've seen.
Yet.. the world has been getting tighter year over year.
What does this tell us?
It means the US absolutely HAS to have large production.
The world simply cannot afford any issue in US production.
If we do ever run into an issue.. prices will take notice.
We are one below-average crop or even one weather scare away from a totally different story in the corn market.
It sucks right now. But a more positive story for corn isn’t as difficult as it looks. It just might take some time.
Something to keep in mind moving forward.
Yes it's going to be an uphill battle right now.
But long term, that is your catalyst for higher prices if the US ever even has just a slight hiccup.
We already have record demand. What happens if we aren’t able to meet that demand? Prices have to justify the lower demand by going higher.
It doesn’t matter today.. but eventually could.
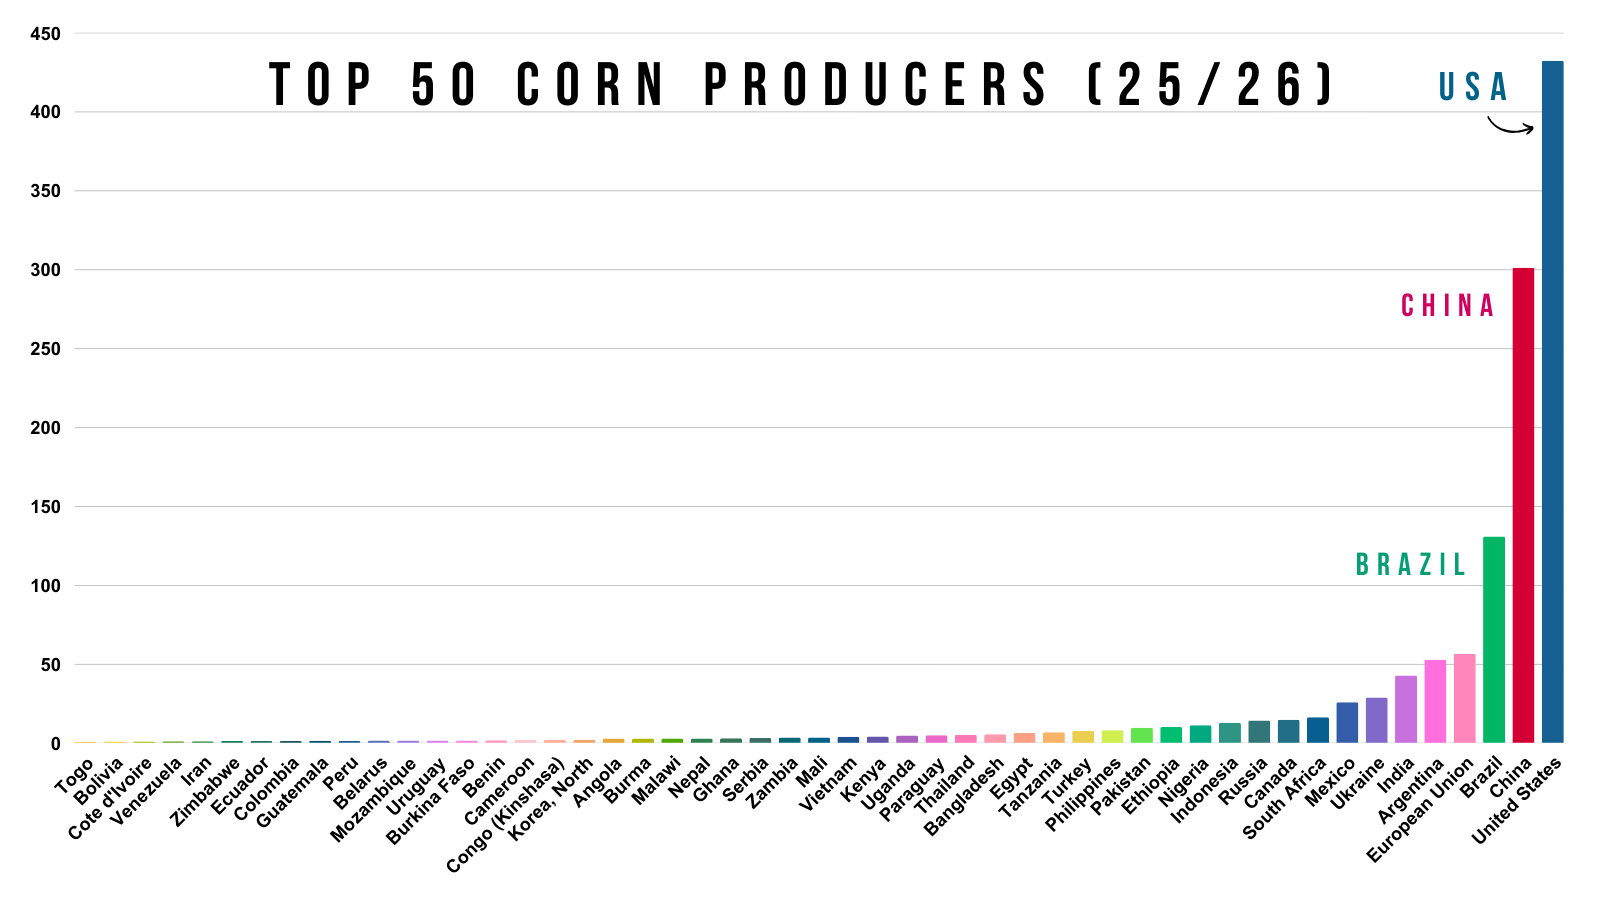
Just to put things into perspective on why the US crop matters so much. This is the top 50 corn producers in the world.
We are far and away the leader by a wide margin.
The next closest is China, who doesn’t export any corn anyways. Then the only other real player is Brazil, who is still miles away from the US.
Bottom Line:
The USDA definitely a threw a curve ball with the acres. Yes, the fundamentals aren’t bullish.
However, demand should help keep this market supported. The job of the market is to put prices at levels to find demand.
I'm not saying we have to rally, but I don’t think we just have to completely fall apart from here.
Back at those contract lows in August, you do have to keep in mind that the market at the time was pricing in a 188 yield and we've found plenty of demand since then.
We are seeing buyers step in on the export market here.
The world story is tight, but only really matters if the US has an issue. Then it becomes a major problem.
To get this market really going it will probably take a weather scare and or less acres.
We haven’t seen a weather scare in a few years. We will eventually whether it's this year or not.
Acres this year will be very important as well.
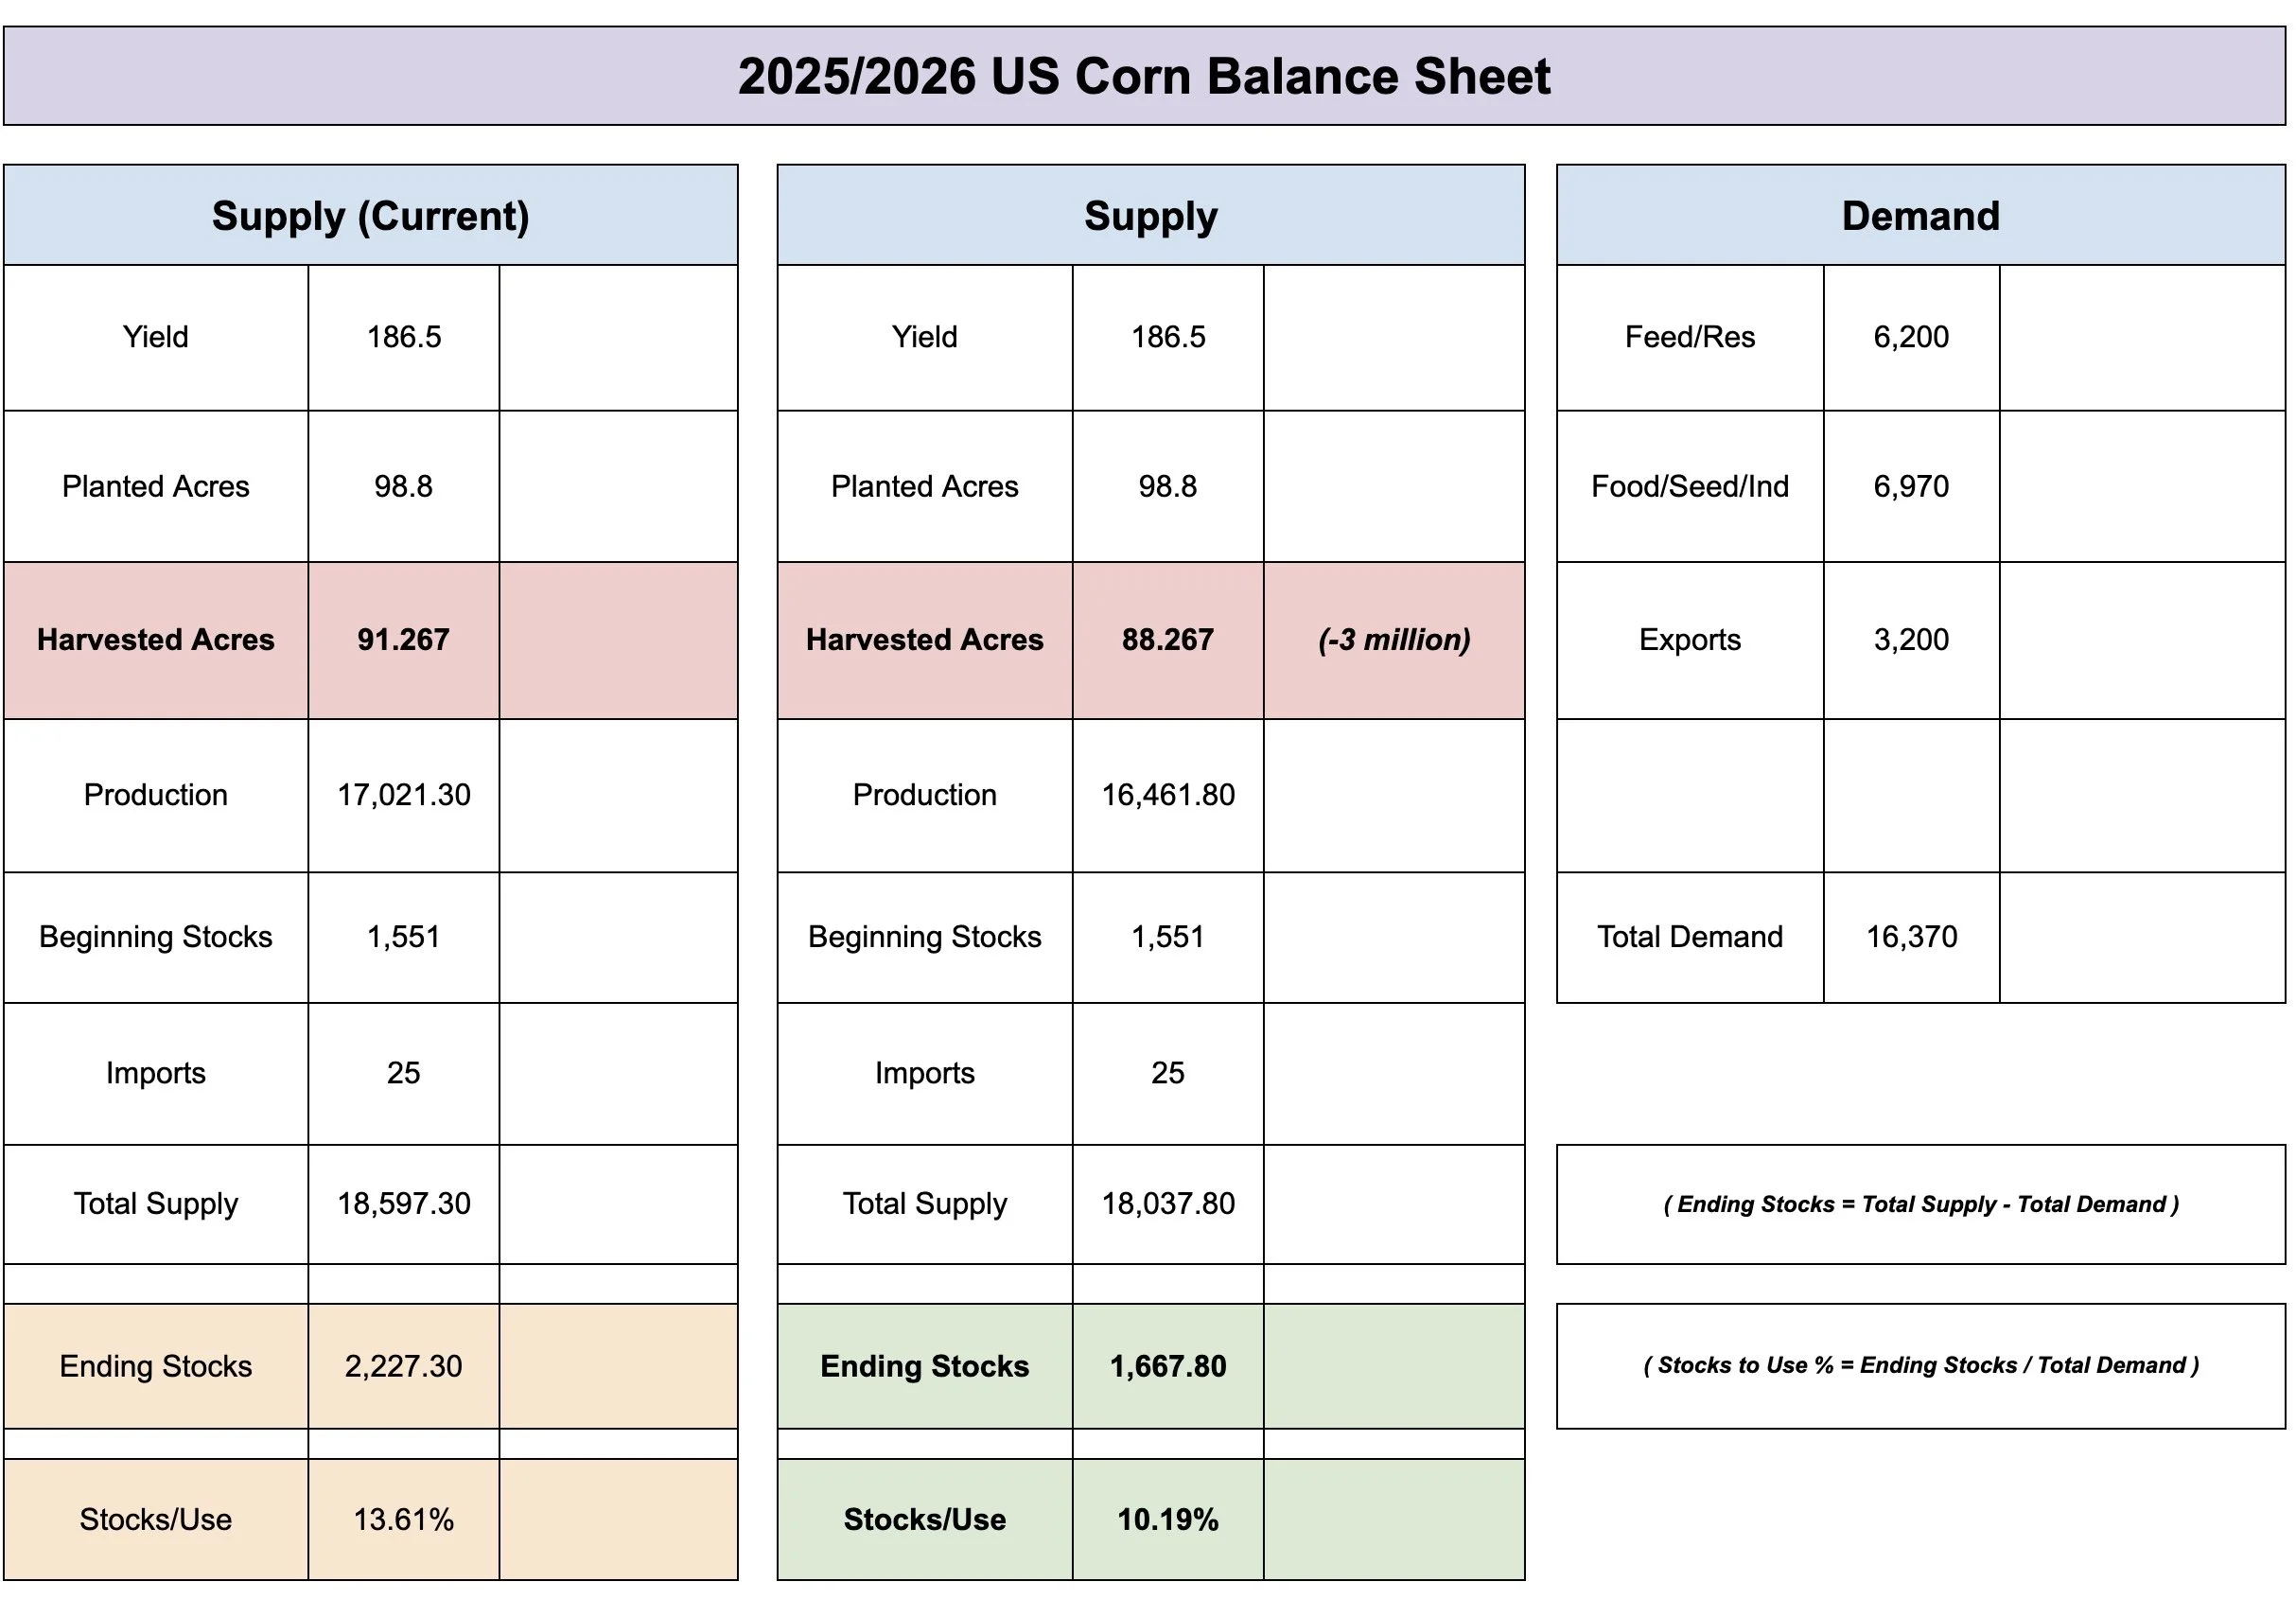
Just to give you an idea on how impactful acres can be.
For visual purposes only to show you it's impact, here is the current balance sheet vs what it would've looked like if you dropped harvested acres by -3 million.
It paints an entirely different balance sheet. That obviously won’t change this year. And no, it's not that easy next year. As there is so much that goes into it, such as demand. But the point is that acres do make a big impact on the balance sheet.
Technicals:
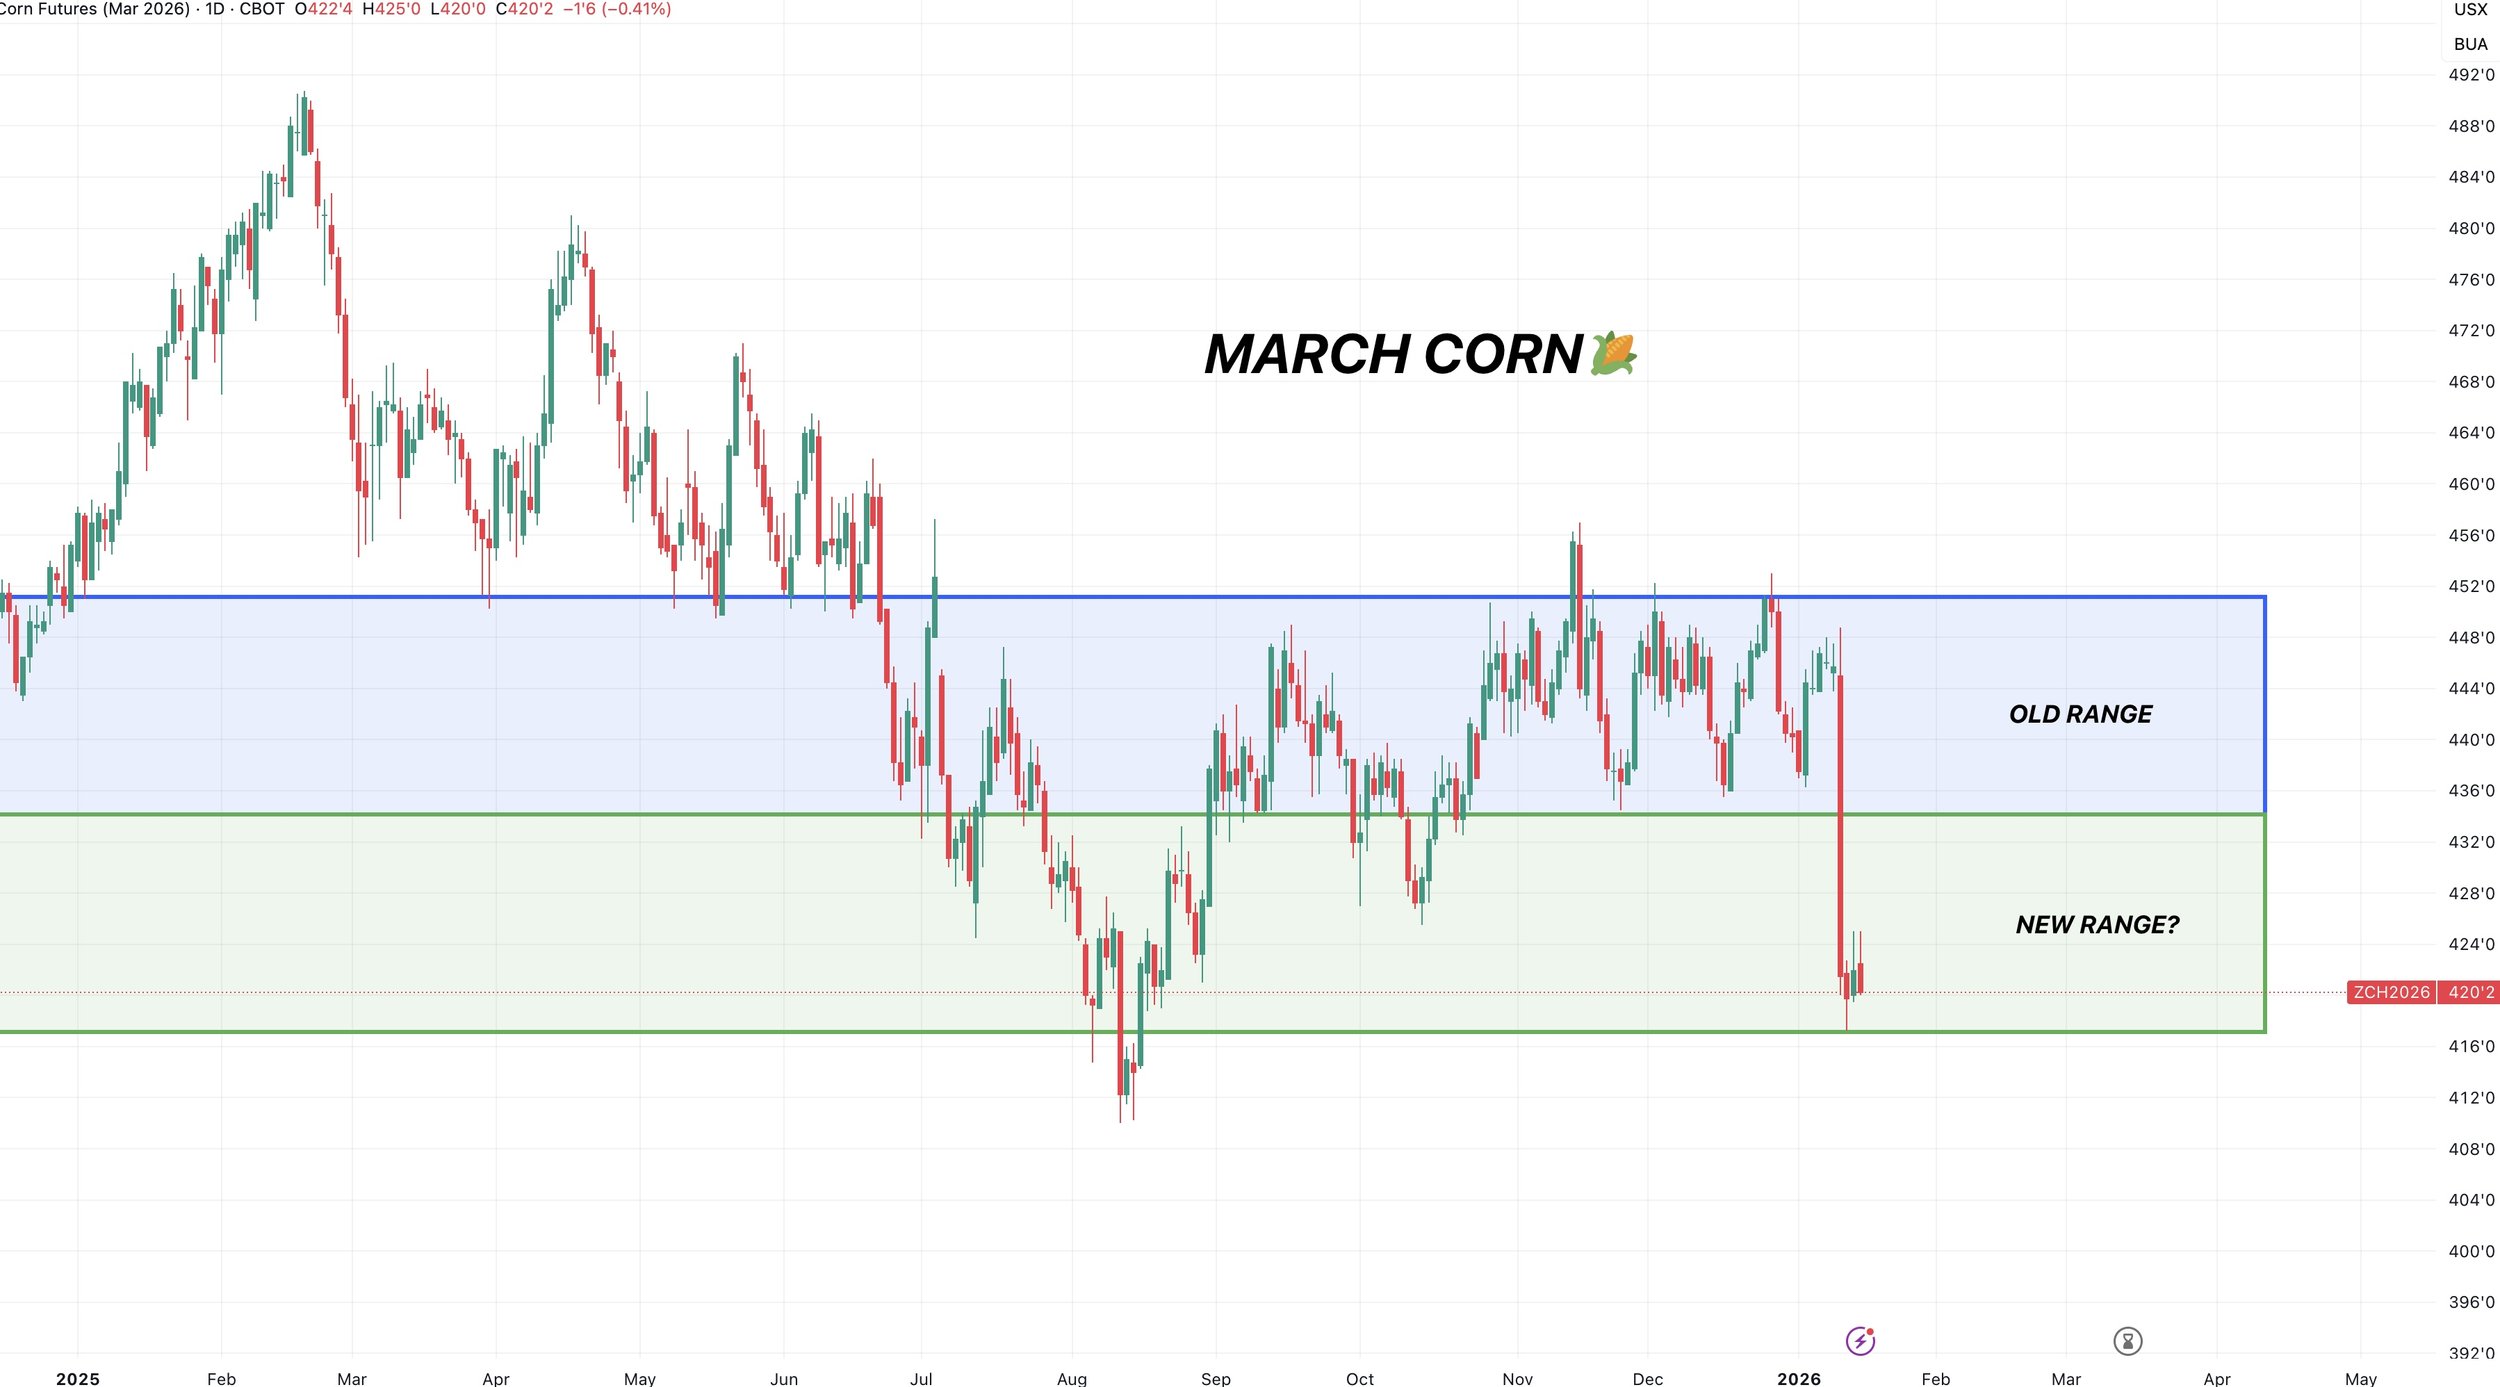
March Corn
I am still not personally trying to catch a falling knife here.
But if you are, you do have some pretty defined levels to work with. With Tuesday's low.
We are at a pretty key spot on the chart that we need to hold.
We are right at the 78.6% level down to contract lows. Which is the last retracement level and line of defense.
If we fail to hold here, it could very easily open the door to those contract lows.
I can’t definitively tell you where we will bottom without seeing confirmation.
However, I can tell you where it makes sense to take risk off the table when the time comes. It's not about outguessing the market. It's about defining where it makes sense to shift your risk to reward.
So let's move on to the next chart.
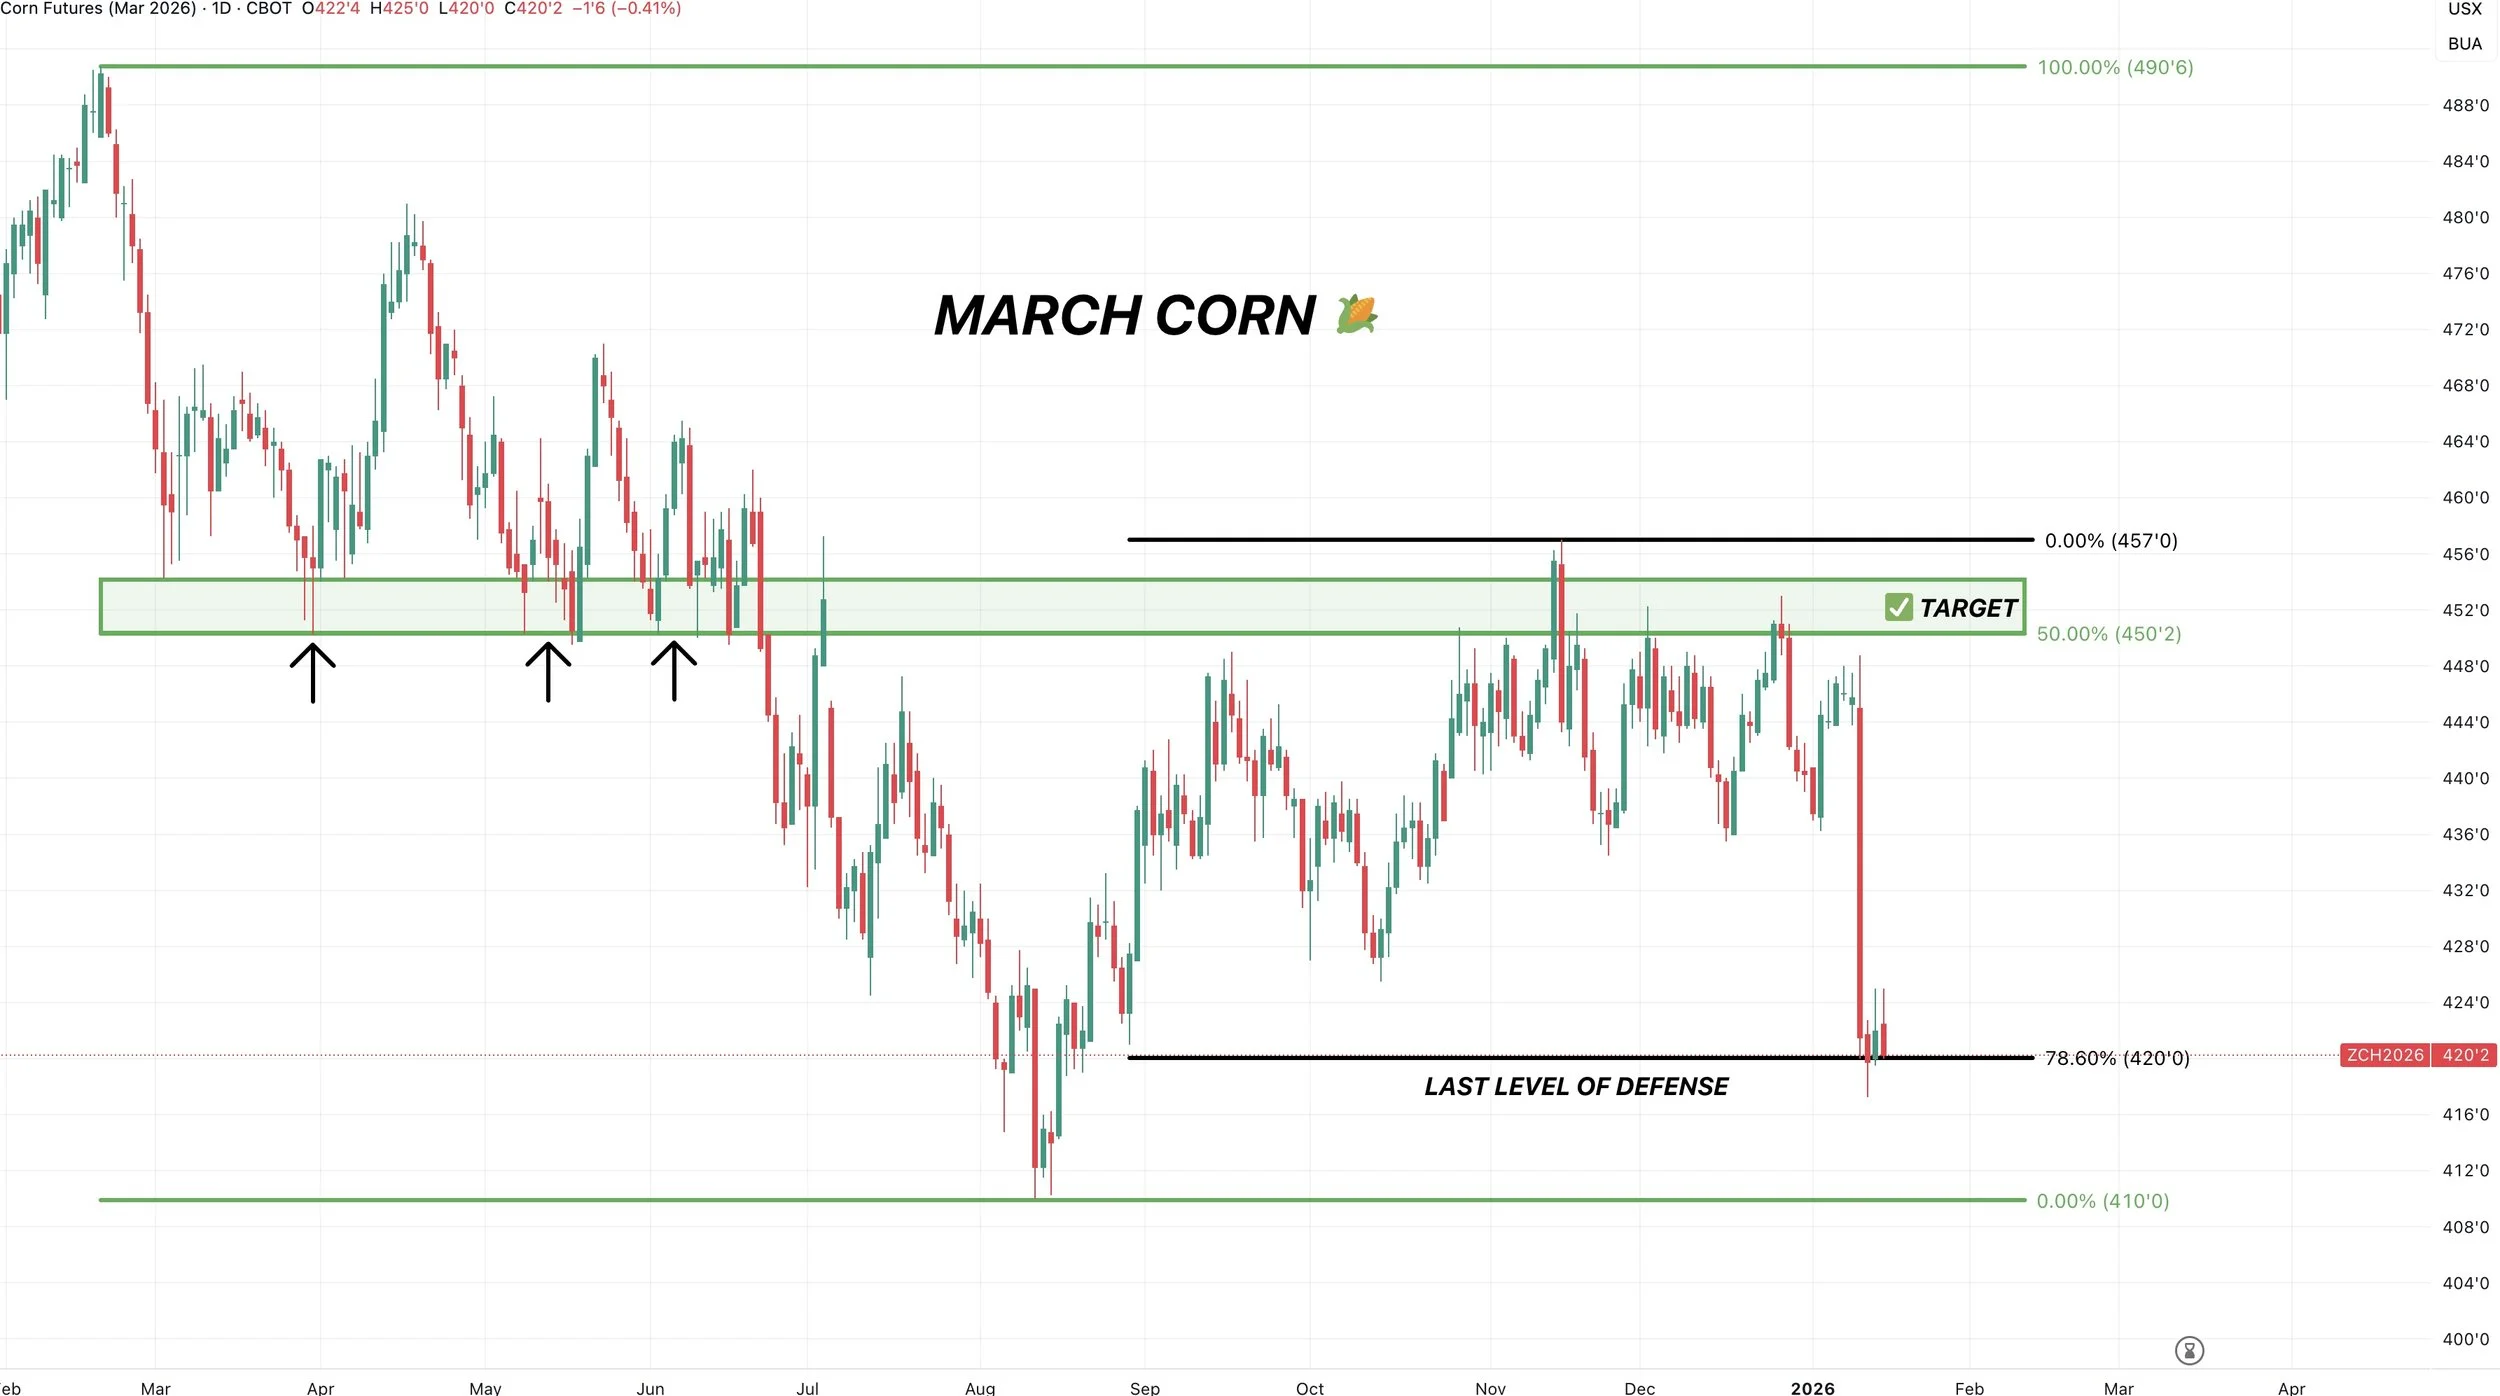
The recent rally topped out after clawing back 50-61.8% of the Feb highs.
That same level also happened to be key support from spring.
So it makes sense to reward a move that claws back 50-61.8% of this recent sell off.
As that same level also happens to be our recent old key support.
Both are the same concept, just on a larger and smaller scale.
Since the fundamental story just shifted, making it even harder to paint a really bullish story. We want to be looking to reward a move in that blue box if it comes.
That is the most common level for a relief bounce to come up to.
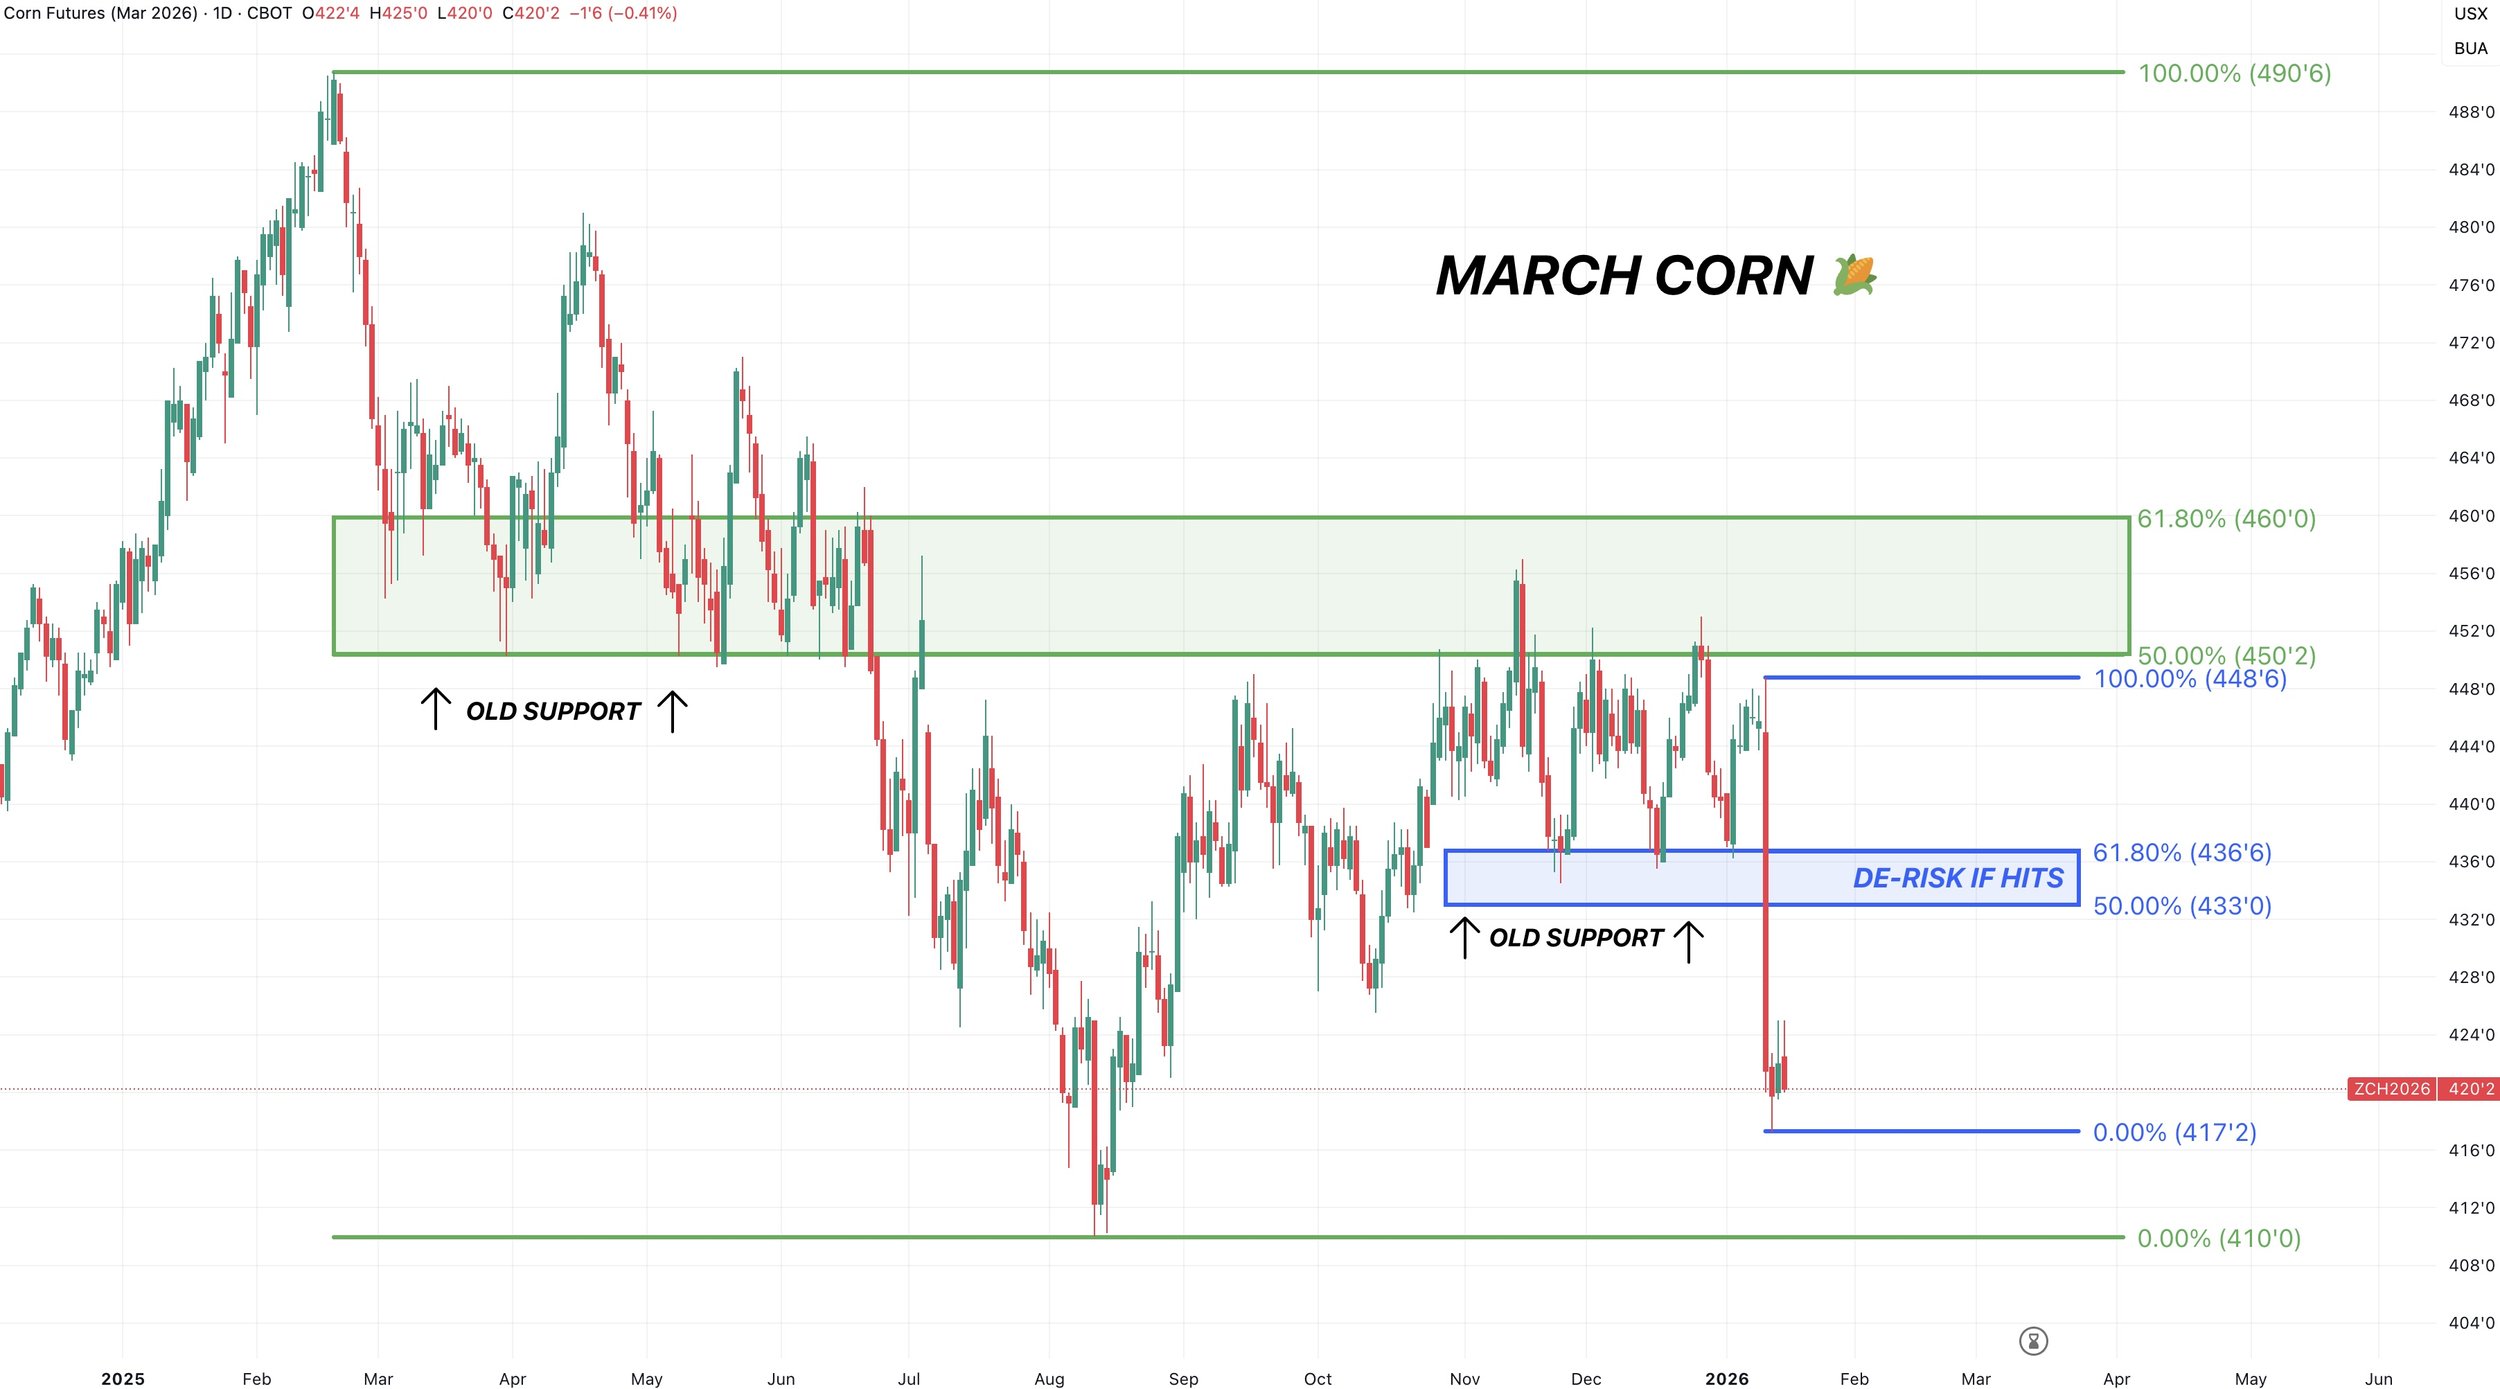
We were just in an extremely tight range for months.
We could very easily be range bound between here and that old support for the time being.
The next big set of data we are going to get is the planting intentions.
So, trading sideways until the market gets some fresh data would not be a surprise at all.
Those planting intentions could then decide which way we break from the range.
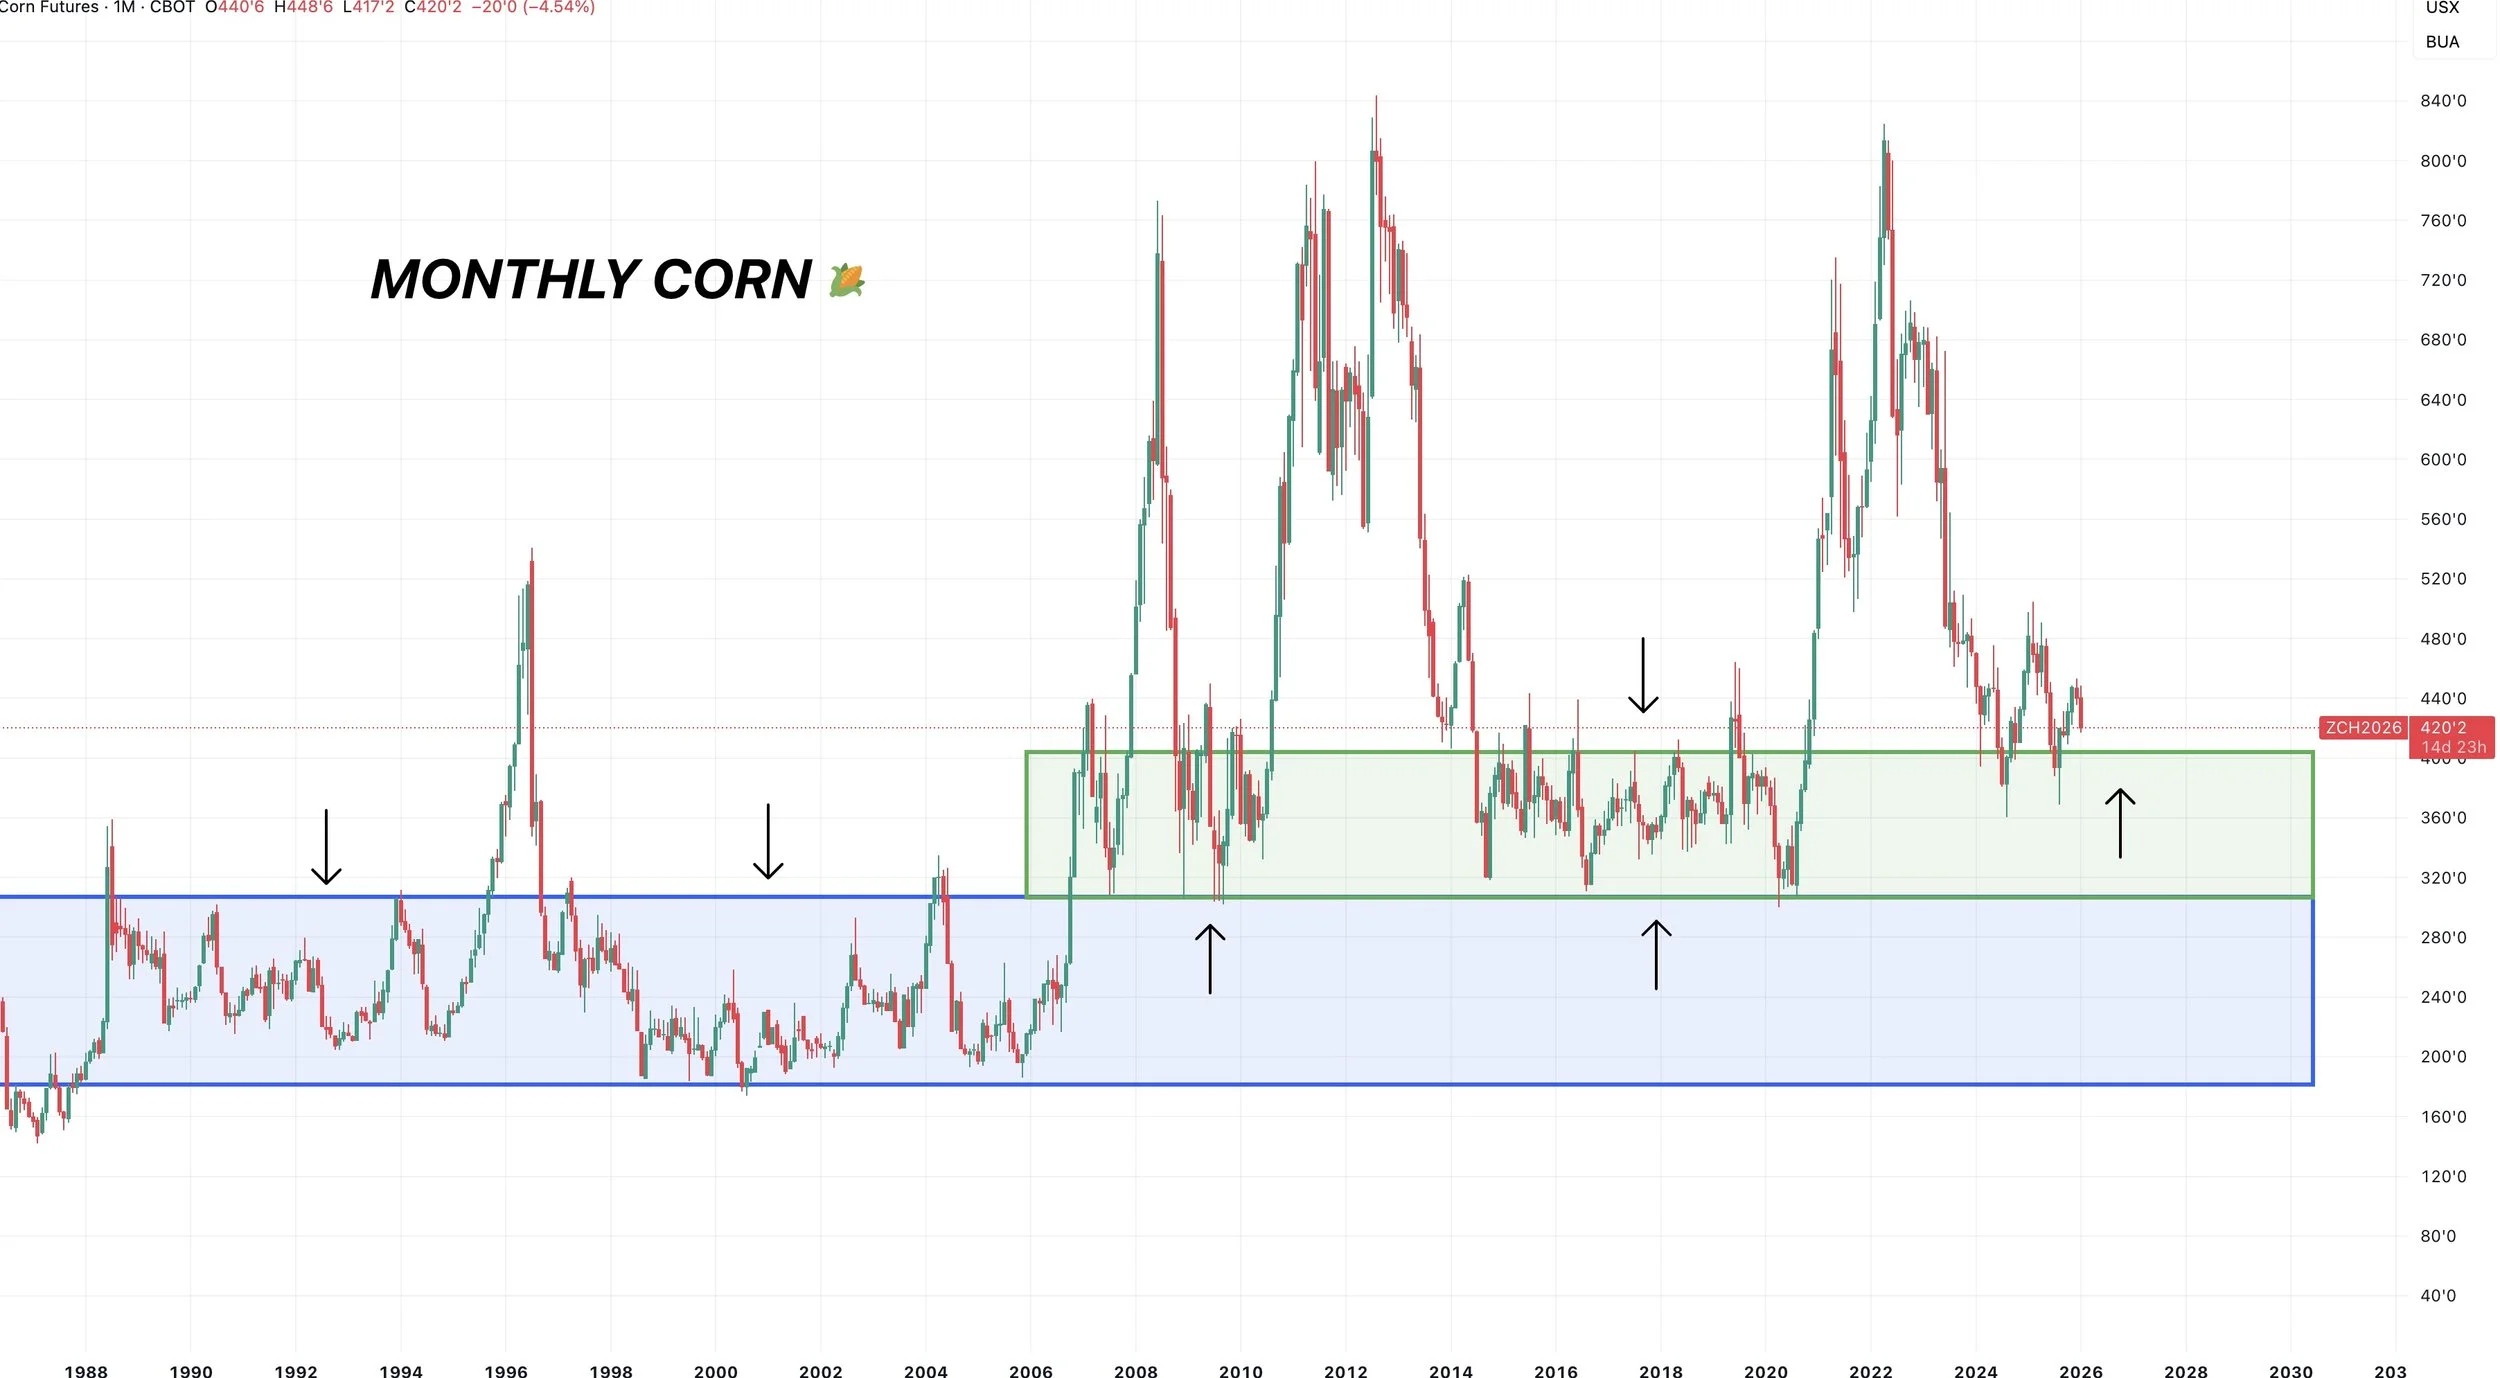
Here is one last chart.
This is the monthly chart.
I've recently seen some chatter and people saying corn is headed to $3.00 etc.
Possible? Sure, as anything is. But I don’t think we have to spend much time below $4.00 if at all.
Corn's ceiling up until 2006 was essentially $3.00 (blue box).
After that, $3.00 became our new floor (green box).
During the bear market from 2014 to 2020, our ceiling was $4.00.
So perhaps around that $4.00 range becomes our new floor.
A simple case of old resistance turning into new support. Which we've seen in the past.
The last few years we only ventured below $4.00 twice. Neither of them last very long.
Soybeans
Fundamentals:
I talked about this on Tuesday, but it is disappointing to see the soybean market have all of this potential, only for that potential to be taken away by trade tensions.
I am talking some serious bullish potential.
For reference, the USDA expects our exports to be down over -100 million bushels compared to the last trade war.
Imagine what the US soybean situation would look like if we had normal export demand.
Add on the fact that crush demand is still great.
The best it's ever been.
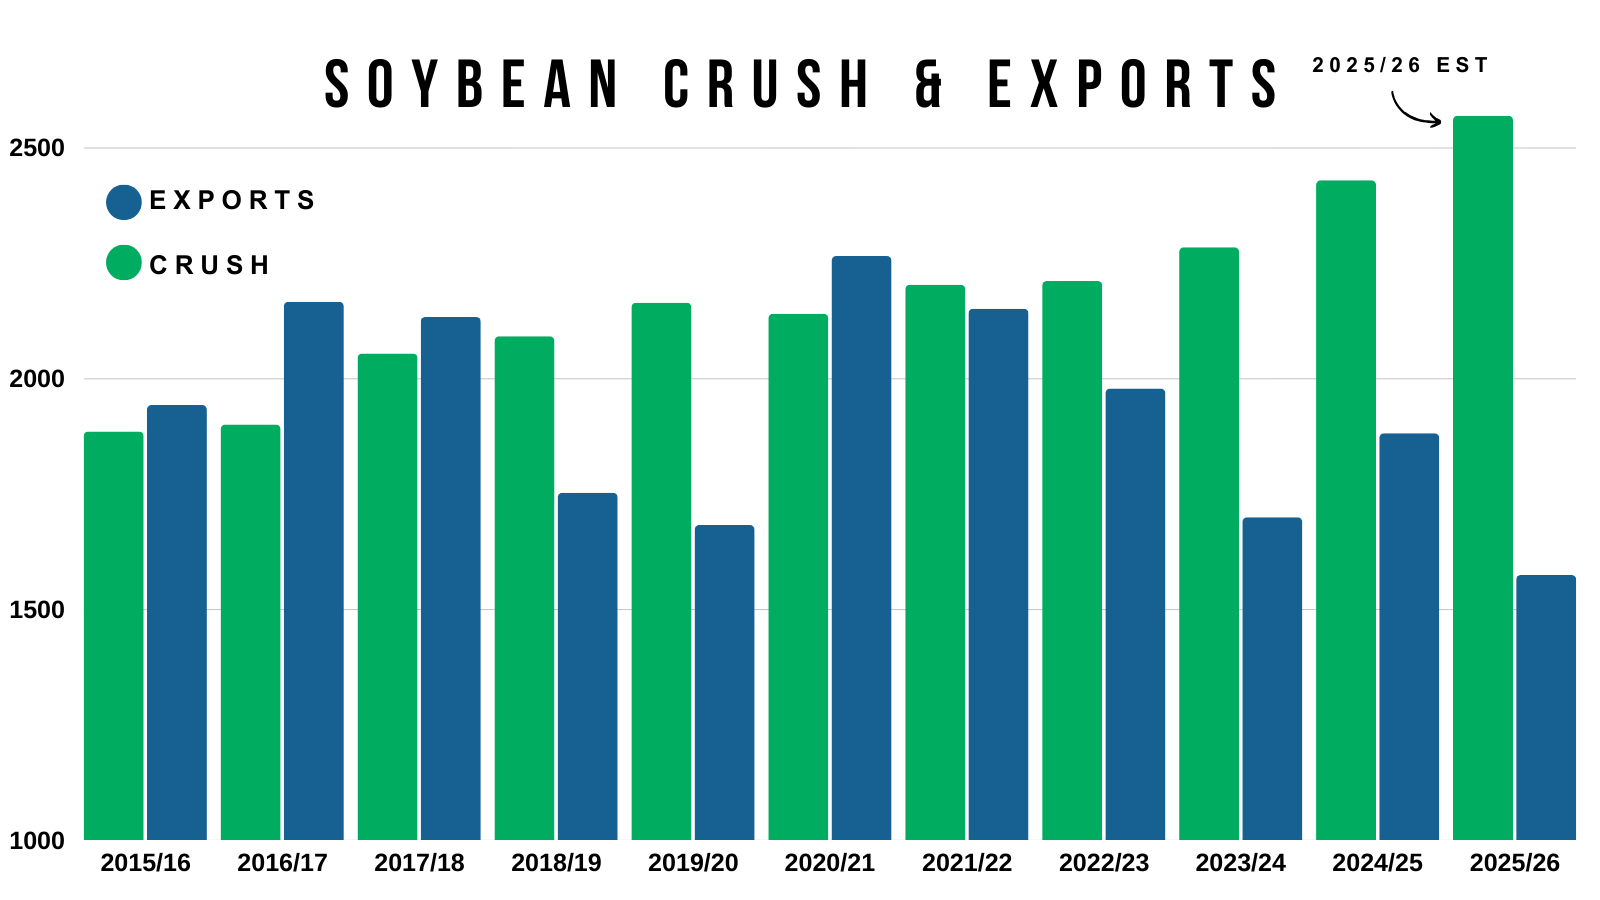
Export demand is cleary the concern when it comes to the soybean market.
You can’t fault the USDA for lowering them on Monday as it was completely justified.
You could argue they still need to be lowered like we talked about earlier.
However, here is a nice chart from Ag Trader Talk.
It shows soybean commitments and the difference between this year and last year (green), along with the USDA's estimates vs last year (orange).
Not too long ago, we were running over -500 million bushels behind last year.
We've started to close that gap. Now only -360 million behind last year.
We aren’t quiet there yet, but we are getting more in line with the USDA's estimates.
So we will have to wait and see if China continues to step up and if the USDA will have to lower exports once again or not.
Our soybeans are overpriced compared to Brazil's. By a lot.
Brazil has a monster crop that is about to come online.
Which would make you think exports continue to struggle.
However, we do also have to keep in mind that there is politics at play here. China has been buying despite the fact Brazil is a lot cheaper.
But overall, there just isn’t that catalyst to get bulls super excited about right now.
If we start to see those Brazil estimates walked back, or China start to come in and buy more than expected, then yes, this market could catch a bid.
But for now, we will want to be looking to reward any sizeable rally.
Technicals:
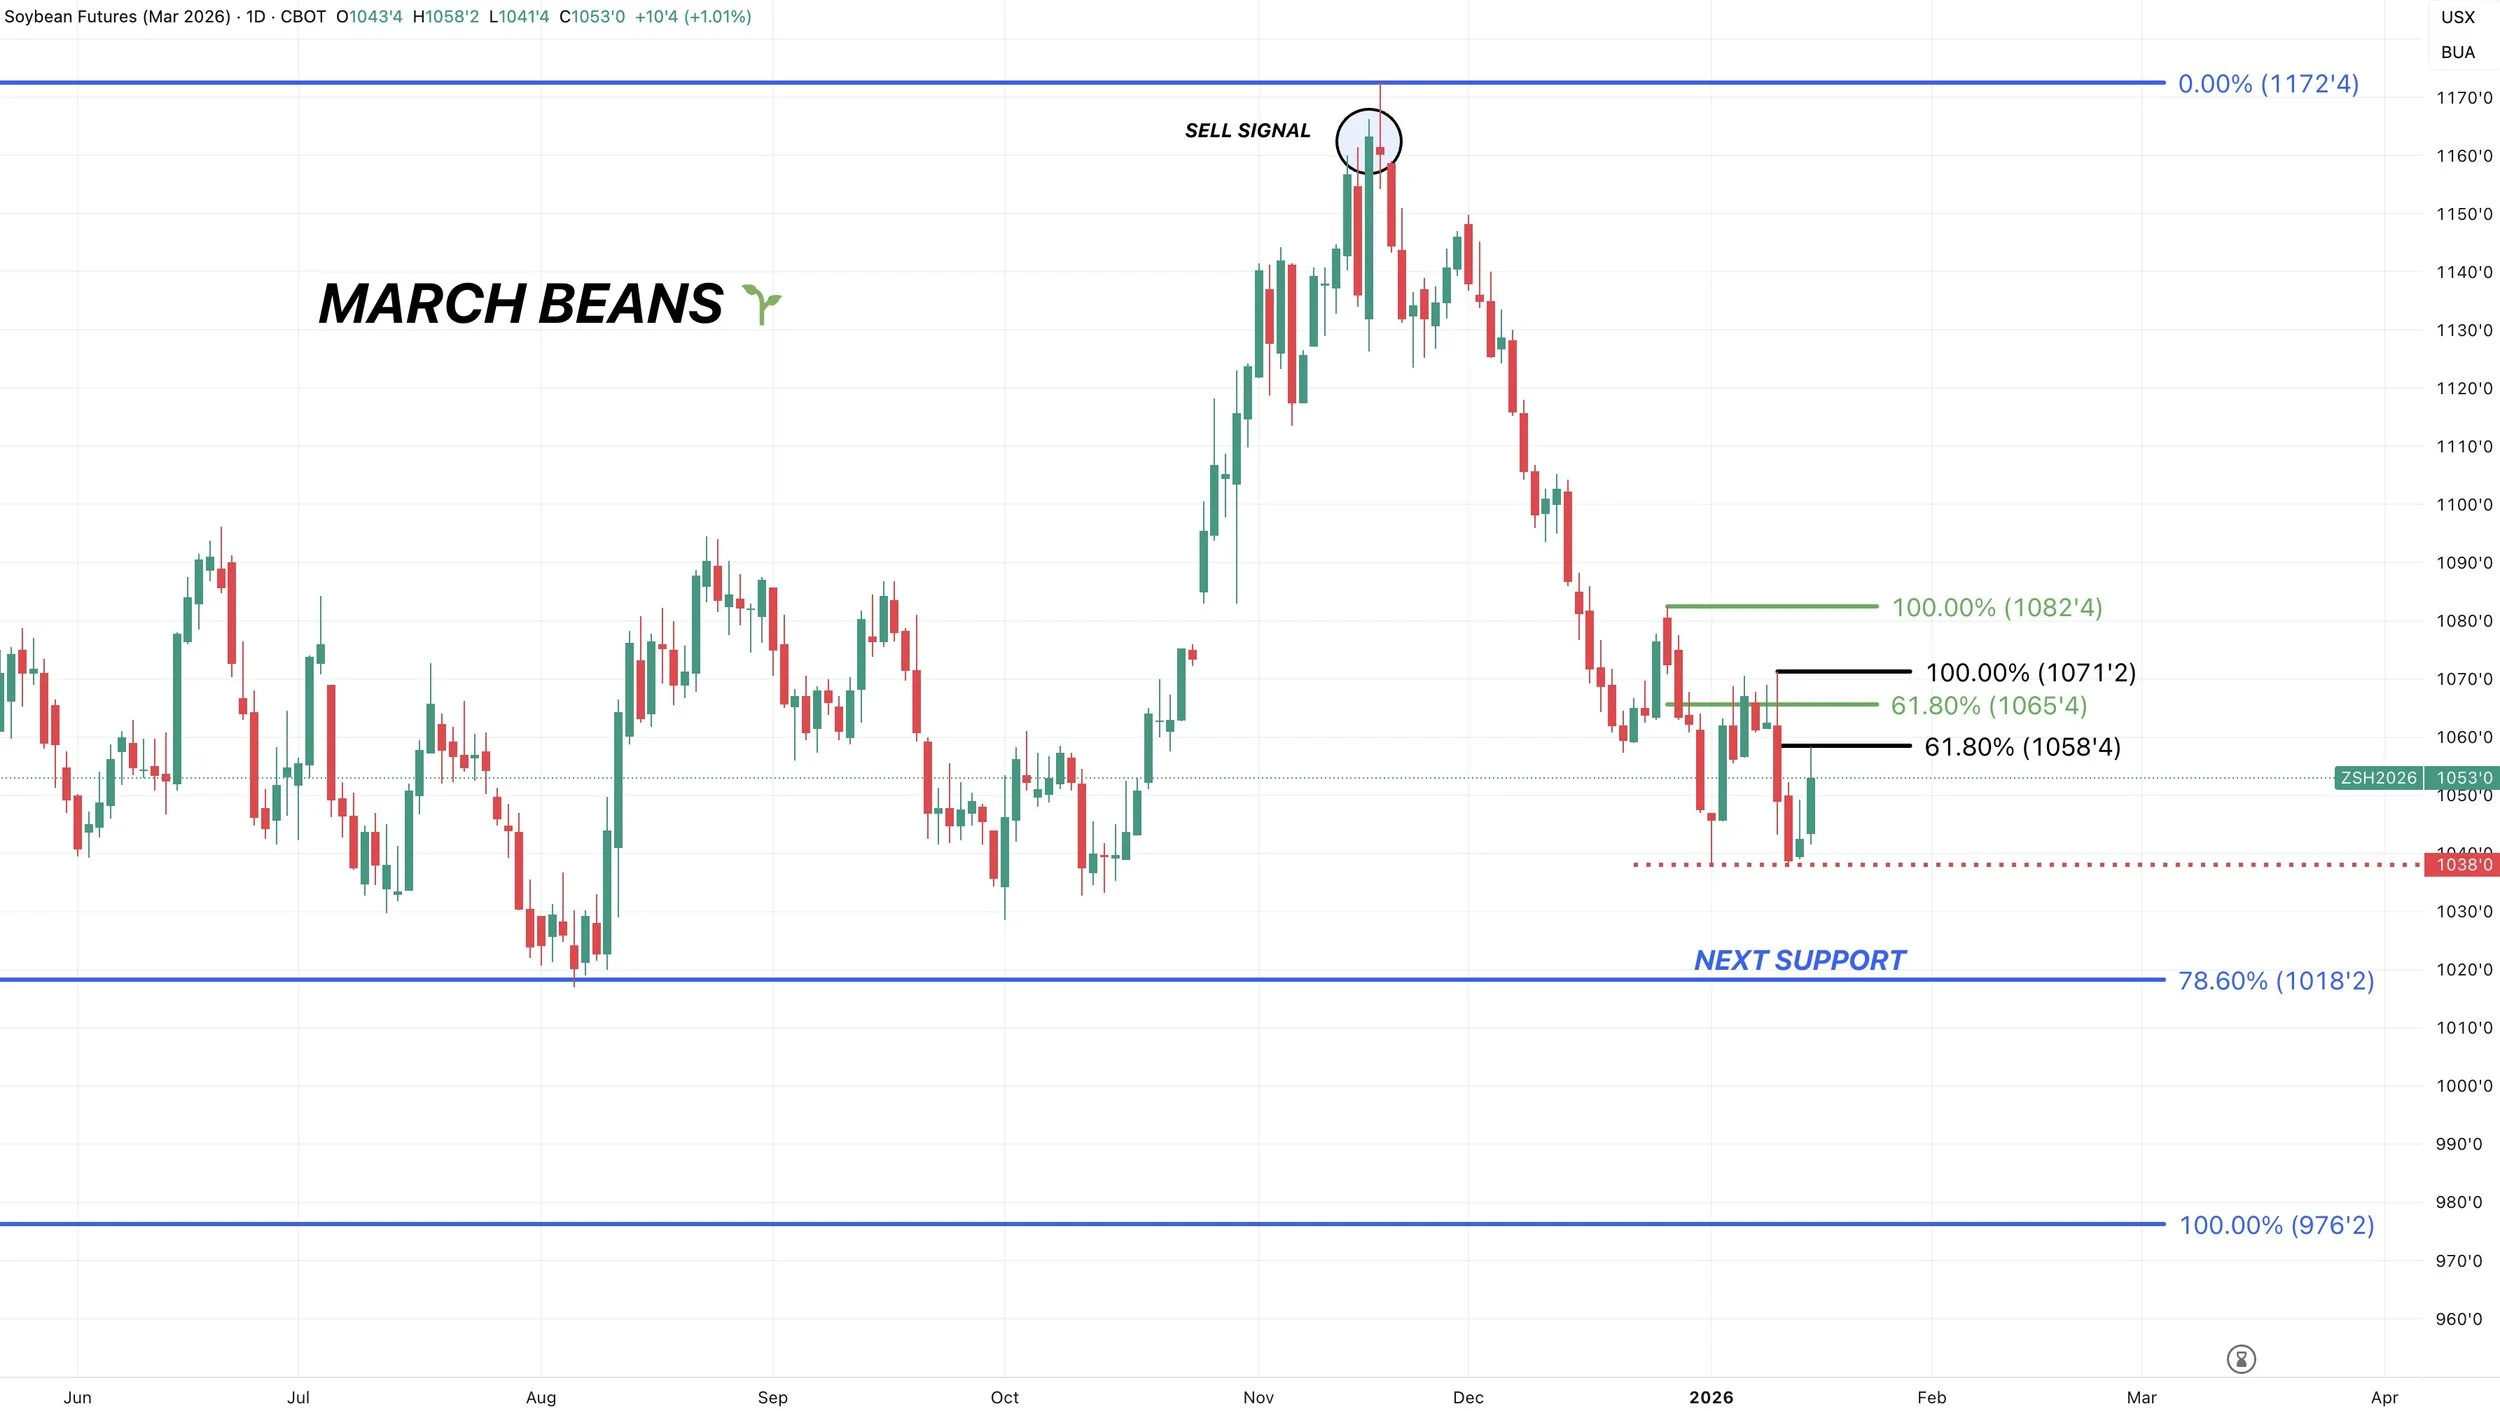
March Beans
We saw a nice bounce right at that must hold spot.
If we fail to hold these recent lows, it could easily open the door towards that $10.18 level.
As that gives back 78.6% of the Nov highs all the way down to the contract lows.
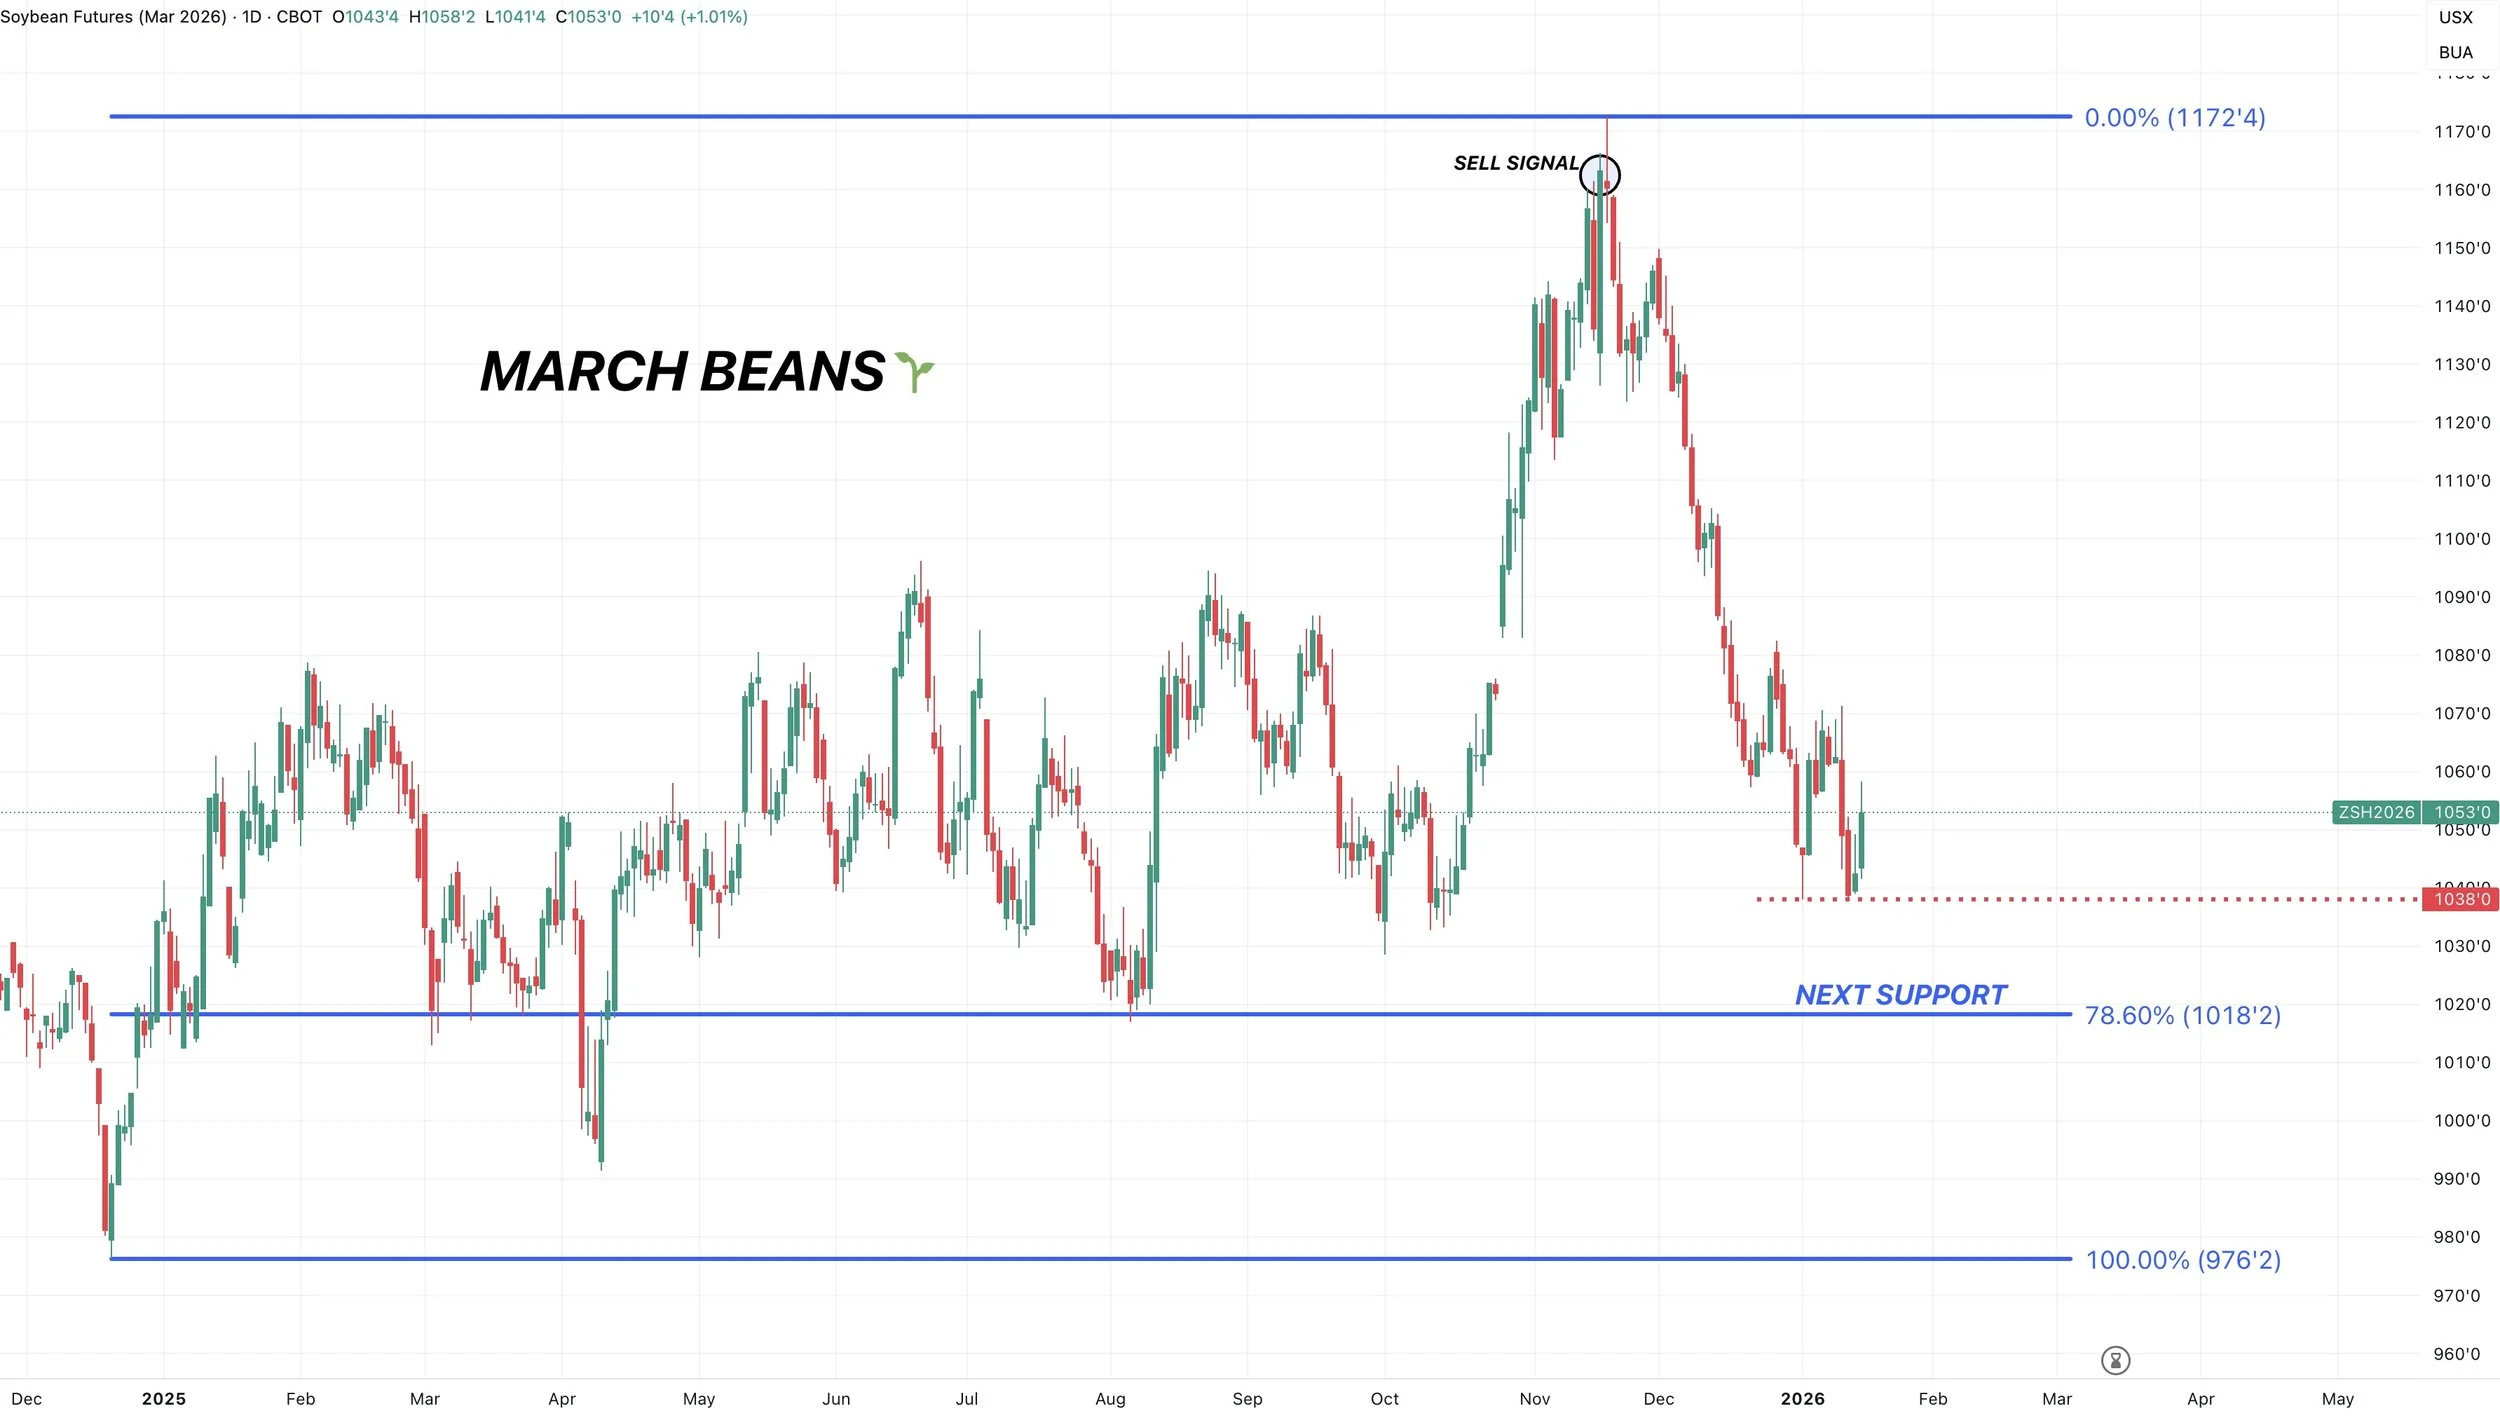
Despite the nice bounce today, we are still clearly in a downtrend with some work to do.
The last bounce failed after clawing back 61.8% of the previous bounces highs (green lines).
Today we clawed back exactly 61.8% of the last bounces highs (black lines).
So that is the level we need to break above to spark some further upside here.
As bounces up to that level are typically reviewed as simple relief bounces until you break above.
Wheat
Wheat lower across the board today.
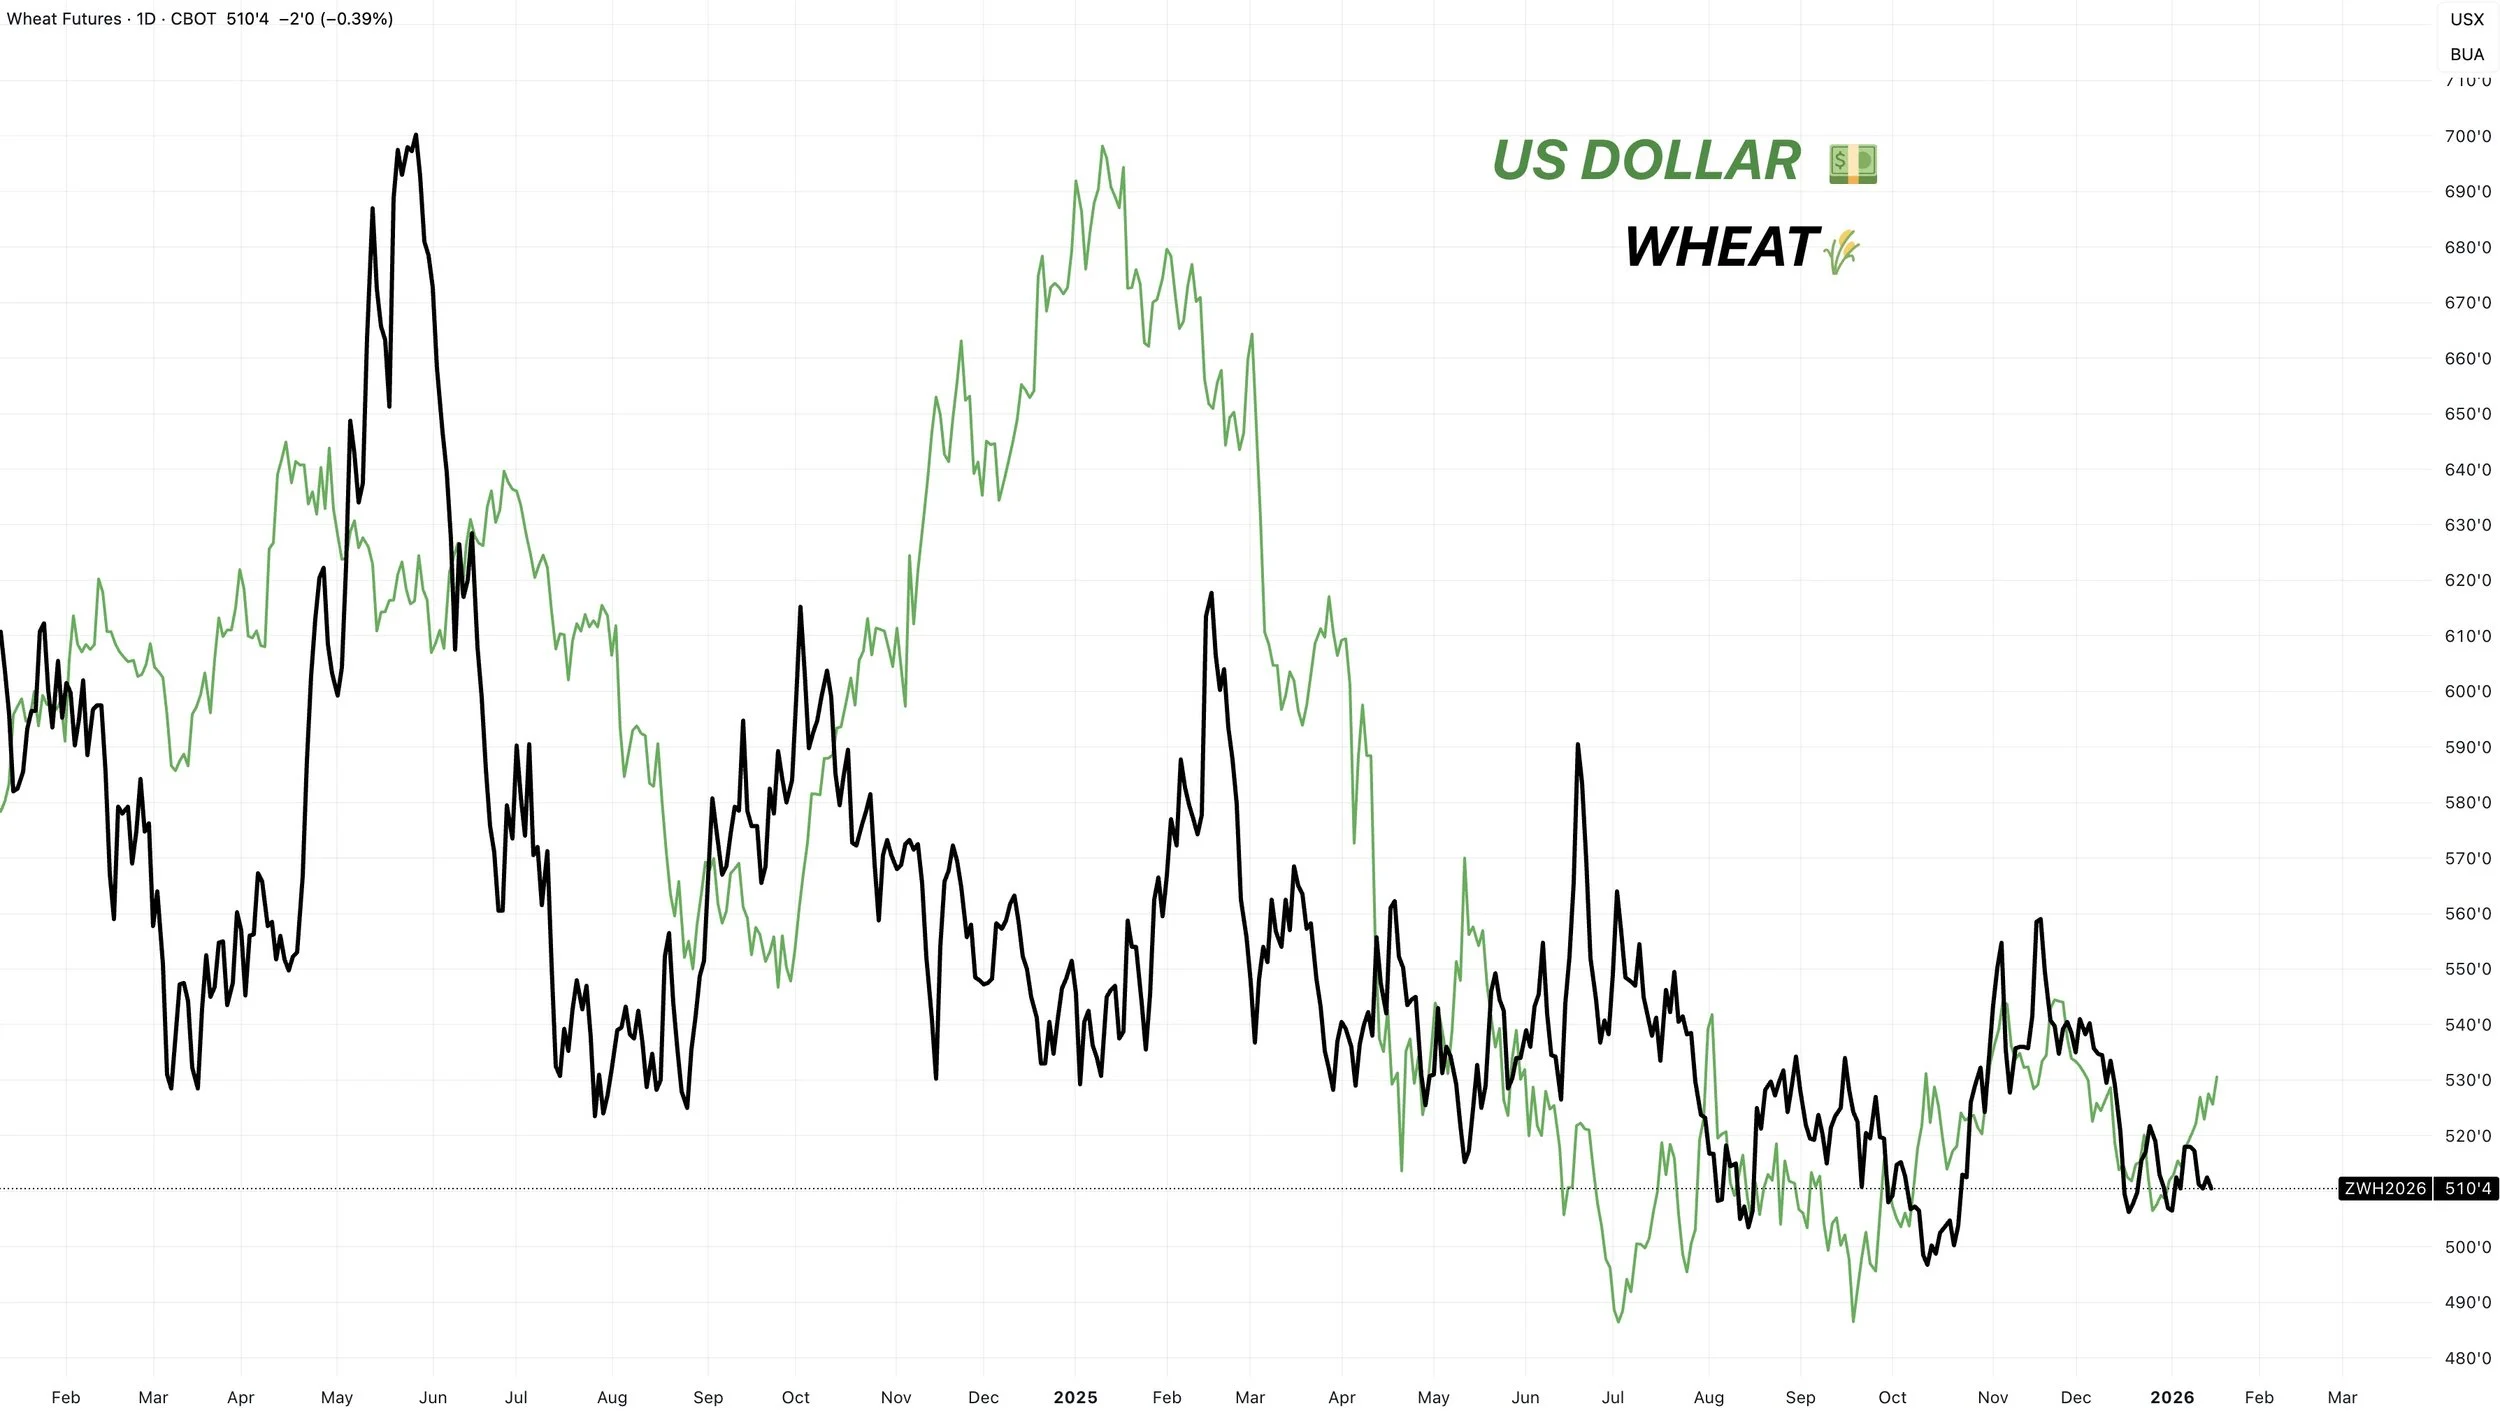
Some people will say "the wheat market was lower today because the dollar was higher".
Yes a weaker dollar is friendly for exports, but it's not an inverse trade between the two.
Here is the US dollar vs wheat prices. Both have tanked. No inverse correlation day to day otherwise wheat theoretically should be a lot higher and that's not the case.
Wheat still lacks a true story for bulls to get behind.
Like we've been talking about for a while, the US situation isn’t bullish today.
The USDA once again raised our stocks to use.
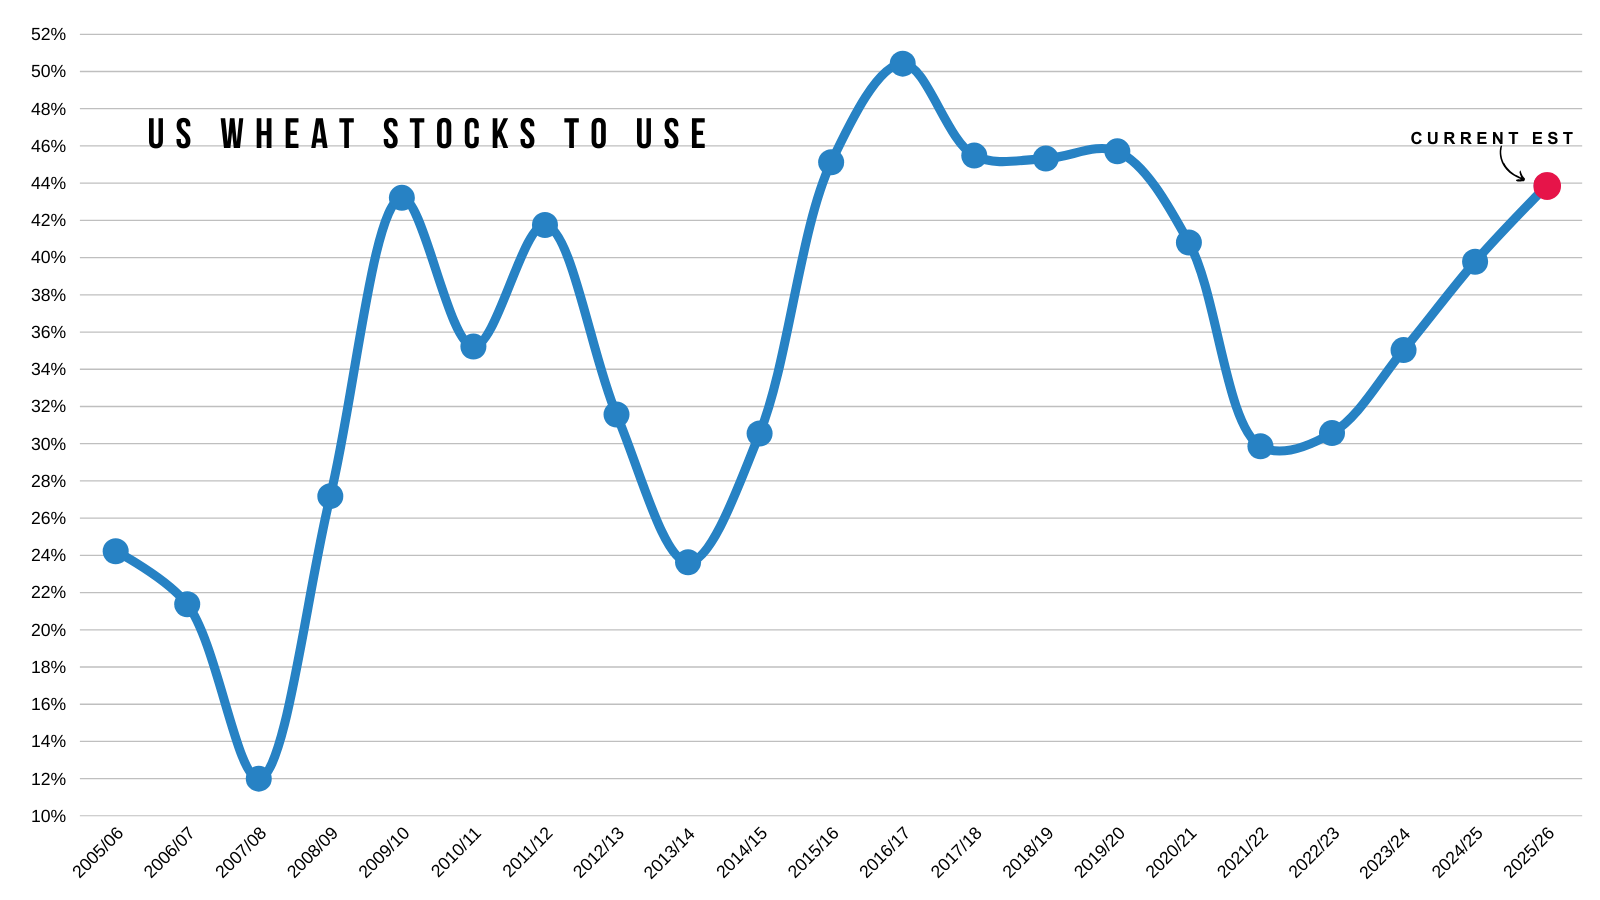
On the bright side, demand is still solid for the wheat market.
Right now, wheat commitments are up +16% vs last year.
Yet.. the USDA only has their export estimate up +9% vs last year
(826 last year vs 900 million this year)
So you could definitely argue exports could be bumped in the future.
Here is a chart from Robert McClure show casing our current pace vs the USDA's target.
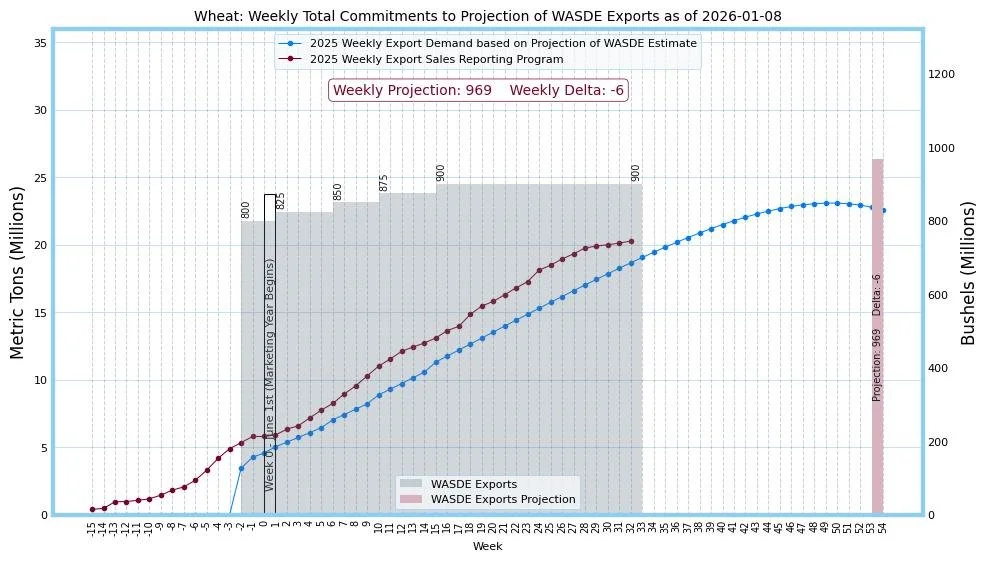
It's hard to imagine wheat is gaining any extra acres. So that's a positive moving forward.
Really nothing else on wheat today.
We still don’t have that factor saying we have to go tremendously higher yet.
Just simply being prepared and ready for when we do.
Technicals:
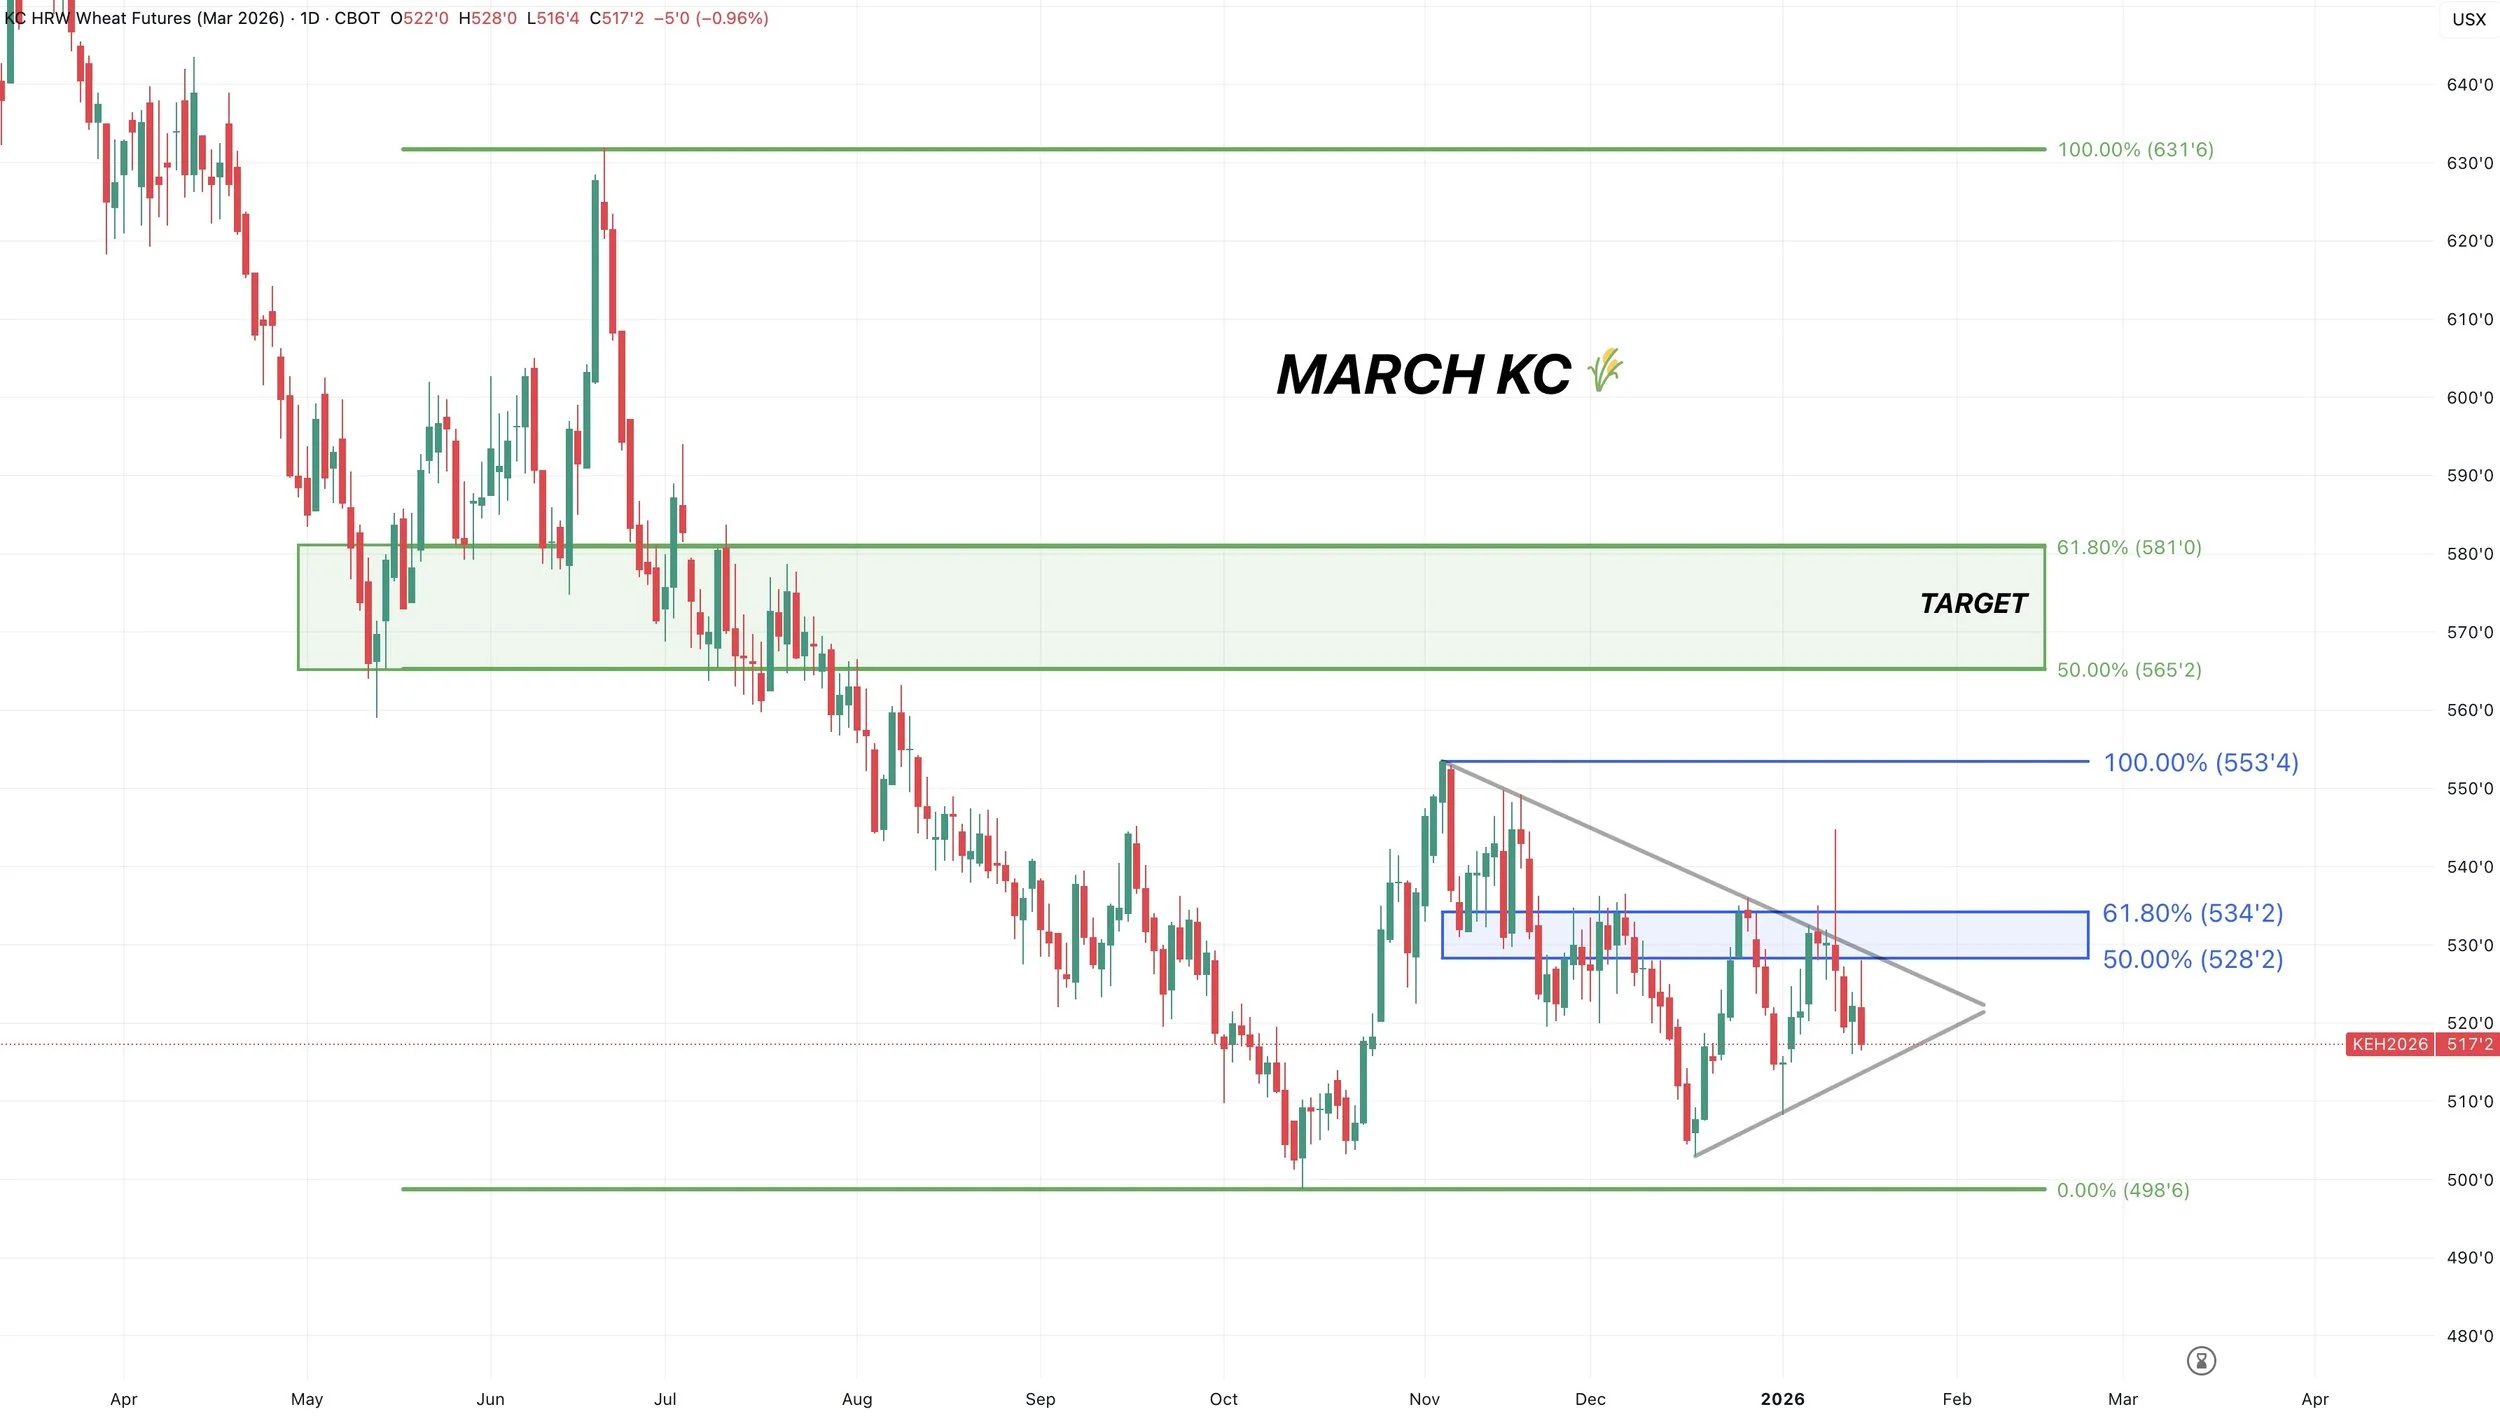
March KC
The level to break is those recent highs.
Break above and it should result in further upside.
That claws back 61.8% of the Nov highs.
We've got a little bit of a wedge pattern going on right now. We will have to wait and see which direction it breaks out of.
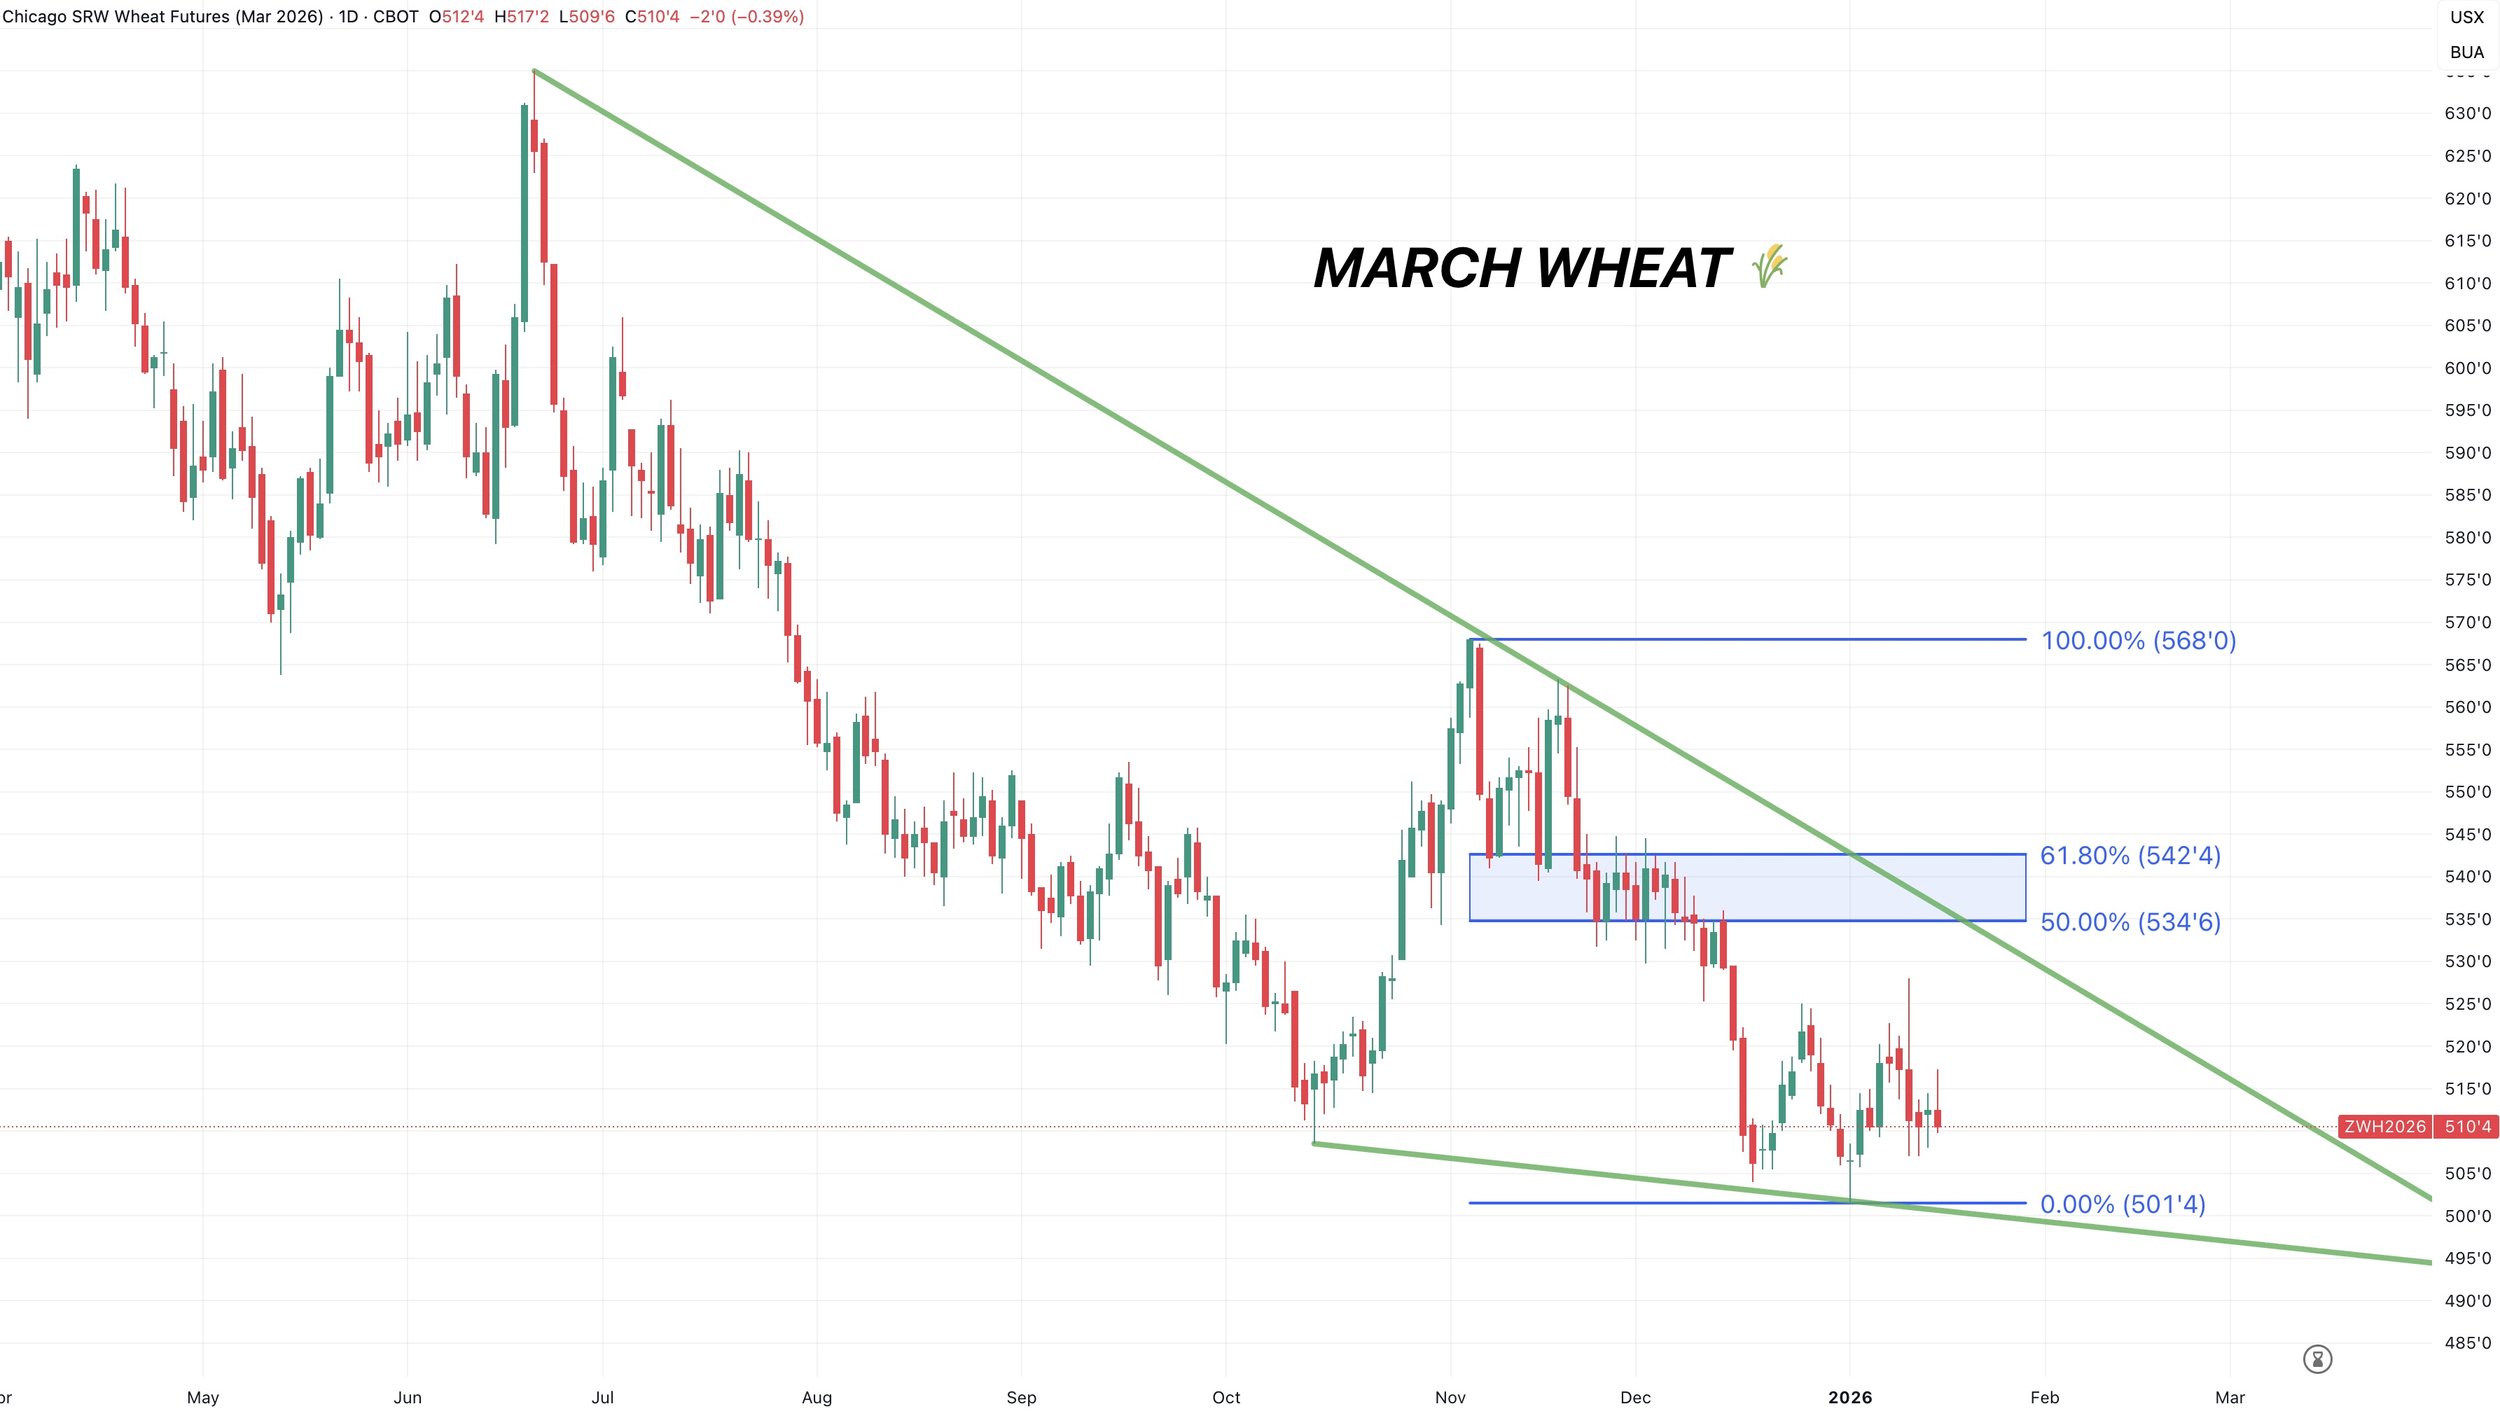
March Chicago
Nothing to update on Chicago.
Essentially sideways near the lows.
Still haven’t seen anything confirming we've put in our lows yet.
Cattle
Fundamentals:
Cattle continues to run.
Cash prices that go into the feeder cattle index were sharply higher yesterday with auctions in the south such as Nebraska and South Dakota. So that gave us a bump today.
Fundamentals are mixed. Demand for cash feeders is strong, but packer profitability is down.
Like we've been talking about, we do like keeping downside protection at these levels.
As there are some concerns about how much stronger beef demand can get.
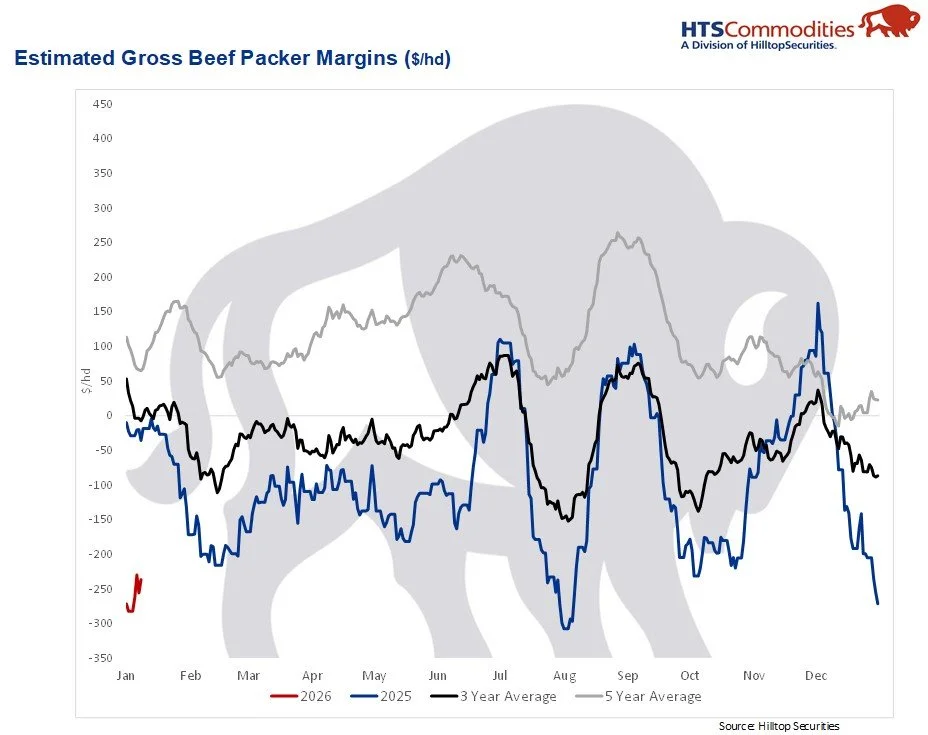
Below is a chart from HTS Commodities that shows estimated gross beef packer margins.
Packer margins have flipped extremely negative.
Meaning the value of boxed beef isn’t keeping up with the cost of buying live cattle.
Usually, when margins get squeezed like this, packers will try to protect themselves by bidding less aggressively and or reducing slaughter. Which can be a tailwind.
As it should lead to less live cattle demand and slaughter.
It lines up with the idea that beef demand might be starting to cool at these levels.
I am not saying cattle can’t go and post new highs. Because we can.
It simply makes sense to defend these levels when the wholesale side of the market is blinking.
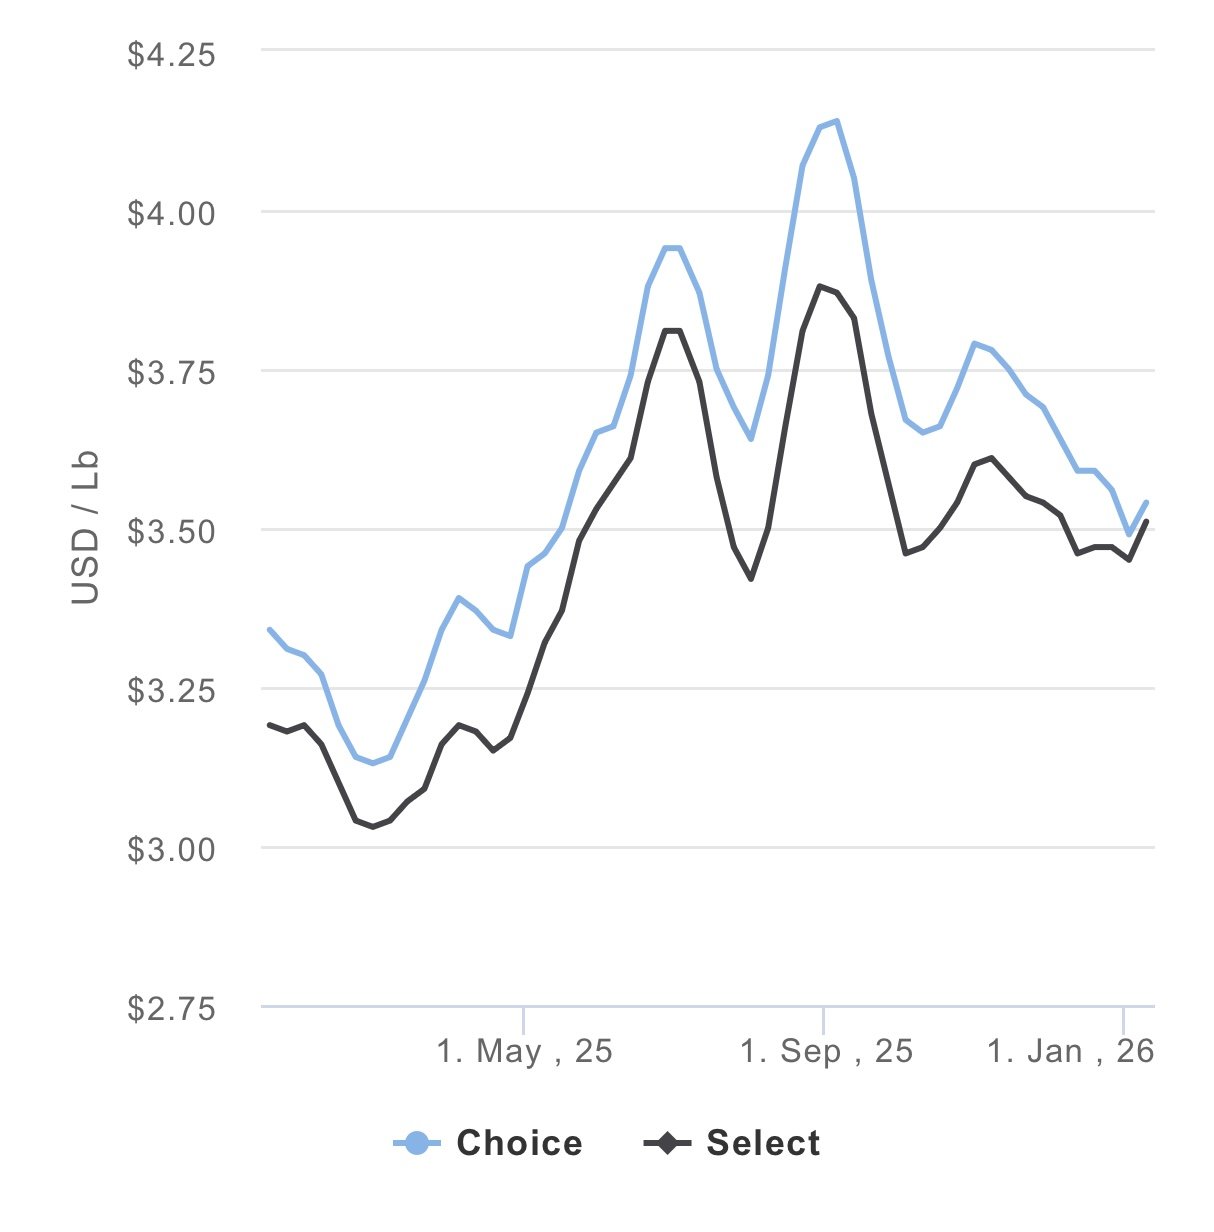
We have cut out values at their lowest levels in a while. Which tells us that demand is getting softer and can lead to packers losing their leverage to bid cattle higher.
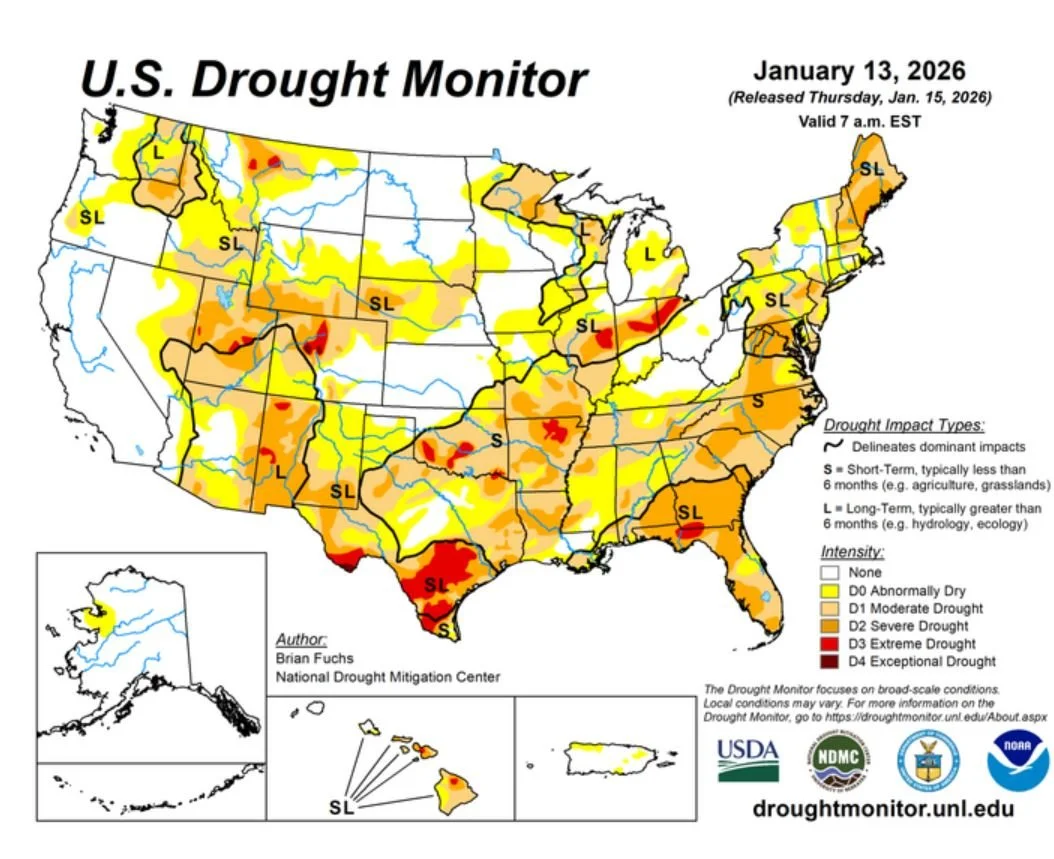
Here is the drought monitor.
Drought in south Texas does not bode well for herd rebuilding. As you can’t rebuild the herd if you don’t have grass for it.
However, it does bring more cows to market and pressure beef prices.
Demand for feeders is as strong as ever, but there are plenty of conflicting signals in the market today.
Technicals:
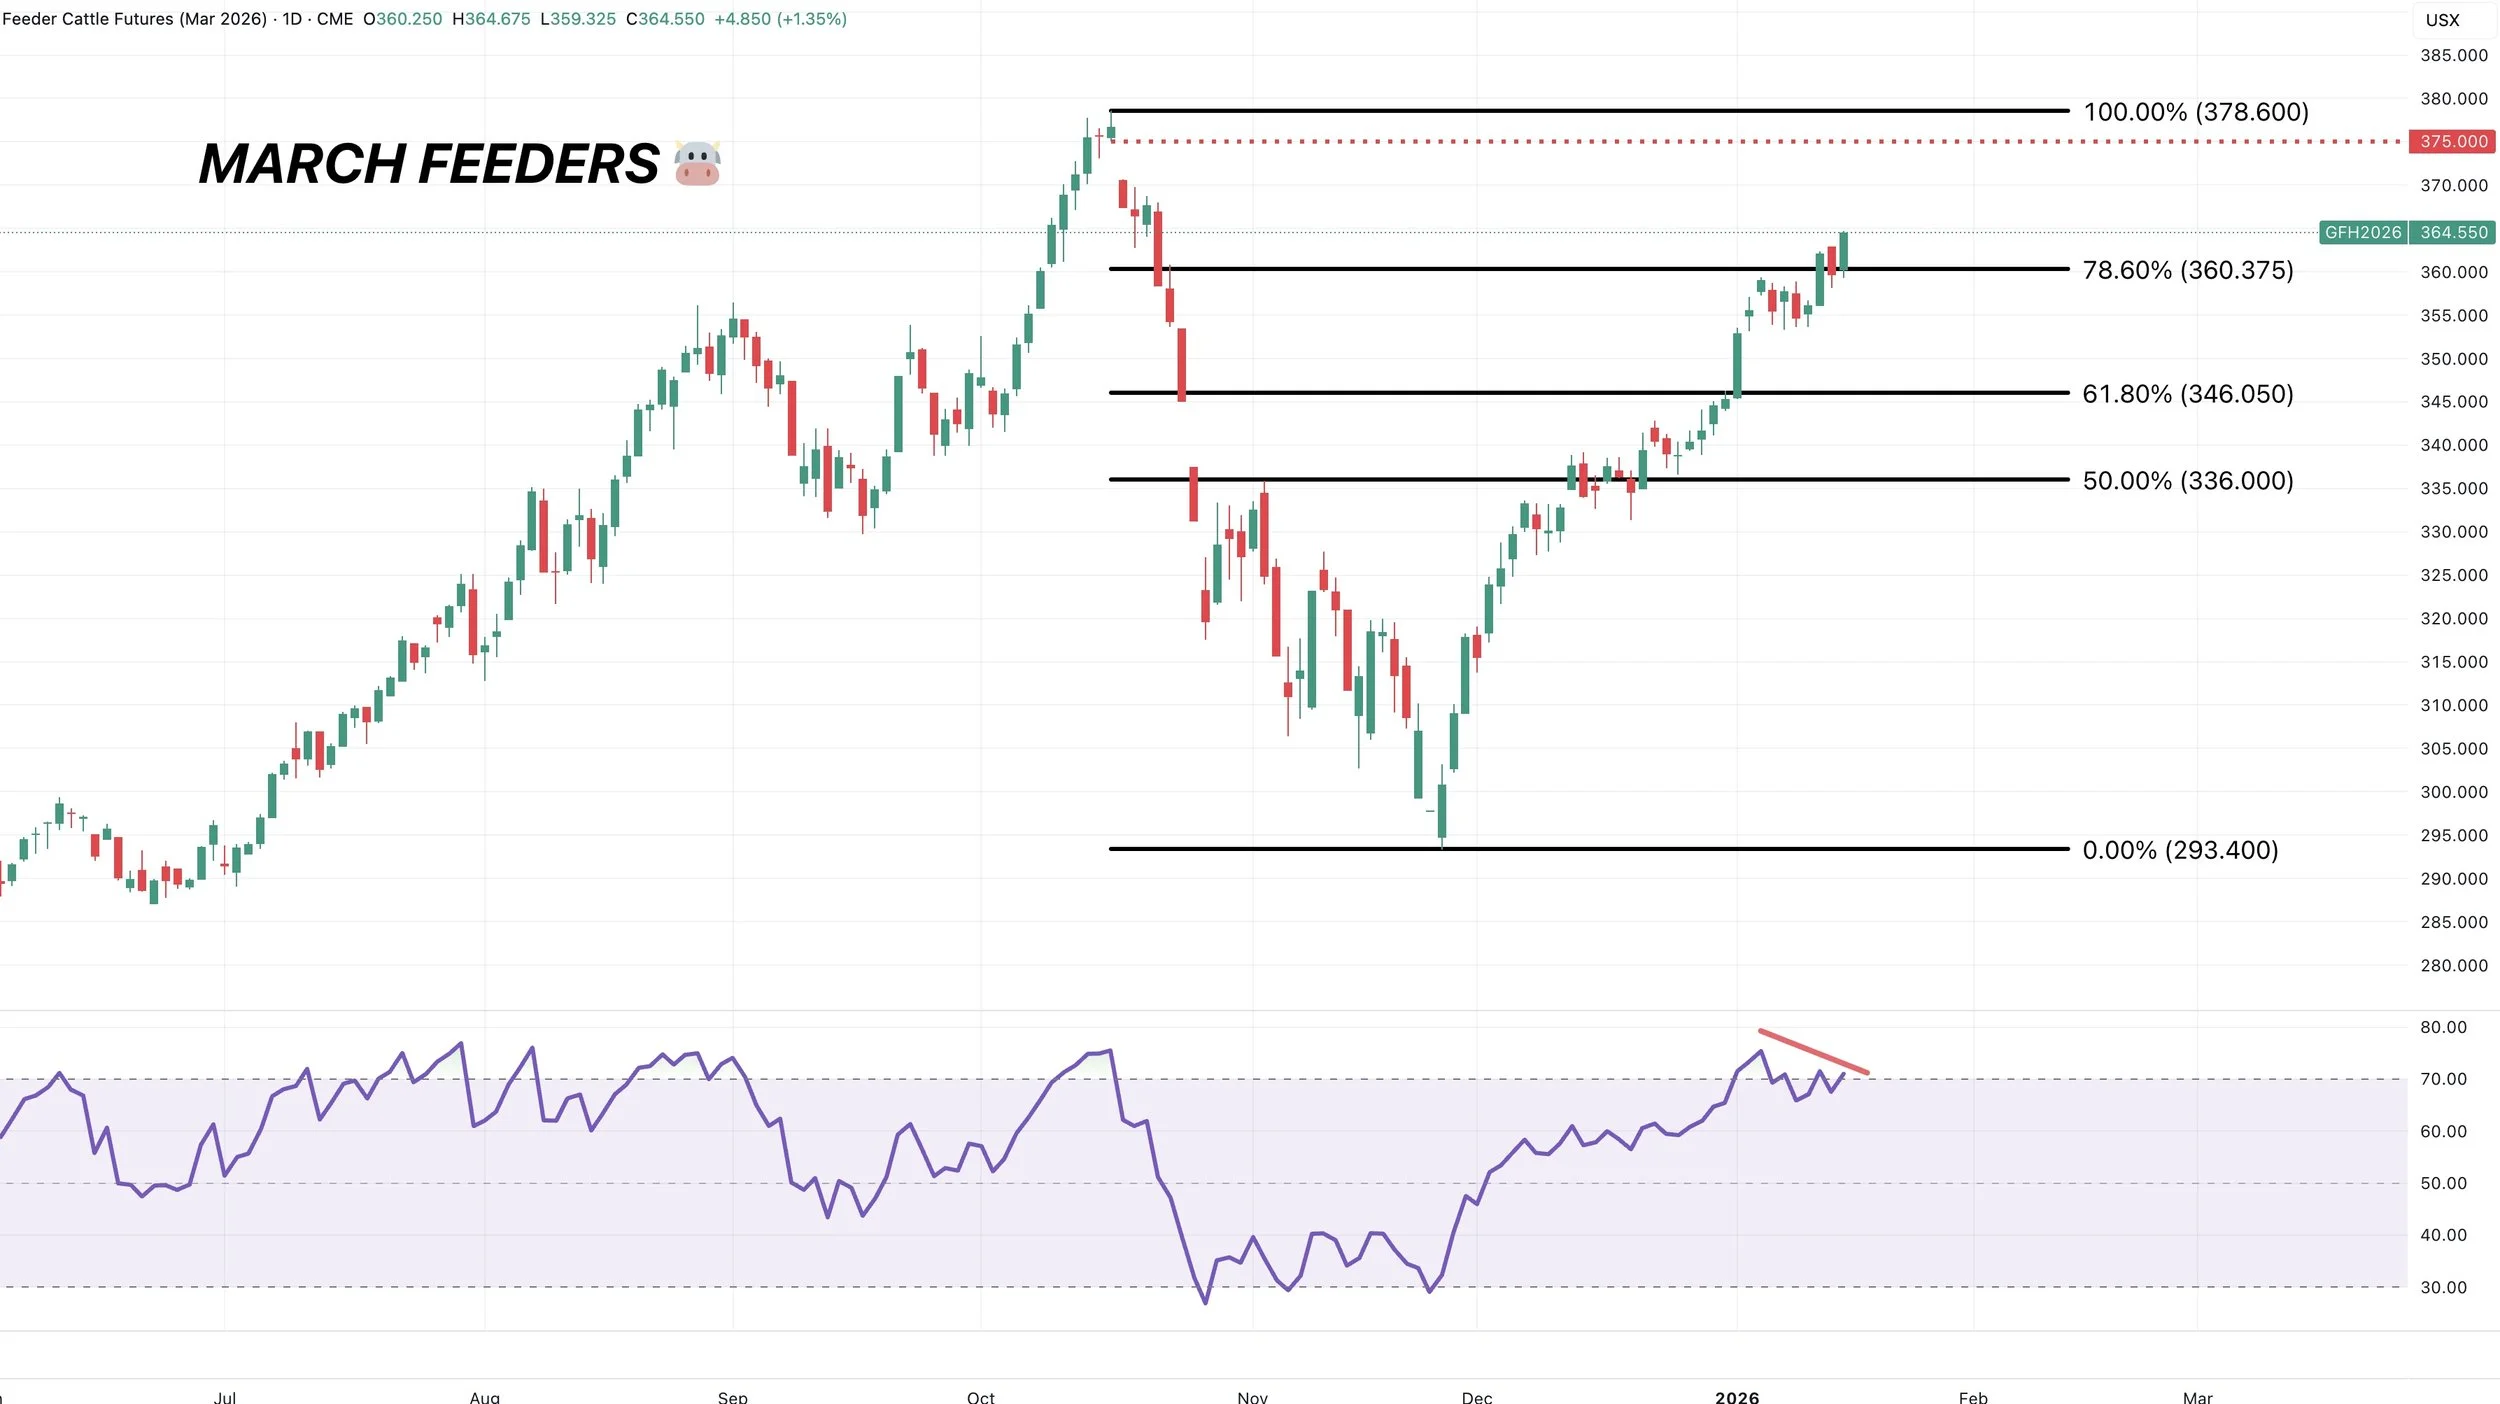
March Feeders
The next point of interest is that final gap and the highs.
However the RSI is showing bearish divergence. Just another reason to use caution up here.
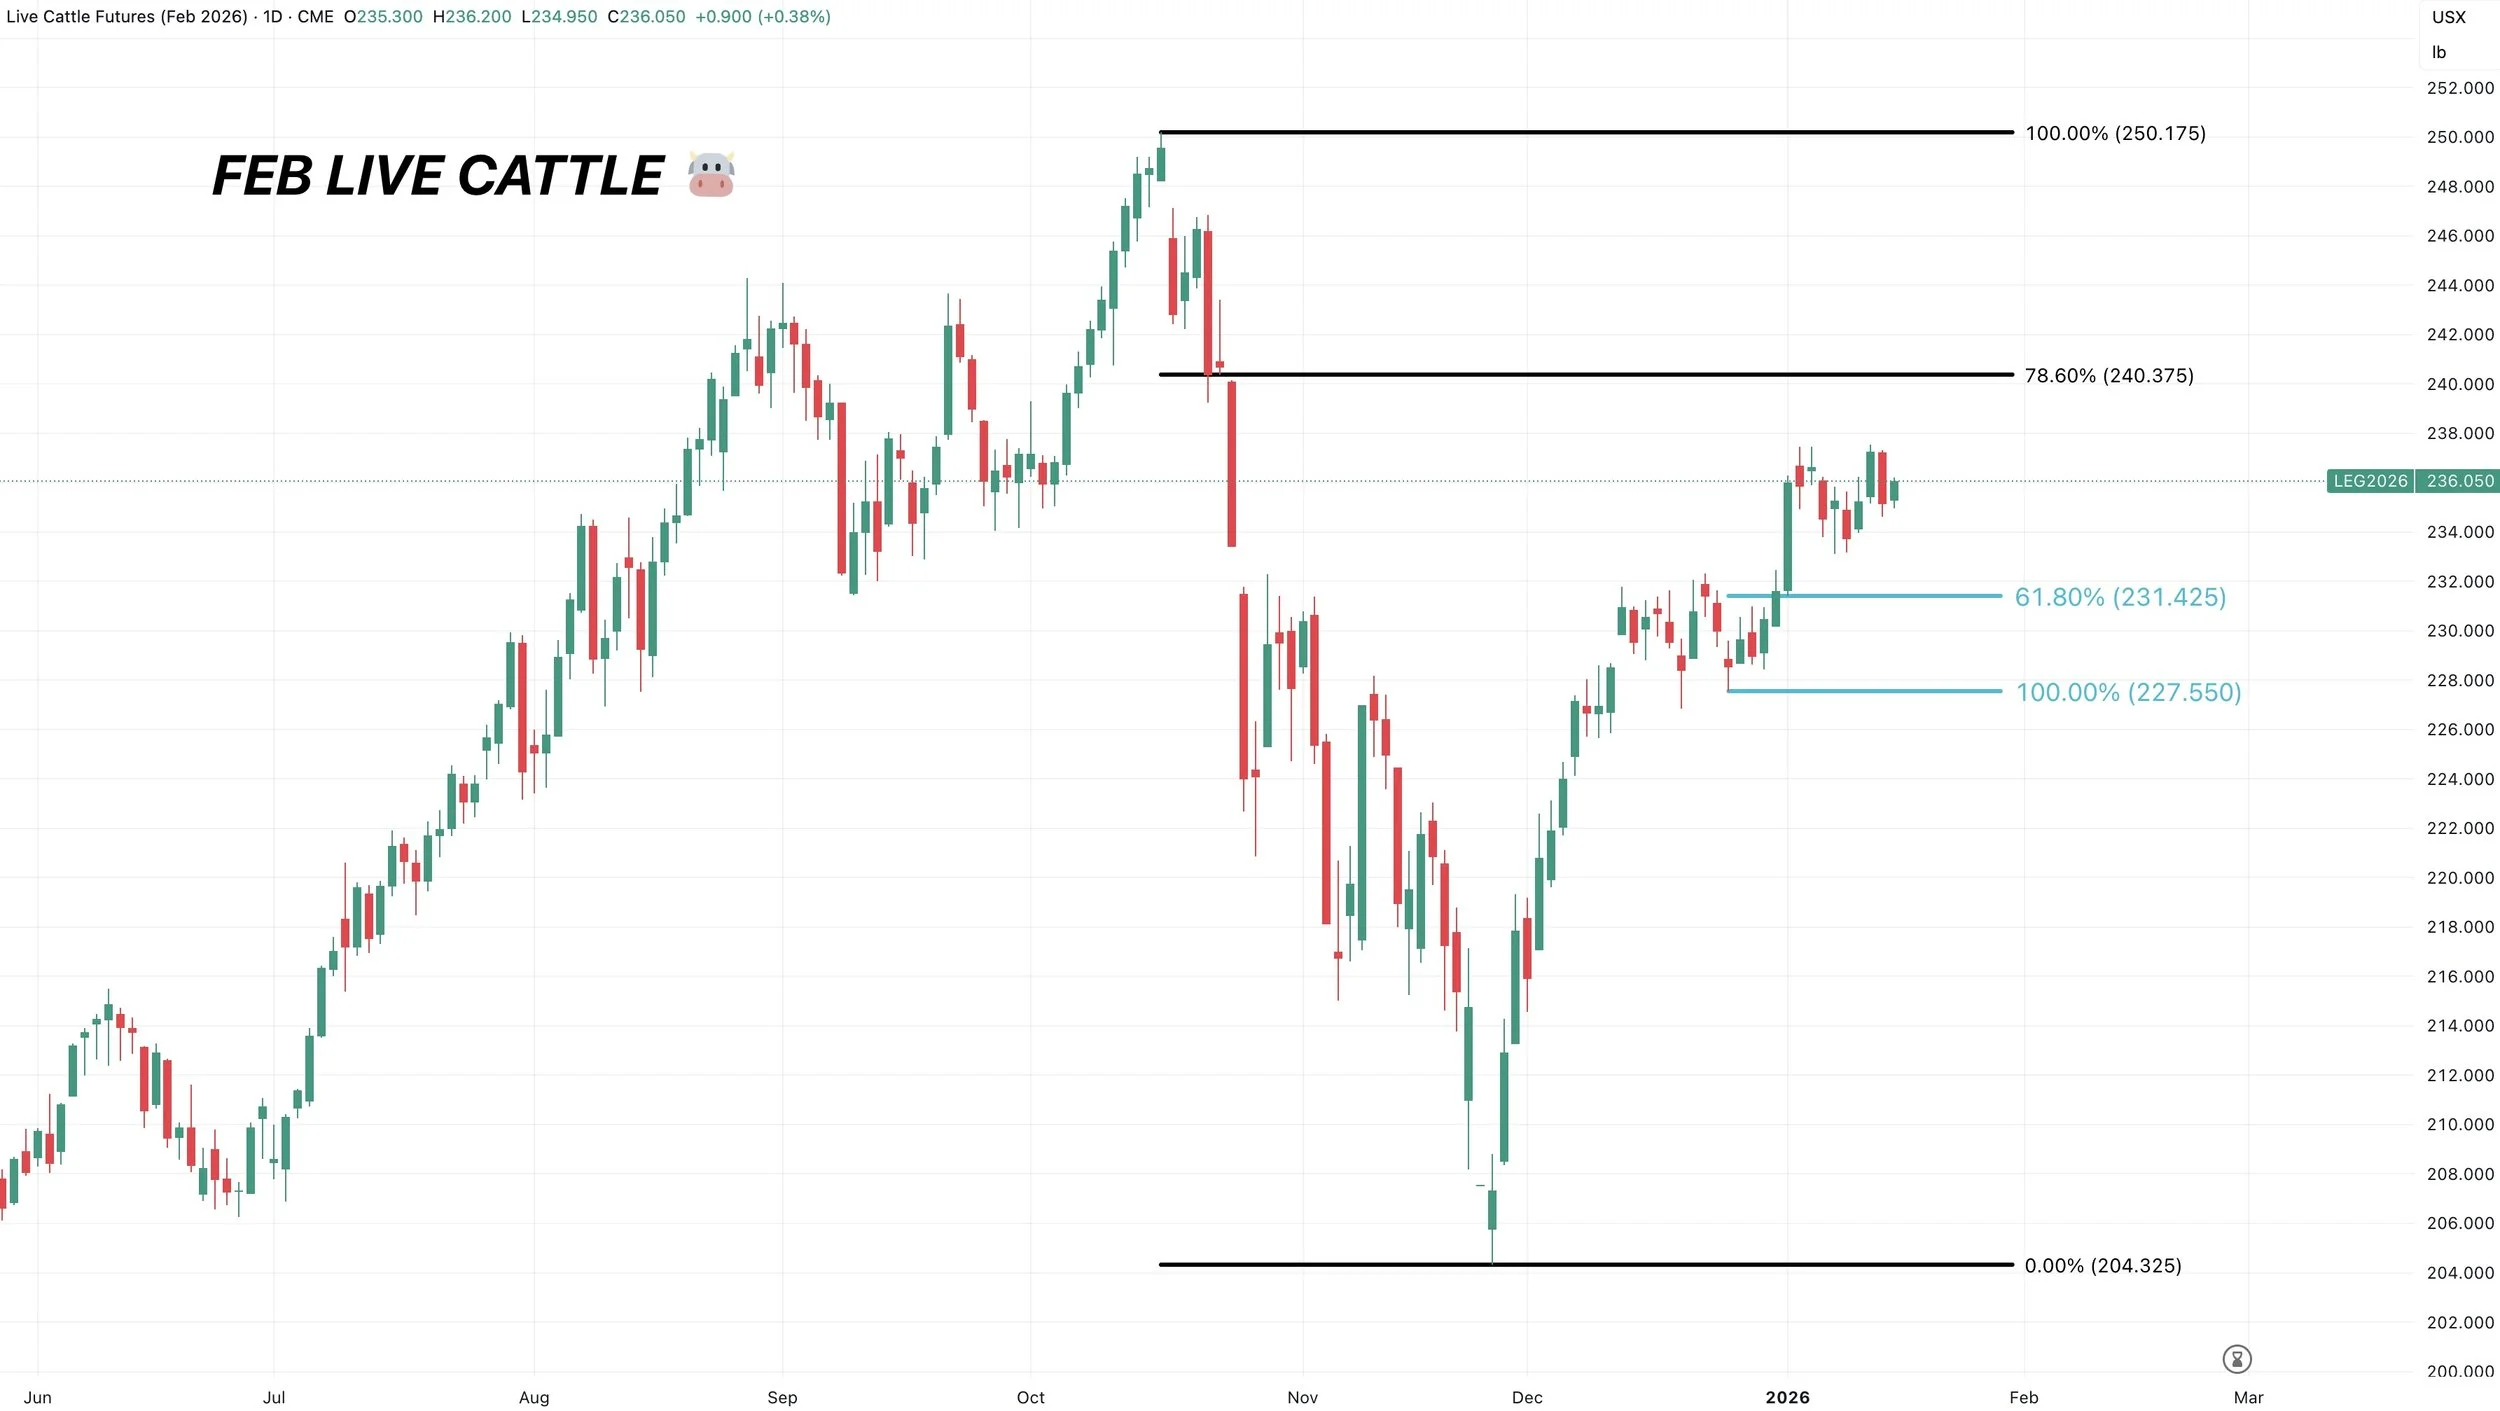
Feb Live
Not nearly as strong as feeders.
Next point of interest is the 78.6% fib.
Really this market is in a clear uptrend until we take out that 231 level.
Past Sell or Protection Signals
Dec 11th: 🐮
Cattle sell signal & hedge alert.
Dec 5th: 🐮
Cattle sell signal & hedge alert.
Nov 17th: 🌱
Soybean sell signal & hedge alert.
Nov 13th: 🌽 🌱
Managing risk in corn & beans ahead of USDA report.
Oct 28th: 🌽
Corn sell signal & hedge alert.
Oct 27th: 🌱
Soybean sell signal & hedge alert.
Oct 13th: 🐮
Cattle sell signal & hedge alert.
Aug 22nd: 🌱
Soybean sell signal & hedge alert.
July 31st: 🐮
Cattle sell signal & hedge alert.
July 10th: 🐮
Cattle sell signal & hedge alert.
CLICK HERE TO VIEW
June 5th: 🐮
Cattle sell signal & hedge alert.
June 2nd: 🌾
MPLS wheat sell signal.
April 10th: 🌽
Old crop corn sell signal.
March 19th: 🐮
Cattle hedge & sell signal.
Feb 18th: 🌽 🌾
Old crop KC wheat & old crop corn signal.
Jan 23rd: 🌽 🌱
Corn & beans old crop sell signal.
CLICK HERE TO VIEW
Jan 15th: 🌽 🌱
Corn & beans hedge alert/sell signal.
Jan 2nd: 🐮
Cattle hedge alert at new all-time highs & target.
Dec 11th: 🌽
Corn sell signal at $4.51 200-day MA
CLICK HERE TO VIEW
Oct 2nd: 🌾
Wheat sell signal at $6.12 target
Sep 30th: 🌽
Corn protection signal at $4.23-26
Sep 27th: 🌱
Soybean sell & protection signal at $10.65
Sep 13th: 🌾
Wheat sell signal at $5.98
May 22nd: 🌾
Wheat sell signal when wheat traded +$7.00
Want to Talk?
Our phones are open 24/7 for you guys if you ever need anything or want to discuss your operation.
Hedge Account
Interested in a hedge account? Use the link below to set up an account or shoot Jeremey a call at (605)295-3100.