
WHAT NEEDS TO HAPPEN FOR HIGHER PRICES?
AUDIO COMMENTARY
What needs to happen for higher beans
Funds need a reason to get behind this
Beans near golden fib (chart below)*
Could the aid help basis?
We’ve created massive demand in corn
When to NOT use basis contracts
Lot of unknown business to corn
Making sales that make sense
SA crop isn’t having big issues
Options strategy that “could” be a home run IF we repeat last year’s price action in corn
Puts are cheap if you need protection
Being proactive when you want to. Not when you have to
Exhaustion gap in cattle? (chart below)*
All chart breakdowns below audio*
Listen to today’s audio below
Want to talk? (605)250-3863
CHARTS
Jan Beans 🌱
Getting close to that downside target.
The 61.8% retracement of the entire rally.
This is where the market usually decides if this is a correction or if we truly falling apart.
Pretty big spot to hold. If we break below, it usually indicates we are not in some simple correction before heading higher. Meaning further downside could be ahead. If we bounce here, it tells us the uptrend is still in tact.
It also happens to be outryearly resistance.
We do not have to fill the gap, but it is possible.
Only 35% of breakaway gaps fill compared to 80-90% of normal gaps.

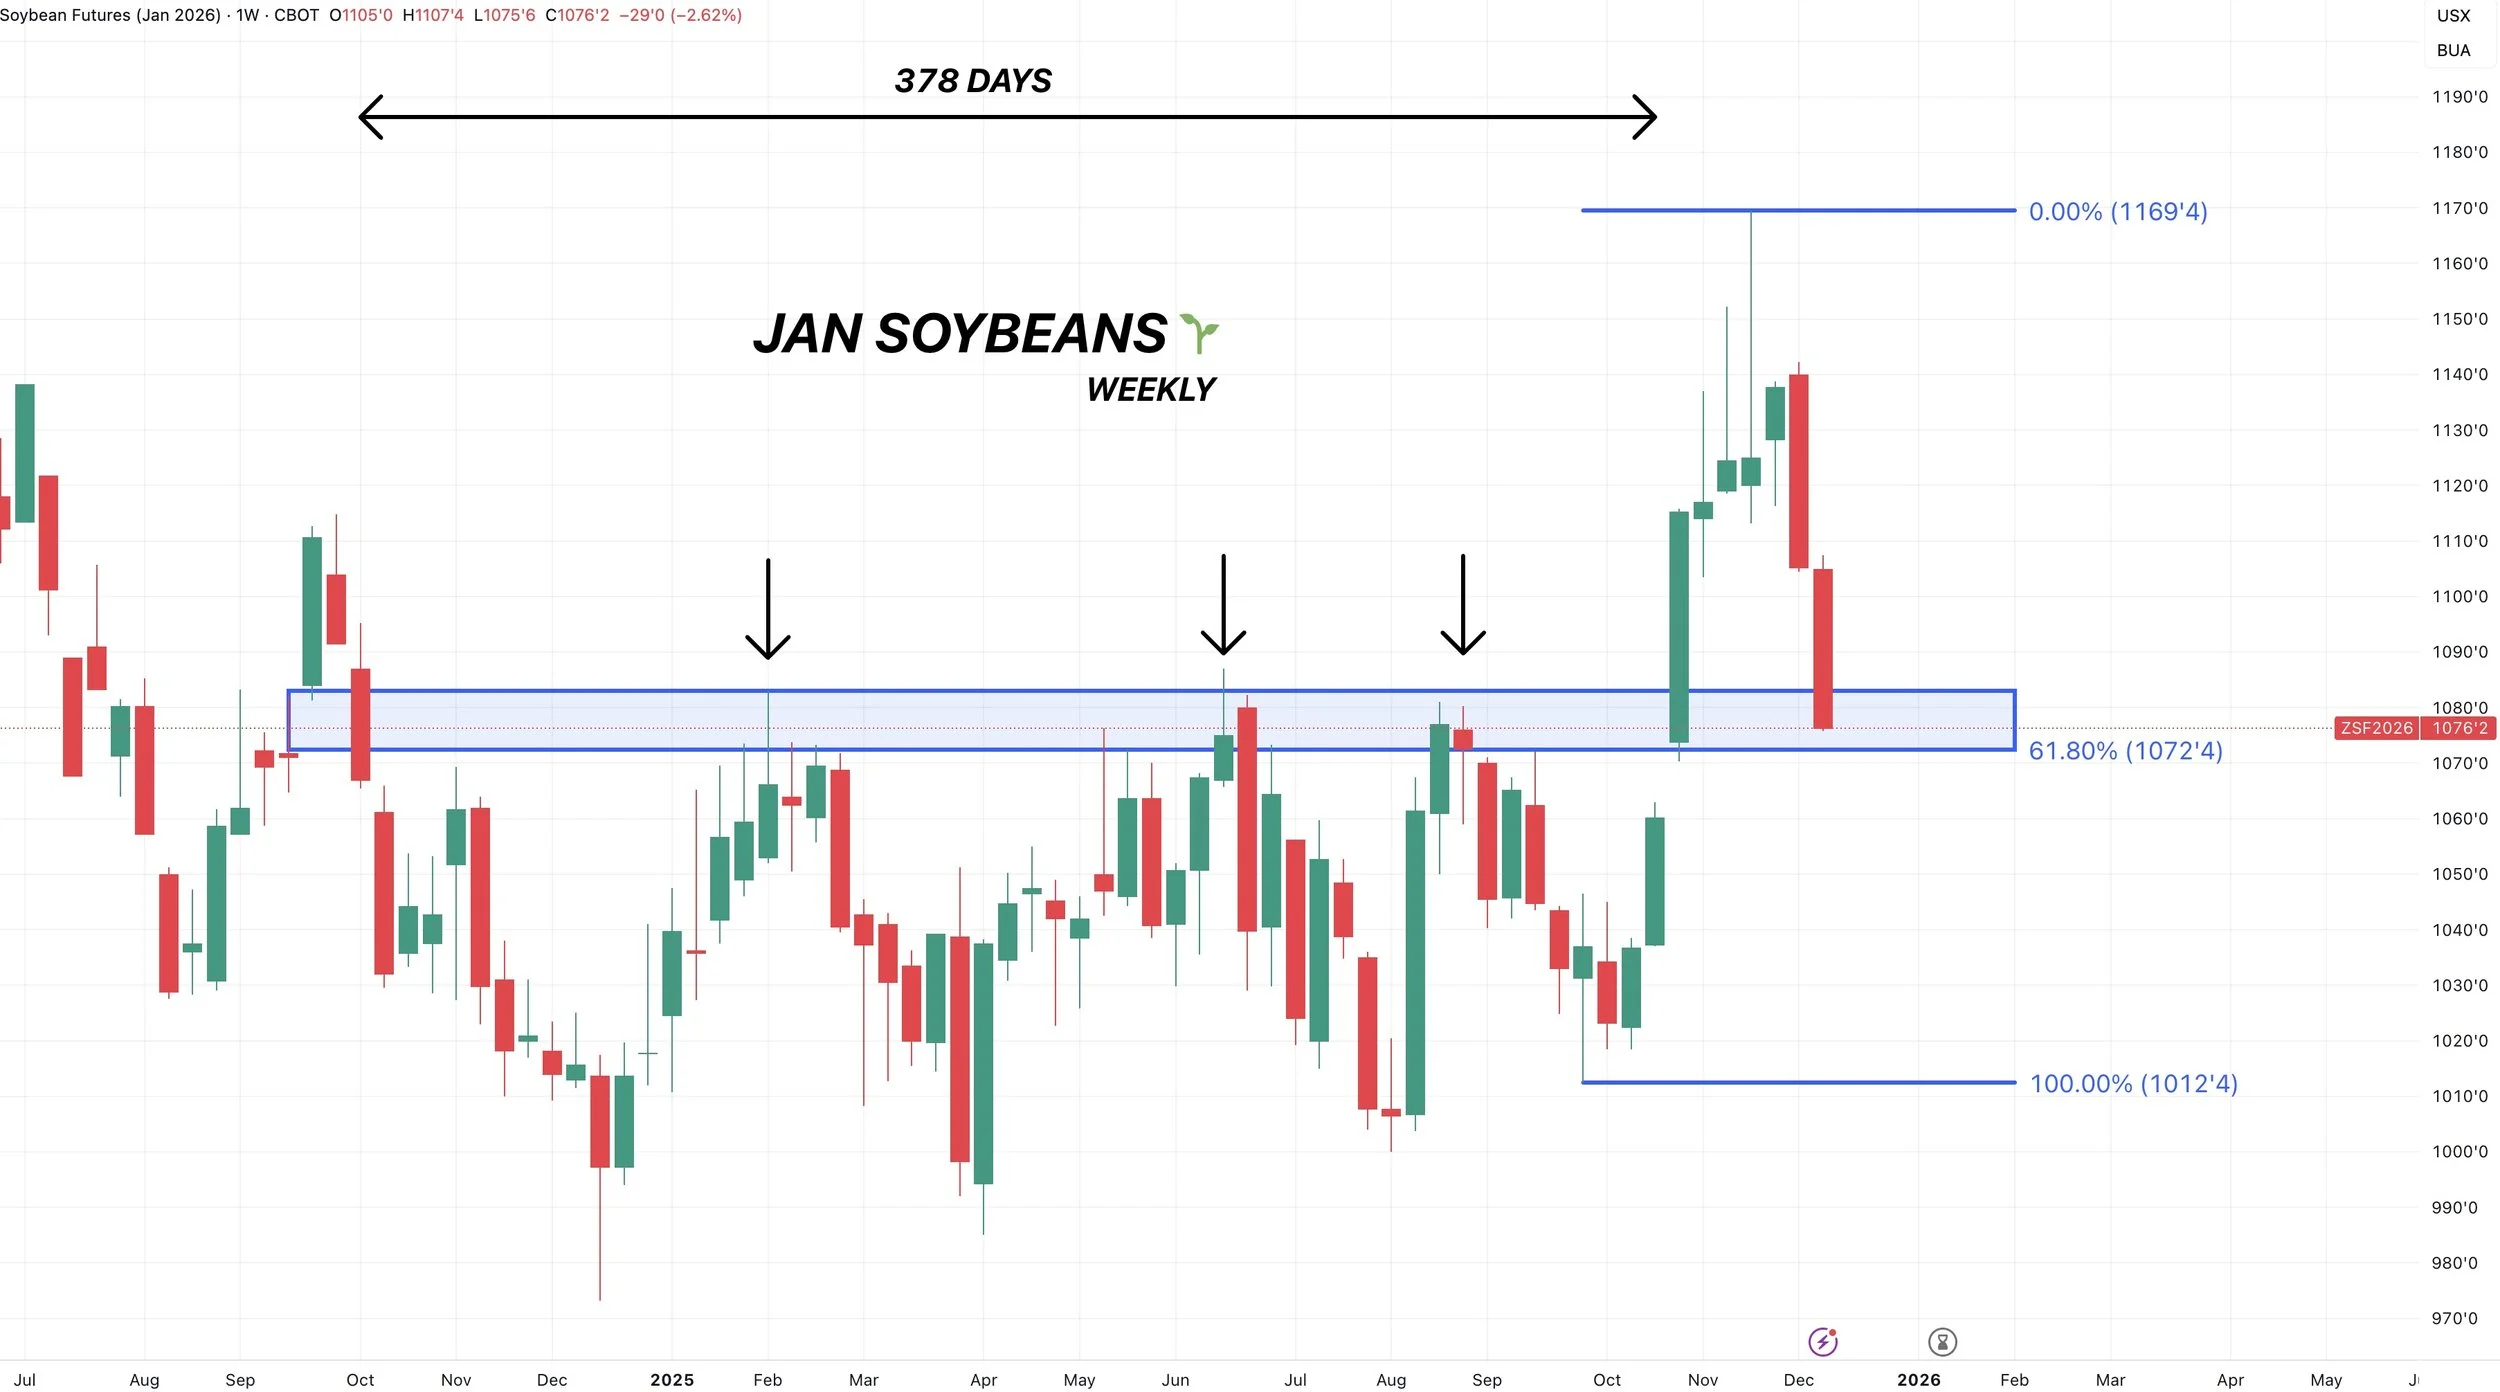
Here is the weekly chart to give you another perspective.
The 61.8% level and yearly resistance are at the same level.
We were trapped in a range for over a year.
We broke out. We are now retesting that point of break out.
If we break below this 61.8% level, we break back into that old range. Which would be viewed as a potential failed breakout.
So ideally we hold it, or we could go back into that brutal range.
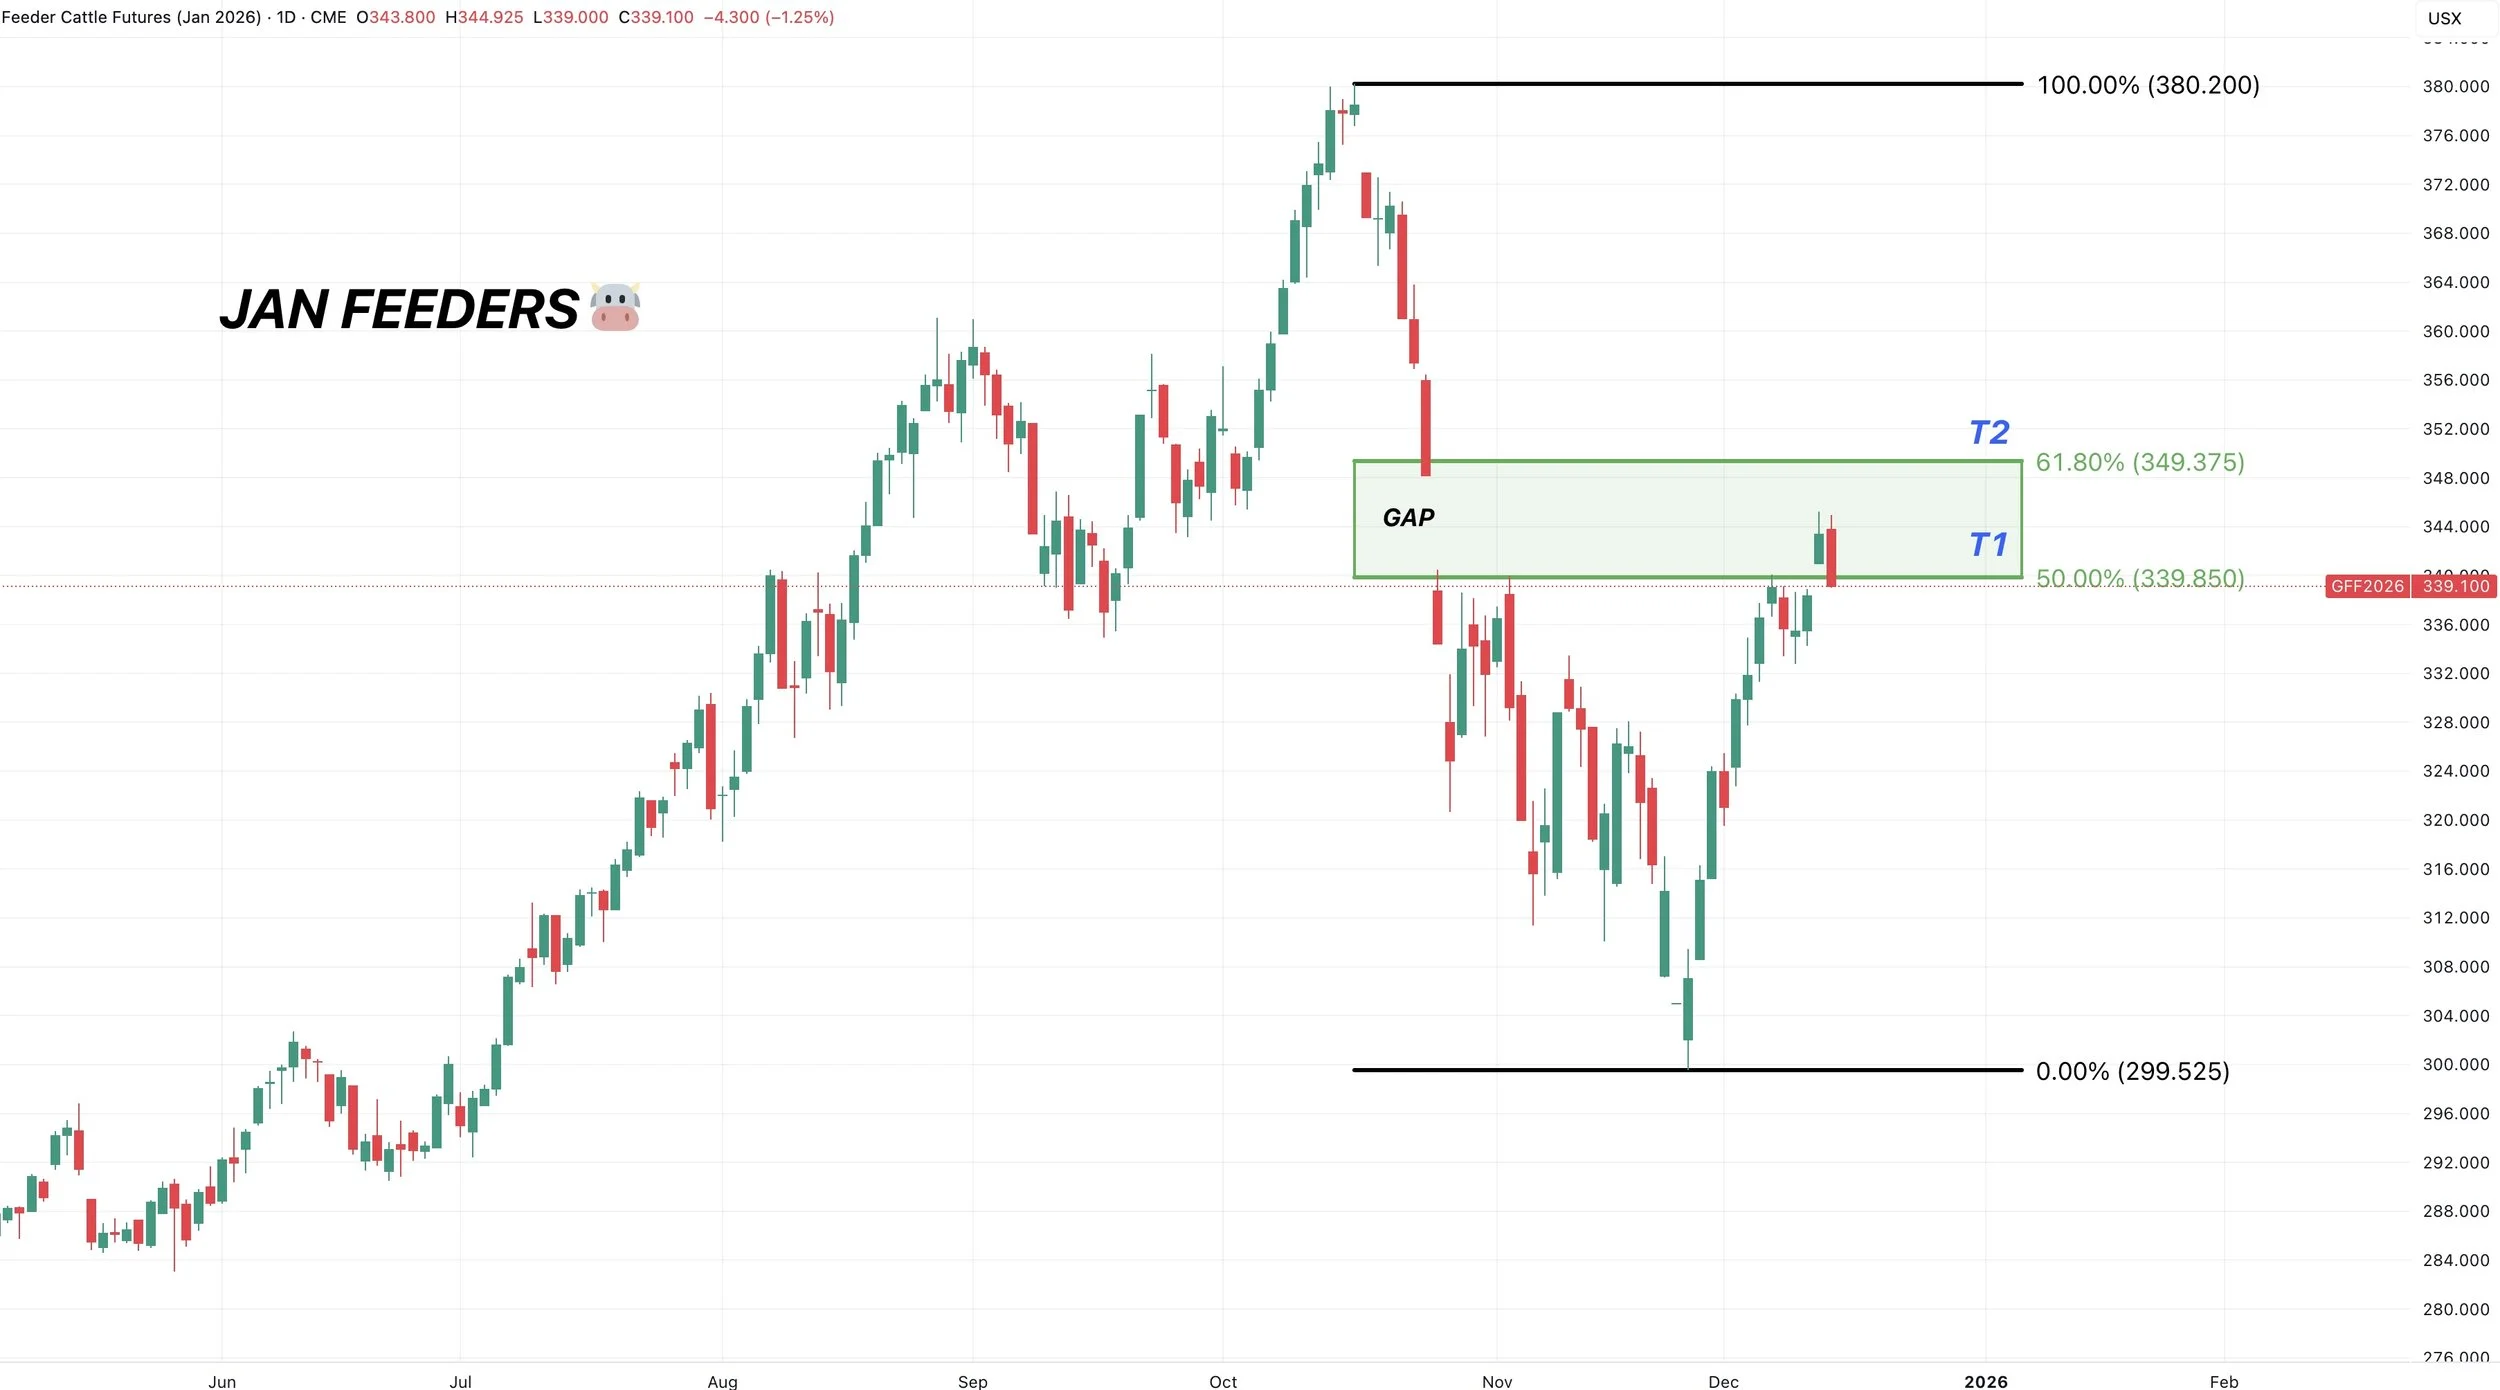
Jan Feeders 🐮
We are in the golden zone.
This is where relief bounces often fail.
If we were to take out that 61.8% level, it usually tells us that this is not a relief bounce and is the start of something bigger. But for now, this is viewed as a relief bounce. Hence our sell signal yesterday.
We also had a potential “exhaustion gap” yesterday.
There are 3 types of gaps.
Normal gaps:
The every day ones.
Break away gaps:
A break away gap is a gap that breaks out of a range and resistance. A very bullish type of gap. What we saw in soybeans.
Exhaustion gaps:
They occur after a big move and at the end of a trend. Oftentimes they can mark the tops or bottoms. As it happens late in trends. Basically it is viewed as the last burst of energy before the momentum fades.
This could very possibly be what we are seeing here. However, we have not yet filled that gap. Typically, you need the gap to be filled to get confirmation this is an exhaustion gap.
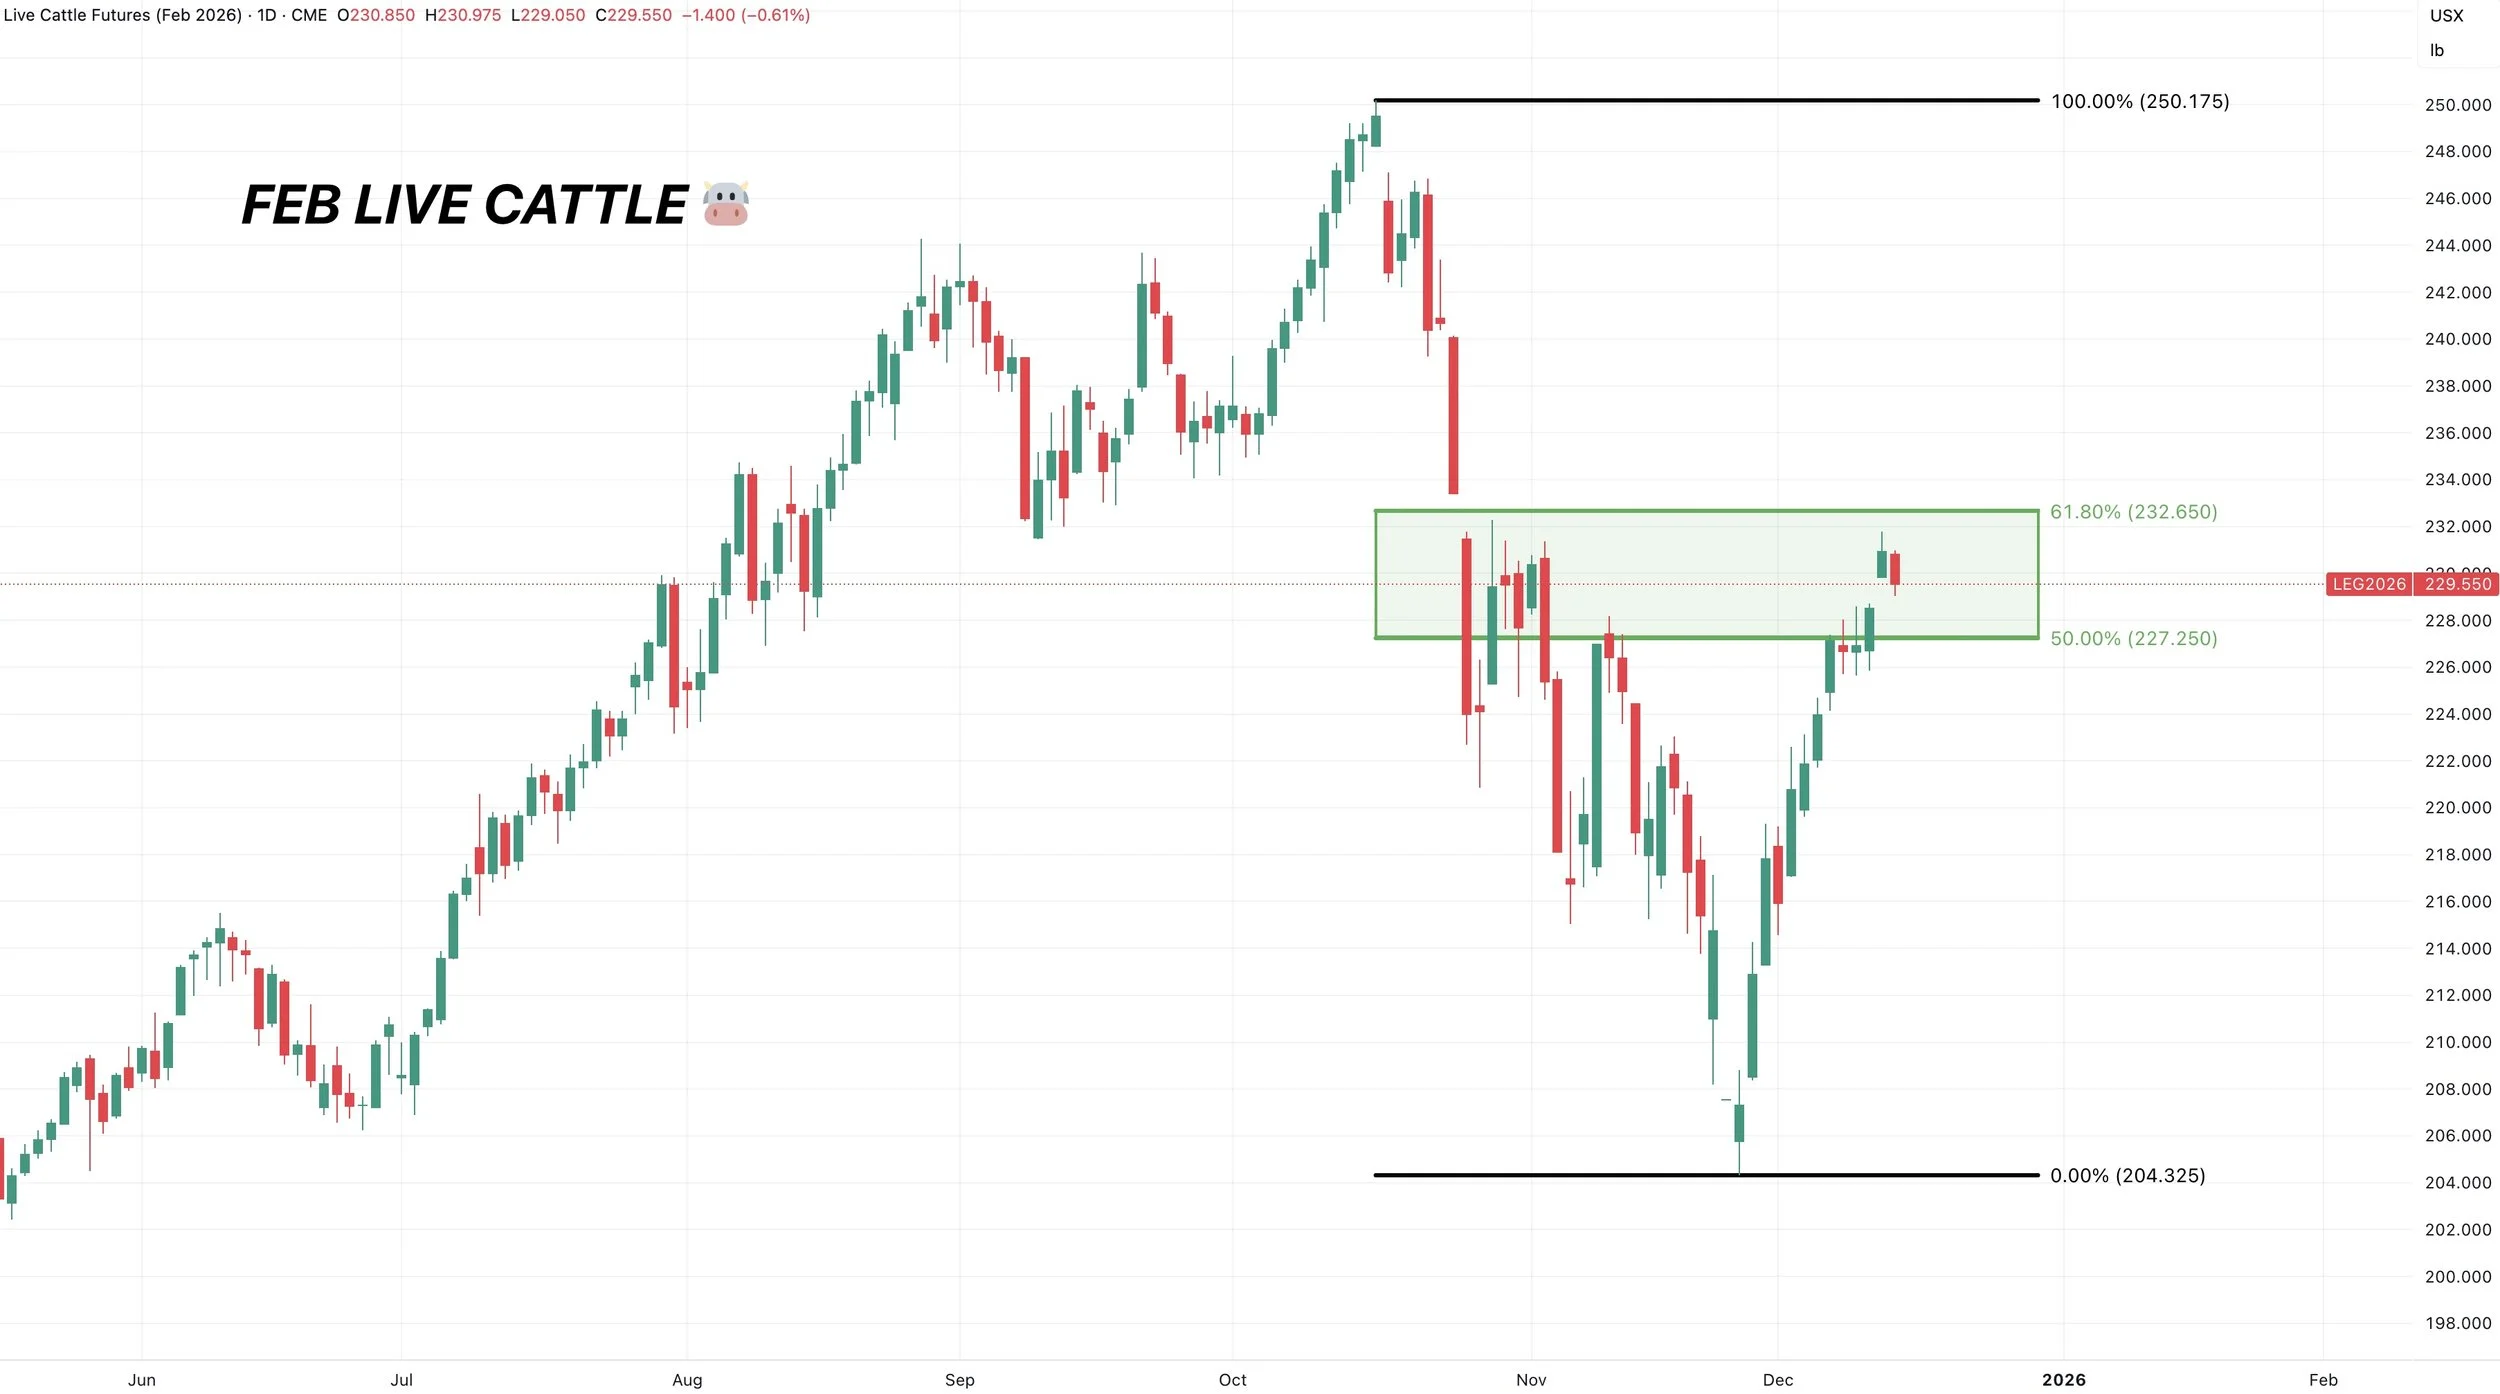
Feb Live 🐮
Looks just like feeders.
We are in the golden zone.
If we fill that gap, it could possibly be an exhaustion gap.
Something to be cautious of up here.
If we take the 61.8% level out, it often indicates this is no longer just a relief bounce.
March Corn 🌽
We are in an uptrend until we break below that red box.
If we break below the red box, we probably revist that orange box area.
The red box is 50-61.8% of this rally from Oct. The most common spot for a correction to end.
To the upside, we need to clear $4.50 to see more upside. It’s been clear resistance for several reasons we’ve talked about.

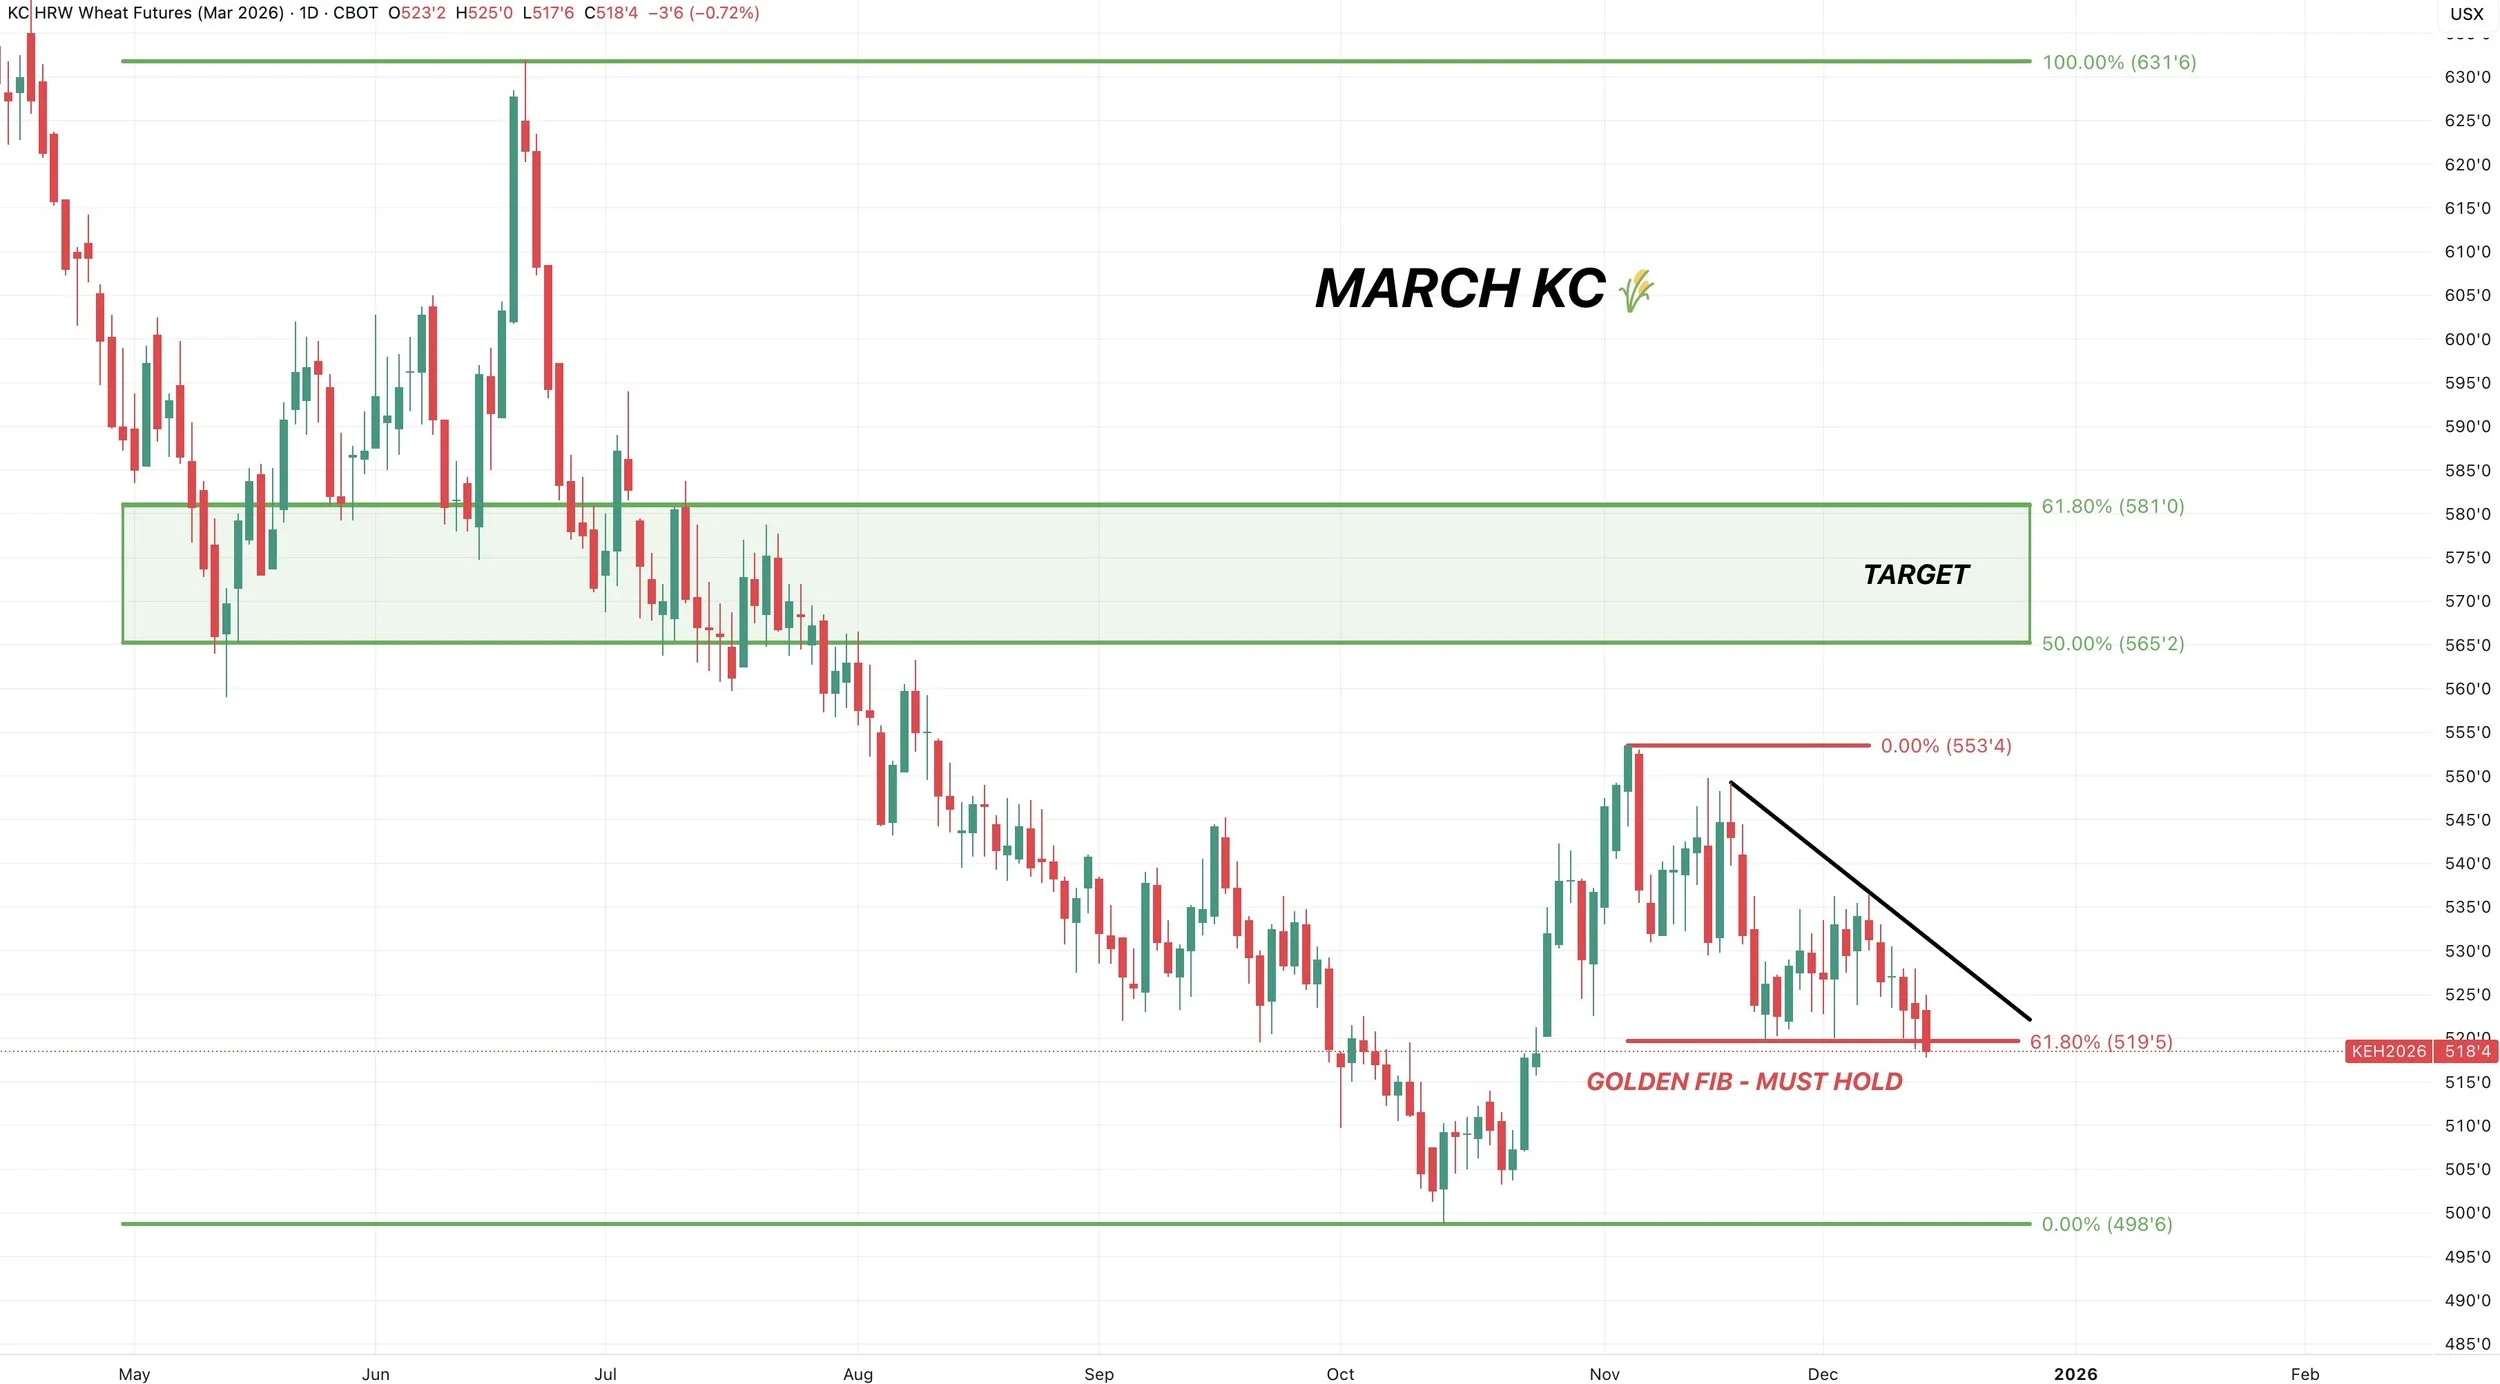
March KC Wheat 🌾
Sitting right at the 61.8% level. The golden fib.
We closed below it today by a hair. If we get back to back days below it, it probably signals we are headed lower.
Pretty much a must hold spot.
Past Sell or Protection Signals
Dec 11th: 🐮
Cattle sell signal & hedge alert.
Dec 5th: 🐮
Cattle sell signal & hedge alert.
Nov 17th: 🌱
Soybean sell signal & hedge alert.
Nov 13th: 🌽 🌱
Managing risk in corn & beans ahead of USDA report.
Oct 28th: 🌽
Corn sell signal & hedge alert.
Oct 27th: 🌱
Soybean sell signal & hedge alert.
Oct 13th: 🐮
Cattle sell signal & hedge alert.
Aug 22nd: 🌱
Soybean sell signal & hedge alert.
July 31st: 🐮
Cattle sell signal & hedge alert.
July 10th: 🐮
Cattle sell signal & hedge alert.
CLICK HERE TO VIEW
June 5th: 🐮
Cattle sell signal & hedge alert.
June 2nd: 🌾
MPLS wheat sell signal.
April 10th: 🌽
Old crop corn sell signal.
March 19th: 🐮
Cattle hedge & sell signal.
Feb 18th: 🌽 🌾
Old crop KC wheat & old crop corn signal.
Jan 23rd: 🌽 🌱
Corn & beans old crop sell signal.
CLICK HERE TO VIEW
Jan 15th: 🌽 🌱
Corn & beans hedge alert/sell signal.
Jan 2nd: 🐮
Cattle hedge alert at new all-time highs & target.
Dec 11th: 🌽
Corn sell signal at $4.51 200-day MA
CLICK HERE TO VIEW
Oct 2nd: 🌾
Wheat sell signal at $6.12 target
Sep 30th: 🌽
Corn protection signal at $4.23-26
Sep 27th: 🌱
Soybean sell & protection signal at $10.65
Sep 13th: 🌾
Wheat sell signal at $5.98
May 22nd: 🌾
Wheat sell signal when wheat traded +$7.00
Want to Talk?
Our phones are open 24/7 for you guys if you ever need anything or want to discuss your operation.
Hedge Account
Interested in a hedge account? Use the link below to set up an account or shoot Jeremey a call at (605)295-3100.