
WORLD VS US SITUATIONS
MARKET UPDATE
You can scroll to read the usual update as well. As the written version is the exact same as the video.
Timestamps for video:
News: 0:00min
World vs US: 3:30min
Corn: 6:10min
Beans: 11:20min
Wheat: 13:30min
Cattle: 14:45min
Want to talk about your situation?
(605)250-3863
Futures Prices Close
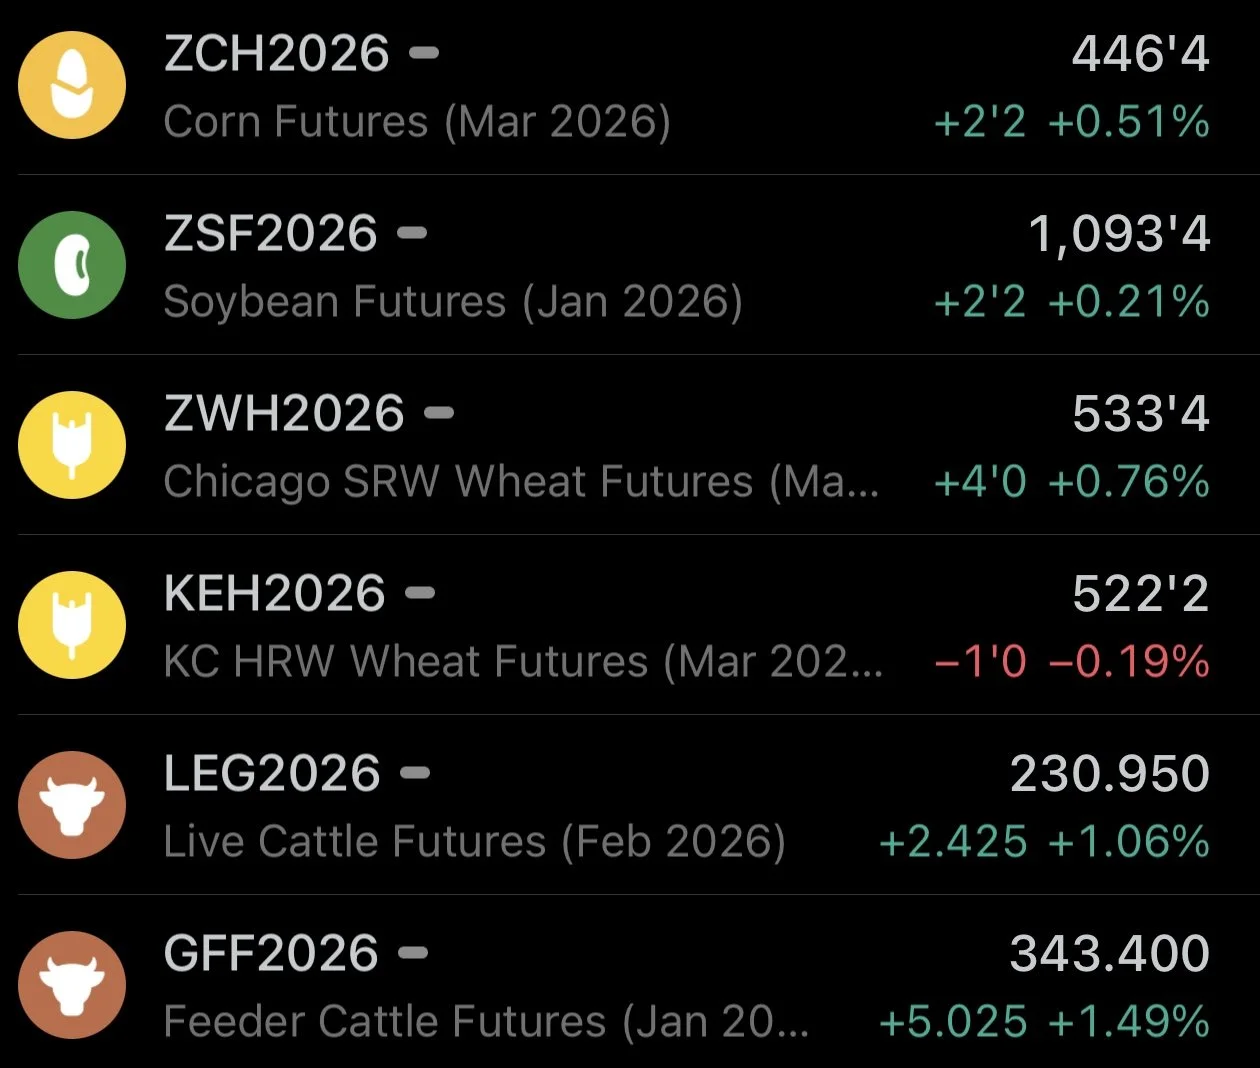
Overview
Grains mostly higher, while the cattle market showed some strength gapping higher on the open.
Today we did issue another cattle hedge alert, so check that out if you haven’t.
Click Here for Signal
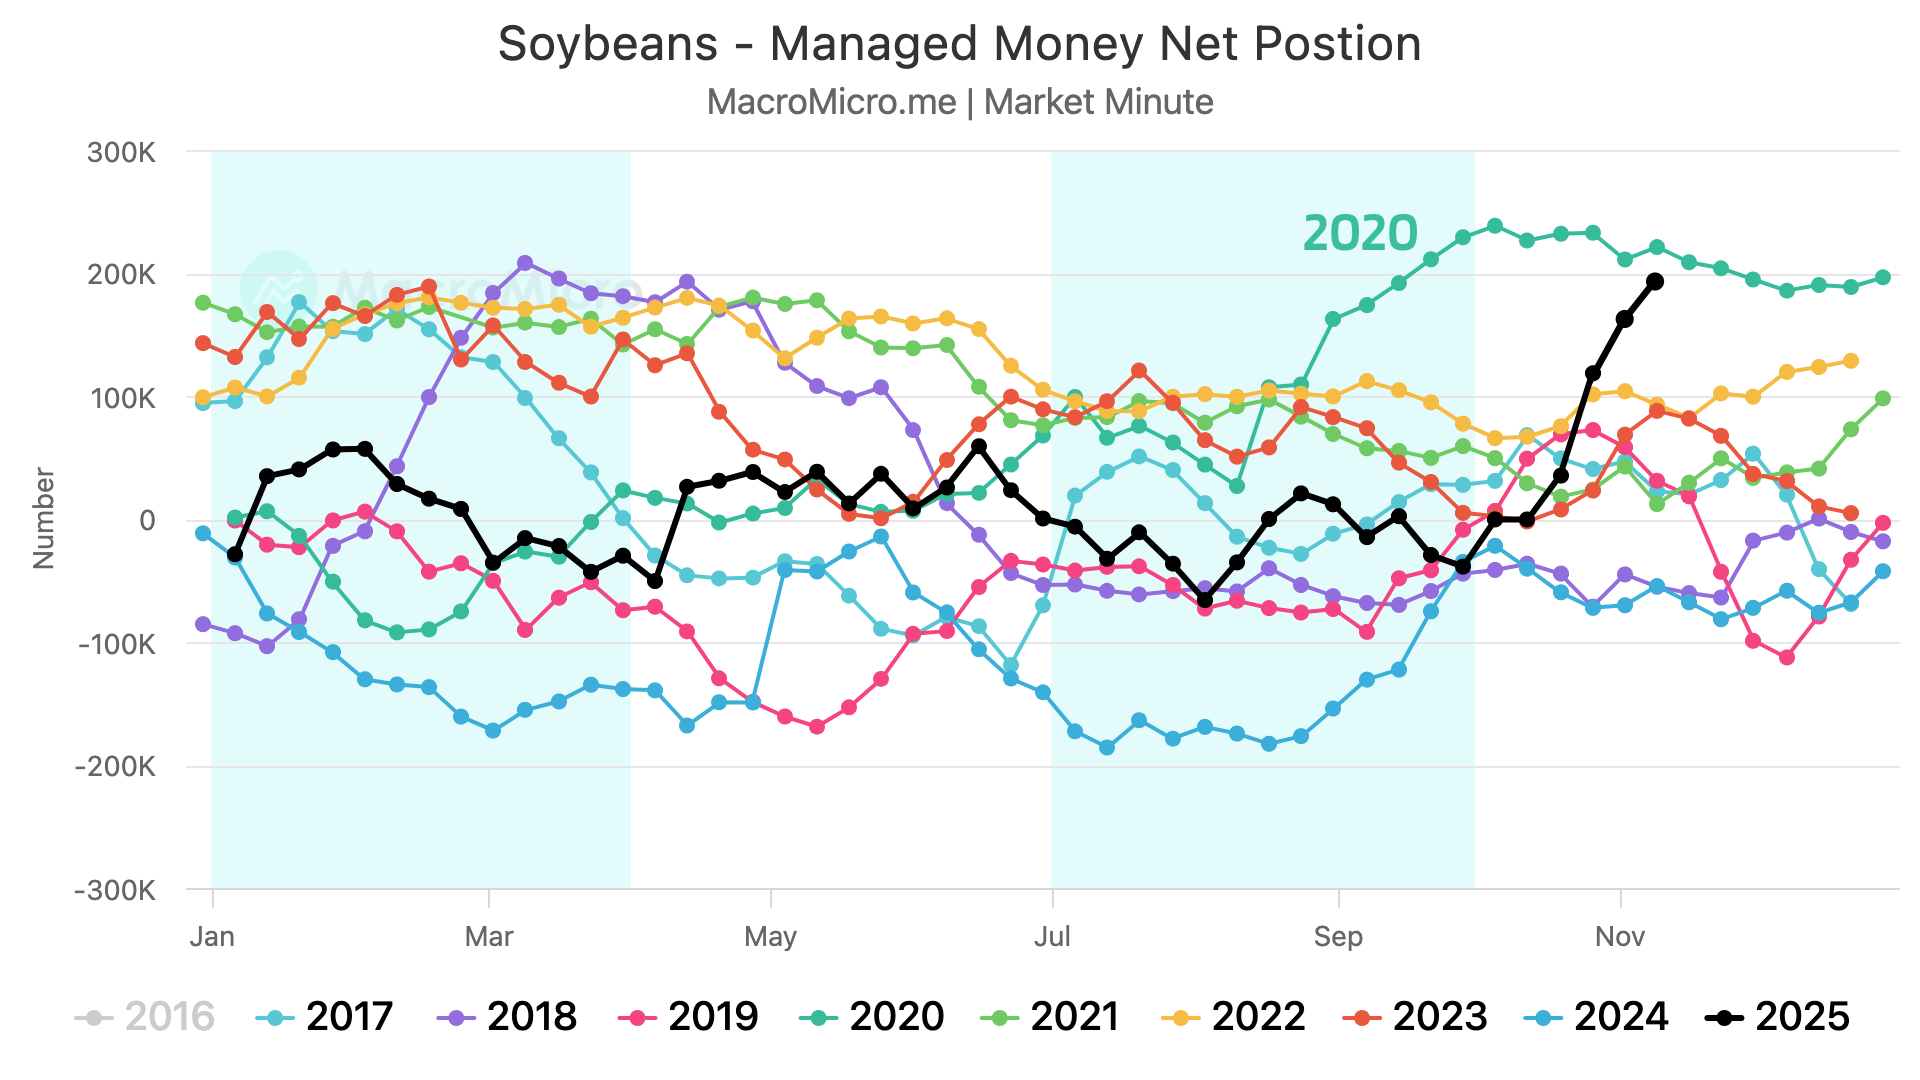
Funds "Were" Near Record Long Beans
Overall there hasn’t been any major pieces of news.
We're still getting the backlog of data from the government such as export sales and the funds positions.
The most recent funds data we received yesterday showed the funds were at near record long levels in the soybean market back on the November 10th data.
As they were long 195k contracts. Just shy of the record in 2020.
Clearly they've now backed off of that position.
The CTFC orginally planned to be caught up with the positions in January. They announced they will now be caught up by the end of the year.
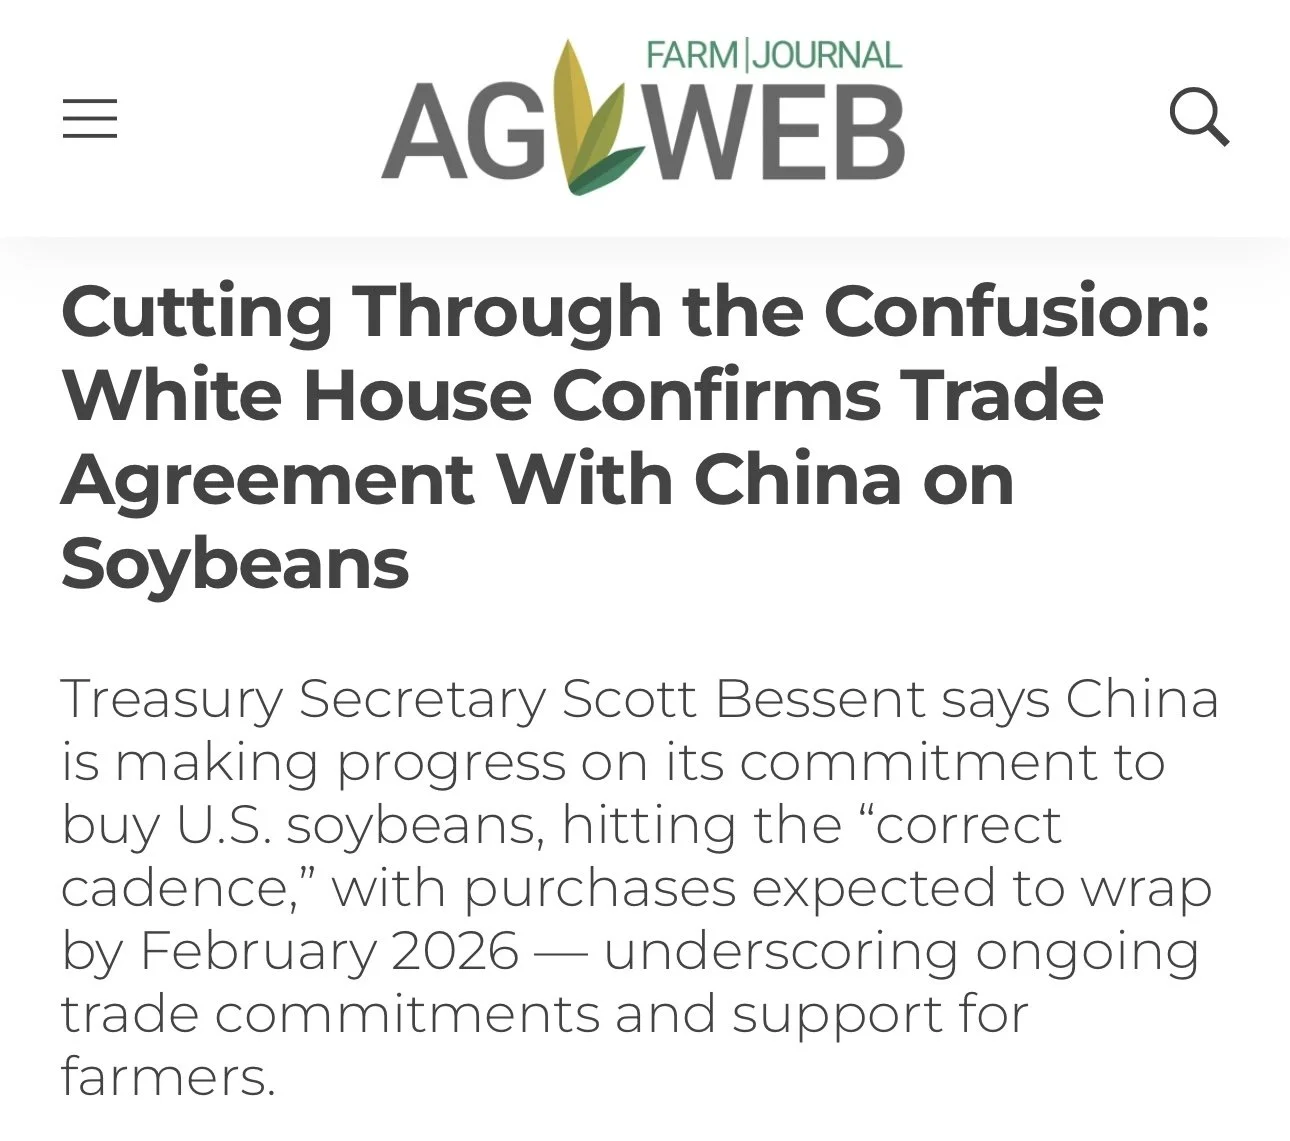
More China & Soybean Confusion
This wasn’t mentioned in yesterday's audio.
But US trade rep Jamieson Greer said that the deadline for China to buy the 12 MMT of soybeans is the end of the "growing season". Not the end of the calendar year.
If he talking about the US growing season next year? Is he talking about Brazil?
It really doesn’t make any sense.
Who knows if he even knows what he's talking about.
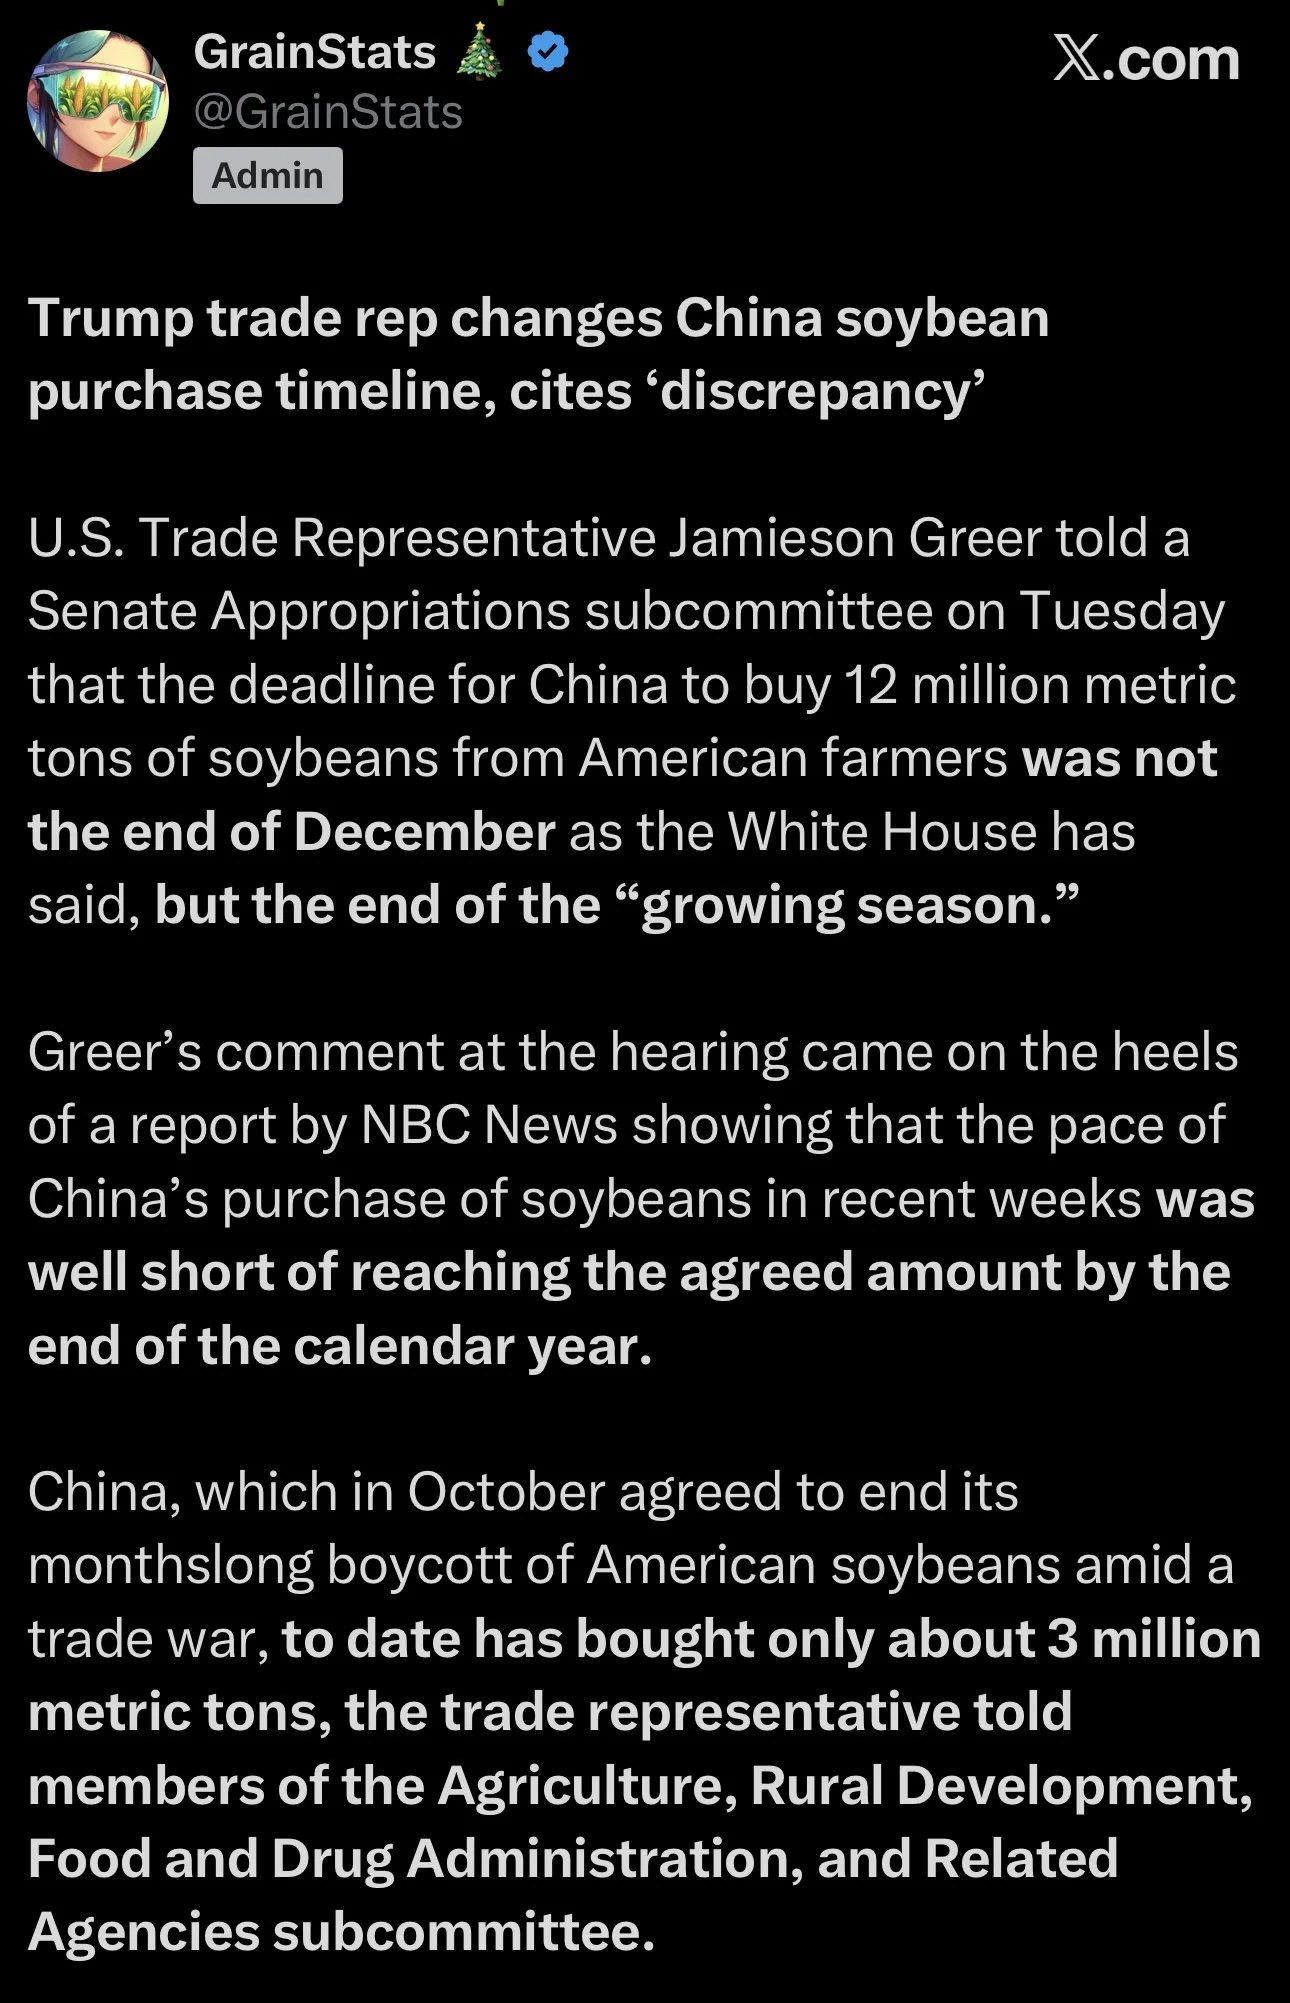
Bessent the other week claimed the deadline was the end of February.
Now this does makes sense.
That is when Brazil's crop comes online, so it makes sense we would get these soybeans sold before Brazil takes over.
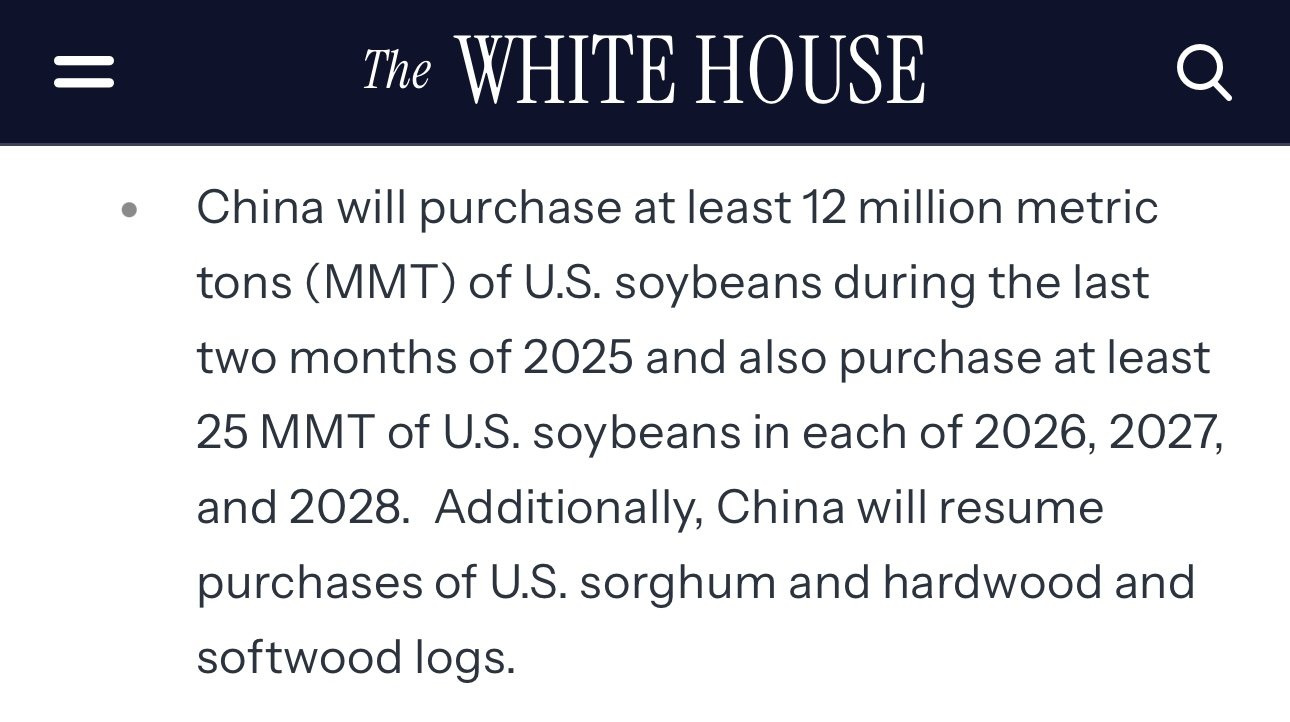
If it actually is the end of the growing season, that would suck. Because you have to remember we have that 25 MMT of soybeans we are suppose to ship every year for the next 3 years.
Getting this 12 MMT done by February would be nice because we can then start that 25 MMT for new crop later in the year.
Originally the White House fact sheet clearly said the end of 2025.
Who knows if they have no clue what they are talking about, or if they really are just attempting to gas light everyone.
Guess we'll find out.
We still do not have that trade agreement Rollins claimed we would be getting any day now either.
As there is nothing in writing and China has yet to verify anything.
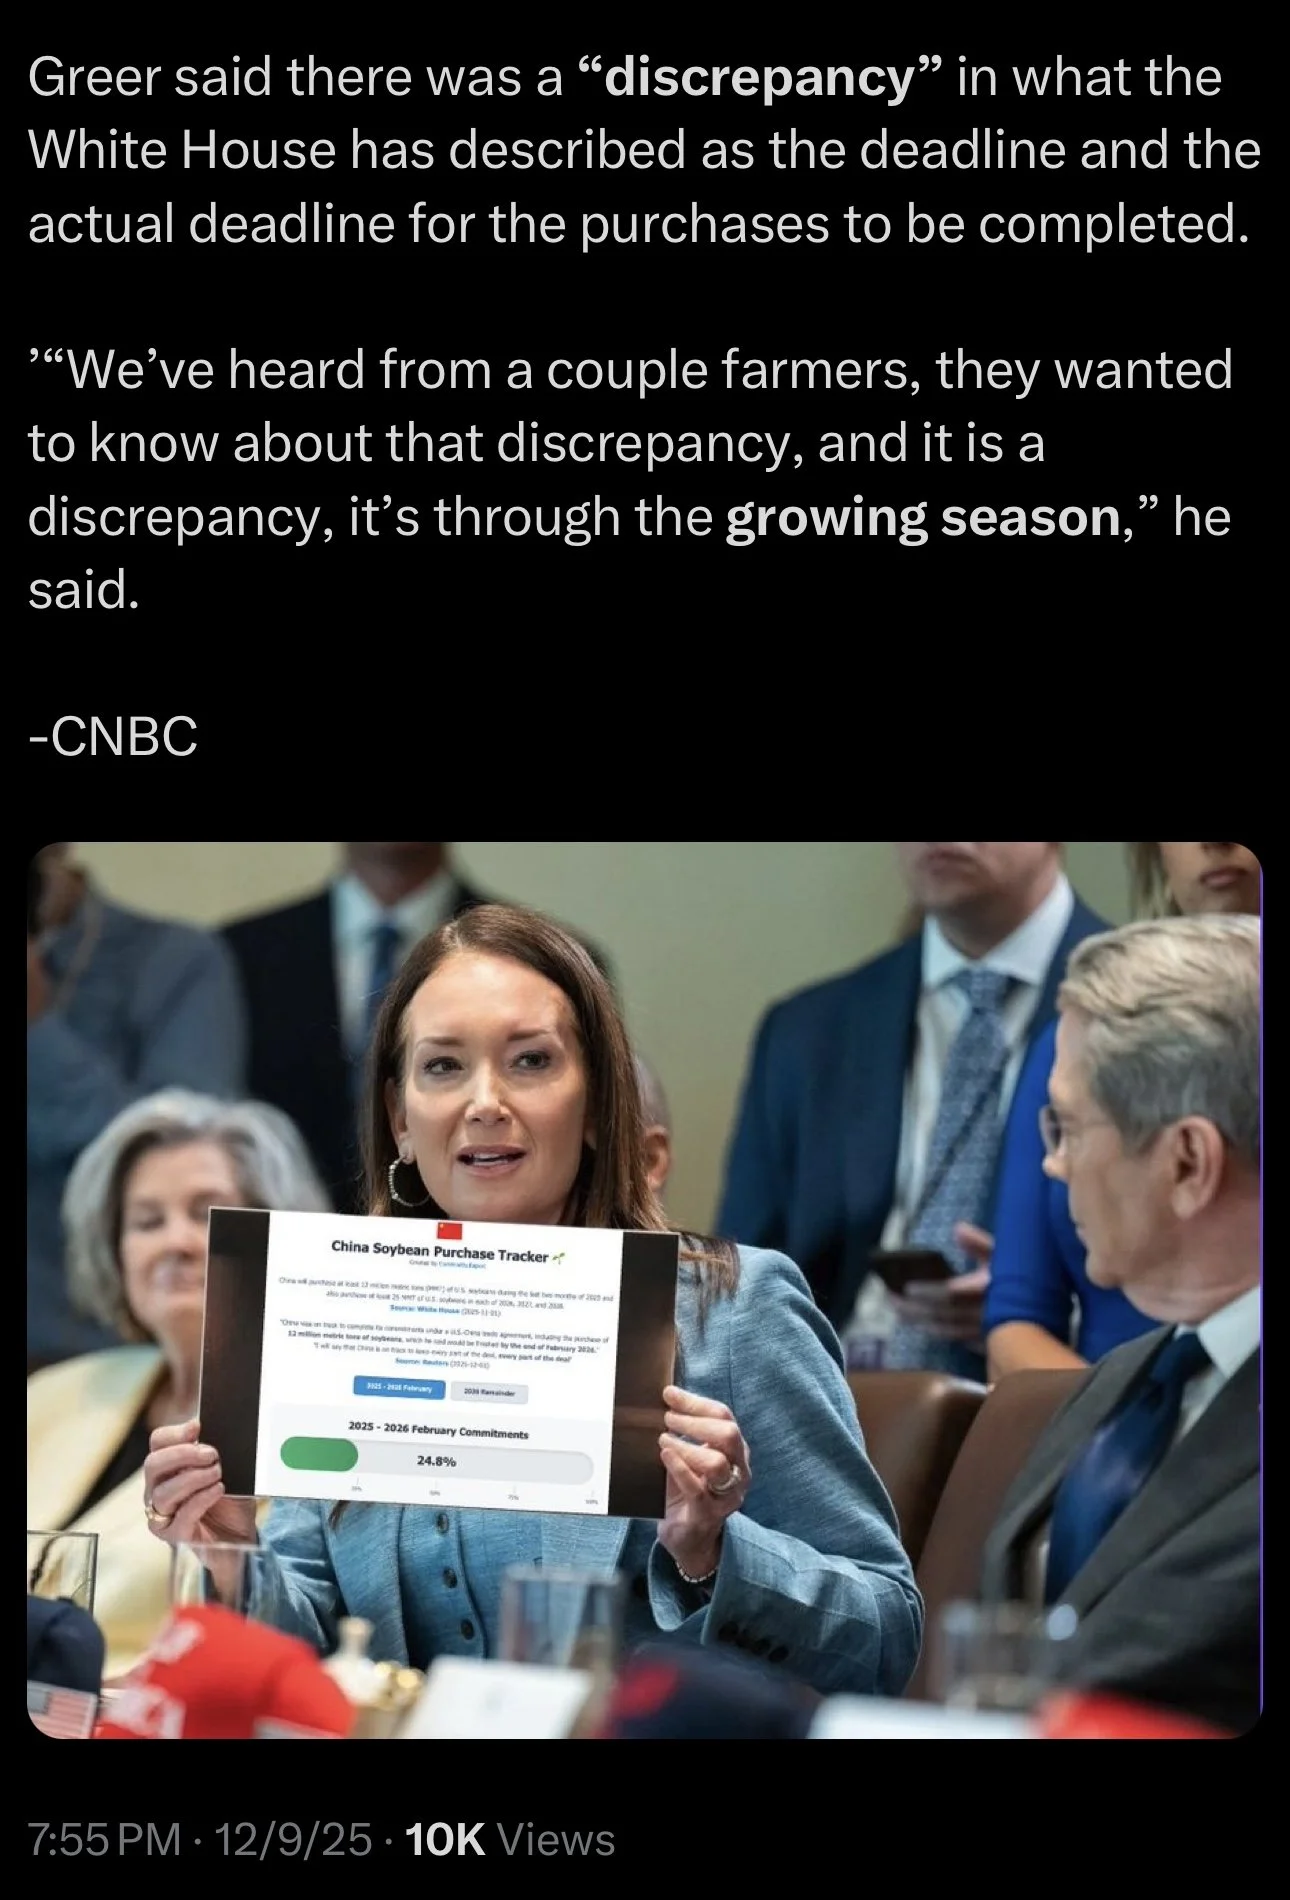
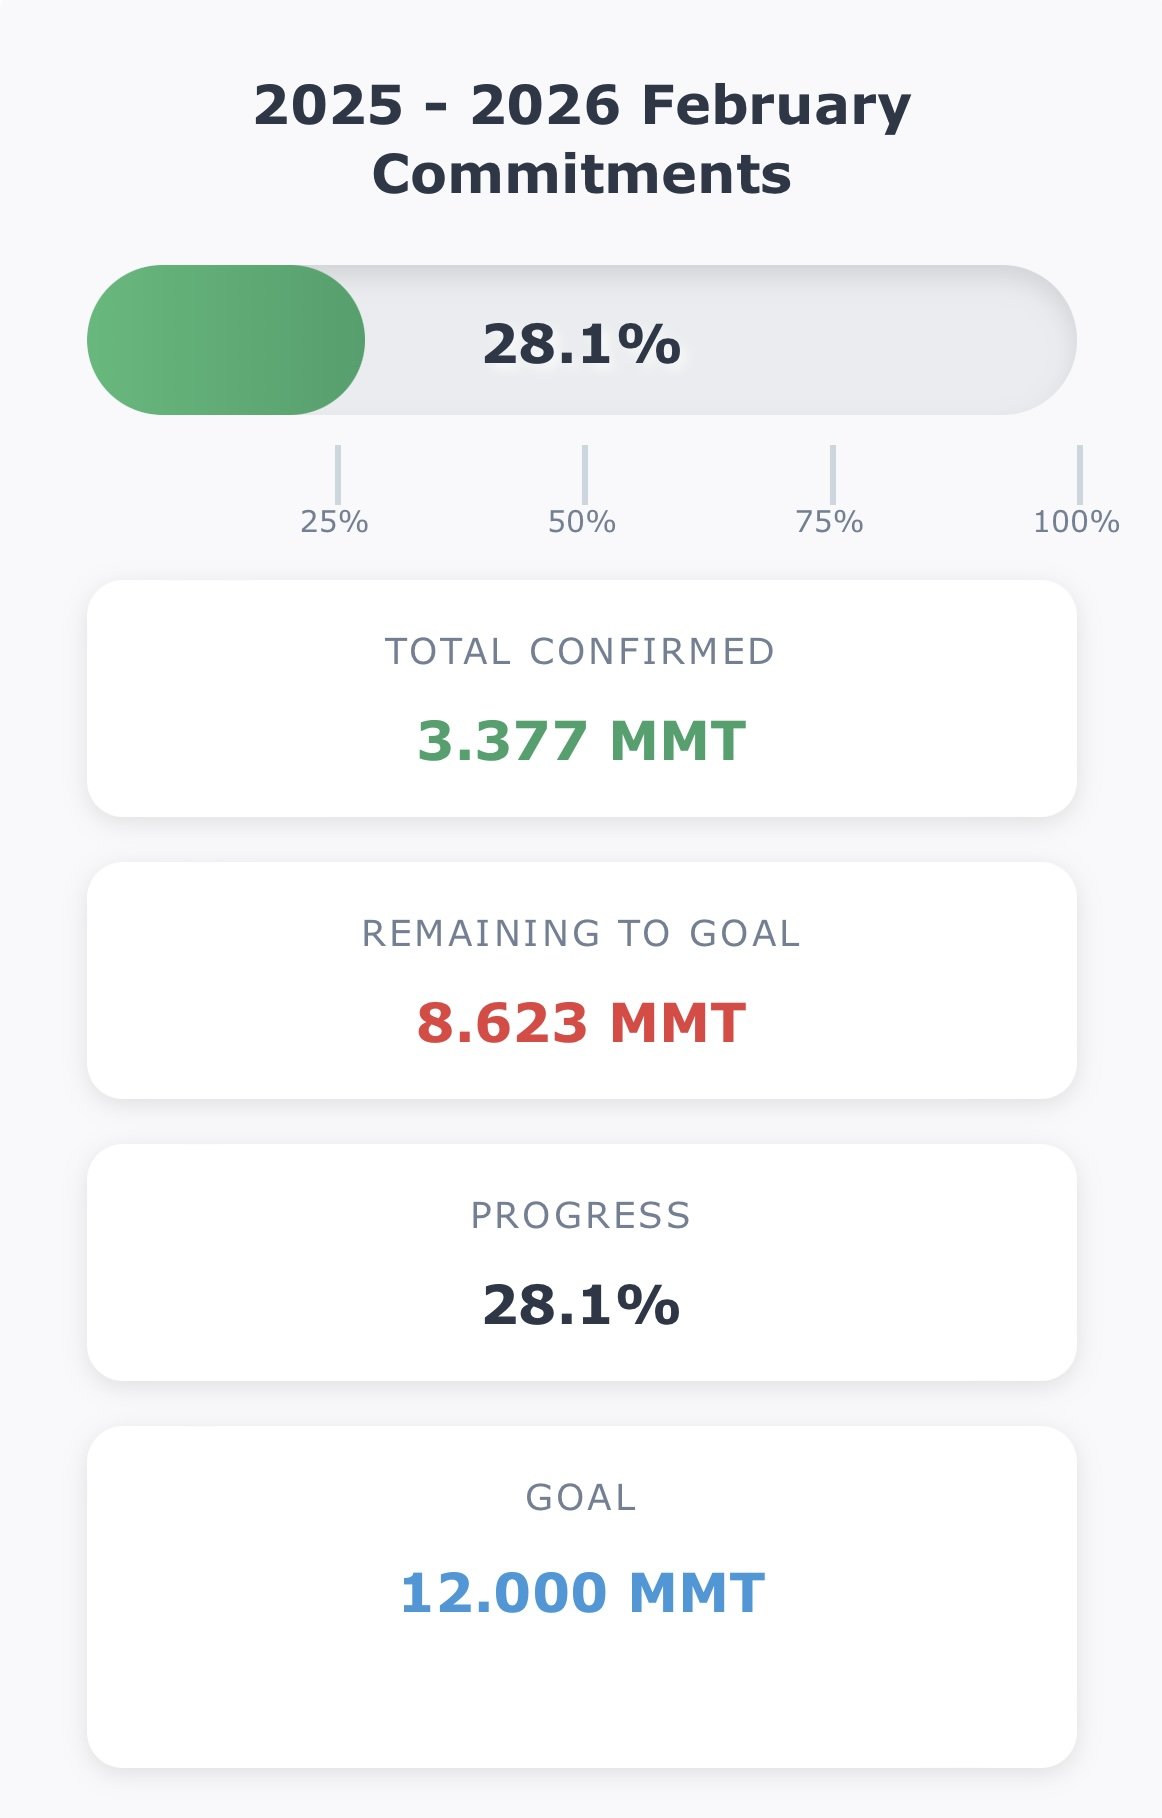
More Bean Sales to China
Despite the confusion, China continues to do what the US claims they agreed to do.
As they do continue to purchase soybeans.
With another flash sale of soybeans to China today.
We have now seen 3.4 million metric tons of the 12 million goal.
Which is 28% of the goal.
It's been about a month since they started buying.
We are over 1/4 of the way to the goal.
So seeing us meet that goal over the next 2 1/2 months by the end of February does not seem unreasonable at all.
Chart from GrainStats
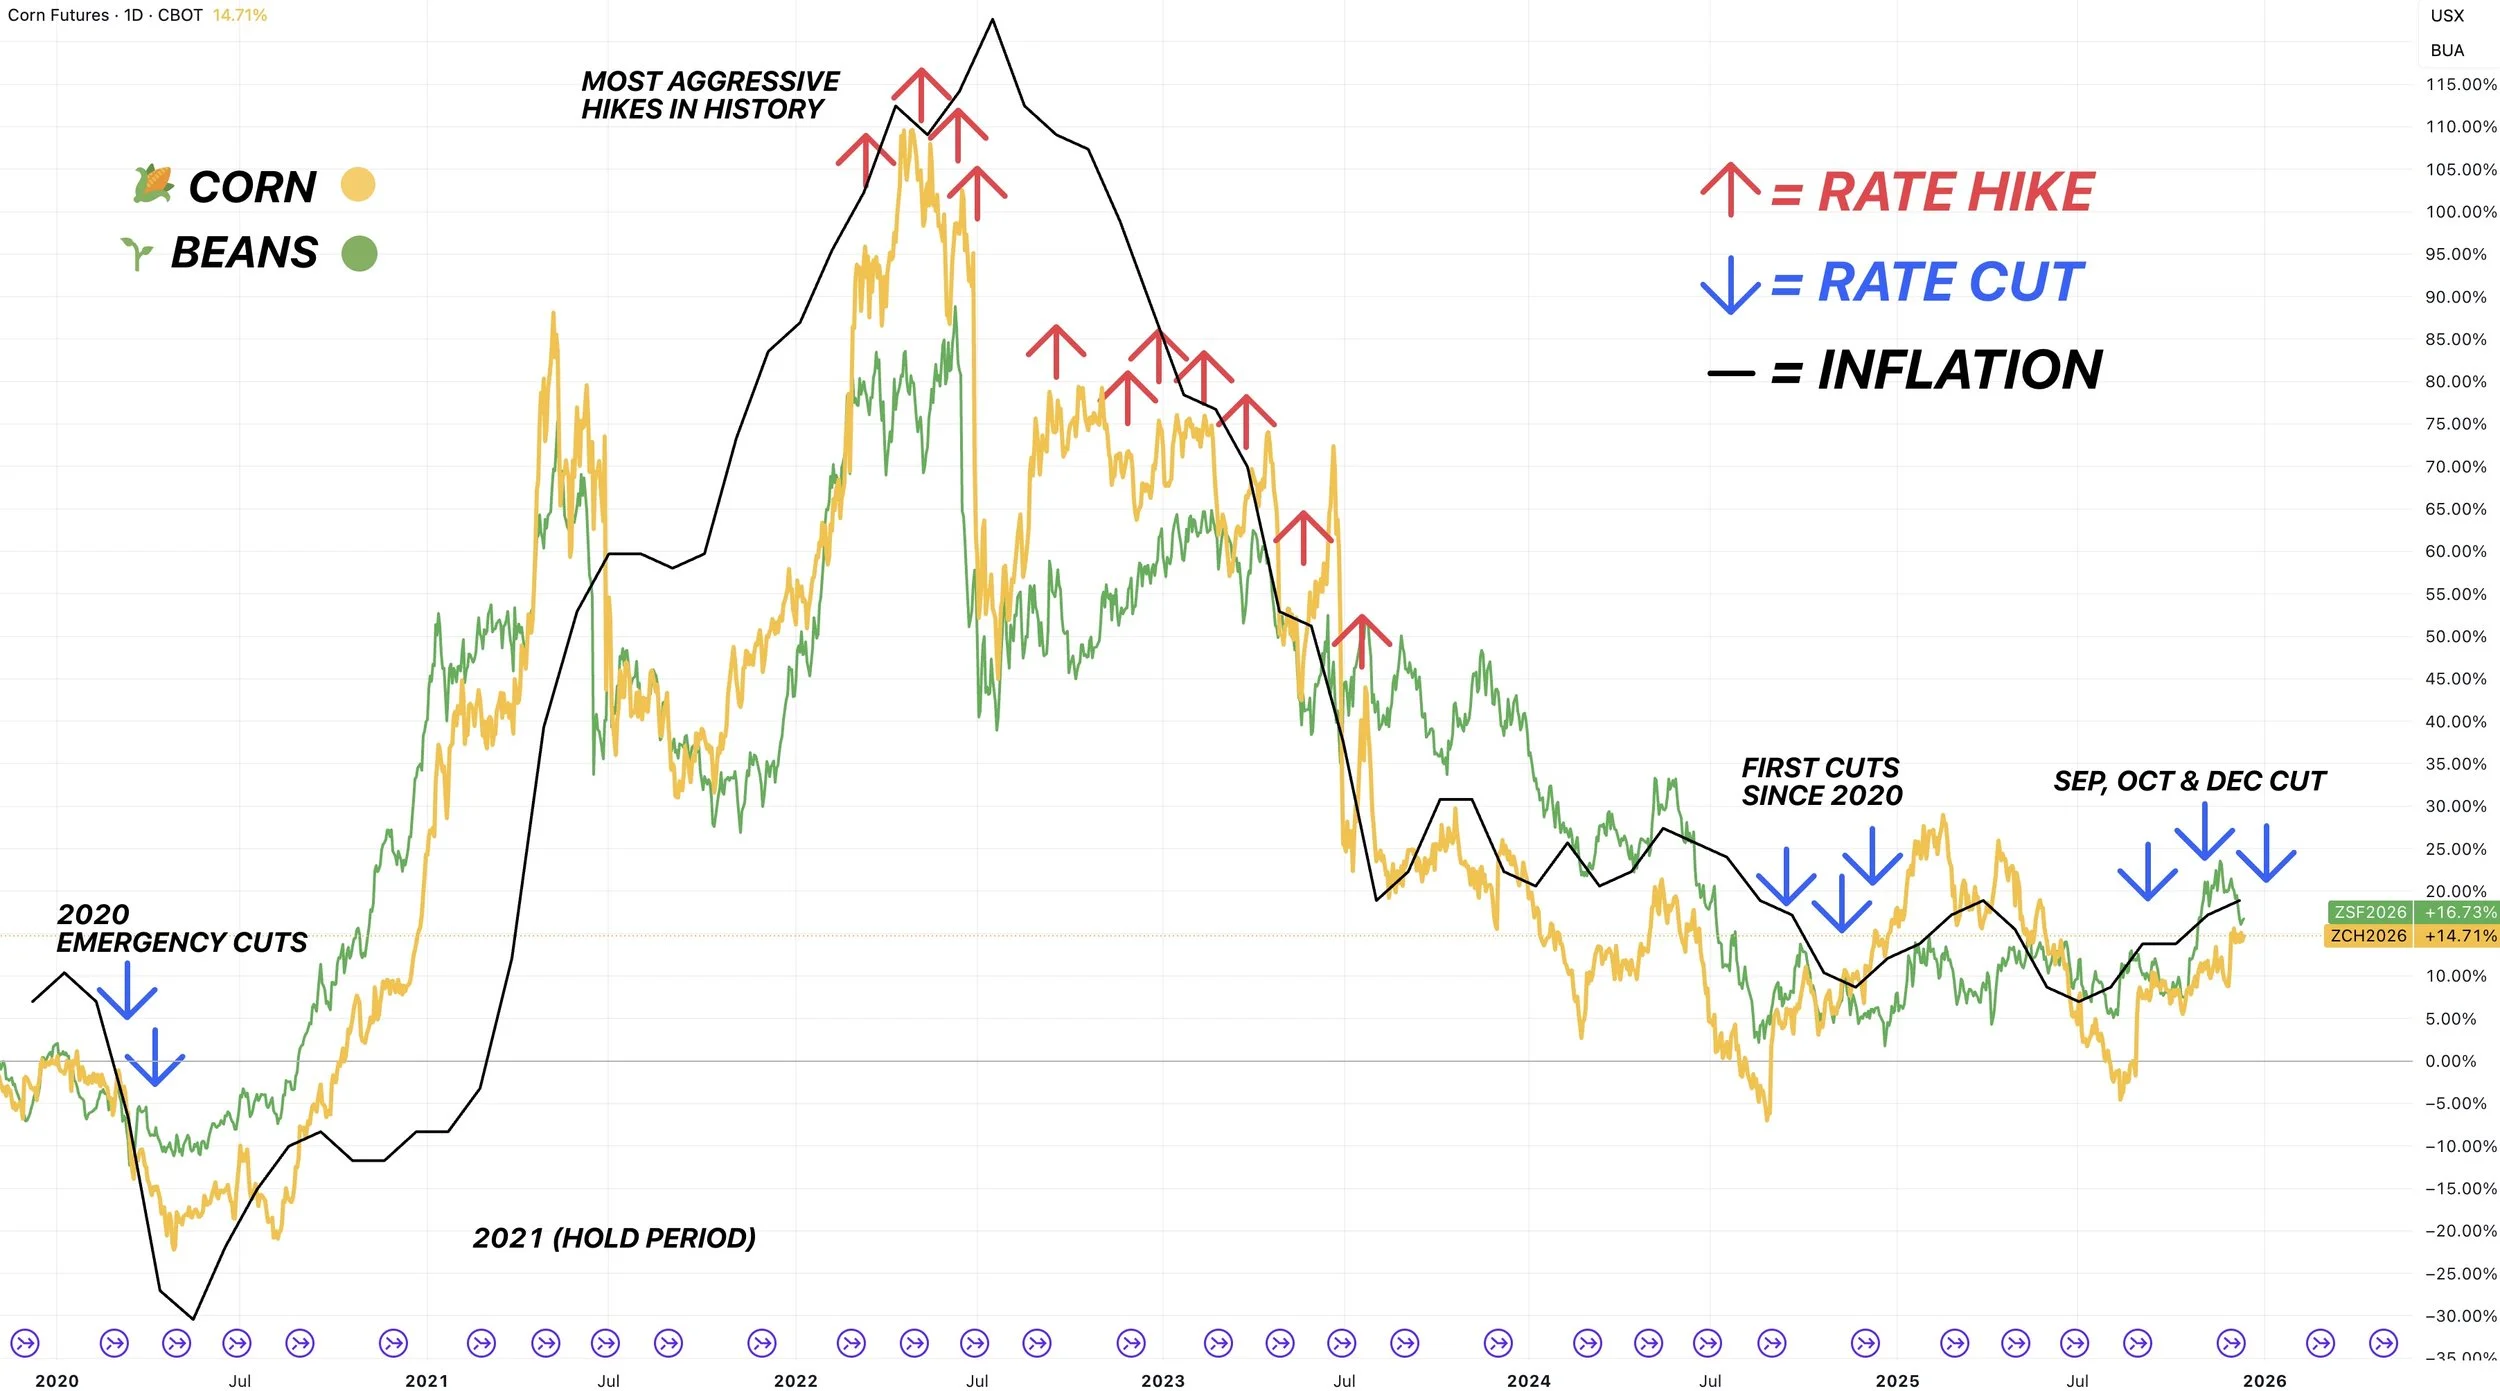
Feds Cut Rates
Feds cut rates once again yesterday as expected.
This is the 3rd cut this year.
Trump said he is going to hire a new fed chair in May when Powell's term ends.
He basically said he is going to hire someone who listens to him and just keeps cutting rates.
Rate cuts lead to higher inflation. This supports higher prices for commodities.
Rate hikes lead to lower inflation. Lower inflation entices lower-priced commodities.
I've shown this chart countless times, but there is a clear correlation when it comes to inflation and the price of corn and soybeans. Whether it's a coincidence or not, it's hard to argue against it.
Take the top of the bull market in corn for example. It ended when the feds started hiking rates at the most aggressive pace in history to lower inflation.
If the feds continue to cut rates, and inflation goes up. It could be bullish for prices LONG TERM, not immediately.
Something to keep on the back burner long term.
World vs US Situations
We've got a tale of two stories here when it comes to corn and soybeans.
First for corn.
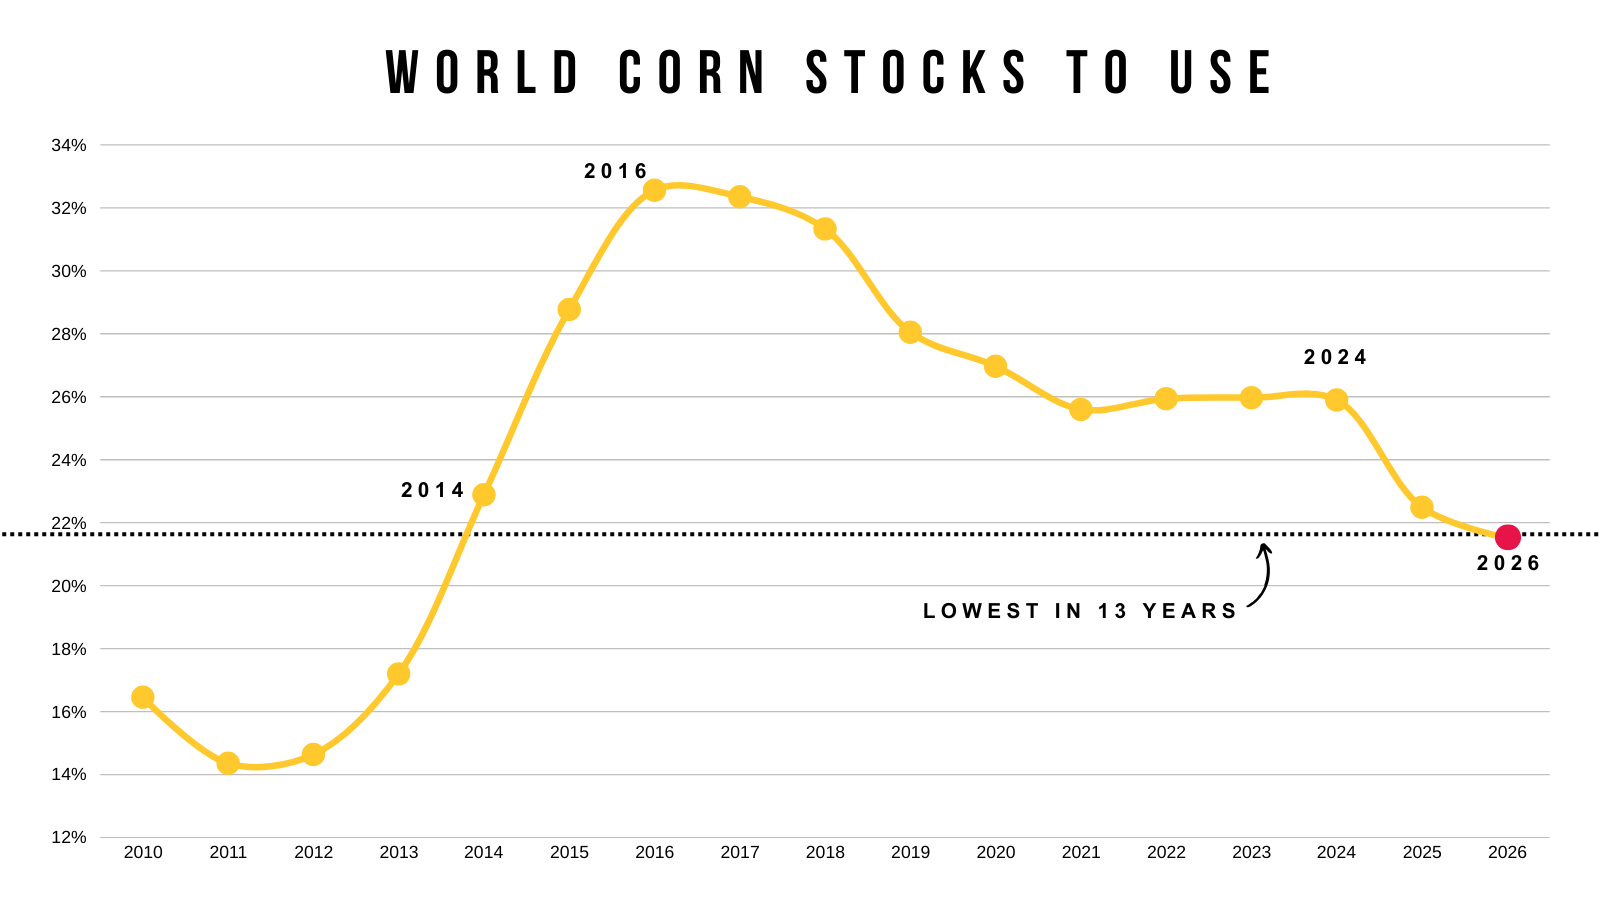
Like I shared earlier this week, the world corn situation is actually tight.
It is the tightest it has been in 13 years.
Even with a record US crop.
Does this matter today?
Yes and no.
It doesn’t matter because the US currently has plenty of supply.
But it will matter if the US or Brazil ever run into a production issue (which is bound to happen someday). We've seen a few years in a row without a weather scare.
If the world is the tightest it's been on corn in a decade, and we run into a weather scare, this chart right here would amplify the effects.
The world clearly still needs our corn.
But if the world situation is tighter than it was during the bull market.. why aren’t prices higher?
Like I said, the US has a record crop.
Our stocks to use ratio here at home isn’t viewed as bullish as of today.
The bull market featured a tight US situation.

Why does this matter?
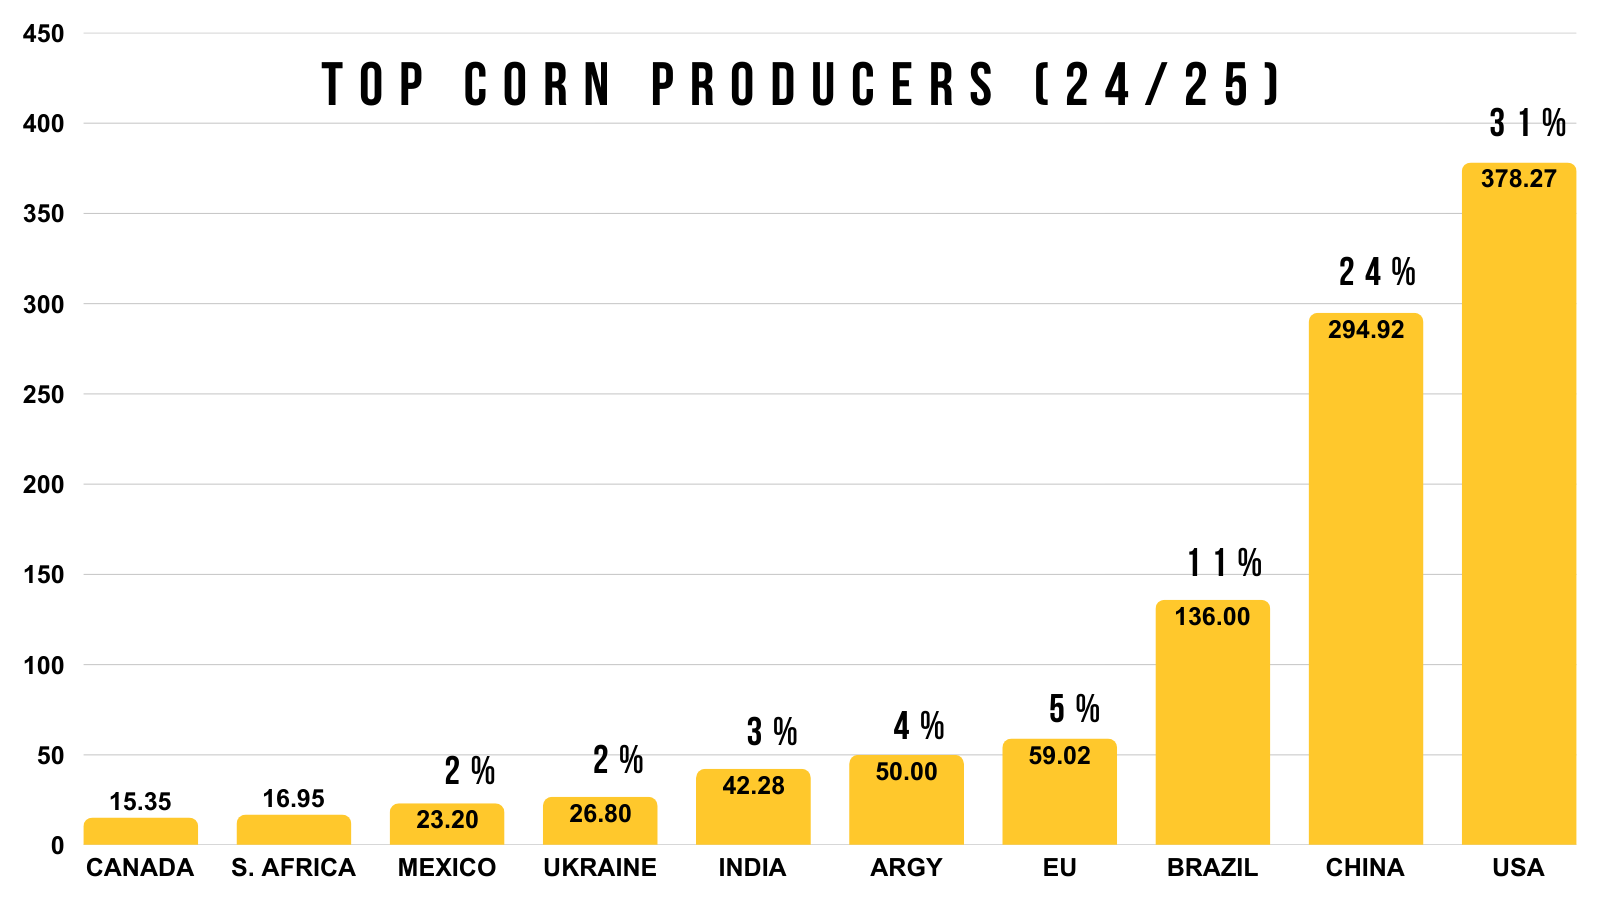
Because the US is clearly the most dominant global player in corn.
We produce 31% of the world's corn.
China doesn’t export corn as they use it domestically.
The next closest is Brazil at 11%.
So the US corn situation matters more than the world corn situation when it comes to it's affect on prices.
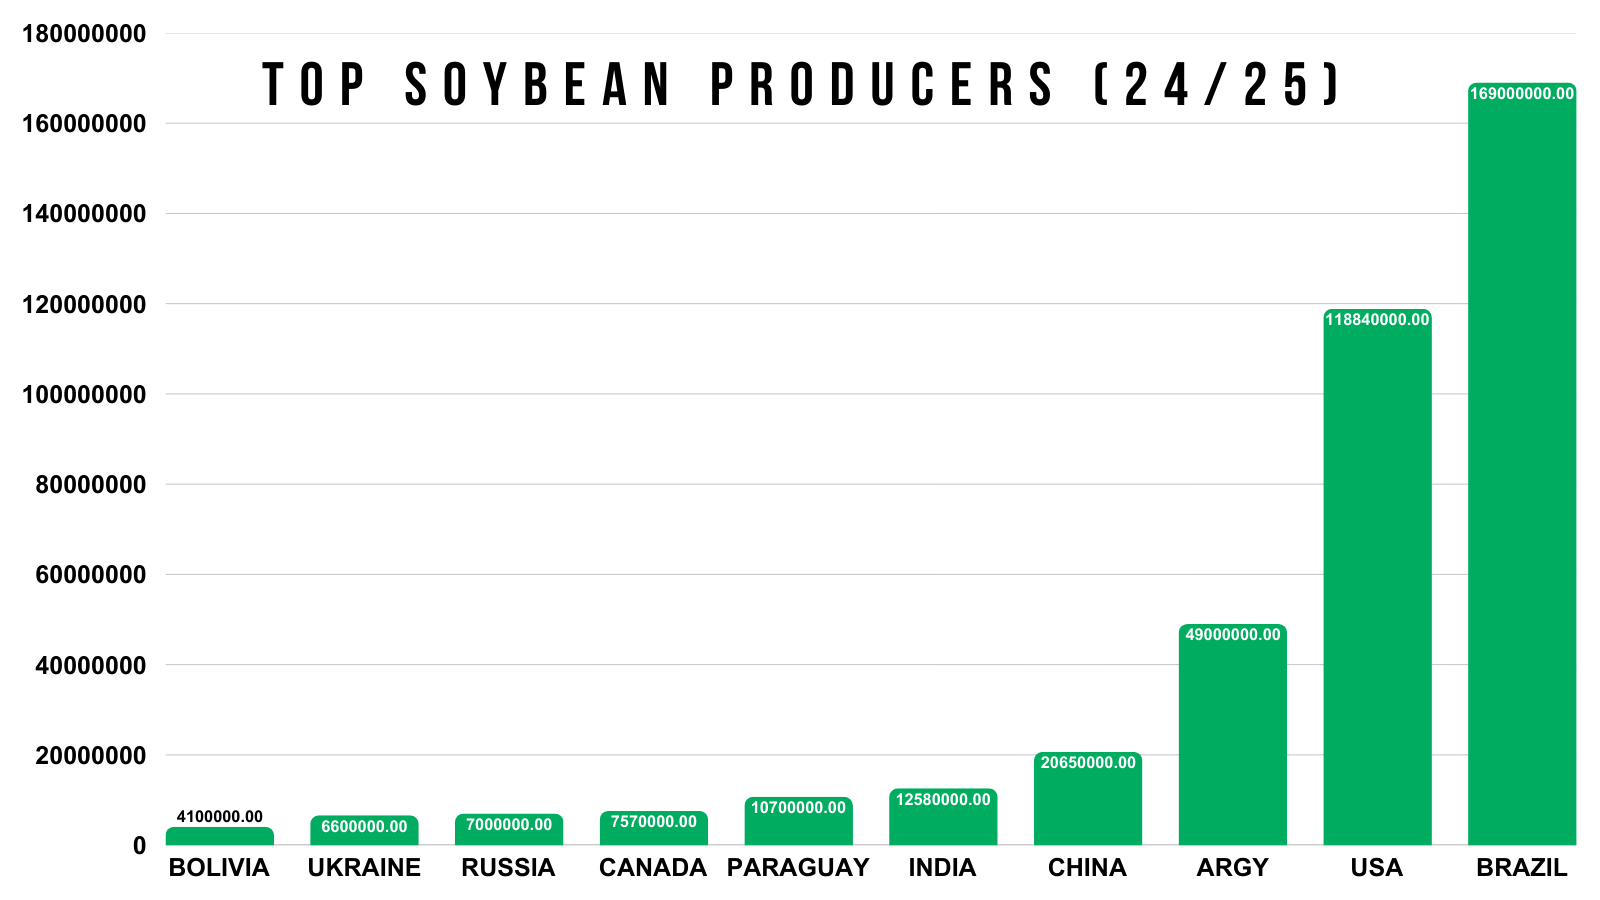
Next for soybeans.
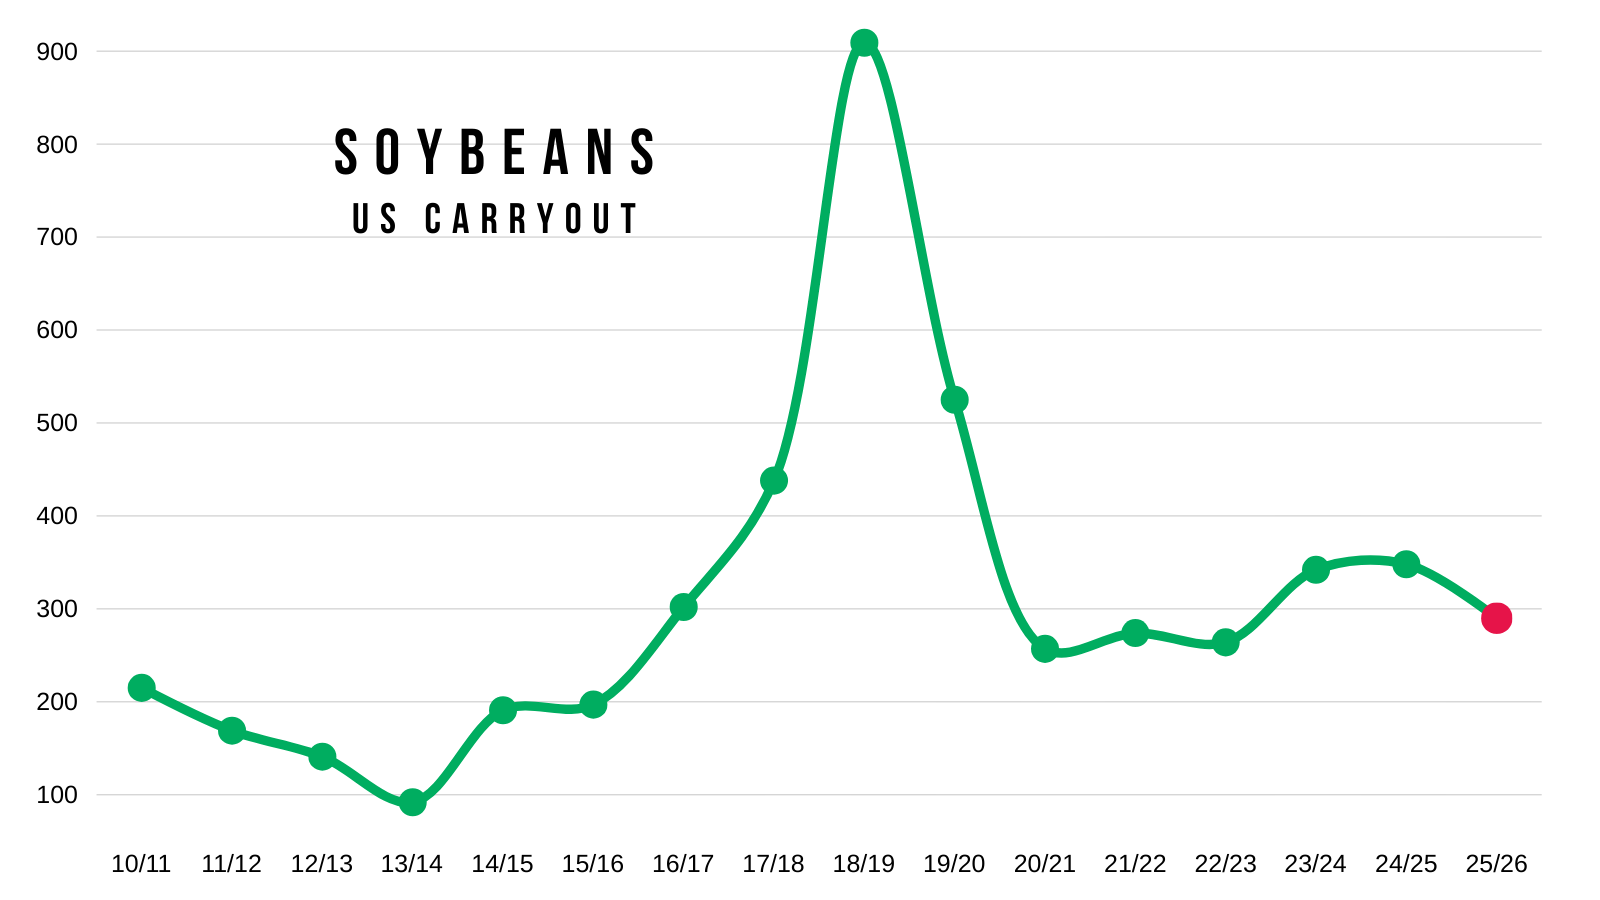
Our US situation is actually decently tight.
A 290 million bushel carryout is almost on par with those bull market years.
So why aren’t prices higher?
Because the world situation in soybeans isn’t bullish.
It's still sitting at some high levels historically.
Only behind the last two years and the trade war.
That bull market featured a tight world situation.
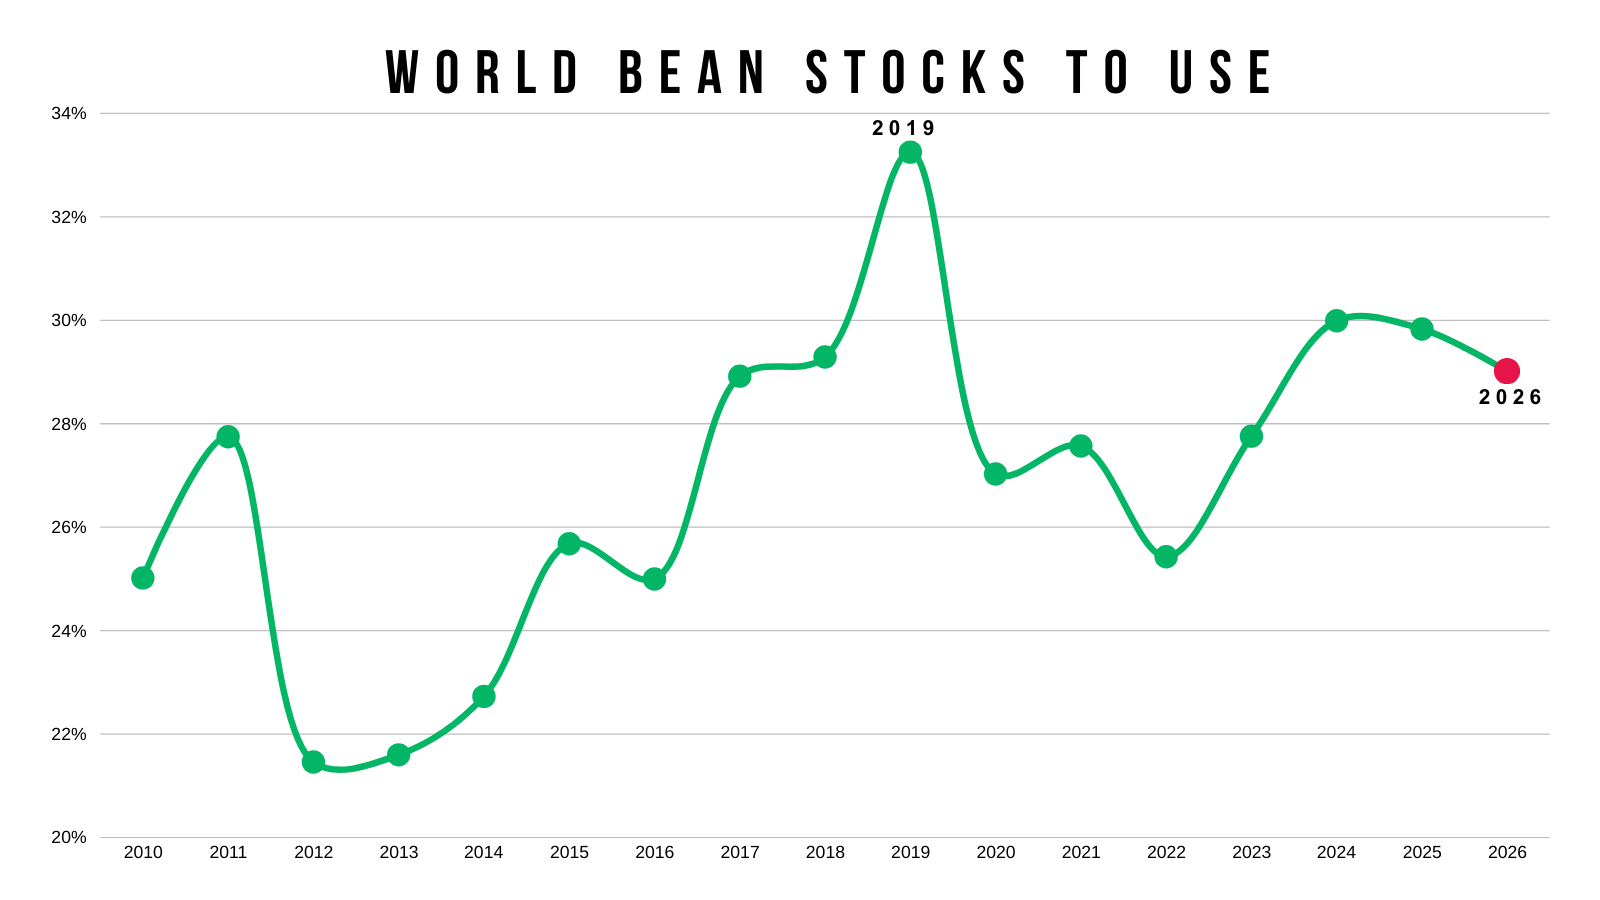
Why does this matter?
Unlike corn, the US does not dominate the world market for soybeans.
Brazil does.
So the US situation matters more in the corn market.
Lastly here is a quick look at the wheat market.
Neither the US or global picture is super friendly.
For starters, the US situation is the most bearish it's been in 5 years.
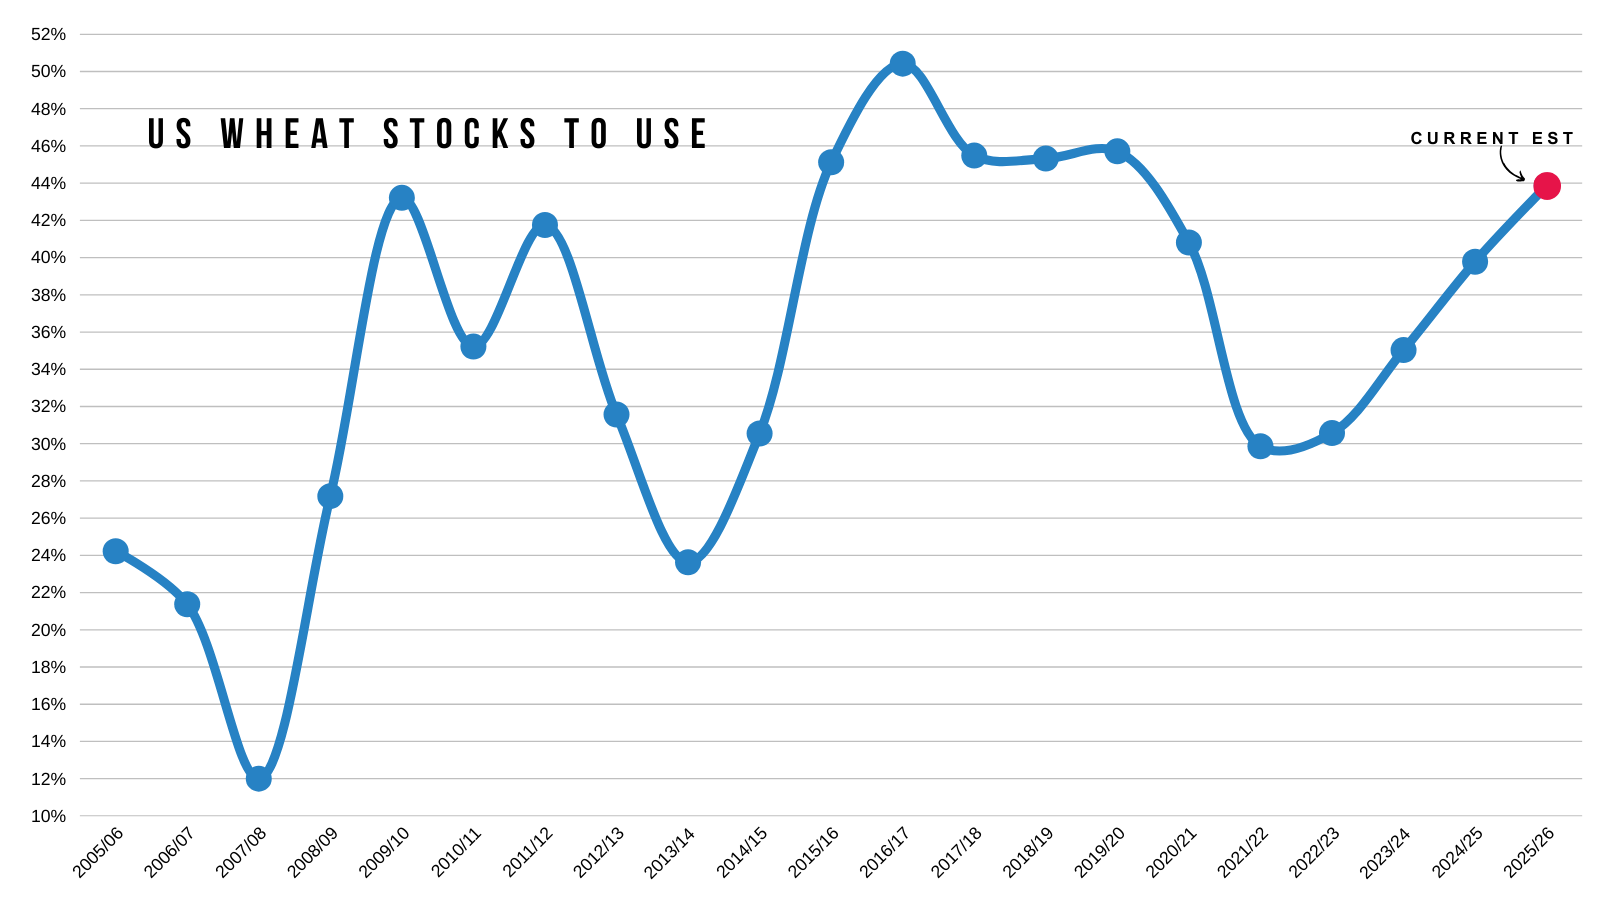
The world situation is actually tighter than it was the last few years.
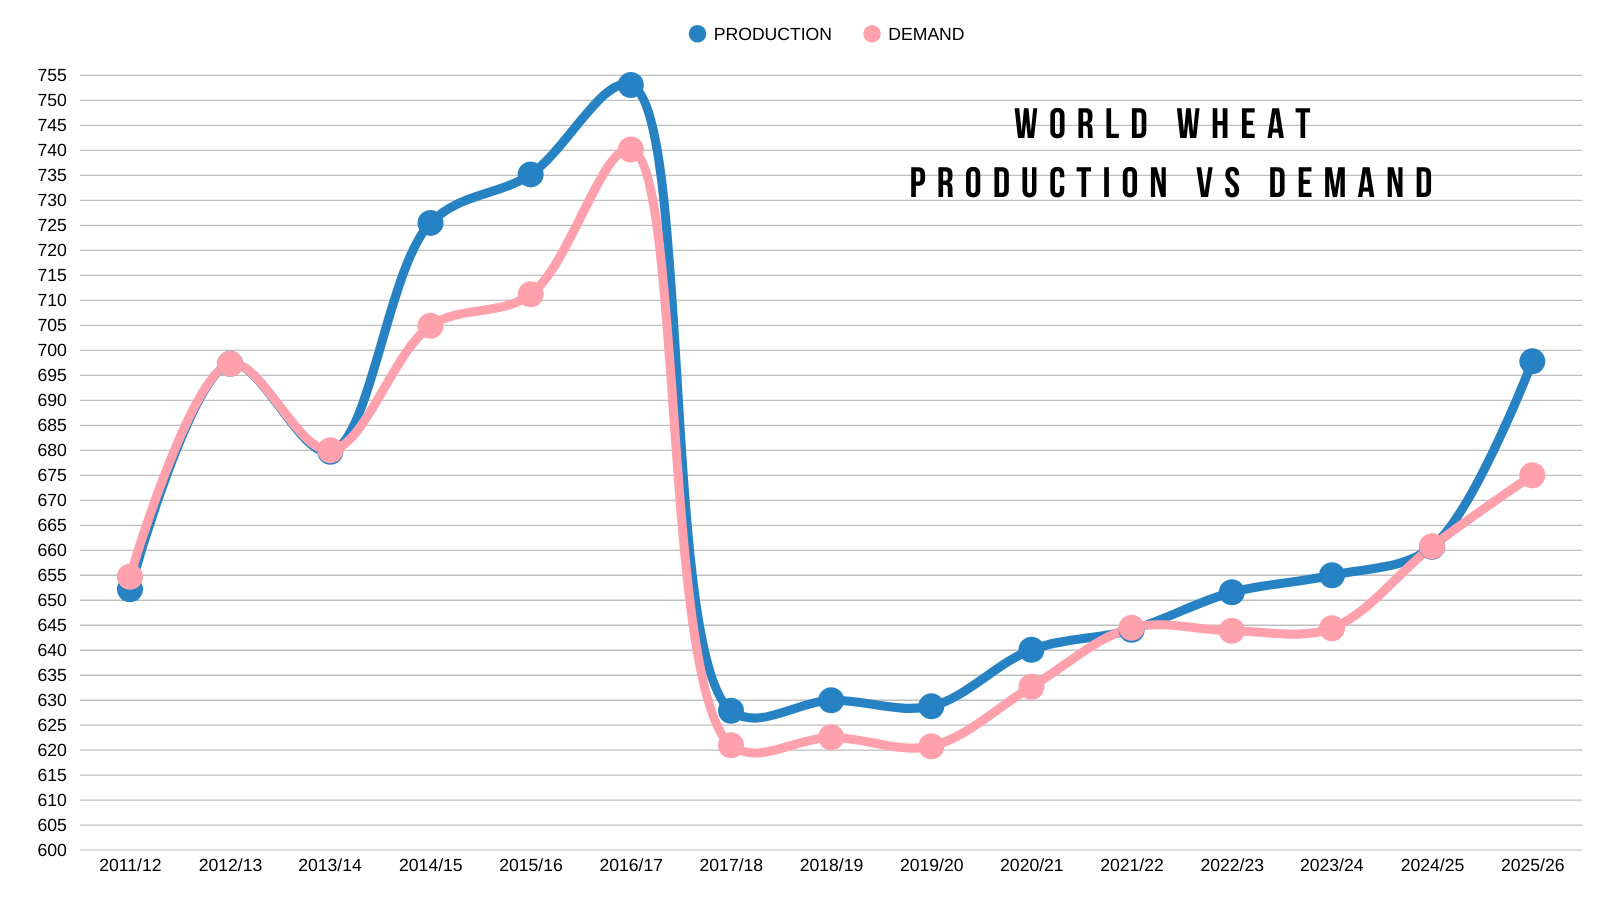
But the stocks to use has started to pick back up this year.
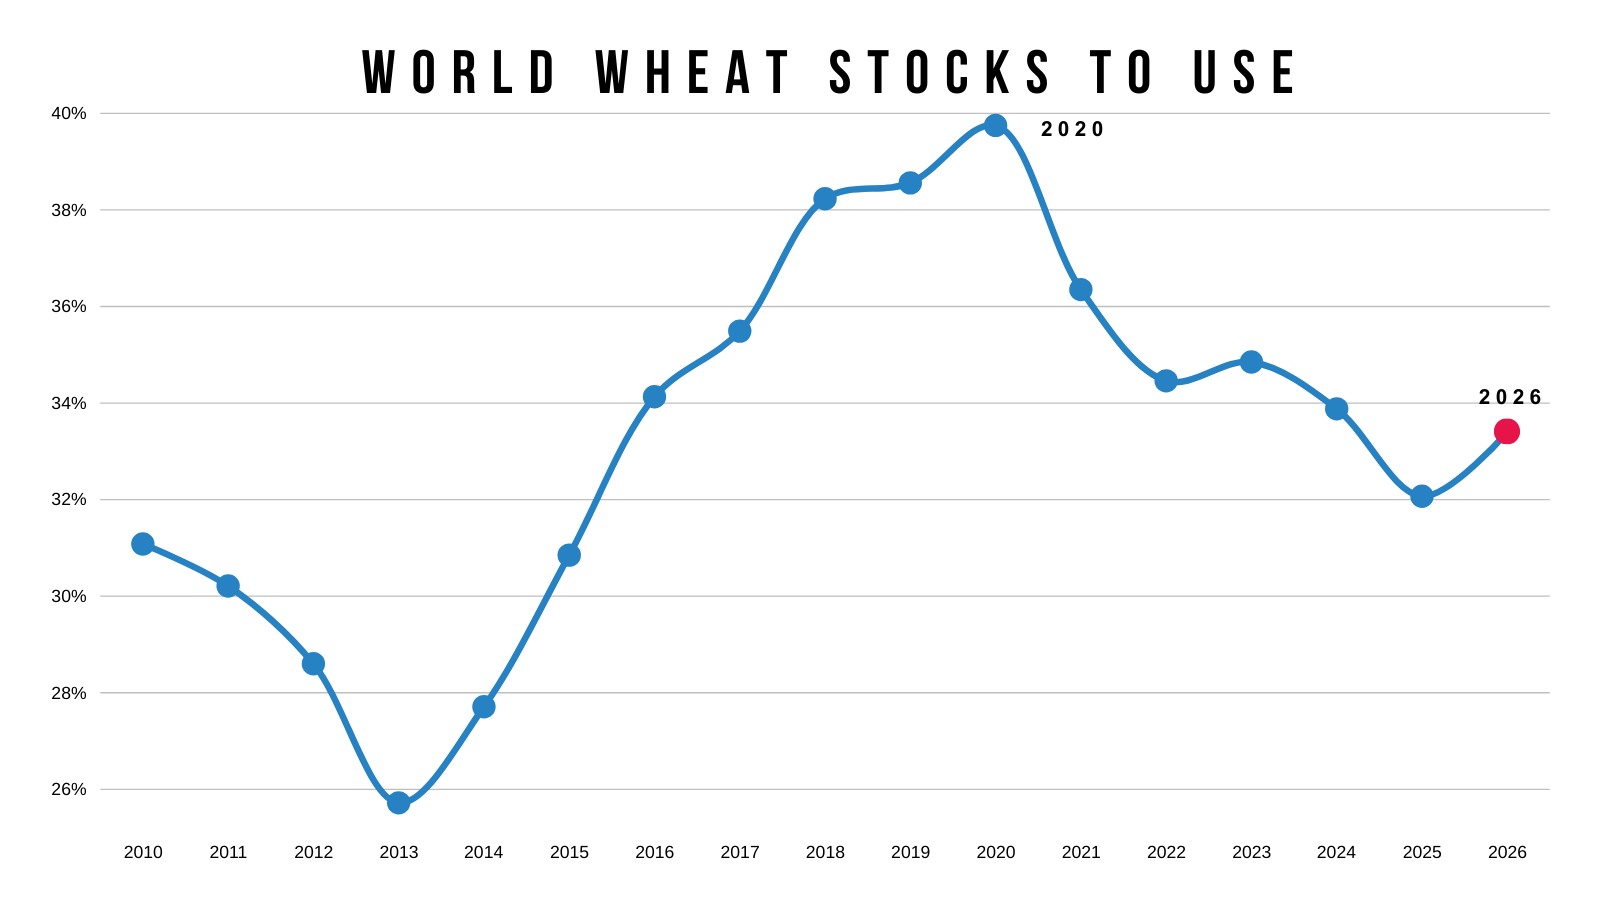
This is because global production is outpacing demand this year.
This is not a great sign when paired with ample US supply.
Today's Main Takeaways
Corn
Fundamentals:
Let's take a look at some of the seasonals today.
I shared these most of these on social media the other day.
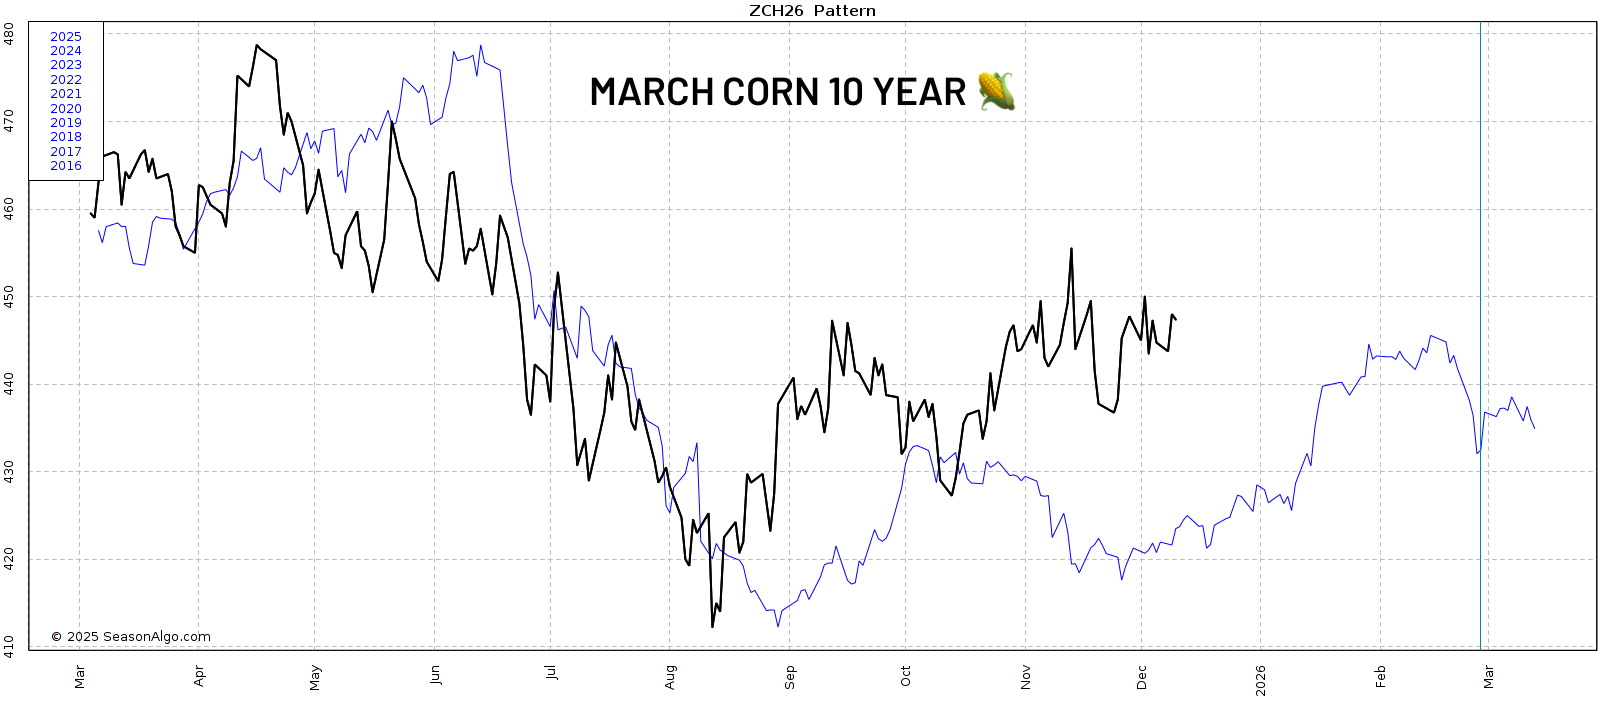
Here is the March corn 10-year seasonal.
Clearly it hasn’t tracked this at all.
So this pattern doesn’t really matter.
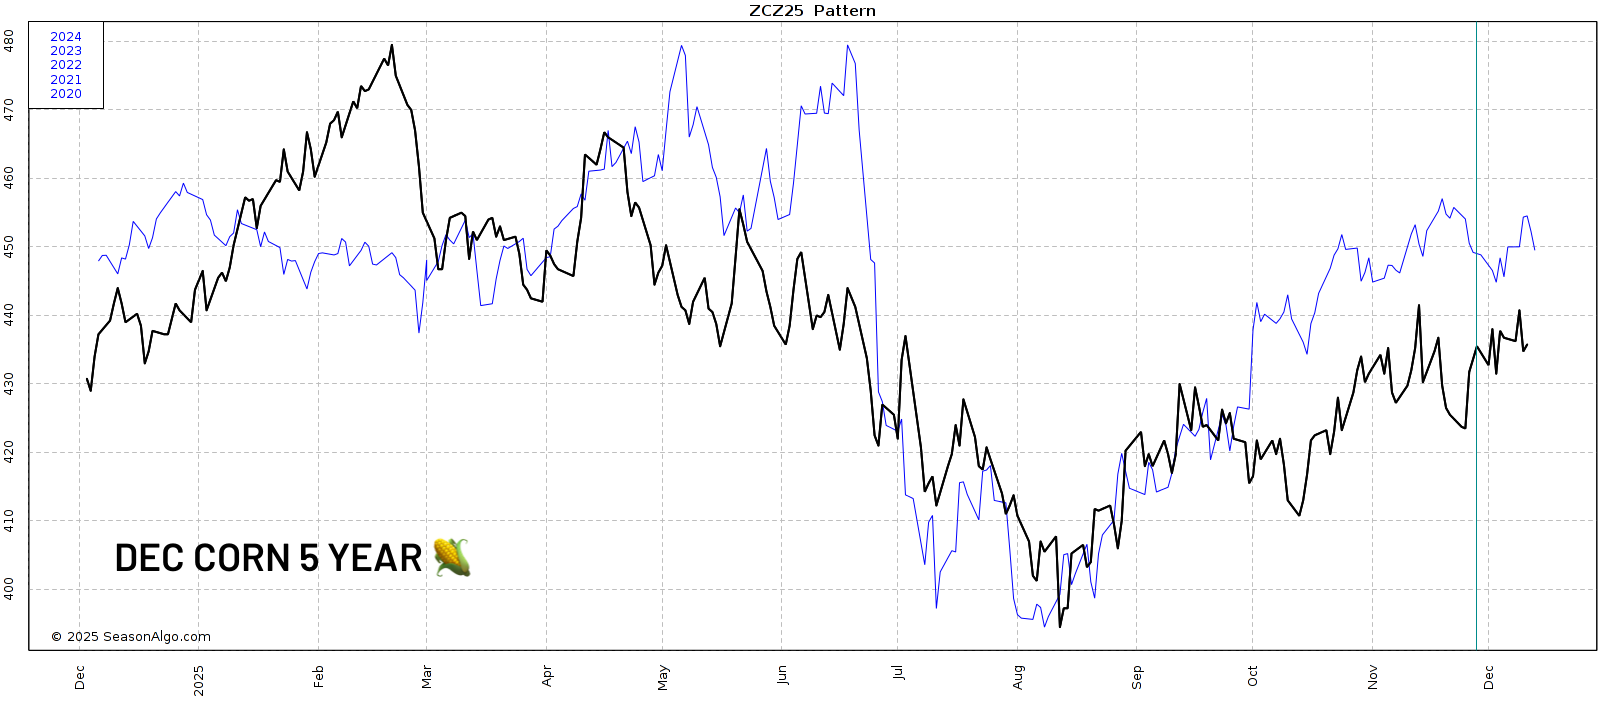
This is the Dec corn 5-year seasonal.
It played out pretty much perfectly.
Altough it wasn’t quite as strong, it followed the exact pattern.
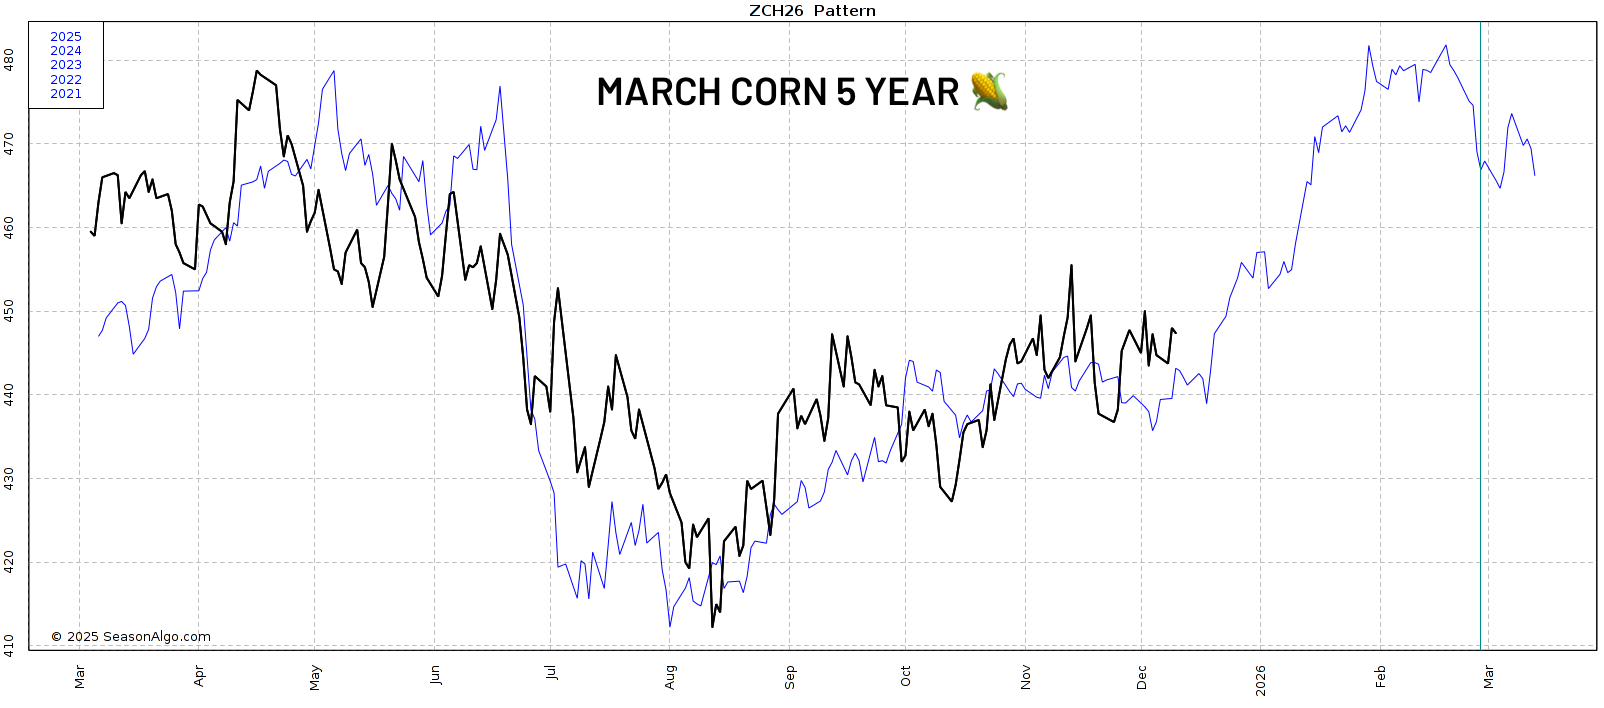
Here is the March corn 5-year seasonal.
We've been following this almost tick for tick.
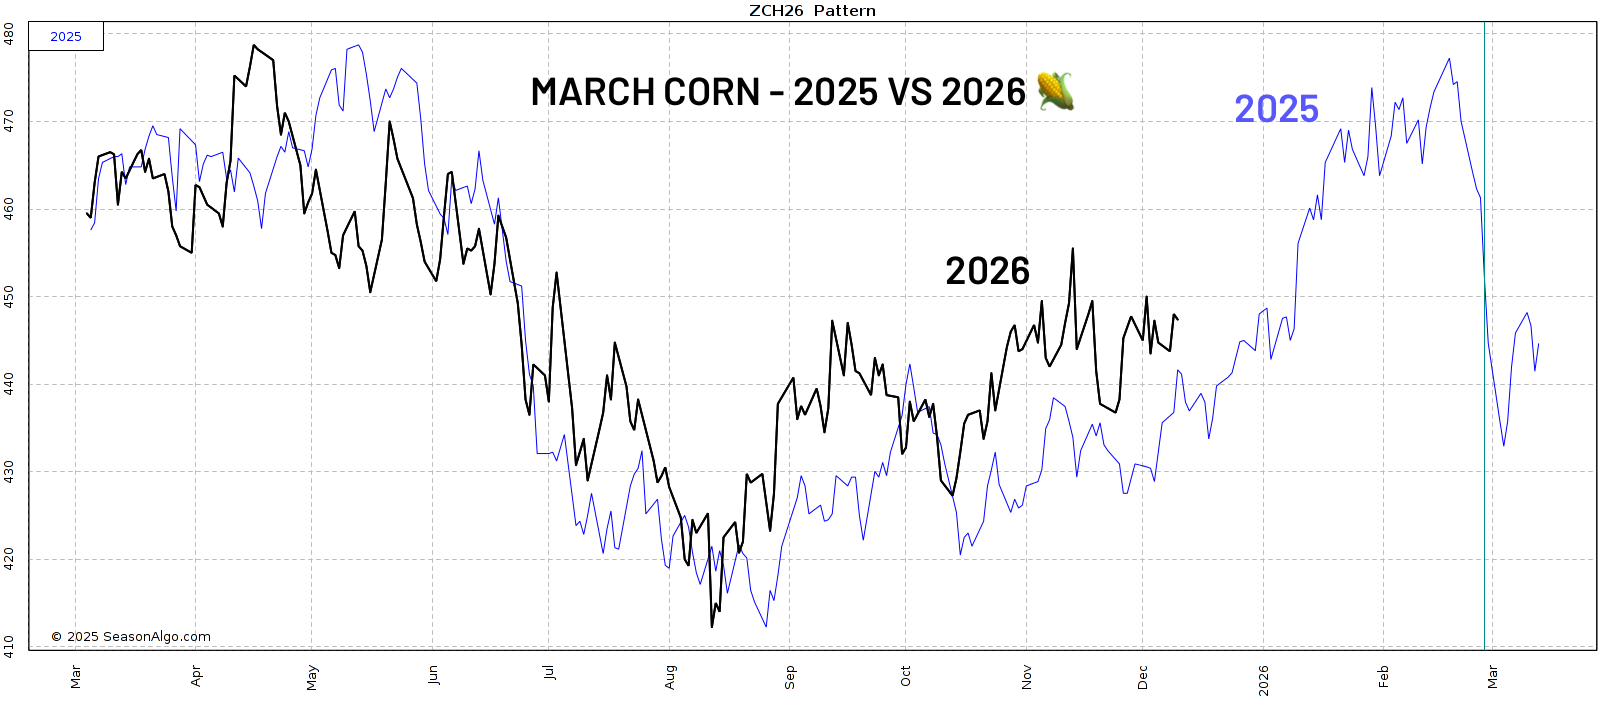
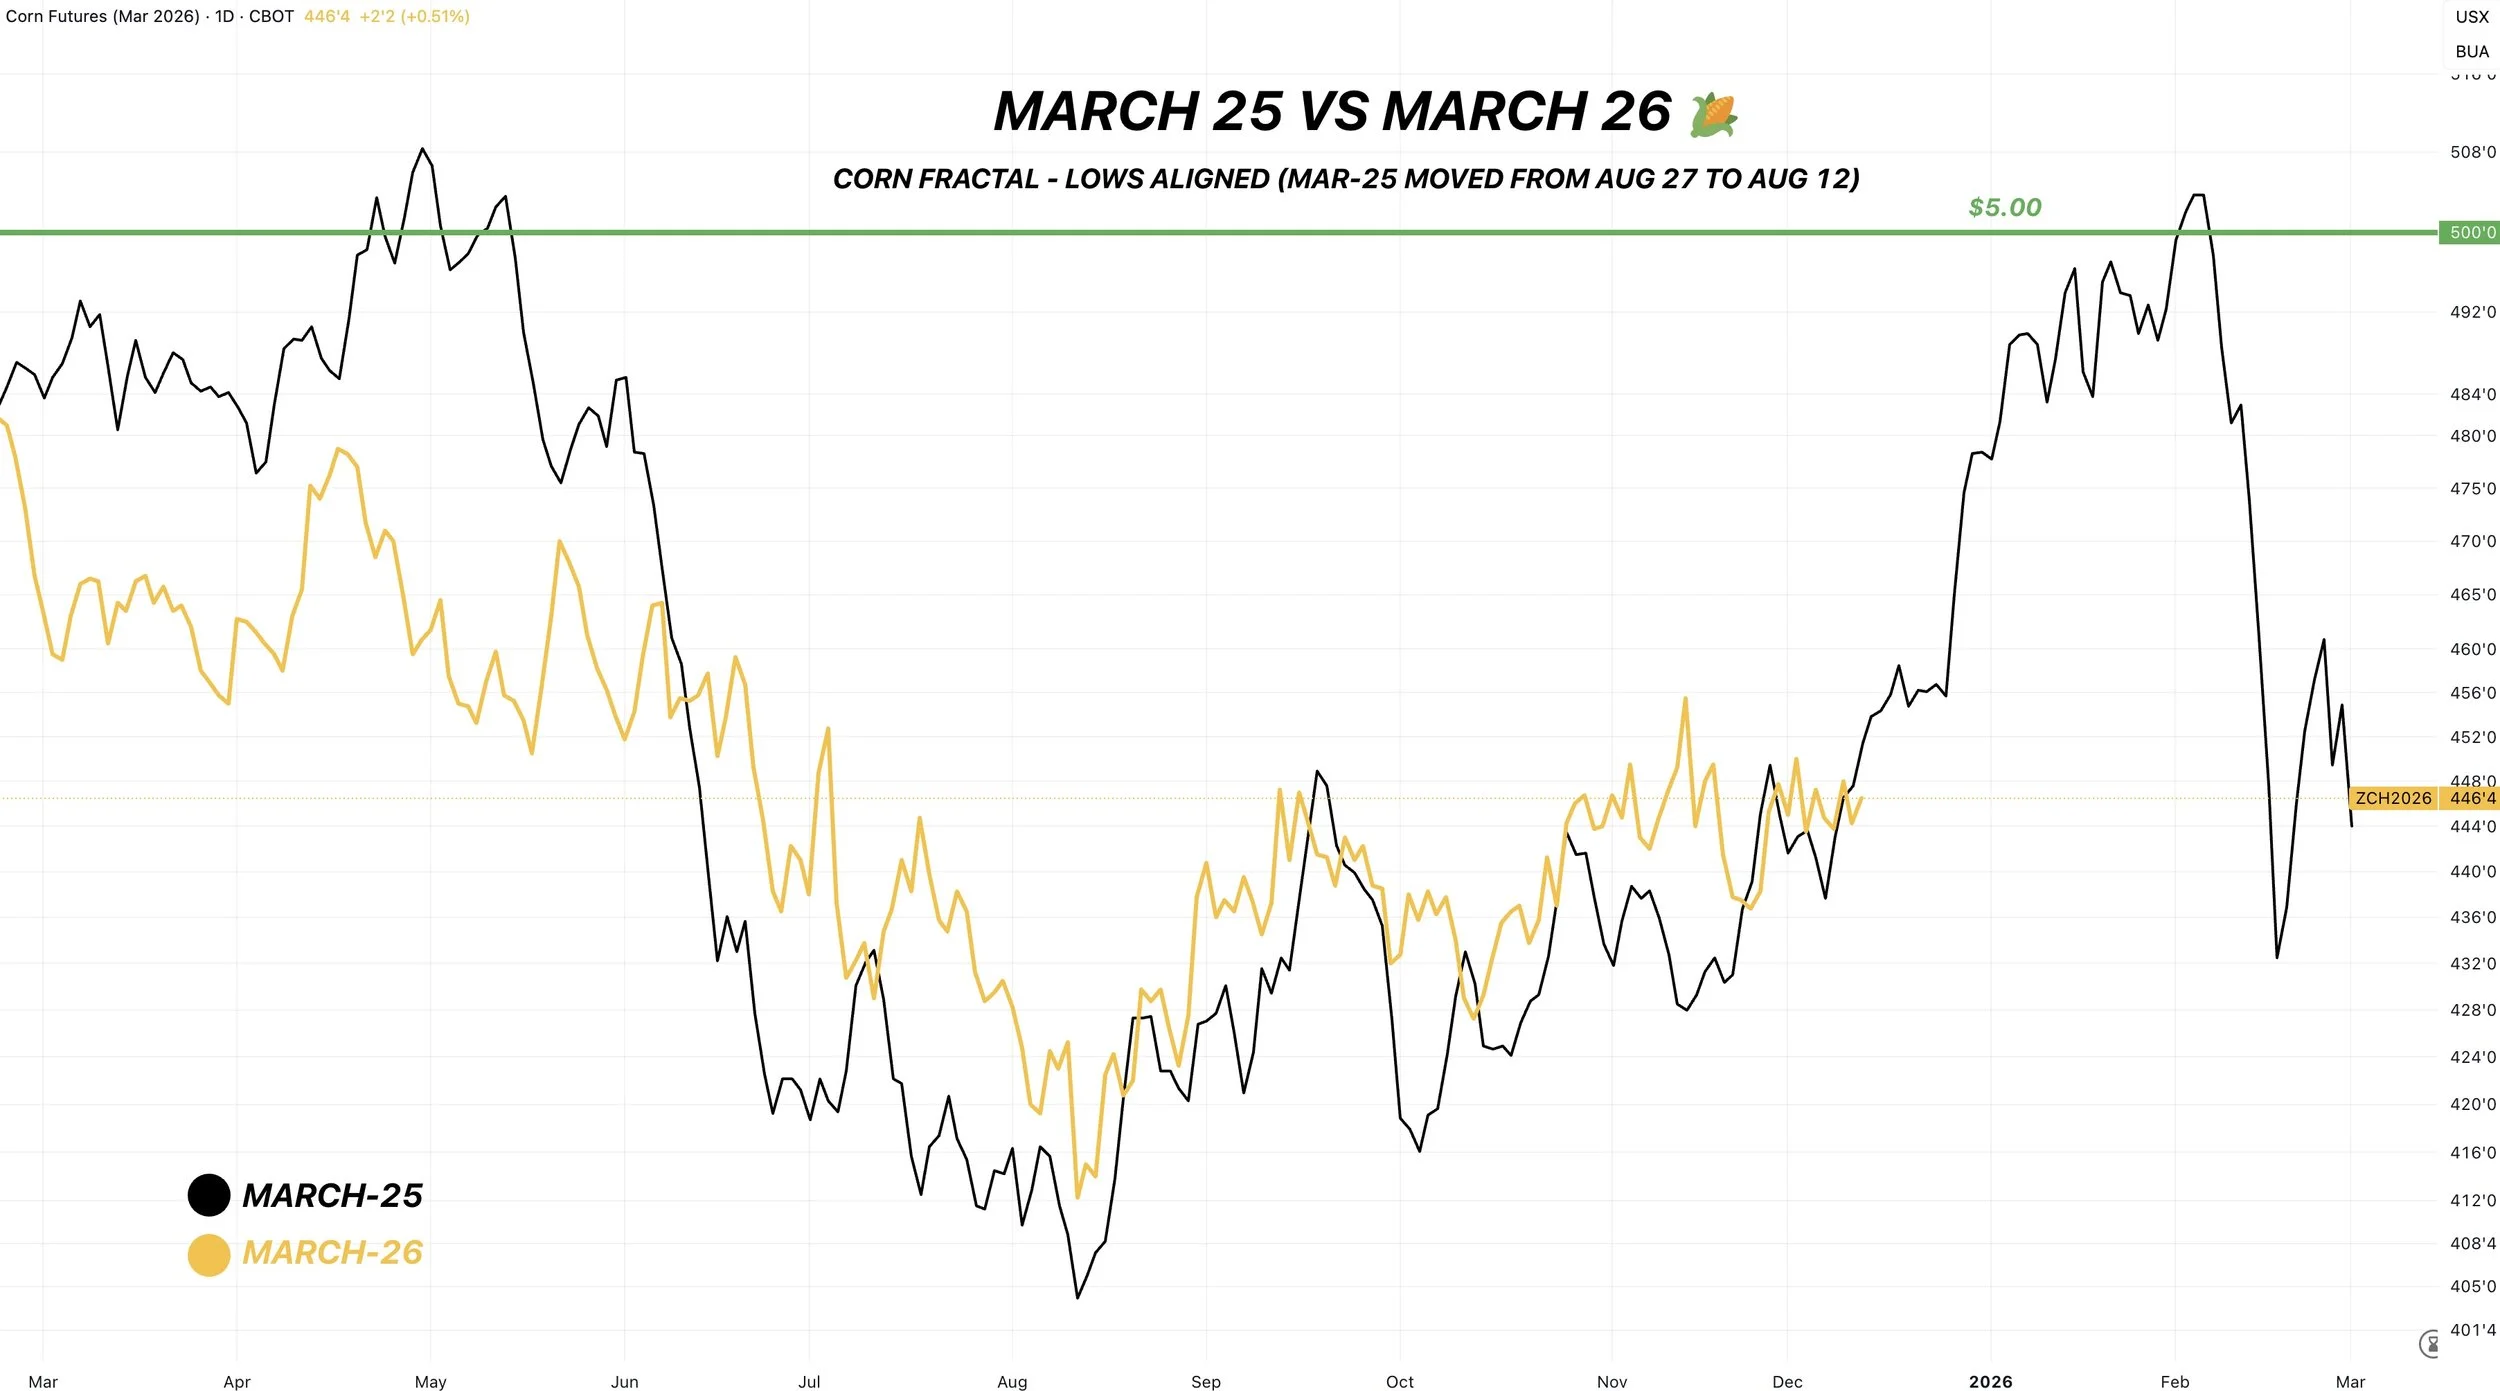
Lastly, here is March-25 vs March-26 corn.
Very similar as well.
In both the 5-year pattern as well as last year's pattern, we re-vist the highs we posted in spring.
If we were to do that again this year, it would put corn in that $4.70 to $4.80 range.
Bottom line, I am not bearish corn. But I do think our upside is still limited beyond $5.00 for now.
Simply because we do have massive production numbers here in the US.
At the same time, record demand should help keep a floor under this market.
To see this market get that next leg higher, it might take a yield cut in the Jan report. The issue is that I'm sure the USDA will walk back some demand numbers at the same time.
But taking a long term perspective on this market.. we have built all of this demand.
What happens if acres come down next year?
What happens if weather isn’t perfect next summer?
We already created a demand monster.
That is why "low prices cure low prices".
It's the markets job to put prices at a level that justify the demand.
For the market to justify lower demand in the future, prices typically have to go higher.
So short term, I think the path to significantly higher prices is harder. Long term we could have a story behind this demand when supply and acres aren’t shattering records.
Corn Options Ratio Strategy
For those with hedge accounts, this is a strategy Jeremey and Lauren are considering for some.
Right now, March corn is trading about exactly where it was last year.
From then, corn went on to rally to around $5.00.
If we wind up with even a remotely similar path, there are ways you can capitalize on that potential.
The trade in simple terms:
Buy 4 February $4.60 corn calls.
Sell 1 December 2026 $5.00 corn call.
Selling the one call pay for the bought calls.
Here is what the calls would approximately be worth at expiration if we rallied to the following:
$4.70 = Each Feb call worth 10 cents
4 of them = $0.40
$4.80 = Each Feb call worth 20 cents
4 of them = $0.80
$4.90 = Each Feb call worth 30 cents
4 of them = $1.20
$5.00 = Each Feb call is worth 40 cents
4 of them = $1.60
$5.50 = Each Feb call is worth 90 cents
4 of them = $3.60
(The Math: Futures Price - $4.60 = Call's Worth at Exp)
Here is a visual on the potential price you'd get for your corn plus the value of the calls at different corn prices. Not inlcuding basis.
This chart is provided that the Dec call you sold expires worthless and you collect the entire premium.
We are not saying any of this has to happen at all, this is simply the results if it happened.
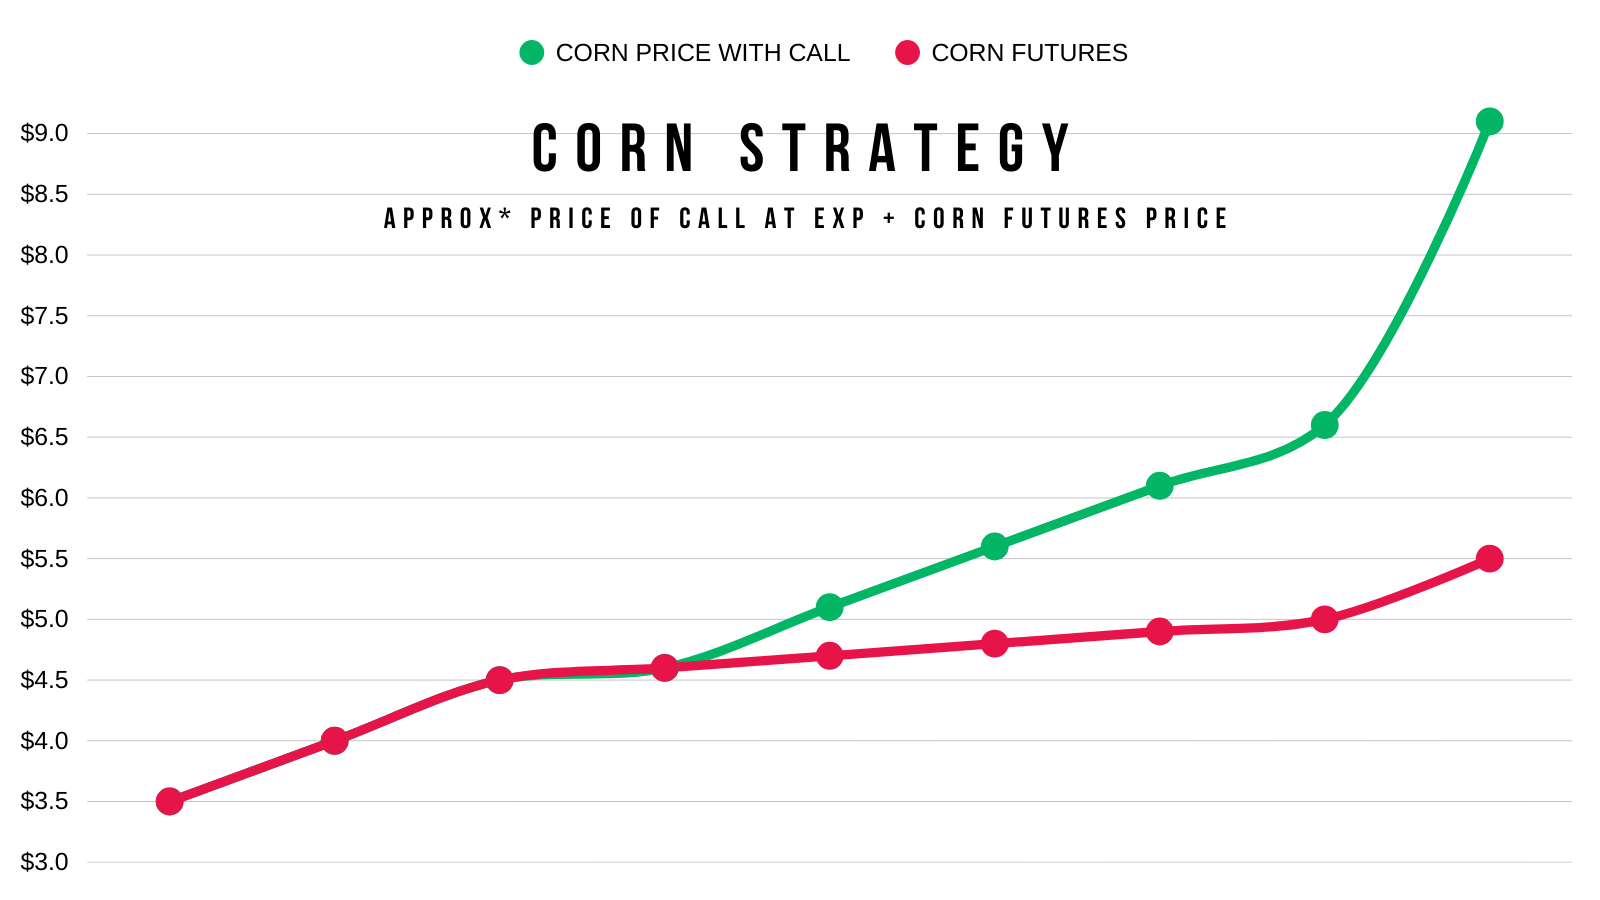
It's a trade that could pay for a farm if the market did decide to take off, or it could turn a break-even year into a profitable one.
Why not just buy calls?
In case the market does not go higher.
By selling the one call, it completely pays for buying the other 4 calls.
If the calls go to zero, you don’t lose much if anything.
Basically, a way to play the upside for free until the long calls expire.
This is just a way to play for a similar type of rally to last year while taking advantage of low implied volatility.
Lauren broke this down even further along with some variations, if you want to check that out:
CLICK HERE FOR LAURENS'S STRATEGY
If you’re interested in this trade, reach out to Jeremey or Lauren.
Jeremey: (605)250-3863
Lauren: (806)391-7178
Technicals:
March Corn
Nothing new on the corn chart.
We've traded pretty much sideways for over a month now.
We have closed between $4.40 and $4.50 for the last 27 of 32 trading days.
A very small 10 cent range over a month.
Whatever way this range breaks should give us our next direction. Everything in between in noise.

Corn still remains in an uptrend as long as we hold the red box.
Which gives back 61.8% of the Oct rally.
We've been battling the 200-day MA for 10 days in a row now. Two consective closes above would be nice to see.
Ultimately, to say we are ready for further upside we need over $4.50
We've only closed above that key resistance one time. It was the day before the USDA report before the USDA sent us straight back down.
It's still clearly the level to break. It is our old key support from spring. Now key resistance.
It reclaims 50% of the Feb highs.

Soybeans
Fundamentals:
Just going over the technical charts today as I do think we are in an area where we should start to find some support.
It's really going to come down to two things here over the next few months.
China and Brazil.
We need China to continue to step in here and buy to help keep a floor under this market. Which I think happens.
But for this market to get super bullish, it very well could take a production scare out of Brazil. It is still early, but so far we haven’t seen many issues.
There are a ton of possibilities in this bean market.
Some could result in +$12.00, some could result in us staying below $11.00.
The potential for a lot higher prices still exists, but the bulls need to keep getting fed.
Whether that's China buying more than expected, a weather scare in Brazil, or a yield surprise in the Jan report.
Technicals:
Jan Beans
Have we found a bottom?
I'm still hesitant to say we bottomed.
But I do still think we bottom somewhere in this green box.
This has been my downside target since those highs.
Giving back 50-61.8% of a rally is viewed as a standard correction.
That is where the market decides if we are still in an uptrend or starting to fall apart.
It also just so happens to be our yearly resistance.
Everyone is screaming about that gap.
Fun Fact: only 35% of breakaway gaps get filled.
it's possible, but I do not think we have to fill that gap.
If everyone thinks something is going to happen, often times it doesn’t happen.

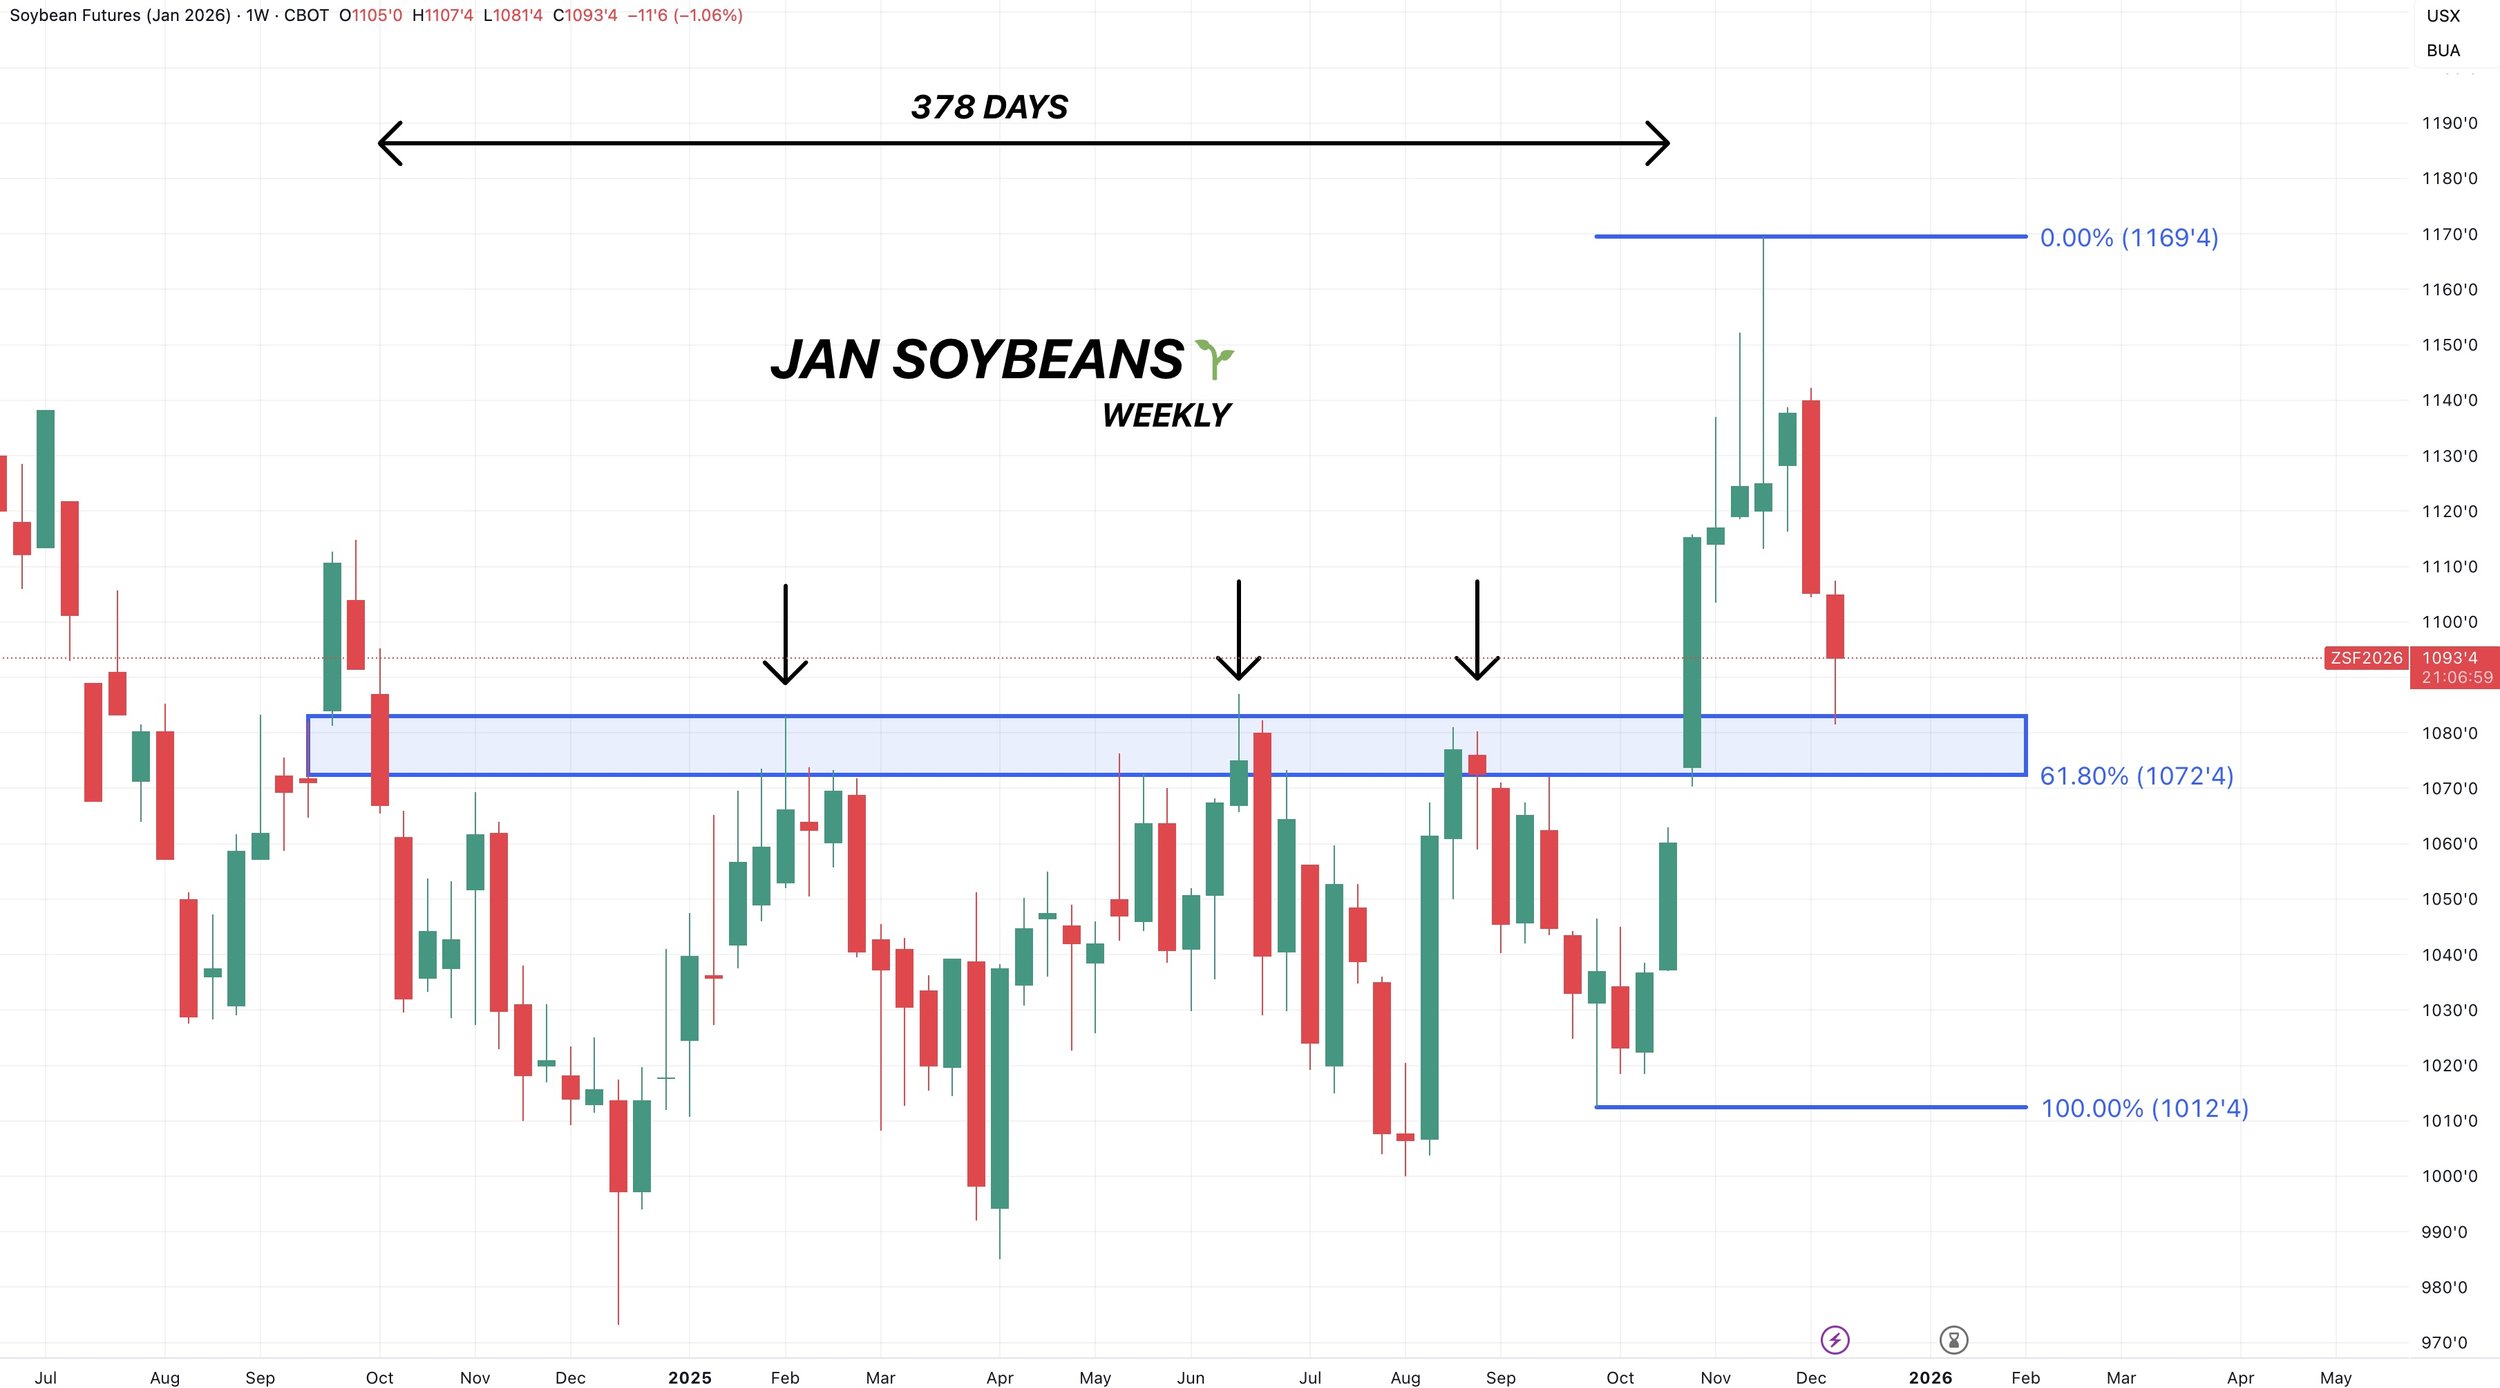
Here is the weekly chart.
We clearly broke out of that brutal range we were trapped in for over a year.
When you break out of a range, it is extremely common to back test the point of breakout.
It was resistance for over a year on several separate occasions.
We are now coming down to test it as support.
We do not want to fall back into that range, as that would be viewed as a failed breakout.
The golden fib (61.8%) sits there as well.
So breaking below that would tell us we are probably in for more downside.
But for now, bouncing in this area makes perfect sense.
Wheat
Like soybeans, just going to be going over the charts today as there really isn’t anything new fundamentally since the USDA report.
We are also at some pretty key levels on the chart.
The wheat market is digesting the news from the USDA.
They confirmed that the wheat crops around the world are getting bigger, and there is no concern globally surrounding wheat.
So the wheat market still lacks a catalyst.
Seeing those production increases in several countries does make you think the wheat market could continue to struggle for some time. So there is no reason to get super bullish, but I find it hard to get overly bearish at these levels.
Simply waiting for an opportunity. Which in the wheat market seems to only come a handful of times a year.
Technicals:
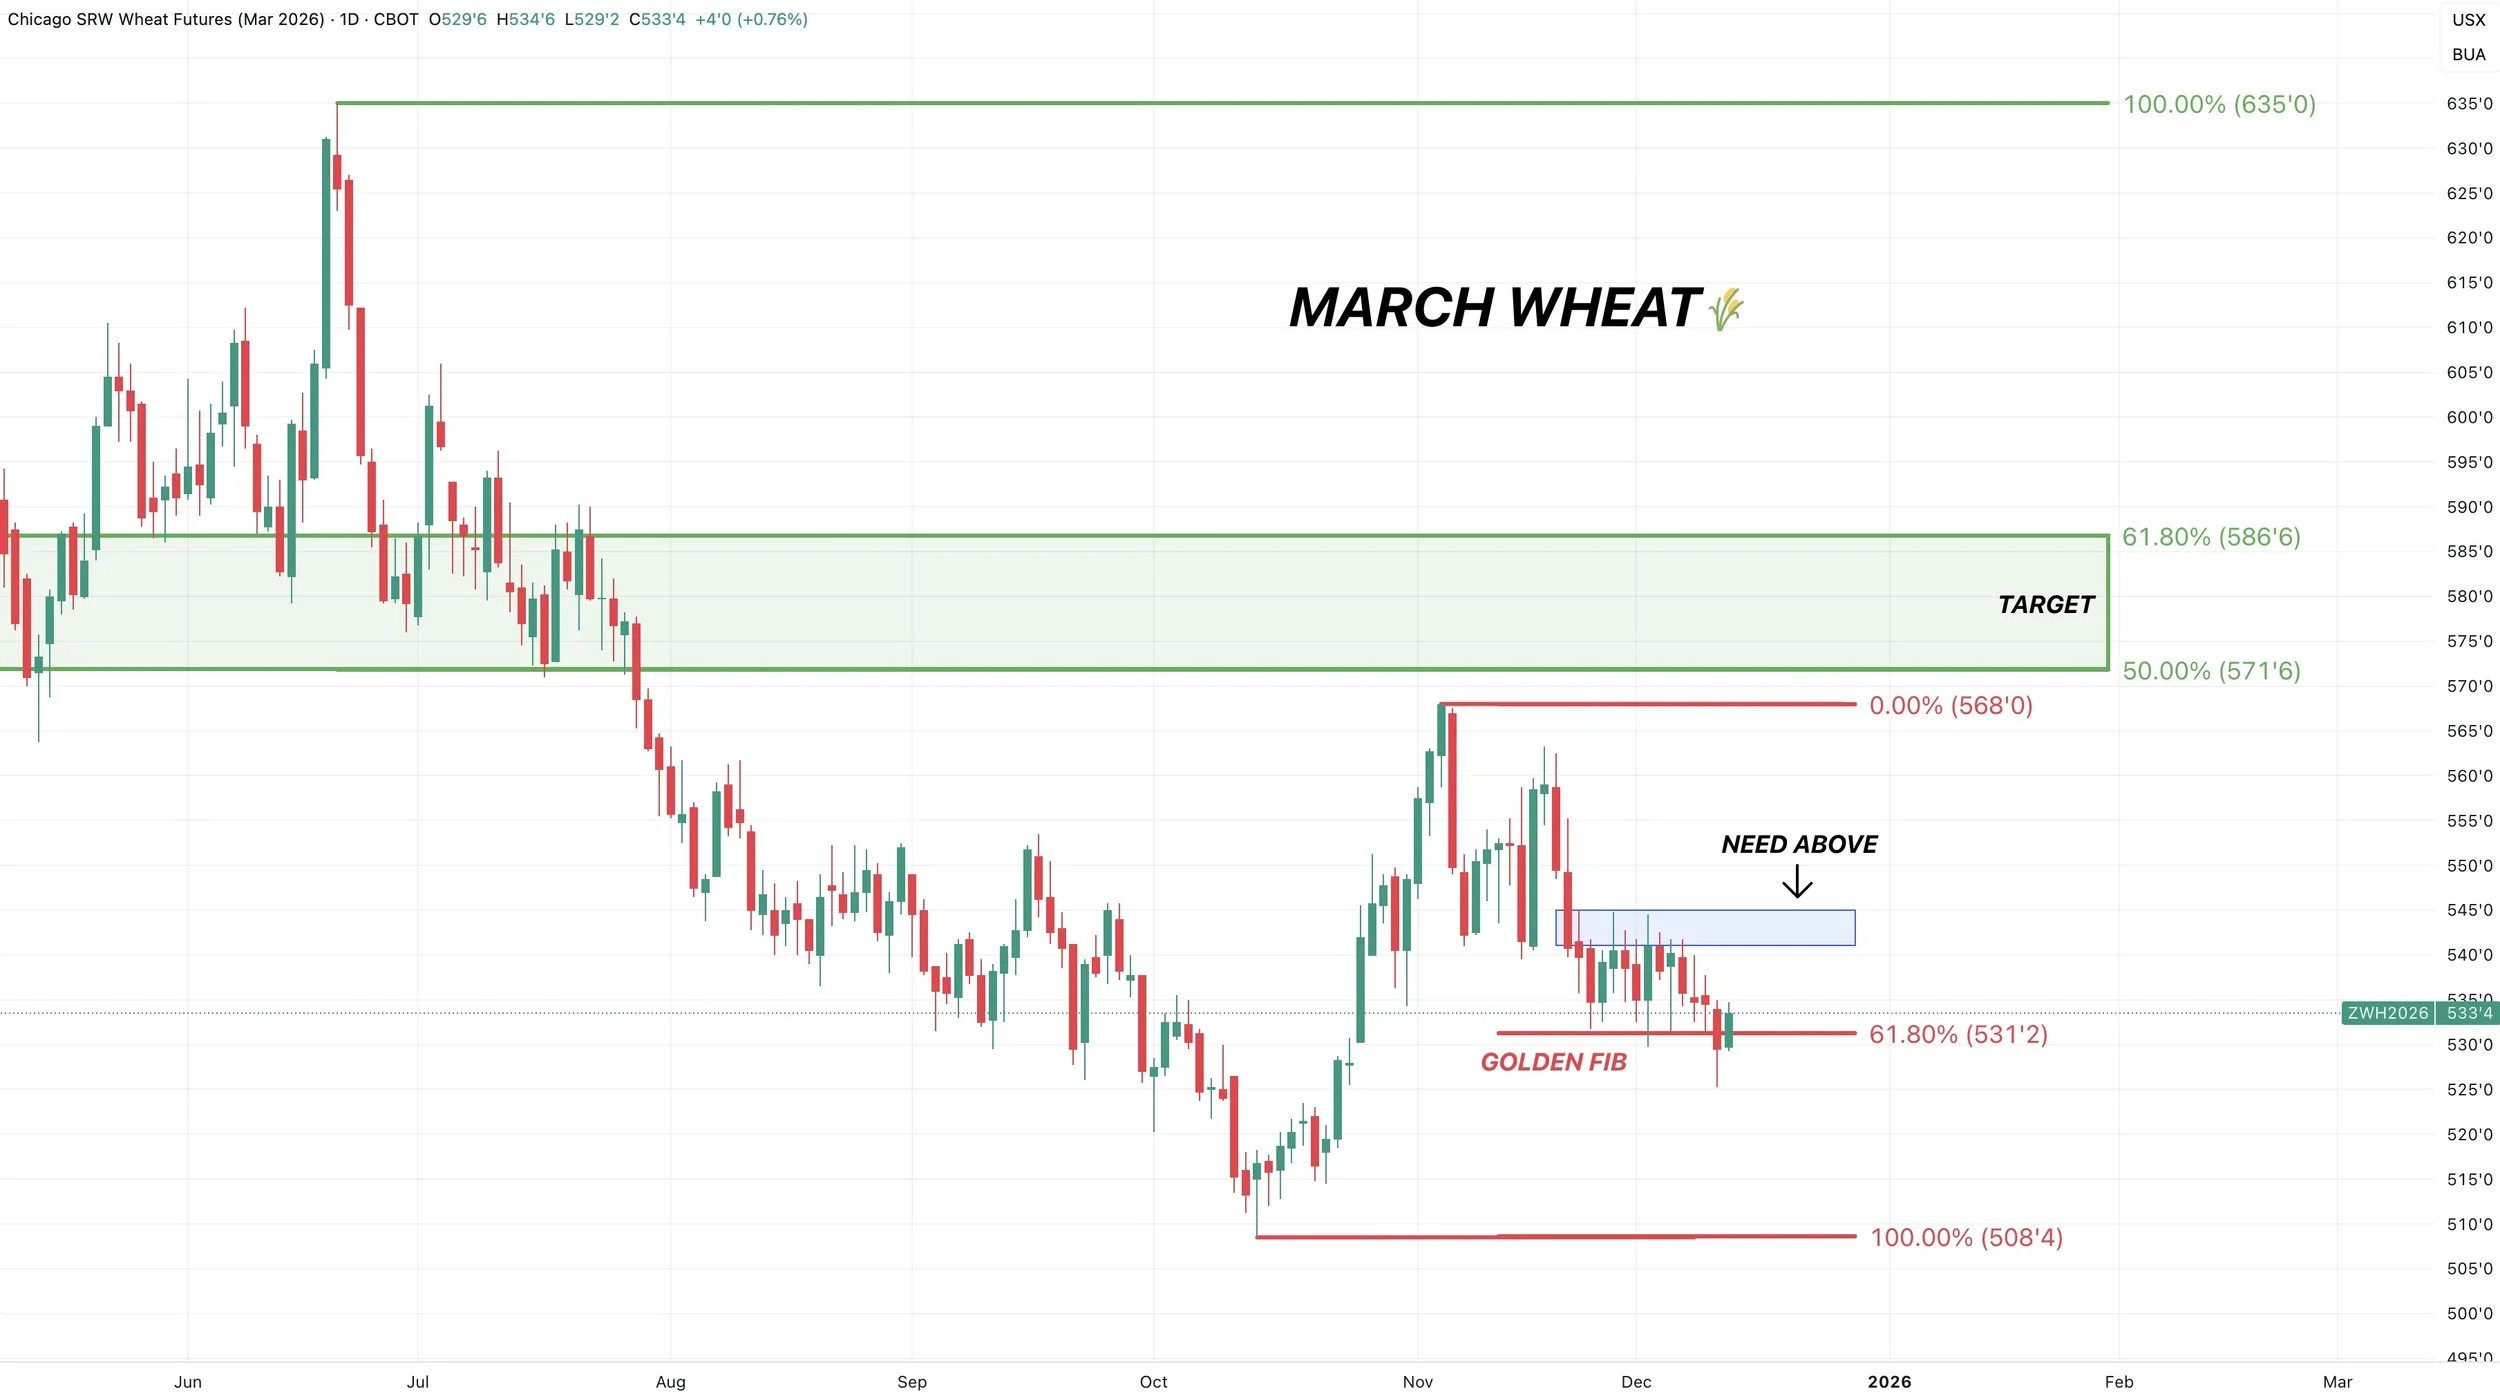
March Wheat
We are sitting right at the golden fib.
61.8% of the entire rally.
This is a must hold spot.
If we fail here, we could easily revist those contract lows.
If we bounce here, this sell off is still viewed as a normal correction and we are still in an uptrend.
Dec KC Wheat
Exact same story for KC.
Sitting right at the golden fib.
Absolutely a must hold spot. As a break below opens the door lower.

Cattle
Like I mentioned, today we did issue another sell signal and hedge alert for the cattle market.
This comes after that hedge alert we issued on Friday.
Why the signal?
Let's jump into the charts.
Technicals:
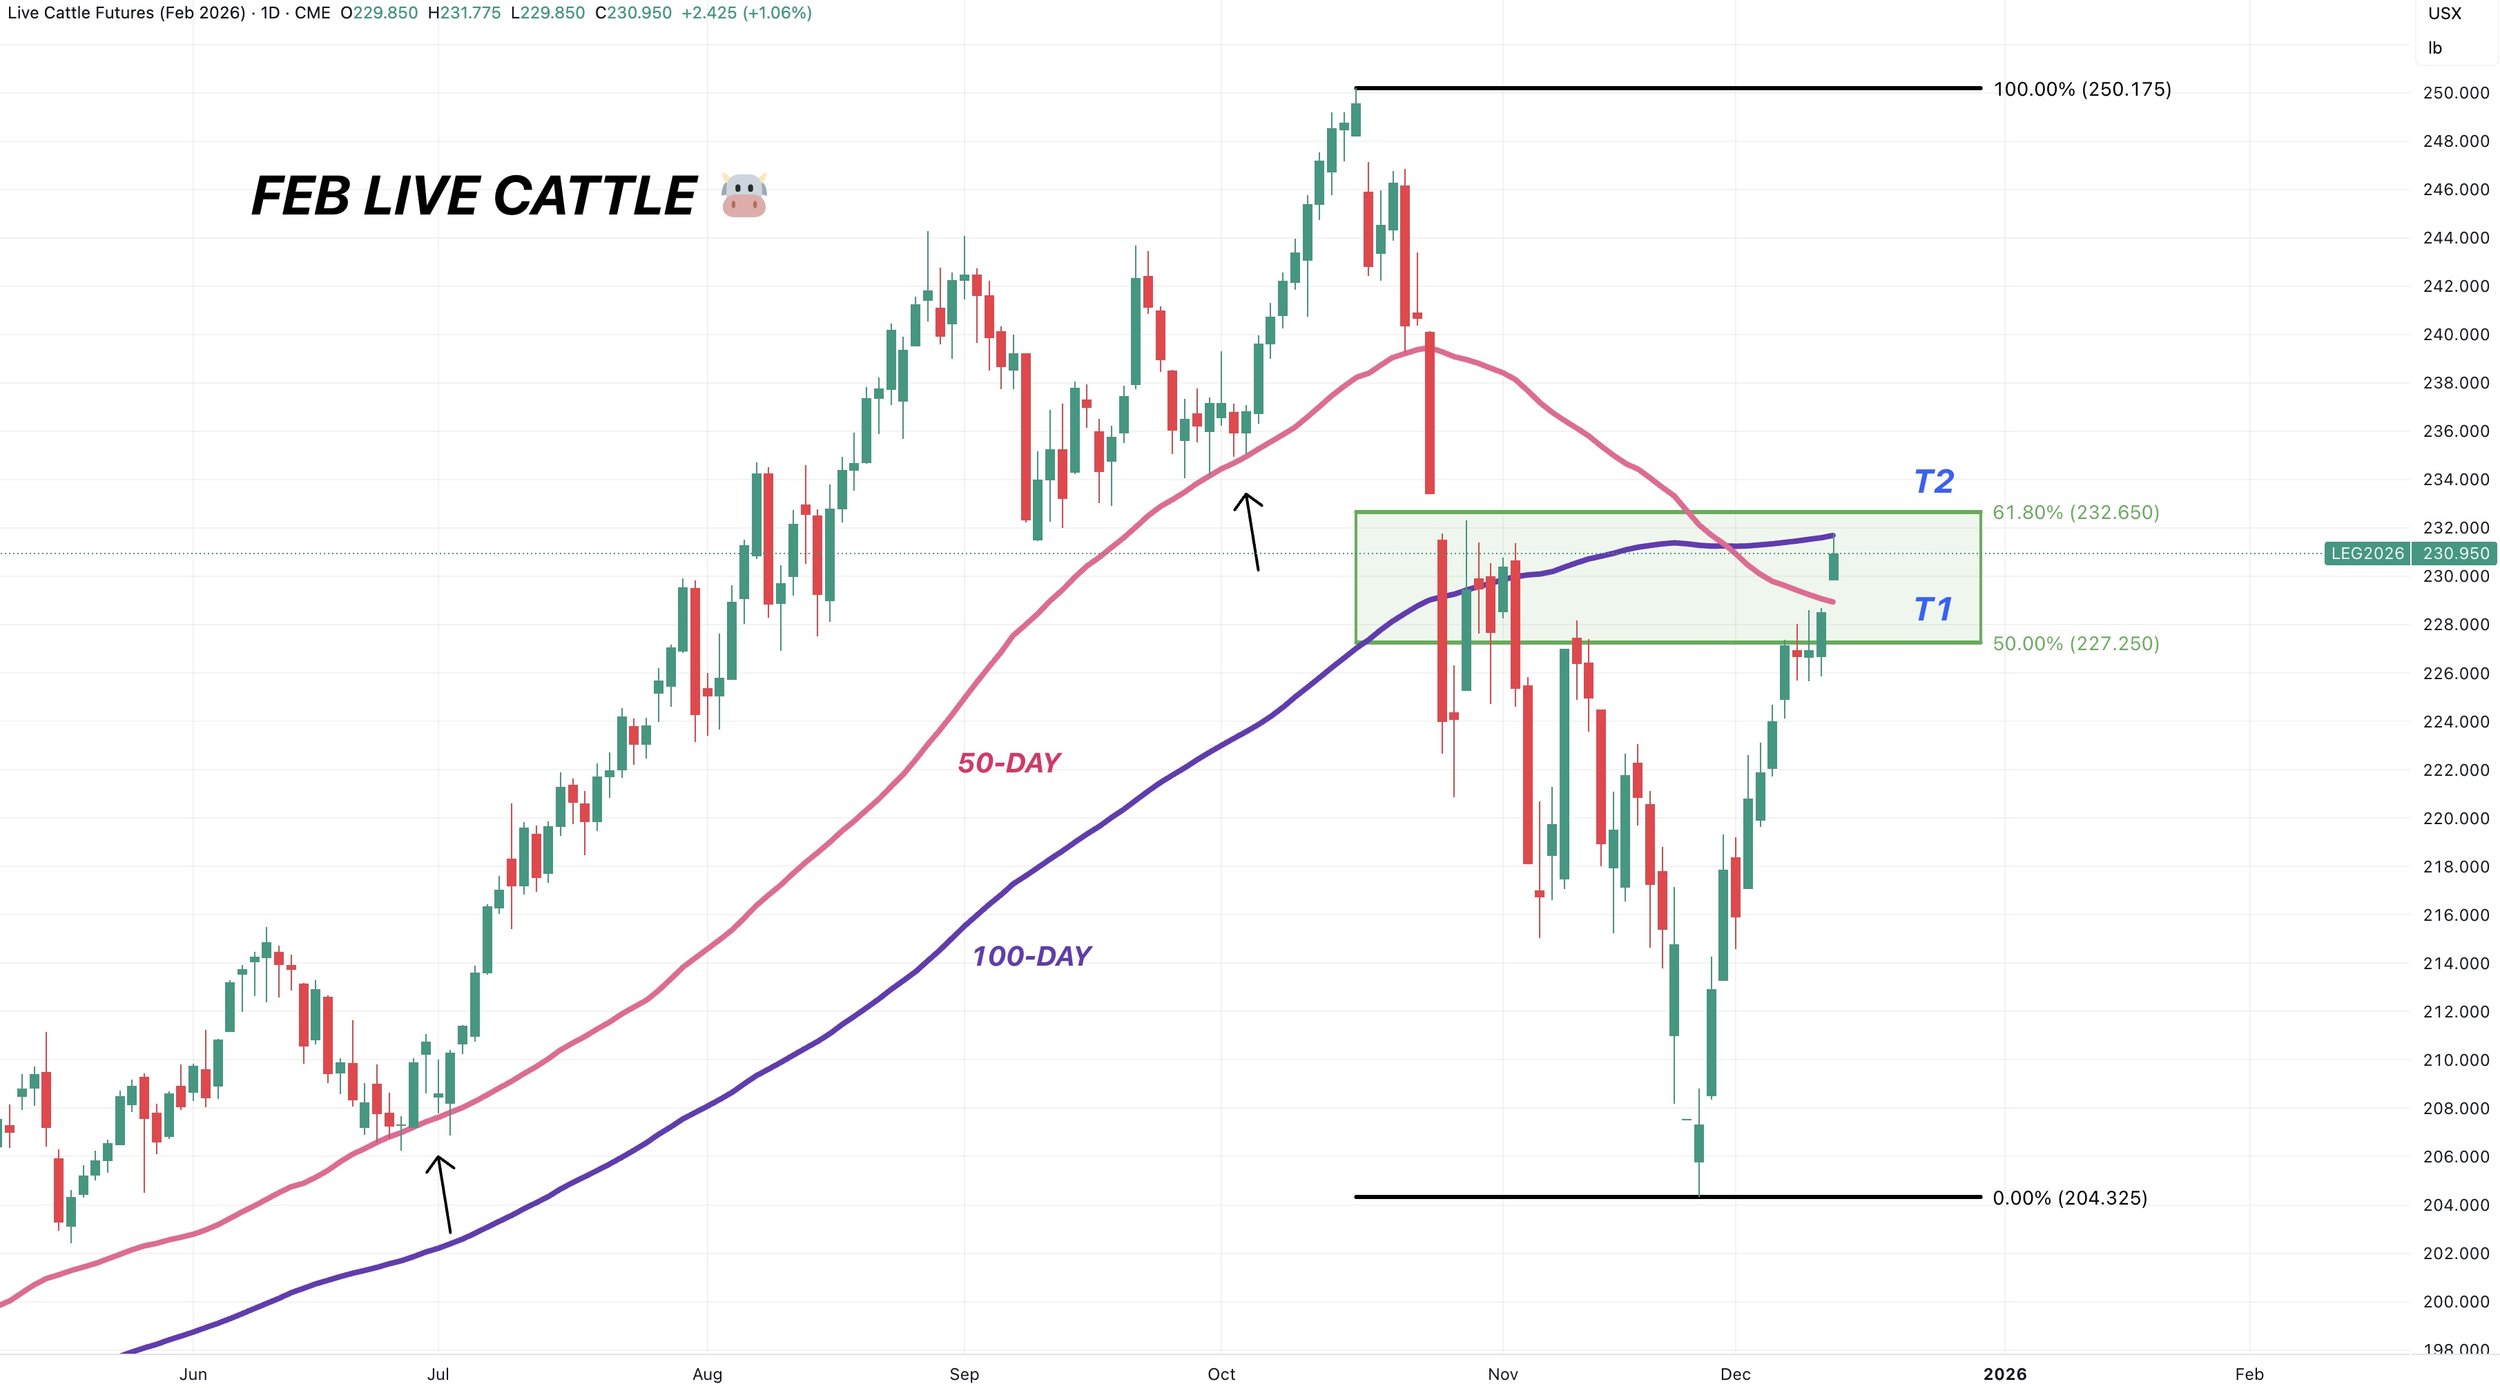
Feb Live
Live cattle is approaching our 2nd target.
Which claws back 61.8% of the sell off.
That is the most common spot where a corrective bounce will fail before heading lower.
We are also right up against the 100-day MA.
We issued the alert on Friday because we reclaimed 50% of the sell off and were approaching the 50-day MA.
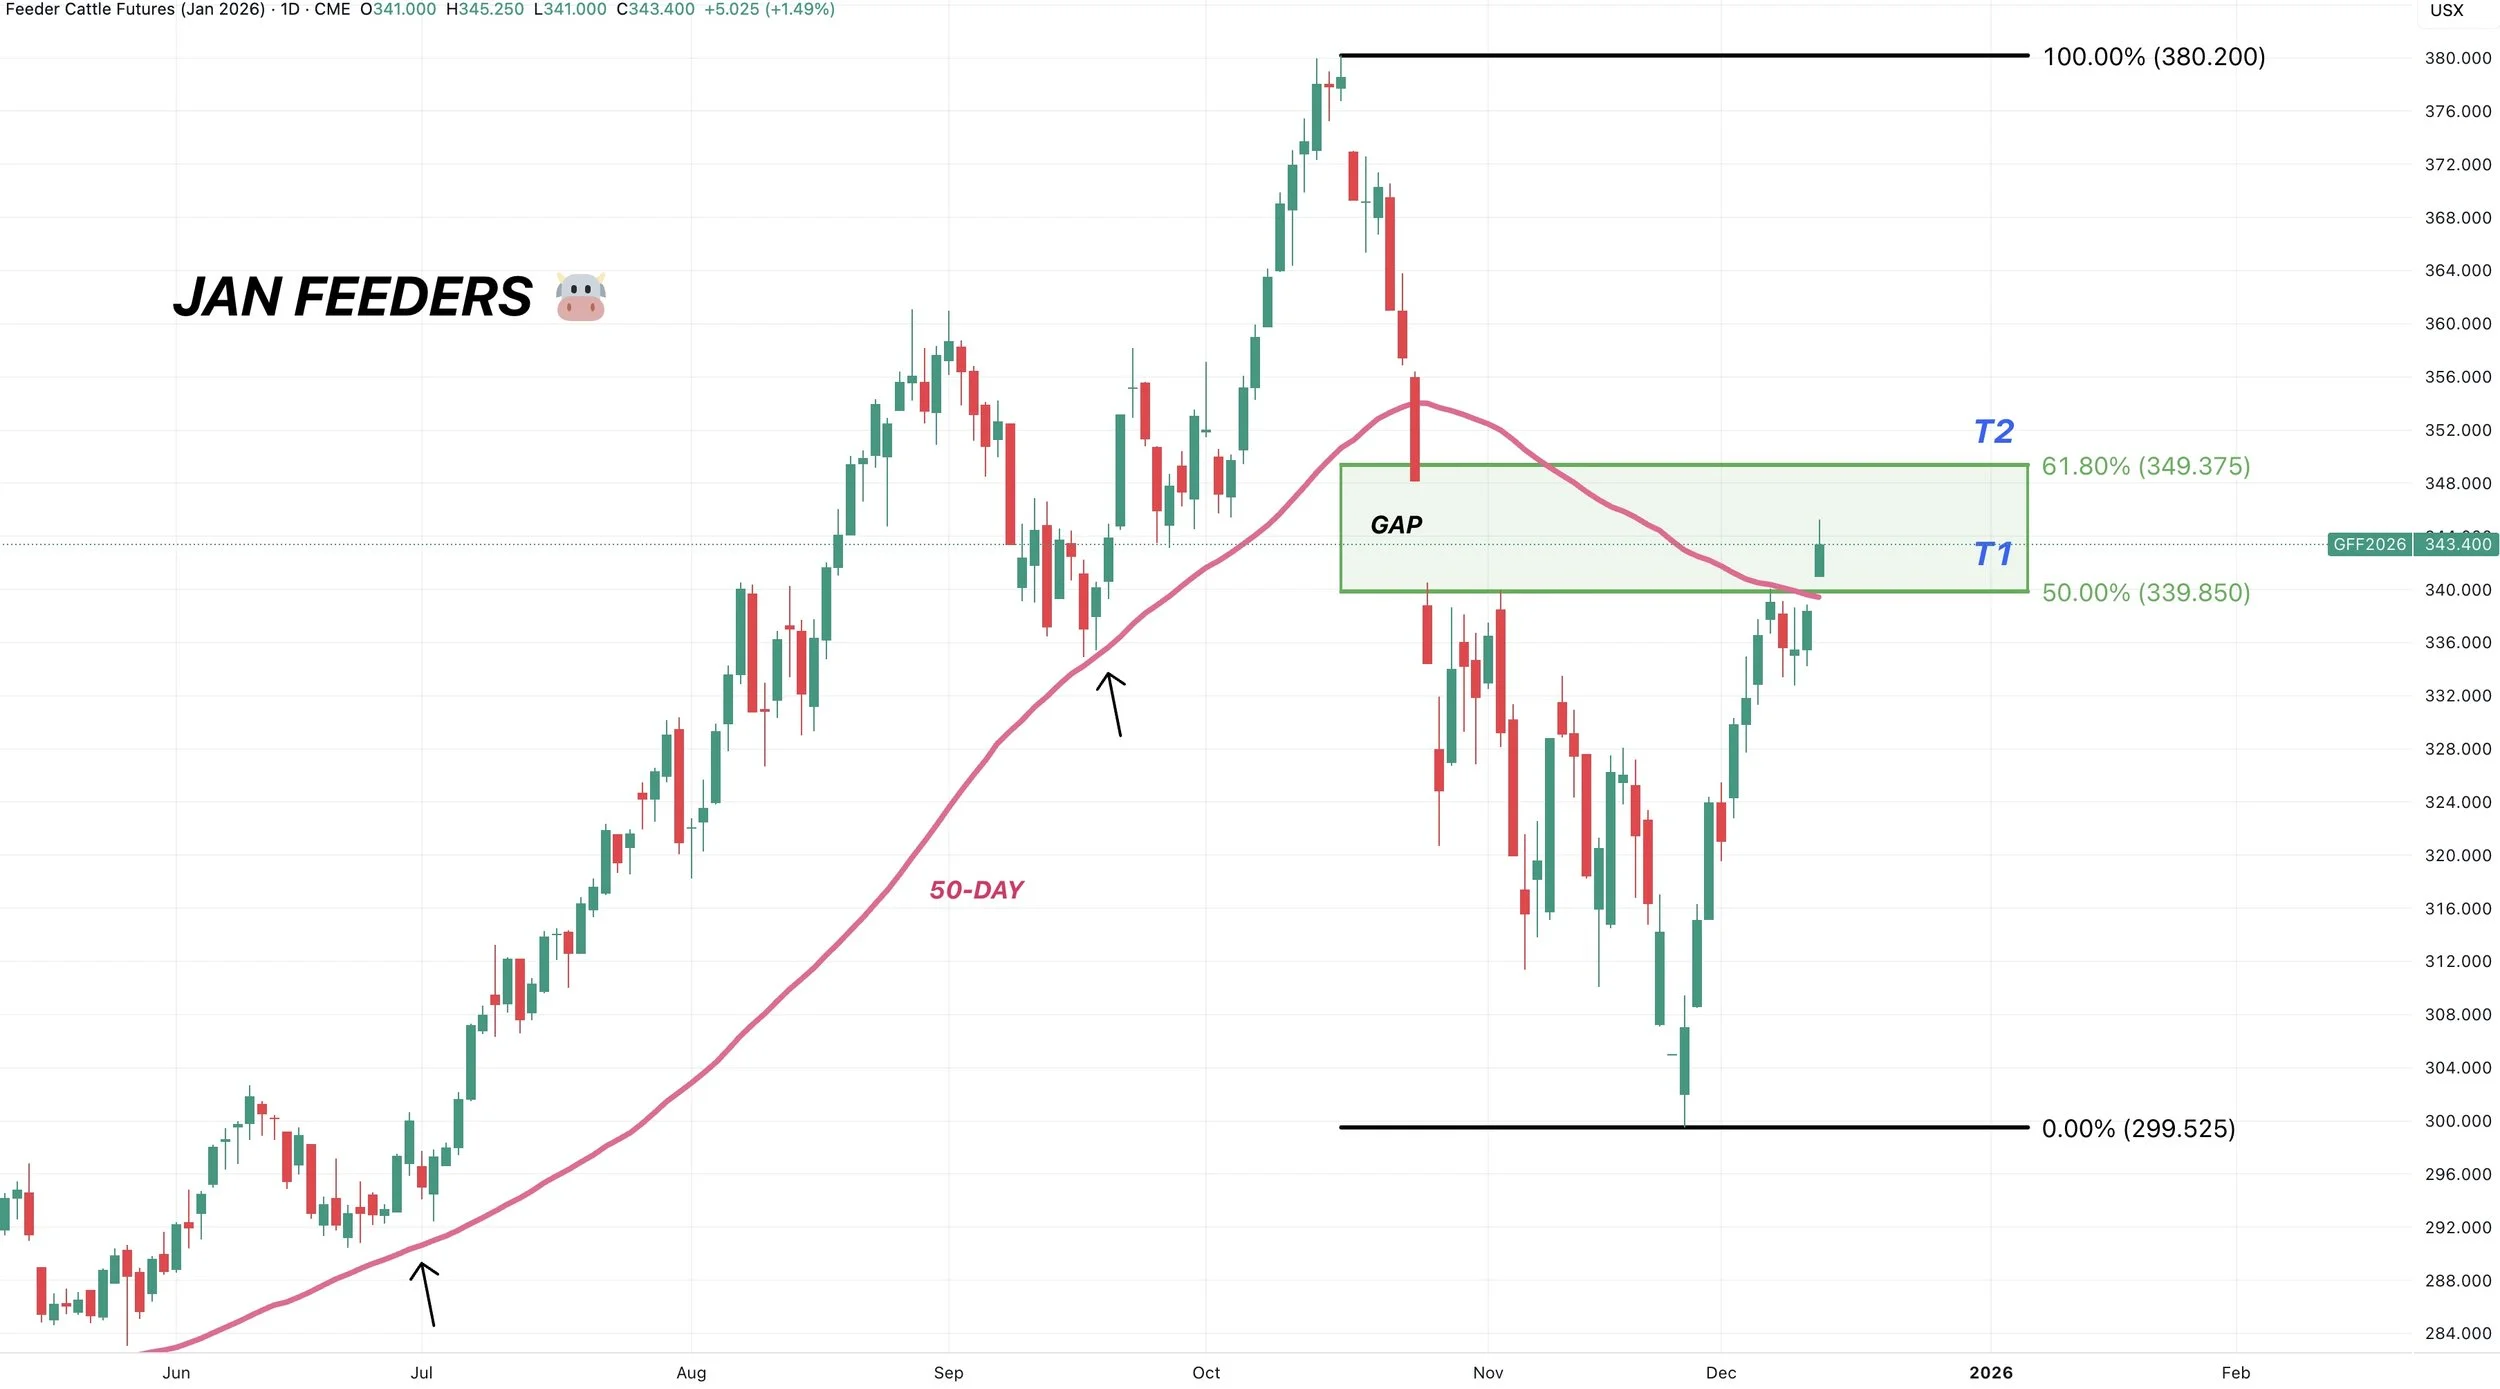
Jan Feeders
Feeders aren’t quite as close to hitting the 61.8% level as live cattle is.
But since we are approaching the target in live cattle, the signal is for feeder cattle as well.
Regardless, this green box is where the market makes a decision and tells us if this is simply a relief bounce before heading lower.
As relief bounces usually claw back 50-61.8% before failing.
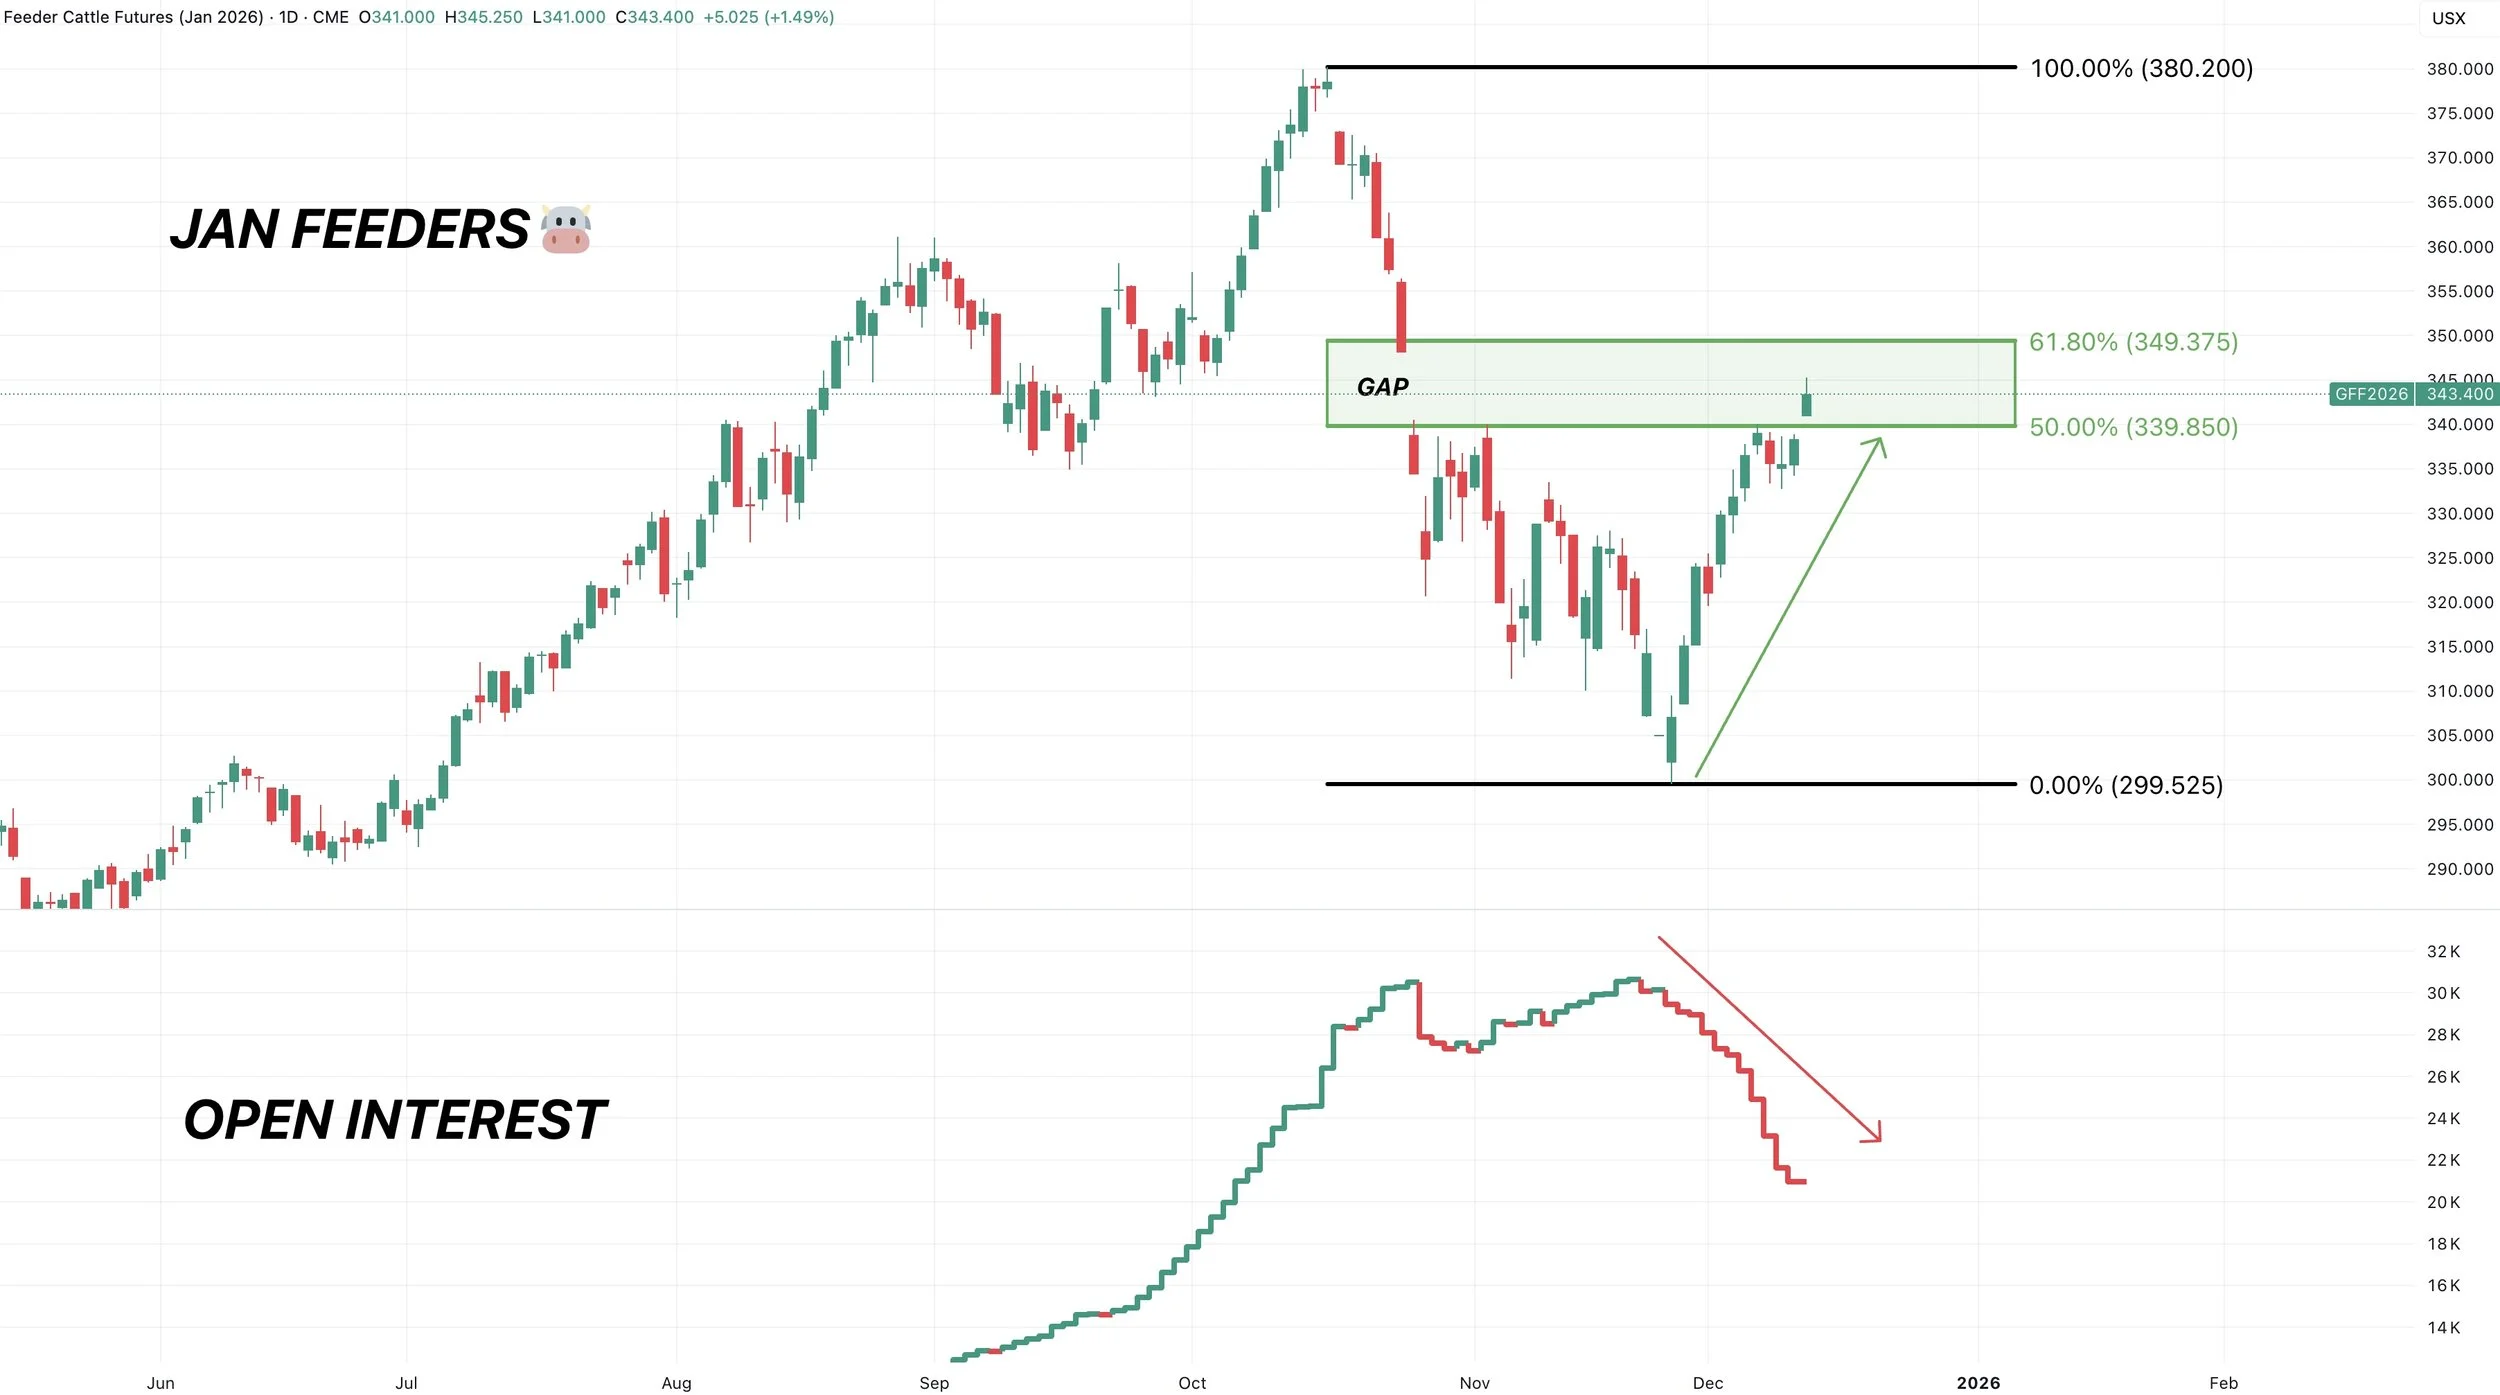
Open Interest
This is something that has me pretty cautious of up here as well.
On the bottom is open interest for Jan feeders.
It's been decreasing this entire rally.
Which means this is a short covering rally.
Meaning shorts are exiting the market, but this rally isn’t fresh longs stepping up and buying into this market.
This usually isn’t something you see if a market is going to go ahead and post new highs.
Past Sell or Protection Signals
Dec 11th: 🐮
Cattle sell signal & hedge alert.
Dec 5th: 🐮
Cattle sell signal & hedge alert.
Nov 17th: 🌱
Soybean sell signal & hedge alert.
Nov 13th: 🌽 🌱
Managing risk in corn & beans ahead of USDA report.
Oct 28th: 🌽
Corn sell signal & hedge alert.
Oct 27th: 🌱
Soybean sell signal & hedge alert.
Oct 13th: 🐮
Cattle sell signal & hedge alert.
Aug 22nd: 🌱
Soybean sell signal & hedge alert.
July 31st: 🐮
Cattle sell signal & hedge alert.
July 10th: 🐮
Cattle sell signal & hedge alert.
CLICK HERE TO VIEW
June 5th: 🐮
Cattle sell signal & hedge alert.
June 2nd: 🌾
MPLS wheat sell signal.
April 10th: 🌽
Old crop corn sell signal.
March 19th: 🐮
Cattle hedge & sell signal.
Feb 18th: 🌽 🌾
Old crop KC wheat & old crop corn signal.
Jan 23rd: 🌽 🌱
Corn & beans old crop sell signal.
CLICK HERE TO VIEW
Jan 15th: 🌽 🌱
Corn & beans hedge alert/sell signal.
Jan 2nd: 🐮
Cattle hedge alert at new all-time highs & target.
Dec 11th: 🌽
Corn sell signal at $4.51 200-day MA
CLICK HERE TO VIEW
Oct 2nd: 🌾
Wheat sell signal at $6.12 target
Sep 30th: 🌽
Corn protection signal at $4.23-26
Sep 27th: 🌱
Soybean sell & protection signal at $10.65
Sep 13th: 🌾
Wheat sell signal at $5.98
May 22nd: 🌾
Wheat sell signal when wheat traded +$7.00
Want to Talk?
Our phones are open 24/7 for you guys if you ever need anything or want to discuss your operation.
Hedge Account
Interested in a hedge account? Use the link below to set up an account or shoot Jeremey a call at (605)295-3100.