
A LOT RIDING ON USDA & BRAZIL
AUDIO COMMENTARY
Corn & beans bounce off their lows
Corn shipments great, beans poor
How long can strong corn demand continue?
Corn holding key level (chart below)*
Good risk parameter in corn
Beans near the gap (chart below)*
Bullish bean divergence? (chart below)*
Need the funds to get interested
A lot riding on USDA and Brazil weather
Everyone across world increasing crush
What if China buys more than agreed?
Possible zero-cost strategies for upside
Re-own area in soybeans?
EPA news adding pressure
Still like protecting cattle rally
Wheat not looking hot (chart below)*
Defining your marketing timeline
Listen to today’s audio below
Want to talk? (605)250-3863
CHARTS
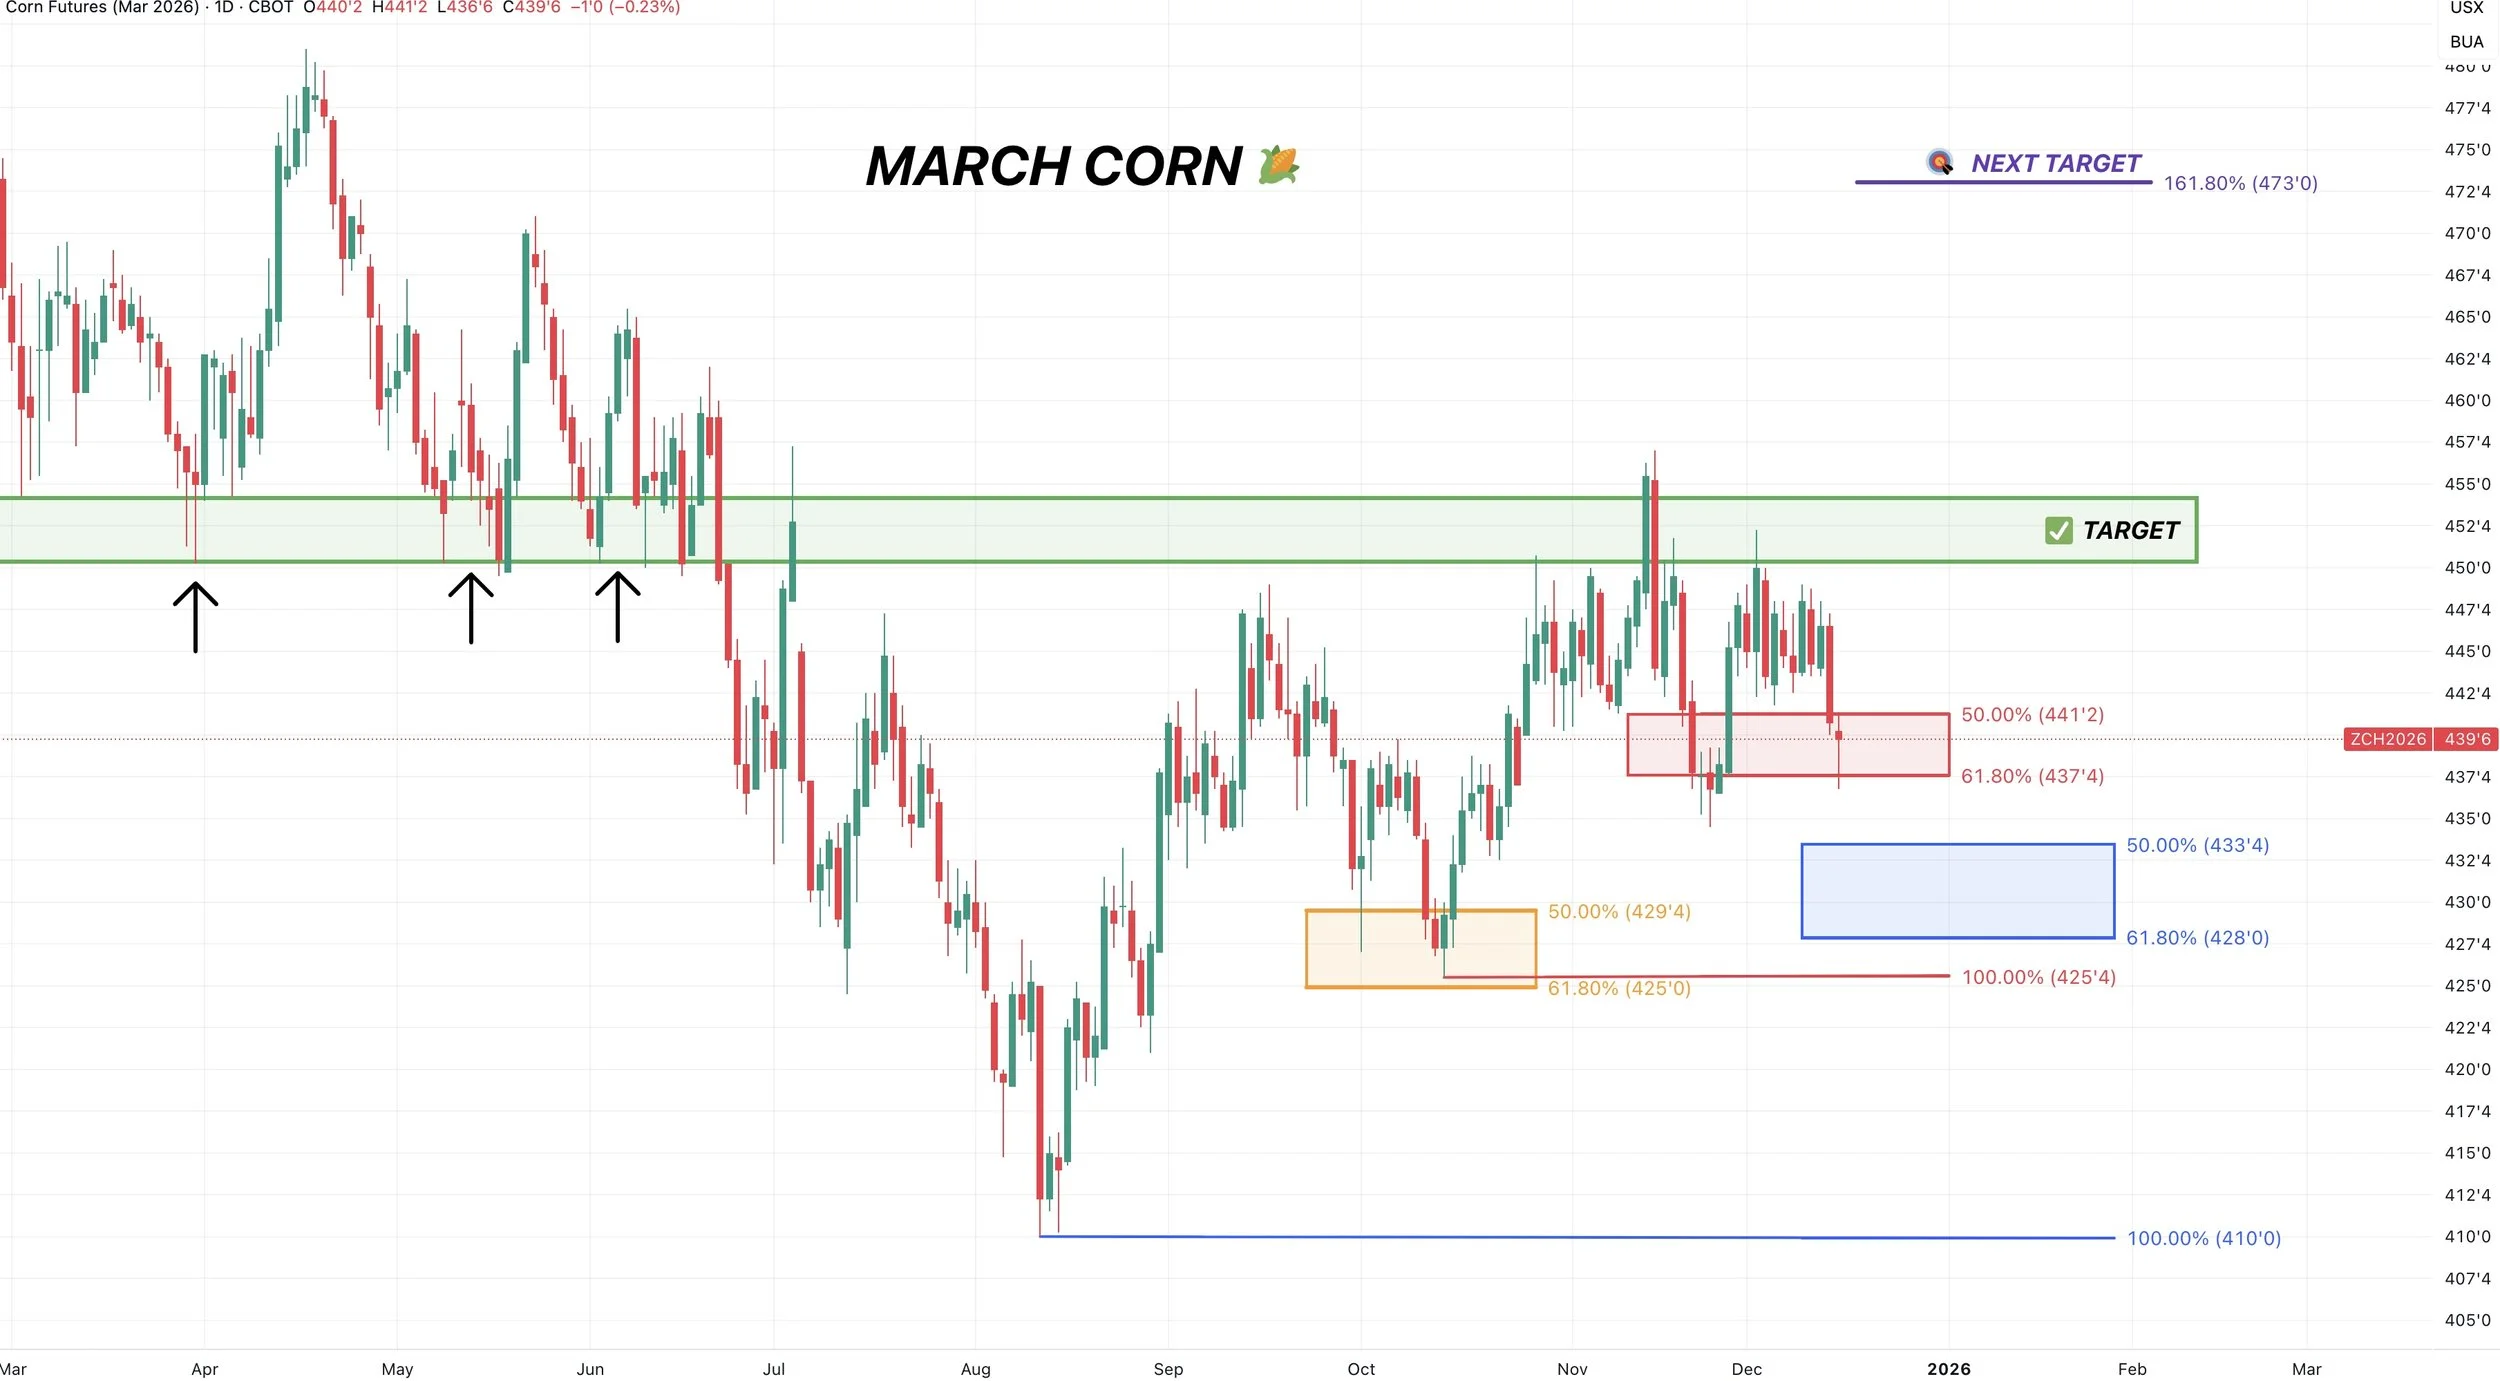
March Corn 🌽
We bounced right where we needed to hold.
Which is those recent lows and the 61.8% level down to those October lows.
Big spot to hold short term. As failure to hold, could bring us down to the blue box.
The blue box is 50-61.8% of the the entire rally from contract lows.
Need above $4.50 to spark more upside. That remains key resistance.
Jan Beans 🌱
Nearly closed the gap today but did not.
Now sitting right at the golden fib. Which gives back 61.8% of the entire rally.
This also happens to be our yearly resistance.
If we are going to be bounce, it needs to be right about here. A bounce here still makes sense.
Failure to hold could result in us dropping to the 78.6% level at $10.46 and could drop us back into the brutal yearly range we were trapped in.
Since we had a sell signal at $11.55, I will share my next target once I am confident we’ve put in a bottom.
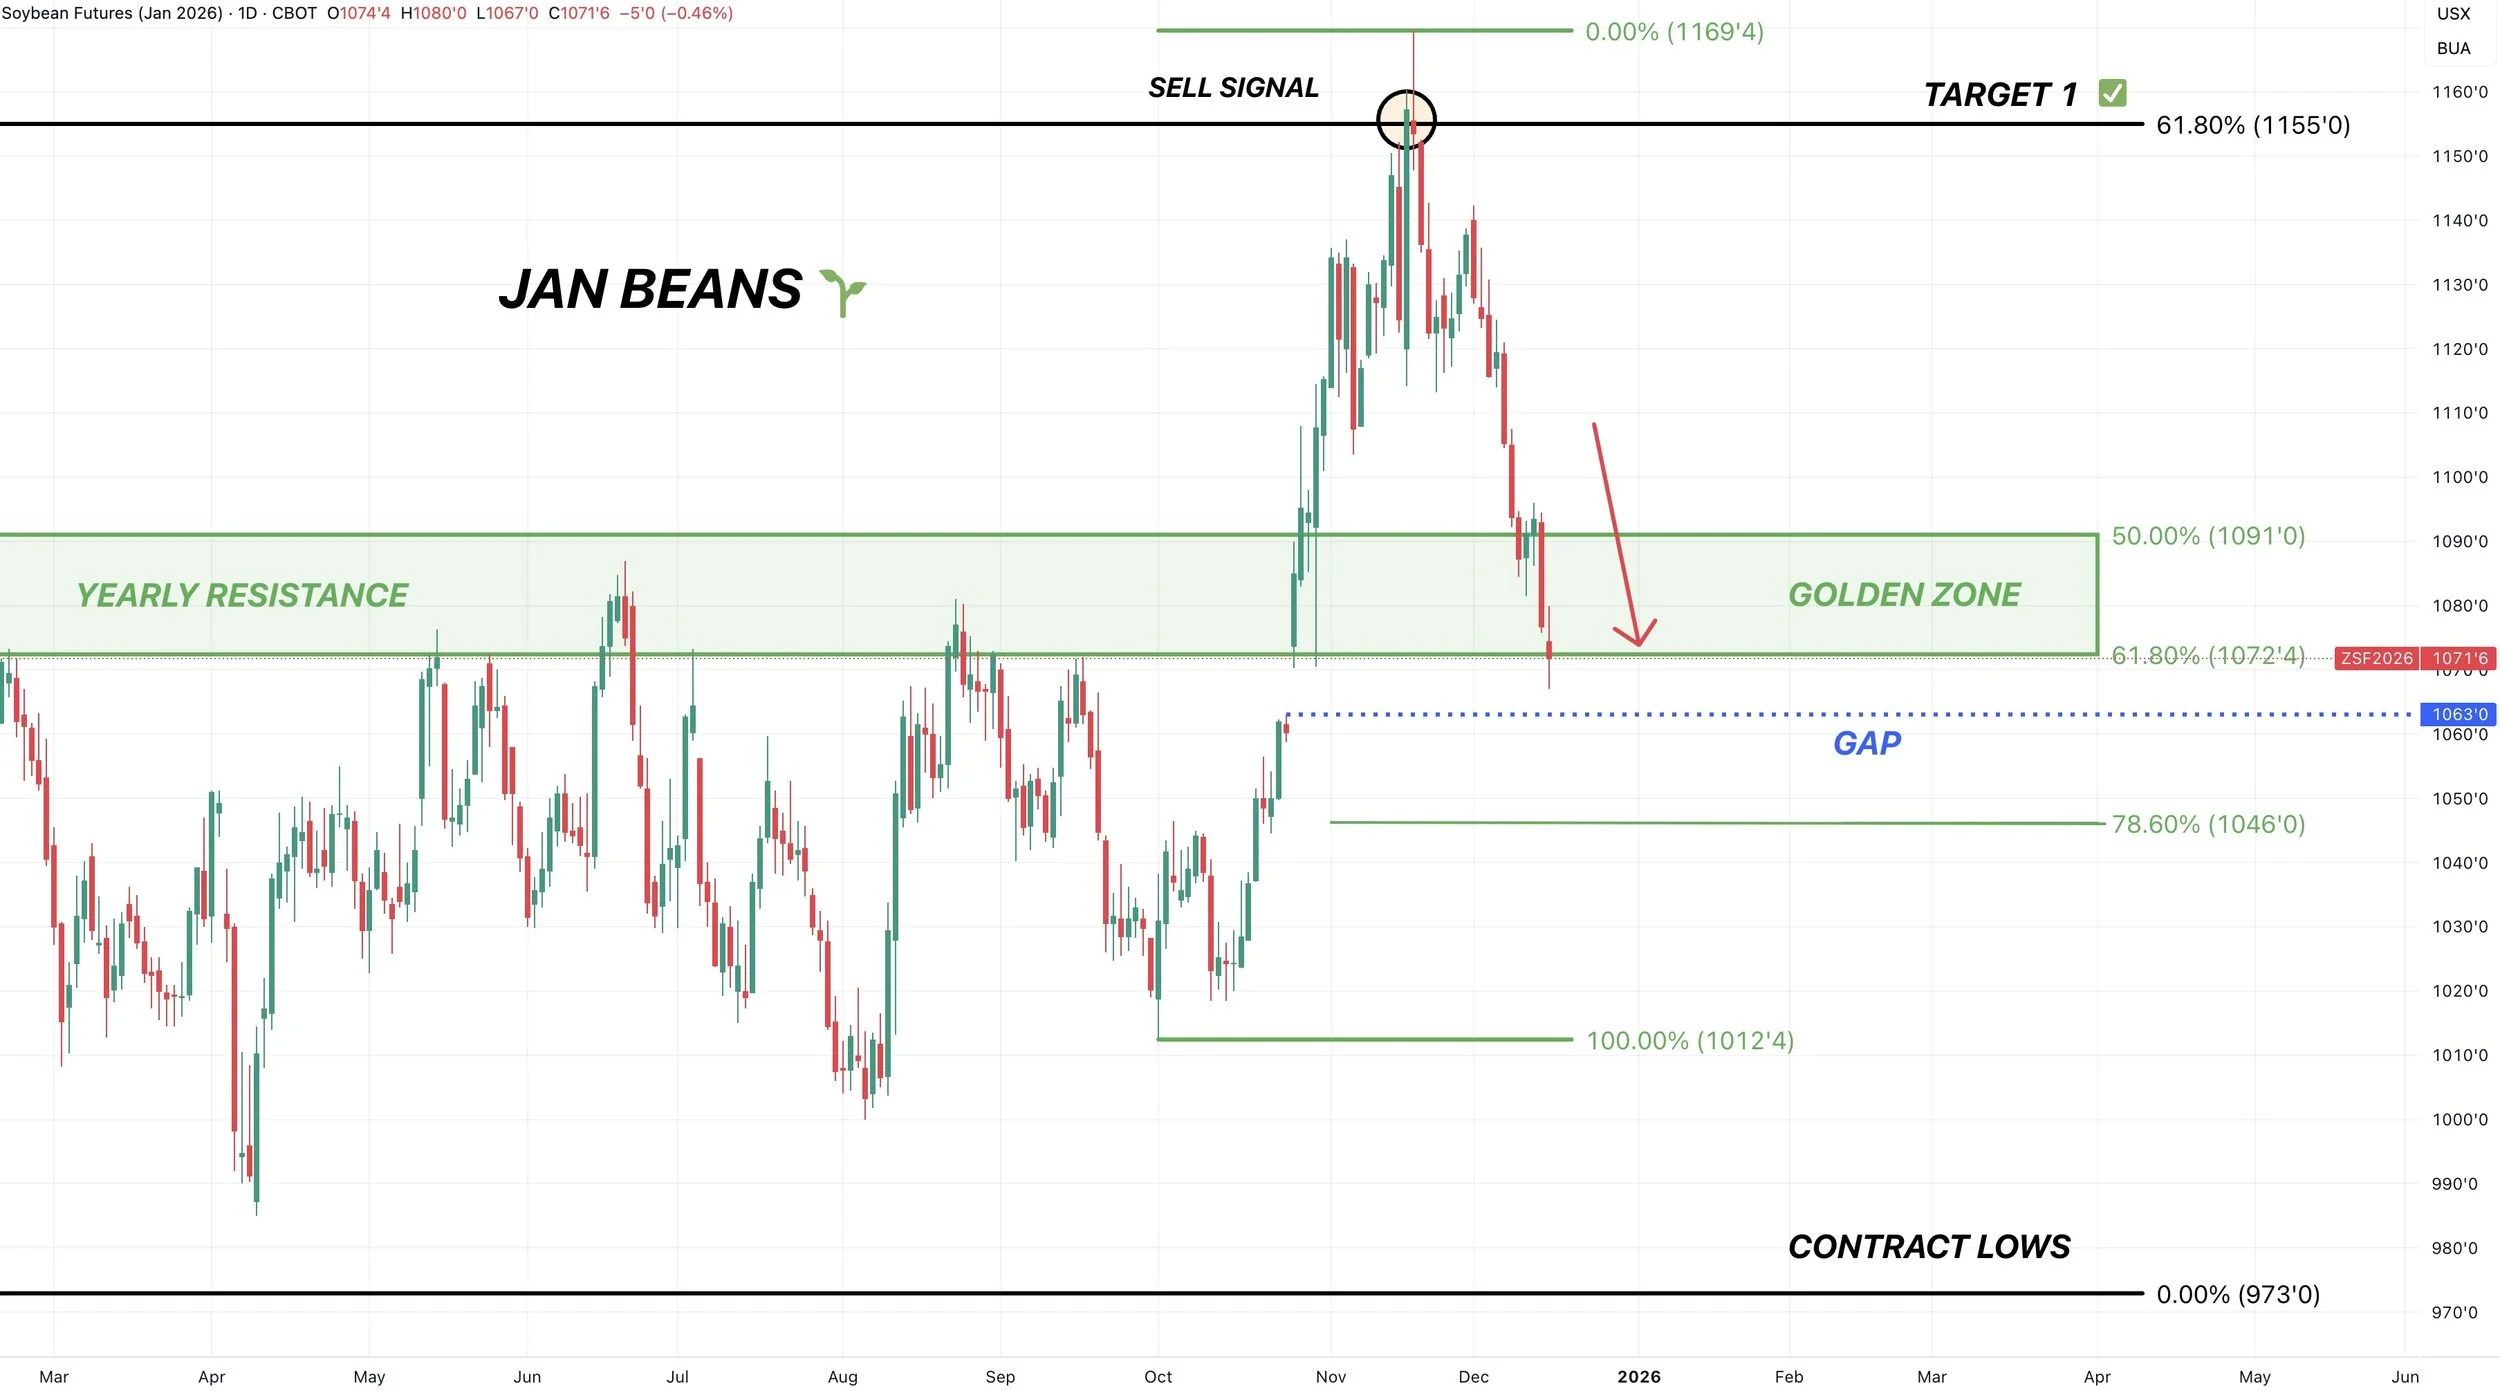
Here is another reason to believe we could possibly find a local bottom here soon.
We are showing potential hidden bullish RSI divergence.
Where the RSI is making lower lows, but prices are clearly higher than where they were the last time the RSI was this low.
Bearish divergence marked those highs. As prices were making higher highs, but the RSI was not.

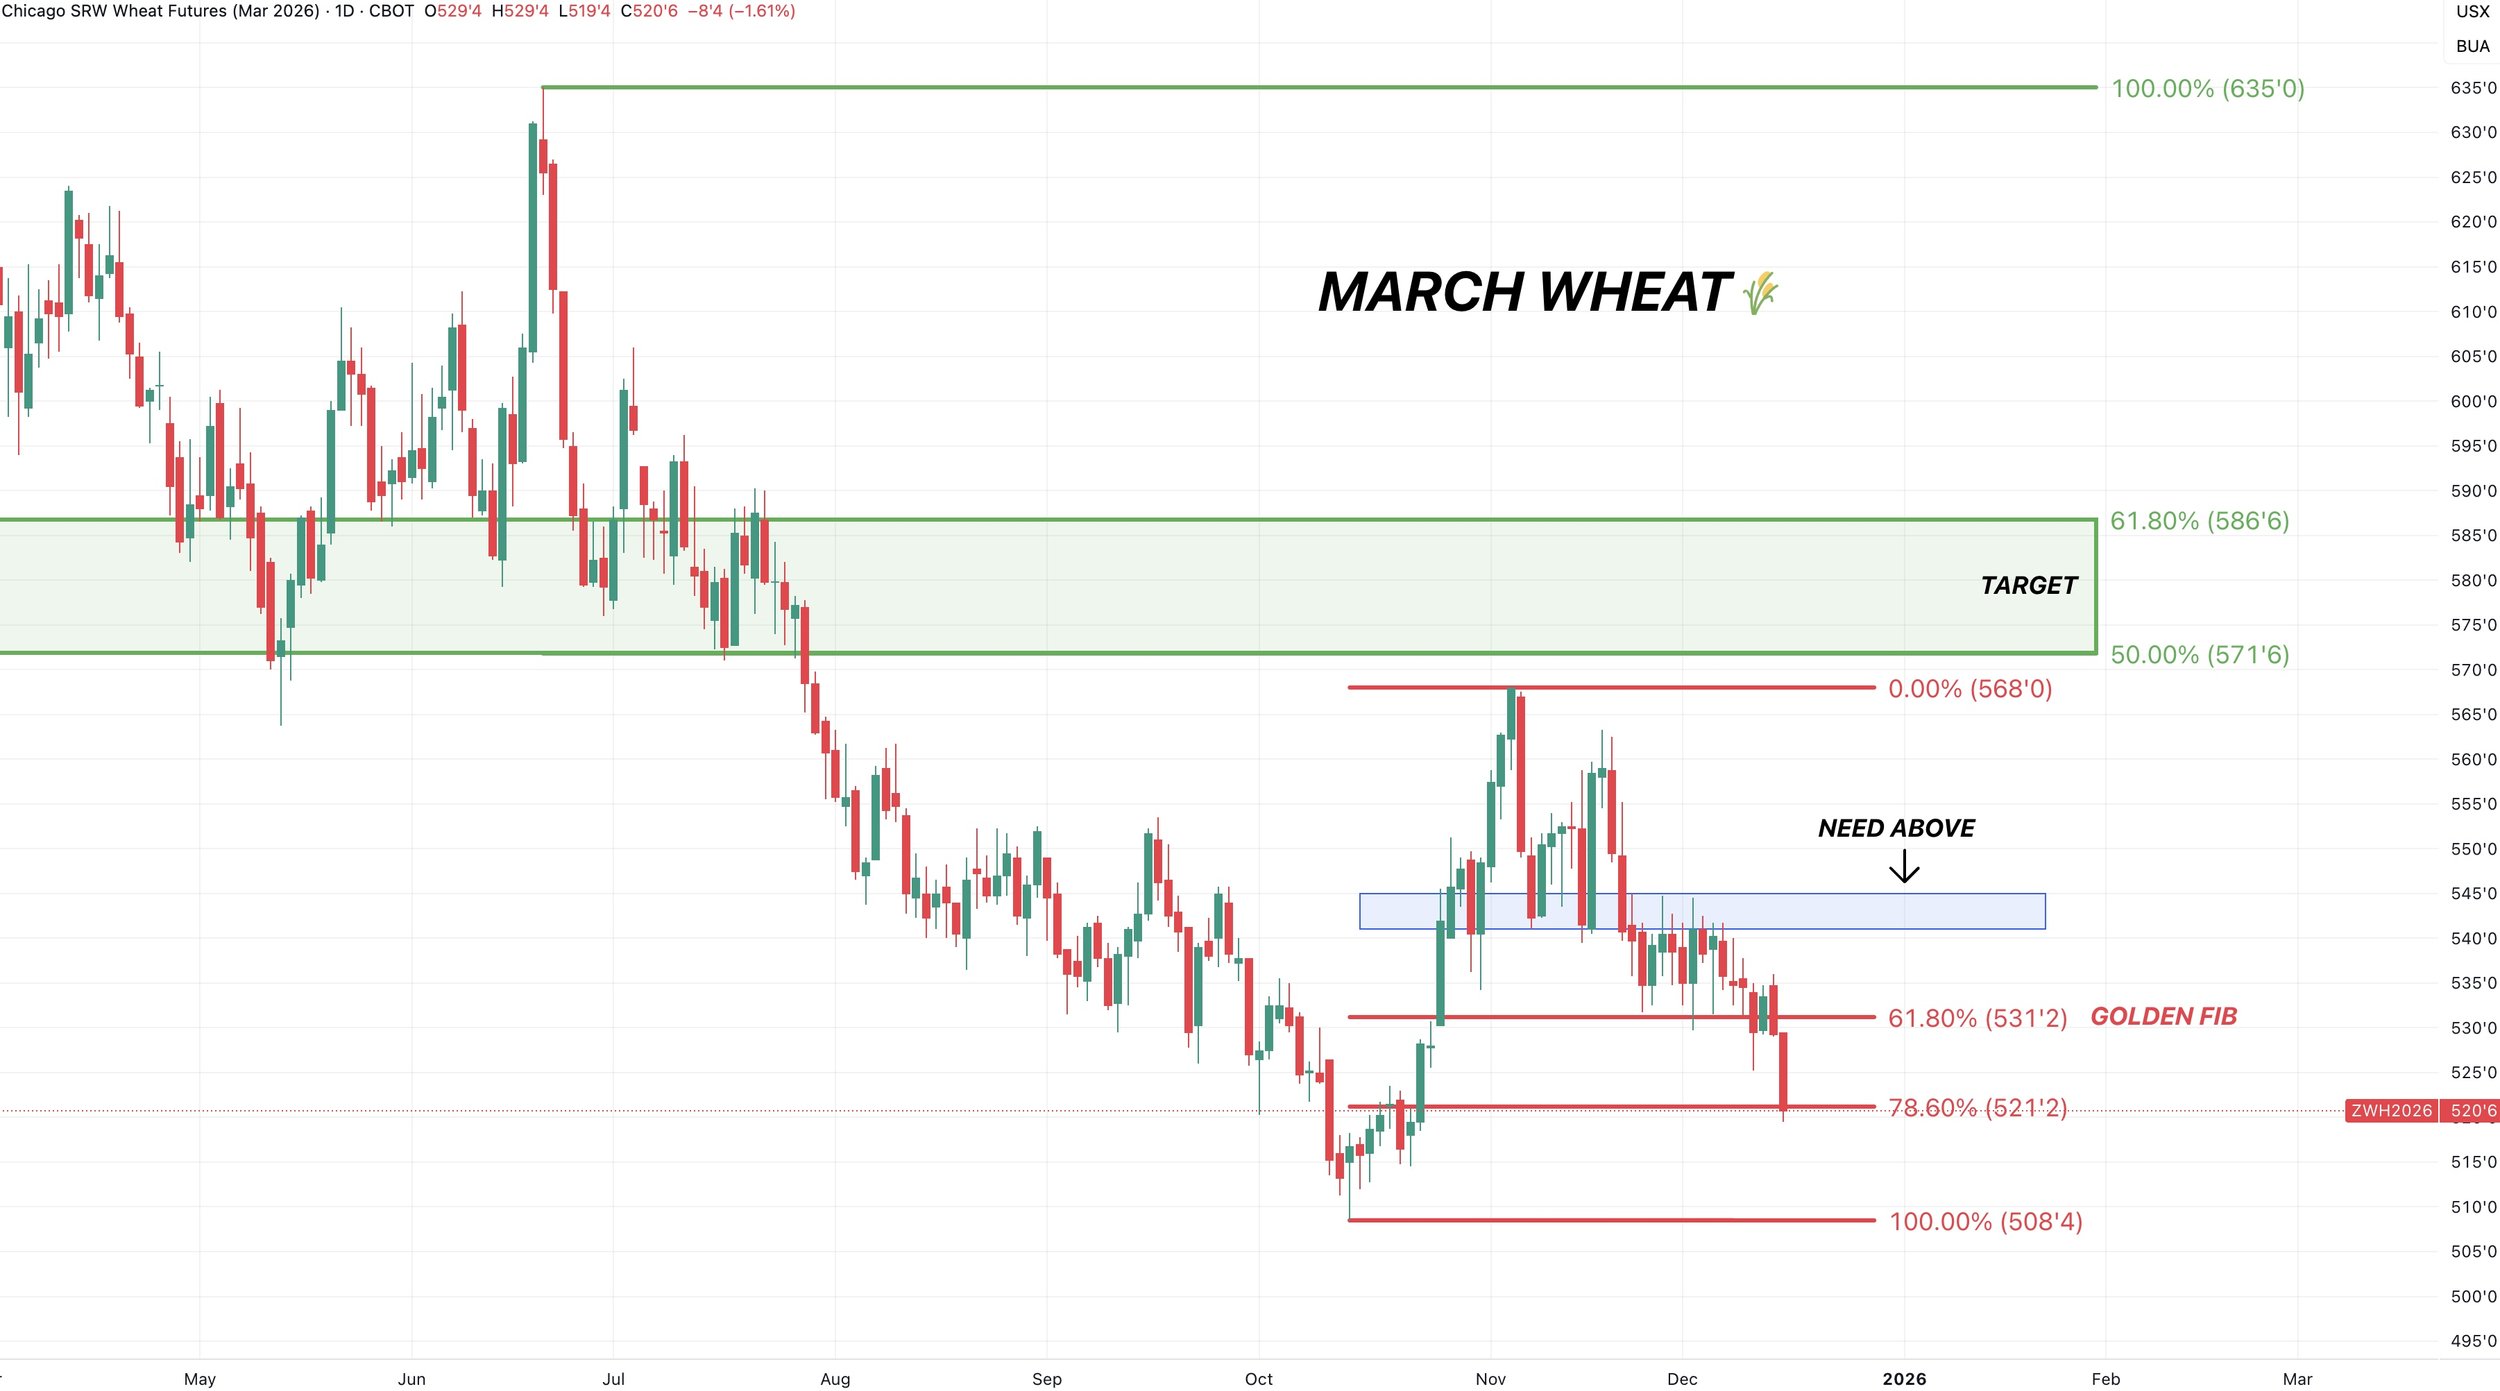
March Wheat 🌾
Not looking to good here.
We broke below the 61.8% level of the contract lows, which was seen as a must hold spot.
The last line of defense we have is the 78.6% level. Otherwise it’s those contract lows.
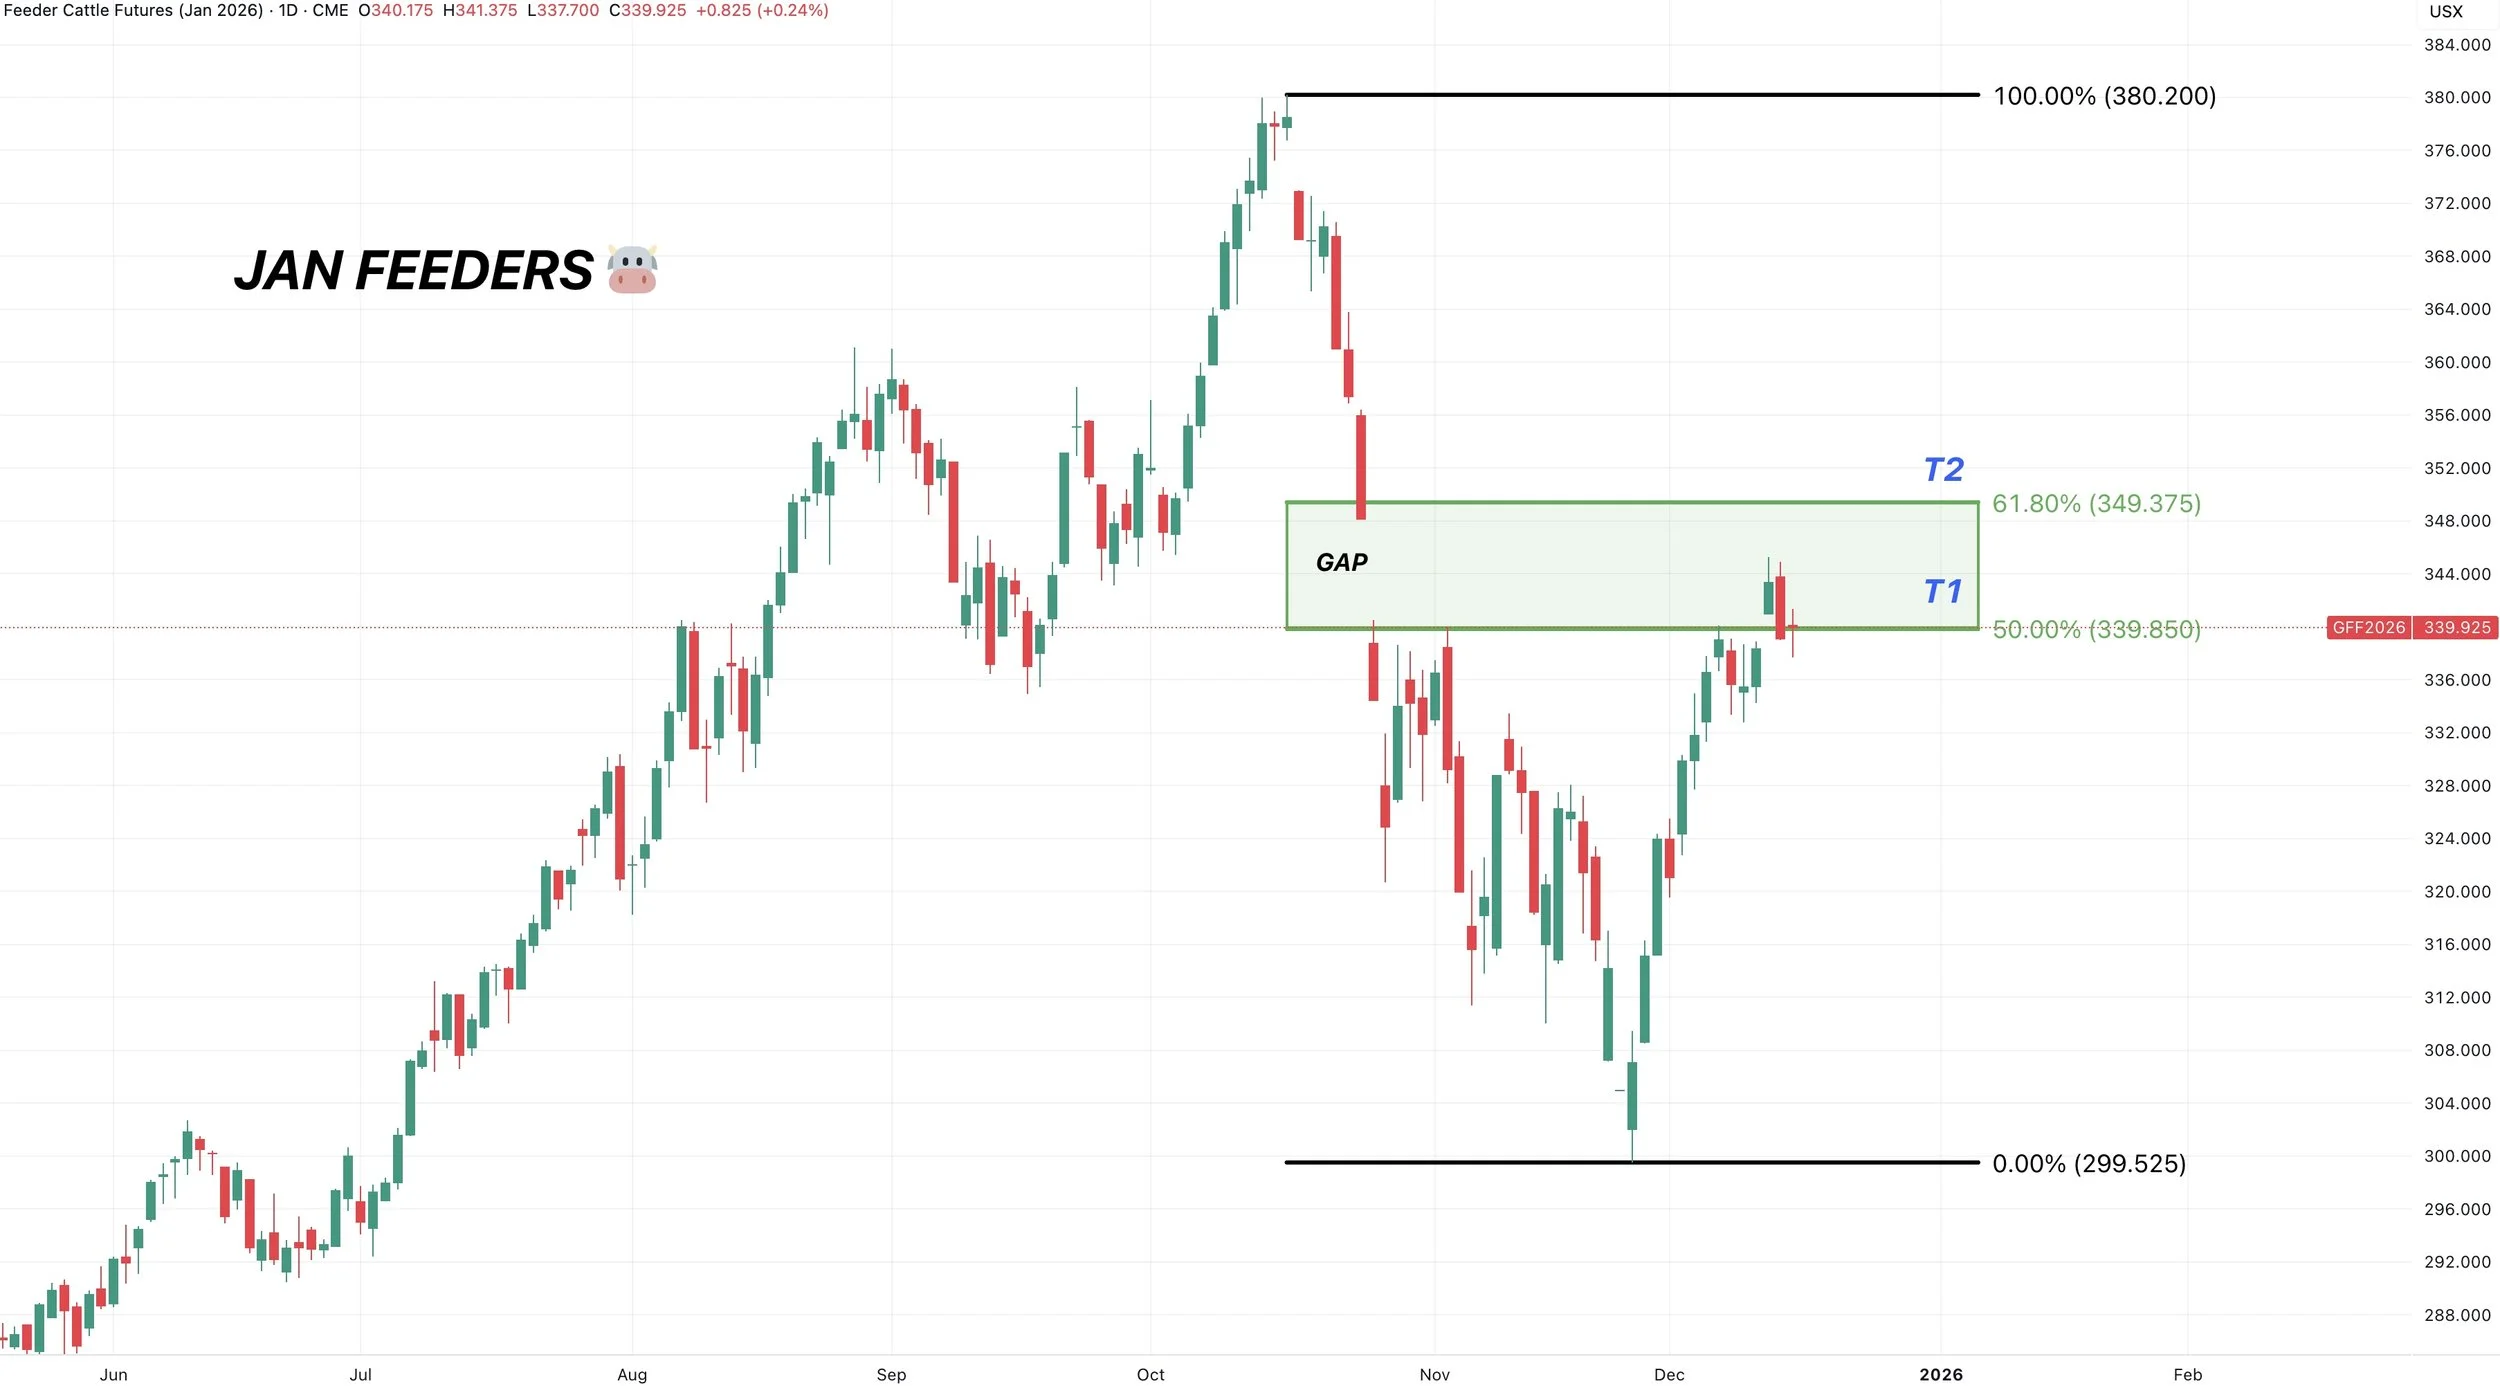
Jan Feeders 🐮
Both feeders & live cattle currently sitting in our target box and the golden zone.
This is where the market typically decides if this is just a correctional relief bounce or the start of a real rally.
This is where most relief bounced fail.
So this is viewed as a relief bounce unless we break above the green box and 61.8% level. If that happens, then often times it tells us this is not a relief bounce but something bigger.
I am still being very cautious that this was an exhaustion gap. We gapped higher after a big rally. We have now filled it in feeders.
Those type of gaps can often mark the end of a trend. Doesn’t have to. But it happening in the golden zone is all that more reason to be cautious.
Past Sell or Protection Signals
Dec 11th: 🐮
Cattle sell signal & hedge alert.
Dec 5th: 🐮
Cattle sell signal & hedge alert.
Nov 17th: 🌱
Soybean sell signal & hedge alert.
Nov 13th: 🌽 🌱
Managing risk in corn & beans ahead of USDA report.
Oct 28th: 🌽
Corn sell signal & hedge alert.
Oct 27th: 🌱
Soybean sell signal & hedge alert.
Oct 13th: 🐮
Cattle sell signal & hedge alert.
Aug 22nd: 🌱
Soybean sell signal & hedge alert.
July 31st: 🐮
Cattle sell signal & hedge alert.
July 10th: 🐮
Cattle sell signal & hedge alert.
CLICK HERE TO VIEW
June 5th: 🐮
Cattle sell signal & hedge alert.
June 2nd: 🌾
MPLS wheat sell signal.
April 10th: 🌽
Old crop corn sell signal.
March 19th: 🐮
Cattle hedge & sell signal.
Feb 18th: 🌽 🌾
Old crop KC wheat & old crop corn signal.
Jan 23rd: 🌽 🌱
Corn & beans old crop sell signal.
CLICK HERE TO VIEW
Jan 15th: 🌽 🌱
Corn & beans hedge alert/sell signal.
Jan 2nd: 🐮
Cattle hedge alert at new all-time highs & target.
Dec 11th: 🌽
Corn sell signal at $4.51 200-day MA
CLICK HERE TO VIEW
Oct 2nd: 🌾
Wheat sell signal at $6.12 target
Sep 30th: 🌽
Corn protection signal at $4.23-26
Sep 27th: 🌱
Soybean sell & protection signal at $10.65
Sep 13th: 🌾
Wheat sell signal at $5.98
May 22nd: 🌾
Wheat sell signal when wheat traded +$7.00
Want to Talk?
Our phones are open 24/7 for you guys if you ever need anything or want to discuss your operation.
Hedge Account
Interested in a hedge account? Use the link below to set up an account or shoot Jeremey a call at (605)295-3100.