
USDA MONDAY & HISTORY OF WEATHER RALLIES
MARKET UPDATE
You can scroll to read the usual update as well. As the written version is the exact same as the video.
Timestamps for video:
Overview: 0:00min
History of Weather Rallies: 1:30min
Corn: 7:40min
Soybeans: 10:55min
Wheat: 13:50min
Want to talk about your situation?
(605)295-3100
Extended access to our planting sale ends this weekend.
Make sure you take advantage before your free trial expires so you don’t miss our next signal & future updates.
Futures Prices Close
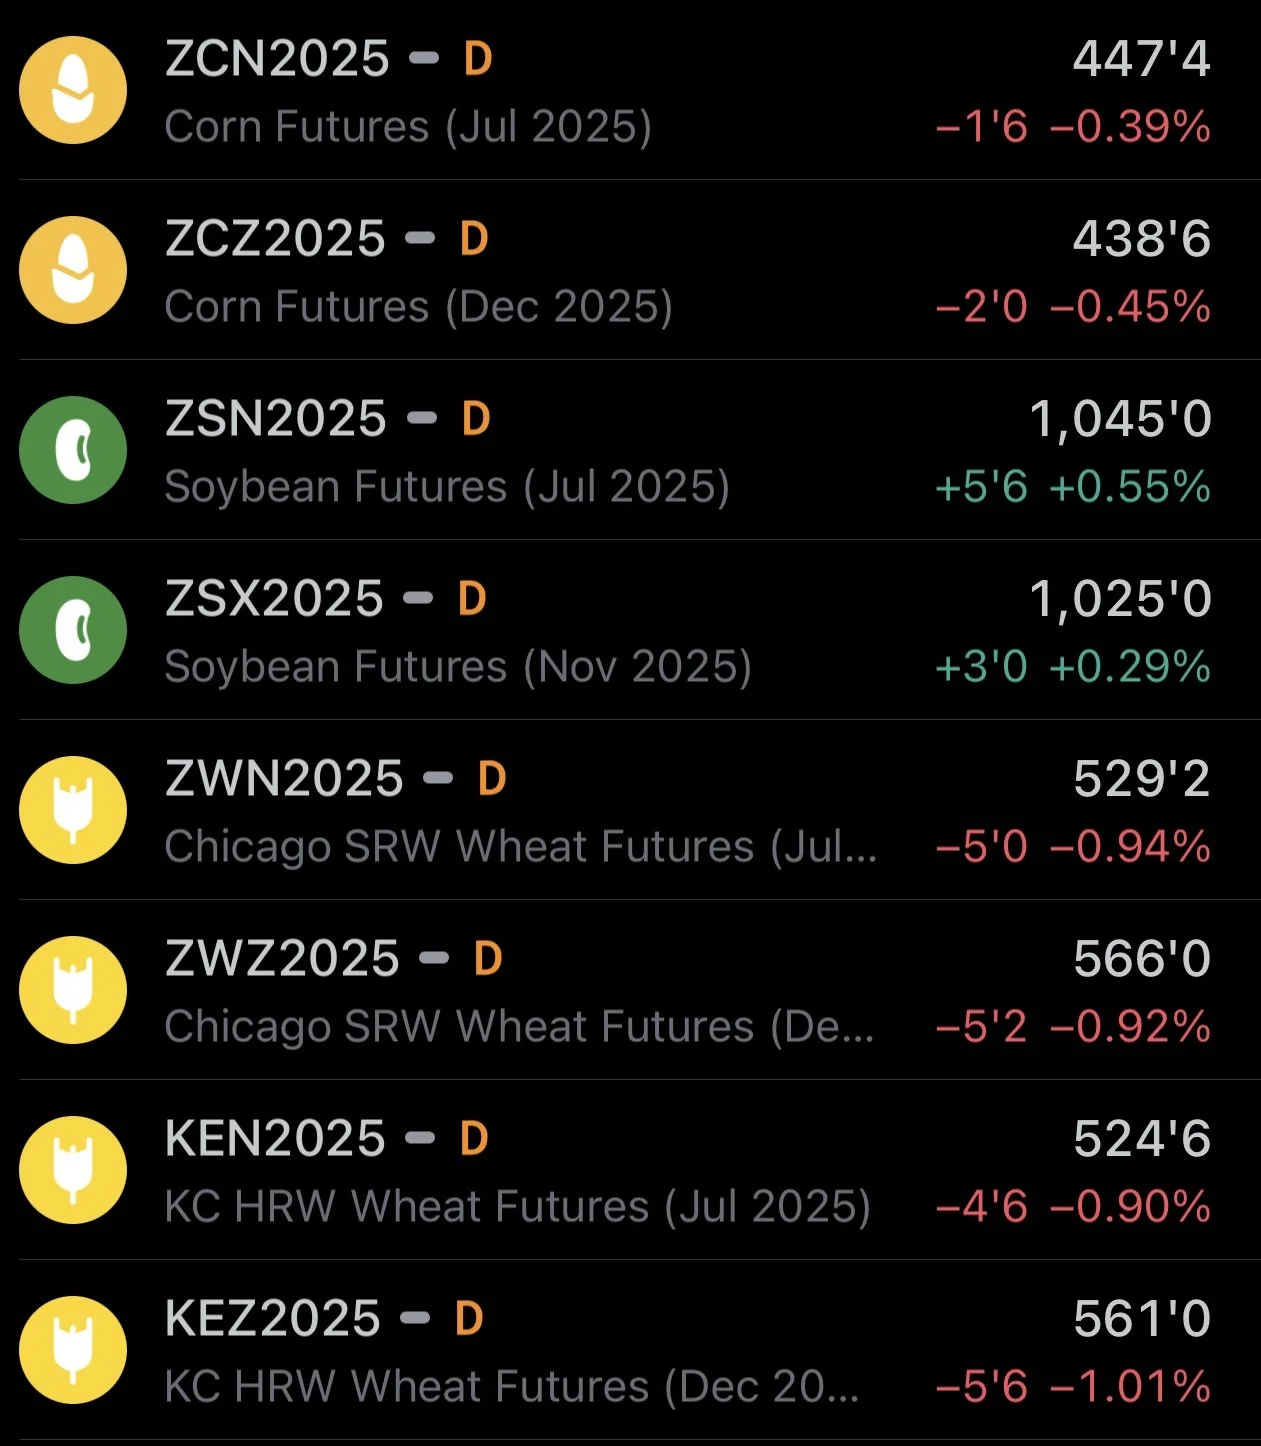
Overview
The corn market continues to fall apart, down 7 of the past 9 days and now -$0.50 off the April highs.
However we did manage to close +5 cents off the lows. So not awful price action today all things considered.
Despite demand continuing to show signs of strength, corn continues to be pressured by spreads unwinding, ideal planting conditions, and the thoughts surrounding a bearish new crop report on Monday's USDA.
Soybeans finding strength on the thought process that the USDA report is going to show a tighter new crop balance sheet unlike corn. We also aren’t having any issues getting the corn crop in the ground, which removes any fear of acres shifting to beans.
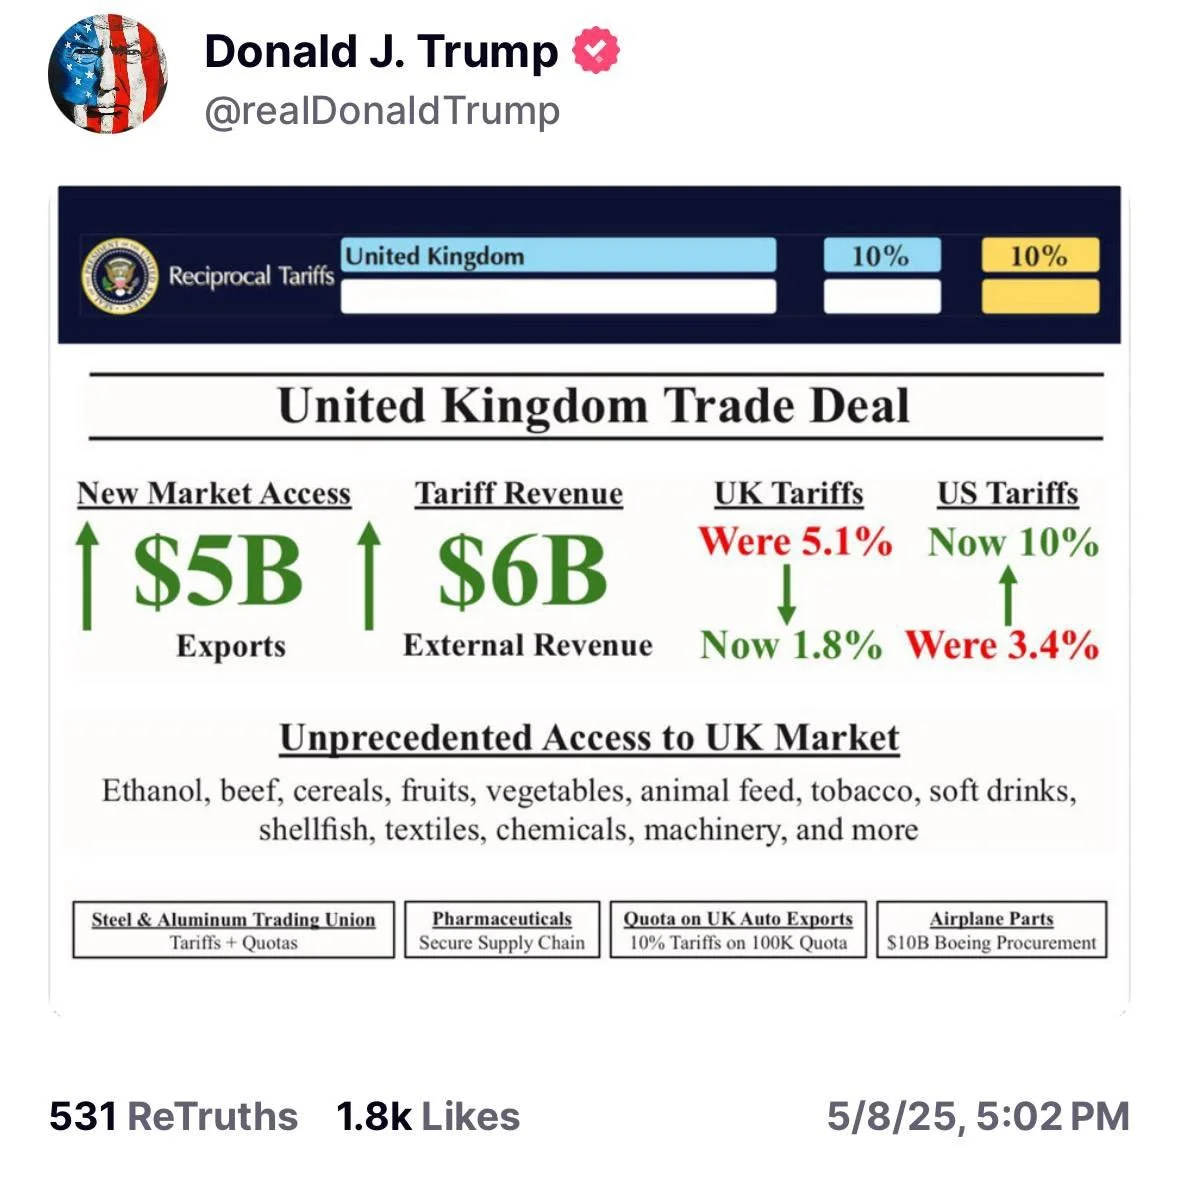
Trump and the UK came to an actual trade agreement (not just a rumor or random headline this time).
Ethanol was included in this trade deal, but it won’t have a major impact on corn use. So not a big factor.
From Rich Nelson of Allendale:
"In 2024 we shipped the UK 244 million gallons of ethanol. That equates to 81 million bushels of corn. Assuming our exports to them increase by +10% that only leads to an 8 million bushel increase in corn use."
The trade is still more interested in trade deals with countries that are big importers such as Mexico, Japan, China, or Canada.
China and the US are scheduled to have trade deal talks this weekend, so we will have to see if anything comes of it.
History of Weather Rallies
Tuesday I broke down what happened in 2023 and how a weather rally can typically play out.
How we can run hard but then give back the entire rally in the blink of an eye.
Let's go over what happened in every year since 2012, weather rally or not.
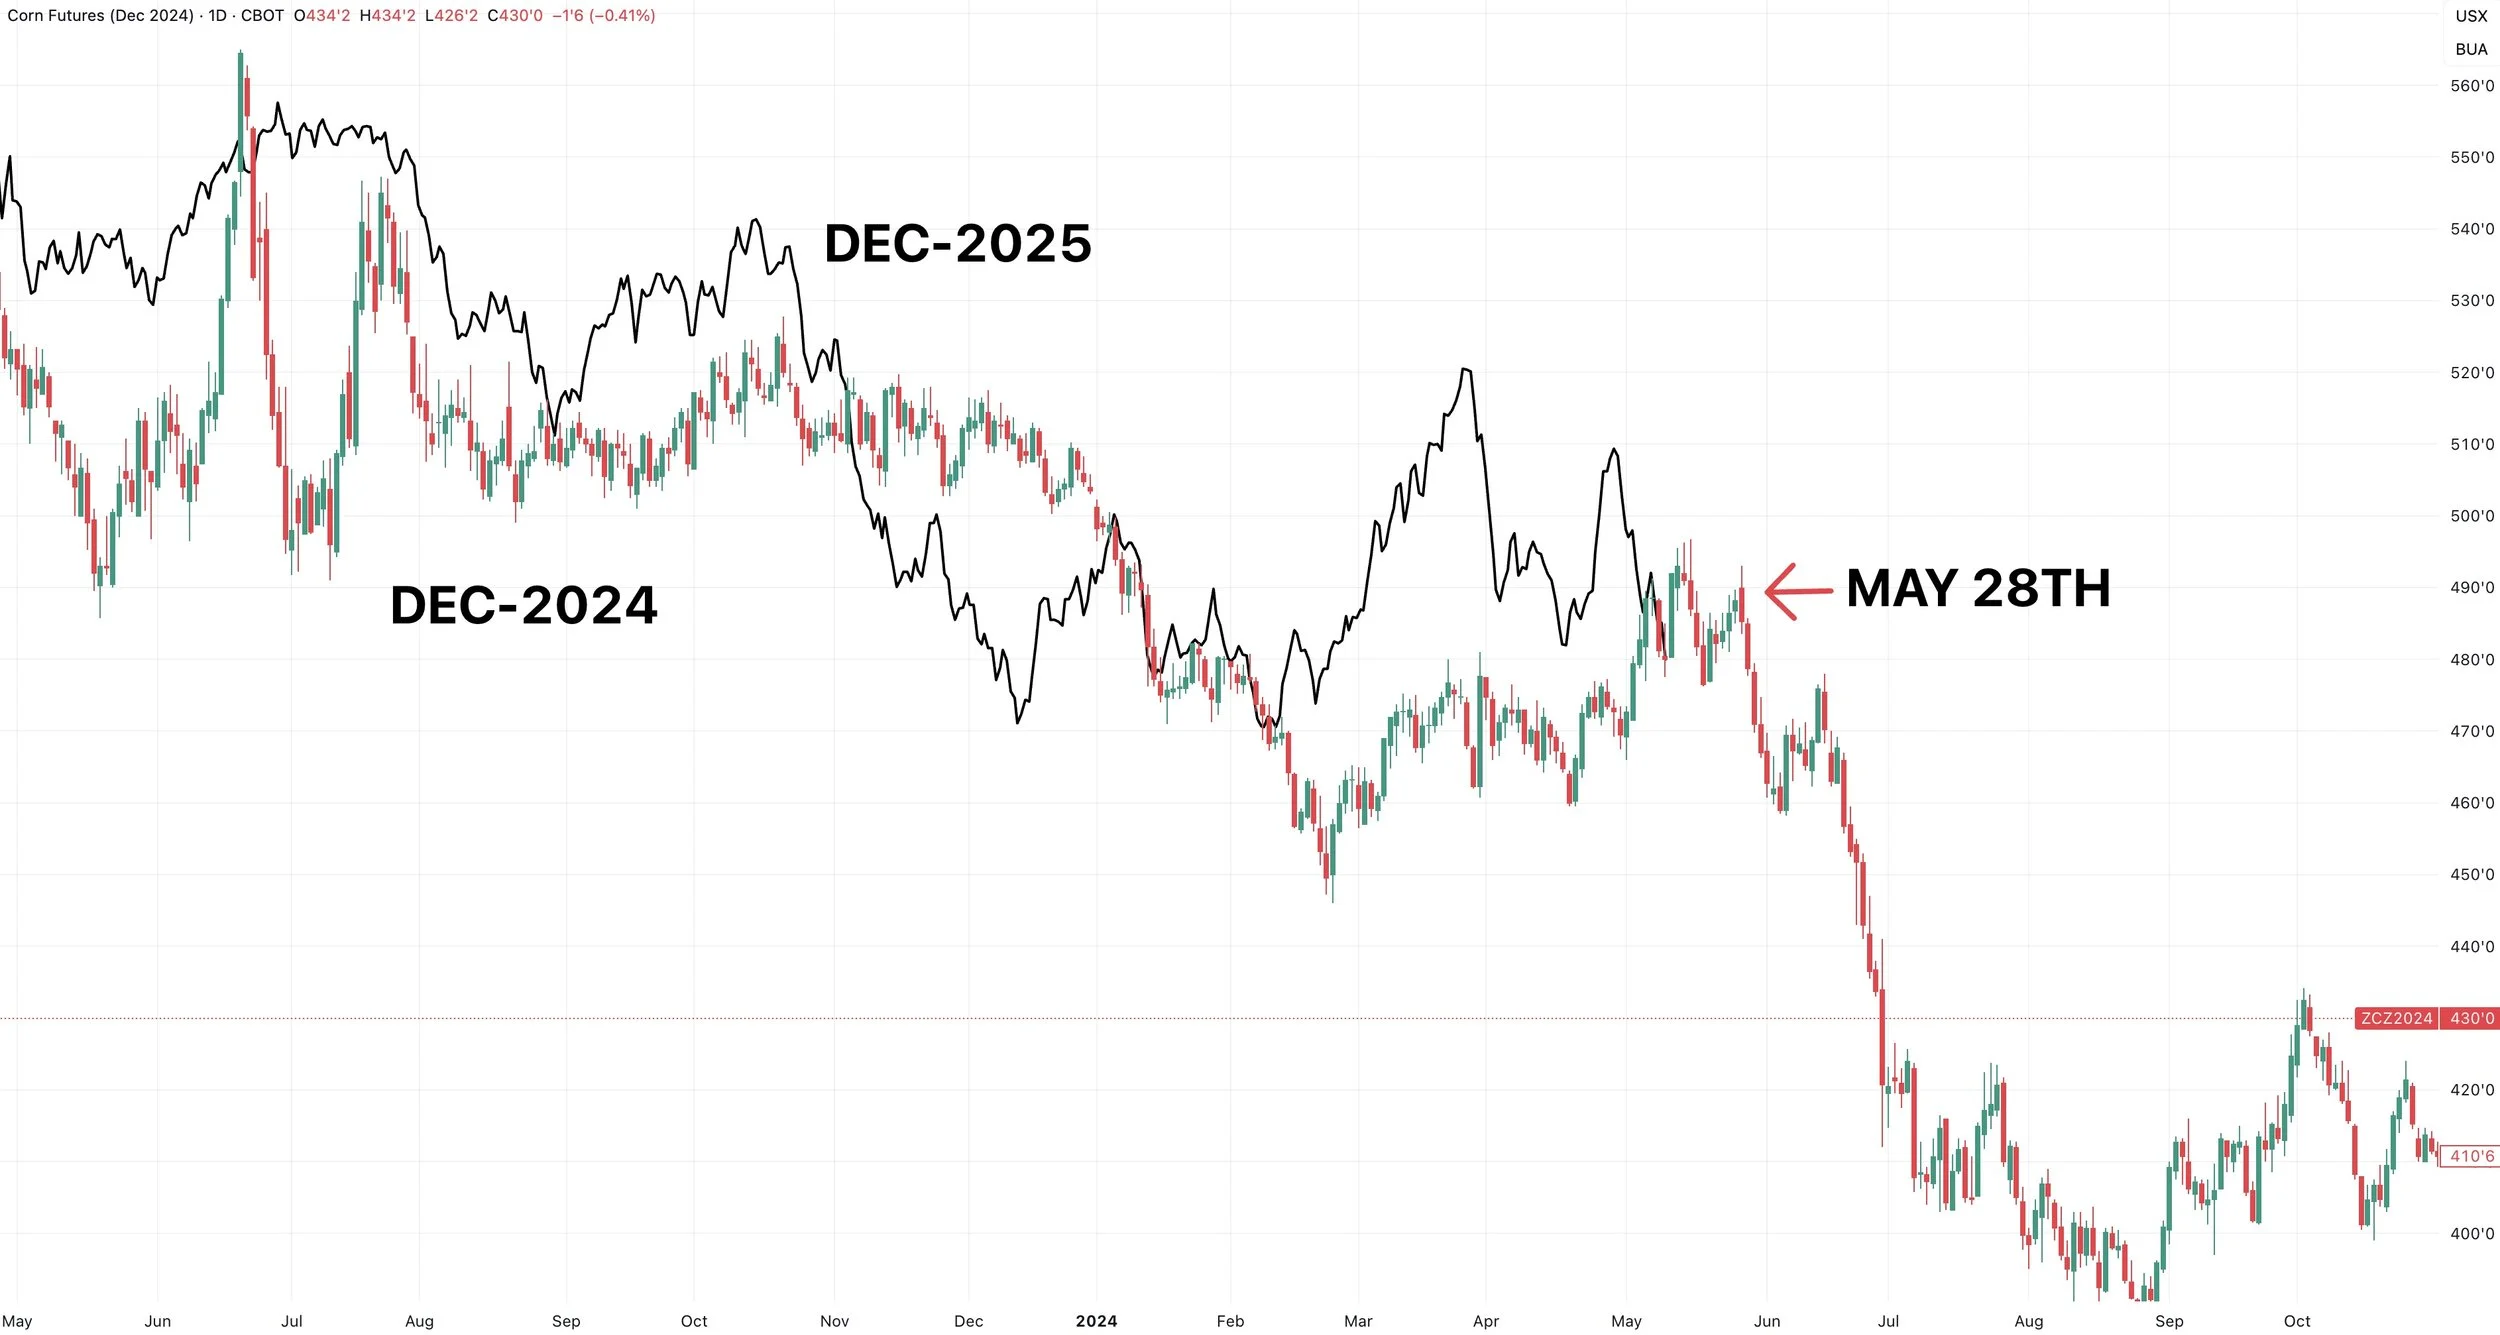
2024 - No Real Weather Scare
No real weather rally opportunity outside of the slight planting delay rally in May.
It was just one of those years where we had a pretty ideal summer and no real threats.
Prices fell apart on May 28th.
2023 - Classic June Drought Scare
We talked about this Tuesday. This is what a drought scare can look, although not every scare will bring a rally of this magnitude.
We bottomed on May 18th (which would be next week).
We then rallied a month, but majority of the rally came in just 7 days.
After posting our highs, we gave back the entire rally in just 9 days.

2022 - Demand Led Rally, Not Weather
The next few years are a little skewed as we were coming off that major demand led rally from the end of 2020.
Regardless, prices tanked after June 17th.
As we erased $2.00 of the rally in just 19 days.
Falling from $7.65 to $5.65 by July 6th.

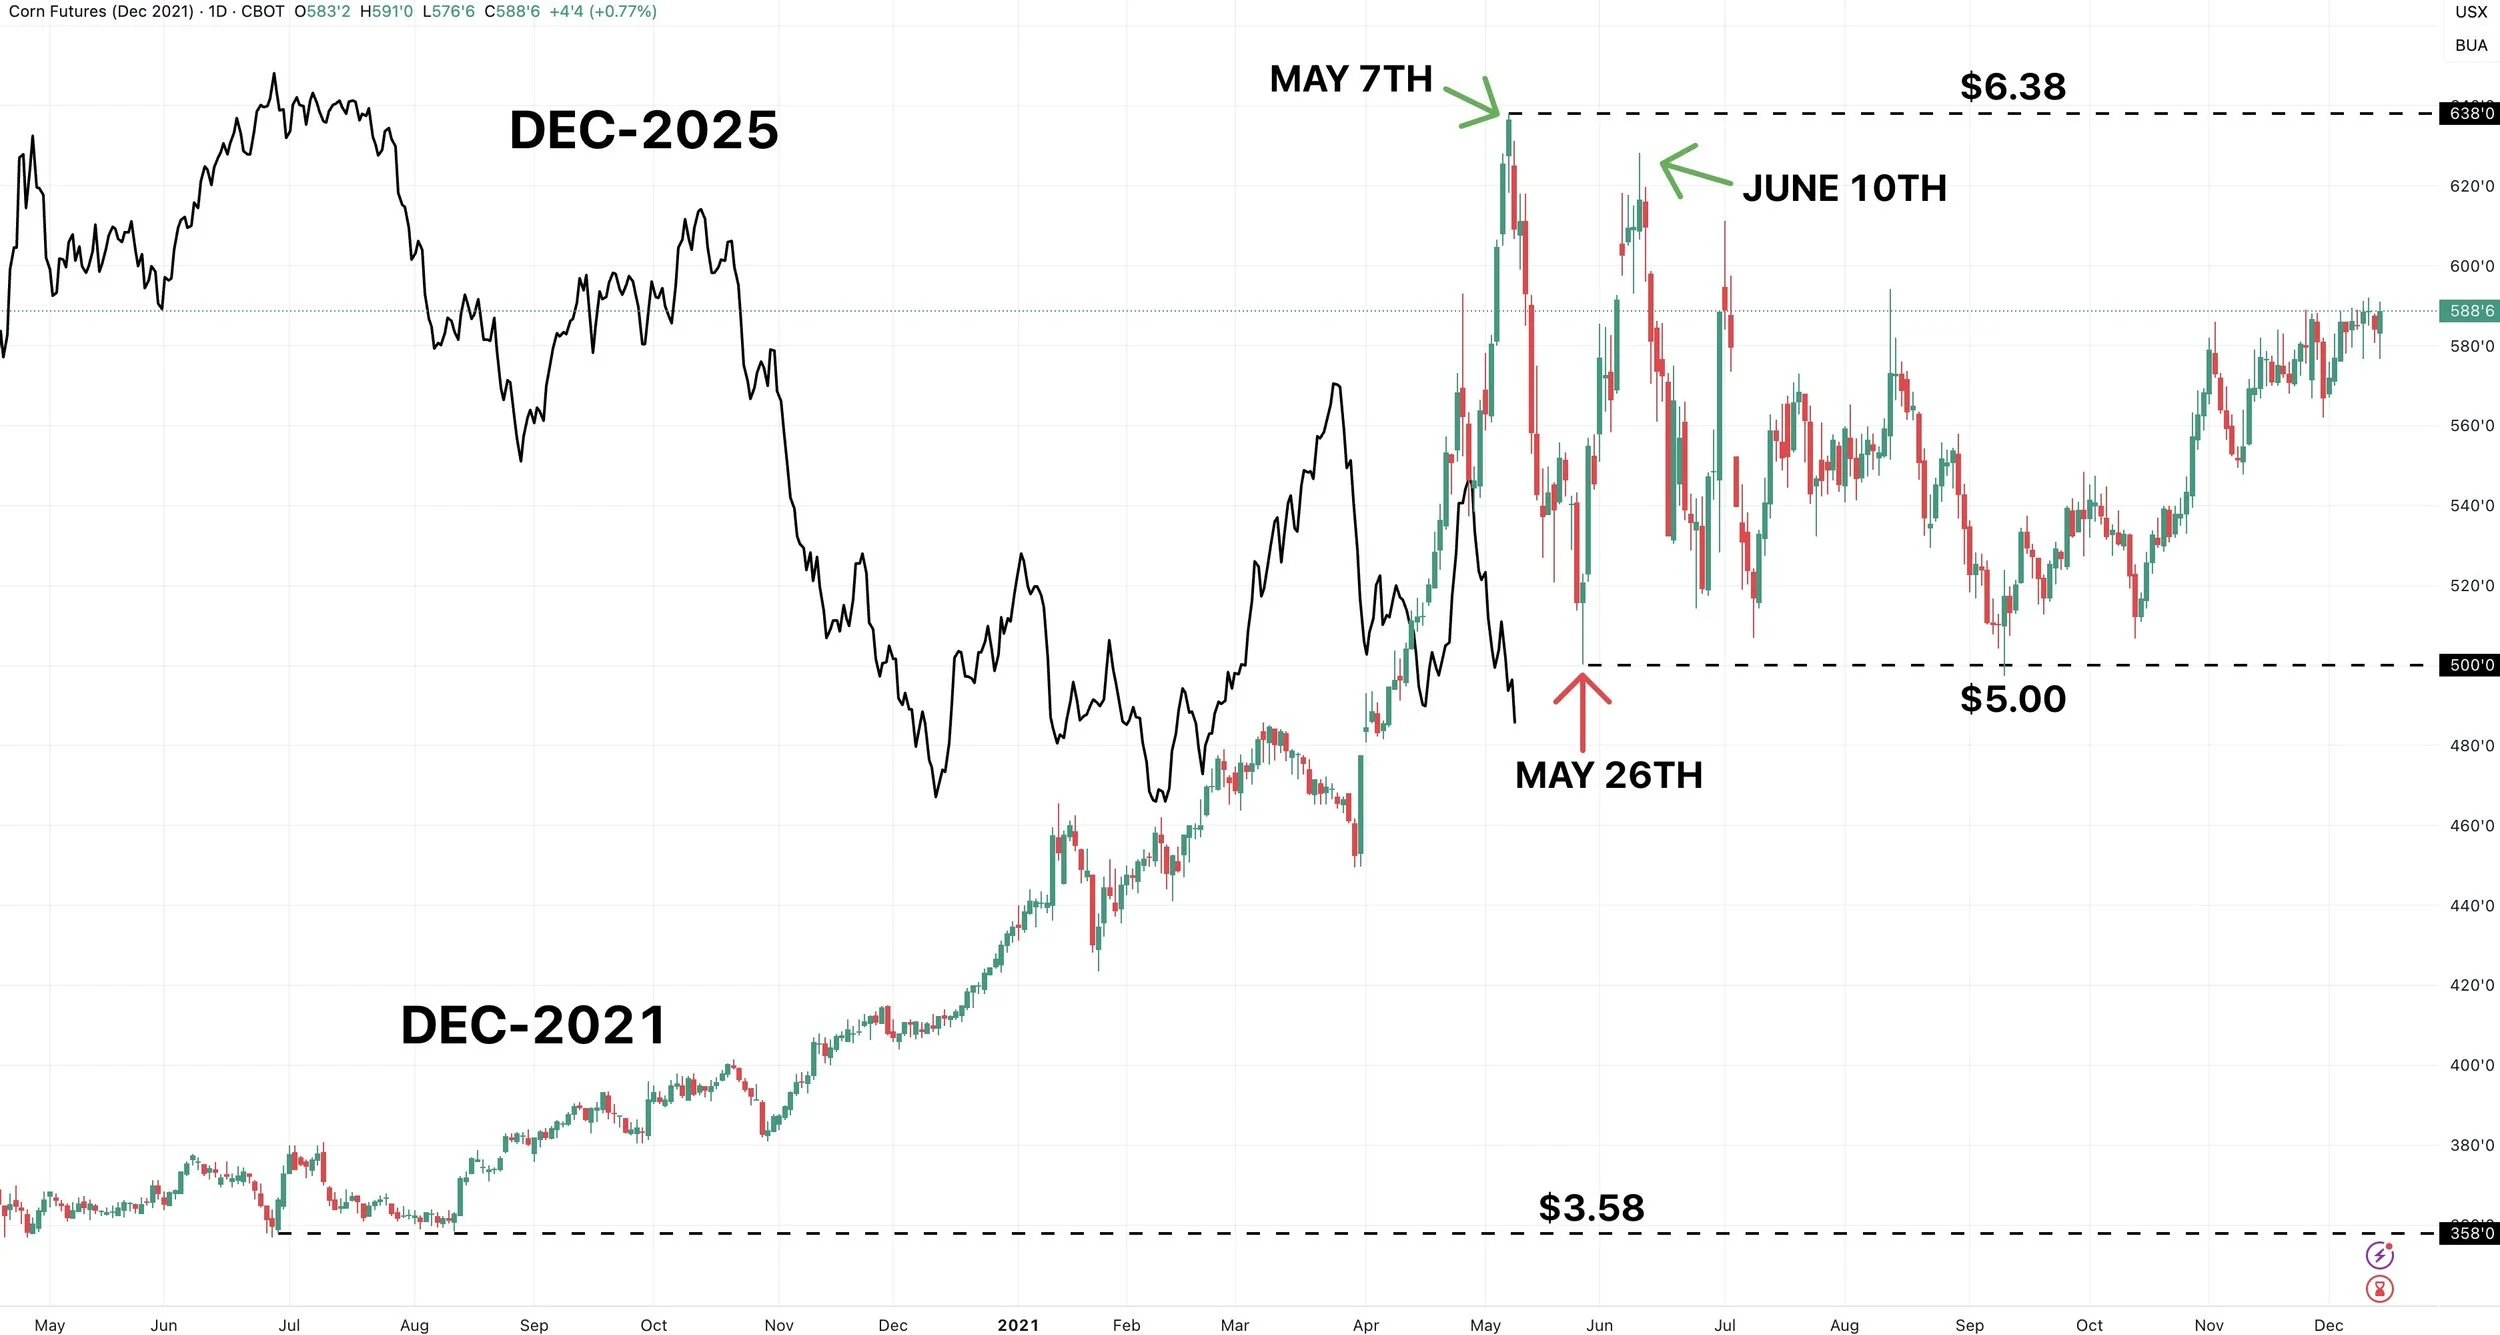
2021 - Demand & Drought
Again this year is a little skewed as well, as we were just starting that demand led rally this year.
However, we did see a drought scare in June.
Prices fell -$1.40 from May 7th to May 26th, but then rallied over +$1.00 for 2 weeks before topping June 10th.
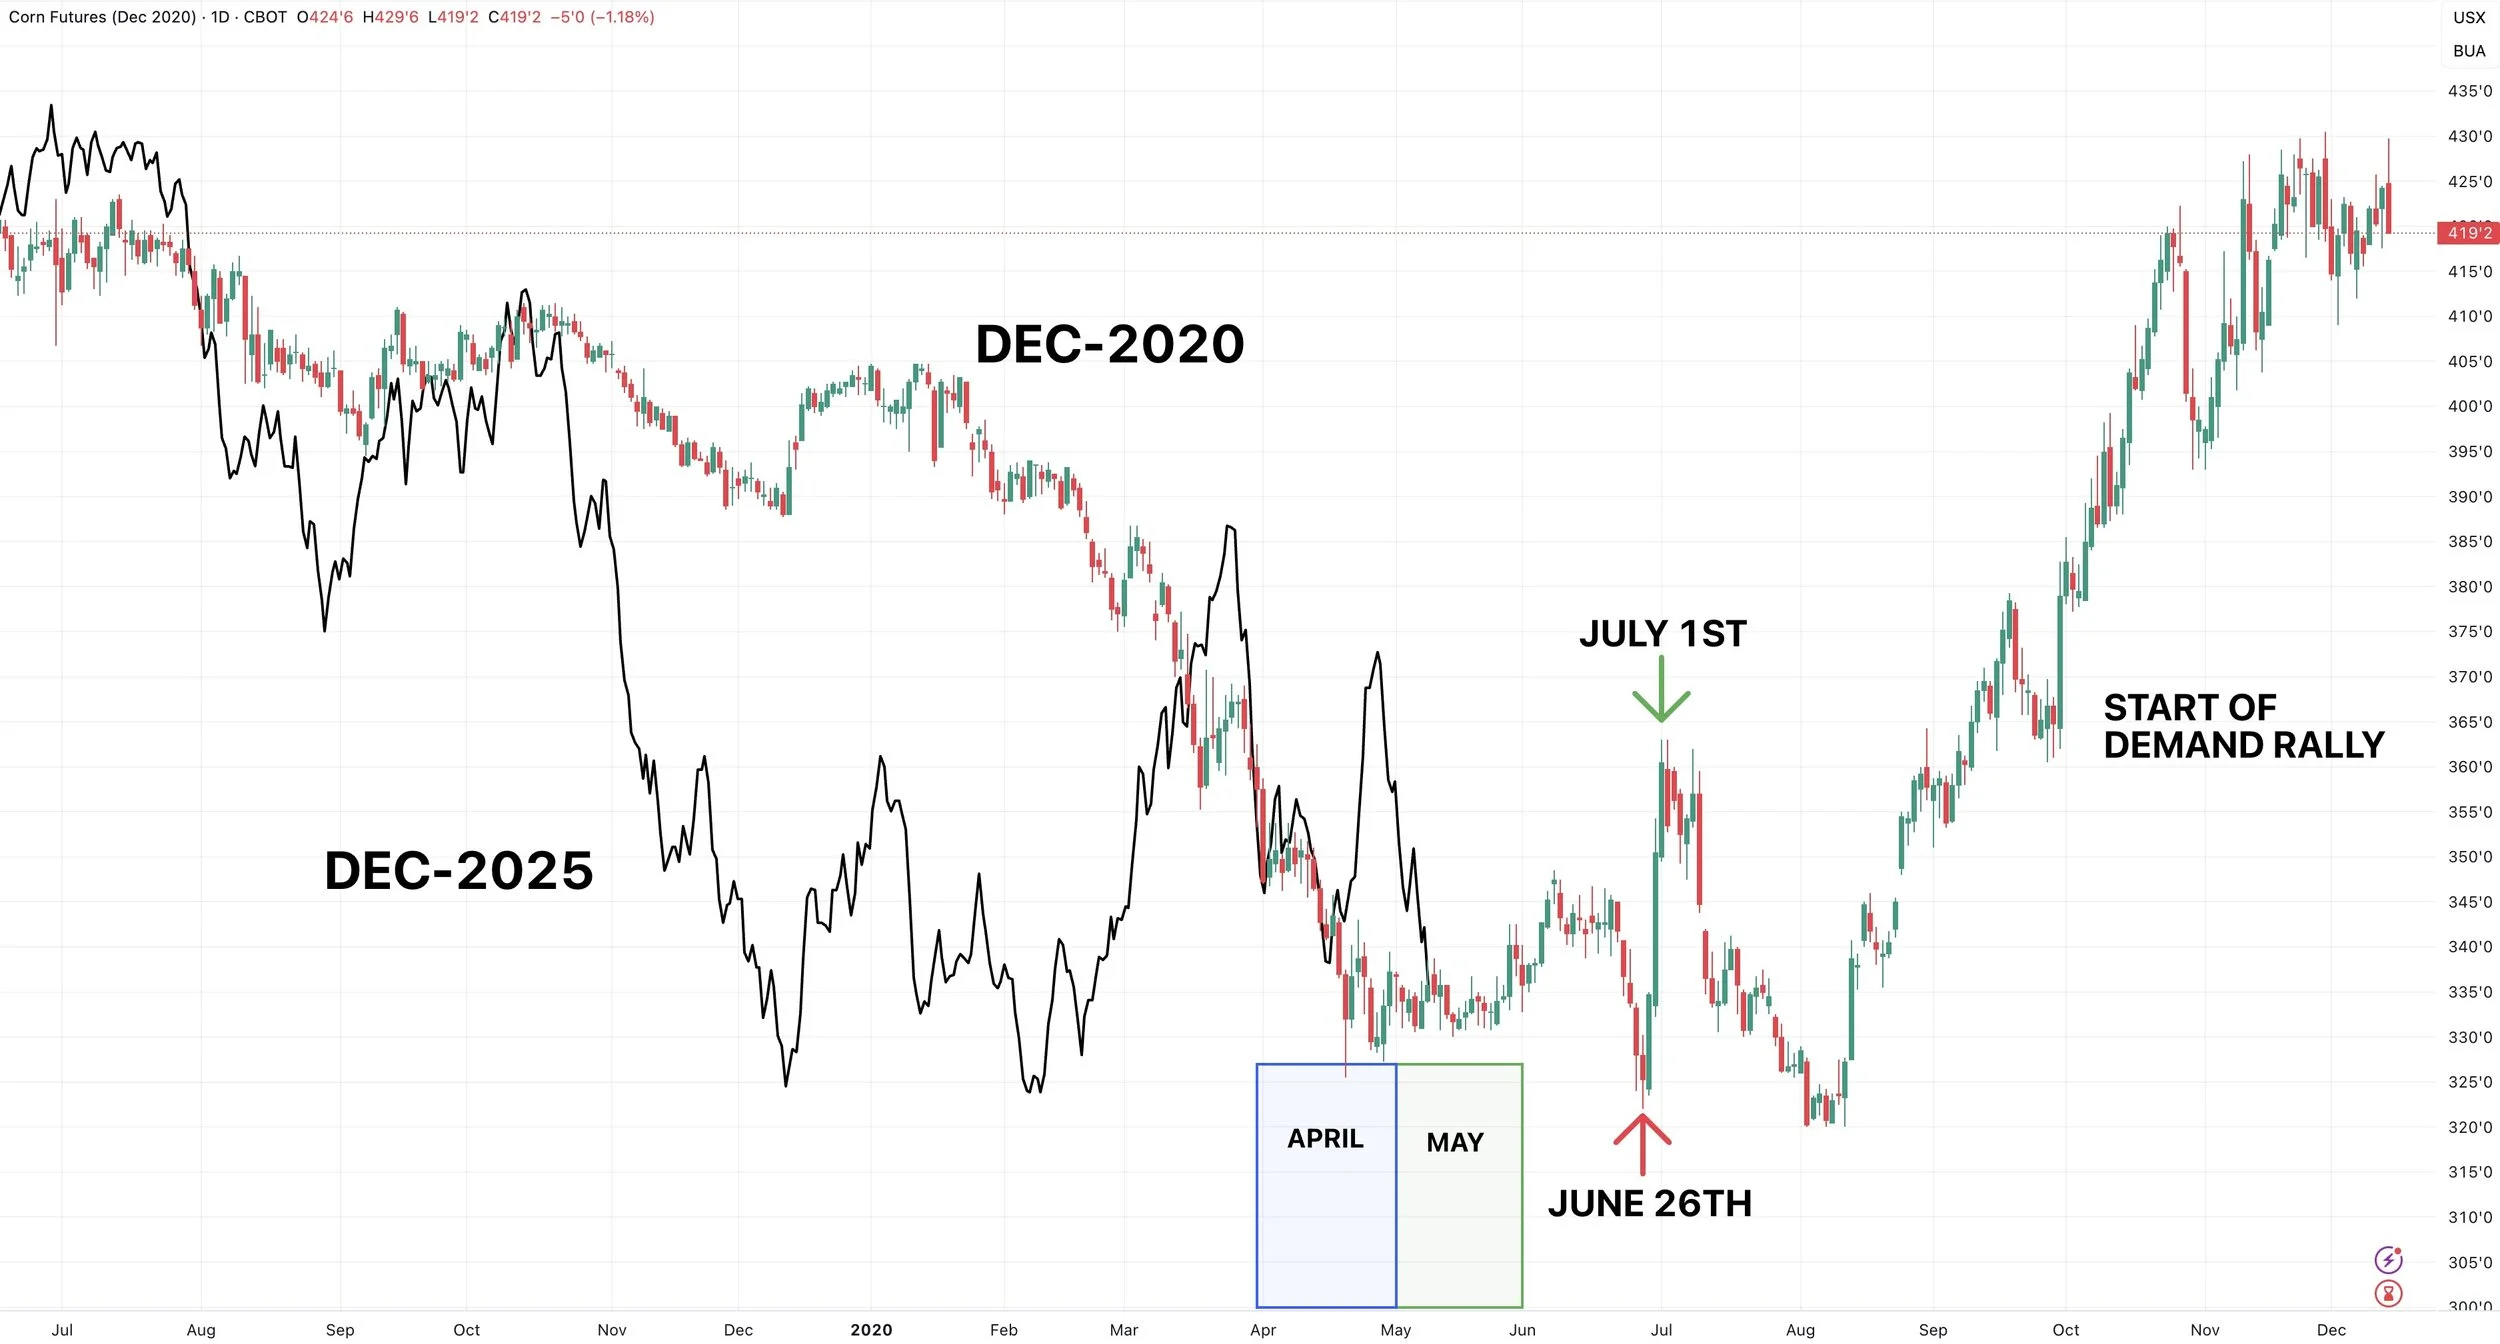
2020 - June Bounce, then Demand Took Over
2020 is known for it's late demand rally. But we did see a brief summer rally beforehand.
We saw a bottom on June 26th then saw a 5 day rally that topped out on July 1st.
We gave most of the rally back in just a few days.
This was a small June weather bounce but not a real major scare.
The derecho and Chinese demand started the multi-year bull run in August.
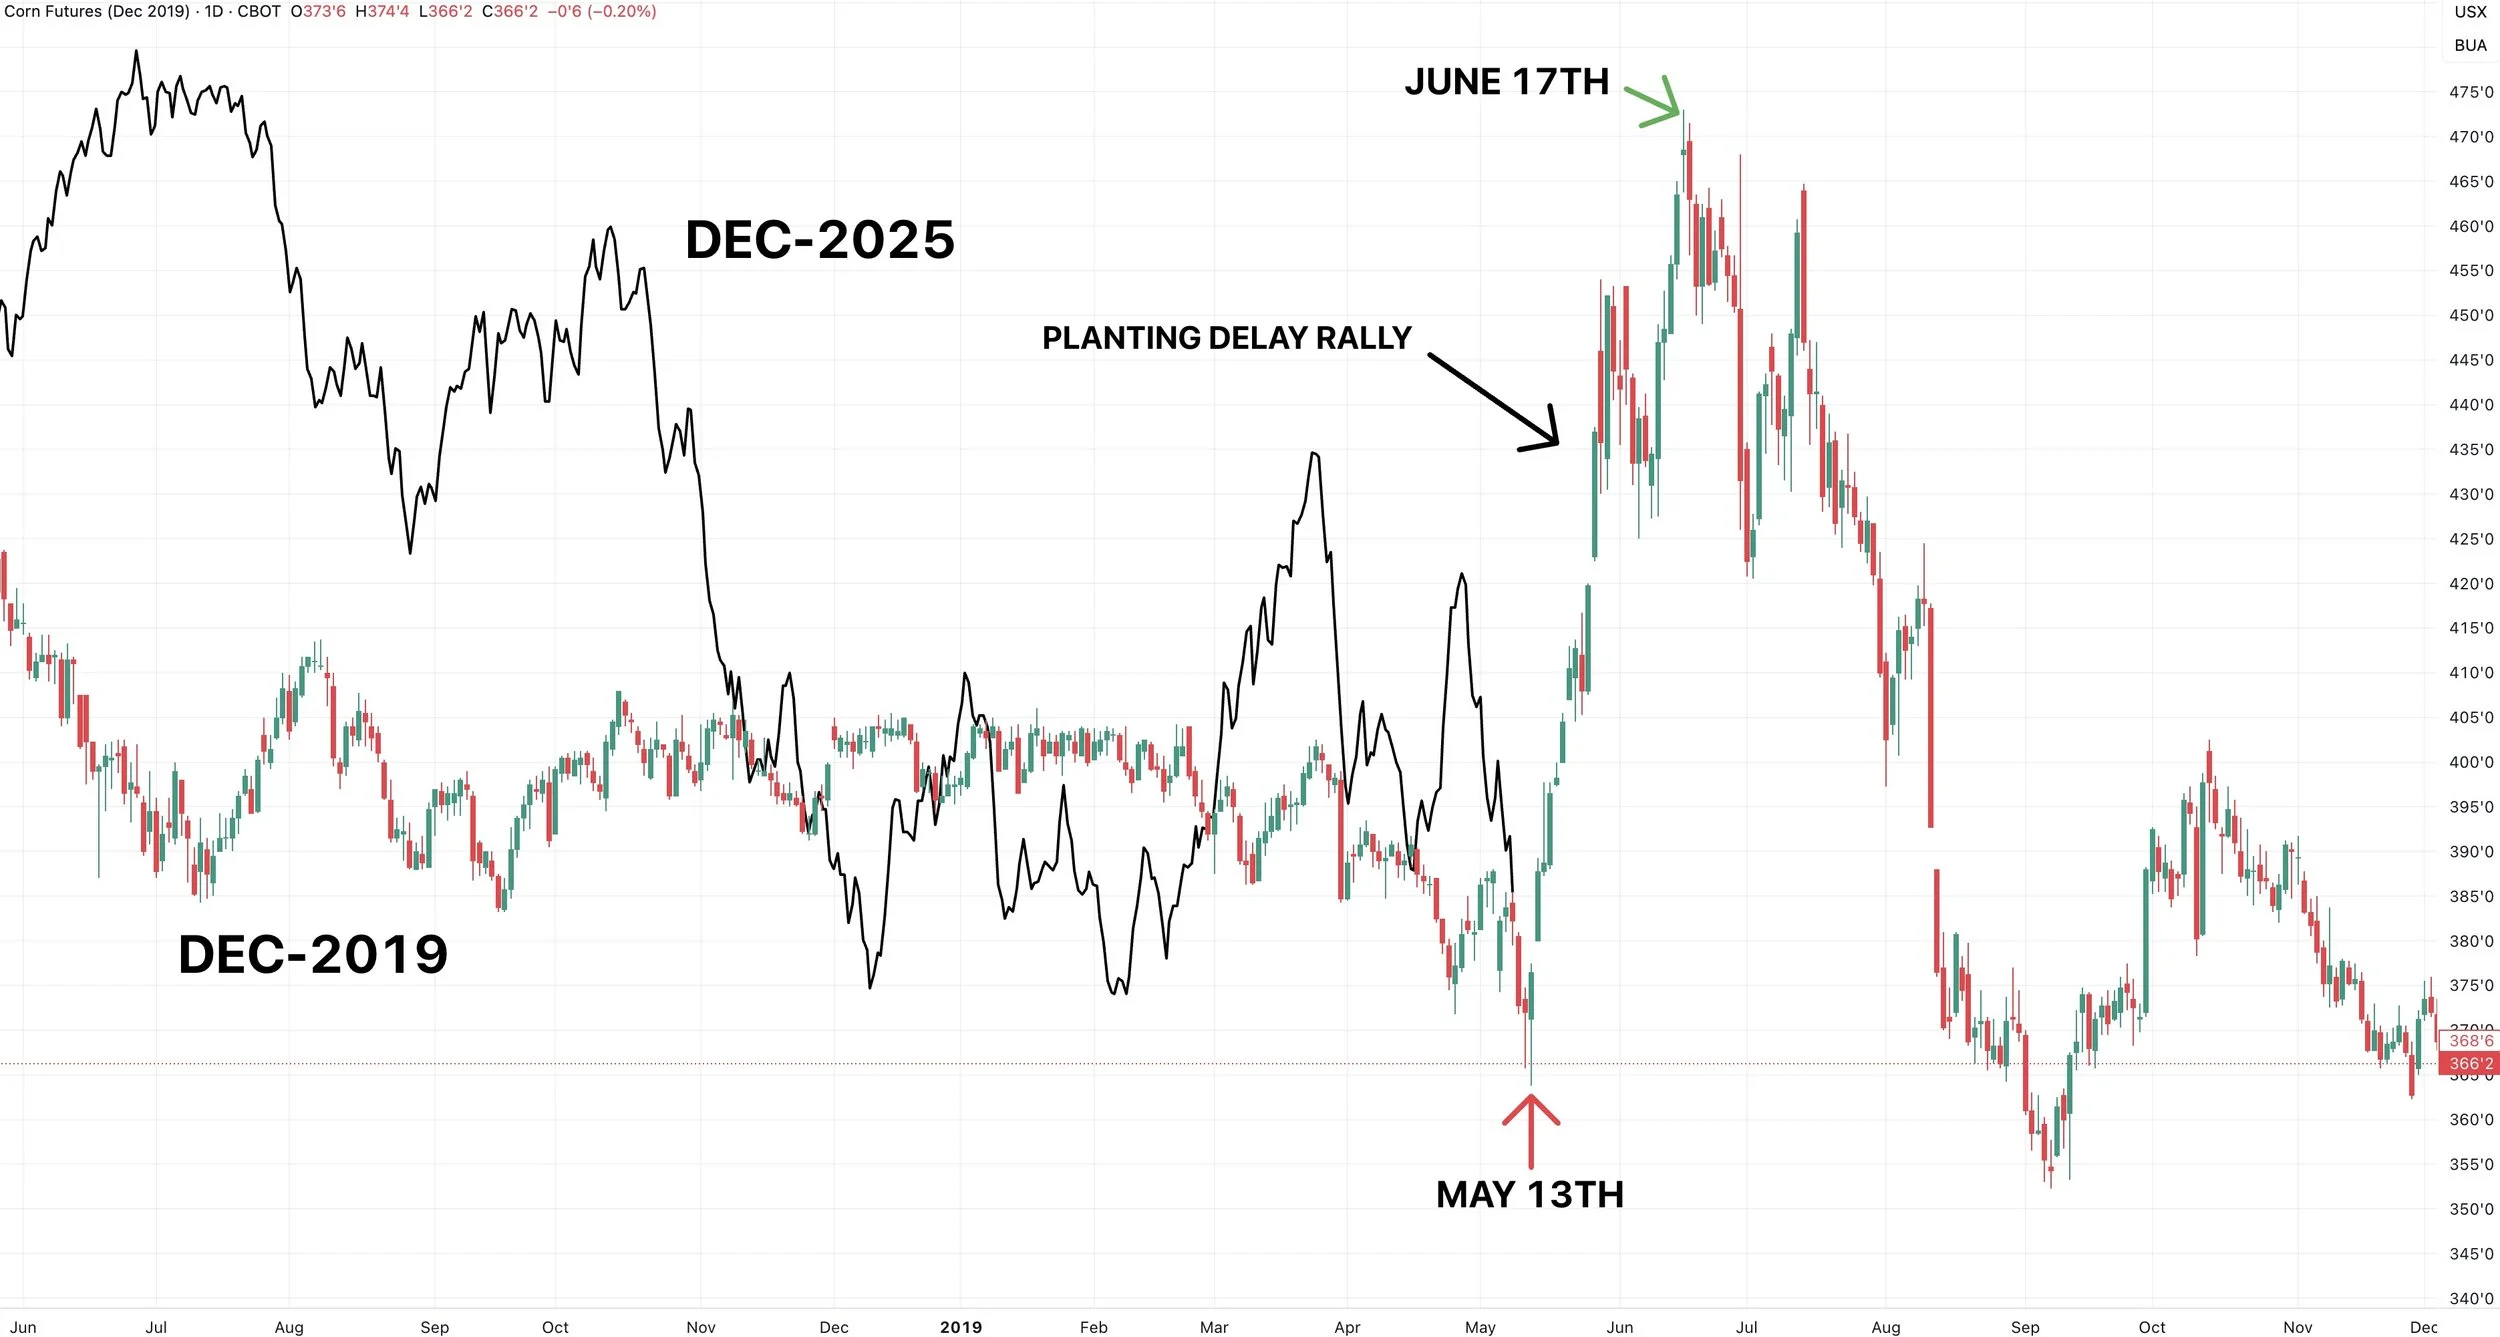
2019 - Planting Delay, Not Drought
This was a spring rally, not a summer one.
As that pricing opportunity came off the back of planting delays and historic rain.
We bottomed on May 13th before rallying a +$1.00 to June 17th.
By July we gave back a good chunk of the rally but didn’t really fall out of bed until August.
So not a typical summer rally.
2018 - No Summer Weather Threat
We saw no weather threat at all really.
We topped out on May 24th before falling out completely out of bed.

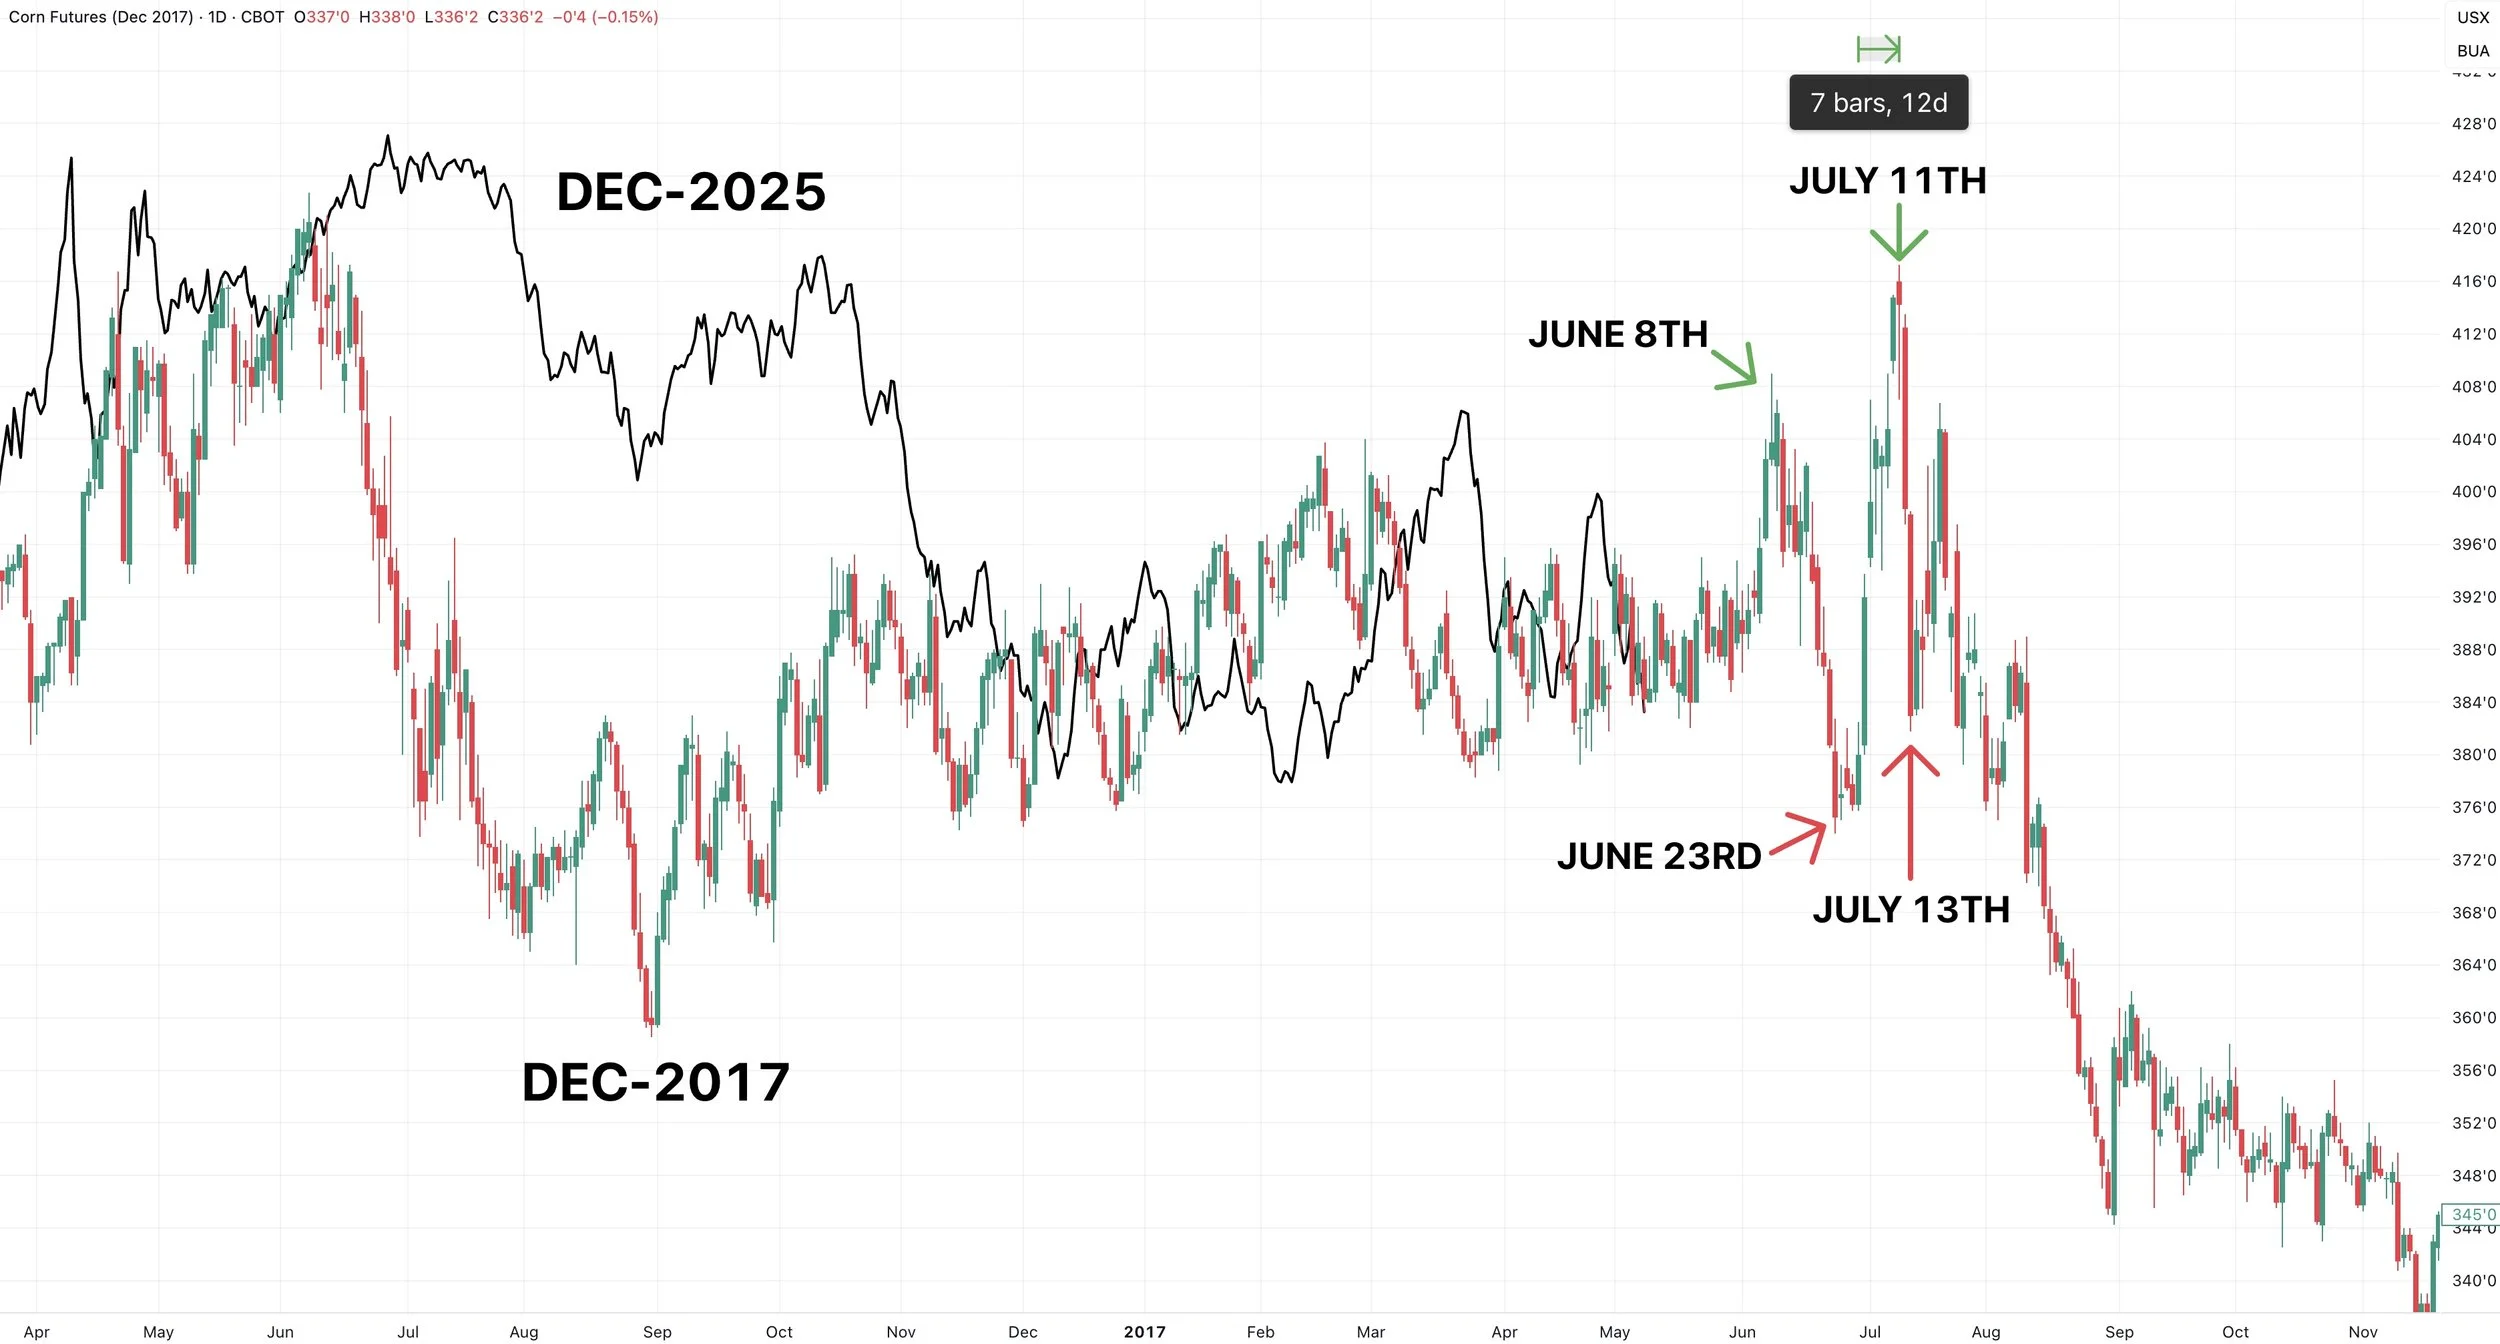
2017 - July Weather Rally
We were sideays for months.
We had a quiet June, but dryness picked up and we rallied hard into July.
We rallied for 12 days from June 23rd to July 11th.
Just 2 days later on July 13th we had already given back the entire rally.
Again, that is how fast drought scare opportunities can be if they are not material (most aren’t).
2016 - Classic June Rally
The market bottomed on May 9th (which is today).
We then rallied about +80 cents over the next month.
We topped out on June 17th.
Just 7 days later on June 24th, we gave back most of the rally.

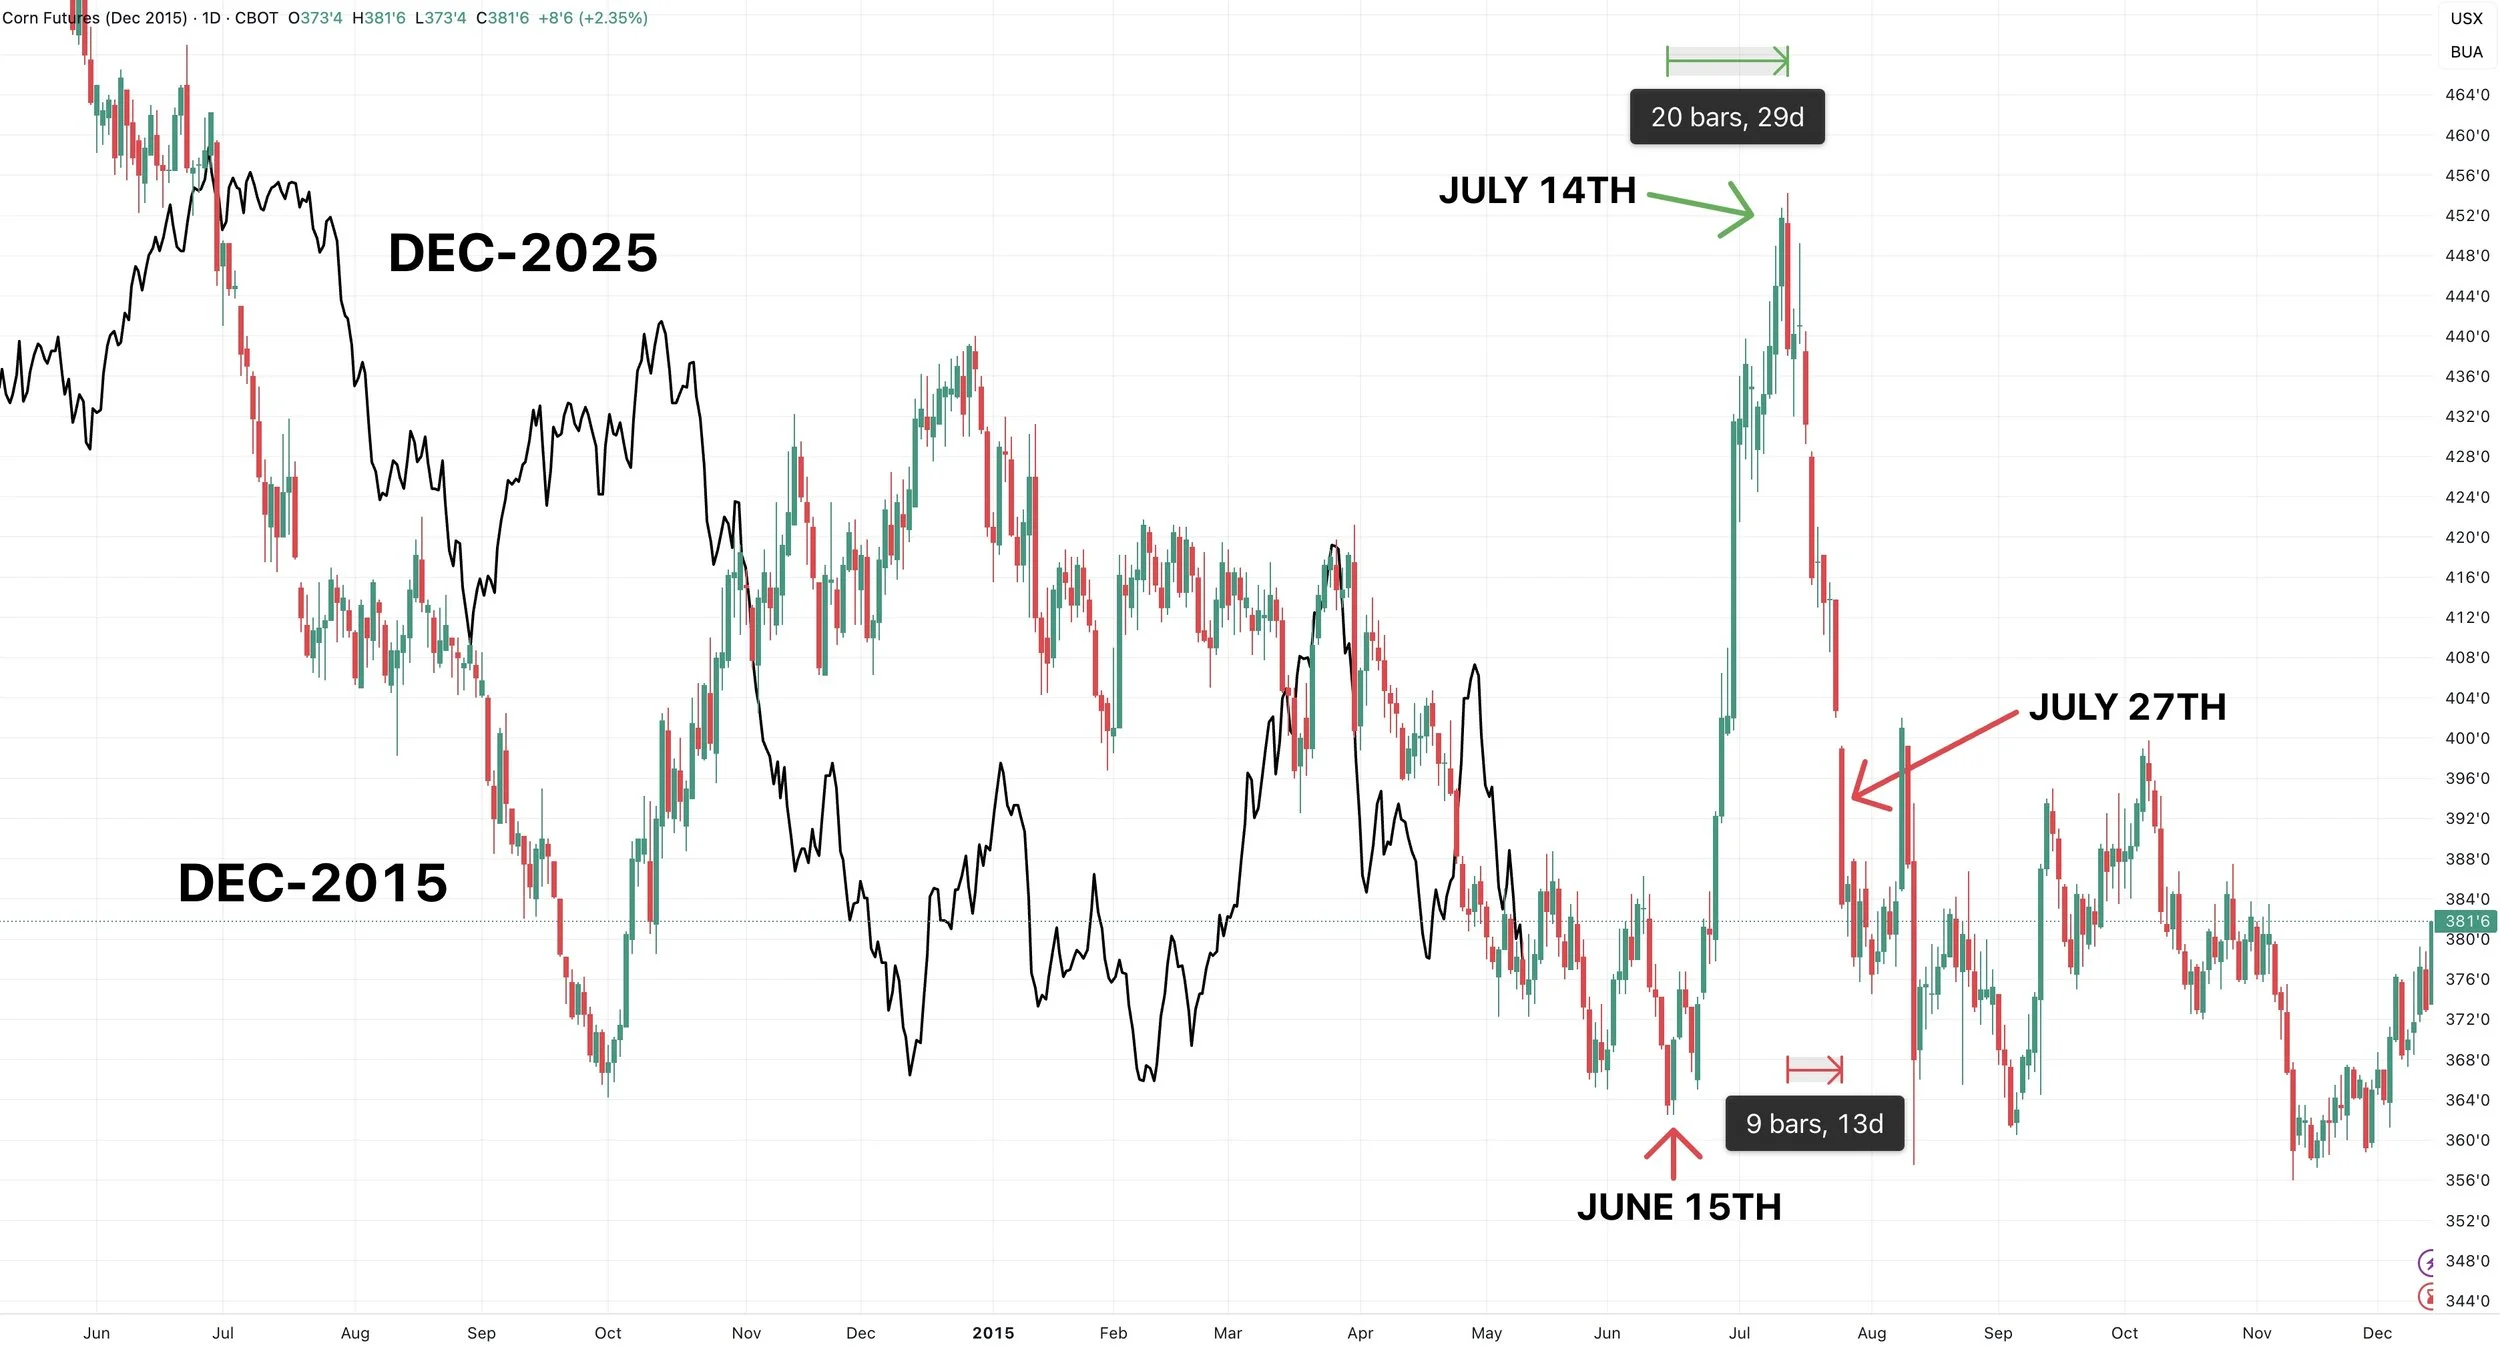
2015 - June to July Drought Rally
This rally was driven by a quick turn in weather, as the season started wet but turned dry fast.
We found a floor on June 15th then exploded nearly +$1.00 higher for the next month.
Topping on July 14th.
Just 2 weeks later on July 27th, the entire rally had collapsed.
2014 - No Threat, No Rally
This was one of those years we saw zero threat or real opportunity.
Crop conditions were good and forecasts were friendly.
A non-event summer.
We peaked on May 9th (which is today) then dropped the entire year.

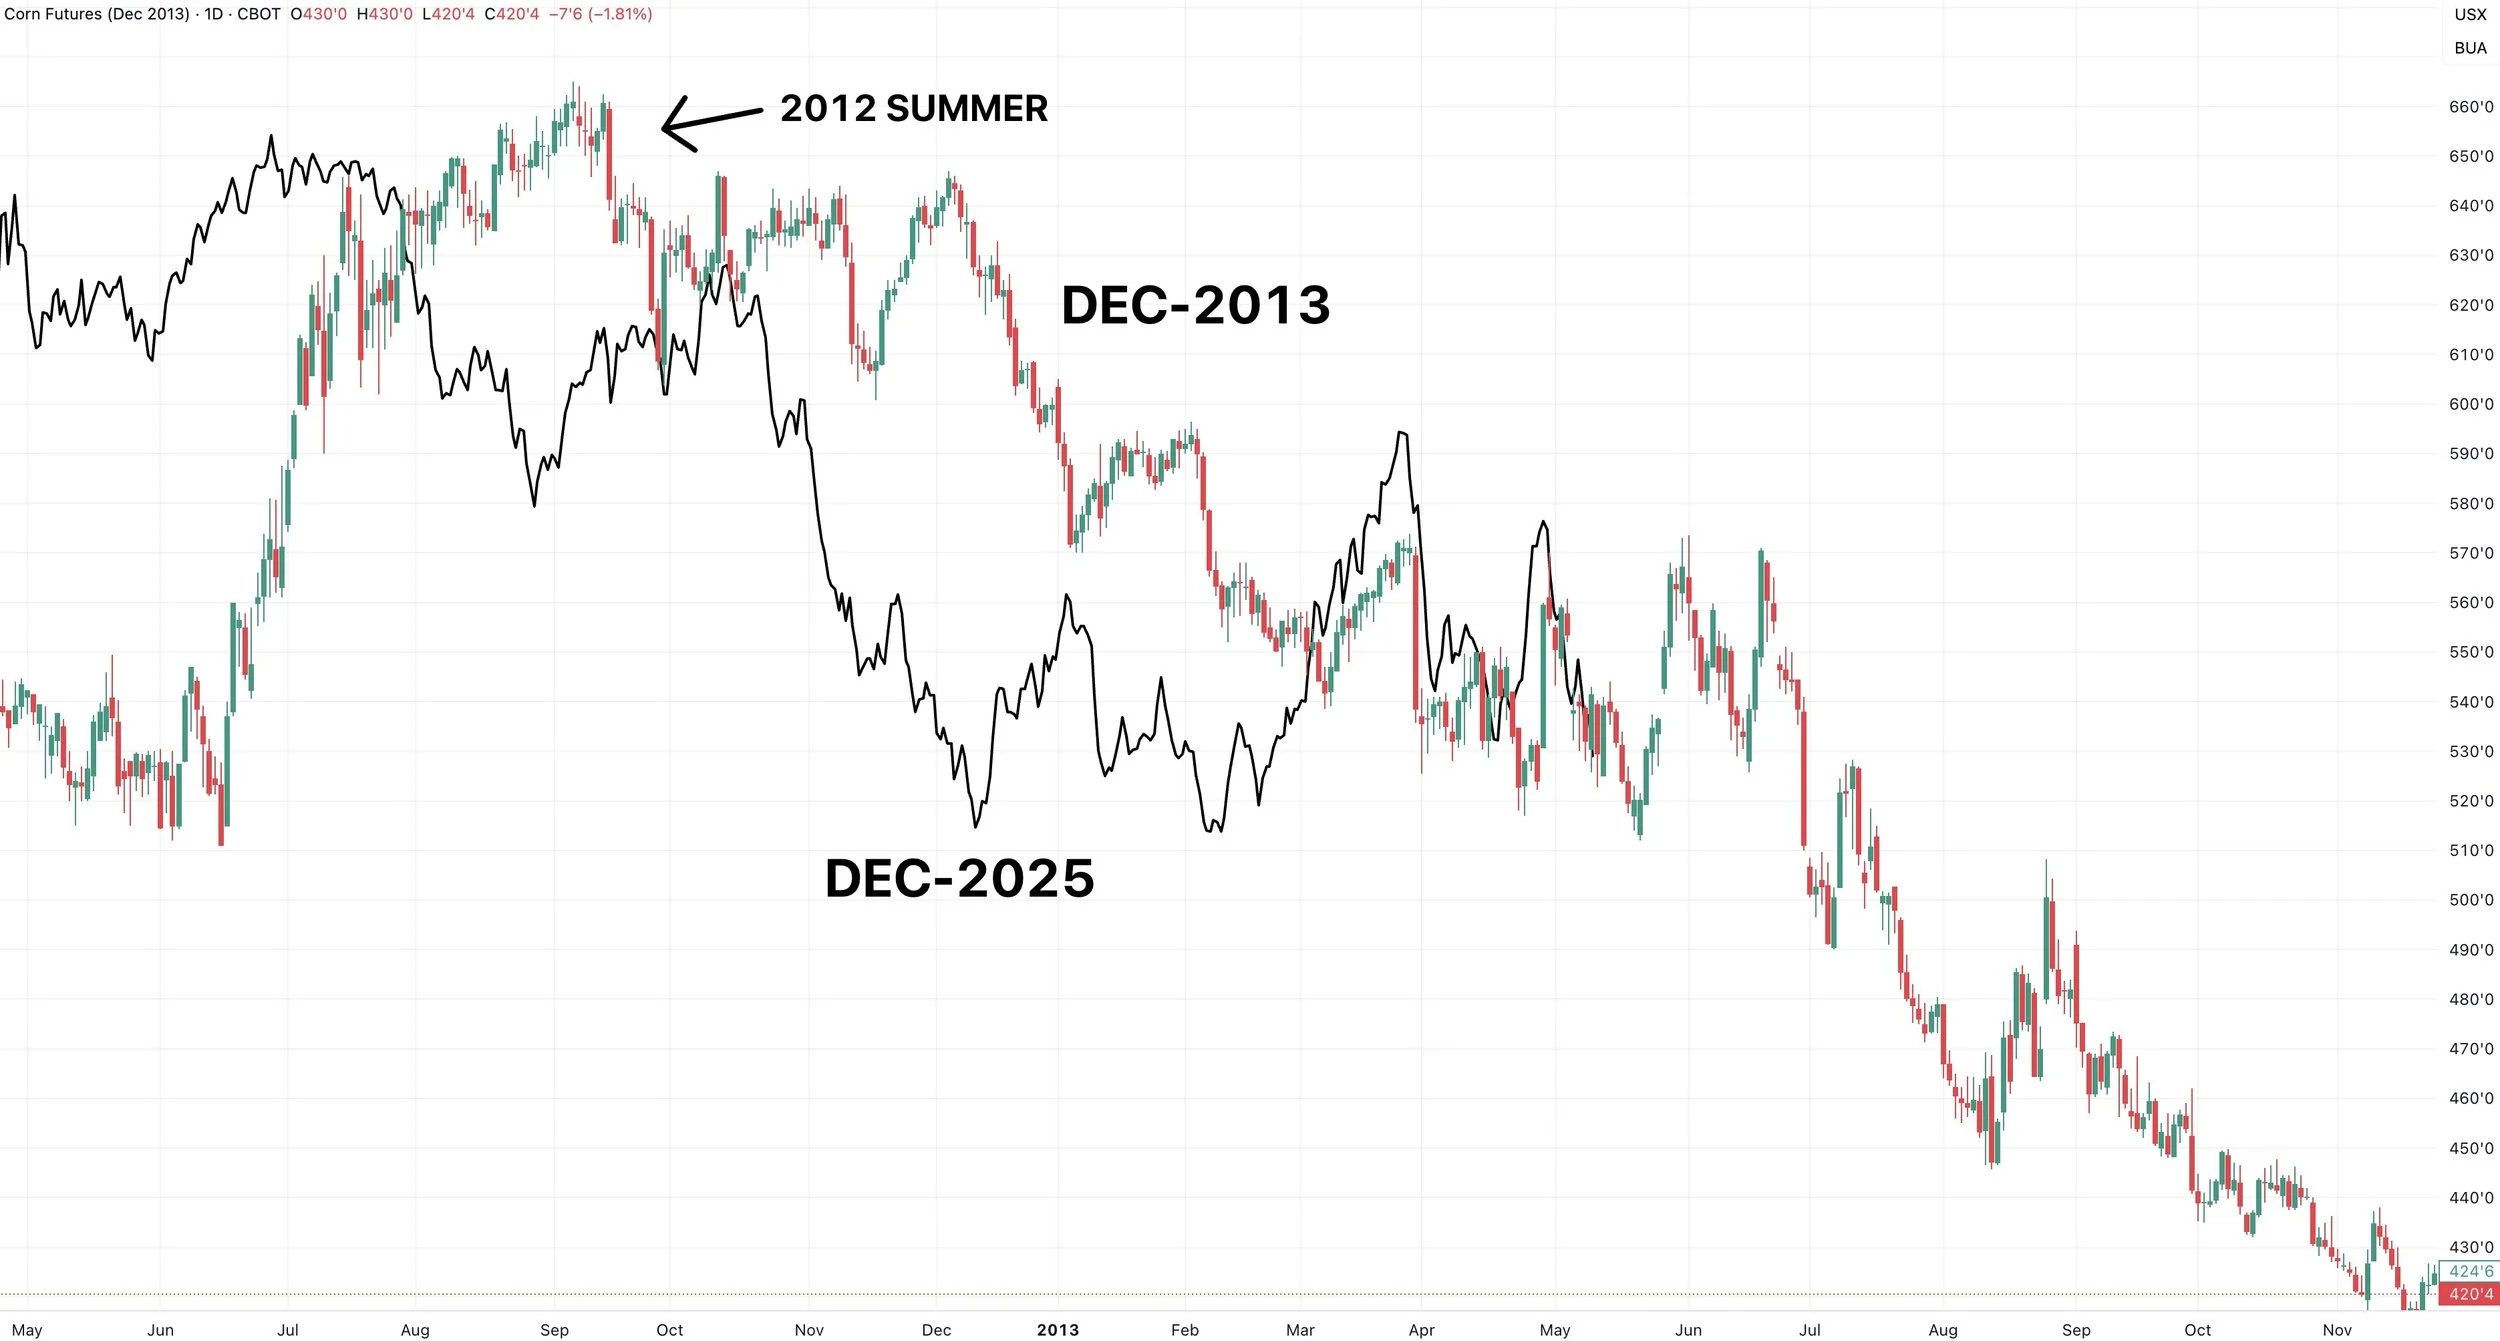
2013 - Ideal Summer, Coming Off 2012 Prices
Another year that provided no scare.
However, there is some context that has to be added.
Prices were basically in a down fall the entire year.
We were coming off the historic 2012 rally and high prices.
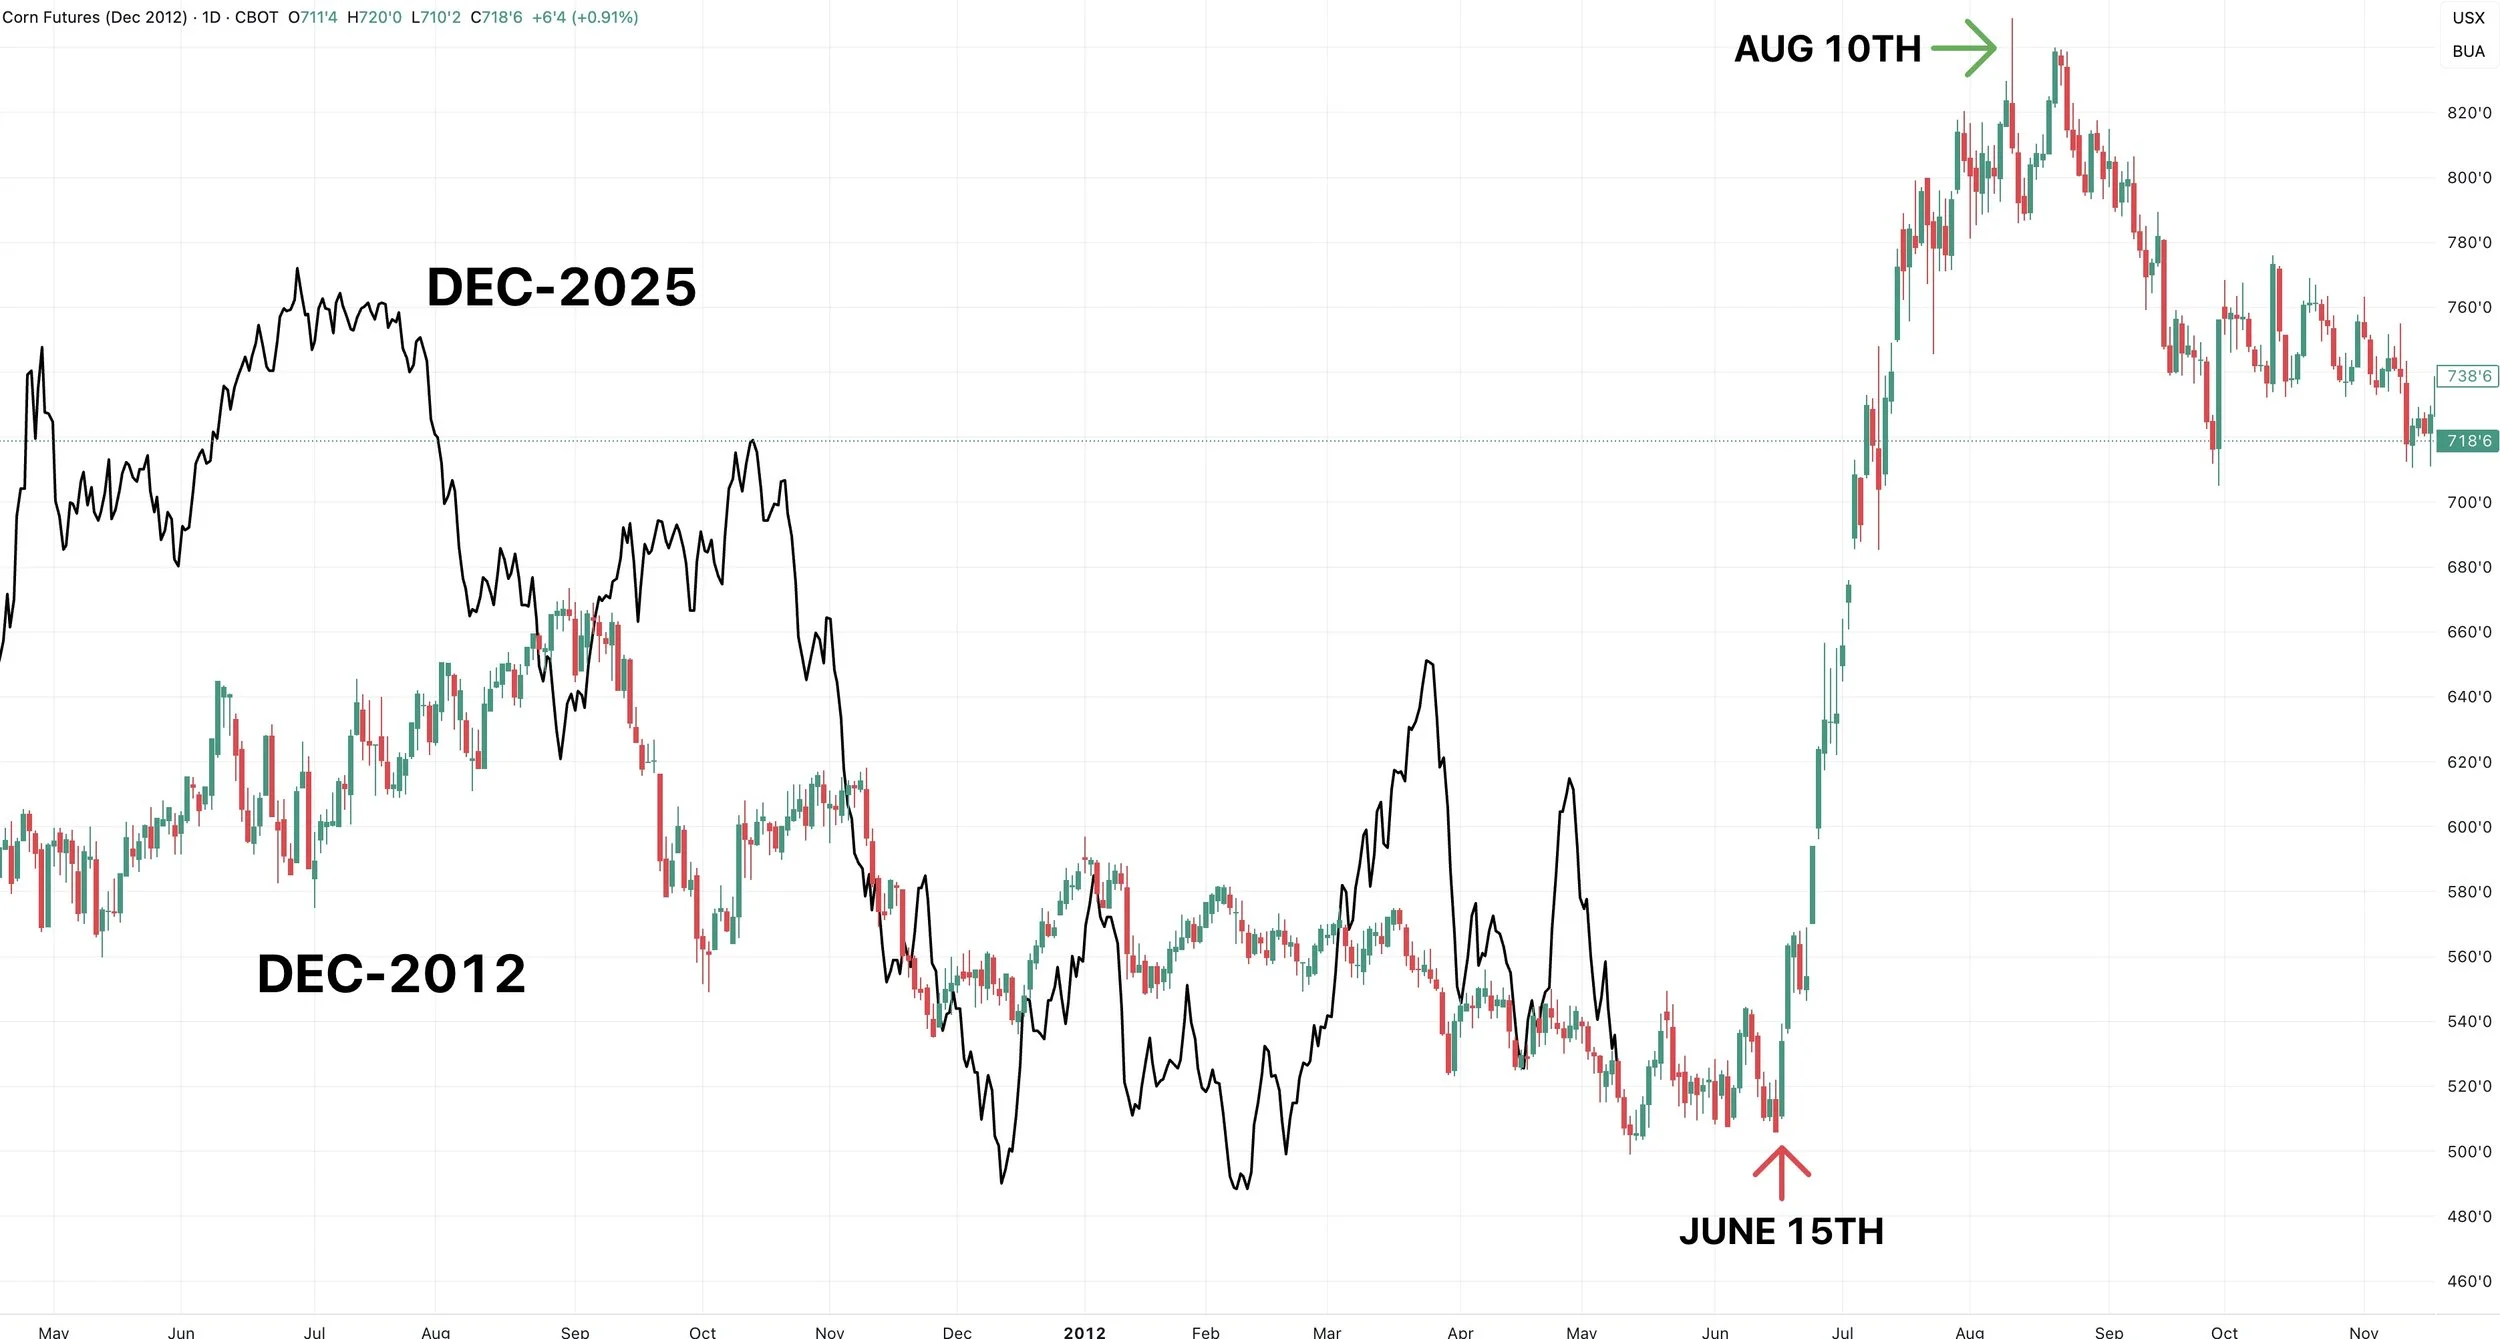
2012 - "The Drought"
I don’t need to say anything about this year.
We bottomed on June 15th, then saw the historical rally that topped out nearly two months later on August 10th.
Do we have to get a weather rally? No of course not.
But the current summer forecasts are still hot and dry.
The point is that if we do get one, you need to be ready.
As most of these rallies crash faster than they come.
Plenty of these years saw the rally vanish in a few days to weeks.
Whether the opportunity came from demand or weather, there are virtually only 3 years that did not provide a real opportunity.
2024, 2018, and 2014 (can include 2013 as well, but we were coming off 2012 and elevated prices to begin with).
Dec Corn 20 Year Seasonal
This is the past 20 years of cumulative price action for Dec corn.
No two years are the same, and this is just a seasonal, so we do not have to follow it exactly.
There will be some years we completely veer off path.
But if you take every years price action and put it together, on average we bottom very soon.
Before topping mid-June then falling apart.

Today's Main Takeaways
Corn
Fundamentals:
Short term corn has no story and zero reason to rally until most of the crop is in the ground and a dry forecast is bullish not bearish to prices.
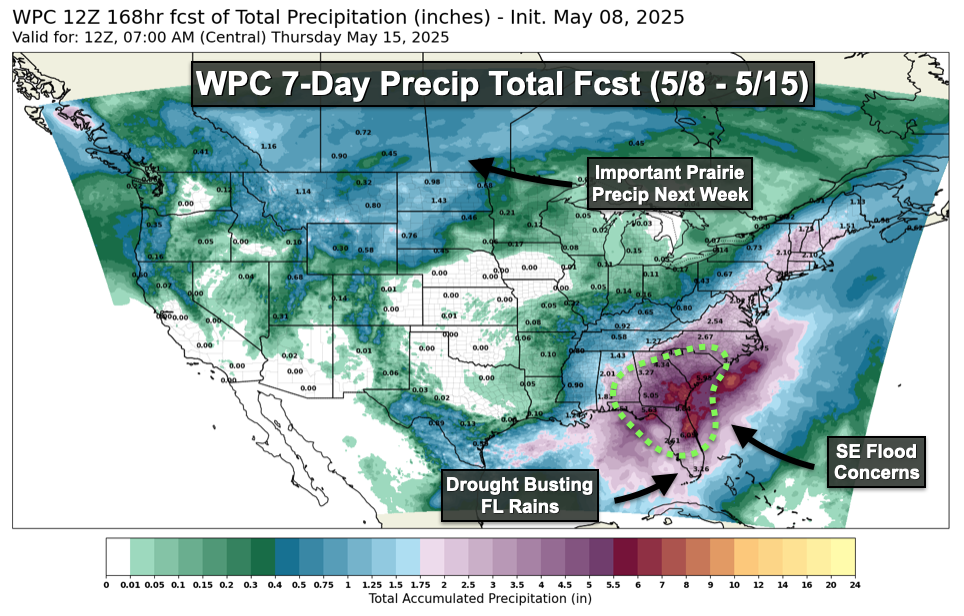
Planting is ahead of pace and the forecasts say we are going to have a wide open planting window for the next week. Which is bearish.
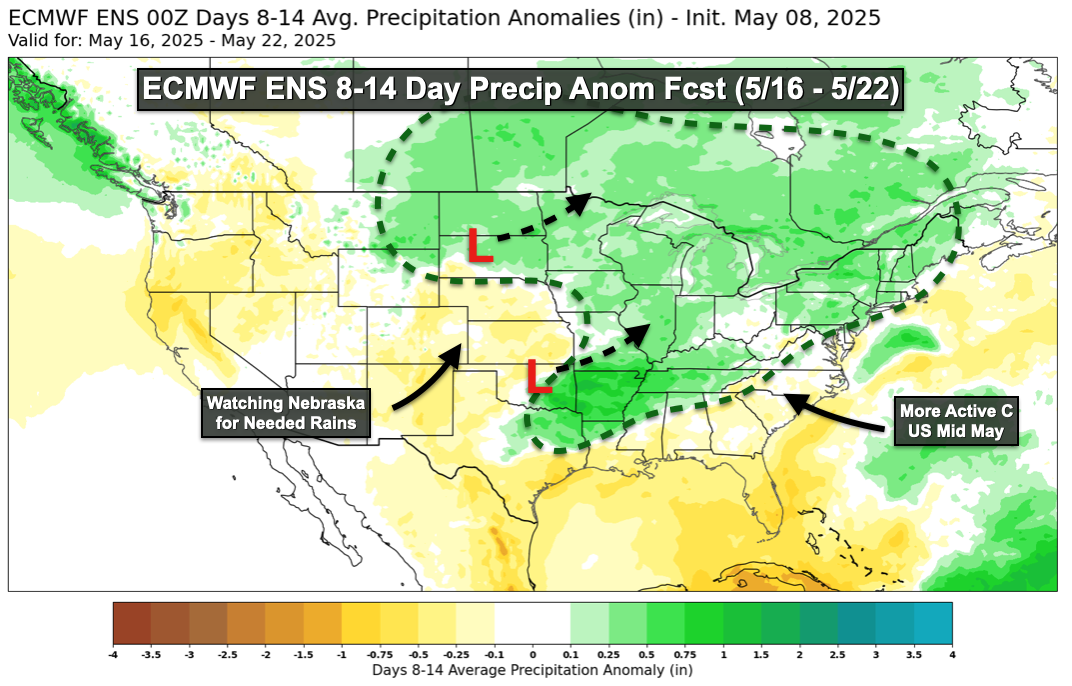
However, rains are scheduled for most of the corn belt in the 8-14 day forecast. I'd consider that more bearish than bullish, as we're going to have a good chunk of this crop in the ground, so this will ultimately just help moisture.
Next 7 Days from Nutrien Ag
8-14 Day from Nutrien Ag
We have the USDA report on Monday.
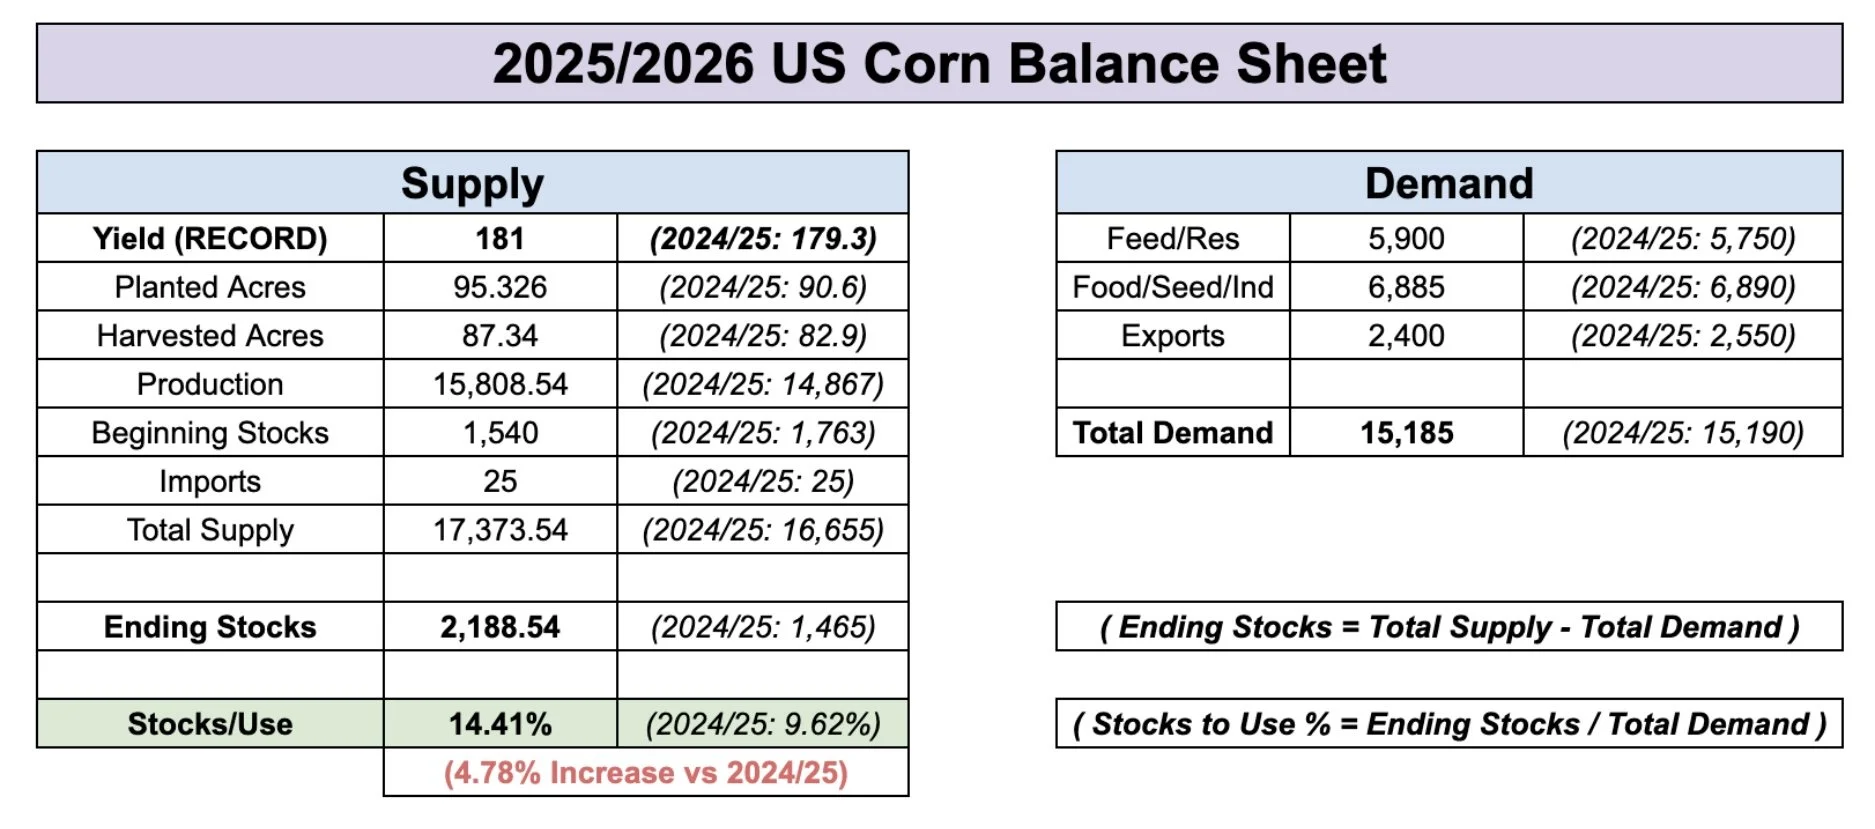
This will be the first official new crop balance sheet. It is going to be a bearish number and show a +2 billion bu carryout.
So that is also adding some fuel to the downside here, as traders know the report is going to be bearish for new crop.
They have a 2.02 billion bu carryout estimate for new crop.
But based on the Feb outlook numbers and March acres, the number should be closer to 2.10 billion. Will depend on how they play around with the demand numbers.
Estimates
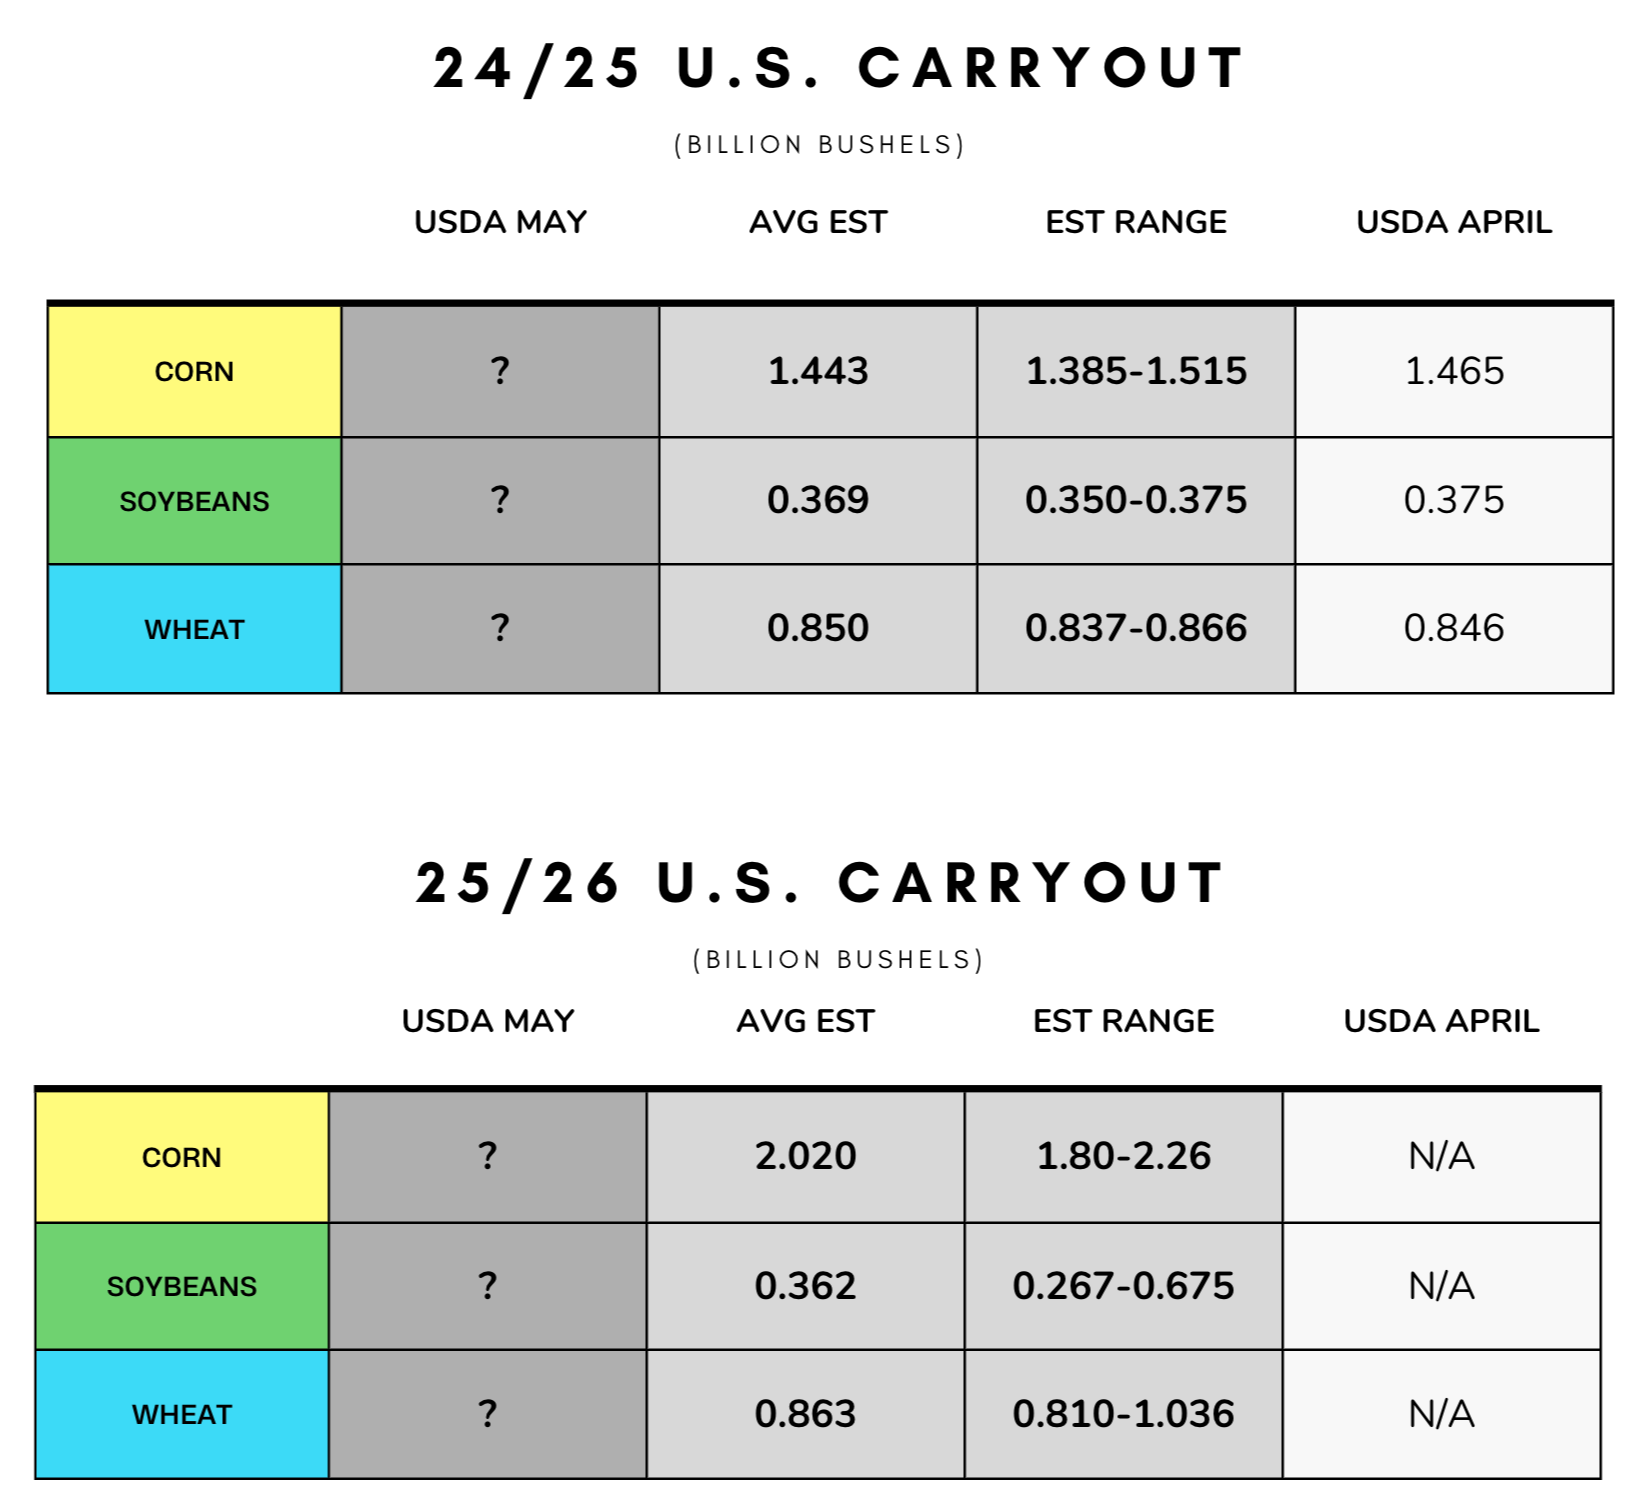
Based on Feb Outlook & March Acres
However, I'd have to imagine a bearish number is mostly priced in. Everyone knows roughly what the new crop balance sheet will look like.
I don't know what numbers the USDA could possibly print that would result in an overly bearish reaction at these levels and after this sell off.
We sold off going into the March report, then once the report came out we were able to move higher. Perhaps we see a similar "sell the rumor, buy the fact" event. Where once we get confirmation of bearish numbers, we will be able to find some footing.
As for marketing, we had the sell signals in Feb and April. Now just going to be waiting for that seasonal opportunity if we get one.
July Corn - 2024 vs 2025
Here is an argument bulls could make that the old crop sell off was slightly overdone.
$4.40 was the lows for July corn last year from April until June.
We had lows of $4.42 today.
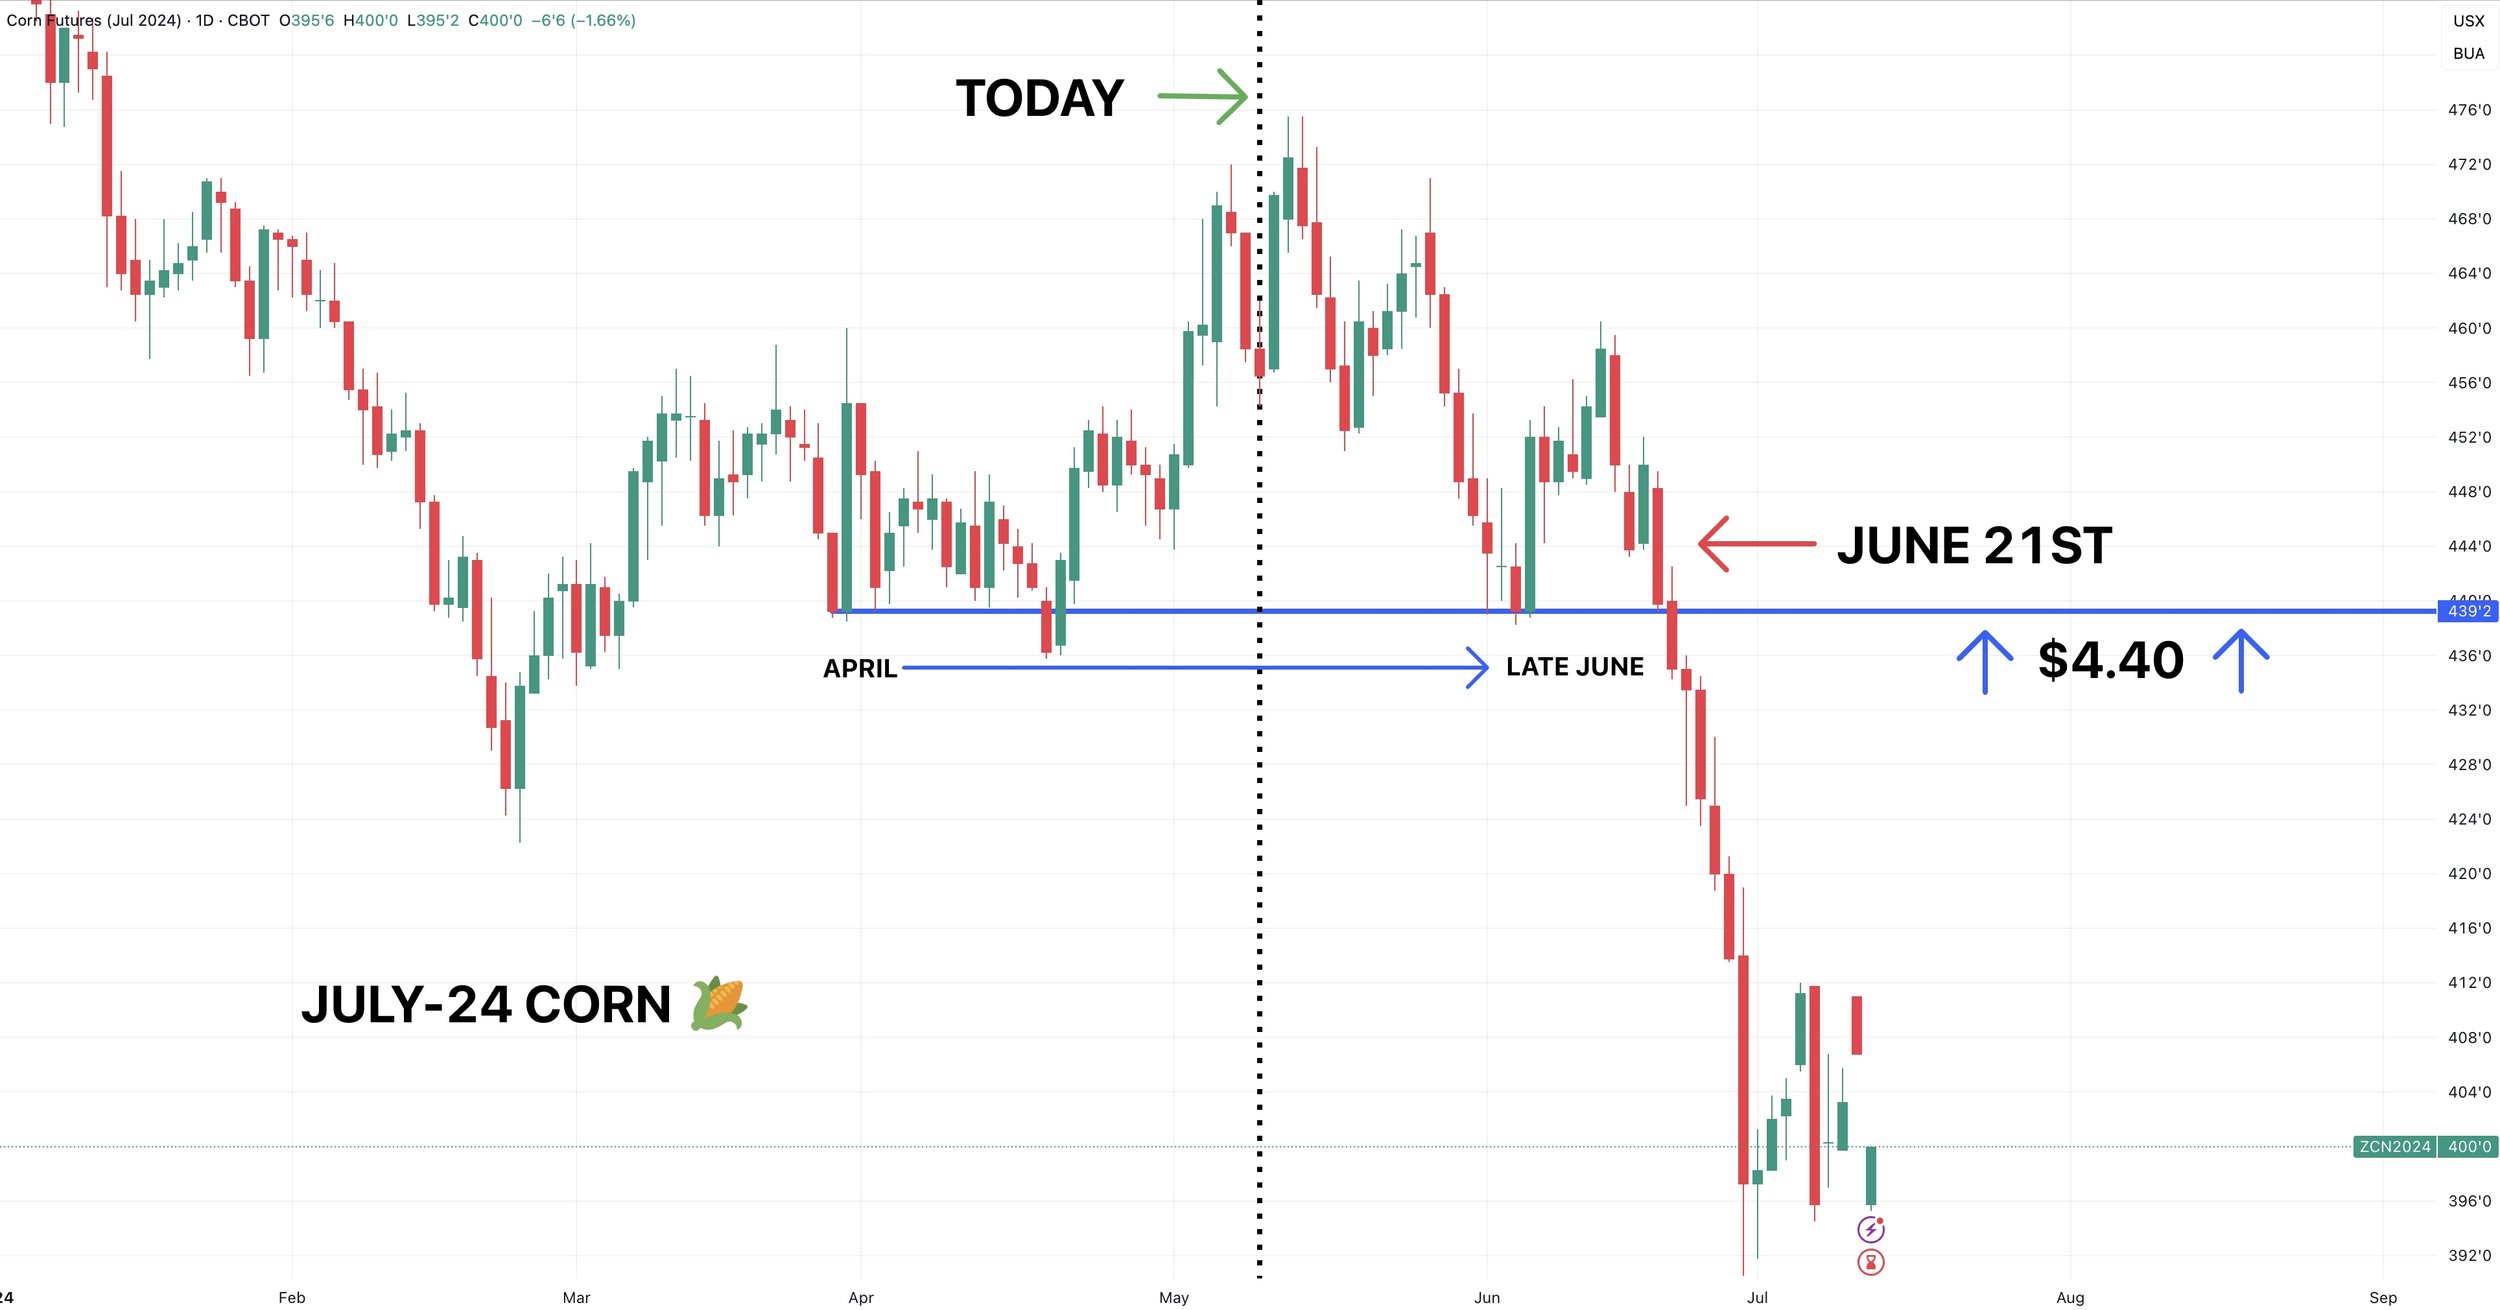
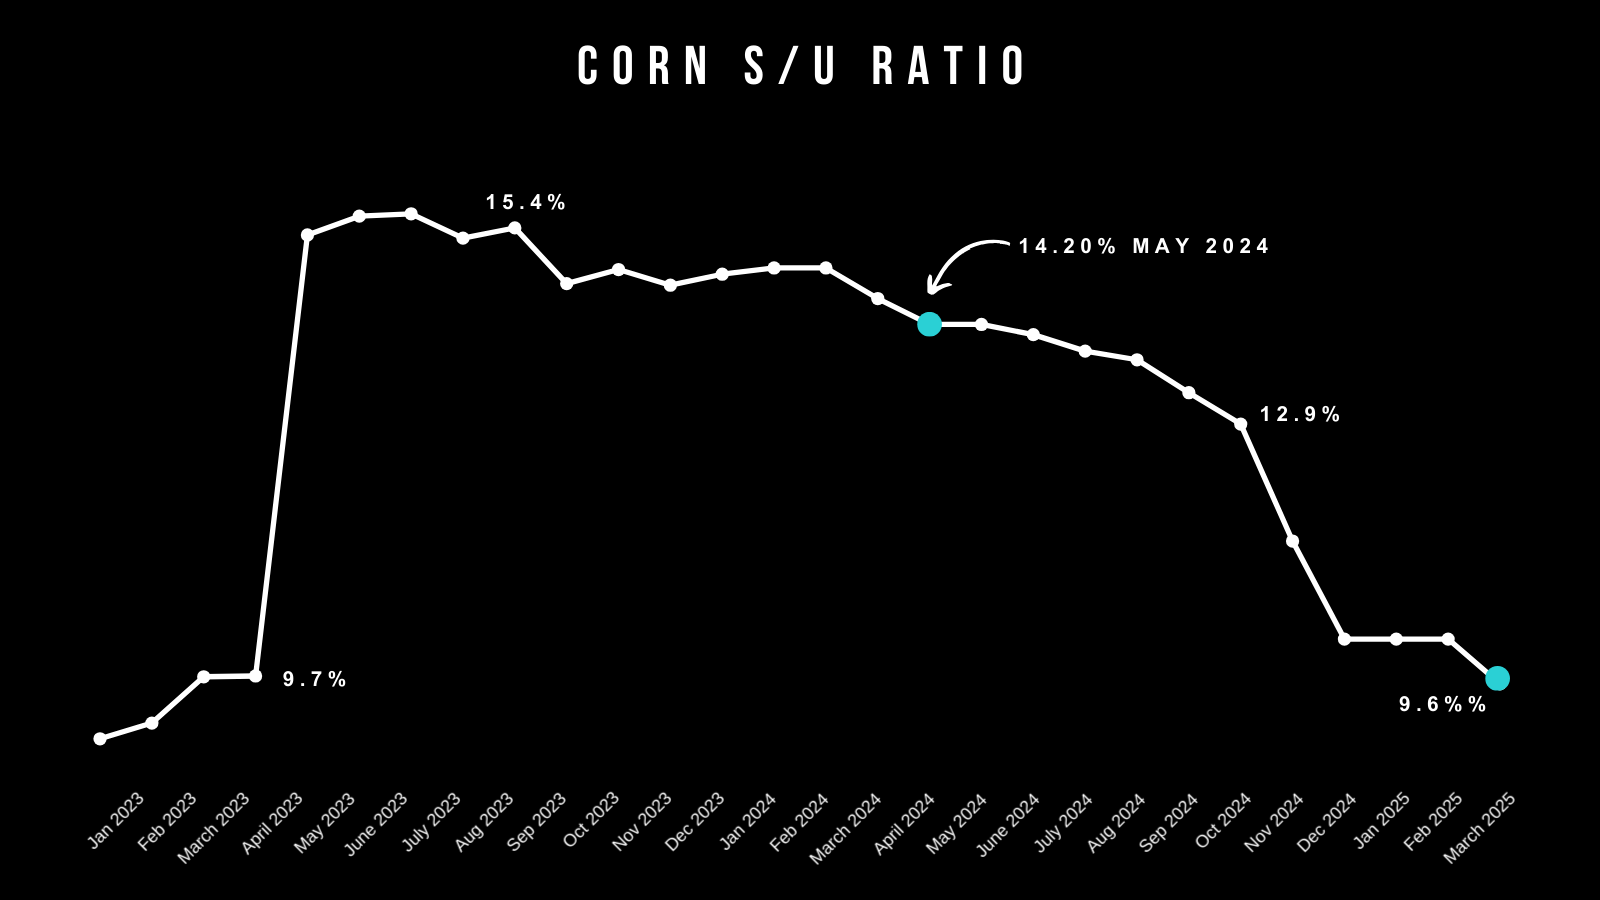
However, last year in July we had a 14% stocks to use ratio.
Today old crop a sub 10% stocks to use ratio.
Yes the new crop situation is far from bullish, but old crop is still far more bullish than it was last year.
Yet we are right at where July corn posted it's lows last year at this same time period.
Technicals:
Good close in July corn today.
Currently sitting right at this first support of $4.45 today.
If this support fails, we then have support at $4.37.
Our big picture upside target of $5.23-26 became invalid as broke below the March lows (that target was 161.8% of the April rally. Since we broke below the starting point of that rally, it is no longer valid).
We will have our next upside target once we think corn has put in a bottom.

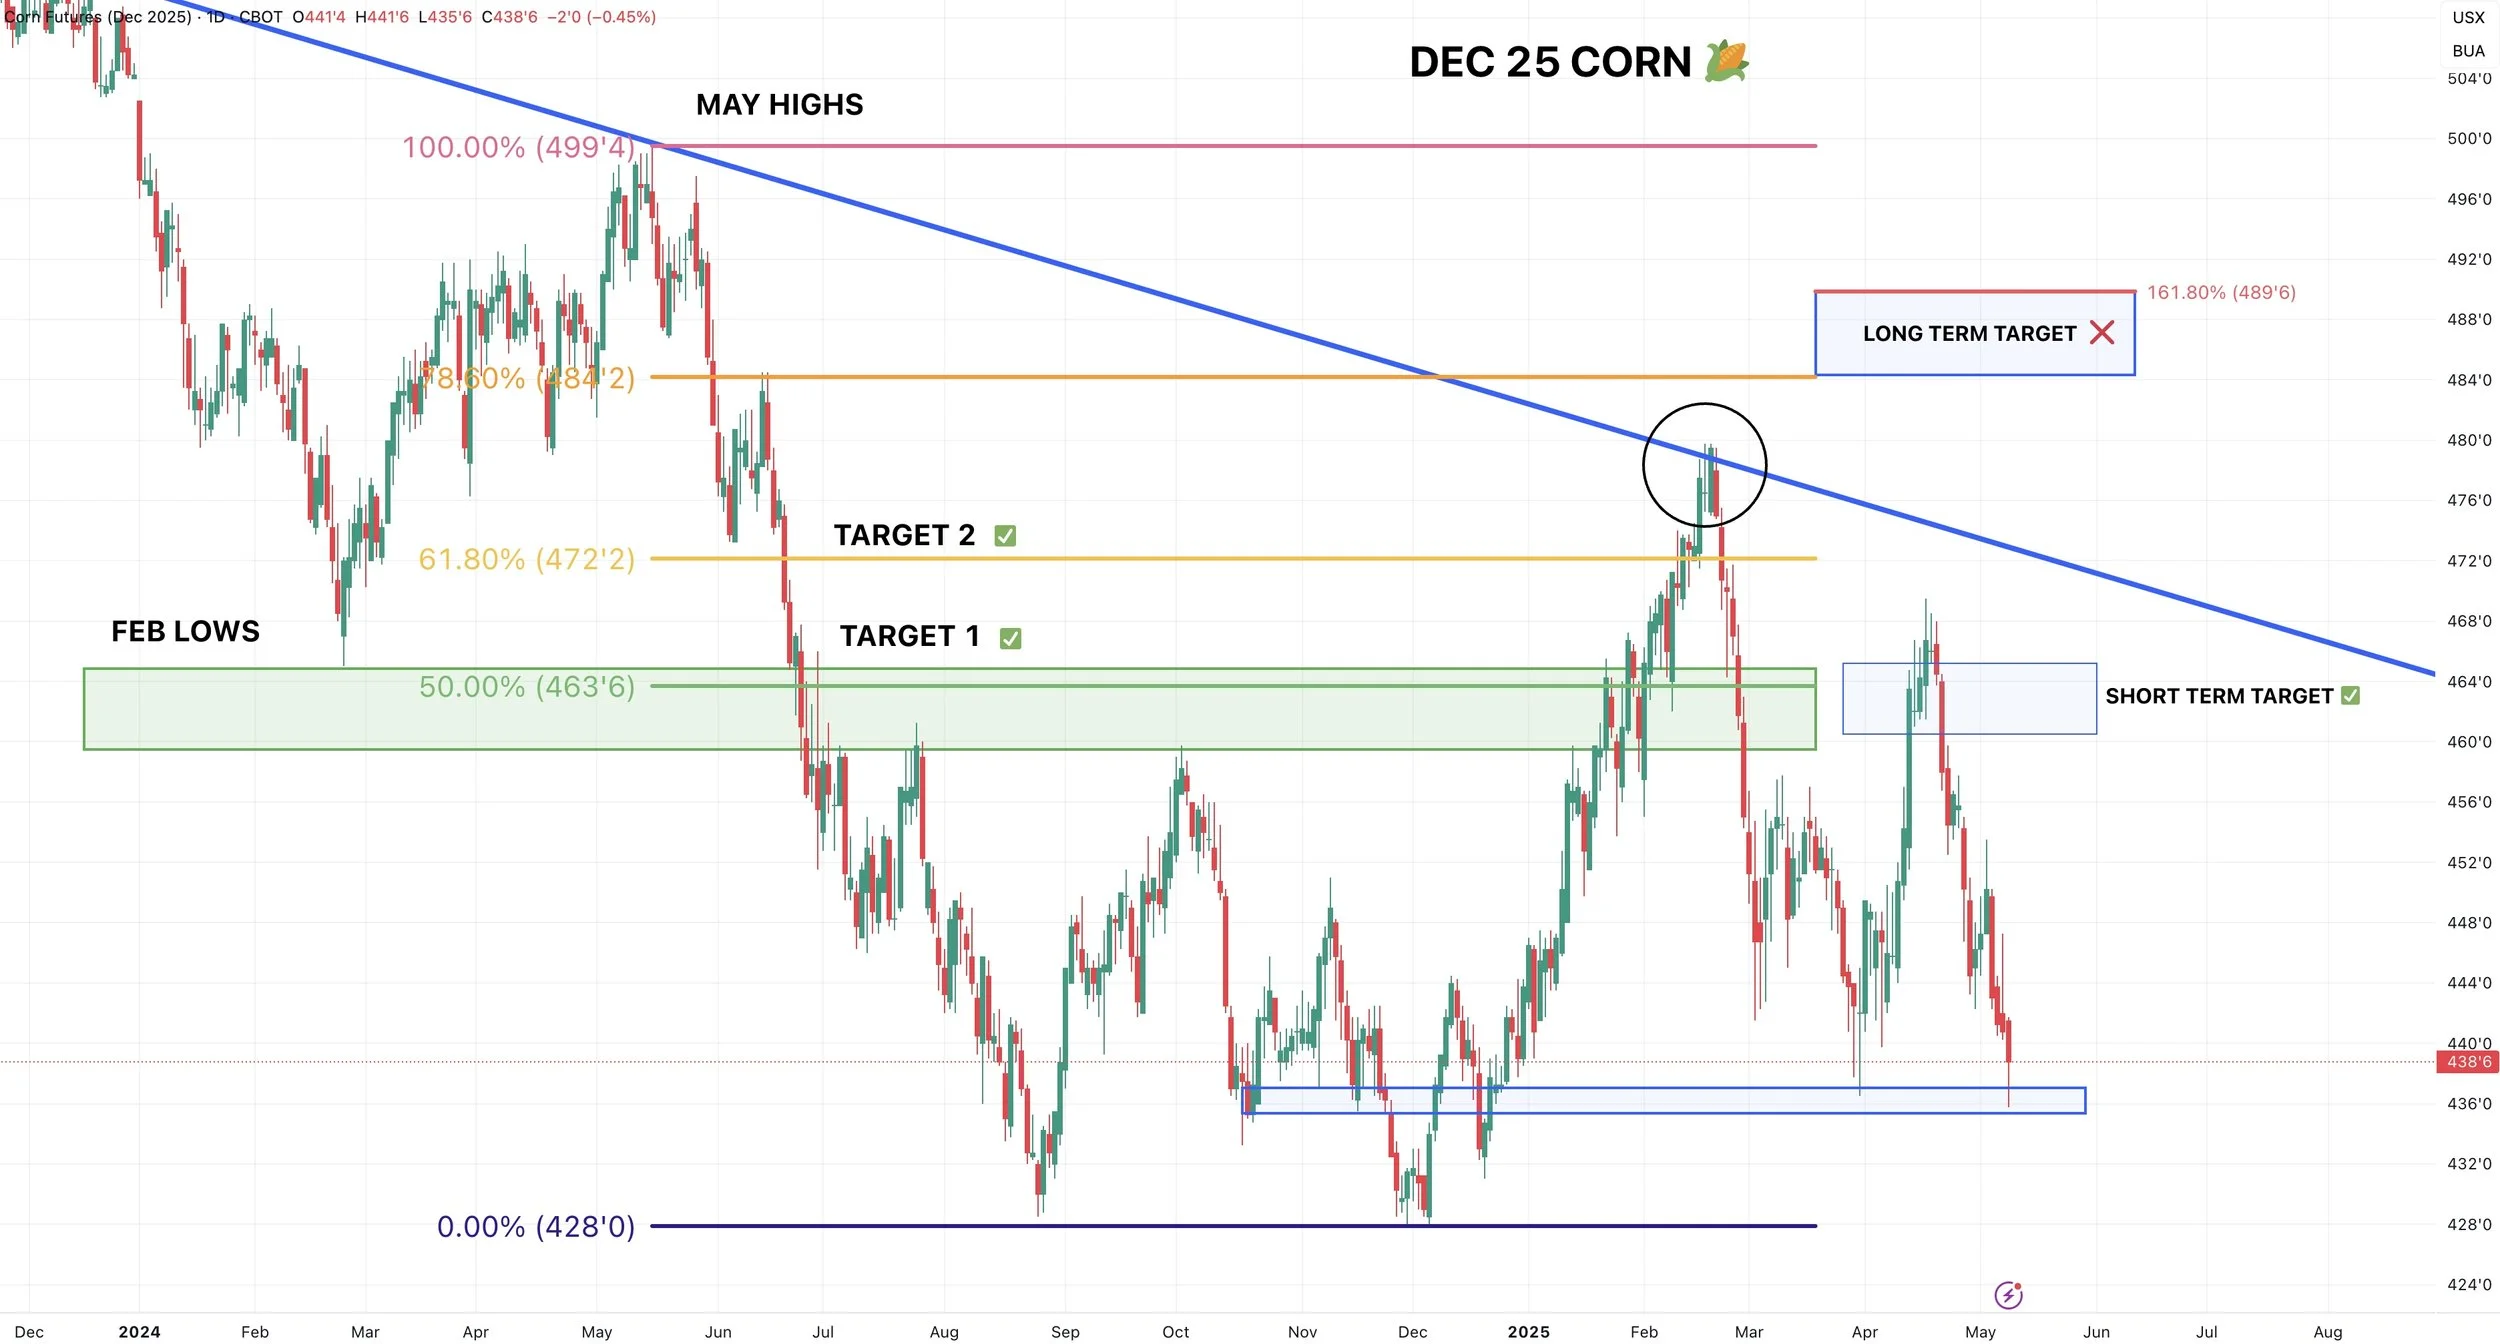
For Dec-25, we are sitting at our support level right at those March lows.
If this support does not hold, next support is going to be those lows.
Like July, the upside target of $4.84-89 became invalid as we broke the March lows.
Will have our next upside target once we think we've found a bottom.
Soybeans
Fundamentals:
Soybeans continue to hang on while corn & wheat fall apart.
Part of this might be optimism surrounding trade deals. Part of it is that soybeans have simply priced in pretty much every known bearish factor over the past 8 months.
We battled the monster Brazil crop. We endured having the largest global stocks on record. What is really left to jump on the mega bearish bandwagon?
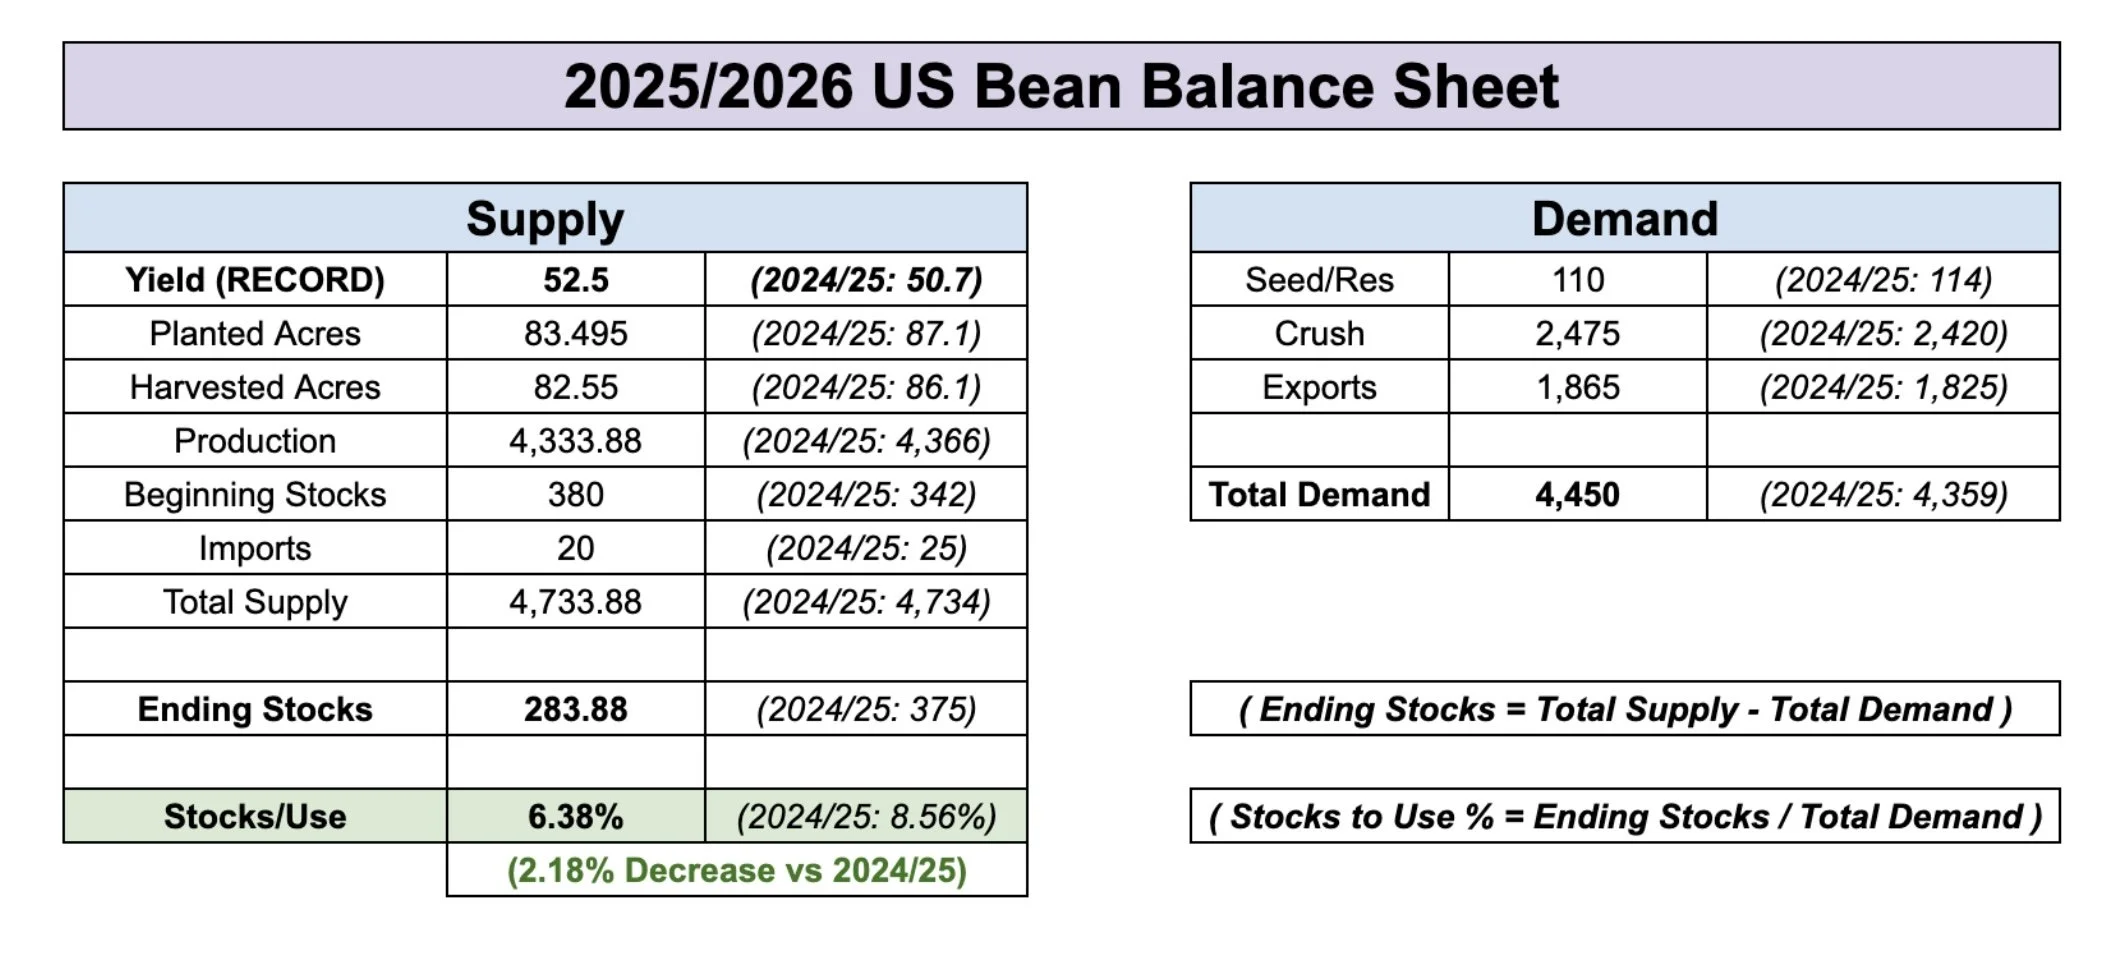
The other part on why prices have hung in there is probably due to the fact that the new crop balance sheet should be a lot tighter than last year. Record yield or not. Simply due to less acres.
Monday's USDA report should show this.
Here are the estimates vs the numbers based on the Feb outlook and March acres.
They have a 362 million bu carryout for new crop. But based on the Feb and March numbers, it should be closer to 300 million. Again, will depend on what they do to demand.
Estimates

Based on Feb Outlook & March Acres
The news of a trade deal with China would provide an initial rally. But the deal is going to take an extremely long time to iron out and to fully see the effects show up on the balance sheet.
Short term, we already got the initial shock of China tariffs and are now trading higher than before the trade war hit. The trade war only becomes bearish if we don’t have a deal by harvest. This is because that is when China buys our beans.
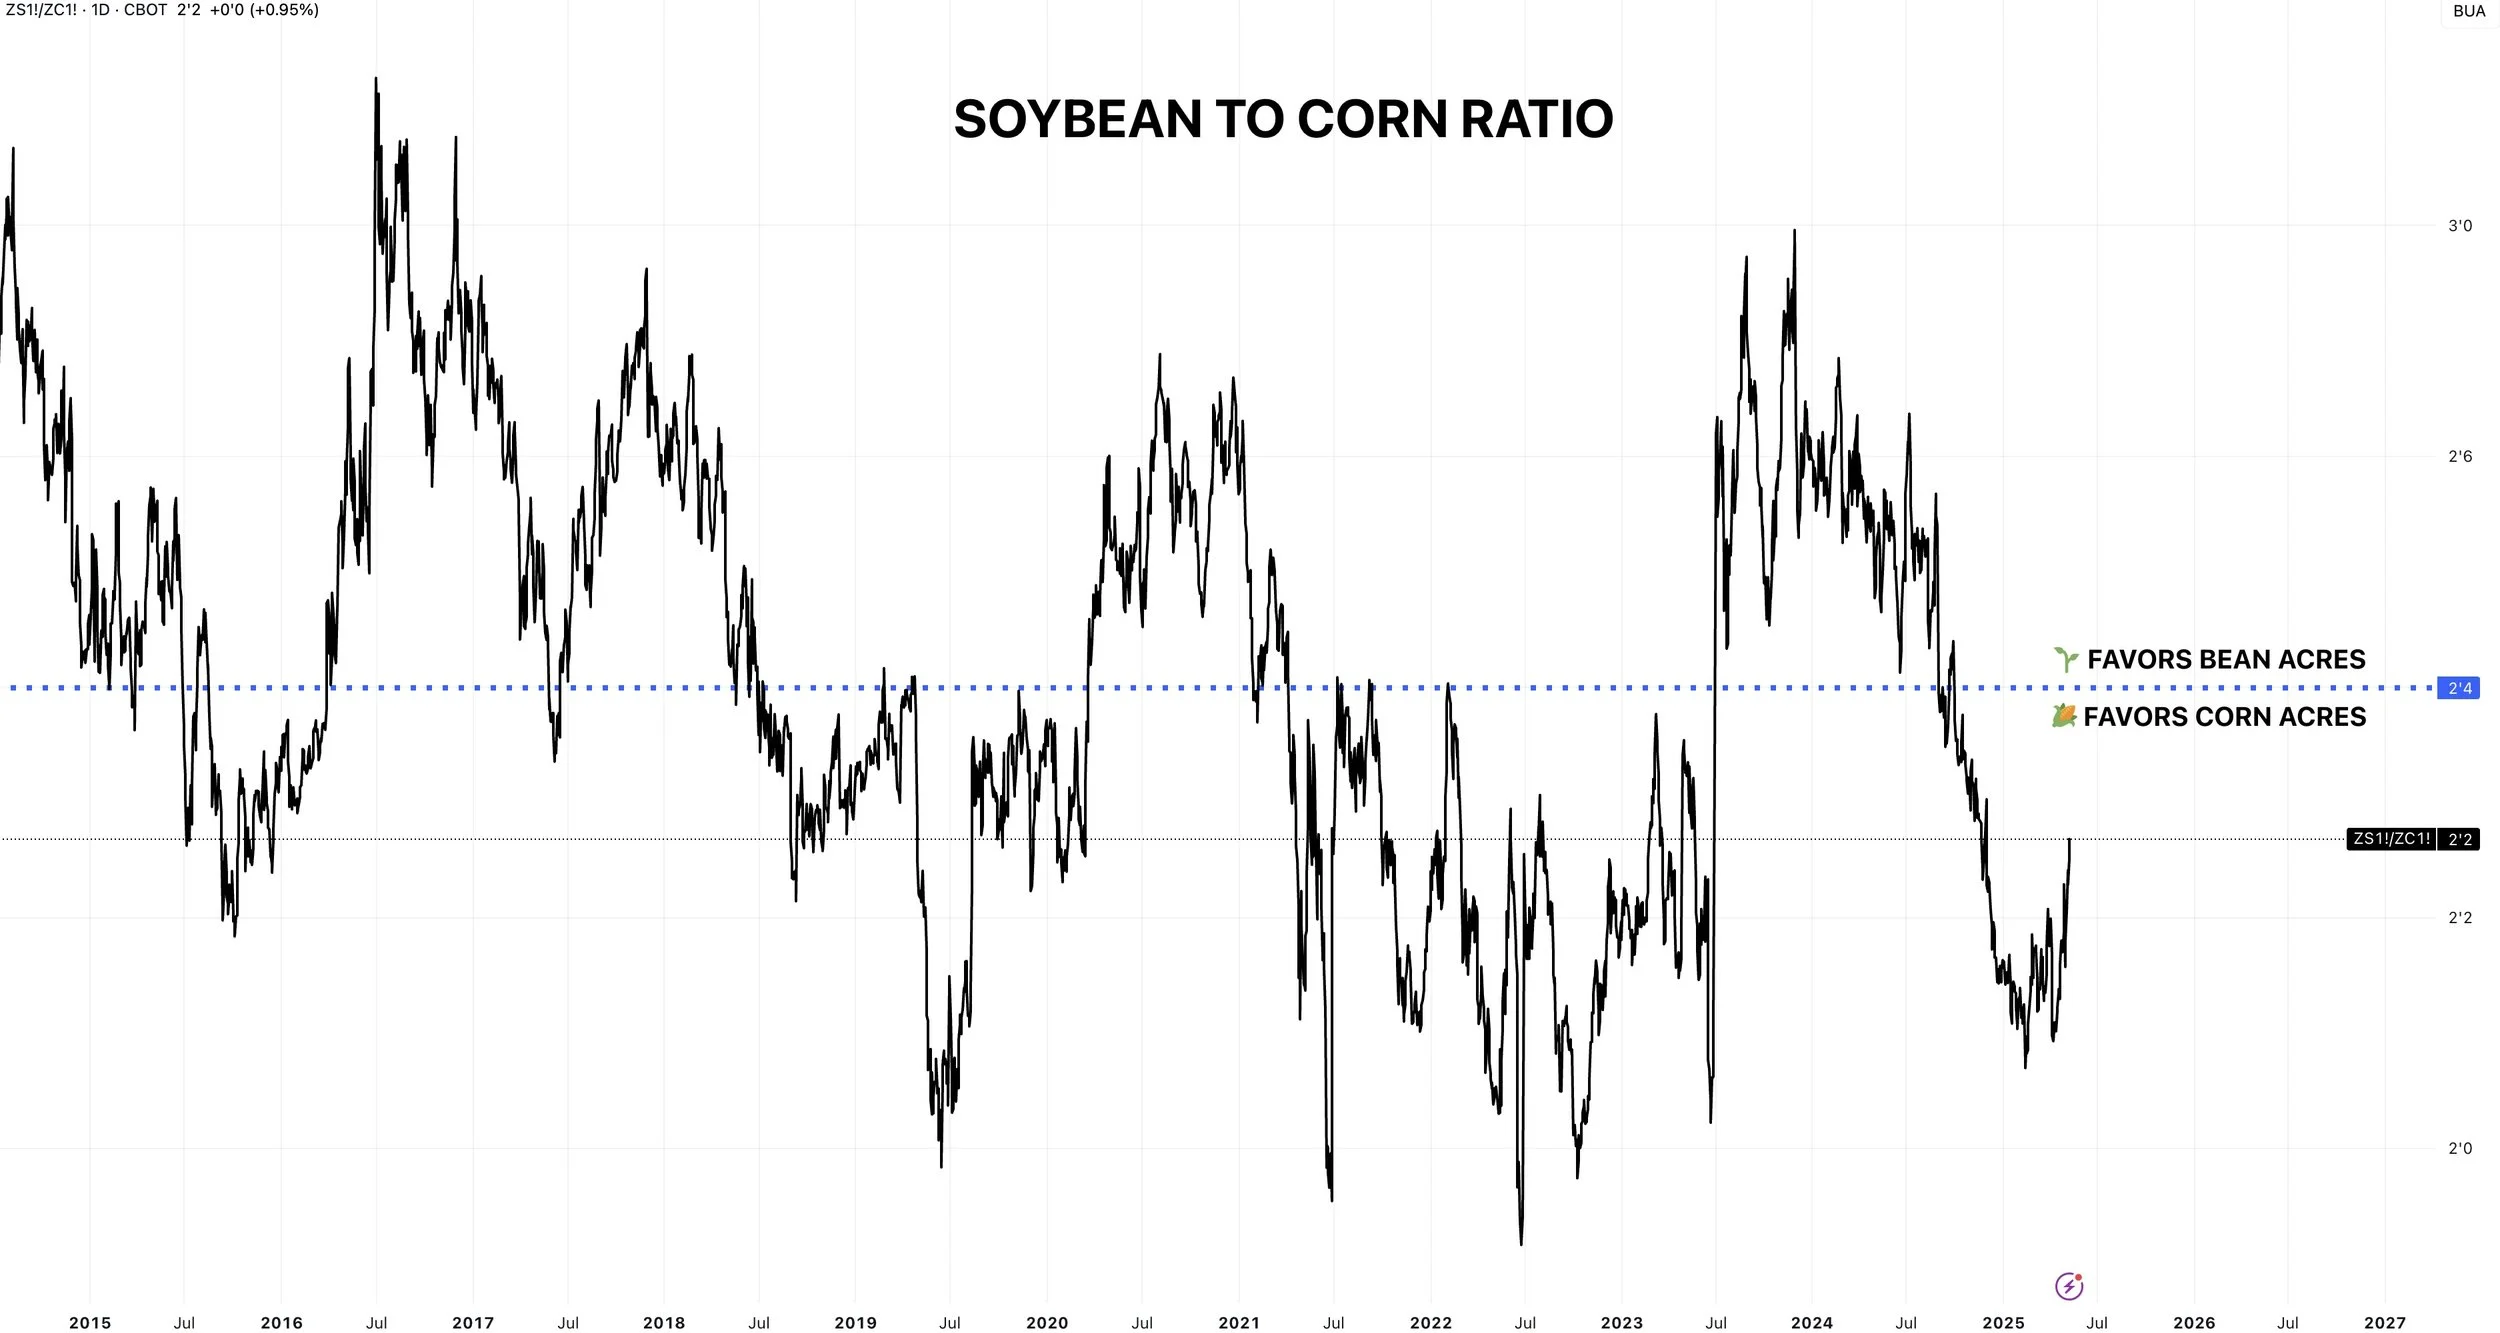
Corn to Soybean Ratio:
Here is soybean prices divided by corn prices.
For months, the ratio heavily favored corn. Meaning beans were undervalued relative to corn. As a result, we saw a big acre shift this year towards corn.
This is how the market naturally fixes itself.
Now that we are looking at big corn acreage, the ratio is starting to swing the other way.
As I've talked about, the smaller bean acres have created a path for a much tighter new crop balance sheet.
For the ratio to rise, corn has to either fall, or soybeans have to rally.
The market created this setup. Now it is positioned for soybeans to play catch up and restore the balance.
Technicals:
July beans still pretty much just trapped between the 100-day and 200-day MAs.
Bulls need to break above the 200-day MA and build a base of support above it. We broke above it recently, but failed to turn it into support.
The 200-day MA has marked every major high and keep a complete lid.
At the same time, bulls need to hold the 100-day MA. A clear break below probably makes our next stop the red box.
That box is then the must hold level for bulls to retain upward momentum.
Next target is still currently $11.04

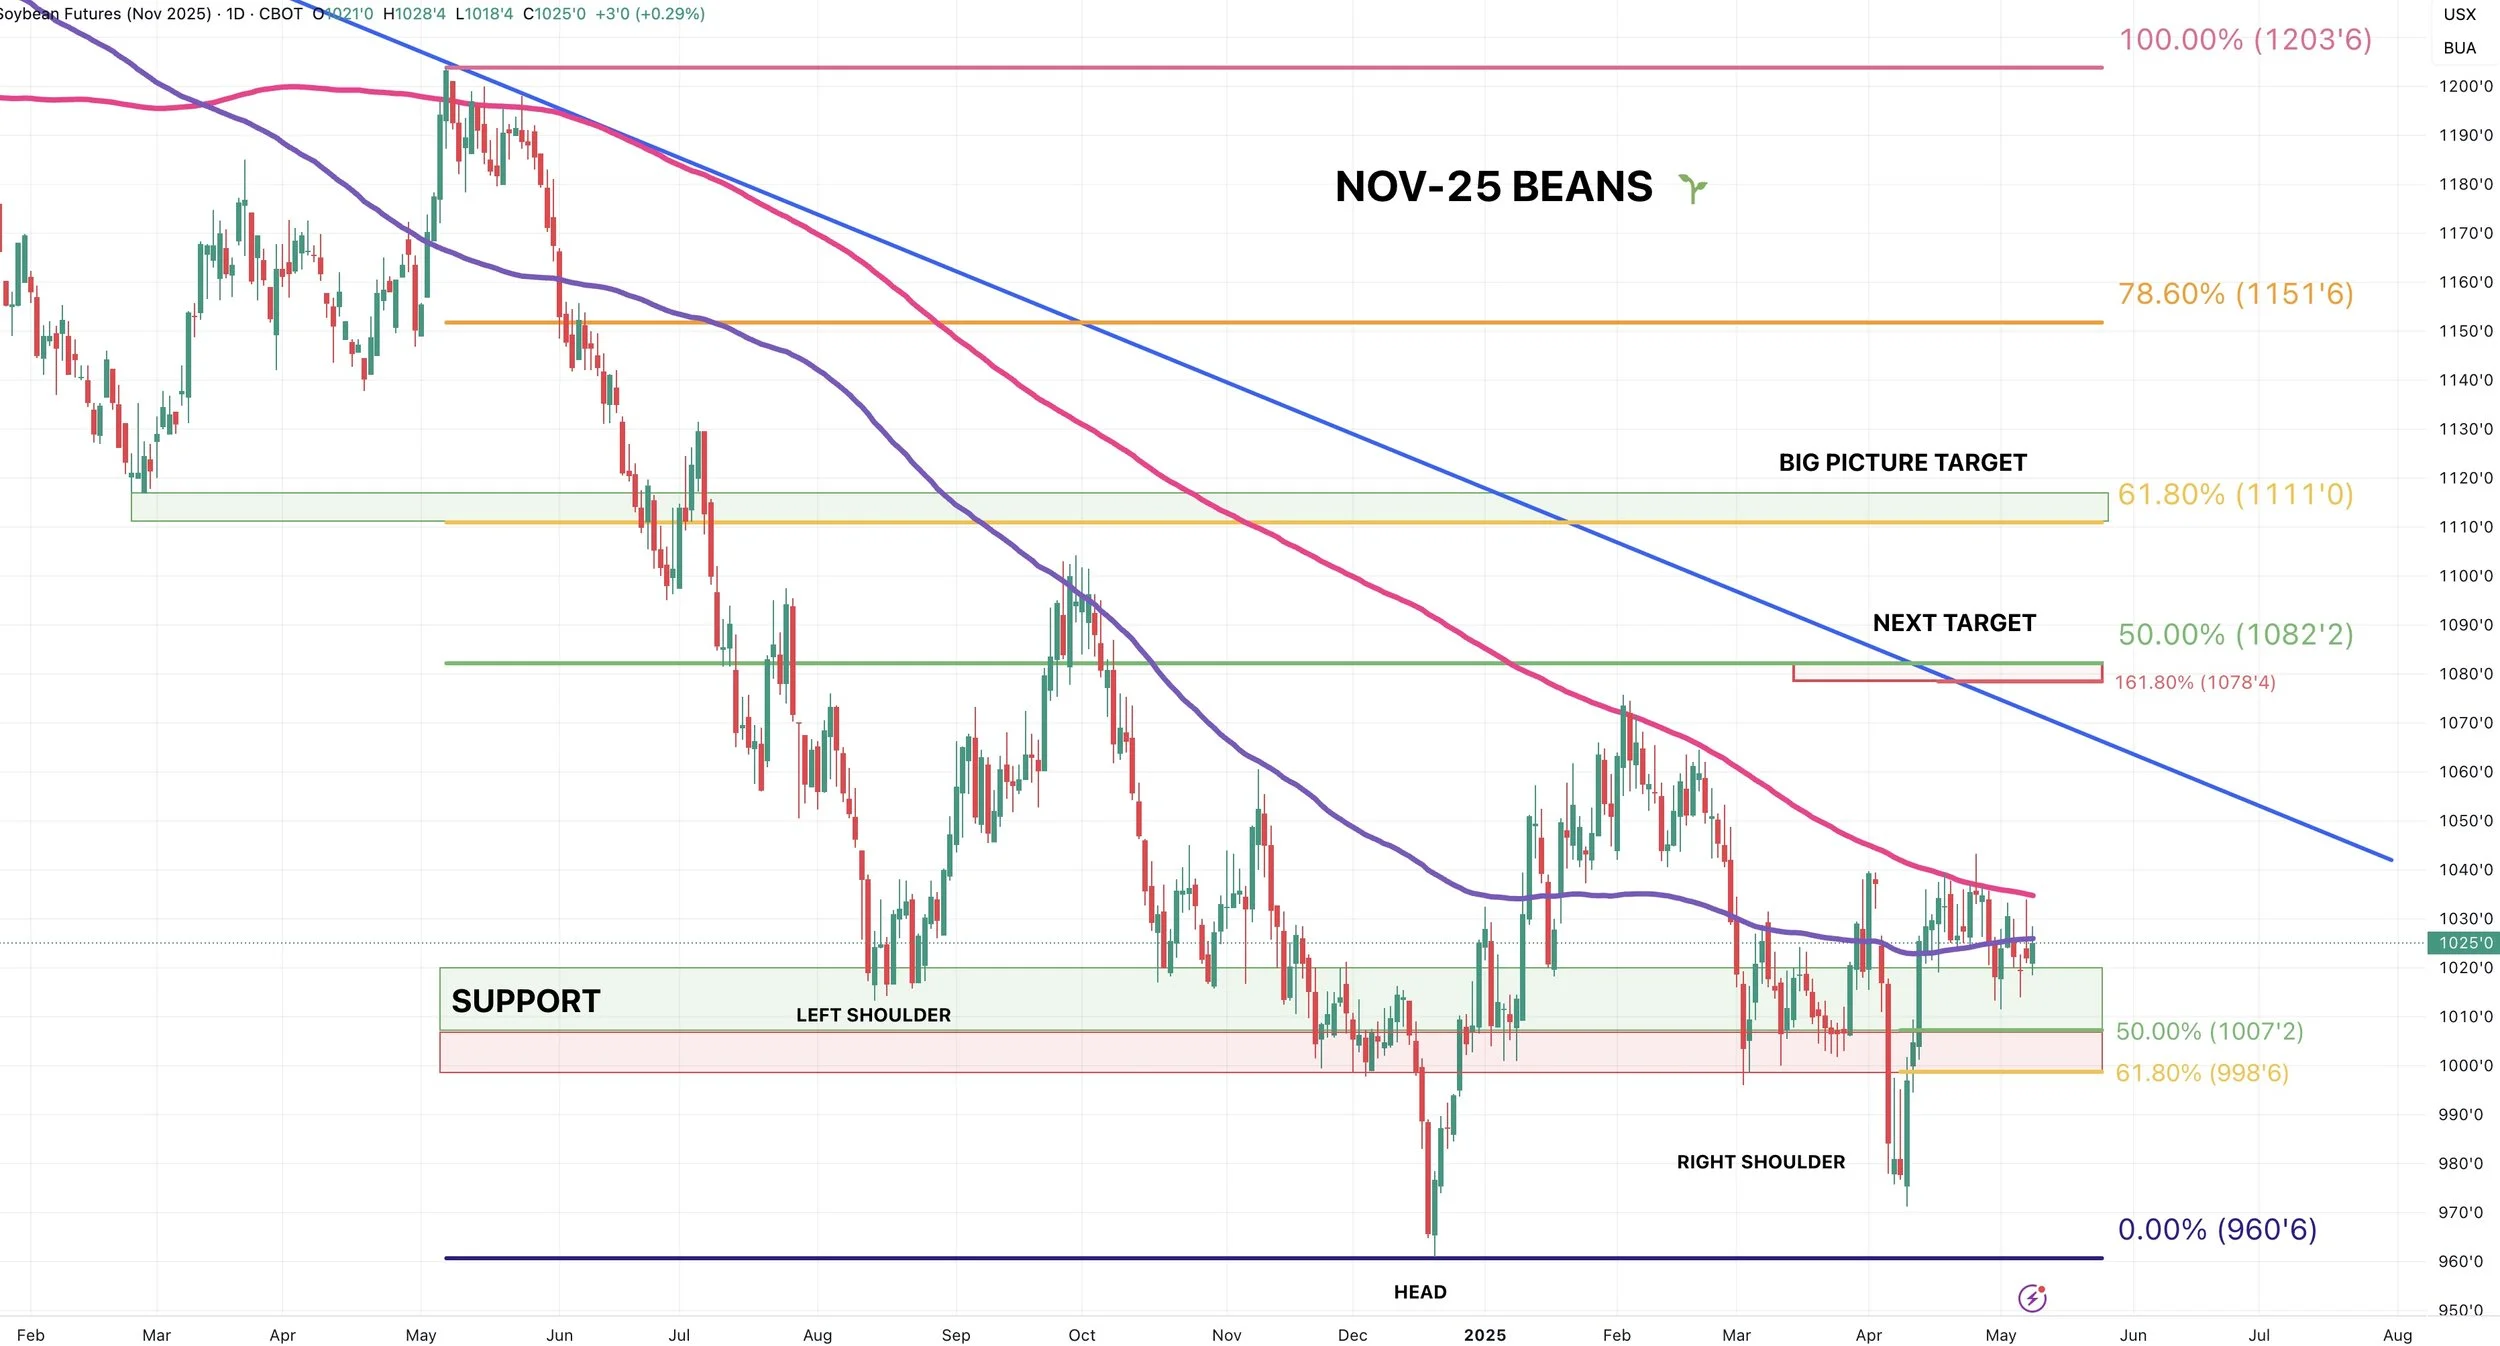
Nov beans still simply trying to break above the 200-day MA.
It has marked pretty much every major top in this market, so a break and hold above would be a great sign.
Next target is still currently $10.78-82
Wheat
Fundamentals:
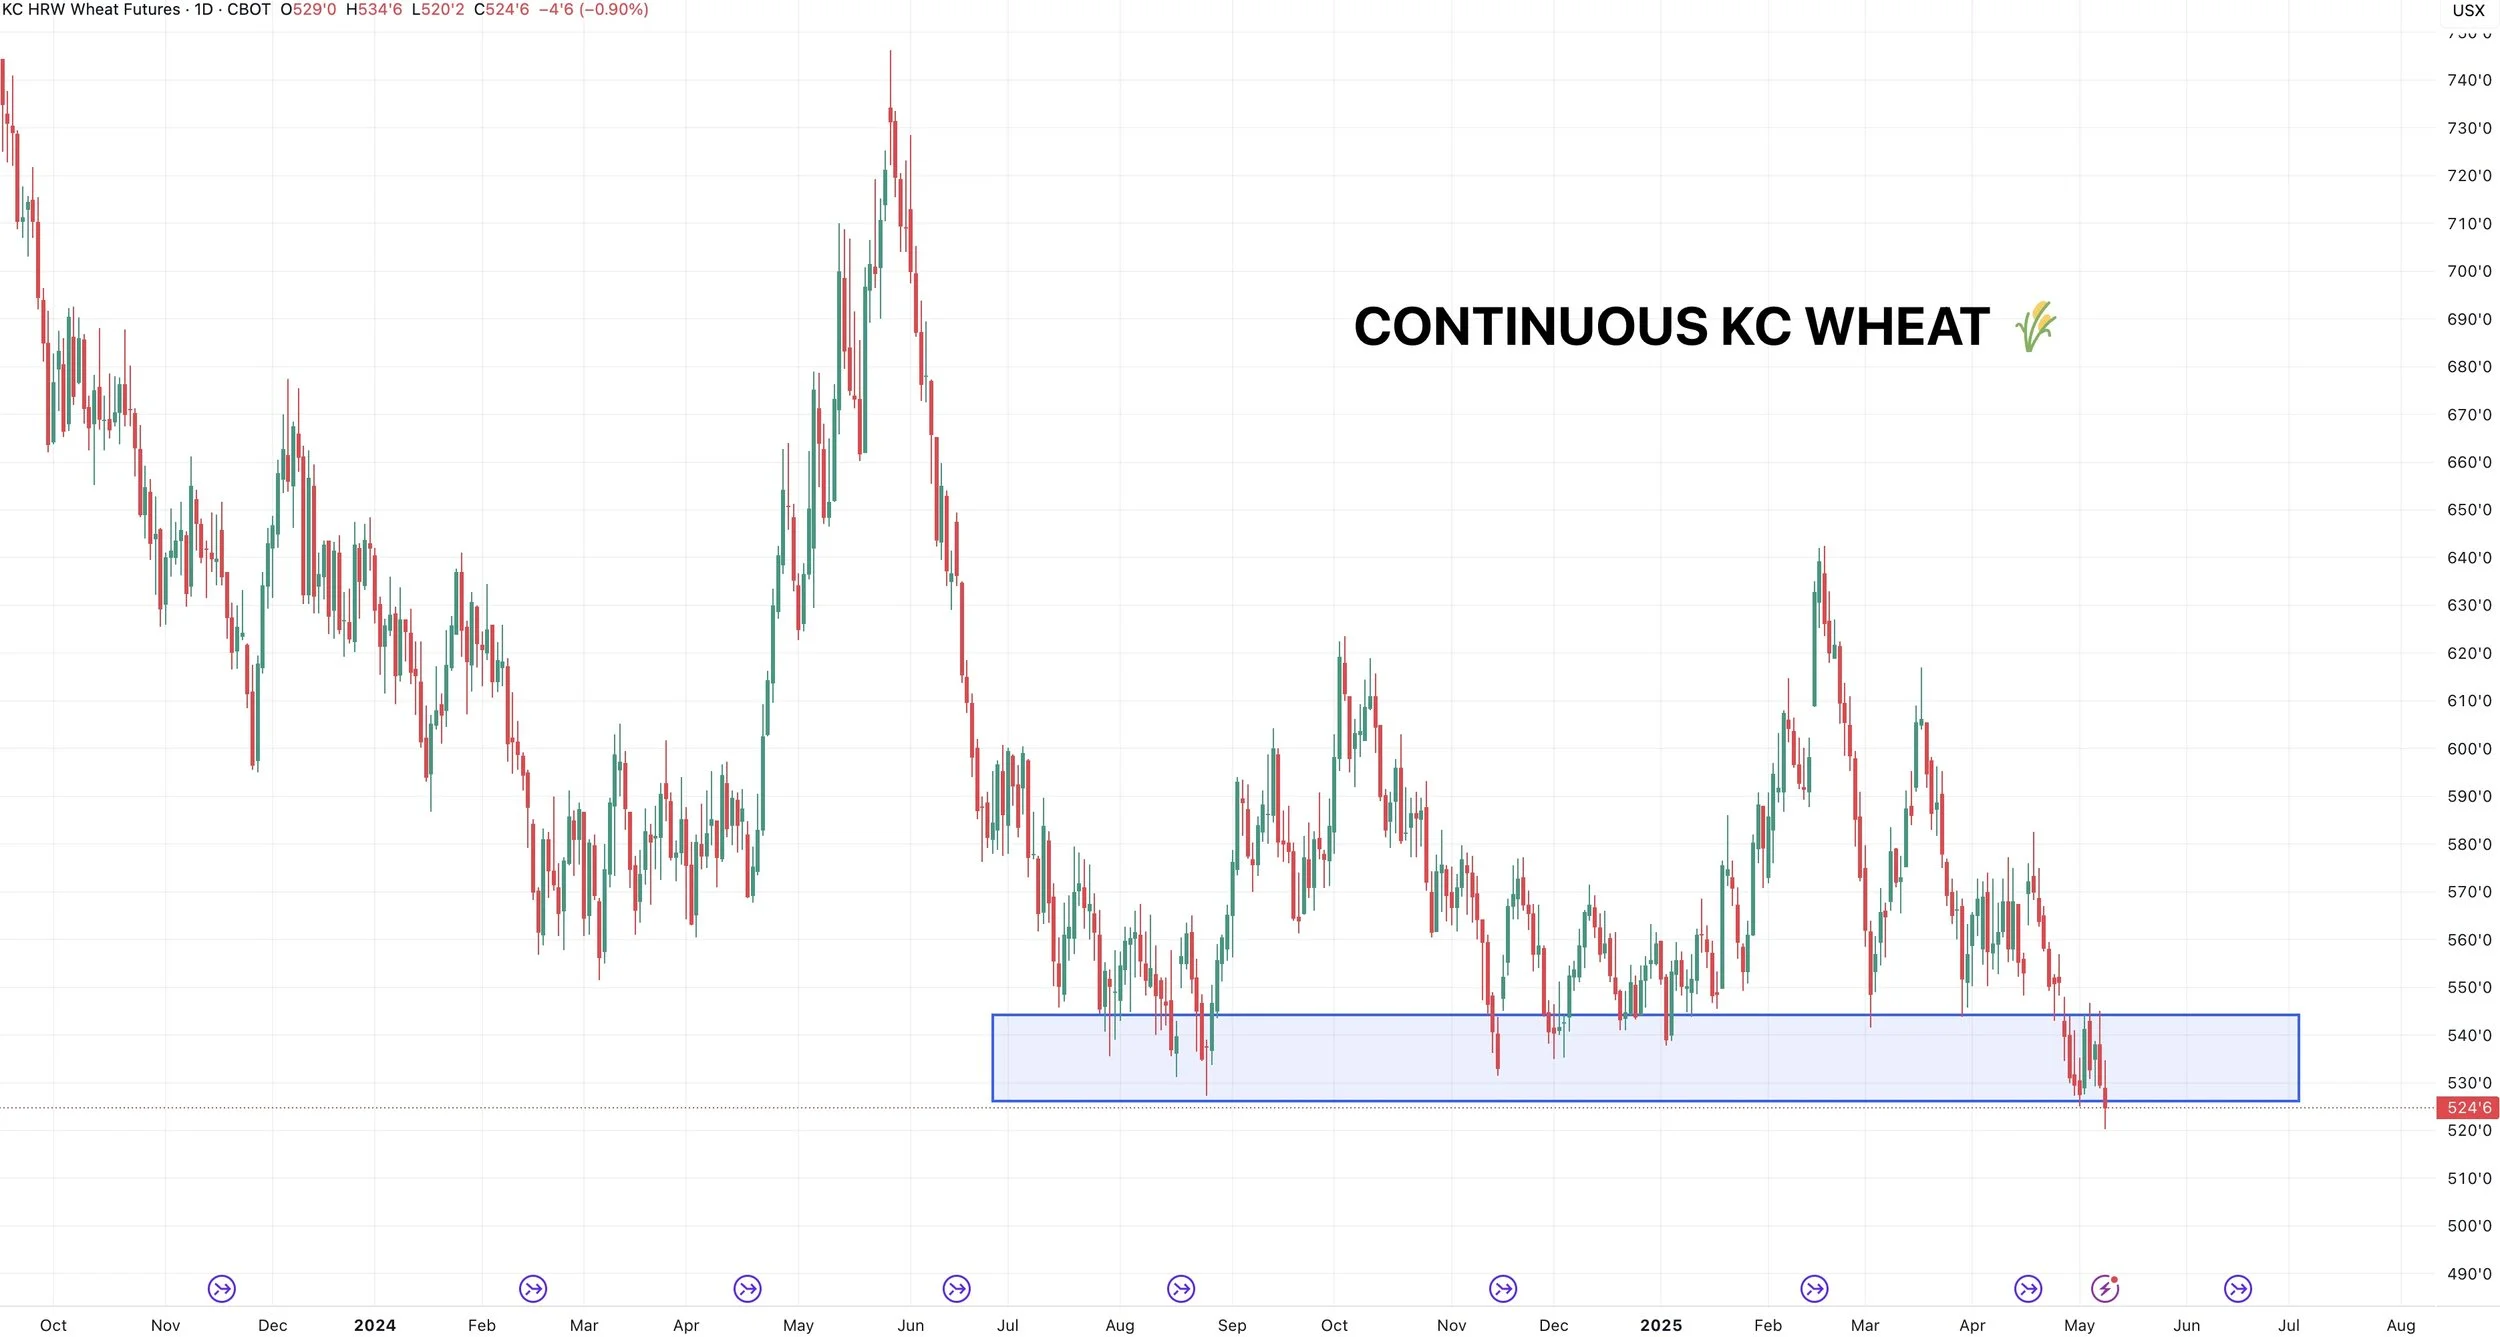
Wheat continues to trickle lower, as KC wheat posted new lows today.
KC wheat continues to be pressured by improvements in the winter wheat ratings and rain in the southern plains.
Today StatsCan showed significantly higher stocks than anticipated, which means Canada is going to be a bigger competitor on the export market. Which weighed on us today.
Nothing new for wheat. Simply waiting for the next opportunity.
The global wheat picture is still more bullish than in recent years. Spring wheat acres are set at all-time lows.
Even if the market continues to fall, I just can’t get overly bearish at these levels. The wheat market in my opinion simply has more upside potential than downside risk and I don’t see the logic into selling at multi-year lows.
Technicals:
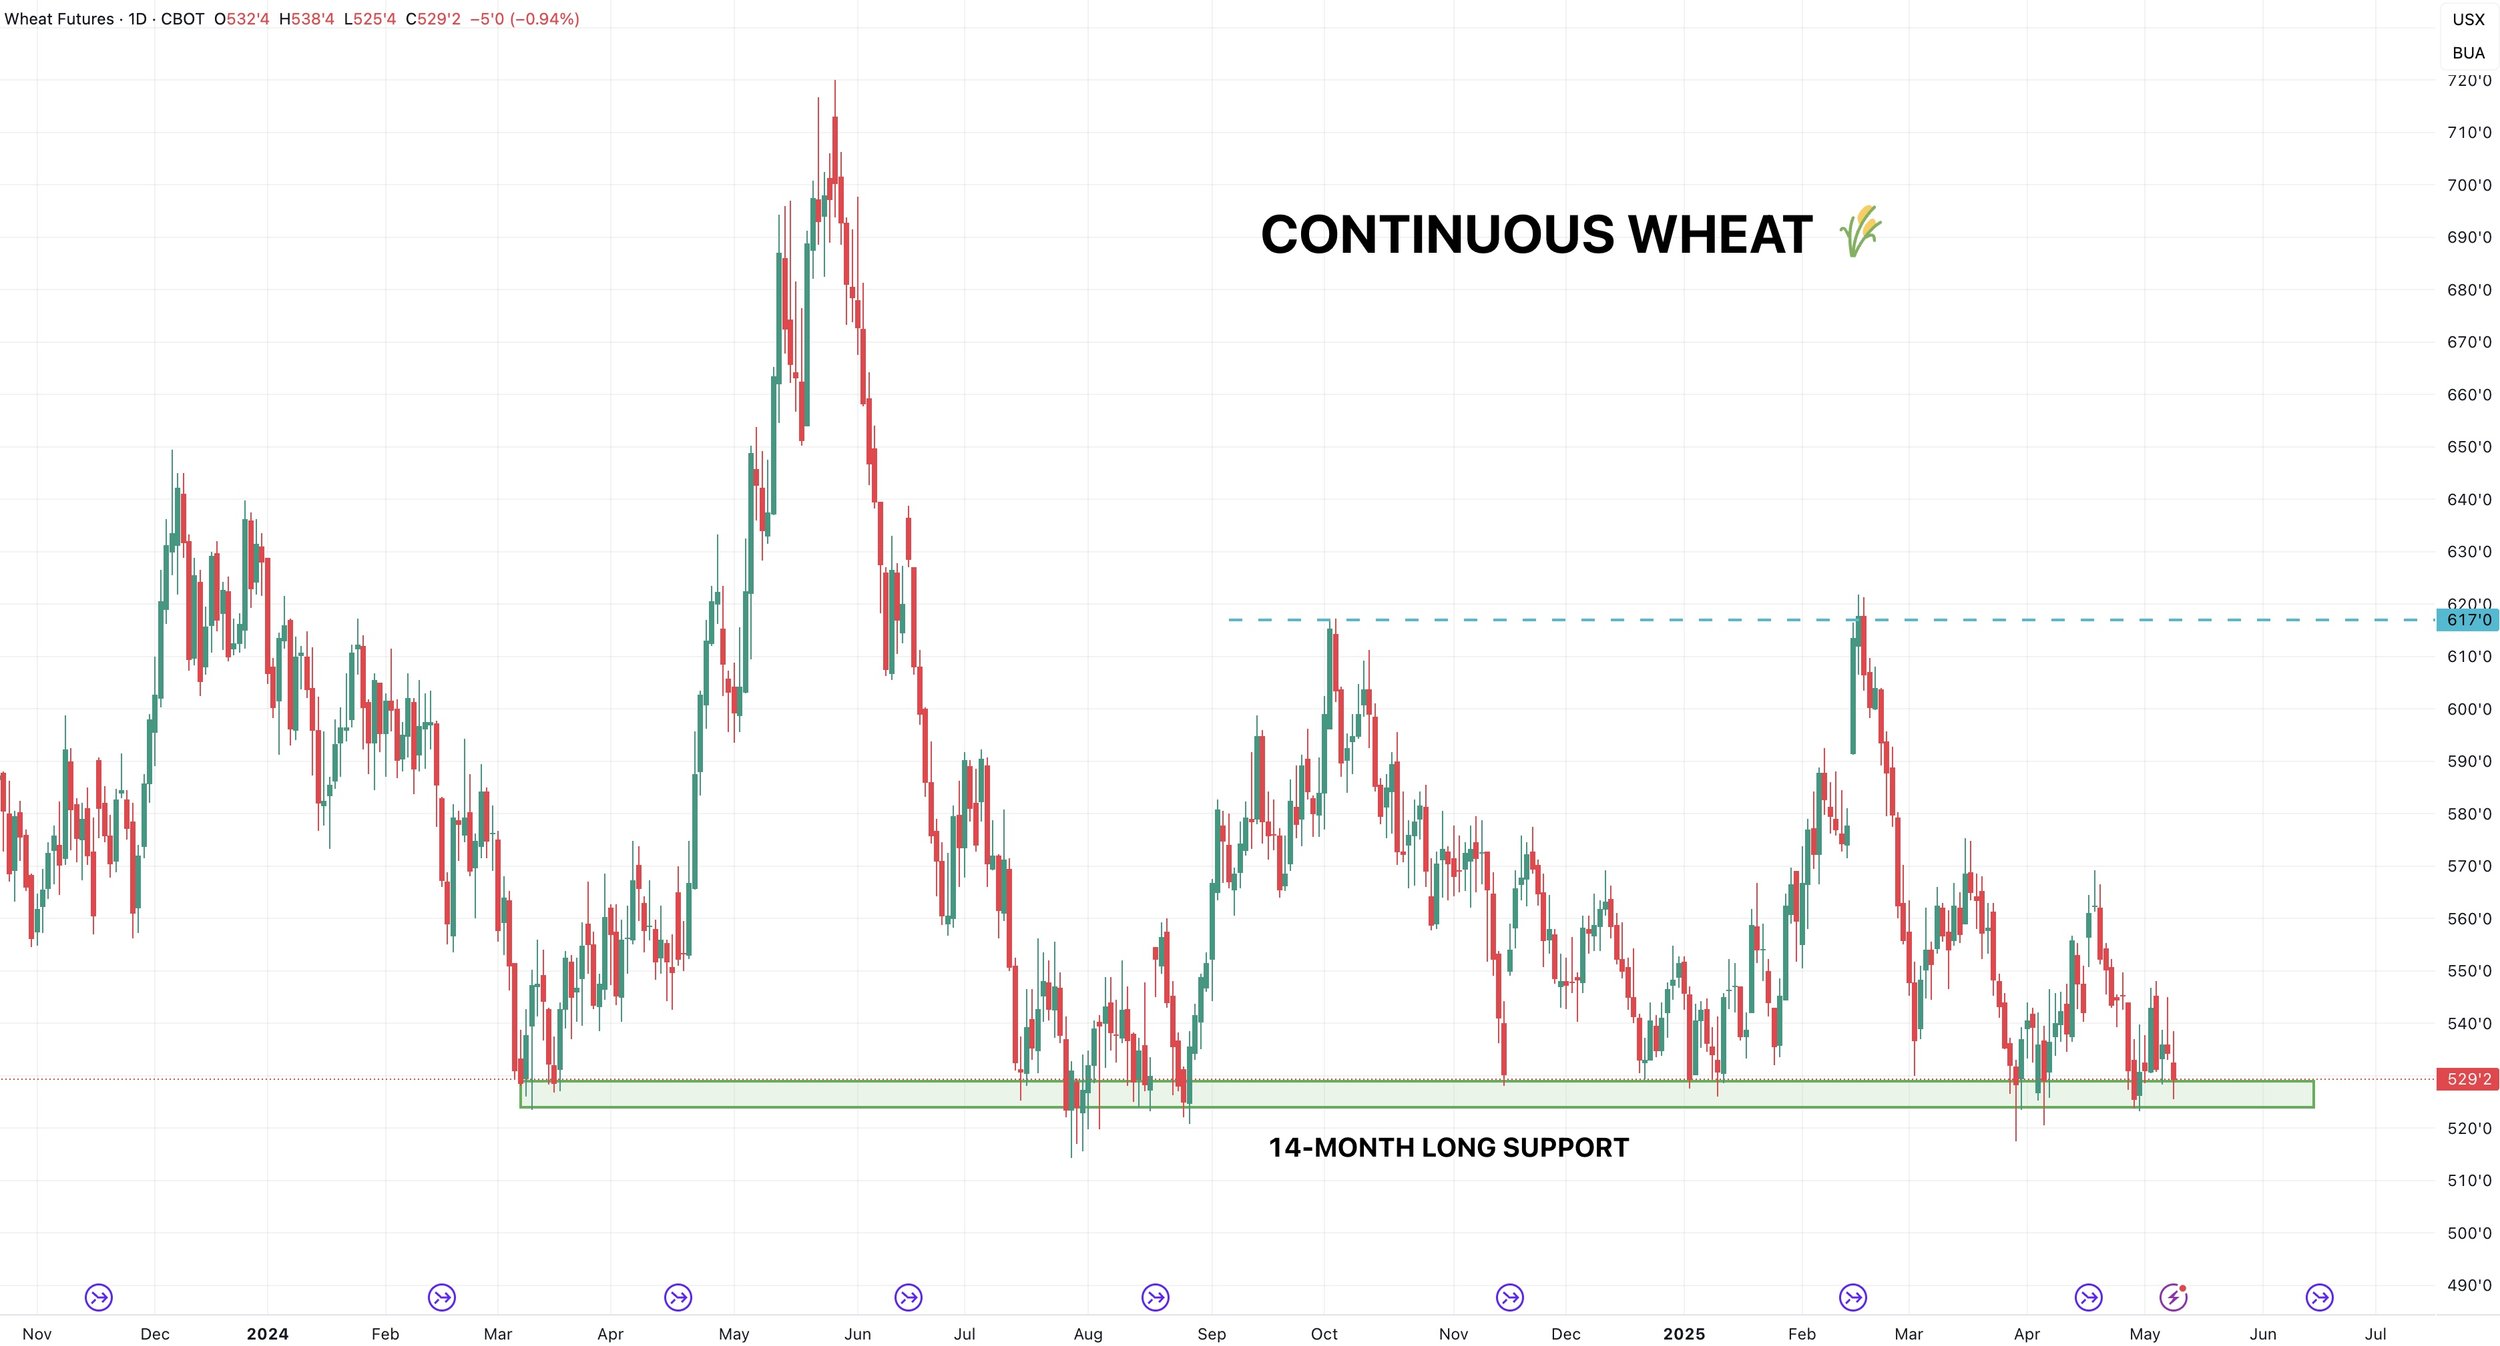
Continuous Chicago still holding this major support level.
As a spec, this is where I'd be a buyer.
Need to hold here to avoid trying to catch a falling knife.
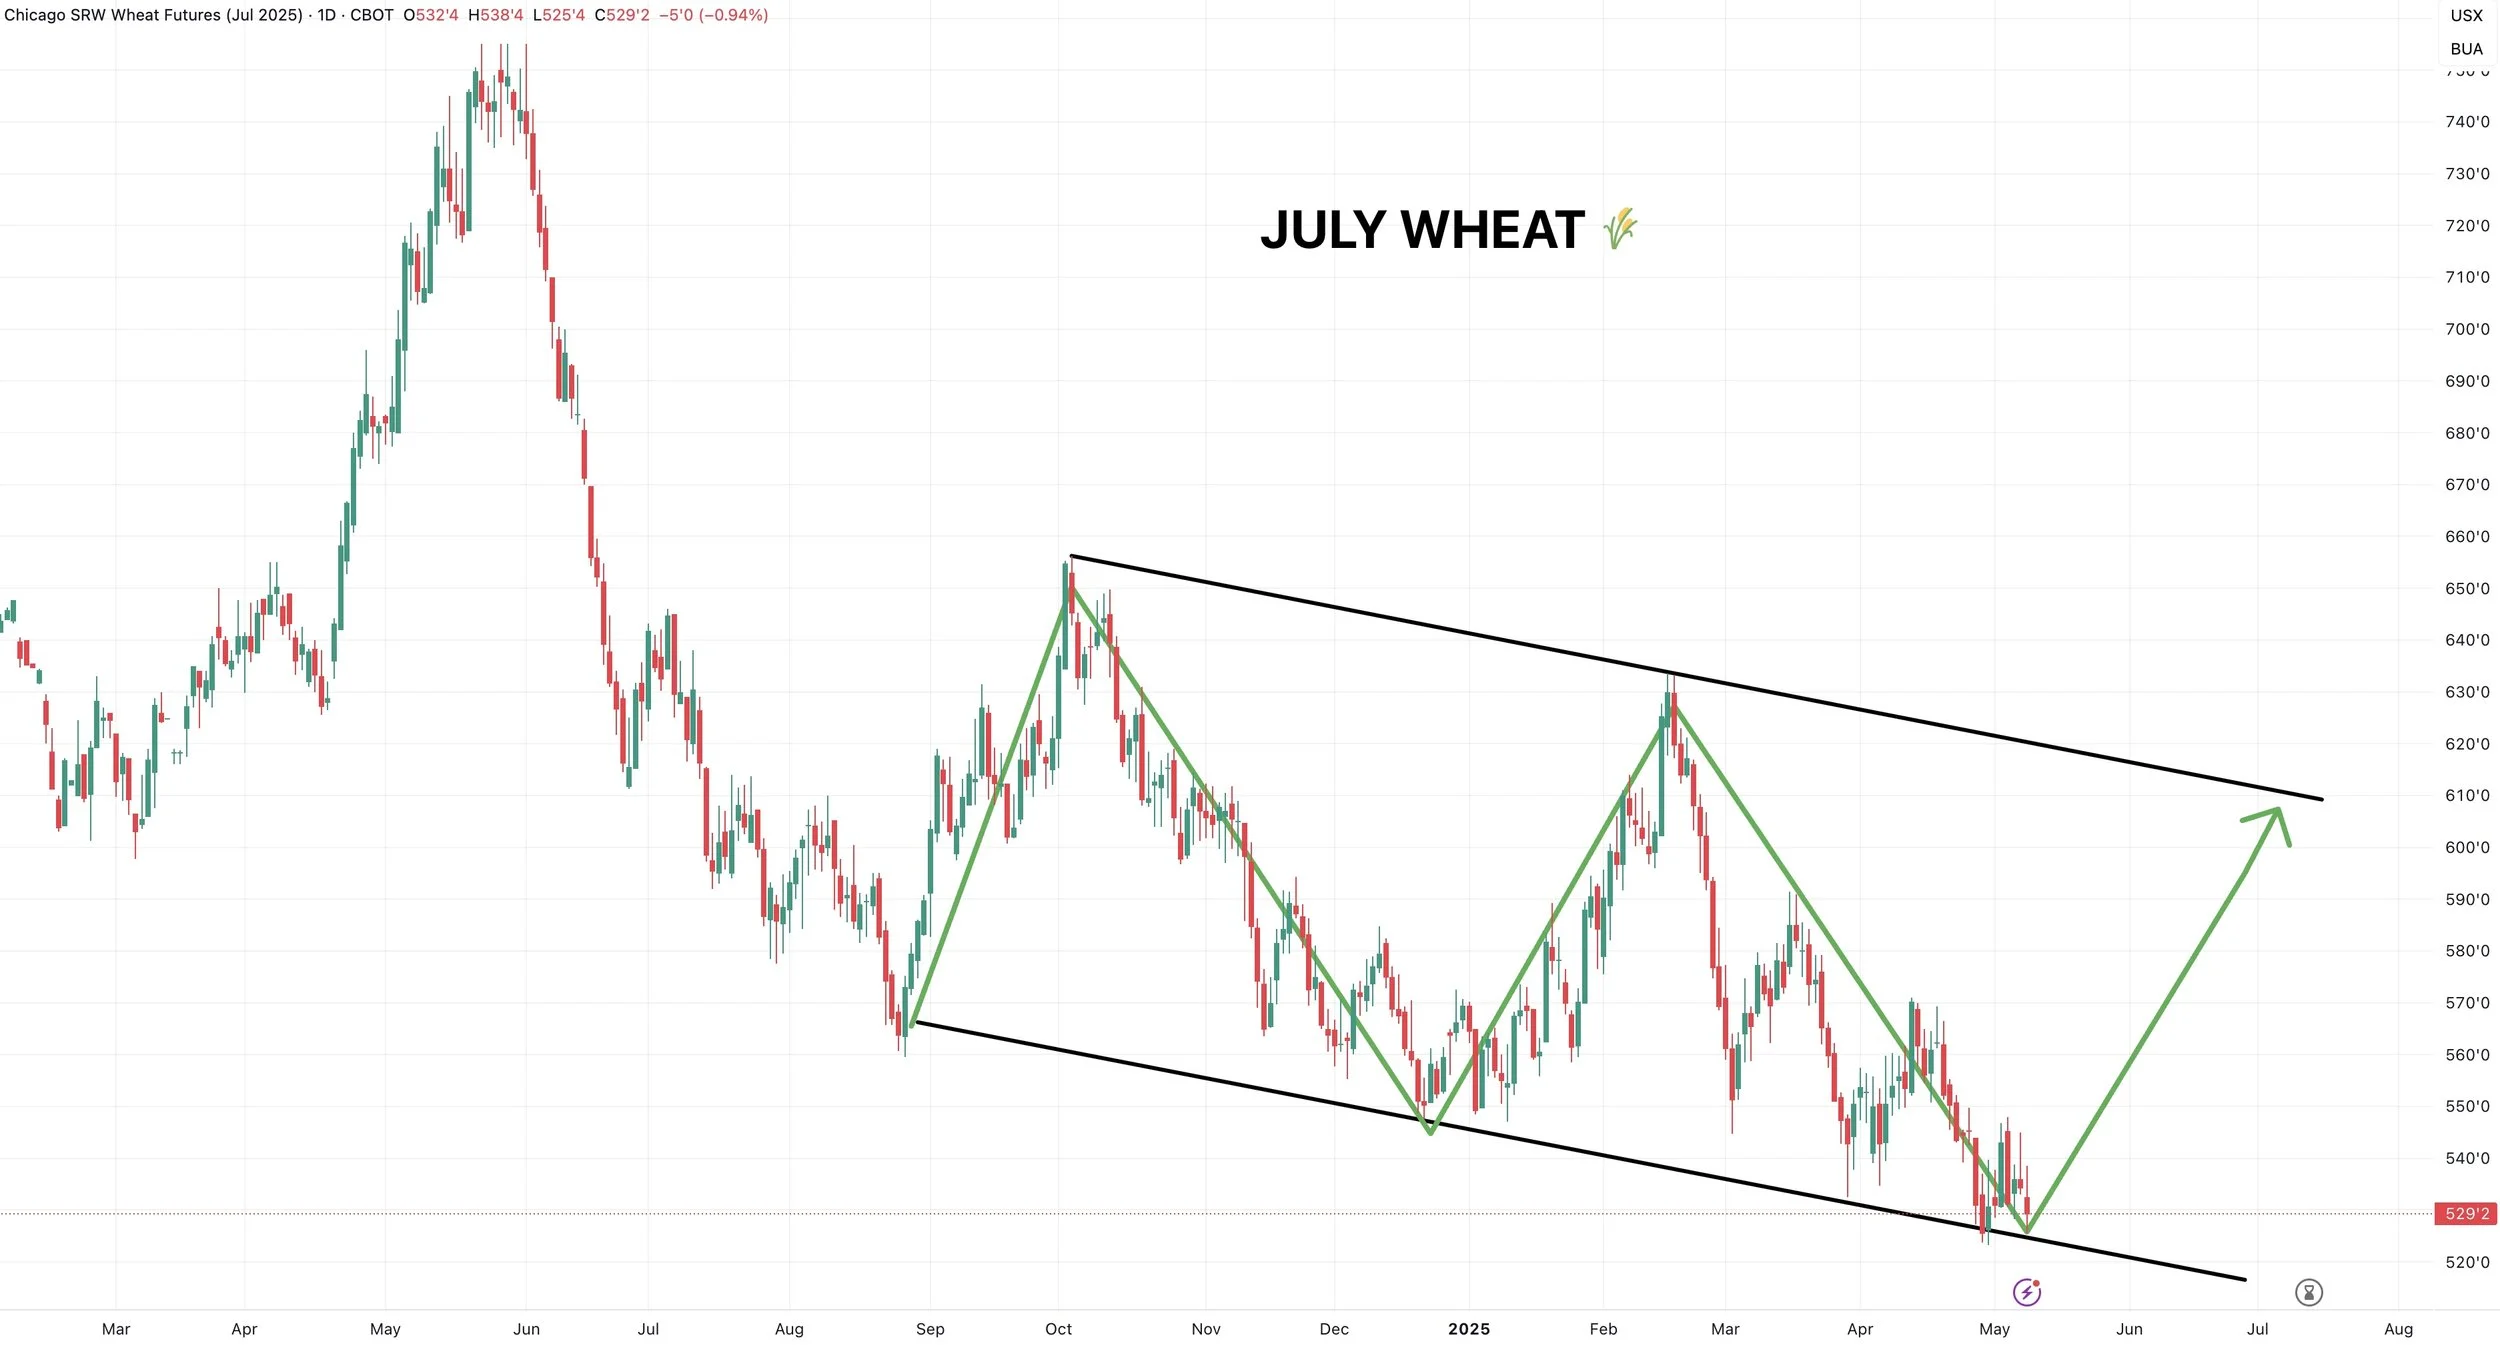
July Chicago still holding this downward channel.
Still not looking to de-risk until we get closer to the top end of it.
Continuous KC wheat needs to bounce pretty much right now to avoid catching a falling knife. As there is no support beneath this level.
July KC is as ugly as possible.
Posting new lows.
Trying to catch a bottom here would be like trying to catch a knife.
Can’t call a bottom until we break up into the red box.

Past Sell or Protection Signals
We recently incorporated these. Here are our past signals.
April 10th: 🌽
Old crop corn sell signal.
March 19th: 🐮
Cattle hedge & sell signal.
Feb 18th: 🌽 🌾
Old crop KC wheat & old crop corn signal.
Jan 23rd: 🌽 🌱
Corn & beans old crop sell signal.
CLICK HERE TO VIEW
Jan 15th: 🌽 🌱
Corn & beans hedge alert/sell signal.
Jan 2nd: 🐮
Cattle hedge alert at new all-time highs & target.
Dec 11th: 🌽
Corn sell signal at $4.51 200-day MA
CLICK HERE TO VIEW
Oct 2nd: 🌾
Wheat sell signal at $6.12 target
Sep 30th: 🌽
Corn protection signal at $4.23-26
Sep 27th: 🌱
Soybean sell & protection signal at $10.65
Sep 13th: 🌾
Wheat sell signal at $5.98
May 22nd: 🌾
Wheat sell signal when wheat traded +$7.00
Want to Talk?
Our phones are open 24/7 for you guys if you ever need anything or want to discuss your operation.
Hedge Account
Interested in a hedge account? Use the link below to set up an account or shoot Jeremey a call at (605)295-3100.
Check Out Past Updates
5/7/25
NEW 2025 LOWS FOR CORN
5/6/25
WHAT’S A SUMMER RALLY LOOK LIKE?
5/5/25
CORN ERASES ENTIRE APRIL RALLY
5/2/25
SELL INTO UNCERTAINTY. NOT KNOWN FACTORS
5/1/25
THE CASE AGAINST A FEB TOP IN CORN
4/30/25
APPROACHING KEY TIME PERIOD FOR GRAINS
4/29/25
PLANTING & FIRST NOTICE DAY PRESSURE. CORN CLOSE TO BOTTOM?
4/28/25
CAPTURING INVERSE & SEASONAL PREPARATION
4/25/25
HOW OFTEN DOES CORN NOT BREAK APRIL HIGHS?
4/24/25
KNOW WHEN TO SELL. BEANS BREAK 200-DAY FIRST TIME IN 483 DAYS
4/23/25
MONEY FLOW & DROUGHT CARDS
4/22/25
CRUCIAL SPOT FOR CORN & BEANS
4/21/25
NO PLANTING THREAT YET
4/18/25
POTENTIAL OPPORTUNITIES, BASIS CONTRACTS & STRATEGIES
4/16/25
HOW YIELD IMPACTS CARRYOUT. MAJOR SPOT FOR SOYBEANS
4/15/25
TOTAL CHART BREAKDOWNS & TARGETS
4/14/25
TECHNICAL SELLING IN GRAINS
4/11/25
SPECIFIC GRAIN MARKETING DECISIONS
4/10/25
USDA REPORT. HOW THIS IMPACTS CORN
4/9/25
TARIFFS GIVE. TARIFFS TAKE
4/8/25
CORN’S DIVERGING STRENGTH
4/7/25
SOLID PRICE ACTION DESPITE OUTSIDE FEAR
4/4/25
CORN PRICE ACTION SPEAKS VOLUME. ANY HOPE LEFT FOR SOYBEANS?
4/3/25
WHAT IS LEFT FOR CORN BEARS? TRADE WAR: CHARTS HOLDING SUPPORT
4/2/25
SHOULD UNKNOWNS KEEP A FLOOR UNDER GRAIN PRICES?
4/1/25
HOW DO ACRES IMPACT FUTURE OF THE GRAINS?
3/31/25
USDA REPORT: NOW WHAT?
3/28/25
ALL EYES ON USDA
3/27/25
PRE-USDA POSITIONING. DON’T GIVE GRAIN AWAY
3/26/25
HISTORY OF MARCH INTENTIONS. SOYBEANS UNDERVALUED?
3/25/25
6 DAYS UNTIL MAJOR USDA REPORT
3/24/25
HOW TO POSITION YOURSELF BEFORE PLANTING
3/21/25
REASONS TO BE OPTIMISTIC IN GRAINS?
3/20/25
WAS THAT THE BOTTOM IN CORN?
3/19/25
THE PATH HIGHER & THE DOWNSIDE RISKS IN GRAINS
3/18/25
SEASONALS, CATTLE HEDGE, CHARTS & DROUGHT?
3/17/25
WHEAT RALLIES. DON’T GET BACKED INTO A CORNER
3/14/25
MARCH 31ST REPORT THOUGHTS & WHAT’S NEXT FOR GRAINS
3/13/25
EXPLAINING RE-OWNERSHIP VS COURAGE CALLS
3/12/25
TARIFF FEARS. EU, CANADA, & ETHANOL
3/11/25
USDA SNOOZE. RECORD FUND SELLING A CONCERN?
3/10/25
USDA TOMORROW. GETTING COMFORTABLE IN MARKETING
3/7/25
HOW TIGHT IS THE WORLD & US SITUATION?
3/6/25
TARIFFS PUSHED BACK. FUTURE OPPORTUNITIES?
3/5/25
IS GRAINS BIGGEST RISK WEAK CRUDE & DEFLATION?
3/4/25
TRADE WAR BEGINS. 8TH DAY OF PAIN FOR GRAINS
3/3/25
TARIFFS ON TOMORROW. BUY SIGNAL
3/3/25
BUY SIGNAL
2/28/25
WHEN WILL THE BLEEDING STOP?
2/27/25
CORN AT CRITICAL SPOT. USDA ACRE REPORT. WAY TOO EARLY DROUGHT TALK
2/26/25
HISTORY SUGGESTS CORN TOP ISN’T IN? ACRE OUTLOOK TOMORROW
2/25/25
POSITIVE CLOSE. WHAT TO KNOW ABOUT USDA OUTLOOK
2/24/25
USDA OUTLOOK, FIRST NOTICE DAY & BRAZIL
2/21/25
WHAT TO EXPECT MOVING FORWARD IN GRAINS
2/20/25
FIRST NOTICE DAY CONCERNS. MASSIVE CORN ACRES OR NOT?
2/19/25
HOW TIGHT IS THE CORN SITUATION?
2/18/25
MORE DETAILS ON TODAYS SELL SIGNAL
2/18/25
OLD CROP KC WHEAT & CORN SELL SIGNAL
2/14/25
WHEAT BREAKING OUT ON WEATHER RISK. TECHNICALS & FUNDAMENTALS
2/12/25
GLOBAL GRAIN SITUATION, ACRE TALK, CHARTS & MORE
2/11/25
USDA: NOT A BEARISH REPORT. DISAPPOINTING PRICE ACTION
2/10/25
USDA TOMORROW. LONG TERM PATH FOR SUB 10% CORN STOCKS TO USE?
2/7/25
WHY WOULD THE FUNDS EXIT THEIR LONGS?
2/6/25
WHEAT FINALLY CATCHING A BID
2/5/25
COMPLETE THOUGHTS ON MARKETS: BACK & FORTH DISCUSSION
2/4/25
STRONG JANUARY LEAD TO STRONG YEAR? TARIFFS, CHARTS & MORE
2/3/25
TARIFFS PUSHED BACK
1/31/25
TARIFF NEWS ALL OVER THE PLACE. ARE YOU PREPARED FOR POSSIBILITIES?
1/30/25
WHEAT BULL ARGUMENT. TRUMP ADDS TARIFFS
1/29/25
CORN APPROACHES $5.00
1/28/25
TARIFFS, CORN FUNDS, SOUTH AMERICA & MORE
1/27/25
HEALTHY CORRECTION WE TALKED ABOUT & TARIFF NEWS
1/24/25
GRAINS DUE FOR SHORT TERM CORRECTION?
1/23/25
OUR ENTIRE NEW CROP SALES THOUGHTS & OLD CROP SELL SIGNAL
1/22/25
GRAINS TAKE A BREATHER. IS CORN IN A BULL OR BEAR MARKET?
1/21/25
HUGE DAY IN GRAINS. WHAT TO DO WITH OLD CROP VS NEW CROP
Read More
1/20/25
VIDEO CHART UPDATE
1/17/25
TRUMP, CHINA, ARGY & USING THE SPREADS INVERSE
1/16/25
OLD CROP LEADS US LOWER. MARKETING THOUGHTS
1/15/25
SIGNAL & HEDGE ALERT QUESTIONS EXPLAINED. IS $6 CORN EVEN POSSIBLE?
1/14/25
MORE DETAILS ON TODAYS HEDGE ALERT & SELL SIGNAL
1/14/25
CORN & SOYBEANS HEDGE ALERT/SELL SIGNAL
1/13/25
USDA GAME CHANGER OR NOT?
1/10/25
BULLISH USDA FOR CORN & BEANS
1/9/25
USDA OUT TOMORROW
1/8/25
2 DAYS UNTIL USDA. BE PREPARED
1/7/25
THE HISTORY OF THE JAN USDA & MORE
1/6/25
MAJOR USDA REPORT FRIDAY
Read More
1/3/25
UGLY DAY ACROSS THE GRAINS
1/2/25