
GRAINS BOUNCING AT KEY SPOTS
VIDEO CHART UPDATE
With the holiday we are only going to be doing a quick video going over the charts today. I included a written version below for those that perfer to read instead.
Video Timestamps:
Corn: 0:00min
Beans: 3:15min
Wheat: 5:15min
Cattle: 6:05min
Want to talk? (605)250-3863
Written Version
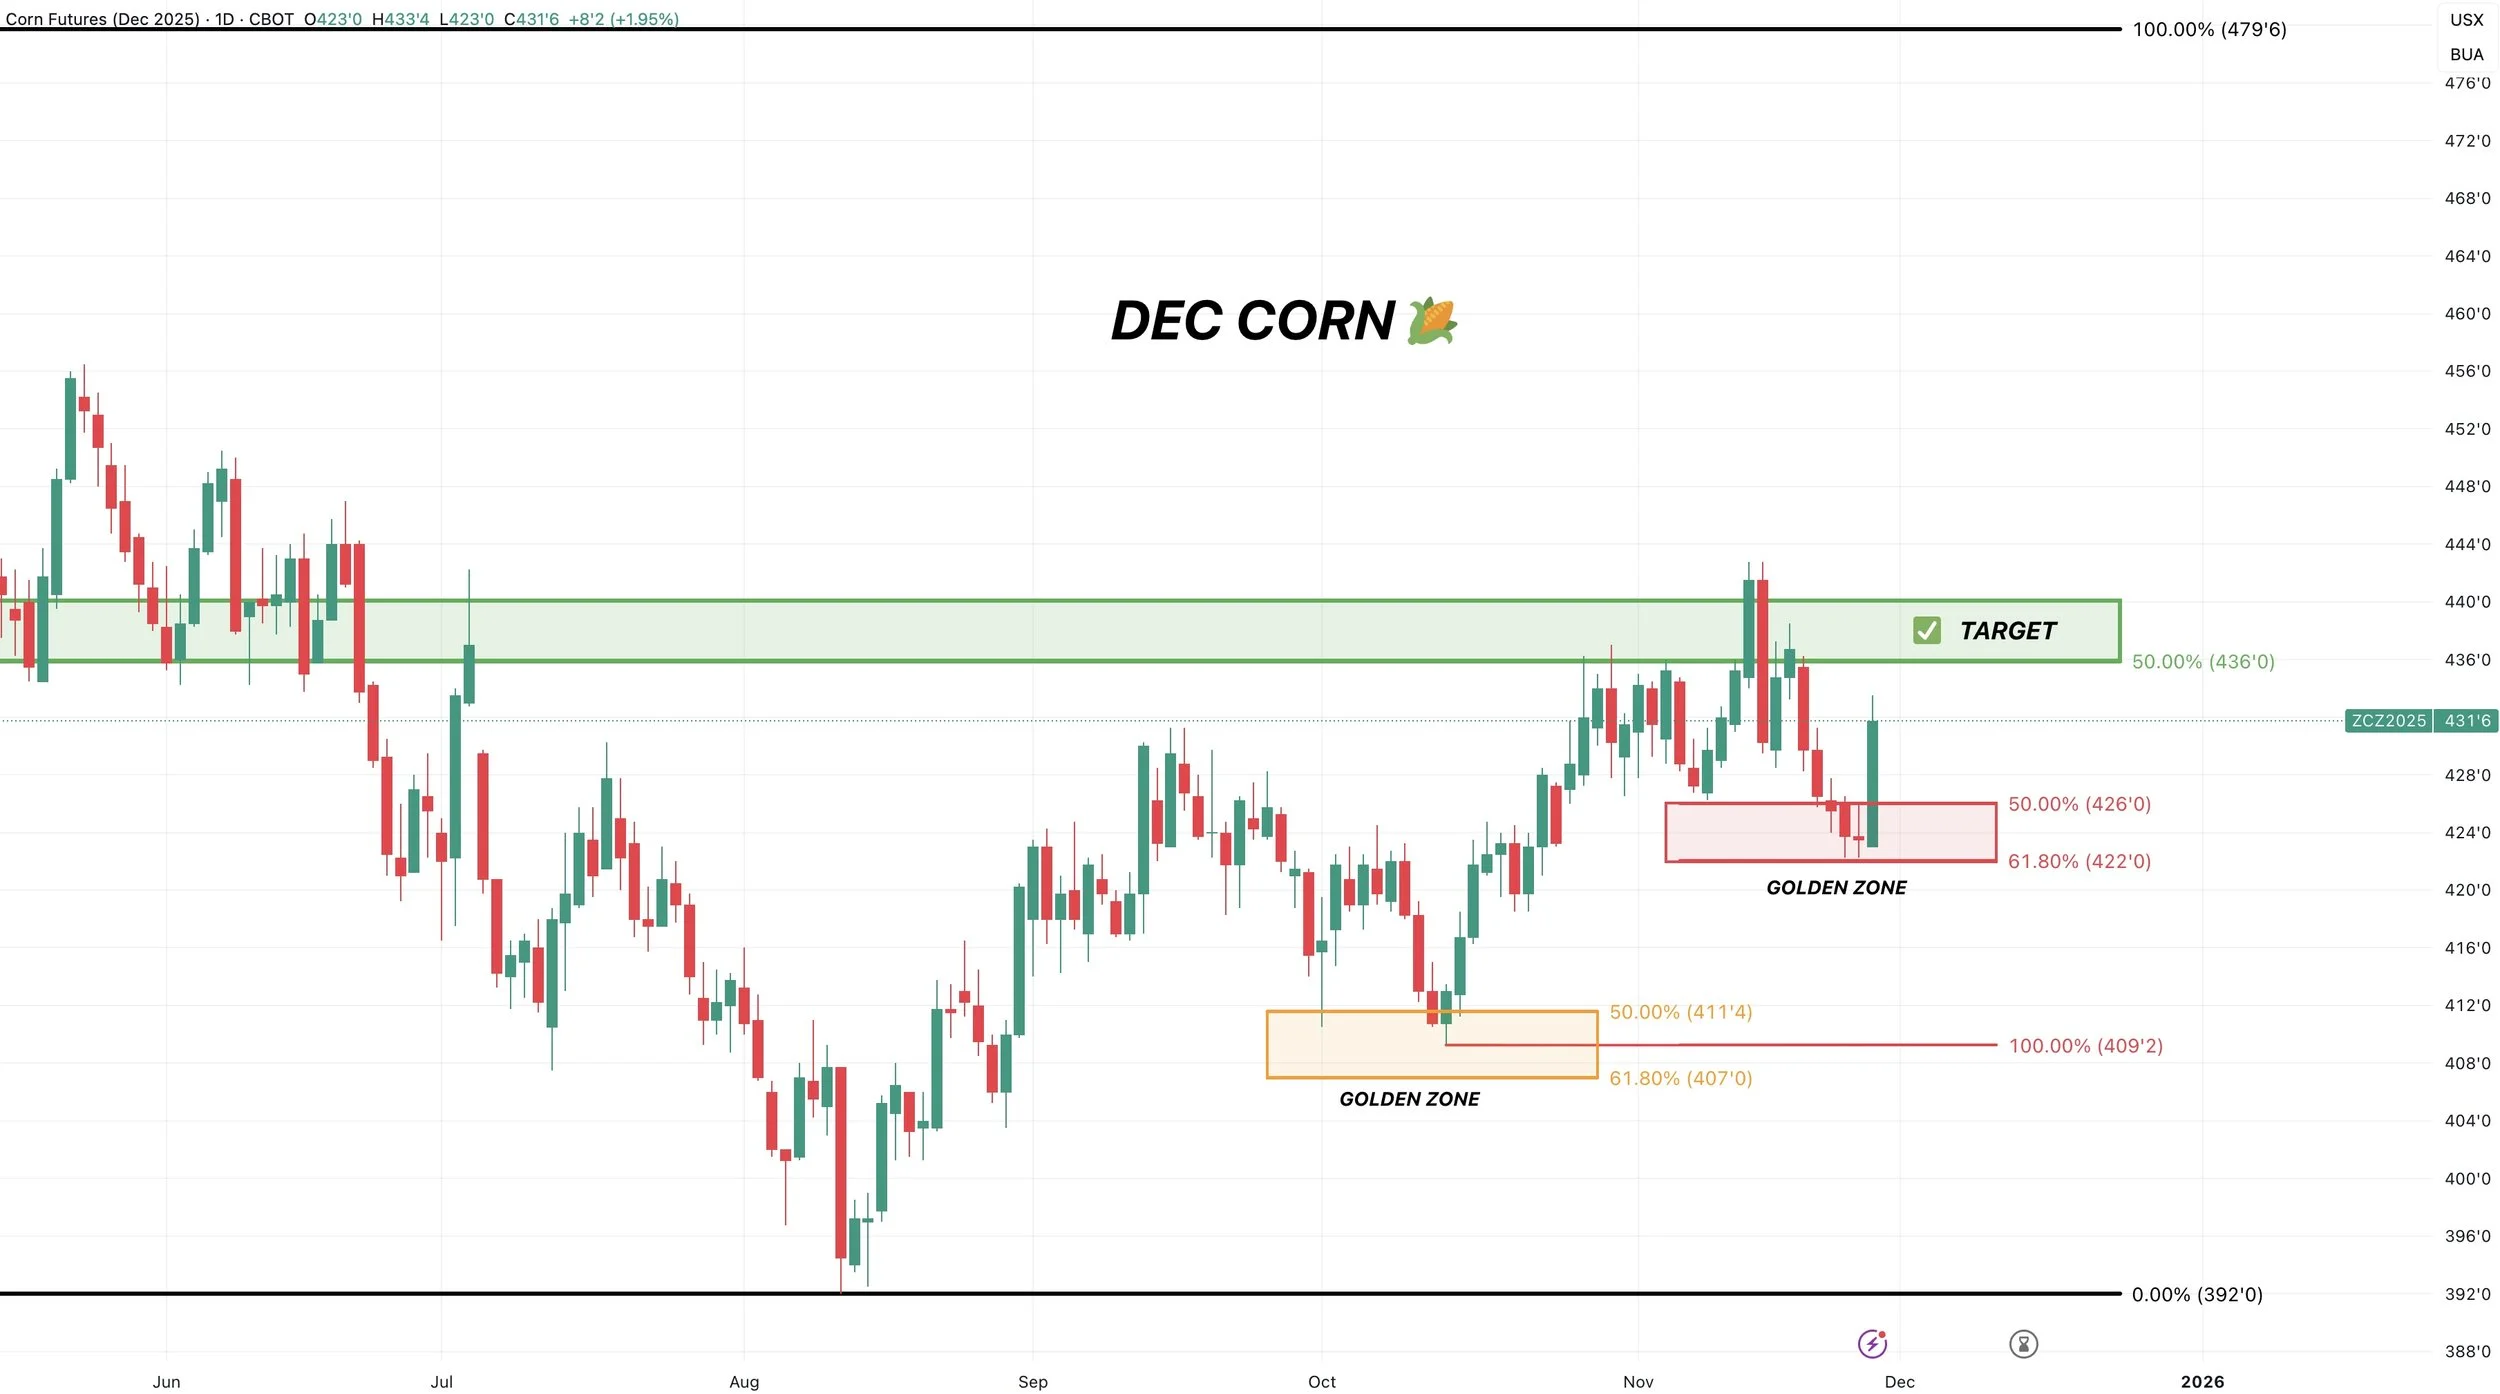
Dec Corn 🌽
We will be switching over to March from now on.
However, Dec corn bounced exactly where we wanted to.
Right at that golden fib.
61.8% of the recent sell off.
March Corn 🌽
Like Dec corn, we had a near picture perfect bounce we were looking for right off that golden fib.
That gave back 61.8% of the recent rally from Oct.
The same exact fib level we bounced at during that Sep sell off after the rally from harvest lows.
The 61.8% level is called the golden fib. You hear me talk about this all time.
Because that is the most common level for a standard correction to end and a trend to resume.
When a market rallies and pulls back, this is the biggest level to watch and usually acts as a decision point.
If the market holds this level, it usually tells us we are still in an uptrend and this is a standard correction.
If we fail to hold that level, it usually tells us we are in for more downside and that this is no longer viewed as a simple small correction.
It's where the market makes a decision.
It tells us if we are correcting or starting to roll over.
Since I took risk off the table and alerted a sell signal at $4.50, my next target is going to be $4.70-73.
The reasoning behind that $4.50 was because it reclaimed 50% of the Feb highs and was old key support turned new resistance.
(Scroll to view why this is the next target)
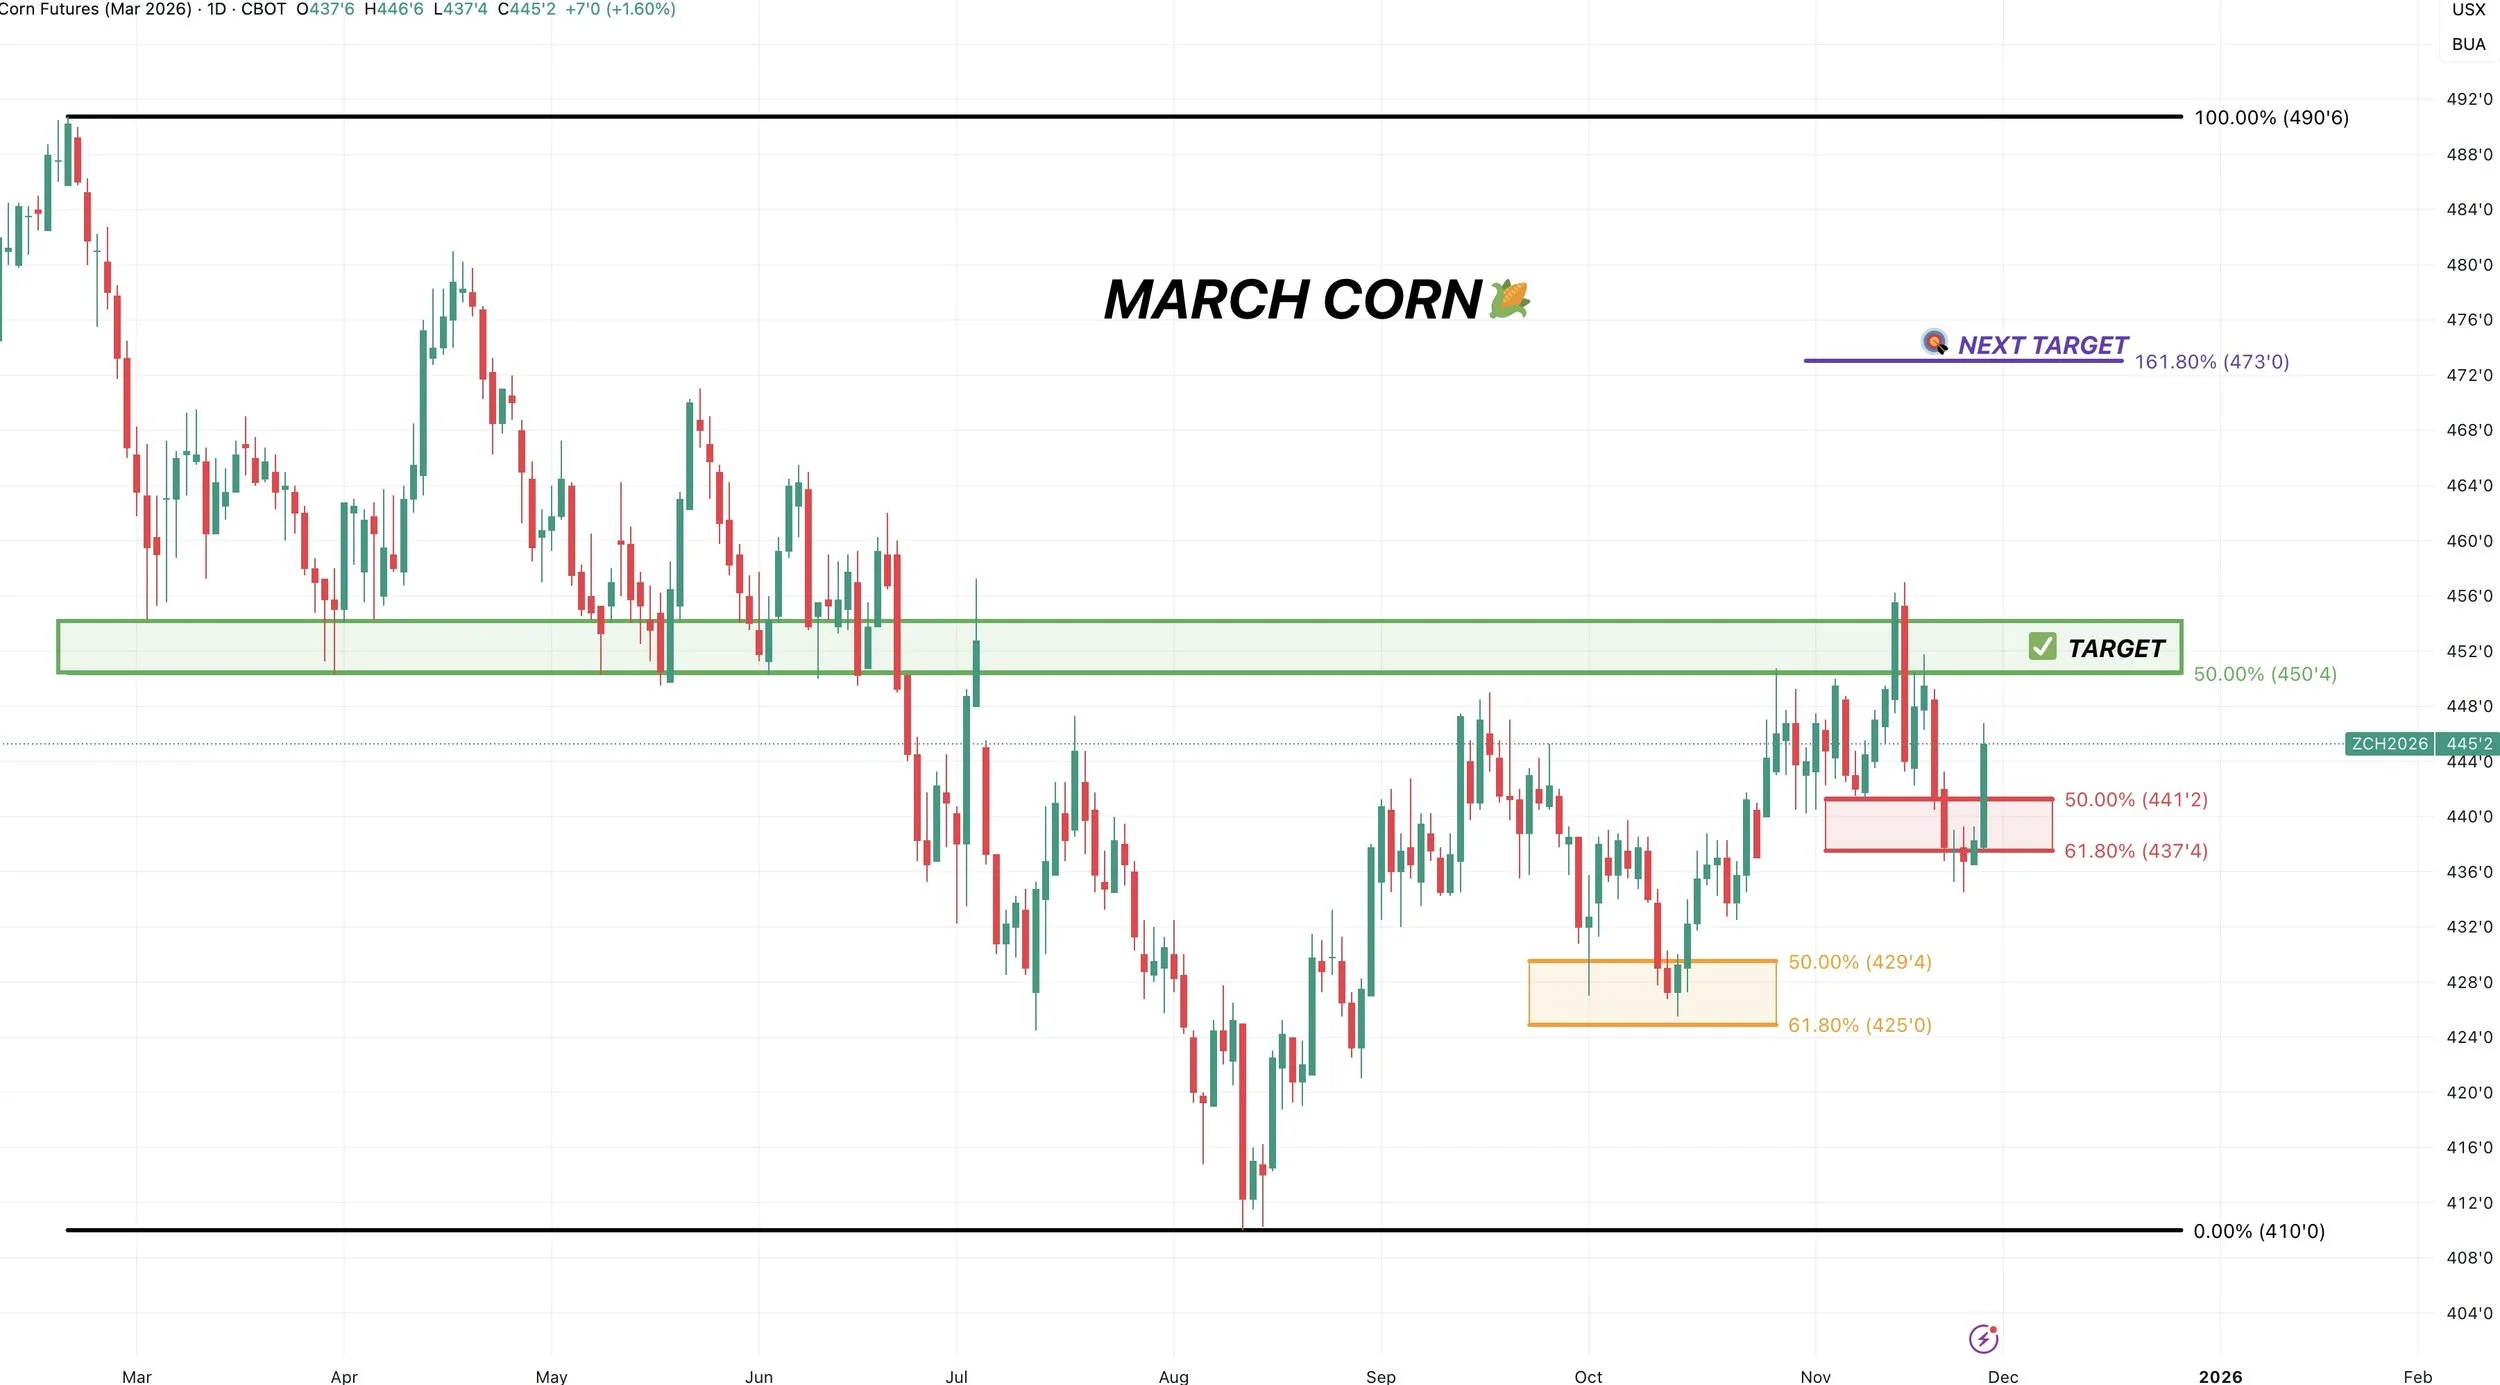
We need to break above $4.48 to be for sure that this is not just a correctional bounce before heading lower.
That reclaims 61.8% of the recent sell off.
If you break above that, this is no longer viewed as a correctional bounce and often indicates further upside.

March Corn: Target 🌽 🎯
After a market rallies, then sees a pullback.
The most common place for the next leg higher is 161.8% of the first move.
That is called the golden fib target.
The math for those curious:
So we rallied from $4.10 to $4.49 on the first move.
That is a 39 cent move.
39 cents X 161.8% = 63 cents.
The $4.10 lows + 63 cents = $4.73

Here is a recent example of the golden fib.
This is live cattle.
We shared this target back in October when we alerted that hedge alert.
It marked the exact top in this market.
It was 161.8% of the first move.

Dec-26 Corn 🌽
I am sharing this because I had a few guys ask my thoughts.
Just like Dec-25 and March-26 corn.
We held that golden zone perfectly.
That was where the market needed to make a decision.
So great sign as we held it.

Jan Beans 🌱
Nothing too complicated here.
The trend remains higher unless we break below $11.08
That gives back 50-61.8% of the candle where we gapped open higher on the China news.
If we fail there, the next objective would be $10.91 to $10.72.
Which would be 50-61.8% of the entire rally we saw from Oct.
This level also lines up perfectly with our old yearly resistance, which is now viewed as support.
So basically we want to hold the red box. If we fail, we could fall to the green one.

Jan Beans: Target 🌱 🎯
Since we alerted a sell signal at $11.55, our next target is going to be right around $12.00
$11.55 was our first target as it clawed back 61.8% of the contract highs.
The next fib level is $12.05, which claws back 78.6% of those contract highs.
There are a few other reasons why $12.00 is the next target which we've talked about before.
(Scroll to view those reasons)
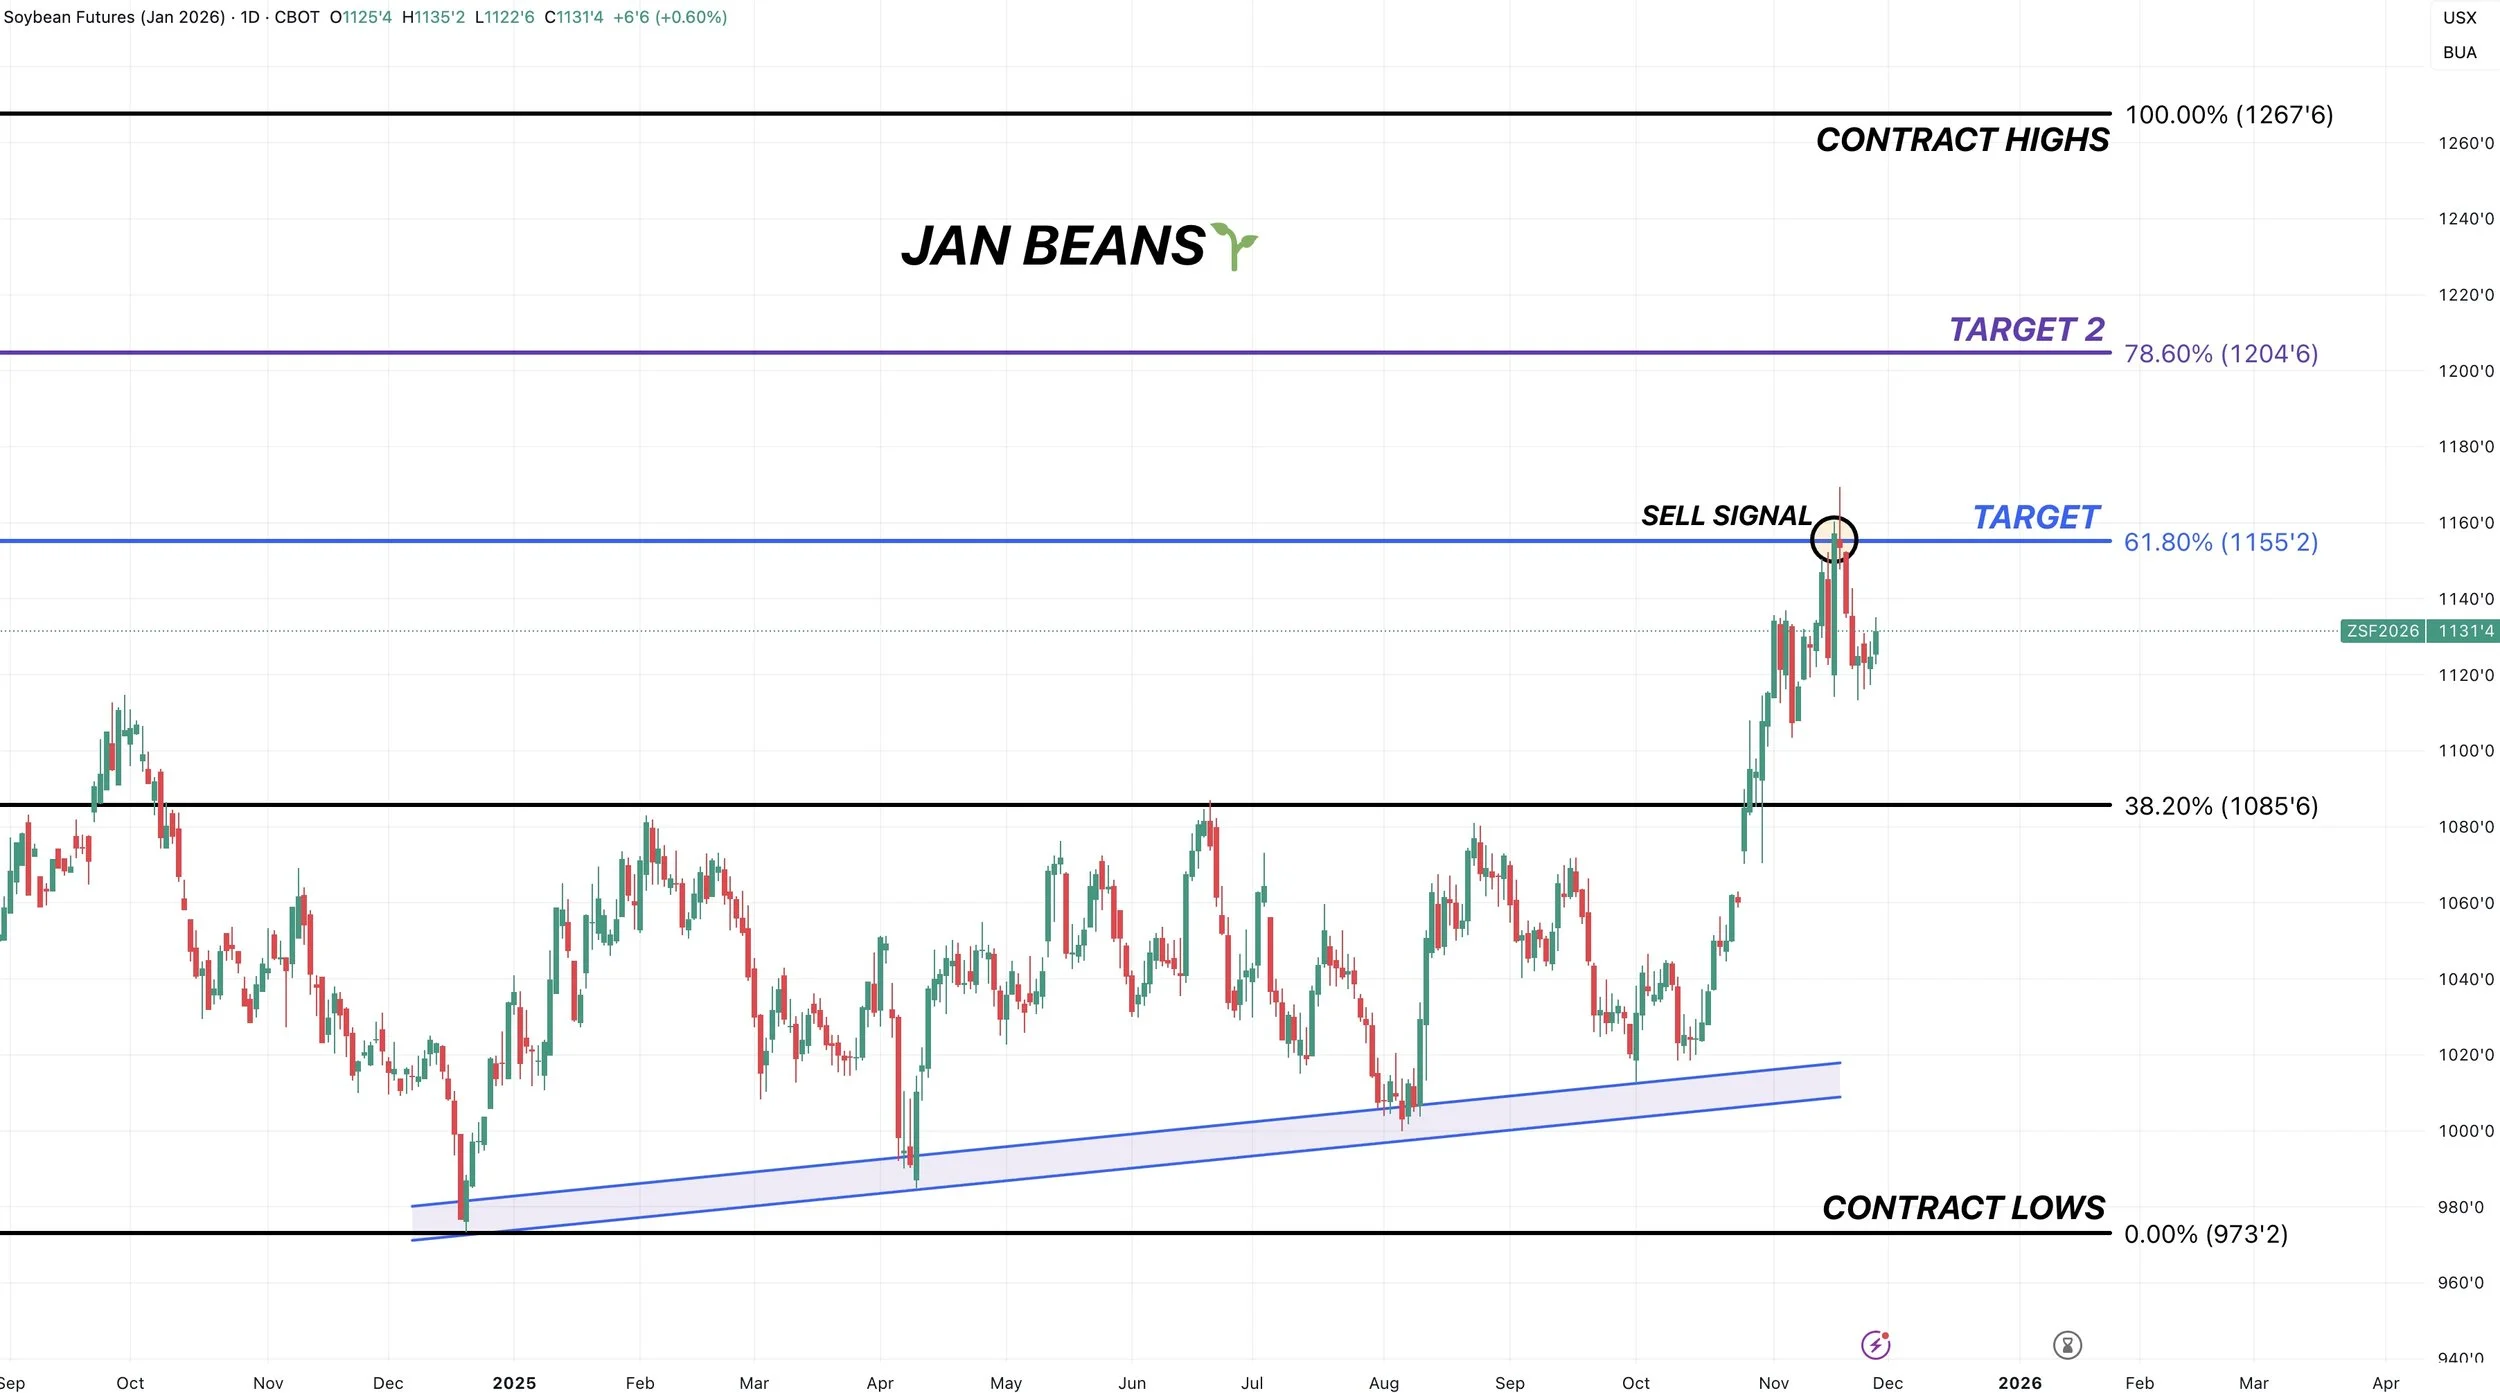
Not only is $12.00 a psychological target.
But it's also a measured move.
I've shown this before.
Soybeans were trapped in a $1.14 range for over a year.
We finally broke out of that range.
The longer a market is trapped in a tight range, usually the bigger the breakout.
A common target is for the market to rally the same distance it was stuck in.
If you add $1.14 to the point of break out, it gives you $12.01.
$1.14 + $10.87 = $12.01

The last reason as you all know is that soybeans simple rarely trade in the $11.00's like we've talked about a dozen times.
Here is the monthly chart.
We've broken the $11.00 level 5 times.
Every single time up to this point, has resulted in a rally up to at least $12.00
We have never stopped in the $11.00's.
Yes it could happen for the first time, hence we why took some risk off the table at $11.55
The monthly candle doesn’t look amazing.
Either way, it's a compelling arguement.

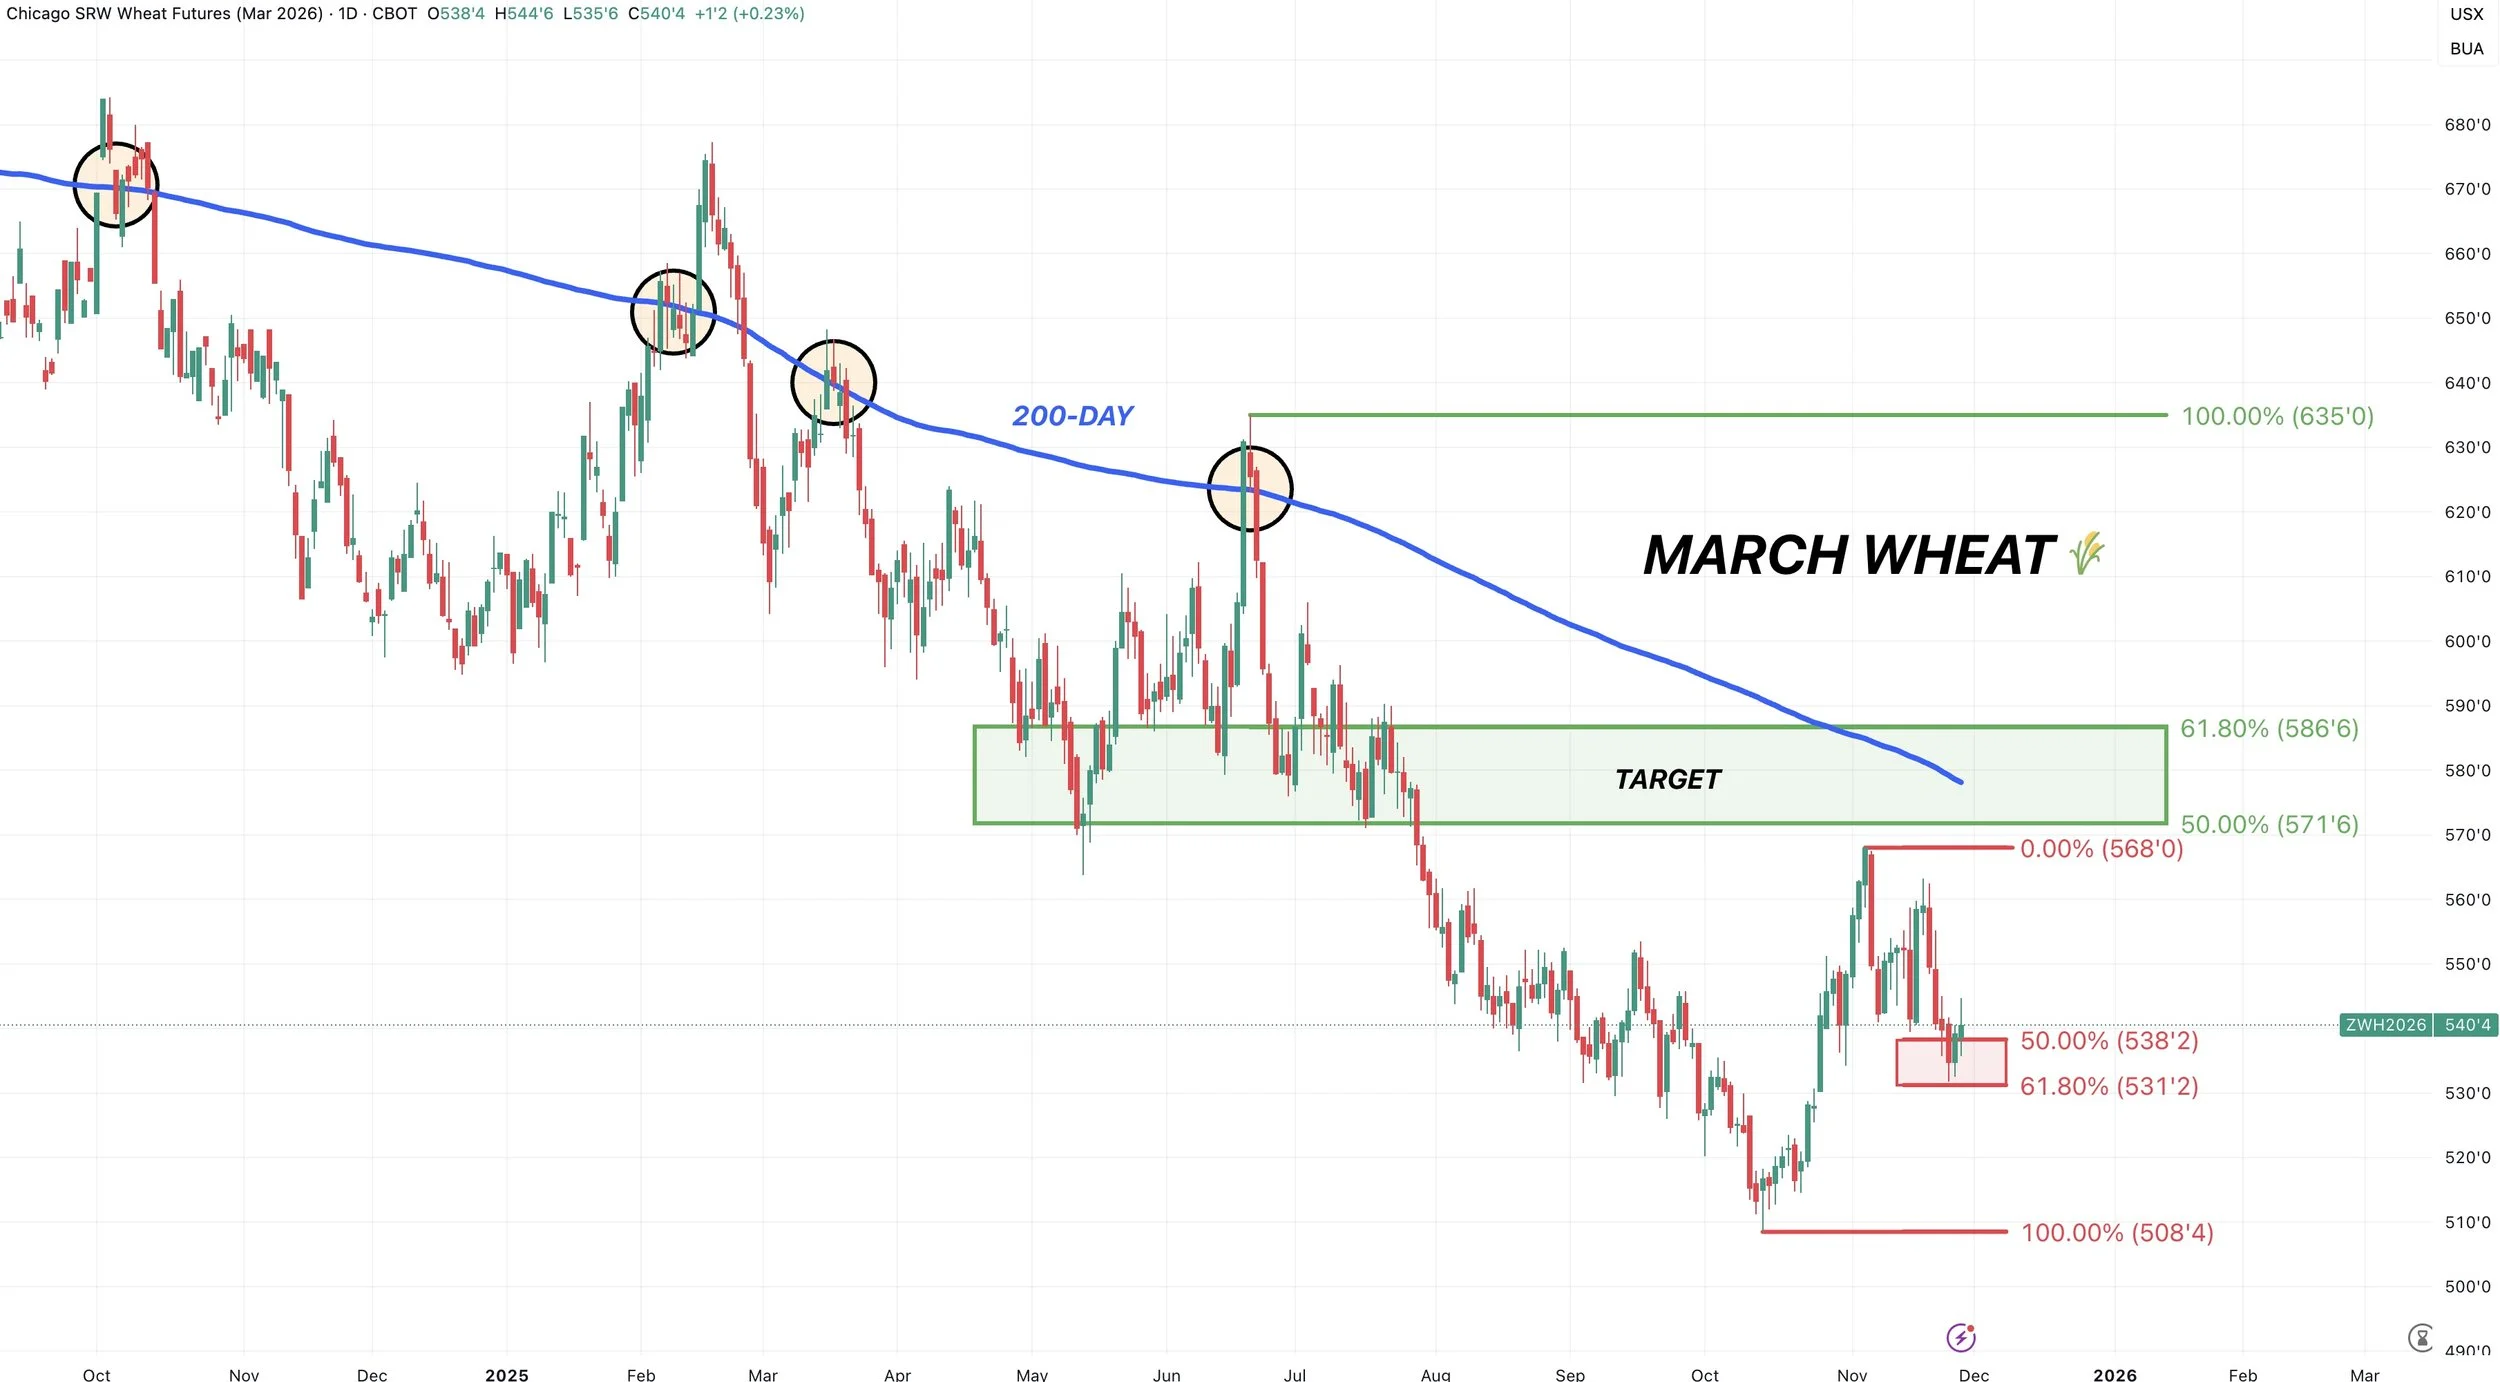
March Wheat 🌾
Like corn, we are now using the March contract.
March actually came down and bounced exactly at that 61.8% level.
Like we talked about in corn, this is where the market usually makes a decision.
Great sign we are bouncing here, but need to hold here.

We want to be taking some risk off the table in the green box.
The golden zone retracements up to the June highs.
It's also the 200-day MA, which the wheat market has struggled to stay above for over a year. Each time is short lived.
March KC Wheat 🌾
So far we are reacting right at that 61.8% level down to contract lows.
Bouncing at the must hold spot.
Looking to de-risk in the green box.

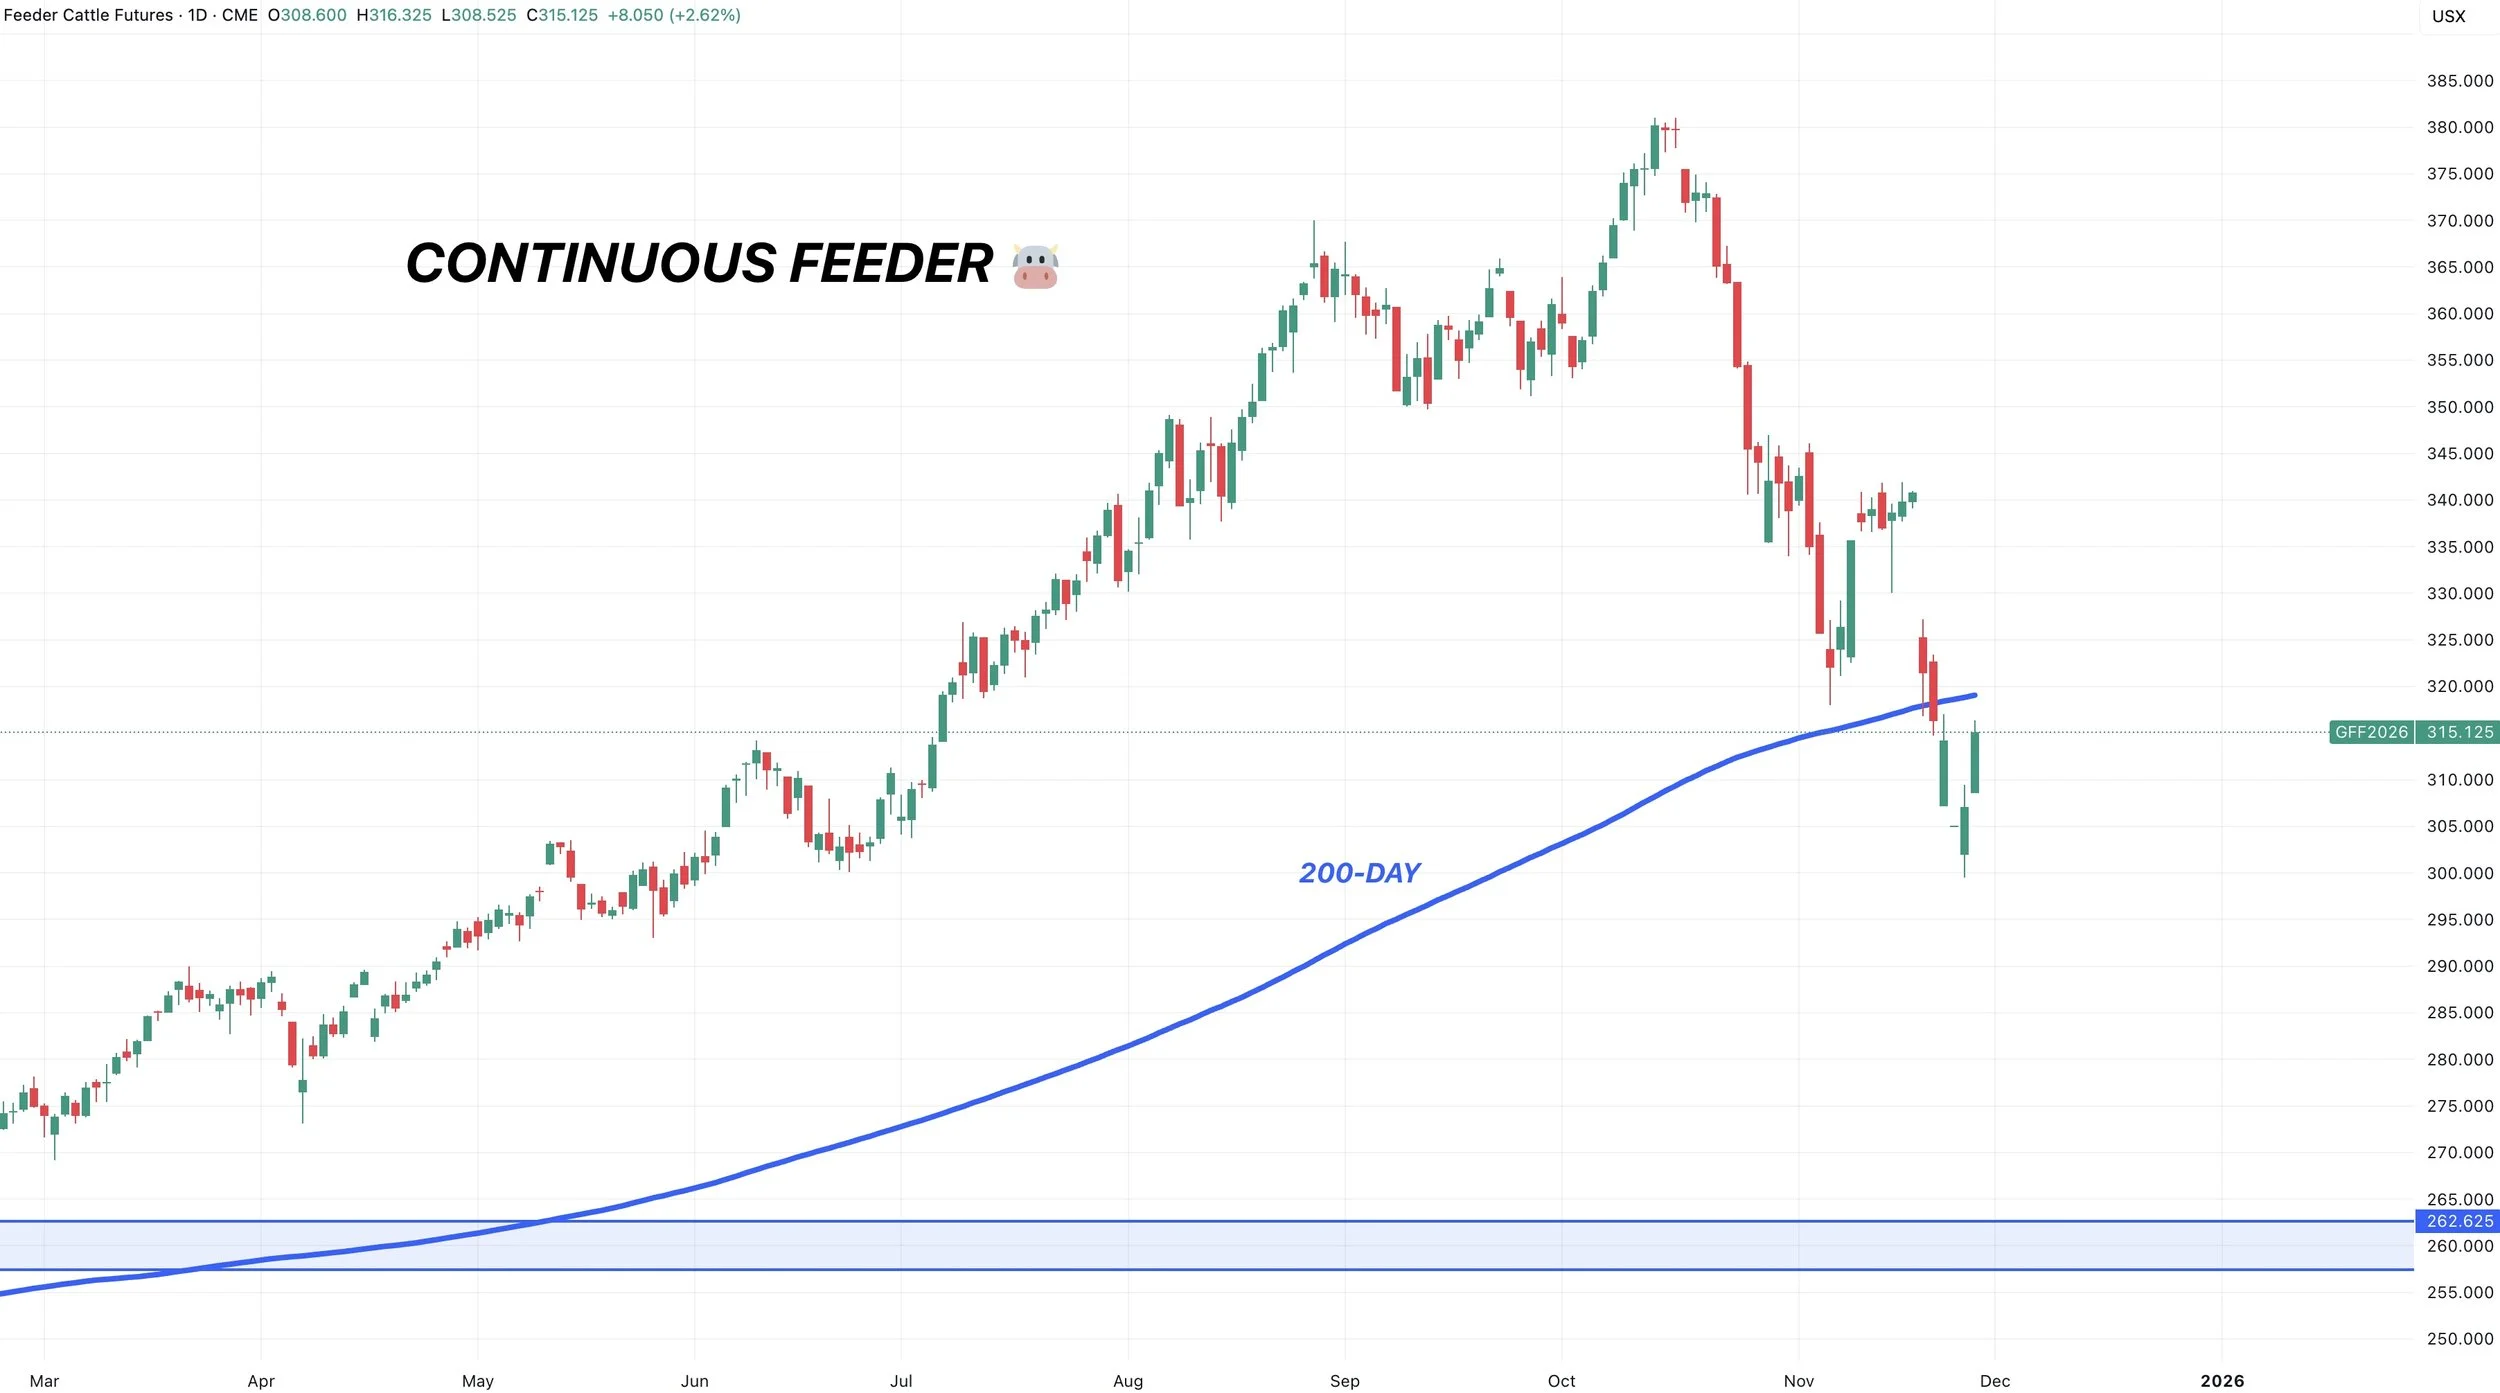
Continuous Feeders 🐮
We are looking at the continuous chart here today.
The big thing to watch is the 200-day MA on here.
If we break above that, then it could indicate we some further upside here.
We could’ve printed a local bottom, but it would be more convincing if we took out that 200-day MA which sits at 319.
Despite the nice bounce, we still haven’t had a high volume reversal day and this could easily just be a holiday bounce.
I will have some upside targets once I feel like we've found a bottom, but we are going to want to look to reward any substantial bounce.
Jan Feeders 🐮
It seems far away right now, but if we reclaimed 61.8% of the entire sell off, it does line up with that big gap we left.
I'm not sure if we have enough juice to get up there, but the 50-61.8% levels would be a point of interest if we got up there.
The 50-day MA sits there as well.
If we post new lows, that box gets moved lower.

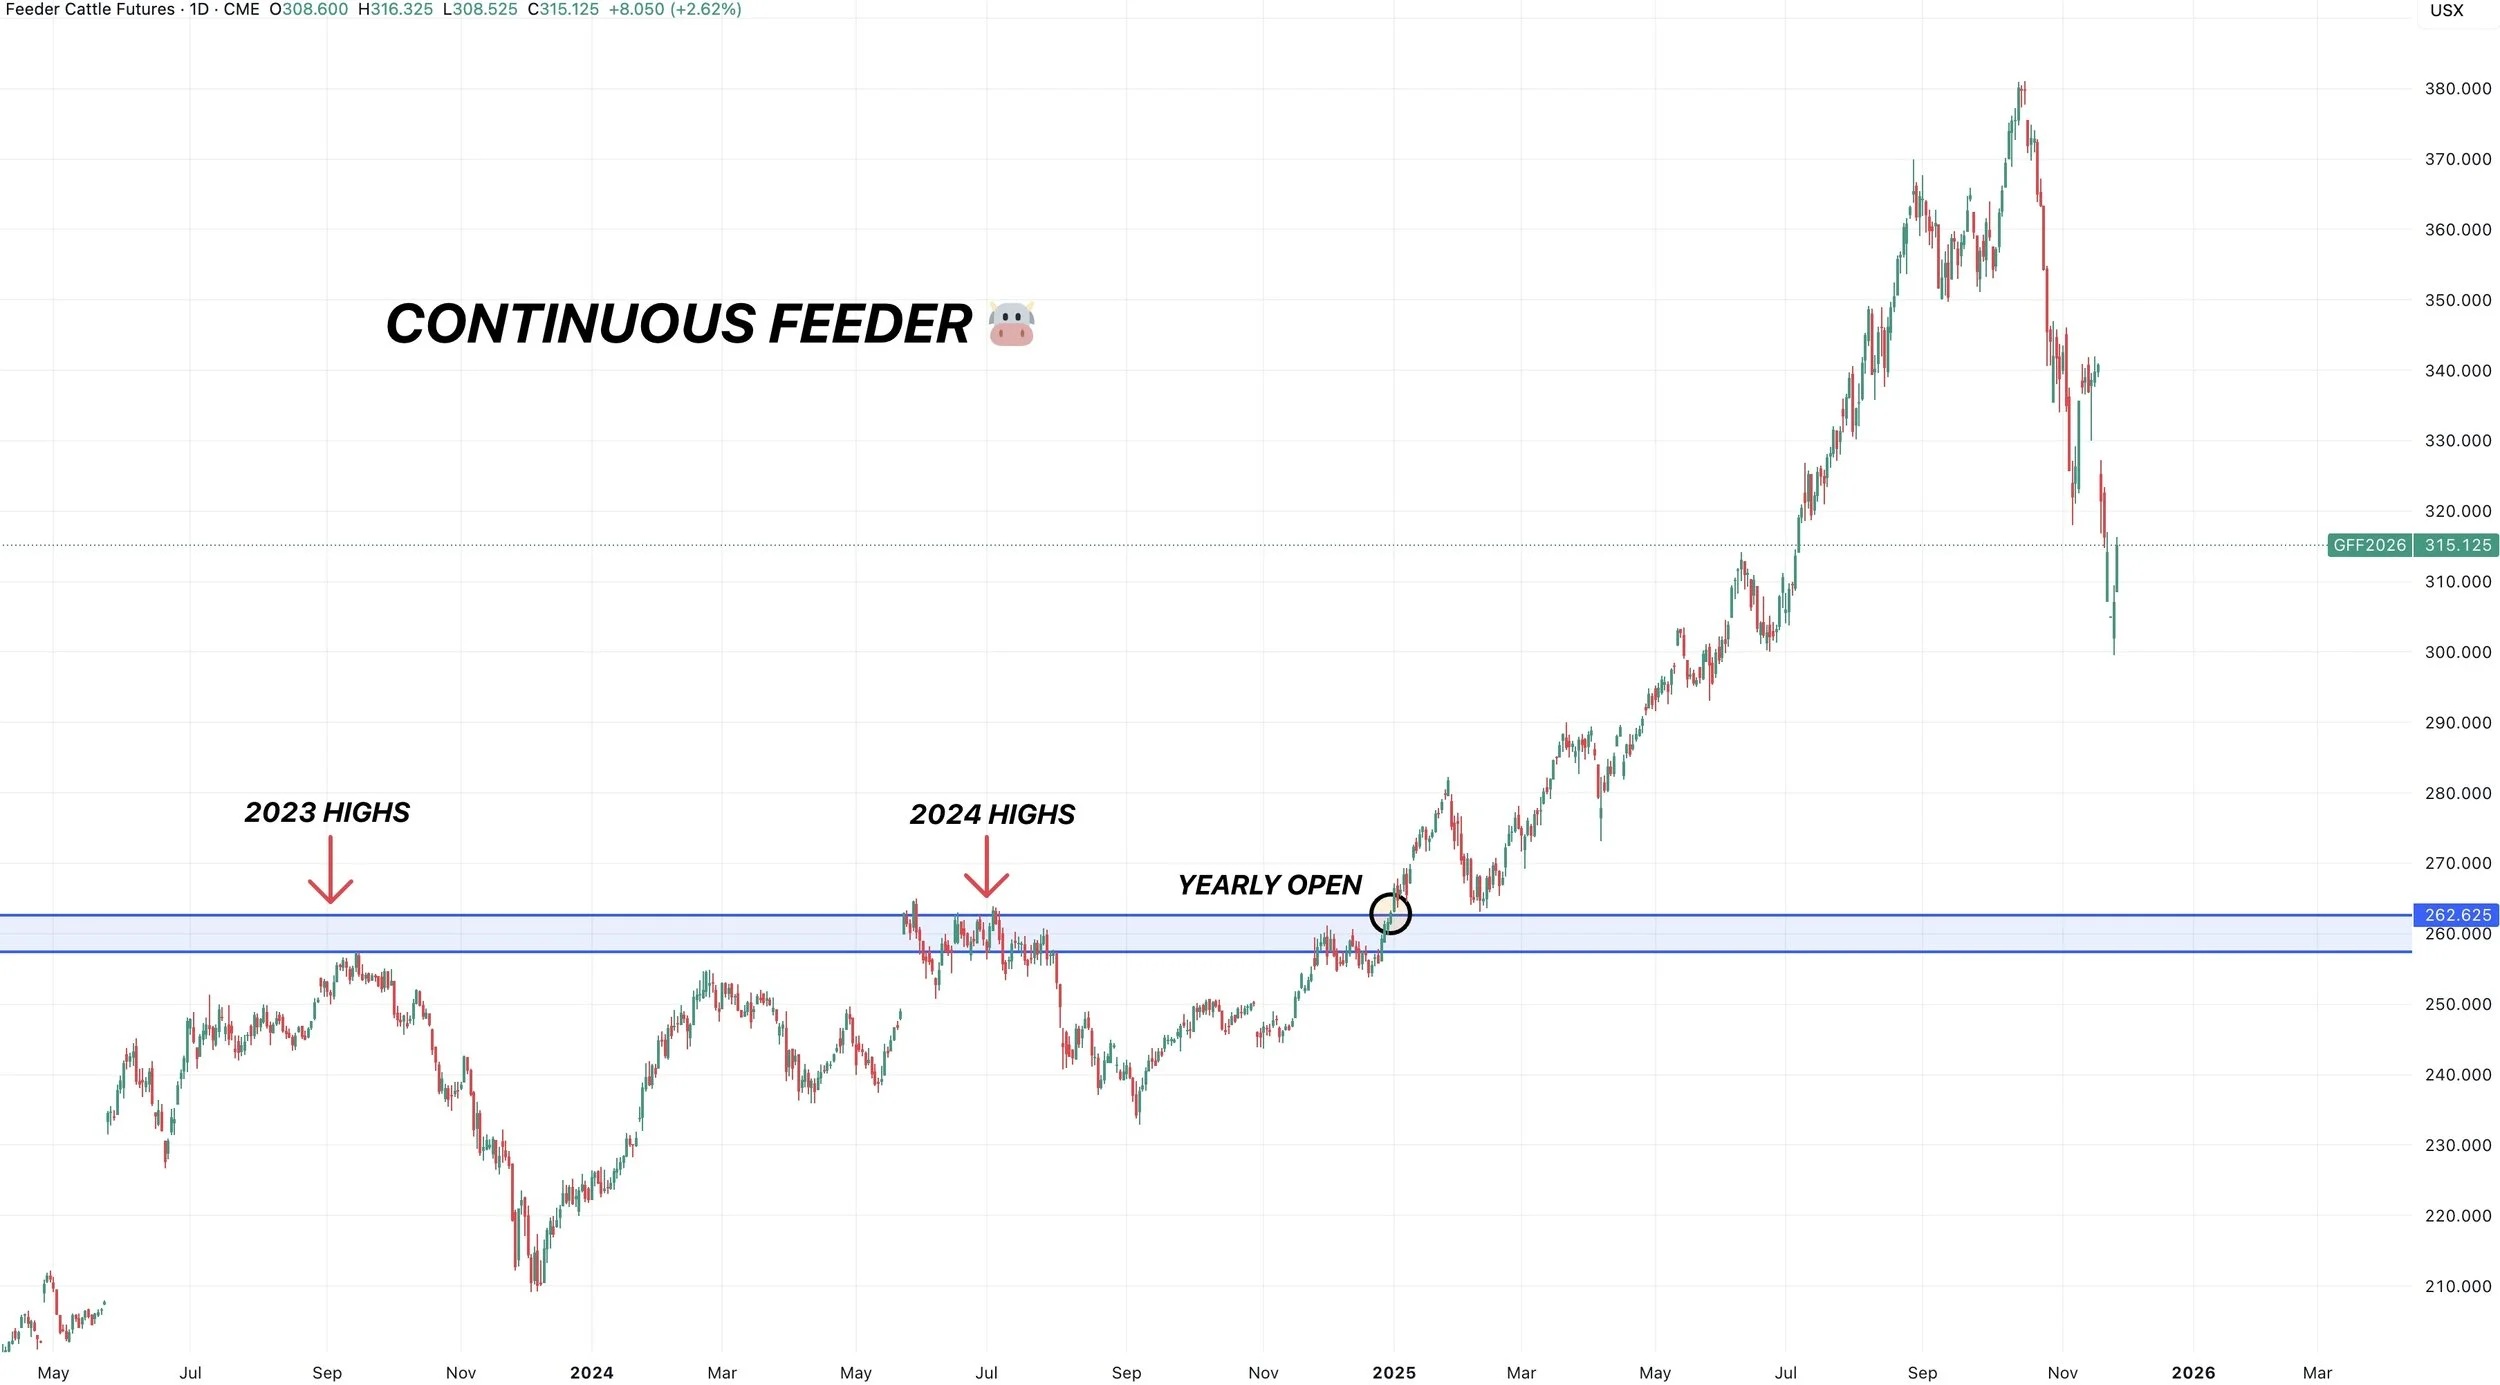
Feeders: Big Picture Floor? 🐮
I showed this earlier this week.
I do ultimately think we could come all the way down towards 260.
I am sure we will see some relief bounced in between, and it could take several months or longer.
But that would be a reasonable place for us to carve out some longer term lows.
That was our yearly open, as well as our resistance in 2023 and 2024.
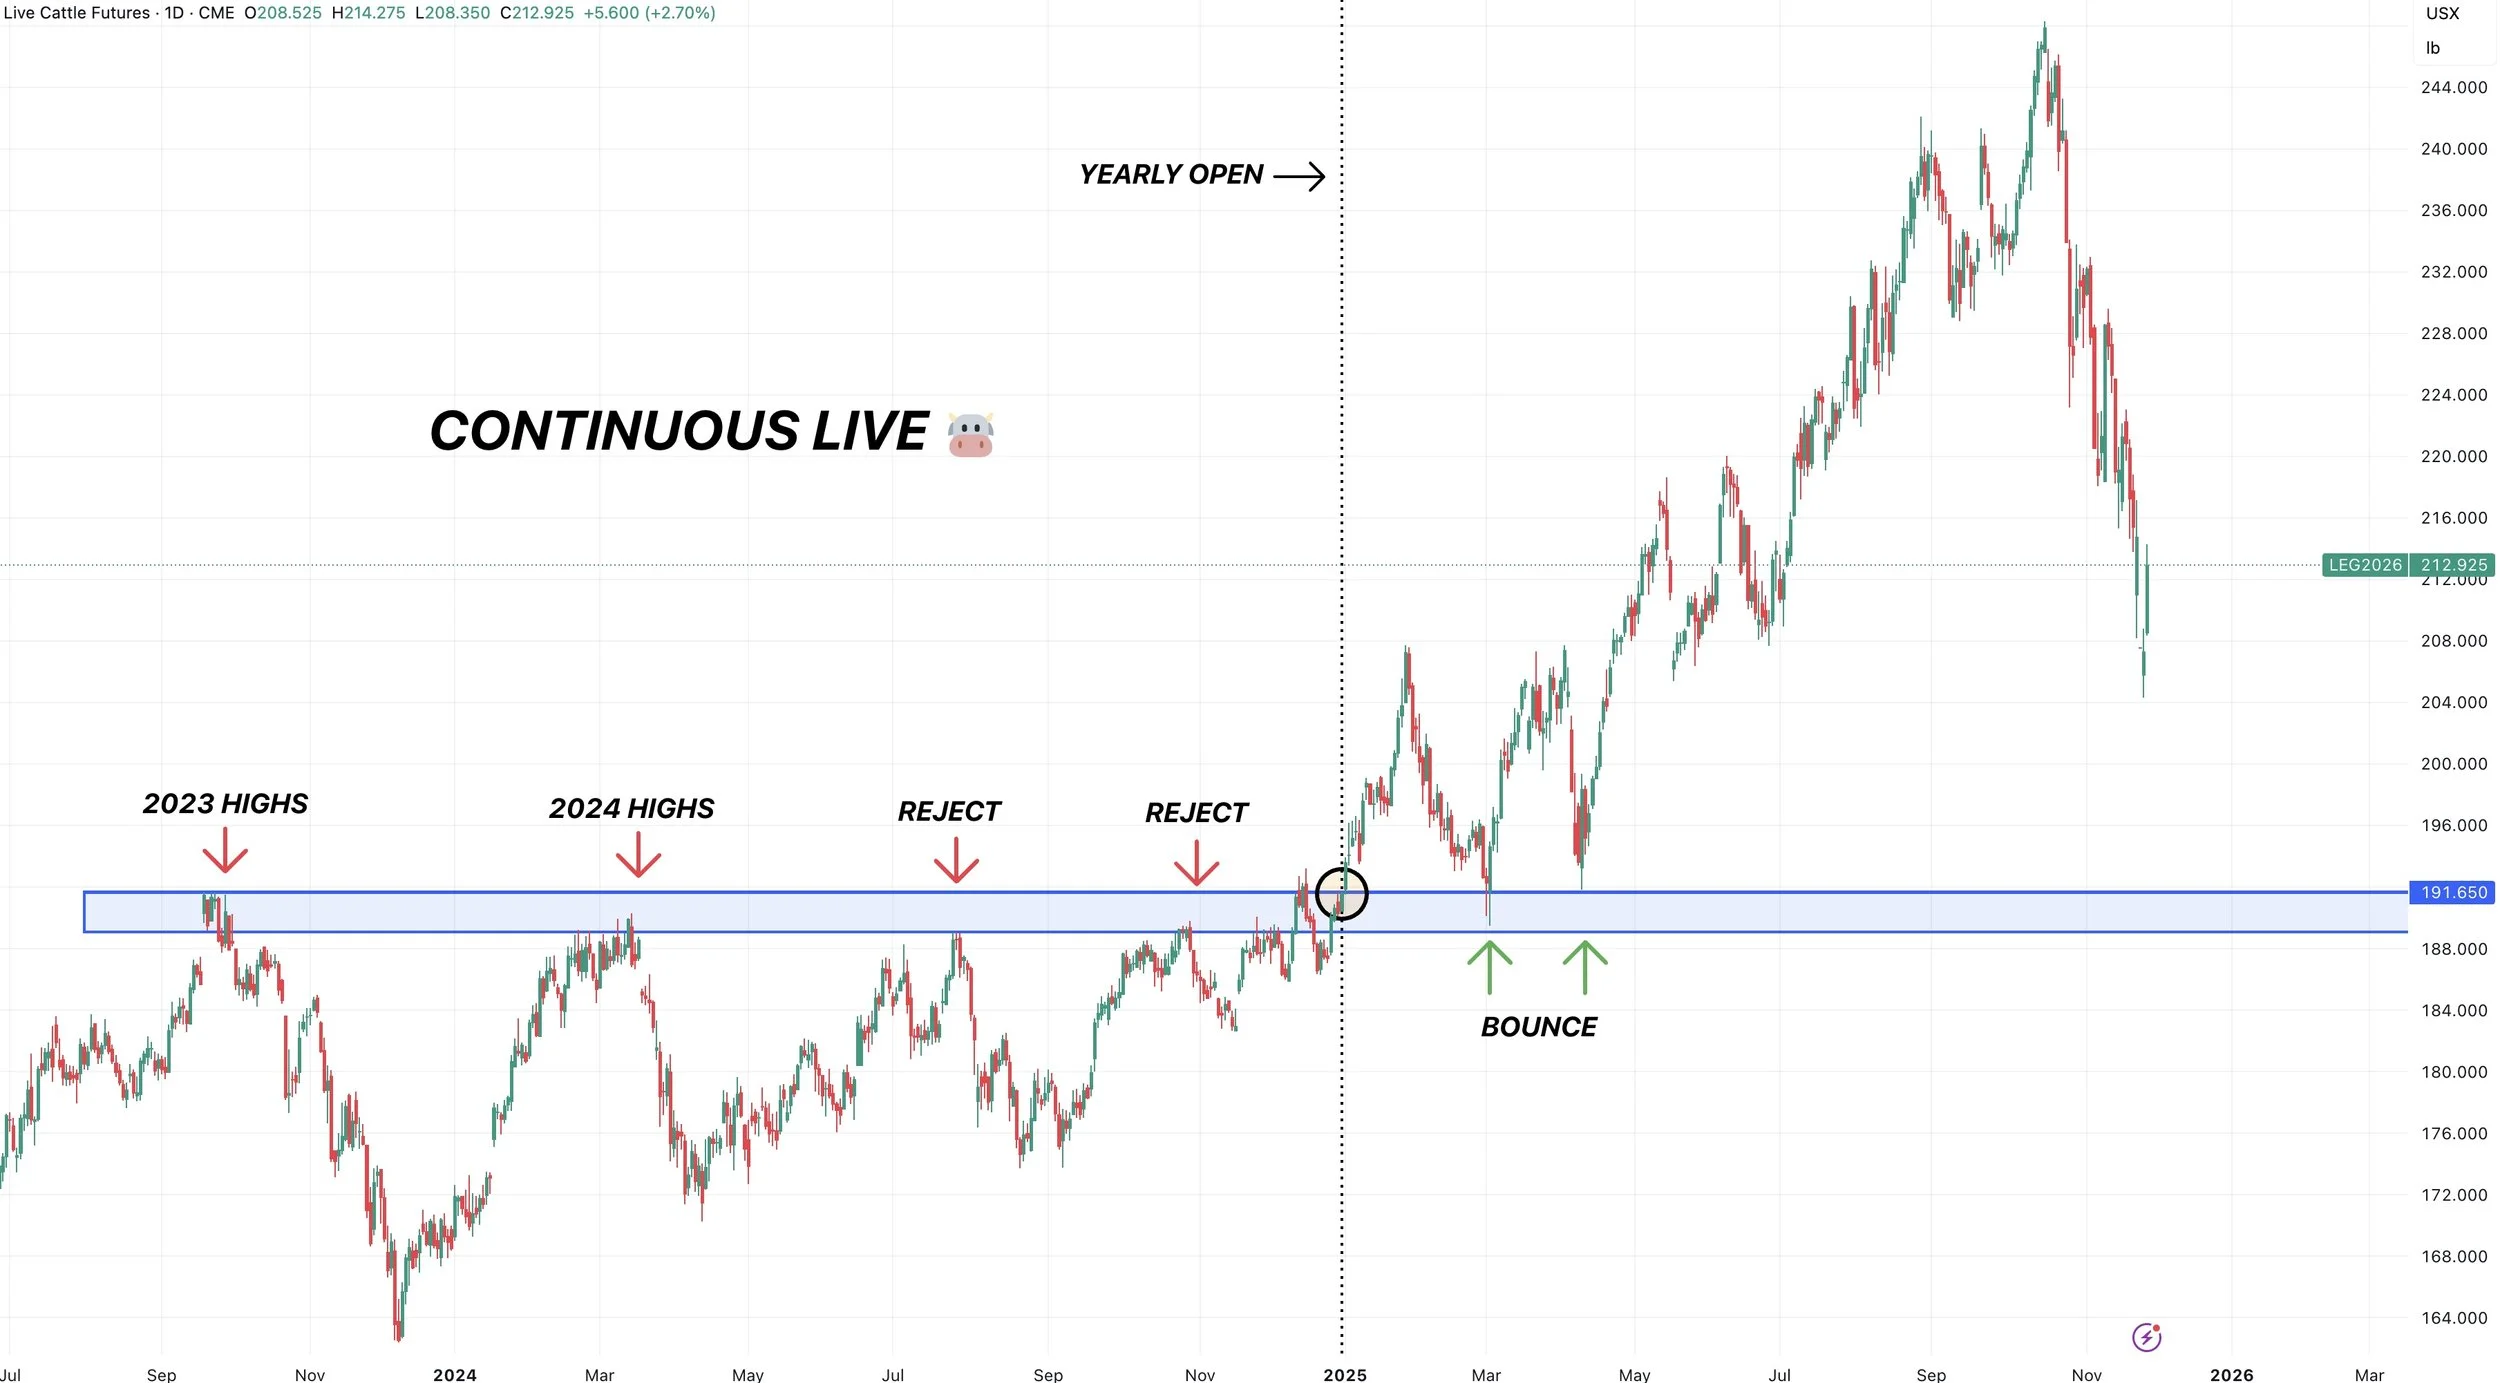
Continuous Live 🐮
All we are watching here is the 200-day MA as well.
If we break above, we could’ve found some local lows here.
It sits at 218.

Live: Big Picture Floor? 🐮
Like feeders, I think our long term floor could very easily be towards 190 or so.
We opened the year there.
It was our highs in 2023 and 2024.
Where we rejected on 4 different occasions.
Old resistance is viewed as new support.
On both of the spring sell offs we bounced there as well.
Past Sell & Protection Signals
We recently incorporated these. Here are our past signals.
Nov 17th: 🌱
Soybean sell signal & hedge alert.
Nov 13th: 🌽 🌱
Managing risk in corn & beans ahead of USDA report.
Oct 28th: 🌽
Corn sell signal & hedge alert.
Oct 27th: 🌱
Soybean sell signal & hedge alert.
Oct 13th: 🐮
Cattle sell signal & hedge alert.
Aug 22nd: 🌱
Soybean sell signal & hedge alert.
July 31st: 🐮
Cattle sell signal & hedge alert.
July 10th: 🐮
Cattle sell signal & hedge alert.
June 5th: 🐮
Cattle sell signal & hedge alert.
June 2nd: 🌾
MPLS wheat sell signal.
April 10th: 🌽
Old crop corn sell signal.
March 19th: 🐮
Cattle hedge & sell signal.
Feb 18th: 🌽 🌾
KC wheat & corn signal.
Jan 23rd: 🌽 🌱
Corn & beans sell signal.
Jan 15th: 🌽 🌱
Corn & beans hedge alert/sell signal.
Jan 2nd: 🐮
Cattle hedge alert at new all-time highs & target.
CLICK HERE TO VIEW
Dec 11: 🌽
Corn sell signal at $4.51 200-day MA
Oct 2nd: 🌾
Wheat sell signal at $6.12 target
Sep 30th: 🌽
Corn protection signal at $4.23-26
Sep 27th: 🌱
Soybean sell & protection signal at $10.65
Sep 13th: 🌾
Wheat sell signal at $5.98
May 22nd: 🌾
Wheat sell signal when wheat traded +$7.00
Want to Talk?
Our phones are open 24/7 for you guys. If you need help with anything at all, don’t hesitate to shoot us a call, text, or email.
Hedge Account
Interested in a hedge account? Use the link below to set up an account or shoot Jeremey a call at (605)295-3100