
LONGEST WHEAT RALLY SINCE 2021 & TARIFF TURMOIL
MARKET UPDATE
You can scroll to read the usual update as well. As the written version is the exact same as the video.
Timestamps for video:
Tariffs: 0:00min
USDA: 5:00min
Corn: 8:45min
Beans: 13:00min
Wheat: 13:55min
Cattle: 17:35min
Want to talk about your situation?
(605)250-3863
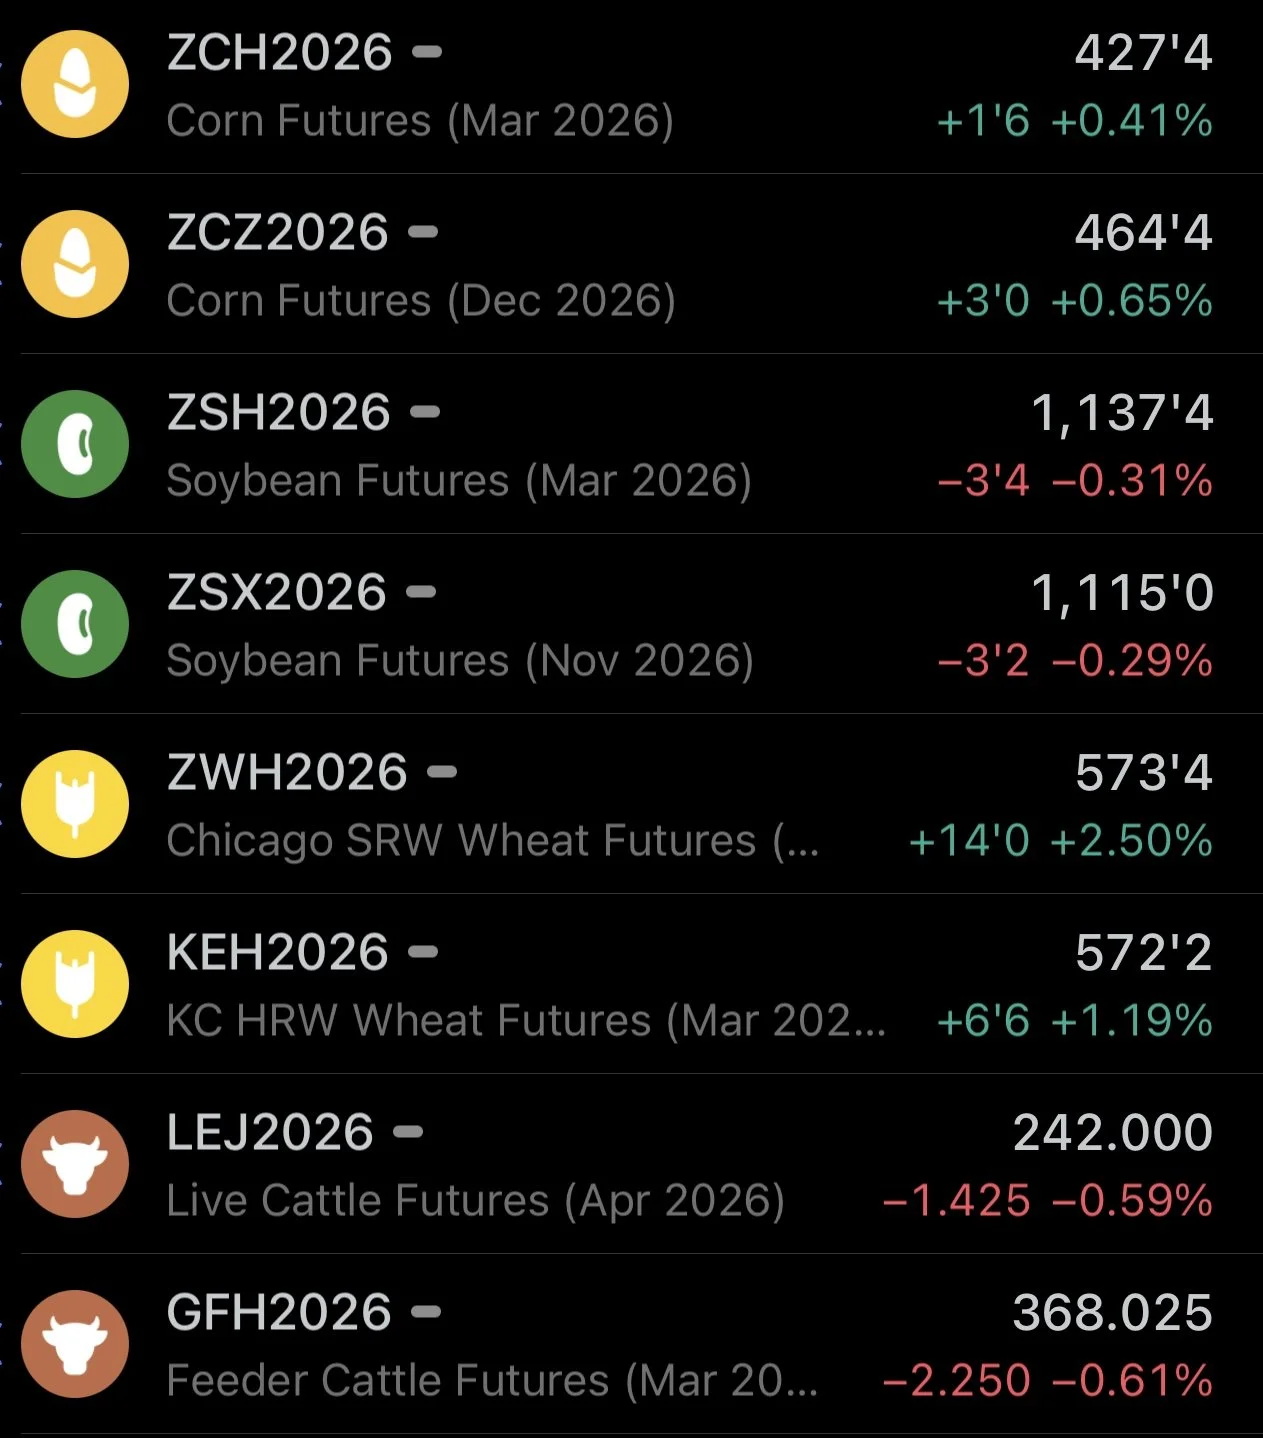
Futures Prices Close
Overview
Grains close out the weak on the strong side.
We've got a ton to unpack today so I apologize if this is getting out a little later than usual.
Everything from the tariff news, the USDA outlook, and the wheat having it's longest sustained rally in years.
On the week:
May Corn: -2 cents
May Beans: +5 cents
May Wheat: +32 cents
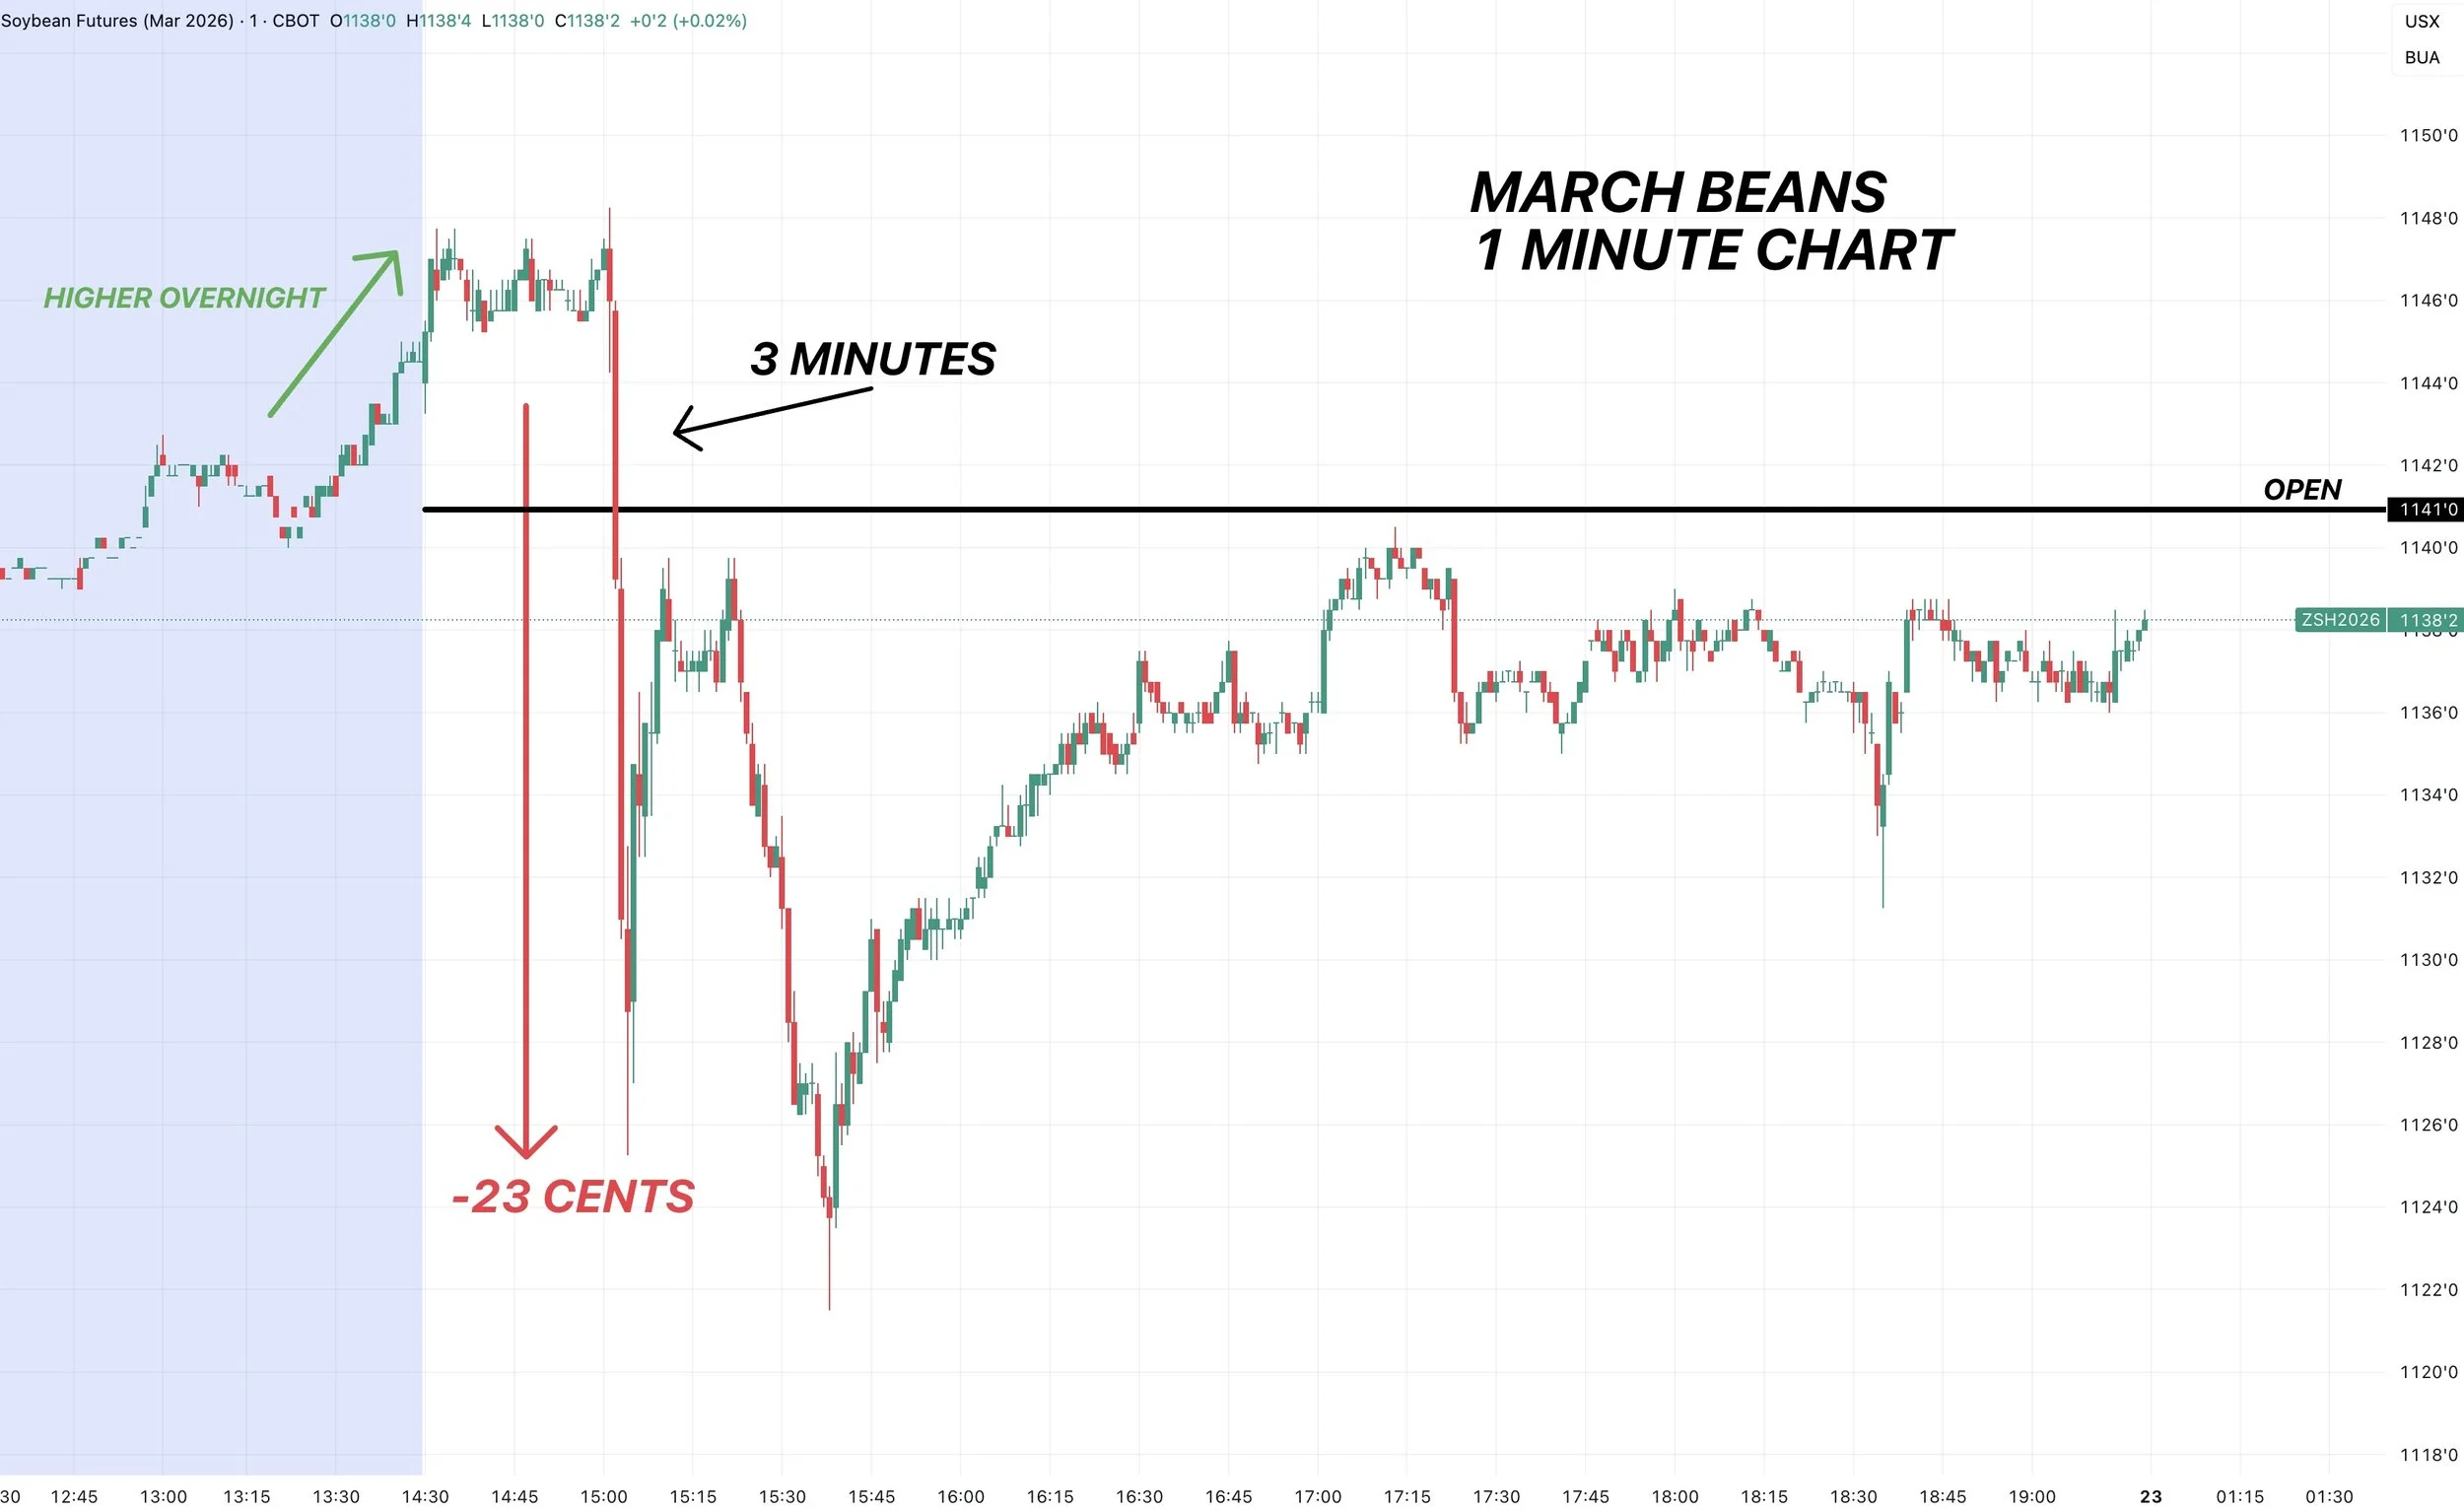
Pretty wild day in the grains. The wheat market continues to push higher. Soybeans had a 27 cent range today.
Soybeans were trading higher this morning.
Then in 3 minutes we dumped -23 cents.
We then spent the rest of the day recovering and only ended the day down just 2-3 cents.
So what happened?
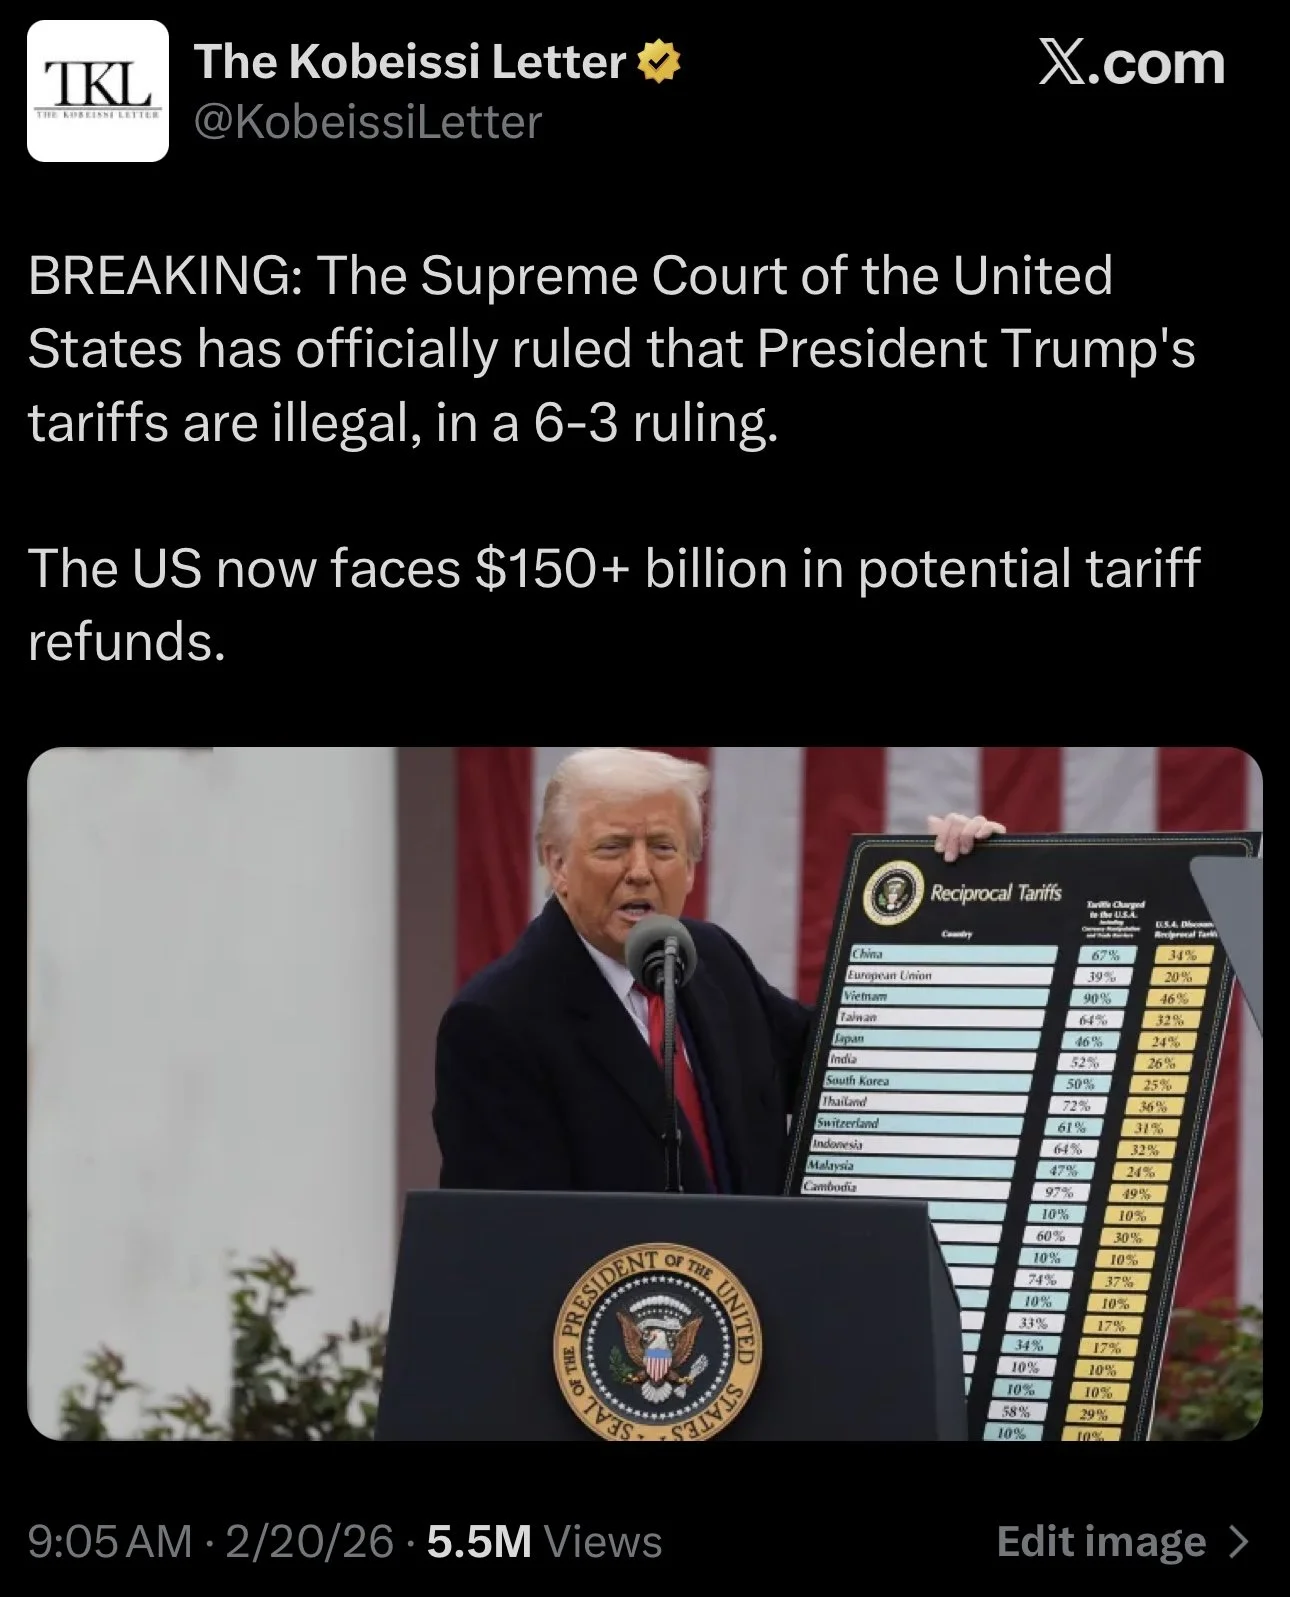
The US Surpreme Court ruled Trump's tariffs illegal.
What happens next?
Now you might have two initial reactions to this news.
One would be:
"Isn’t cancelling tariffs bullish for grains? Tariffs tanked our market last April and destoryed the soybean export program."
The other reaction would be:
"Wait this is actually bearish because no tariffs means that China no longer has a reason to buy those soybeans they agreed to buy. Because they were only buying to make a deal with Trump. No tariffs means that Trump loses his leverage and China is no longer forced to buy our soybeans that are $1 more expensive than Brazil's."
or "What if China cancels the soybeans they bought?"
Is it really that simple?
Short Answer: No
Let's dive into the fine details of the entire situation.
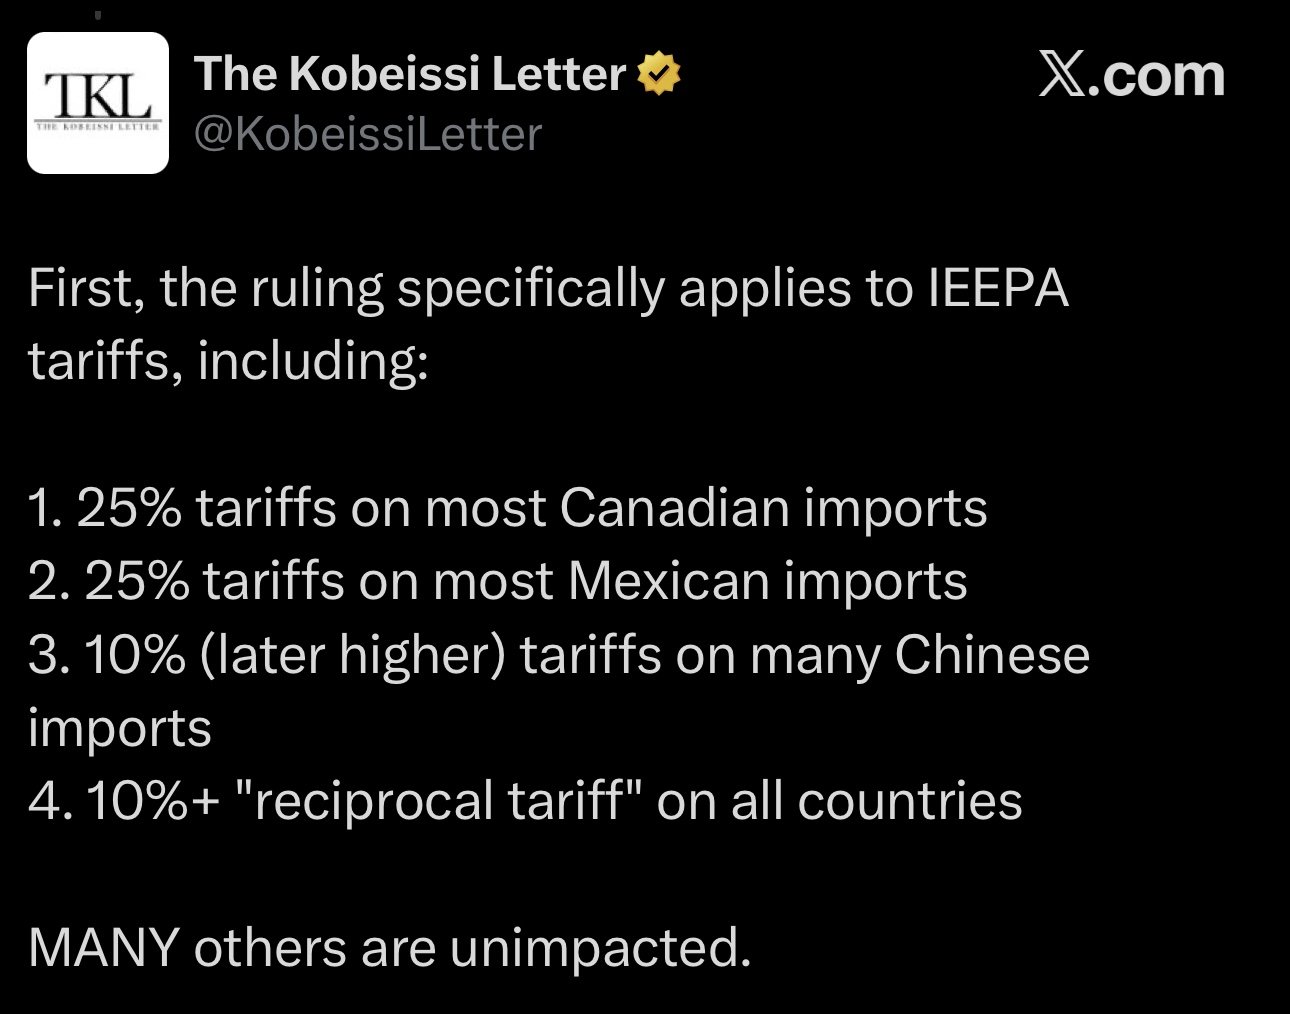
First off, this ruling only applies to IEEPA tariffs.
(Known as the emergency tariffs)
Which means it only affects the tariffs of the following:
25% tariffs on Canada imports
25% tariffs on Mexico imports
10% tariffs on China imports
The reciprocal tariffs
Which means there are a lot of other tariffs that are completely unimpacted.
Tariffs under Section 301, Section 232, and others remain in effect which I'll explain.
Trumps Plan B
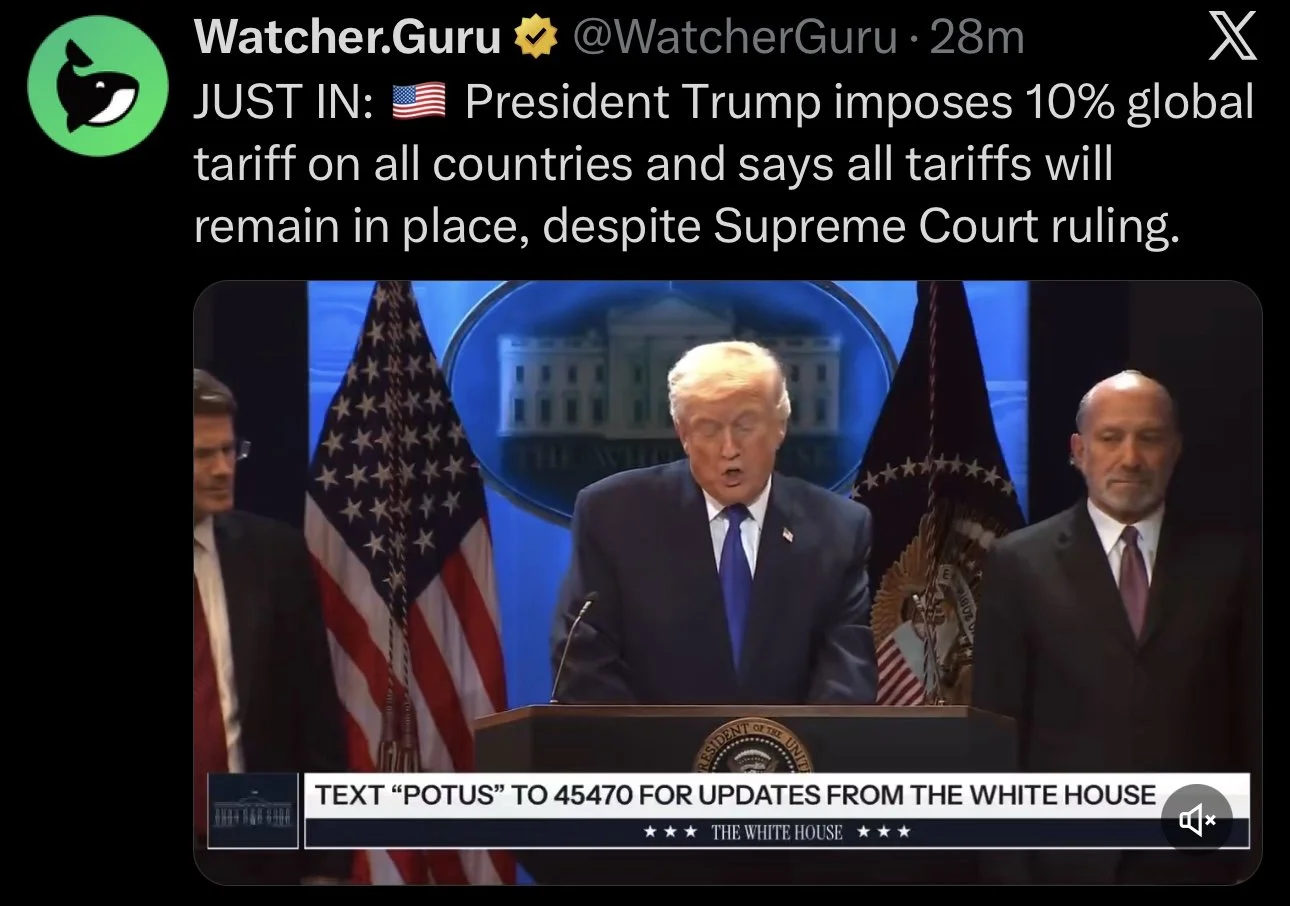
After the ruling, Trump made a statement and said he has a back up plan.
This afternoon Trump announced that they would imposing a 10% global tariff above the tariffs already in place.
He also stated that all the tariffs will remain in place depsite the Supreme Court ruling.
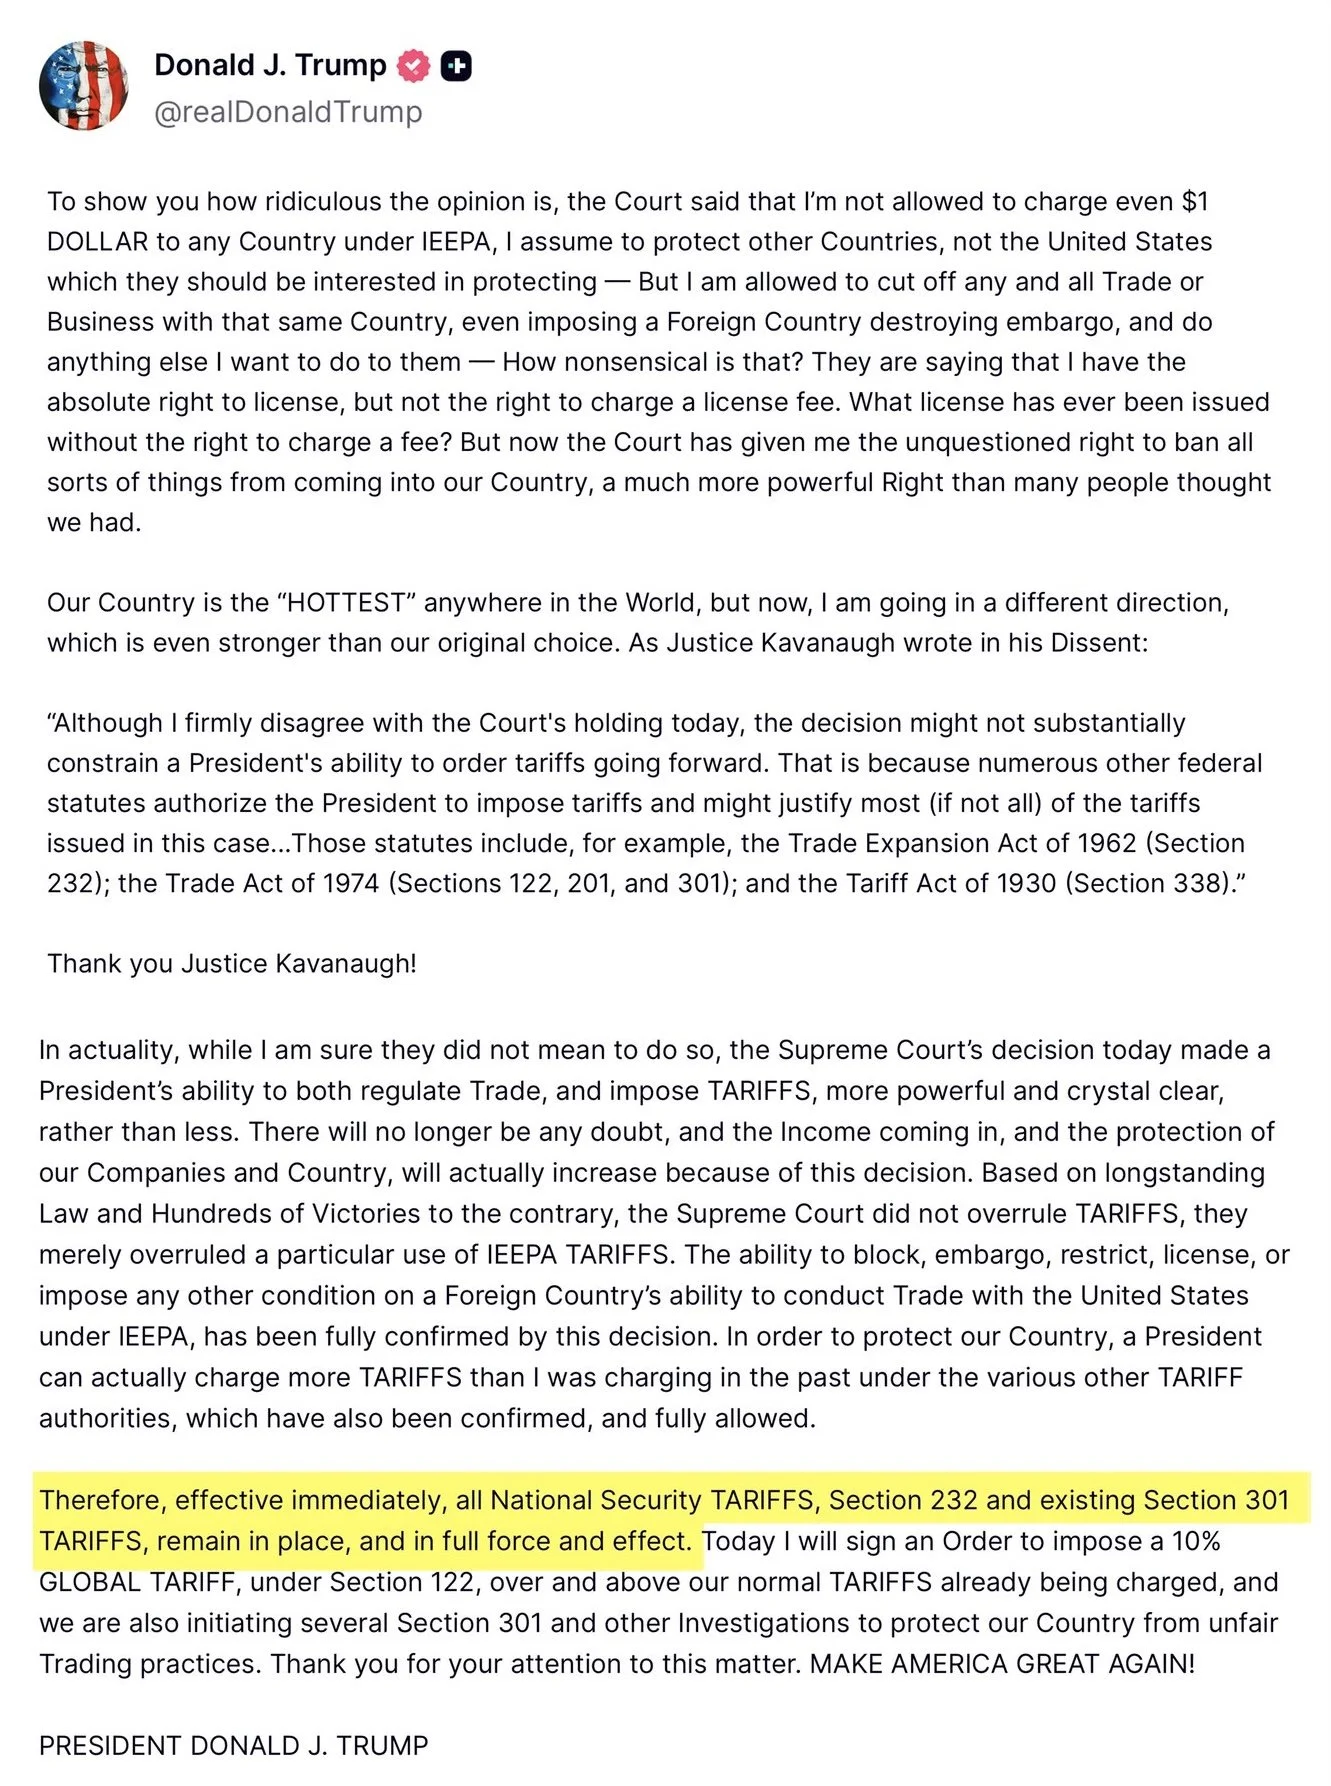
Here is what he tweeted.
He said:
"Tariffs, section 232 and existing section 301 tariffs, remain in place, and in full effect. Today I will sign an order to impose a 10% global tariff, under section 122."
What does this mean?
Trump basically found a legal work around.
The court basically told him that he can’t justify broad tariffs using the specific emergency law he tried to use (Called IEEPA).
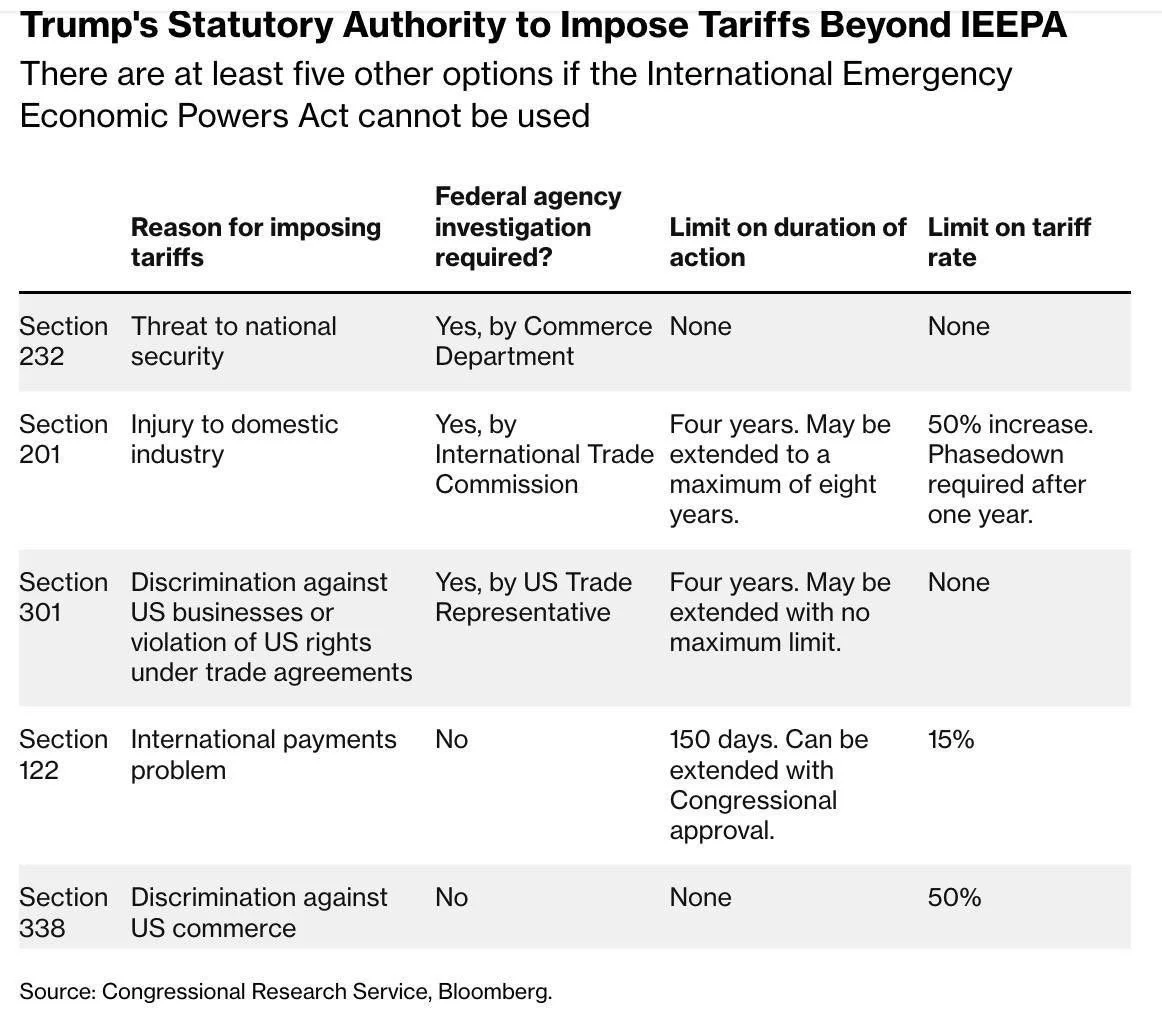
So he's trying to impose tariffs under different sections and laws from the 70's and 80's.
The sections are viewed as legal permission slips.
Section 232 - National Security: this allows tariffs on specific industries if imports threaten US supplies such as steel and aluminum etc. He is keeping these tariffs as there is no limit on the rate.
Section 301 - Unfair Trade: This is basically allows tariffs against countries that are cheating in trade. He is keeping these tariffs as there is no limit on the rate.
Section 122 - Trade Deficit: This is the big one today. This says that he can impose tariffs on ALL imports from any country if the US trade deficit is hurting the economy. This is how he imposed that 10% global tariff today.
So basically, Trump is restructuring the trade policy in a way that is harder to overturn.
Impact on Grains?
Originally, tariffs were viewed as negative. Because they hurt our export demand. For example, it nearly destroyed the soybean export program last year.
That is, until Trump used soybeans as a bargaining chip with China. If they want a trade deal, they need to buy some soybeans.
I'd argue that right now, today's ruling doesn’t have a major impact on grains for now. Given that there are other ways around their ruling. But it could develop into something else.
It appears that tariffs are not going anywhere, and it's not that easy just to remove them.
So you could argue that for now, soybeans can still be used as a bargaining chip to China.
It's a lot to unpack and is constantly developing. It's hard to decipher exactly how it'll all shake out.
Signs the market isn’t betting tariffs going away
Right after the news came out this morning about the ruling, there were signs that the market did not believe that that was it for tariffs.
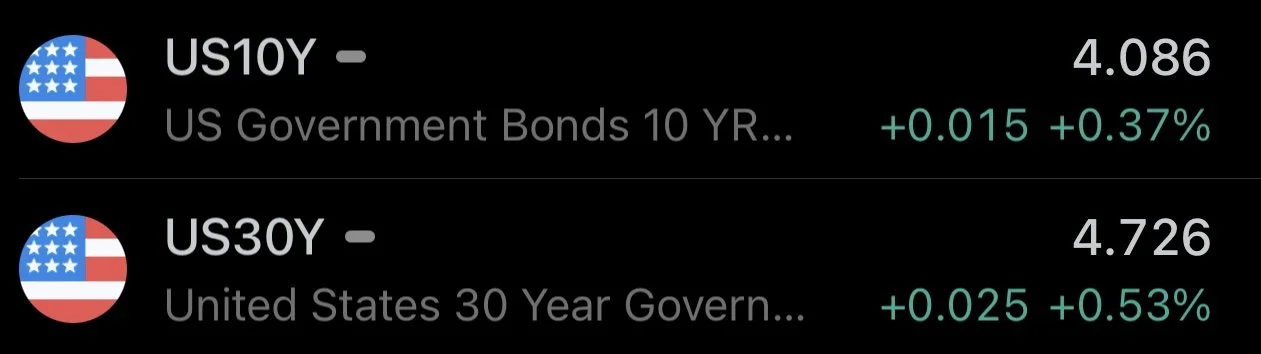
Take the bond market for example.
If the market truly believed tariffs were going away, the bond market would’ve dropped.
Instead, it was higher even right after the ruling.
Stocks and commodities react to events and headlines.
Bonds react to outcomes.
Bonds don’t think tariffs are going away.
USDA Outlook
The tariff headlines stole the show today, but yesterday we had the USDA outlook and got a glimpse at their original thoughts for the new crop balance sheet.
Here was their numbers.
First for corn.
Corn:
Acres: 94 million
Yield: 183 bpa
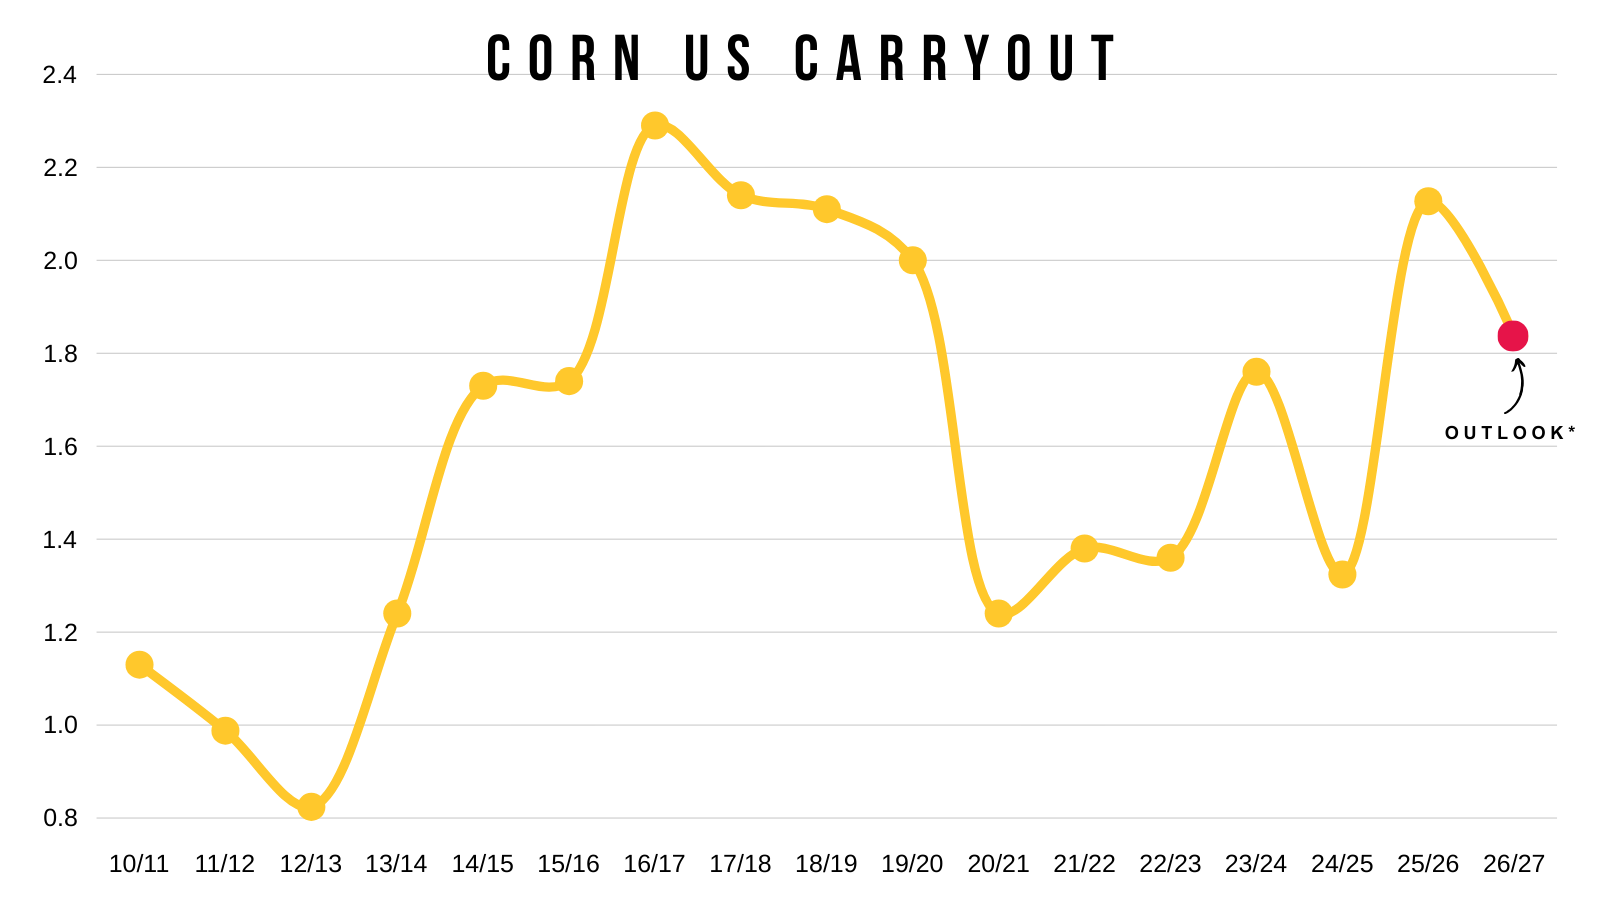
Carryout: 1.84 billion
So they have acres, yield, carryout, feed & residual, and exports all lower from last year.
The cut to acres and yield would result in 1 billion bushels less production vs last year.
We'll dive into how this could impact the new crop balance sheet later in the corn section, but first let's look at how these numbers stack up.
Here is the new crop outlook numbers vs old crop numbers.

A 183 yield is down from last year's record, but would still be the 2nd largest ever of course.
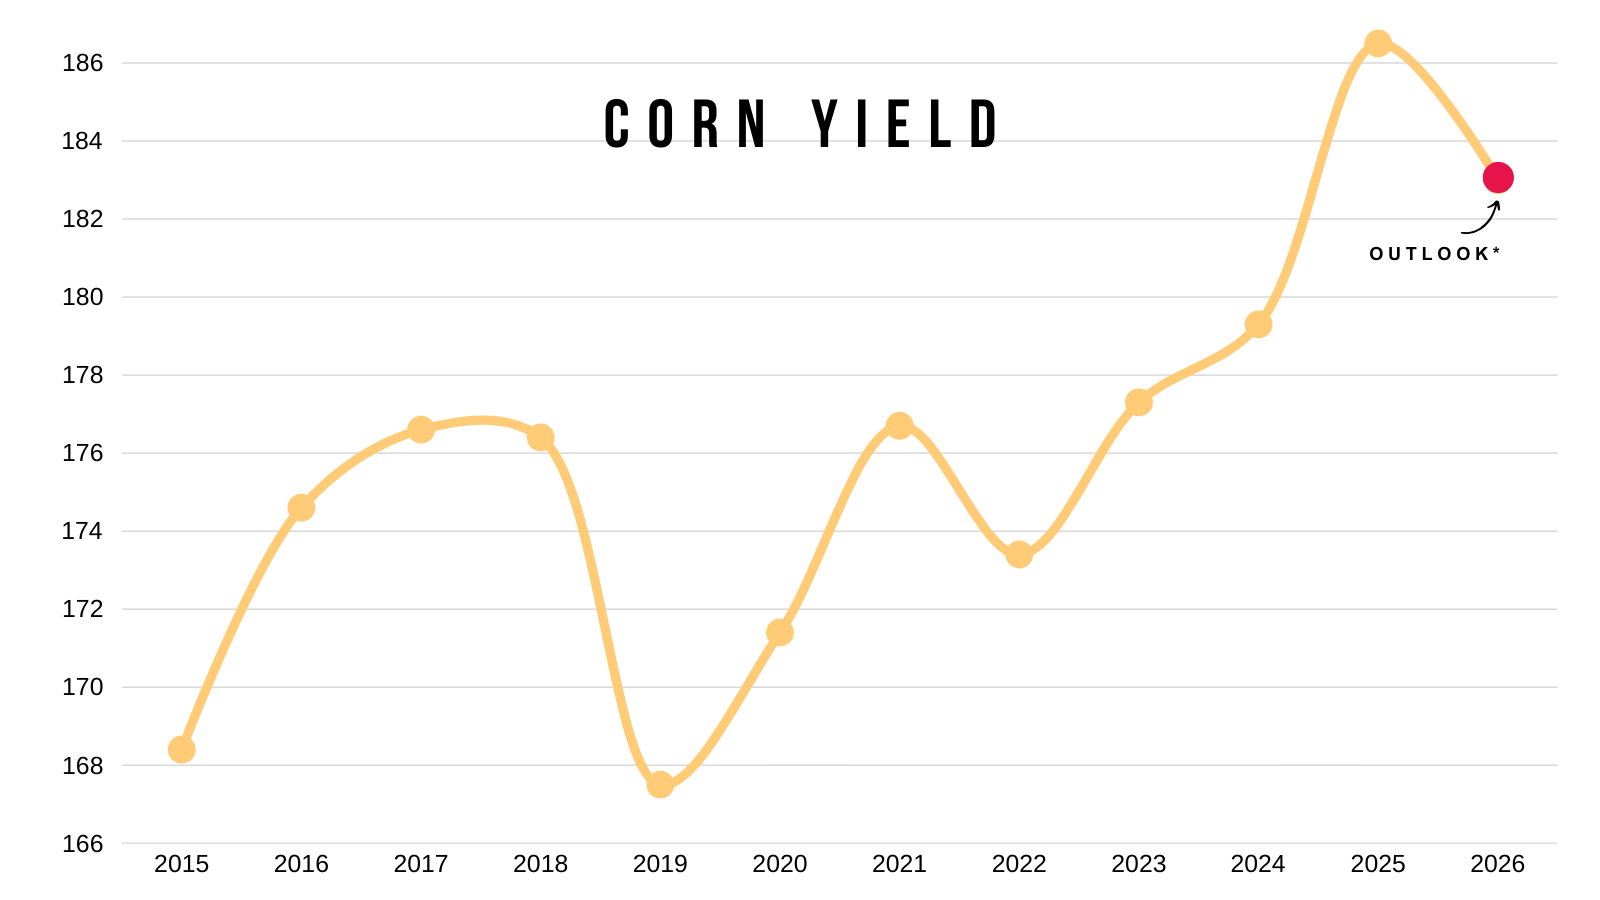
For carryout they are actually expecting a pretty large drop.
1.84 billion vs last years 2.13 billion.
That's nearly a -300 million bushel decline.
Even so, it would be the 2nd largest since 2019. Only behind last year.
But on the bright side, that means the corn story is expected to be more bullish than last year.
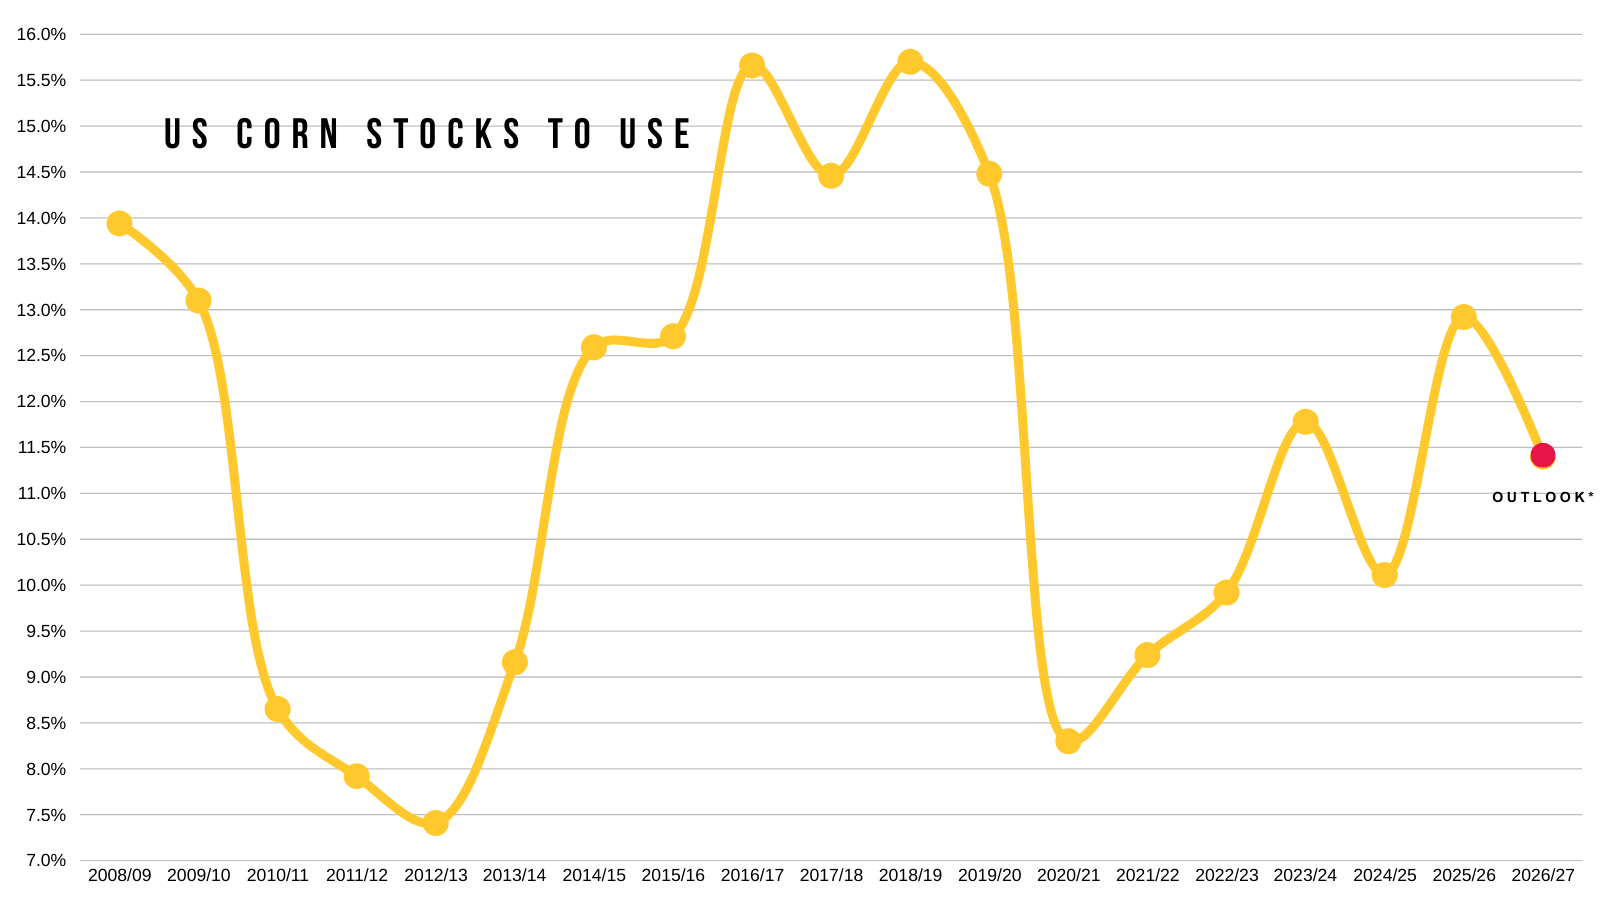
For the stocks to use ratio they had 11.40%.
That is a decent drop from last year's 12.90%.
That would put this year right about in the middle of last year and 2024.
The acres is where things get interesting.
They are expecting 94 million acres.
This would still be one of the larger acres we've ever seen.
Despite being down nearly -5 million from last year.
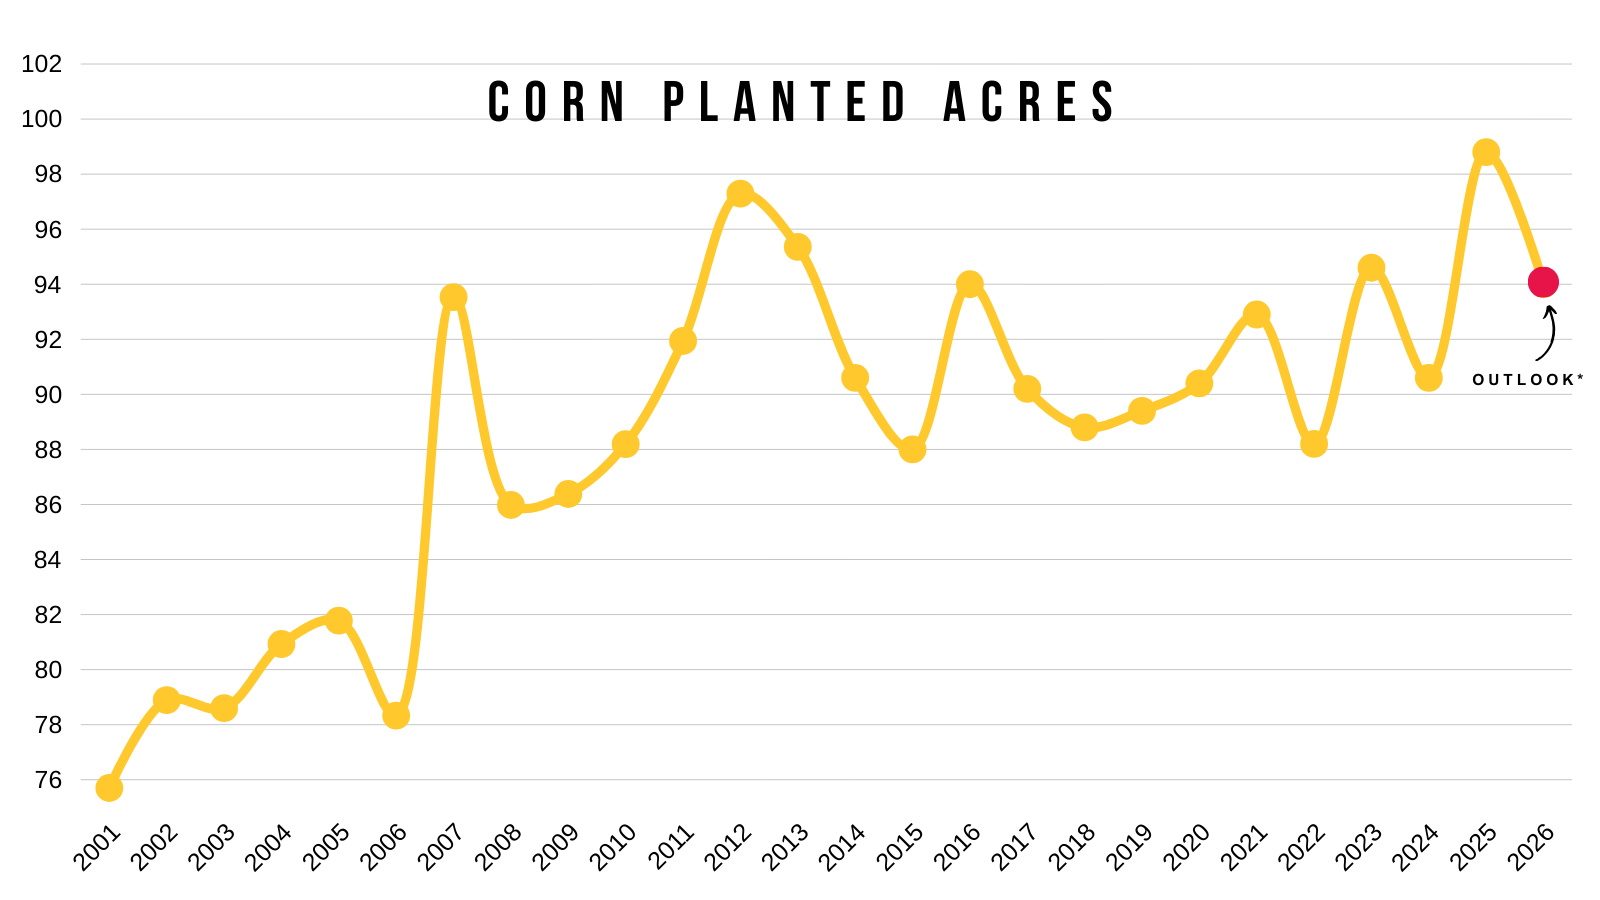
Losing -5 million acres would obviously be friendly and make it a lot easier to get a bullish story going in corn later.
The problem is that most think we're going to be closer to 96 rather than 94 million.
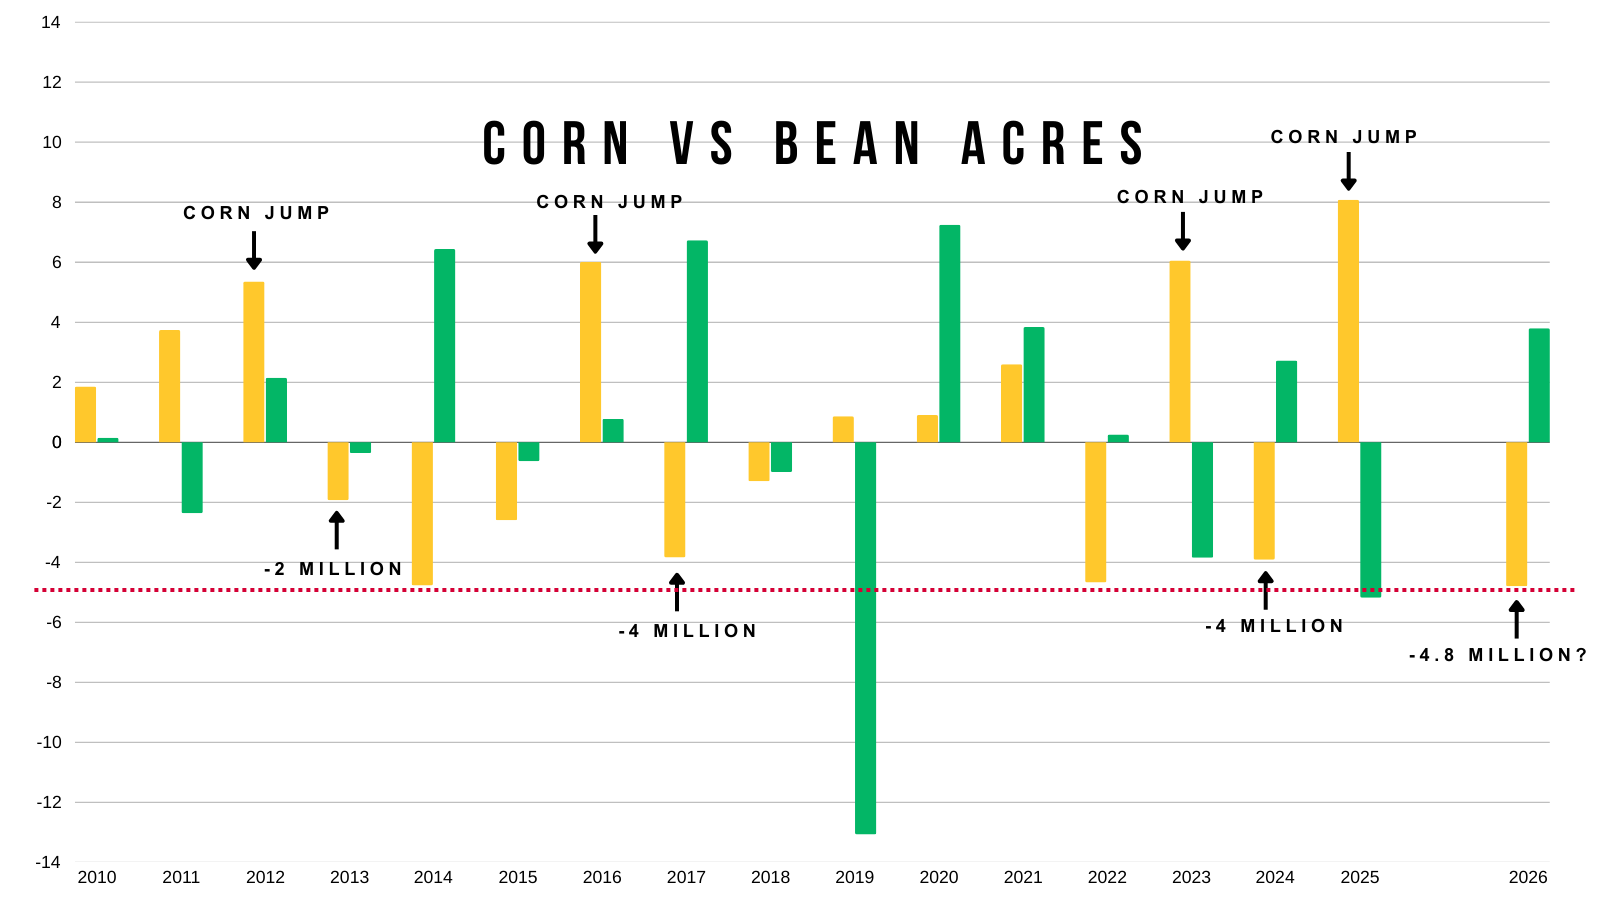
If you look at prior changes, when we have seen a big jump in corn acres, the following year tends to result in a drop of between 2 to 4 million acres the following year.
So we should expect a drop, but a 4.8 million drop to 94 million would be one of the larger drops we've ever seen. Making it harder to think that's how it shakes out.
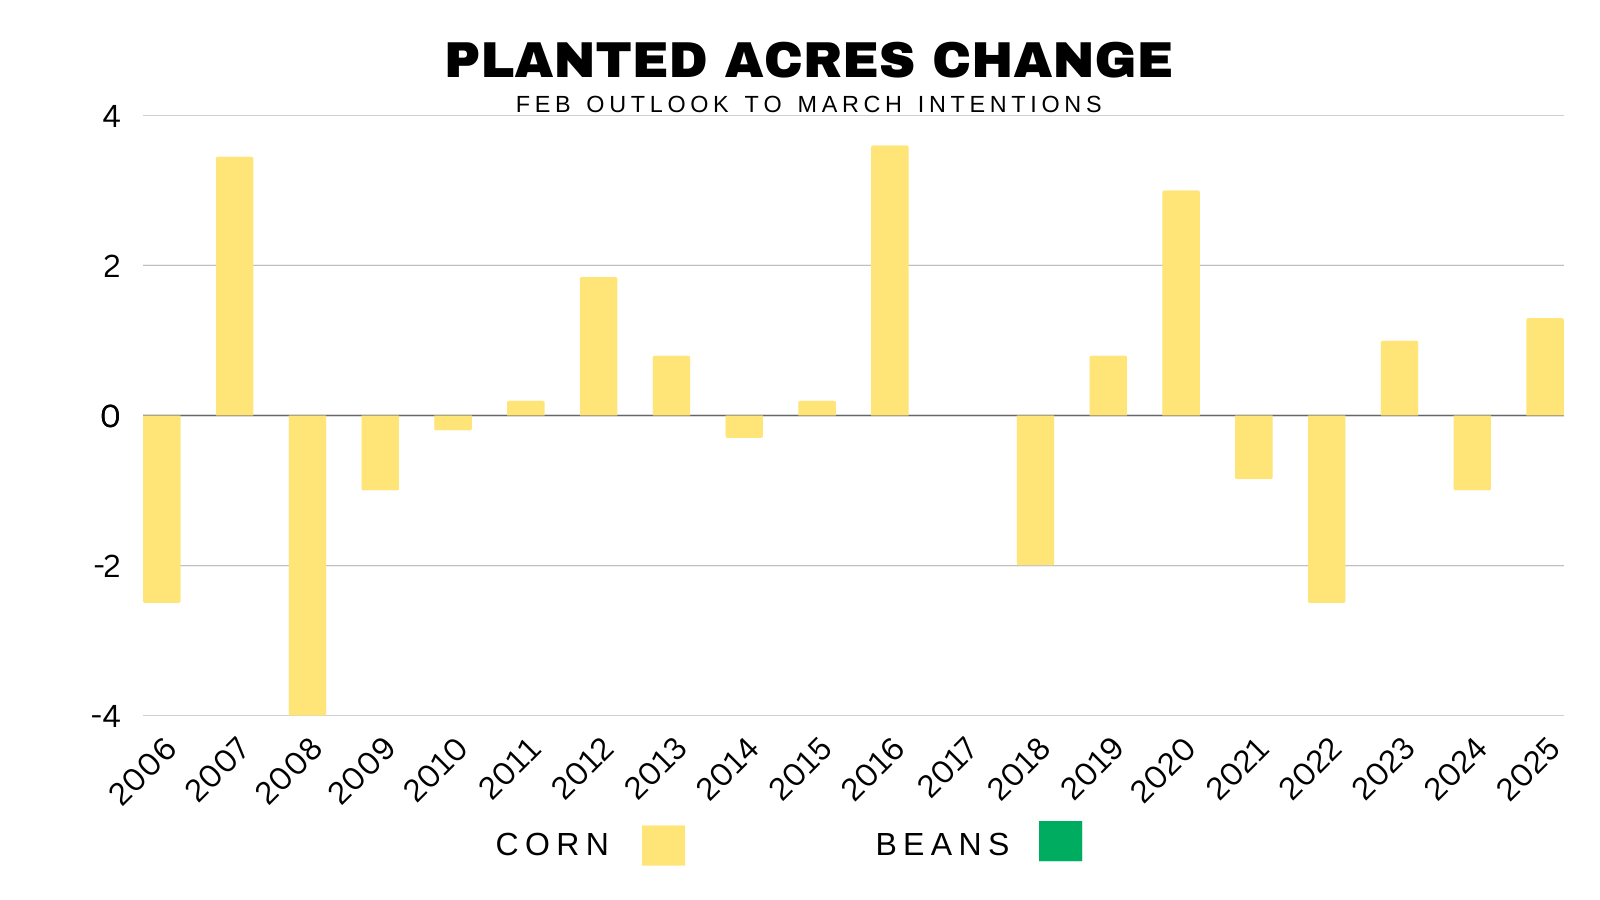
How do acres usually change from the February outlook to March planting intentions?
Here is the past acre changes from the two reports the last 20 years.
The data is actually split 50/50.
9 years they lowered it.
10 years they raised it.
1 year they left it unchanged. (2017)
Average change higher or lower is +/- 1.60 million acres.
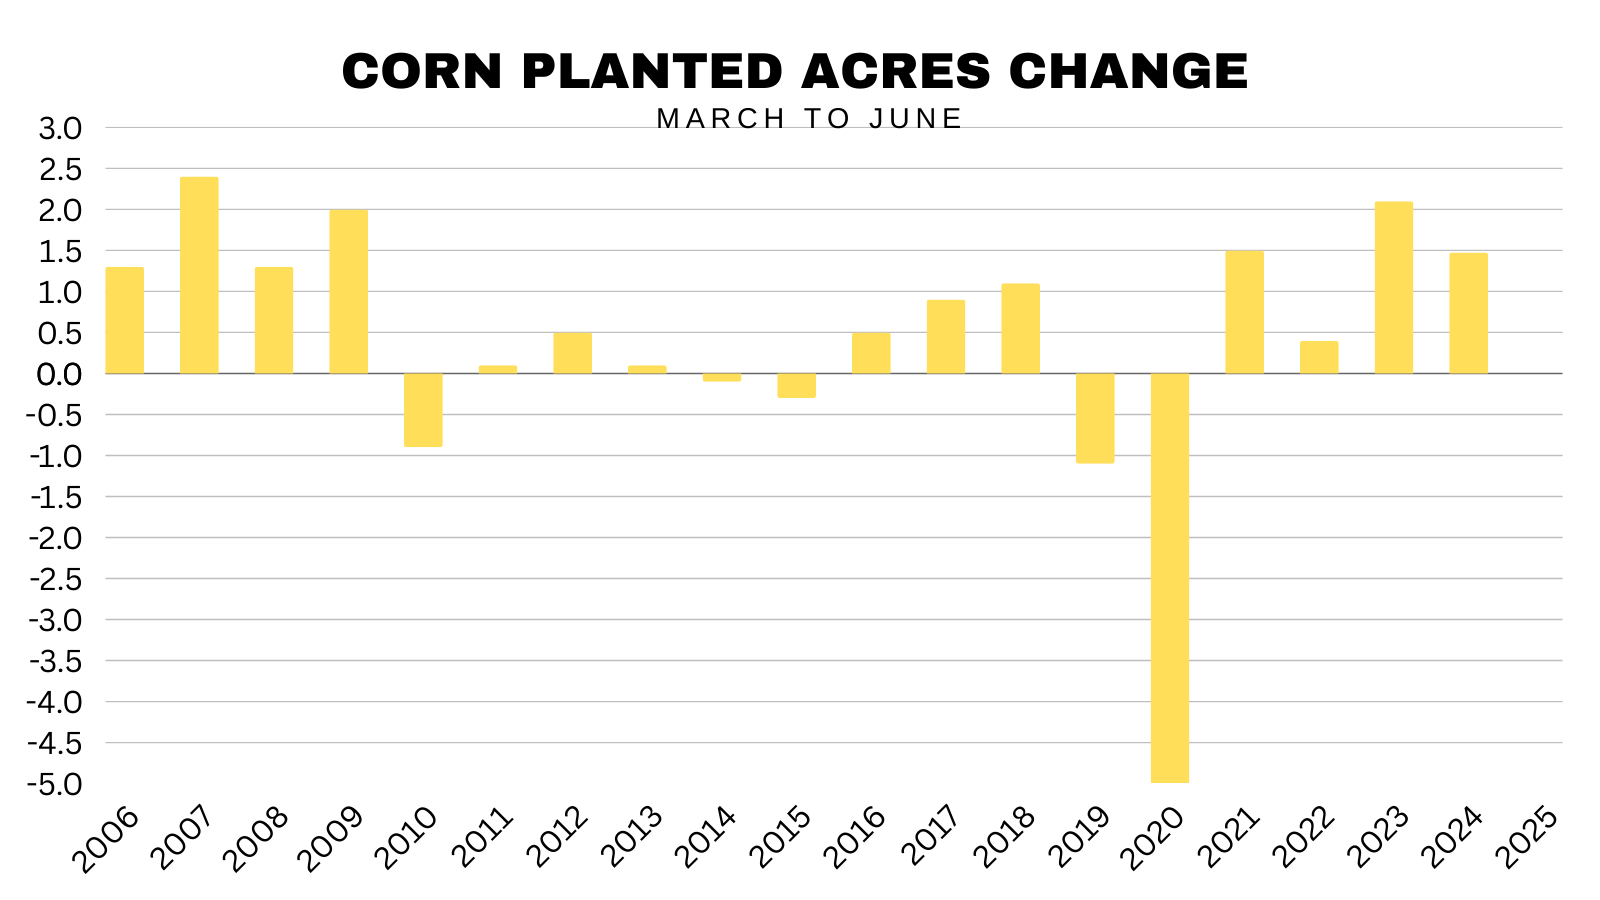
Here is another interesting set of data.
This is March planting intentions to the June WASDE report.
Whatever number they come up with in the intentions, almost always gets bumped in the June report.
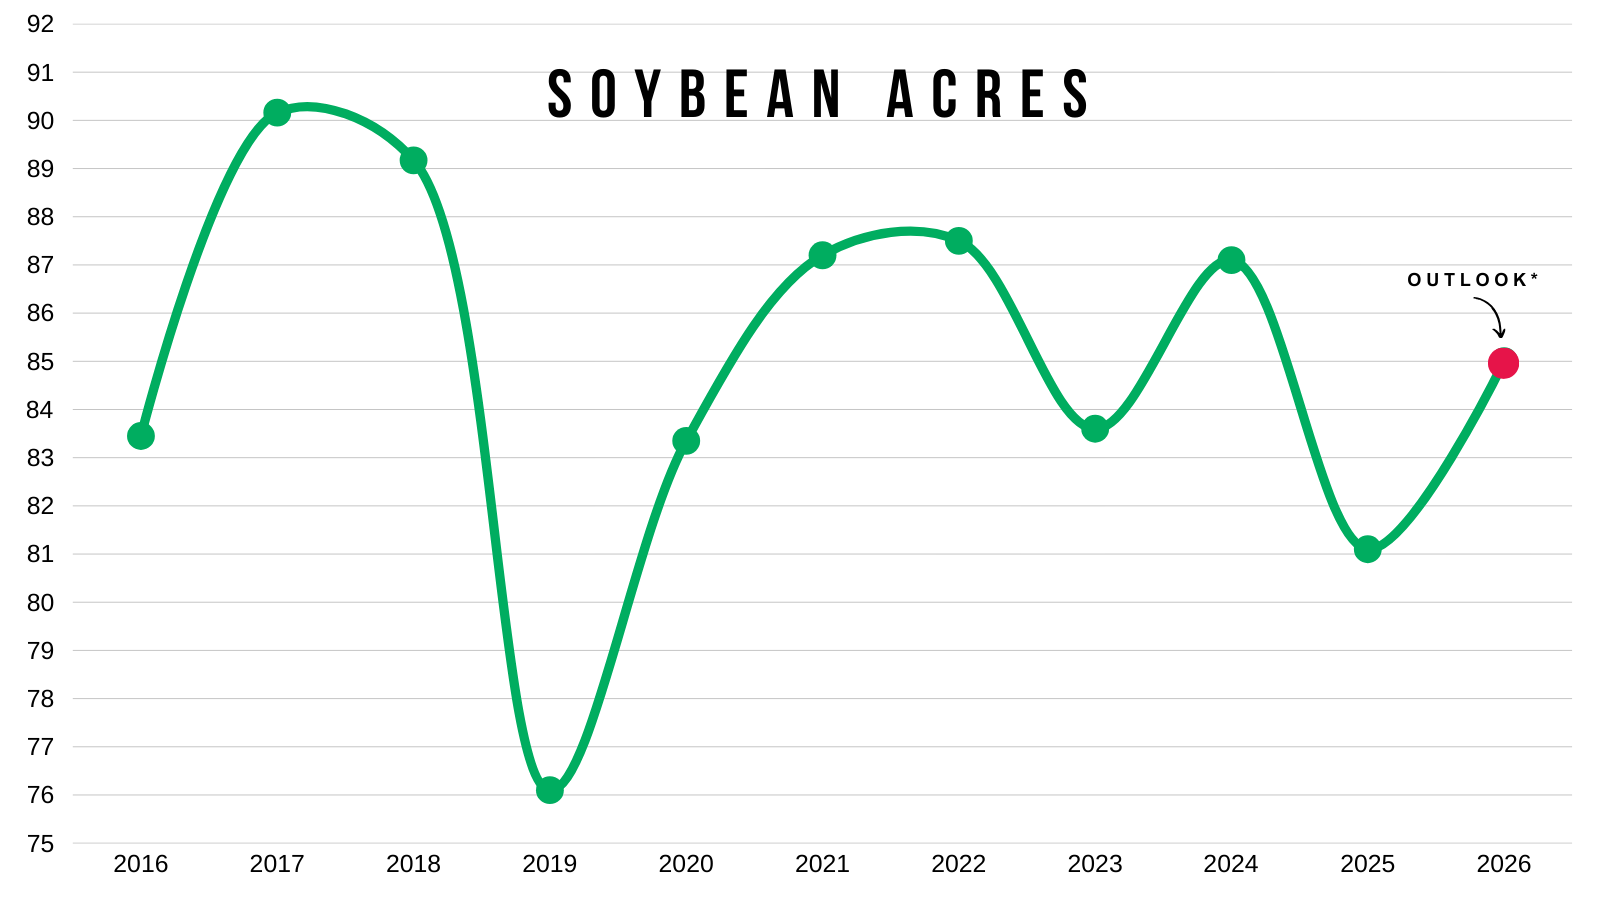
Soybeans:
Here was the soybean numbers.
Acres: 85 million
Yield: 53 bpa
Carryout: 355 million

Nothing too interesting here.
Yield and carryout are both estimated the same as last year.
Acres of course expected to see an uptick compared to last year, but still below what we saw in 2024.
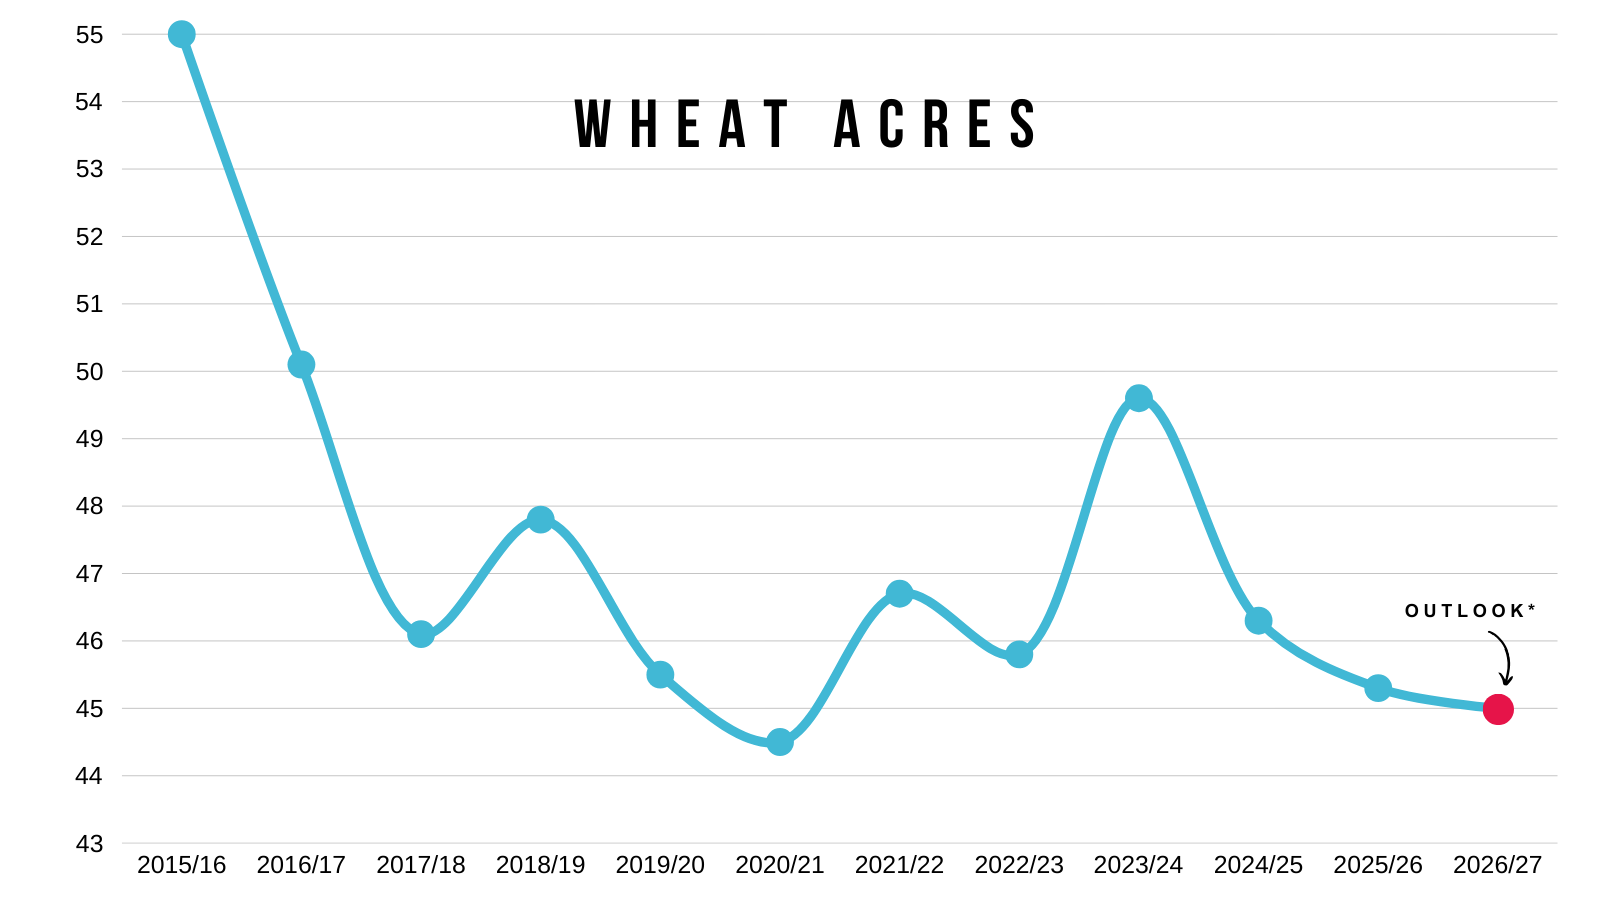
Wheat:
Here was the numbers.
Acres: 45 million
Yield: 50.8 bpa
Carryout: 933 million

Yield is expected to be lower than last year.
Acres are still expected to be some of the lowest we've ever seen.
Only larger than 2020.
Today's Main Takeaways
Corn
Fundamentals:
There is nothing screaming that corn has to go a lot higher today.
It still feels like there is far more risk in old crop compared to new crop.
They are completely different markets.
New crop is sitting within 10 cents of 8-month highs.
Old crop is sitting near 6-month lows.
Old crop is battling the largest production number ever.
It took a record yield and record acres to get a carryout of 2 billion bushels in old crop.
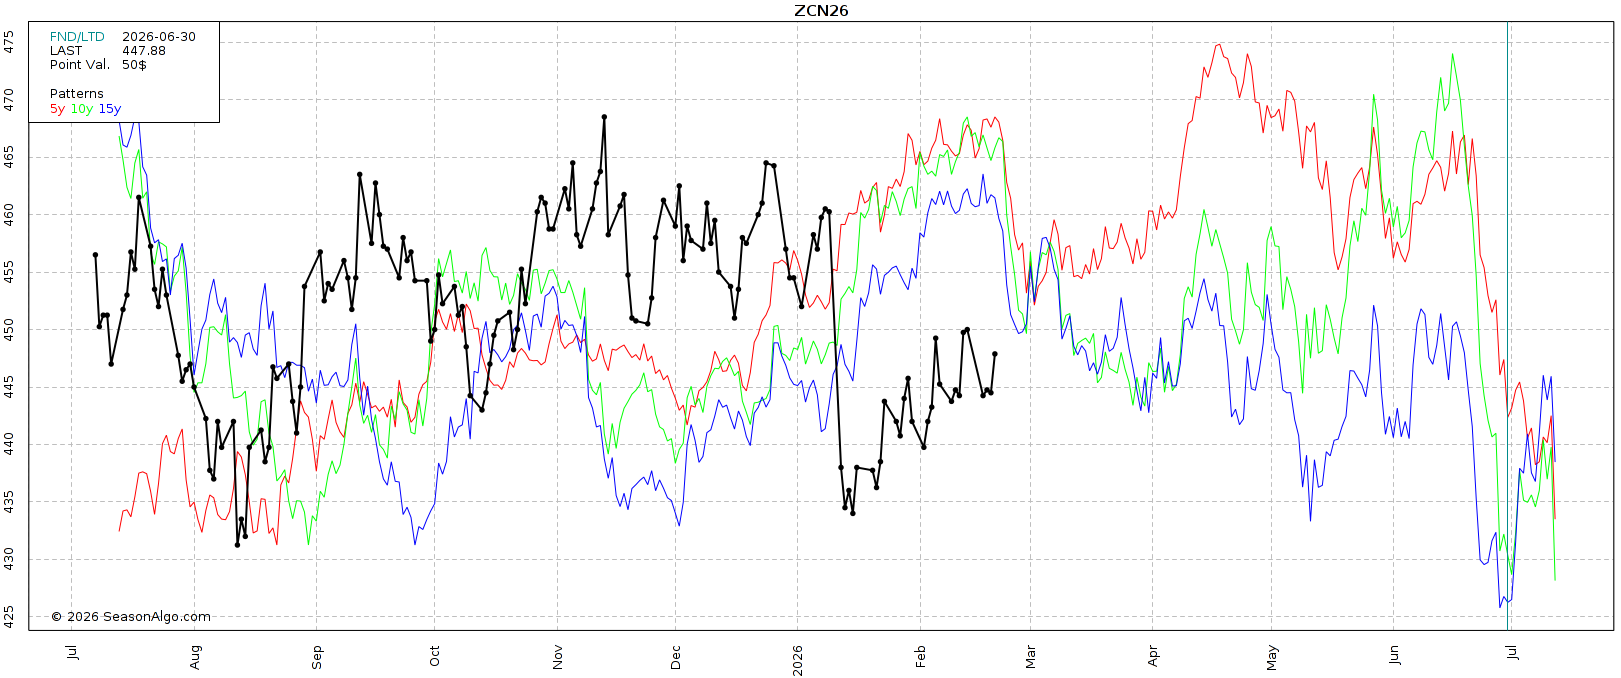
(Yellow is Old Crop - Green is New Crop Outlook)
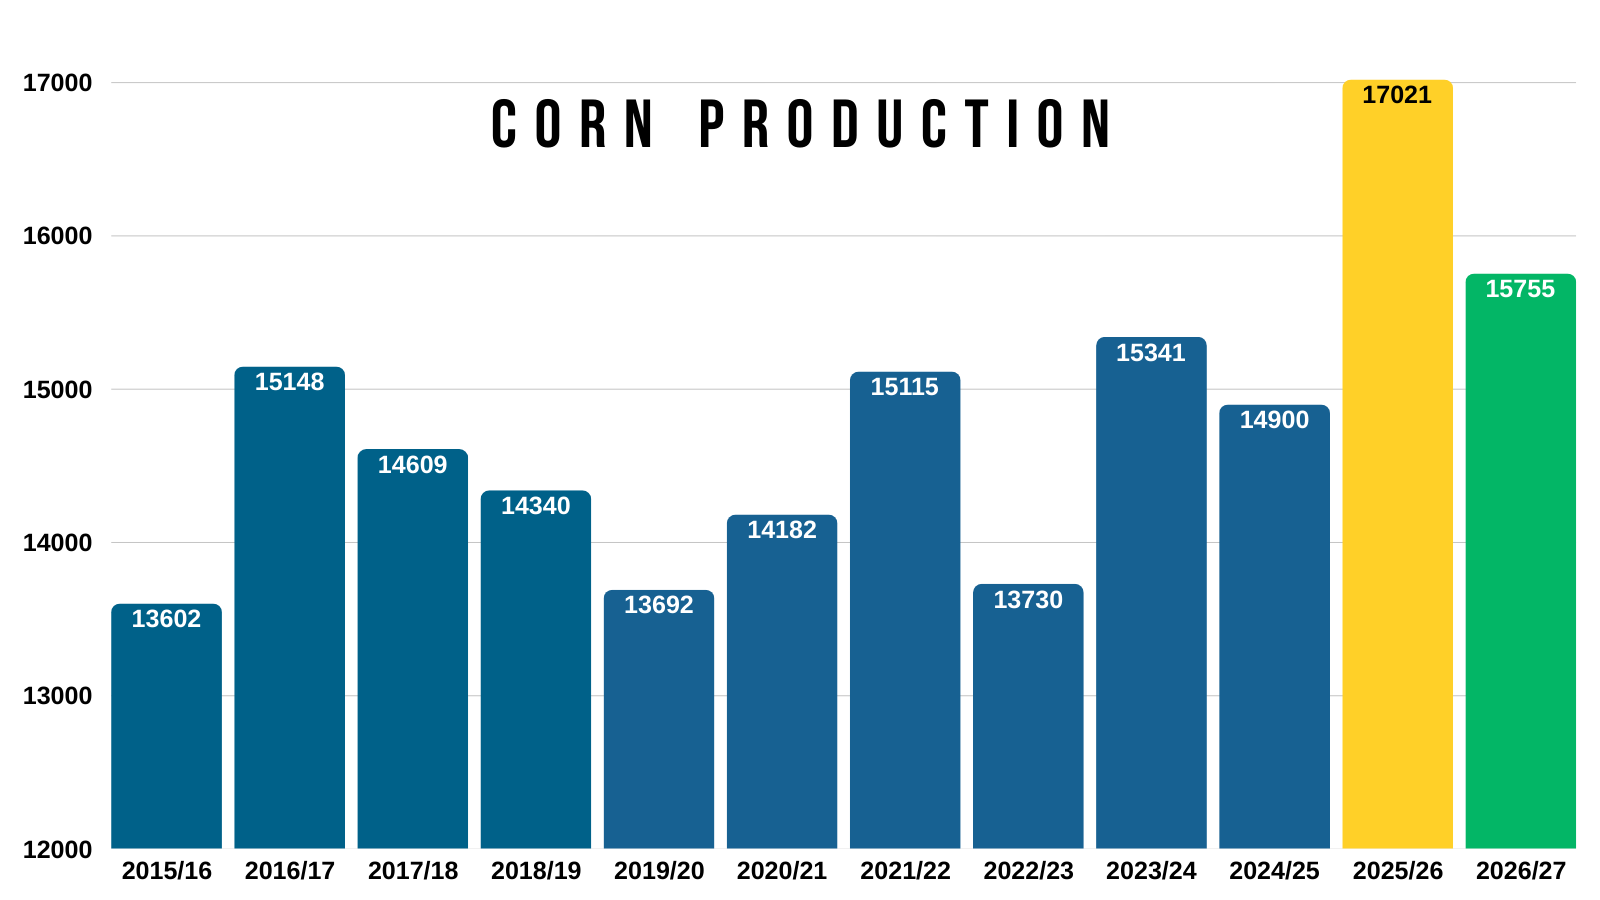
What happens to new crop if we lose a few acres? We are going to need a big yield to keep the new crop balance sheet large.
Here is the preliminary new crop balance sheet from the outlook vs the old crop balance sheet.
Green highlights bullish changes.
Red highlights bearish changes.
They have total supply dropping by about -700 million and demand dropping by -400 million for a net loss of -300 million on our carryout.
Preliminary Balance Sheet
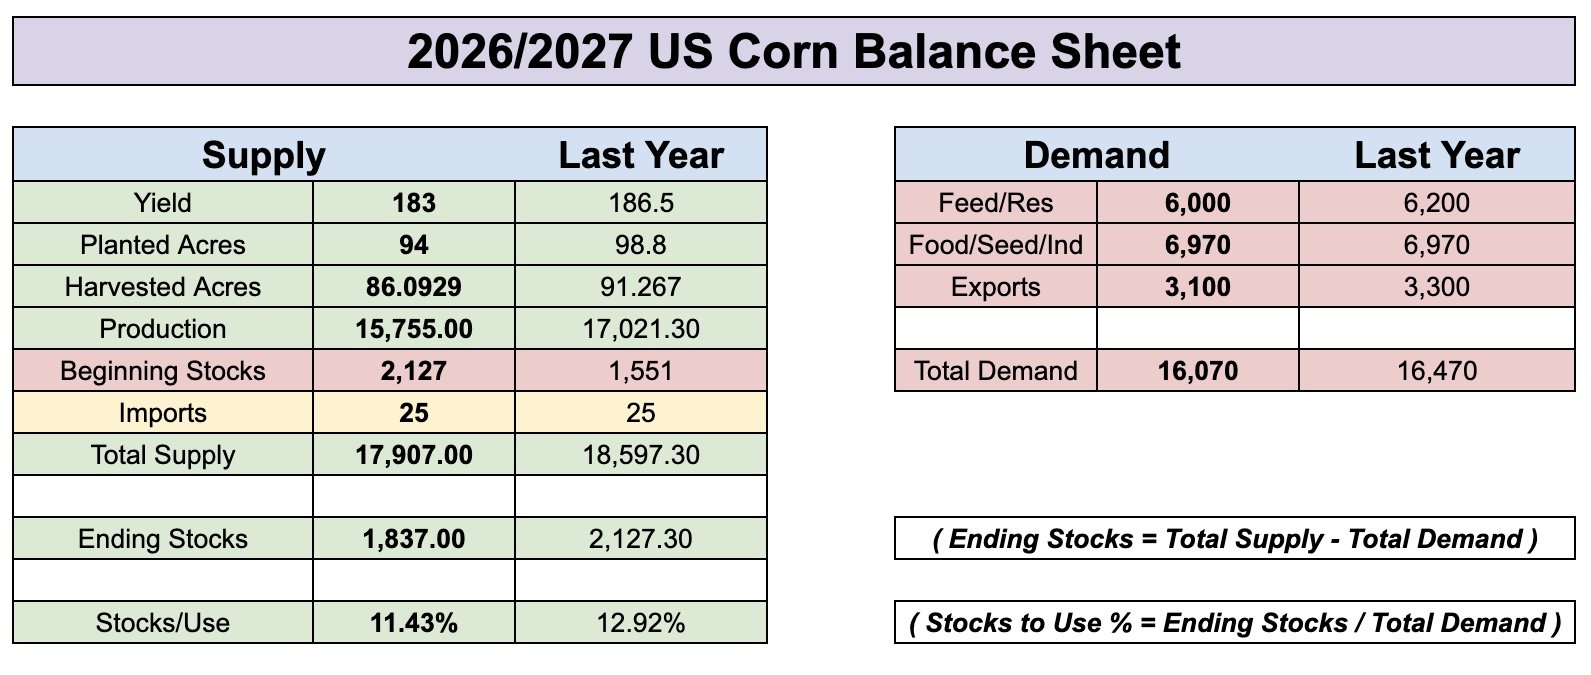
I'd argue that this balance sheet is actually decently friendly if stays true.
This balance sheet says that we need a 183 yield to get a 1.80 billion bushel carryout.
This is with them expecting demand to be lowered by -400 million bushels vs last year.
If this was actually the real balance sheet they are going to use, it doesn’t leave much wiggle room for production.
Meaning the balance sheet could get tight if yield isn’t as large as advertised.
However, it does feel like 94 million acres could wind up being a little low based on what we already talked about.
There is a reason the market takes this report with a grain of salt.
Corn acres came in -1 million lower than expected, yet corn traded lower.
Because the numbers don’t mean much today as it's just their orginal outlook that is bound to change.
Regardless, there could be a completely different story in new crop corn.
We still have to get through first notice day and this seasonally negative time frame here for old crop.
So if you have to move corn by May, we do still like having downside protection in old crop if you don’t have any from our sell signal two weeks ago.
Link to Sell Signal: Click Here
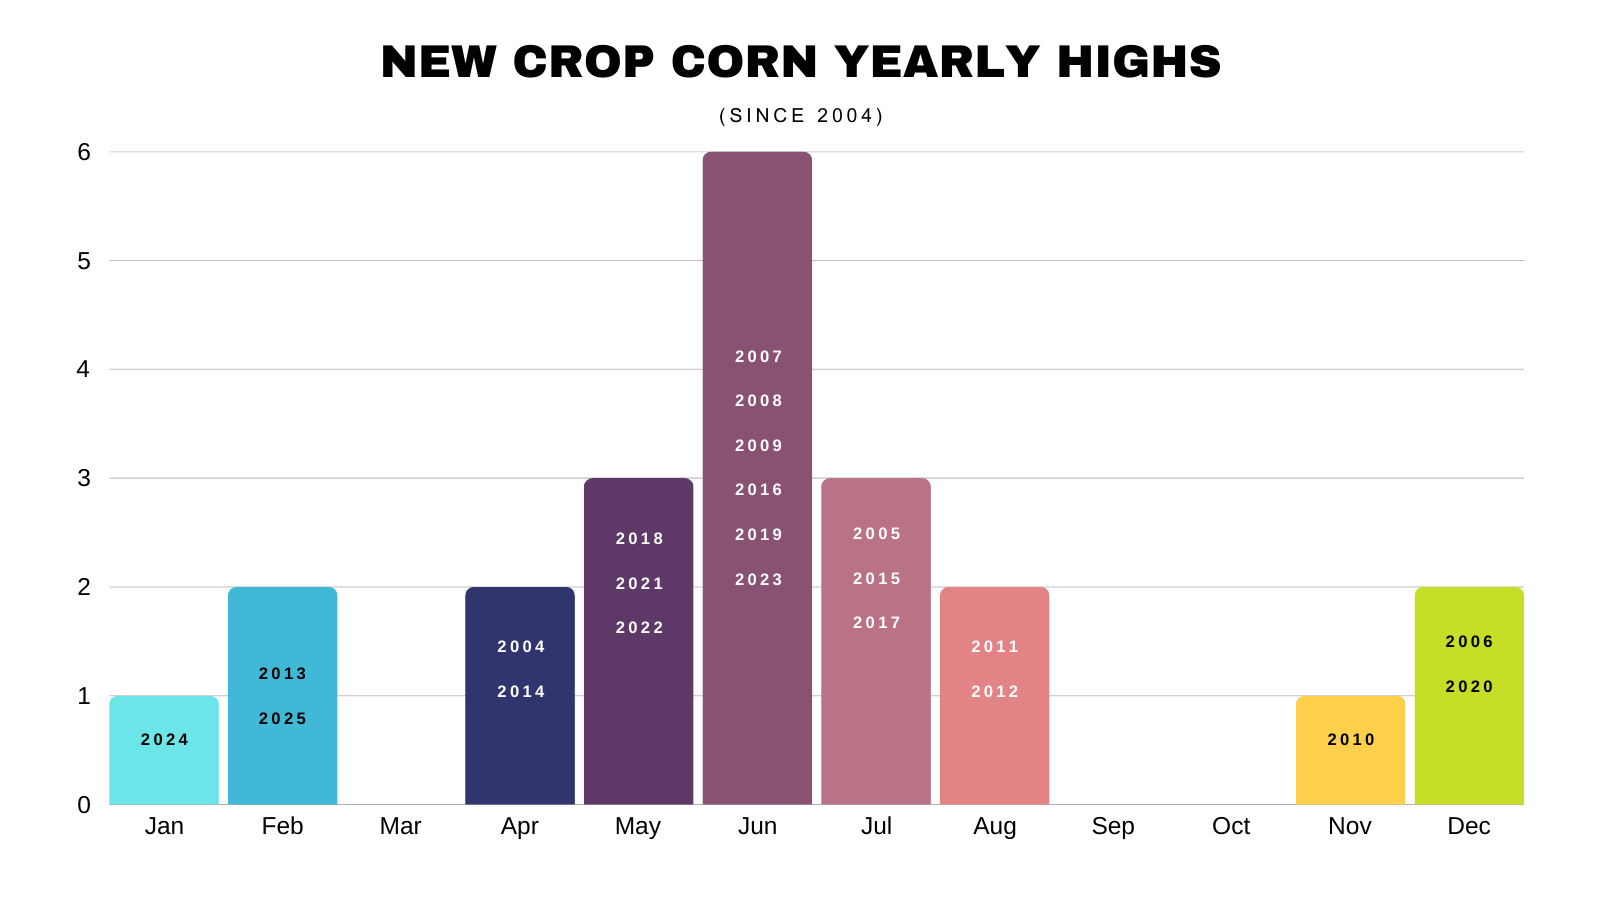
Given that we clearly aren’t short on supply, it's probably going to take some sort of weather scare for us to get a true opportunity at drastically higher prices.
We usually get one to some sort of extent.
You don’t need a crop failure. You just need the market to think that supply is at risk even if it's for a short period of time.
Which is why new crop corn has posted it's highest price of the year 12 of the last 22 years between May and July.
The world outside of the US is still tight on corn.
We still have record demand.
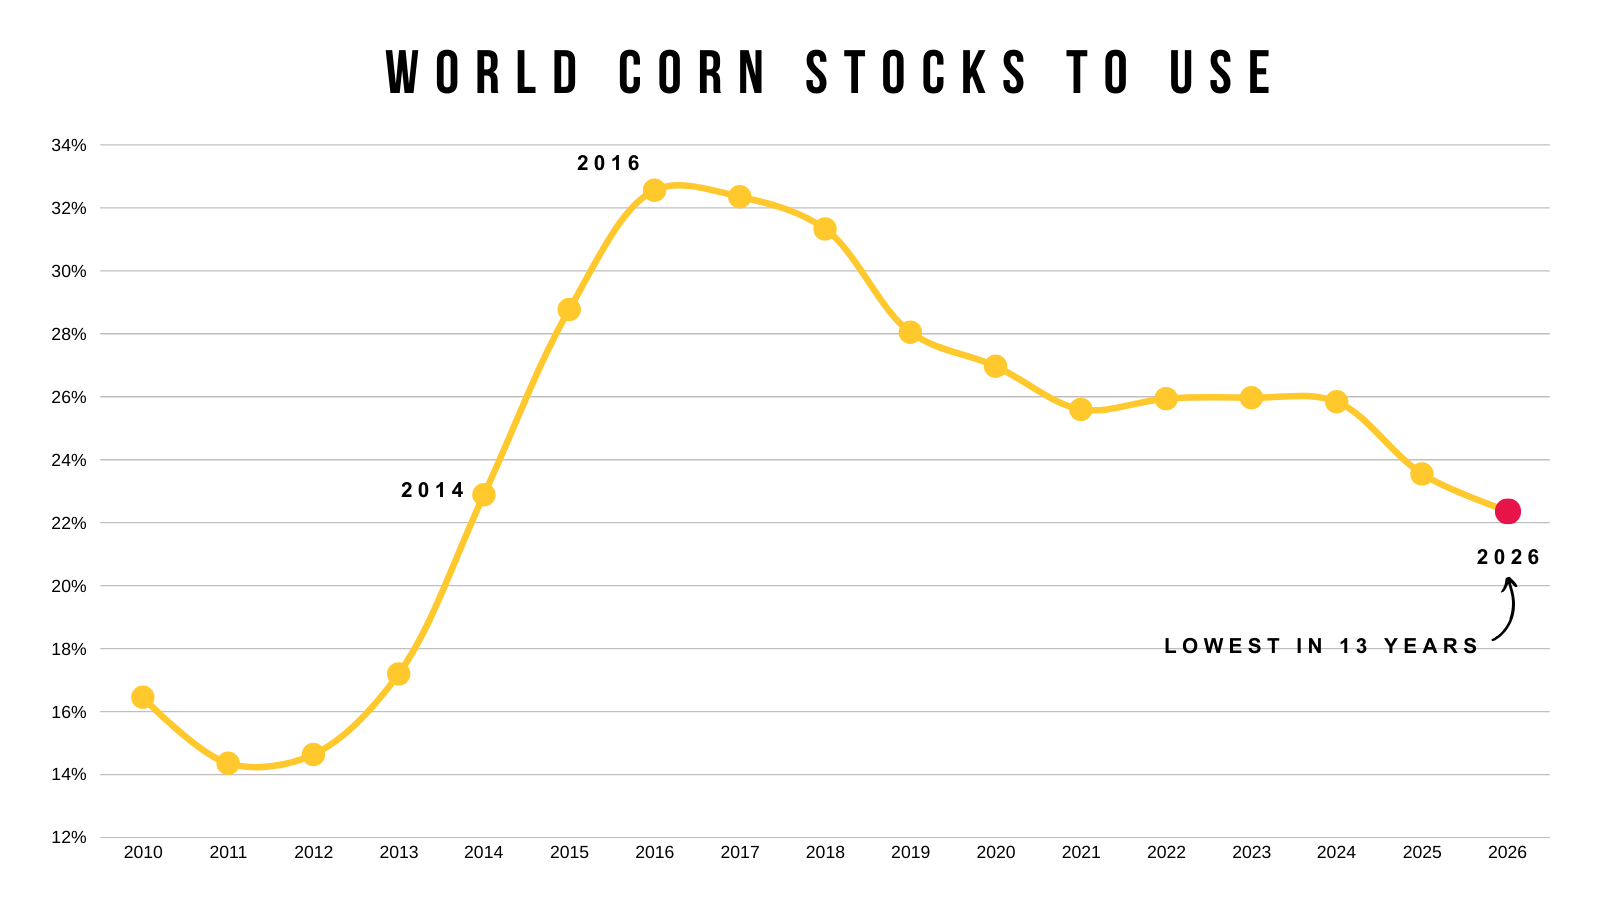
What happens if the US even has one below average crop?
The story isn’t bullish today.
But the narrative could change fast.
Technicals:
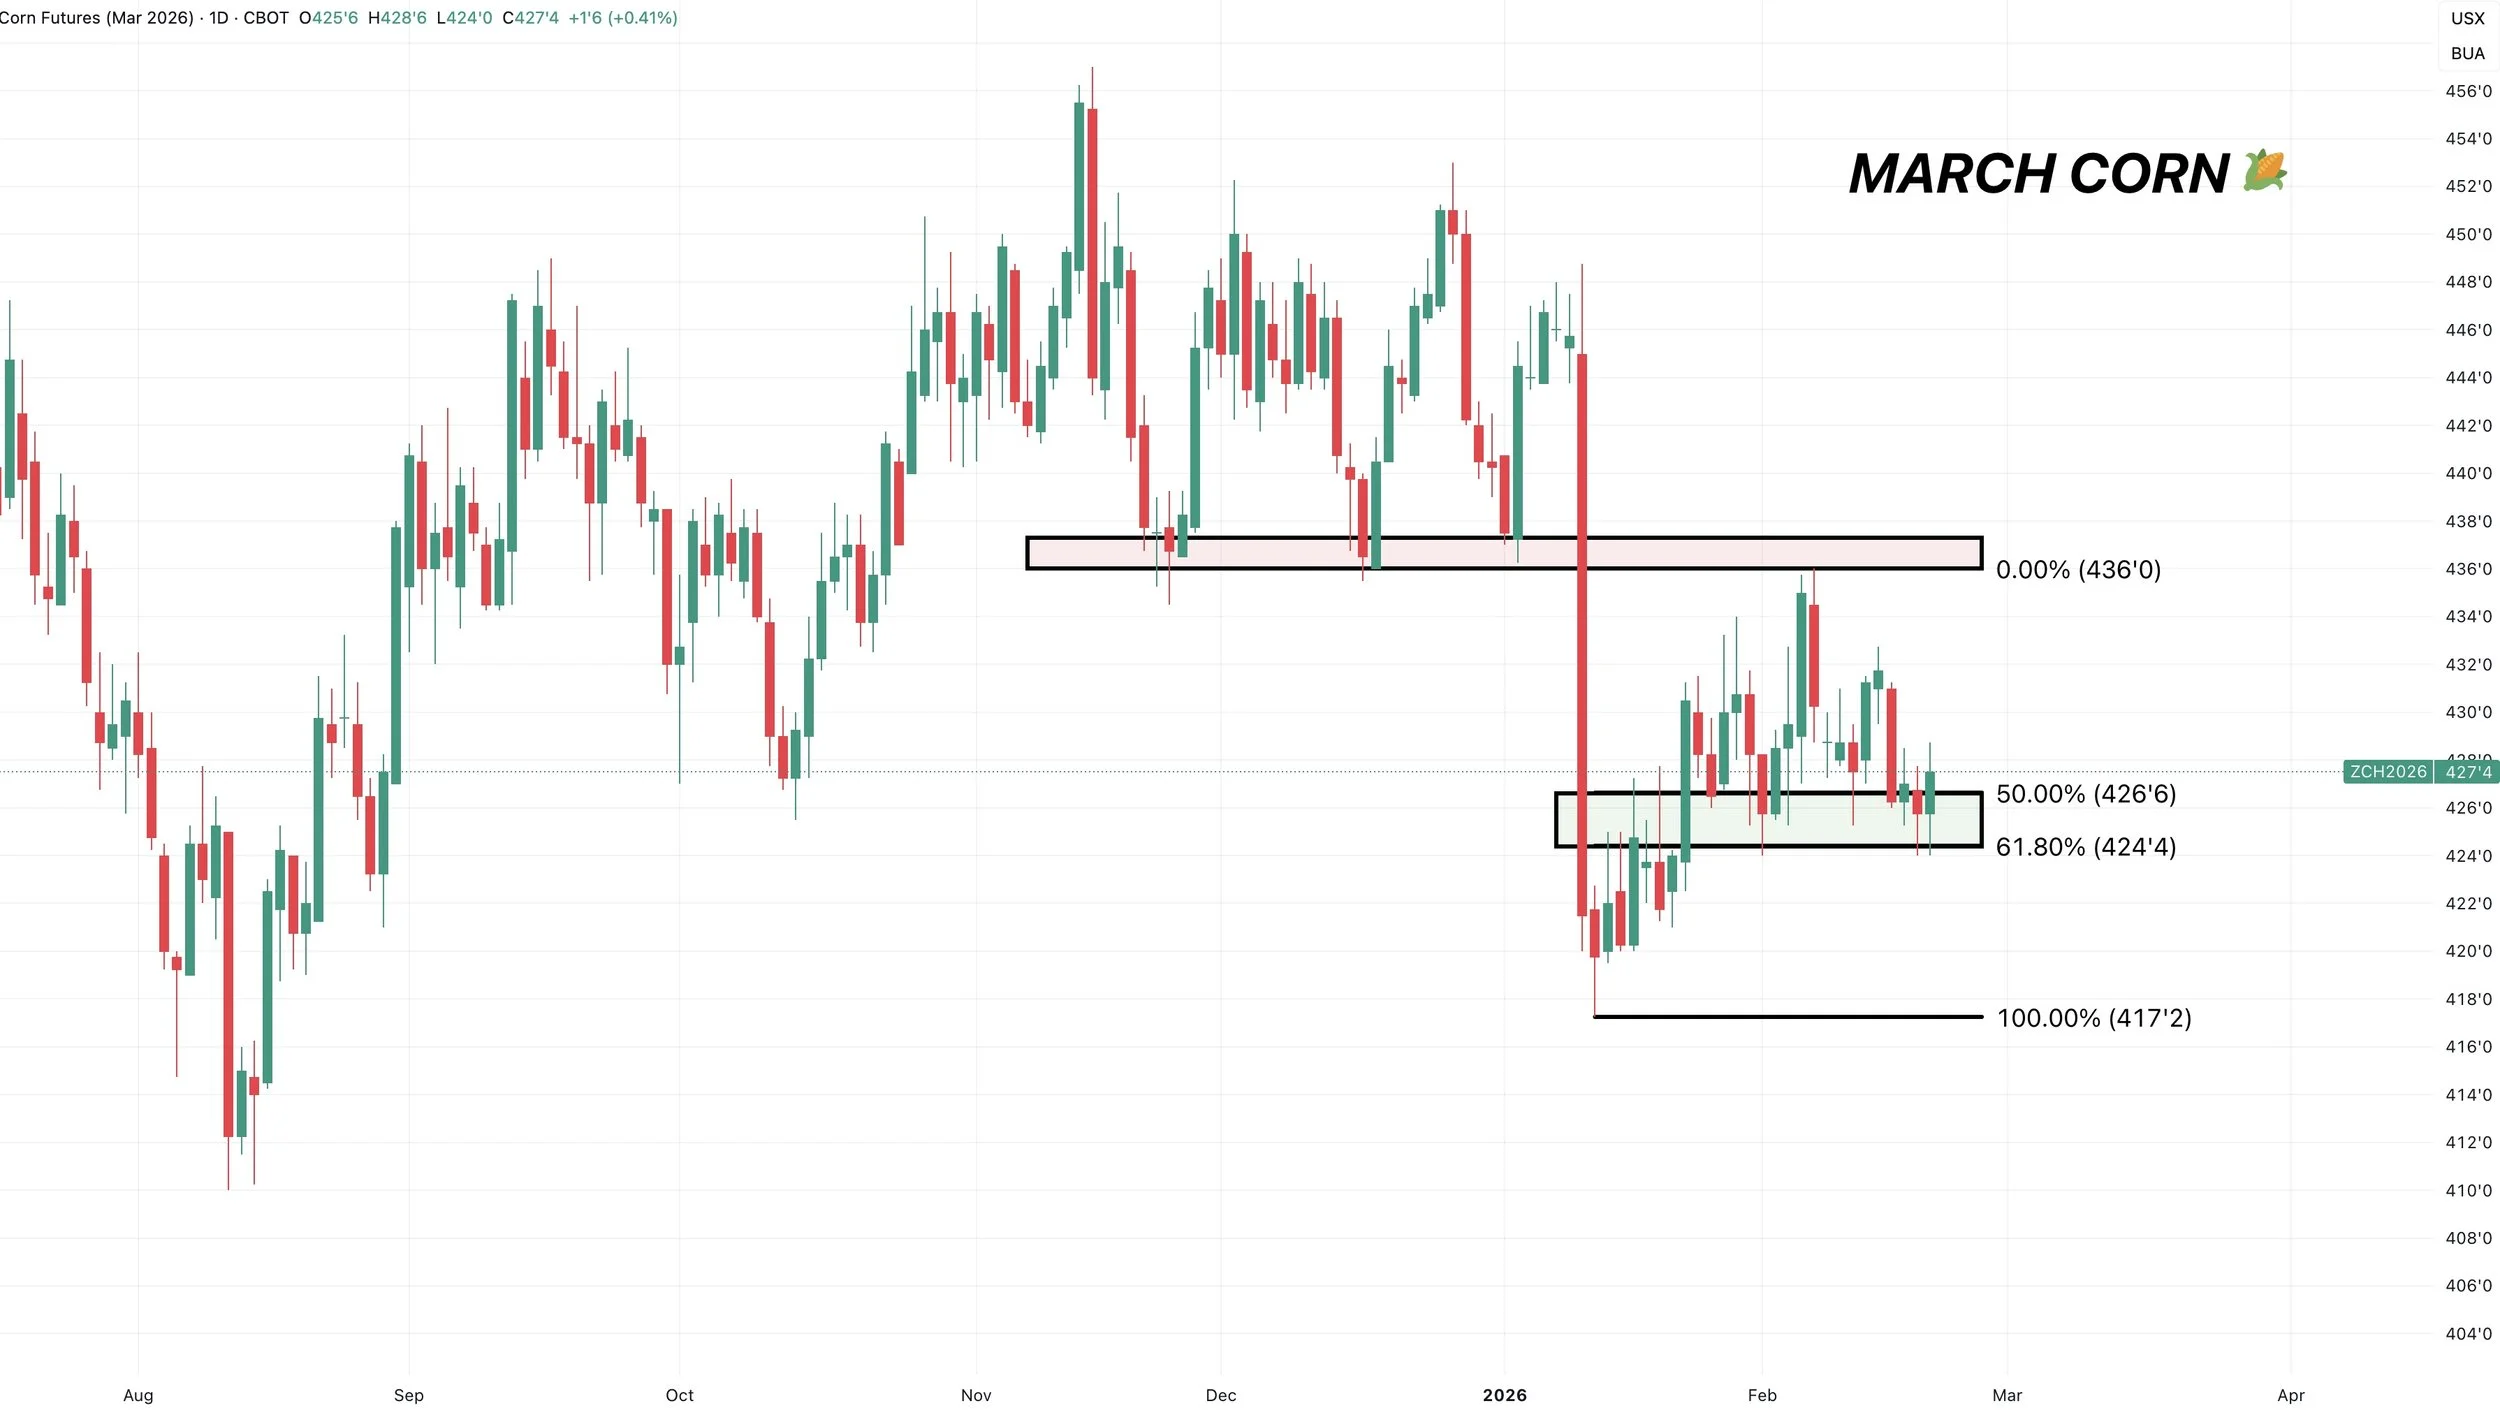
March Corn:
March corn doesn’t look great here.
We failed that prior support level and where we issued the sell signal.
We have a possible bear flag break down along with a potential head and shoulders.
Definitely adds down downside caution here.
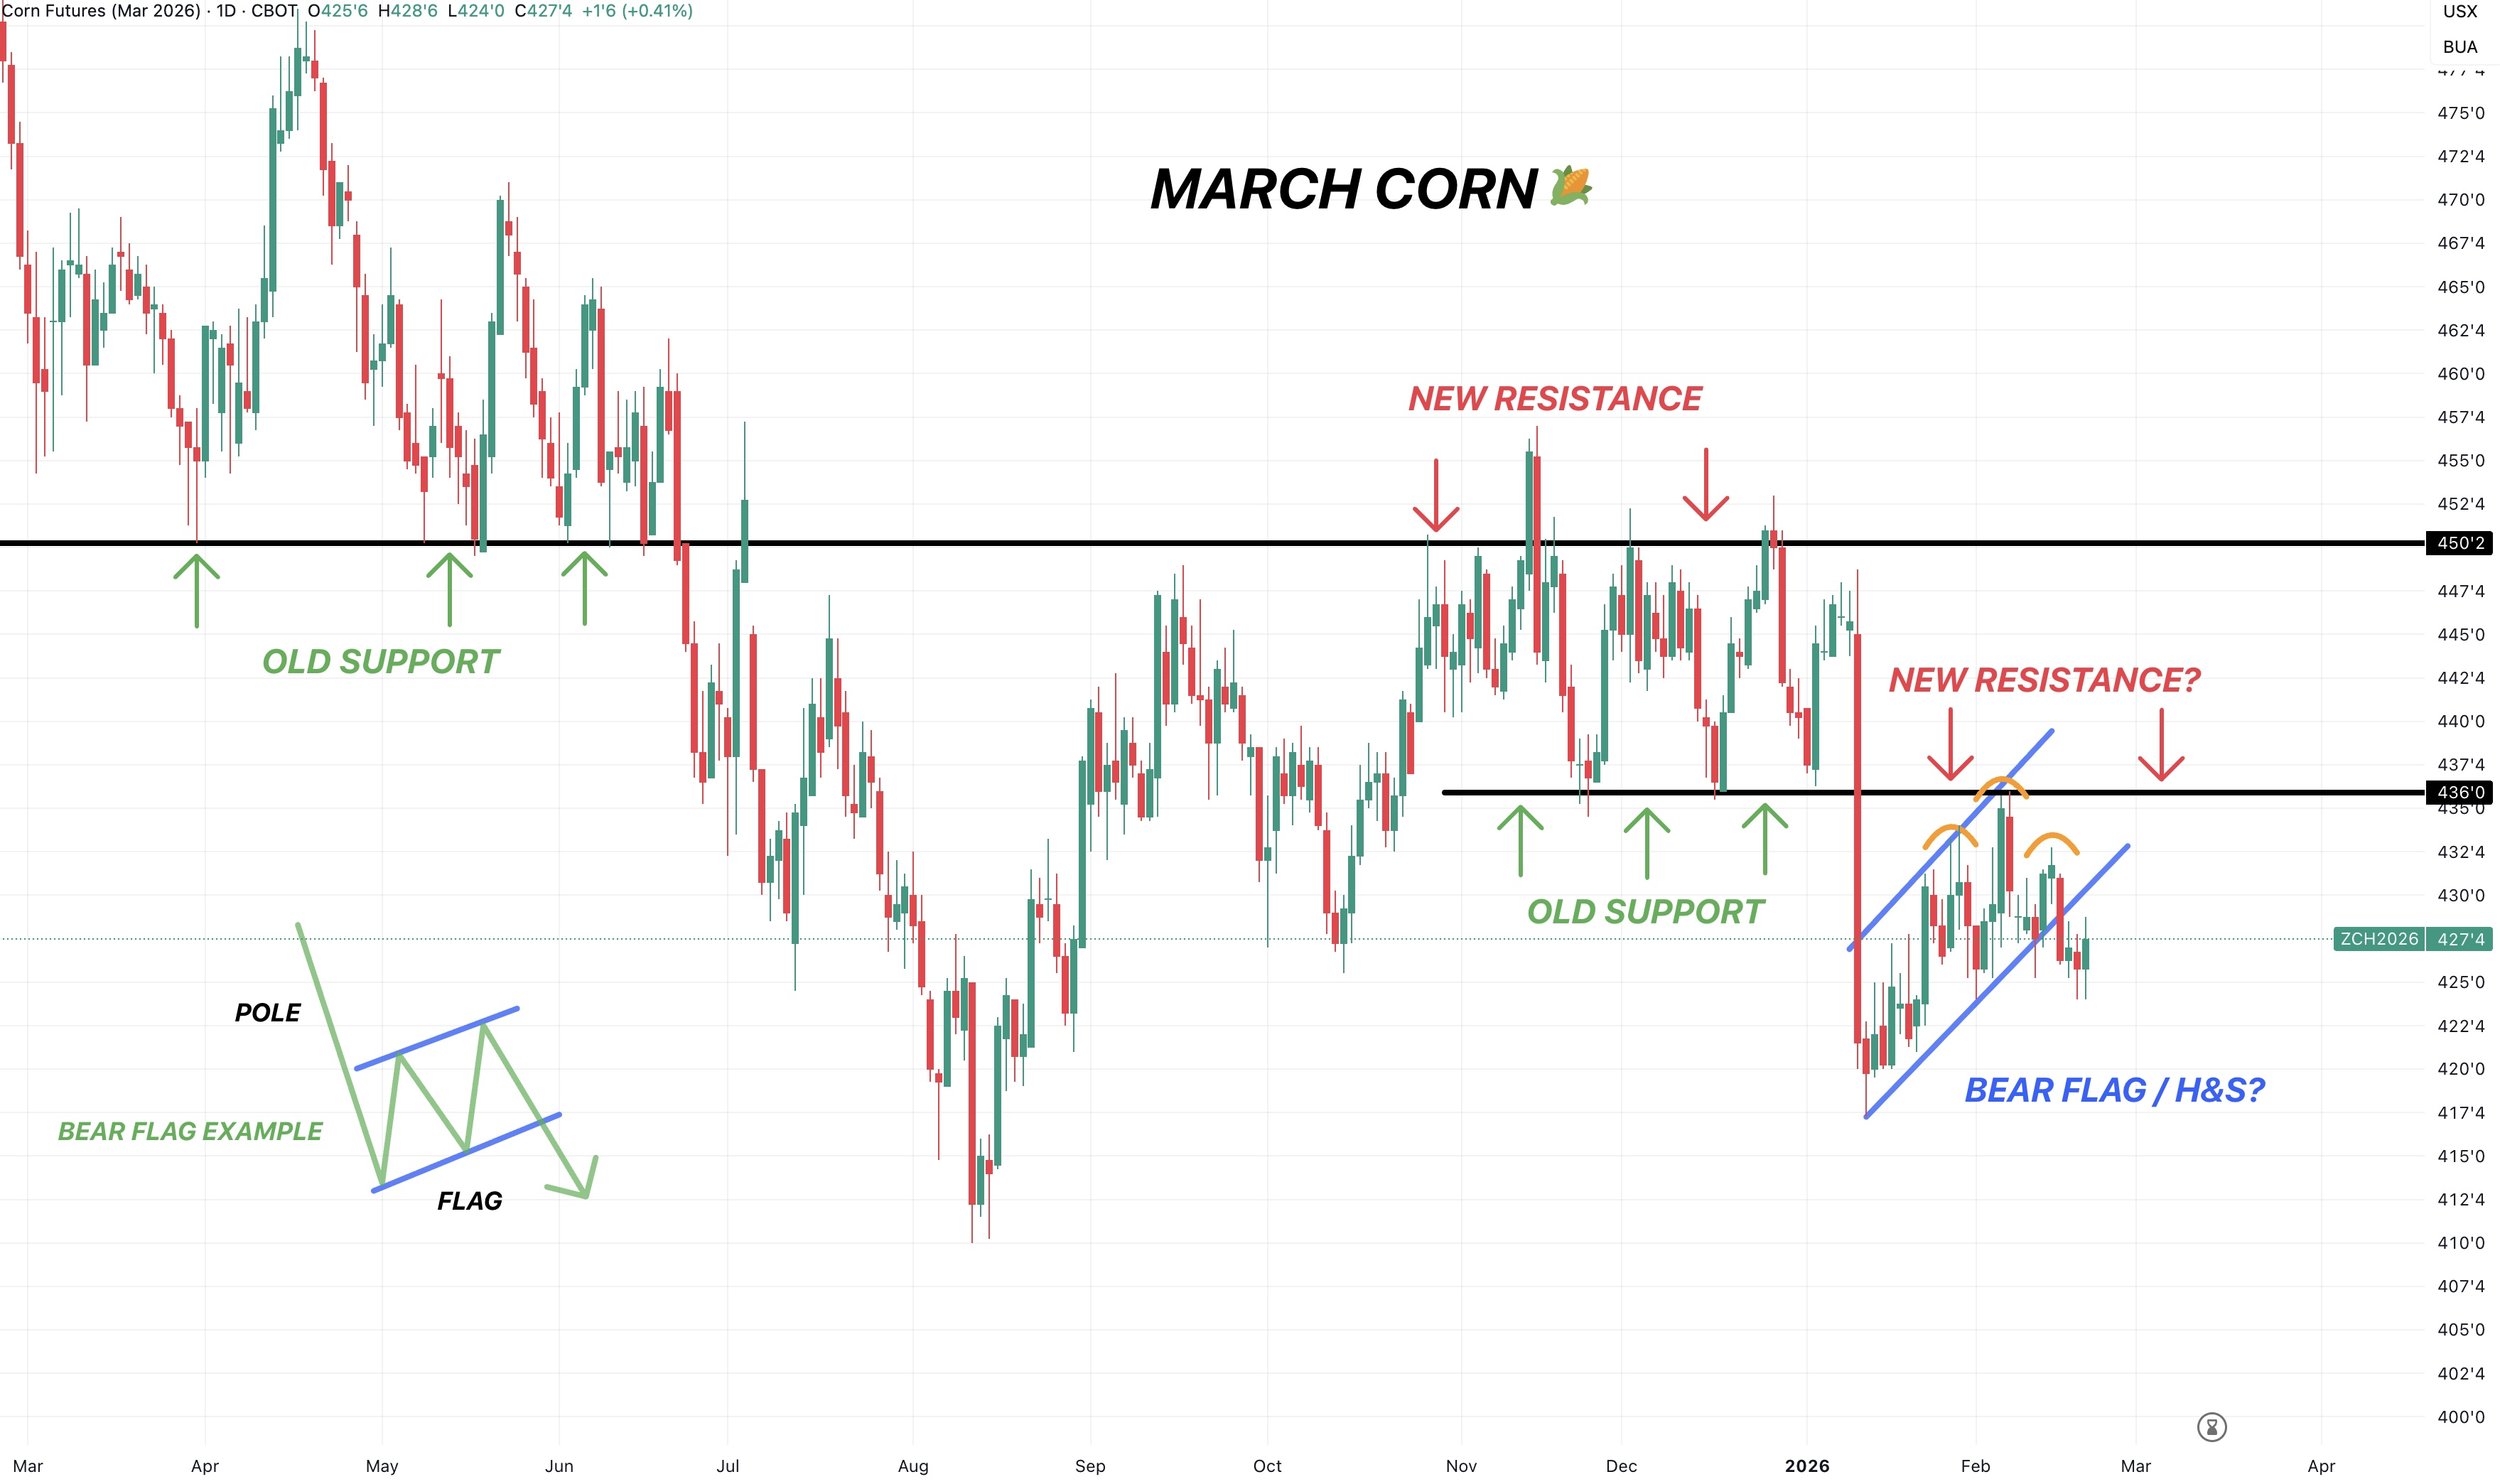
We are however still holding the golden zone of the entire rally.
That $4.24 level is viewed as that must-hold level to prevent further downside.
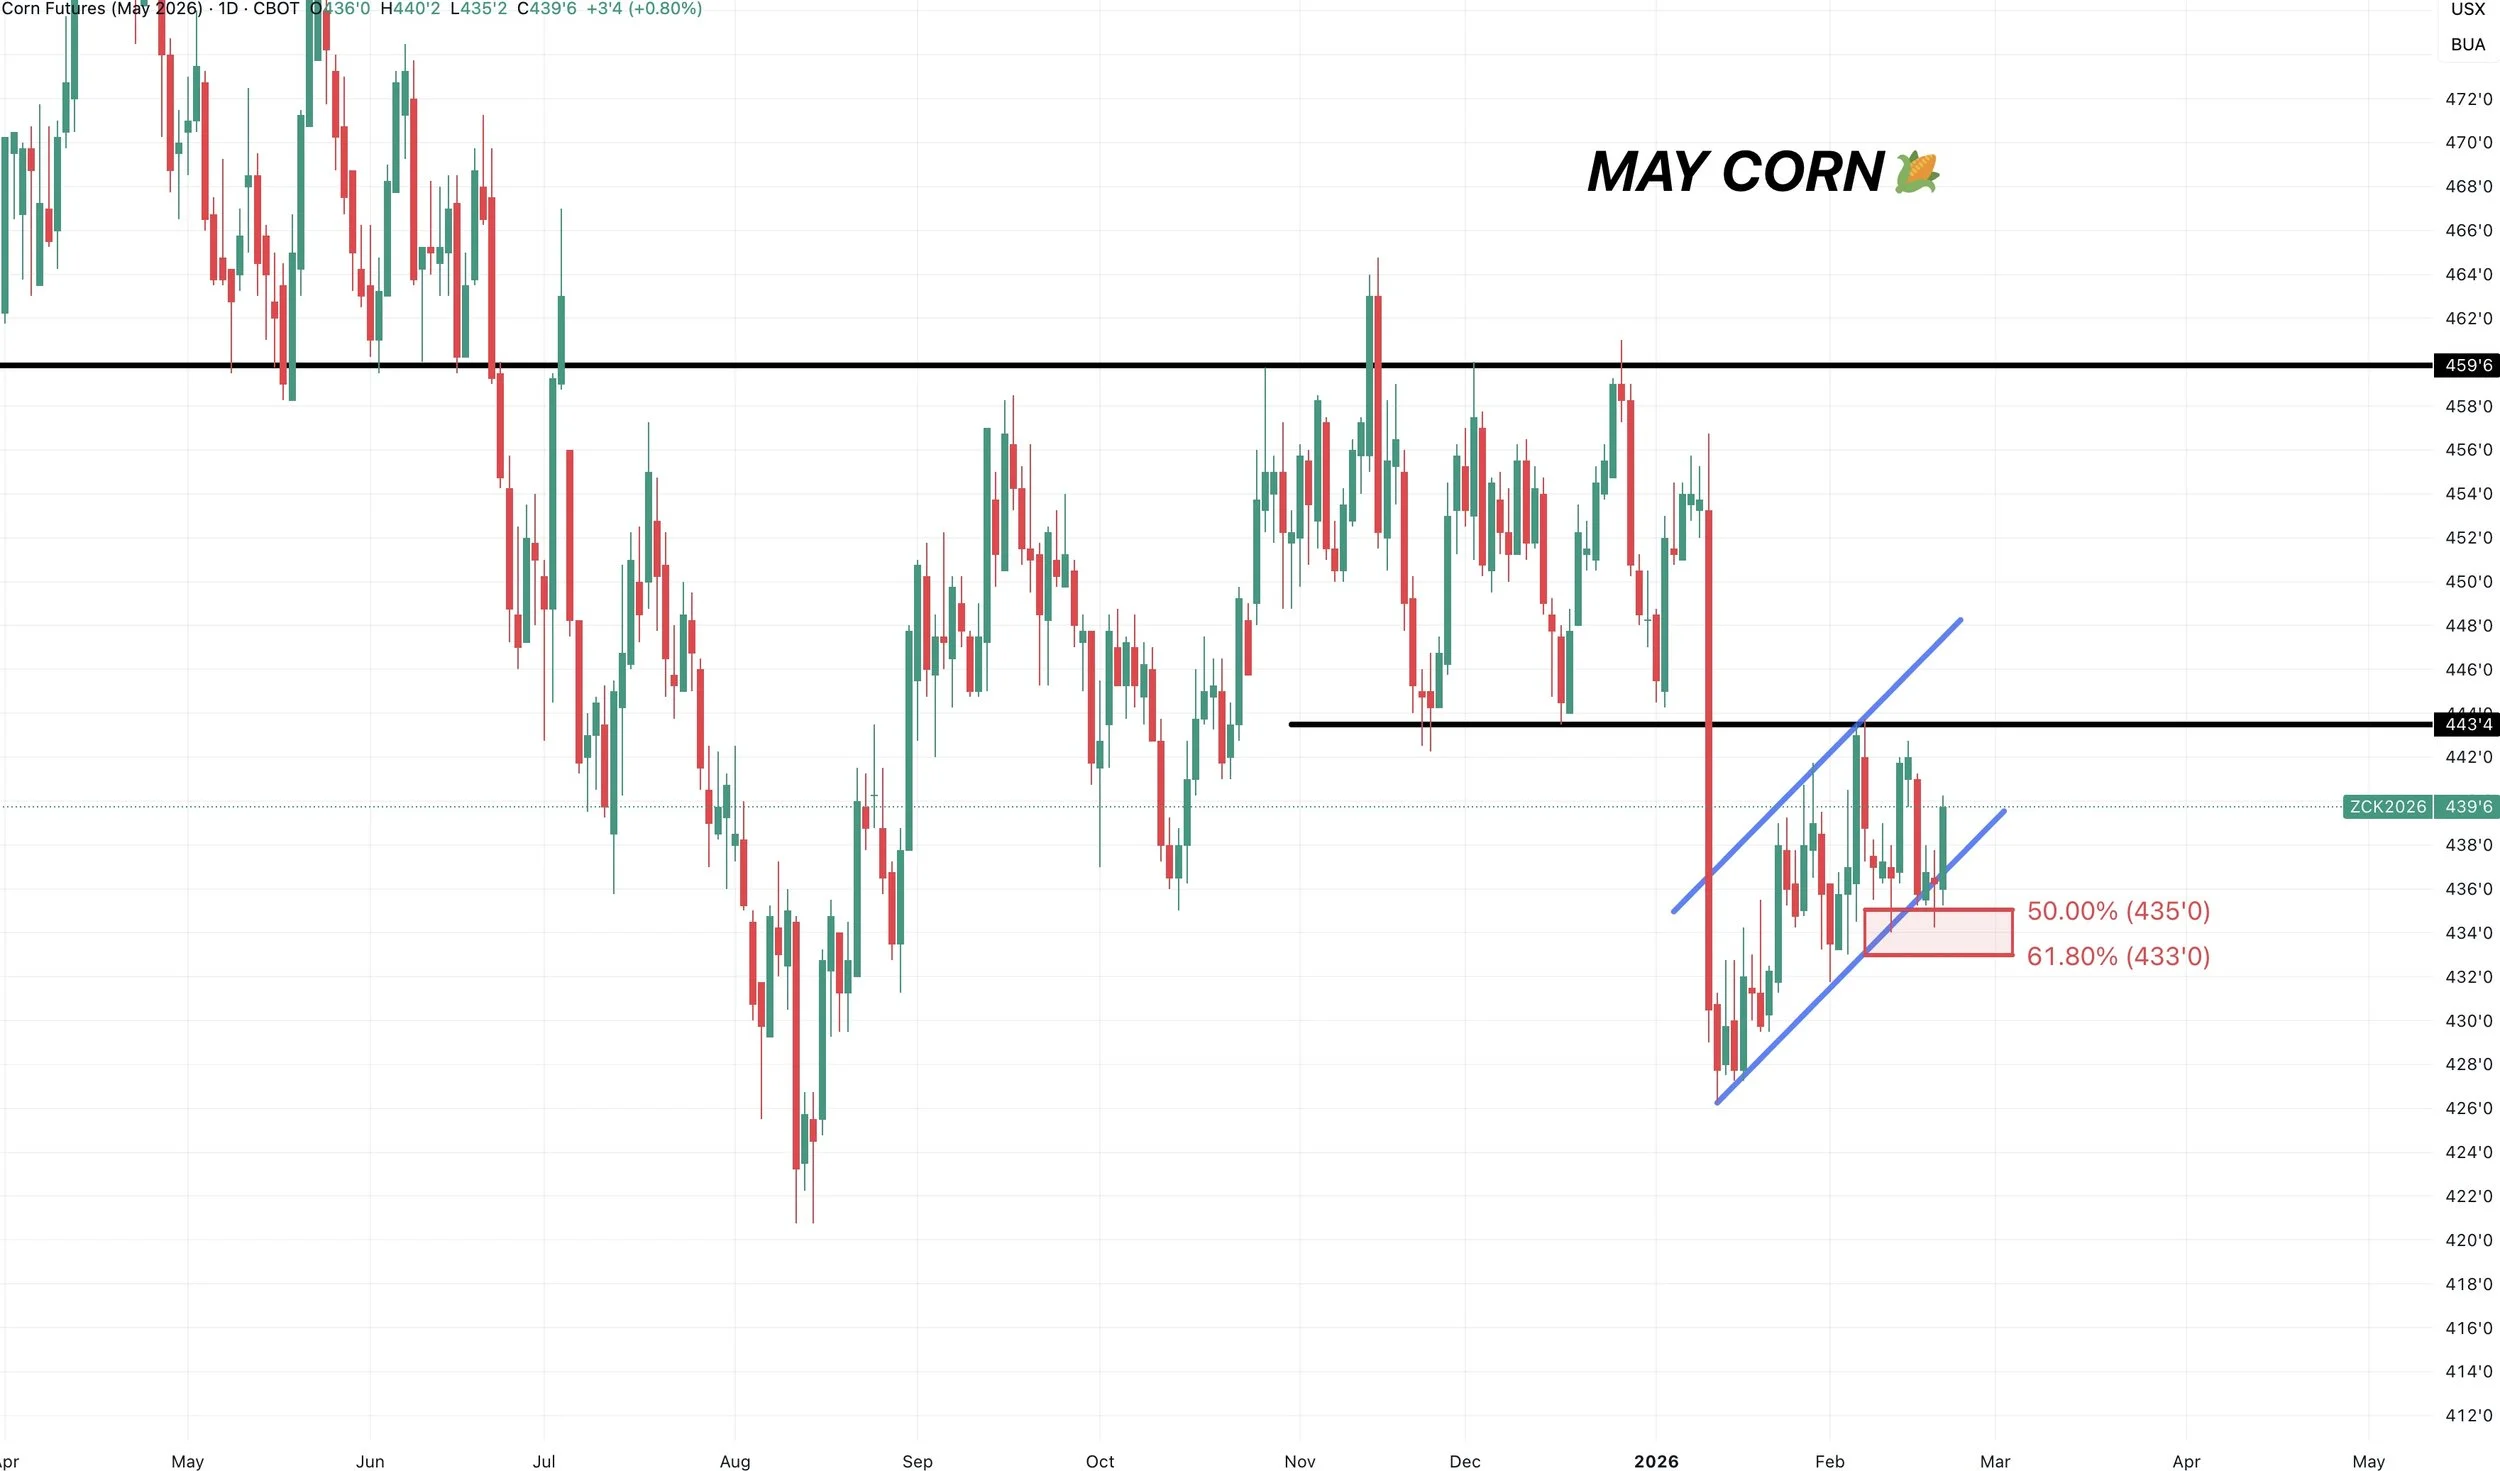
May Corn:
Looks better than March, but still have a potential bear flag.
Bulls need to hold the golden retracement at $4.33 or we probably get a leg lower. That's going to be our sign if this market is going to roll over.
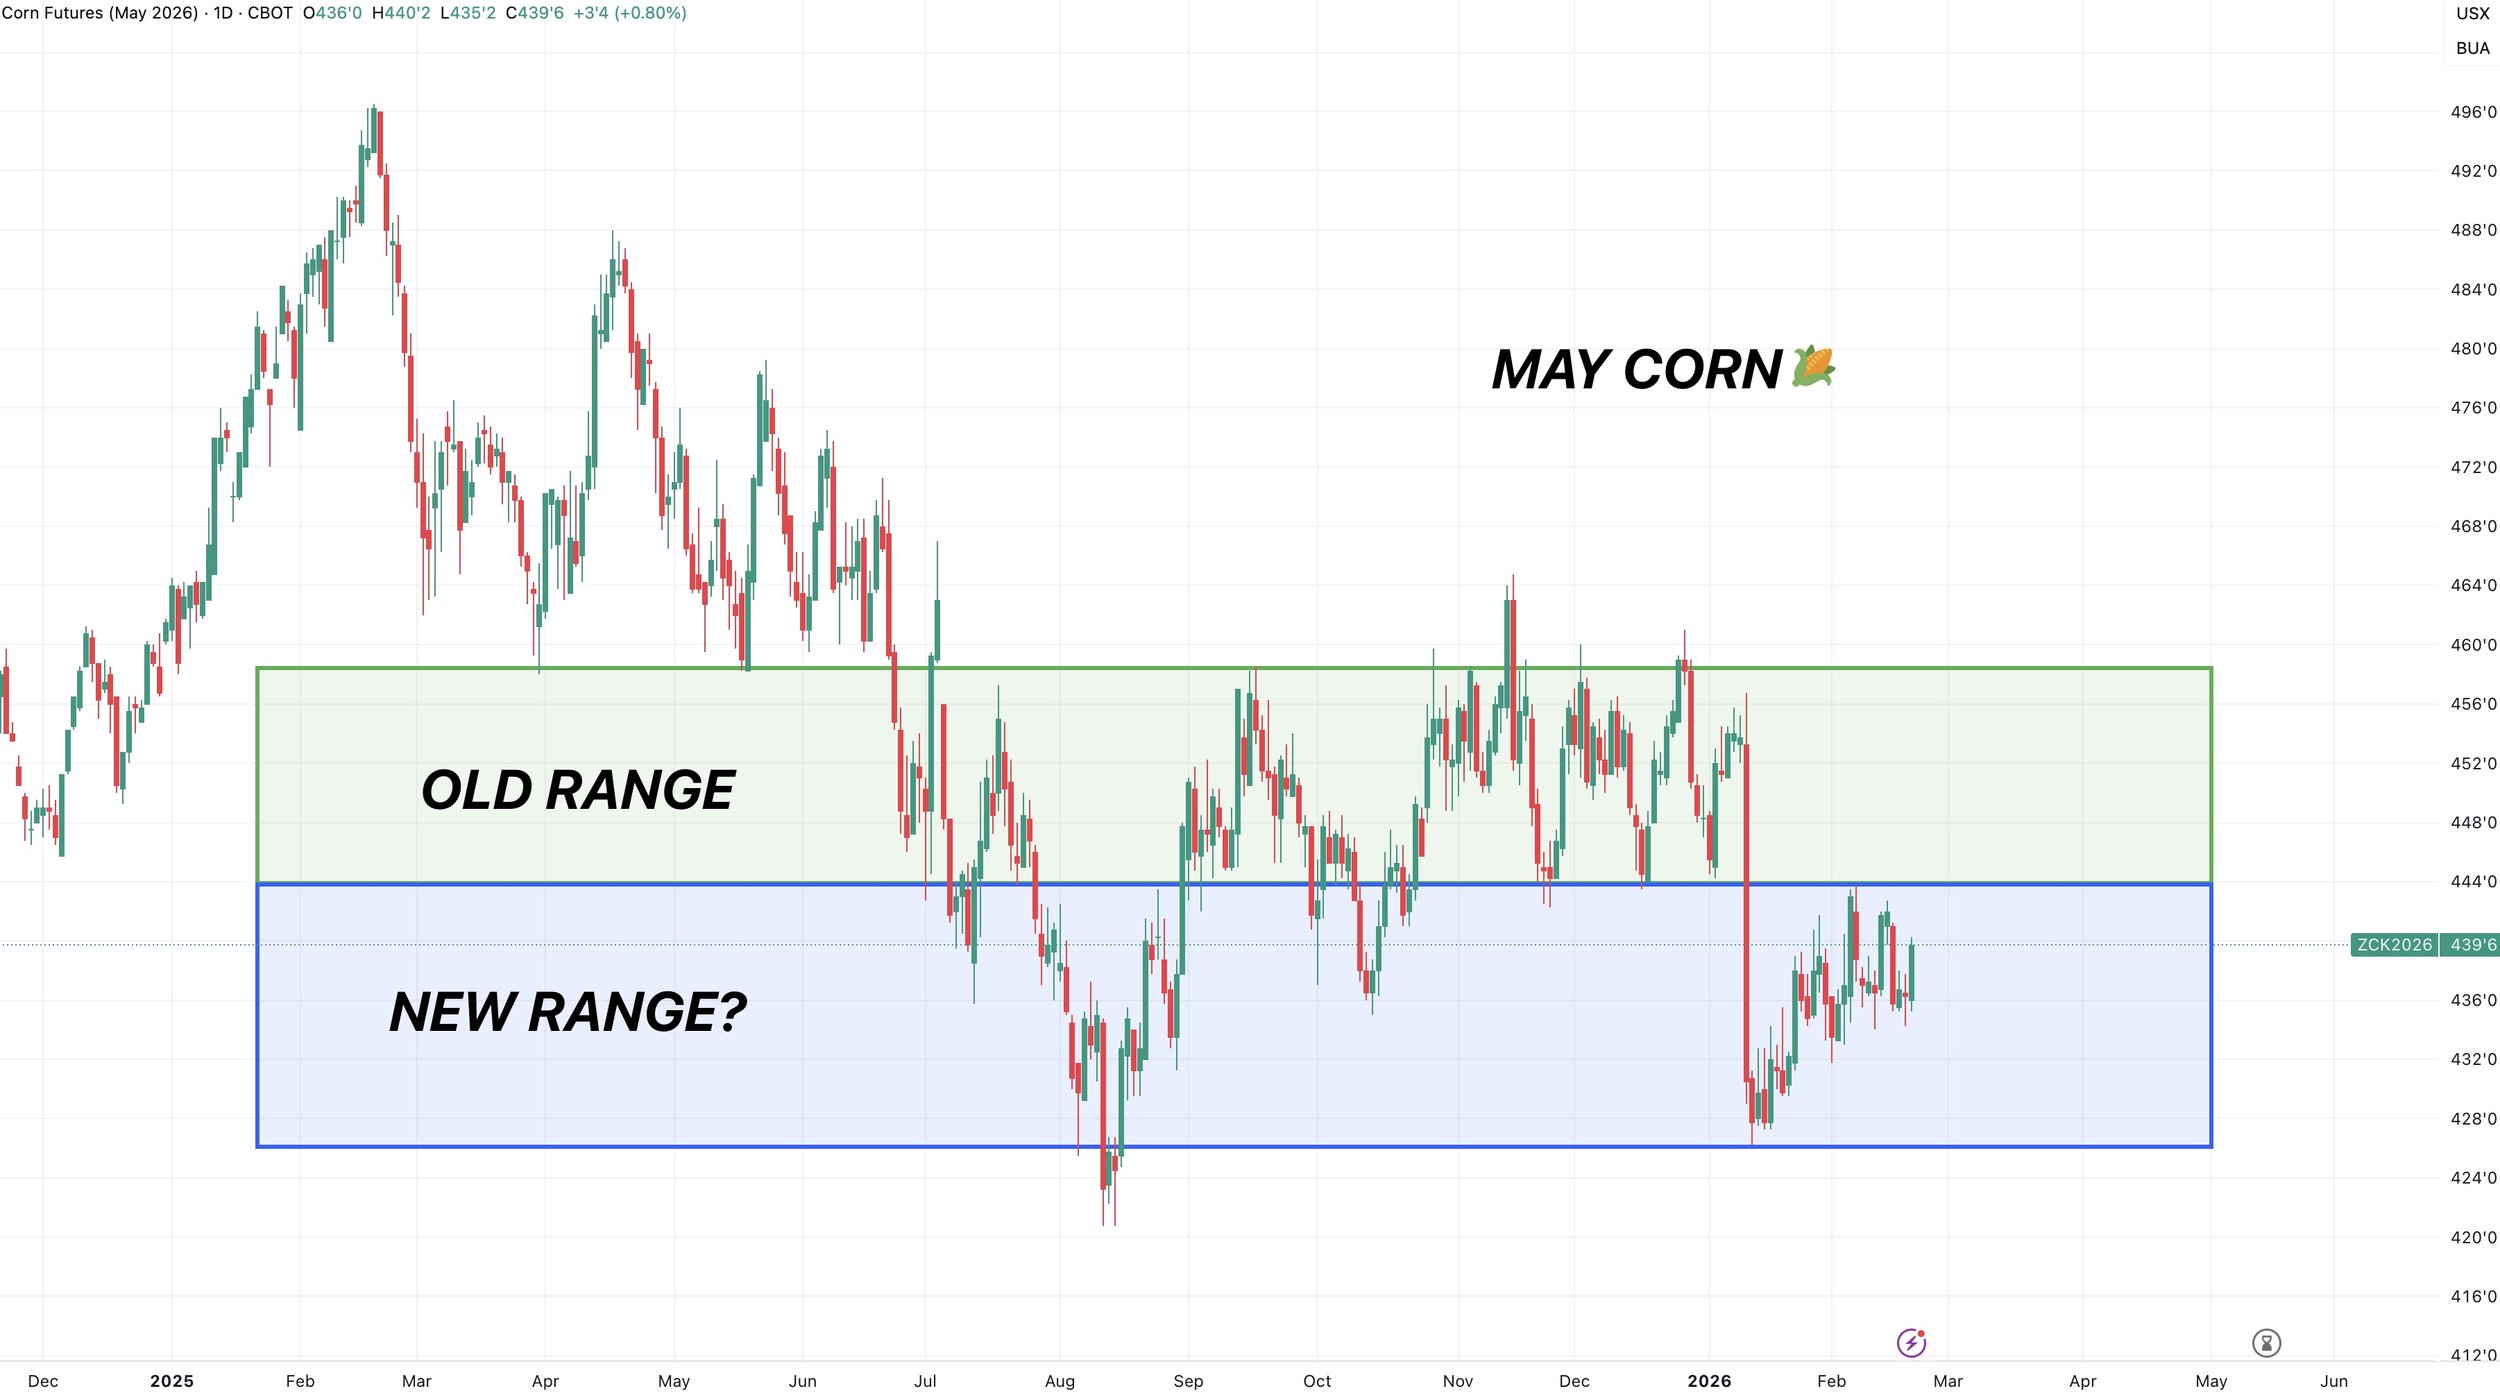
To the upside, if we break the recent highs it does open the door higher. As that was the support from last year and would result in us breaking into the old range.
Still feels like we are simply range bound down here like I've been talking about for weeks.
We probably need a catalyst to break out.
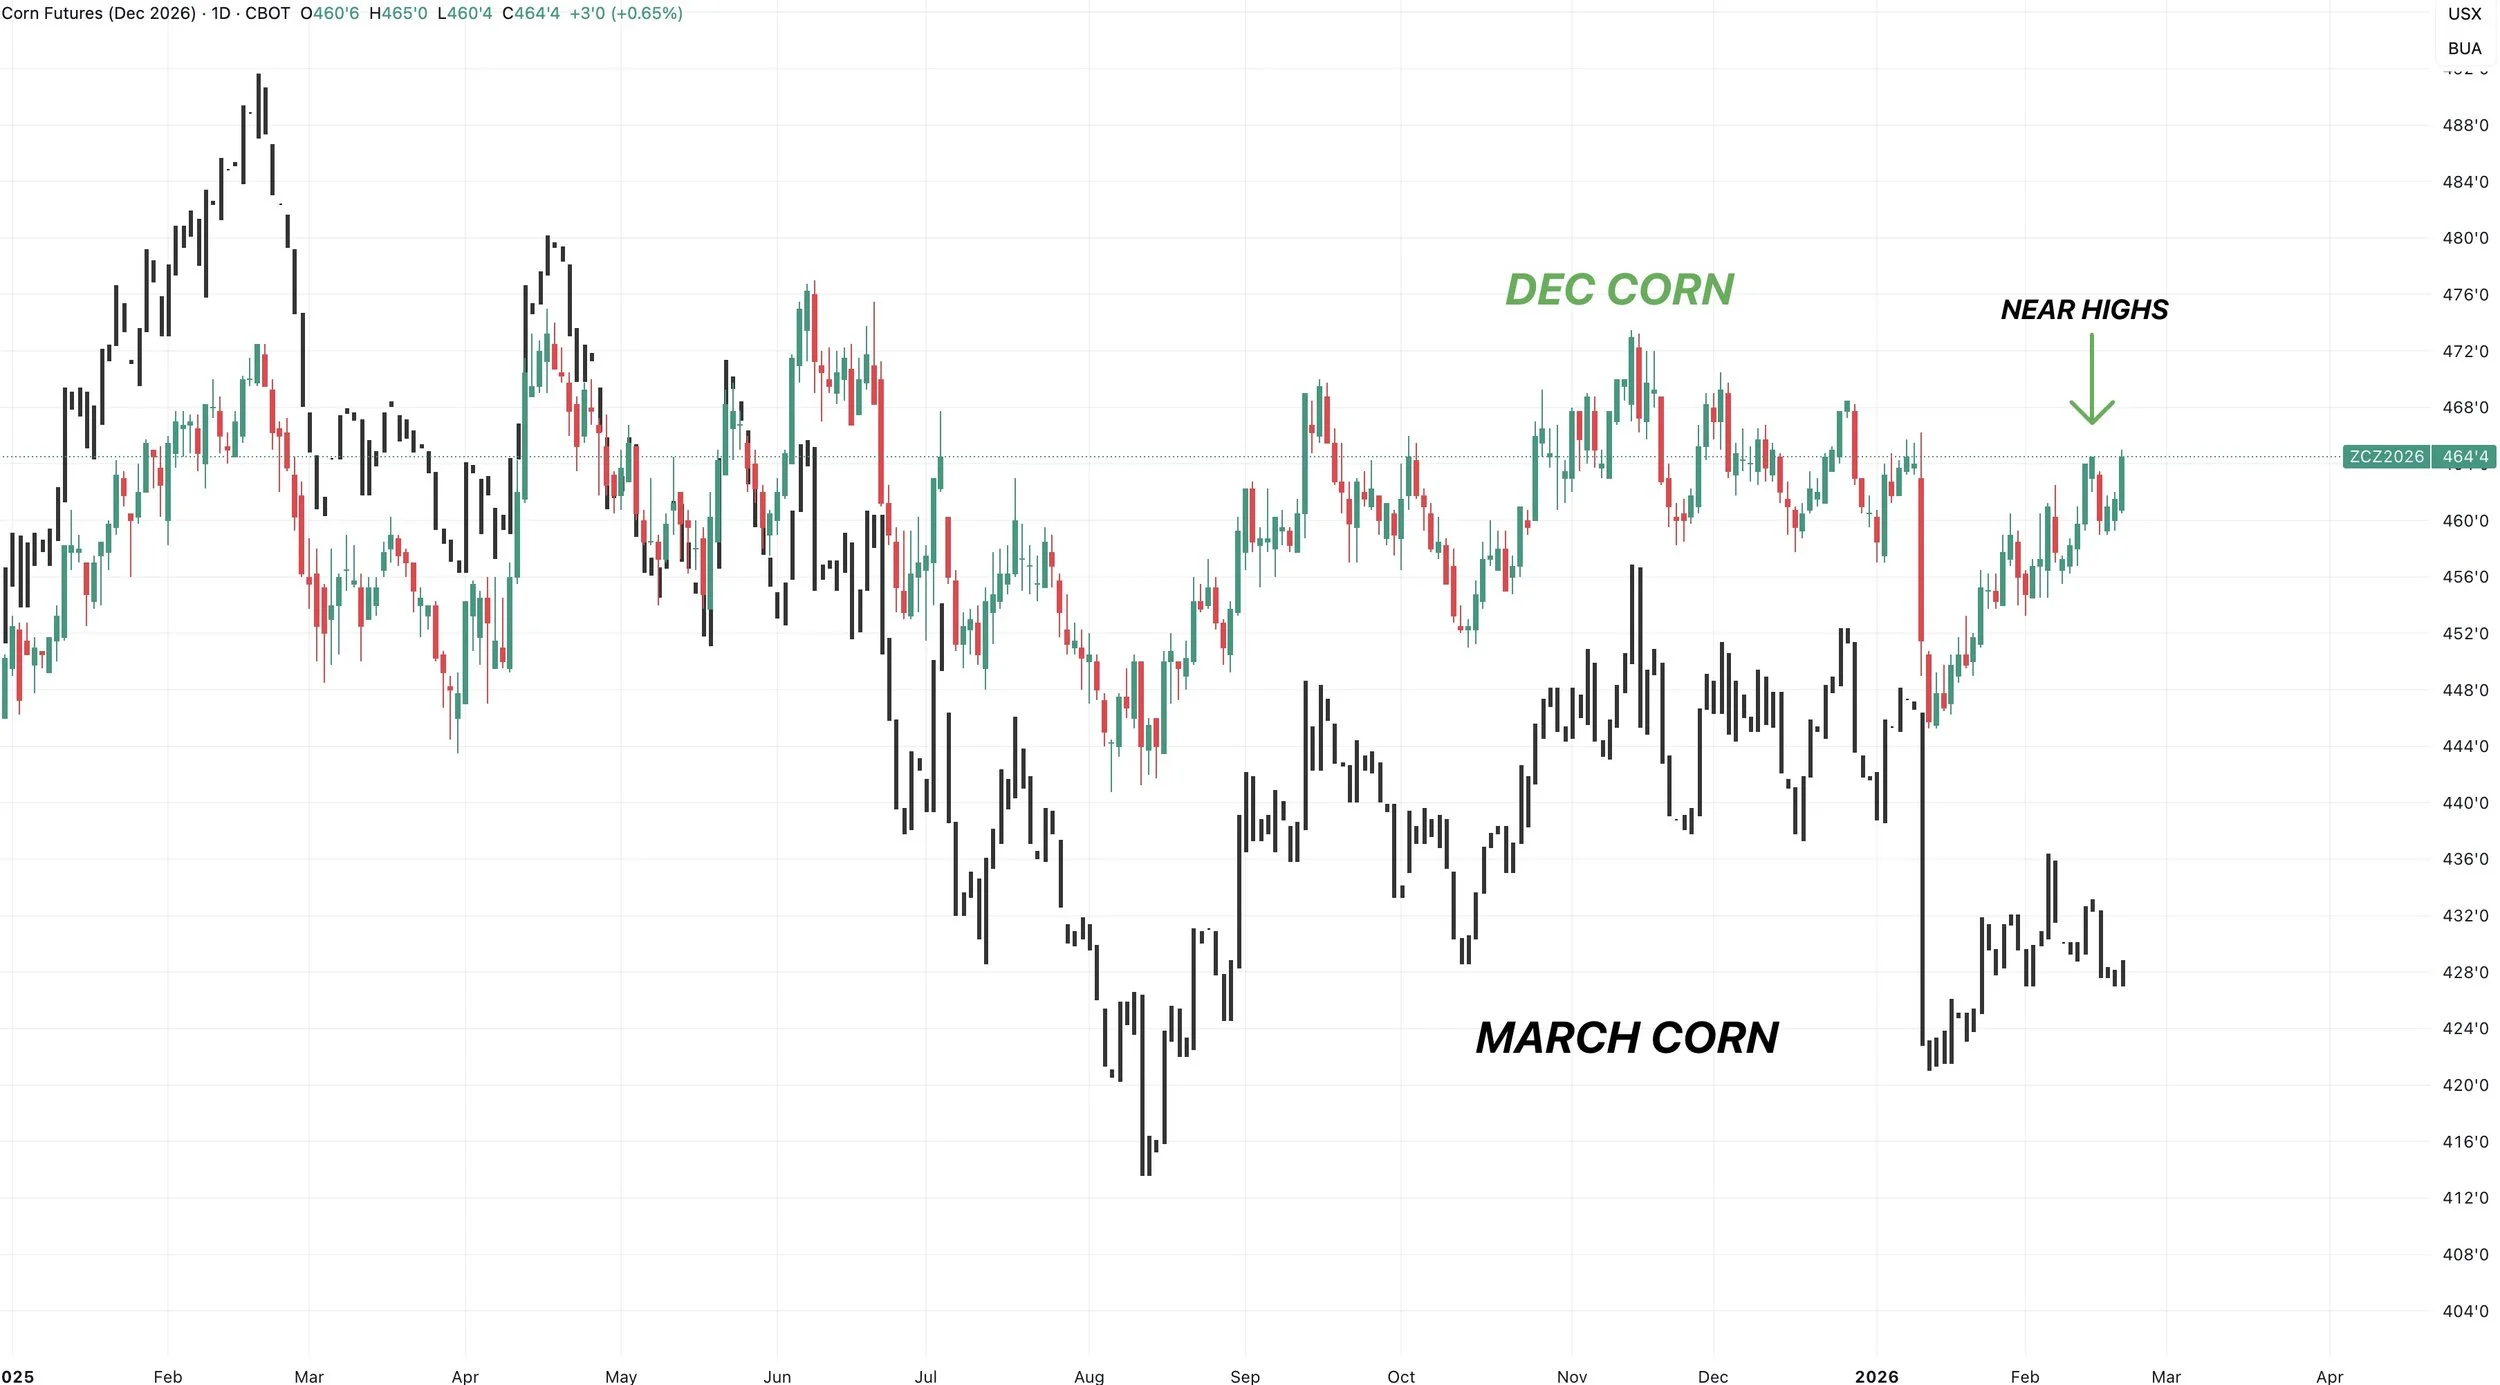
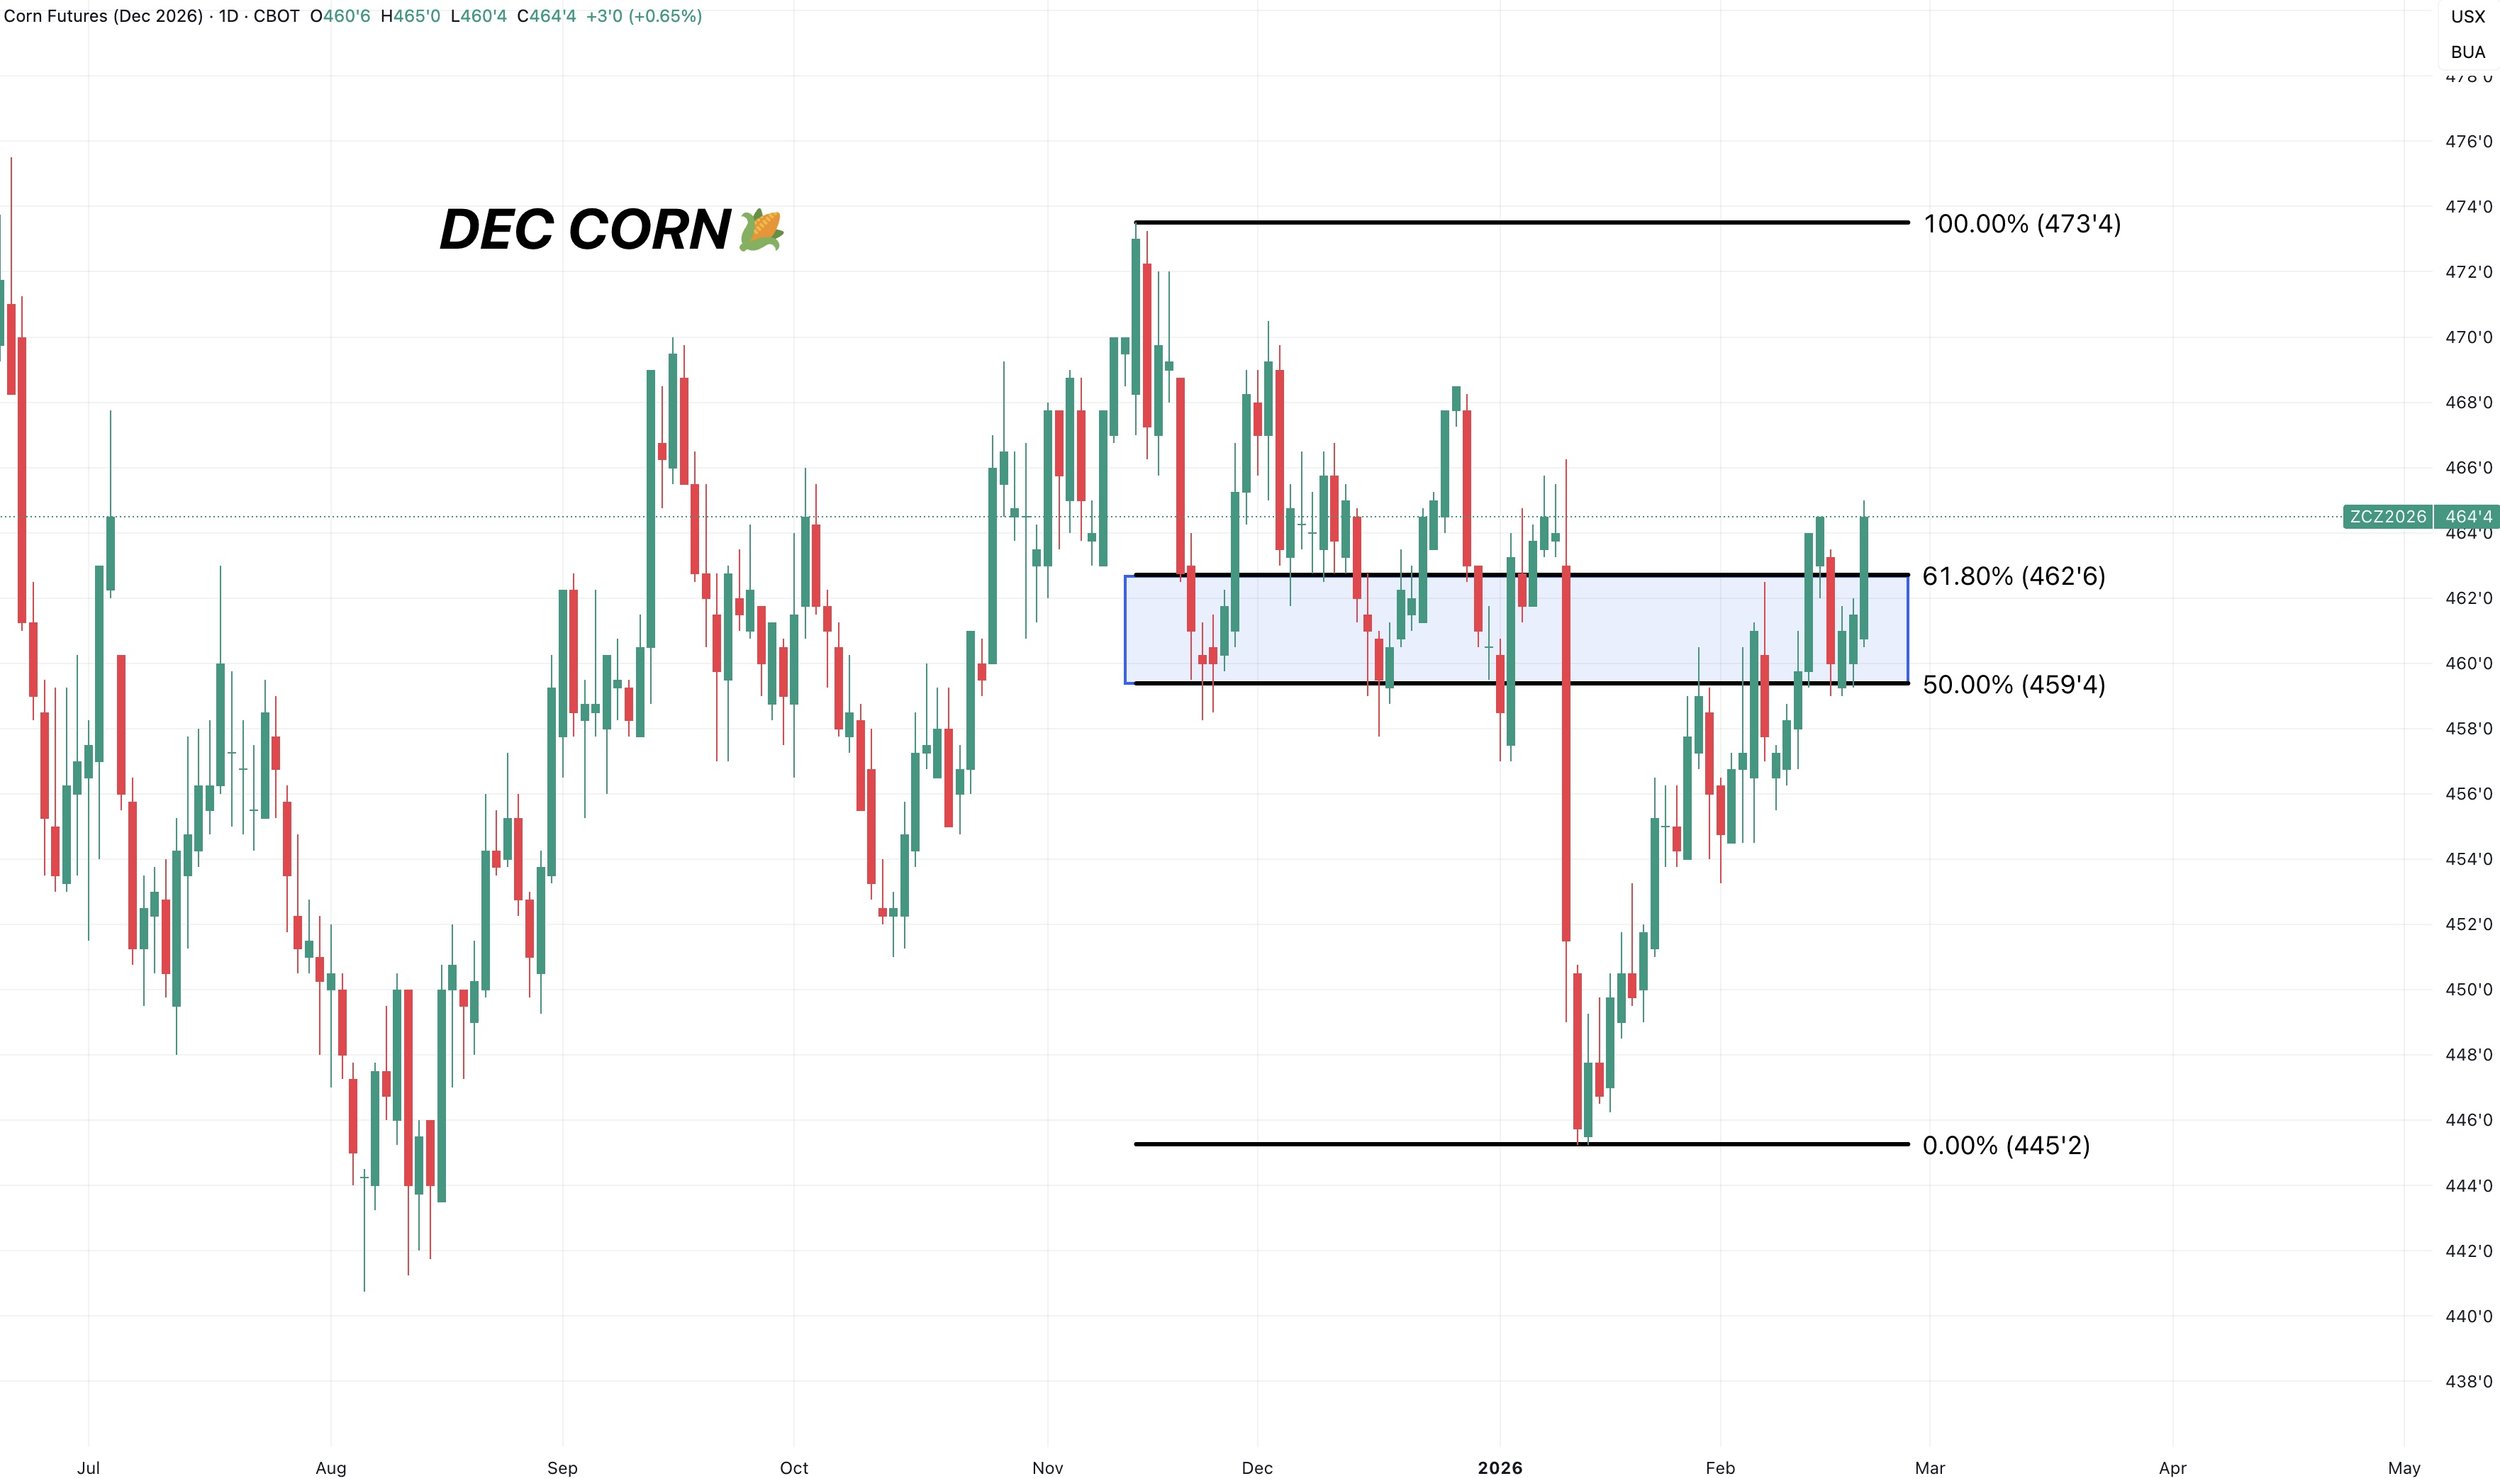
Dec Corn:
Dec is actually pretty strong.
I don’t mind some of you getting a small start on new crop here in the golden zone up to the November highs.
But overall, we like remaining far more patient here than in old crop. As old crop holds most of the risk and the chart looks far weaker.
Soybeans
Fundamentals:
Not going to spend any time on the fundamentals today.
We will have to wait and see how the Trump, China and tariff story unfolds here.
This market still has potential if China is going to come in and buy what Trump said they would.
But a headline driven market of course doesn’t come without risks.
Next Targets:
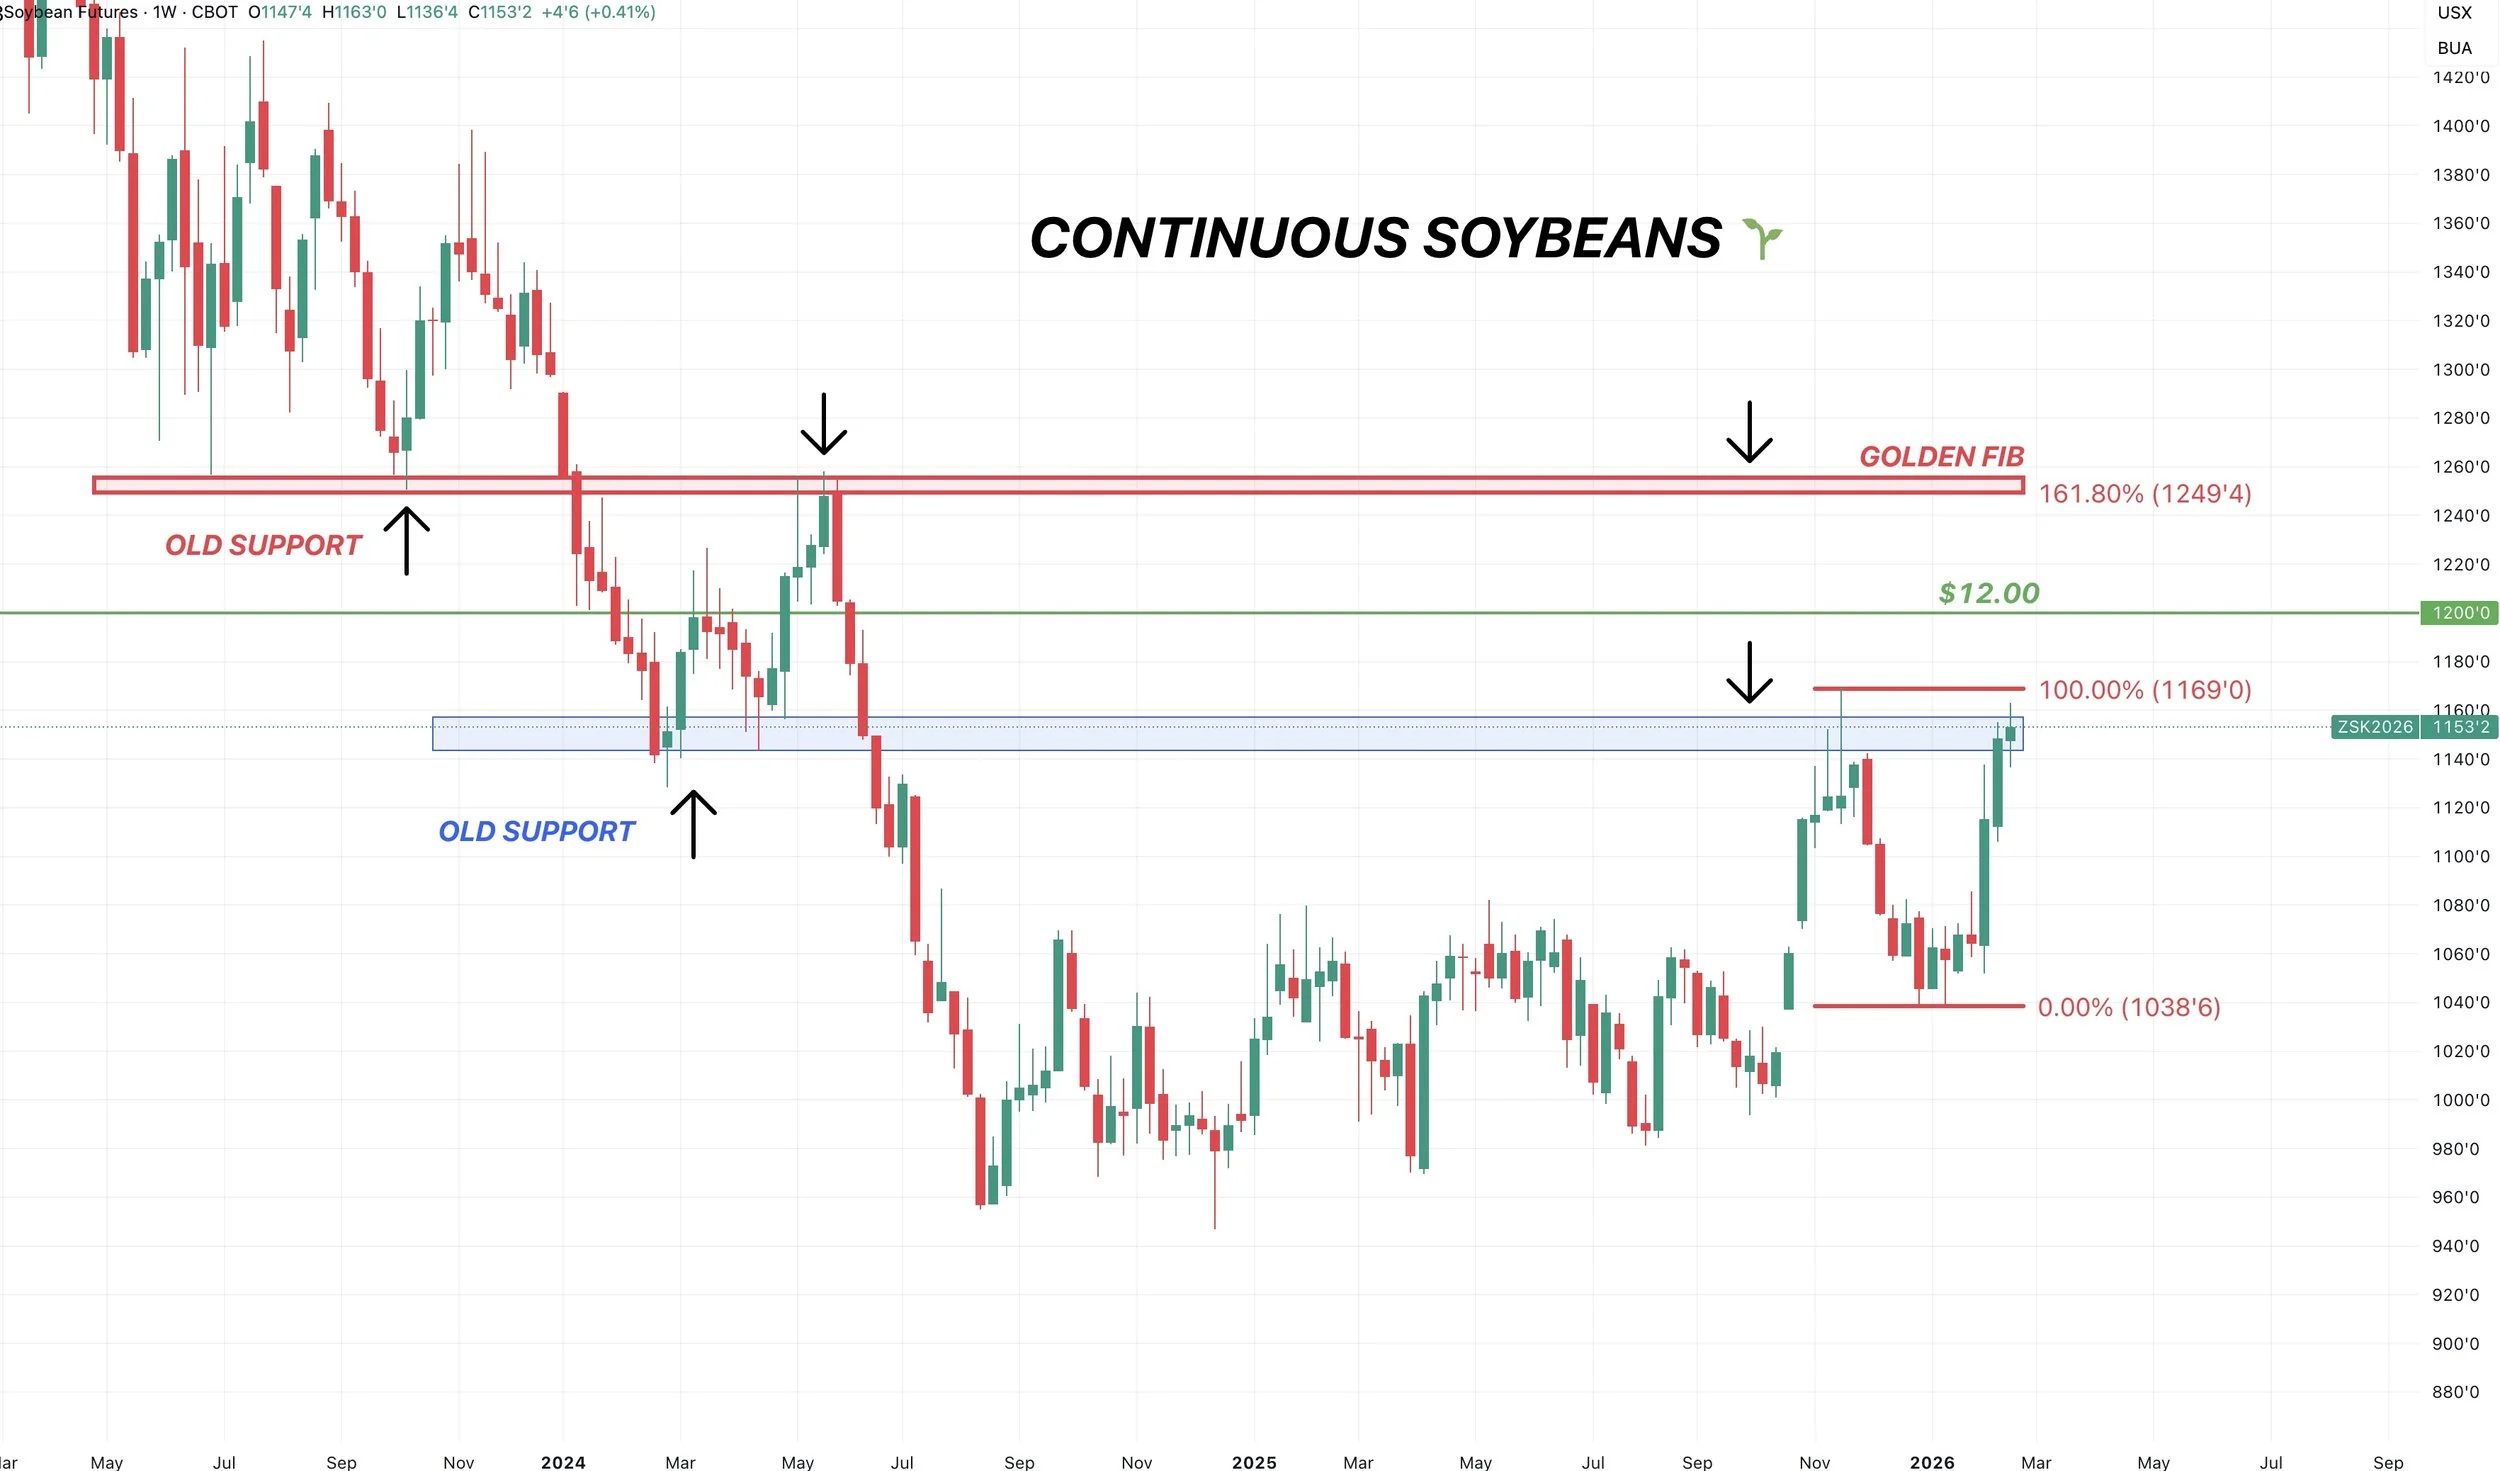
Here is the weekly chart.
We took some risk off the table at these levels already.
We are still sitting at a pretty big resistance level here. Hence why we took some risk off here.
The November highs and our support from 2024.
Break above, and the next point of interest is the psychological $12 level.
After that, the next target is $12.50
That is old key support and resistance.
It is also 161.8% of the recent lows up to the November highs. Known as the golden fib extension.
Wheat
Yesterday's Signal:
We did issue a KC sell signal and hedge alert yesterday as we were approaching our upside targets I've been showing you every day for the last several months.
Link to Yesterdays Alert: Click Here
Let've dive right into the charts.
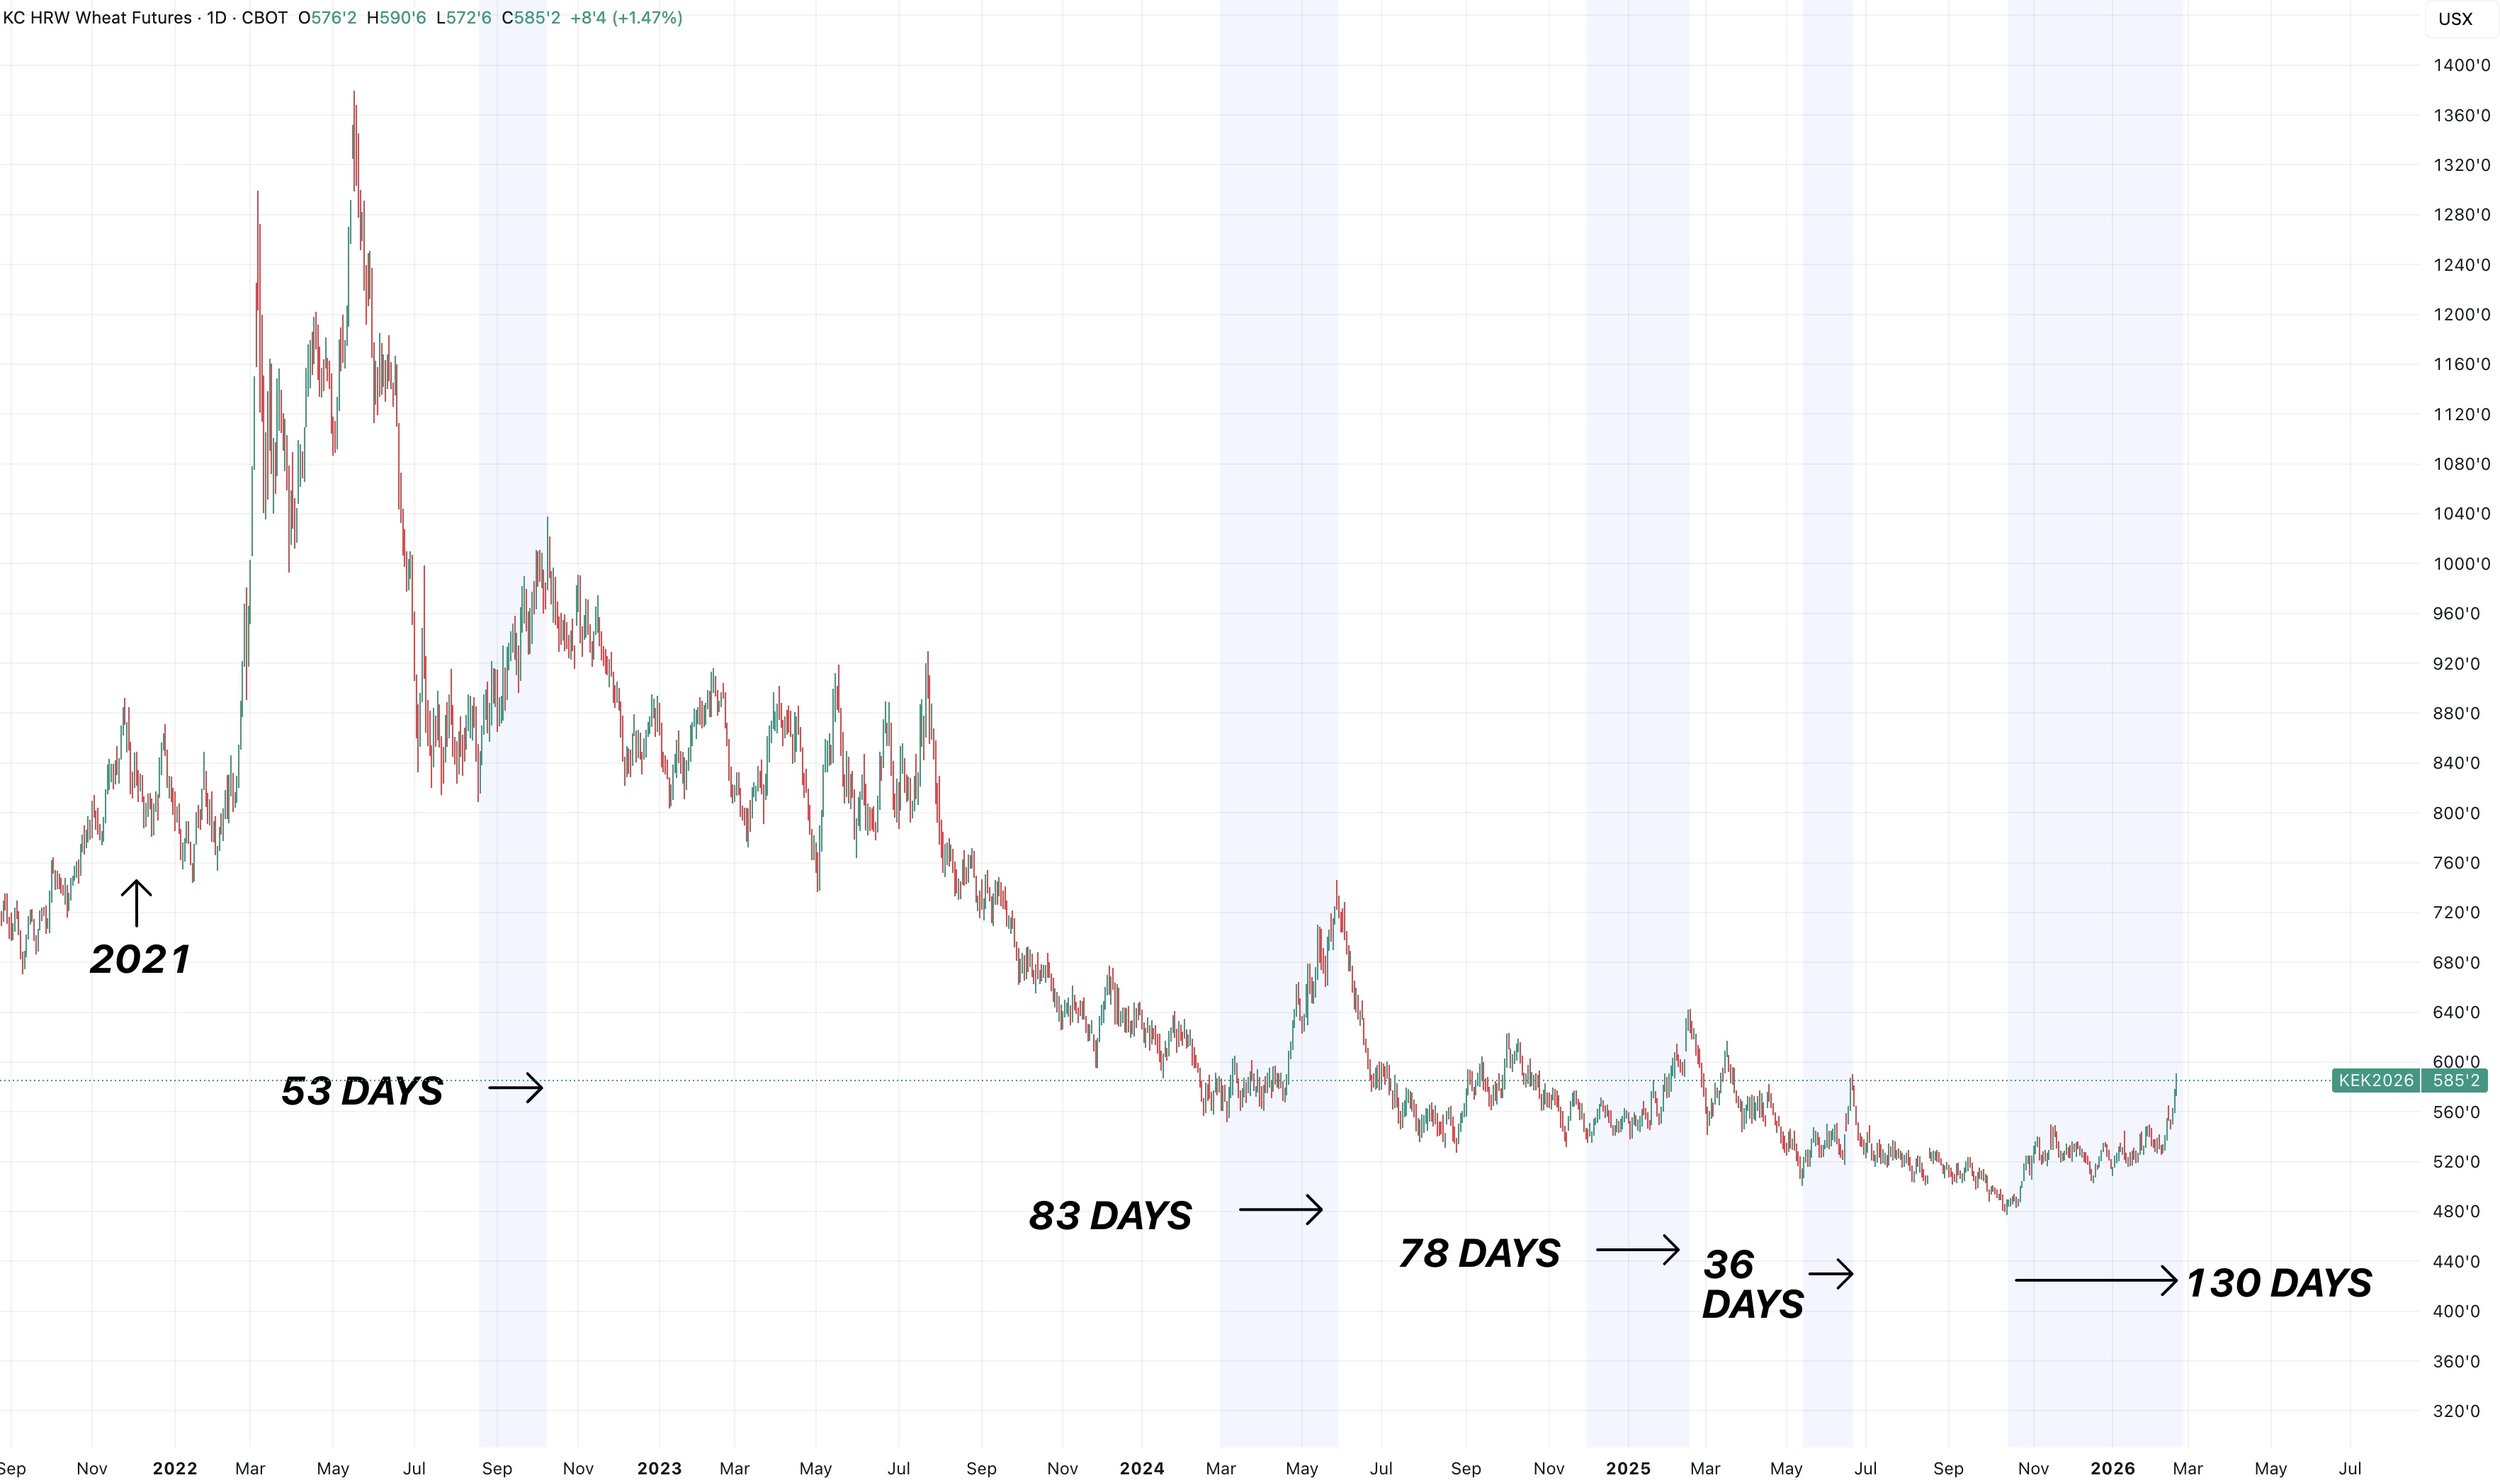
Longest Wheat Rally Since 2021
For starters, this is the longest sustained rally the wheat market has seen since 2021.
I'm not even exaggerating.
It has been 130 days since we posted those October lows.
We have not seen a rally last longer than this since the rally back in 2021.
As the next closest rally was the spring rally in 2024 off the back of that Russia weather story. That rally only lasted 80 days.
To me, this tells us that this rally could very well be a trend change in the wheat market when taking a long term approach.
Bearish Until it's Not?
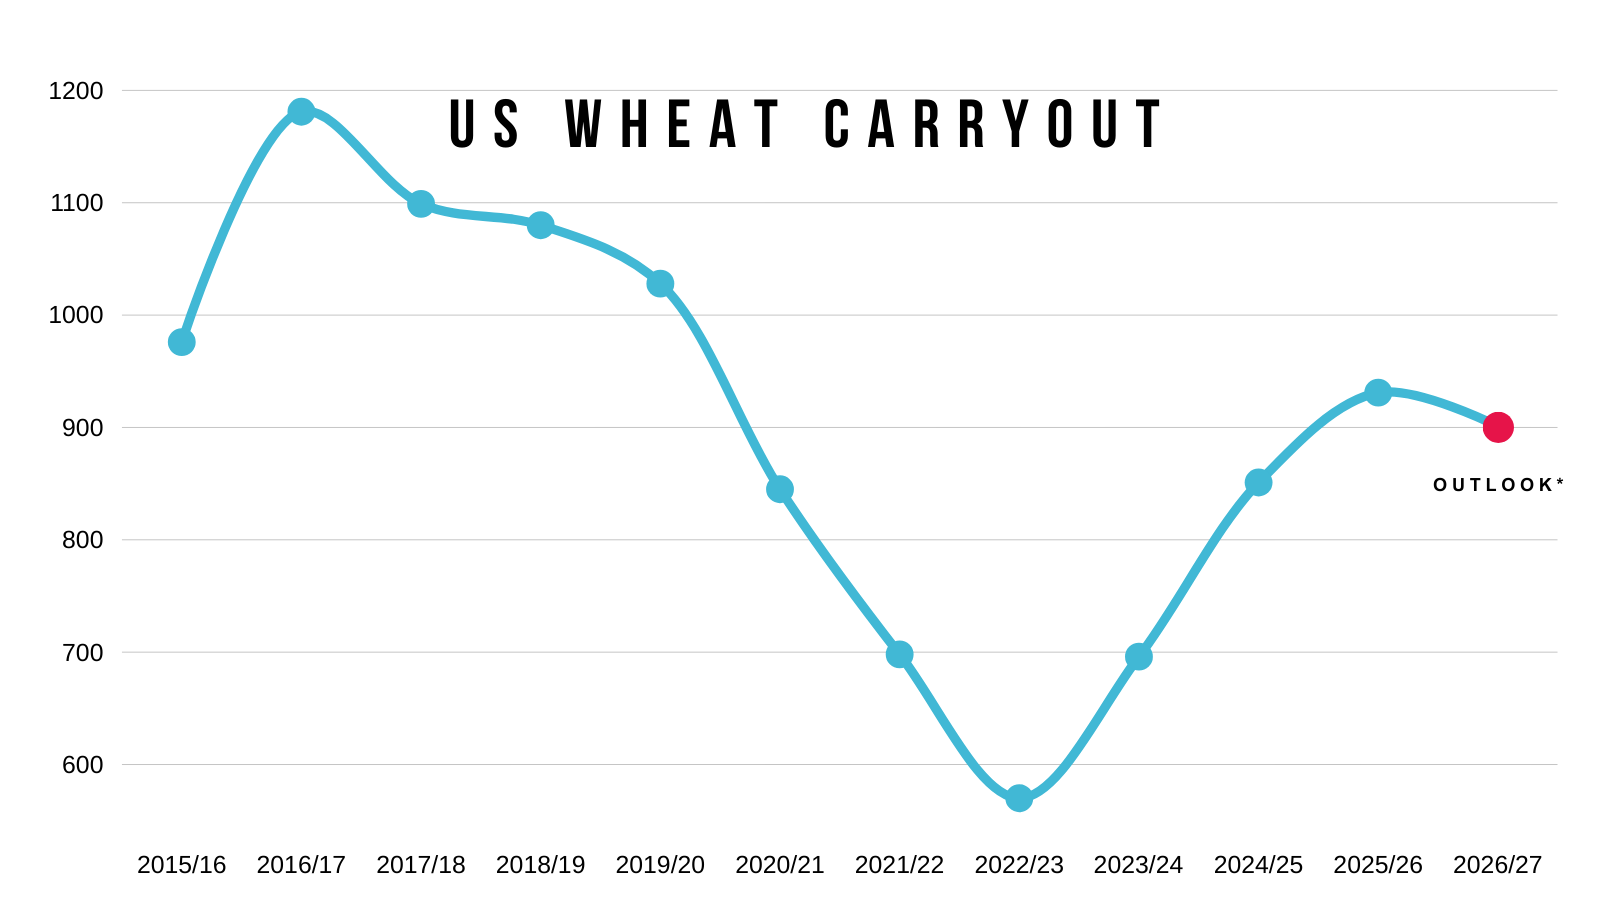
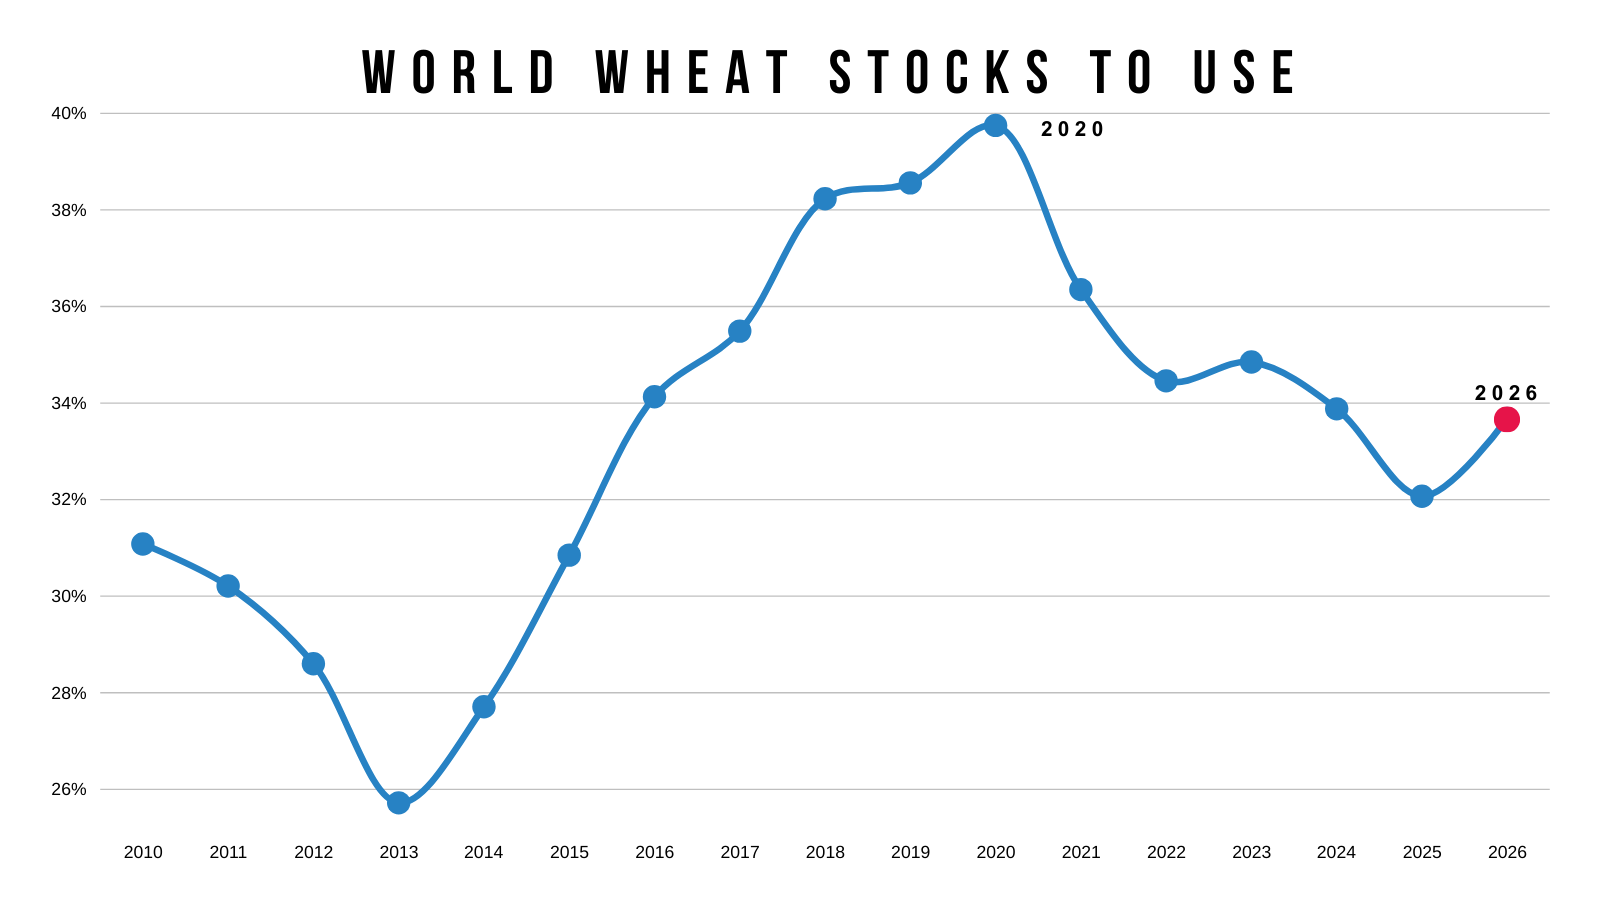
Right now the US and world wheat balance sheets are not what you would call bullish.
But at a certain point, when everything is bearish, it eventually becomes priced in.
Is the only direction left to go a more bullish story?
I mean the wheat market is at 5-year lows and relatively cheap in comparison to everything else.
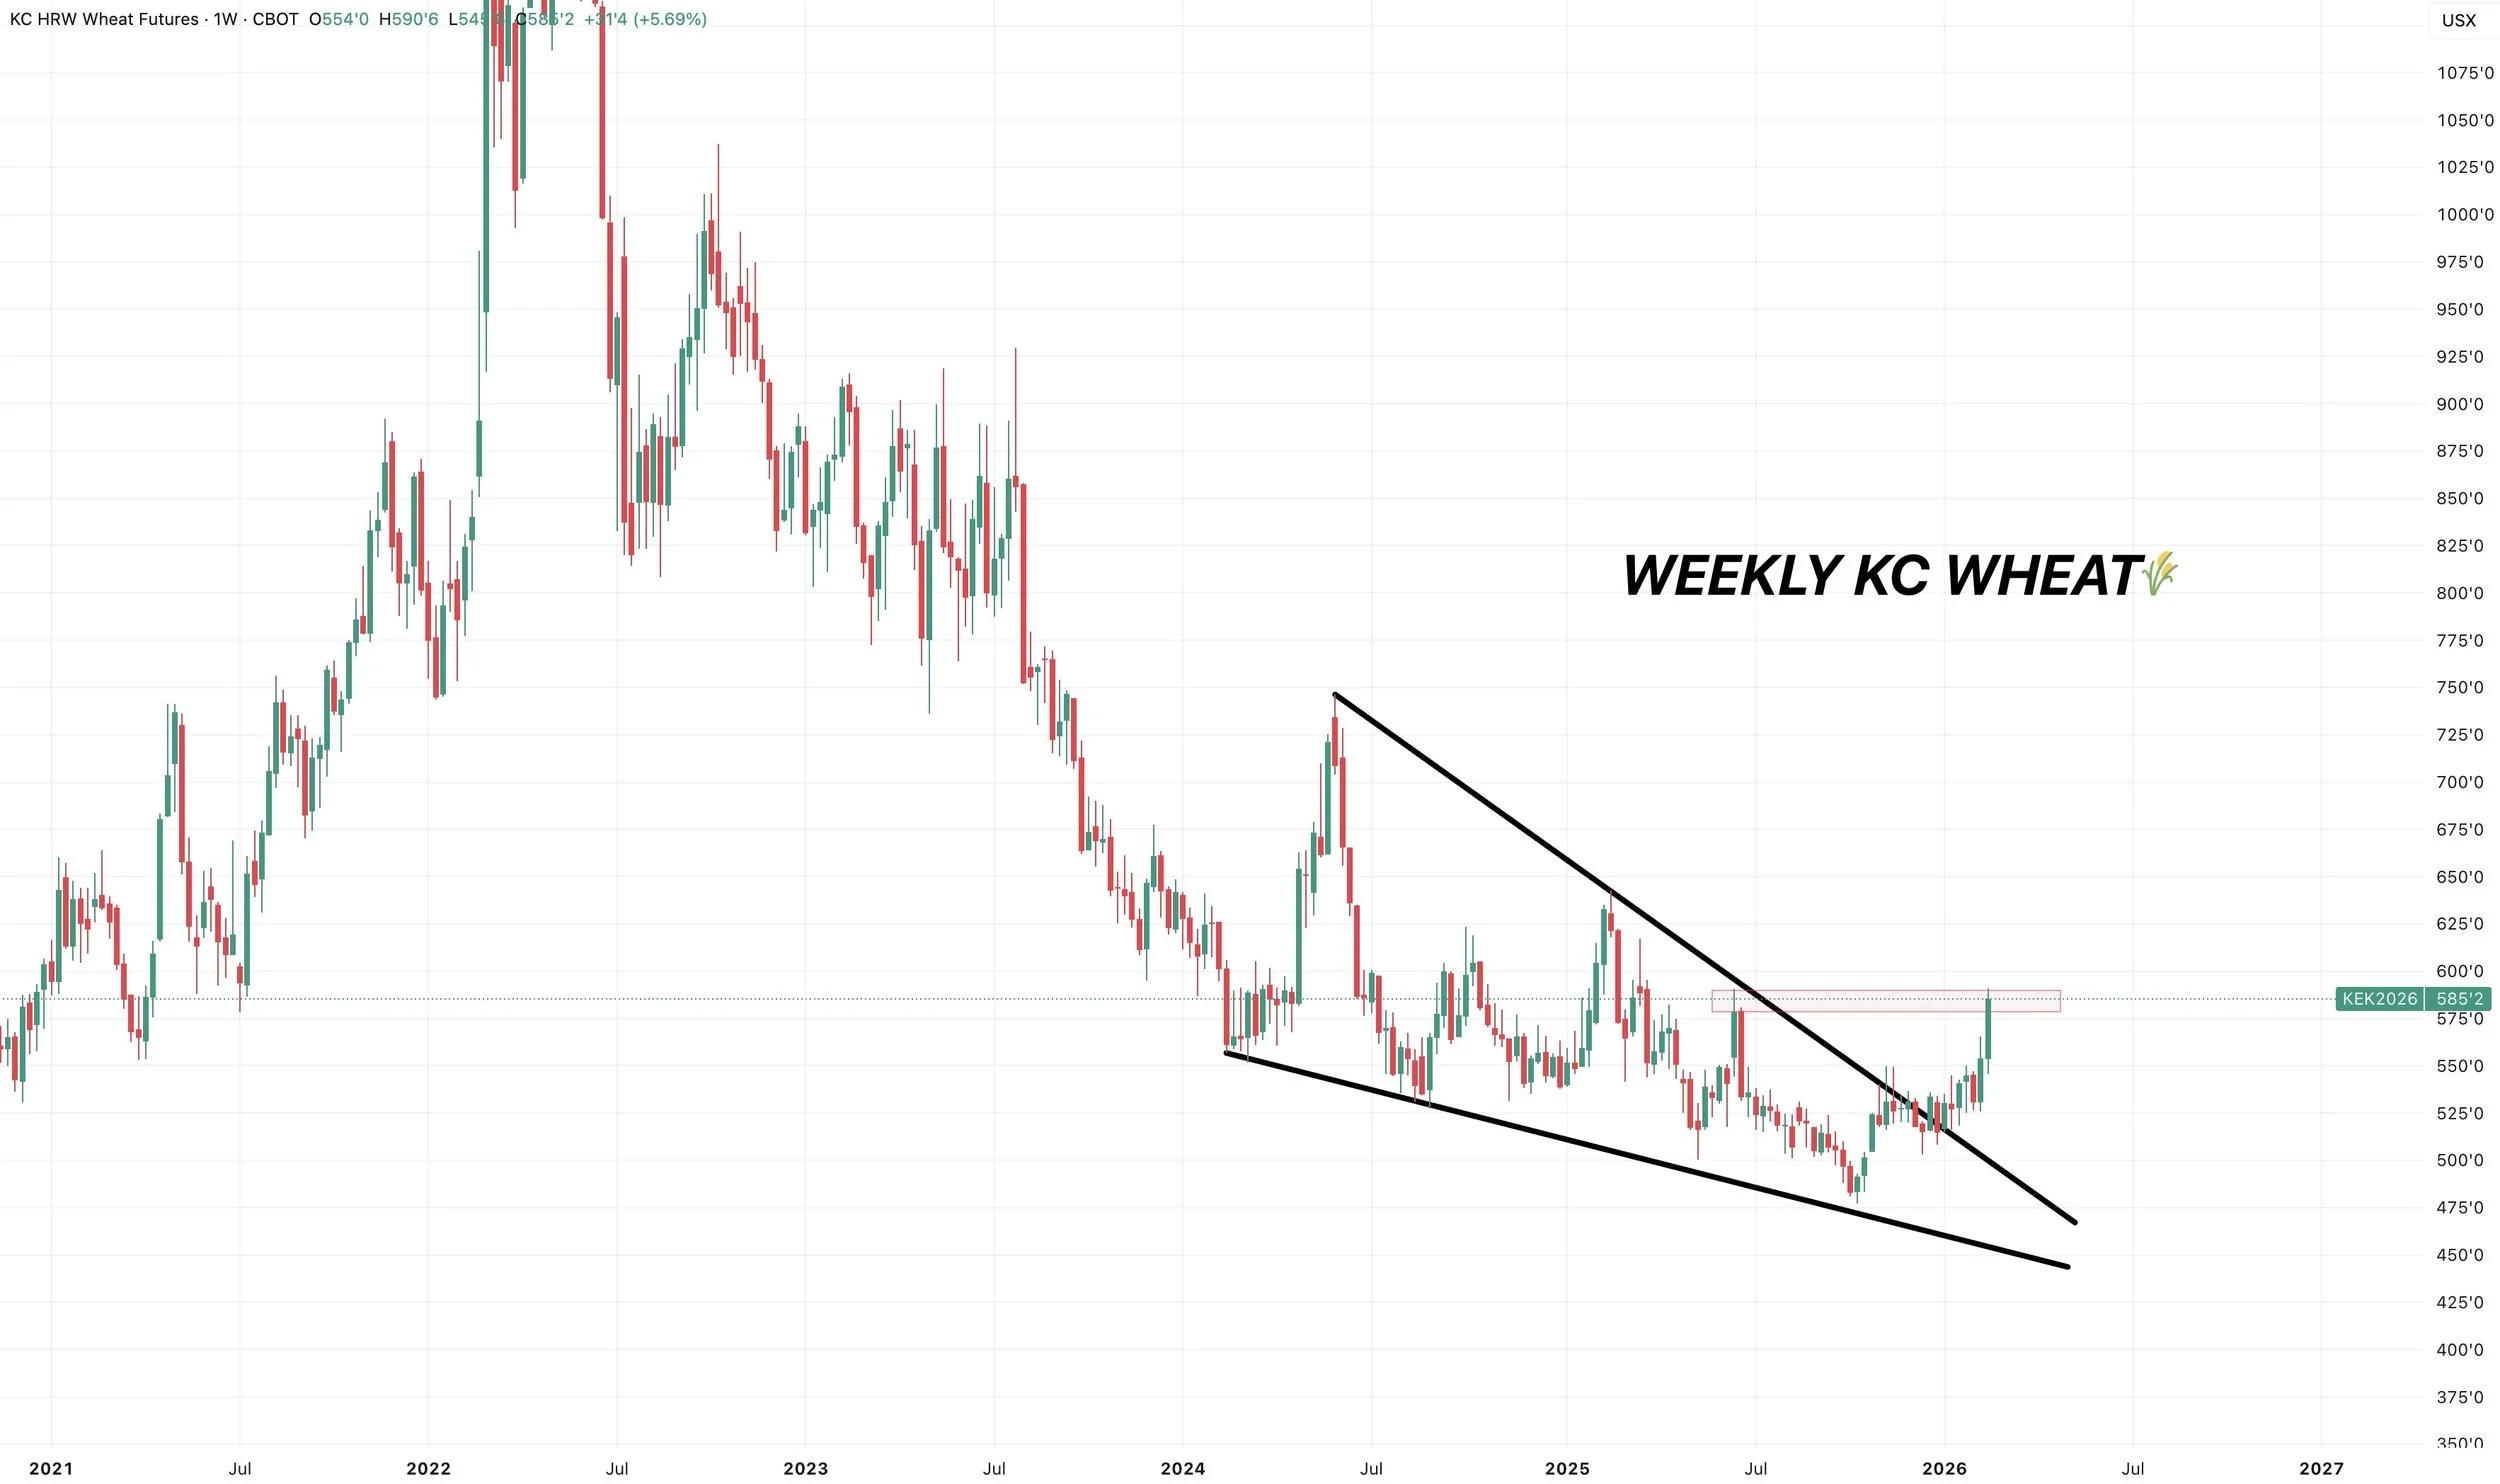
Weekly KC:
I mean just take a look at the weekly chart from a big picture perspective.
We have a clear breakout from a muli-year wedge pattern.
We are right up against some resistance at those June highs, but it looks like a potential bottom has been formed long term.
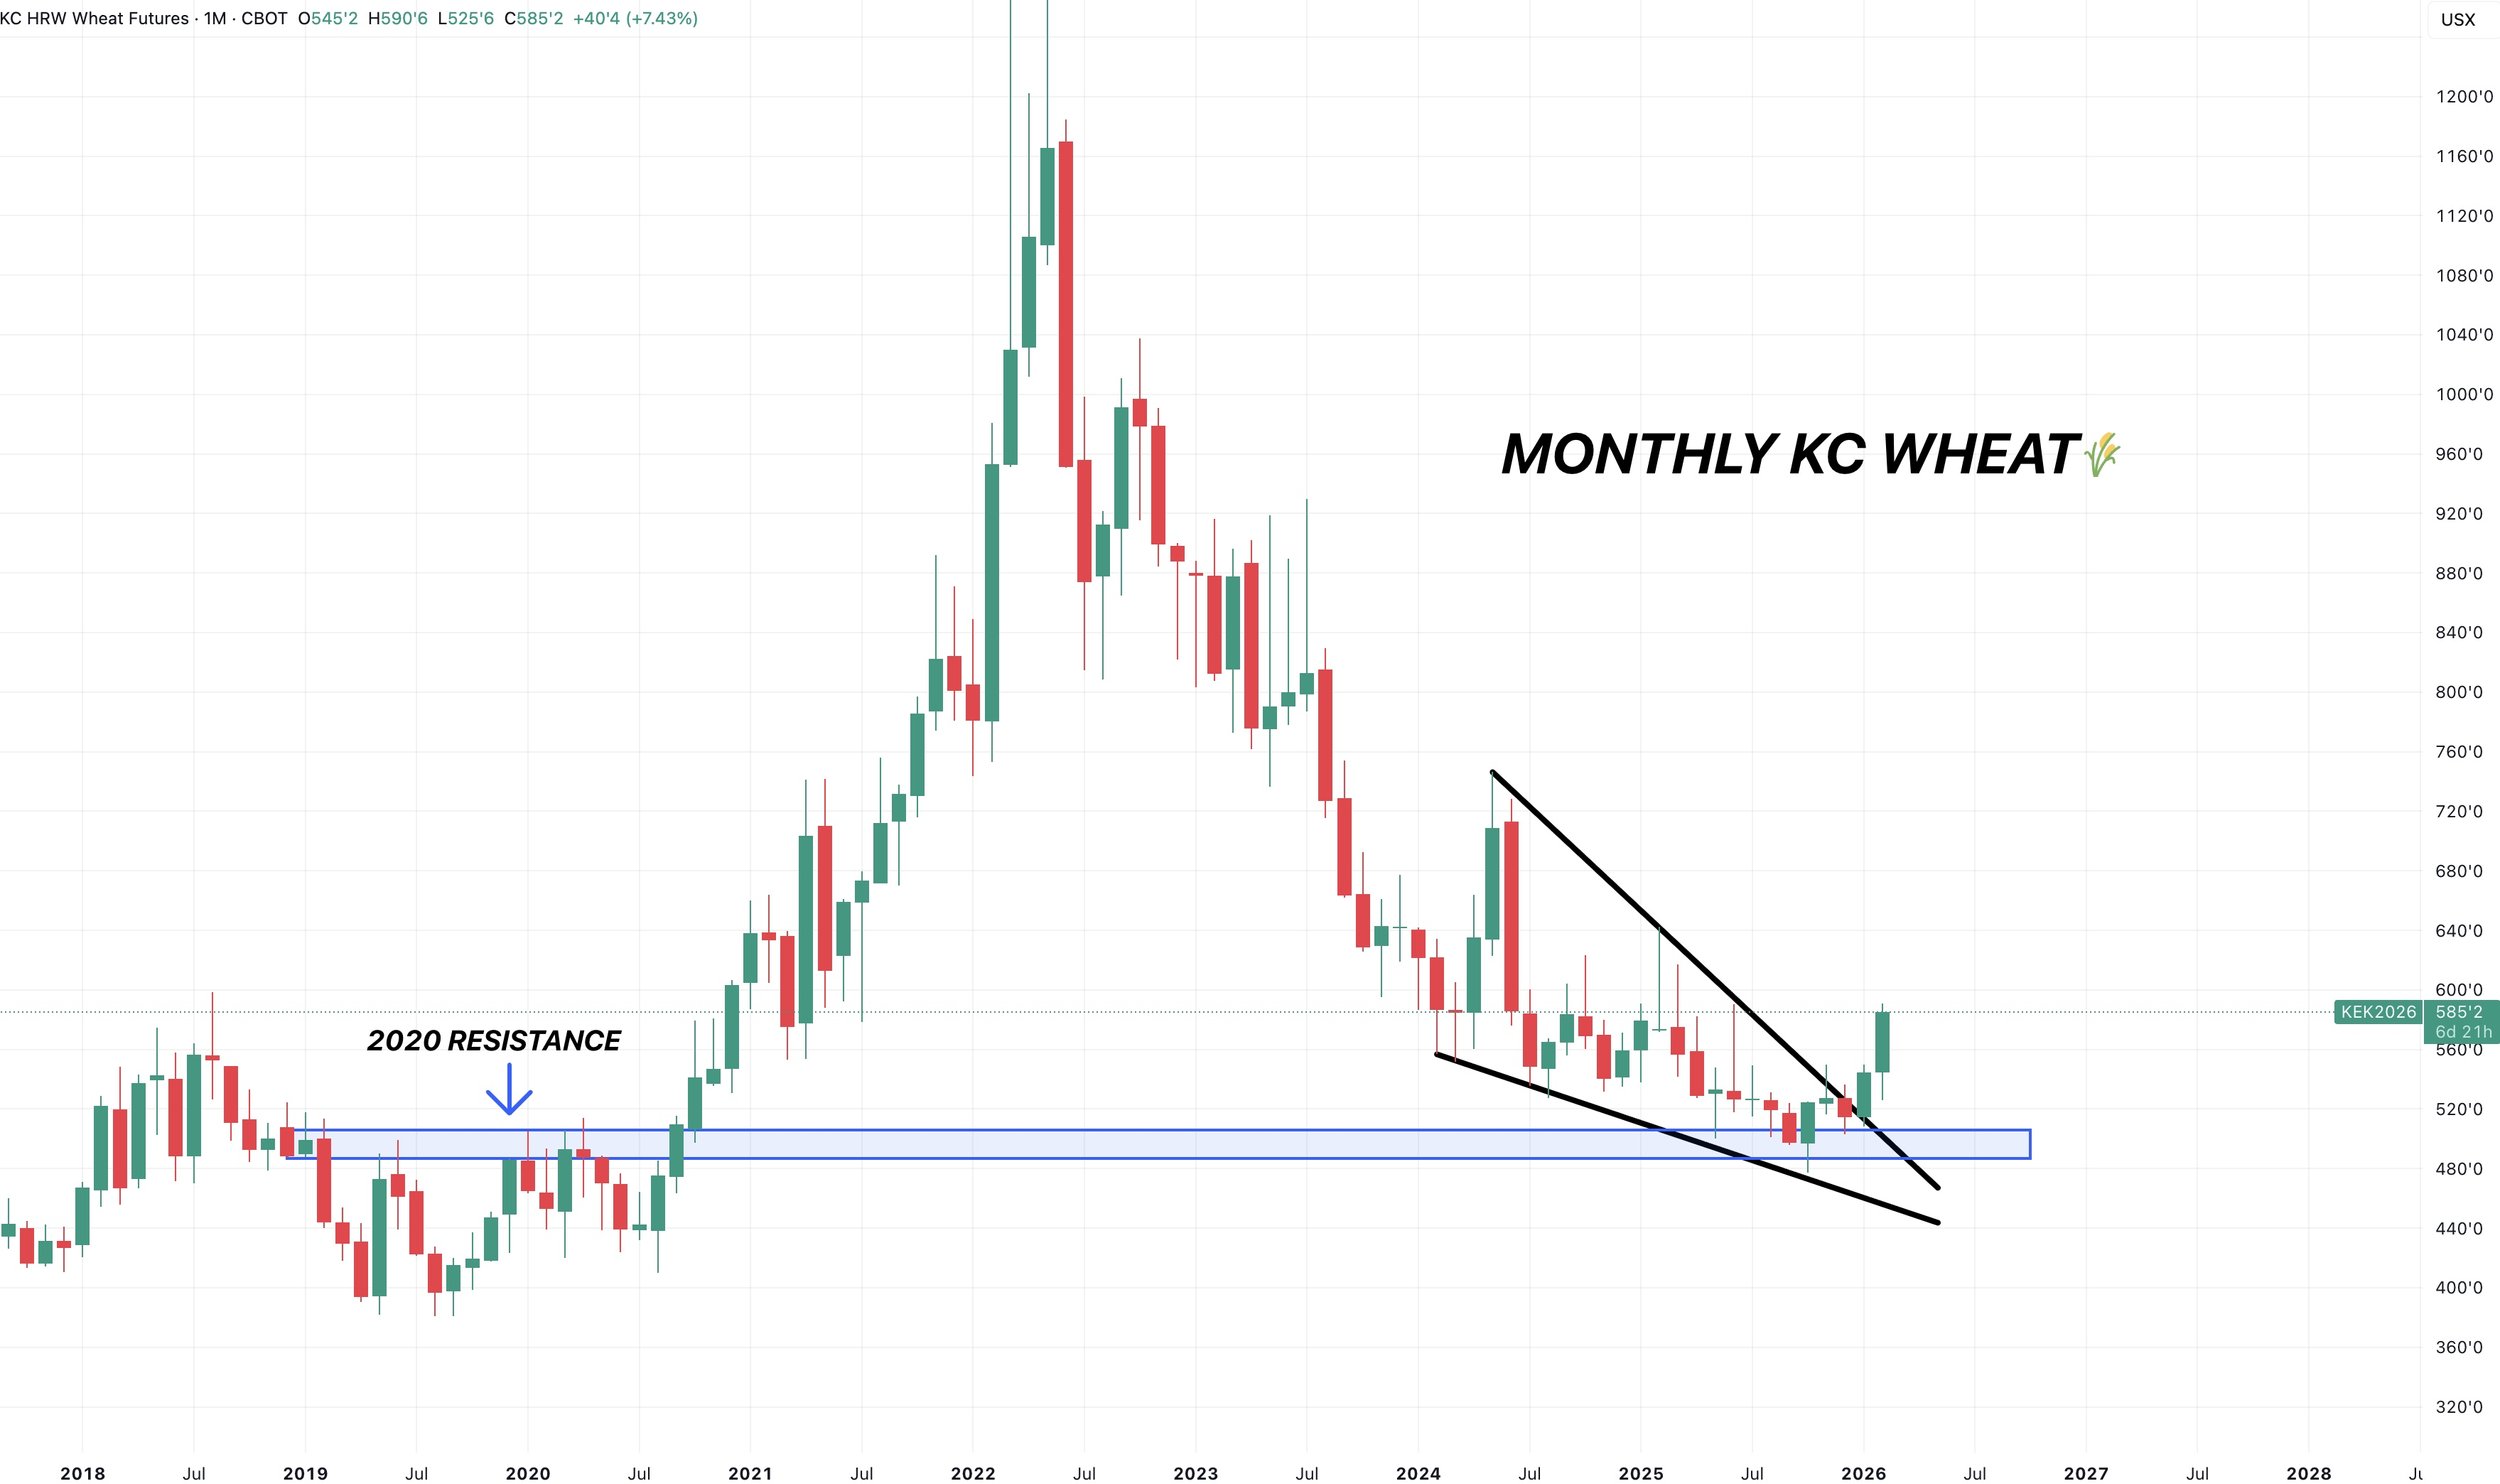
Monthly KC:
Here is the monthly look.
We found support right at the 2020 resistance. We got the wedge breakout. Trading at 8 month highs.
I am long-term bullish on wheat. Meaning I think we put in some longer-term lows, and the overall long-term structure has shifted.
The chart looks solid.
But short term, we are at an area where it makes sense to take some chips off the table, which brings me to these next charts and our reason behind the alert.
Reason for the Signal:
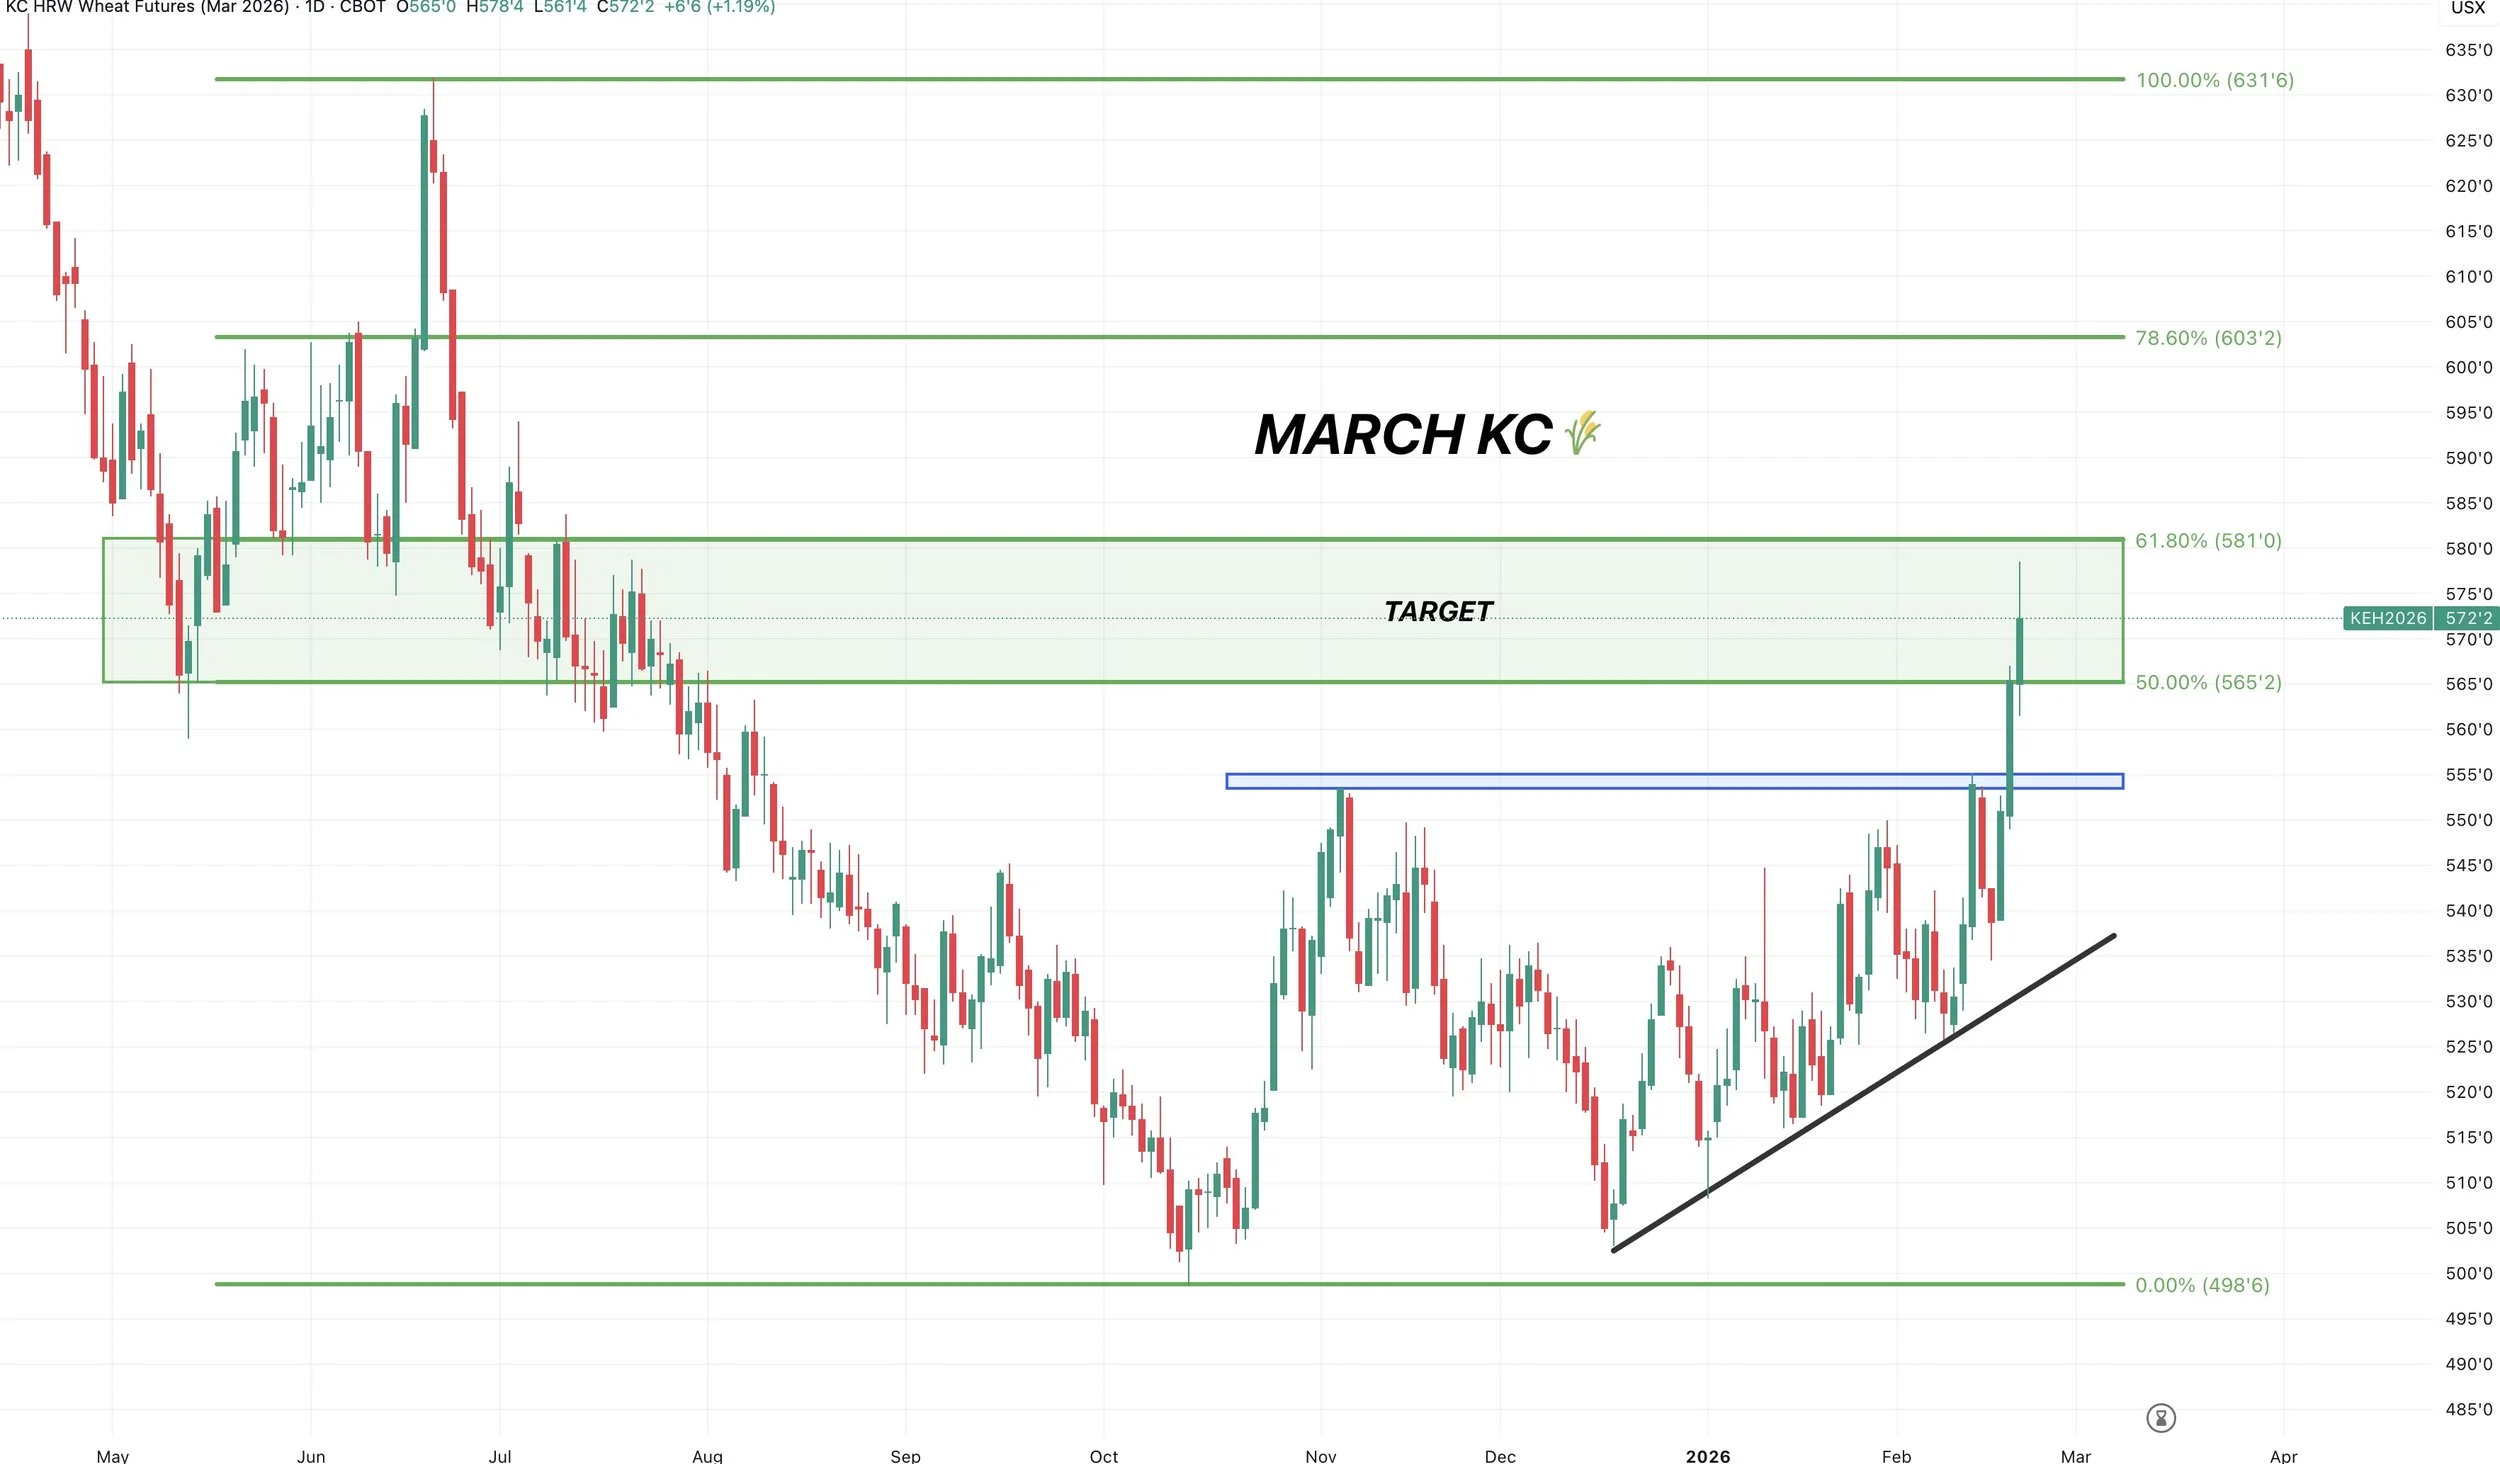
March KC:
We are right in that target box I've had since October.
The golden zone up to the June highs.
This is where rallies can often stall or find resistance.
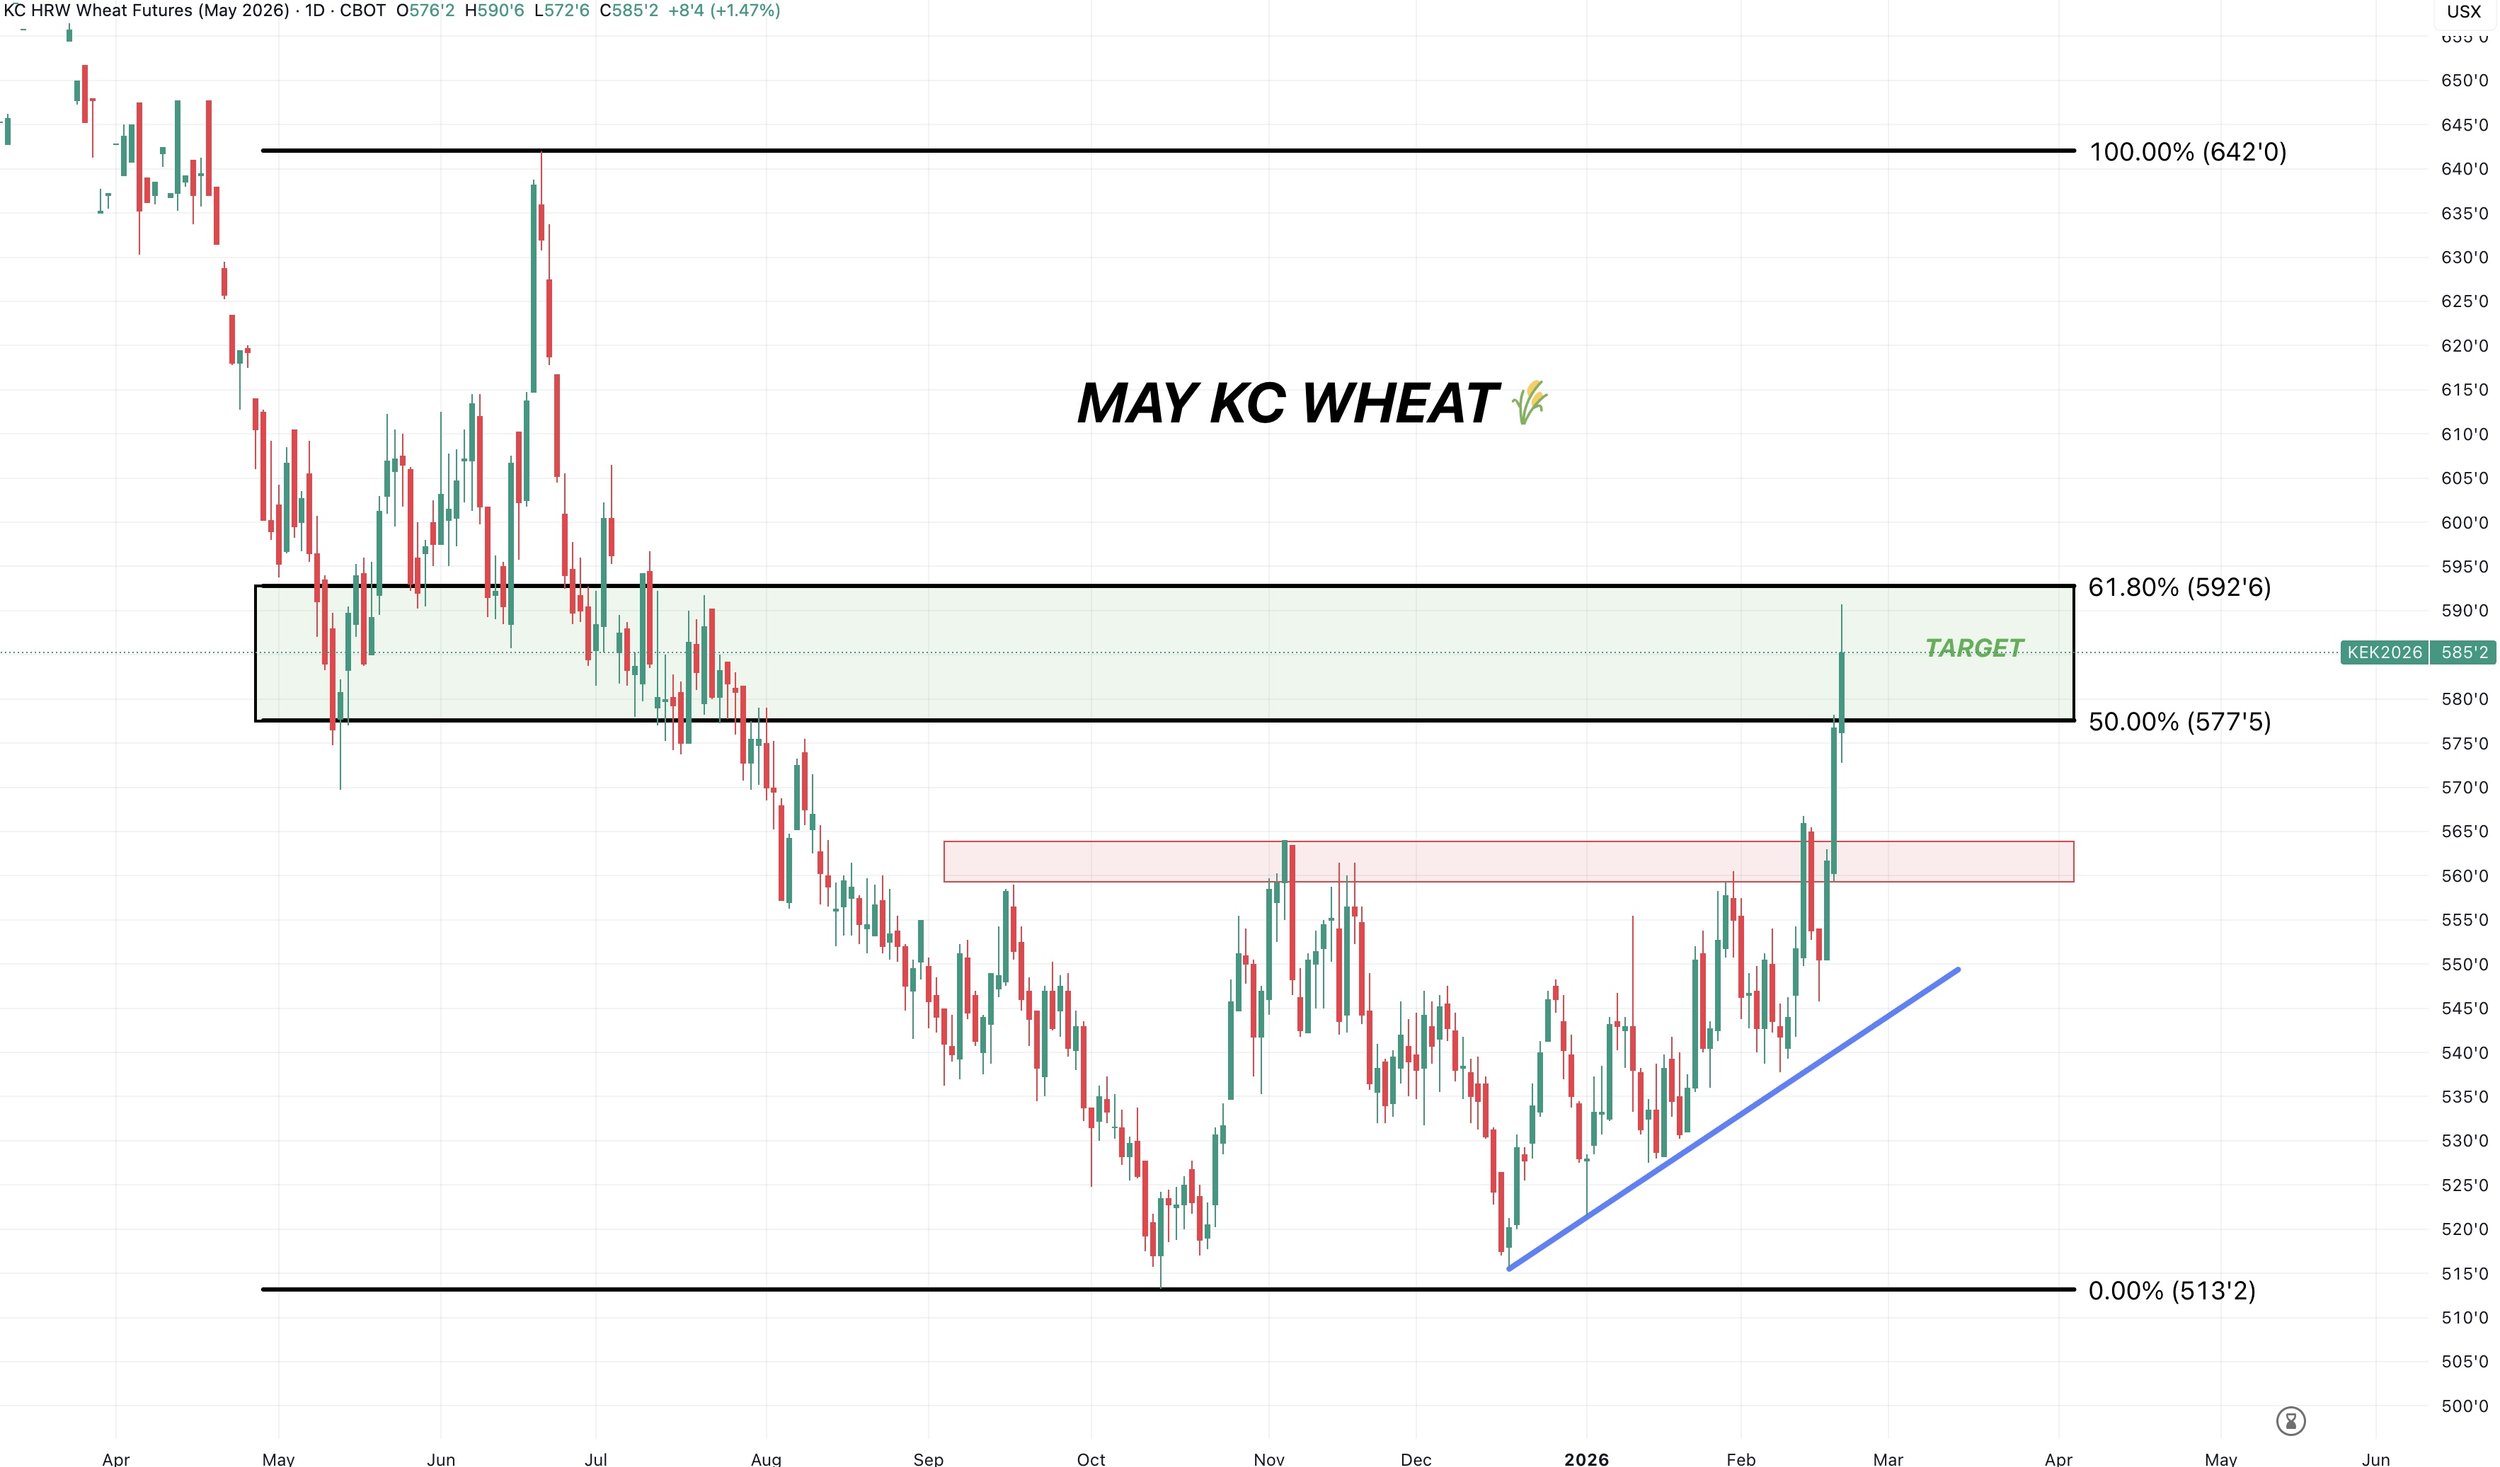
May KC:
Same story in May KC.
Right in that golden zone.
This was also prior support as well.
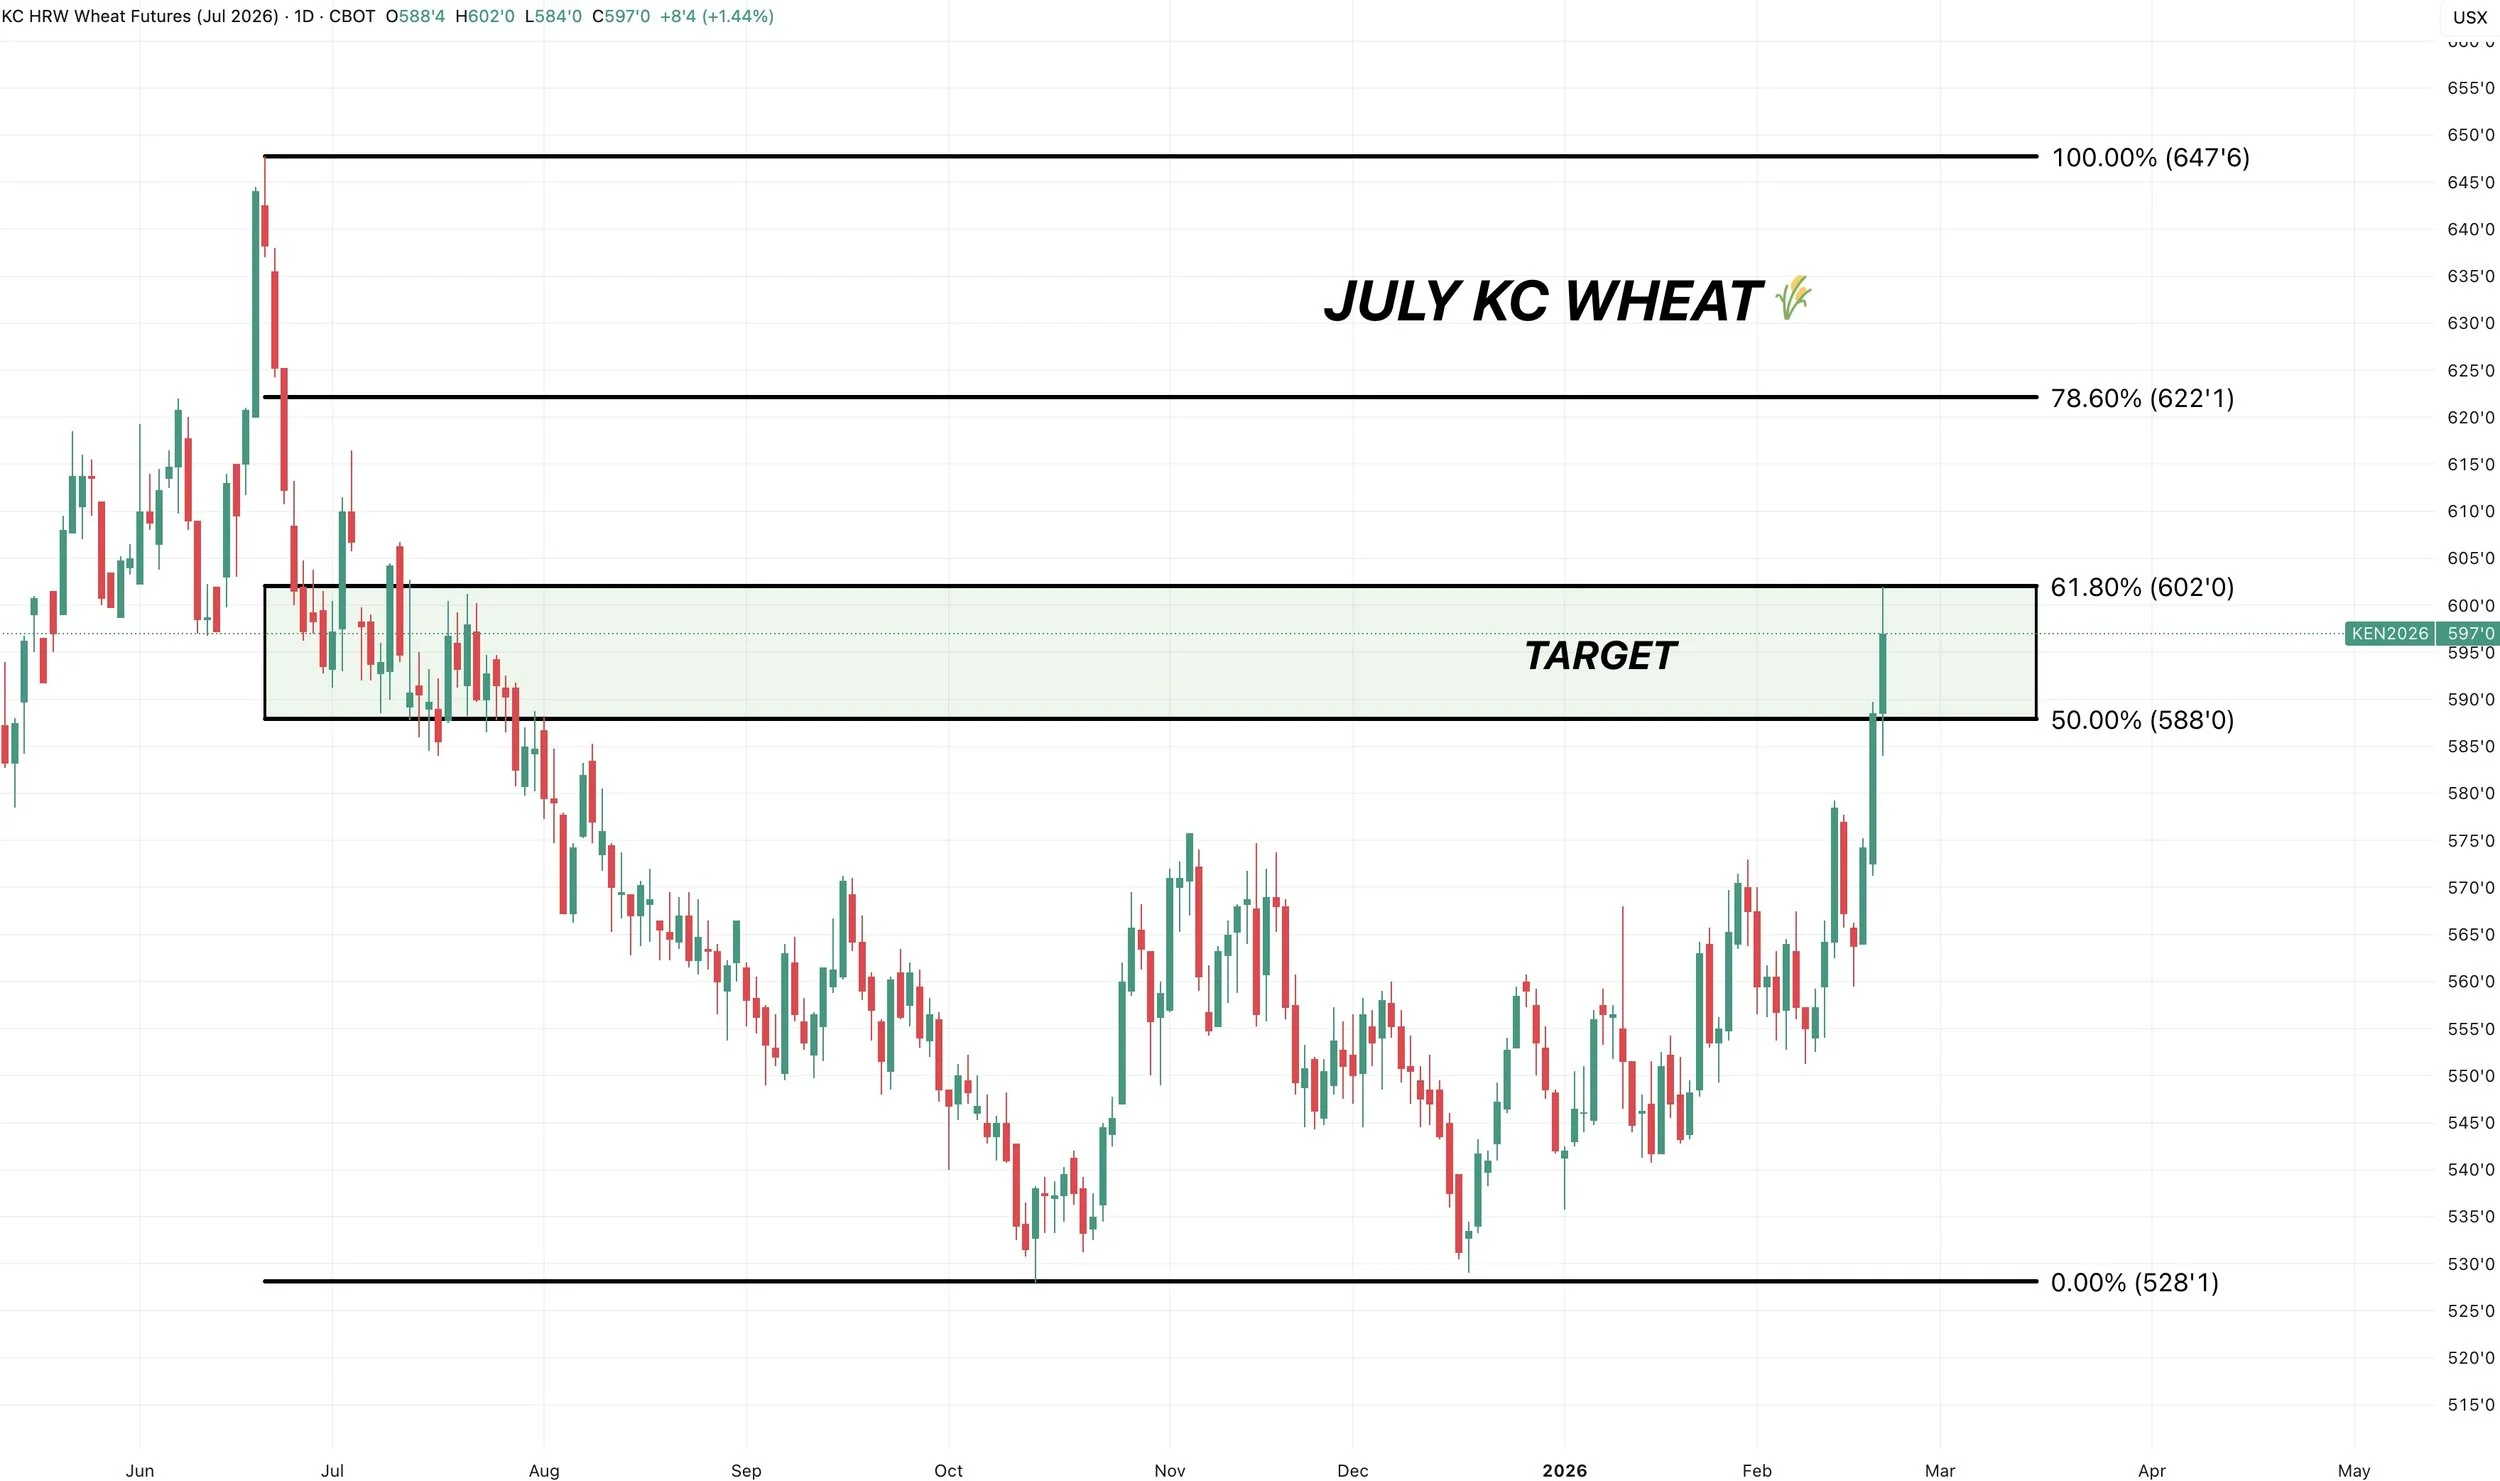
July KC:
Same thing in July KC.
We perfectly tagged the 61.8% level up to the June highs.
I am not claiming the rally is over.
I don’t think it is long term.
This is just where it makes sense to reward rallies, as they often fail here.
It's not about perfectly out guessing the market.
It's about taking risk off the table where it makes sense to do so. Areas where the risk to reward changes.
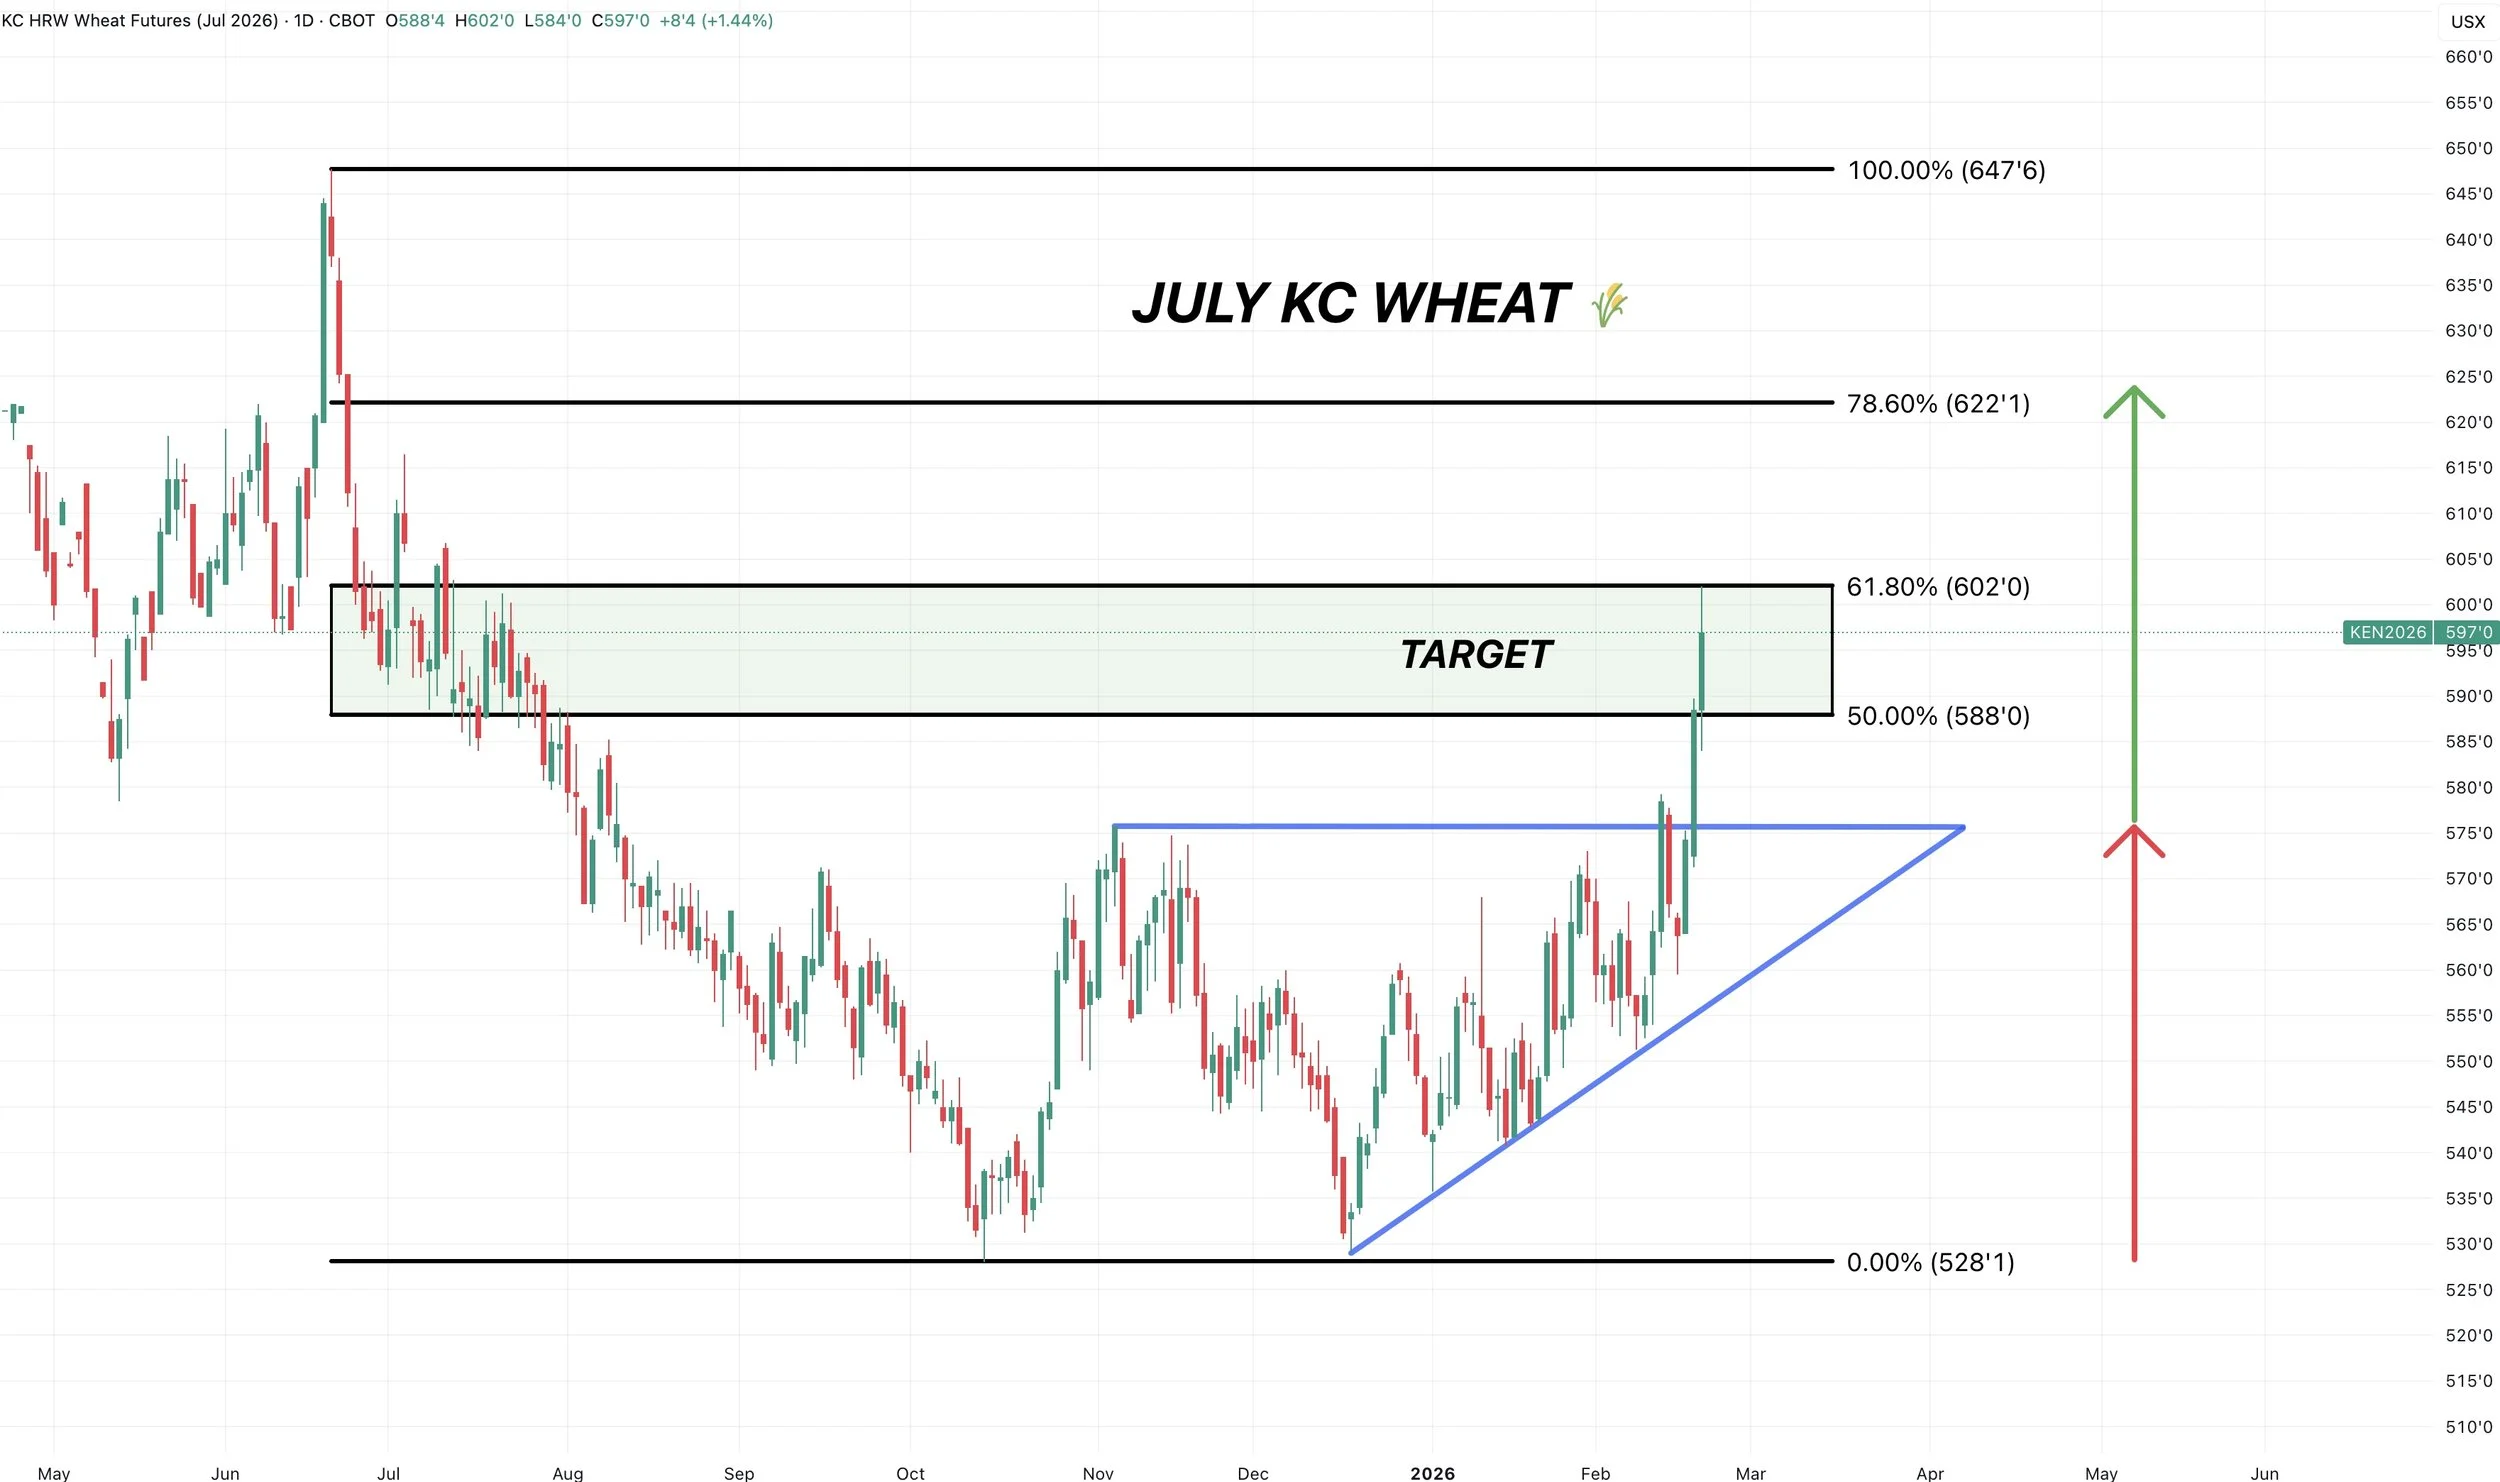
July KC: Next Target
Let's say the rally keeps going, or we get a correction first and then the rally continues.
Where is the next level we are looking at?
We have an ascending triangle pattern here.
The implied move takes you to $6.24 on July KC.
That also lines up with the next retracement level.
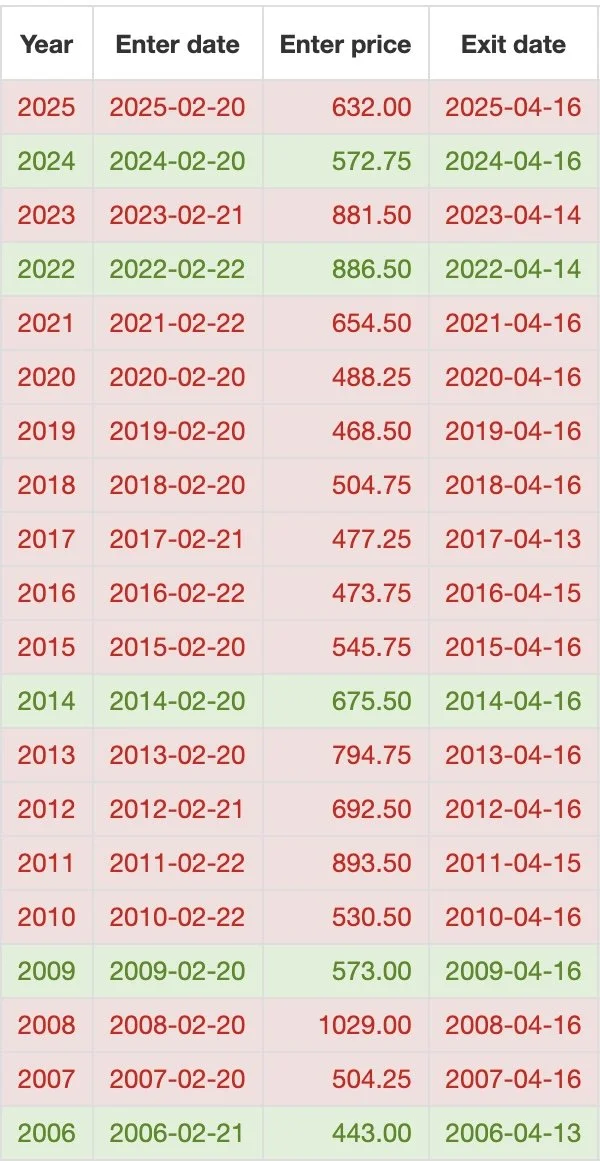
Seasonal March & April Weakness:
This is just something to keep in mind as we head into March.
The March to April timeframe often tends to be weak for the wheat market.
Here is the seasonal data from today until April 16th.
Lower 8 of 10 years (80%)
Lower 15 of 20 years (75%)
So it makes sense to reward this rally to a certain extent, especially if you do not have storage etc.
This doesn’t mean we can’t go higher here first, but by mid-Aprill we tend to find weakness.
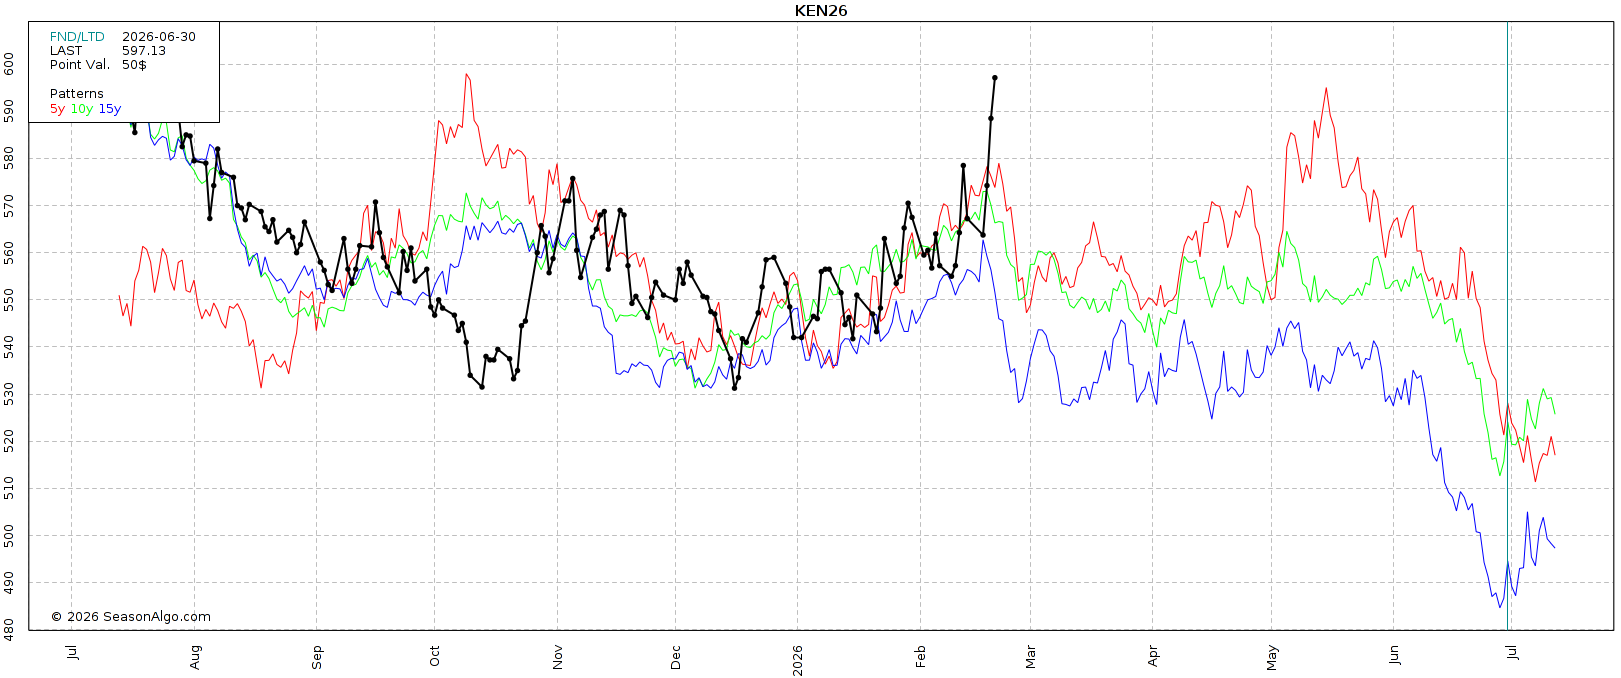
Here is the seasonal chart for July KC.
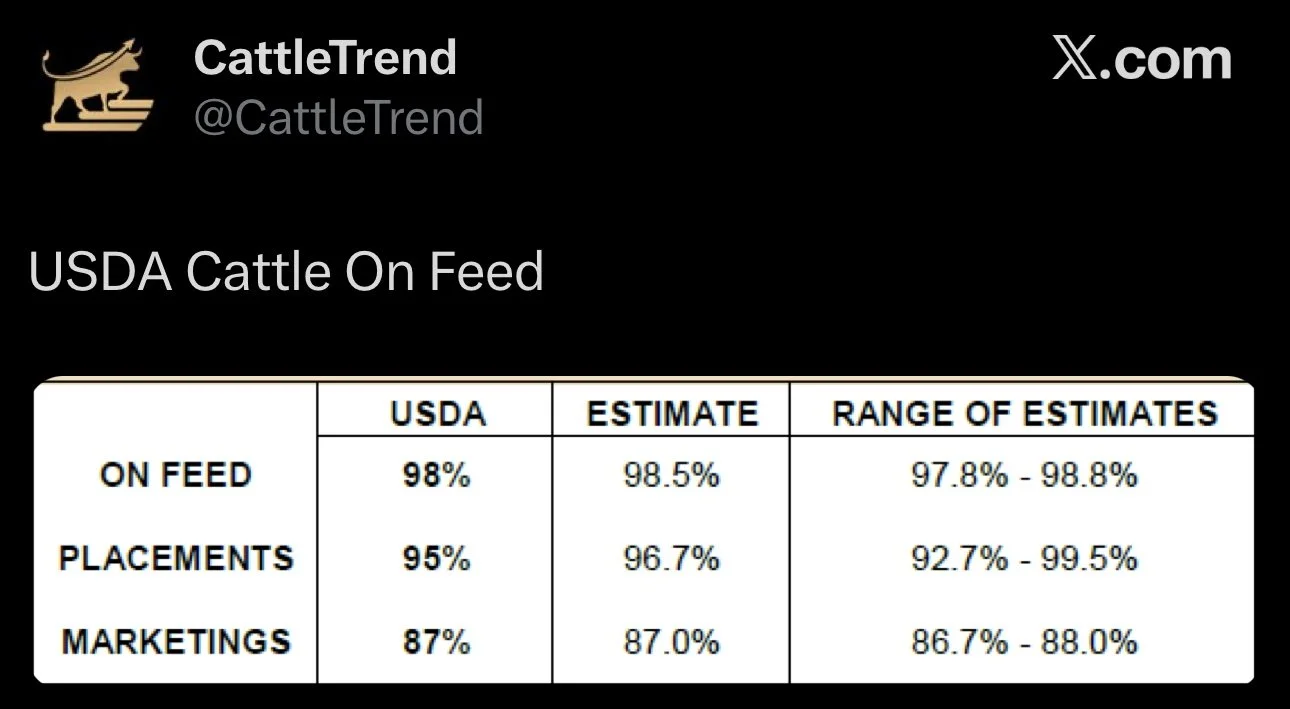
Cattle
We had the cattle on feed today after close.
Placements came in lower than expected, while marketings came in at the estimates.
So overall, the report was viewed as neutral.
Cash traded higher, which is supportive, but the COF shows we are placing more than we are killing and highlights the effort the packer is putting into slowing down the chain speed, with that expected to continue.
It's not working or they wouldn’t be paying up for cash. But they are trying to swing leverage. Estimated packer break even is negative $300/hd approximately.
I'm not going to go too much into cattle today, as I don’t want to keep today’s update too long.
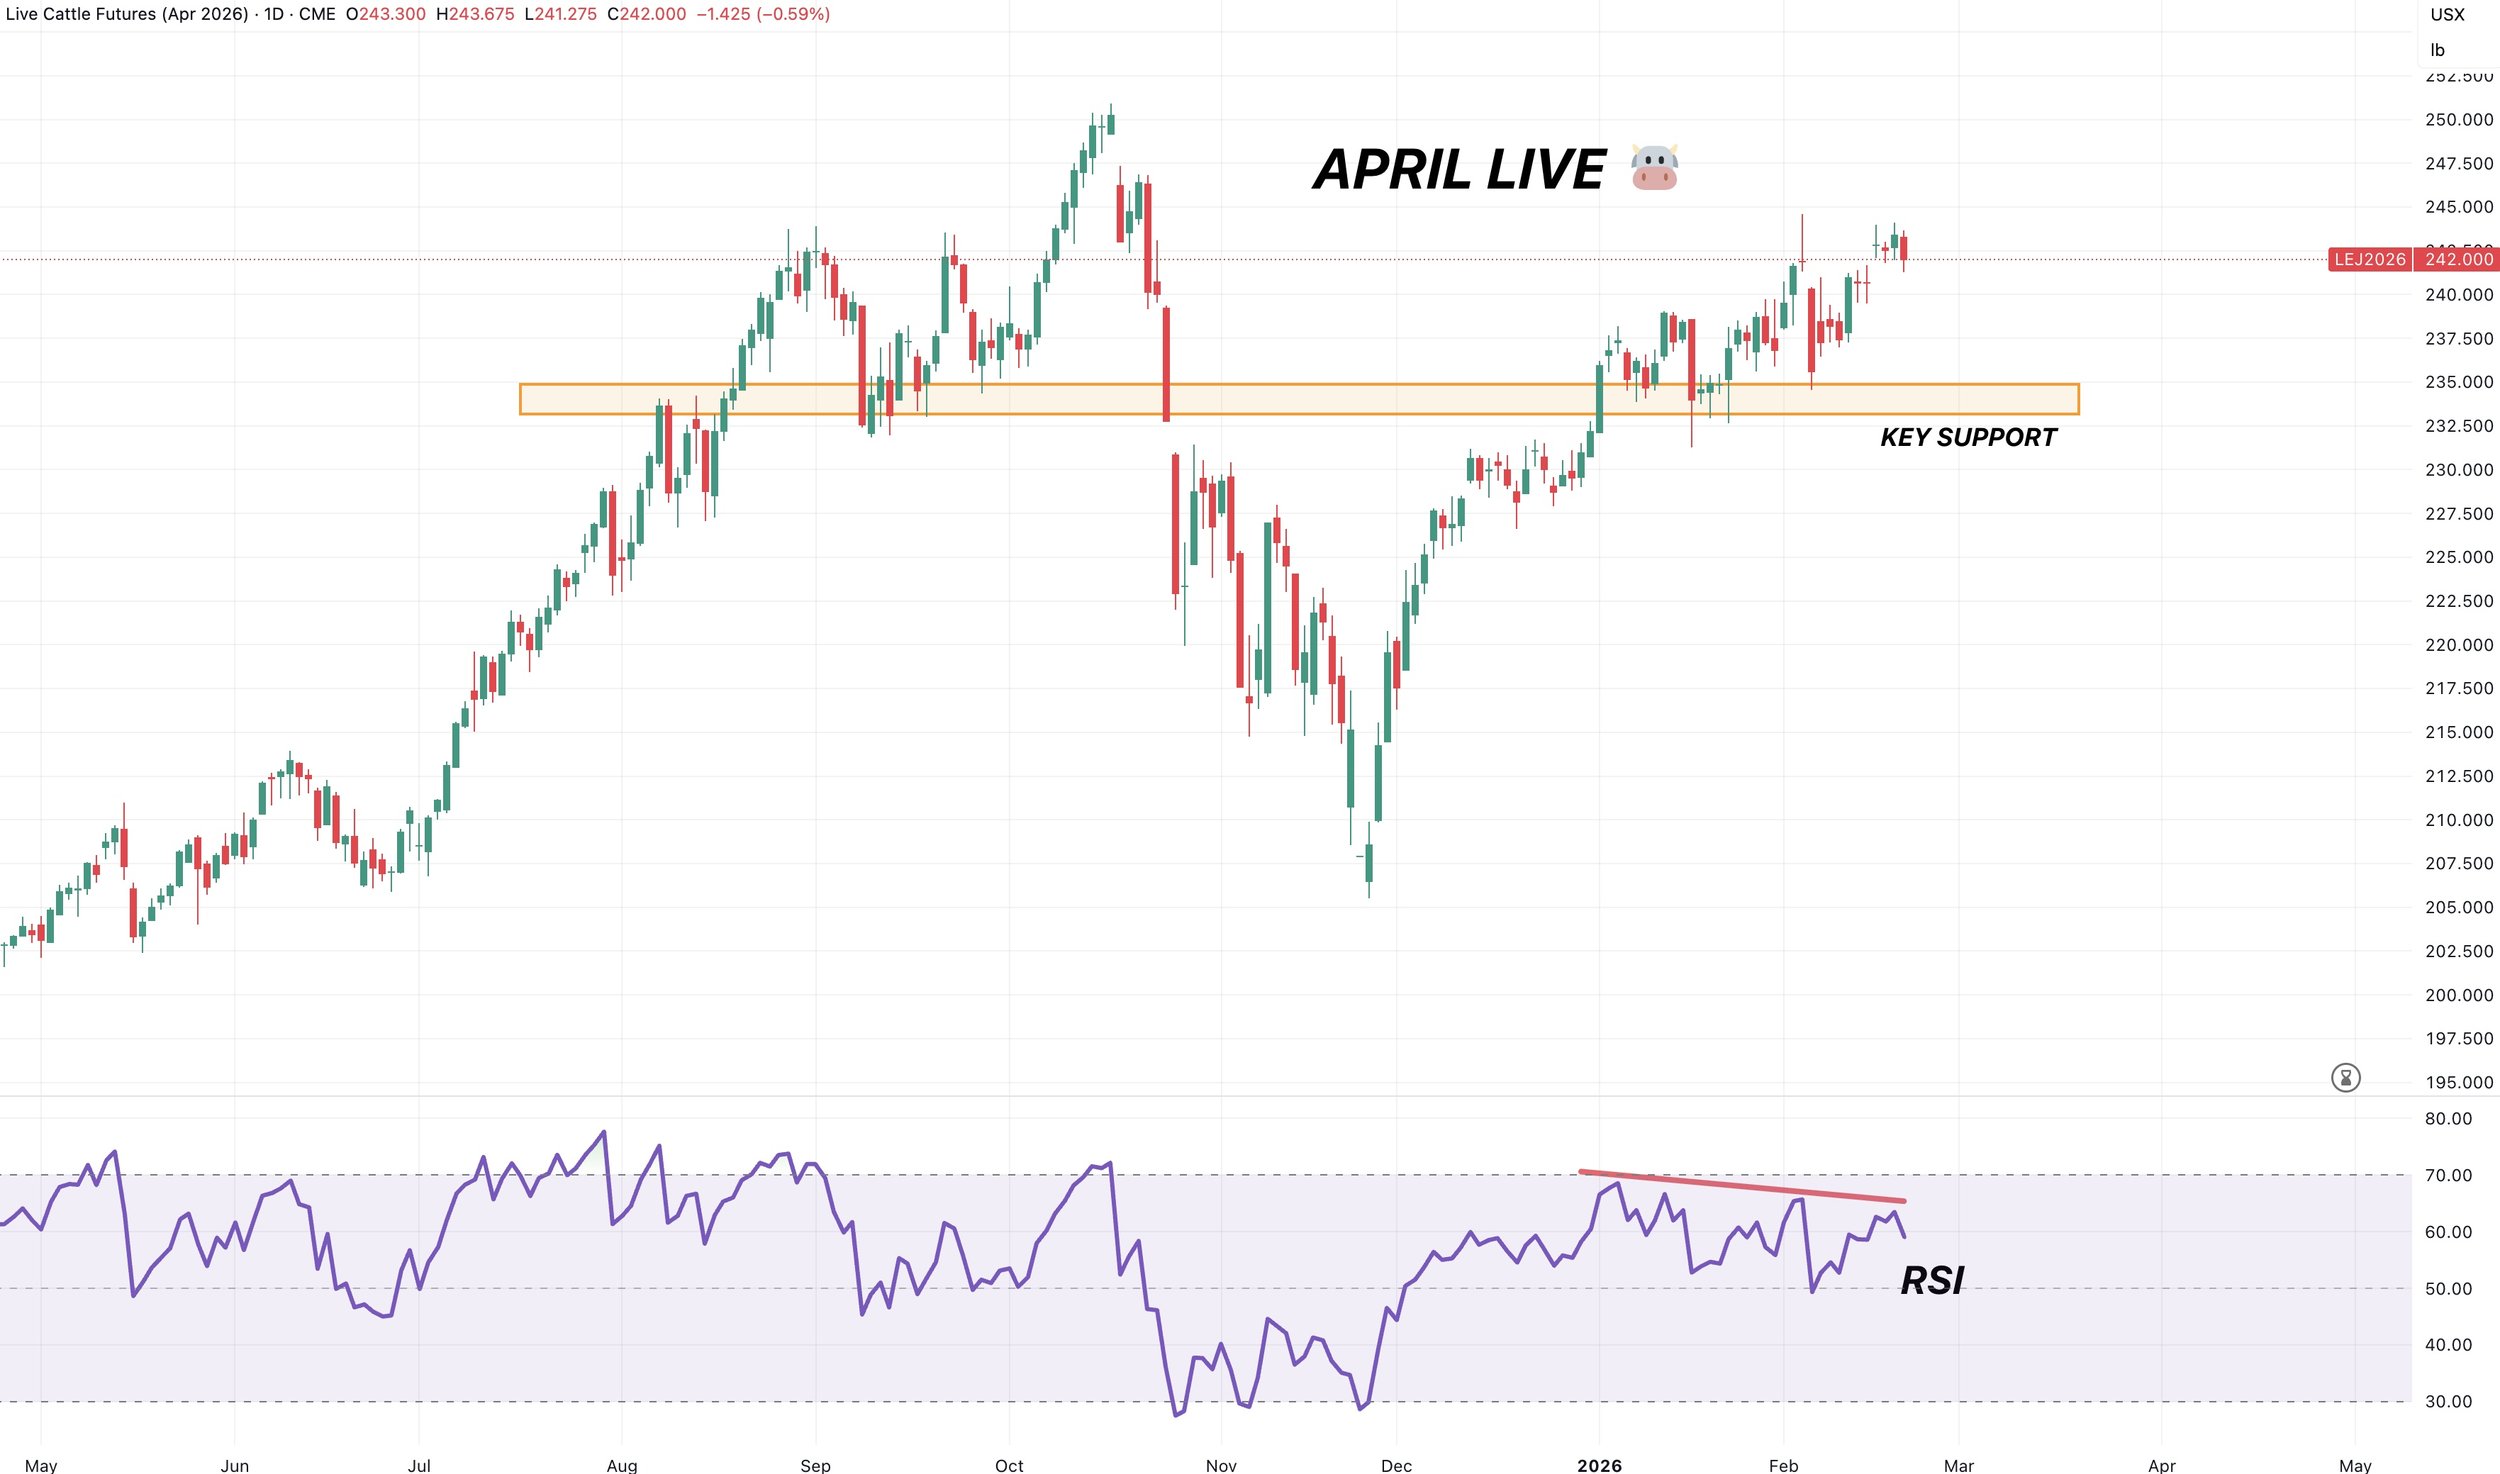
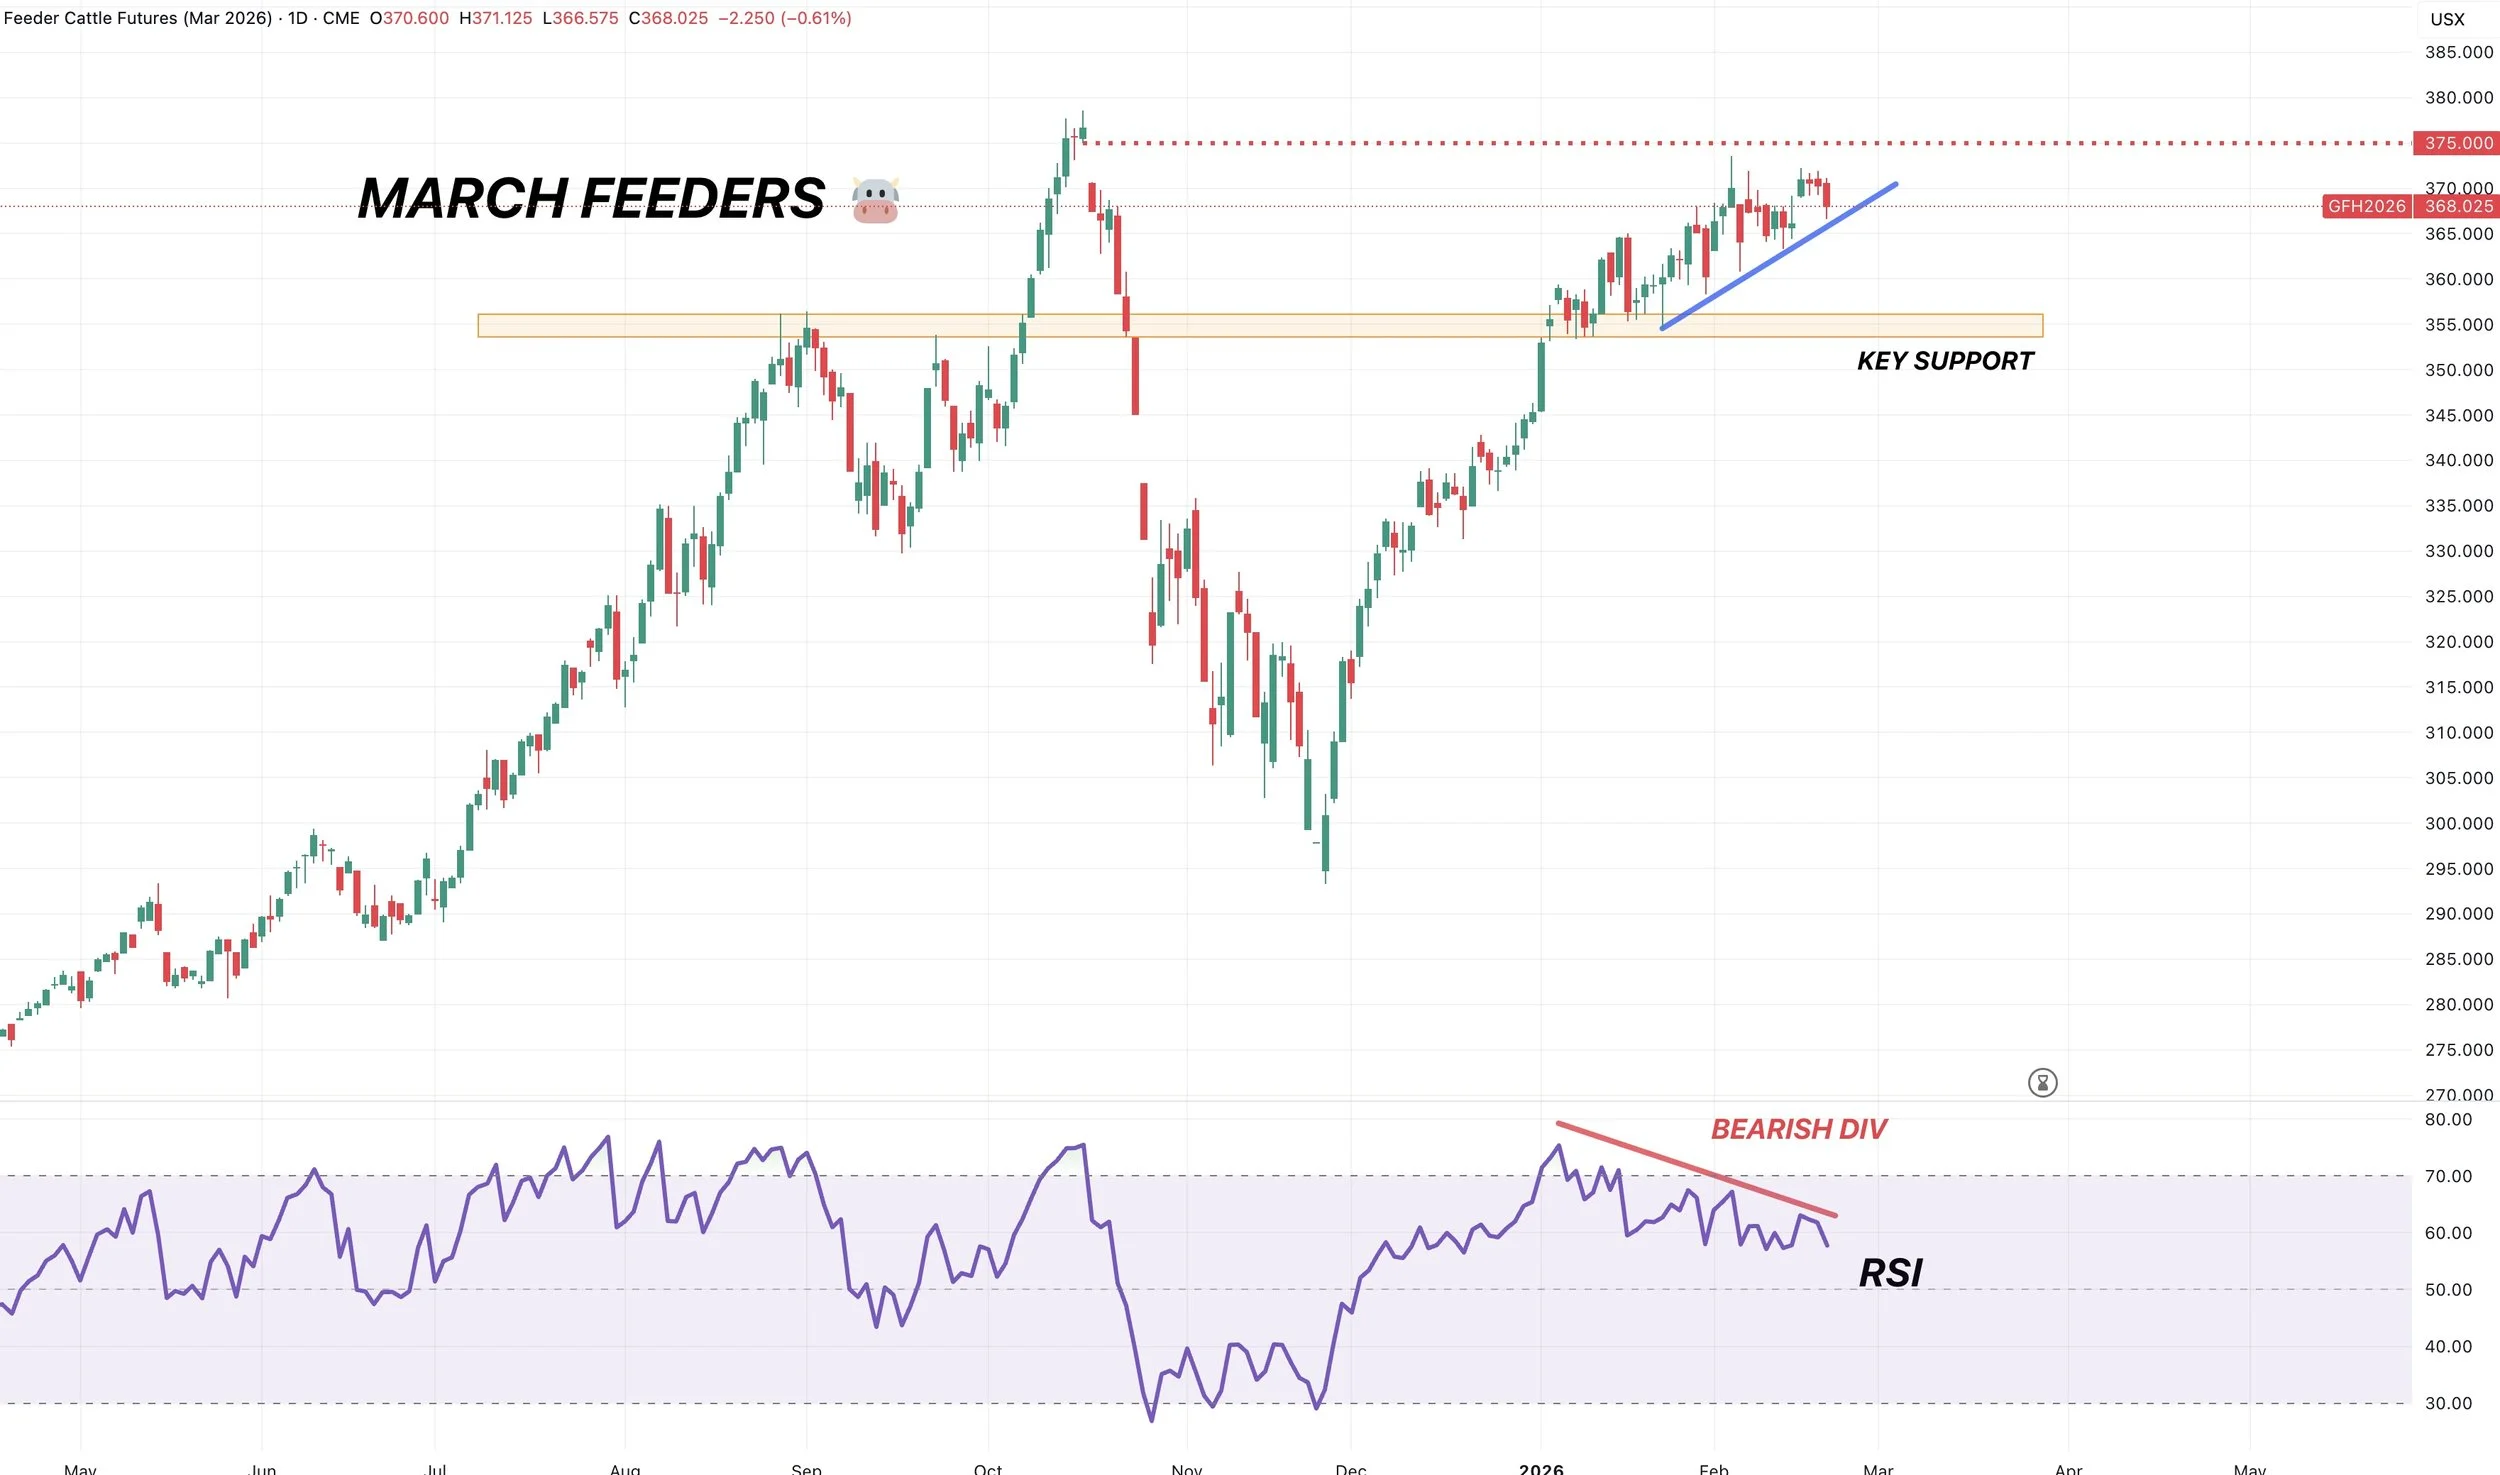
Purely based on the charts, it feels tired up here.
We had new cash highs in the feeder index, and we haven’t pushed higher.
Both feeders and live cattle still showing clear bearish divergence.
Simply makes sense to keep some downside protection with all of the headline risk.
April Live
March Feeders
Past Sell or Protection Signals
Feb 19th: 🌾
KC wheat sell signal & hedge alert.
Feb 6th: 🌽 🌱
Corn & soybean sell signal & hedge alert.
Feb 4th: 🌱
Soybean sell signal & hedge alert.
Dec 11th: 🐮
Cattle sell signal & hedge alert.
Dec 5th: 🐮
Cattle sell signal & hedge alert.
Nov 17th: 🌱
Soybean sell signal & hedge alert.
Nov 13th: 🌽 🌱
Managing risk in corn & beans ahead of USDA report.
Oct 28th: 🌽
Corn sell signal & hedge alert.
Oct 27th: 🌱
Soybean sell signal & hedge alert.
Oct 13th: 🐮
Cattle sell signal & hedge alert.
Aug 22nd: 🌱
Soybean sell signal & hedge alert.
July 31st: 🐮
Cattle sell signal & hedge alert.
July 10th: 🐮
Cattle sell signal & hedge alert.
CLICK HERE TO VIEW
June 5th: 🐮
Cattle sell signal & hedge alert.
June 2nd: 🌾
MPLS wheat sell signal.
April 10th: 🌽
Old crop corn sell signal.
March 19th: 🐮
Cattle hedge & sell signal.
Feb 18th: 🌽 🌾
Old crop KC wheat & old crop corn signal.
Jan 23rd: 🌽 🌱
Corn & beans old crop sell signal.
CLICK HERE TO VIEW
Jan 15th: 🌽 🌱
Corn & beans hedge alert/sell signal.
Jan 2nd: 🐮
Cattle hedge alert at new all-time highs & target.
Dec 11th: 🌽
Corn sell signal at $4.51 200-day MA
CLICK HERE TO VIEW
Oct 2nd: 🌾
Wheat sell signal at $6.12 target
Sep 30th: 🌽
Corn protection signal at $4.23-26
Sep 27th: 🌱
Soybean sell & protection signal at $10.65
Sep 13th: 🌾
Wheat sell signal at $5.98
May 22nd: 🌾
Wheat sell signal when wheat traded +$7.00
Want to Talk?
Our phones are open 24/7 for you guys if you ever need anything or want to discuss your operation.
Hedge Account
Interested in a hedge account? Use the link below to set up an account or shoot Jeremey a call at (605)295-3100.