
DEEP DIVE INTO USDA: HOW BEARISH FOR CORN?
MARKET UPDATE
You can scroll to read the usual update as well. As the written version is the exact same as the video.
Timestamps for video:
Overview: 0:00min
Corn: 0:40min
Beans: 10:00min
Wheat: 13:10min
Cattle: 15:10min
Want to talk about your situation?
(605)250-3863
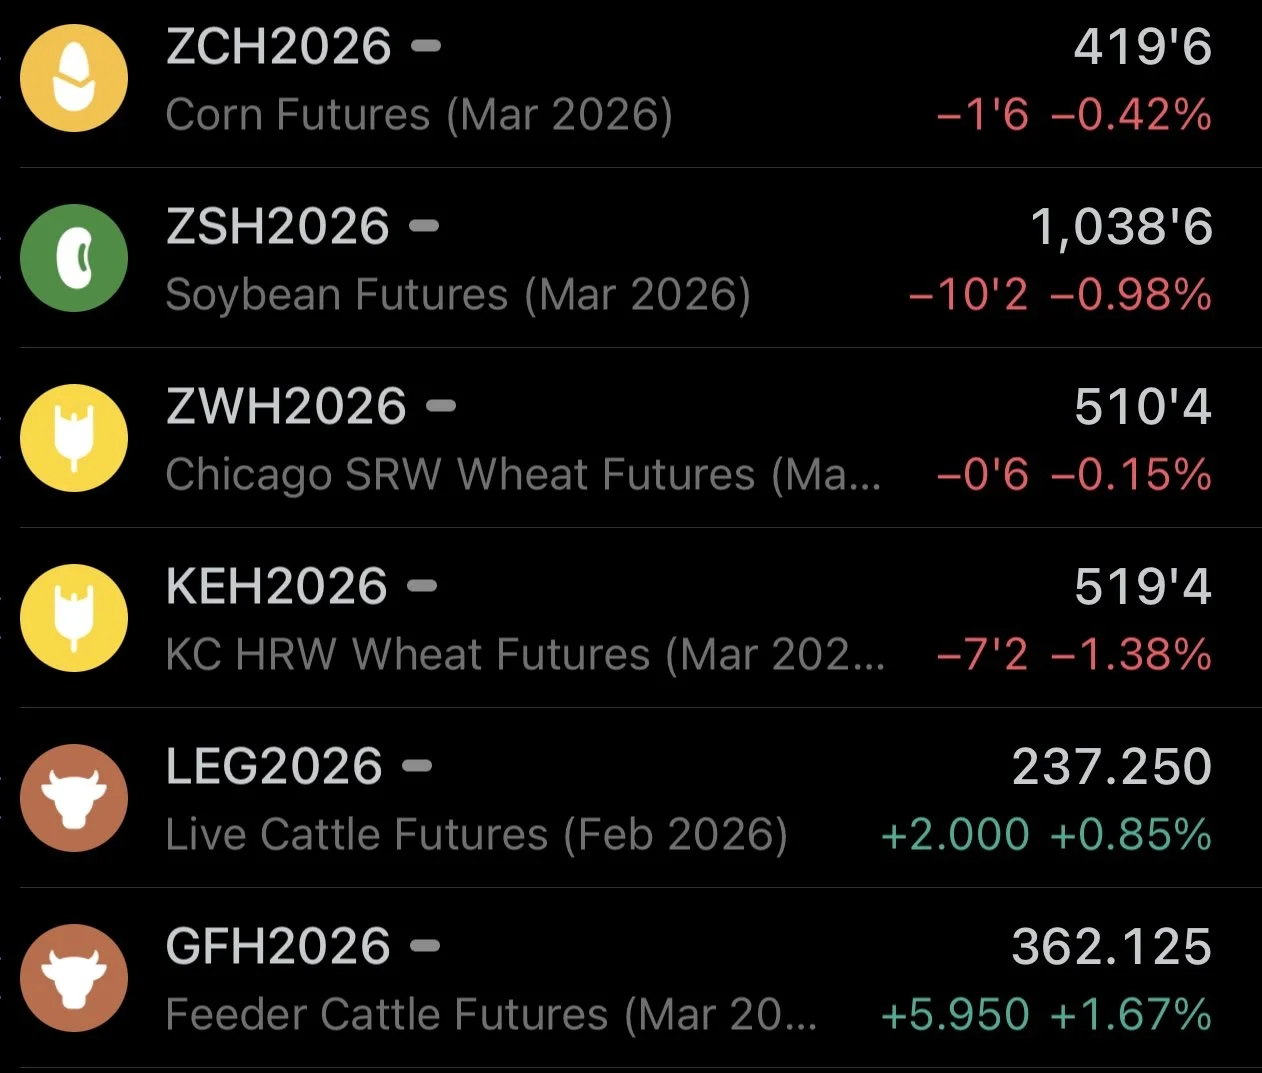
Futures Prices Close
Overview
Grains lower while cattle continues to run.
Yesterday's report was a memorbale one, and not in a good way.
It was bearish across the board. Production came in higher than estimates everywhere, and wheat plantings even came in higher than expected.
It caught almost everyone off guard.
It was the most bearish report in over a decade for the corn market.
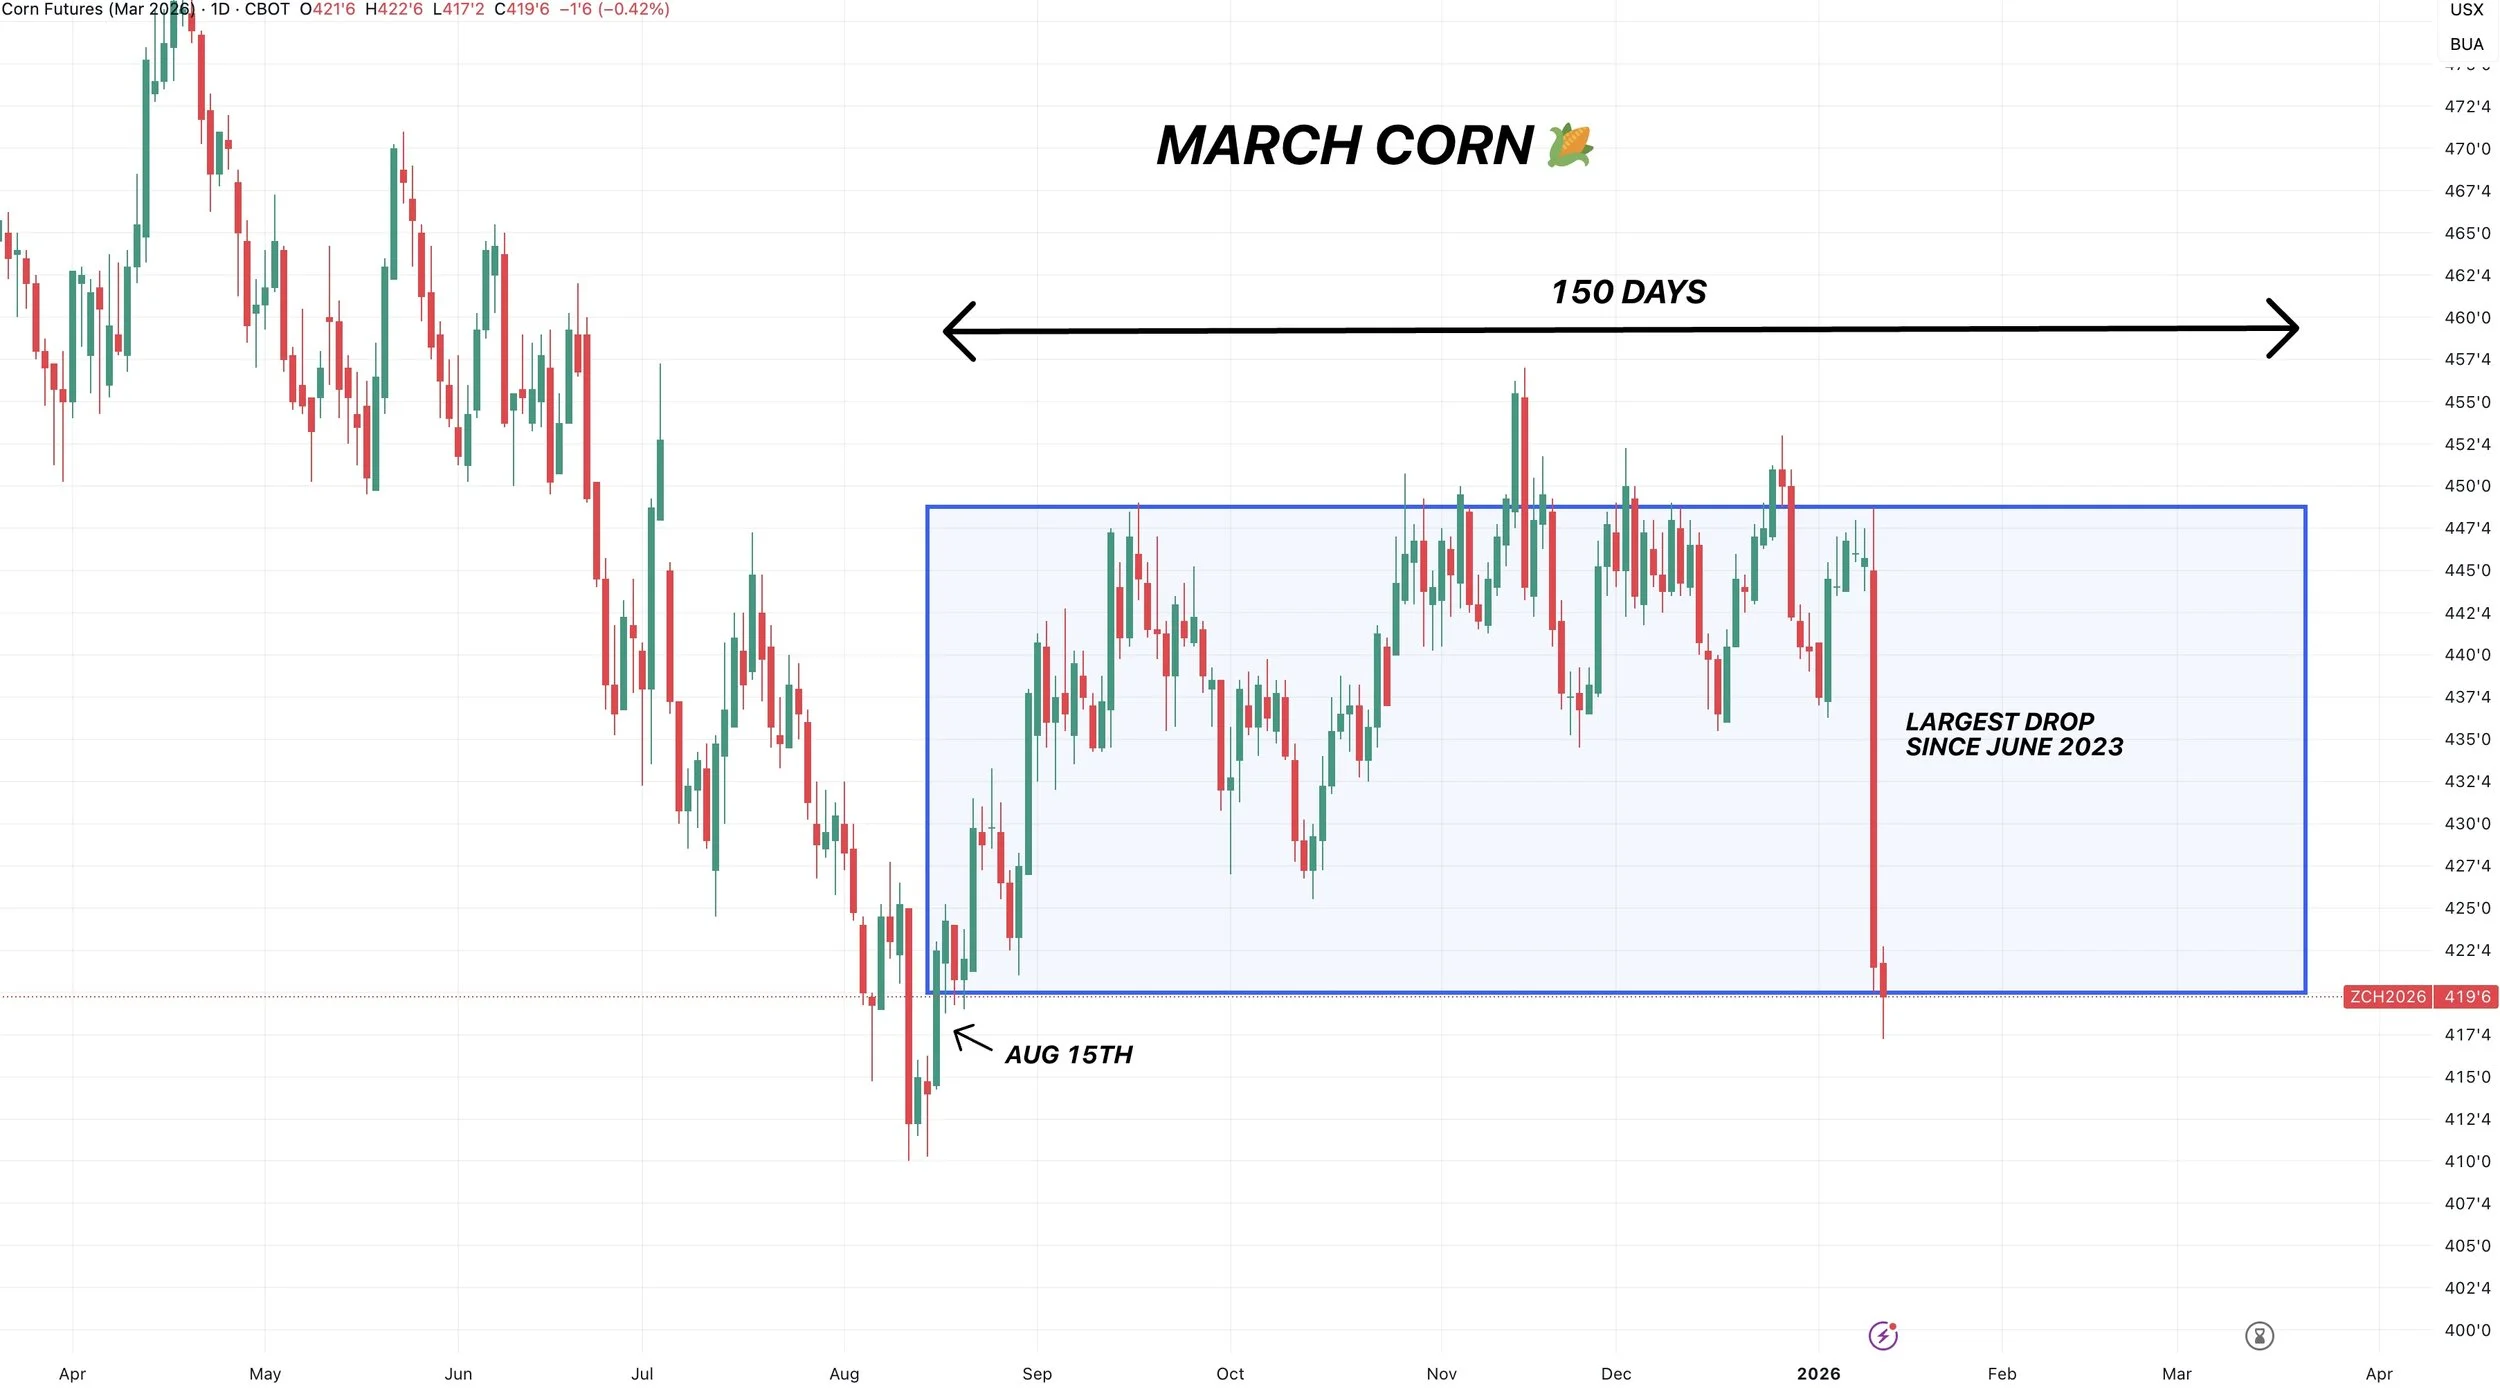
Yesterday corn saw it's largest daily loss since June 2023.
In one single candle, we wiped out the past 150 days of price action.
Let's jump right into the corn section and go through this report and what it means moving forward.
Today's Main Takeaways
Corn
Fundamentals:
Well, I didn’t have yesterday's USDA numbers on my bingo card.
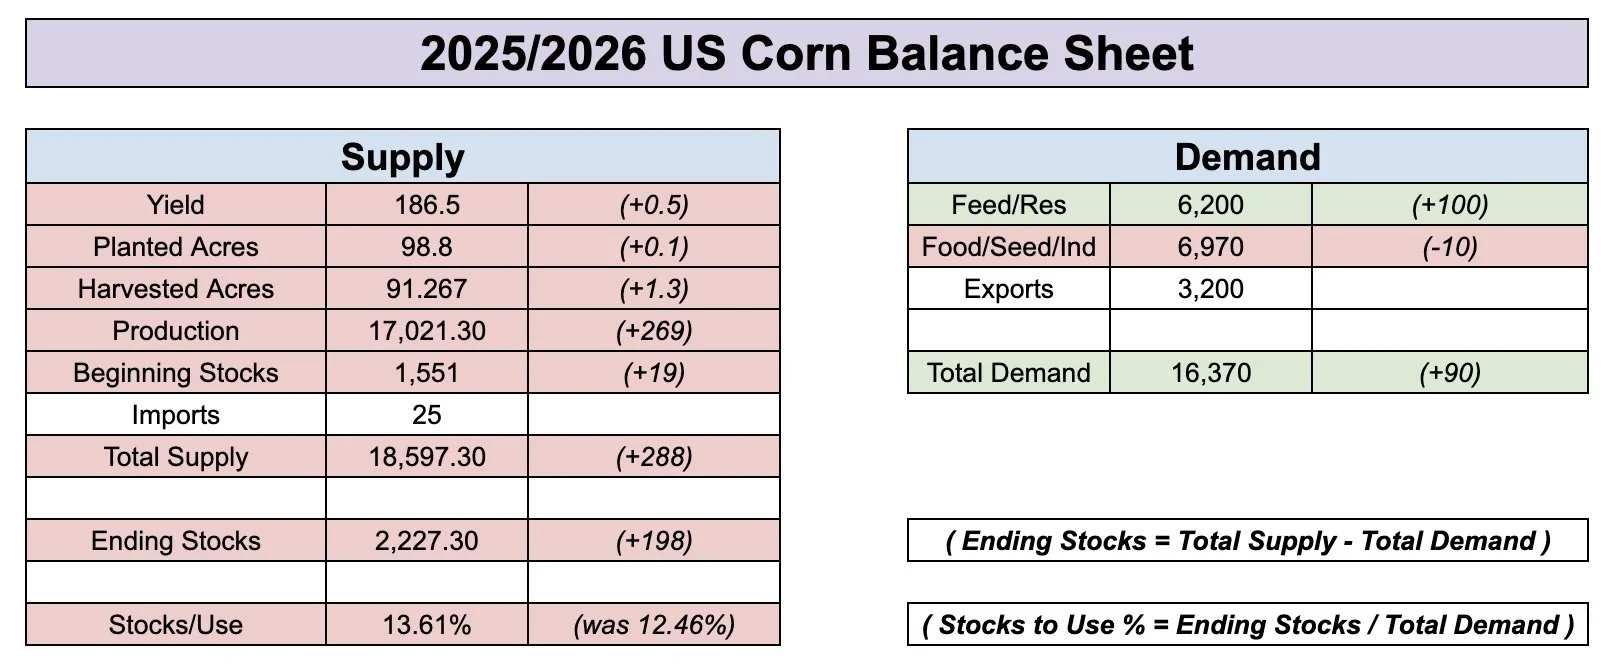
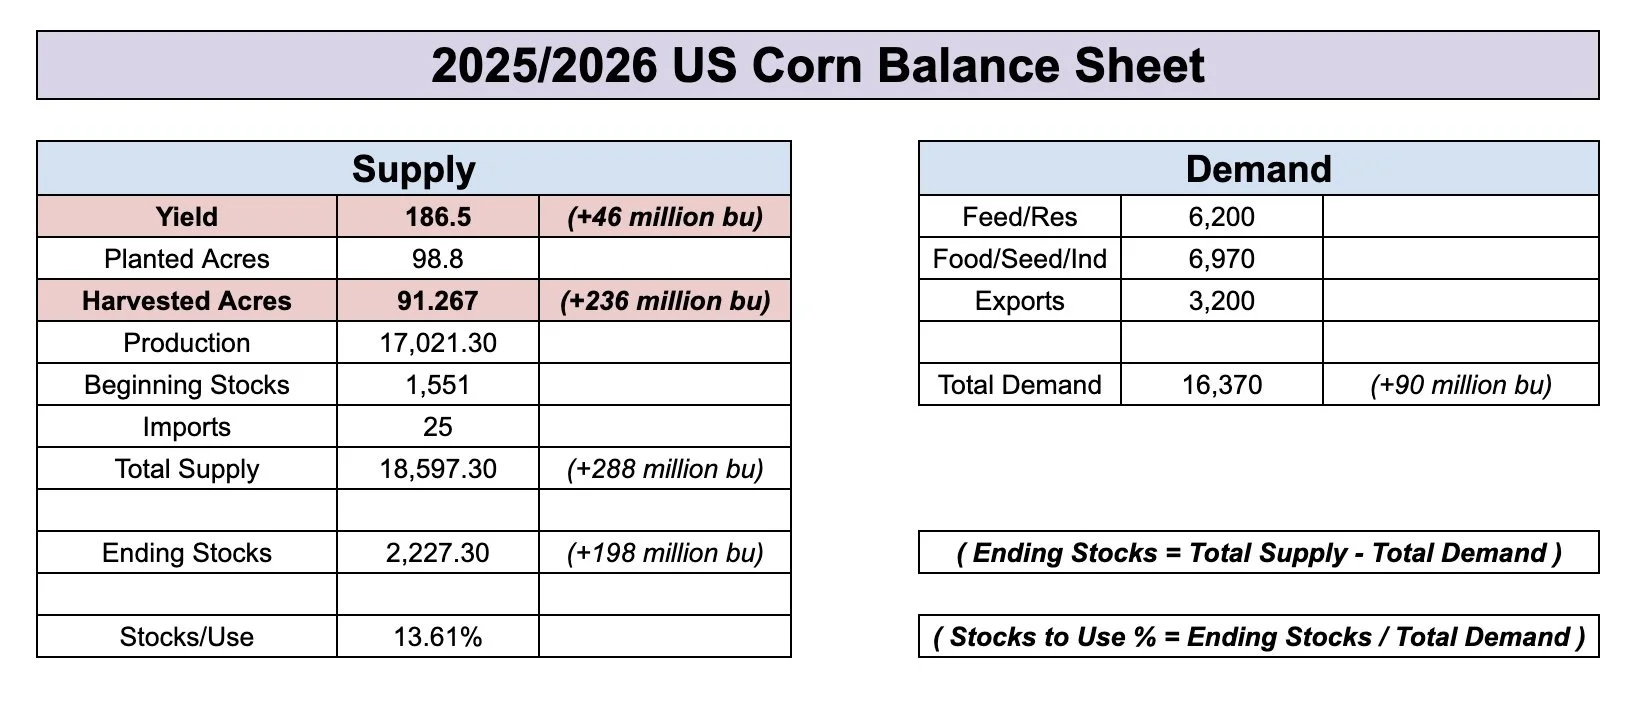
Here are the complete balance sheet changes.
This report was about worst case possible for the corn market.
It was actually the most bearish report in 14 years.
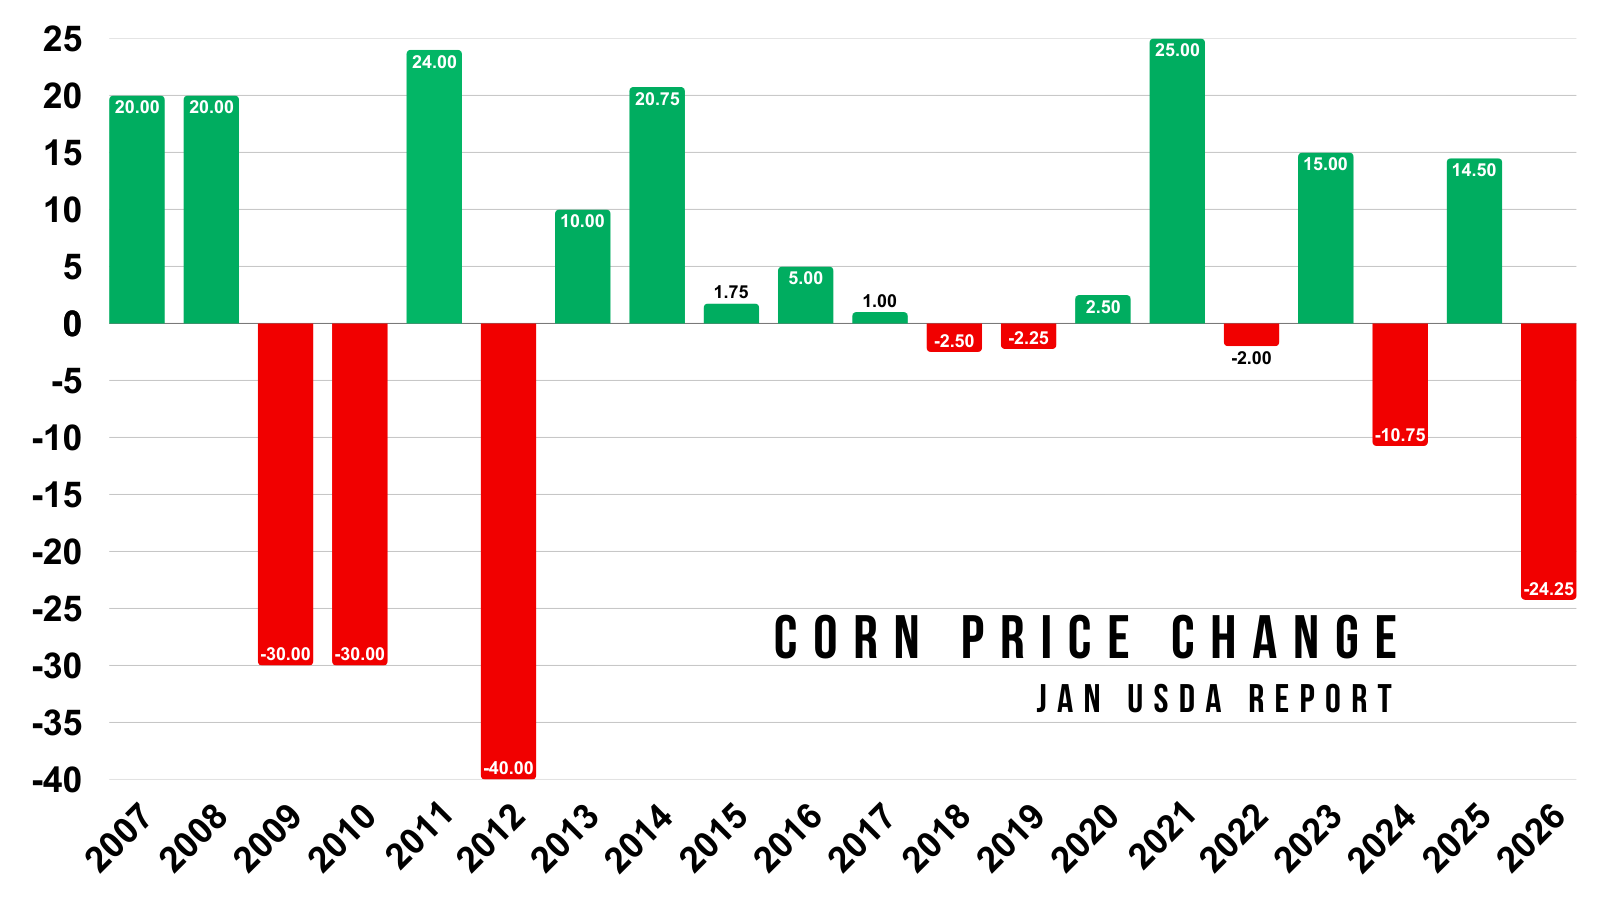
Here is the past price changes.
It resulted in the biggest sell off for the day of this report since 2012.
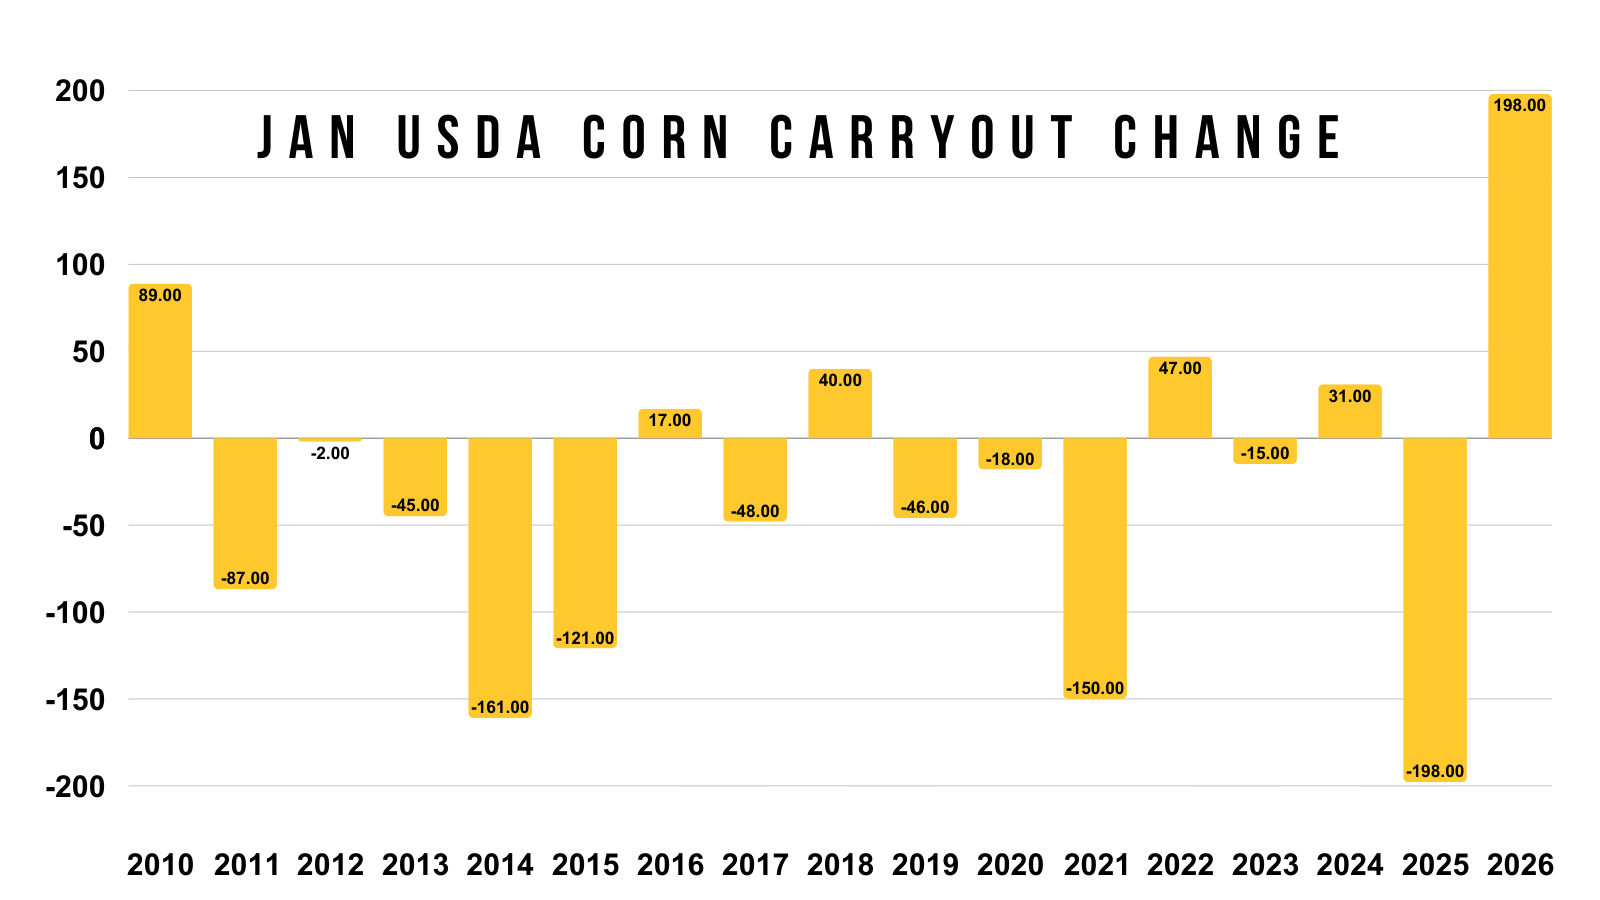
Here is the past carryout changes for this report.
Yesterday was the biggest increase to carryout we've seen in this report in over a decade.
They increased carryout by nearly +200 million bushels.
We've only seen one other year that resulted in over a +50 million bushel increase.
Clearly, this report is in a world of it's own the last decade.
As you all know, the USDA chose to actually raise yield up to 186.5 bpa.
Almost everyone thought yield would be coming down, some thought it could be a rather drastic change.
Even Arlan of StoneX who had this 186 guess back during the summer, recently said he thought yield was 182 and wouldn’t be surprised if it was even lower.
So everyone was surprised.
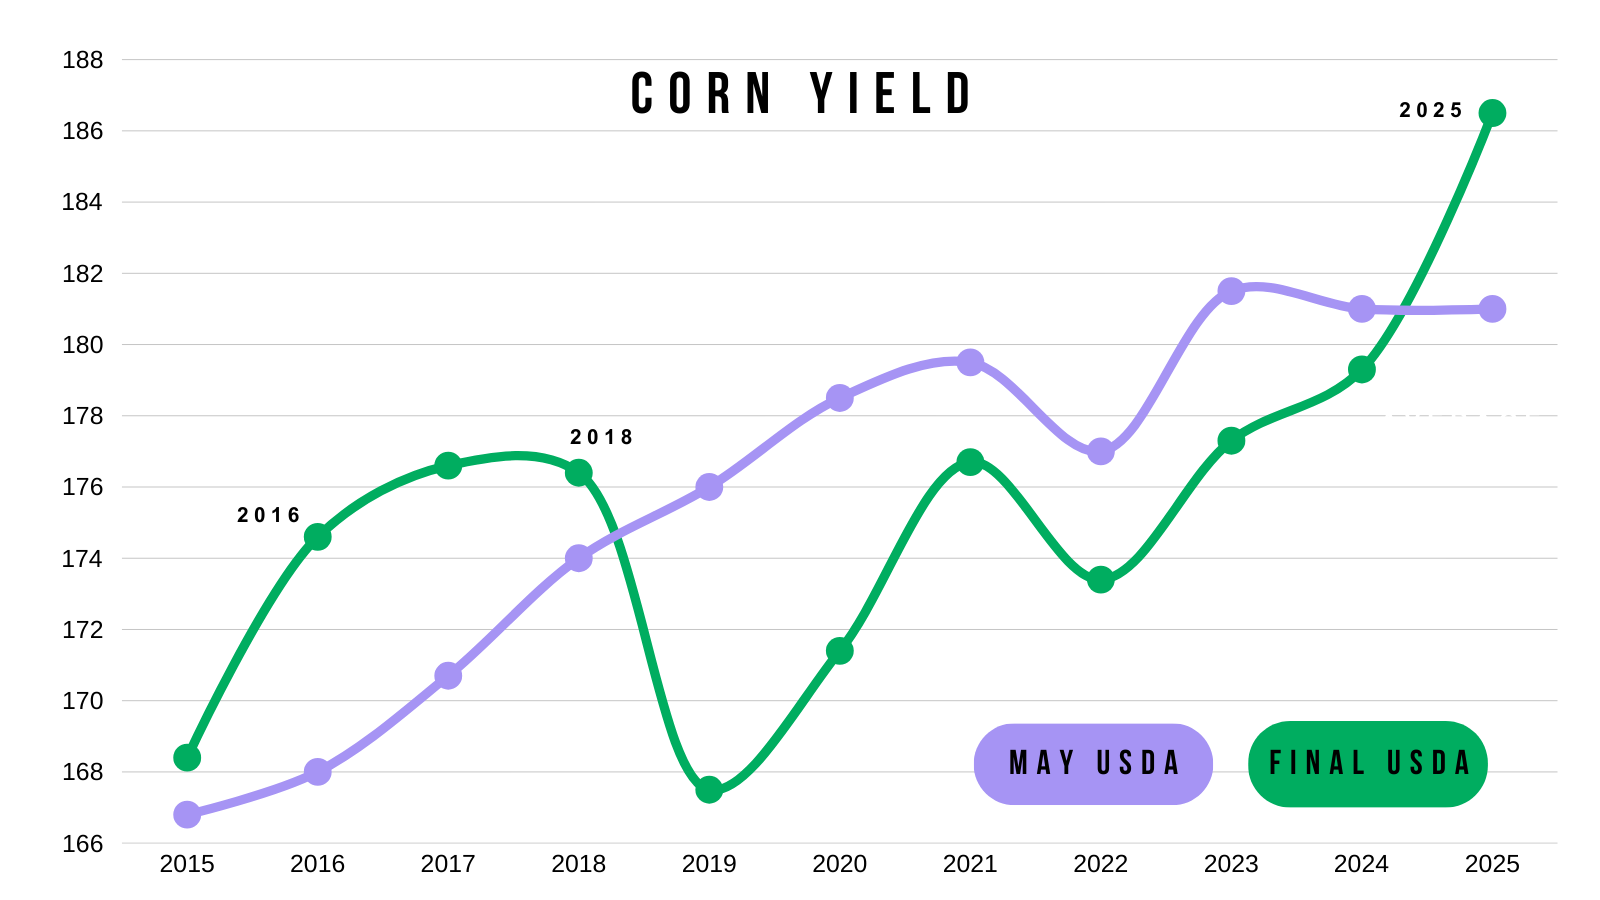
Here is a chart showing May vs final yield.
For the first time since 2018, our final yield came in higher than the orginal May estimate.
186.5 vs the orginal 181 (+5.5 bpa).
Not only did the USDA raise yield.. they also added acres.
Planted acres only rose 100k, but harvested acres jumped a large 1.3 million...
This was an even larger surprise than the yield.
And it's a more bearish factor than the yield.
Just to put it into perspective:
That 1.3 million acres added an EXTRA 236 million bushels of supply to the balance sheet.
The 0.5 bpa increase to yield only rose supply by 46 million bushels.
Not only did yield increase, but they found more acres which provided an even bigger blow.
The numbers the USDA gives us are the numbers we have to deal with.
Yes it sucks. But none of us can do anything about it whether we agree with their methodology or not.
Regardless, it is getting harder and harder to defend them when they've been incredibly inconsistent with their data the last year or two.
It's no secret that the USDA is understaffed, so you have to wonder if that is starting to show in their work.
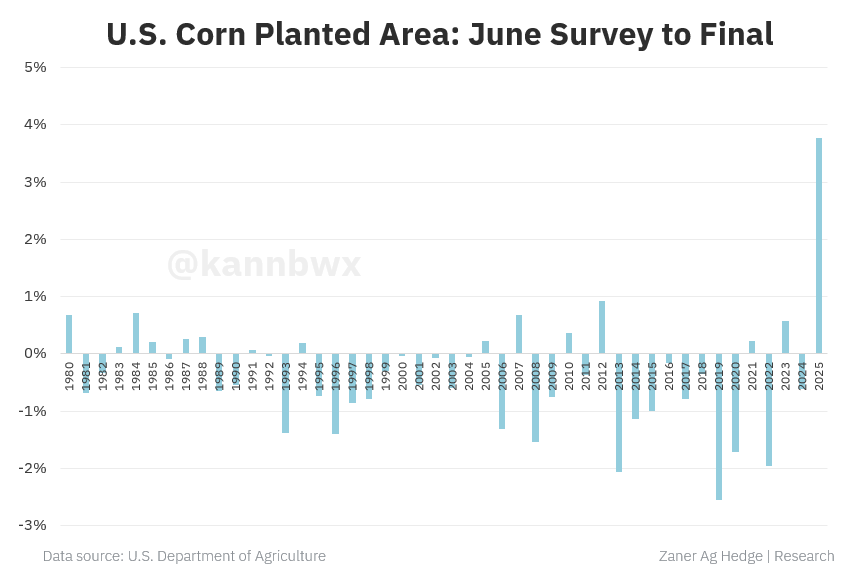
Here is a fantastic chart from Karen Braun of Zaner Hedge.
This shows corn planted area from June to final.
A completely unprecedented miss.
This has still yet to be explained.
Since the USDA added so much supply, they naturally had to balance the balance sheet to prevent our carryout from getting too large.
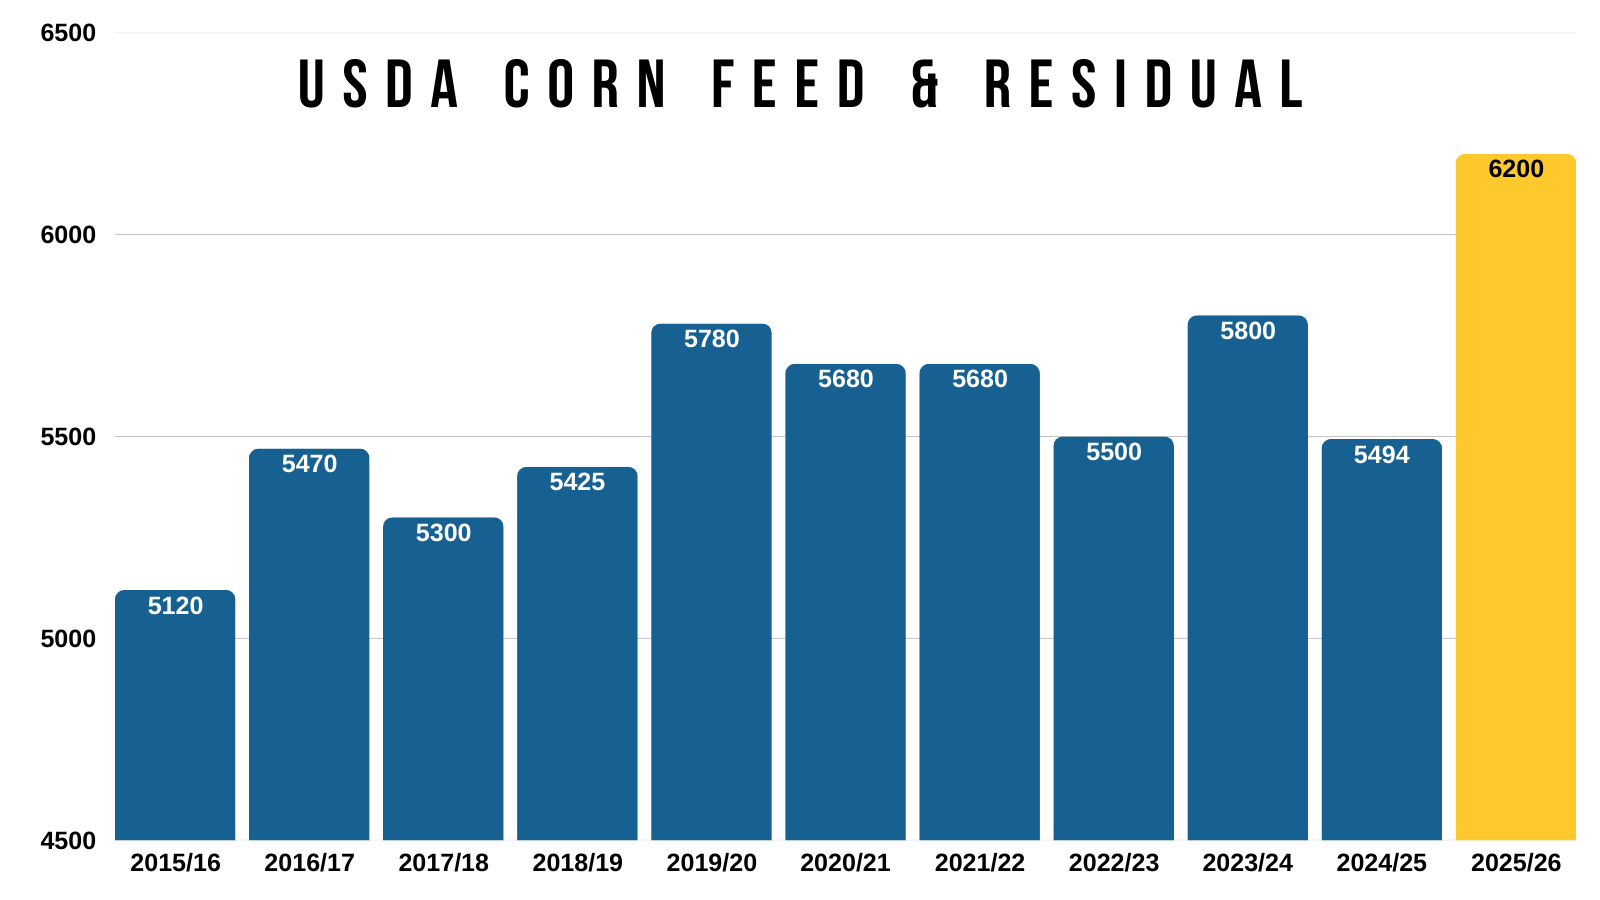
What they did was raise feed and residual by another +100 million bushels.
While leaving our export demand completely unchanged.
Almost everyone would agree this just makes no sense.
Most agree feed usage is too high to begin with.
What argument would justify feed demand being +700 million higher than last year when we have fewer animals on feed?
We have never seen this type of increase before.
The USDA is using this as a toy number so they can hide other data in there. Next year we are going to be wondering why they dropped the feed usage number.
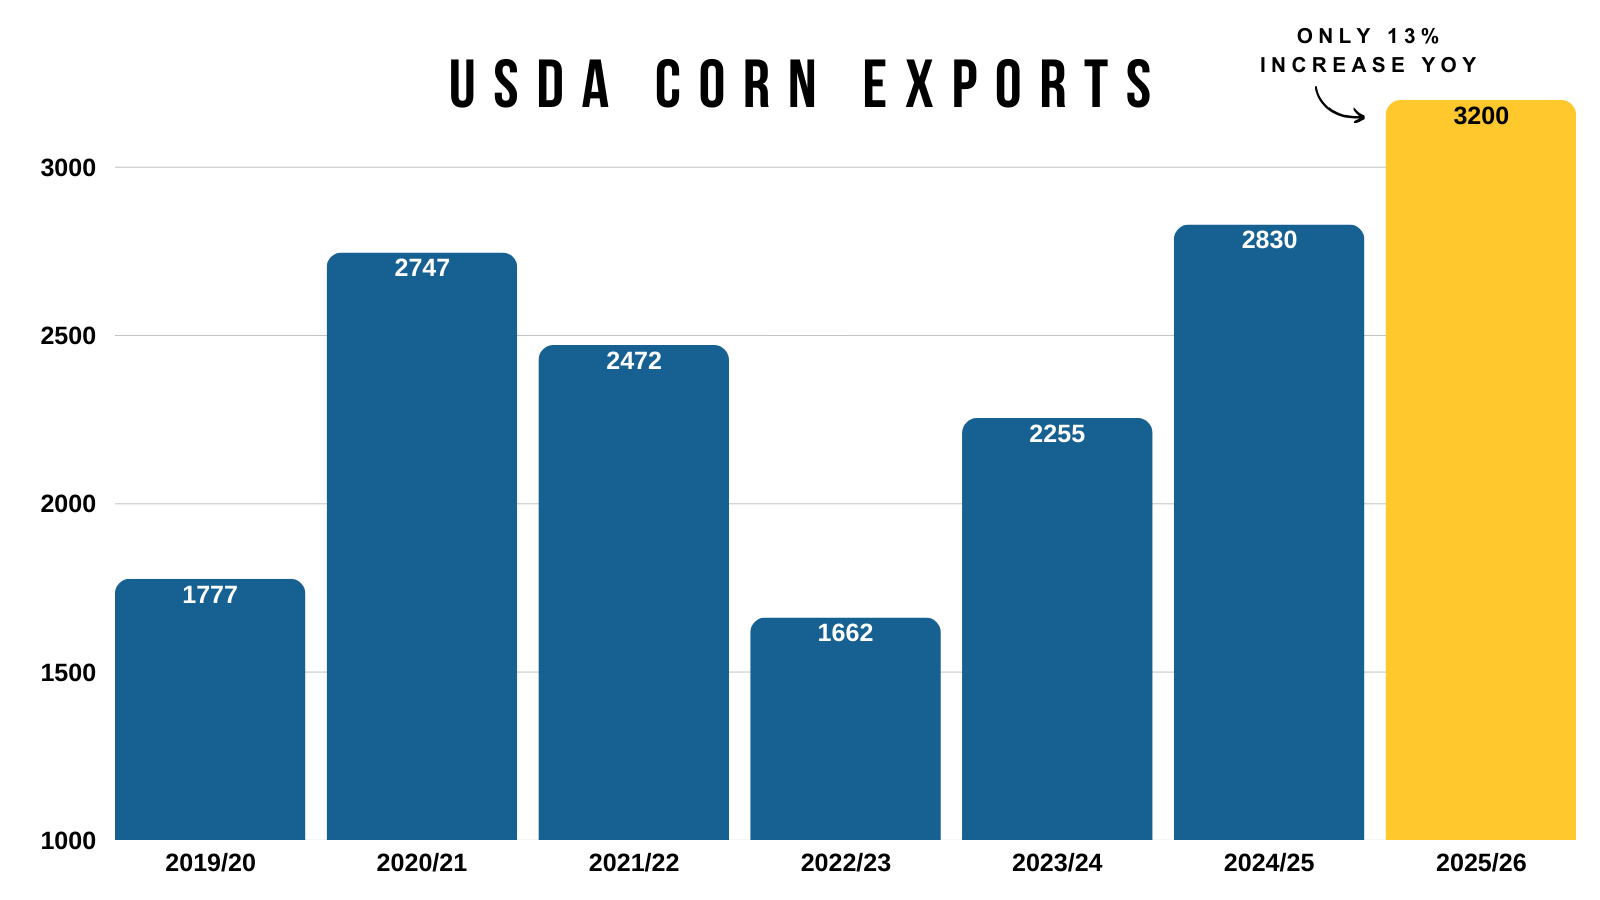
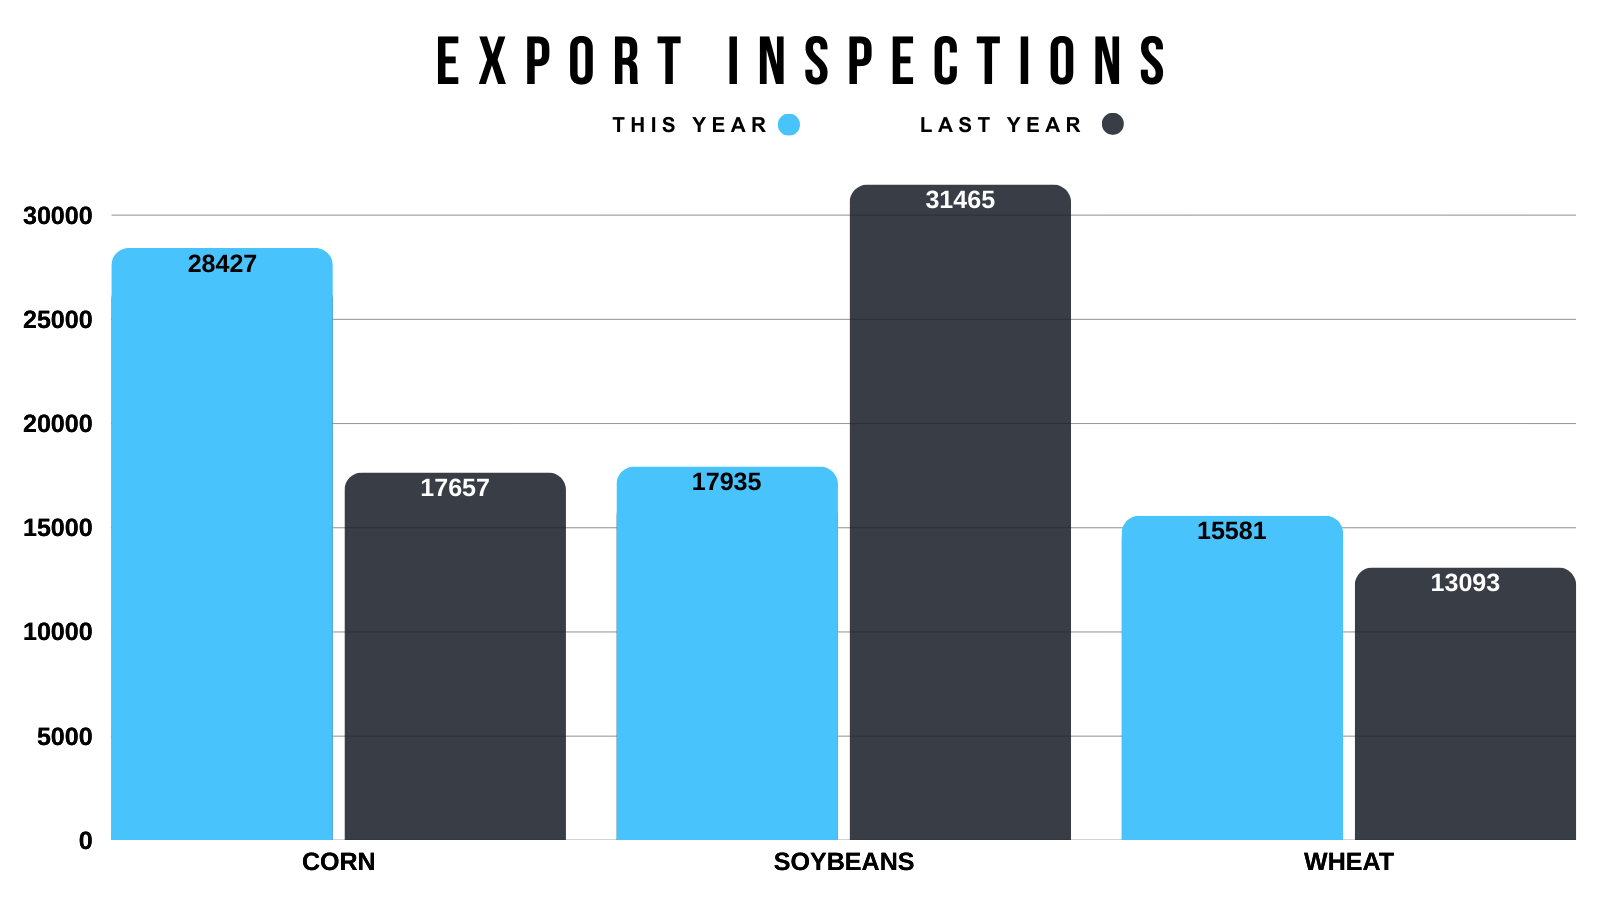
Now on the other hand, they chose to leave exports unchanged..
Meanwhile export inspections are up +61% vs last year.
Yet the USDA projections exports only up +13% vs last year.
We are currently on pace to beat the USDA's estimate by over 300 million bushels.
So a bump in exports would’ve made sense. Rather than a bump in feed.
I'm sure exports will eventually be raised higher.
The numbers yesterday don’t make sense, but they are the numbers we got.
This report does change things it a big way.
For a long time I’ve been talking about how corn had limited upside, and it would be an uphill battle to see $5.00 this year.
Given that we had record production no matter how you sliced the pie.
That battle just a whole lot harder, some would say almost impossible without some sort of outside influence such as a weather scare.
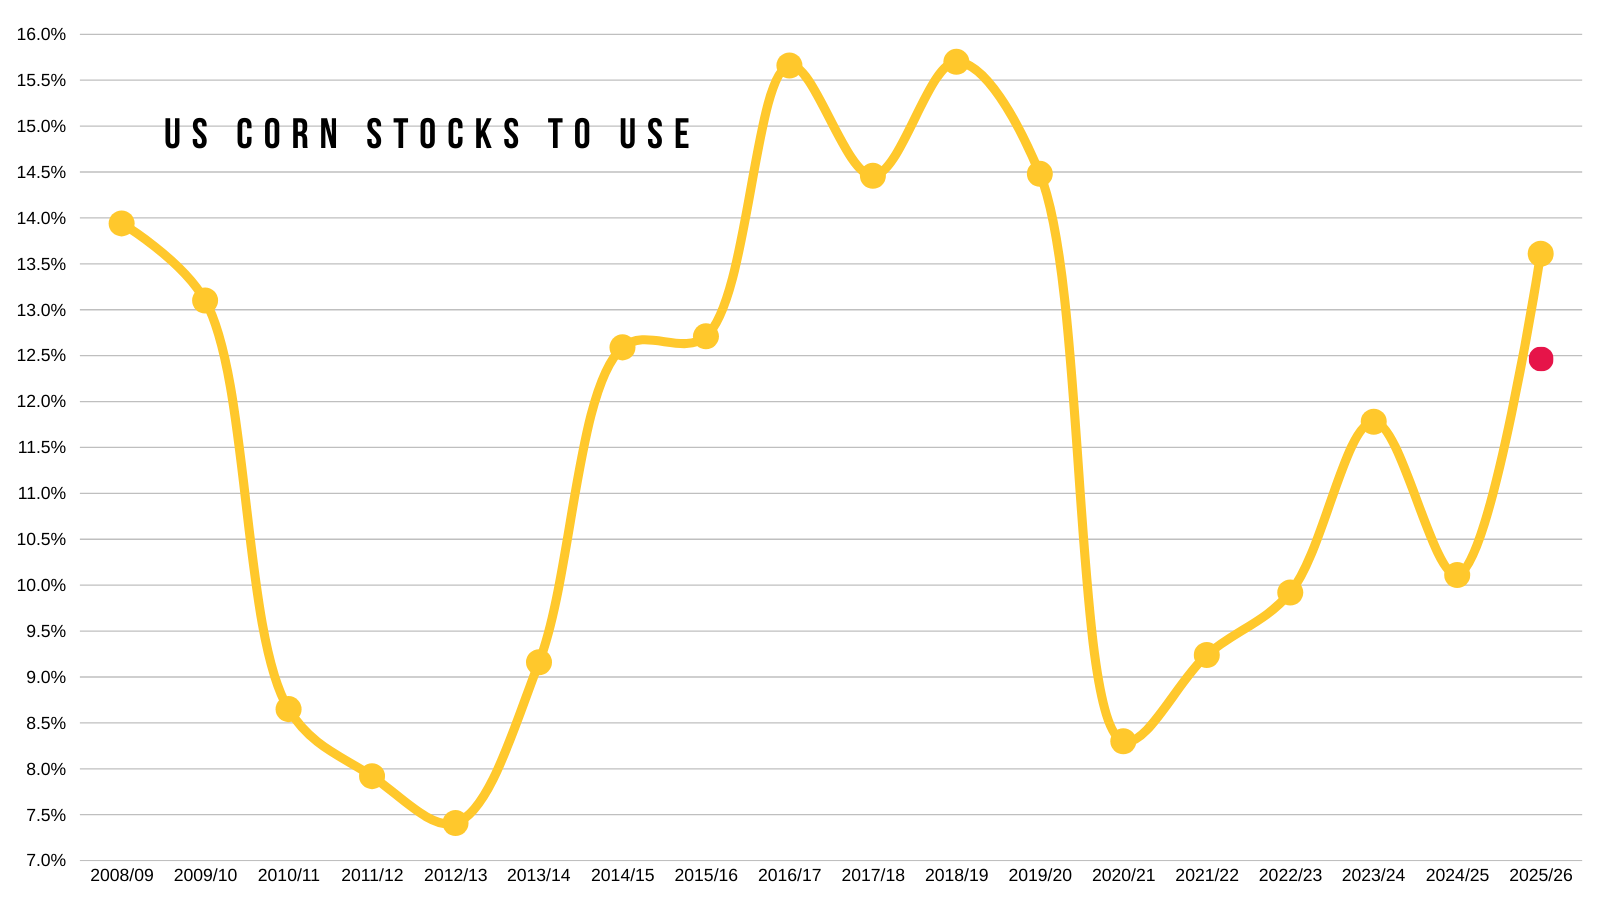
First for the stocks to use ratio.
It jumped from 12.46% to 13.61%.
That is a bearish number. The most bearish since 2019/20.
(Red dot is previous estimate)
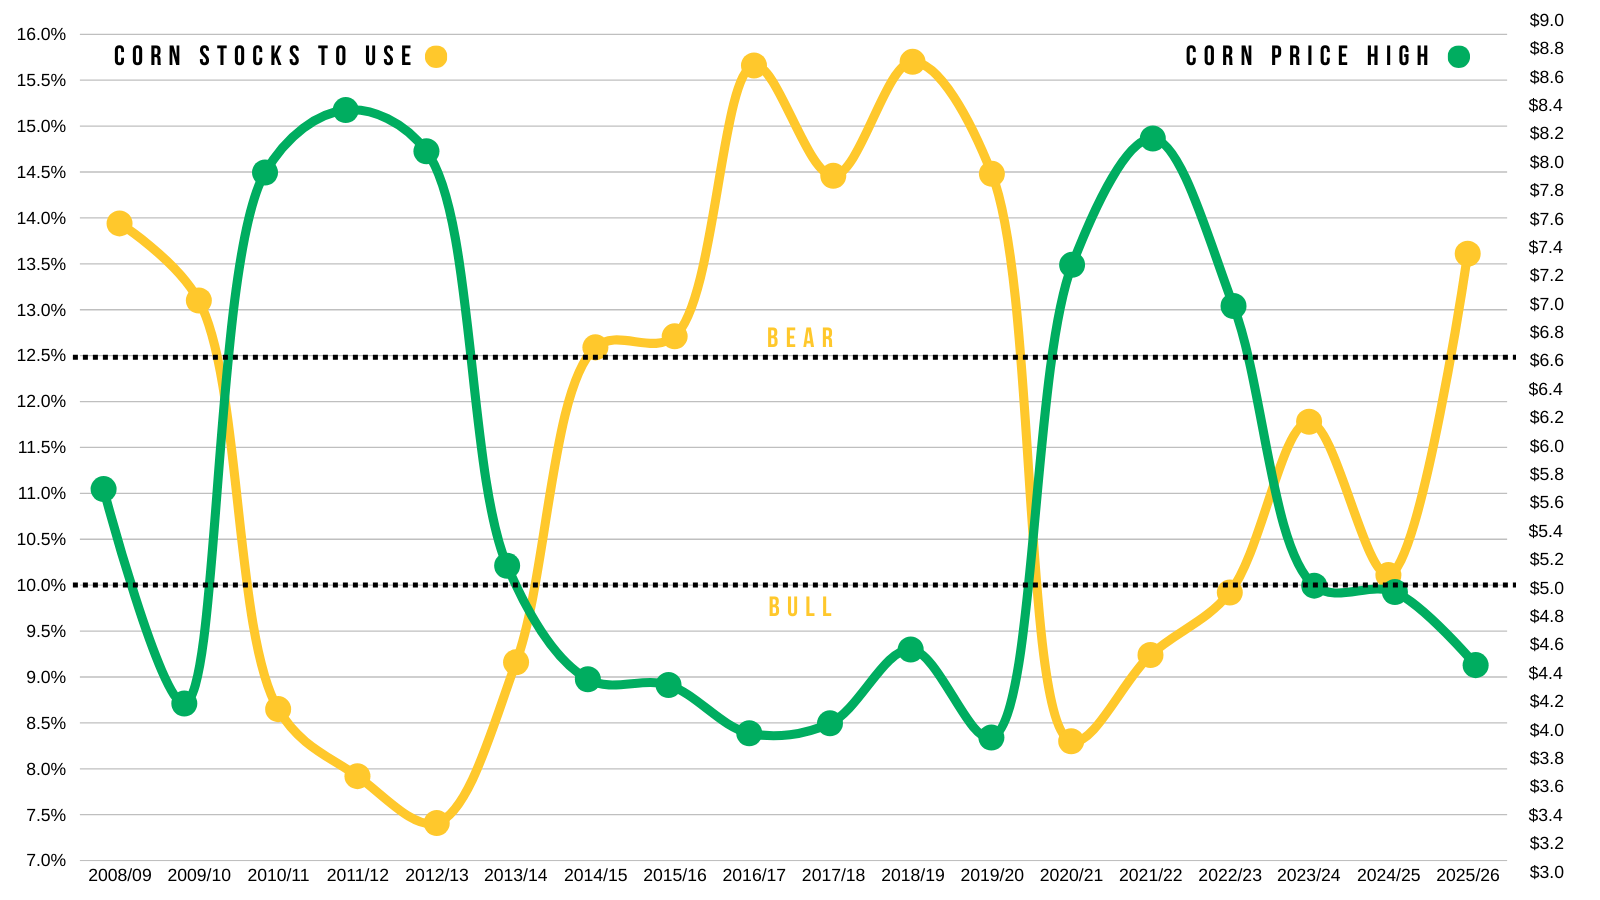
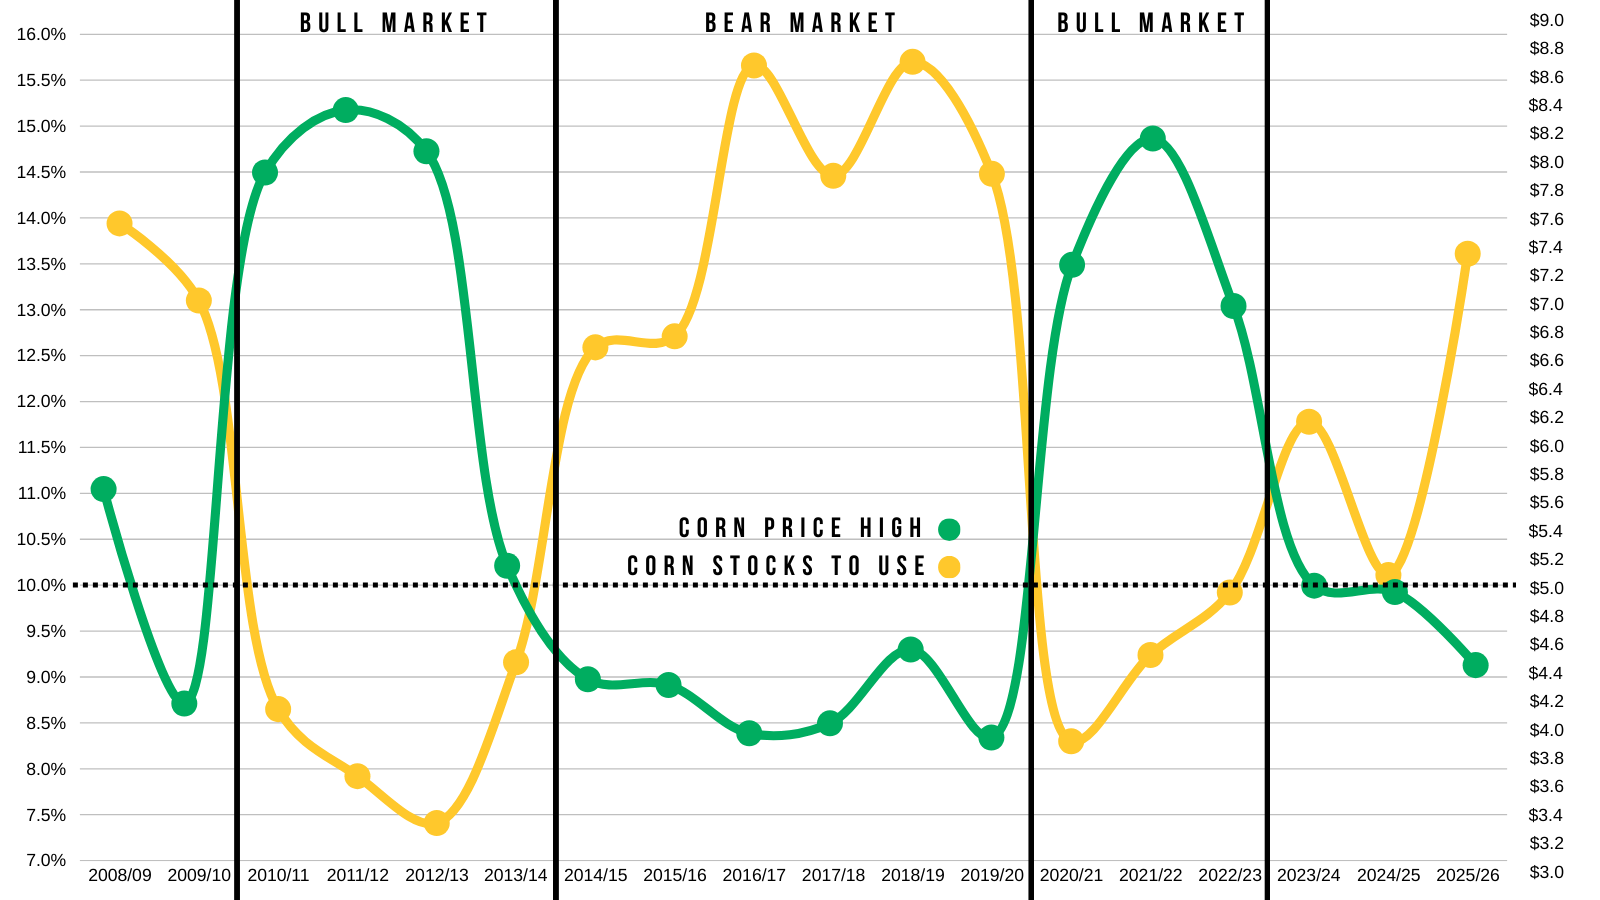
Here is a good way to visualize the stocks to use and it's impact on prices.
This chart shows our stocks to use in yellow.
Along with corn's highest price for the year in green.
I drew two lines on this chart.
One at 10% and one at 12.5%.
To get prices beyond $5.00, it almost always takes a stocks to use 10% or lower.
If you focus on that bottom line, anytime the stocks dips below 10% (yellow), the prices jump above $5.00 (green).
Now let's focus on the top line.
Anytime our stocks to use (yellow) is above 12.5%, our prices (green) tend to top out under $5.00 and result in a bear market.
Here is another way to look at it.
By splitting up the bull markets and the bear markets.
If our stocks to use stays this high, it is about on par with the last bear market.
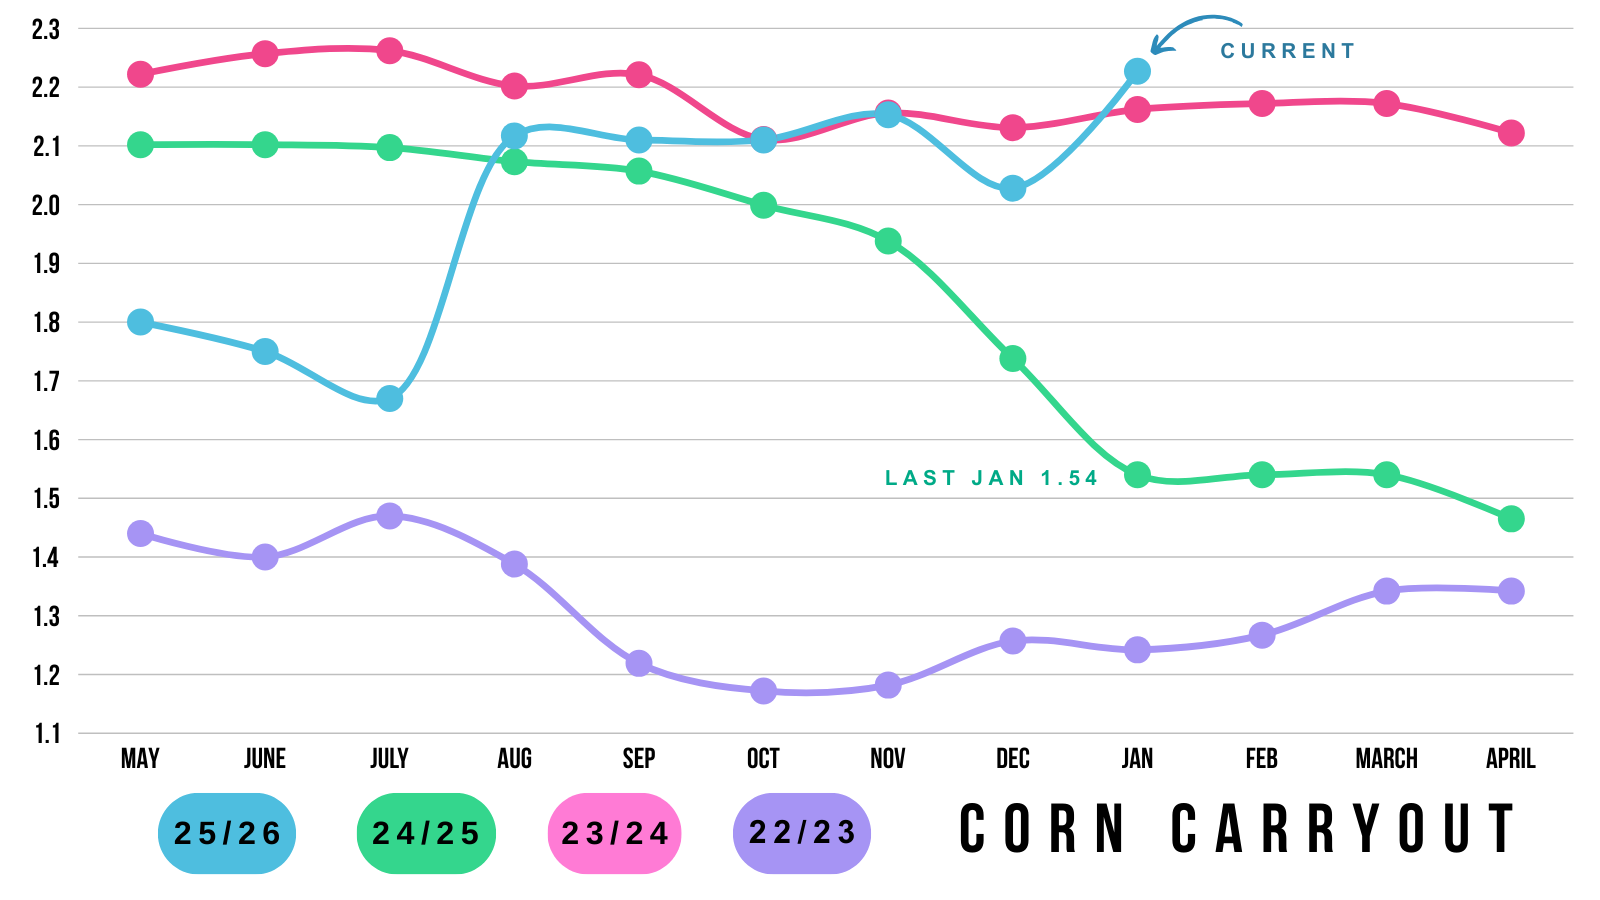
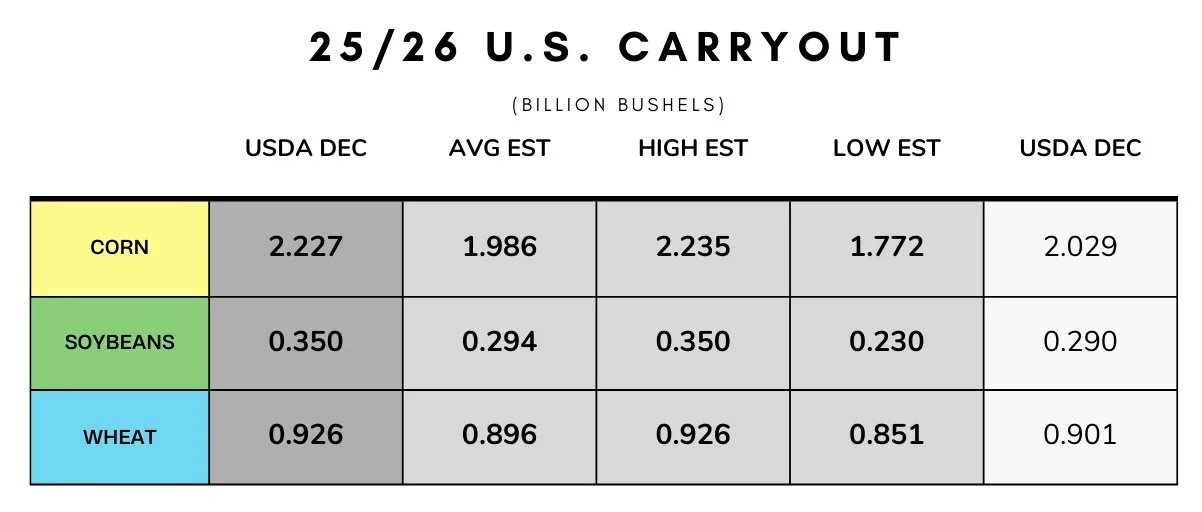
Here is a visual of our carryout.
It's now sitting at a pretty massive 2.23 billion bushels.
Which is the largest in the last few years.
We went from a not "overly bearish" situation if yield would’ve fallen down to 182 for example, to a clearly bearish situation.
To eat into that carryout, we'd have to see one of two things happen.
Demand continues to eat into it, or we get a weather scare.
The problem is that since the USDA once again upped feed usage, they more than have the ability to lower it in the future. So it seems like it'll be pretty difficult to get a carryout below 2 billion for now.
If we want corn to have a real story, we will need less acres this spring, a weather scare, or some other outside factor.
Until then, we will want to be rewarding any opportunity or rally that comes. As the fundamentals suggest sizeable rallies should be sold.
The report was indeed a game changer and answered questions about what corn's potential truly is from here.
I am not saying corn can’t go higher and we won't get an opportunity. Even bear markets provide opportunities. But it could very well be a struggle for corn here the next few months maybe even until planting.
We want to be prepared for when they do this year.
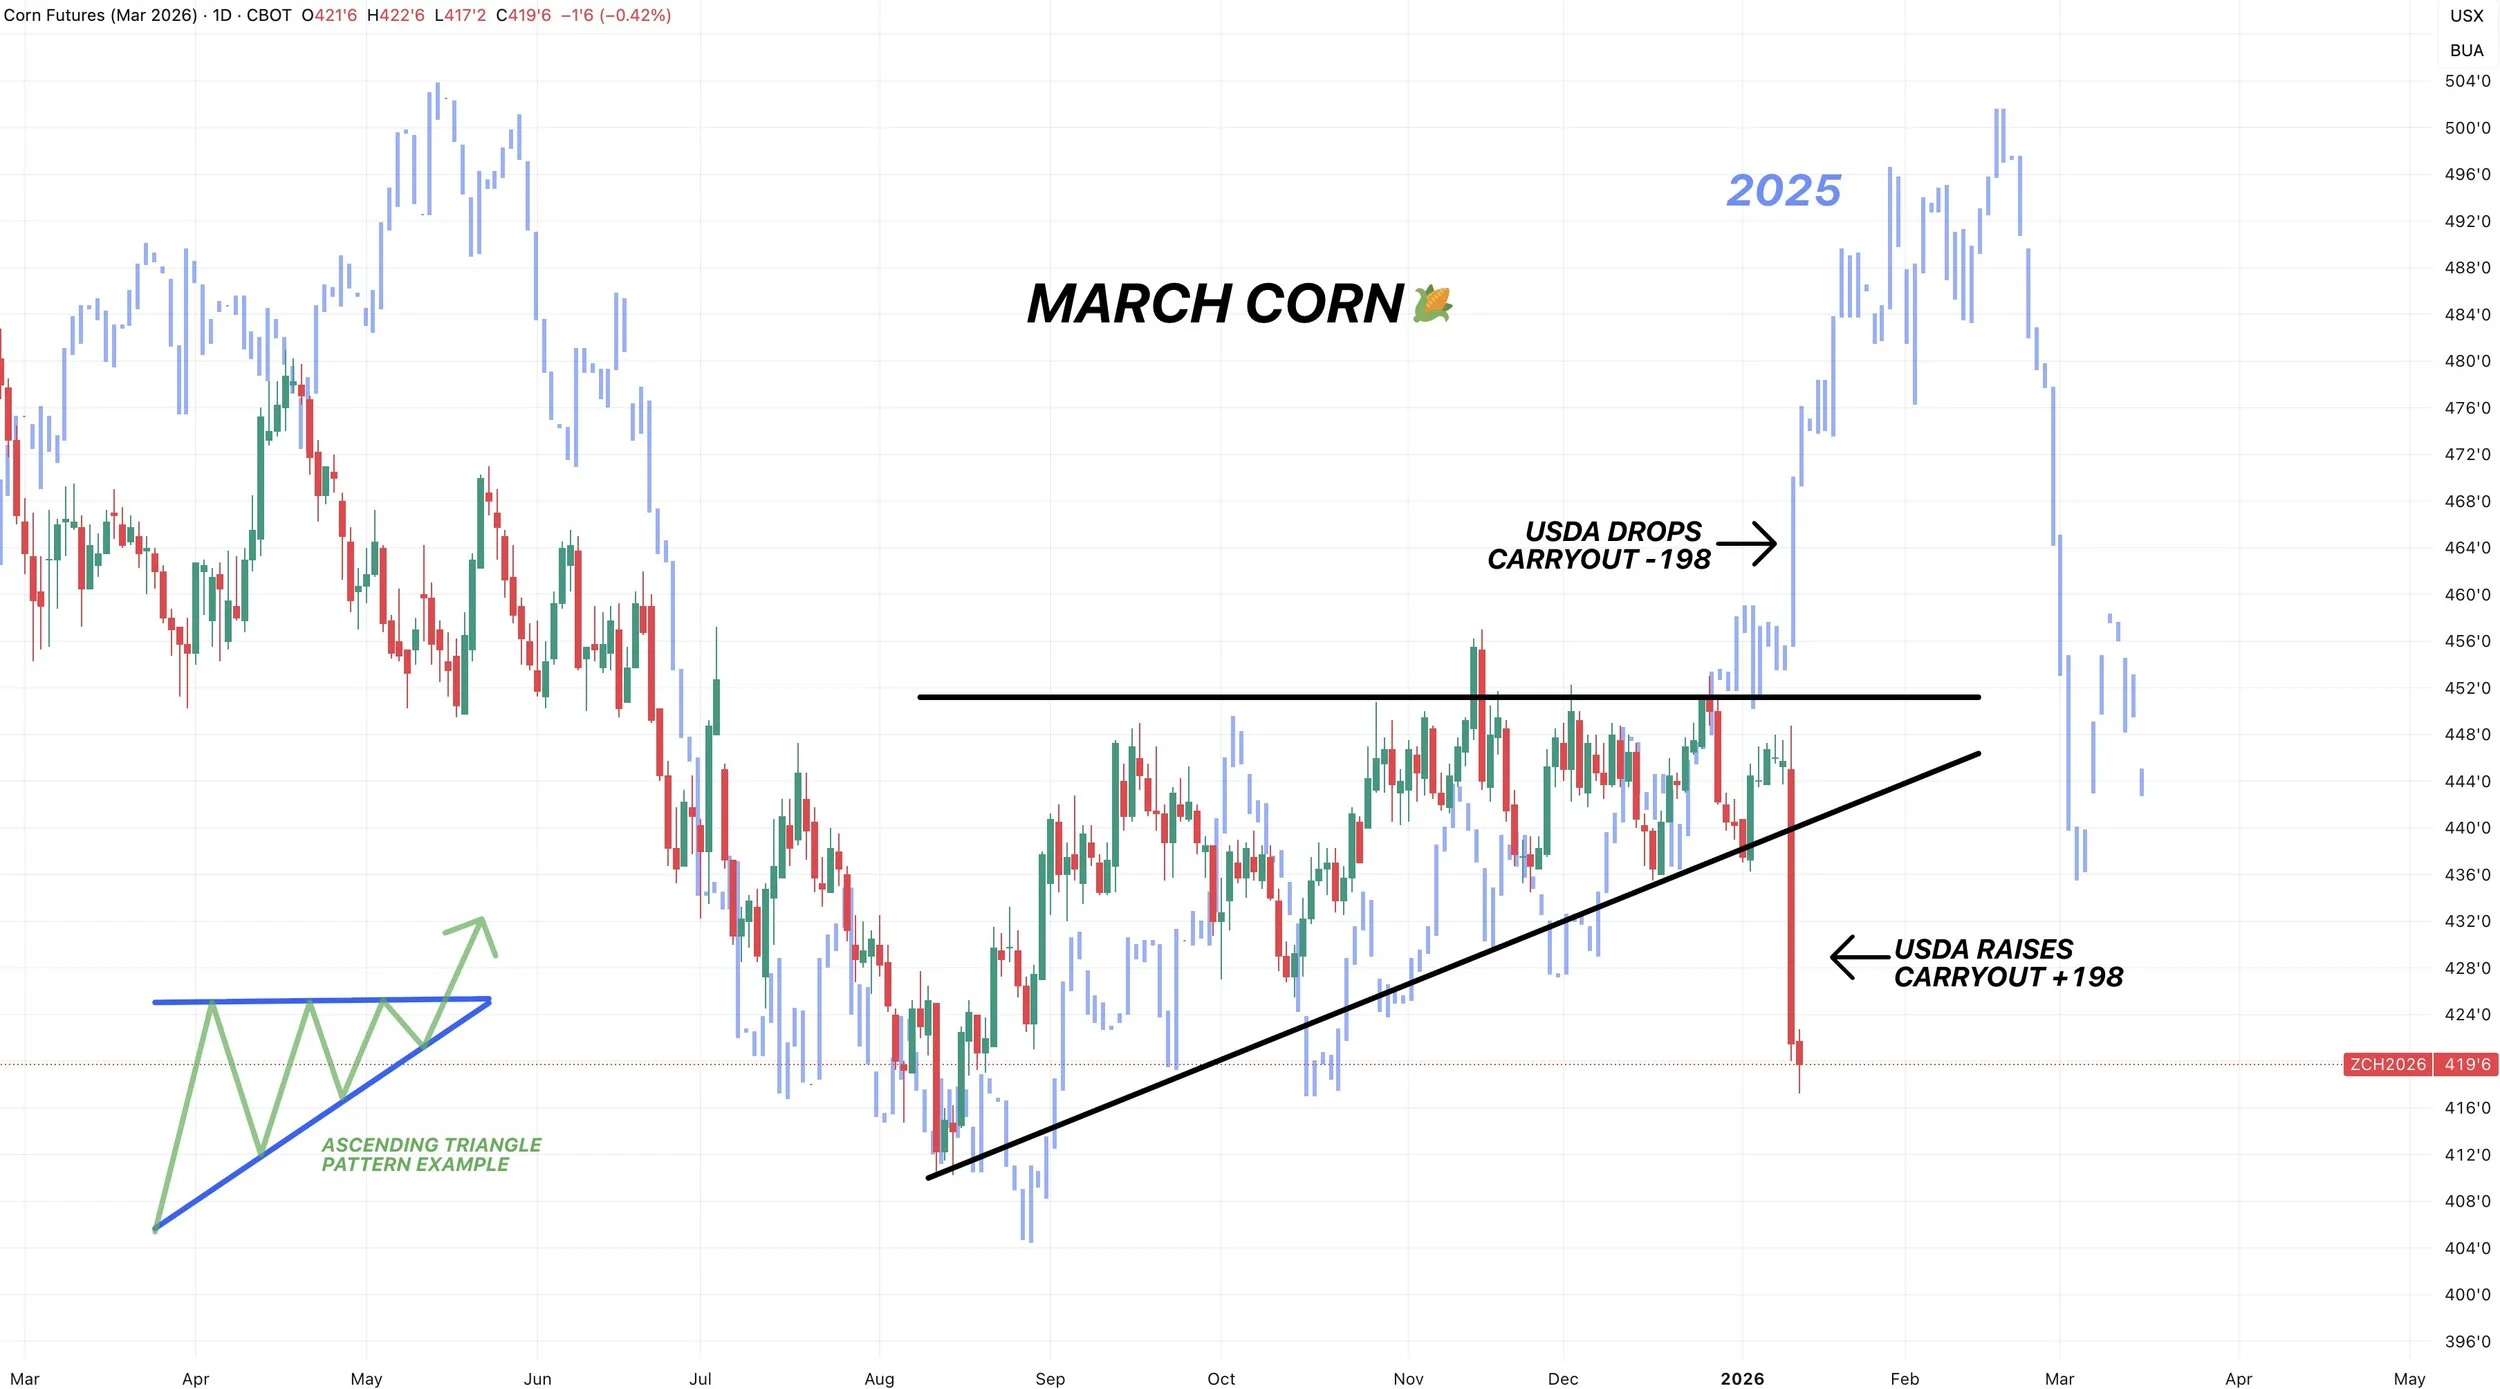
We had been tracking this pattern between March-25 and March-26 corn for the last several months.
Up until yesterday, were still tracking almost identically.
Those similarities ended yesterday.
Last year, the USDA dropped carryout by -198 million.
Yesterday, the USDA raised carryout by +198 million.
They did the exact opposite as last year, and the market got the exact opposite reaction.
Technicals:
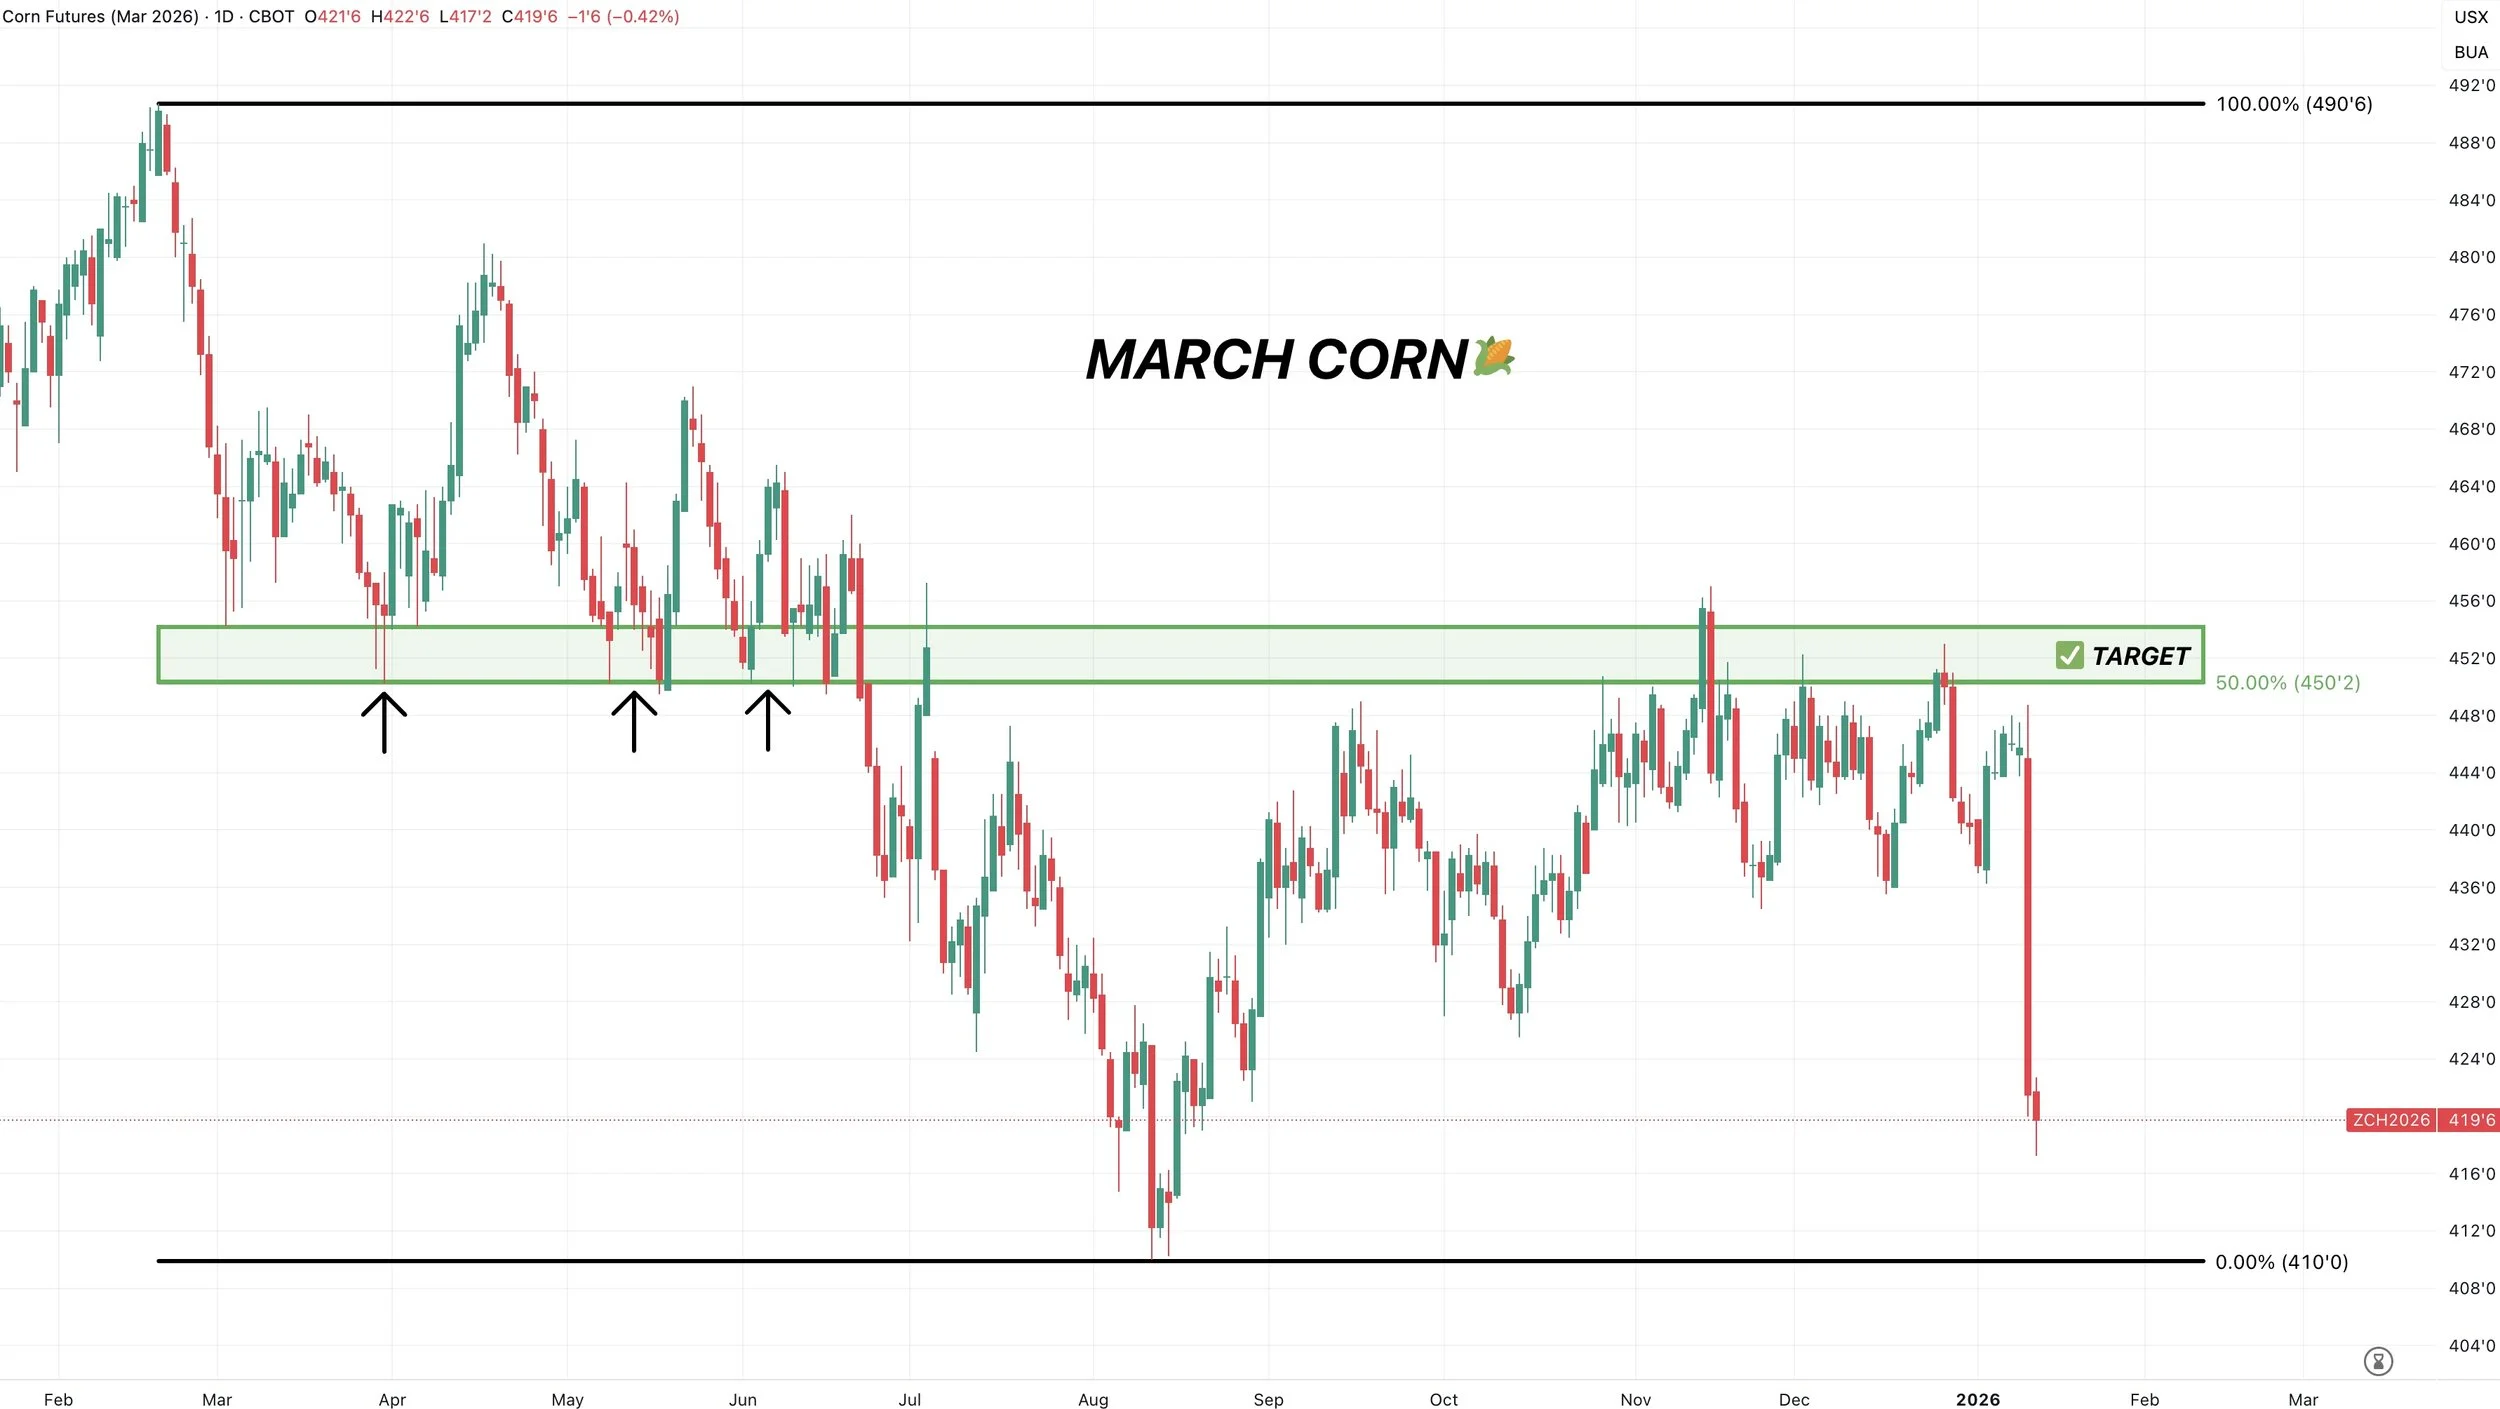
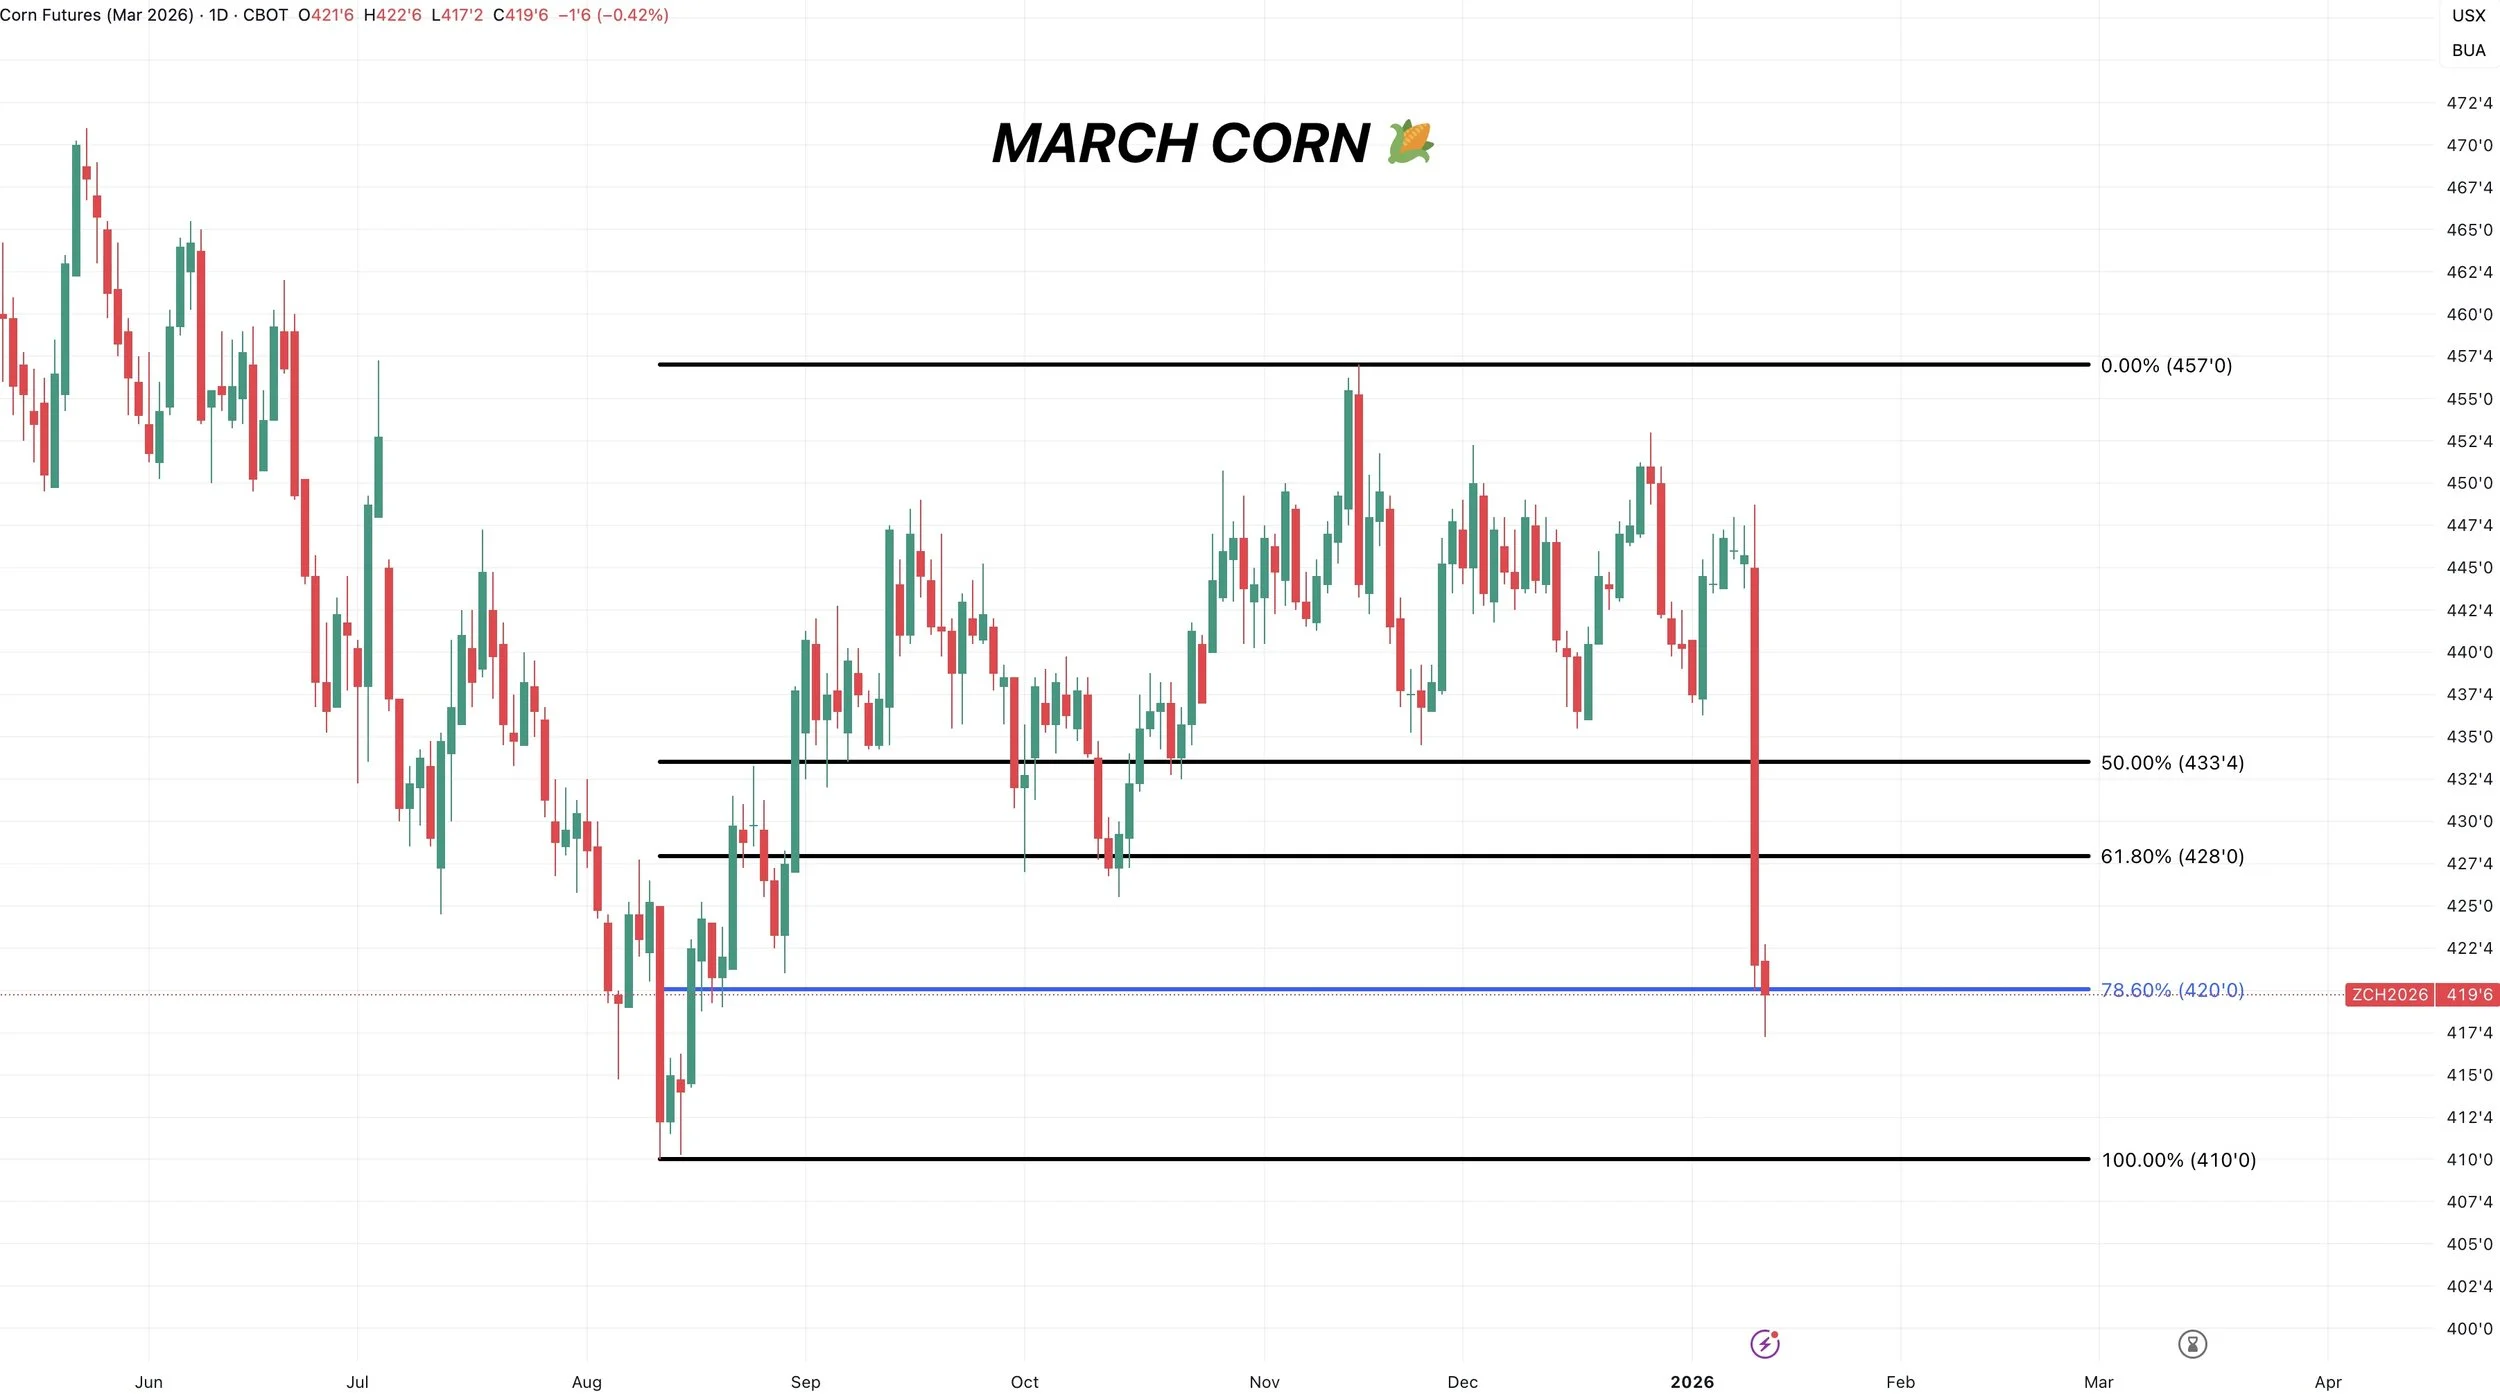
March Corn
We originally had that sell signal at $4.50.
As it was key resistance and our first target.
In hindsight, yes, I wish we had been more aggressive.
That $4.50 was the level we needed to break through to get the next leg higher and we just didn’t get that.
Those numbers were about the only thing the USDA could’ve printed to get THAT bearish of a reaction.
I am not going to personally try to catch a falling knife here.
Today's candle did provide some optimism.
But we are essentially at our last line of defense before those contract lows.
Which is the 78.6% retracement down to contract lows.
If we take out this level, contract lows is the next point of interest.
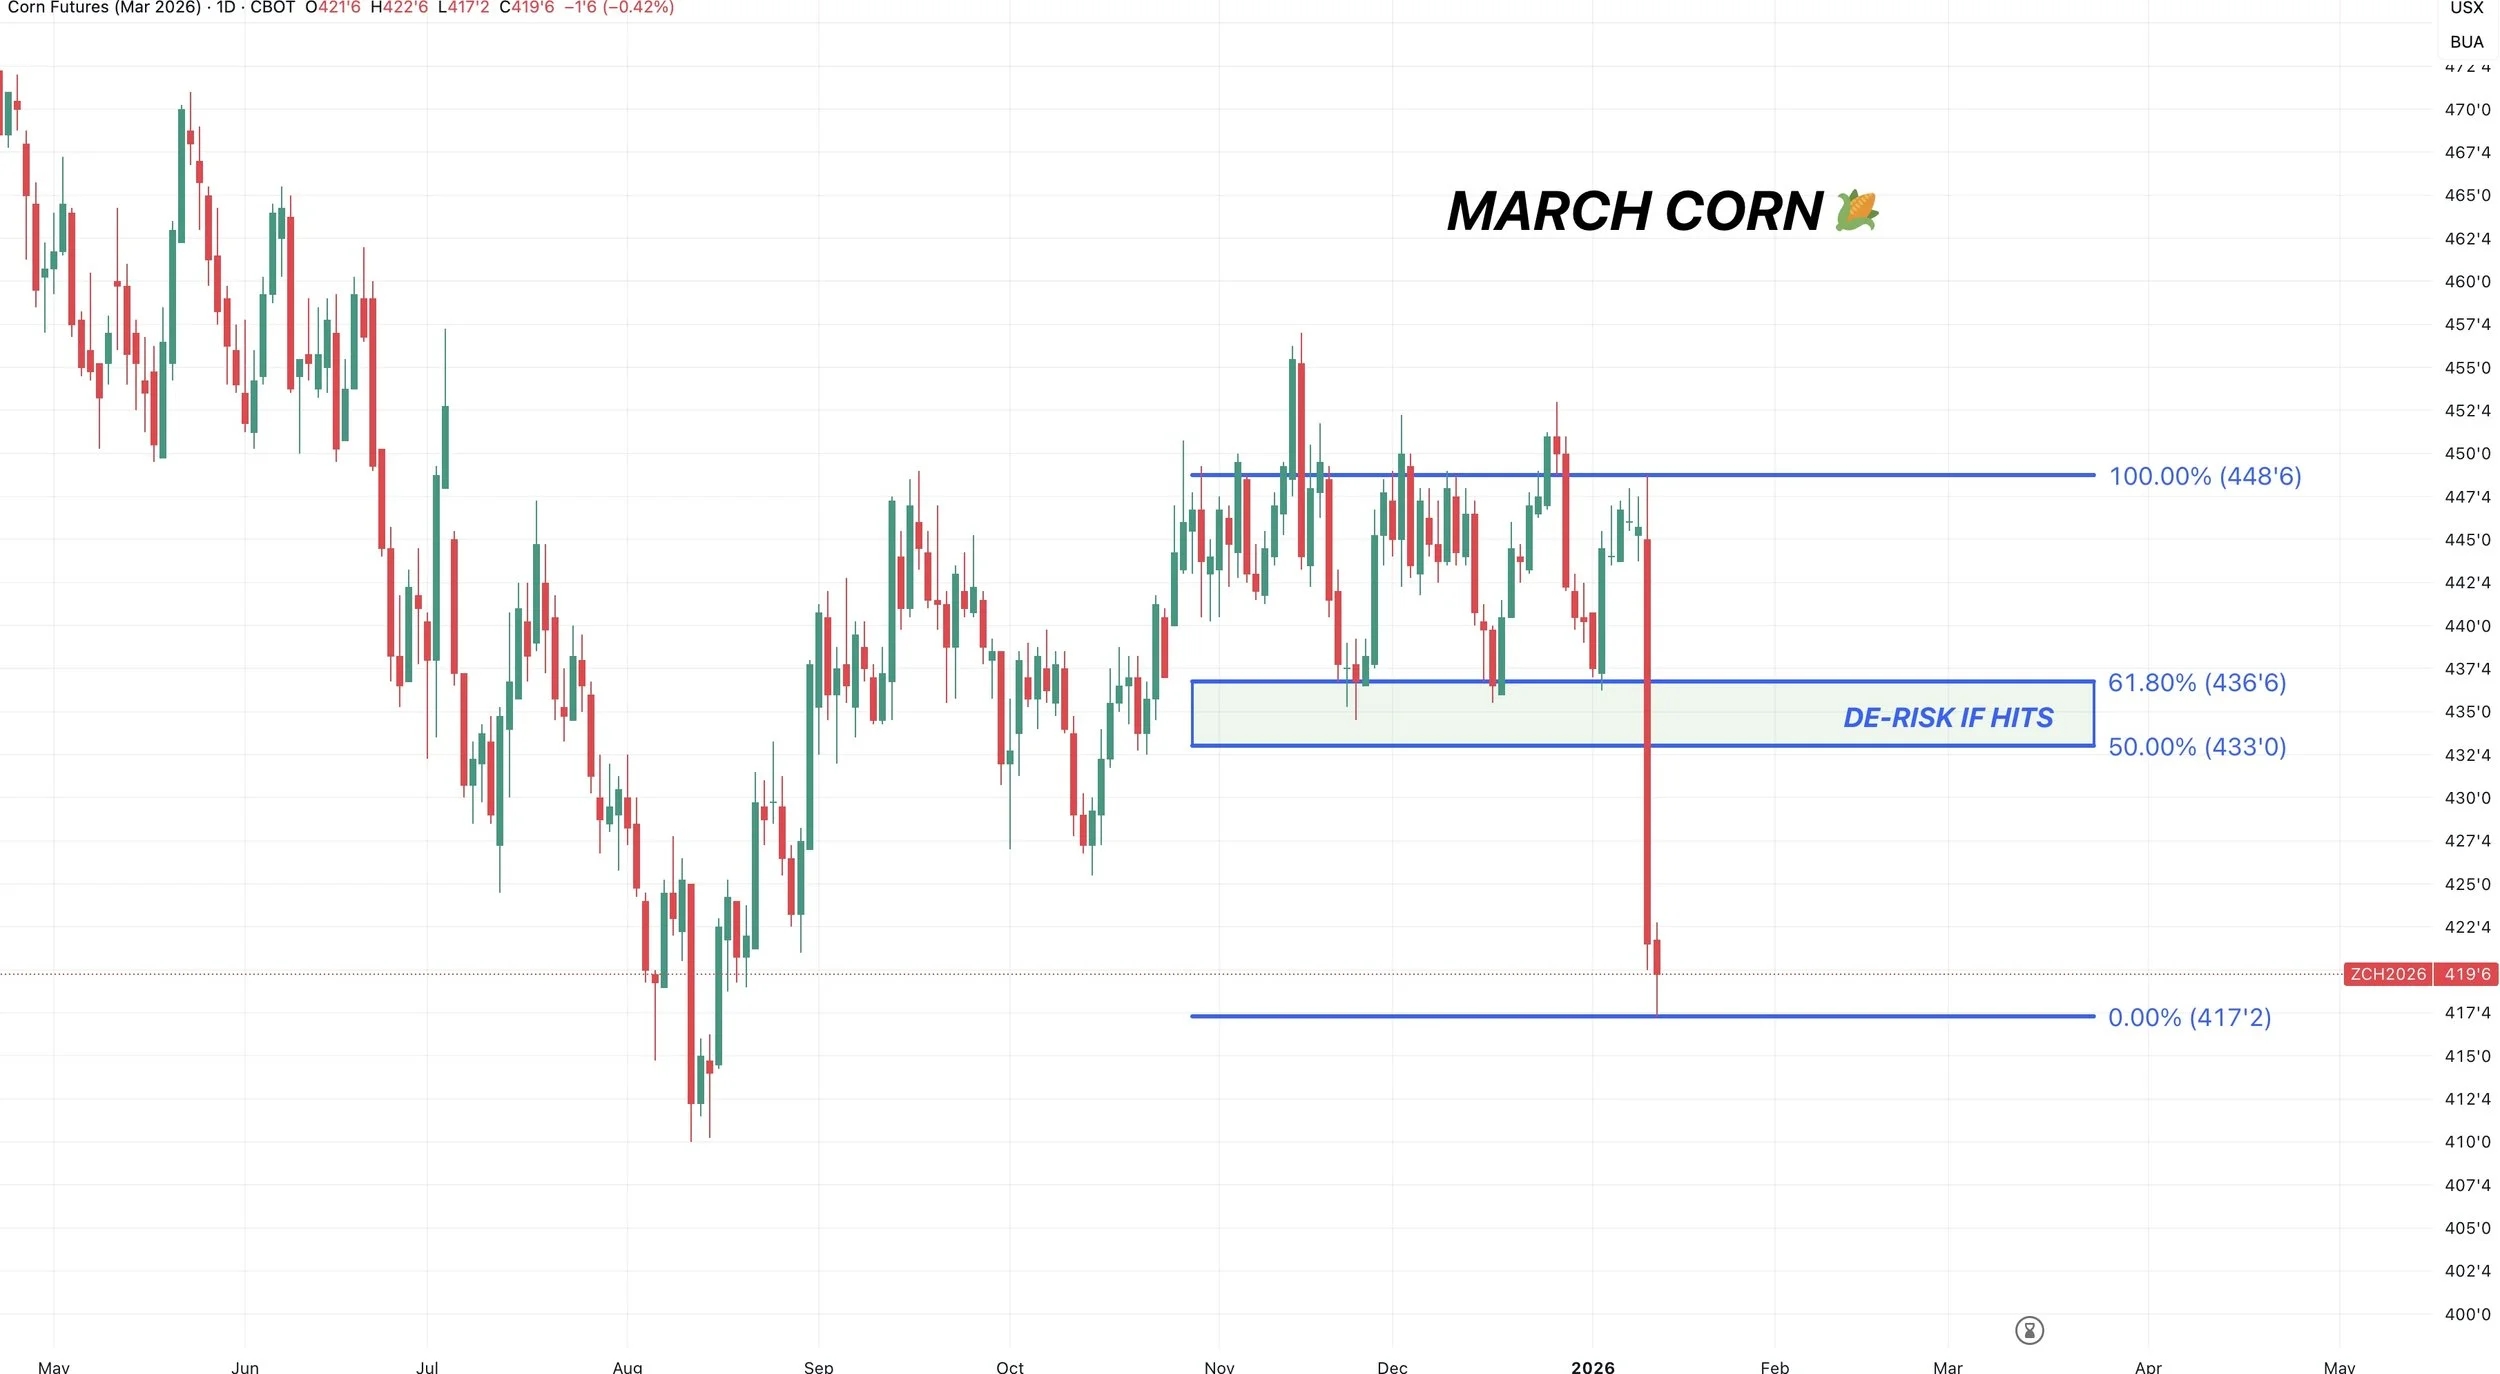
Where to de-risk:
We will get a dead cat bounce at some point whether we go lower from here first or not.
We will want to be looking to reward any relief bounce that claws back 50-61.8% of this sell off.
If we move lower, then this target box changes.
Currently, that golden zone aligns with our old support.
Targets do not have to hit. They are just there to let you know to de-risk if they do.
Soybeans
Fundamentals:
Corn's overly bearish report stole the show.
But the report for soybeans was also pretty bearish.
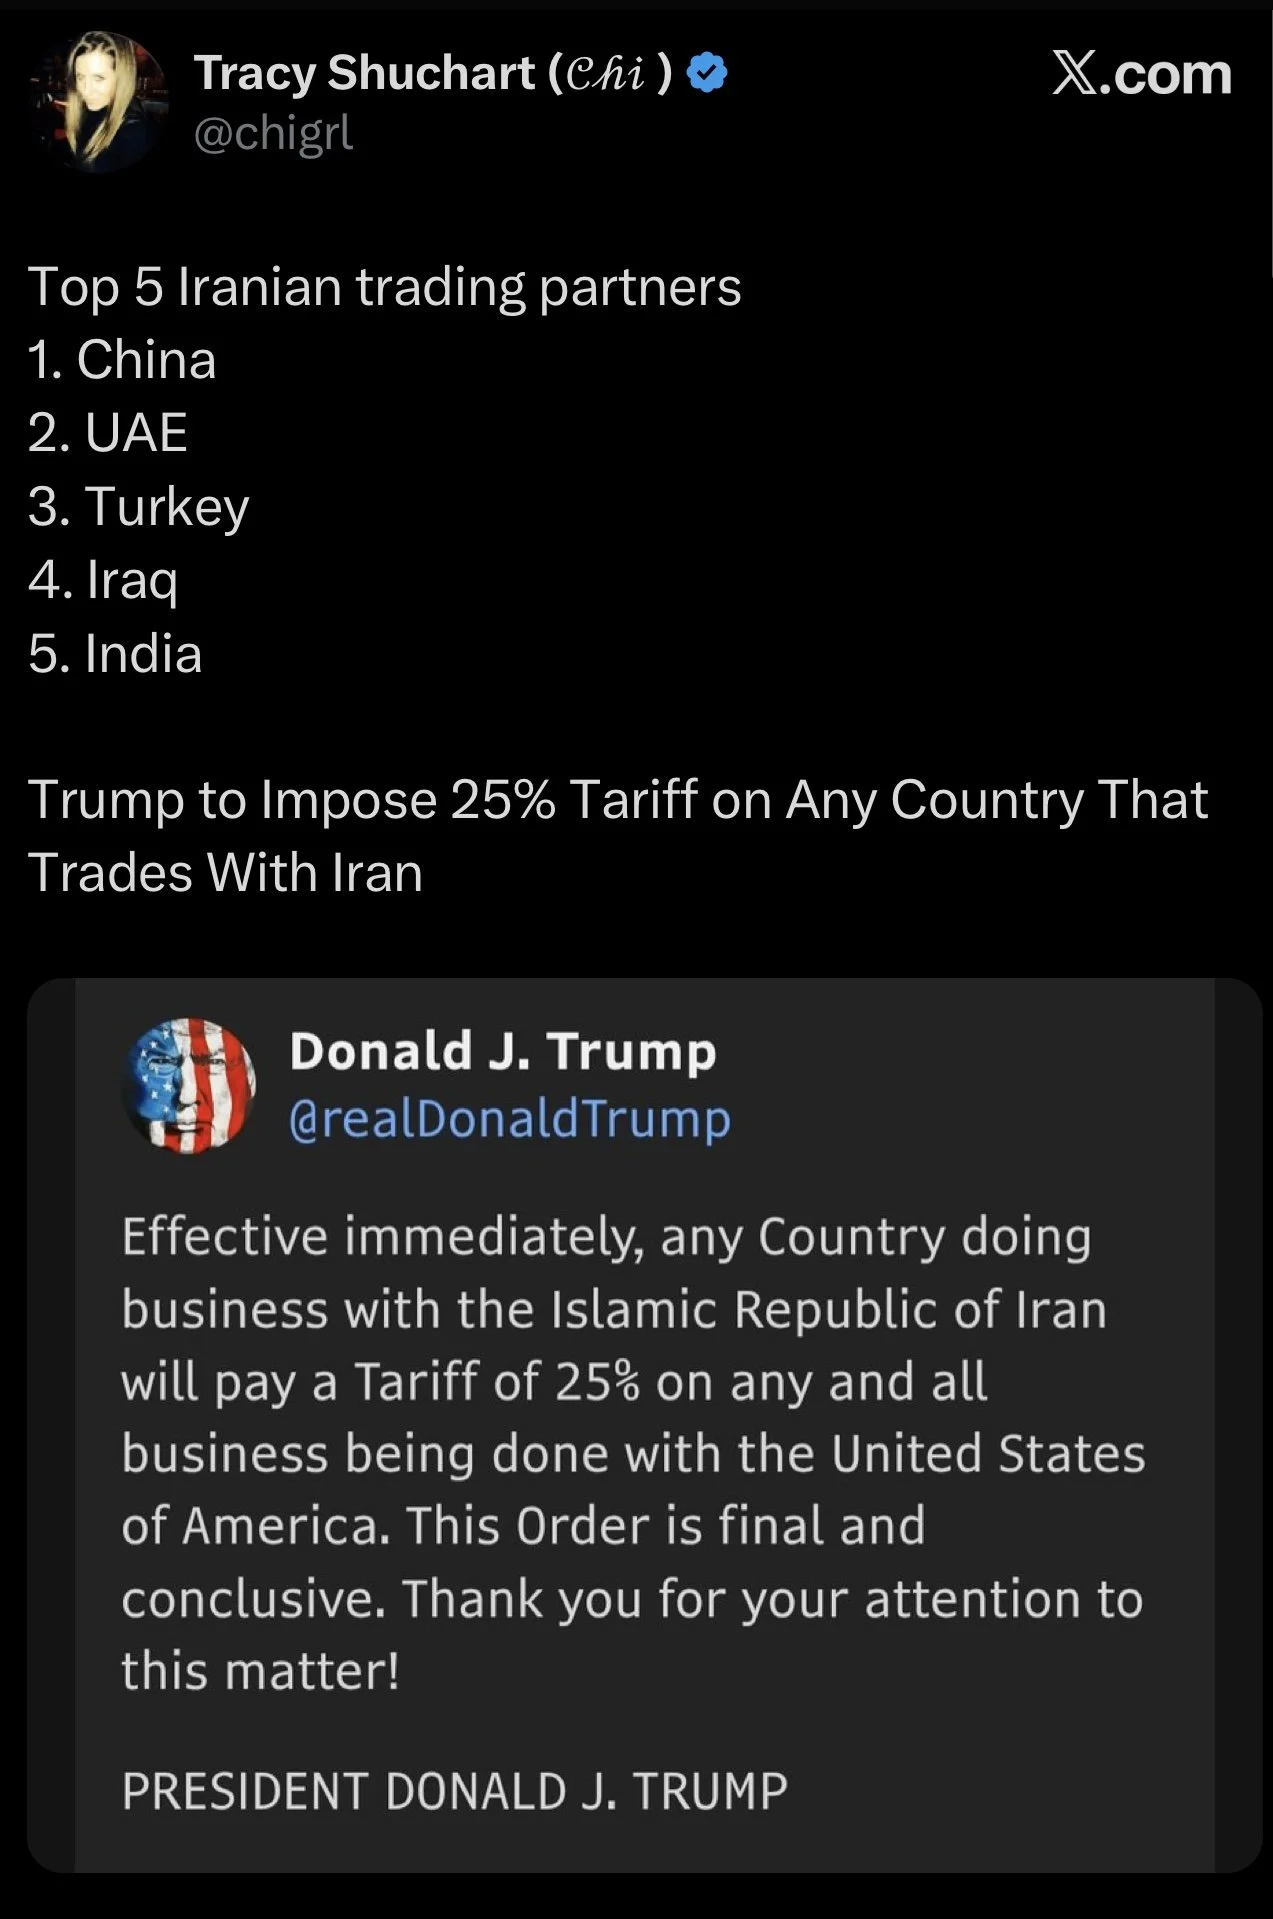
Not only are soybeans dealing with a bearish USDA, but we are once again dealing with trade conflicts. Which is probably part of the reason why we struggled today.
Trump announced he would be imposing 25% tariffs on any country that trades with Iran.
China is Iran's #1 trading partner.
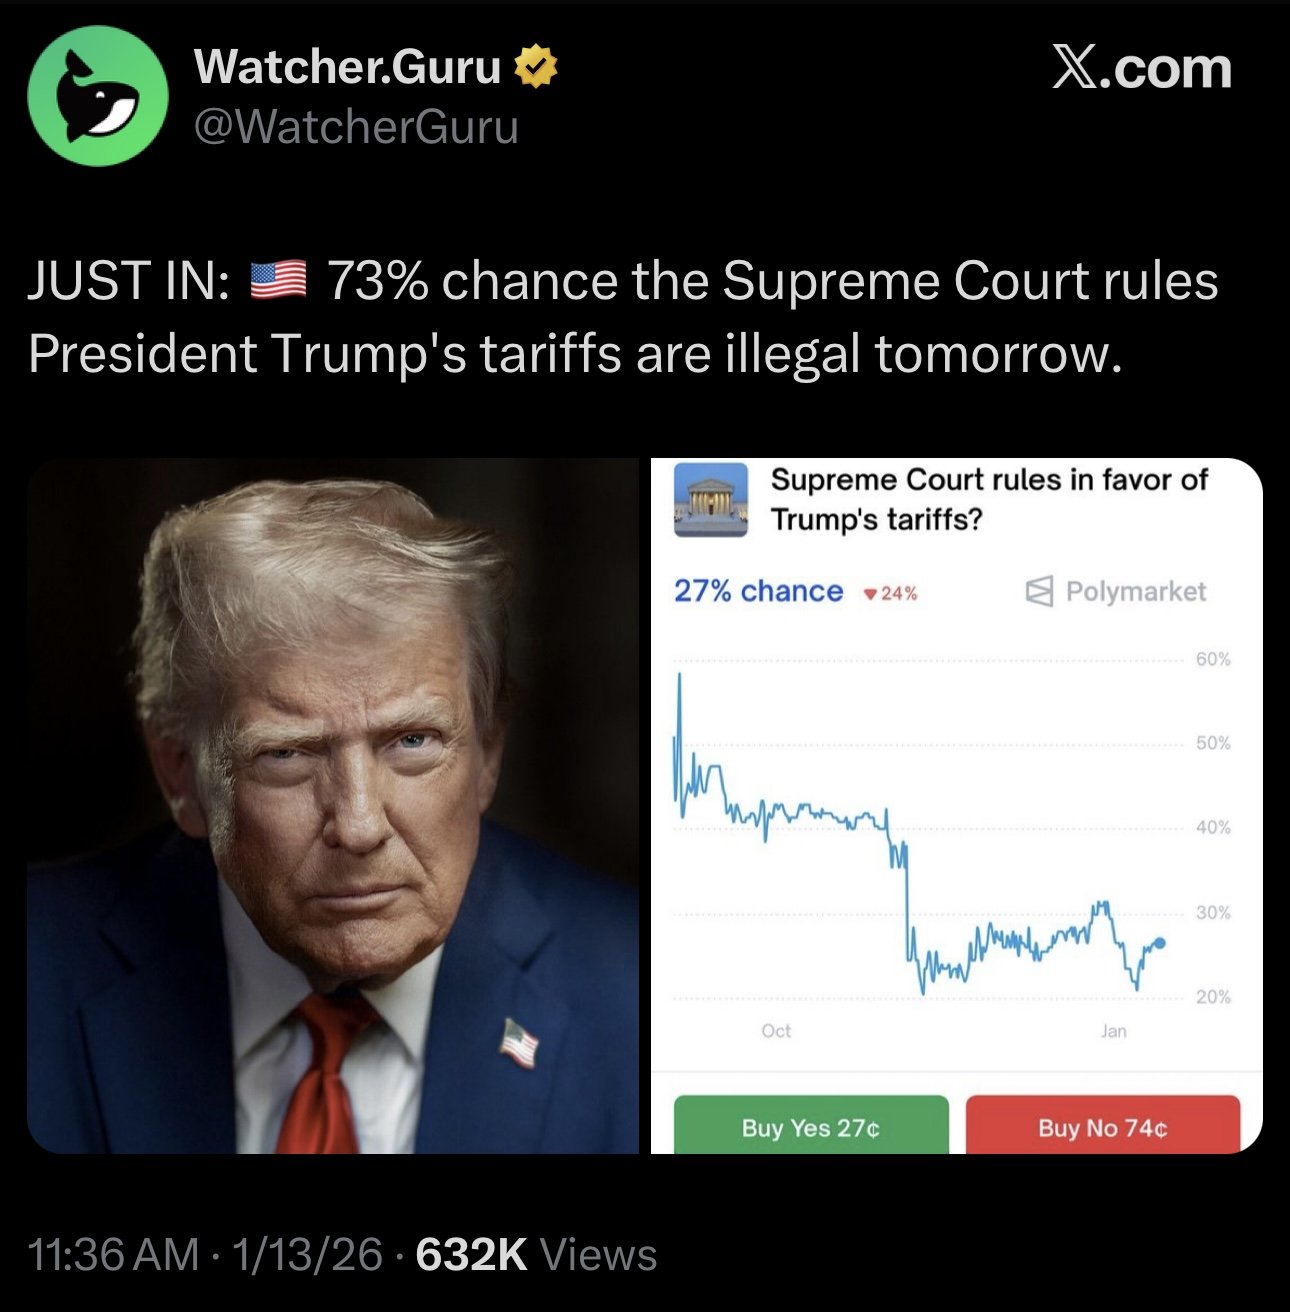
The Supreme Court rules on Trump's tariffs tomorrow.
Odd makers say there is a 73% chance they rule them illegal.
We will have to see if the soybean market reacts to the ruling.
The soybean situation does suck, given that there was so much potential for soybeans to have a really bullish situation.
The potential was definitely there.
But trade conflicts ruined that.
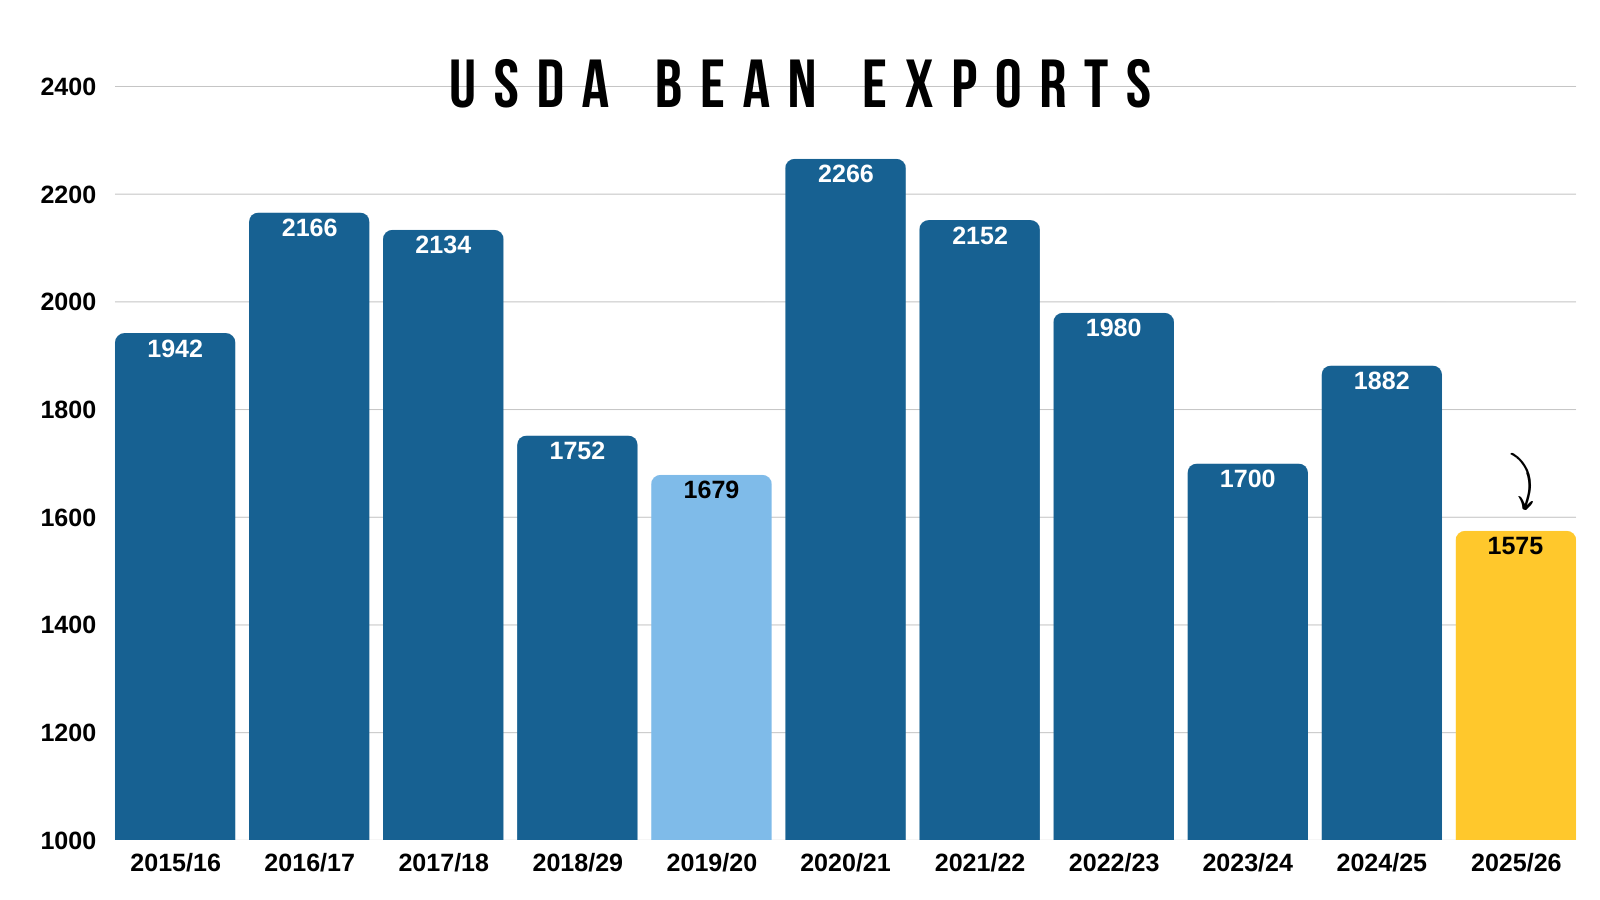
Our exports are estimated to be 104 million bushels below what they were in 2019/20.
The US situation would be very tight if exports would’ve been fine.
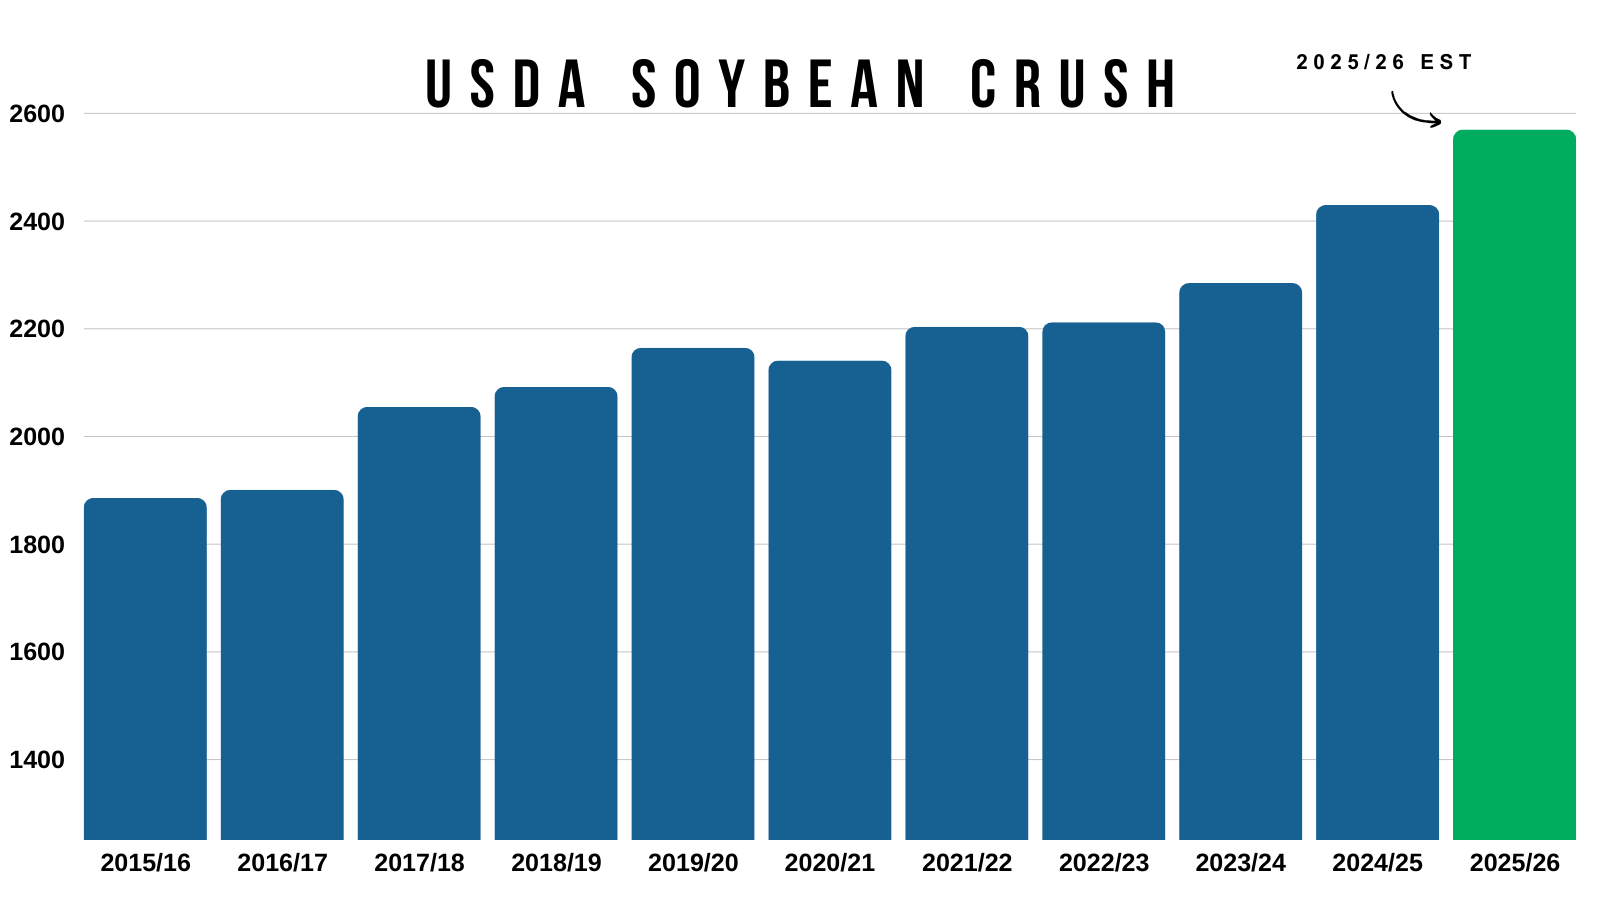
We are crushing more than ever.
Crush demand is as strong as it's ever been.
So imagine if exports weren’t awful.
Even if we had the same exports as the last trade war, you'd be taking off an extra 100 million bushels of supply on the balance sheet.
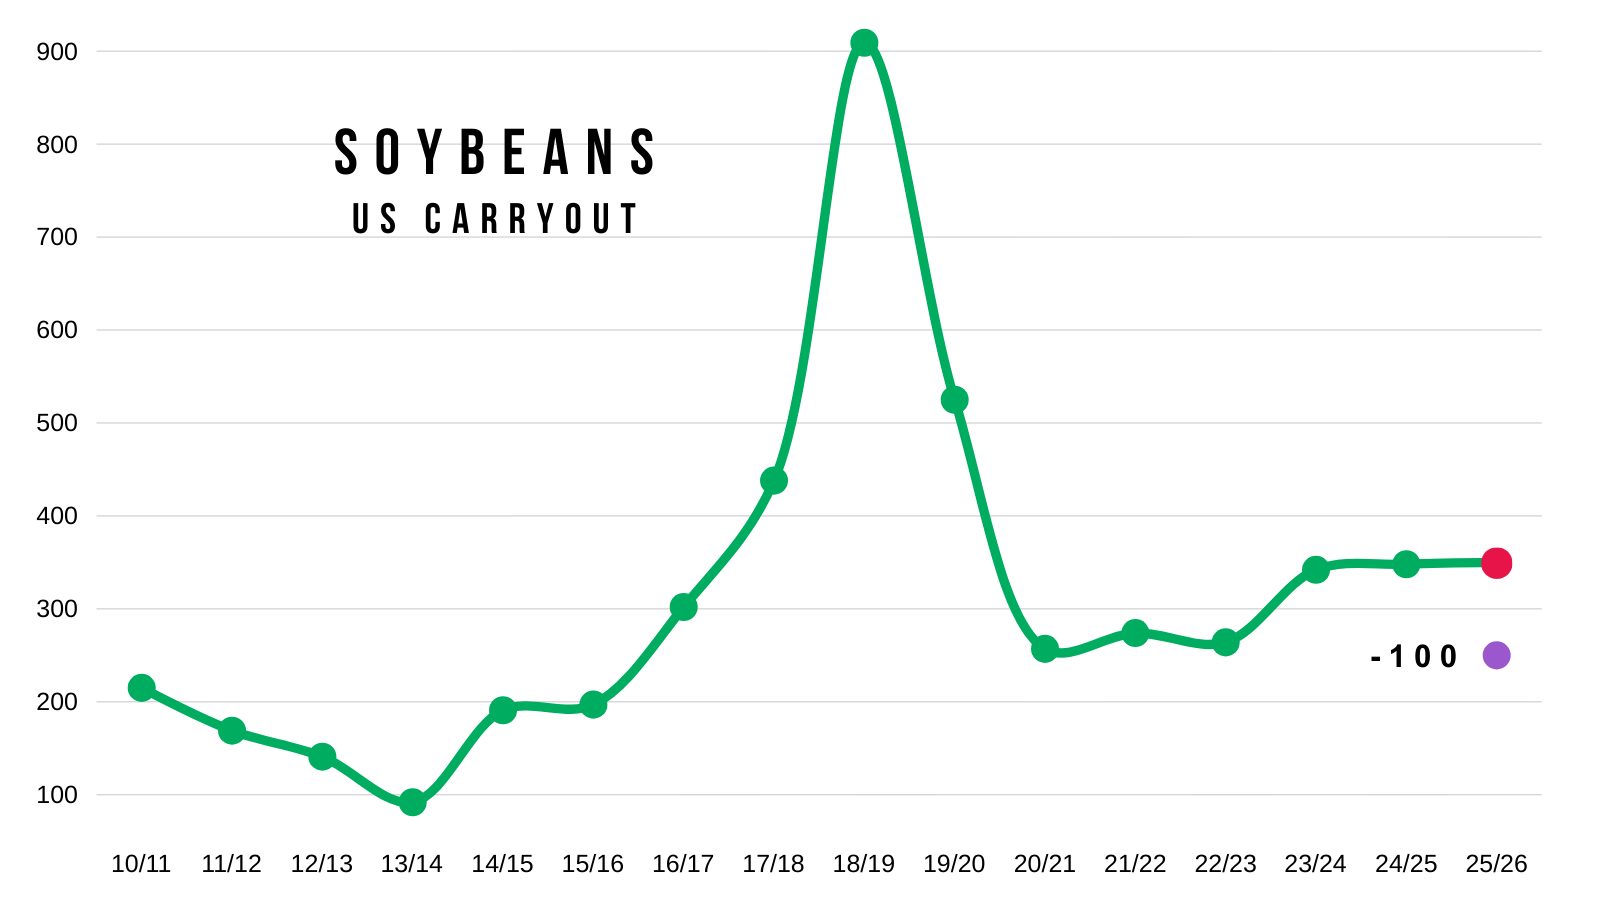
With a carryout of 350 million, that is a big swing.
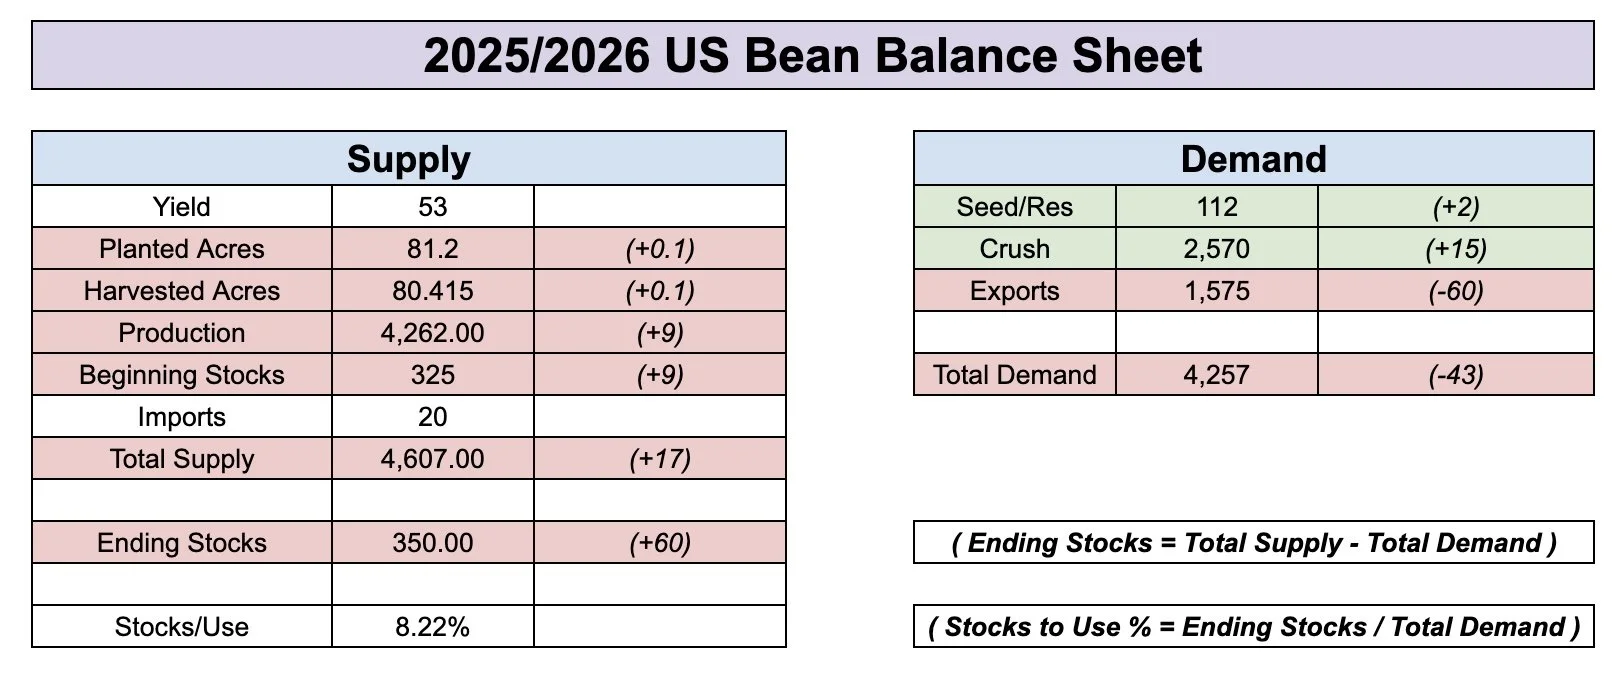
Here is the balance sheet changes from the report.
Yield unchanged.
Exports dropped -60 million.
Crush increased by +15 million.
They found an extra 100k acres.
The increase in crush was offset by the increase in acres.
Resulting in carryout jumping by +60 million from 290 to 350 million.
You can’t really argue against their decision to cut exports.
I think that is totally justifiable.
Export demand is so far behind pace and we are well past our prime shipping window.
We're down -43% vs last year.
To add on to that, Brazil has a record crop that's about to come online.
They haven’t seen any weather issues.
Which makes it that much harder for soybean exports.
This was the 5th time in the last 12 years where yield didn’t come down in this report.

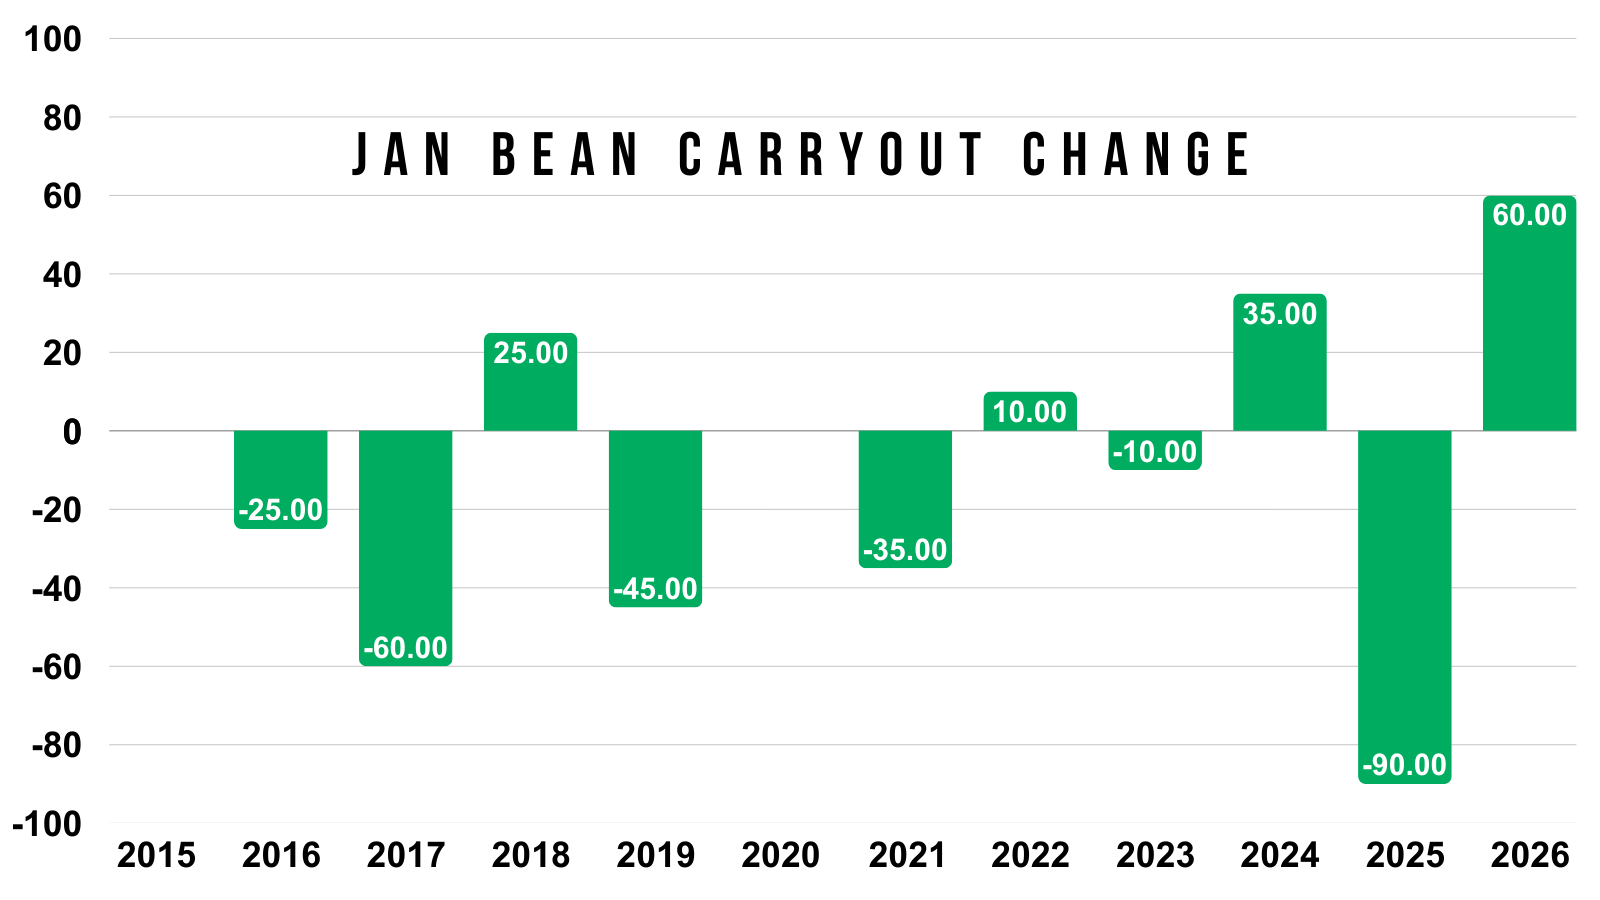
Like corn, this report was one of the most bearish in the last decade.
It featured our largest increase to carryout in over a decade.
Almost double the next largest one.
Technicals:
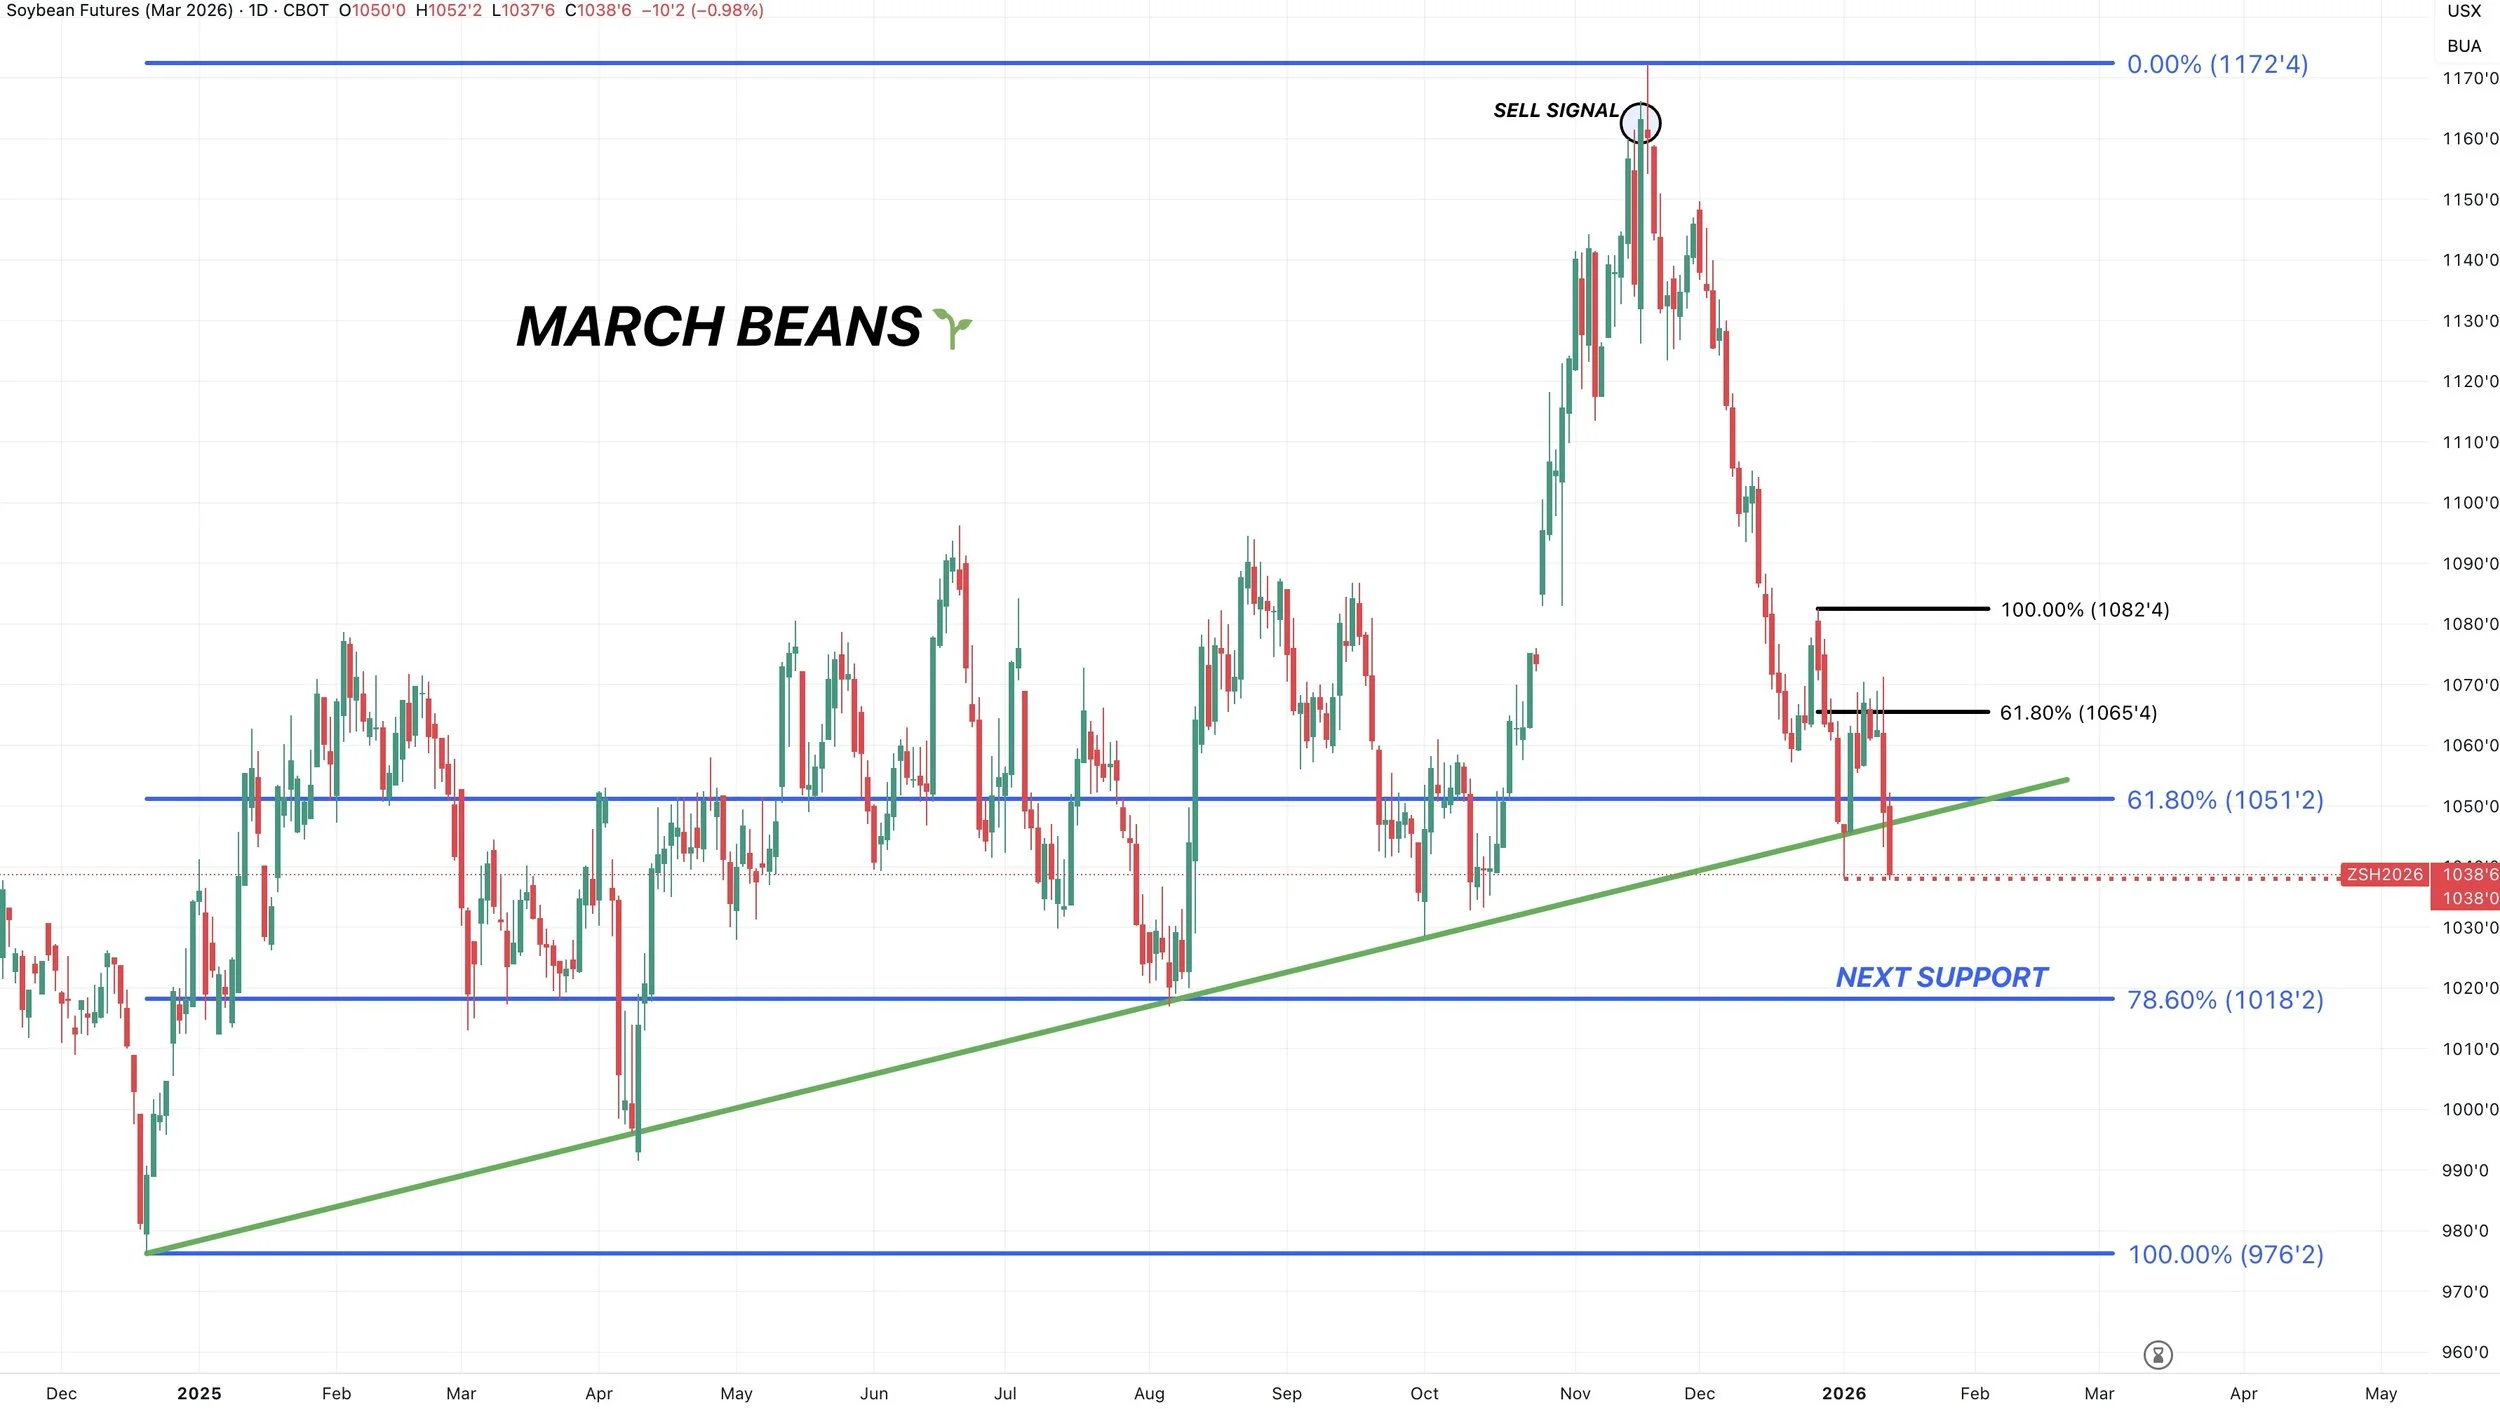
March Beans
The chart doesn’t too great here.
We failed to bust above that 61.8% retracement up to those Christmas highs. Which was the level we need to break to spark further upside.
We now broke that trendline support from contract lows.
We are now sitting right at those lows from new years.
If we fail to hold that level, it could easily open the door another -20 cents lower.
As the next point of interest is going to be the 78.6% level down to contract lows.
Still looking to reward a sizeable relief bounce if it comes.
Wheat
Wheat was trying to breakout before the report but ultimately failed. The data certainly didn’t help, but I'd imagine the collapse in corn spilled over to the wheat market.
There wasn’t a ton of adjustments for wheat in the report.
Wheat had the least bearish report, but like corn and soybeans couldn’t escape the bearish surprises.
Carryout surprised a little high.
Winter wheat plantings were down about -1% vs last year.
But came in higher than the trade was anticipating.
Most feel like this number could work itself lower given that prices are far from appealing.
You could argue that we see some downward revisions come March.

Outside of that, the wheat story still lacks a catalyst and the situation is still far from being bullish.
We have plenty of supply in the US.
The stocks to use increased once again.
(Red dot is previous month)
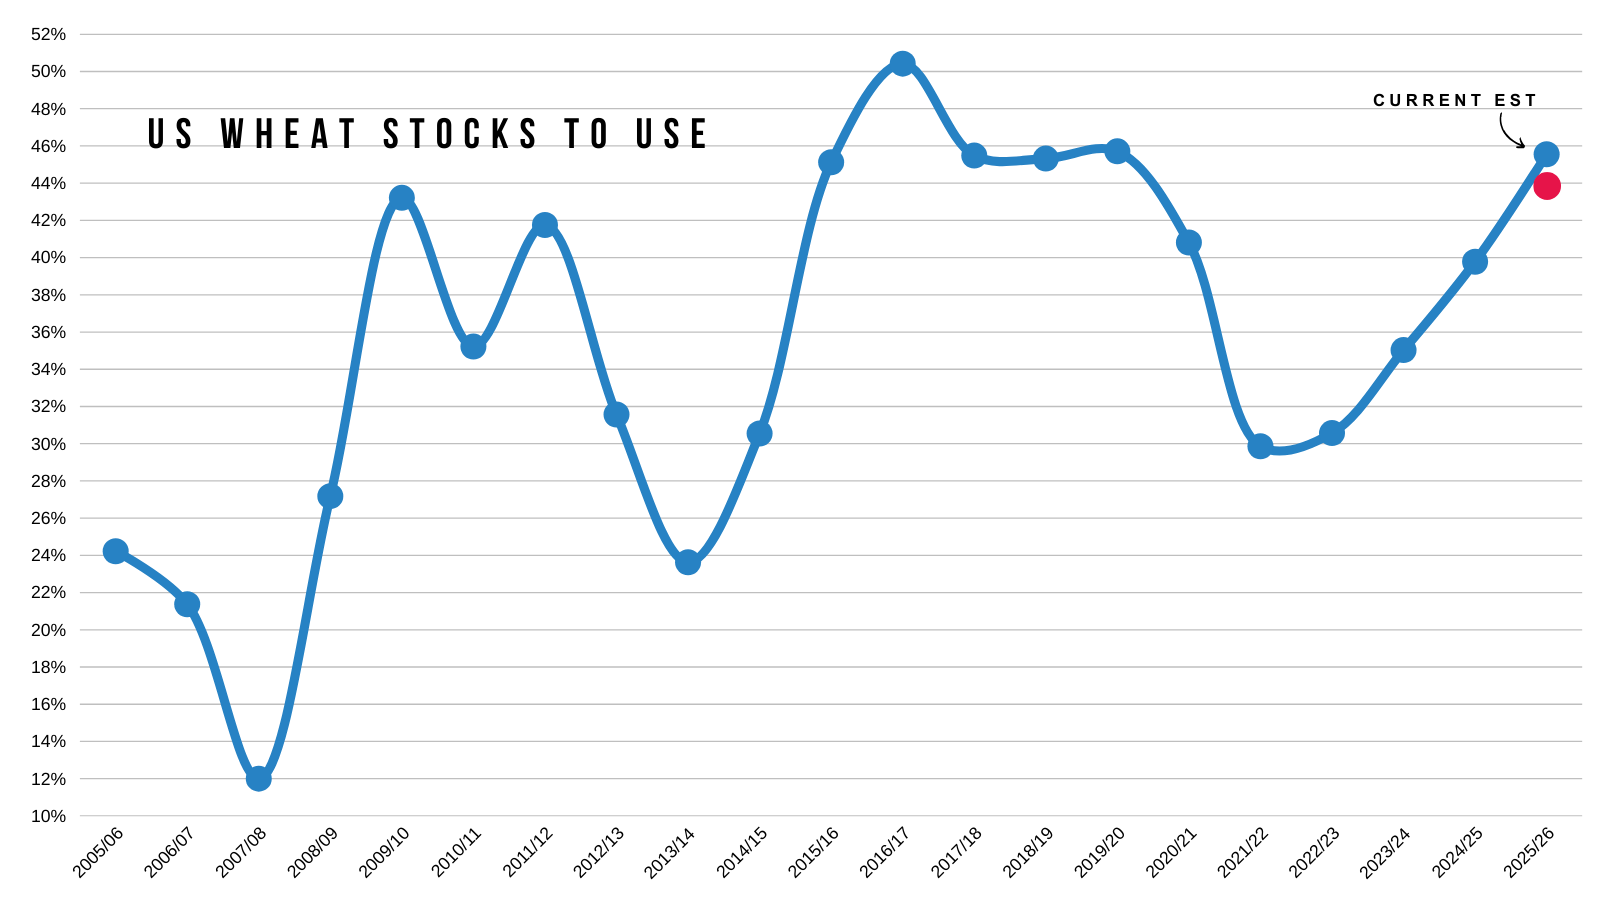
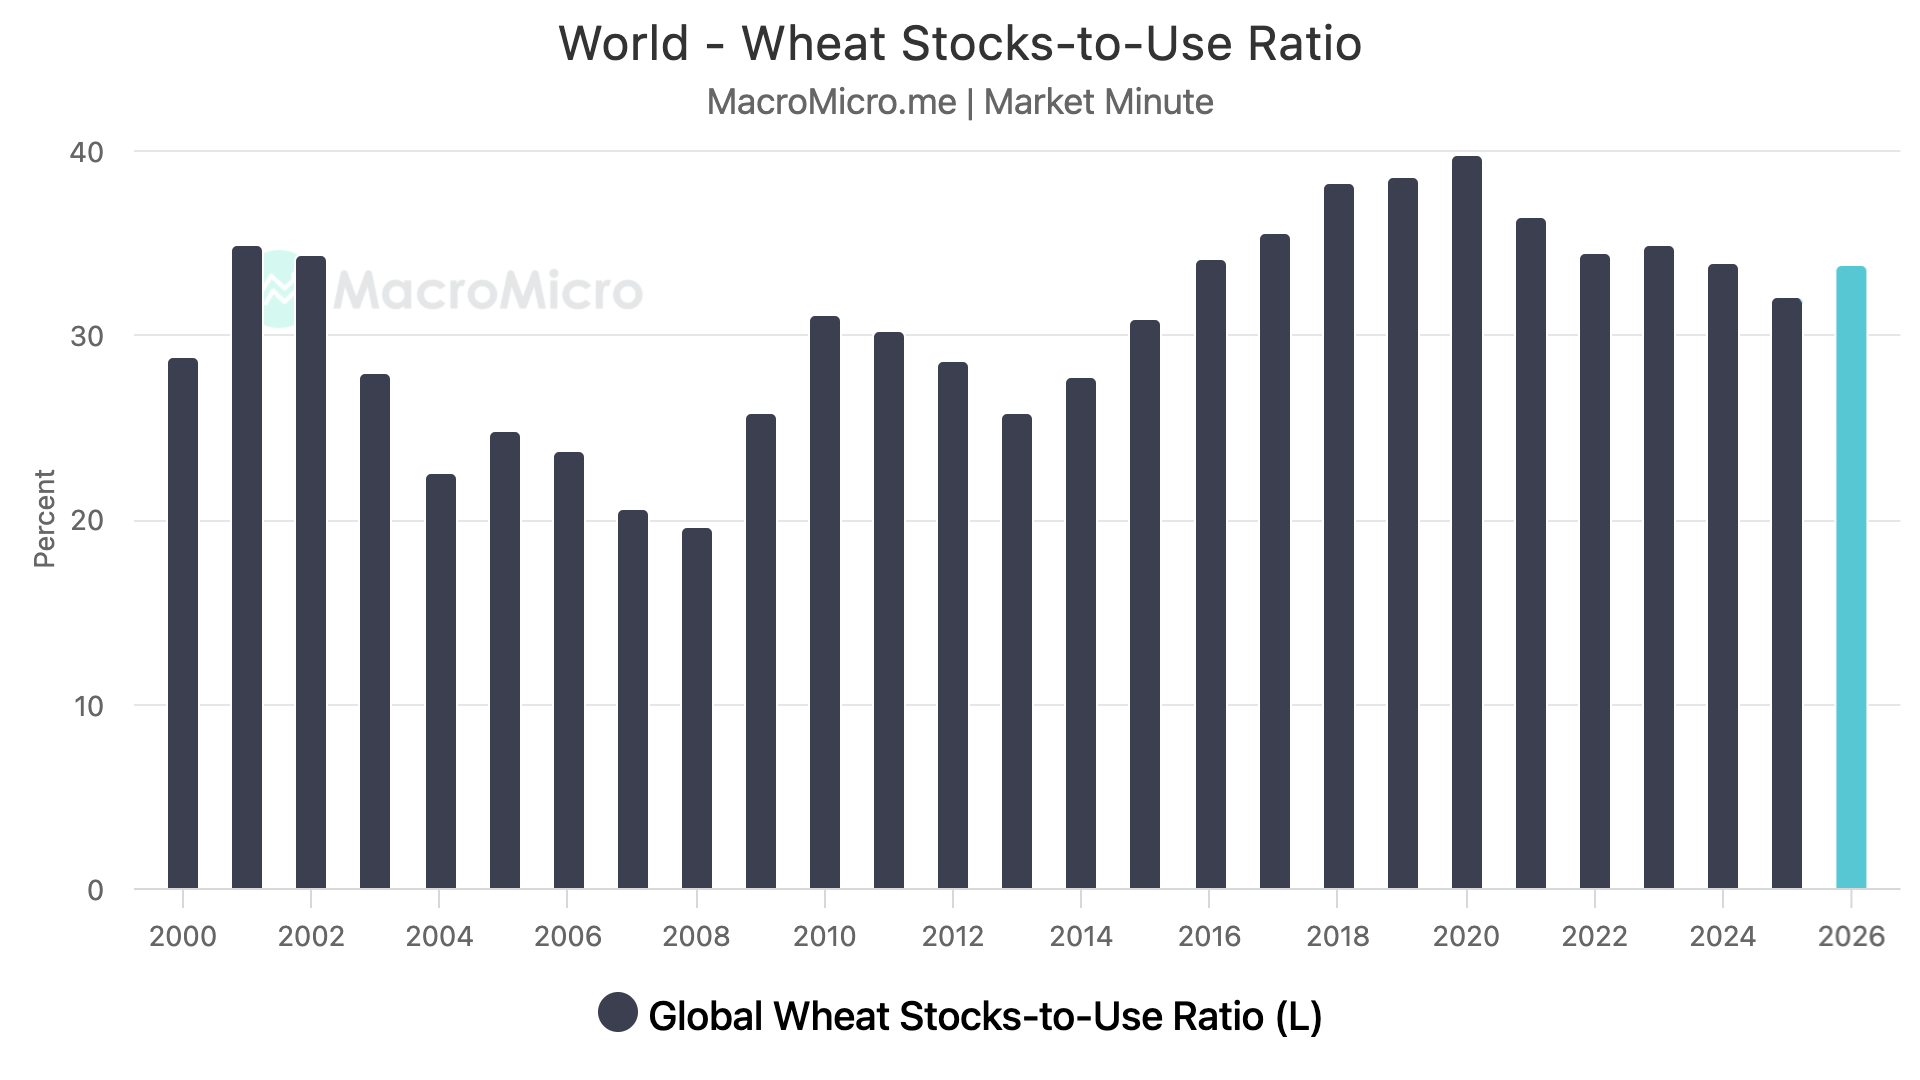
We also still have plenty of supply globally.
Without a major global player having any supply or weather issues, it just makes it hard for the wheat market to catch a real bid.
There will be a concern somewhere eventually, but for now there just isn’t.
Still remaining as patient as I can in wheat.
We don’t have a reason to get overly bullish. But at the same time, it's hard to justify being bearish at $5.00 wheat.
Seasonally, the wheat market tends to get it's biggest opportunity of the year during the spring.
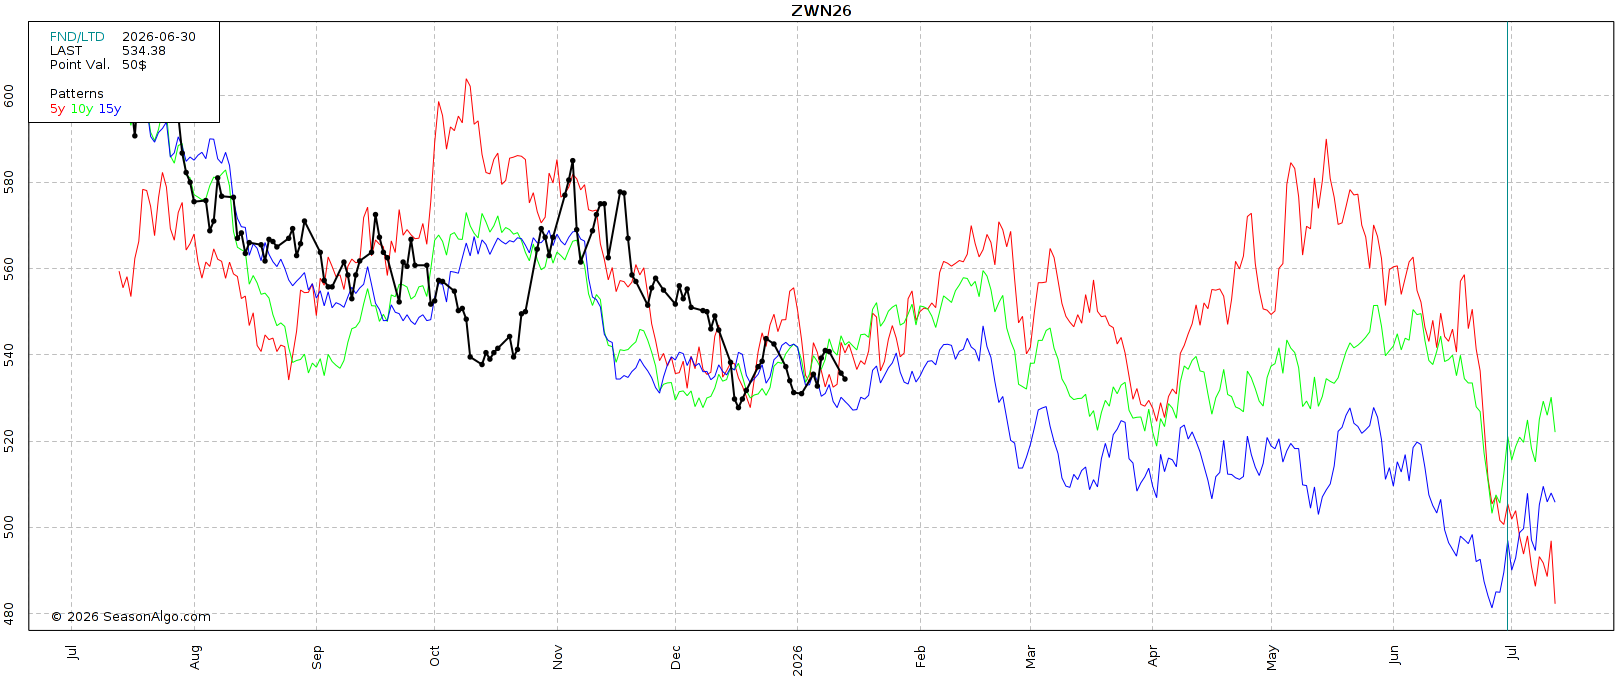
Chicago Seasonal
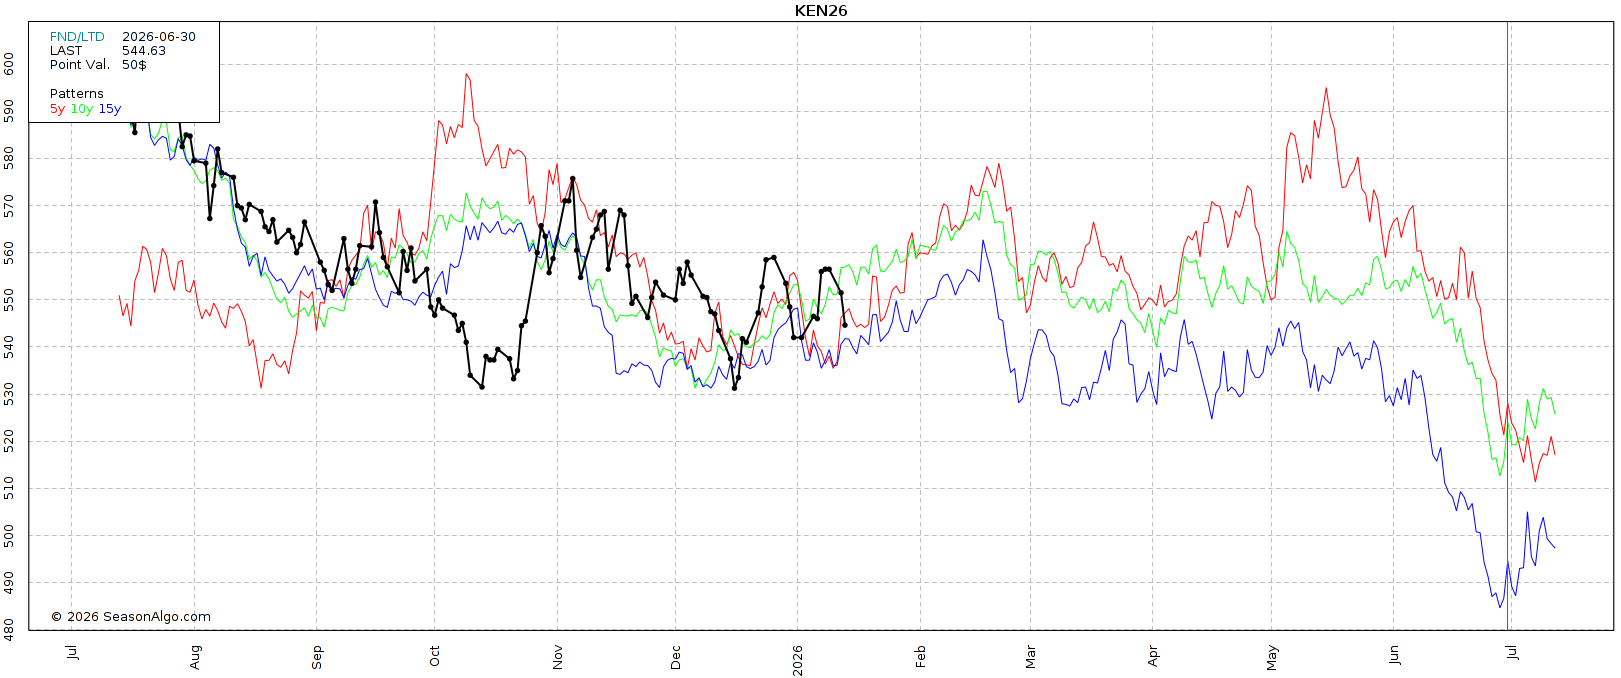
KC Seasonal
Technicals:
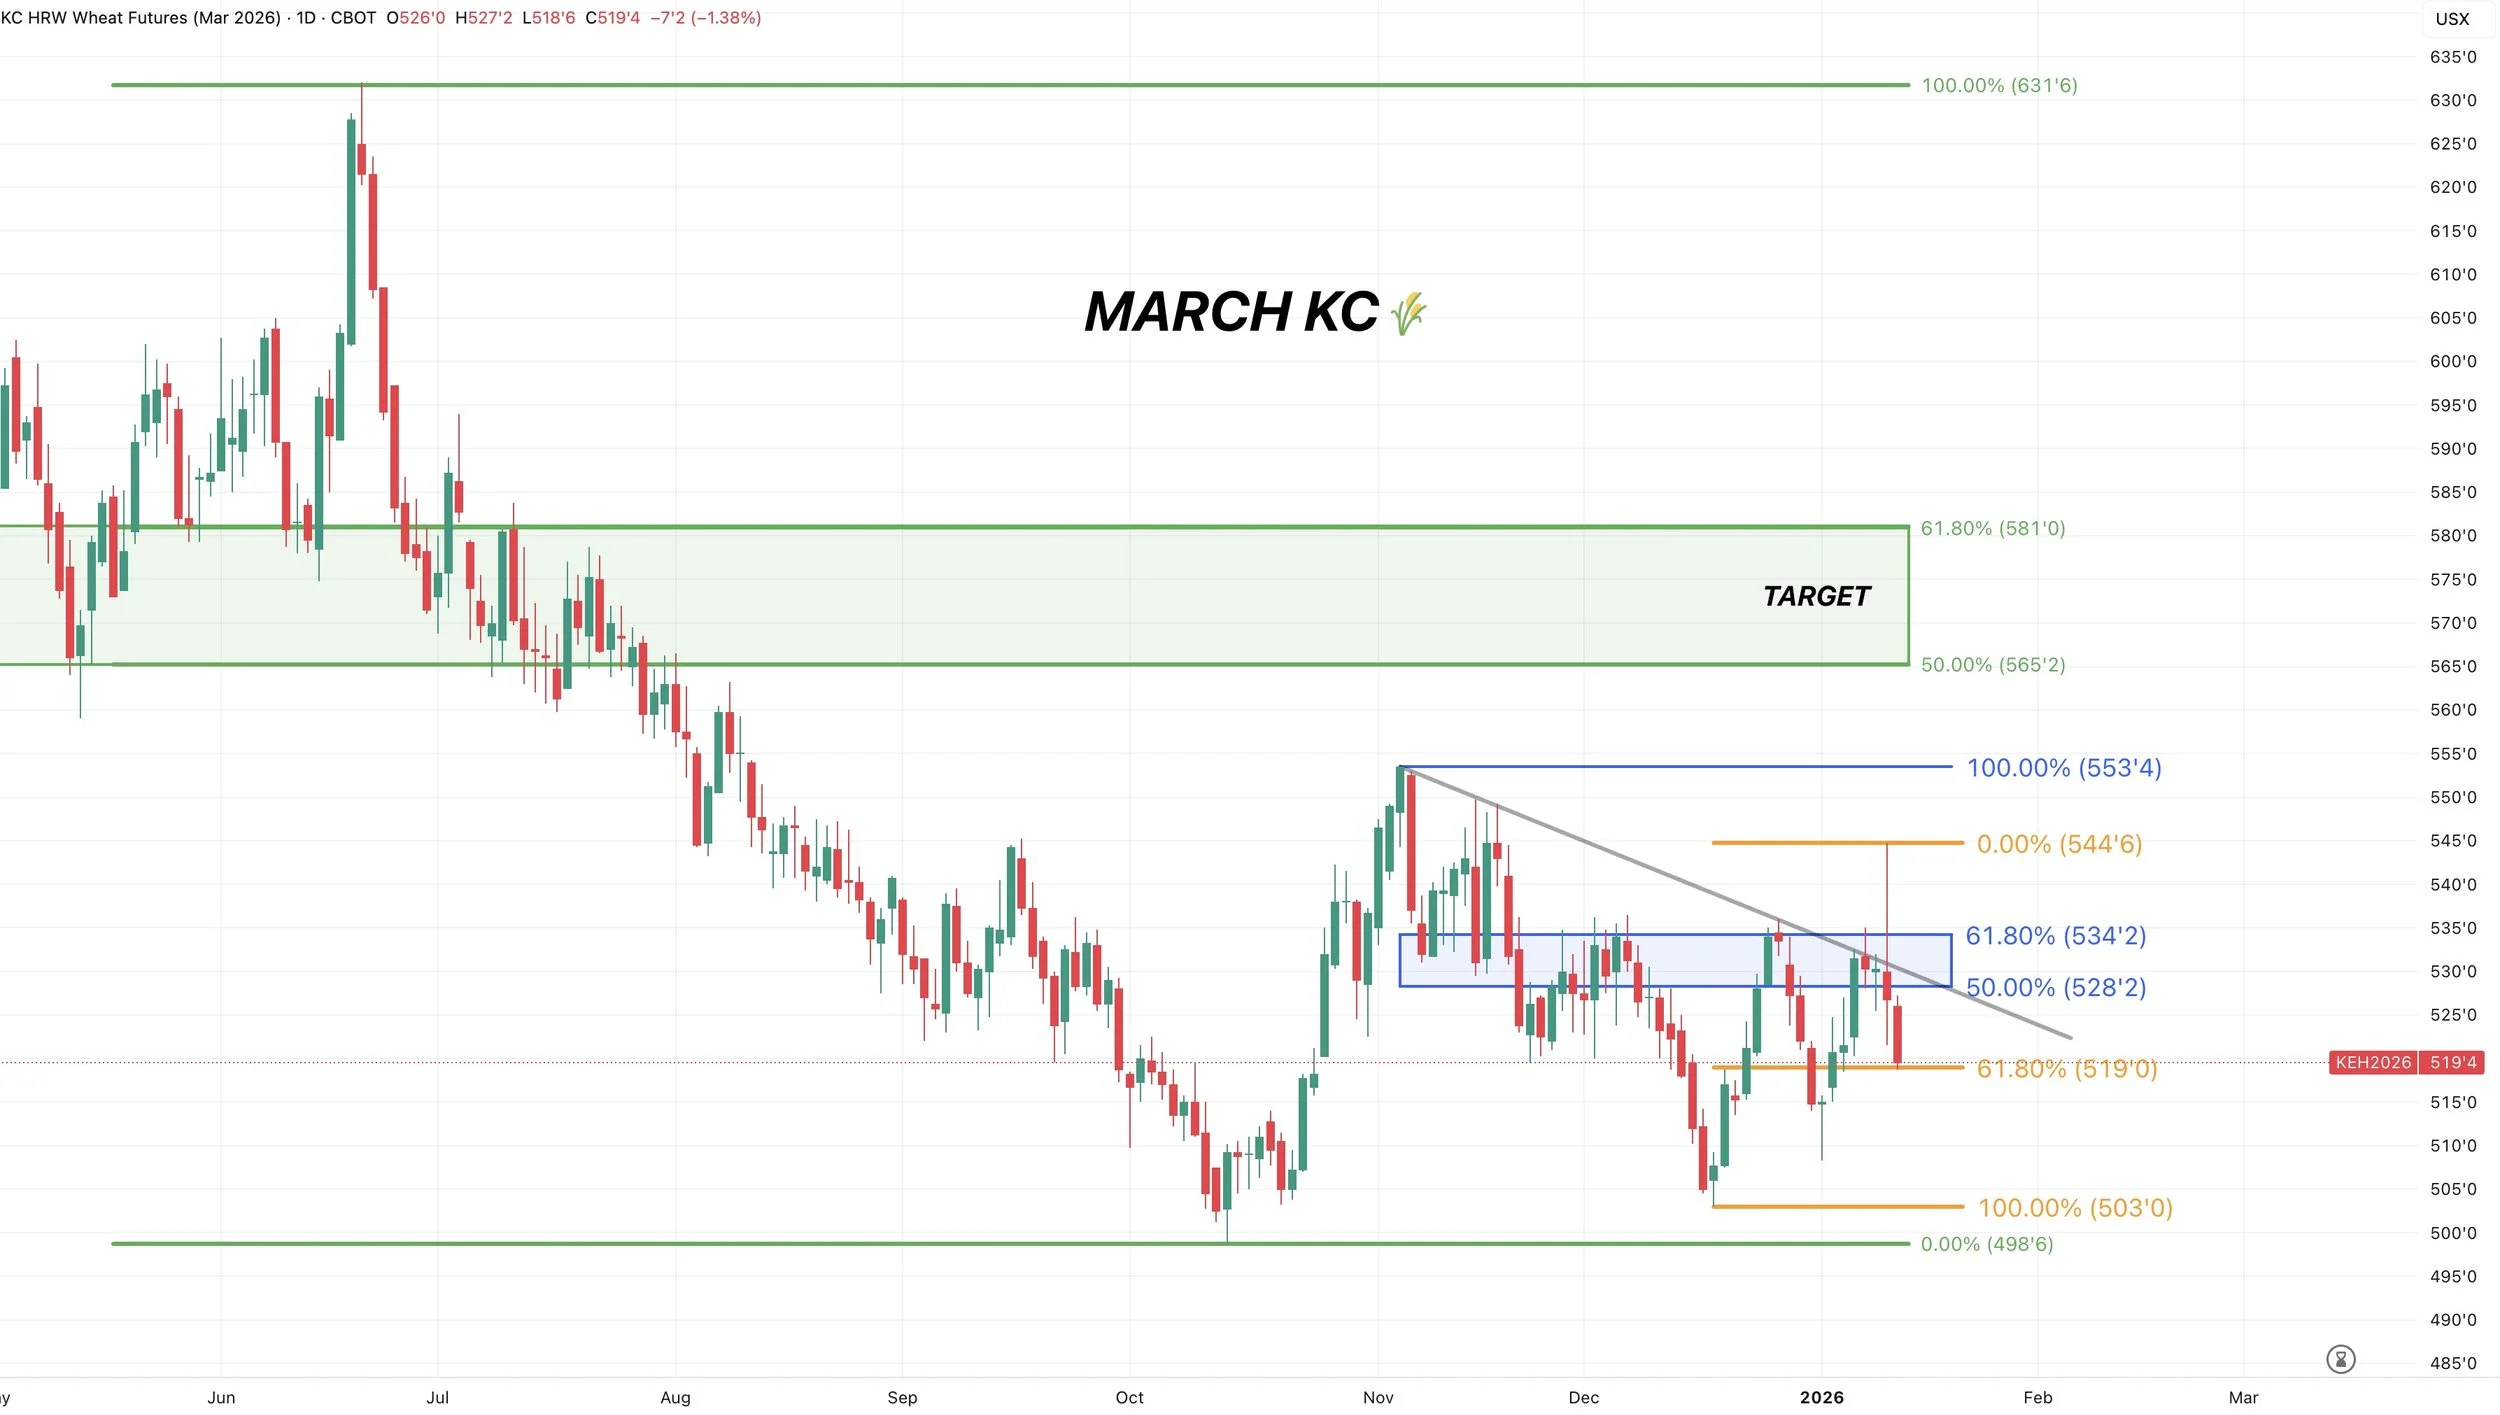
March KC
We failed right at that 61.8% retracement up to those Nov highs once again.
We also failed to break trendline resistance.
That $5.35 level is still the clear level bulls need to break to get a leg higher.
In the meantime, we've now given back 61.8% of yesterday's highs down to those Dec lows. Important spot to hold here.
If we fail to hold here, we could go test those lows.
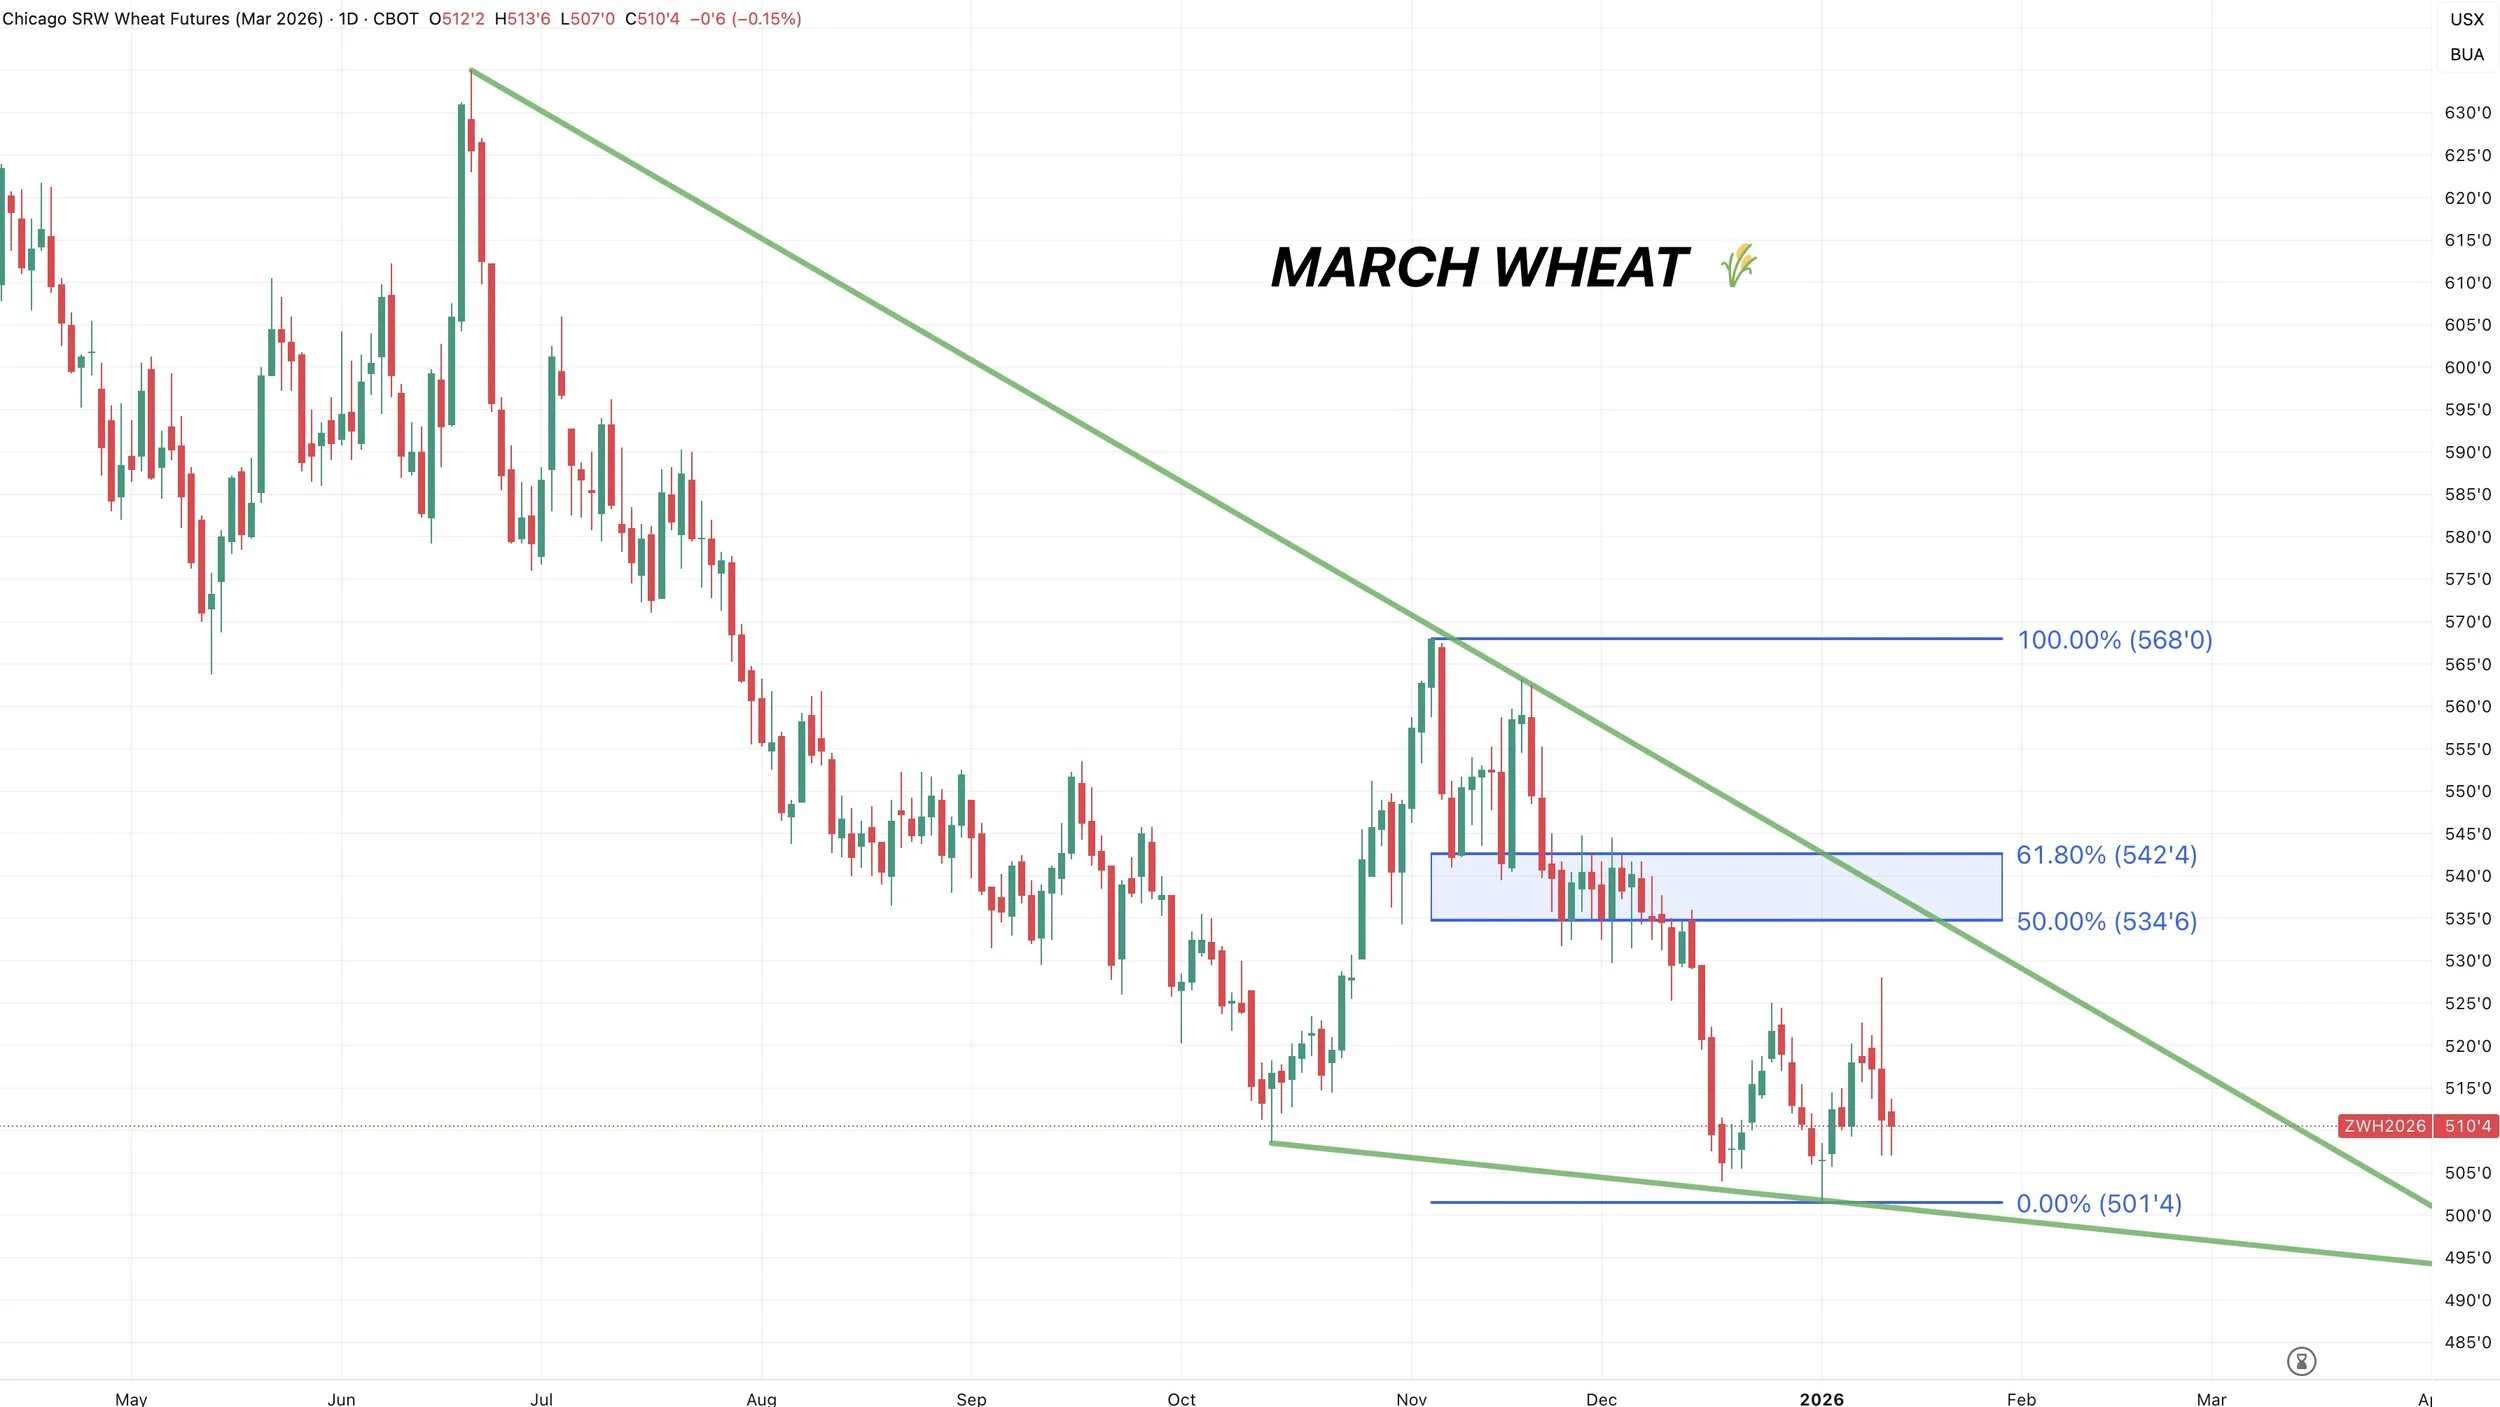
March Chicago
Nothing to update here.
Simply consolidating near the lows.
Cattle
Fundamentals:
Not a ton on cattle today as today's focus in the update was the USDA report and the grains.
Cattle continues to push higher with the lower corn.
It makes the cost of gain cheaper so you can theoretically pay for more cattle.
Which often supports feeders the most because feedlots can pencil better margins and theoretically bid more aggressively for feeder cattle.
The cattle situation is still tight.
However, I am skeptical that we have much more upside for beef demand here.
Here is an interesting tweet I saw from Swift Trading.
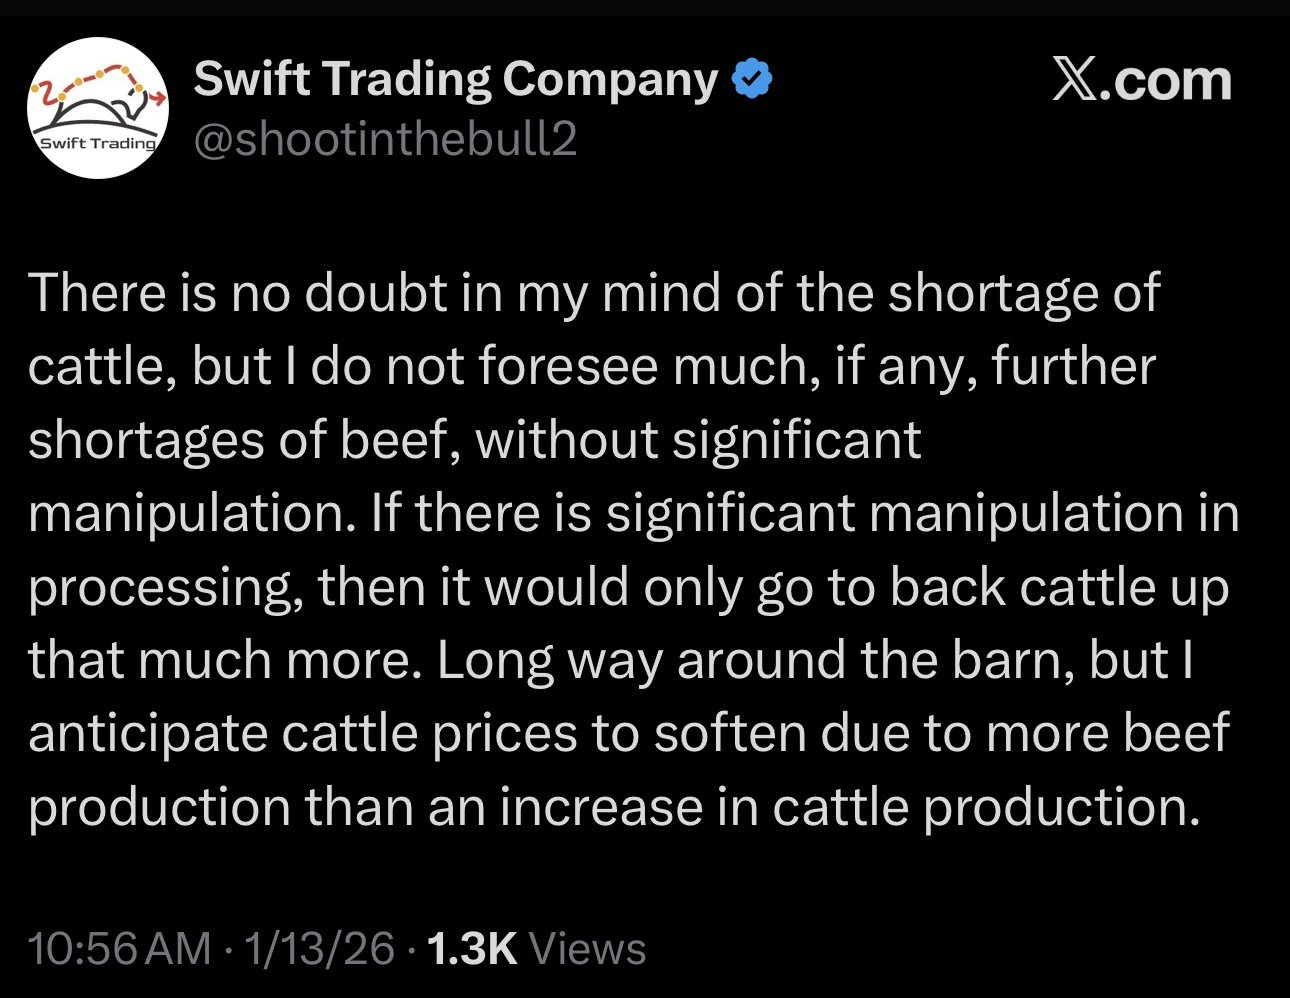
They make a good argument.
They argue that yes cattle supply is tight, but that doesn’t automatically mean beef gets tighter from here.
They are basically saying that cattle can be tight while beef production still holds up because carcass weights can increase, and slaughter pace can stay strong. You can end up with more beef showing up, even without more cattle showing up.
Cheap corn and a high cattle market will also incentivize heavier carcass weights. That is a metric we need to continue to monitor here.
So if beef production stays steady and demand isn’t growing, then you could argue cattle prices might need to soften because the beef pipeline isn’t getting tighter.
Overall, the cattle market clearly remains bullish with the big picture tight supply story.
But I am still using caution up here as some areas of demand aren’t showing a lot of room for further upside. Such as weak cut out.
The wholesale side of things are also showing some signs of weakness. For example, rib primal value is -26% lower than a month ago. Which feels important because when the wholesale side gets weak, it can often be a sign that demand is getting tapped out at these levels.
There is talk about a dairy buy out program in attempts to get ground beef prices lower. But from what I've heard, it doesn’t sound like it will be happening. The trade hasn’t seemed to care about it either.
Technicals:
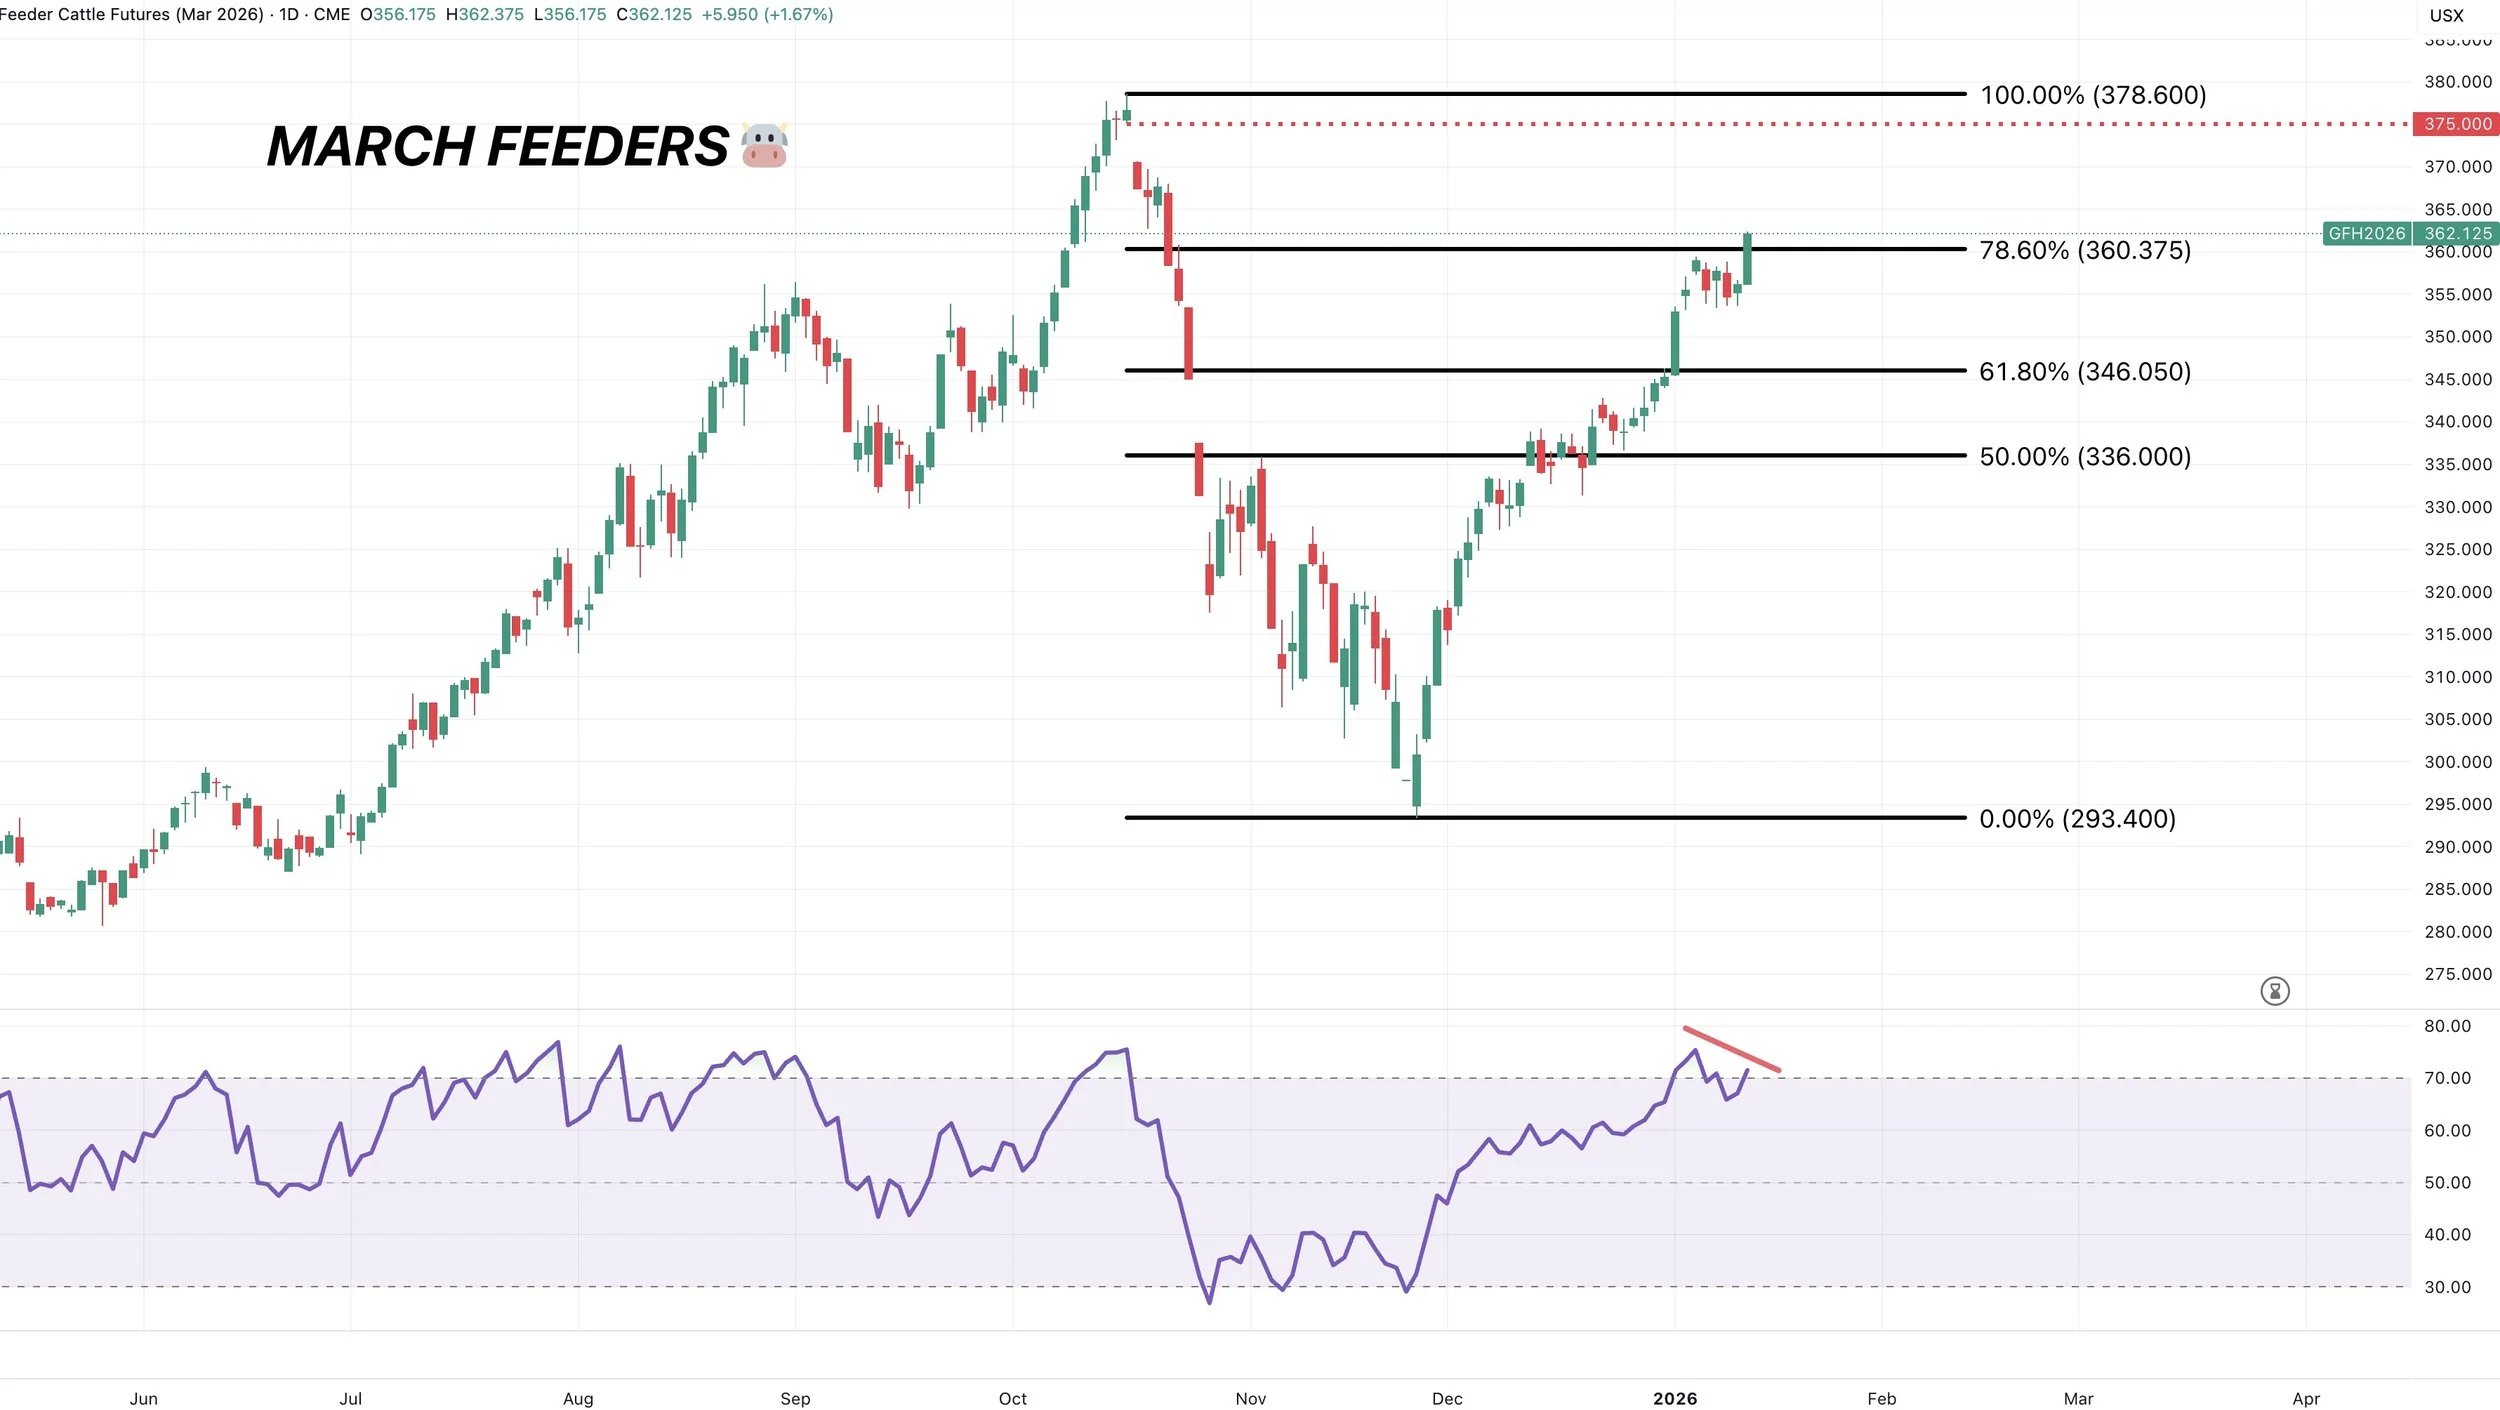
March Feeders
We are now above the 78.6% level of the entire sell off.
So from a technical standpoint, the next point of interest is that last gap and those highs.
We are showing some bearish divergence on the RSI. Just a reason to have some caution as well. Prices made new highs, the RSI did not.
Overall, we still like defending these levels in some sort of matter if you have not yet done so. It's hard to call a top in a bull market.
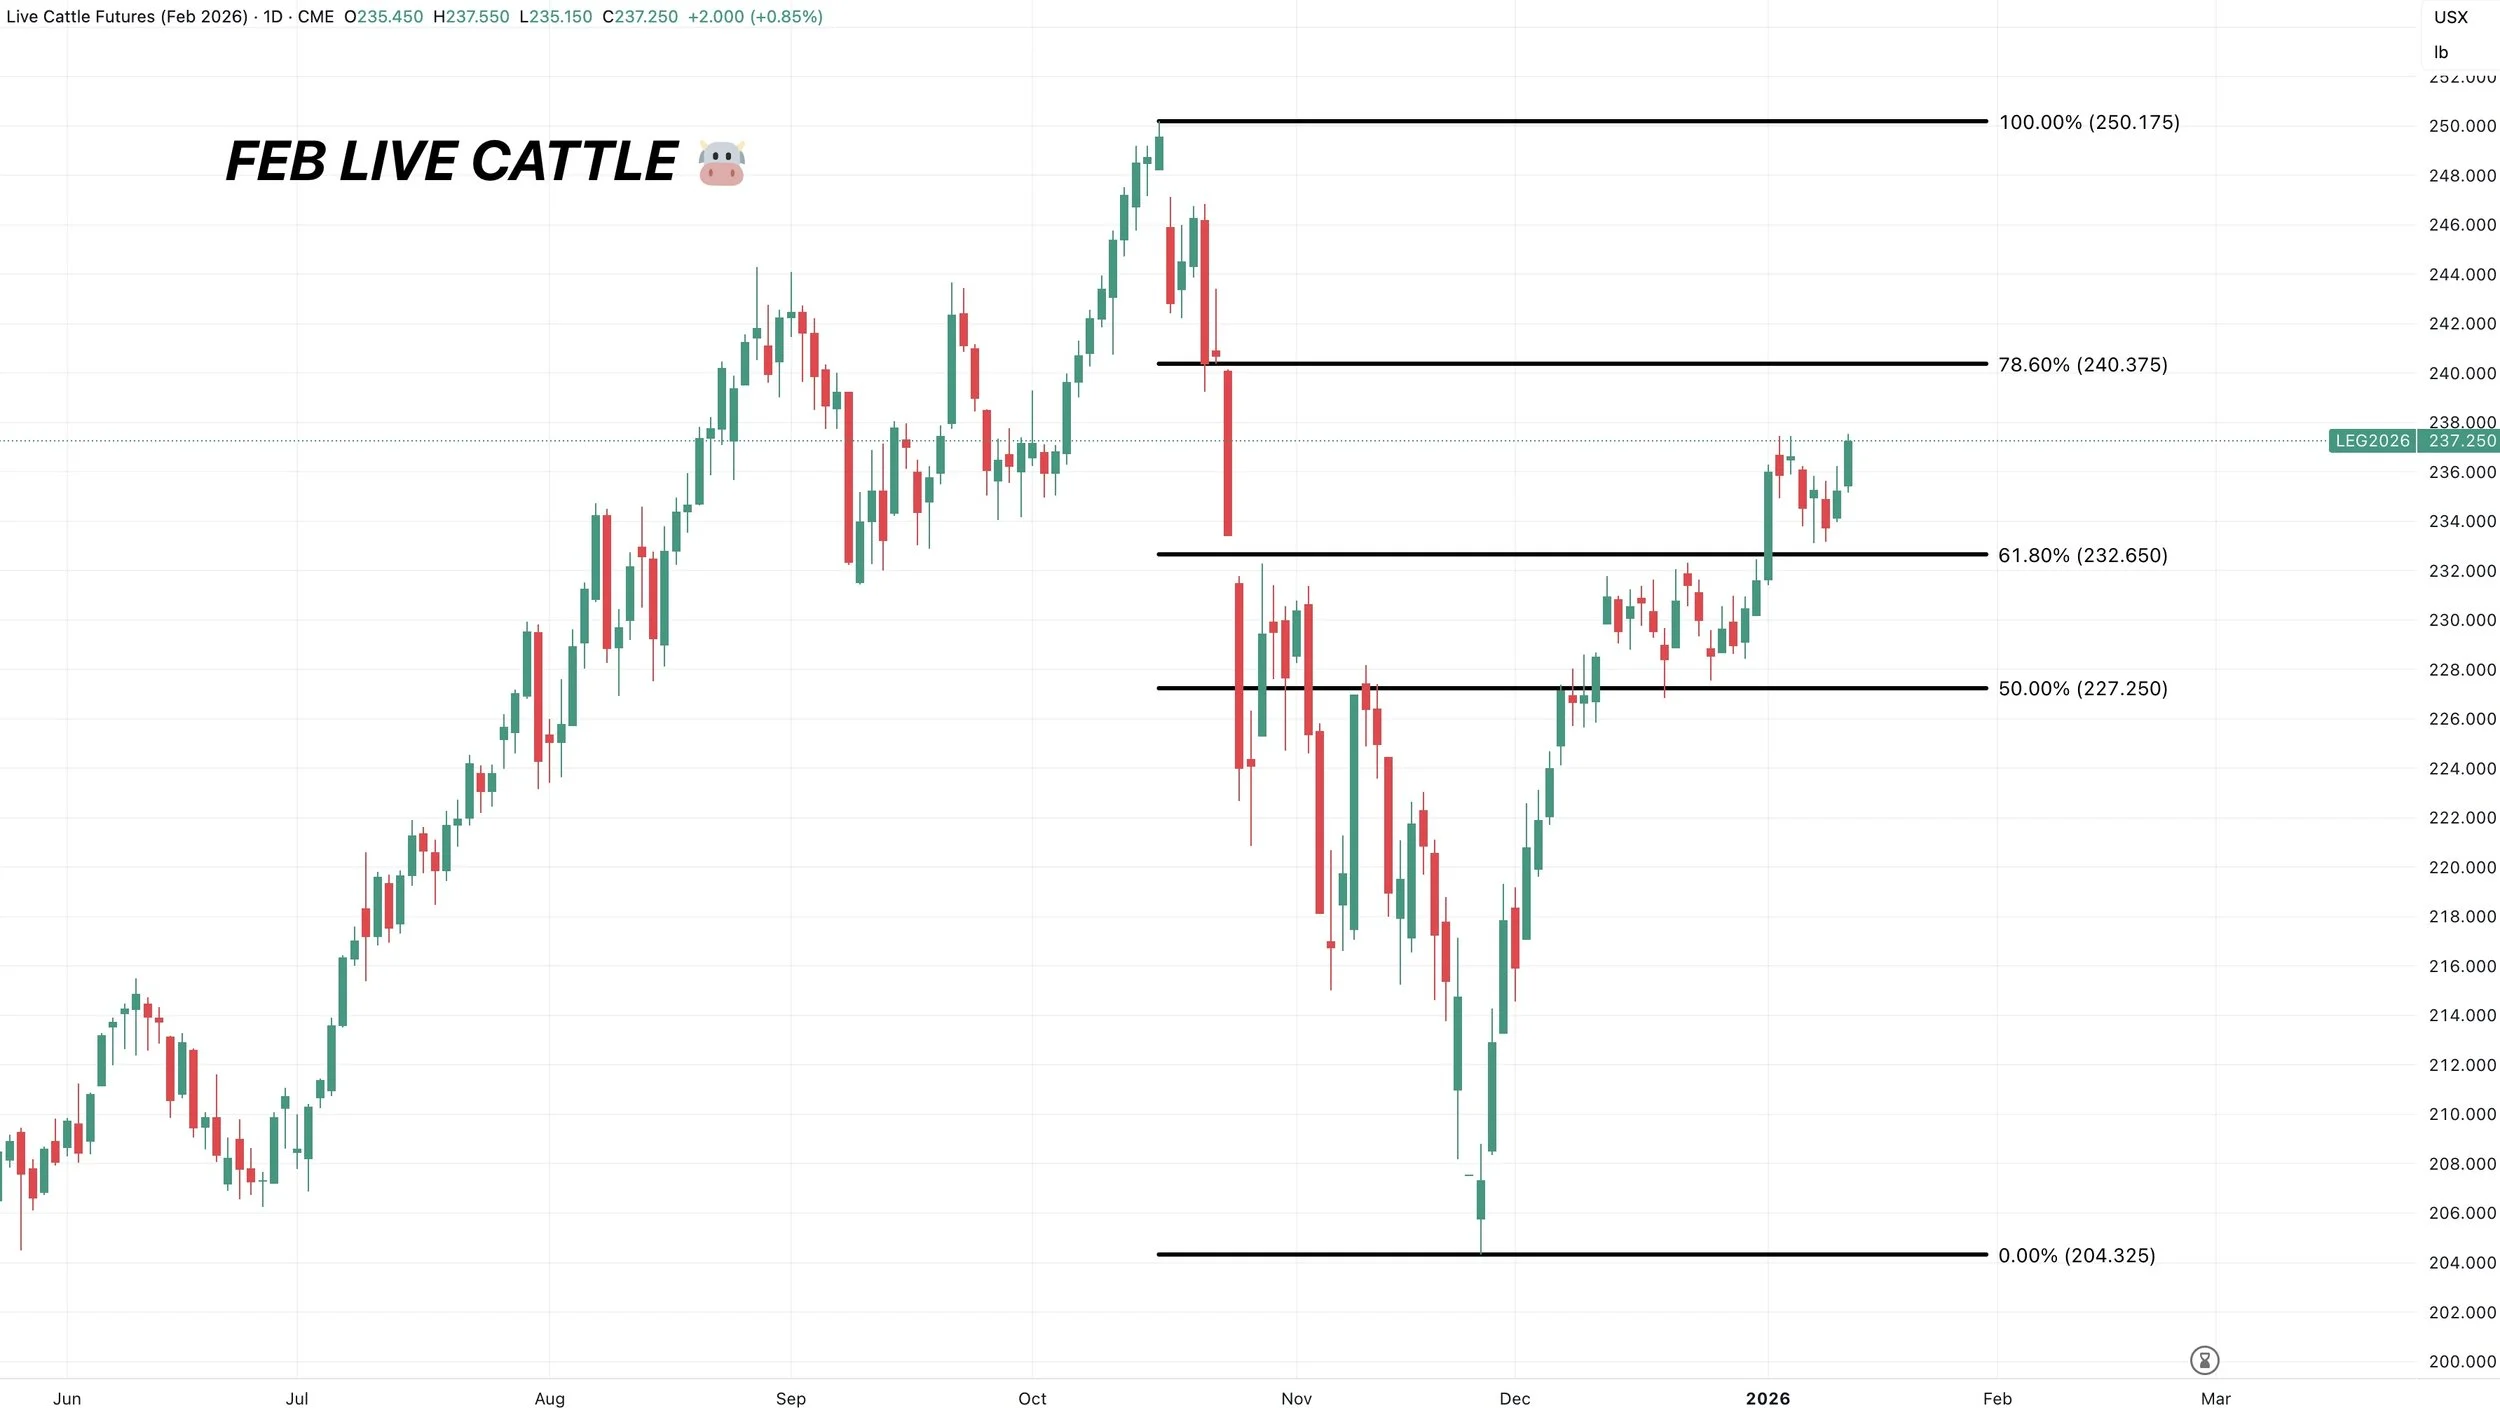
Feb Live
Next point of interest is the 78.6% level just over 240.
Past Sell or Protection Signals
Dec 11th: 🐮
Cattle sell signal & hedge alert.
Dec 5th: 🐮
Cattle sell signal & hedge alert.
Nov 17th: 🌱
Soybean sell signal & hedge alert.
Nov 13th: 🌽 🌱
Managing risk in corn & beans ahead of USDA report.
Oct 28th: 🌽
Corn sell signal & hedge alert.
Oct 27th: 🌱
Soybean sell signal & hedge alert.
Oct 13th: 🐮
Cattle sell signal & hedge alert.
Aug 22nd: 🌱
Soybean sell signal & hedge alert.
July 31st: 🐮
Cattle sell signal & hedge alert.
July 10th: 🐮
Cattle sell signal & hedge alert.
CLICK HERE TO VIEW
June 5th: 🐮
Cattle sell signal & hedge alert.
June 2nd: 🌾
MPLS wheat sell signal.
April 10th: 🌽
Old crop corn sell signal.
March 19th: 🐮
Cattle hedge & sell signal.
Feb 18th: 🌽 🌾
Old crop KC wheat & old crop corn signal.
Jan 23rd: 🌽 🌱
Corn & beans old crop sell signal.
CLICK HERE TO VIEW
Jan 15th: 🌽 🌱
Corn & beans hedge alert/sell signal.
Jan 2nd: 🐮
Cattle hedge alert at new all-time highs & target.
Dec 11th: 🌽
Corn sell signal at $4.51 200-day MA
CLICK HERE TO VIEW
Oct 2nd: 🌾
Wheat sell signal at $6.12 target
Sep 30th: 🌽
Corn protection signal at $4.23-26
Sep 27th: 🌱
Soybean sell & protection signal at $10.65
Sep 13th: 🌾
Wheat sell signal at $5.98
May 22nd: 🌾
Wheat sell signal when wheat traded +$7.00
Want to Talk?
Our phones are open 24/7 for you guys if you ever need anything or want to discuss your operation.
Hedge Account
Interested in a hedge account? Use the link below to set up an account or shoot Jeremey a call at (605)295-3100.