
HISTORY OF JAN USDA
MARKET UPDATE
You can scroll to read the usual update as well. As the written version is the exact same as the video.
Timestamps for video:
Overview: 0:00min
Jan USDA: 2:20min
Corn: 4:40min
Beans: 10:00min
Wheat: 12:45min
Cattle: 13:50min
Want to talk about your situation?
(605)250-3863
Futures Prices Close
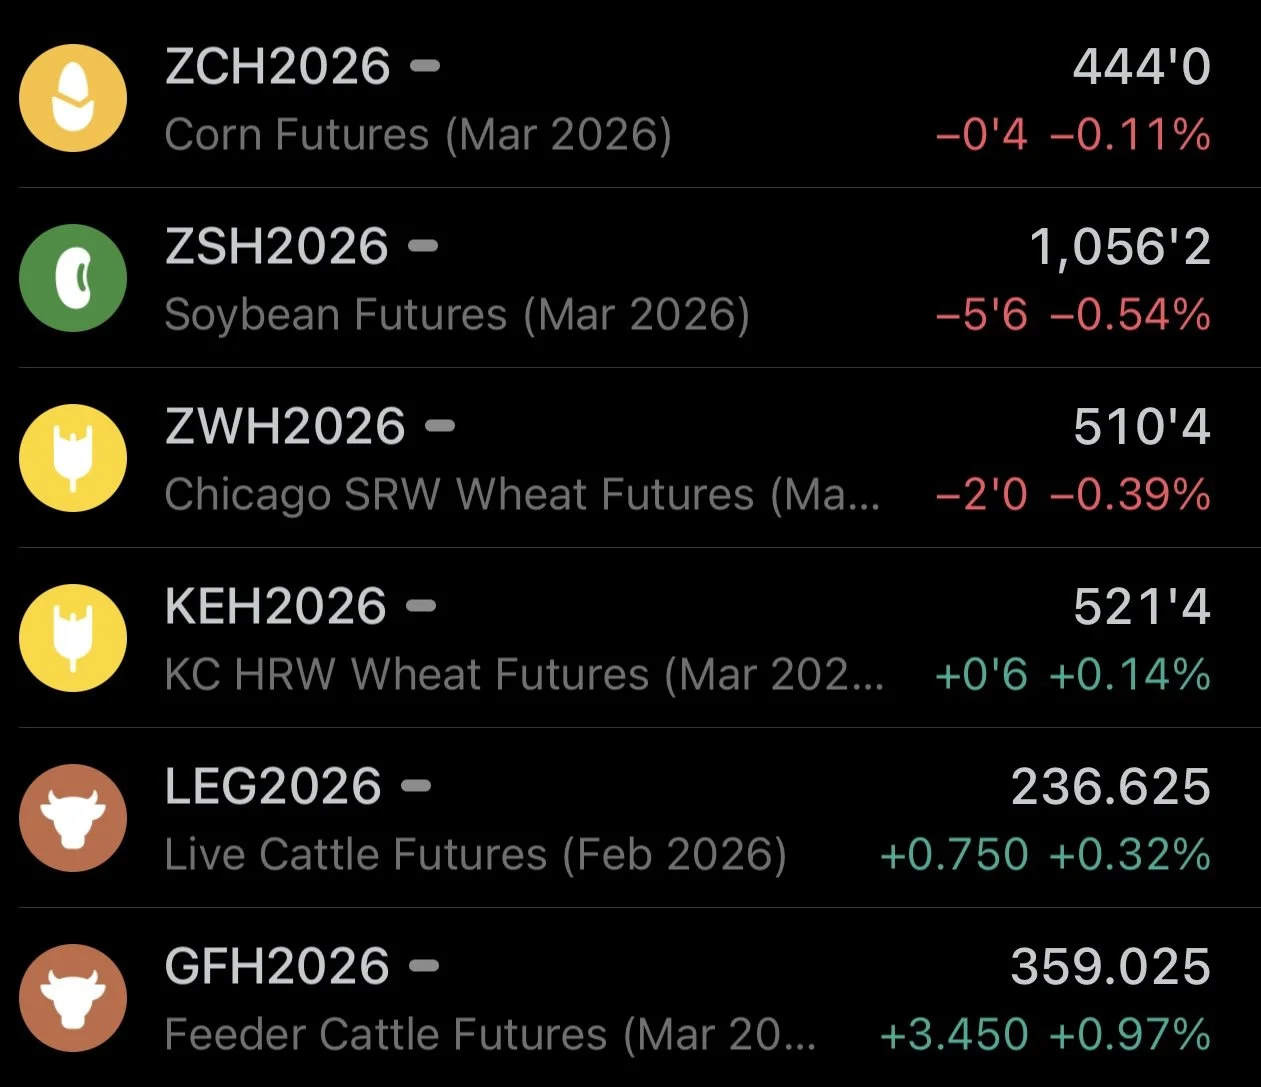
Overview
Grains mixed while cattle led the way higher.
The markets are back out of holiday mode but overall we still lack a ton of fresh news. With all eyes set on next week's USDA report.
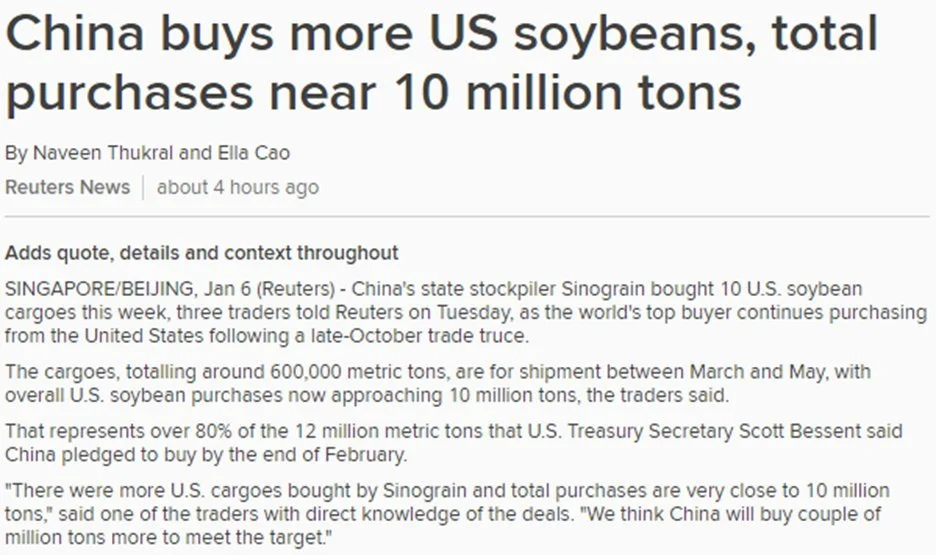
We did see China buy more US soybeans. With a 336k MT flash sale this morning.
They've officially bought around 7.2 MMT, which is 60% of the 12 MMT goal.
Chart from GrainStats
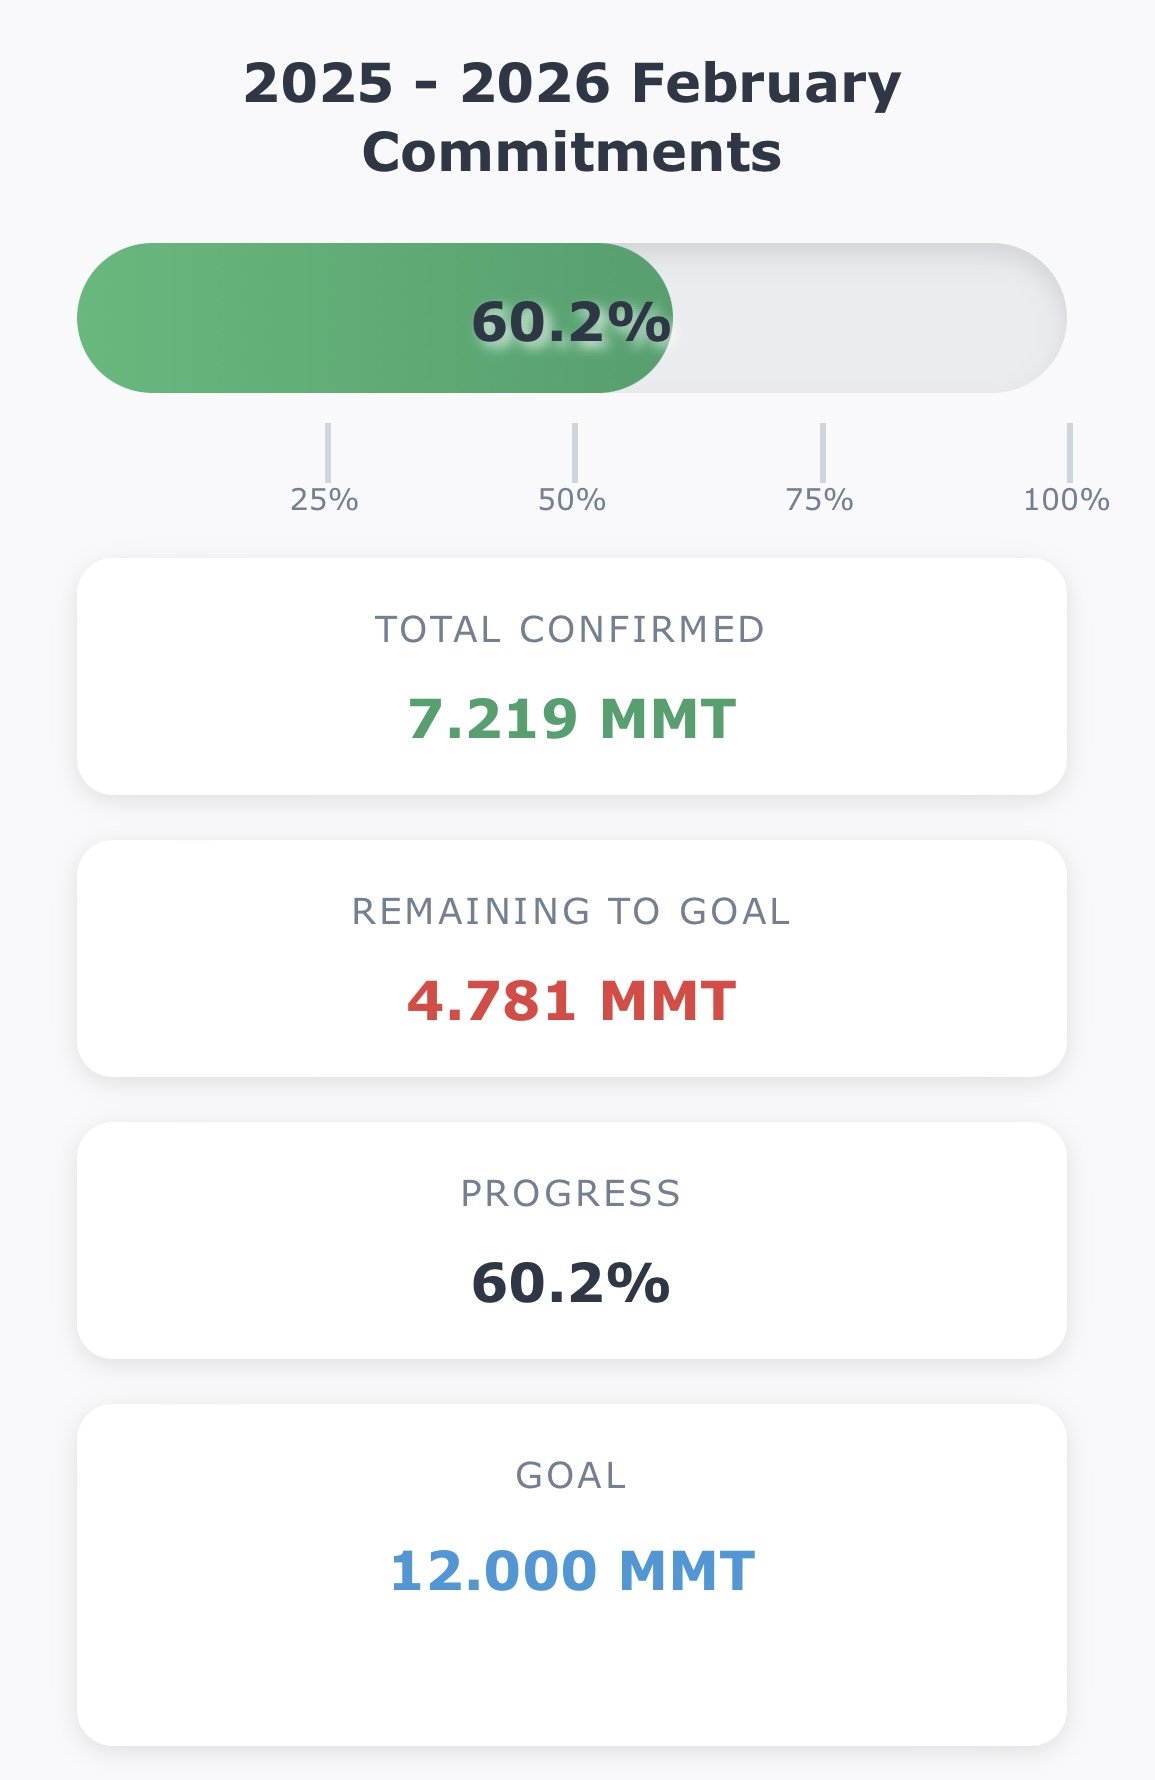
However, rumors speculate that they've actually bought closer to 10 MMT. Which would be 80% of the goal.
So it doesn’t look like it should be too hard to reach that goal by the end of February, which was Scott Bessents deadline.
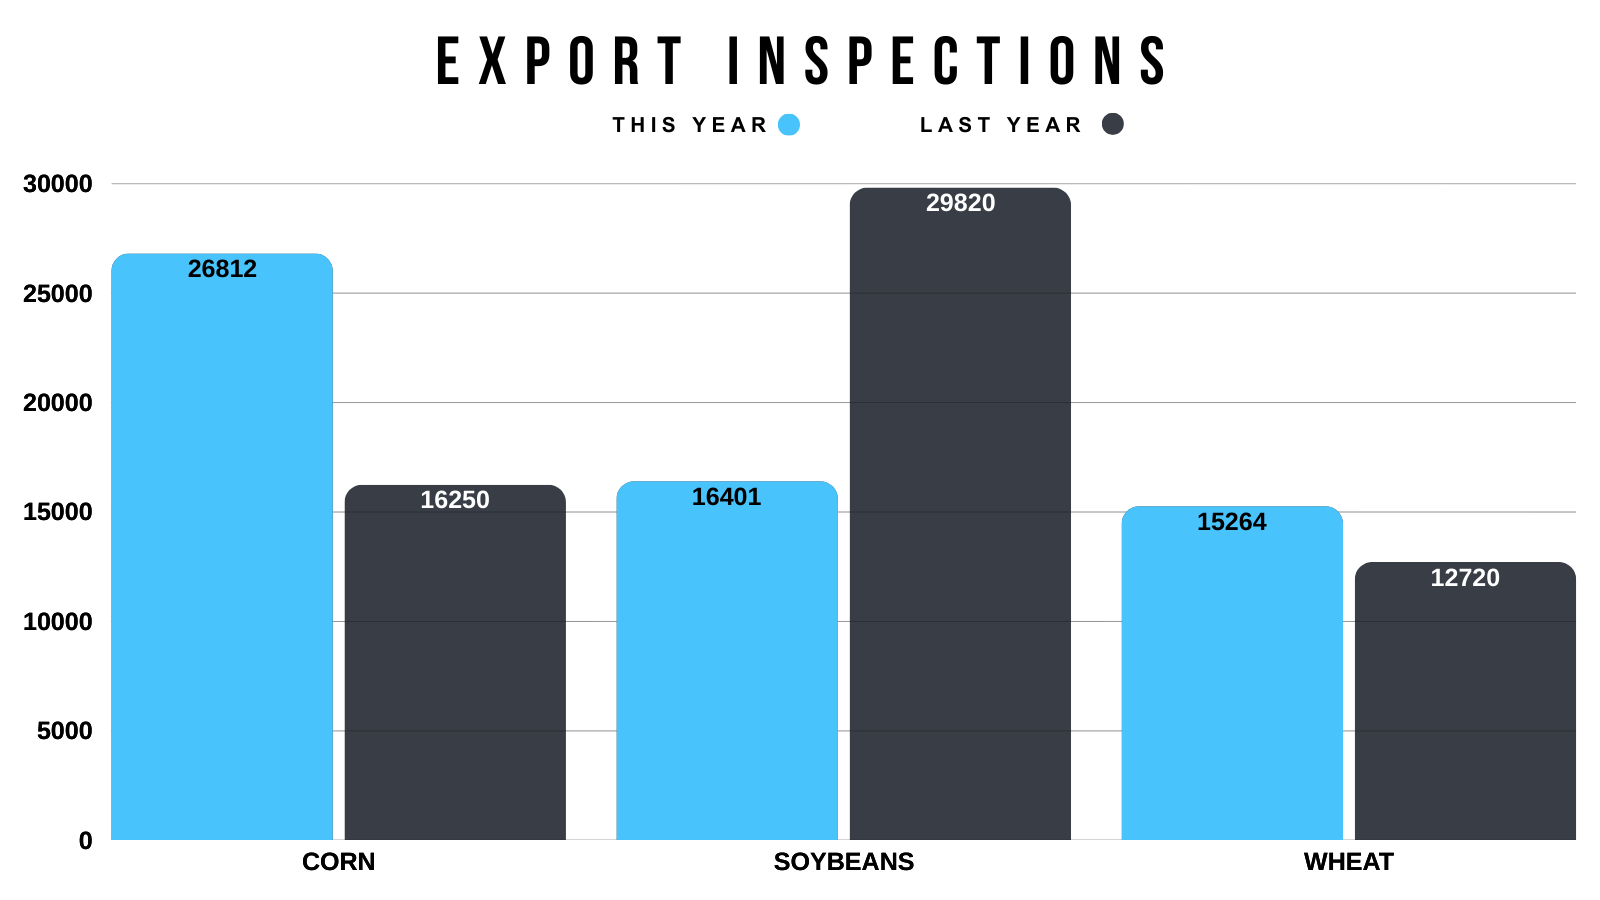
Export Inspections vs Last Year
This Year vs Last Year
Corn: +65%
Beans: -45%
Wheat: +20%
Corn demand remains phenomenonal.
Soybean demand continues to be some of the weakest on record.
Wheat demand continues to impress.
The Funds
We are finally getting caught up on all of the delayed data from the government shut down.
The funds positioning is fully up to date now.
Their positions:
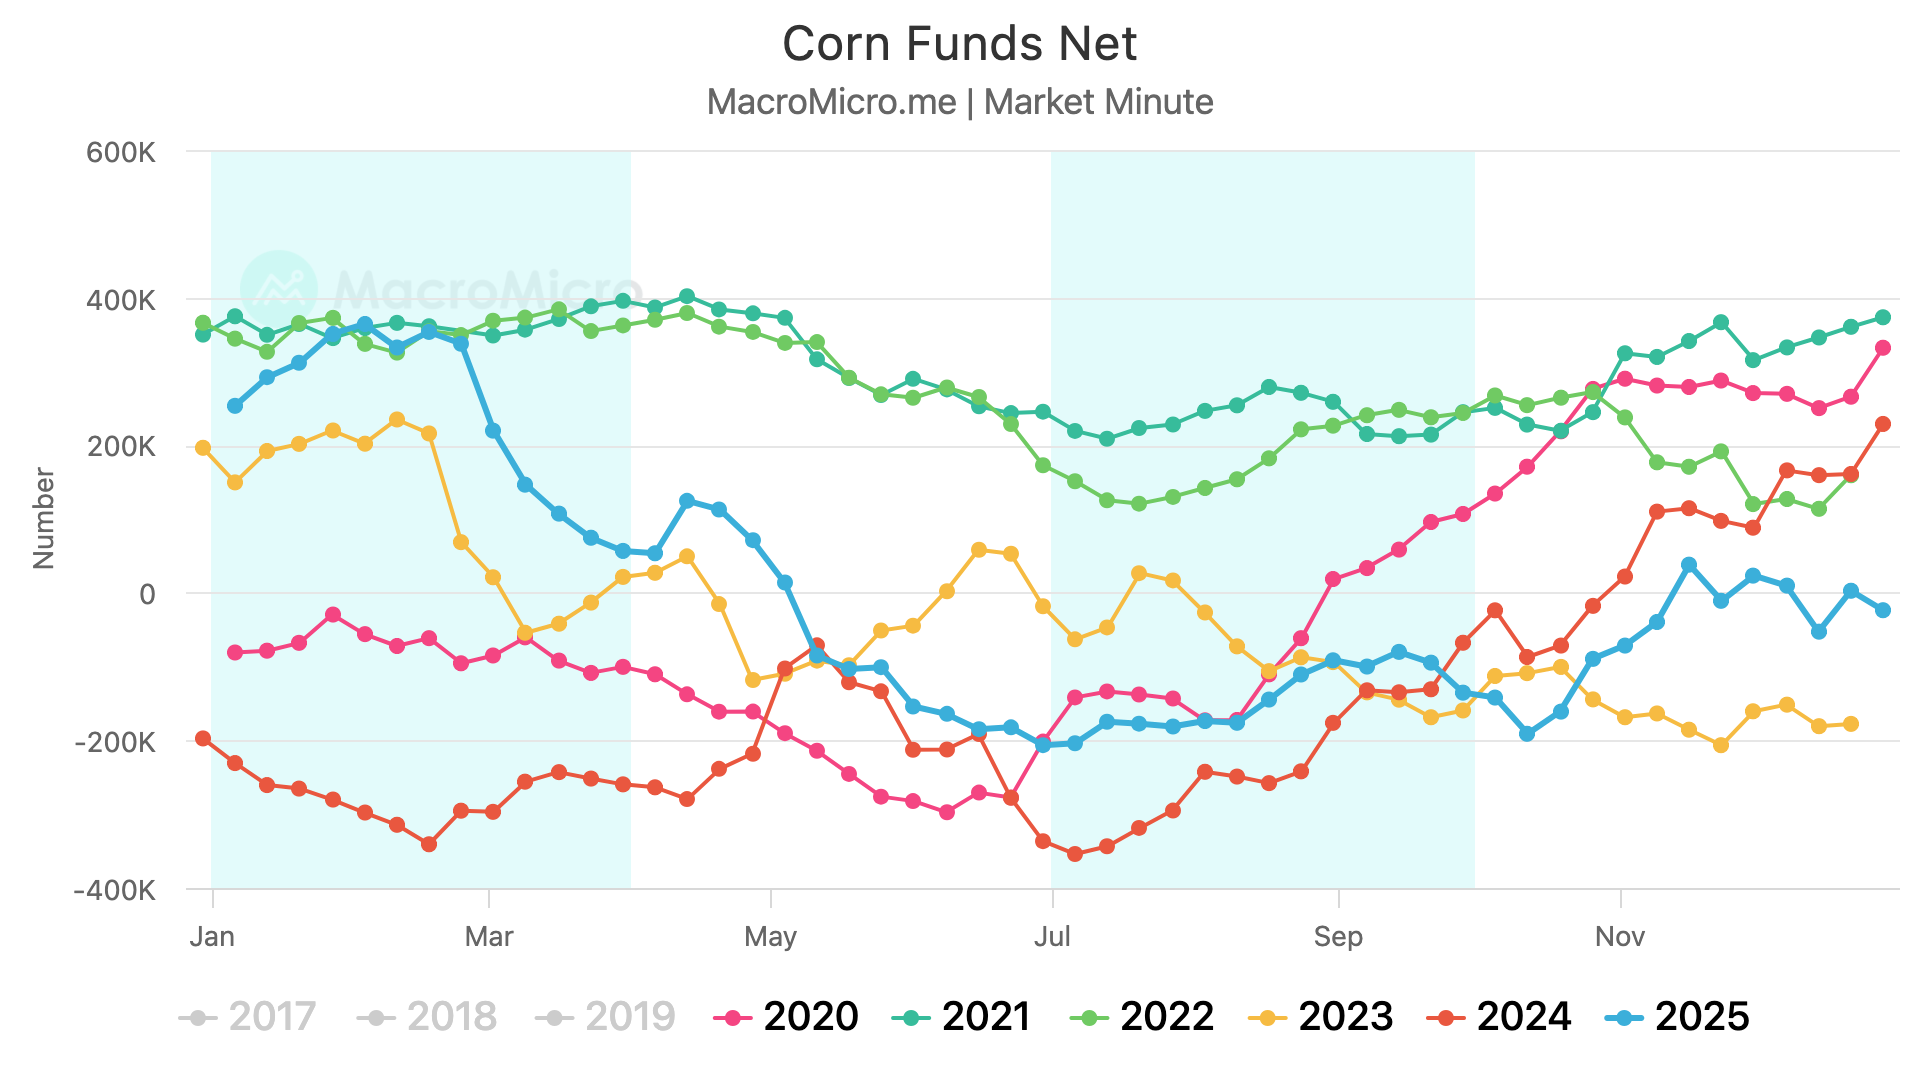
Corn: -23k
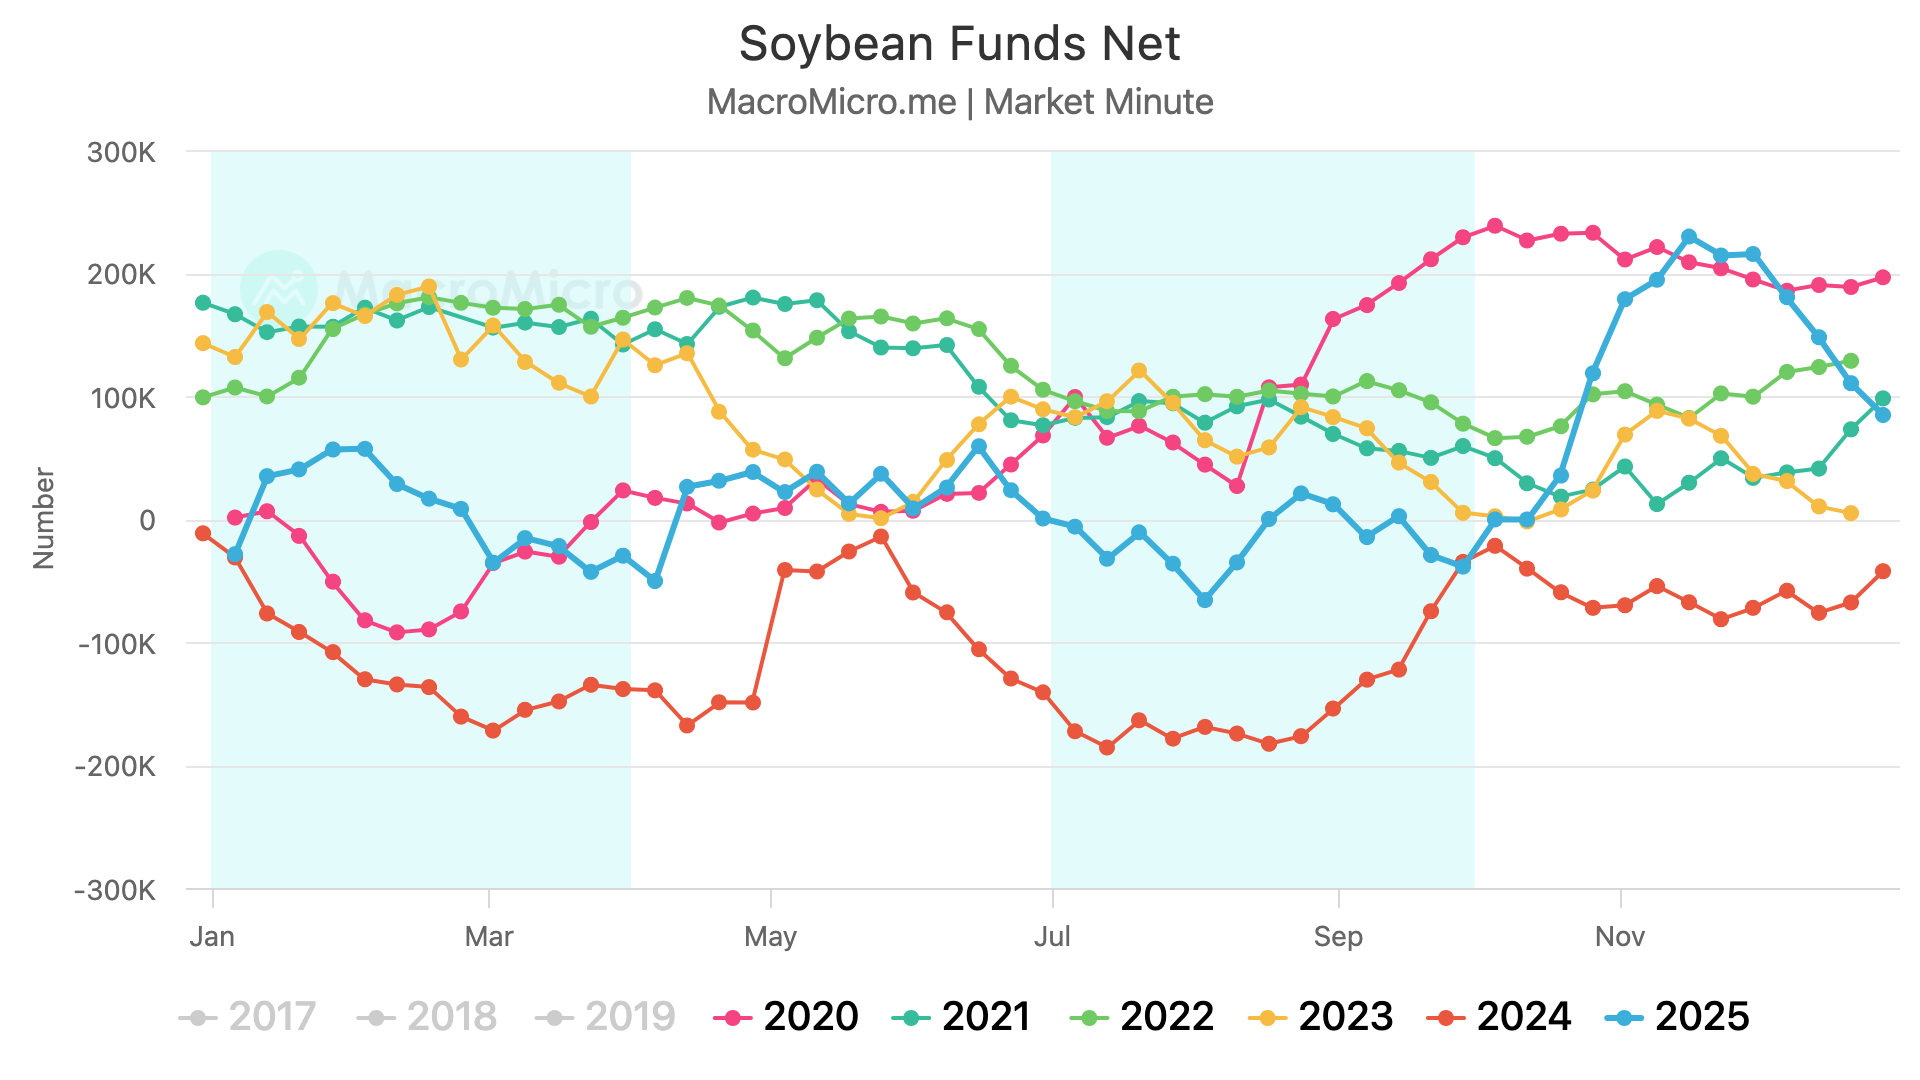
Soybeans: 85k
SRW Wheat: -95k
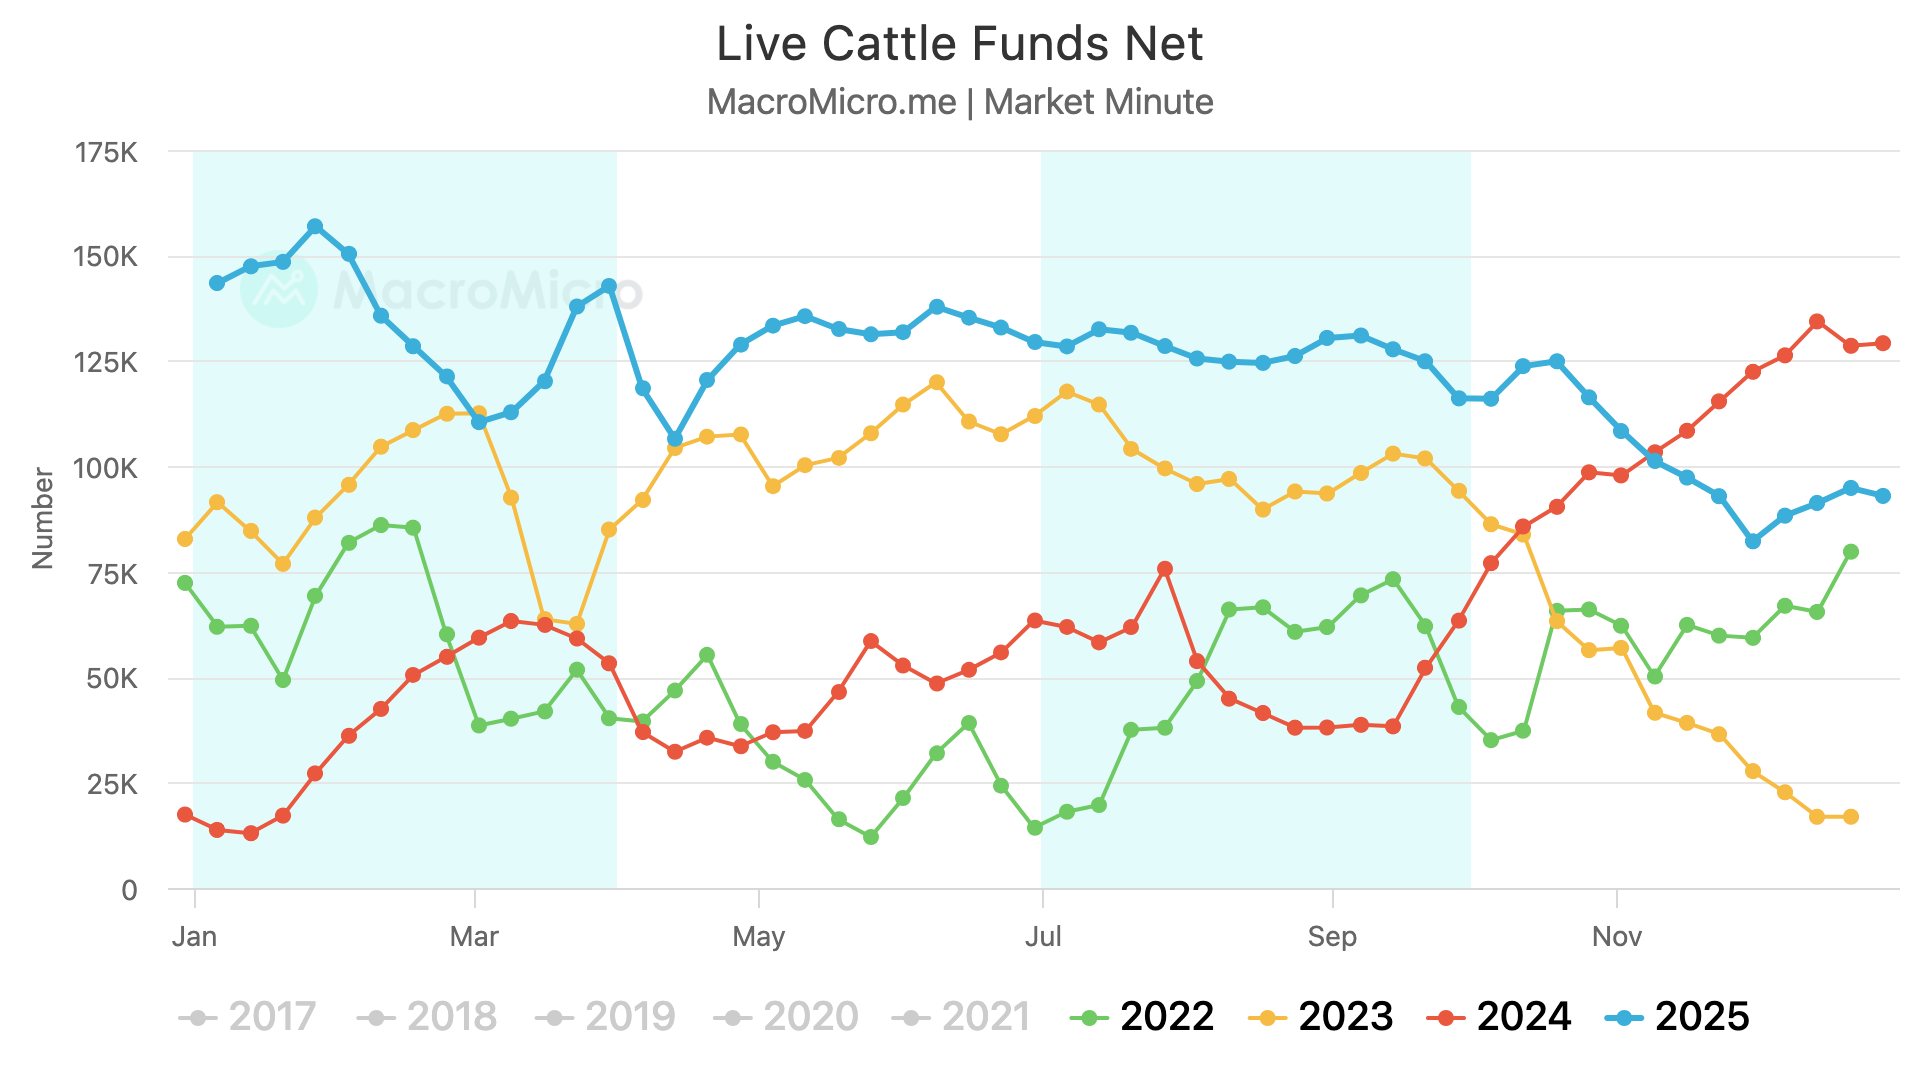
Live Cattle: 93k
Here are the visuals.
Corn funds are essentially neutral as they haven’t done much for the last two months. Hence why prices have also traded sideways for the last two months.
For soybeans, the funds were near record long back in November.
Long 230k contracts.
They've clearly given back a big chunk of that length, but are still long 85k contracts. So they haven’t entirely given up that position.
In live cattle, the funds still hold a large position historically speaking.
But isn’t close to the length we saw earlier this year.
The funds are actually holding a smaller position at the end of 2025 than they were at the end of 2024.
History of Jan USDA
This report is always one of the biggest of the year.
It can set the tone for a few months and ultimately has the potential to be a game-changer in either direction.
Let's dive into what this report has provided in the past.
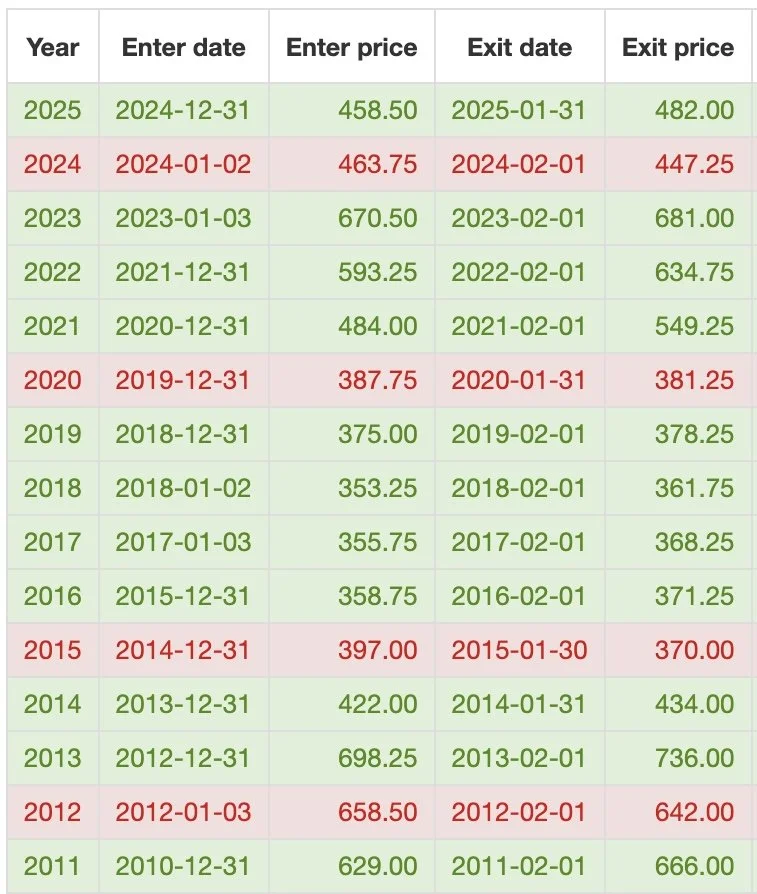
First for corn.
Corn has traded higher on this report the last 8 of 12 years.
Interestingly enough, in 3 of those 4 losses we only traded lower by around 2 cents.
There is only one time in recent memory where we truly had a negative reaction. Which was 2024.
More often than not, this report doesn’t tend to be overly bearish.
It doesn’t mean it has to be "bullish" like last year, but we rarely sell off the day of the report.

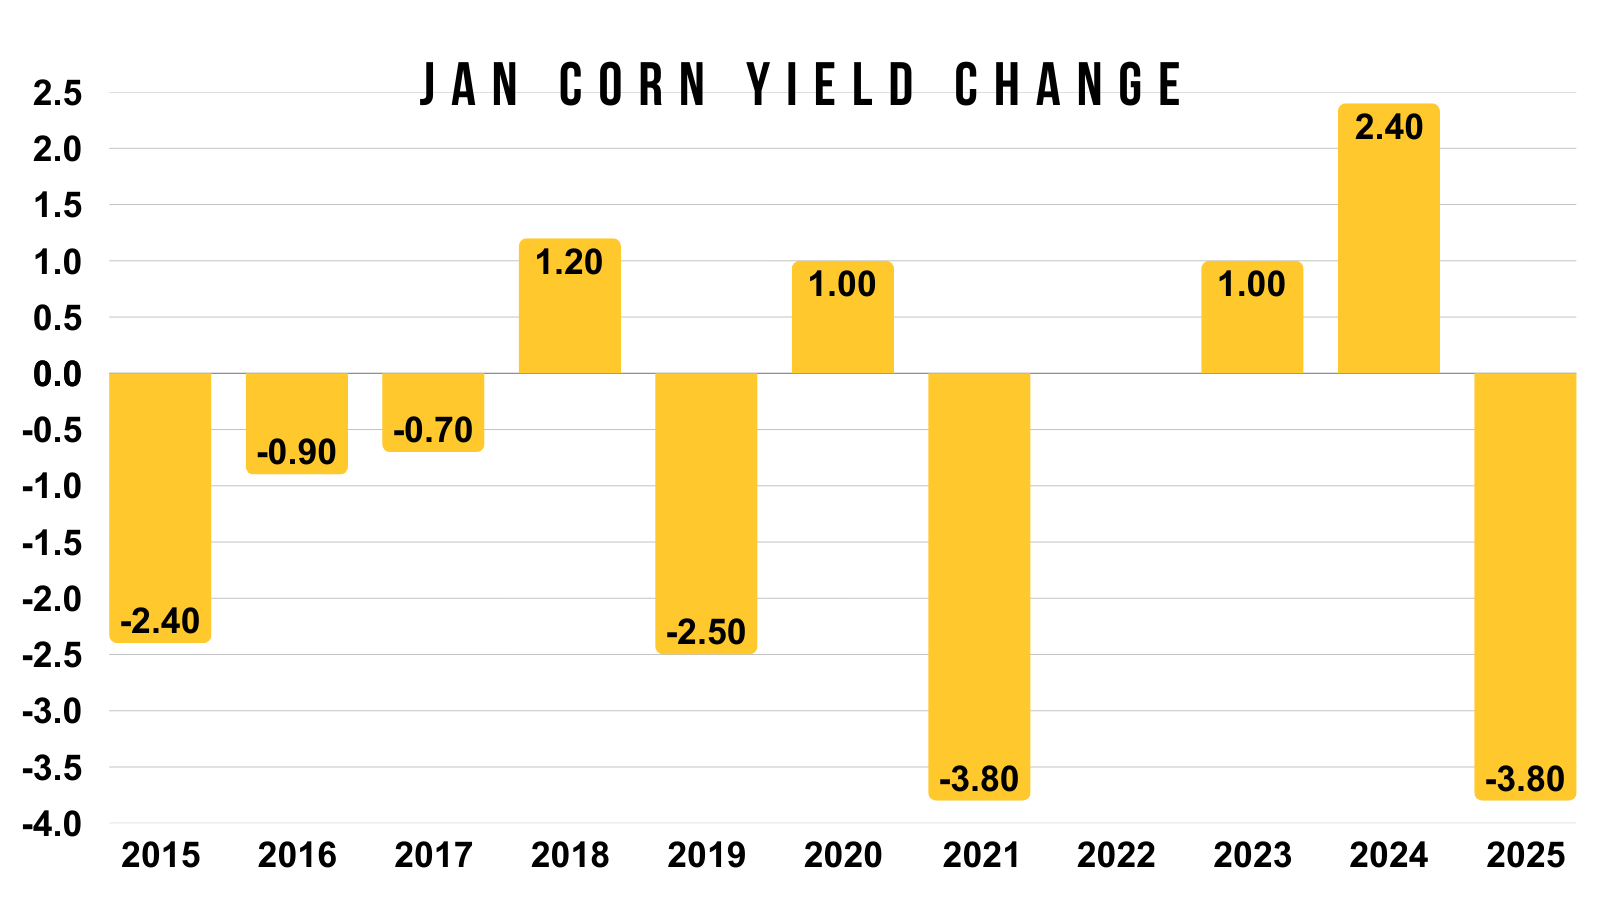
Yield tends to come down in this report.
I think everyone agrees yield should be dropping in this report.
The biggest drops we've seen in recent memory came last year along with Jan 2021.
Where yield dropped -3.80 bushels an acre.
The current yield estimate is 186. So if we saw the same cut as last year, it would peg us at 182.2 bpa.
Meaning it would take the biggest drop we've ever seen to get yield below 182 in this report.
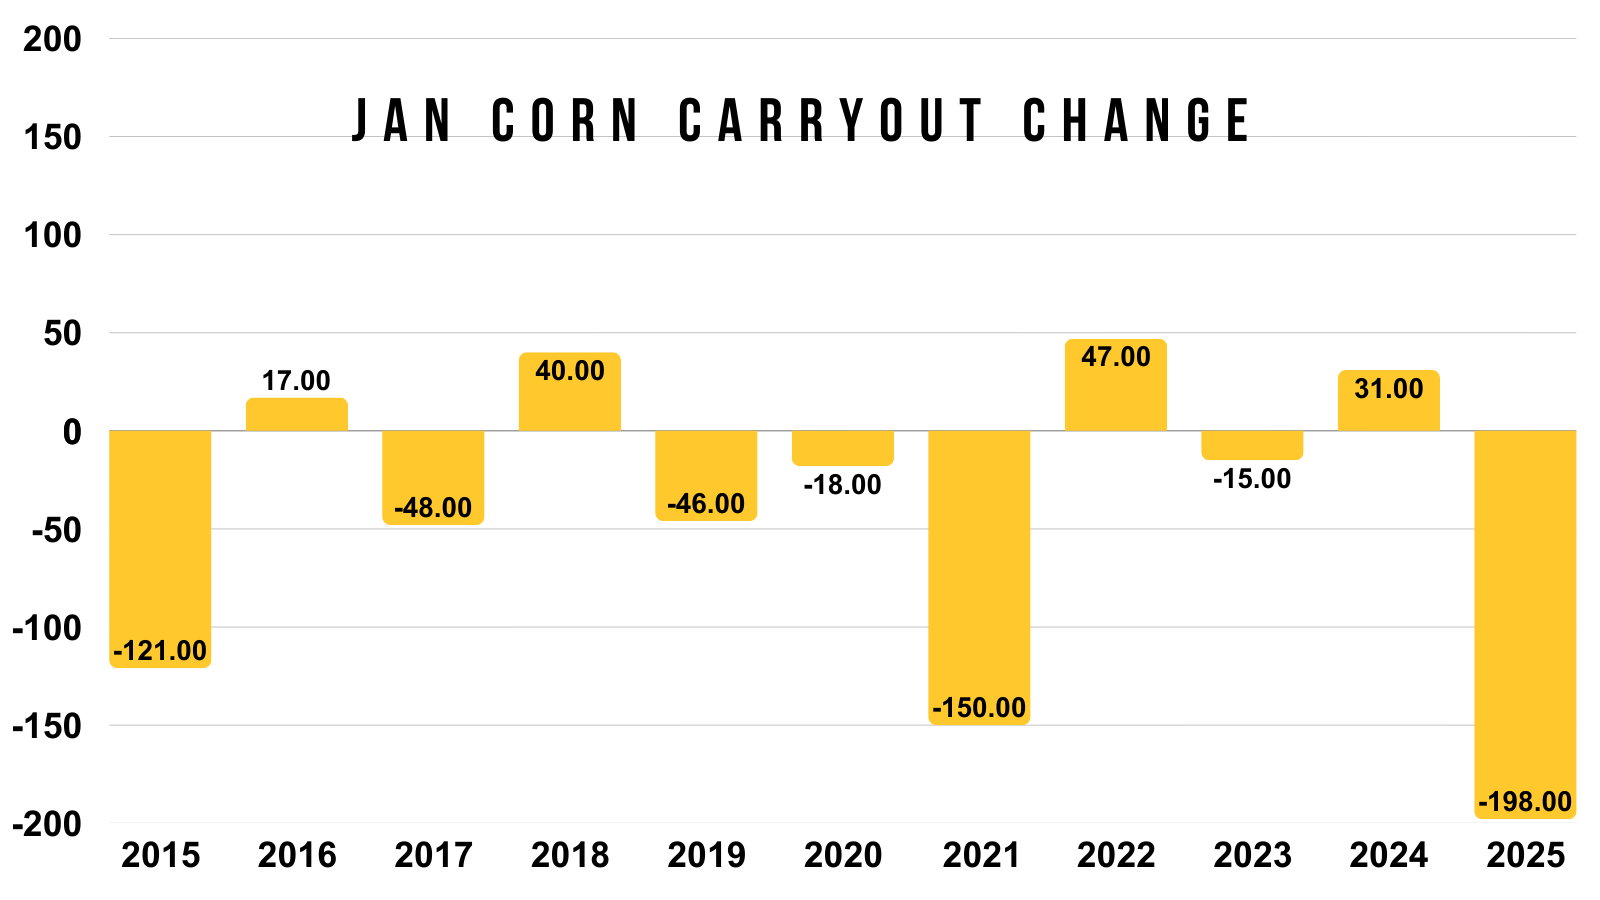
Lastly for carryout.
In at least the last decade, we've never seen carryout bumped by more than 50 million bushels.
However, we've only seen it drop by more than 100 million three times.
Last year was the largest we've seen.
Again, this report doesn’t tend to be overly bearish, even if it doesn’t wind up being mega bullish like in 2021 or last year.
Next for soybeans.
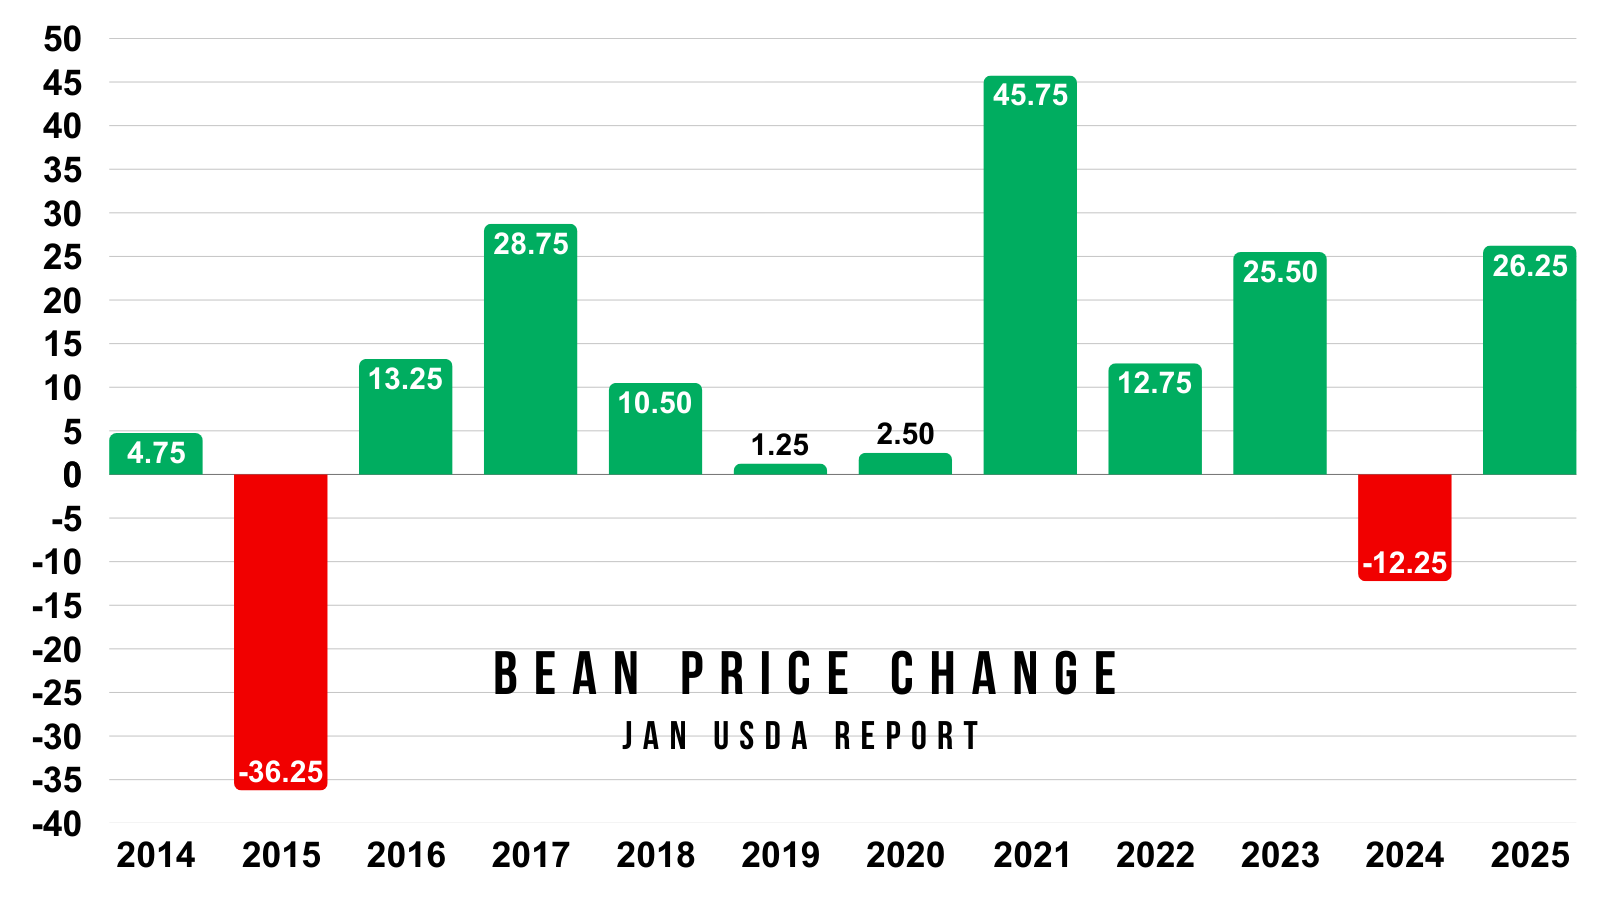
The price action provides some interesting data.
Soybeans have only traded lower on the day of this report twice in the last 12 years.
So the data says this report does tend to be friendly.
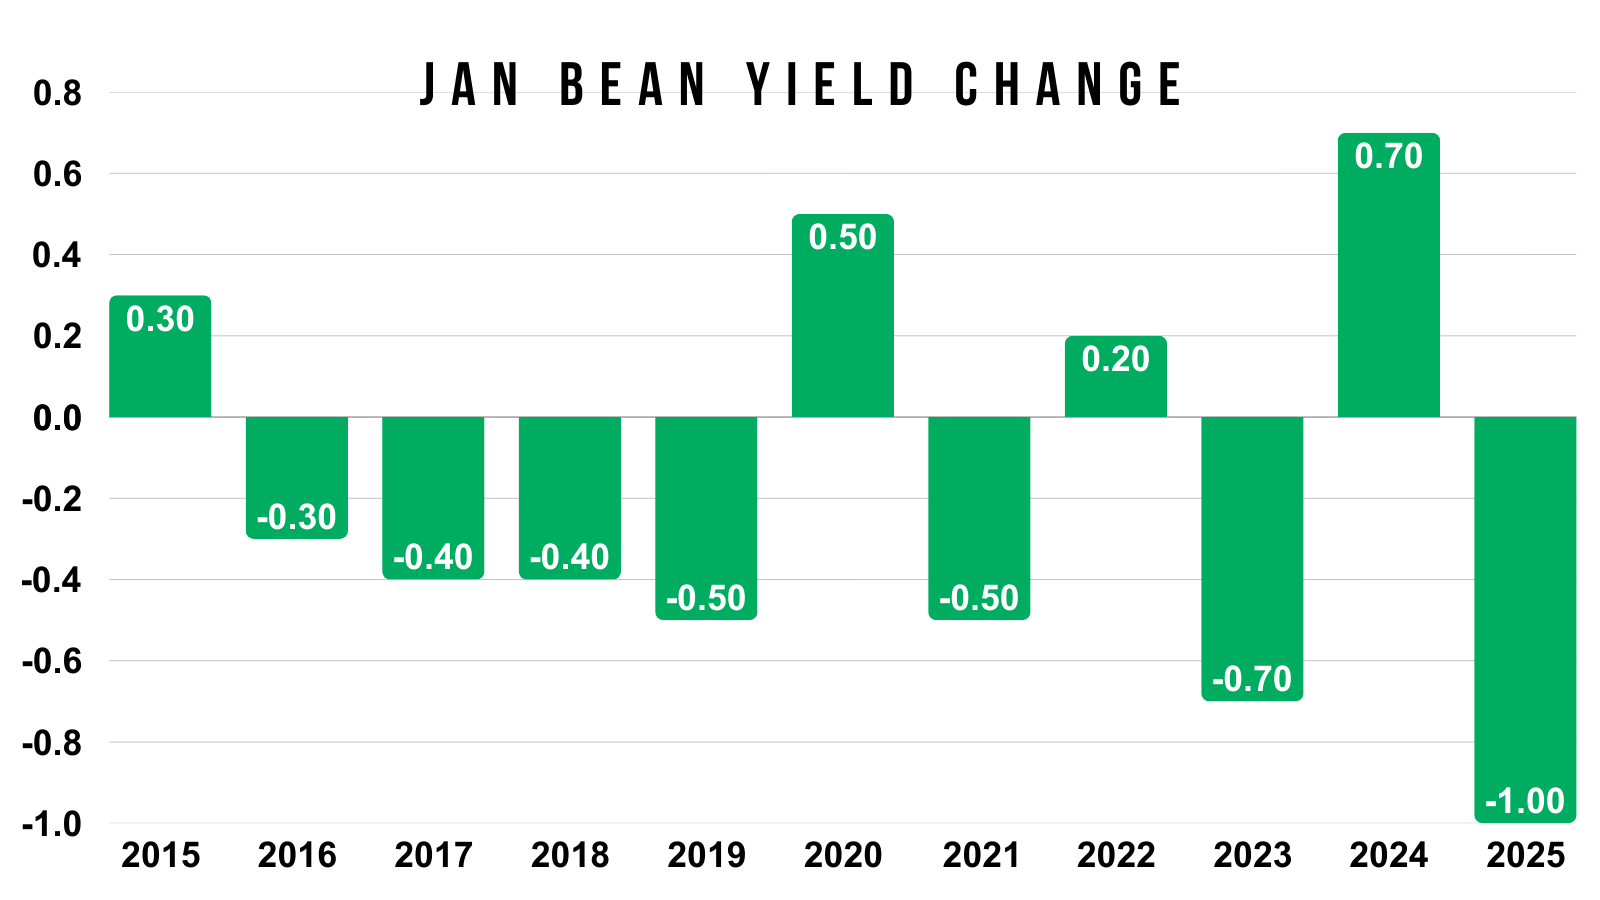
Yield also tends to come down in soybeans.
But last year was the only year in the last decade where yield fell by a full 1 bushel an acre.
With the current estimate of 53 bpa.
That means to get a yield below 52, it would take one of the largest cuts we've seen.
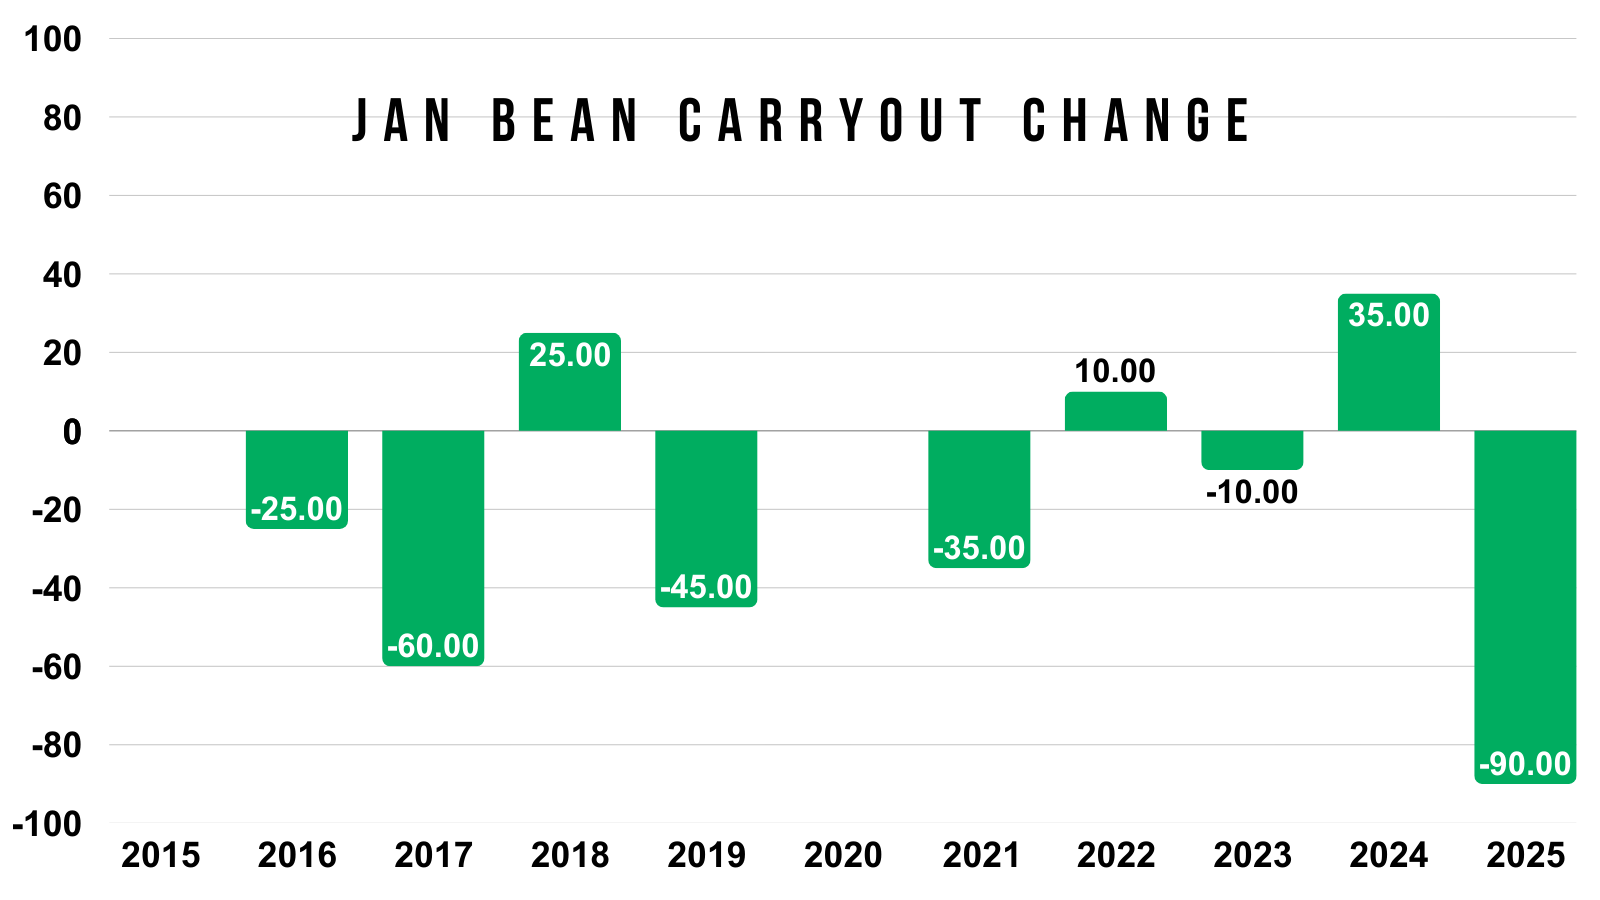
Lastly here is the carryout changes.
Last year provided one of the largest drops ever. As it dropped -90 million.
Today's Main Takeaways
Corn
Fundamentals:
Demand is still amazing. The sole reason you can’t get overly bearish on corn.
However, we still have an ample amount of supply and a carryout of 2 billion bushels.
Both of these have led to corn trading virtually sideways for a few months. Every break has been bought. Every rally has stalled.
I think corn has upside potential from here.
That record supply and large carryout has already been priced in, meanwhile we have record demand continuing to prevent this market from falling apart.
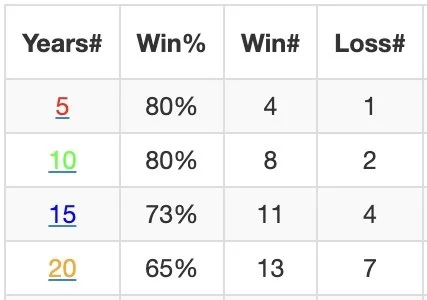
Just a reminder, corn has traded higher 8 of the last 10 years during the month of January.
Higher the last 4 of 5 years.
Higher the last 11 of 15 years.
Seasonally it's a friendly time period.
But what would it take to get corn beyond $5.00?
We have record supply, but clearly the corn story isn’t the most bearish it's ever been. Because we also have record demand.
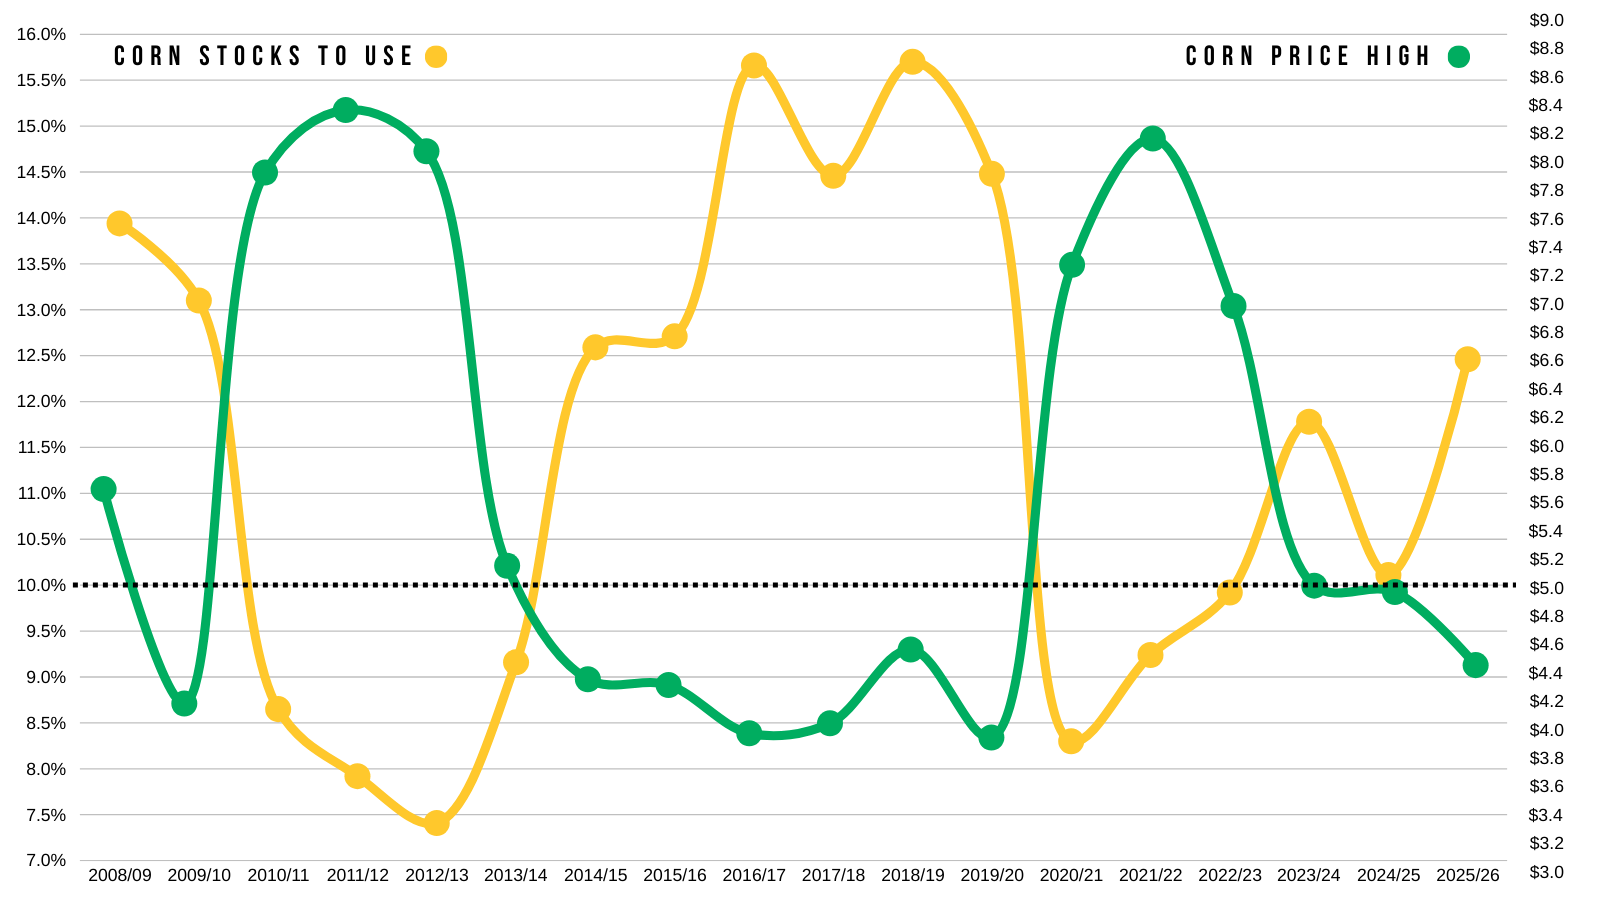
Stocks to use ratio is the best way to determine the supply and demand story.
It tells us how much supply is left over after demand.
This chart shows our stocks to use (in yellow).
Along with the highest corn prices each marketing year (in green).
I drew line at a 10% stocks to use ratio as well as $5.00
Based on this chart, you can see that normally, to get corn much above that line of $5.00, the stocks to use ratio typically has to also drop below that line of 10%.
For example:
2010 to 2013 the stocks to use was below 10%. Prices were above $5.00
2014 to 2020 the stocks to use was above 10%. Prices were below $5.00
2021 to 2023 the stocks to use was below 10%. Prices were above $5.00
So if you want greater than $5.00 corn, you usually need a stocks to use ratio below 10%.
We currently have a stocks to use ratio of 12.5%.
Last year we ended at a 10.10% stocks to use with a high price of $5.04.
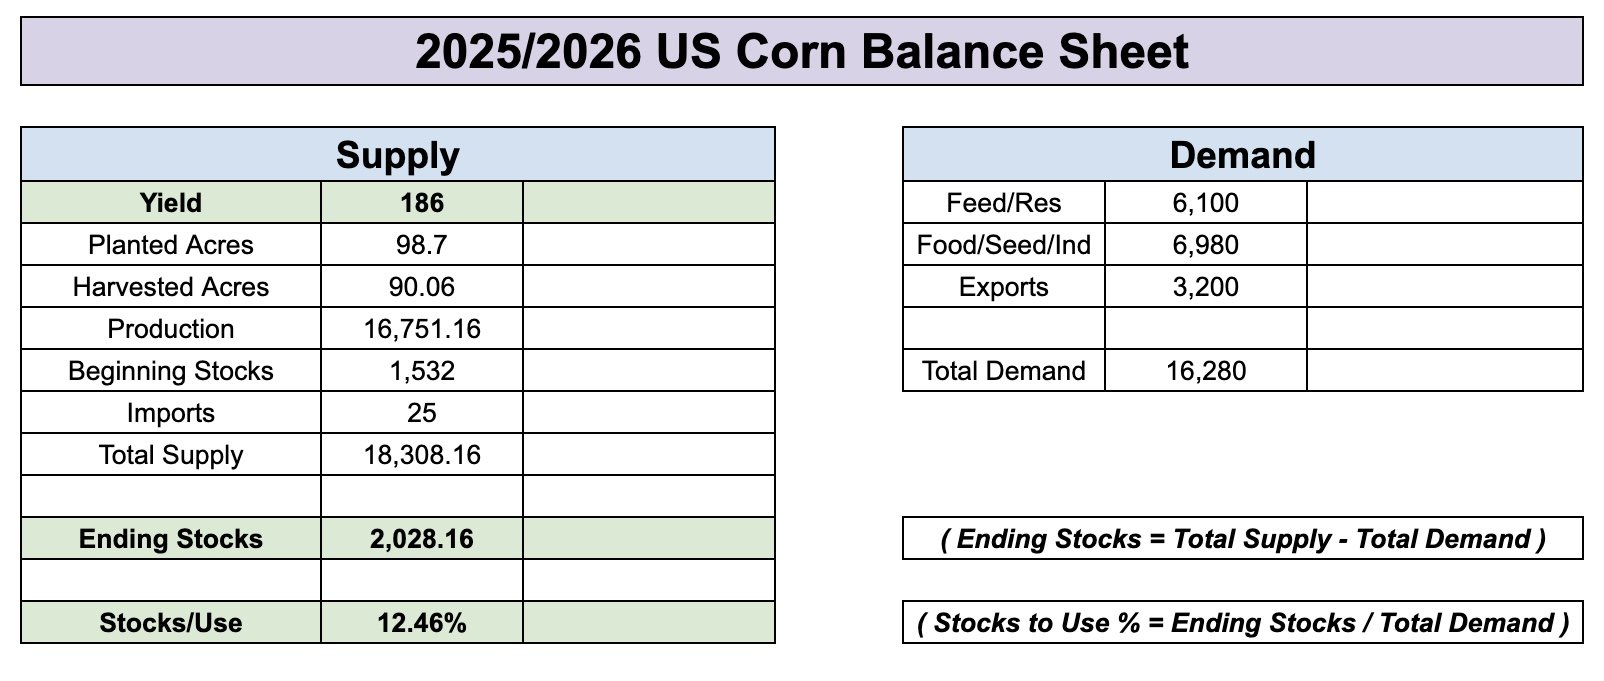
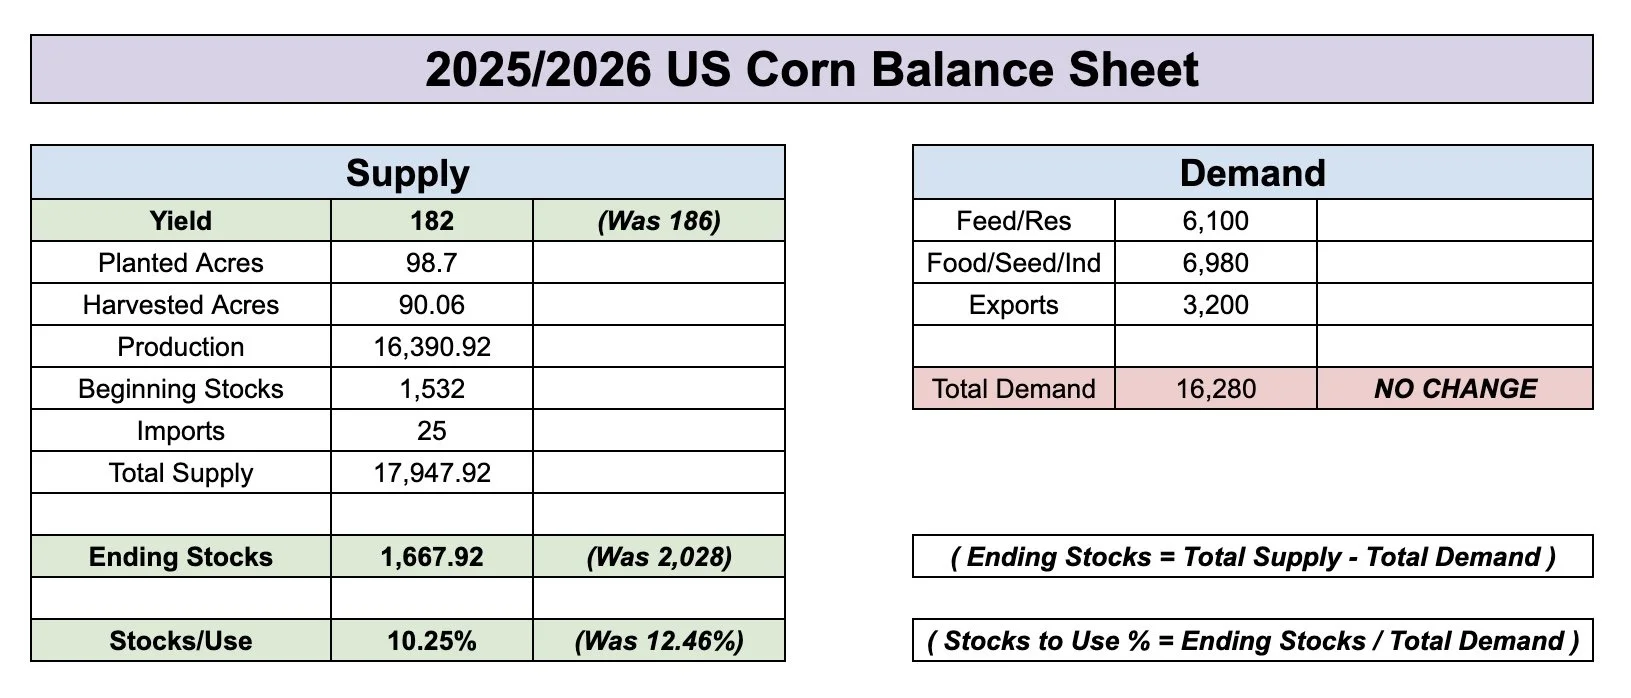
Here is the current balance sheet ahead of the USDA report.
We have:
186 yield
2.03 billion carryout
12.46% stocks to use
I've shown this example before.
But for this example, let's just say yield comes in at 182.
If you did NOT change any demand numbers at all.
This would drop our stocks to use ratio down to 10.25%.
HOWEVER, if the USDA drops yield, they will inevitably drop demand. To balance the balance sheet.
Most argue feed and residual demand is too high to begin with. While others argue our export demand is being understated.
Regardless, you can see that it is hard to paint a scenario where the corn balance sheet drops to near 10%.
As it would take a 182 yield with demand being left unchanged to do so.
Which is why I personally think corn's upside is limited beyond $5.00 for now.
Later in the year, a completely new story could emerge.
China could buy corn. We could run into a supply scare this summer, and ultimately go a lot higher.
I am not bearish corn, but unless one of those happens, it is an uphill battle to get a stock to use near 10%.
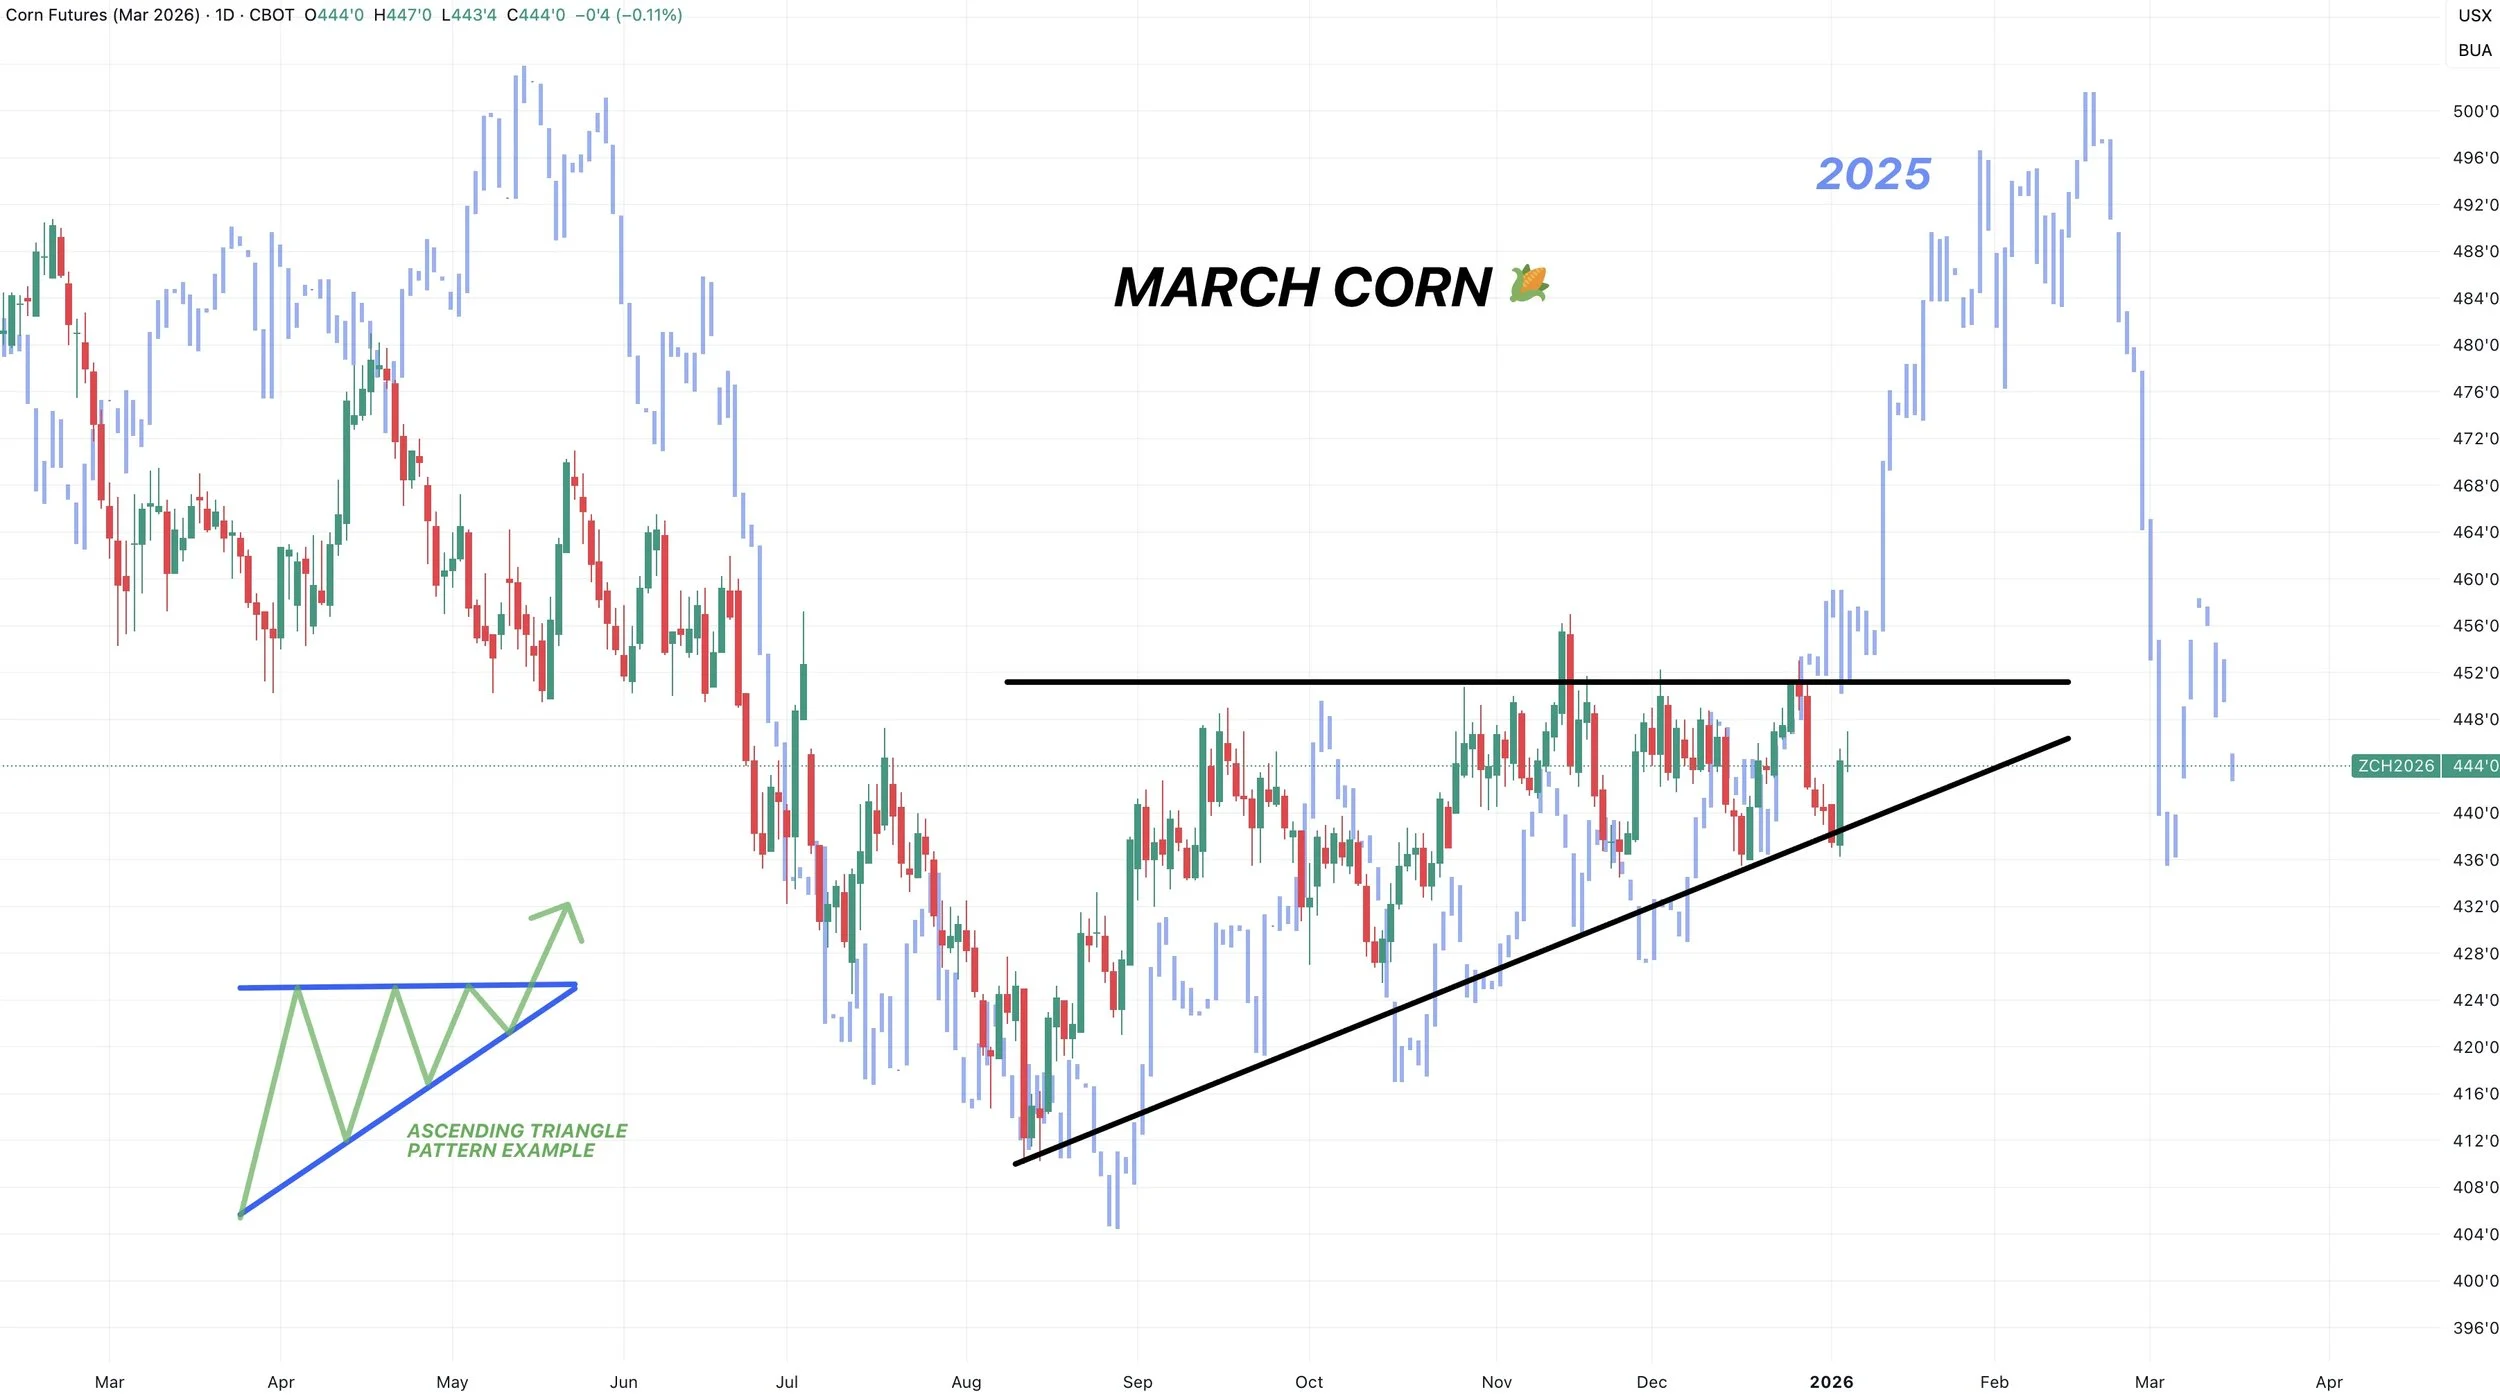
Now we are showing some very interesting similarities to corn last year when it comes to price action.
Here is March-25 corn overlayed on top of March-26 corn.
We are sitting in the exact same ascending triangle pattern.
We have seen identical action off the harvest lows.
I do not think we have quite the upside as last year, based on the fundamentals not being as friendly this year, but I do think we could follow a similar pattern with a breakout in January.
Technicals:
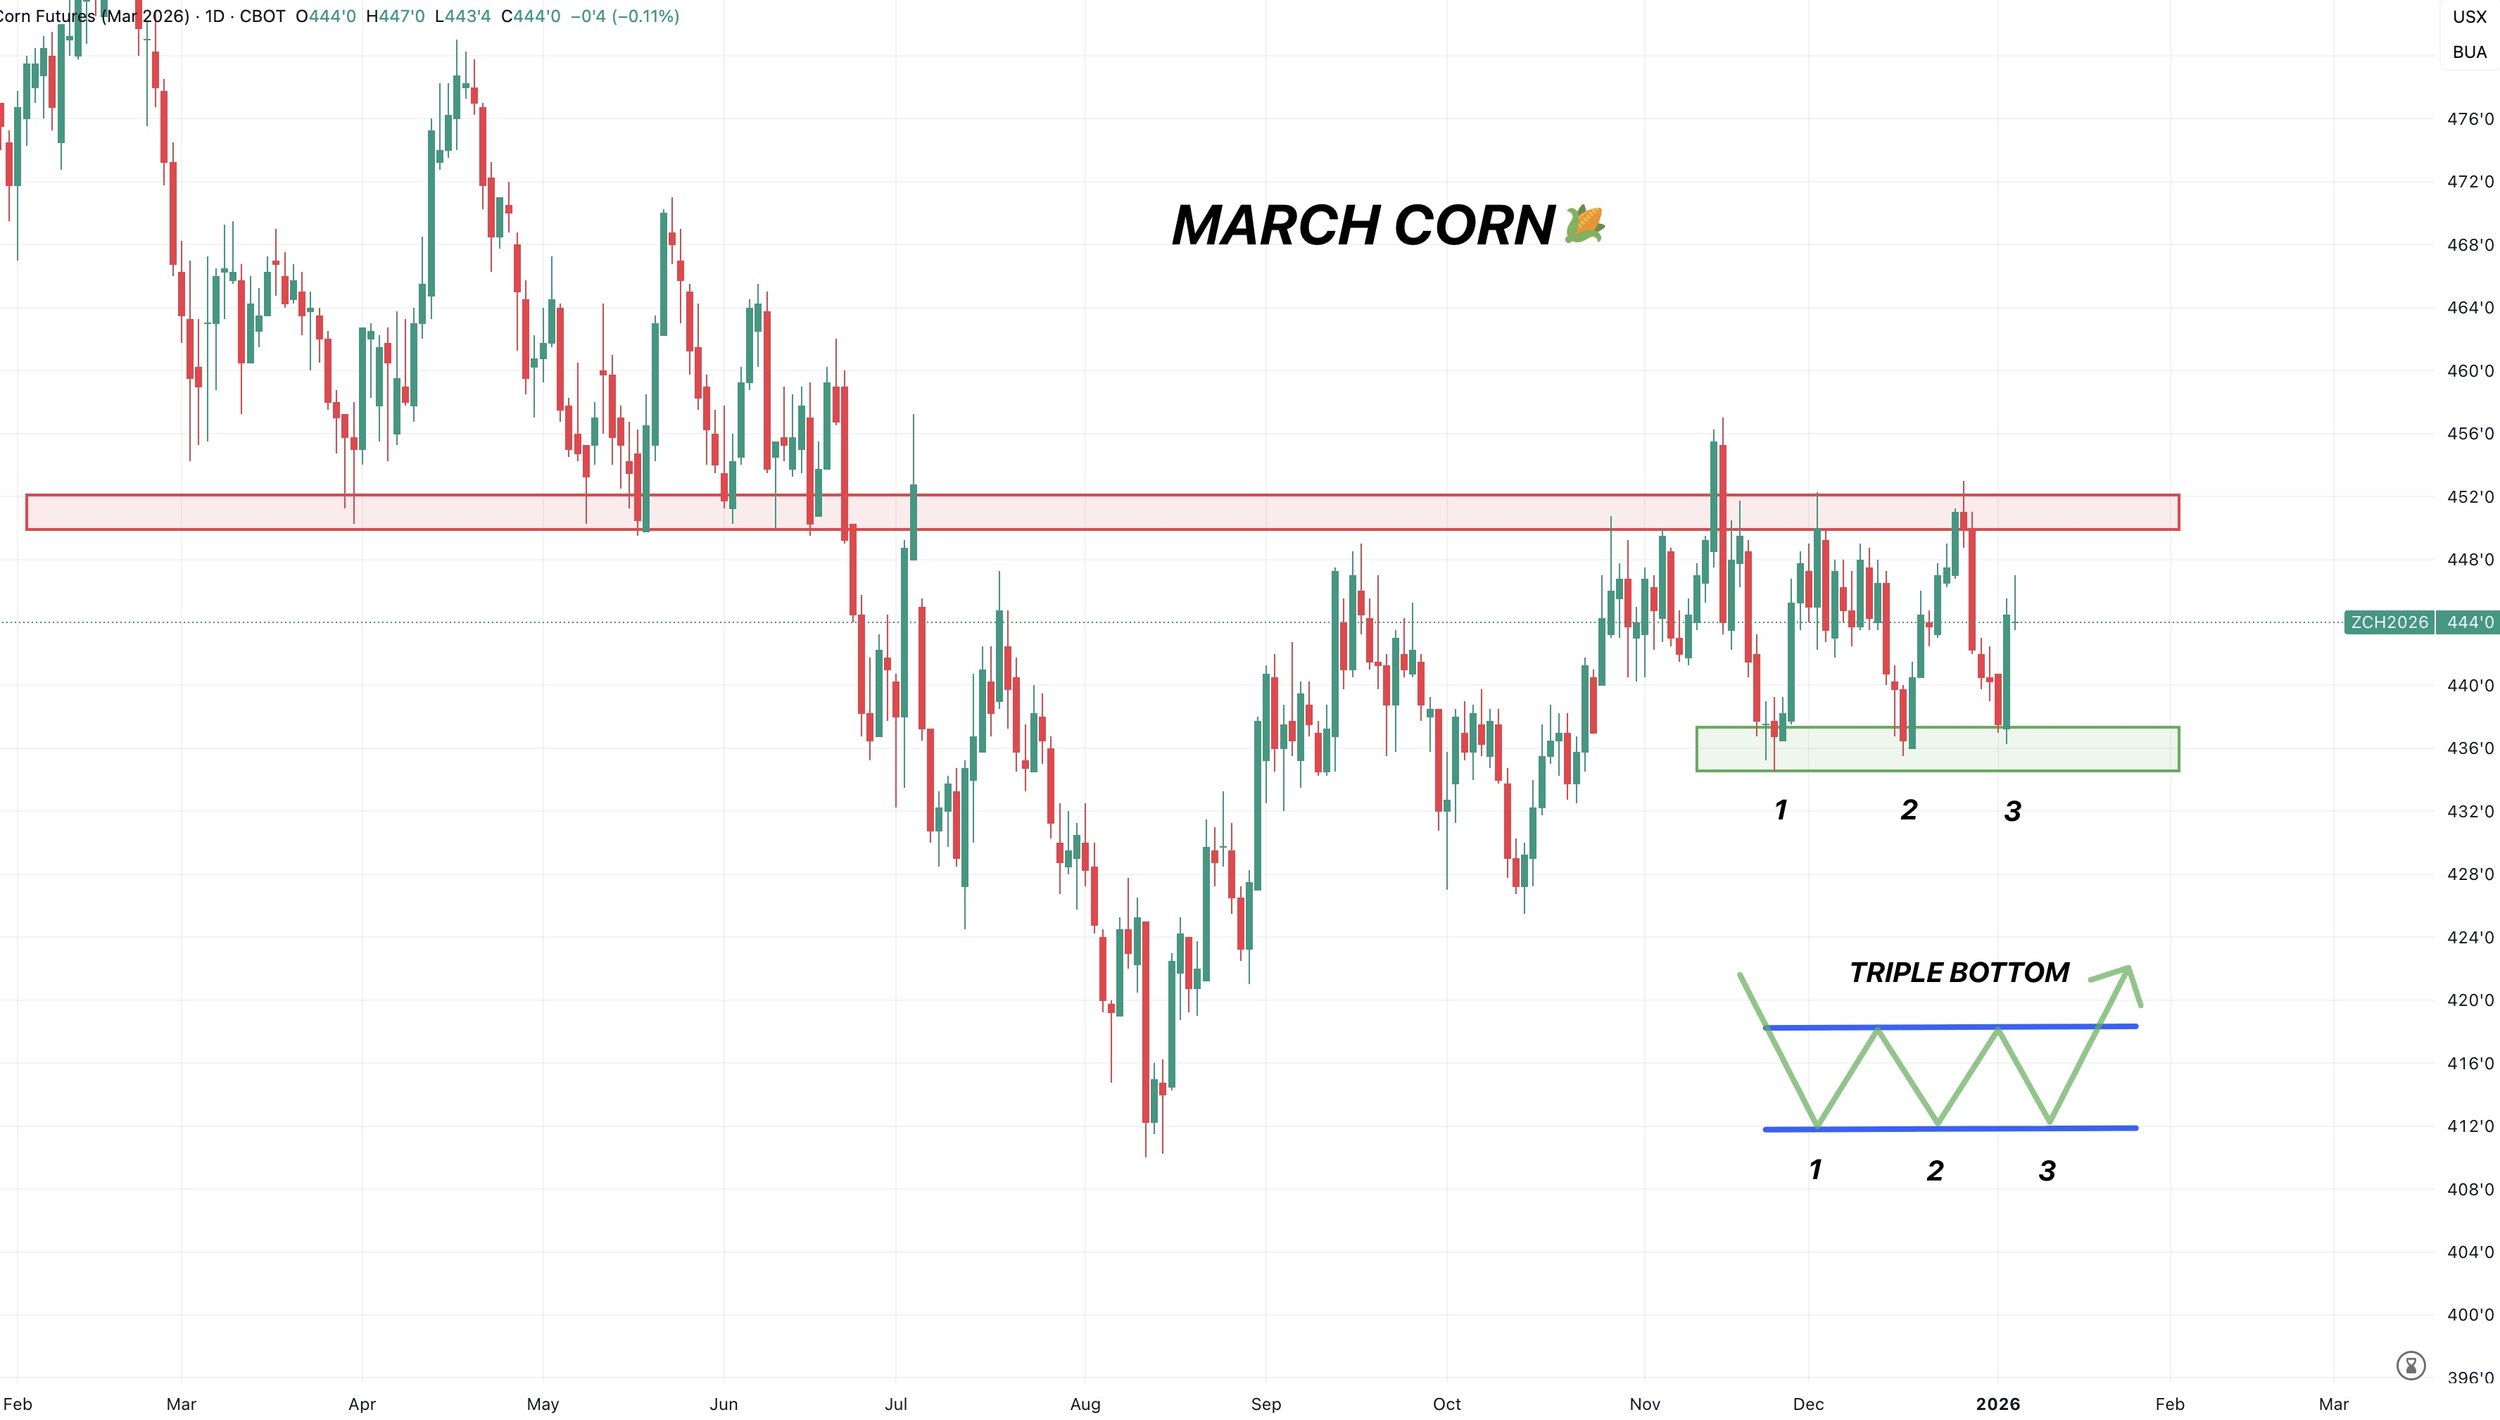
March Corn
We've traded sideways since October.
We now have a triple bottom pattern in place. Which is typically considered a bullish set up.
We've tested the local lows 3 times now.
Which is showing that sellers continue to fail while we build a floor.
The clear level to break is $4.50
If we break above, it should result in a leg higher.
In the meantime, we want to hold those local lows to prevent a leg lower.
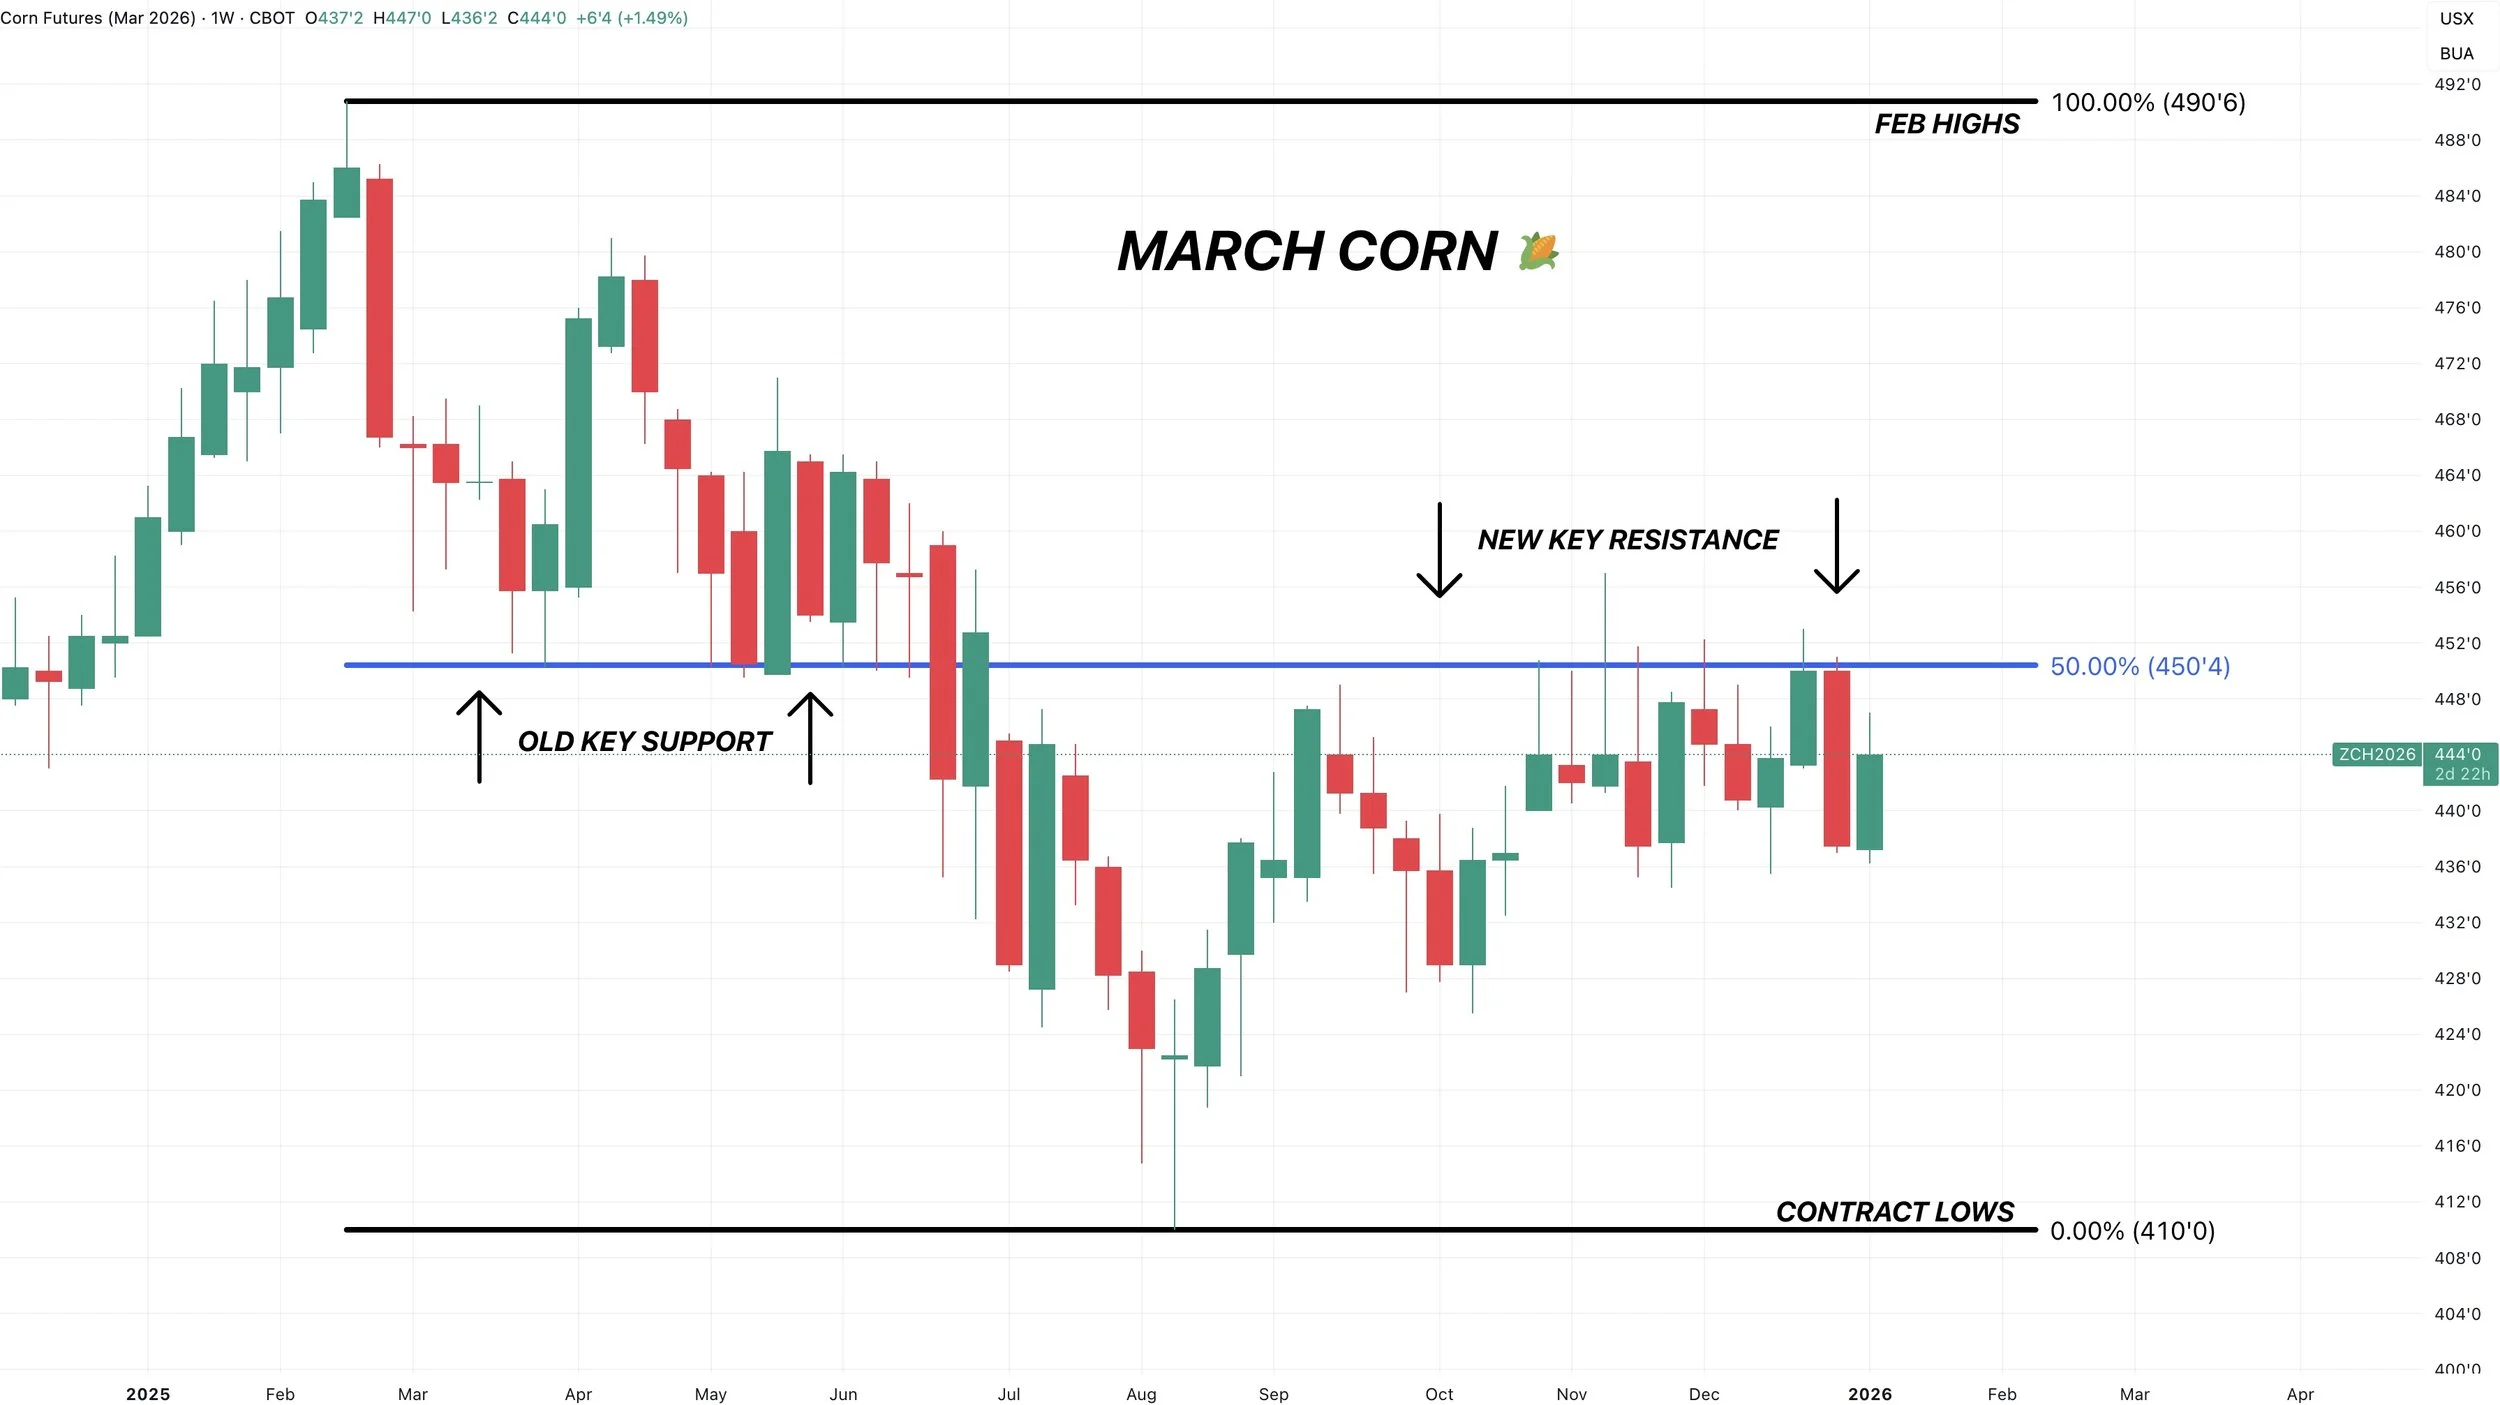
Here is the weekly chart.
We have still yet to get a close above $4.50
Again, that is key resistance.
We've failed there for months now.
It was support from spring.
It claws back 50% of the Feb highs.
Break above key resistance and we should go higher.
Soybeans
Fundamentals:
The biggest questions going into the report are going to be yield and if the USDA drops soybean exports.
I mean exports are down -45% vs last year. Yet the USDA's estimates are only -13% lower than last year.
So there is definitely an argument to be made.
The biggest thing preventing bulls from getting excited is South America.
Weather has been mostly favorable.
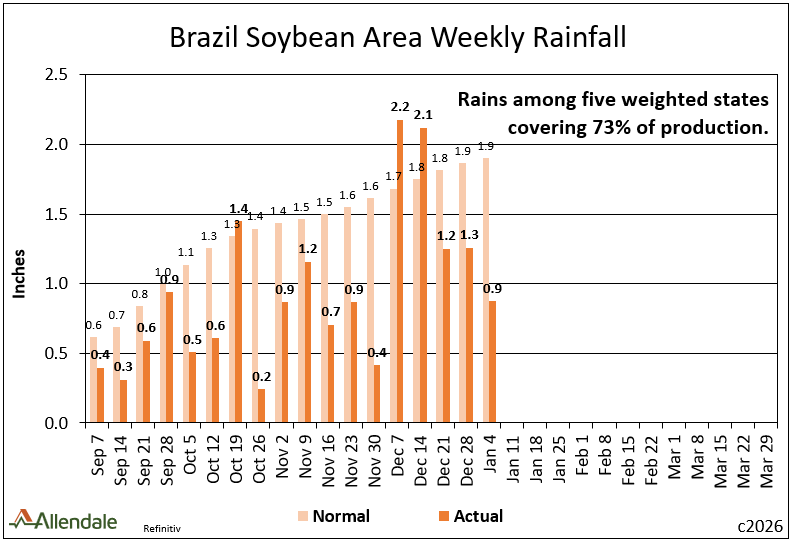
Here is Brazil's weekly rainfall amounts vs normal.
They've seen some dry weeks here and there, but overall nothing to be concerned about. Clearly the market hasn’t seemed worried about it.
Charts from Rich Nelson of Allendale
China has continued to buy soybeans and live up to their word. Which is great to see.
But the market seems to think it's not enough.
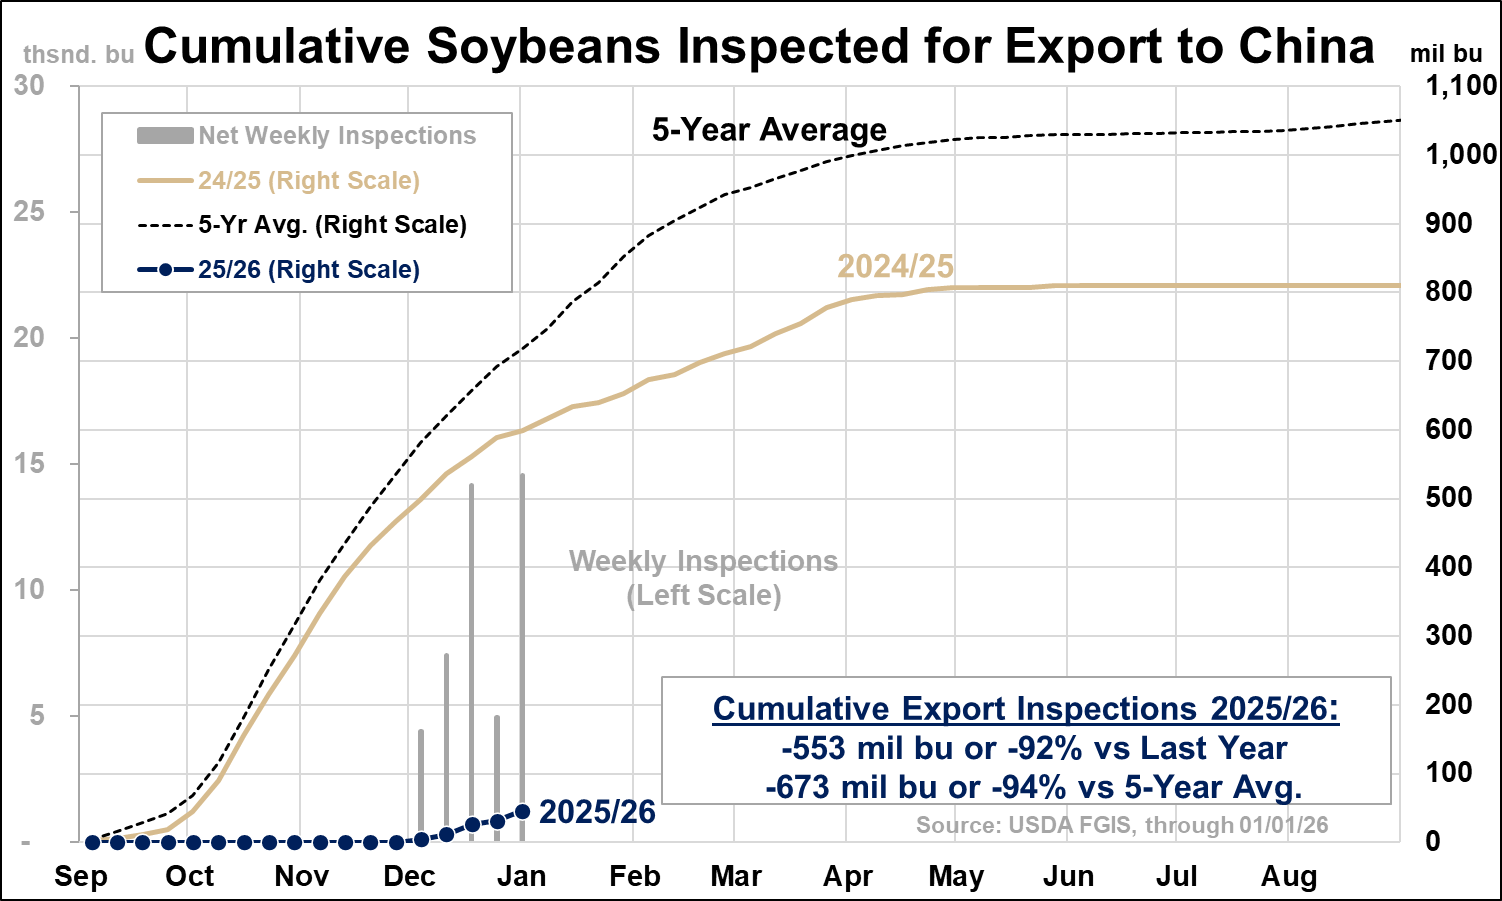
For reference, export inspections for soybeans to China do look pretty worrisome.
They are down over -90% vs last year.
Chart from Dave Brock of Brock Report
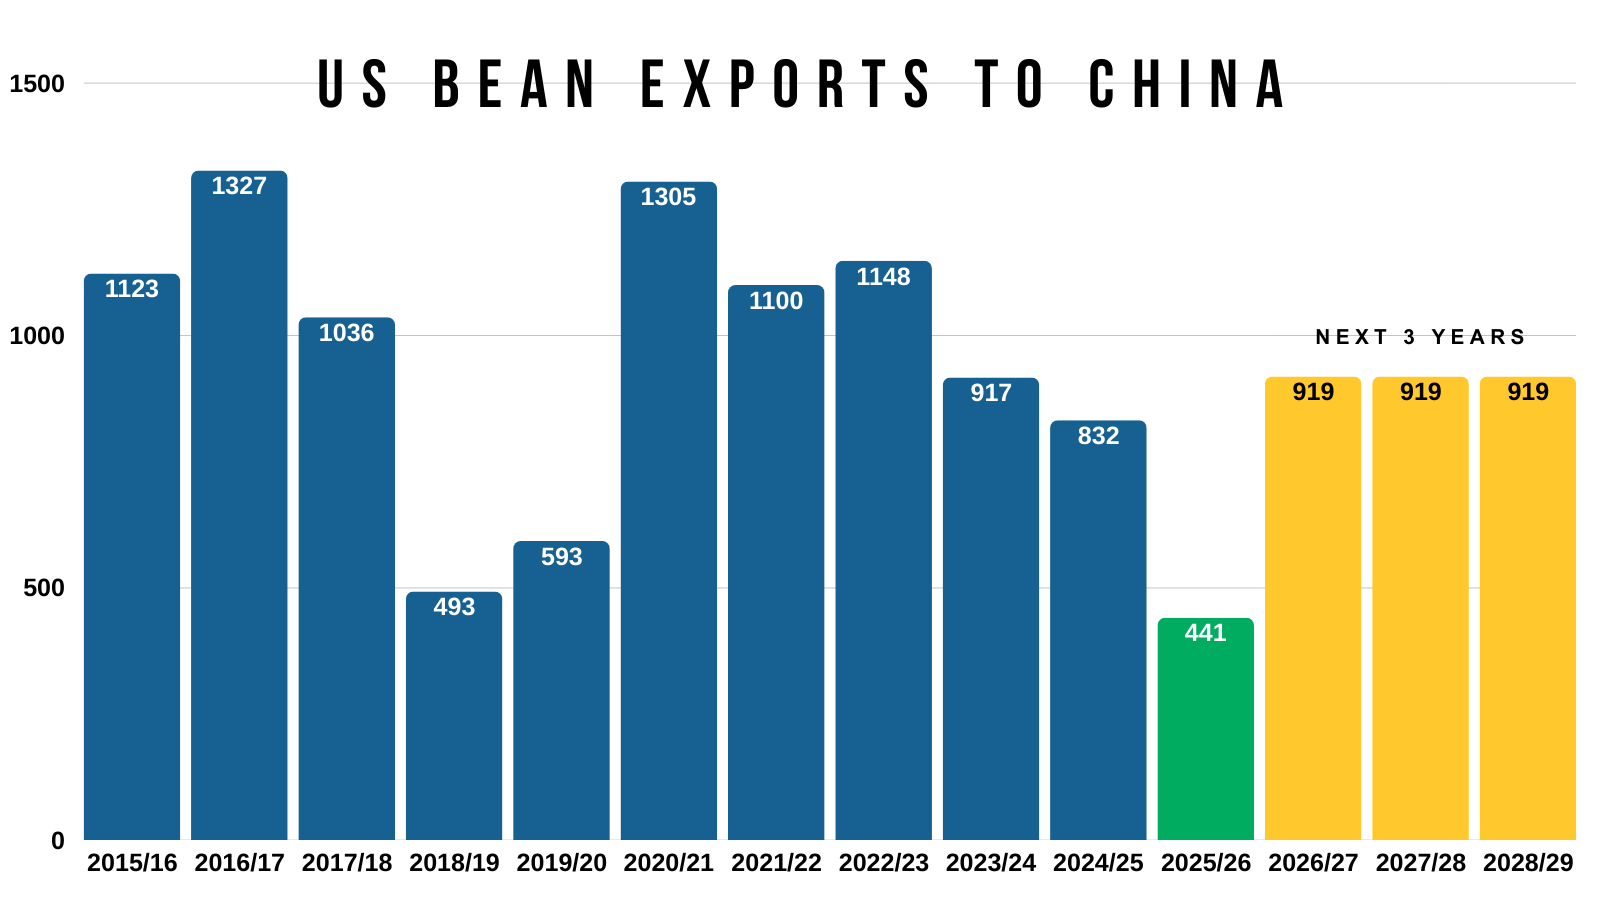
Taking a bigger picture perspective, China did agree to buy double for the next few years as to what they agreed to buy this year.
Which could be viewed as a silver lining moving forward if the agreement stays.
Overall there isn’t much for bulls to get overly excited about for now.
Brazil isn’t having any issues.
China continues to buy but overall export demand is still a big question mark.
We will have to see if the USDA provides bulls anything to chew on next week.
As the supply side of the US balance sheet is still fairly tight, given the 2nd-tightest acres of the last decade. That is if exports aren’t totally overestimated.
Technicals:
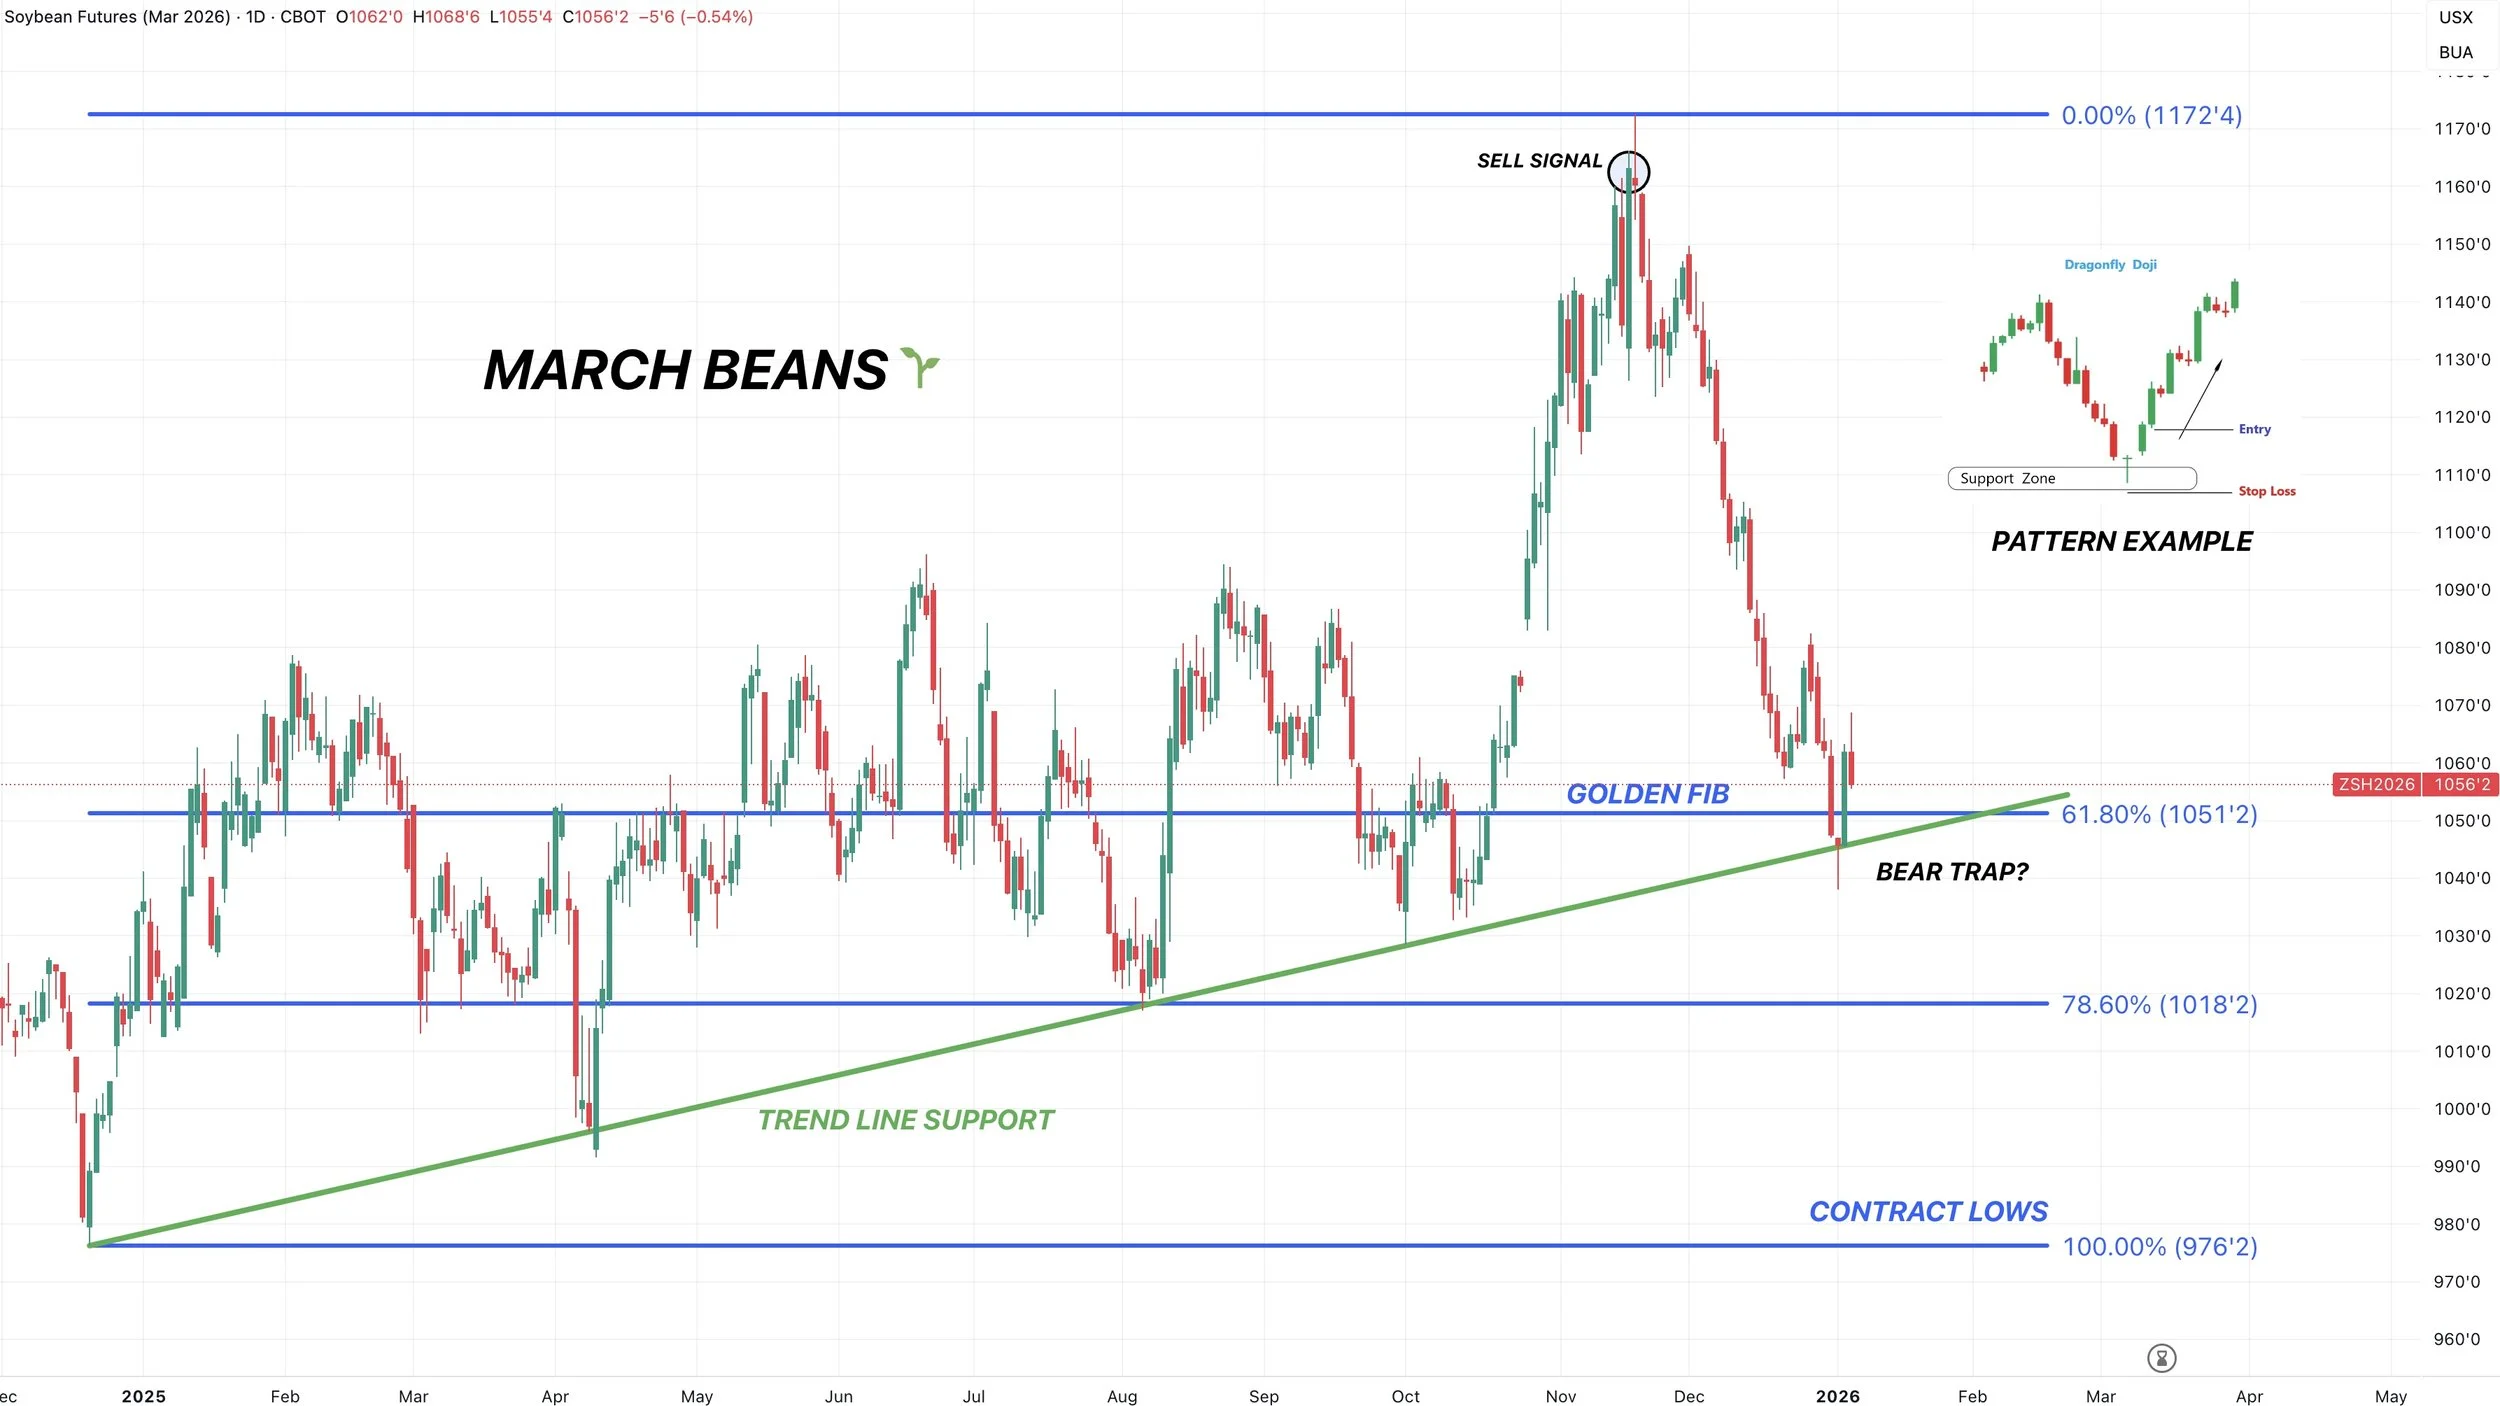
March Beans
Today was somewhat of a disappointing candle following yesterday's solid price action.
As on Friday, we left a dragonfly doji, and we then followed it up with a very solid day yesterday.
This is a textbook reversal pattern.
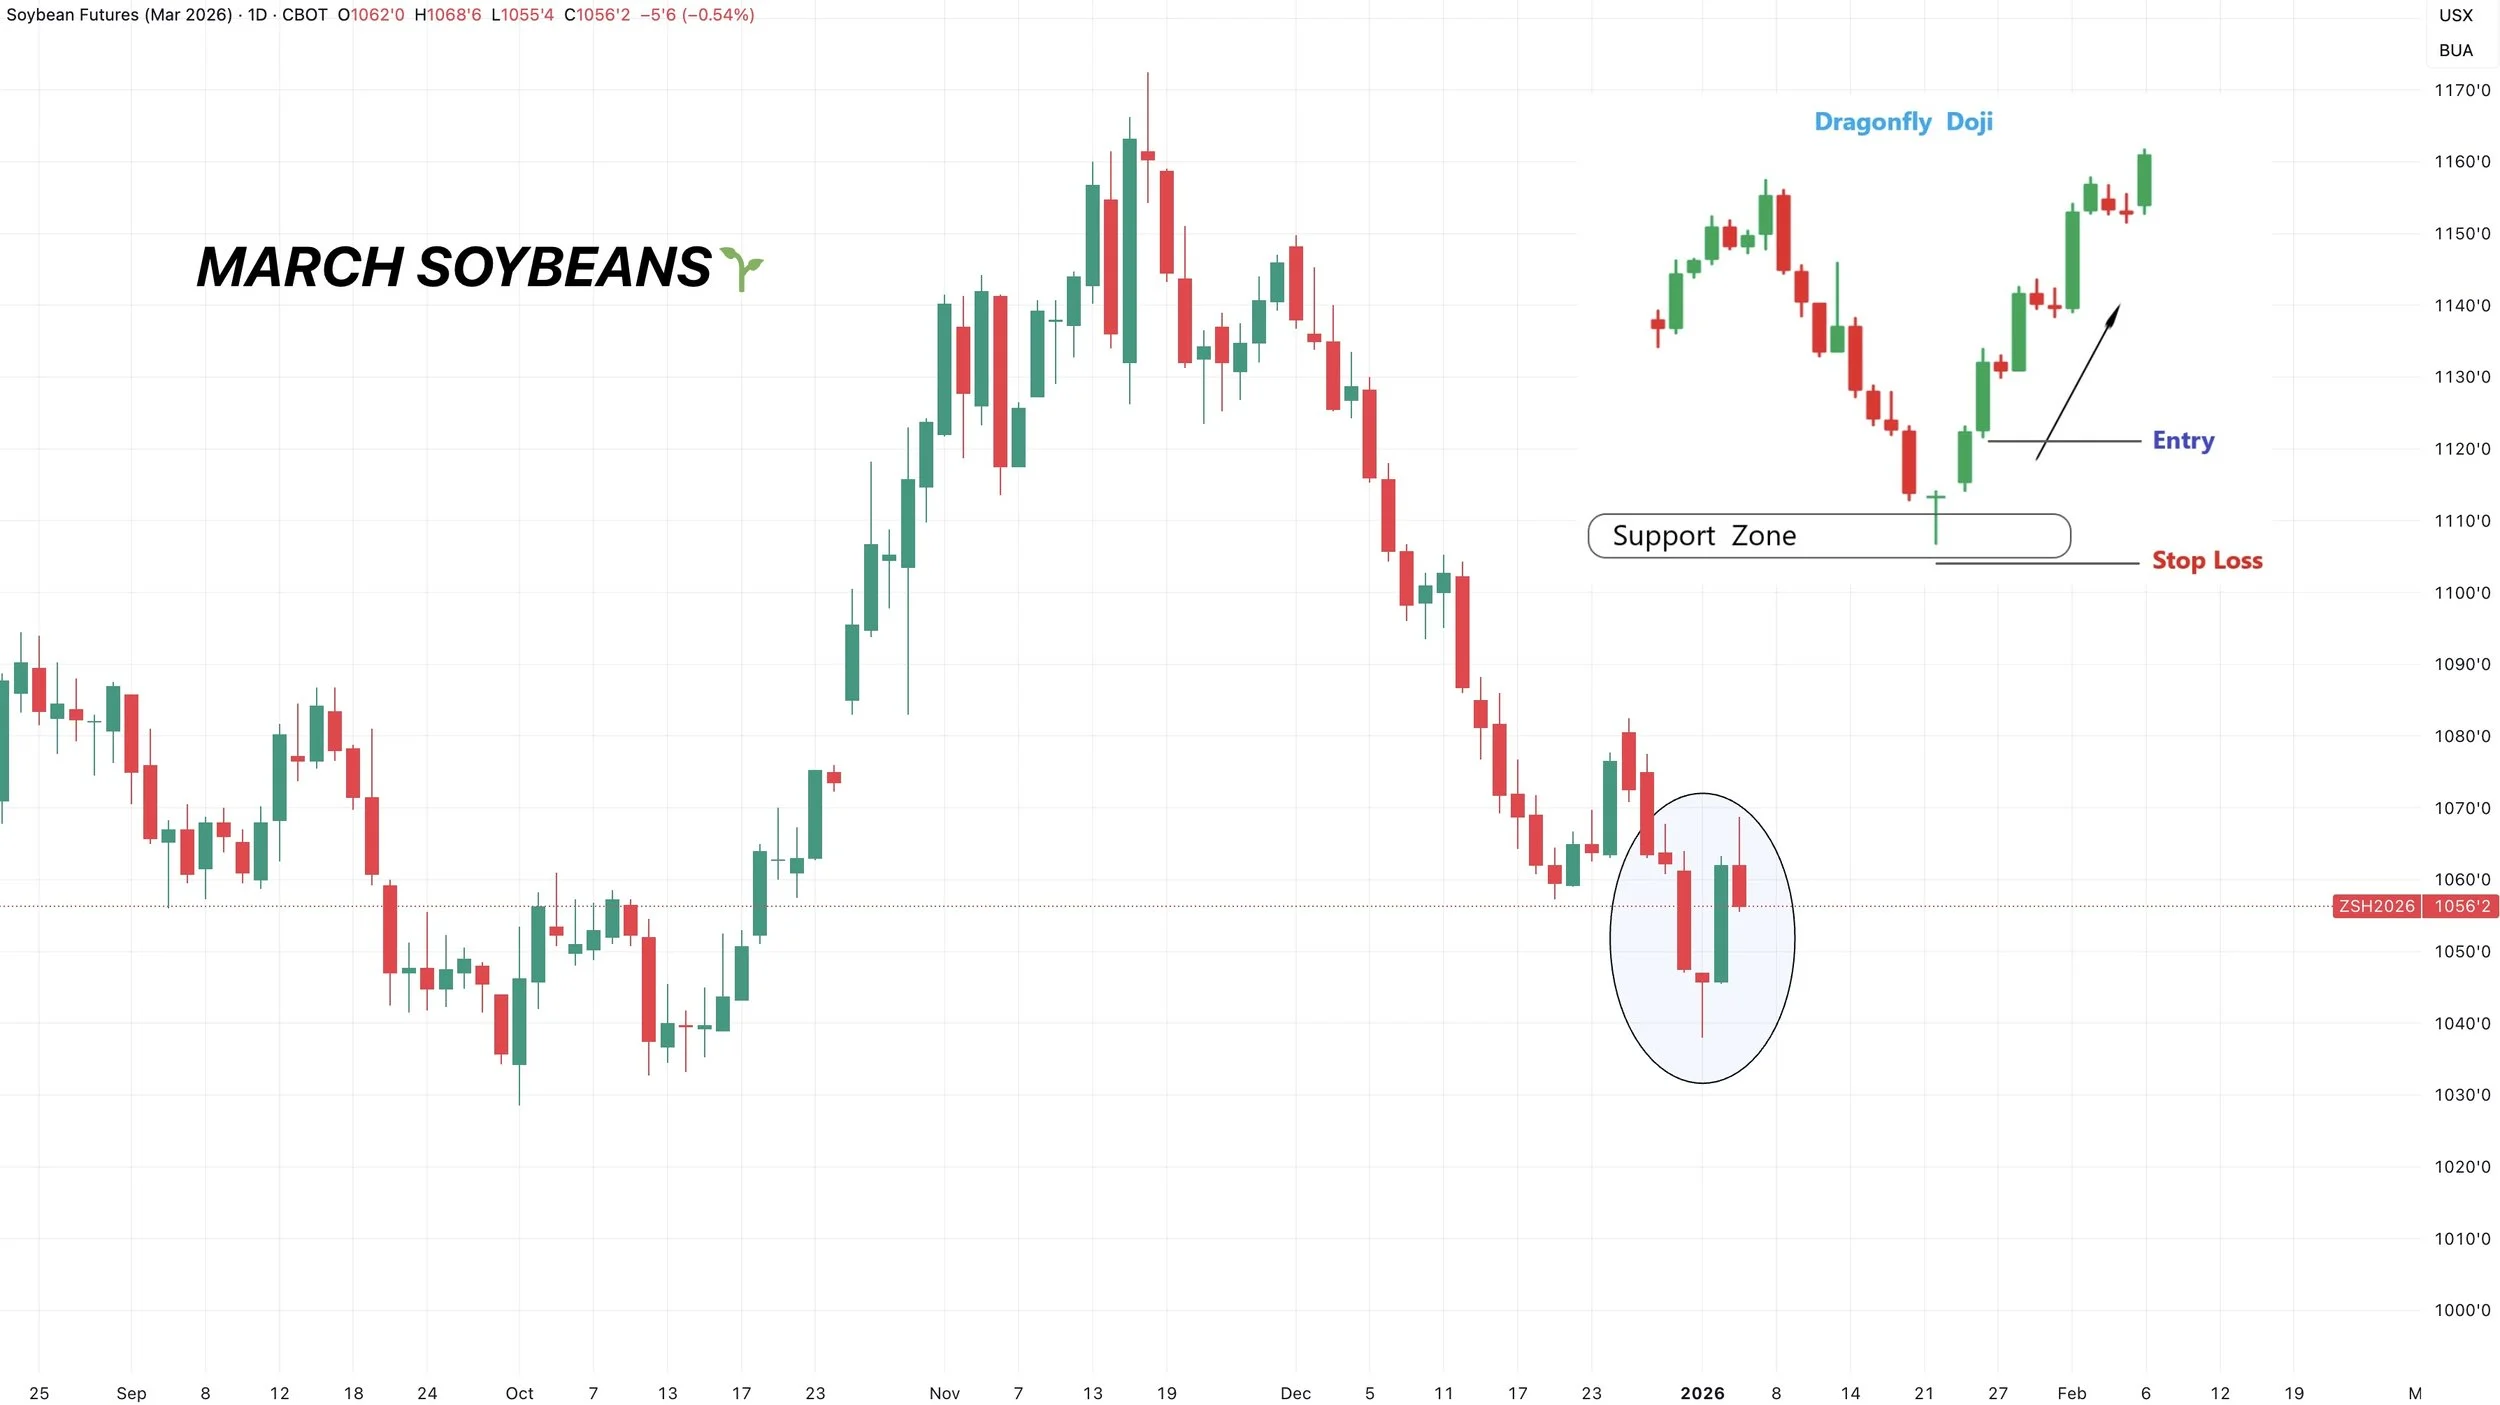
We also had a potential classic bear trap on Friday.
False breakdowns (aka bear traps) occur when you break below key support but quickly snap back above it.
In this case, we broke below the golden fib down to contract lows. Along with trendline support from contract lows.
Yesterday we then rallied back above them
We also posted confirmed bullish divergence.
As prices made new lows, yet the RSI did not.
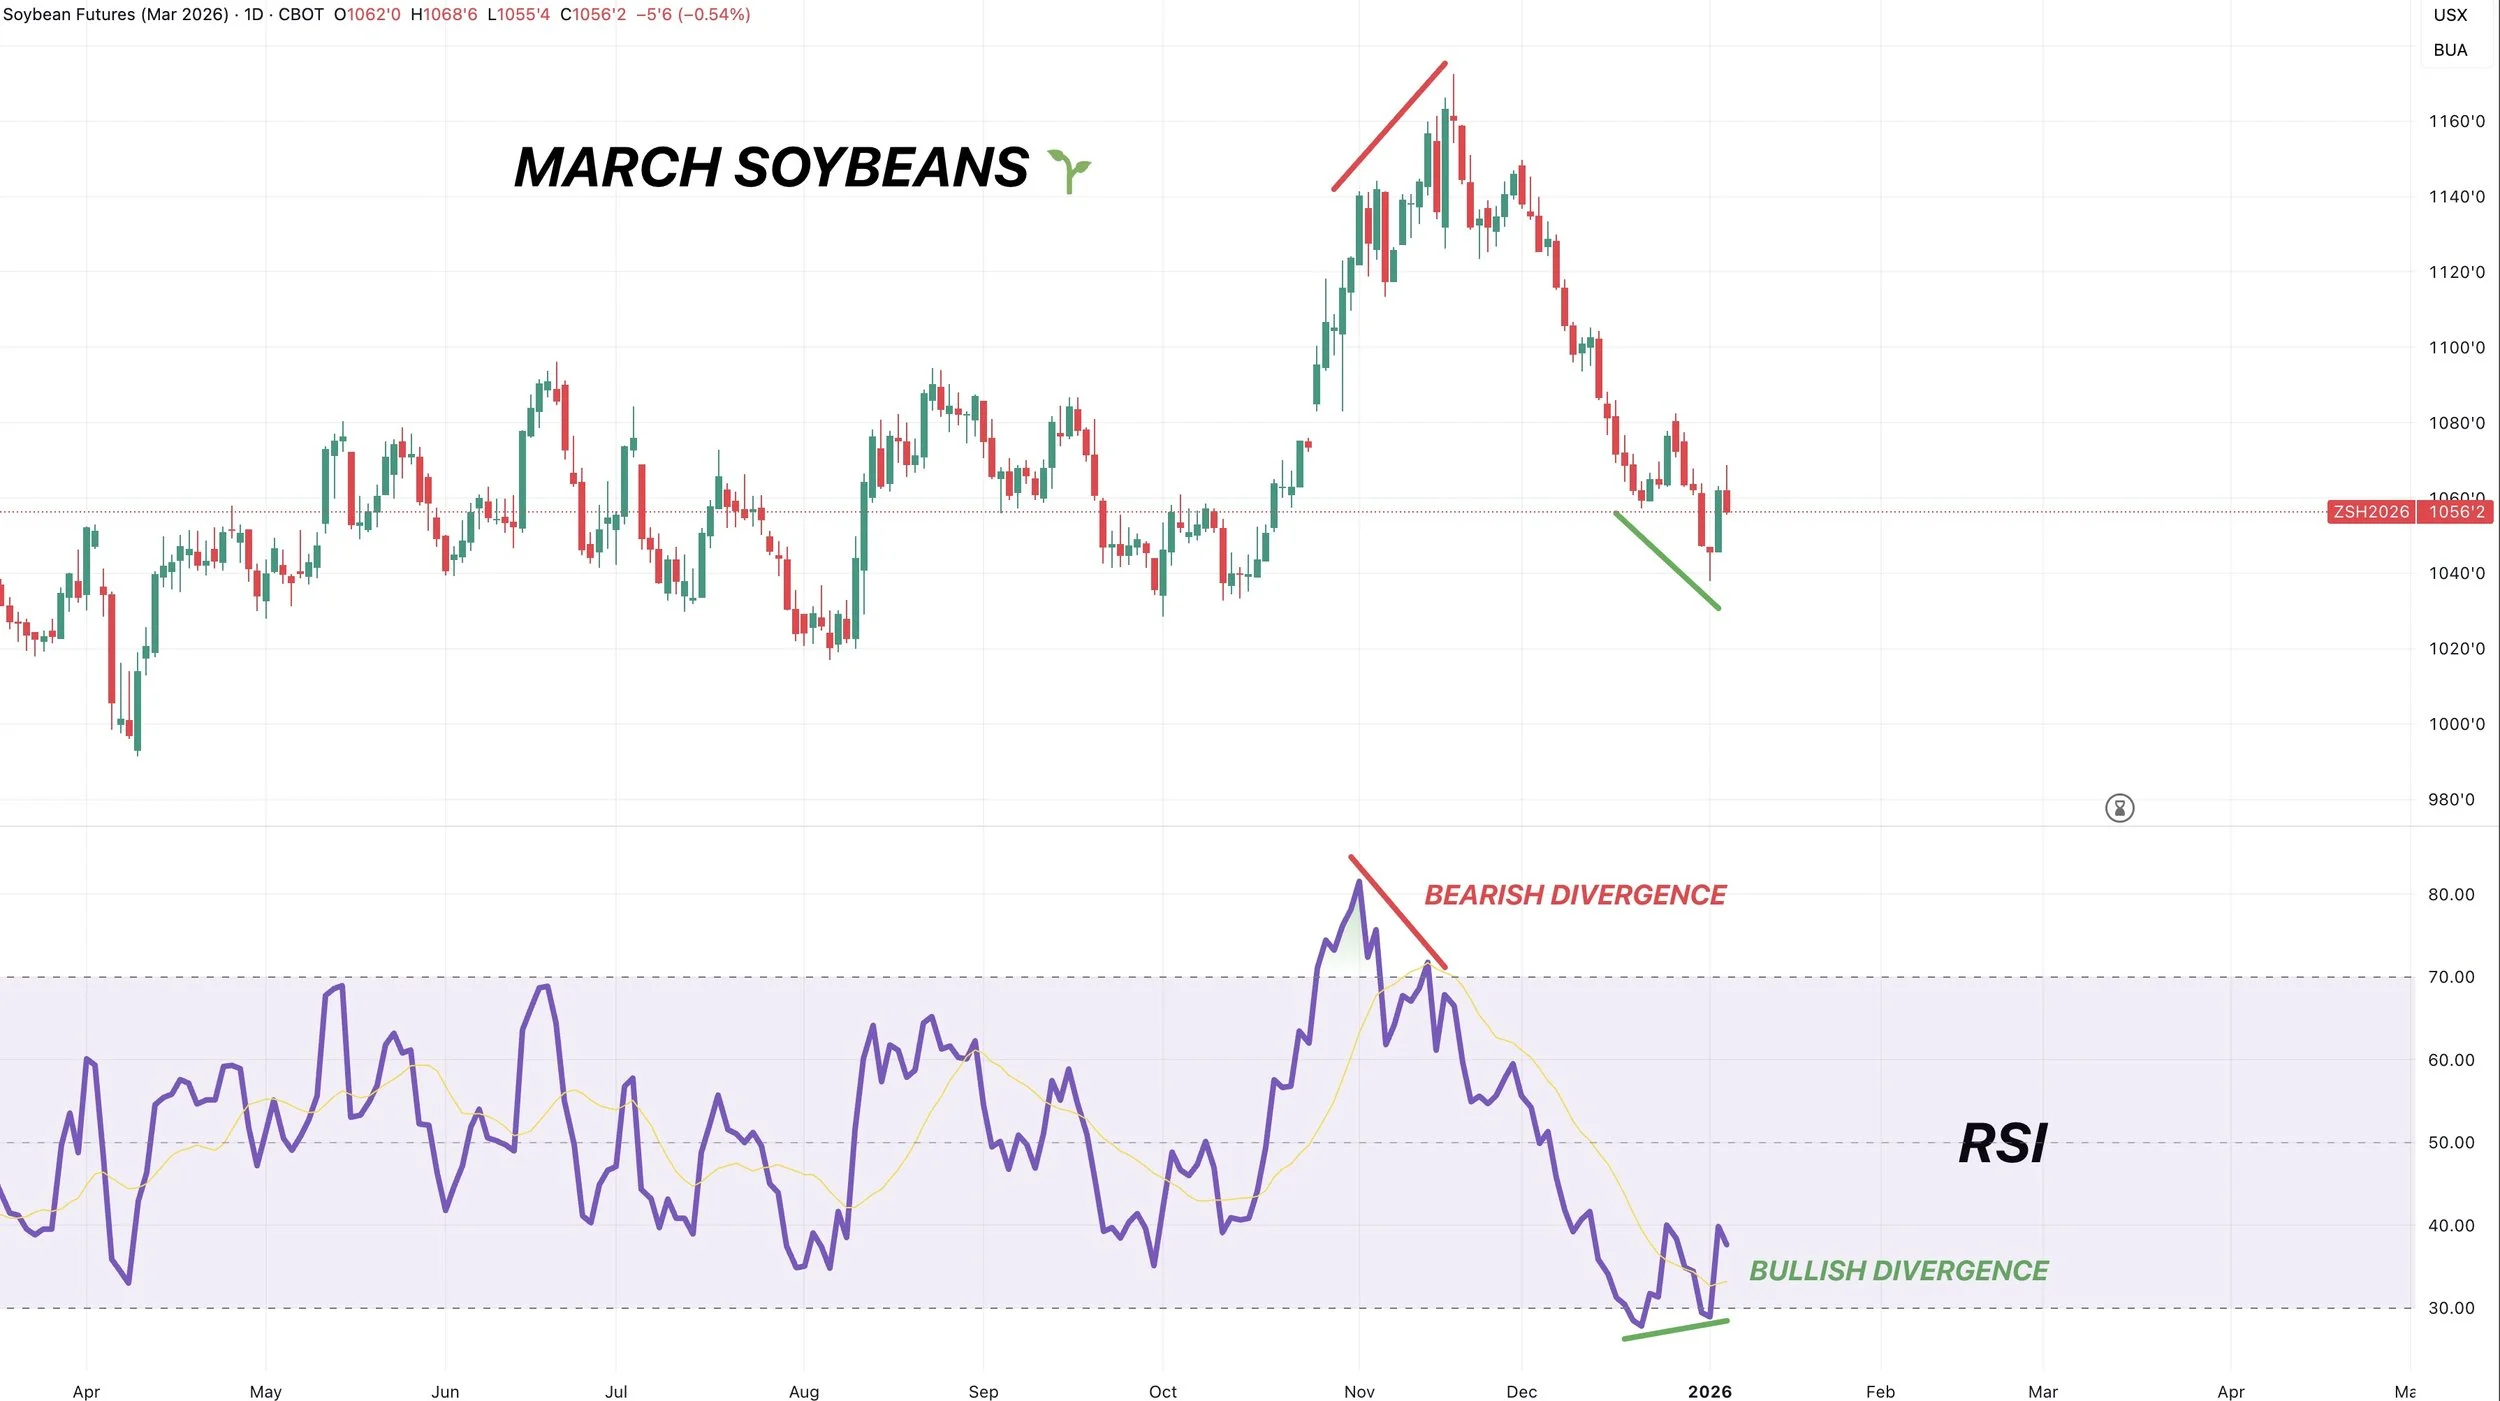
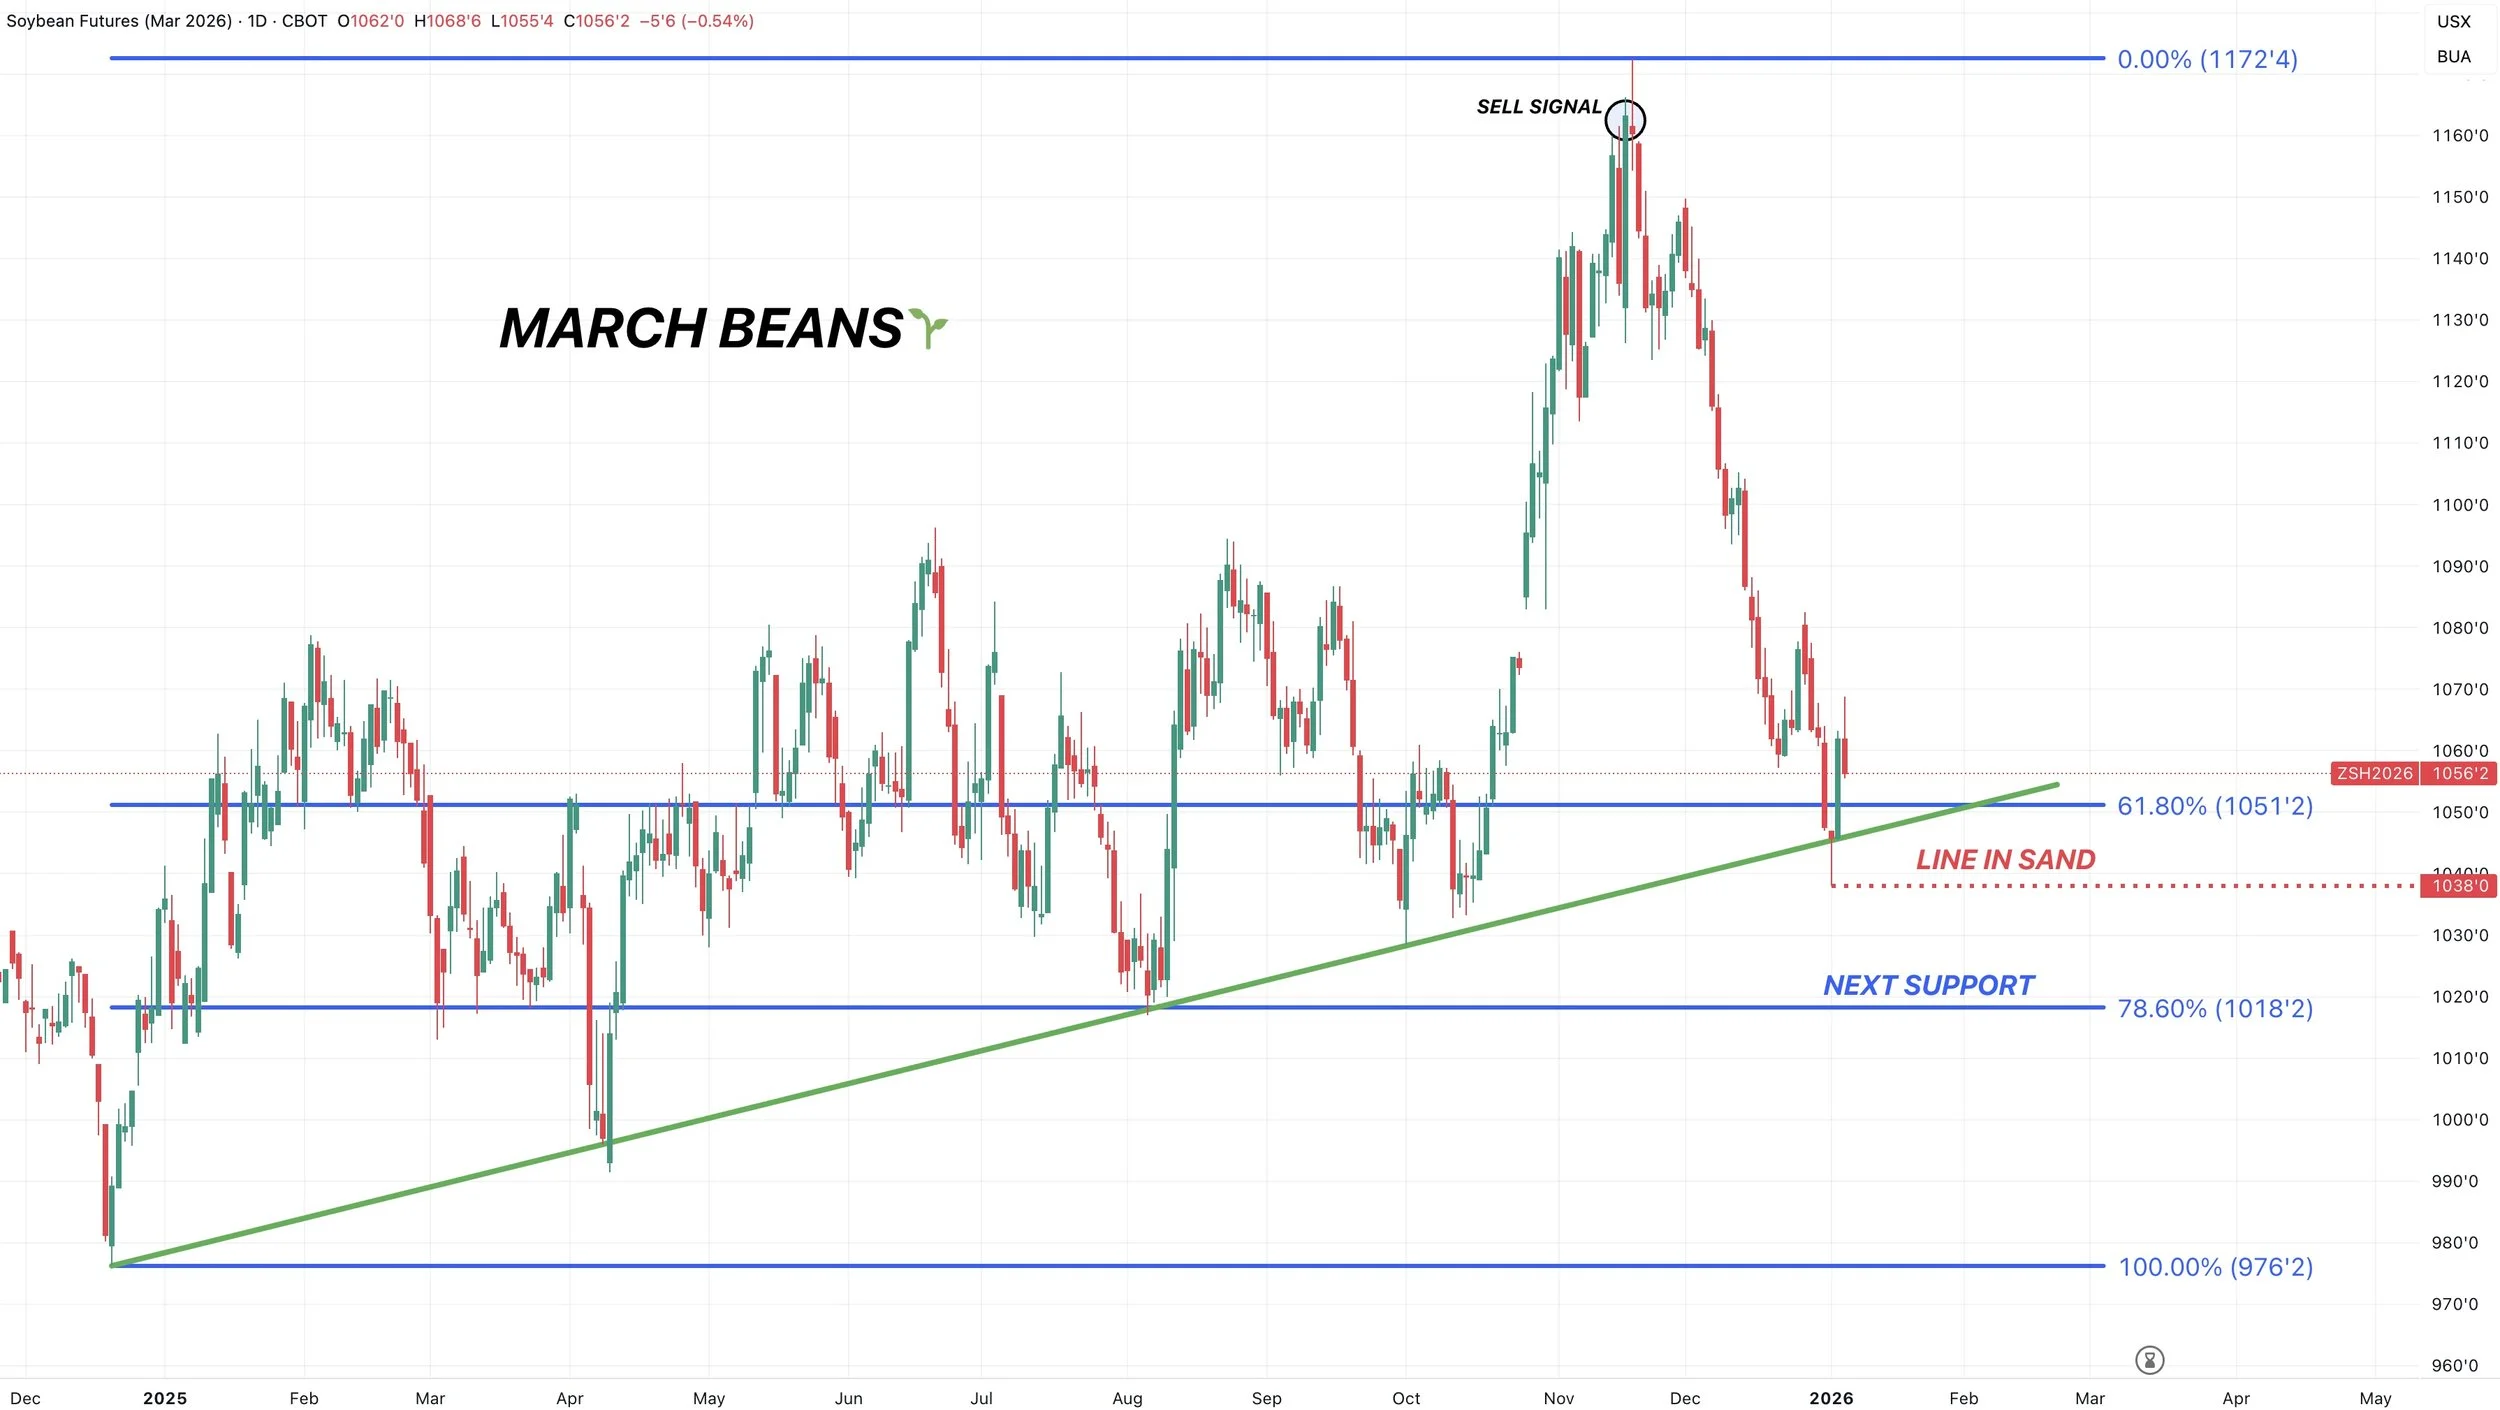
Yesterday's rally looks optimistic for some further upside.
However, the line in the sand is going to be Friday's lows of $10.38.
If we break below that level, we could open the door another 20 cents lower.
As $10.18 would be the next level of support.
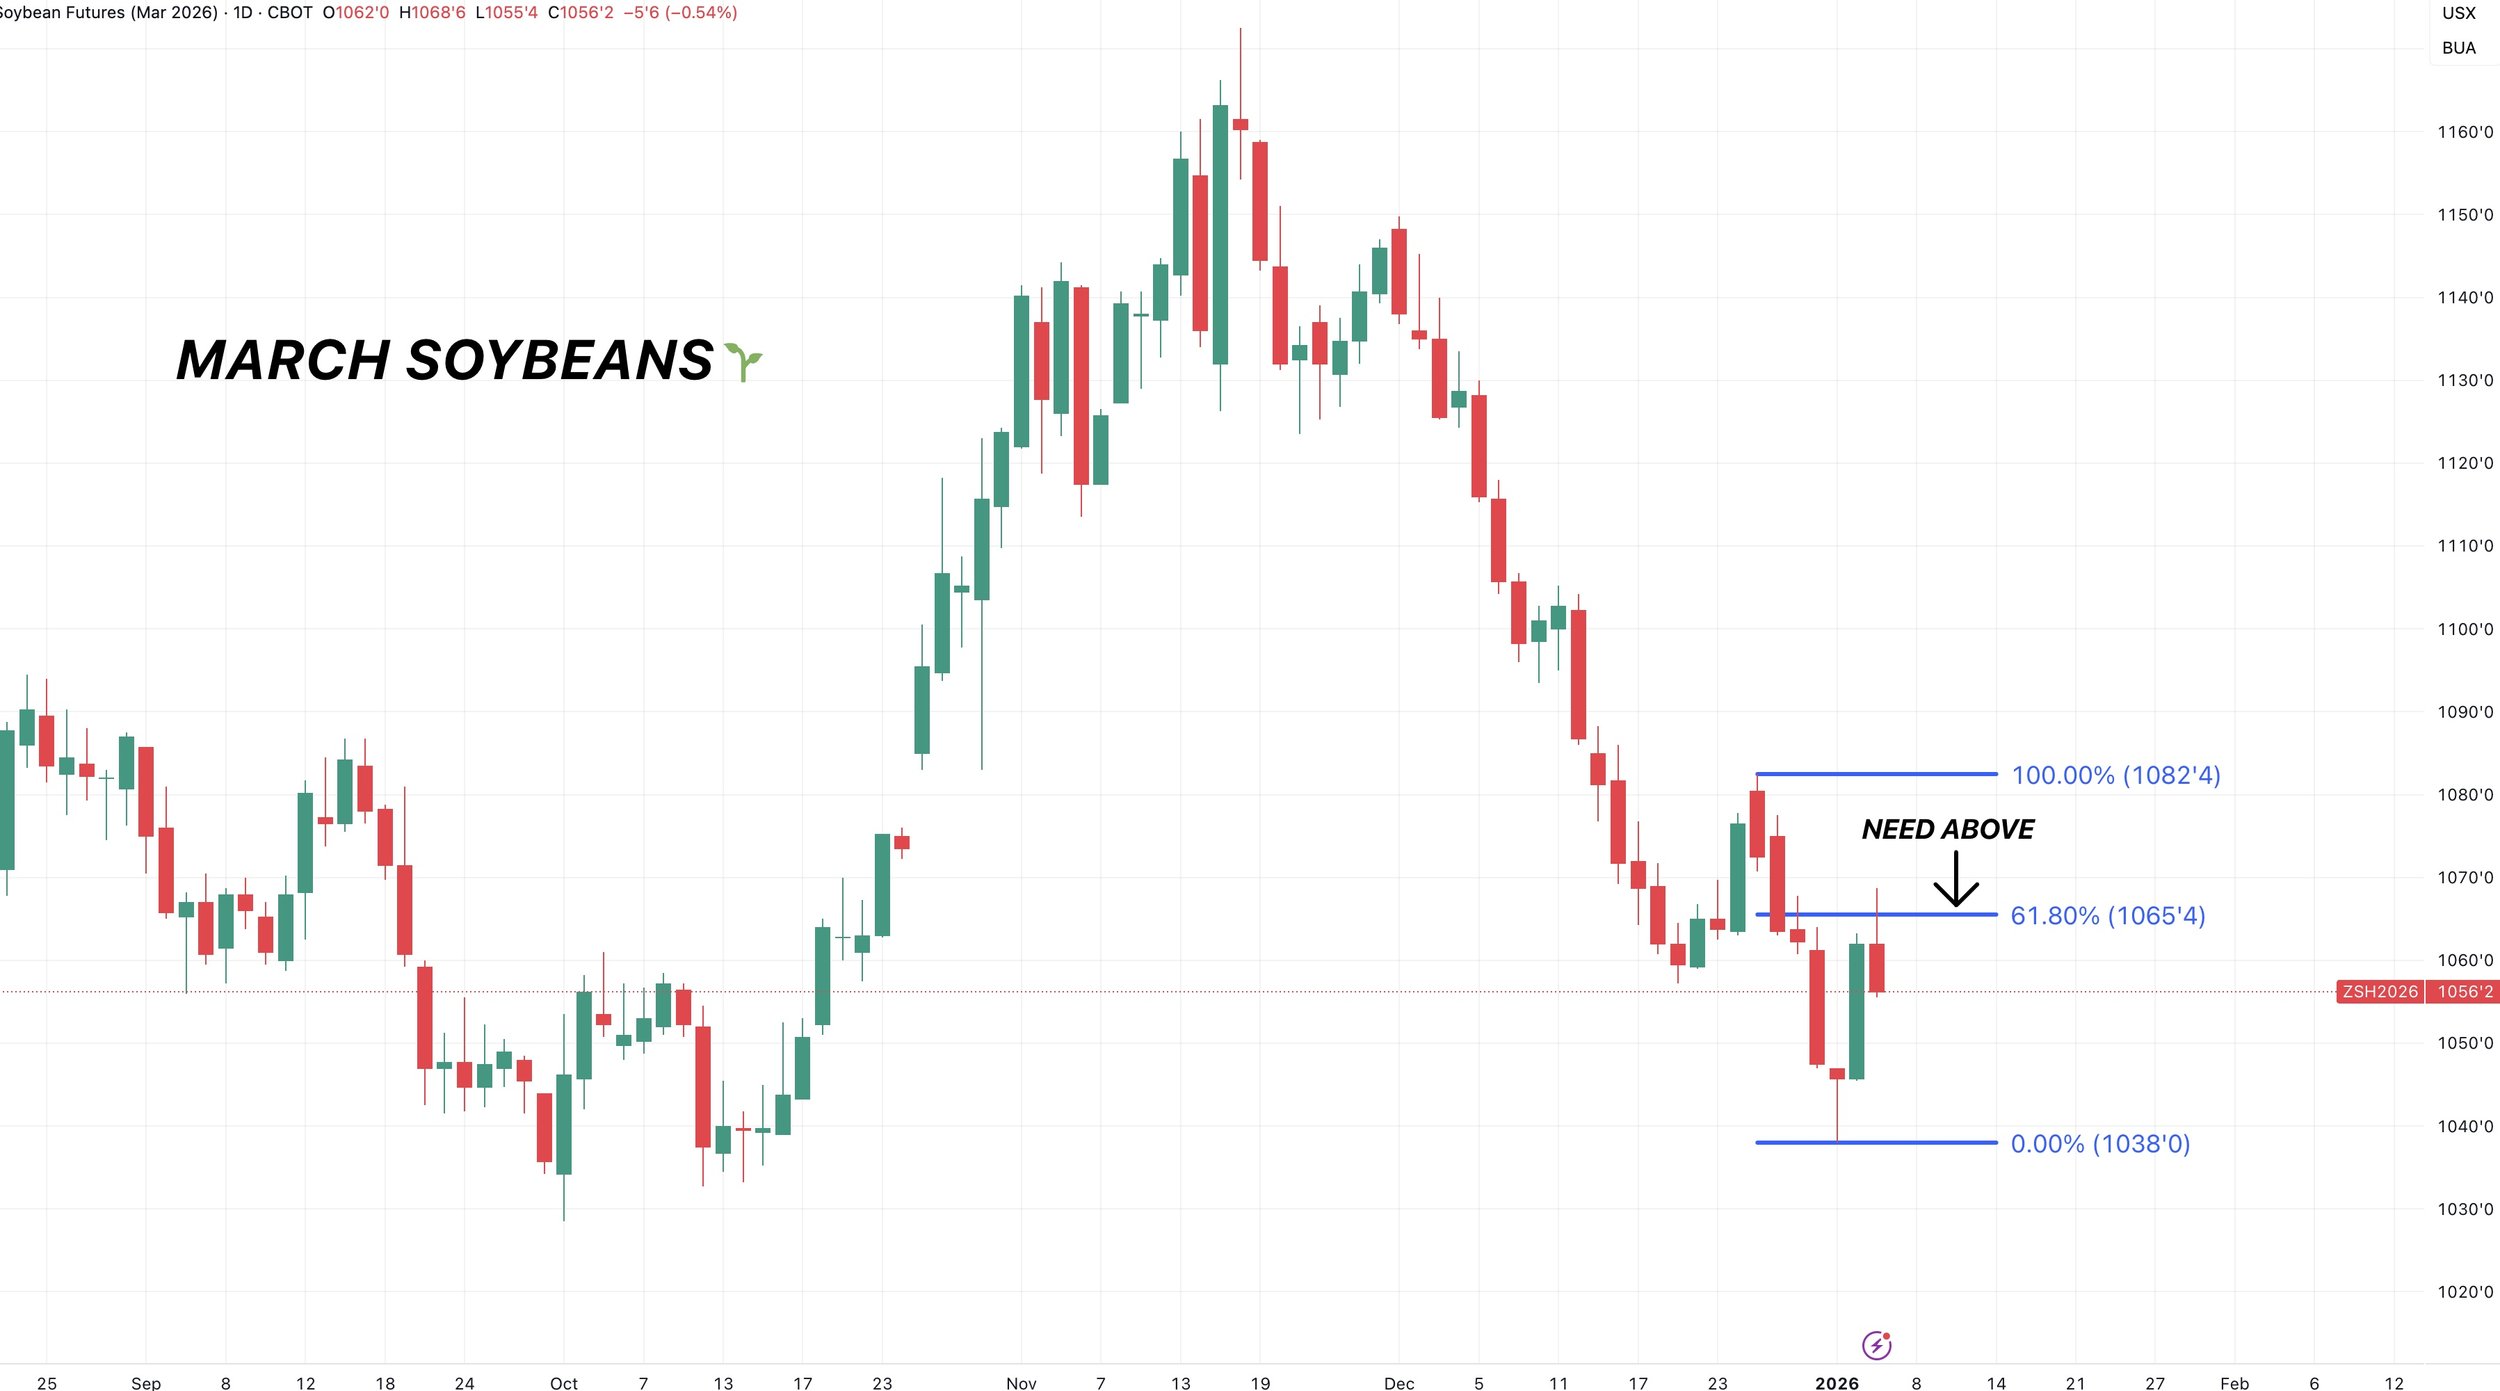
I'll have upside targets and areas to de-risk when I'm confident we've printed our lows.
If we close above $10.65 I'd be confident we are ready for a leg higher. As that is the 61.8% level up to those recent Christmas highs.
Wheat
Not going to go over much in wheat today as I don’t want to make today's update too long. There isn’t much new in the wheat market to begin with.
We still lack have a bullish catalyst.
As the US wheat situation is bearish, and globally, there are zero concerns with supply.
Patiently waiting for an opportunity.
Technicals:
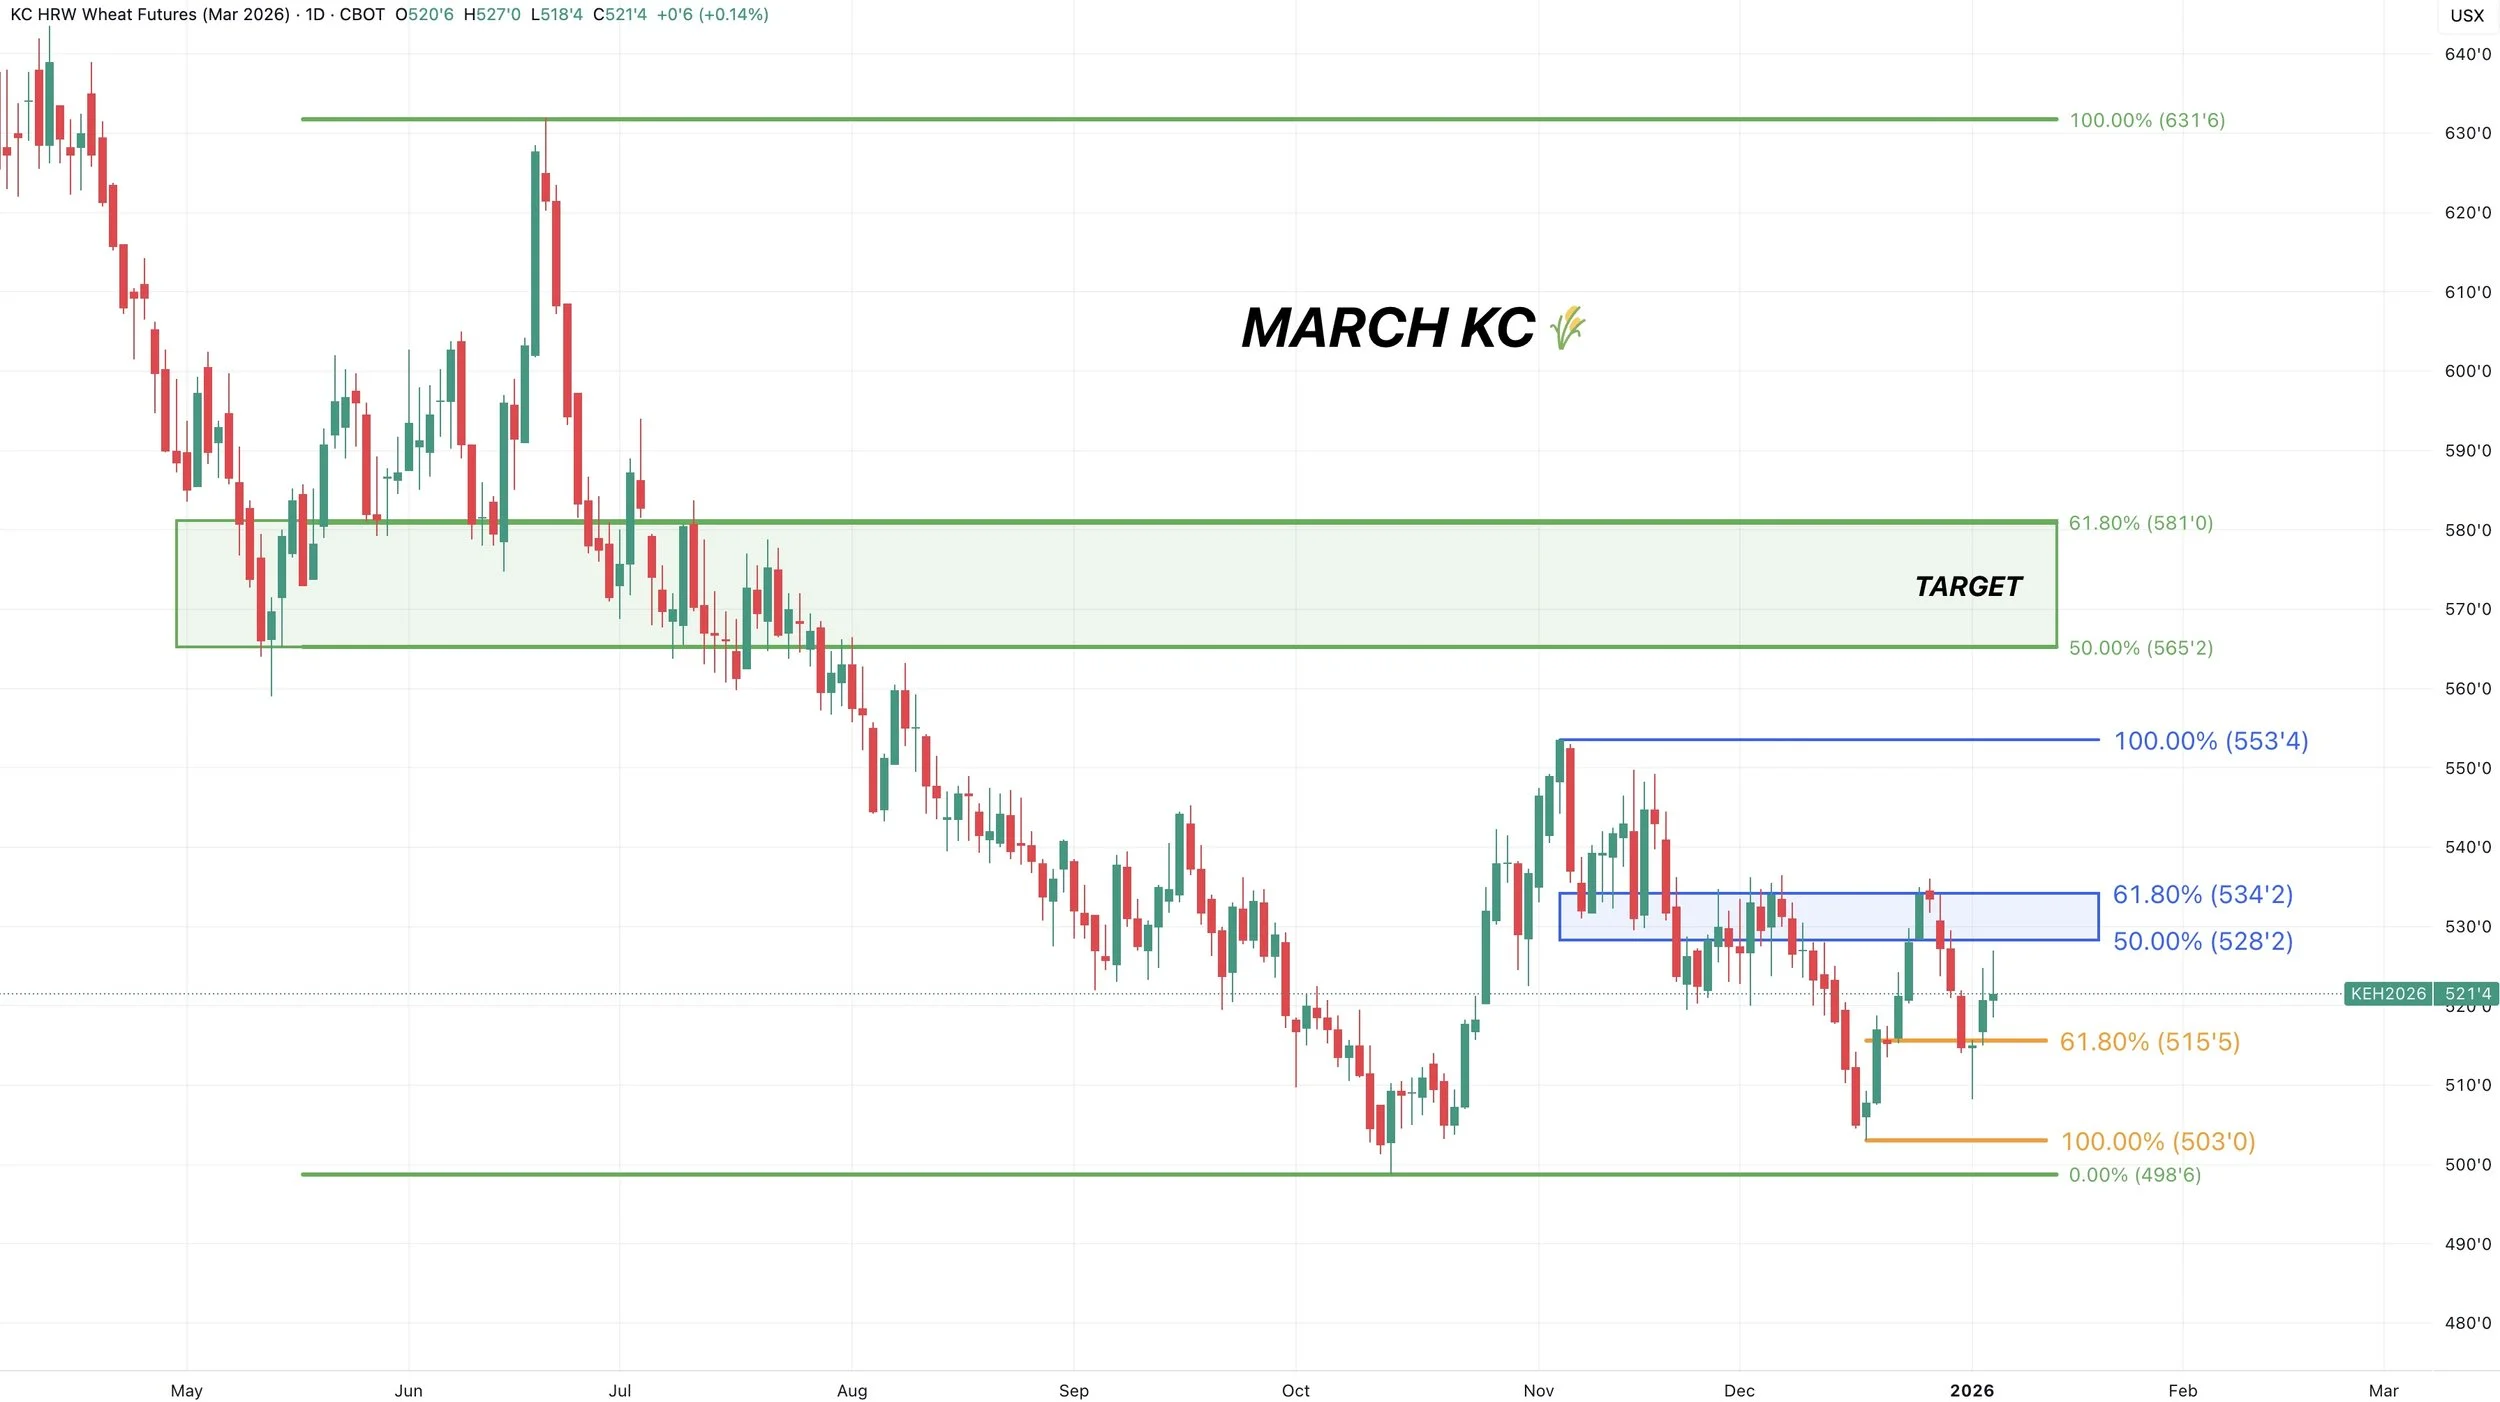
March KC
So far we are finding some support where we need.
The 61.8% level of this entire mini bounce we had to end the year.
Need to hold that otherwise we go and test the contract low area.
To the upside we need to take out those Christmas highs at $5.34.
That claws back 61.8% of the Nov highs.
Do that and we can be confident we are ready for the next leg higher.
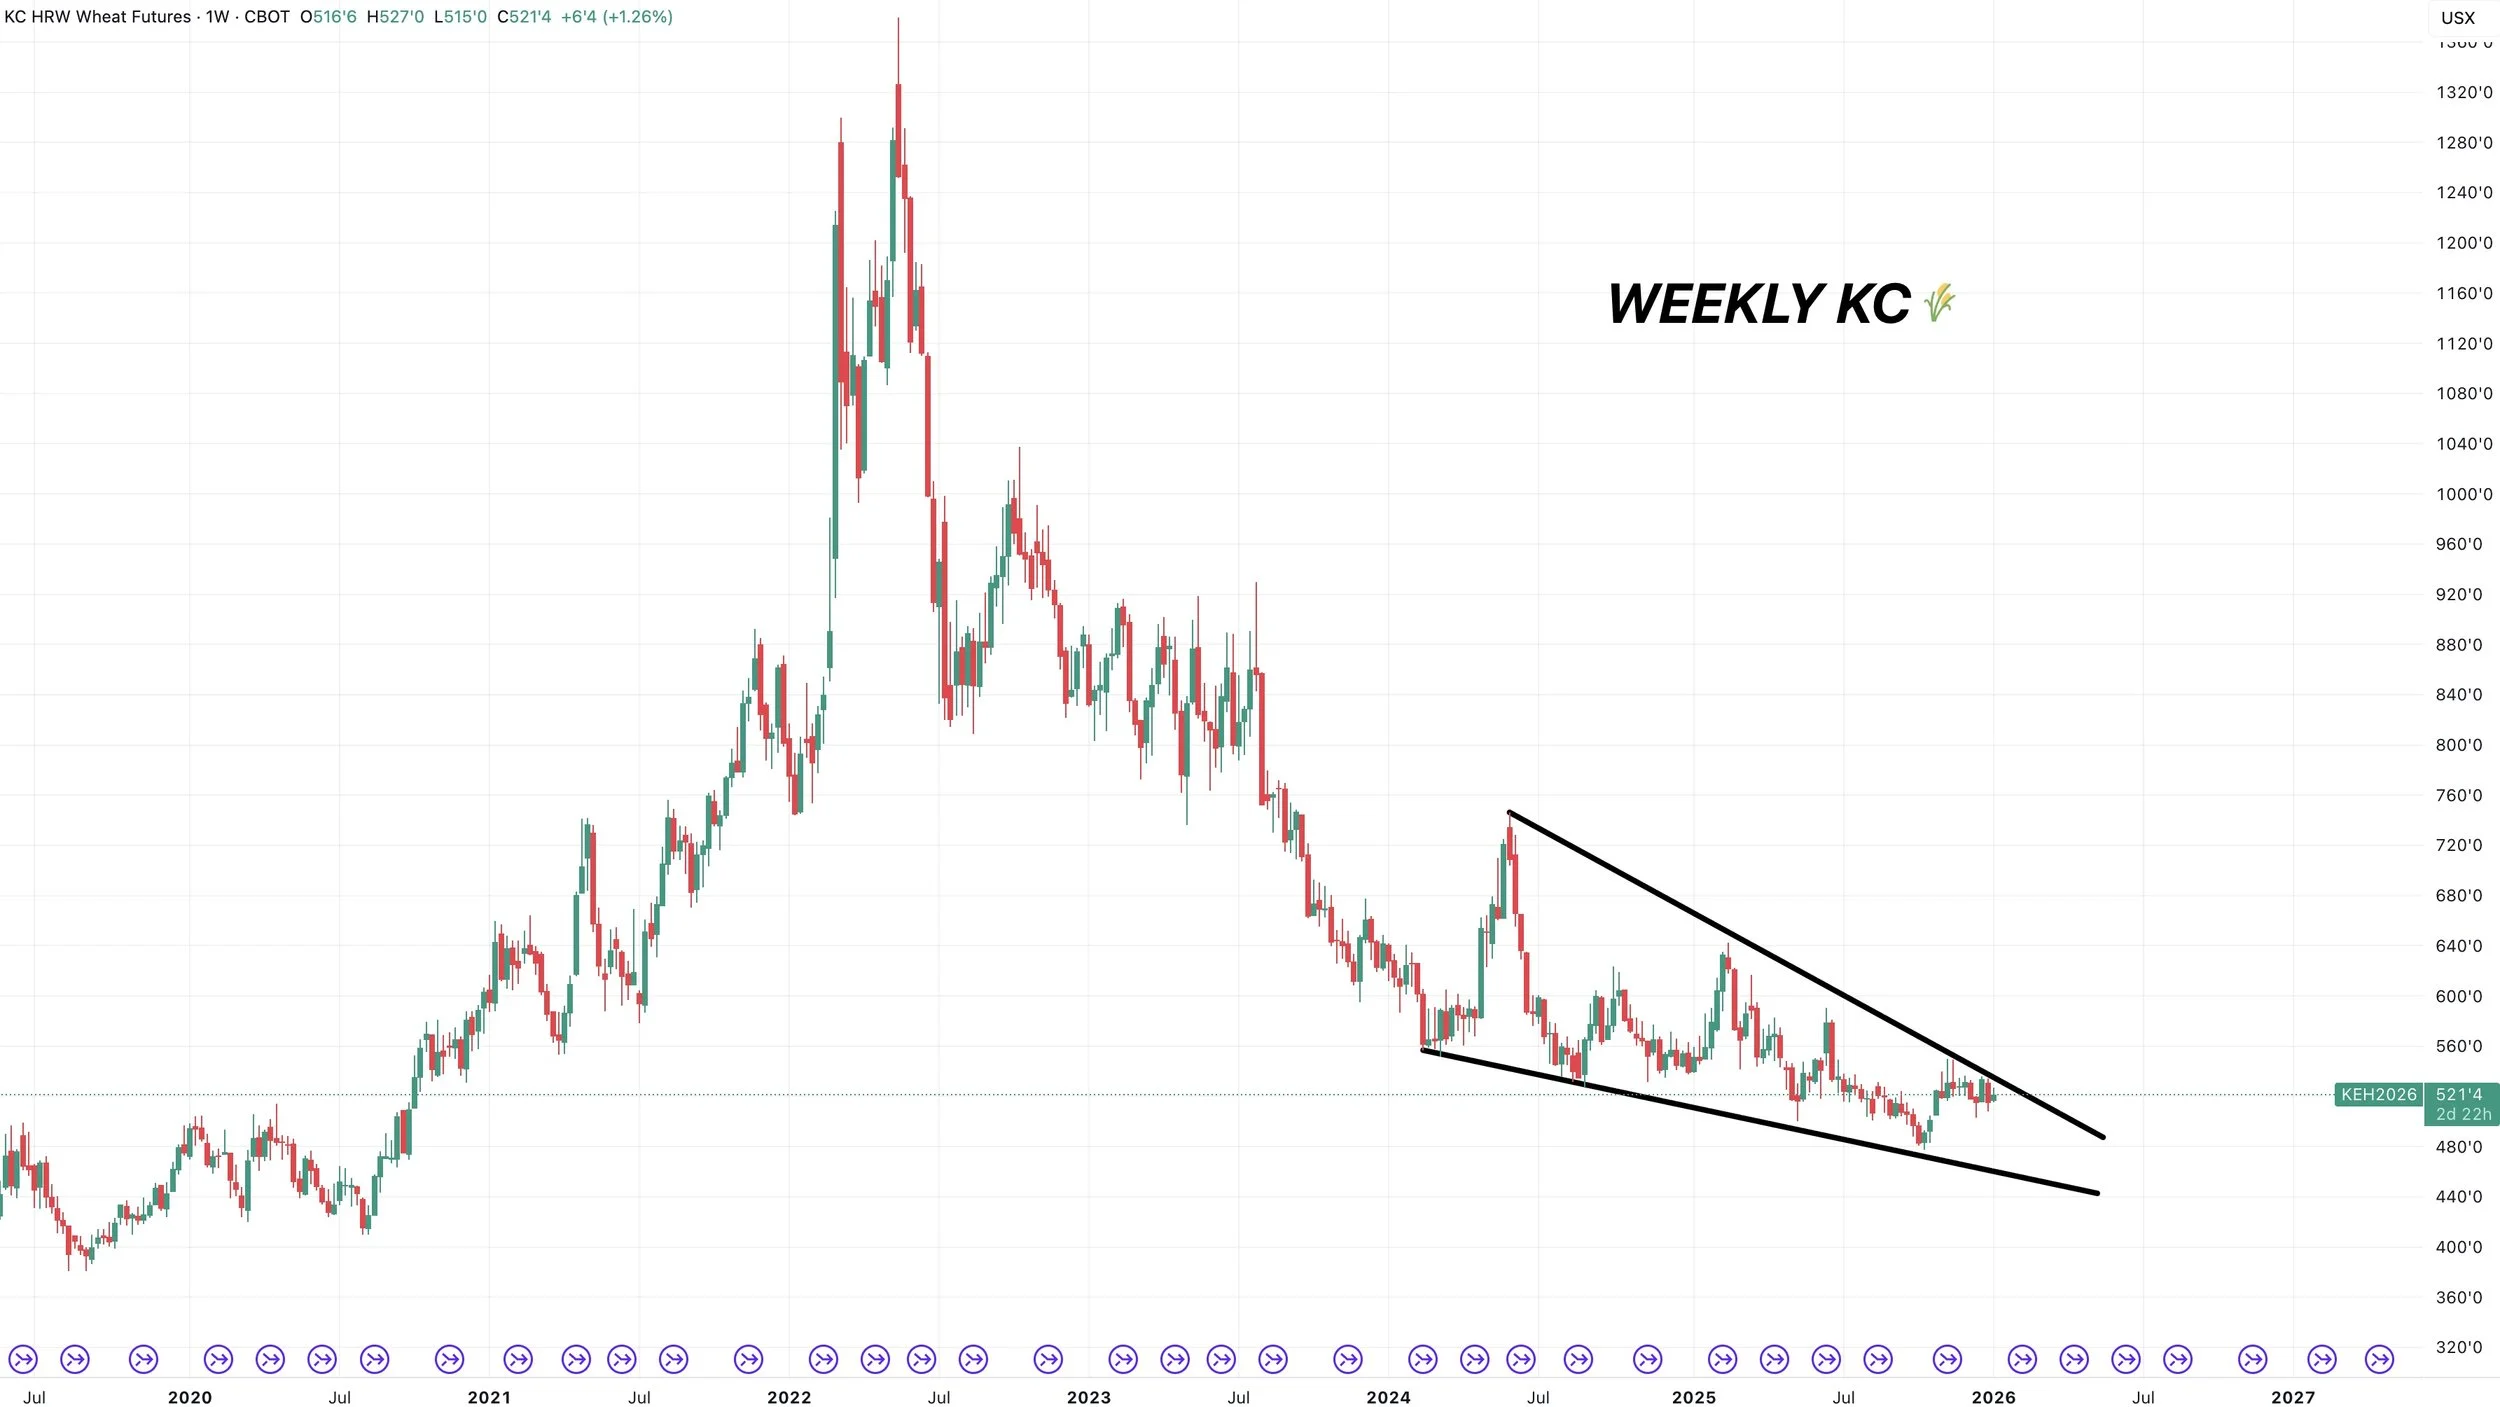
Weekly Continuous KC
Here is the weekly chart.
We do have a massive wedge pattern we've been forming since 2024.
I'd like to think that eventually we get a break out.
Just might not happen as soon as we'd like.
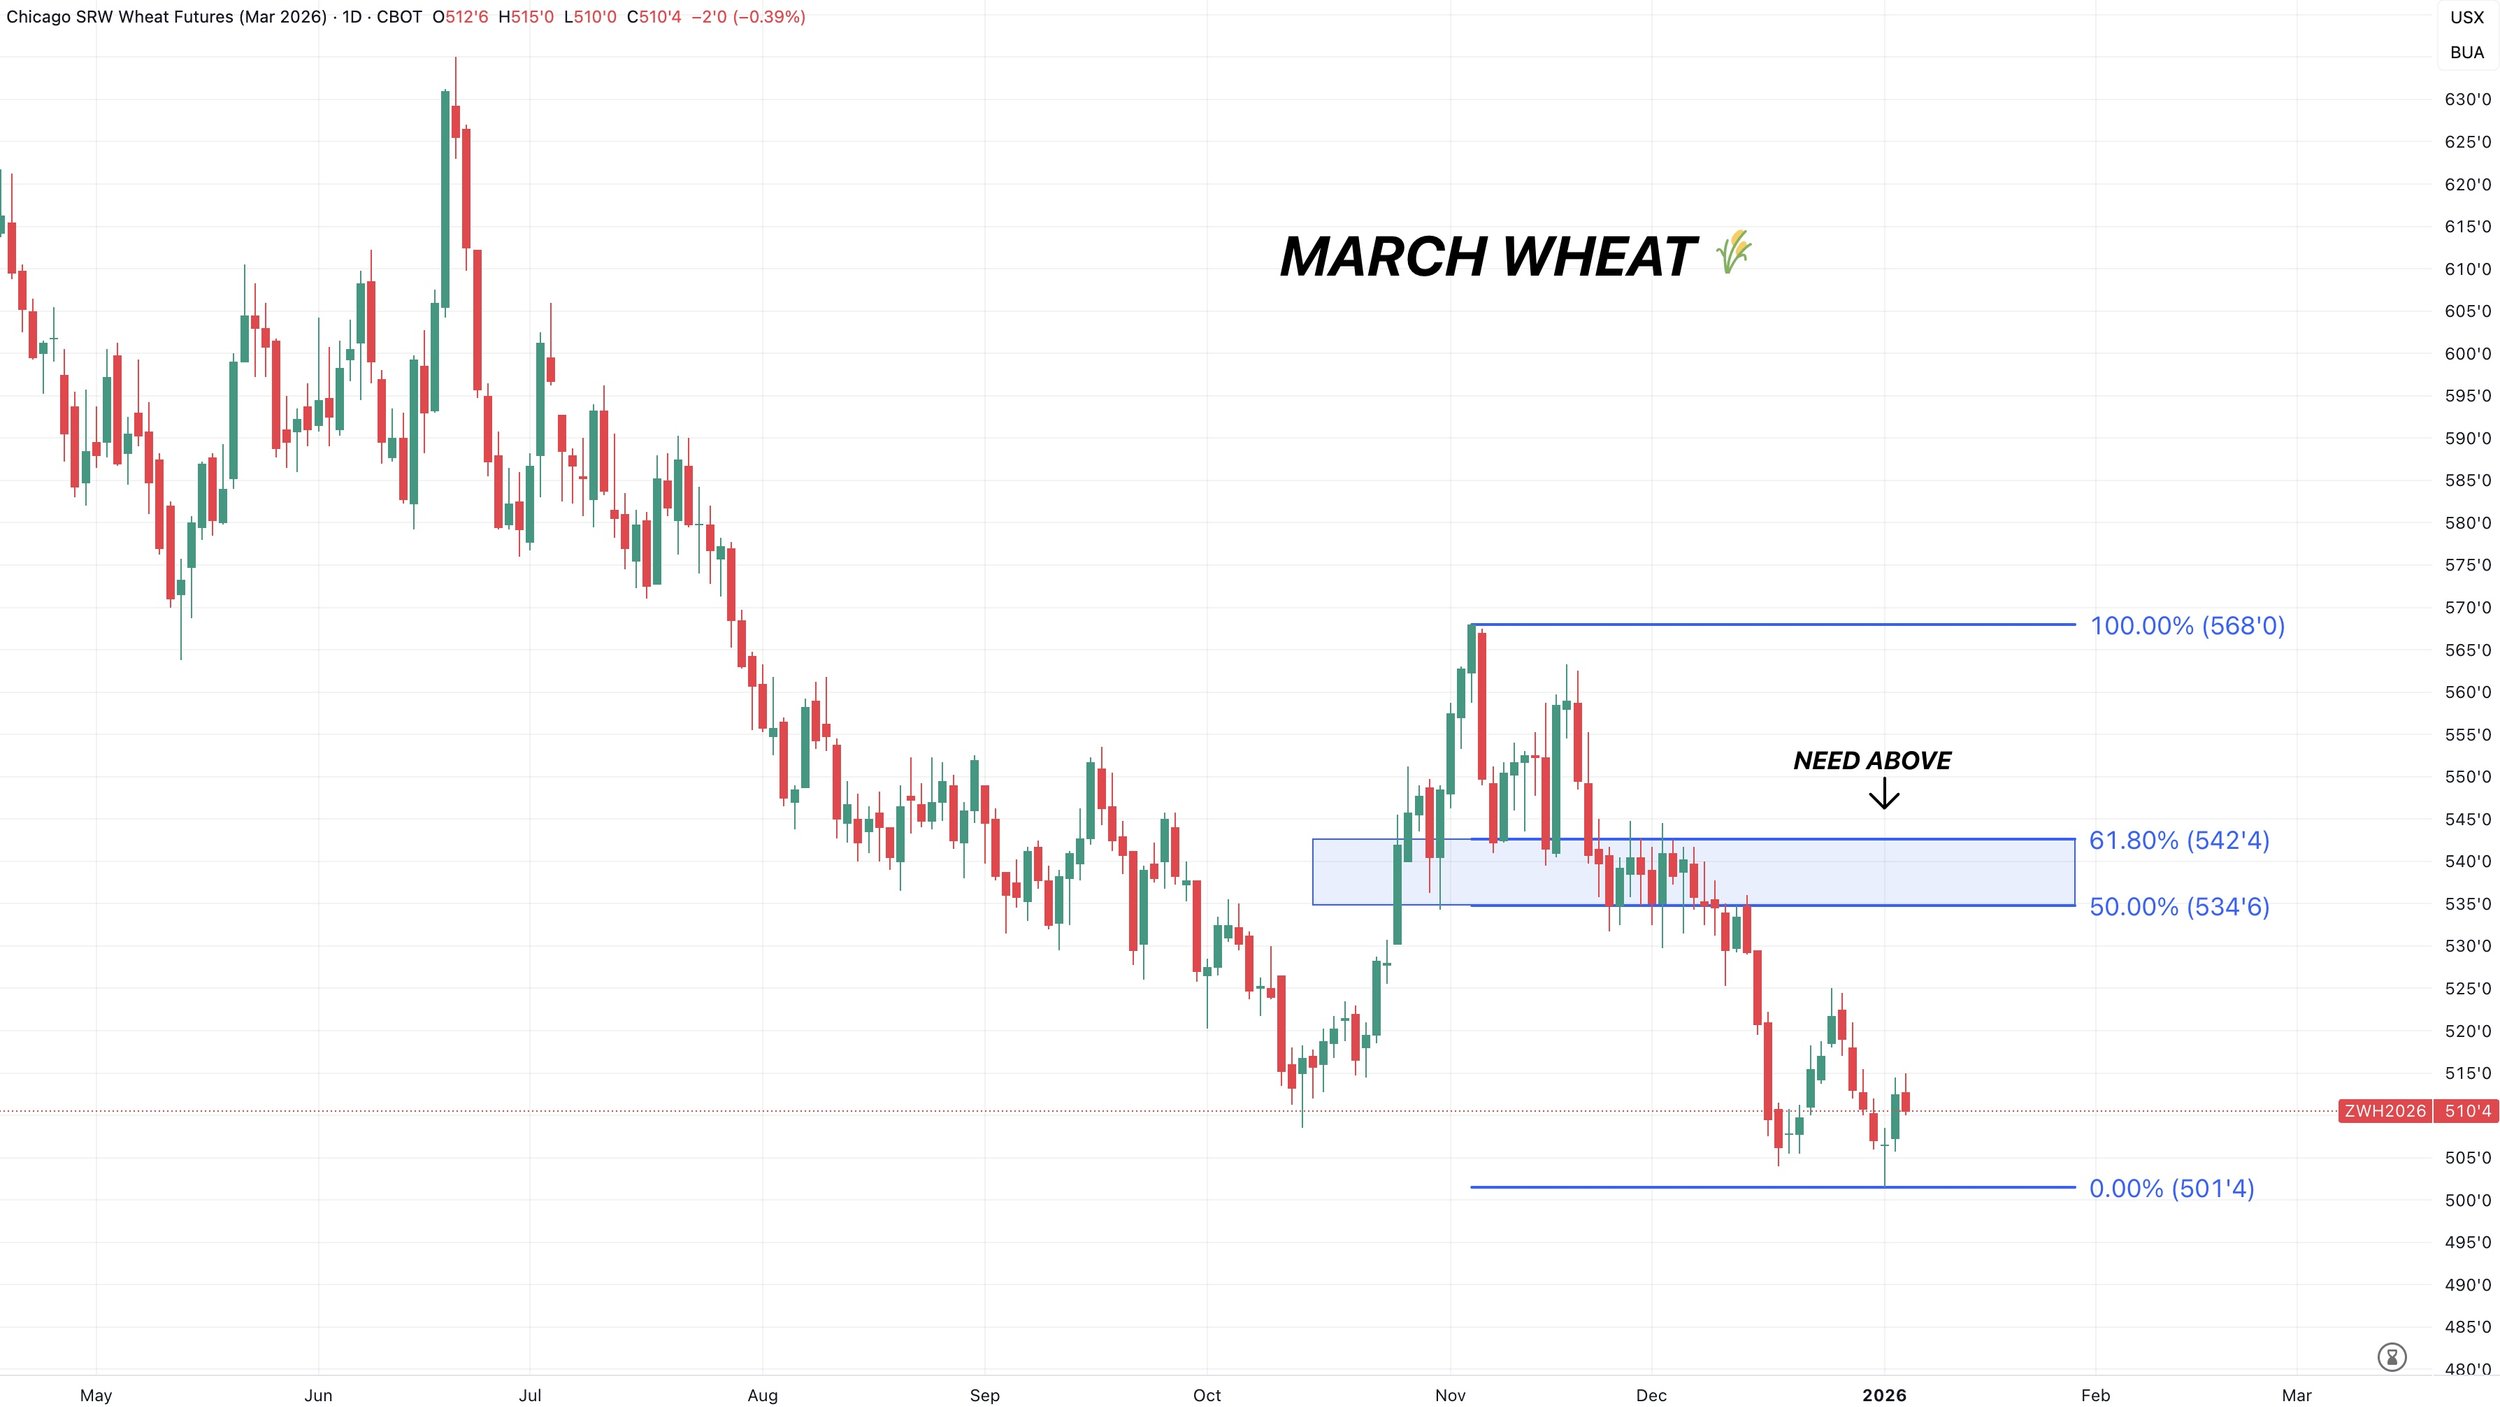
March Chicago
Hovering near contract lows.
We have some work to do for me to be confident we've found a bottom.
Cattle
Fundamentals:
Live cattle are stalling while feeders continue to rally.
The price action does feel a little backwards.
Cattle is ripping higher even though packers are in the red, we had a packing plant close down, and the beef cutout isn’t strong. Yet they continue to push this market higher. So this rally is hard to justify fundamentally.
Feeders have been leading the charge on this move. It feels like a dash for cash, a race to buy feeders as fast as they can.
It feels like we are getting a little disconnected as far as margins go.
With feedlot margins and packer margins not lining up, the market is getting a little stretched out. For the rally to stay "fundamentally clean". Cash needs to keep going higher or cut out needs to improve significantly.
If you look at the charts, clearly they aren’t bearish. I've been surprised at the strength of this rally. We've blown past some key levels, and the trend remains higher unless we take out last Friday's lows.
With the market doing the opposite of what it feels like it should be doing, we want to be cautious.
We don’t want to stand in front of a moving train here. But this is absolutely a rally where we should be taking chips off the table and upgrading protection.
If you have LRP coverage with a much lower floor, consider rolling that floor up with some strategies.
Give us a call if you have questions:
Jeremey: (605)250-3863
Lauren: (806)391-7178
Technicals:
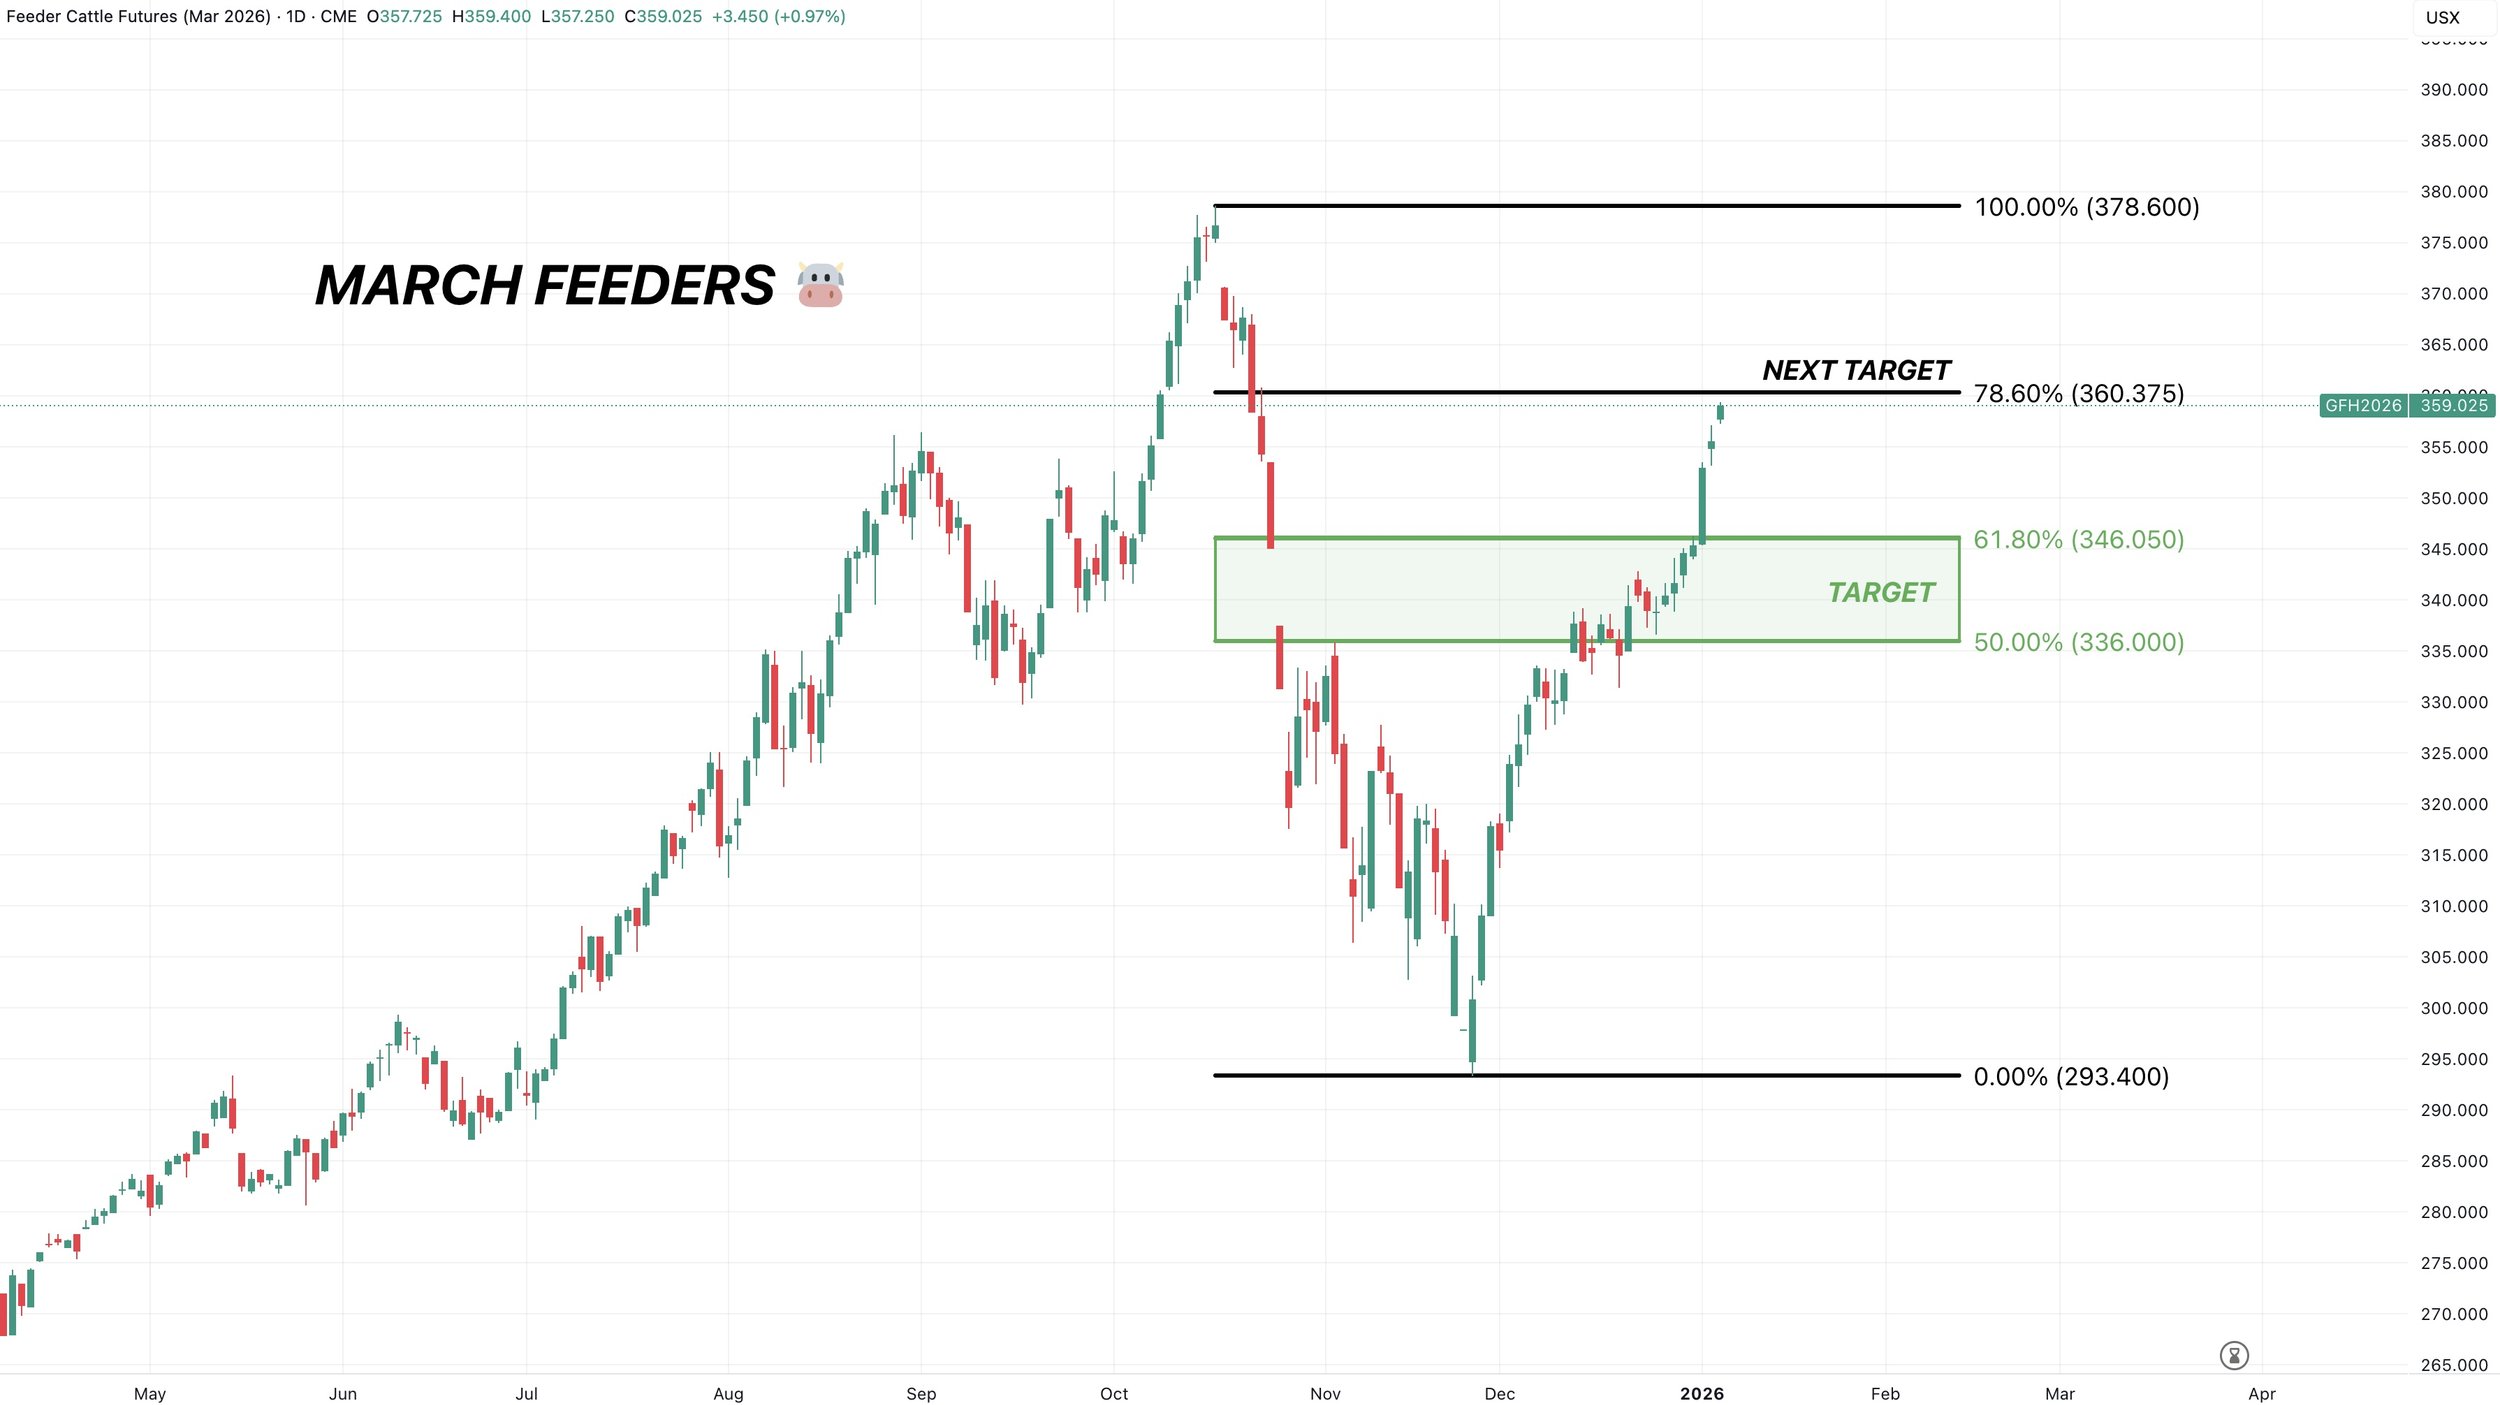
March Feeders
We've now blown past that orginal target box. Which was the golden zone retracement of the entire sell off.
We are now really close to hitting my last target before those highs.
Which is the 78.6% level up to those highs.
If we take out this level, then the next point of interest is that last gap and those highs.
Regardless we still like taking some chips off here.
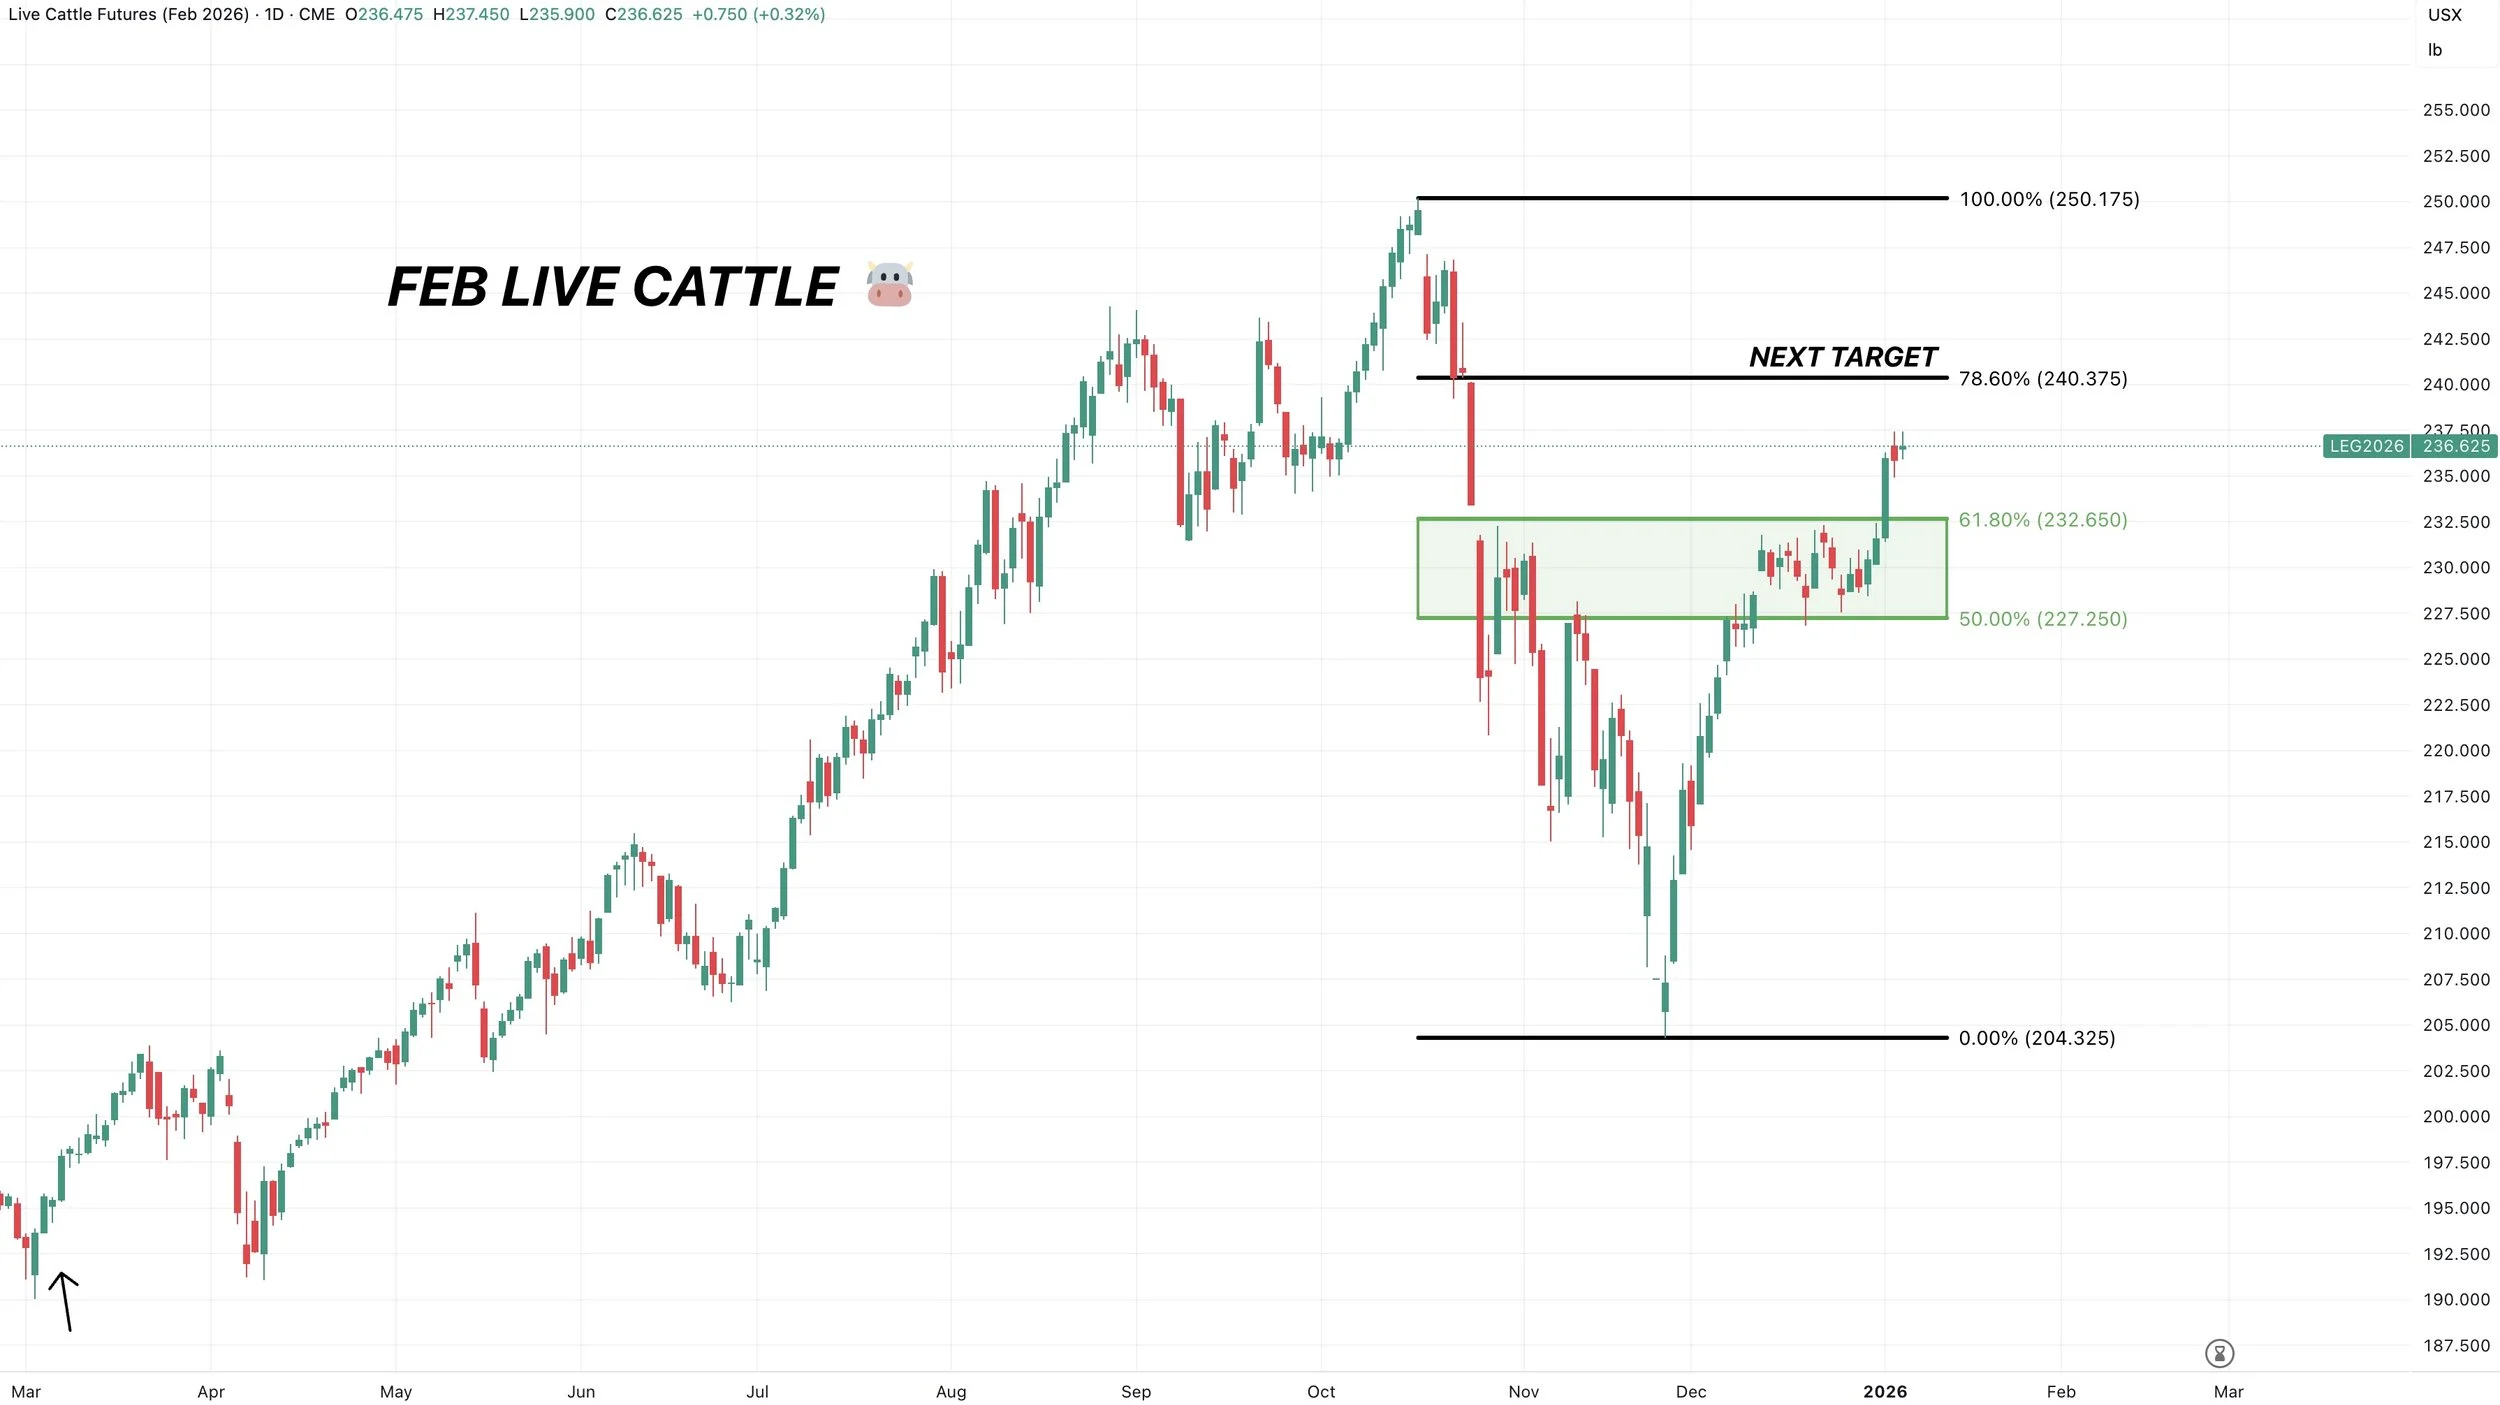
Feb Live
Live cattle also above that original target box.
The next point of interest is the 78.6% level right above 240.
Past Sell or Protection Signals
Dec 11th: 🐮
Cattle sell signal & hedge alert.
Dec 5th: 🐮
Cattle sell signal & hedge alert.
Nov 17th: 🌱
Soybean sell signal & hedge alert.
Nov 13th: 🌽 🌱
Managing risk in corn & beans ahead of USDA report.
Oct 28th: 🌽
Corn sell signal & hedge alert.
Oct 27th: 🌱
Soybean sell signal & hedge alert.
Oct 13th: 🐮
Cattle sell signal & hedge alert.
Aug 22nd: 🌱
Soybean sell signal & hedge alert.
July 31st: 🐮
Cattle sell signal & hedge alert.
July 10th: 🐮
Cattle sell signal & hedge alert.
CLICK HERE TO VIEW
June 5th: 🐮
Cattle sell signal & hedge alert.
June 2nd: 🌾
MPLS wheat sell signal.
April 10th: 🌽
Old crop corn sell signal.
March 19th: 🐮
Cattle hedge & sell signal.
Feb 18th: 🌽 🌾
Old crop KC wheat & old crop corn signal.
Jan 23rd: 🌽 🌱
Corn & beans old crop sell signal.
CLICK HERE TO VIEW
Jan 15th: 🌽 🌱
Corn & beans hedge alert/sell signal.
Jan 2nd: 🐮
Cattle hedge alert at new all-time highs & target.
Dec 11th: 🌽
Corn sell signal at $4.51 200-day MA
CLICK HERE TO VIEW
Oct 2nd: 🌾
Wheat sell signal at $6.12 target
Sep 30th: 🌽
Corn protection signal at $4.23-26
Sep 27th: 🌱
Soybean sell & protection signal at $10.65
Sep 13th: 🌾
Wheat sell signal at $5.98
May 22nd: 🌾
Wheat sell signal when wheat traded +$7.00
Want to Talk?
Our phones are open 24/7 for you guys if you ever need anything or want to discuss your operation.
Hedge Account
Interested in a hedge account? Use the link below to set up an account or shoot Jeremey a call at (605)295-3100.