
RISK OFF CHAOS
MARKET UPDATE
You can scroll to read the usual update as well. As the written version is the exact same as the video.
Timestamps for video:
Overview: 0:00min
Corn: 3:05min
Beans: 5:20min
Wheat: 9:40min
Cattle: 11:10min
Want to talk about your situation?
(605)250-3863
Futures Prices Close
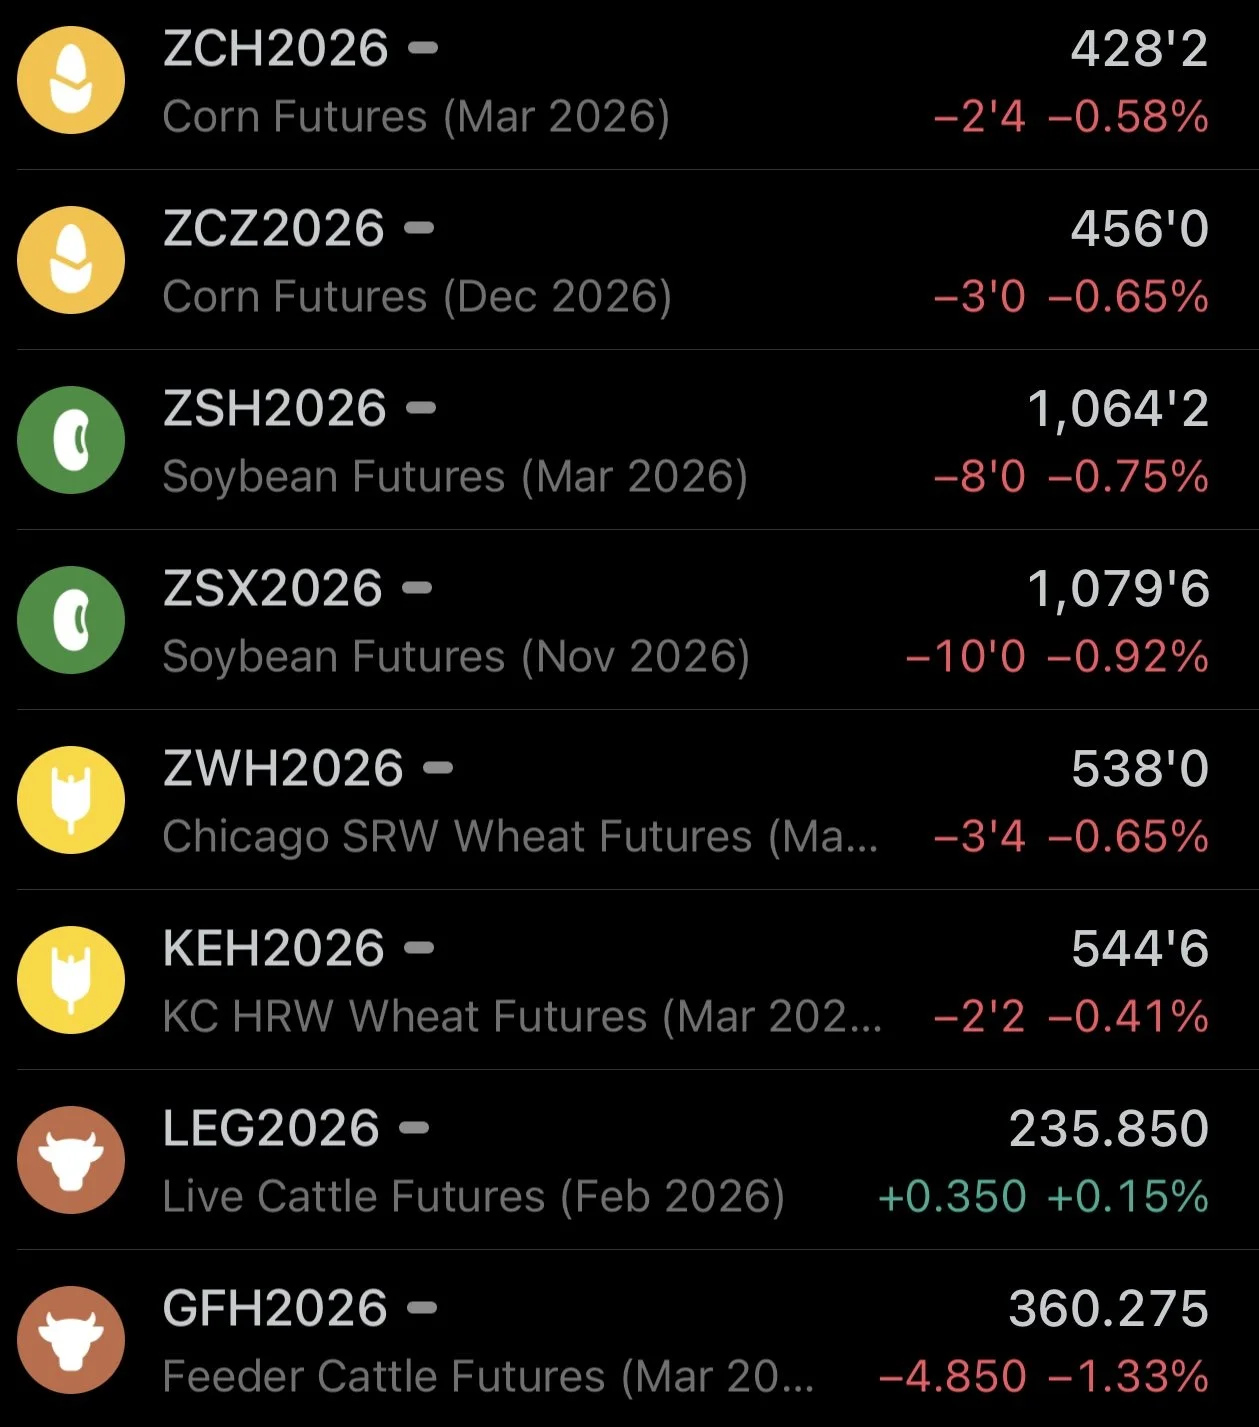
Overview
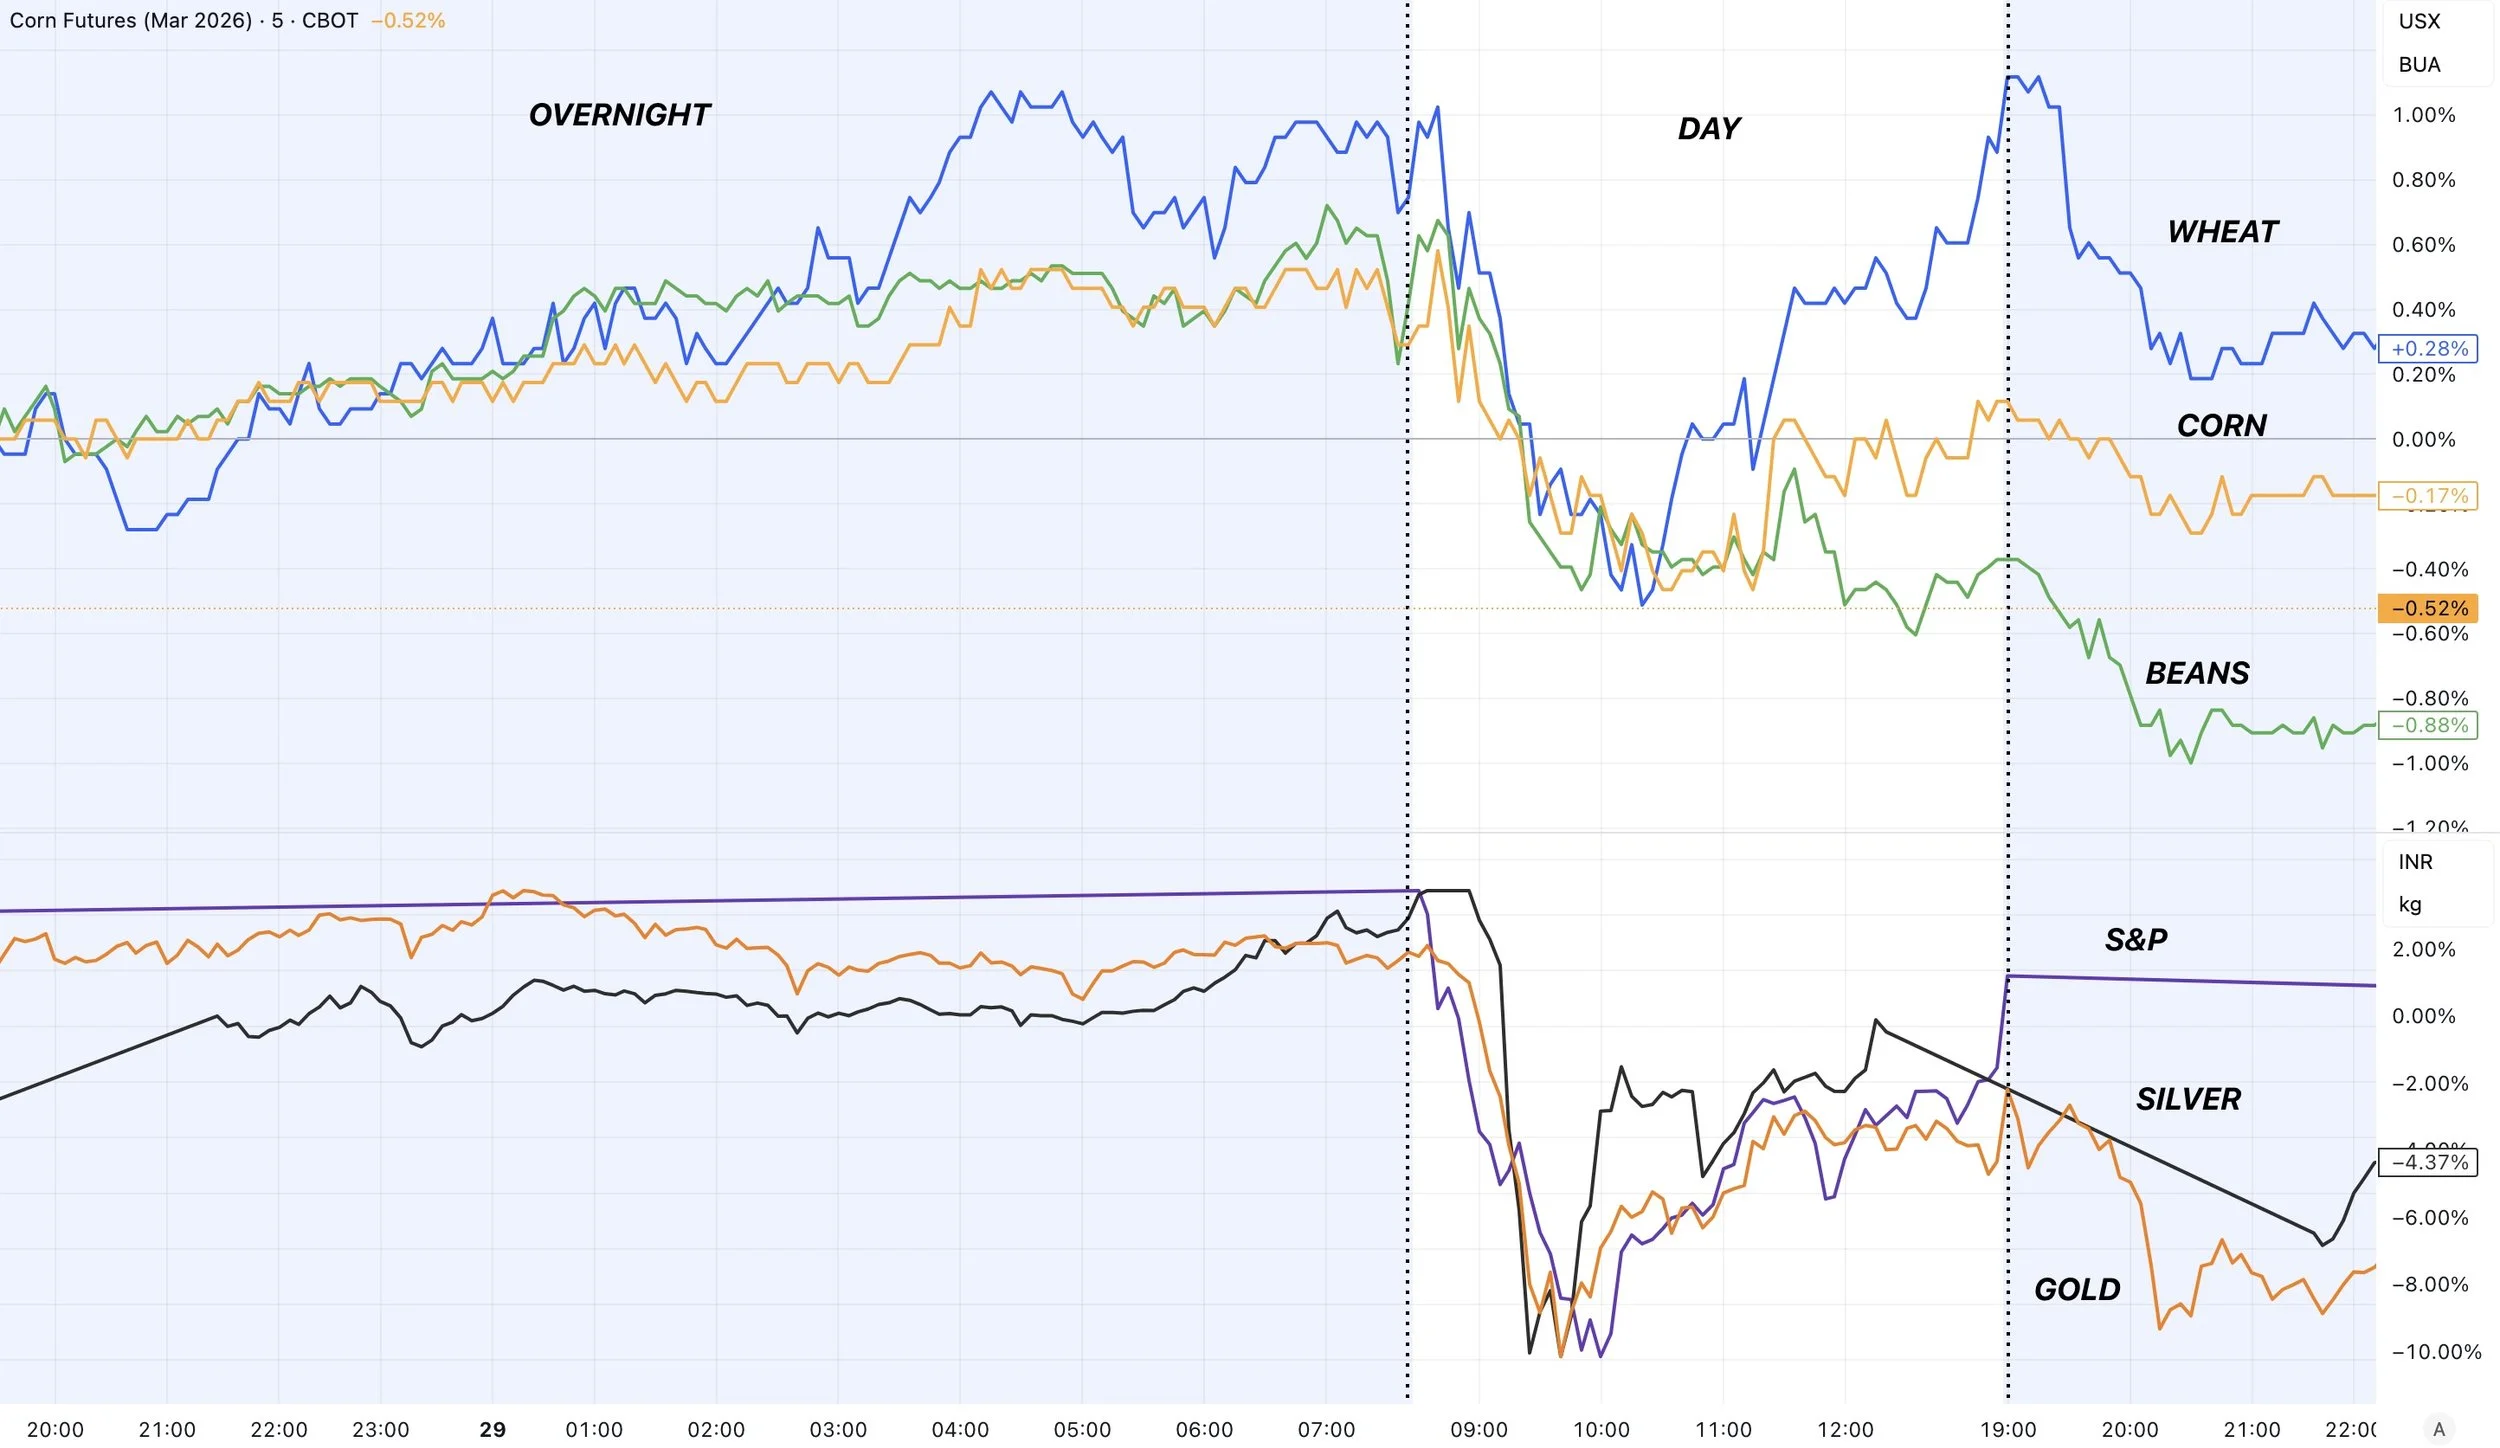
Grains were lower across the board. Cattle was lower. Stocks were lower. Metals got destroyed. The US dollar was strong.
It was simply a risk-off day in absolutely everything and record setting blood bath in the outside markets. Specifically, the metals.
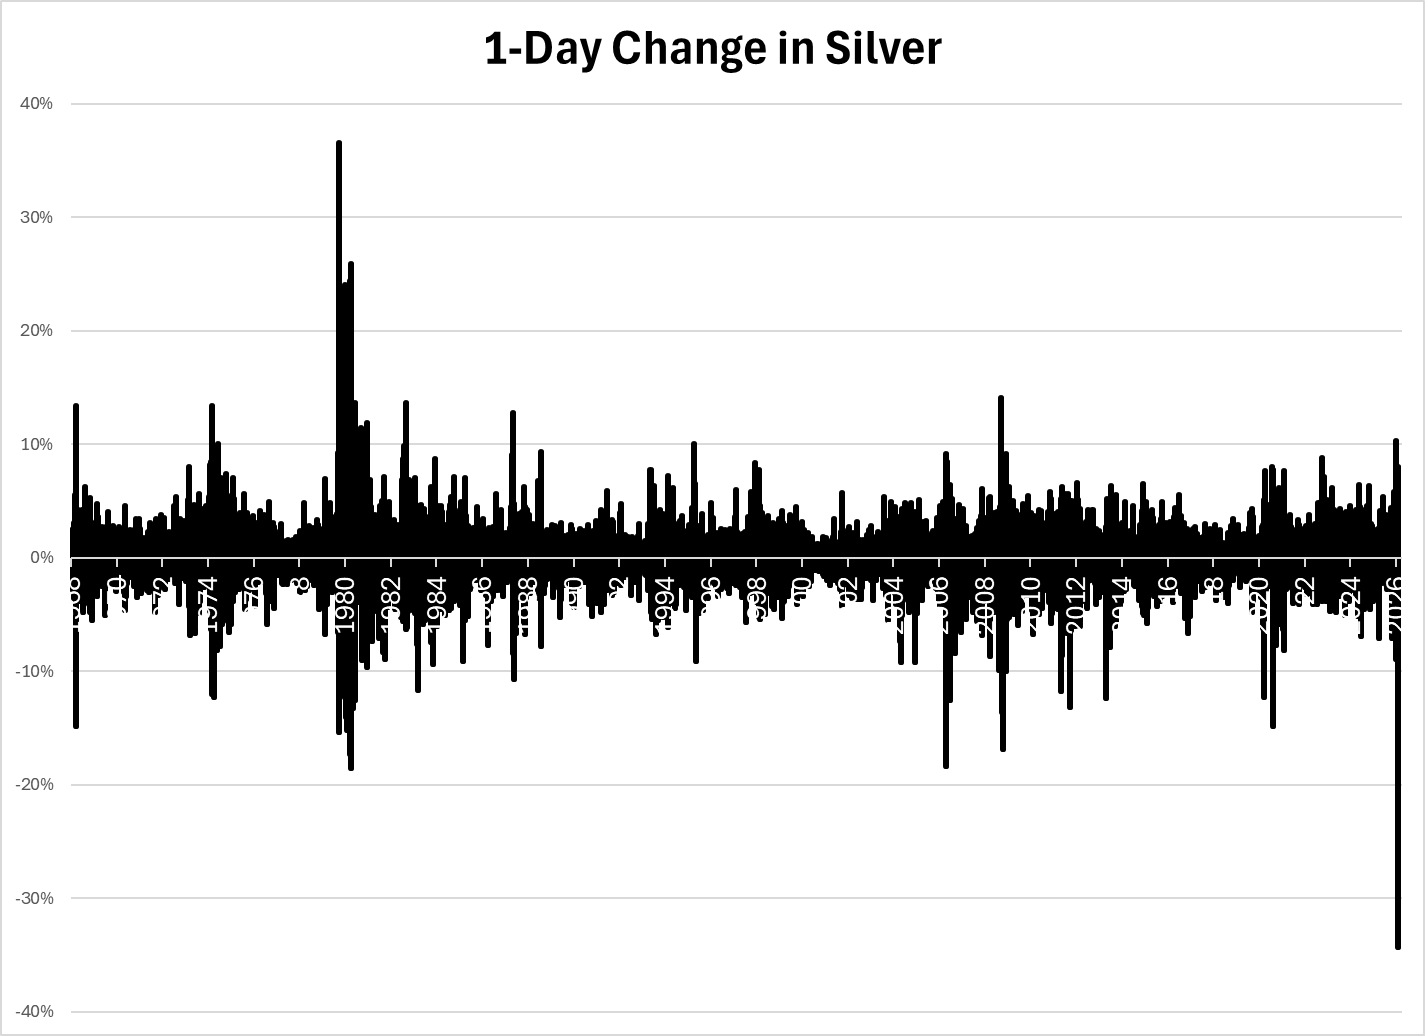
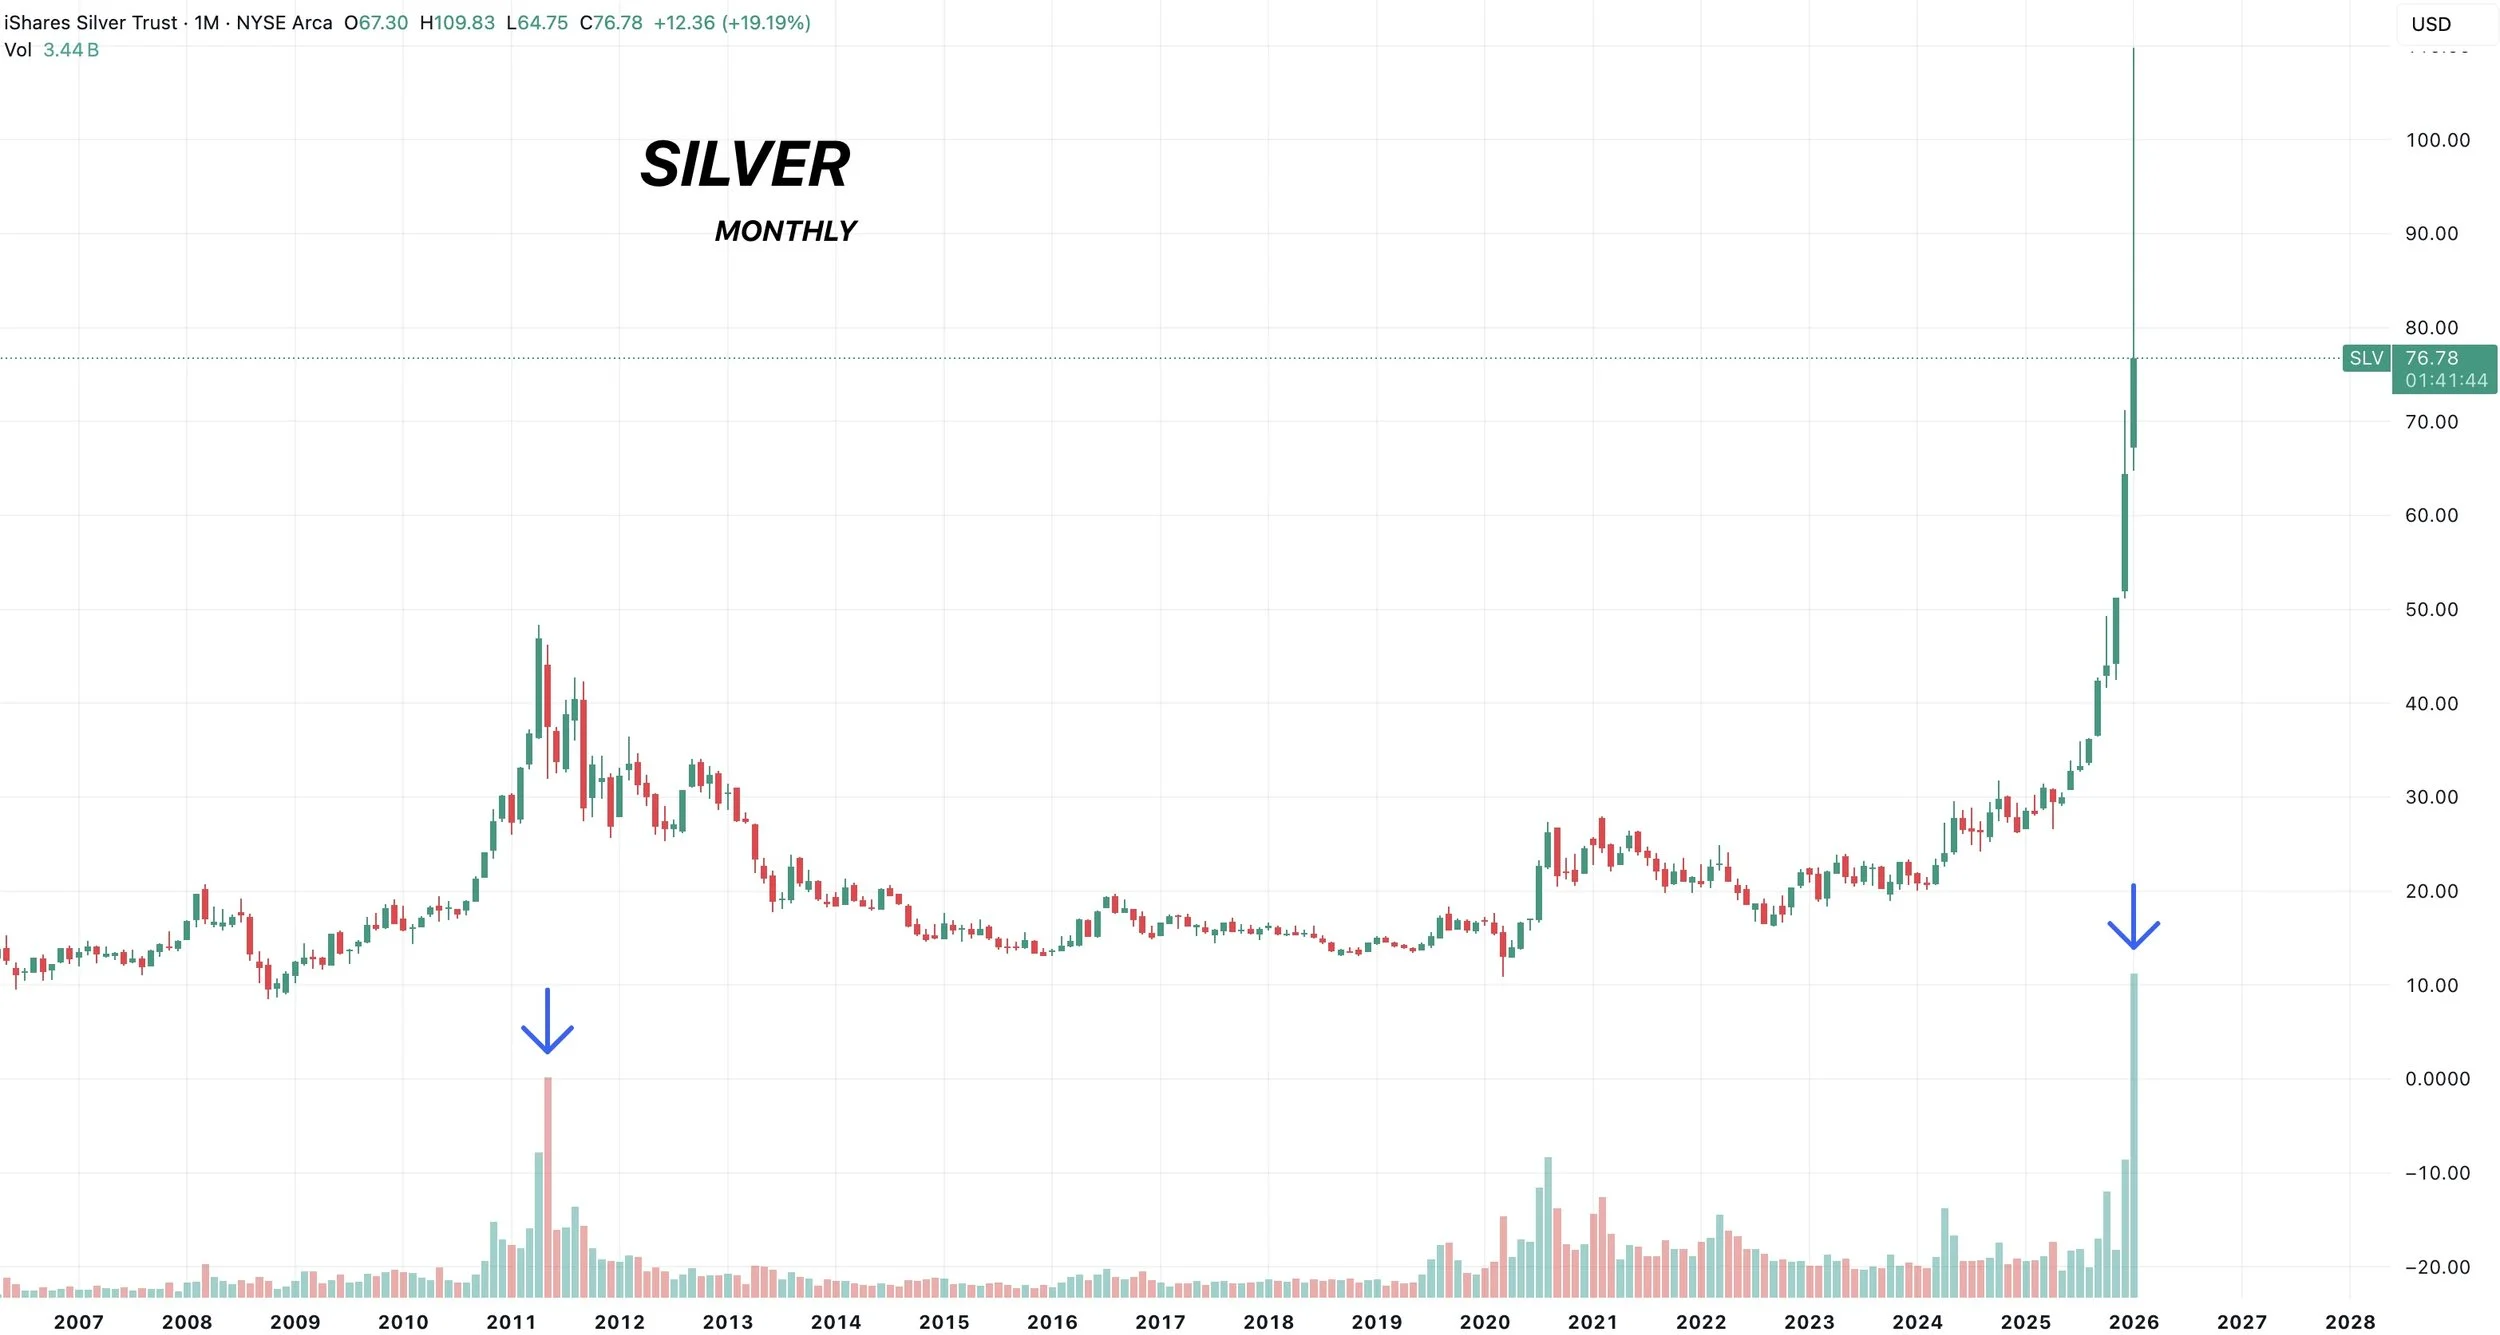
At one point today, silver was down -35%.
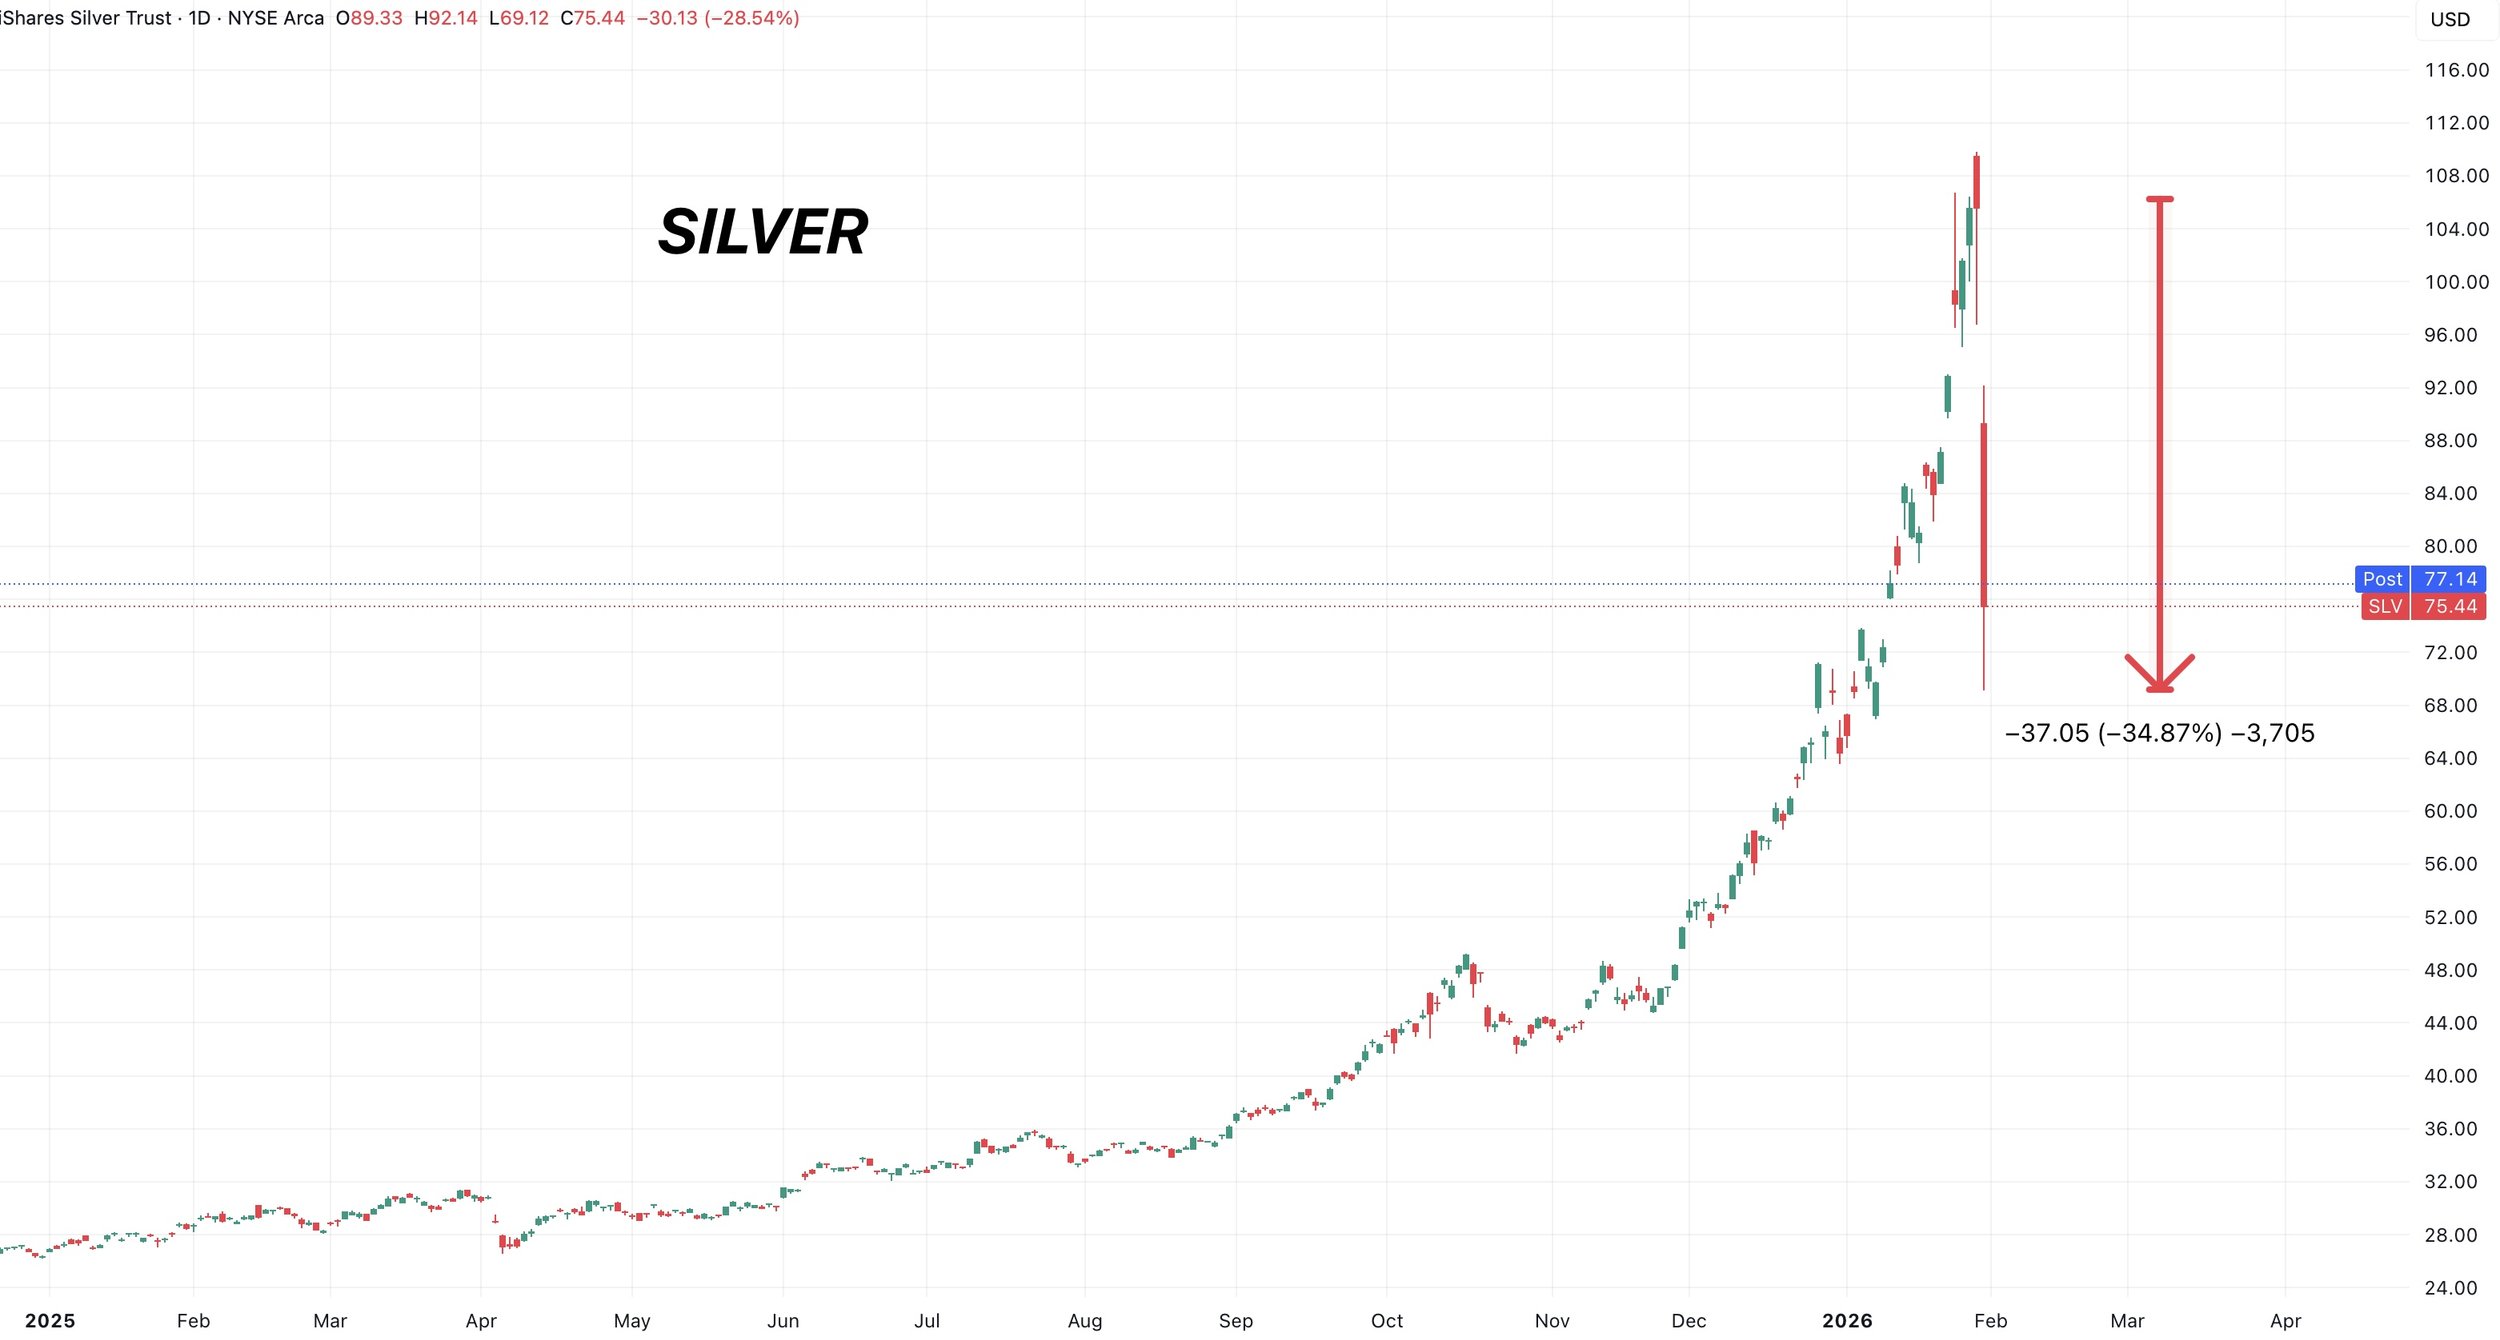
The largest daily drop ever.
Going from $109 yesterday to $69 today.
We have never seen anything like this.
To put the size of this move into perspective. It would be like soybeans dropping -$3.70 or the corn market dropping -$1.50, or feeders dropping over -$100 in a single day.
The drop today erased $2 trillion dollars of market cap. For reference, only 5 companies in the US have a larger market cap than $2 trillion.
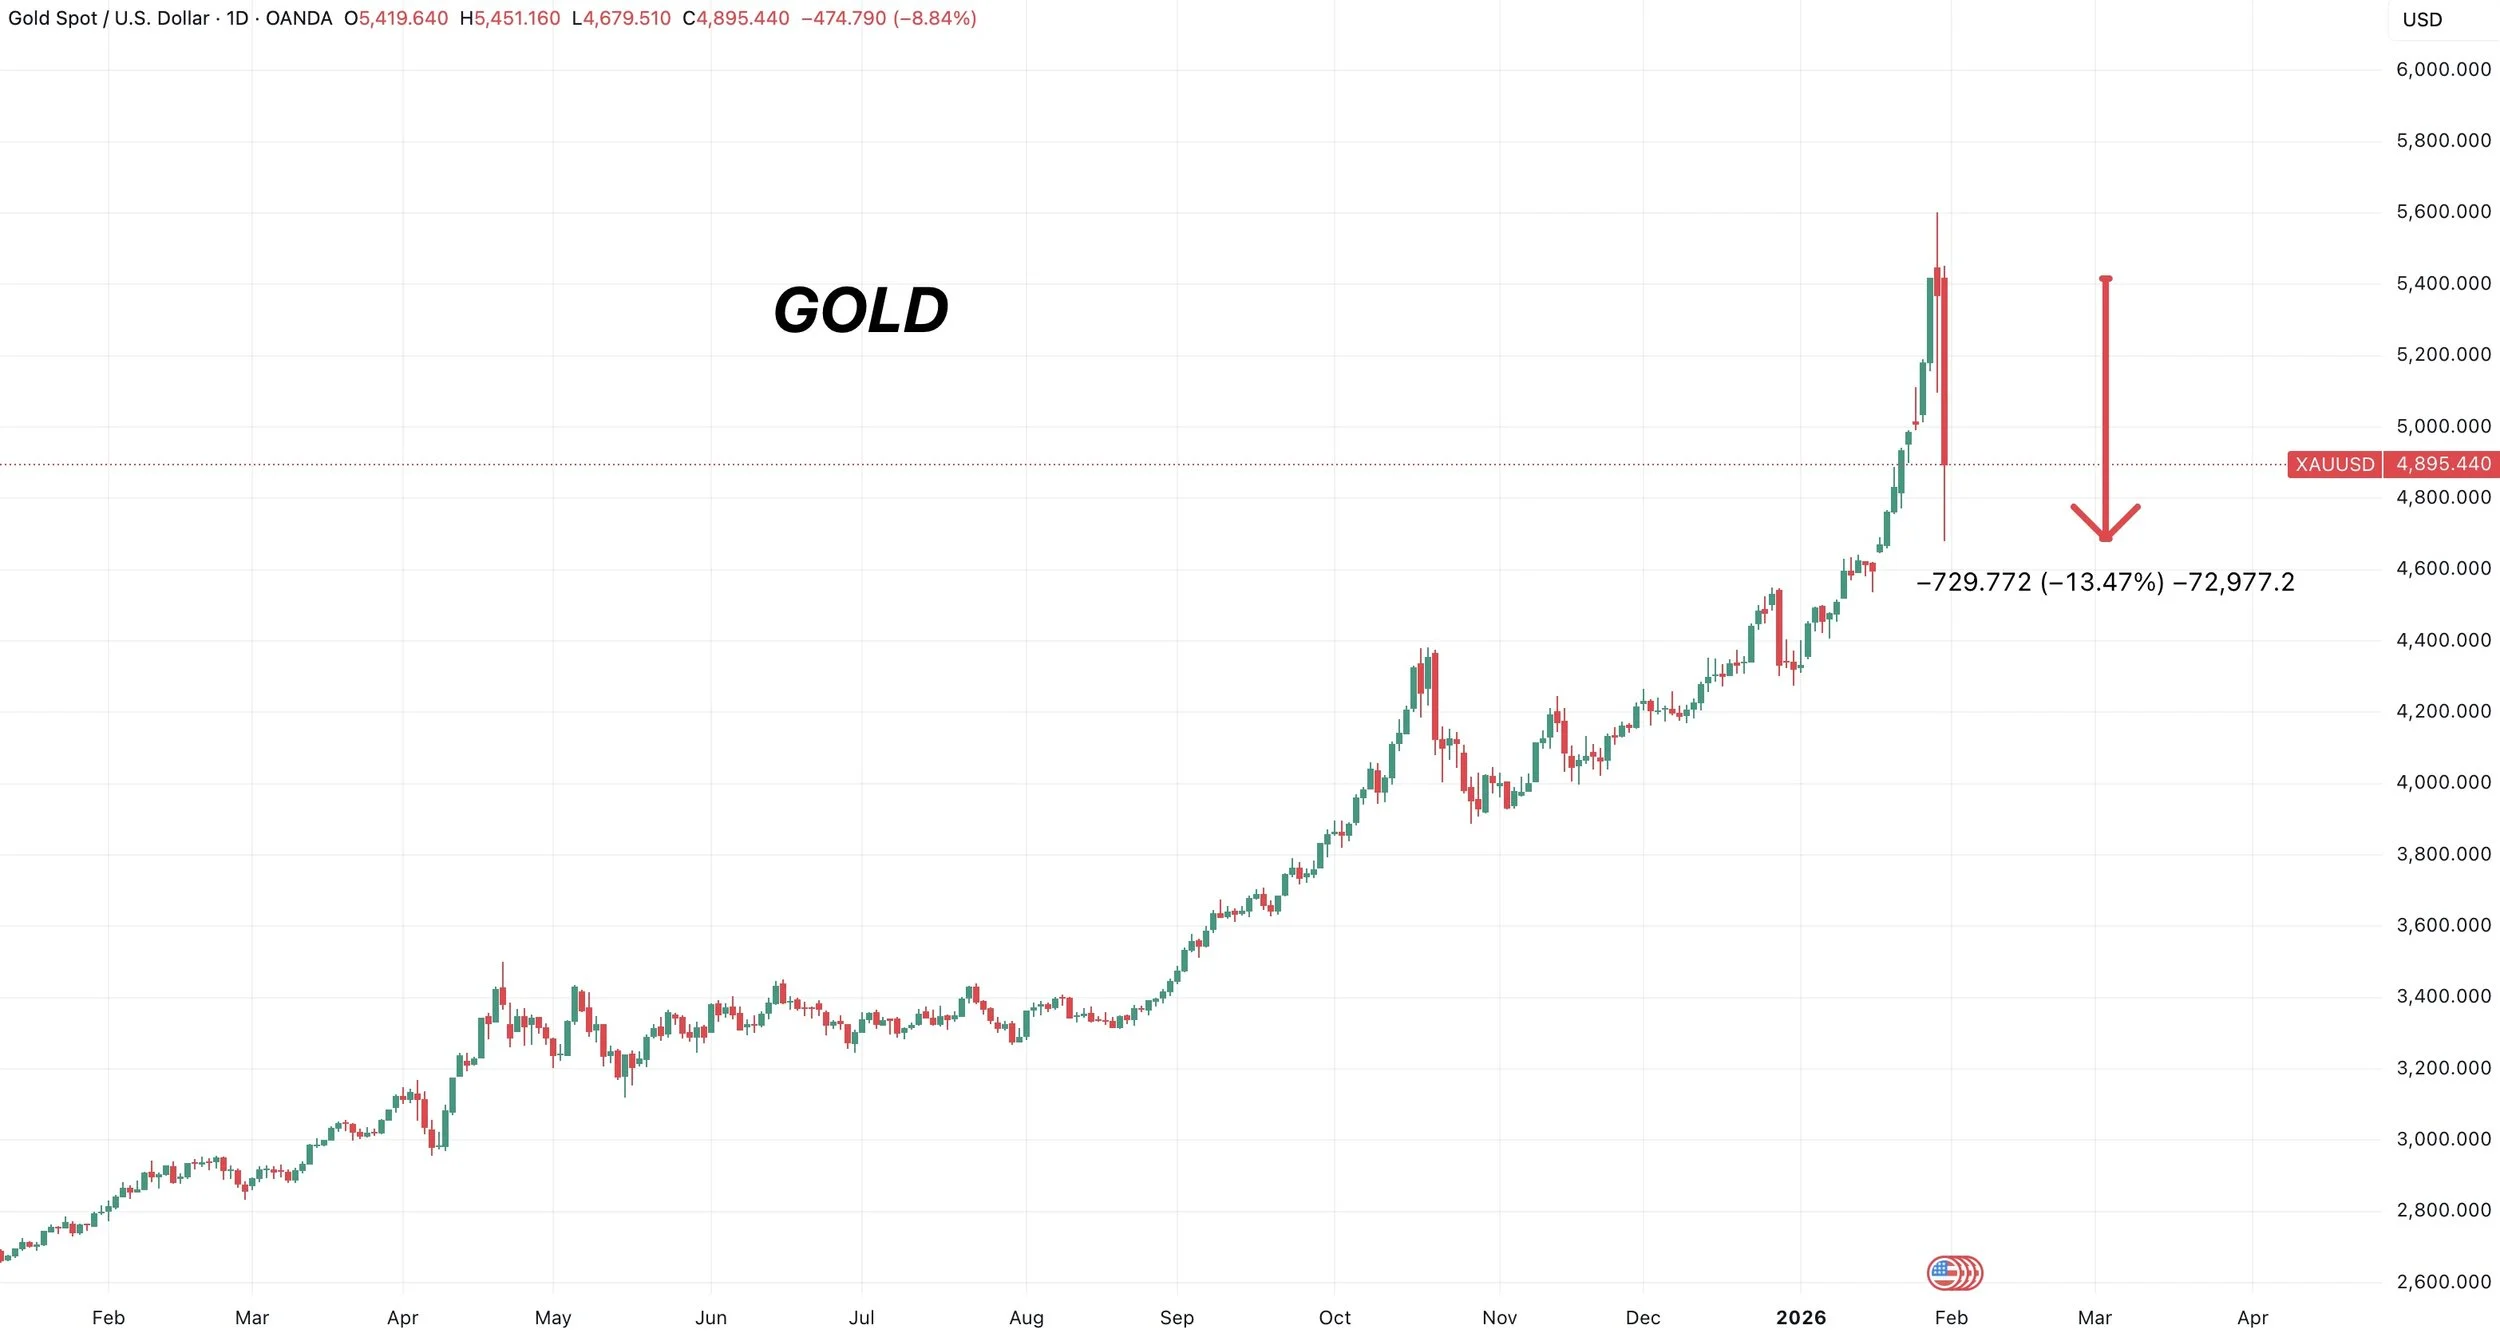
Gold was down -13% at one point today.
The largest single day drop since 1983.
It lost over -$6 trillion worth of market cap.
For reference, the largest company in the world is NVDA with a market cap of less than $5 trillion.
Before we jump into the headlines behind this move.
Let's look at the silver chart quick.
This was something we talked about on Tuesday.
Blow off tops are almost always associated with record volume.
The last time we saw volume like this, marked the top.
The warning signs were there.
Why did this happen?
Aside from metals being incredibly overbought. The biggest reason behind all of this outside market weakness was that Trump announced his new Fed chair pick was Kevin Warsh.
The markets did not like this at all.
Basically, Warsh was viewed as one of the less dovish candidates. Trump stated today that Warsh will cut rates "without any pressure".
But the market is worried about this track record. As in the past, he's warned about strong inflation and has called for shrinking the Fed's balance sheet.
This worries the market that rate cuts might not come as soon as they'd like.

Most of the weakness in the grain markets was likely just risk off attitude spilling across pretty much everything.
Yesterday we saw pretty clear evidence of this.
Grains were higher overnight.
The market opened. Stocks tanked, outside markets tanked, the grains followed suite.
So it really just feels like grains were caught in the cross fire of the outside markets and overall risk off trade across everything.
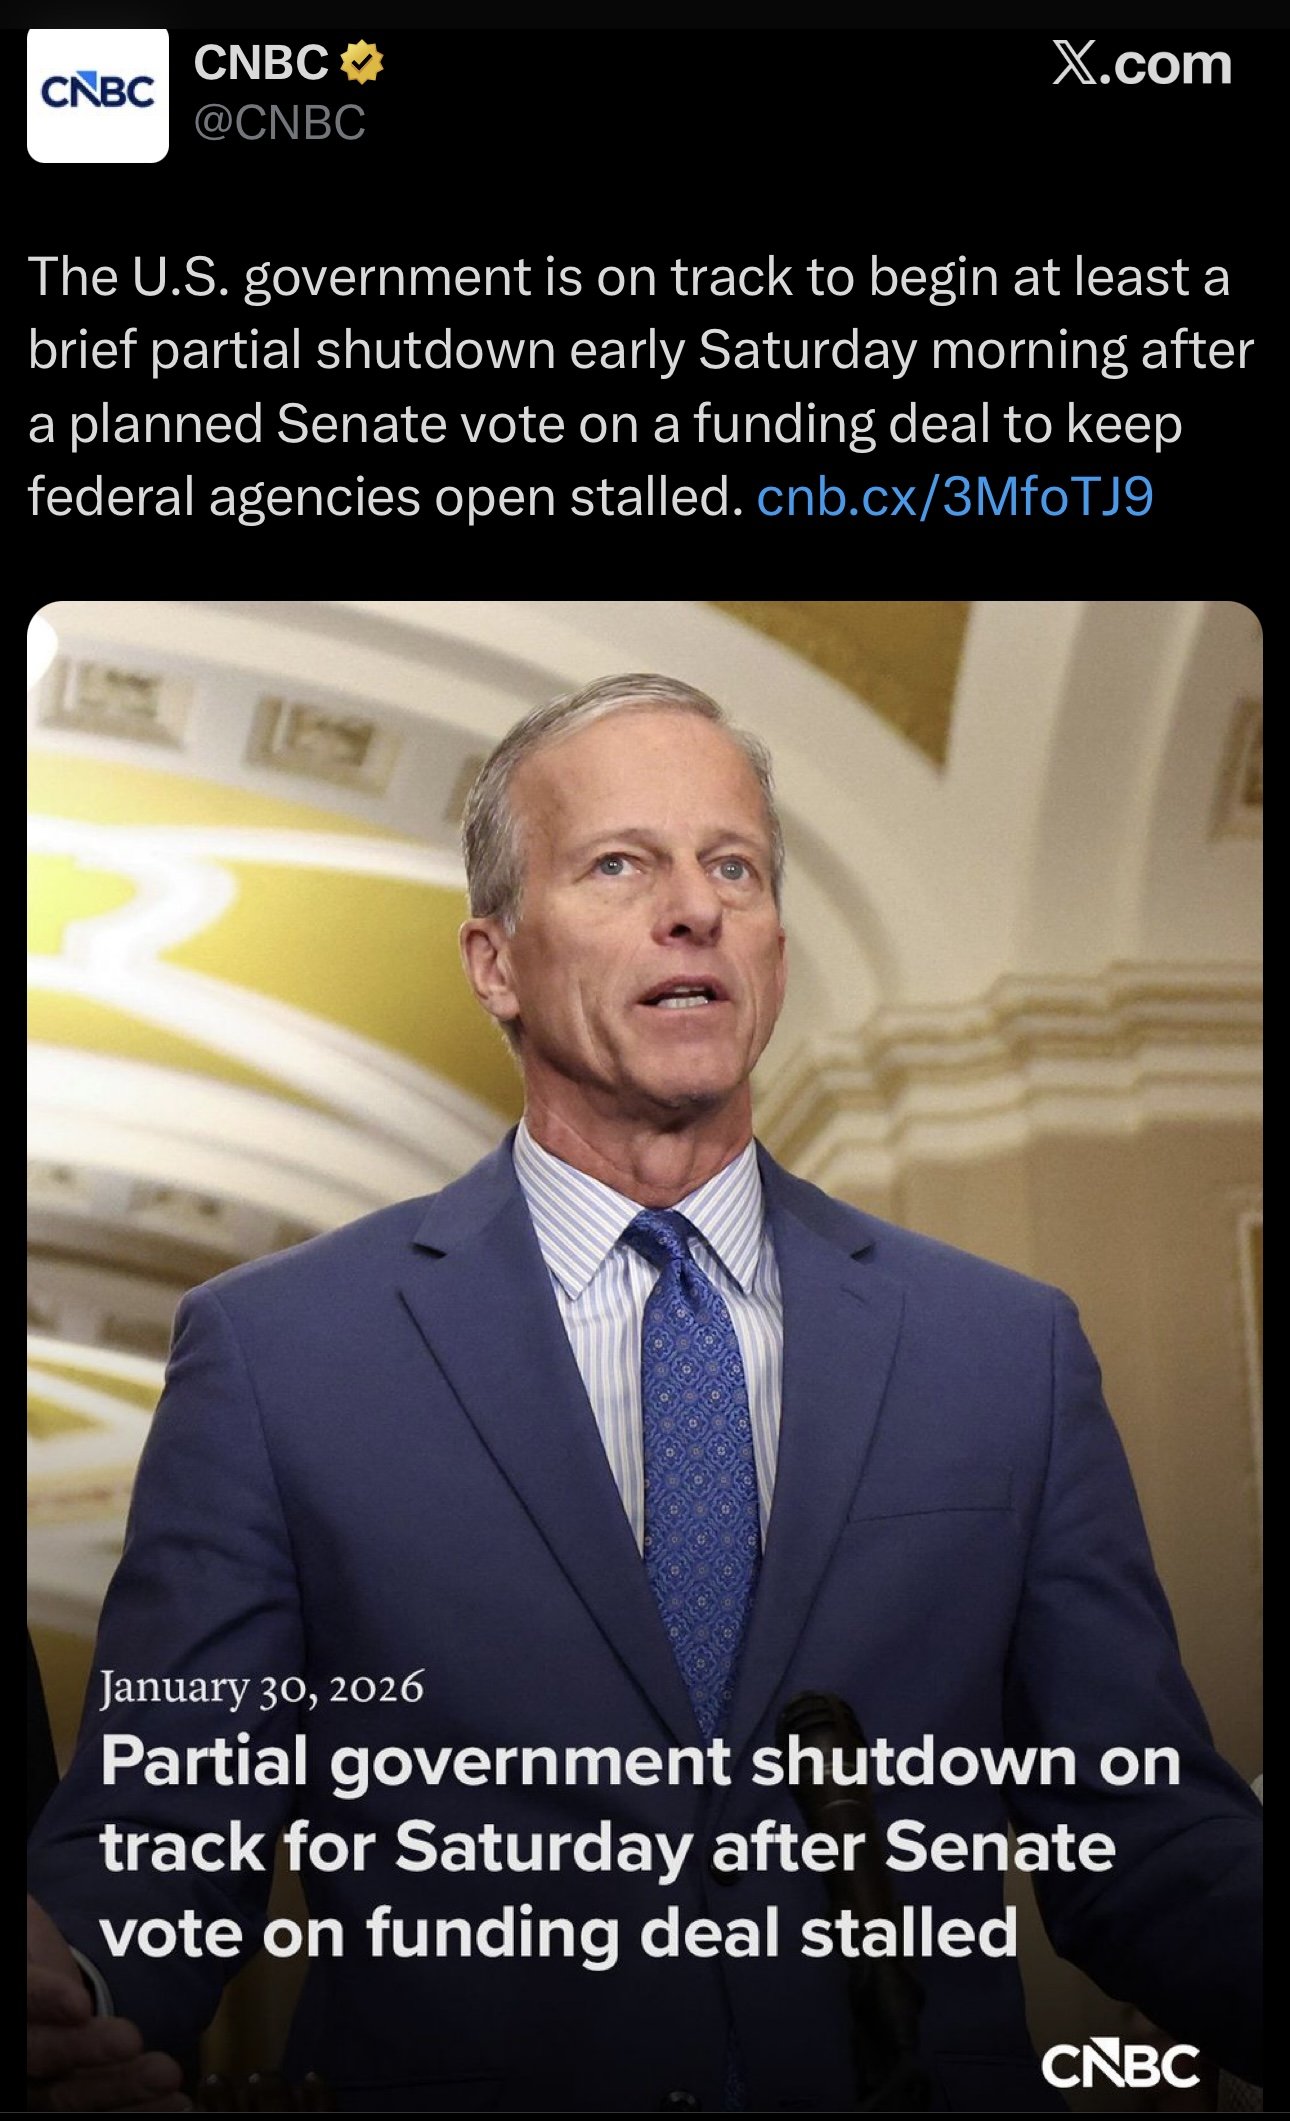
Gov Shutdown?
The Senate approved the spending package to keep the government open.
However, the House is gone for the weekend. The bill needs to be voted on by the House Monday.
So we will probably still see a partial shutdown over the weekend. This added even more tension to the outside markets.
But the USDA was able to get funding for the rest of the year. So it shouldn’t impact the USDA if it shuts down.
Aside from the outside markets falling apart, the actual news surrounding the grain markets was relatively quiet today
Today's Main Takeaways
Corn
Fundamentals:
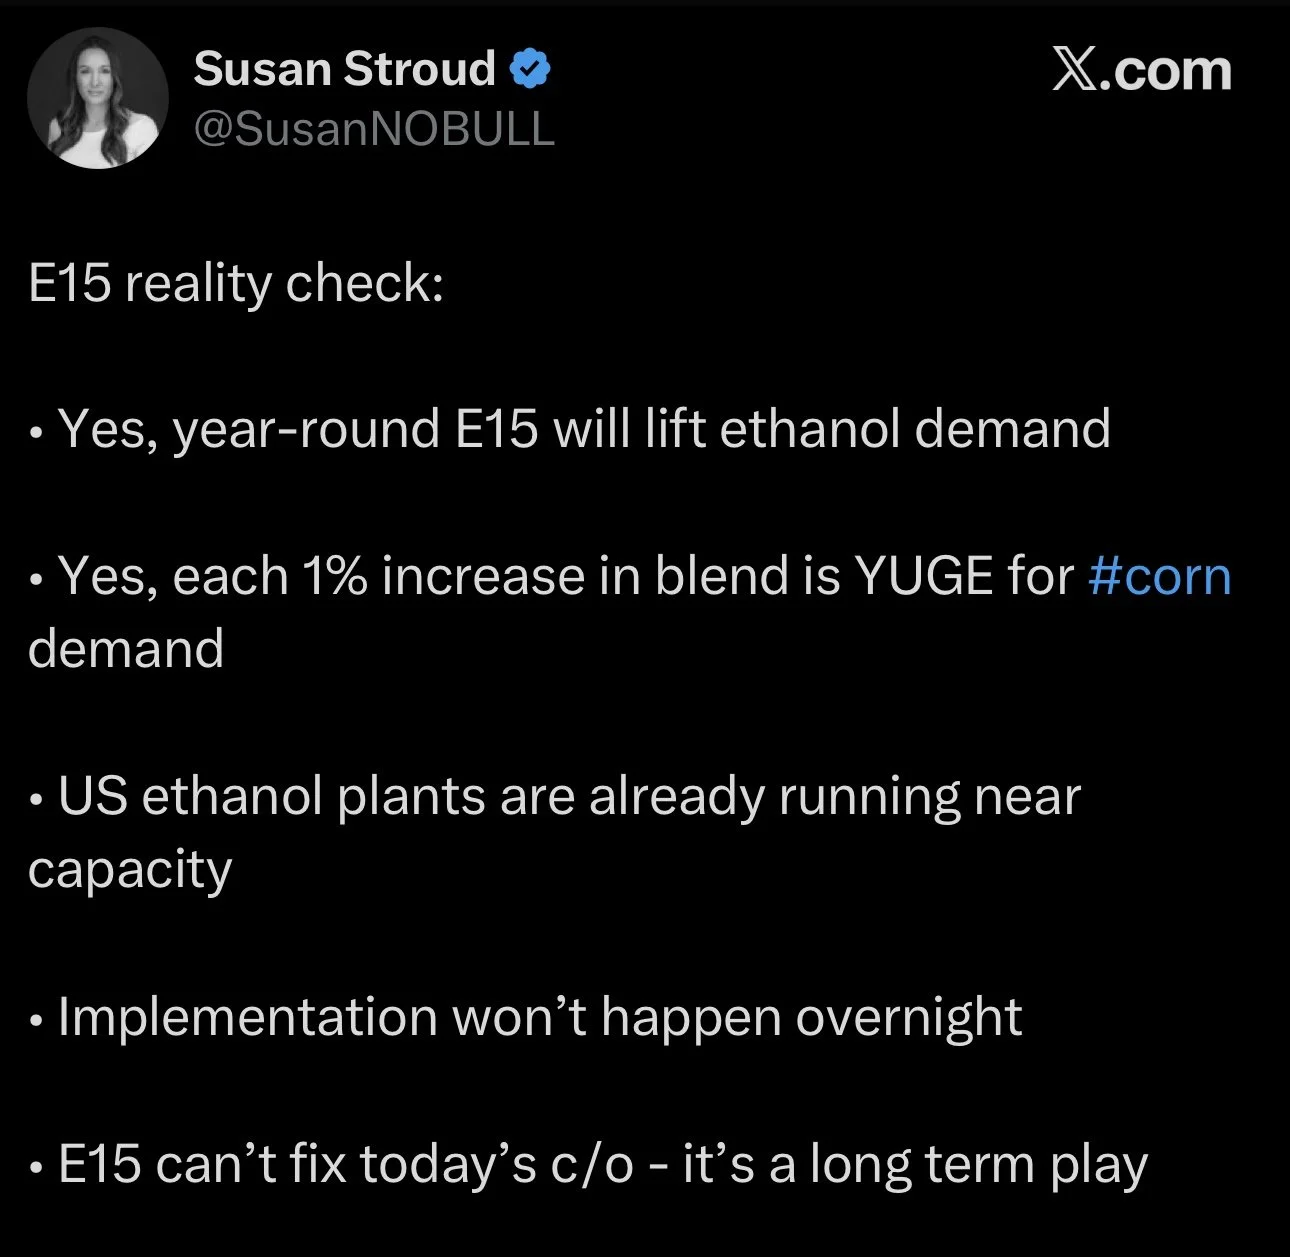
E15 - Big deal or not?
Short term, no.
Long term, yes.
We still do not have a mandate or federal law. Despite Trump saying he supports it.
But even if we did get the mandate, it is not going to be some factor that is going to immediately create all of this extra demand right away.
Here is a tweet from Susan of NoBull Ag that pretty much sums it up.
It's great, but it's a long term factor.
Demand remains phenomenal.
This should continue to pervent corn from completely falling apart.
However, we can’t ignore the size of the crop we have.
Which is going to limit our upside potential.
The recent USDA report was bearish. No doubt. The corn situation isn’t bullish.
But at the same time, this report was about last year's crop. We've been pricing in a record crop since August.
So moving forward, there are plenty of risks ahead to this year's crop. Which the market will soon start to focus on.
Which is why the market usually provides an opportunity in the spring or summer. Despite that not being the case the last two years.
We talked about this on Tuesday.
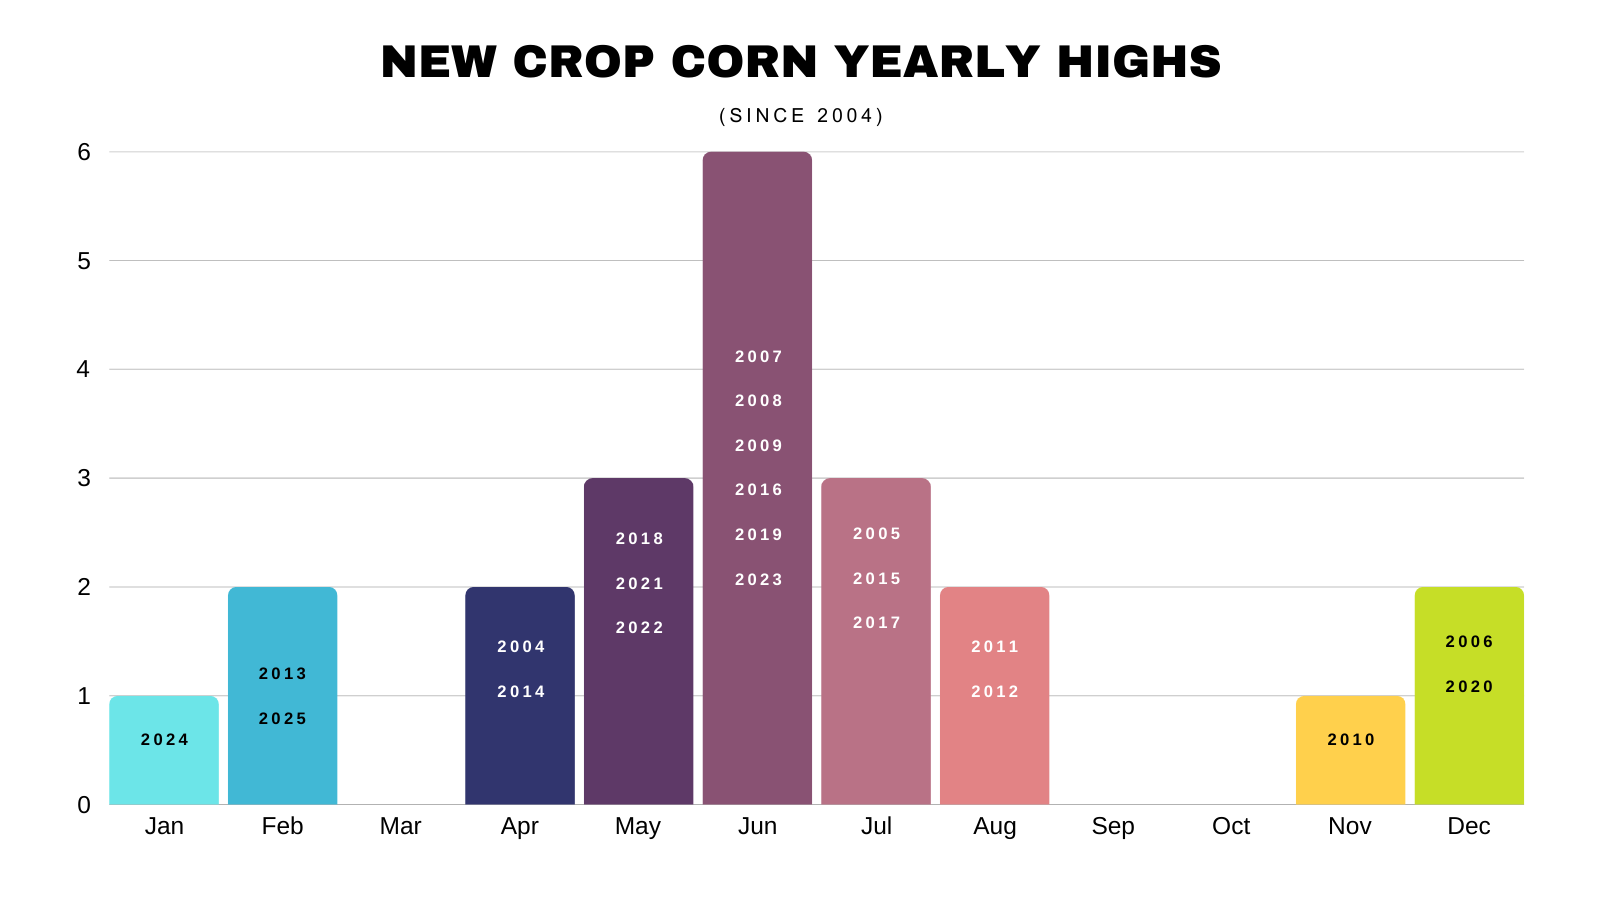
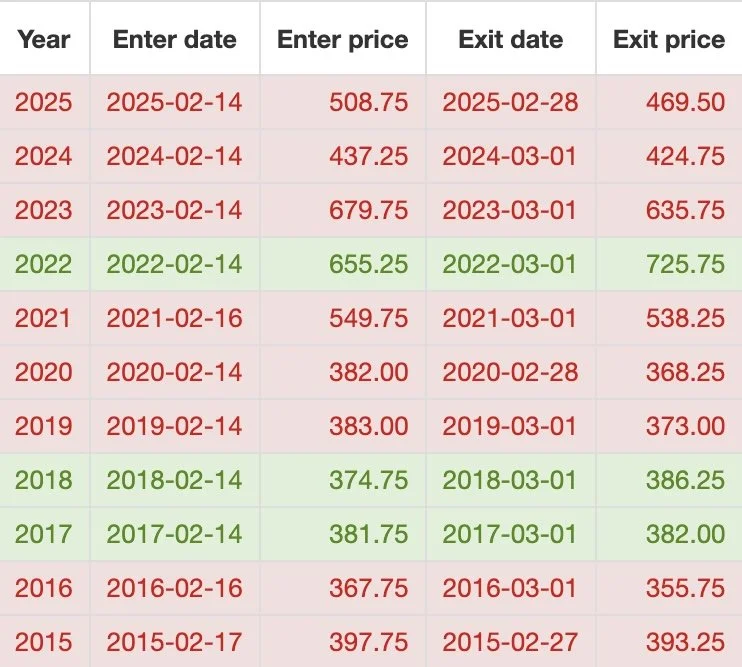
But in the short term, one of the bigger concerns has to be first notice day.
Corn has traded lower from Feb 14th to Feb 28th the last 8 of 11 years.
(The 2 weeks going into first notice day).
Something to be aware of.
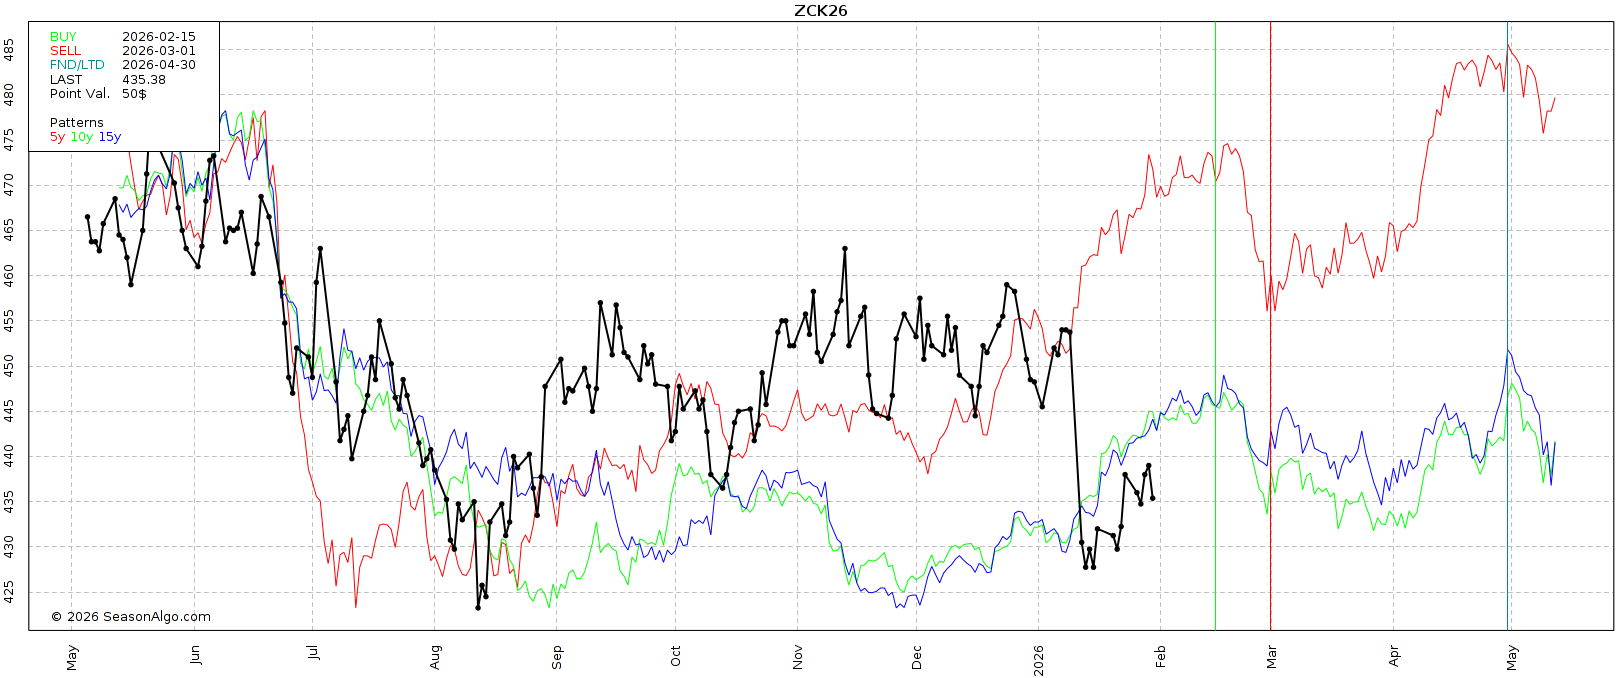
Here is the seasonal pattern.
Again, we tend to be weak heading into the end of February before finding strength heading into spring.
Green Line = Feb 14th
Red Line = Feb 28th
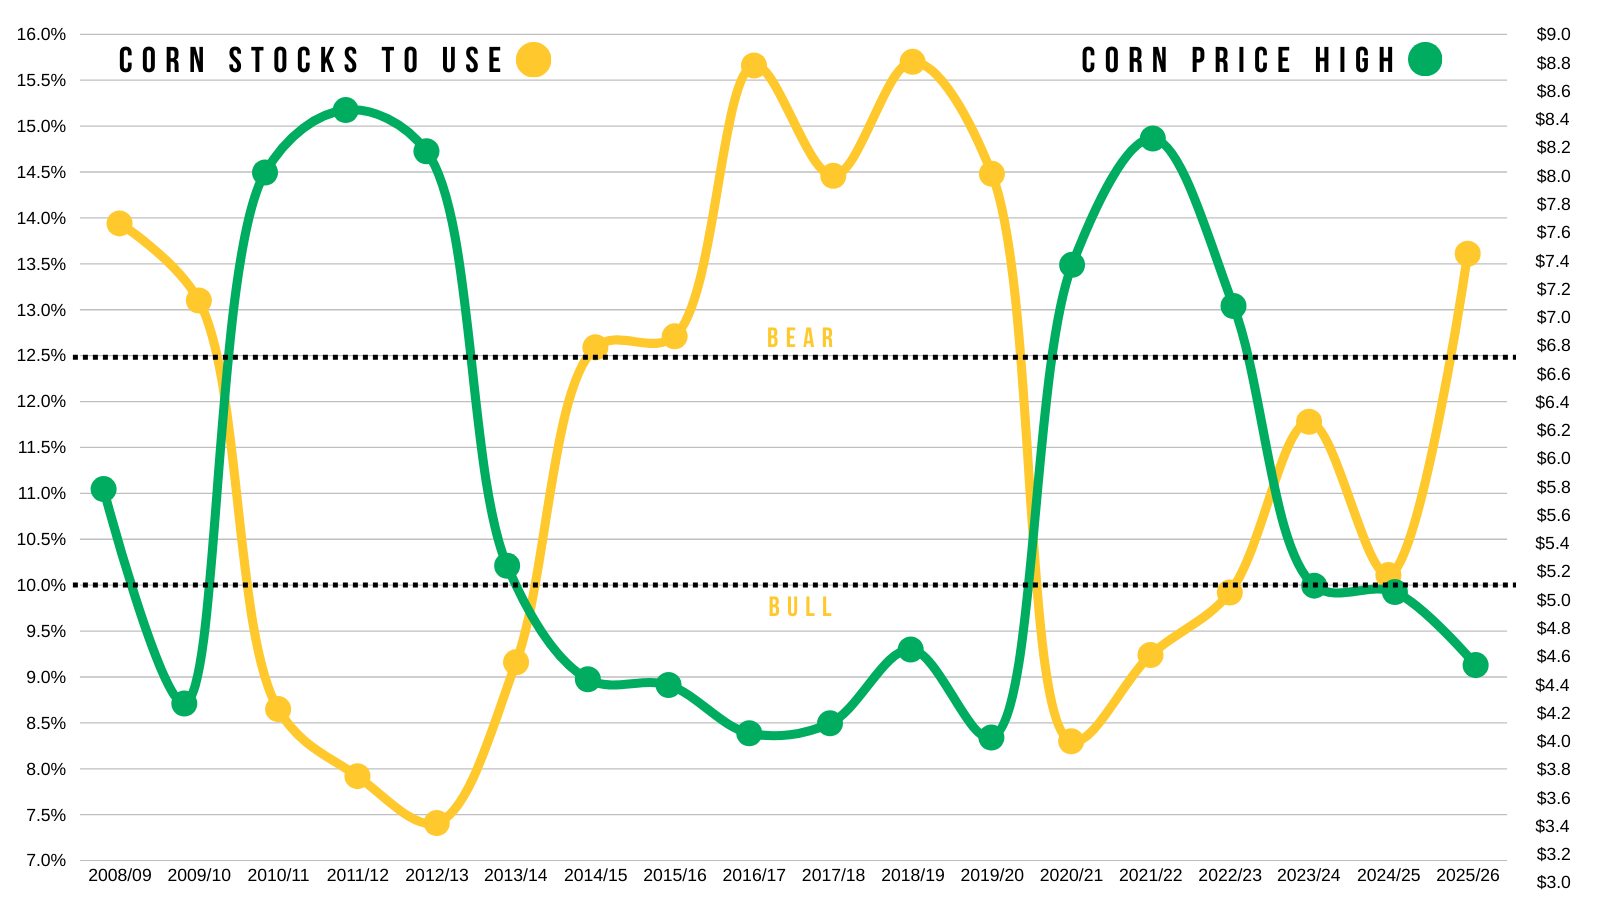
Bottom line, the story isn’t bullish like we've talked about for a long time.
Our stocks to use is on par with other bear market years. So our upside is going to be limited unless something changes.
Despite this, demand is as great as it's ever been. Which should prevent us from getting too cheap.
There really isn’t a ton to update on corn that we haven’t covered in the past.
The corn market still lacks a catalyst to push us higher or lower.
The next big set of data is going to the planting intentions.
So I'm still expecting some range bound trade for the time being. As the fundamentals don’t scream tremendously higher or lower from here.
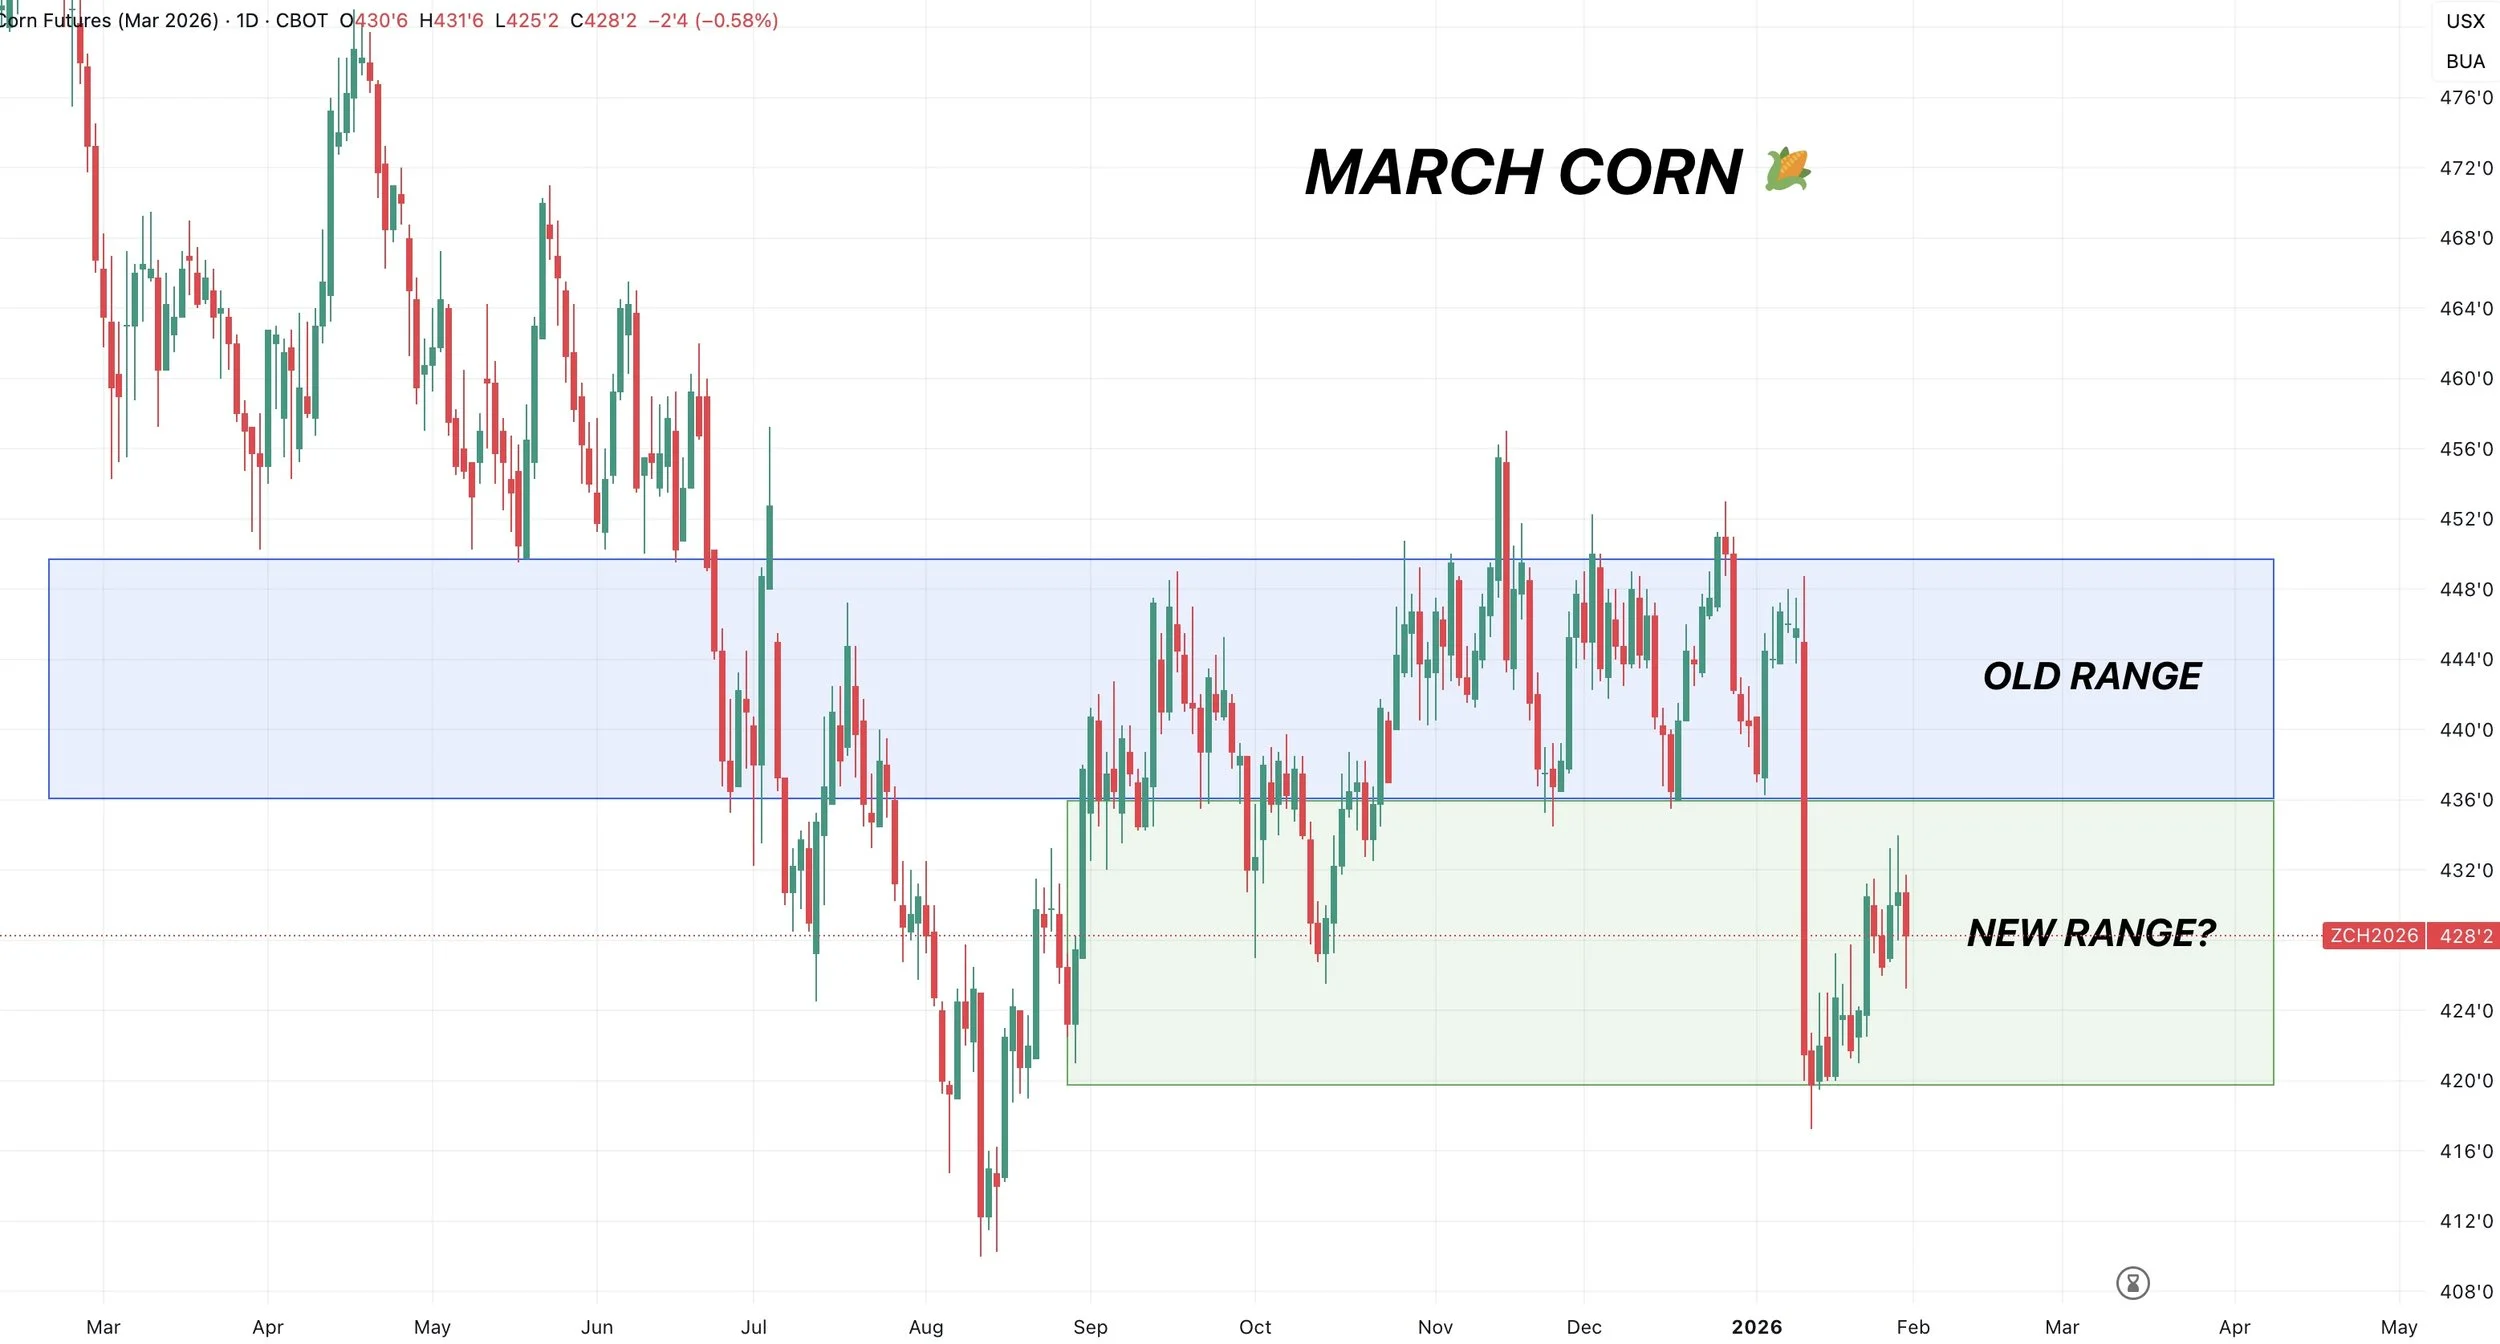
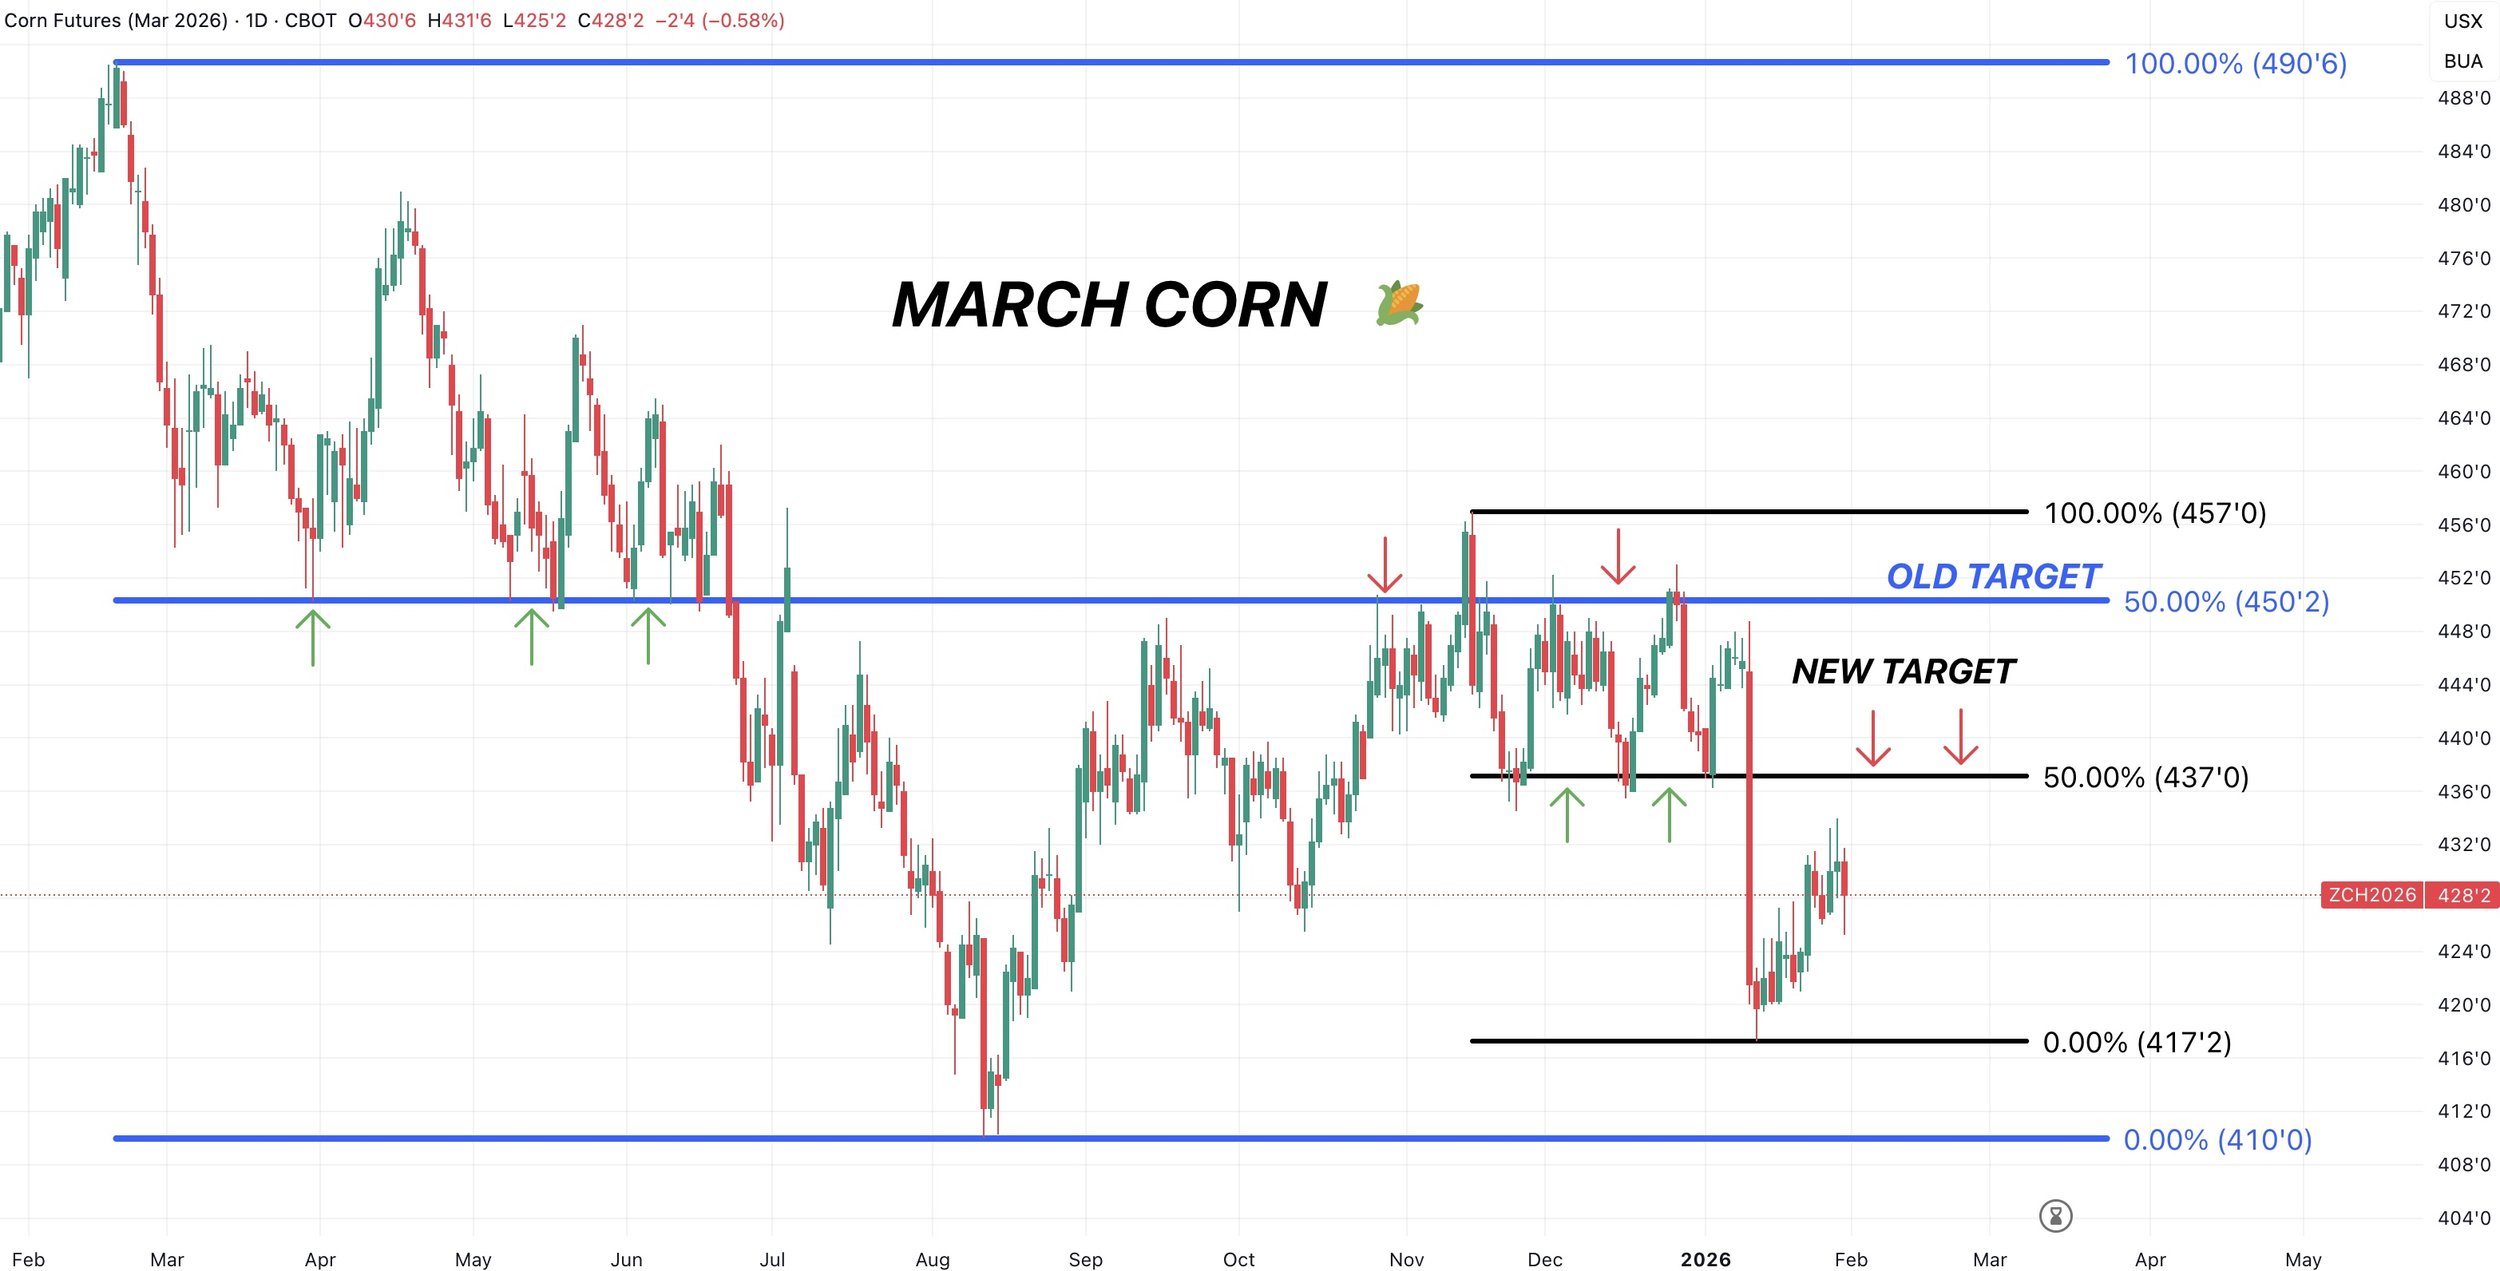
March Corn
Technicals:
Nothing to update here.
Still looking to reward $4.36 to $4.37 for a variety of reasons we've discussed.
I went over the reasoning further in Tuesday's video:
Link to Tuesday's Video
Soybeans
Fundamentals:
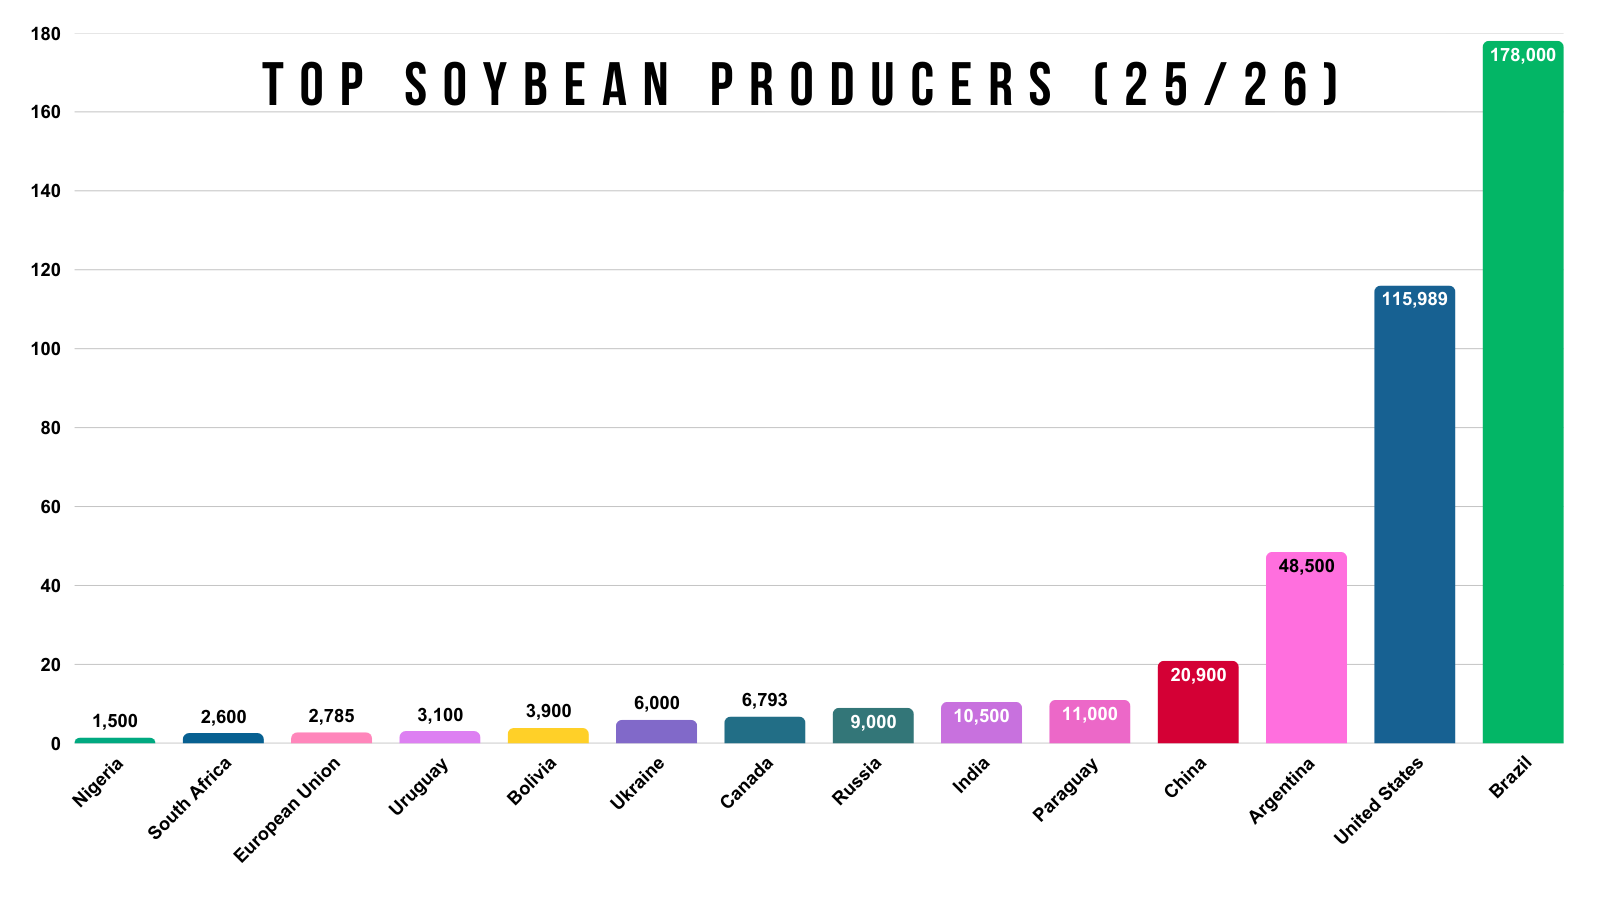
Despite the recent weakness largely being driven by the outside markets in my opinion, soybeans are also dealing with a record crop out of Brazil.
Argy has been dealing with some pretty dry weather which is supportive. As Argentina's G/E ratings have dropped -20% since the start.
Chart from Mike Castle of StoneX
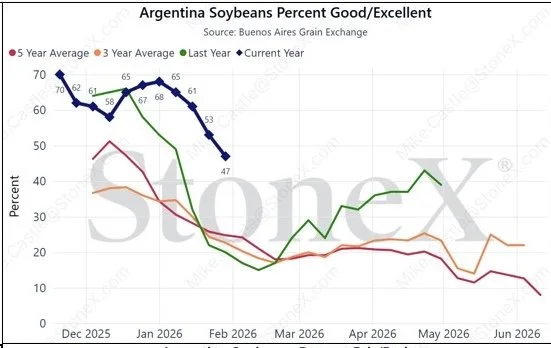
But you have to keep in mind that Brazil's crop is 3 times the size of Argentina's.
The market is well aware of the big crop. However we are still going to have to deal with the physical pressure of the crop and it's going to be a hurdle.
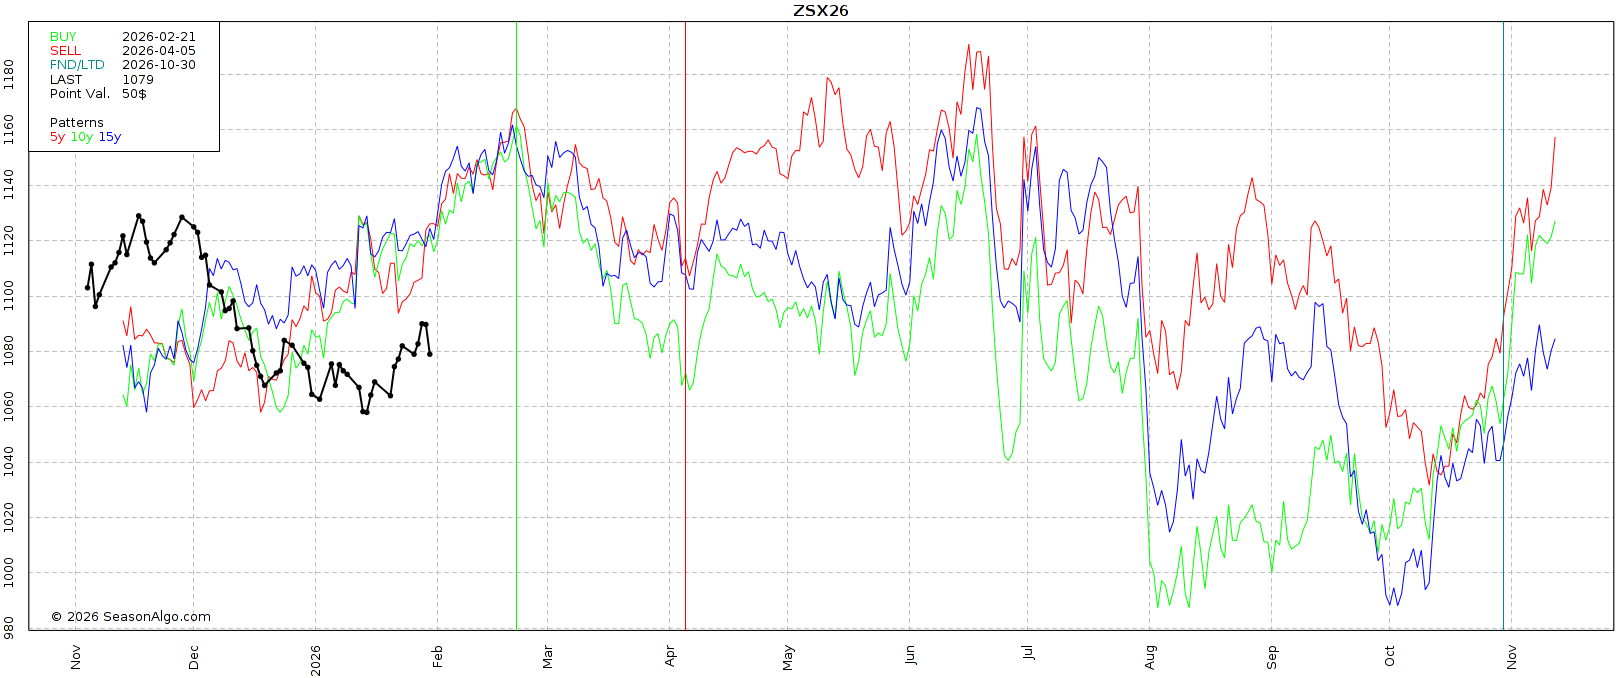
If you look at the seasonal pattern, it gives you a good idea of the window of Brazil's harvest and it's usual impact on prices.
Soybeans actually tend to be strong during the month of February.
However, as Brazil's harvest pressure starts to kick in we tend to see pressure from around Feb 21st until early April.
Similar to how the markets stabilize after the US harvest. The soybean market tends to find a secondary bottom after Brazil's harvest pressure is out of the way.
Nov Seasonal
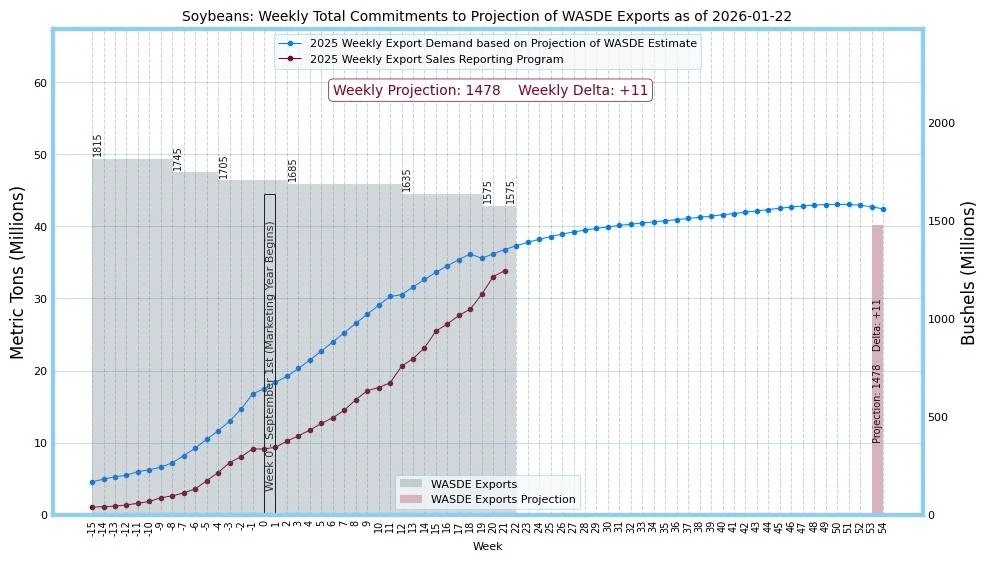
Everyone is concerned about export demand.
Exports recently have actually been great.
Export sales are now essentially right on pace with the USDA's estimates after being extremely behind not too long ago.
So the argument that the USDA is going to have to drop export demand further is becoming less likely.
Chart from Robert McClure
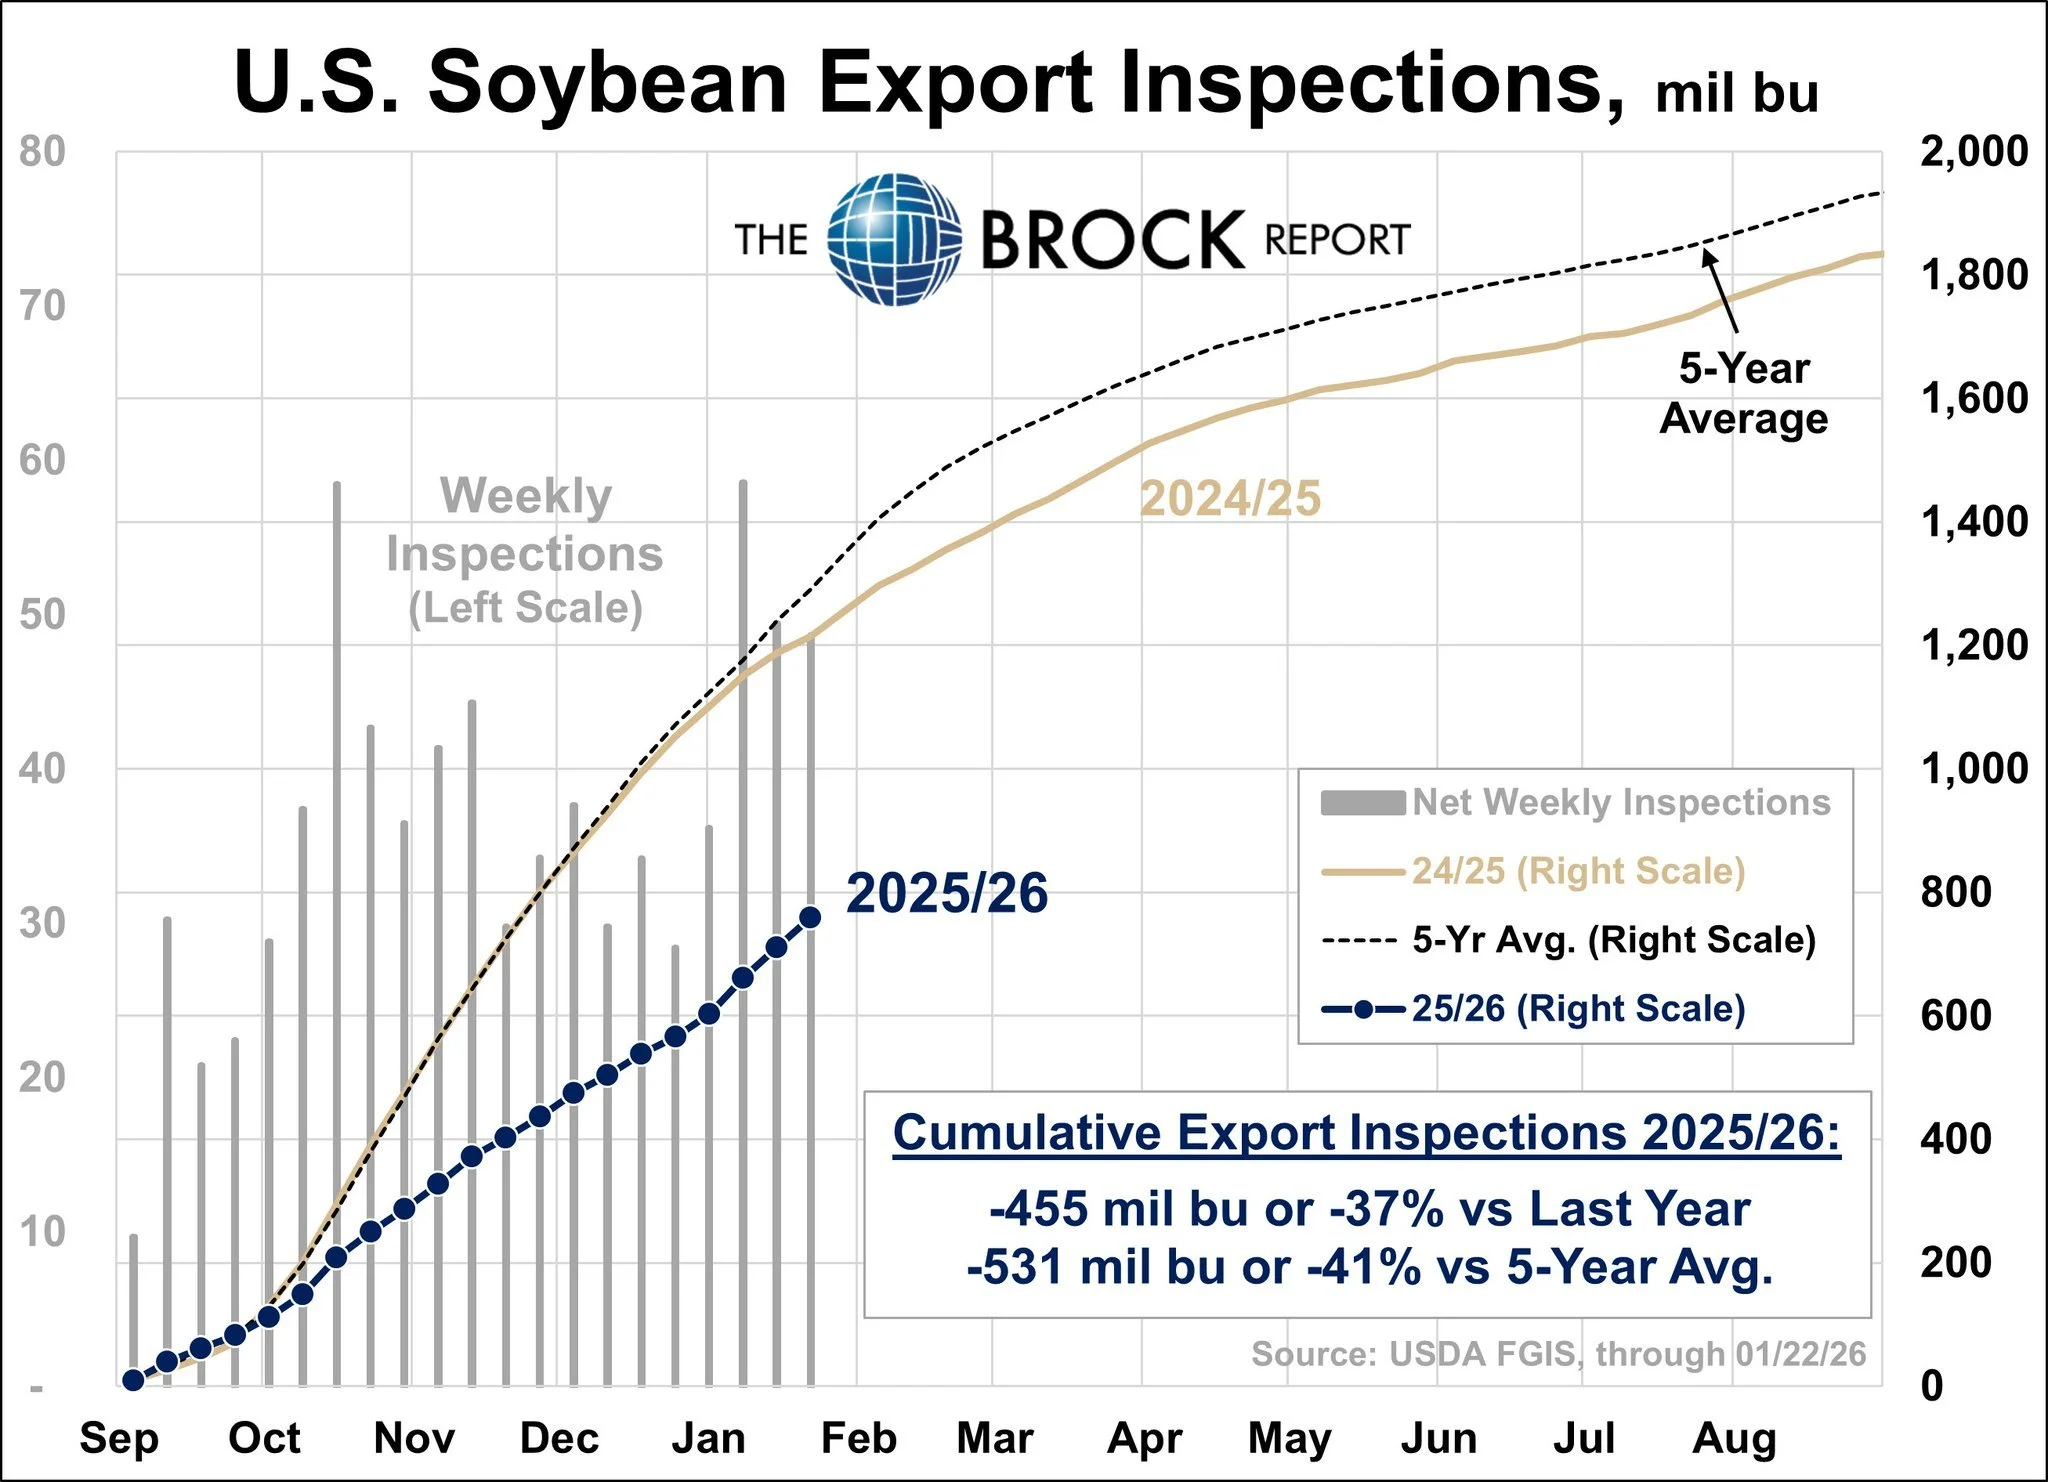
However, export inspections (soybeans shipped) do still severely lag behind.
So our commitments are on track, but we have a record amount of unshipped soybeans.
This opens the fear to cancellations down the road.
Chart from Dave Brock of Brock Report
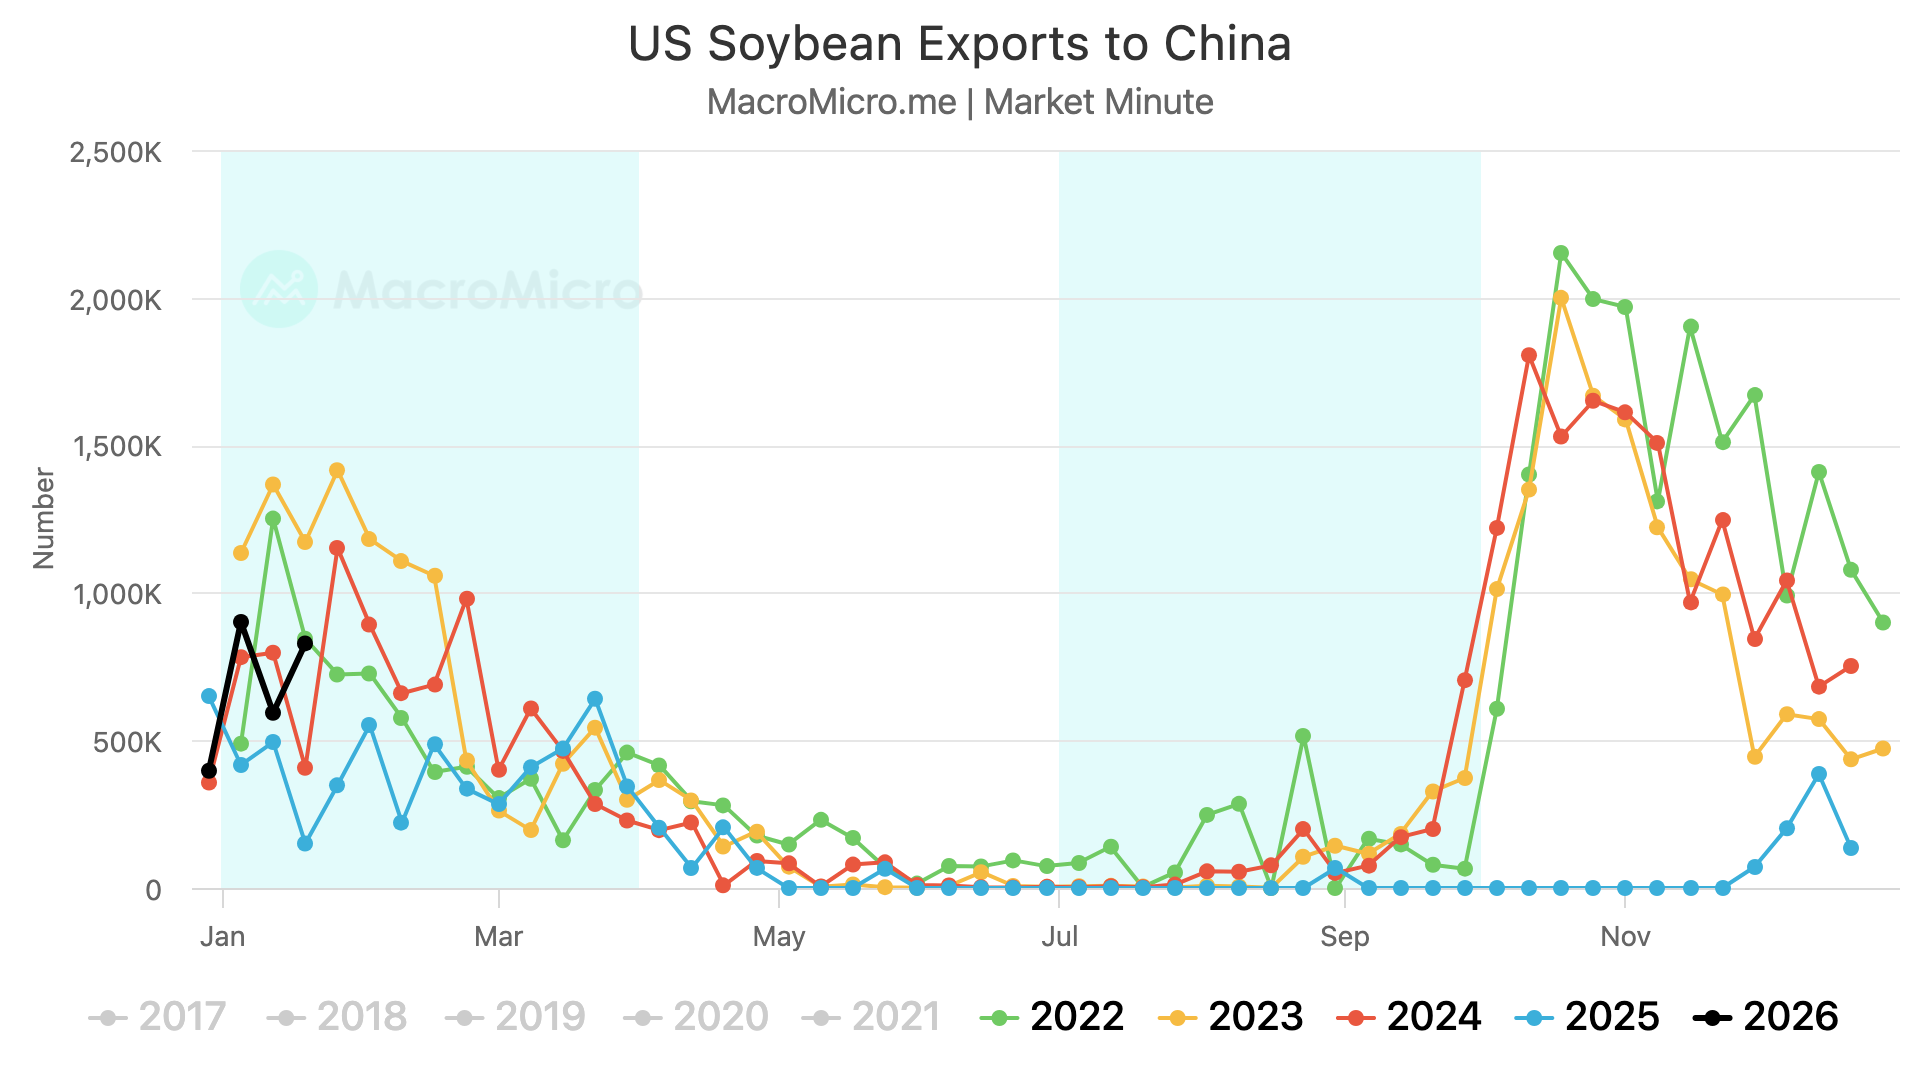
The problem many have is the thought process that China is basically done buying soybeans now after meeting that goal.
Typically, this is the time of year when China almost entirely stops buying from us and switches over to Brazil as their crop becomes available.
It's a valid concern and I don’t have the answer.
Will China stop buying because they usually do? Especially given the fact that Brazil's beans are a lot cheaper than ours.
Or will China continue to buy our soybeans as a good will offer to keep trade relations happy?
It's impossible to know. If China does continue to step in here and buy, the market will take notice. But typically they don’t buy much here.
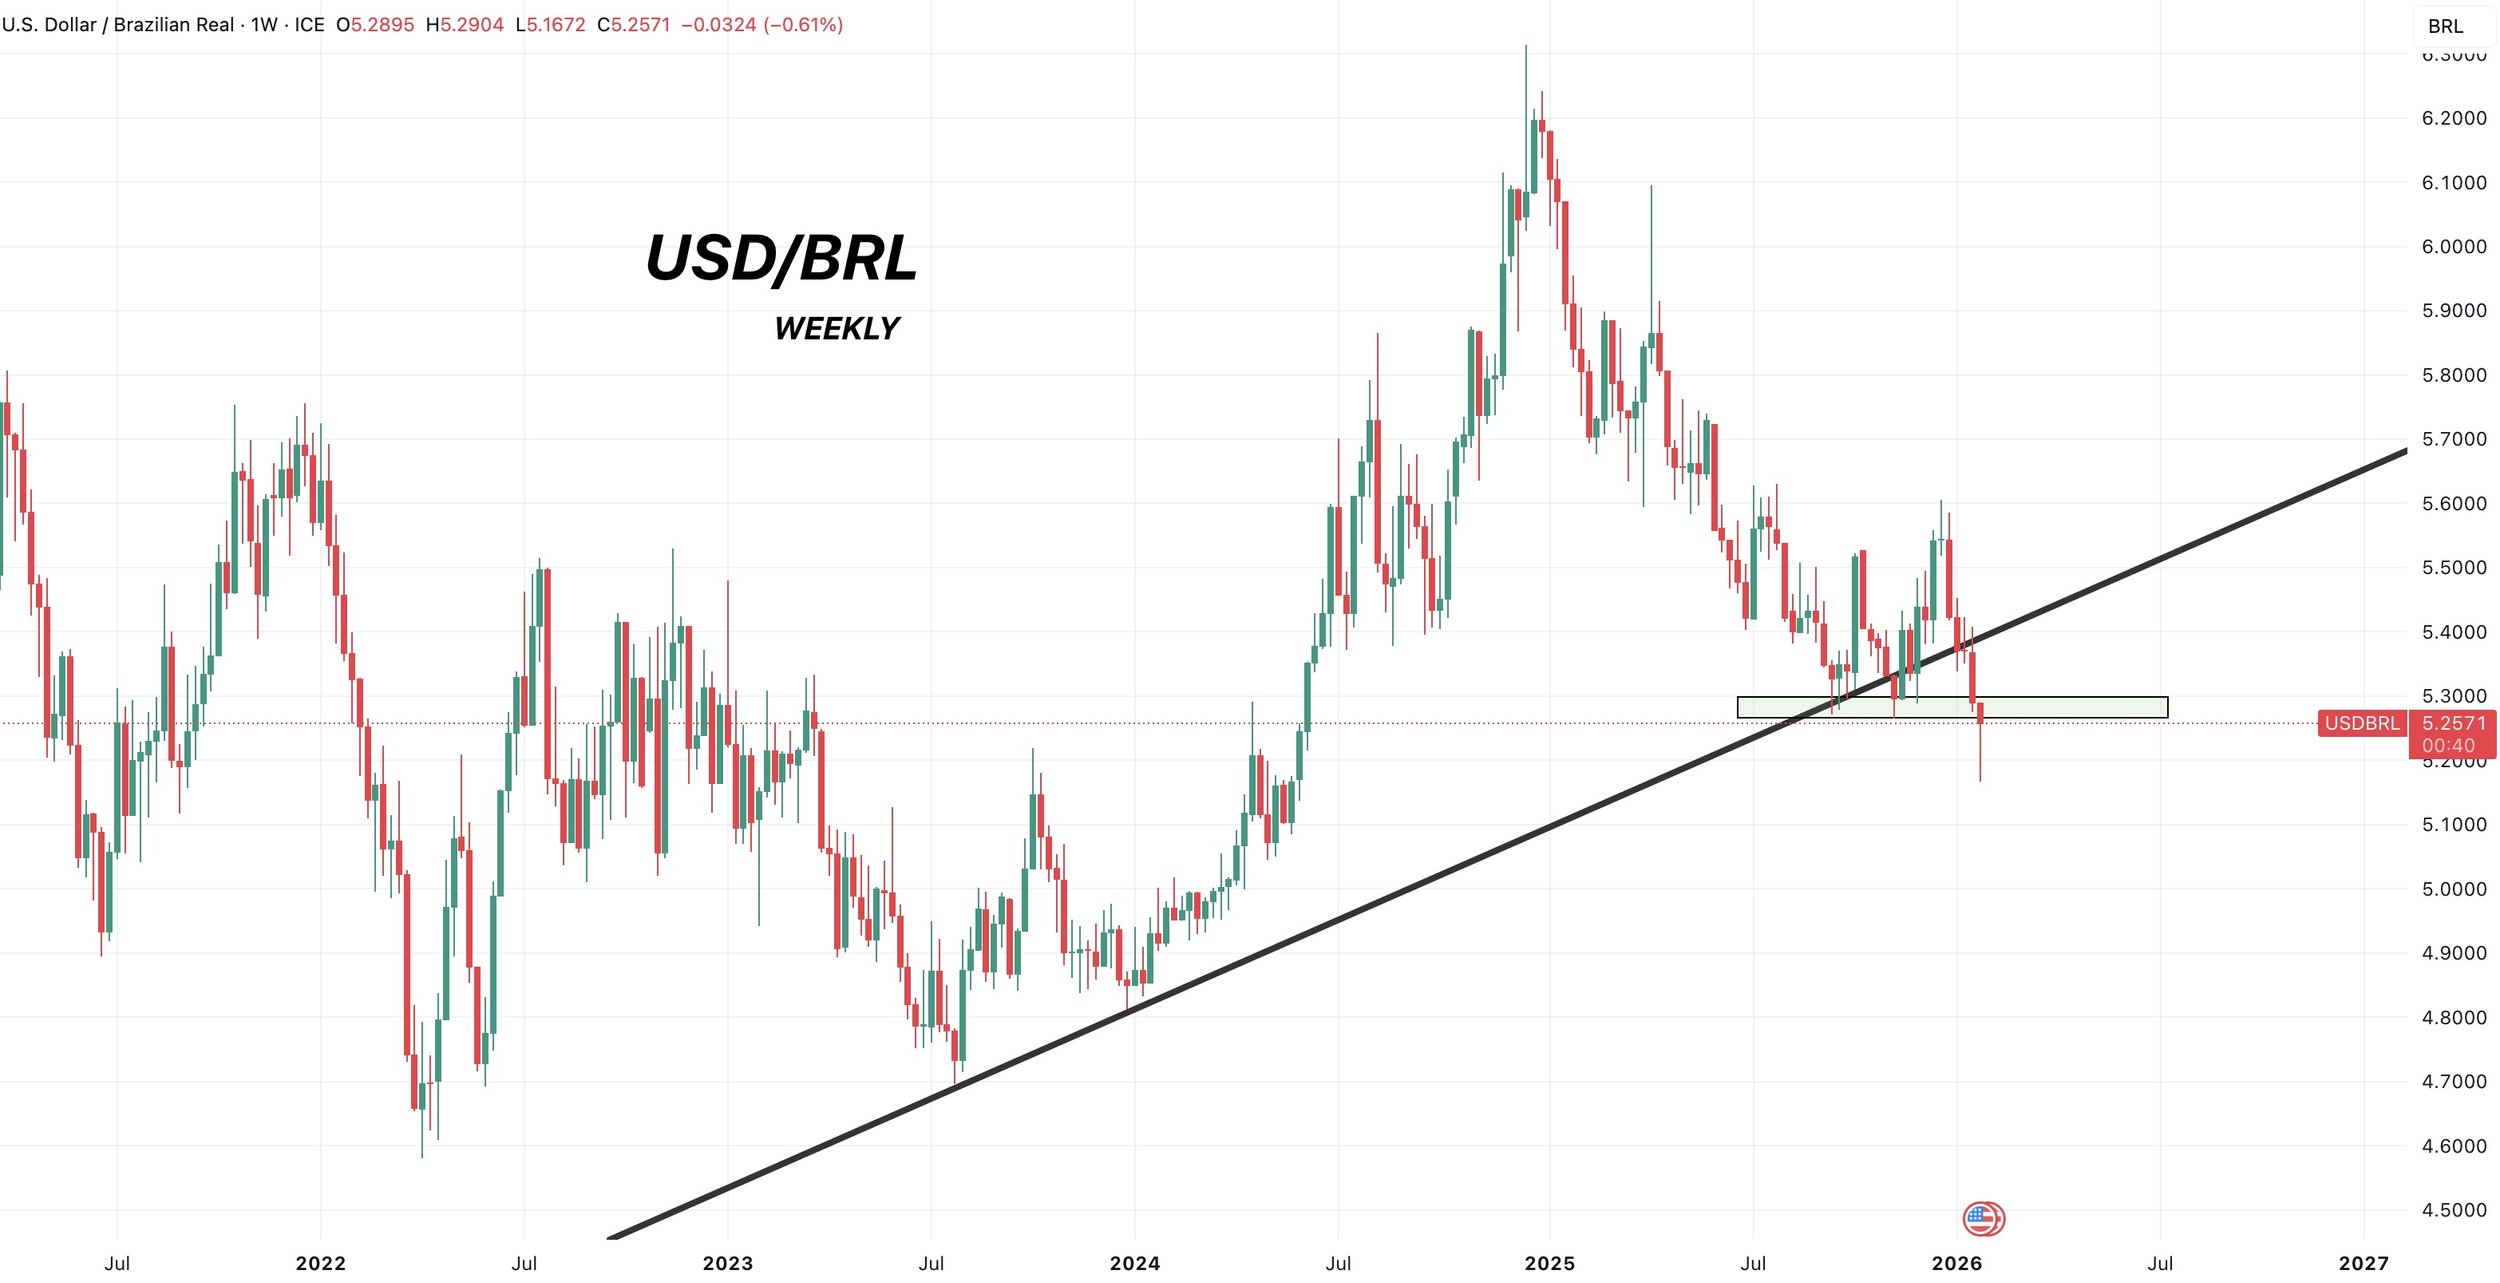
Here is the USD vs Brazilian Real weekly chart.
The outside market turmoil led to the dollar rallying today.
As a result, the US Dollar vs Real rallied. Which was probably part of the weakness today as well.
However, this chart did break some key support. If it continues to fall, this will help offset the negative effects of that monster Brazil crop.
Let's just say the Brazil harvest does result in soybeans trending lower.
The incentive to plant soybeans is only going to shrink.
If soybeans lose some acres, it could set up a friendly scenario later on.
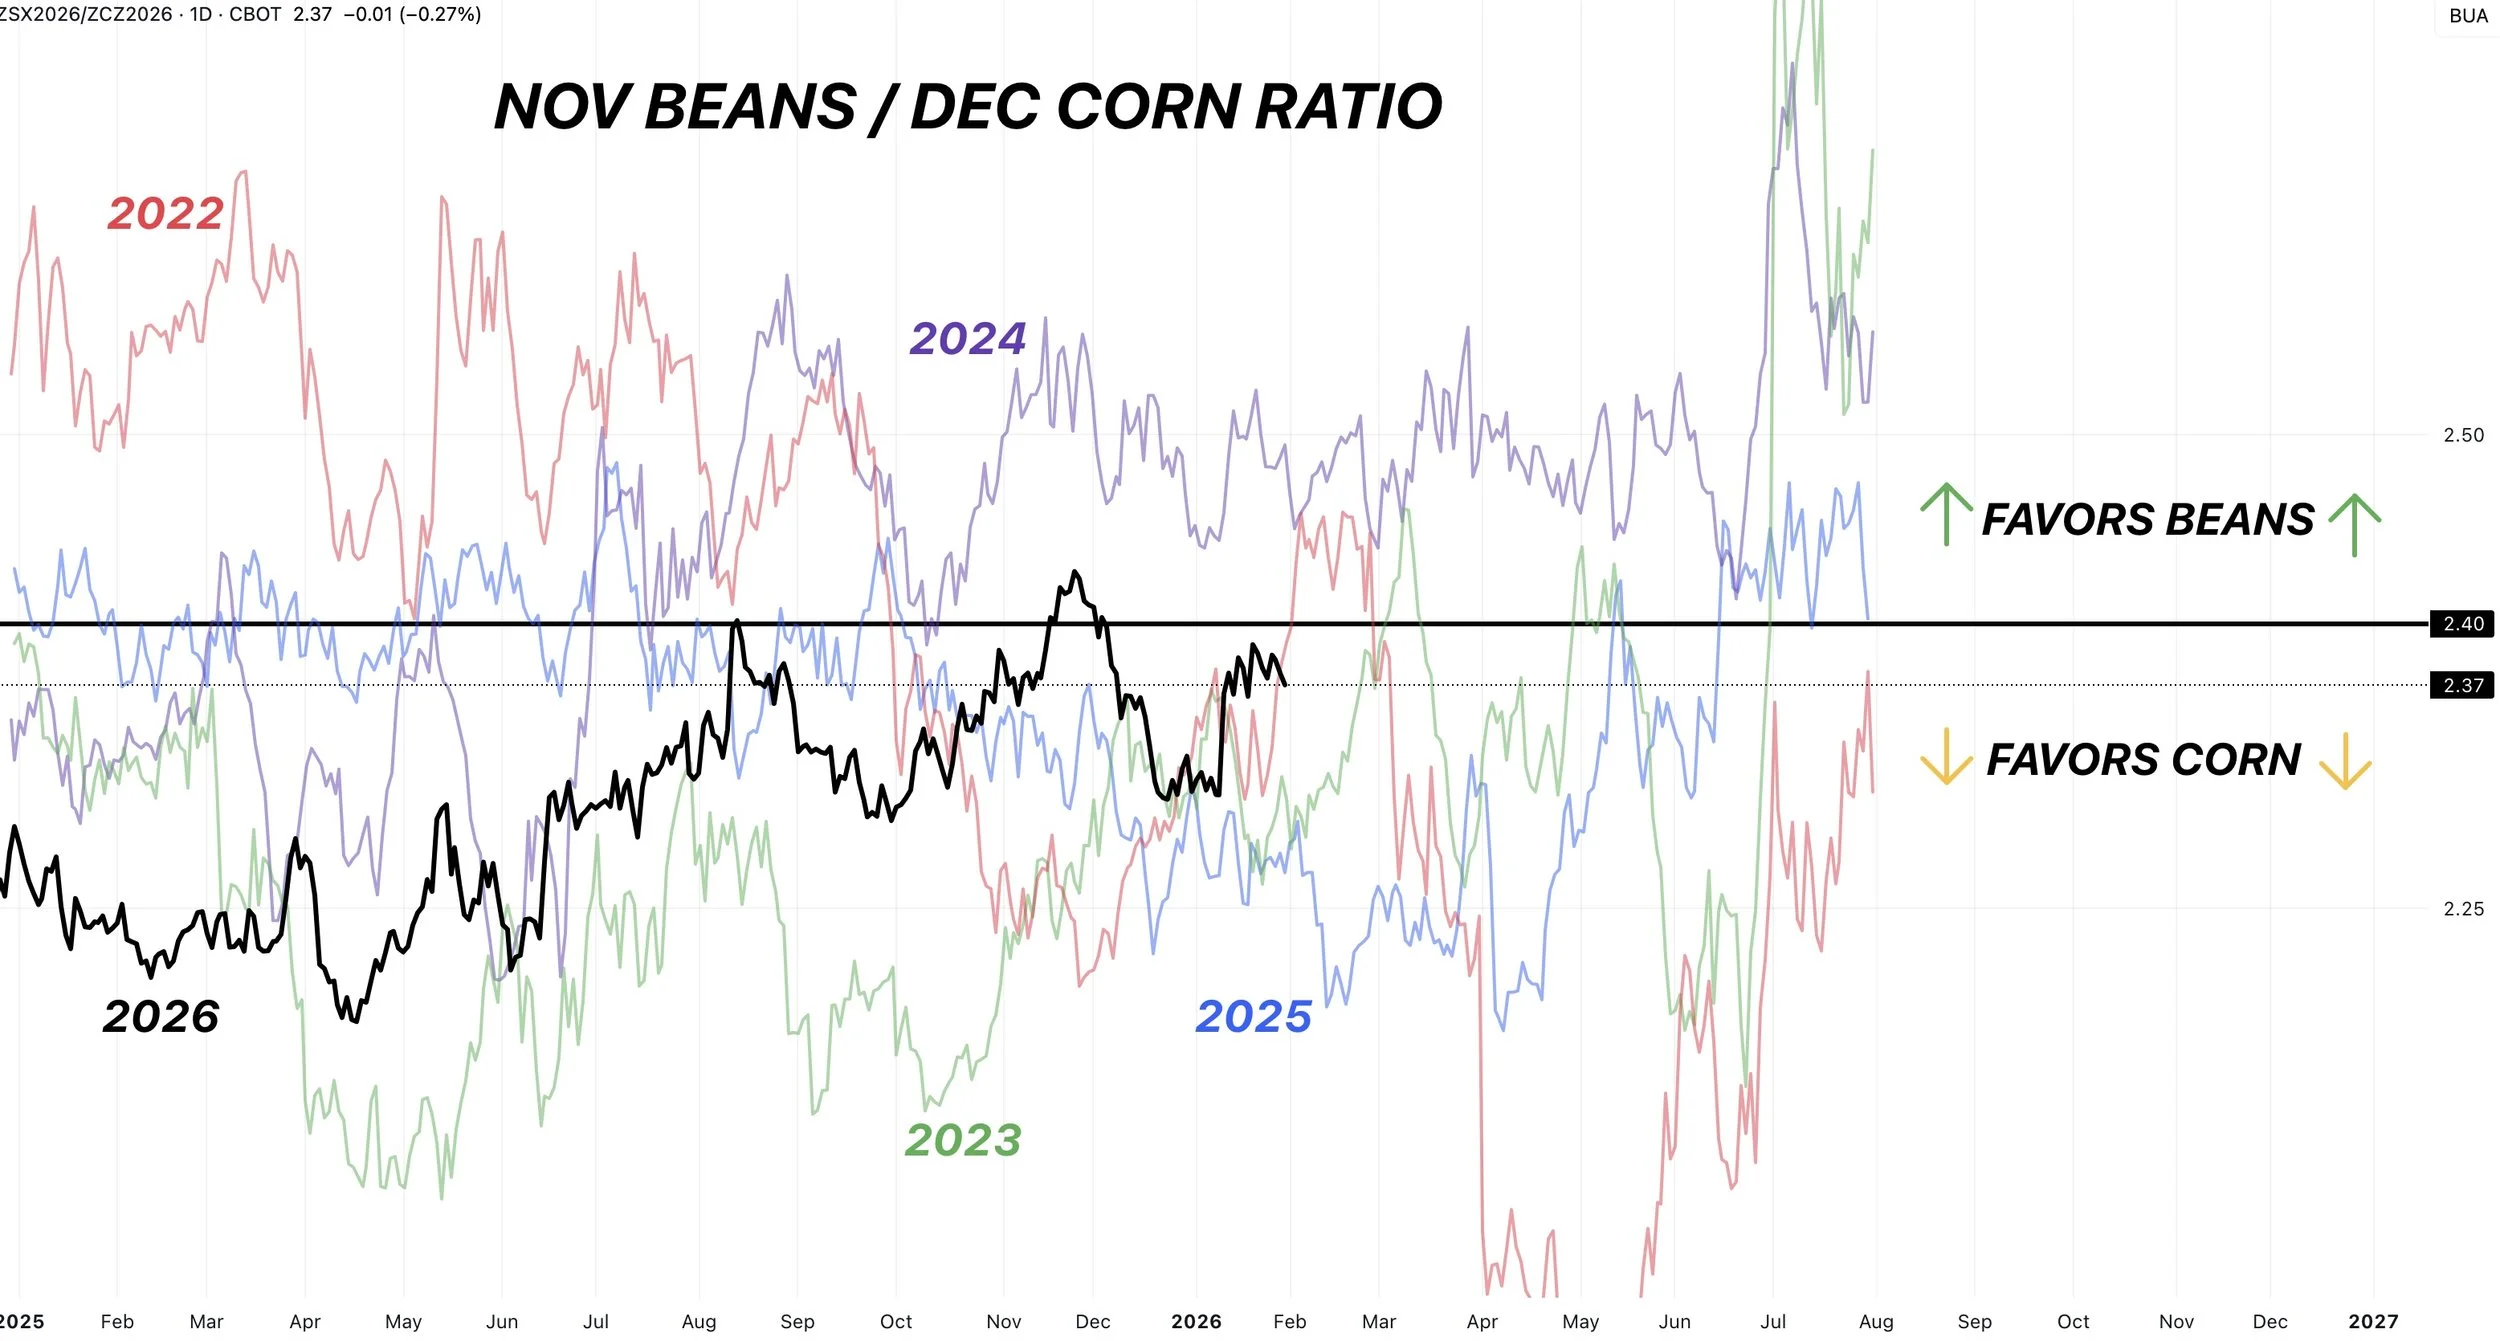
Here is the soybean to corn ratio. It currently still favors corn. If soybeans drop further, it further favors corn.
Bottom line, the story in soybeans isn’t screaming higher today. The record Brazil harvest could very well keep a lid on us short term.
So we will still want to be defending opportunities if they come here, like we've been talking about for weeks.
The biggest factor to watch is going to be China and if they decide they want to keep buying or not.
We did not issue a full blown sell signal on the recent bounce. As the market did not provide much time for us to get one out at open yesterday.
However, Jeremey was vocal about some of you taking some chips off the table the last few days if you needed to do so. As we were approaching some targets on the charts.
Technicals:
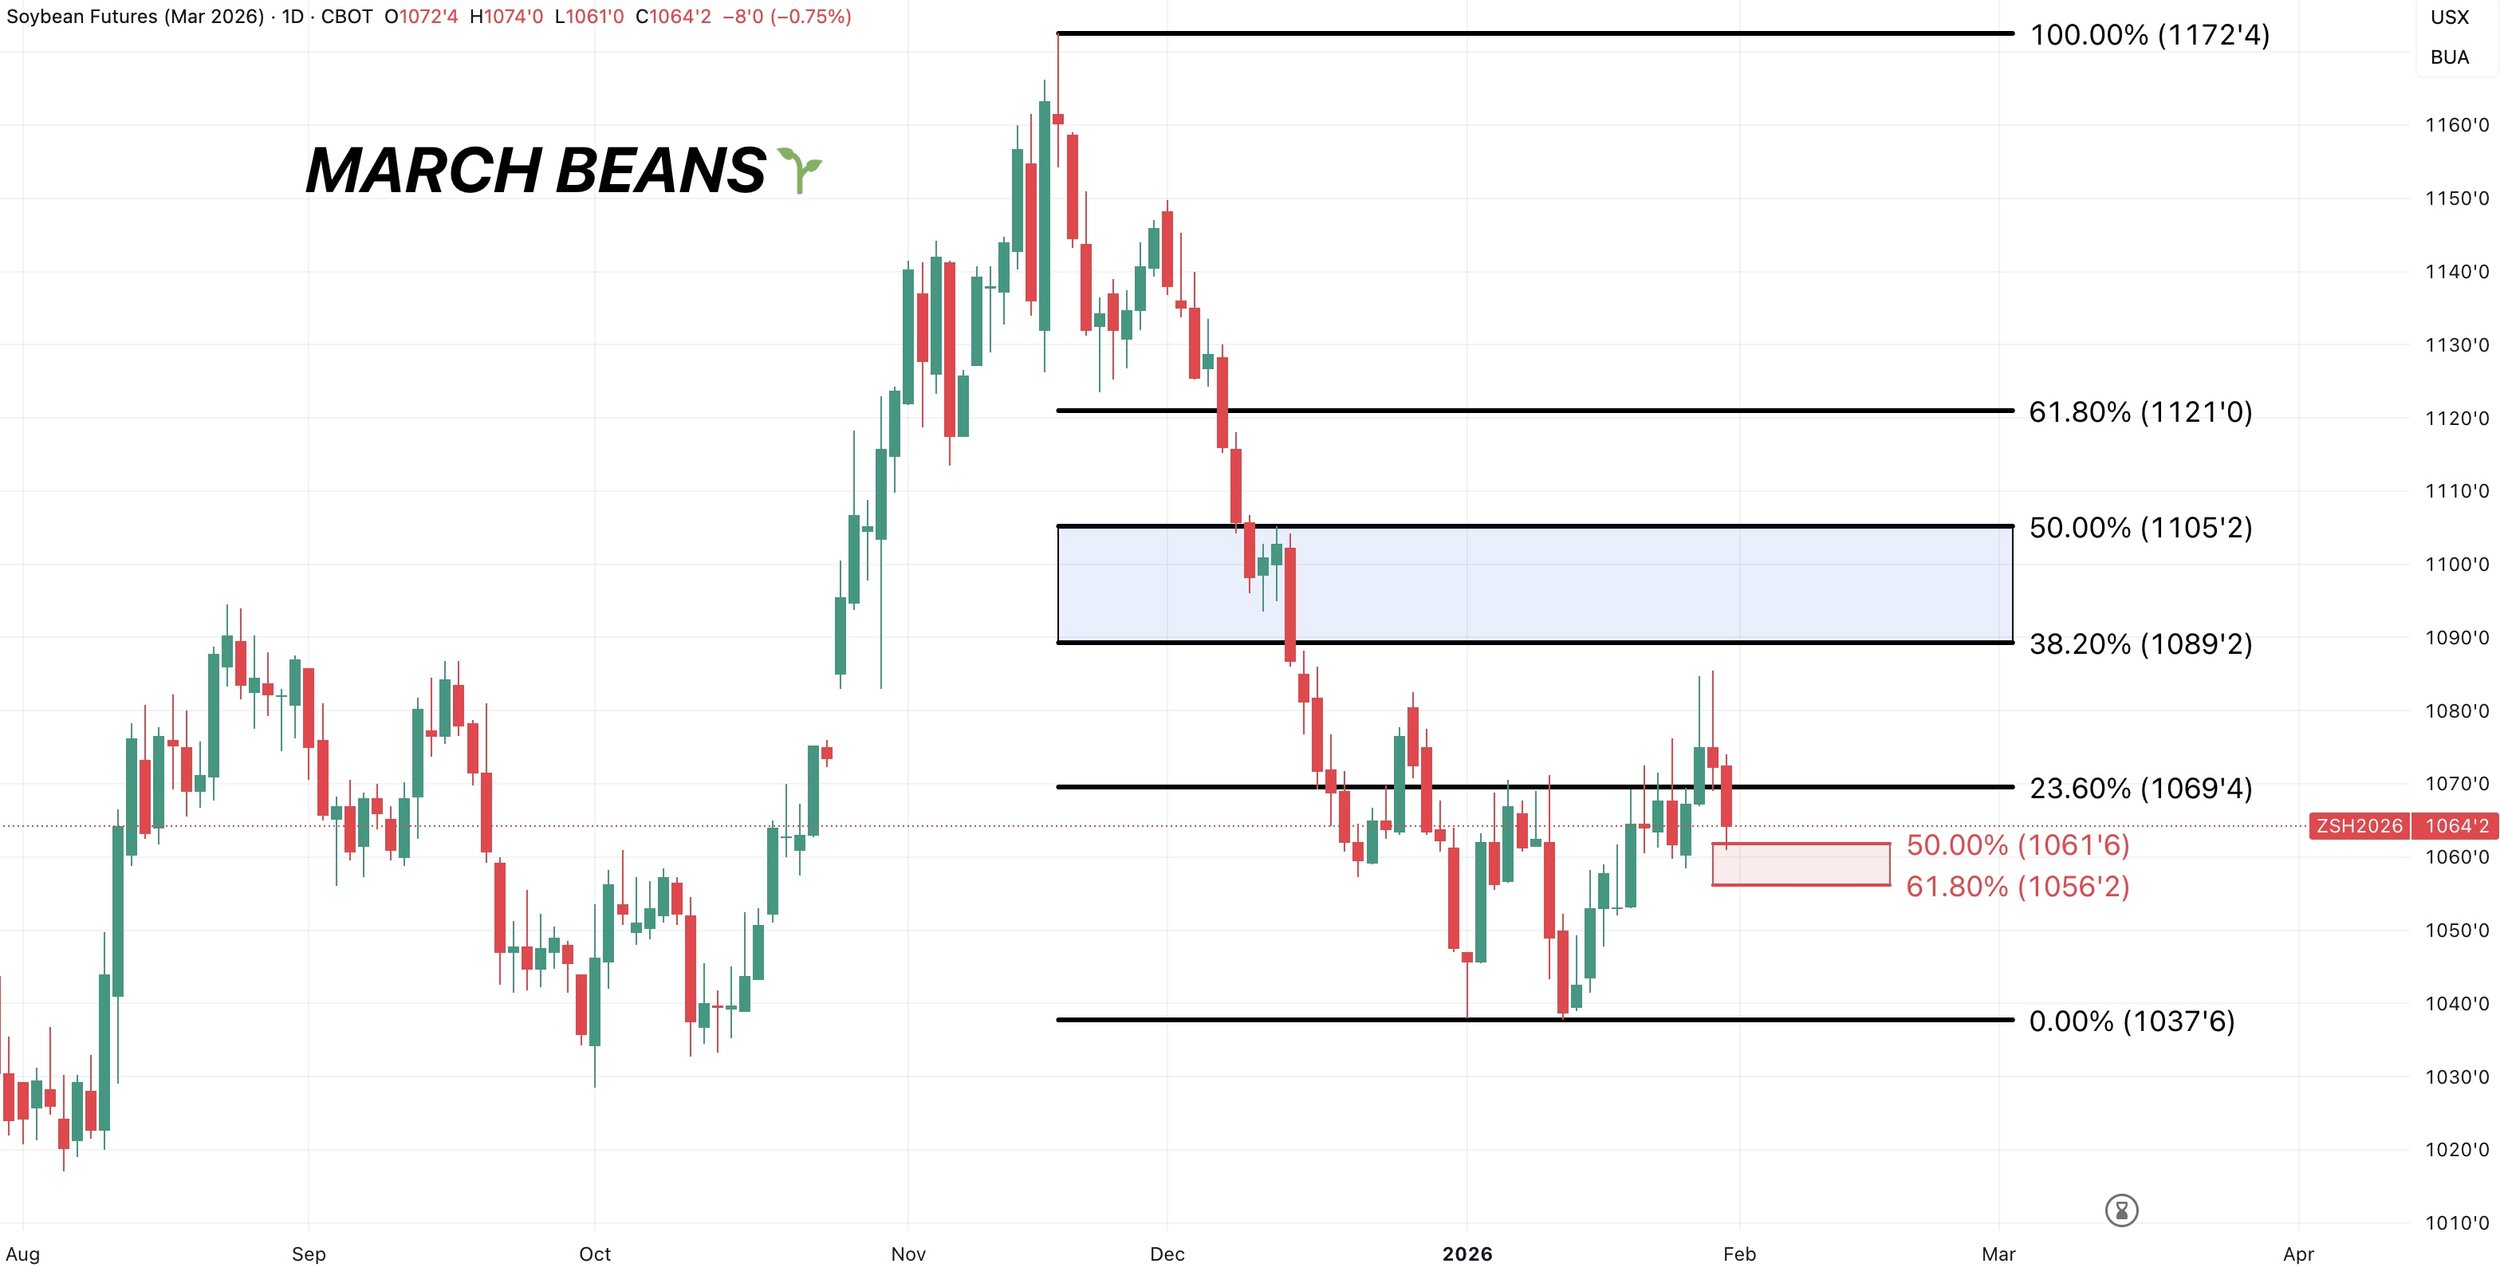
March Beans:
March beans missed that target box for us to alert a signal by 4 cents.
That is still going to be the level to reward if it comes.
In a big picture downtrend like this one where the correction was this deep, the 38.2% retracement level is a very common level for us to top out at on a relief bounce. Sometimes it can extend to 50%.
Those levels are $10.89 to $11.05
To the downside we want to hold $10.56 to keep the trend higher.
That is the 61.8% retracement of the entire bounce.
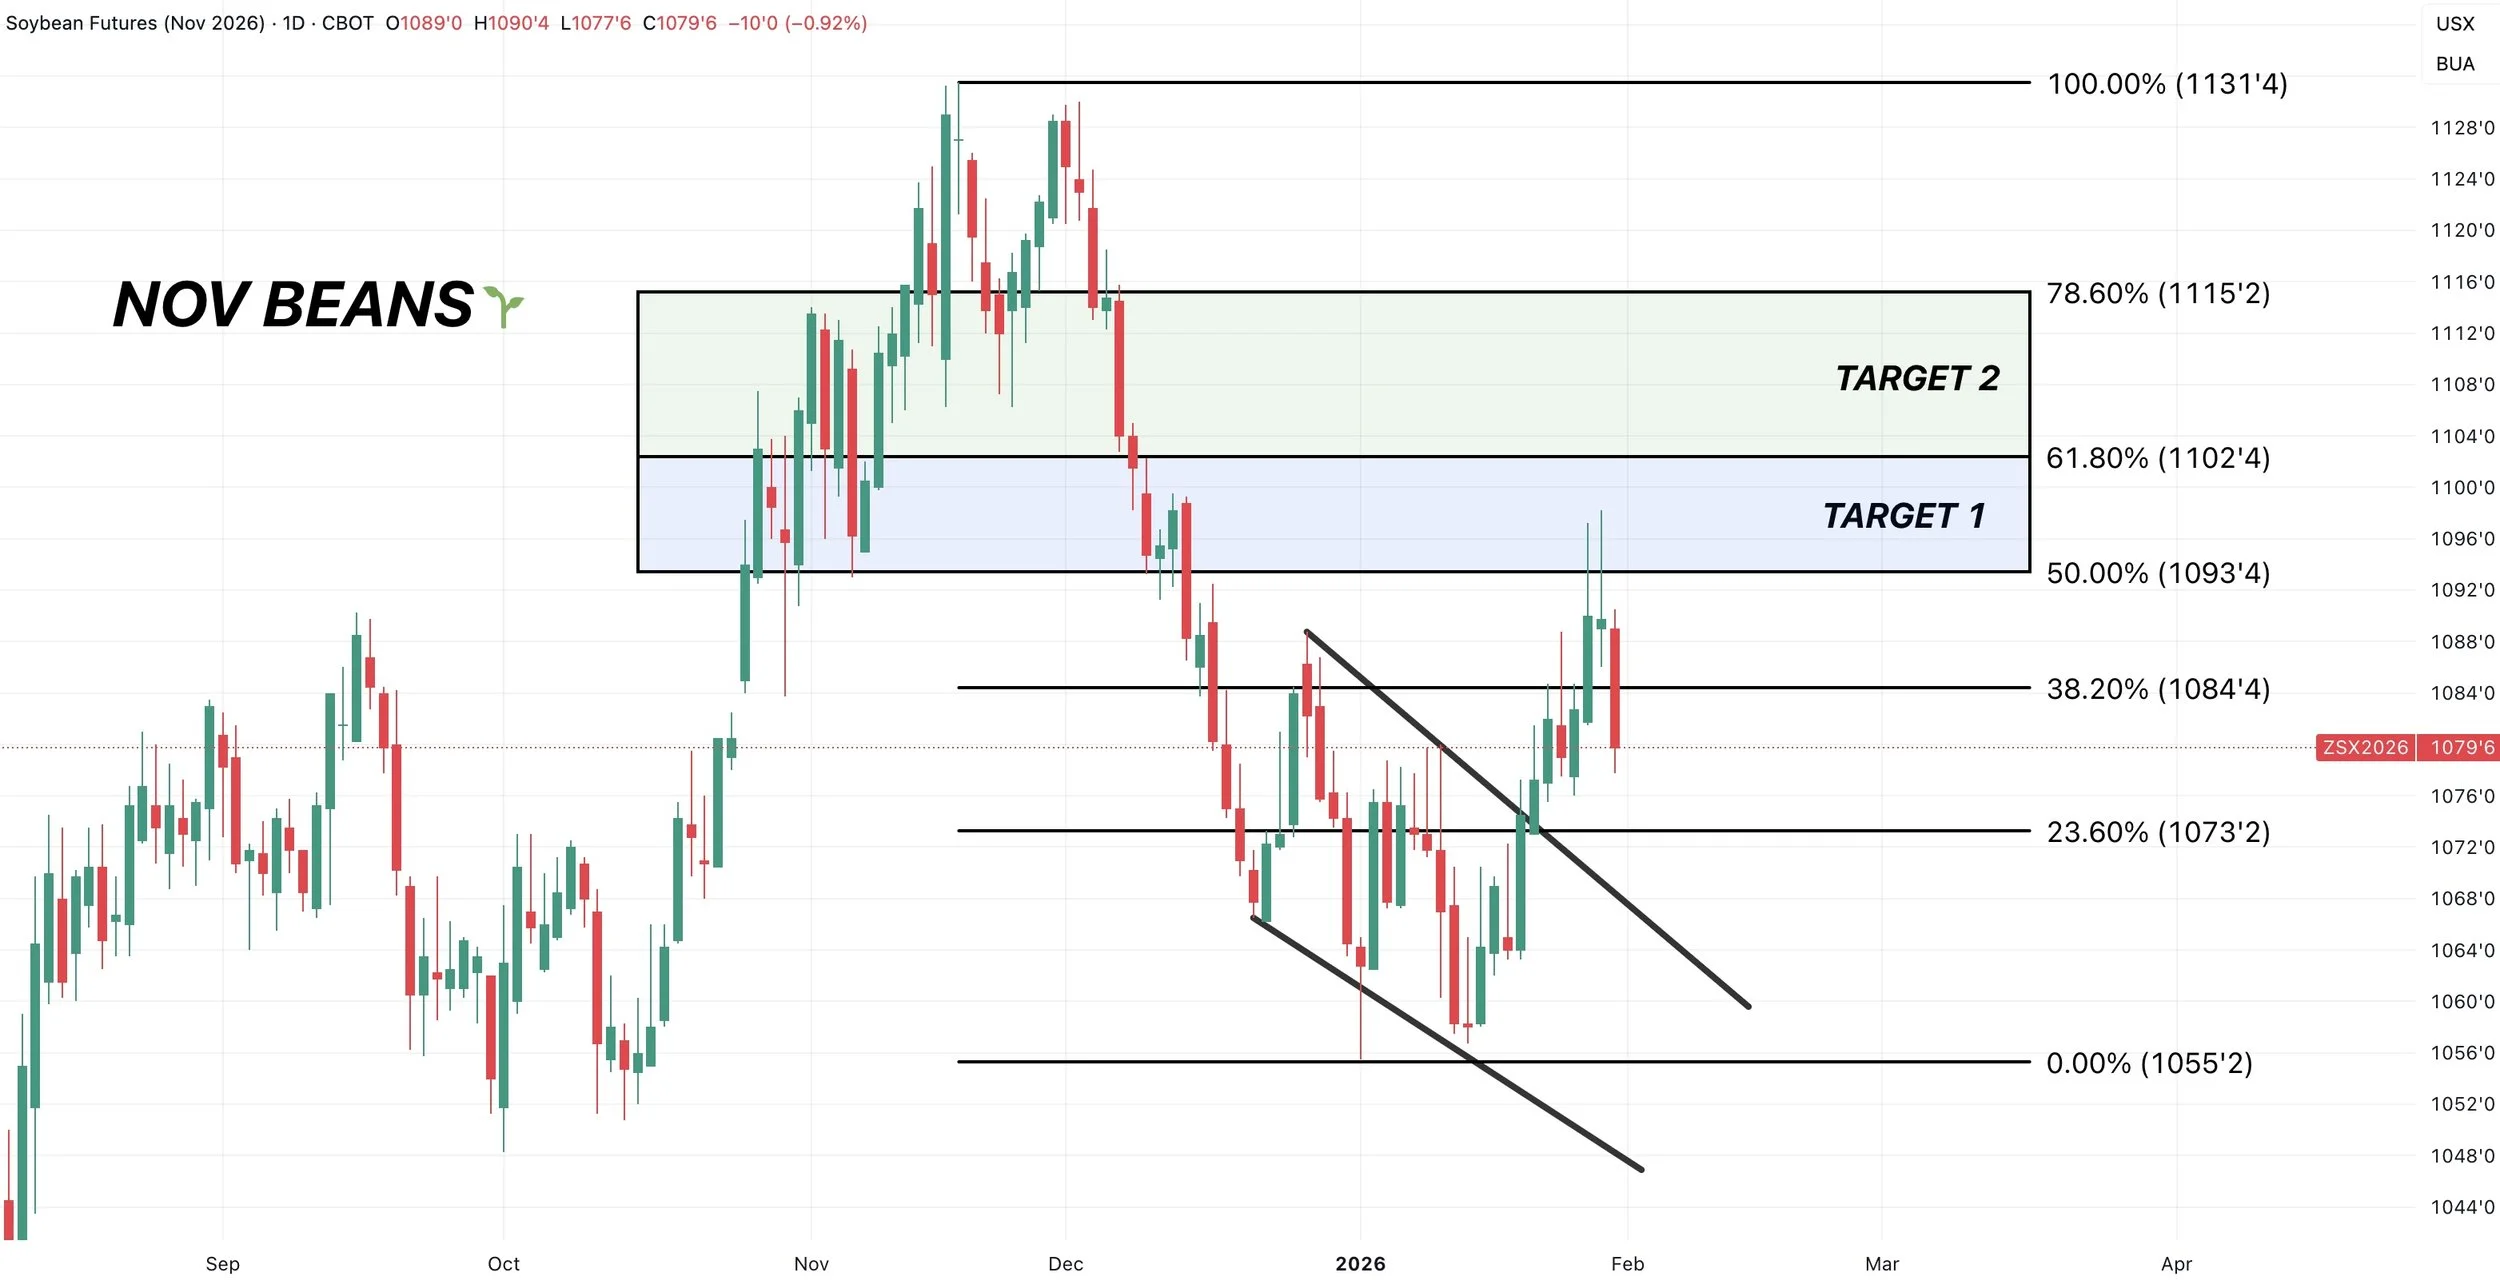
Nov Beans:
Nov soybeans did hit that original target box.
Which was the golden zone retracements of the entire sell off (50-61.8%).
The next levels to de-risk are the 61.8% and 78.6% levels at $11.00 and $11.15
Wheat
Wheat caught a bid this week off the back of short covering.
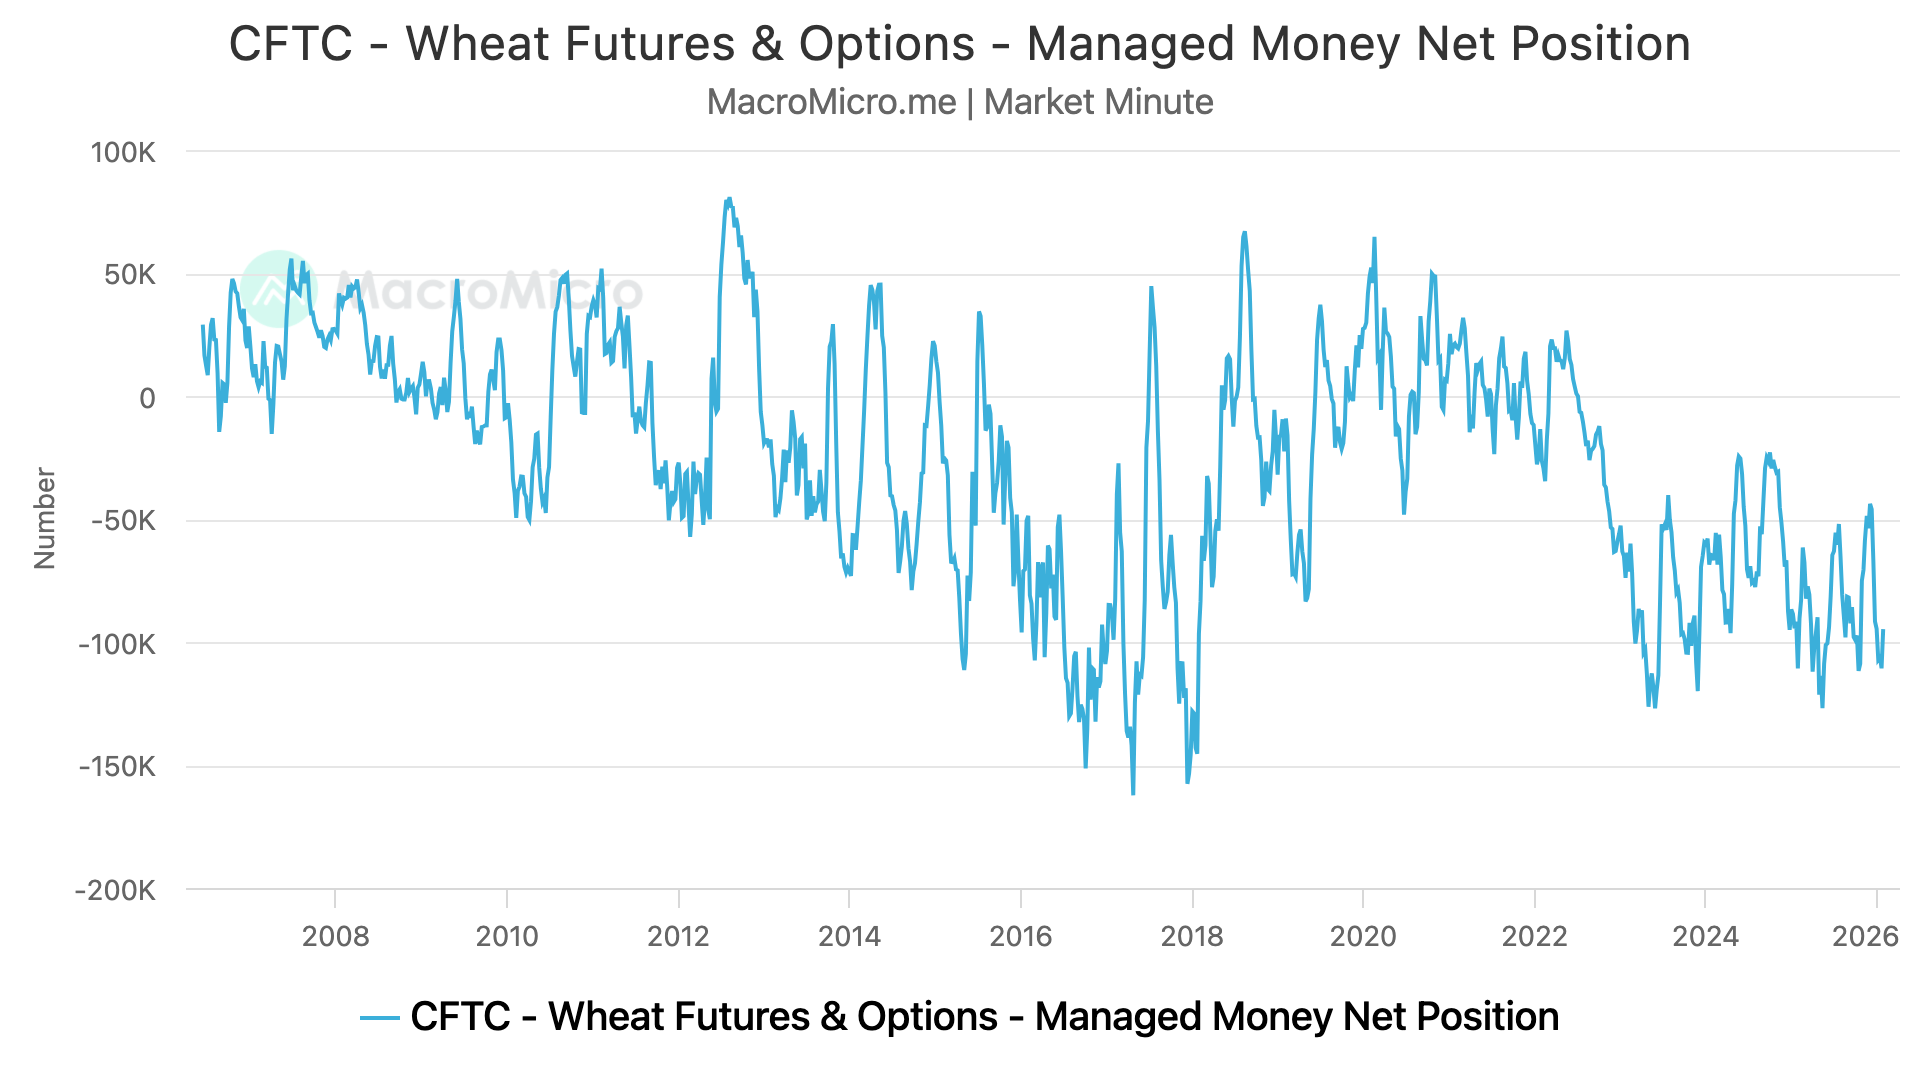
Short covering has been driving this rally.
Like we've talked about, the funds are almost always short the wheat market.
It's the funds favorite thing to short.
So anytime there is a supply issue anywhere, they start to cover. As a result the wheat market gets a nice rally out of nowhere.
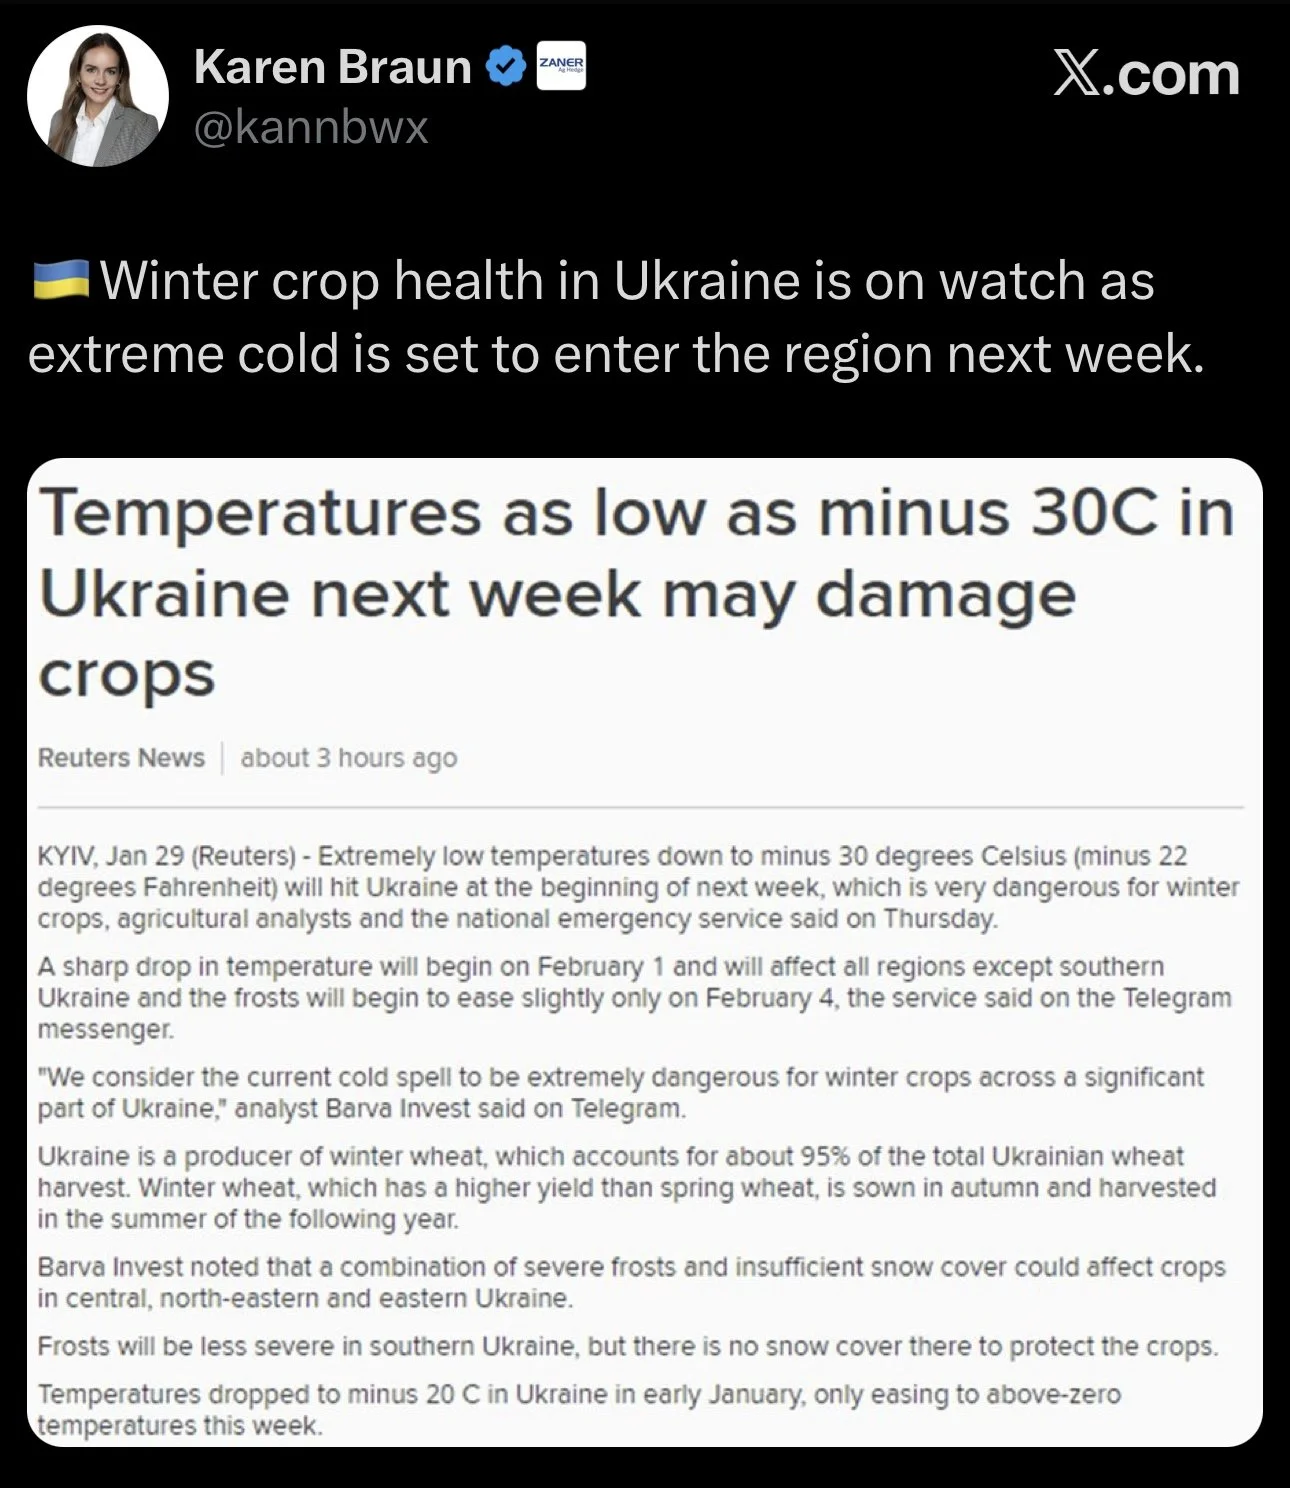
For the first time in a while, weather isn’t perfect globally.
We saw some brutally cold weather in the US.
Australia is having some dry concerns.
And Ukraine is on extreme cold weather watch next week. With temps expected to reach as cold as -22 degrees. Which adds some risk to that winter wheat crop.
Technicals:
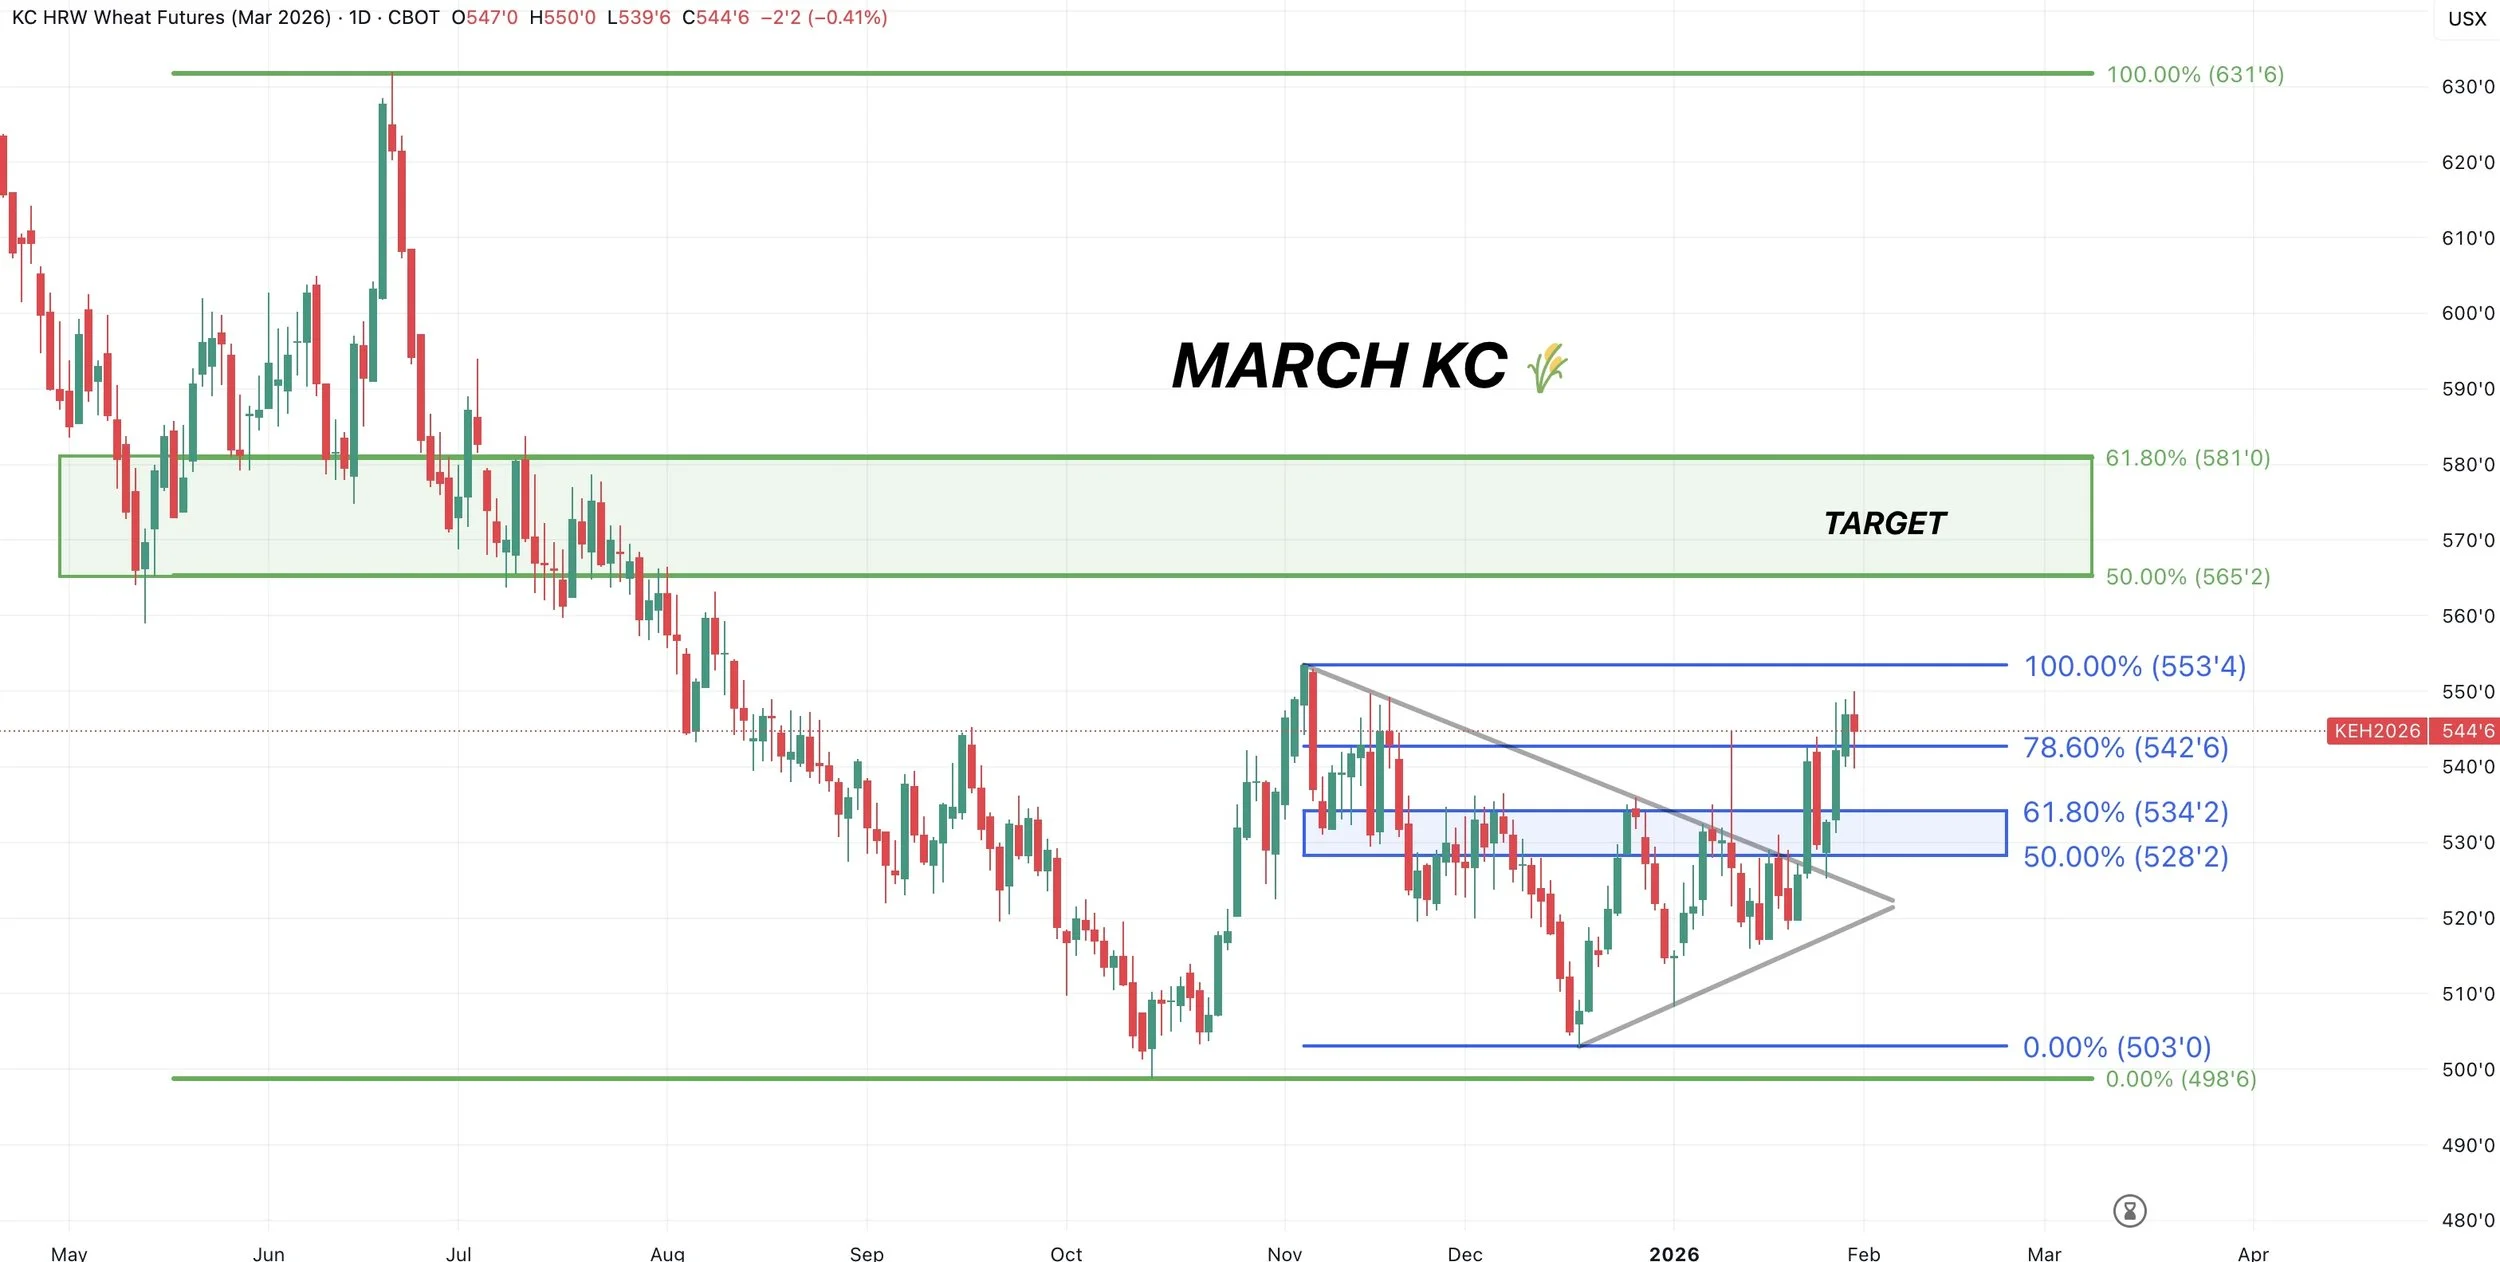
March KC
The chart looks pretty solid here.
If we can break those Nov highs, I am looking to reward a move in the green box target box we've had for months.
Which is 50% to 61.8% of the June highs. Where most corrective bounces fail.
$5.65 to $5.81
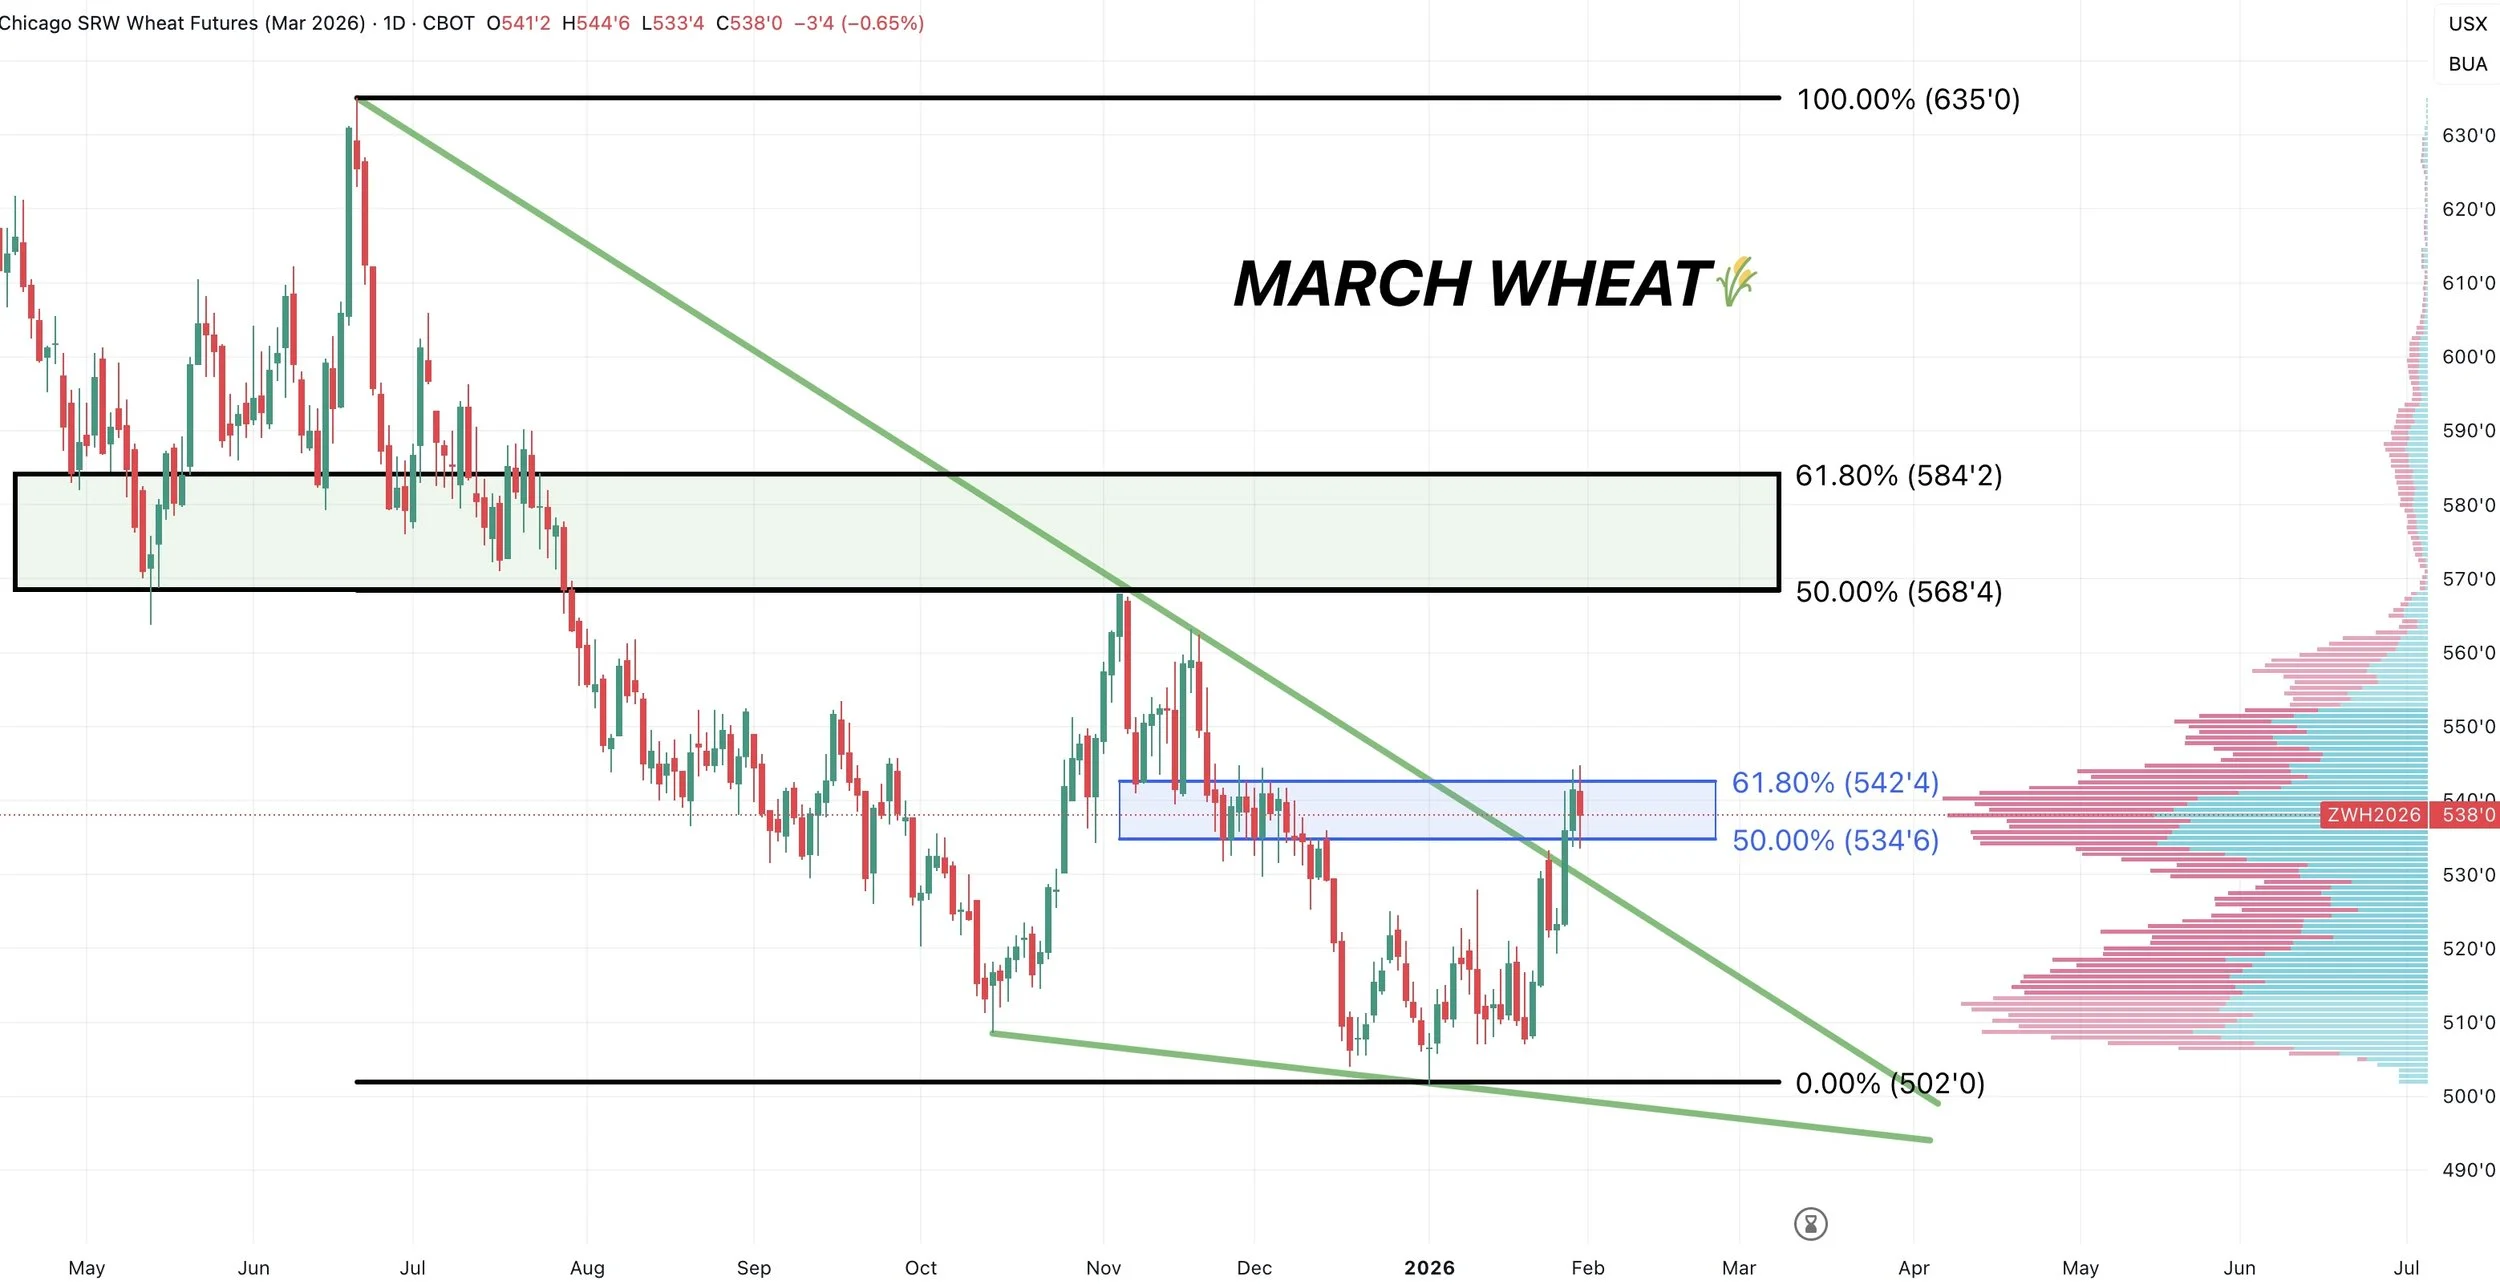
March Chicago
March Chicago wheat doesn’t look quiet as strong.
We got the breakout of this multi-month wedge pattern.
However, we are now sitting at a pretty important level of resistance.
Which is the 61.8% level up to those Nov highs. This is where relief bounces fail.
This is also an area of high volume.
However. if we can break above it, it should result in a leg higher. As it would tell us this isn’t just a relief bounce.
Big level for bulls.
If we can break above, we are looking to reward the target box of $5.68 to $5.84. The golden zone up to the June highs.
Cattle
Fundamentals:
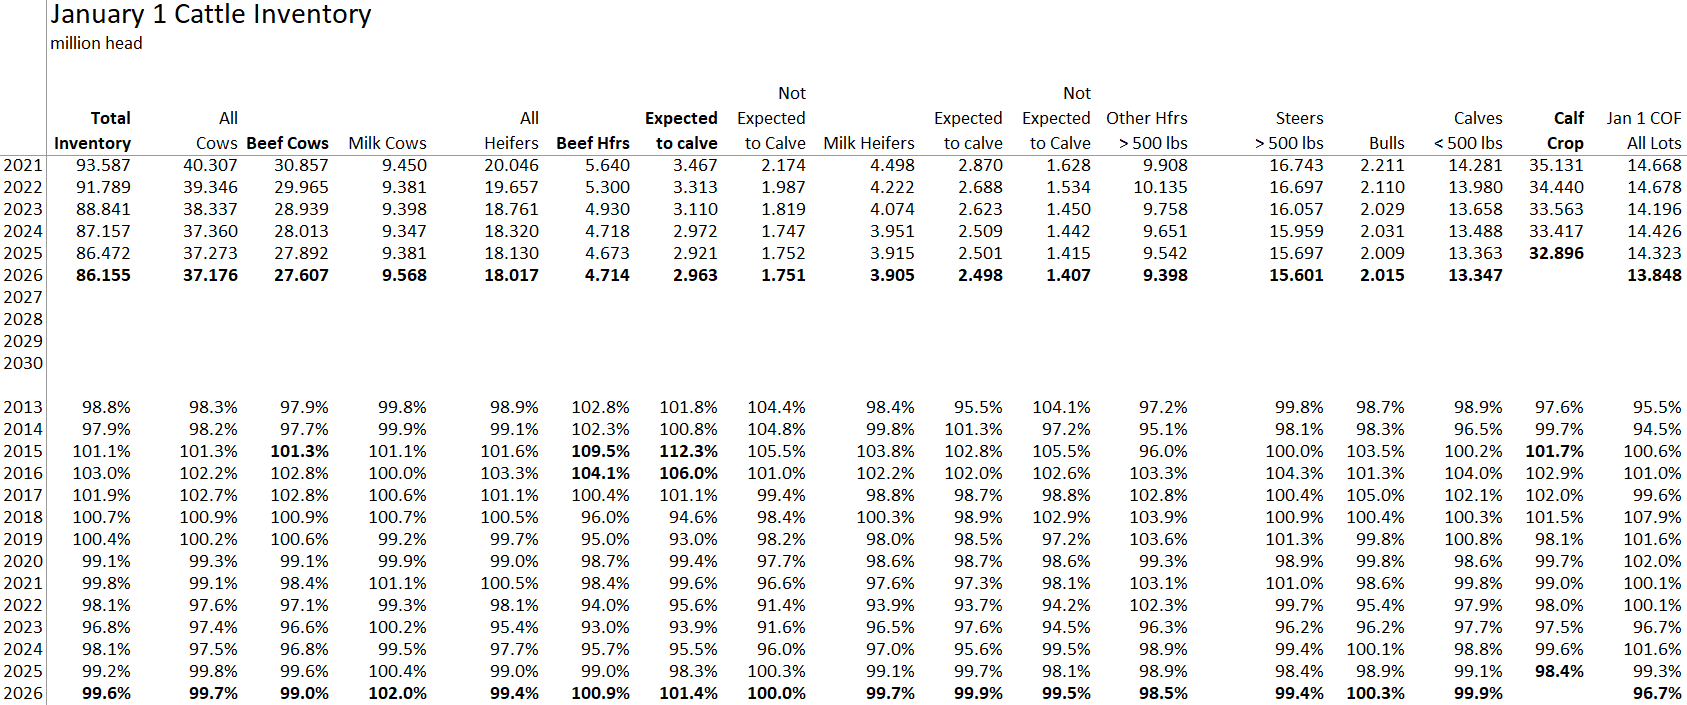
Today we had the bi-annual cattle report.
The numbers were on the slightly friendly side, but no major surprises.
I'm not going to spend much time on cattle today.
Fats were stronger because cash is stronger. Feeders were down hard with the rumors of screwworm in Texas.
As we've been saying for a while, it still makes sense to defend these type of price levels.
You have to be cautious here with demand.
This market simply has major headline risk.
What happens if screwworm does wind up in the US? It would be an immediate negative factor and major headline.
Outside of that we did have Trump bump his tariffs on South Korea. They are actually the number one buyer of US beef. It would be a bigger concern if supply wasn’t as tight as it is, but definitely a risk factor.
We have to keep in mind that it is the market's job to price in tight supply numbers. So the market will eventually top before we see the tightest supply numbers.
I'm not calling a top here. It's impossible to perfectly time the top of a bull market. As the top will only be confirmed in hindsight. There is just downside risk at these levels, and it would be irresponsible to not have any downside protection.
Technicals:
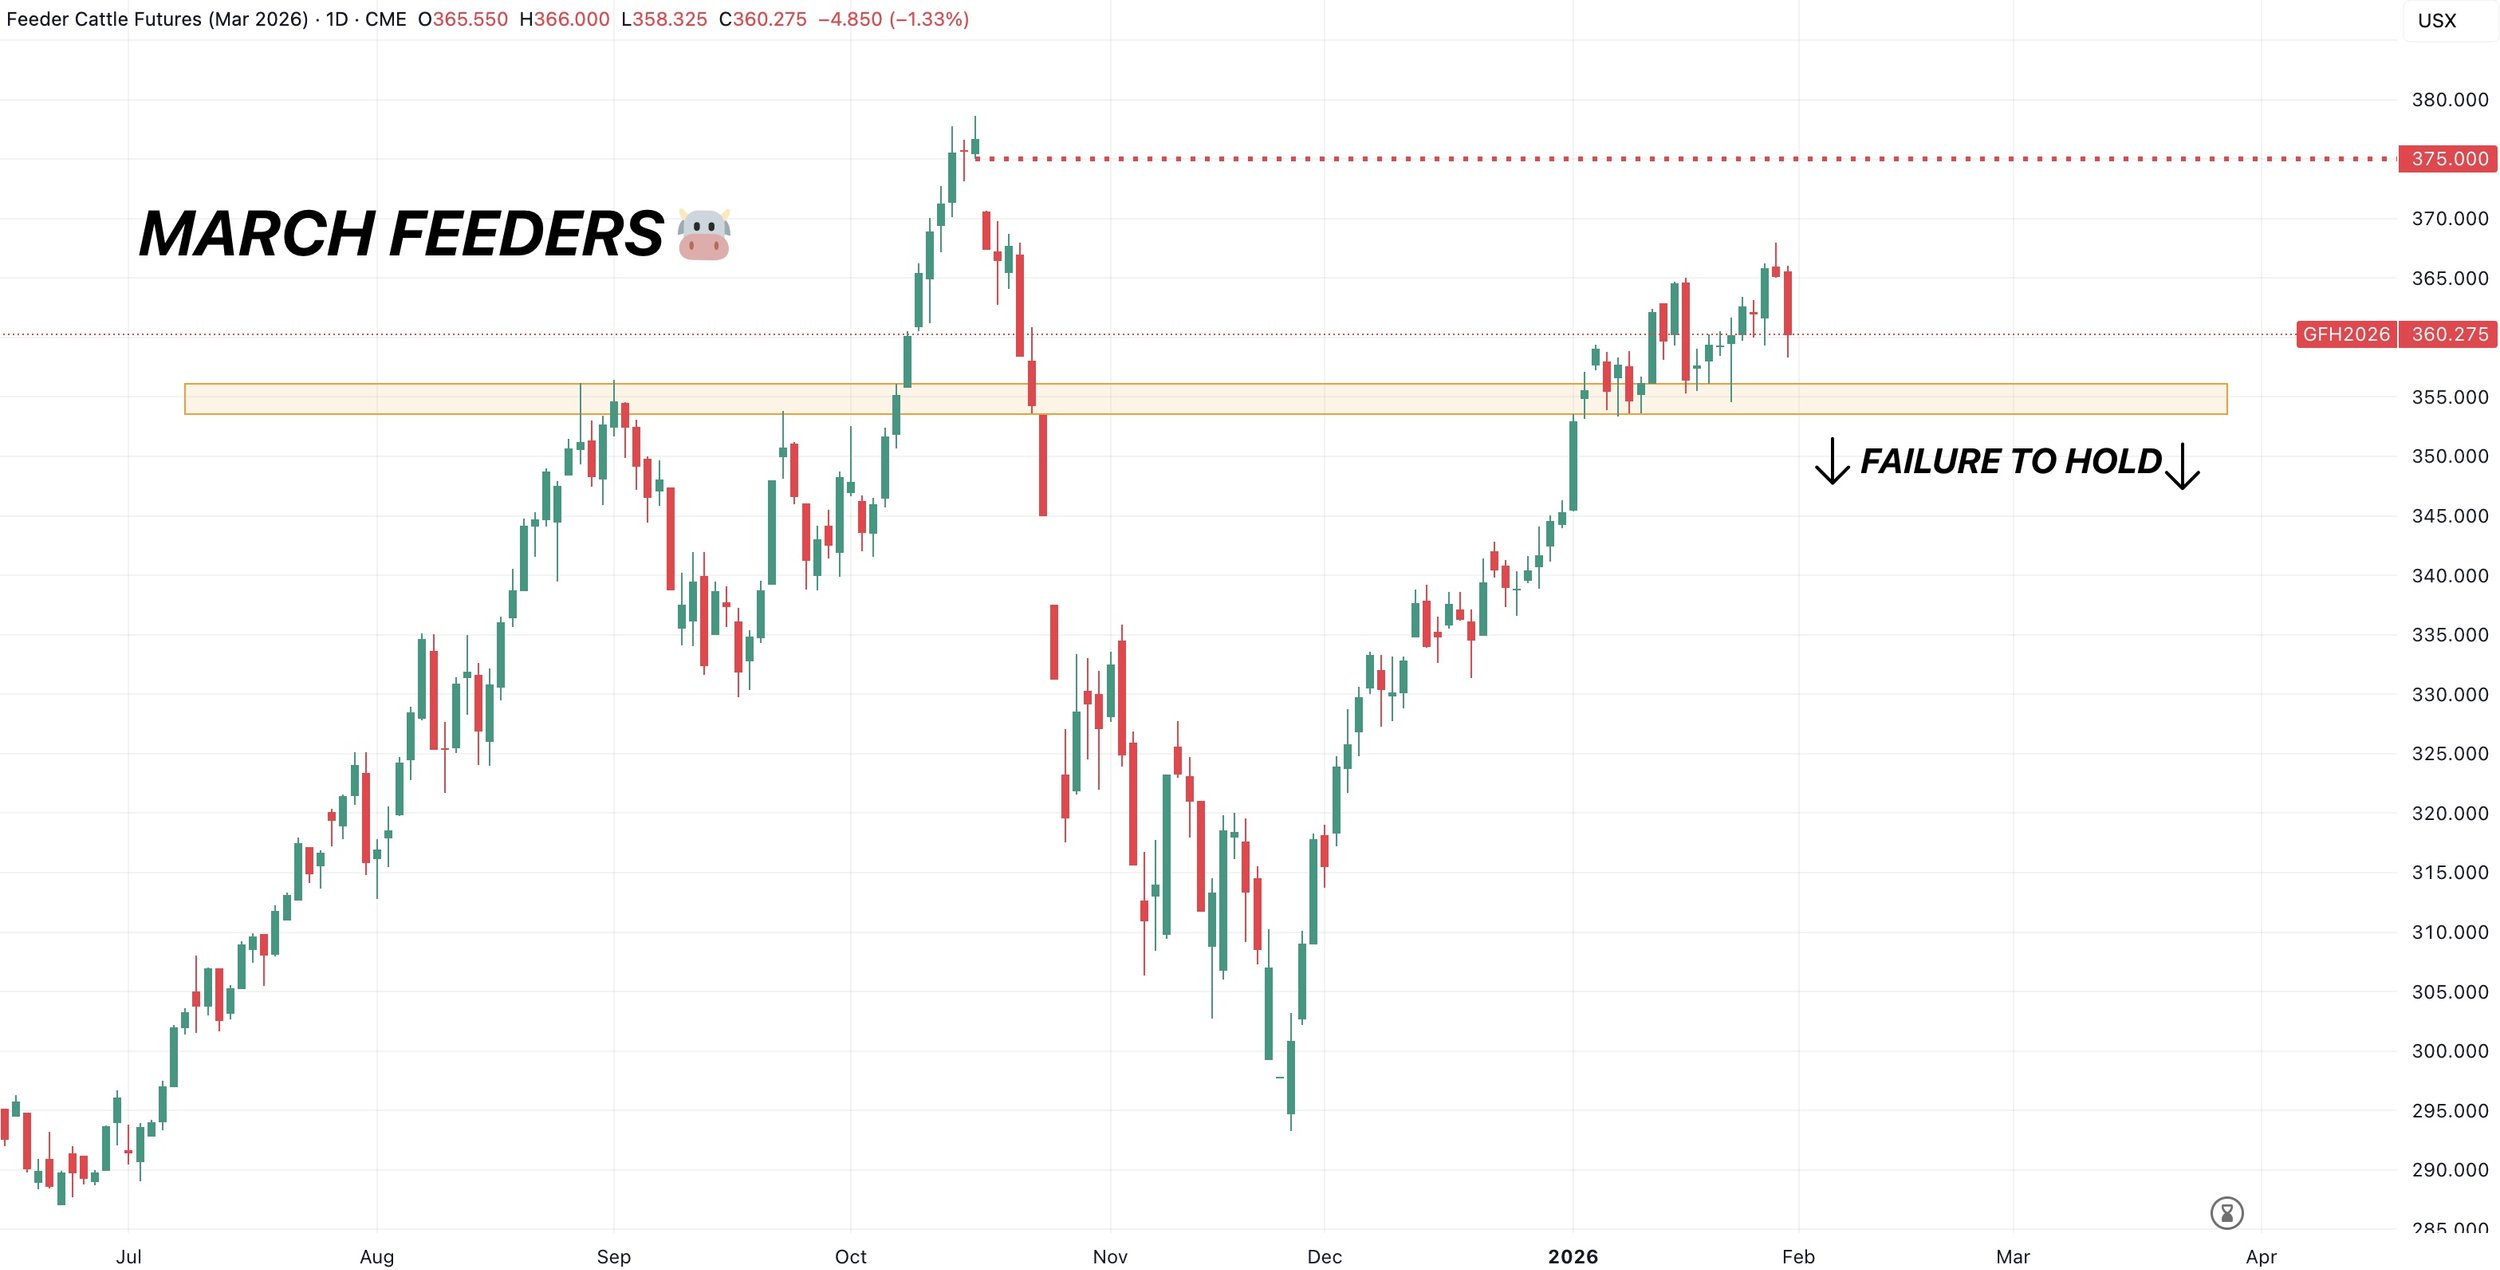
March Feeders
That $353 to $354 support box is still the level to hold.
Failure to hold opens the door lower.
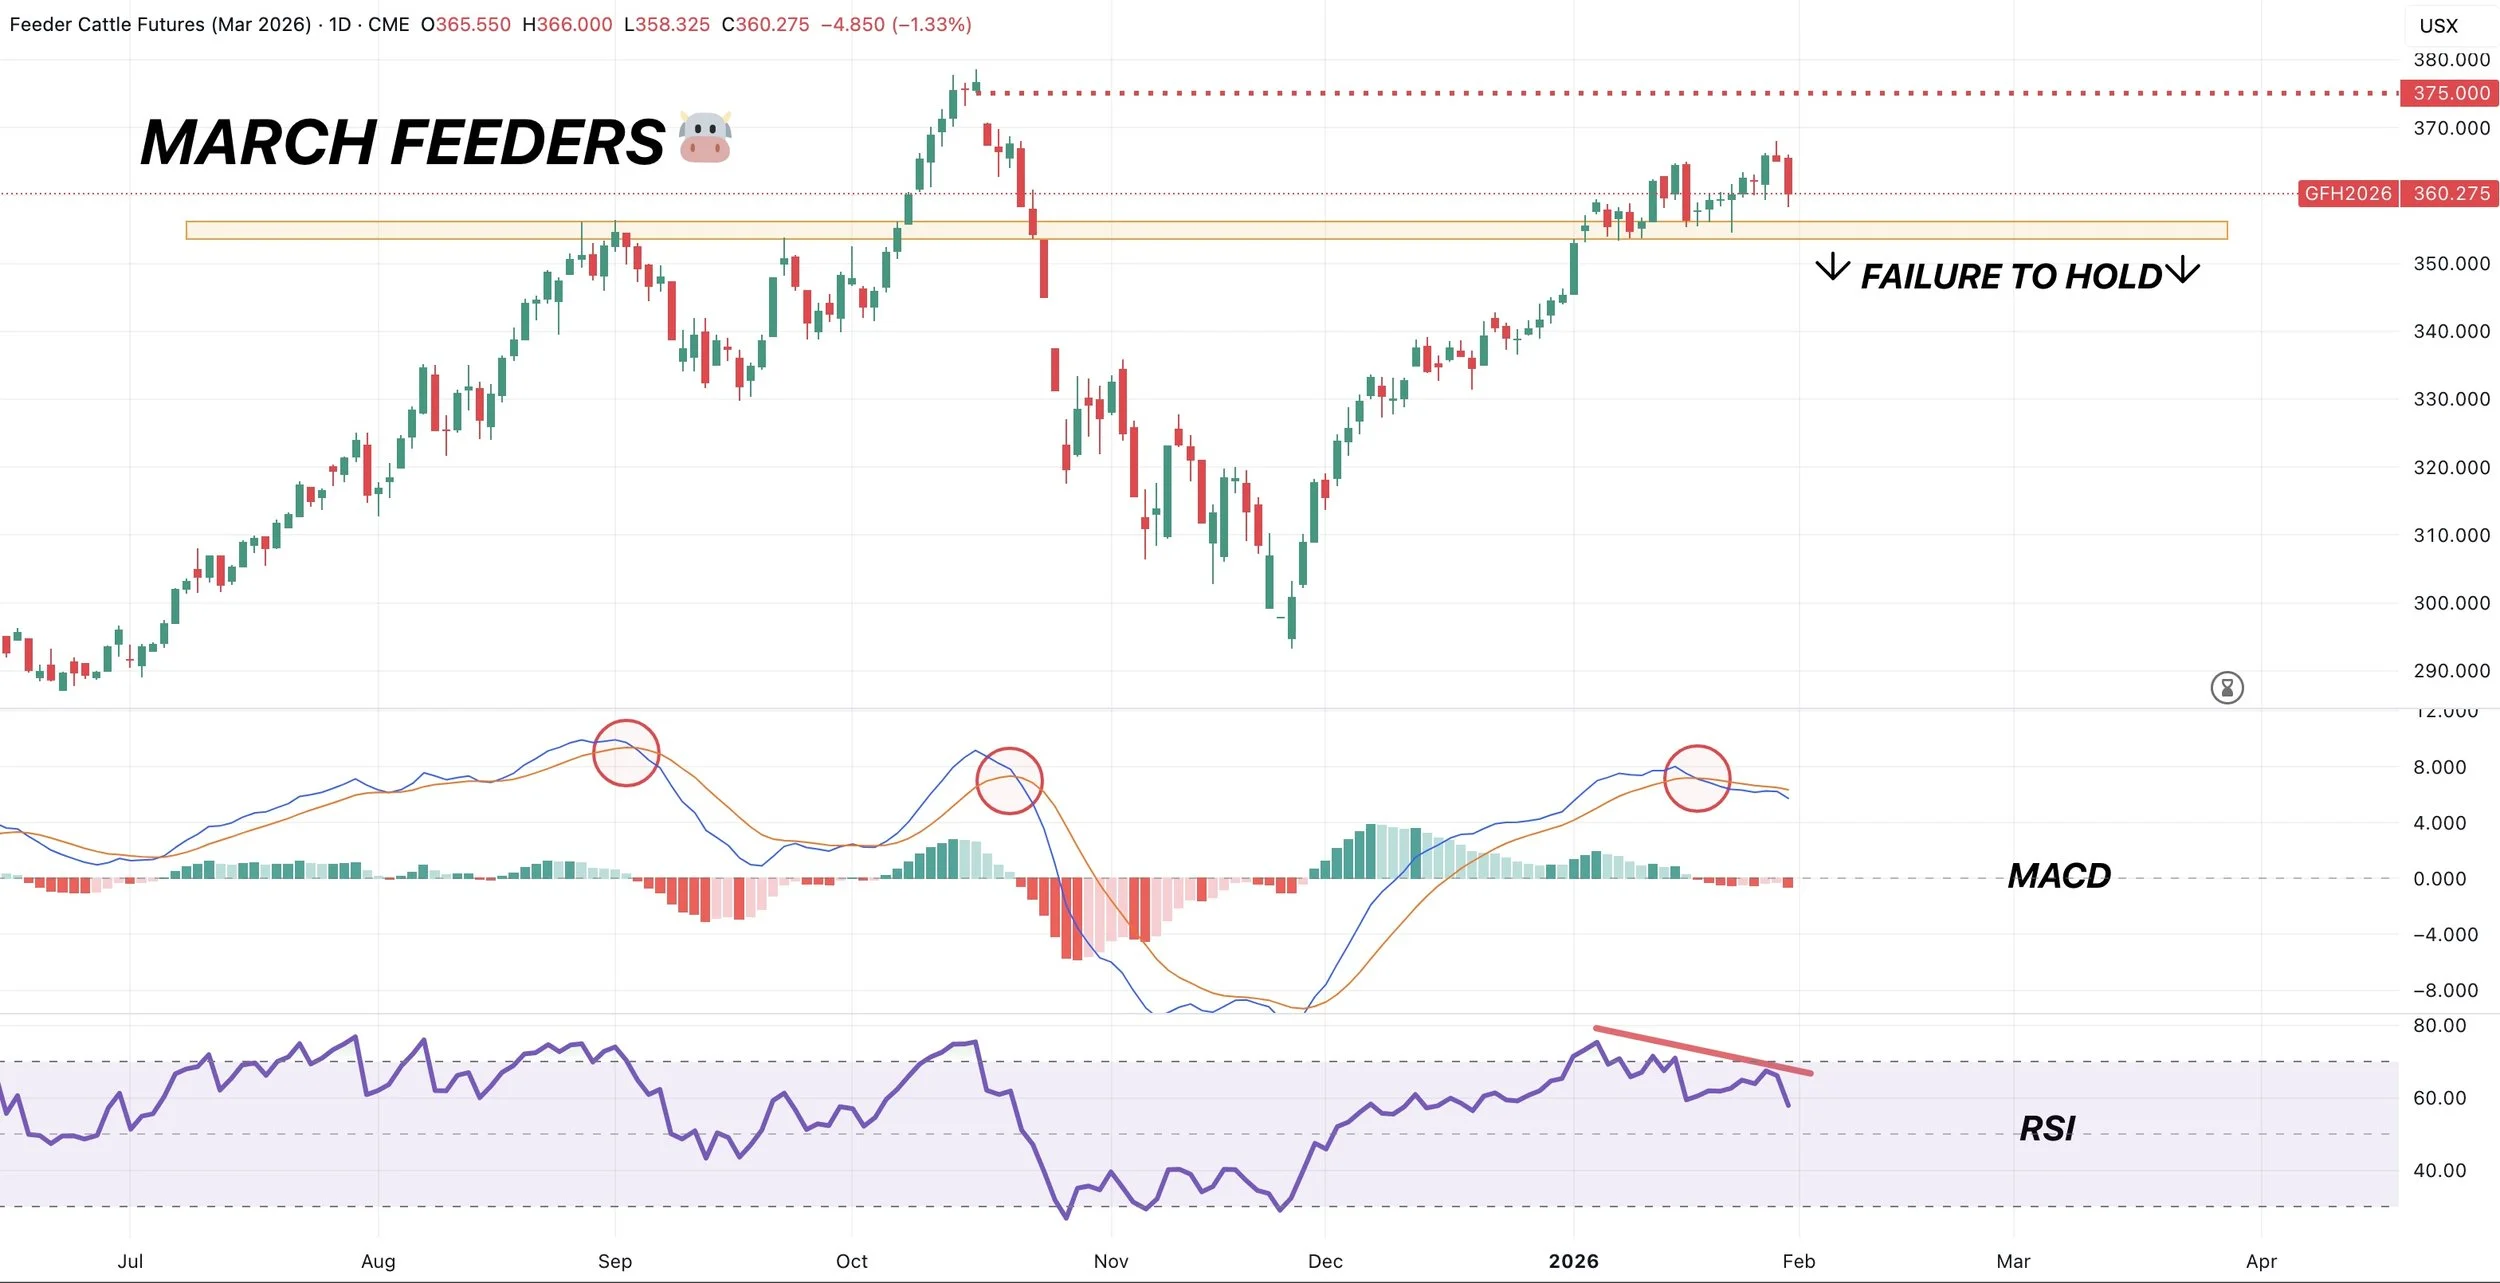
As I've been talking about since last week, this market is showing some reasons to be cautious.
We have confirmed bearish divergence.
The MACD flipped bearish for the first time since those highs. Both hinting at weak upside momentum.
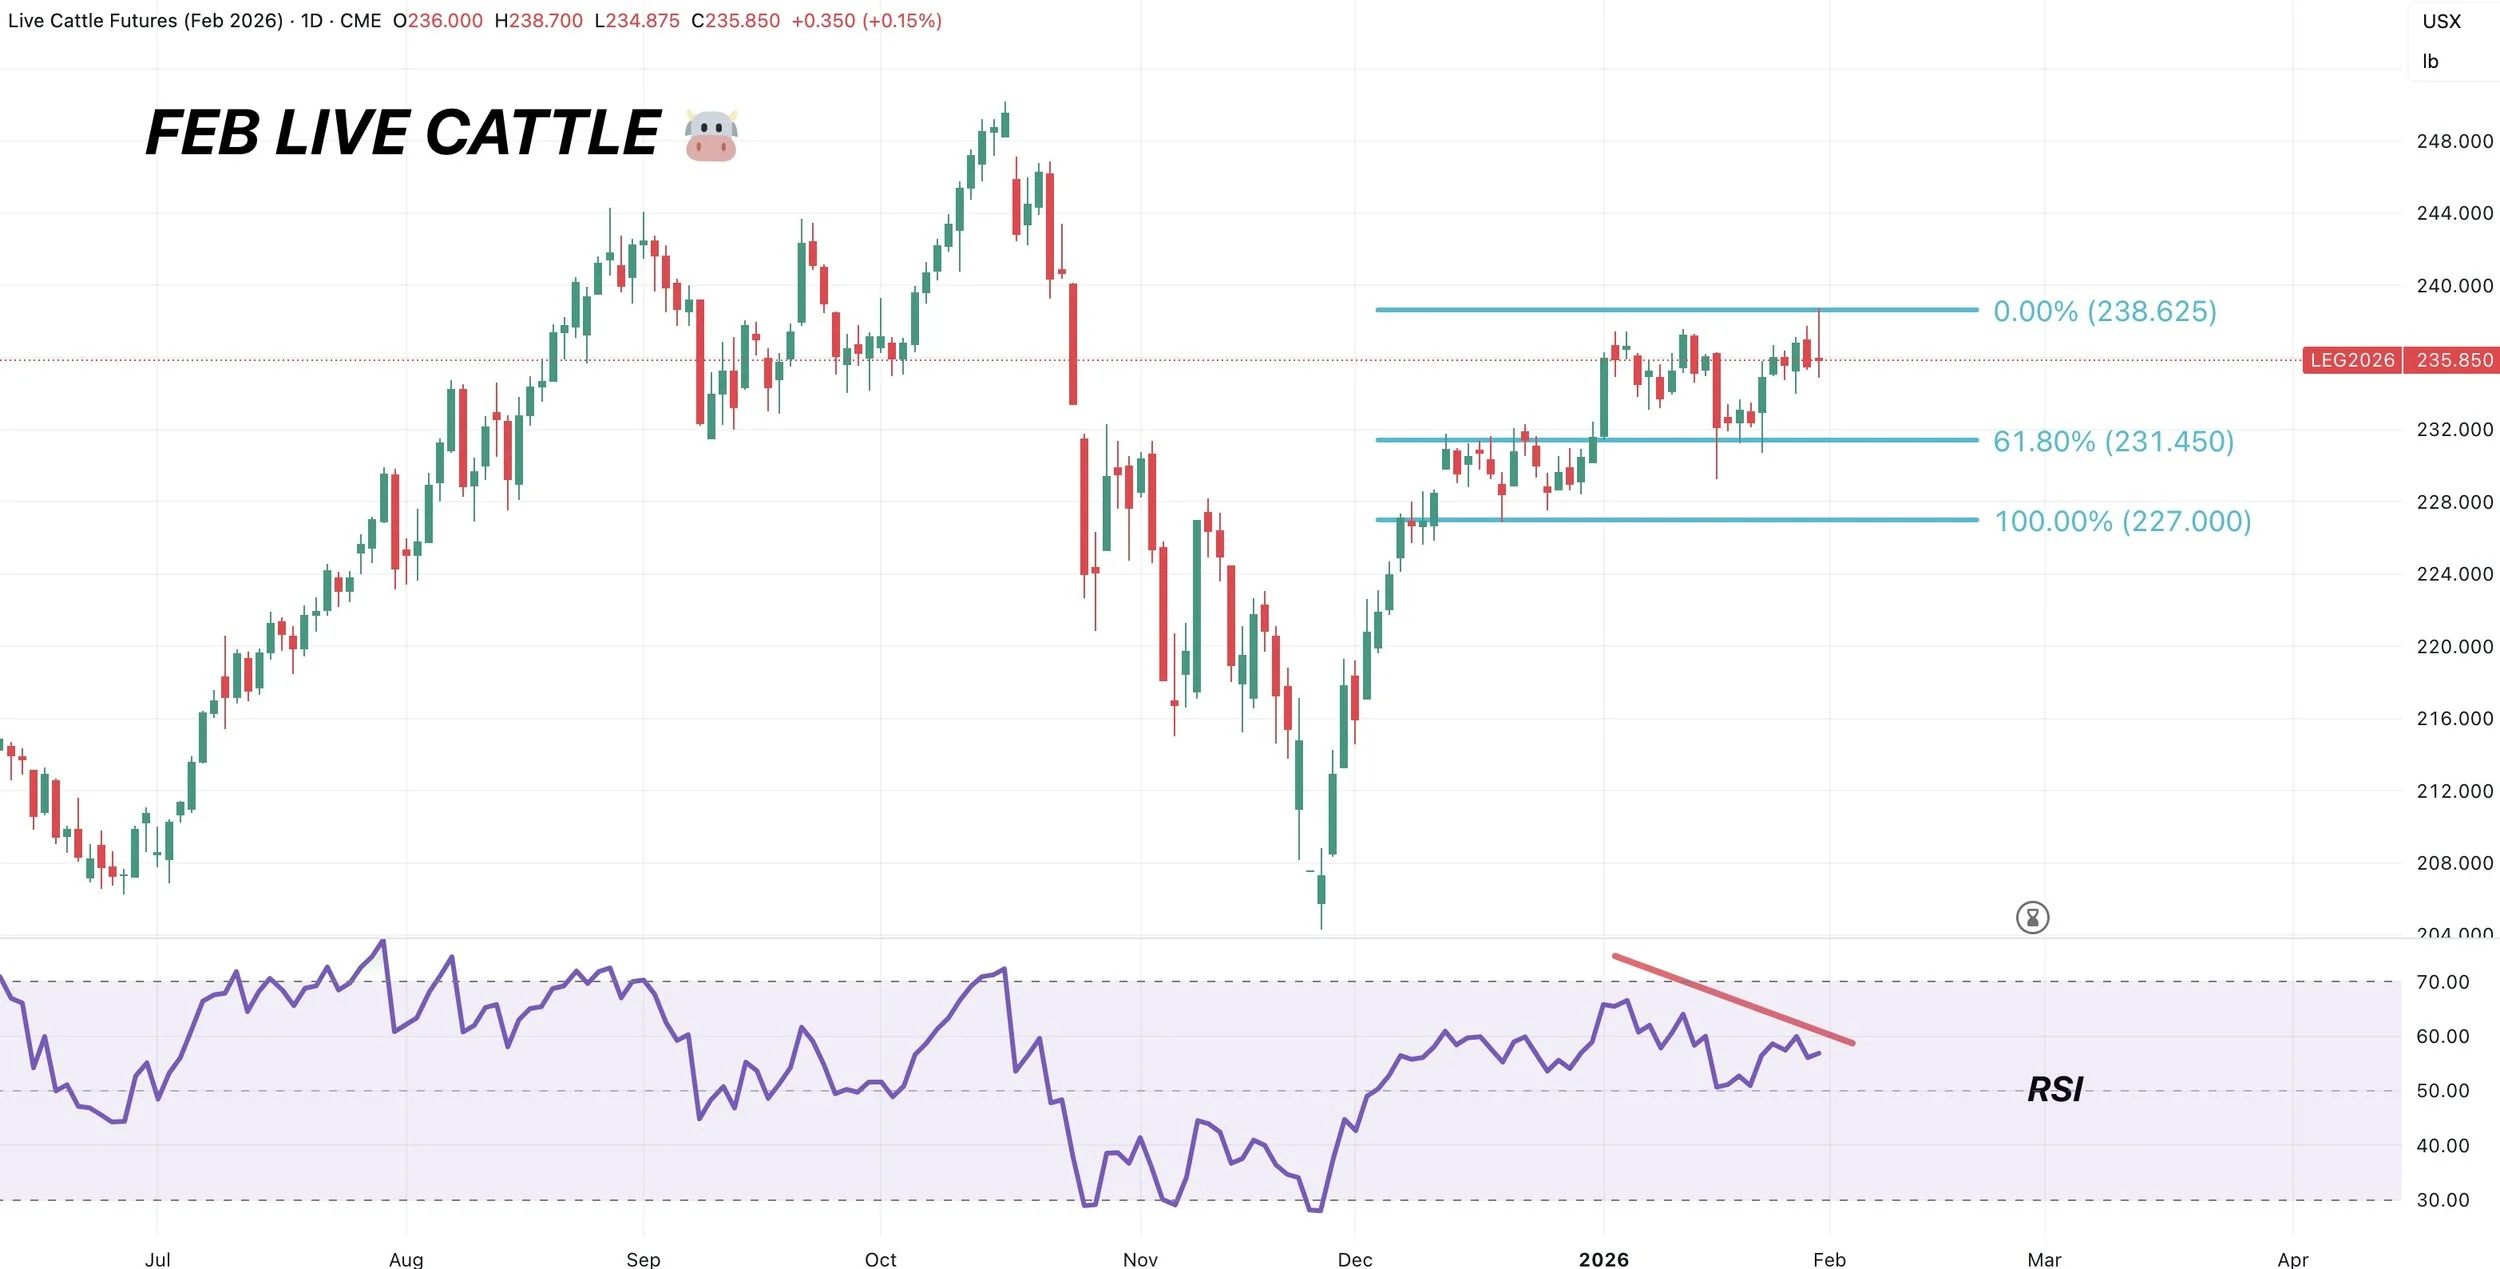
Feb Live
The level to hold is the golden fib at $231.45
We are still showing clear bearish divergence which is a reason for caution.
Past Sell or Protection Signals
Dec 11th: 🐮
Cattle sell signal & hedge alert.
Dec 5th: 🐮
Cattle sell signal & hedge alert.
Nov 17th: 🌱
Soybean sell signal & hedge alert.
Nov 13th: 🌽 🌱
Managing risk in corn & beans ahead of USDA report.
Oct 28th: 🌽
Corn sell signal & hedge alert.
Oct 27th: 🌱
Soybean sell signal & hedge alert.
Oct 13th: 🐮
Cattle sell signal & hedge alert.
Aug 22nd: 🌱
Soybean sell signal & hedge alert.
July 31st: 🐮
Cattle sell signal & hedge alert.
July 10th: 🐮
Cattle sell signal & hedge alert.
CLICK HERE TO VIEW
June 5th: 🐮
Cattle sell signal & hedge alert.
June 2nd: 🌾
MPLS wheat sell signal.
April 10th: 🌽
Old crop corn sell signal.
March 19th: 🐮
Cattle hedge & sell signal.
Feb 18th: 🌽 🌾
Old crop KC wheat & old crop corn signal.
Jan 23rd: 🌽 🌱
Corn & beans old crop sell signal.
CLICK HERE TO VIEW
Jan 15th: 🌽 🌱
Corn & beans hedge alert/sell signal.
Jan 2nd: 🐮
Cattle hedge alert at new all-time highs & target.
Dec 11th: 🌽
Corn sell signal at $4.51 200-day MA
CLICK HERE TO VIEW
Oct 2nd: 🌾
Wheat sell signal at $6.12 target
Sep 30th: 🌽
Corn protection signal at $4.23-26
Sep 27th: 🌱
Soybean sell & protection signal at $10.65
Sep 13th: 🌾
Wheat sell signal at $5.98
May 22nd: 🌾
Wheat sell signal when wheat traded +$7.00
Want to Talk?
Our phones are open 24/7 for you guys if you ever need anything or want to discuss your operation.
Hedge Account
Interested in a hedge account? Use the link below to set up an account or shoot Jeremey a call at (605)295-3100.