
USDA OUTLOOK TOMORROW
MARKET UPDATE
You can scroll to read the usual update as well. As the written version is the exact same as the video.
Timestamps for video:
Overview: 0:00min
Corn: 4:50min
Beans: 7:45min
Wheat: 11:40min
Cattle: 14:25min
Want to talk about your situation?
(605)250-3863
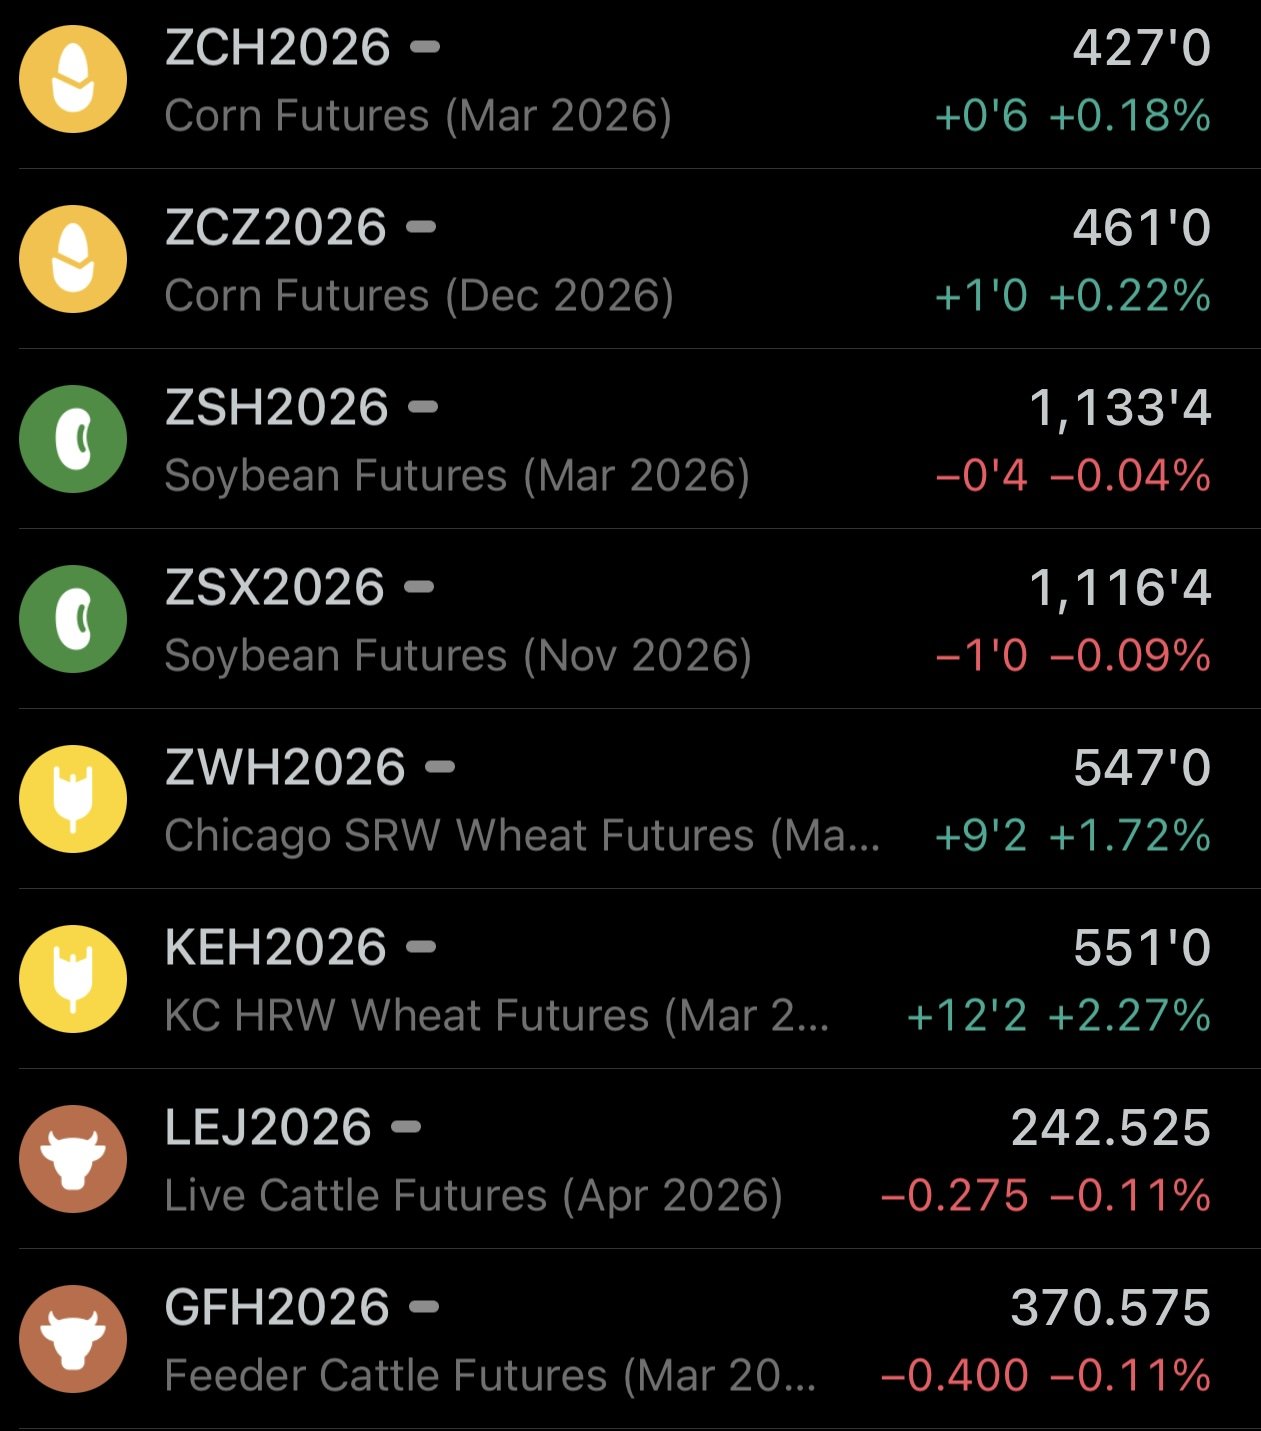
Futures Prices Close
Overview
Impressive day for the wheat market as it led the way higher. Erasing the last two days of losses and closing near the recent highs.
The soybean market was hot overnight posting new highs, but faded well off the early highs.
Meanwhile the corn market traded both sides of the board ending fractionally higher.
News was on the light side for the grains.
All eyes are on tomorrow’s USDA Ag Outlook numbers.
USDA Ag Outlook Preview
I believe the numbers will be released at 6:00am CT tomorrow morning.
We will be receiving the original acre outlook along with the USDA's starting yield they will be using on the new crop balance sheets.
Here are all of the estimates for the report.
Corn:
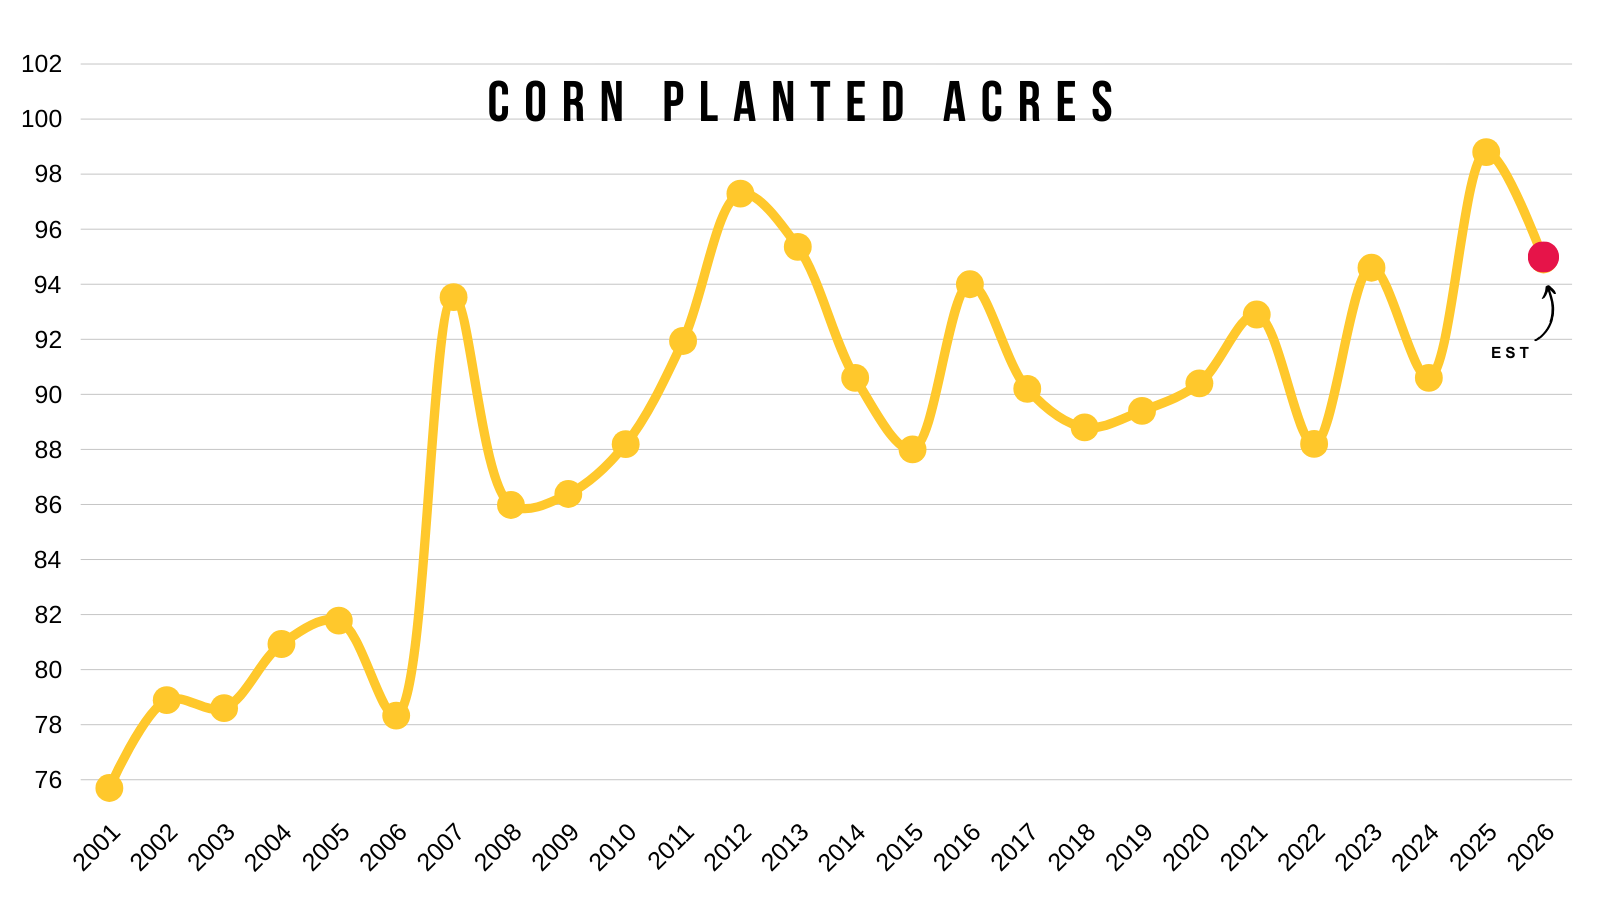
Planted acres estimate is 94.9 million. Down about -4 million from last year's 98.8 million.
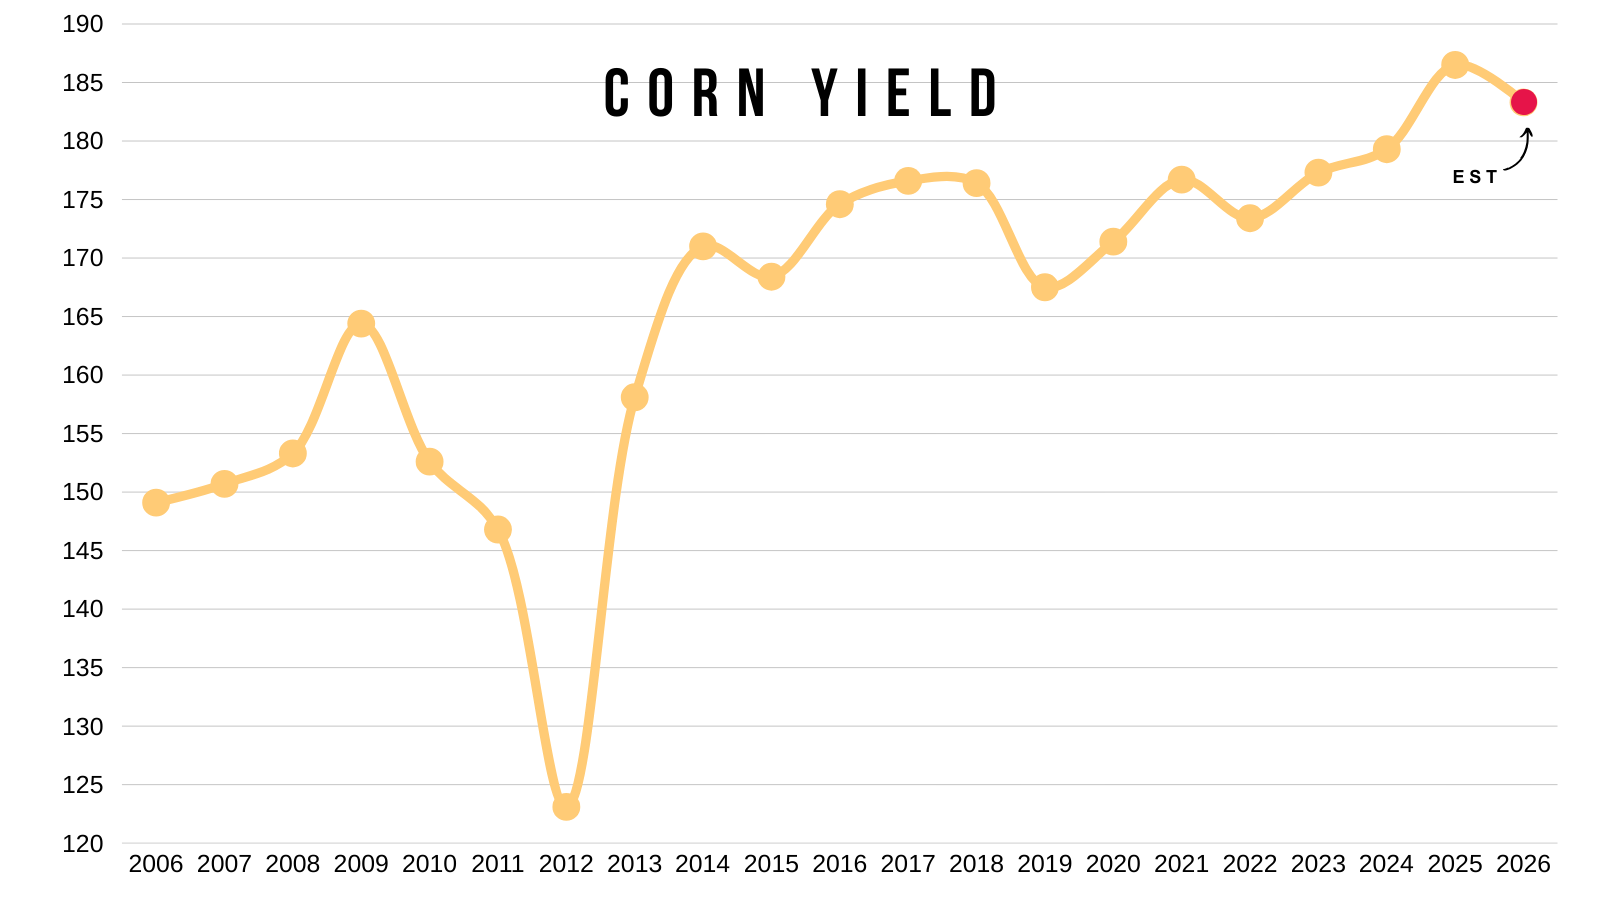
Yield is estimated at 183.3 bpa. Down from last year's 186.5 bpa.
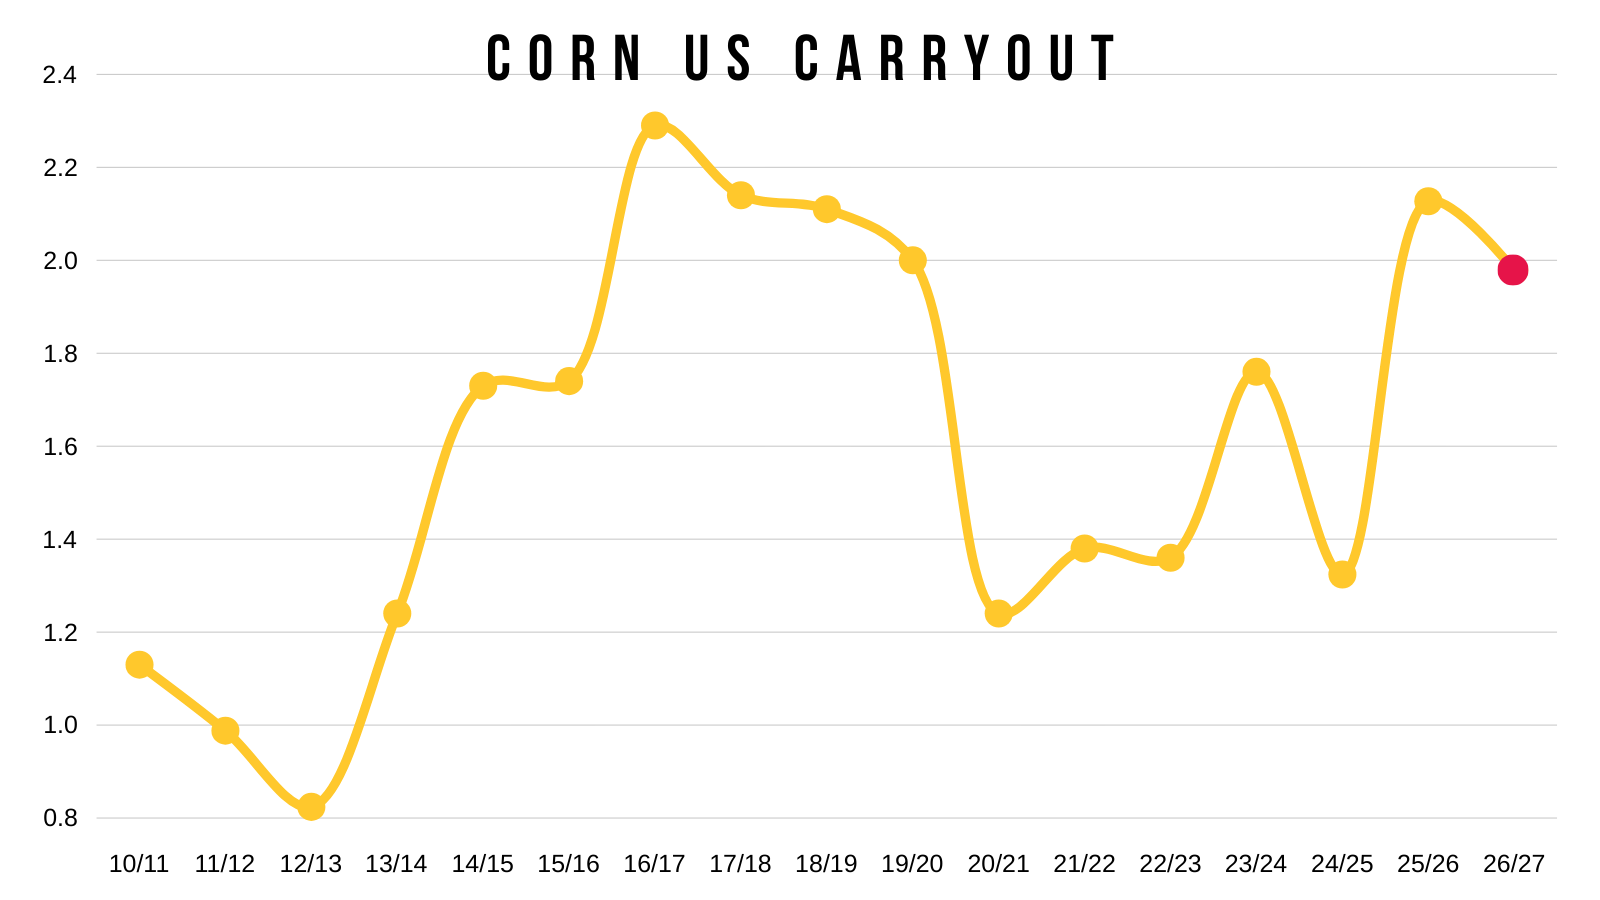
Carryout is estimated at 1.98 billion bushels. Down around -150 million bushels from the current old crop balance sheet (2.13 billion).

Corn Visuals:
Here are what the estimates look like compared to other years.
First for yield.
Would of course be the 2nd largest on record only behind last year.
But a sizeable drop.
Here is carryout.
It would still be a rather large carryout.
Still sitting near 2 billion.
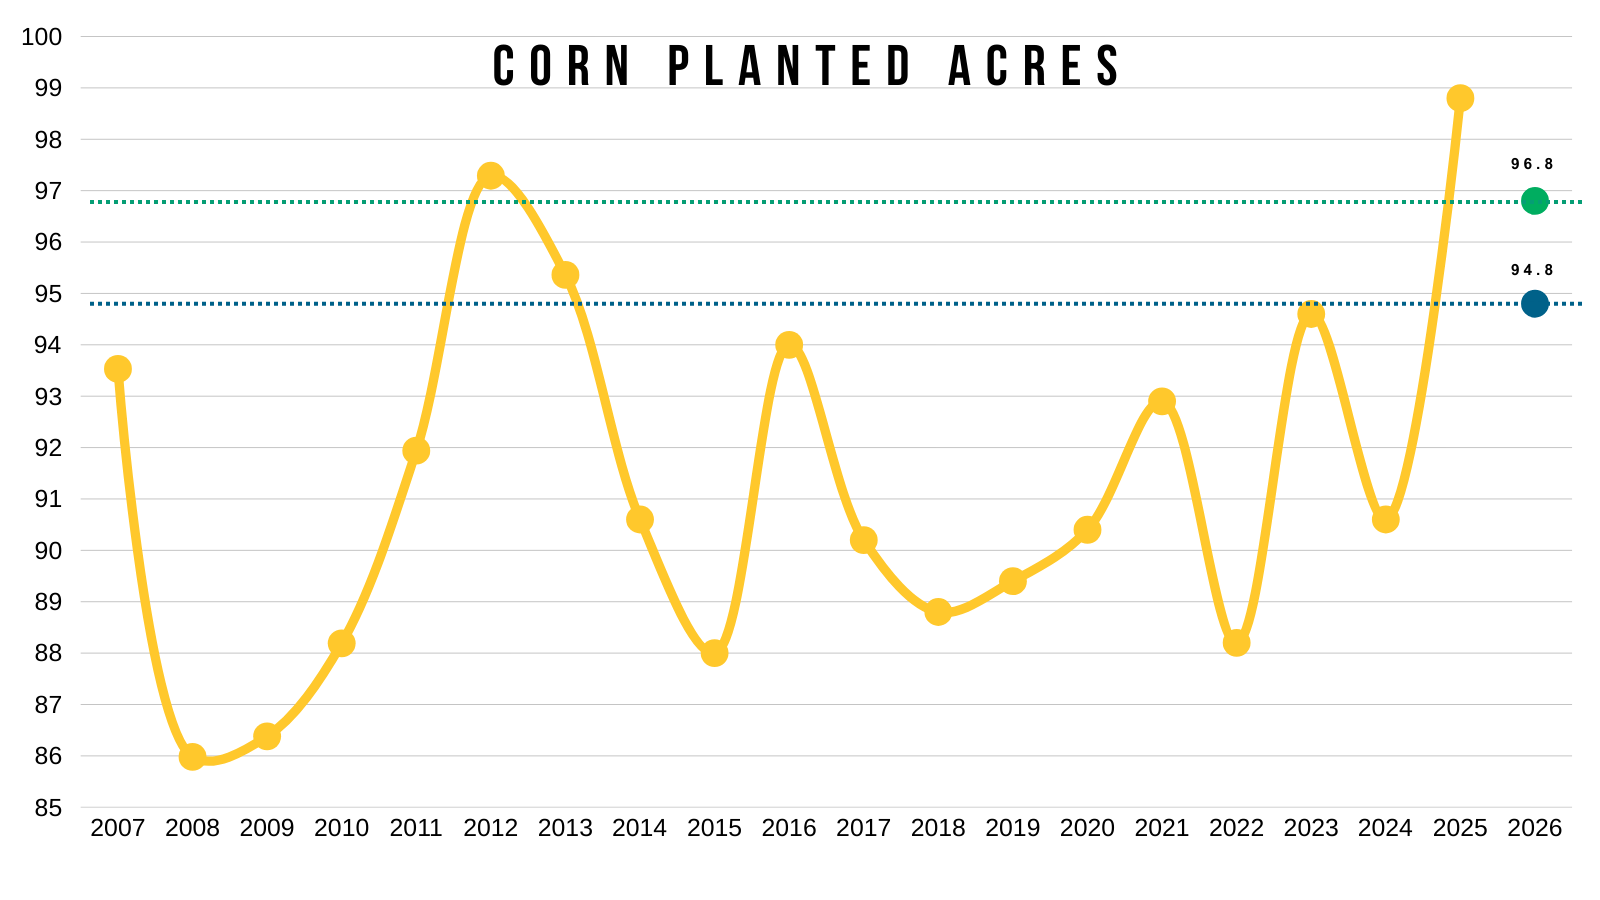
Here is the acres.
Pretty sizeable drop from last year, but it's still a lot of acres.
Soybeans:
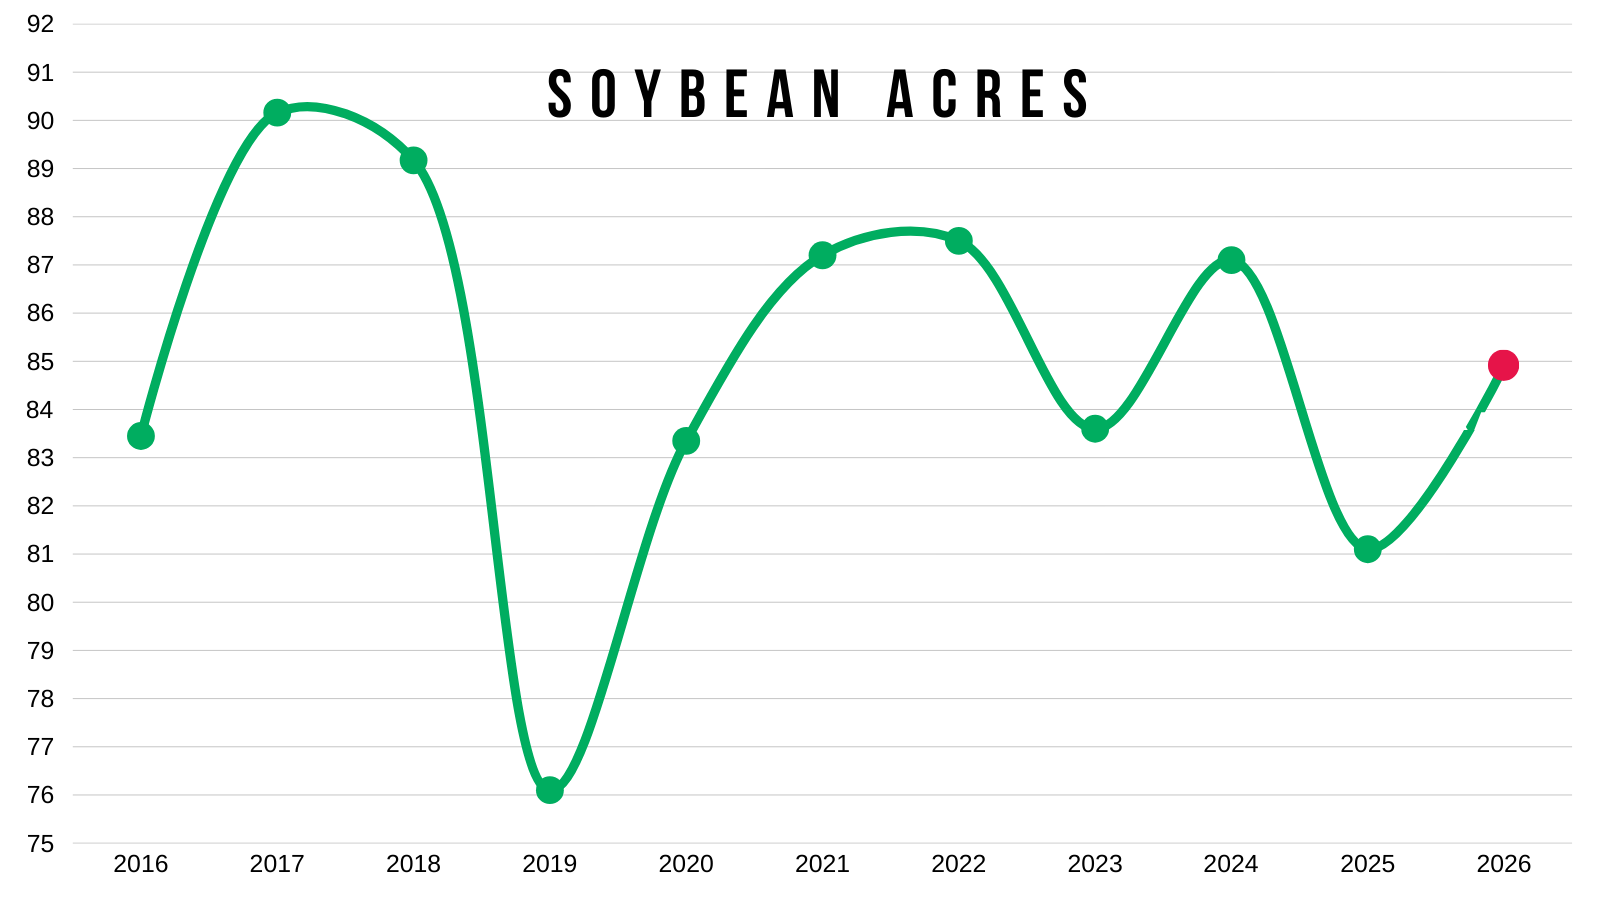
Planted acres estimate is at 84.9 million. Up 3.7 million from last year's 81.2 million.
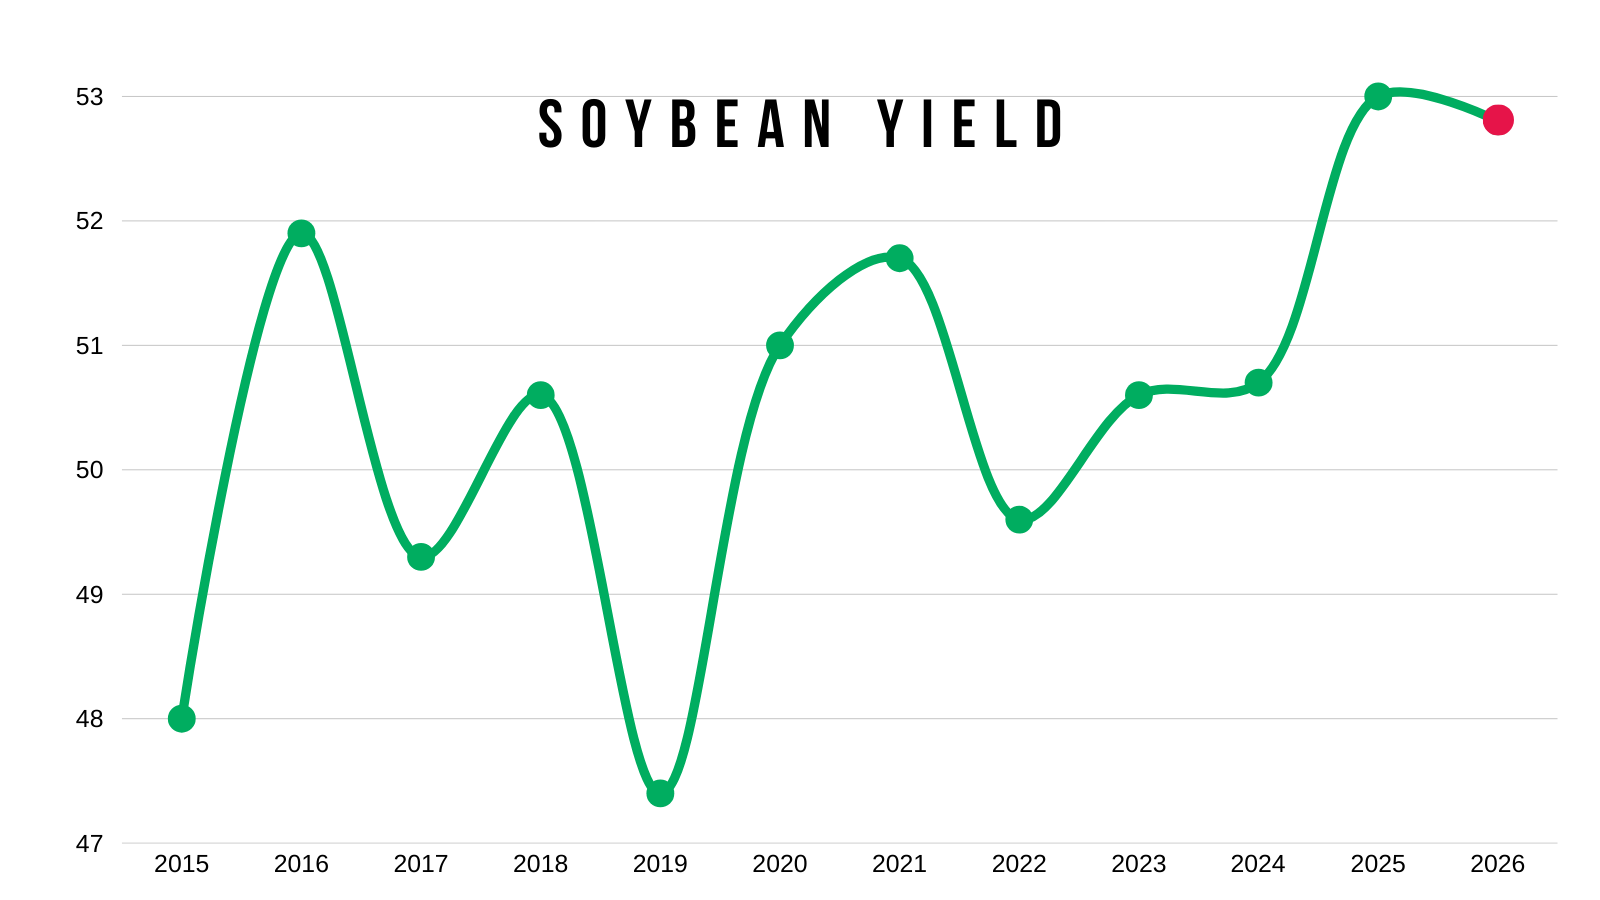
Yield is estimated at 52.8 bpa. Down from last year's 53 bpa.
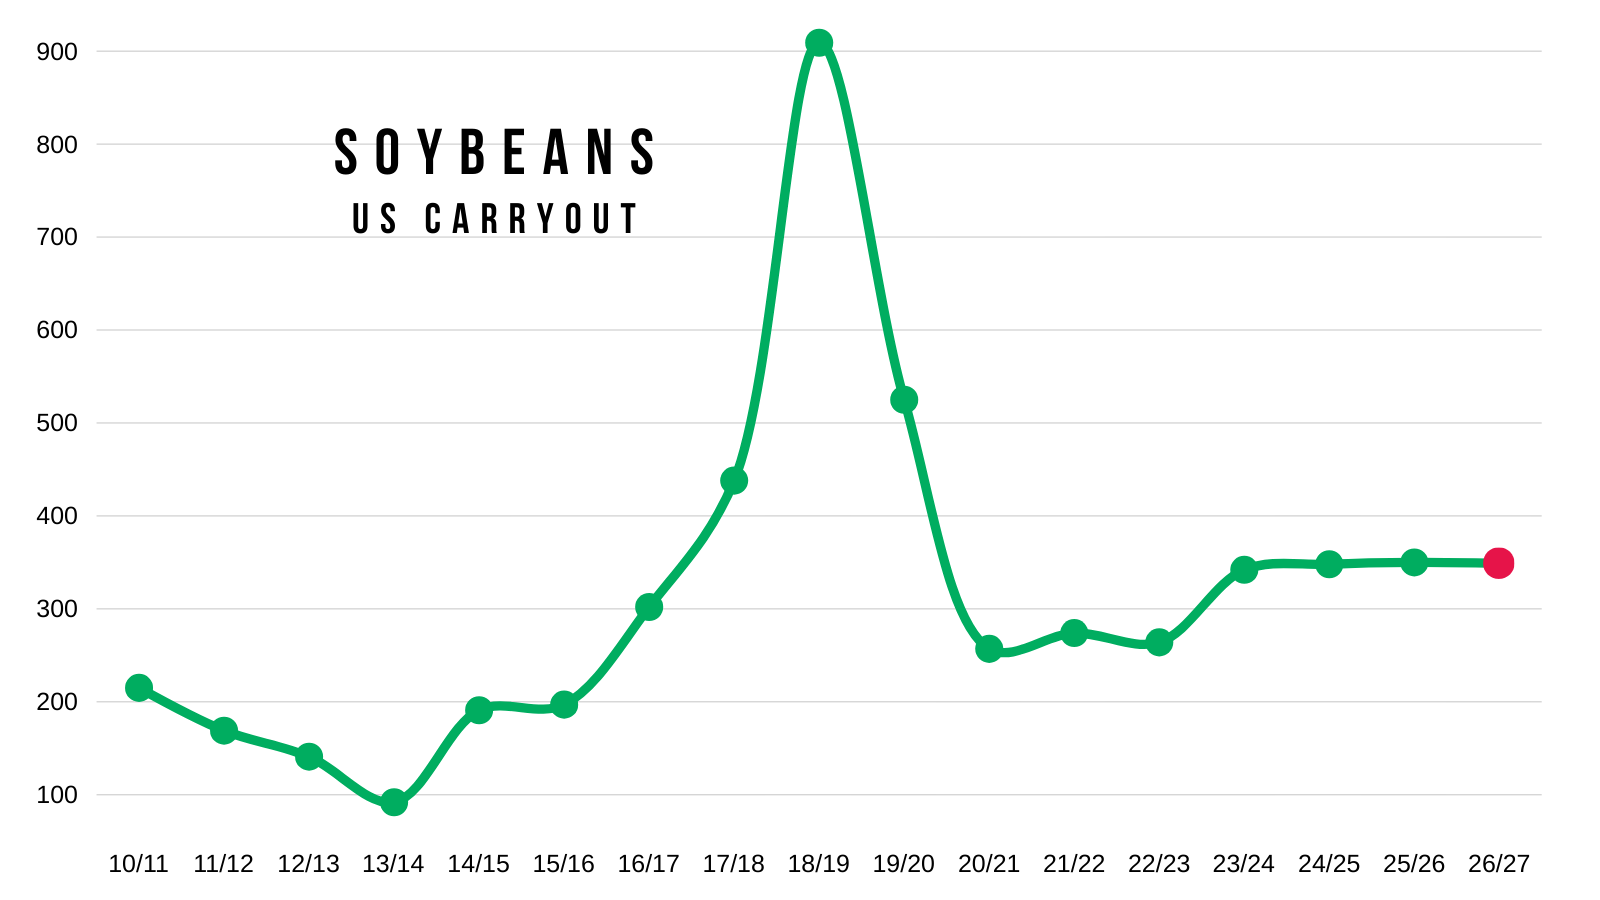
Carryout is expected to remain the same as old crop. Right around 350 million bushels.

Soybean Visuals:
Here is the yield.
Just shy of last year's record.
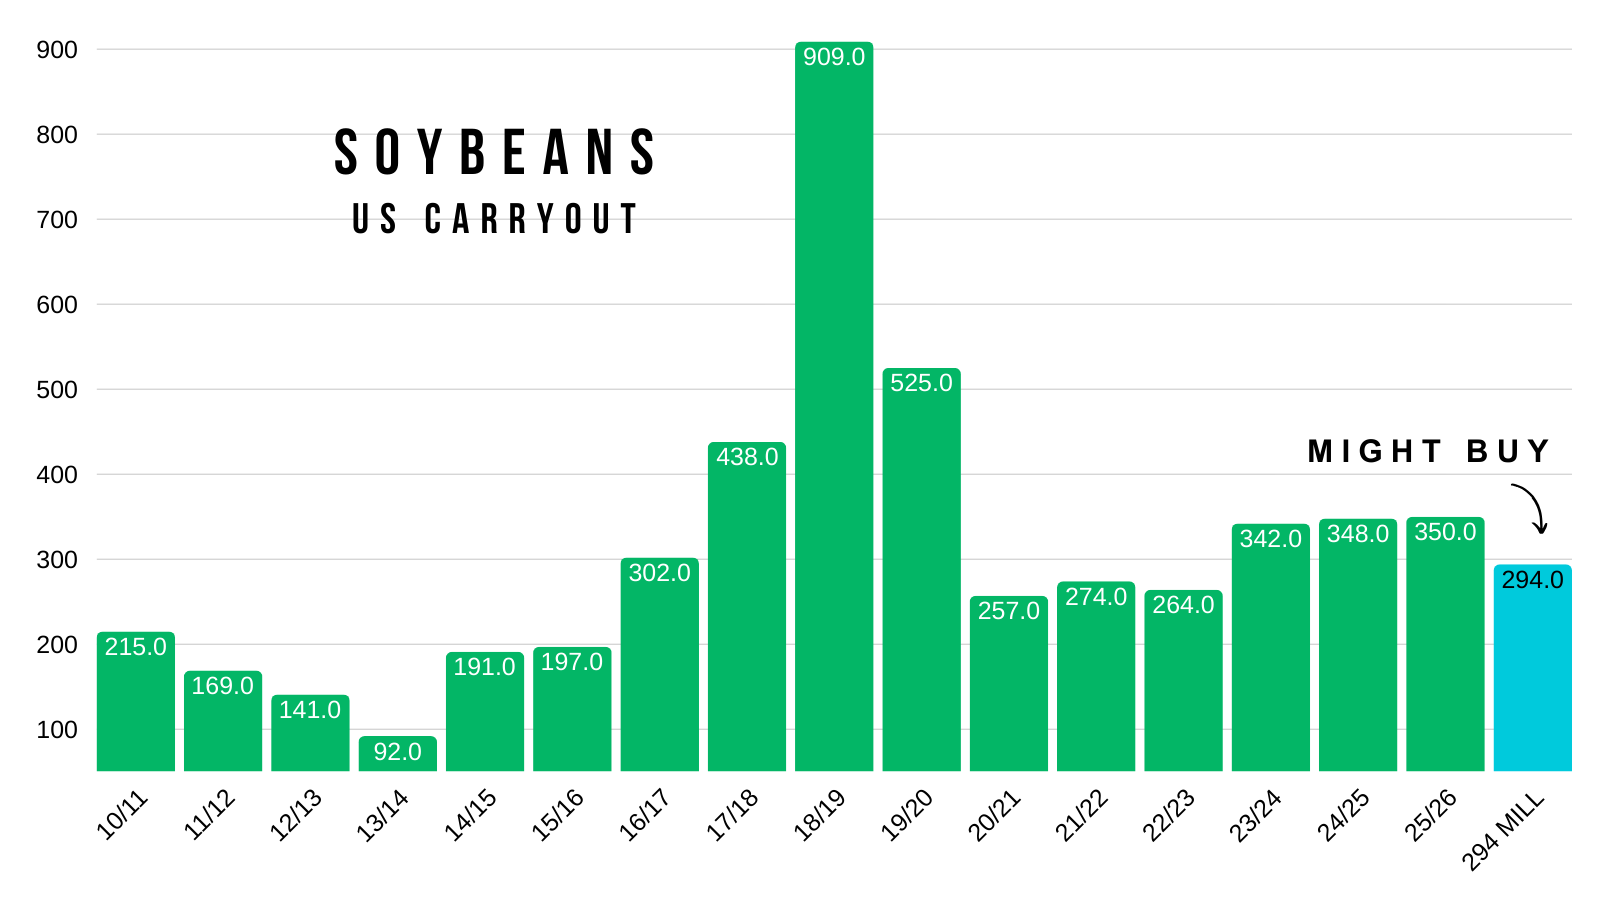
Here is carryout.
It's projected to be flat for the 4th year in a row.
Here is acres.
An uptick from last year, but still below 2024.
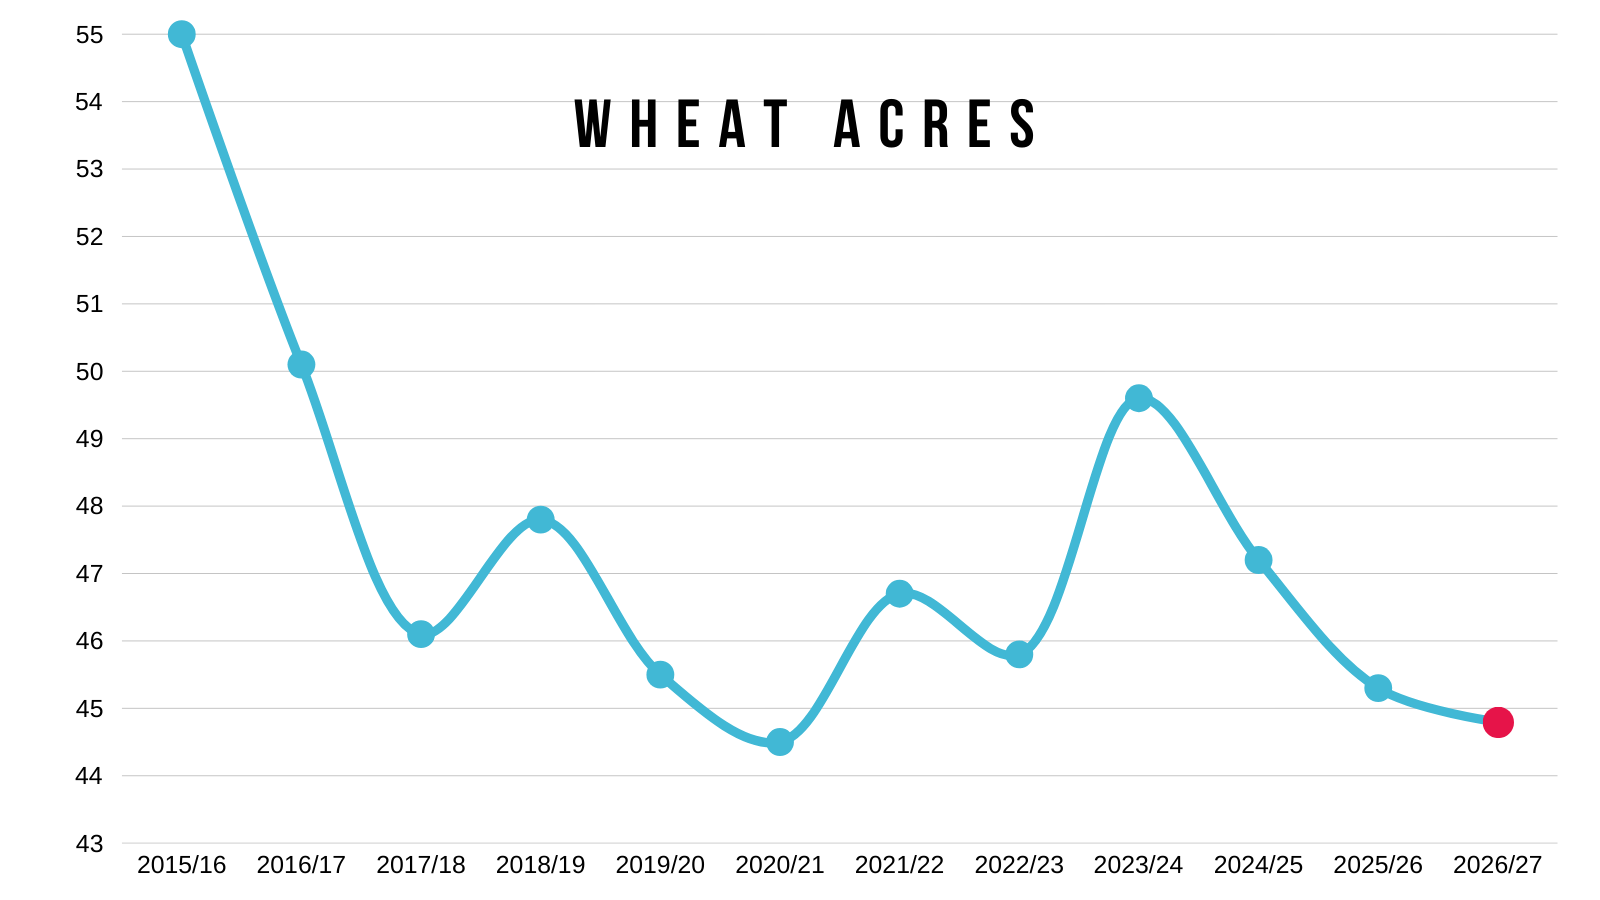
Wheat:
Planted acres are expected to drop 0.5 million from last year.
Yield is expected to drop -1.4 bpa.
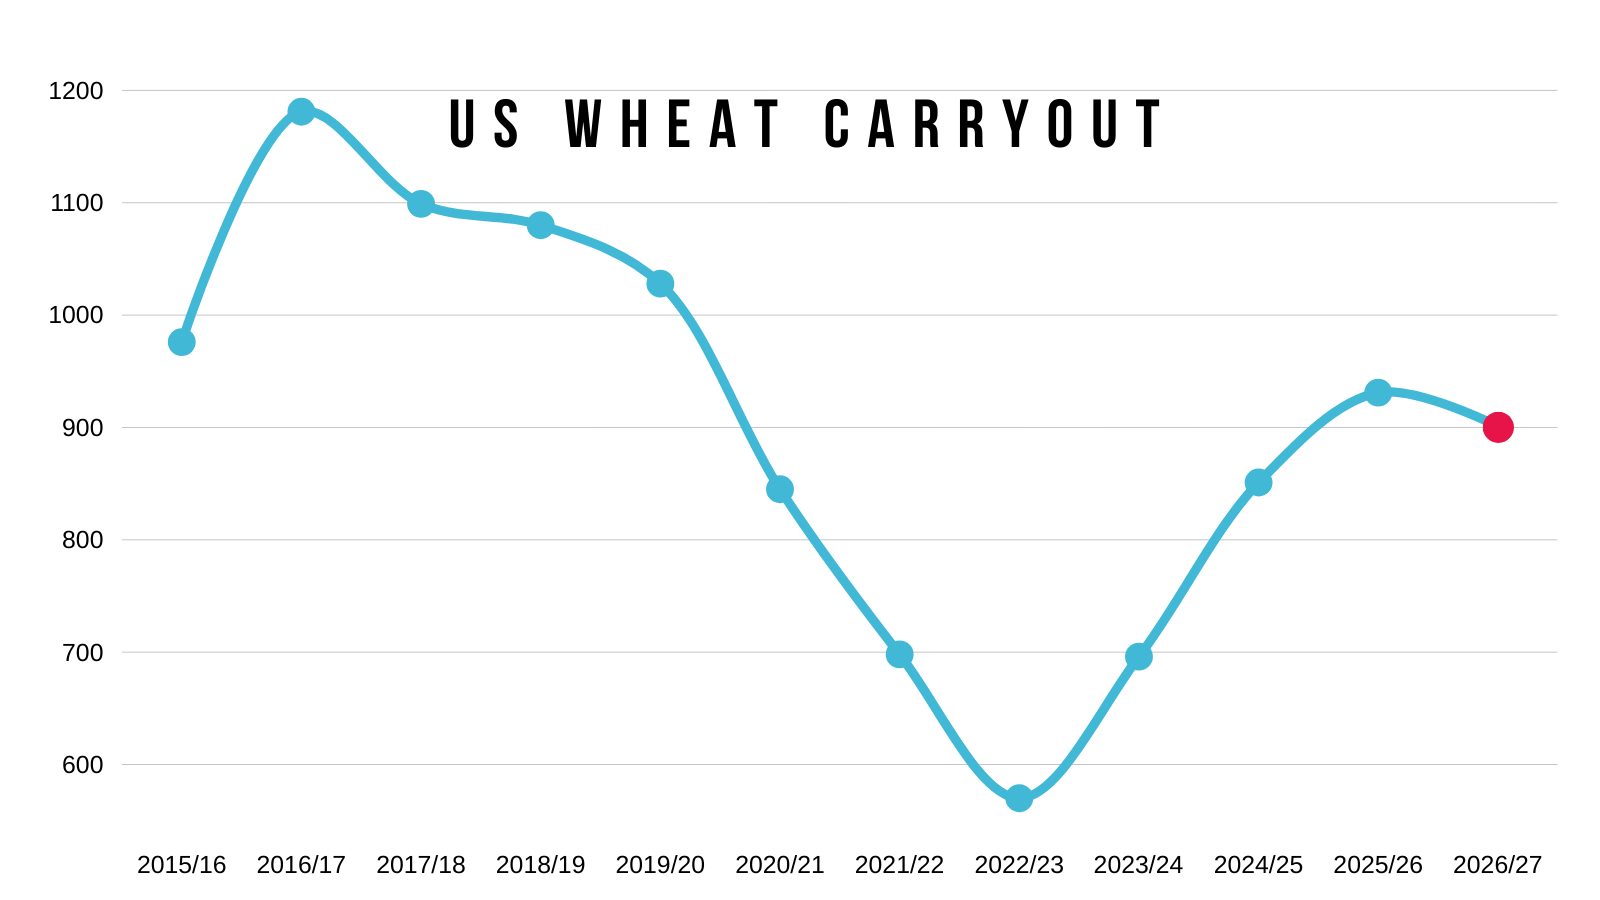
Carryout is expected to be down slightly vs last year by just -30 million bushels.

Wheat Visuals:
Here is the carryout projection.
Down from last year, but still one of the highest in recent years.
Here are the acres.
The estimate would be on the low range for the last decade.
Acre Debate
Here is the updated new crop soybean to corn ratio.
It's sitting at 2.43 today. Posting a new high but still isn’t "heavily" favoring a massive amount of corn switching to beans.
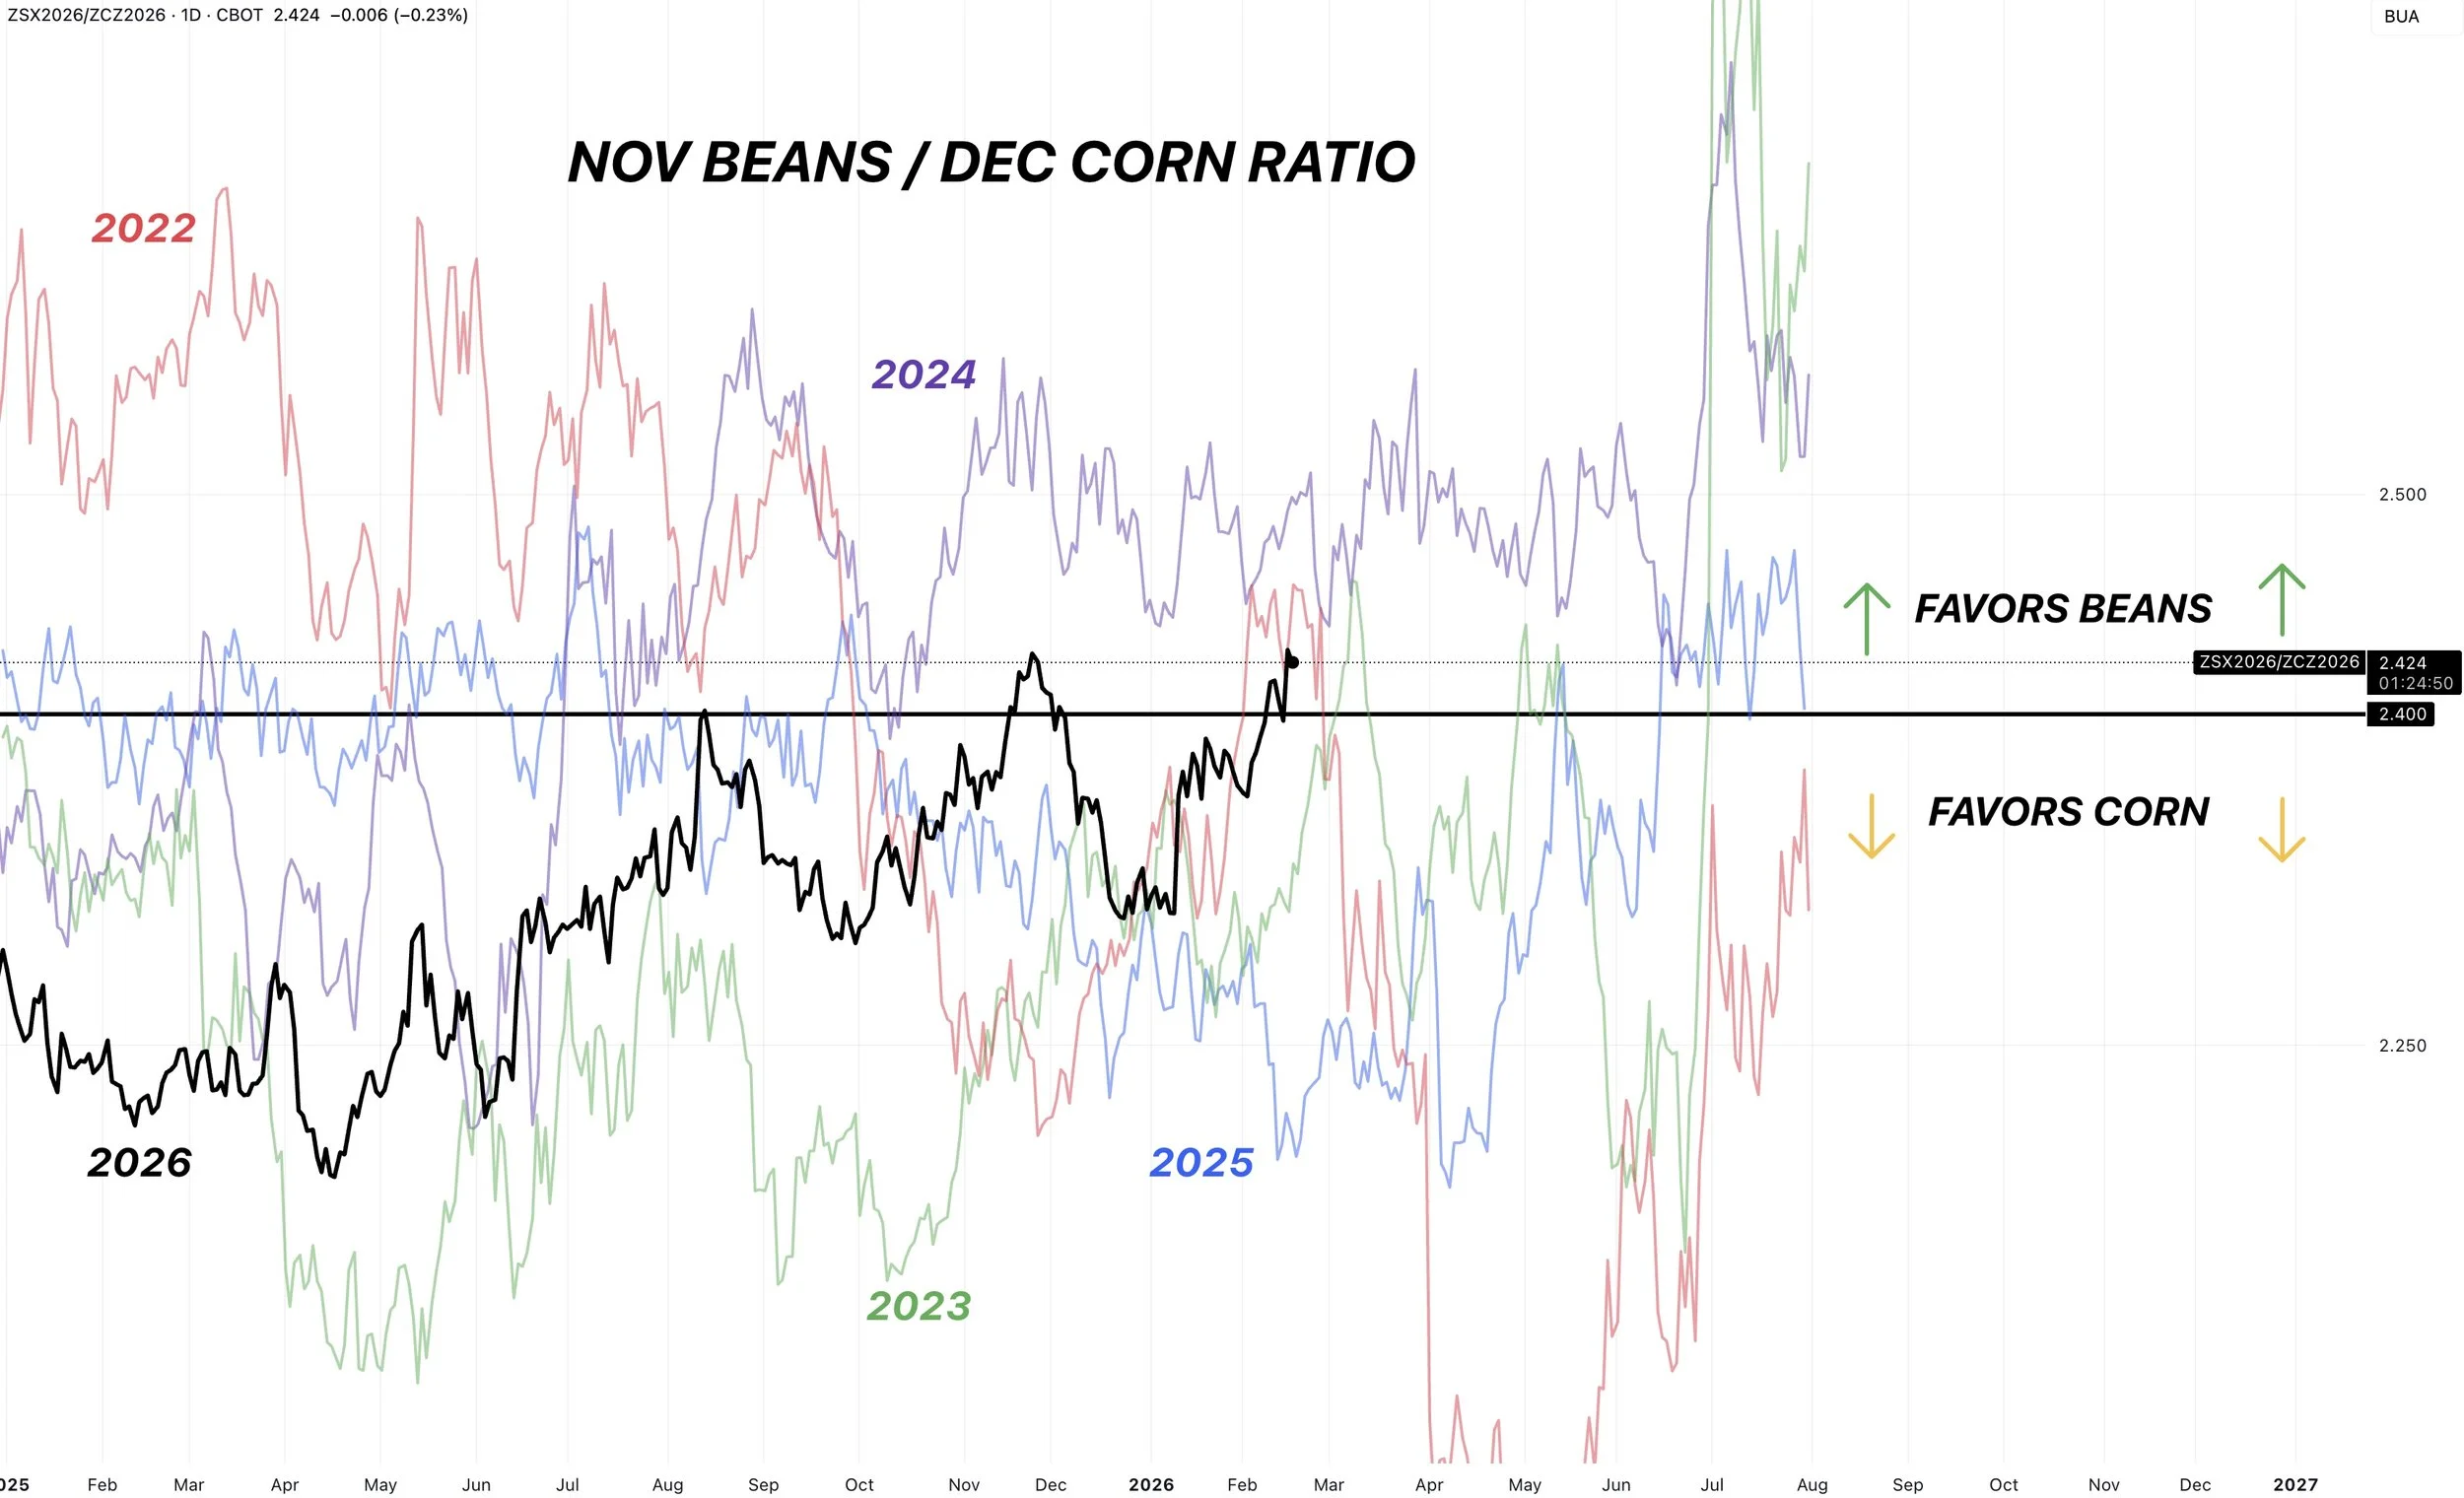
The recent jump in beans should prevent us from seeing 98 to 99 million acres of corn like last year.
Given that last year was a record amount of corn acres, we should naturally see somewhat of a shift.
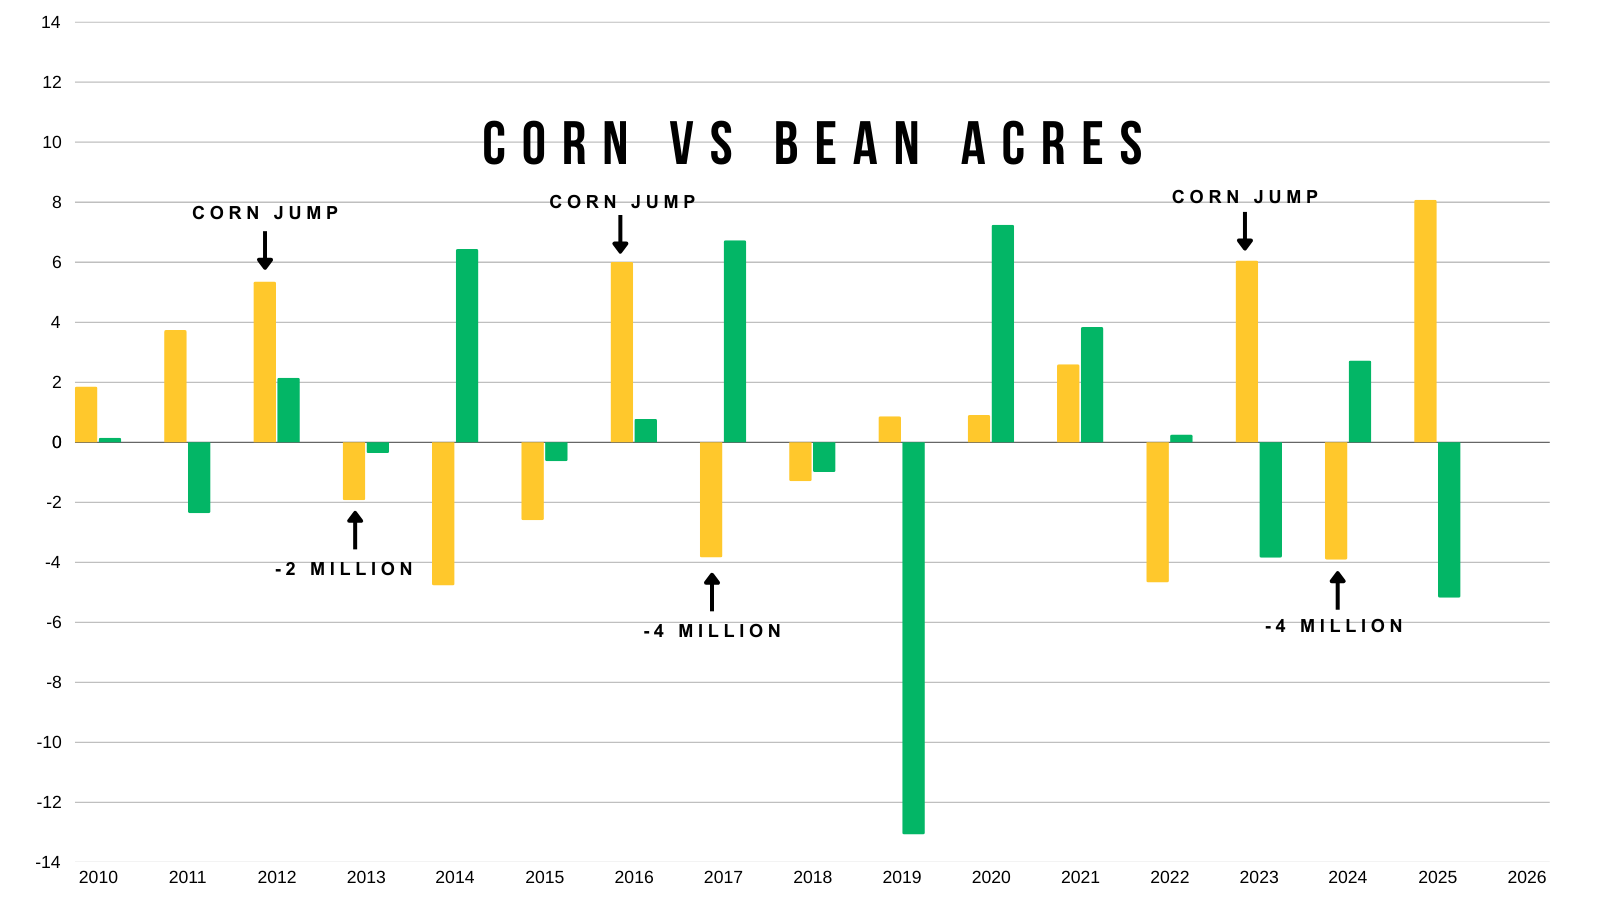
How many corn acres could we expect?
This next chart simply shows the year over year acre changes.
Anytime we've seen a big jump in corn acres like we did last year, we tend to naturally see anywhere from 2 to 4 million less acres the following year.
2023 we saw a big jump in corn acres. In 2024 we dropped -3.90 million.
2016 we saw a big jump in corn acres. In 2017 we dropped -3.85 million.
2012 we saw a big jump in corn acres. In 2013 we dropped -1.95 million.
Last year we planted 98.8 million.
A 2 to 4 million drop would put us between 94.8 to 96.8 million.
Here is what 94.8 to 96.8 million looks like compared to history.
The issue is that it is still a lot of corn acres.
Both would be some of the larger corn acres we've seen.
Today's Main Takeaways
Corn
Fundamentals:
Not much else on corn today.
As I've been pointing out for a while, seasonally this is one those weaker time frames of the year as we head into first notice day.
We saw pressure each of the last 3 years going into it.
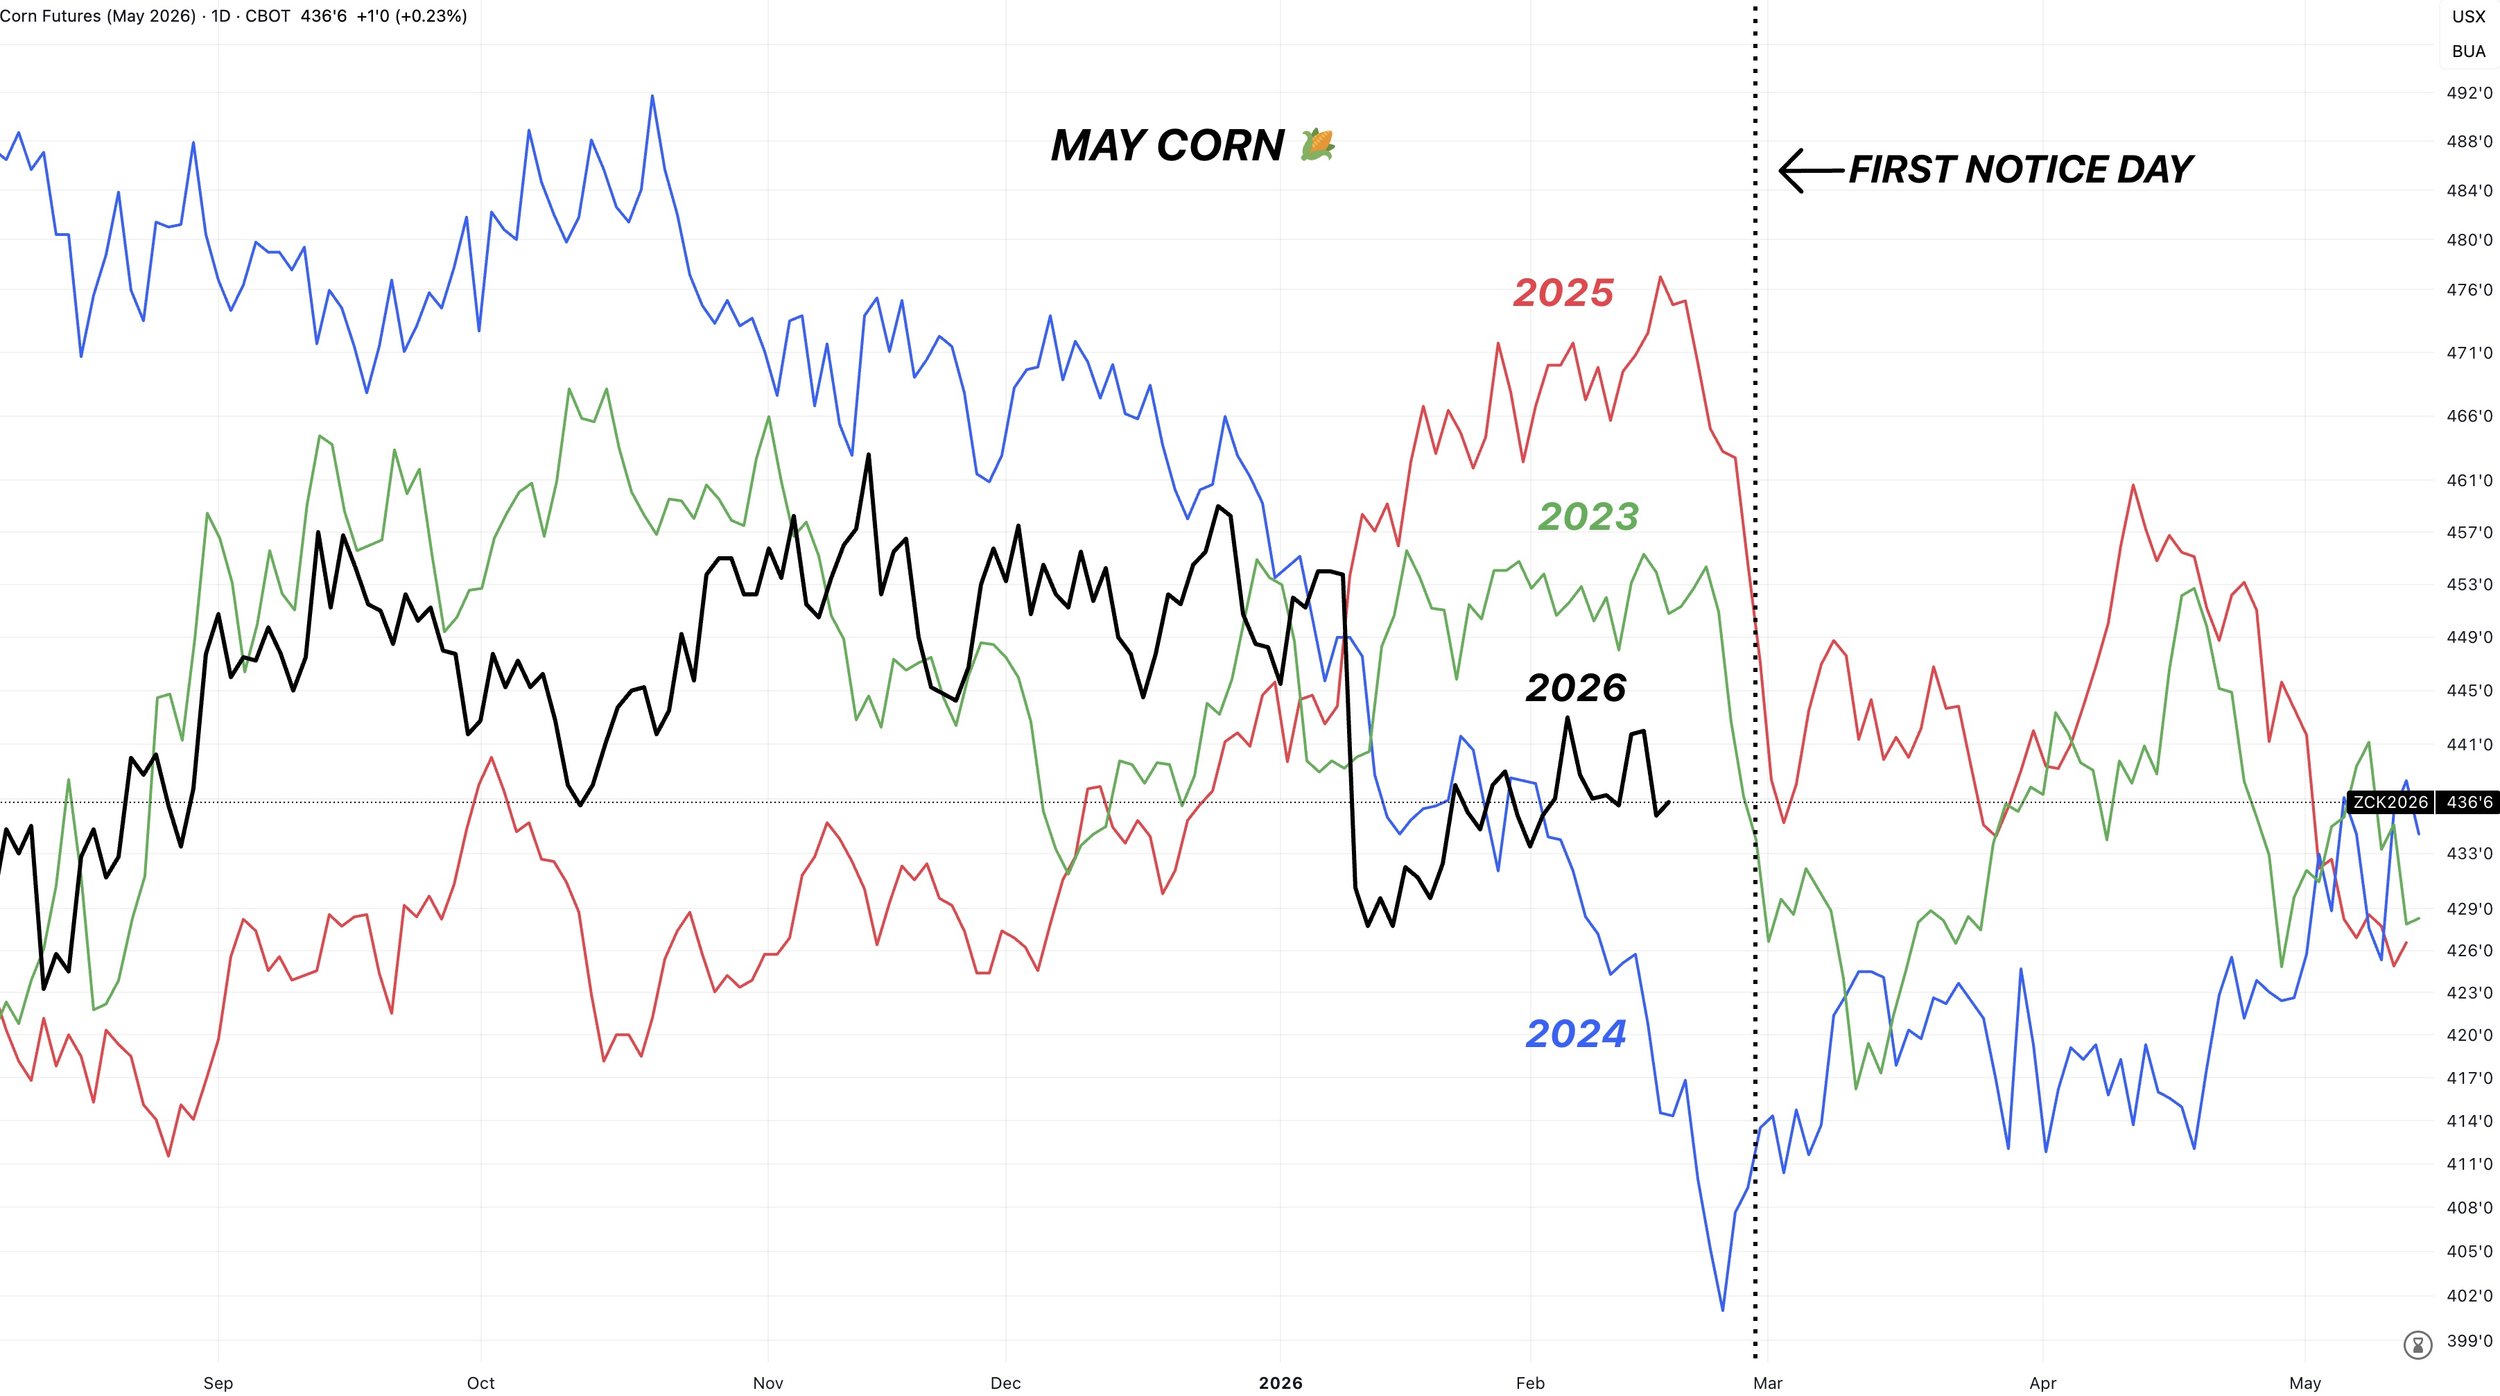
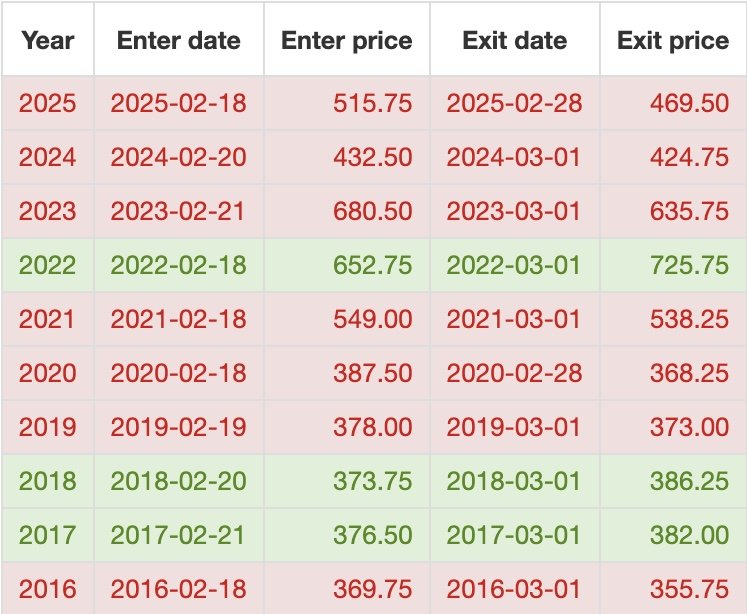
If you take the data from today, until March 1st.
May corn has traded lower the last 7 of 10 years.
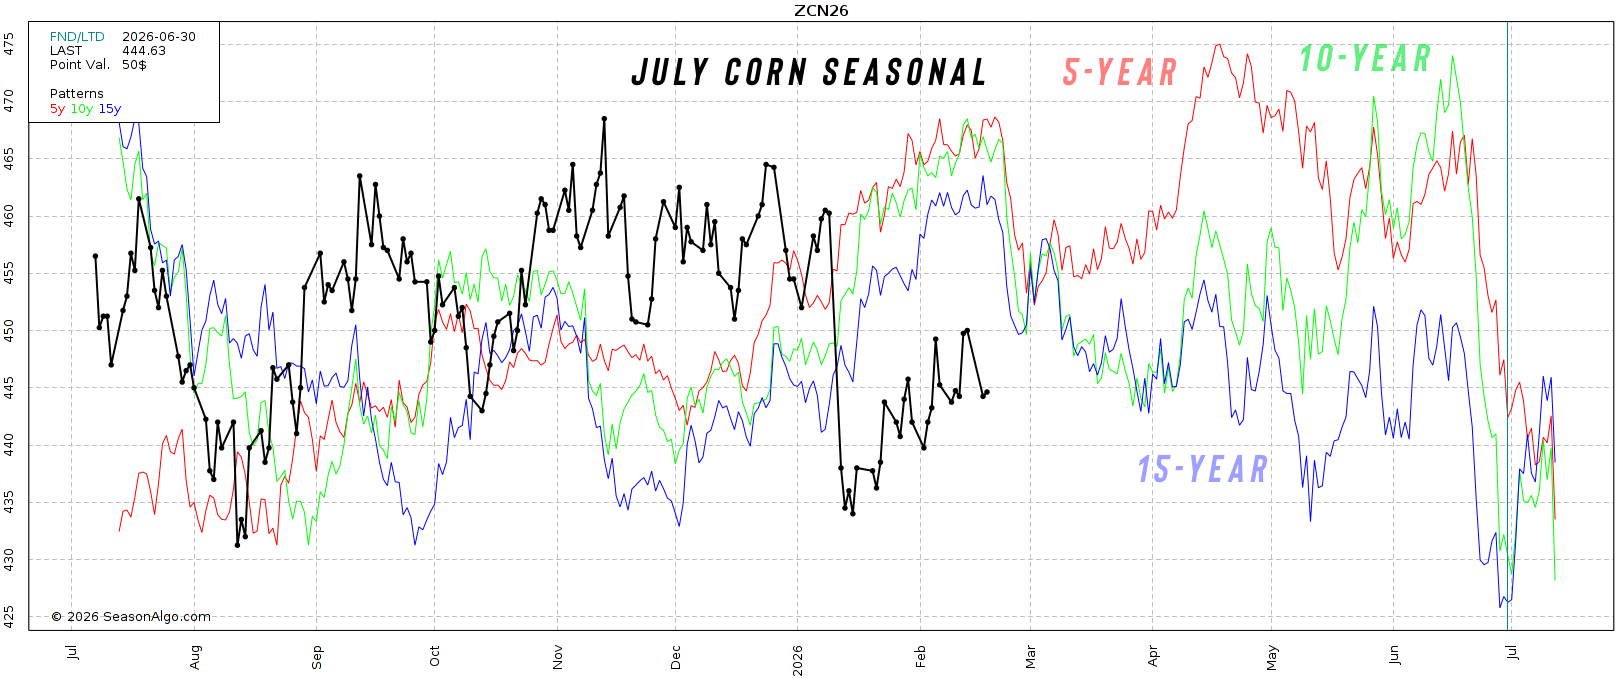
Here is the July corn seasonal chart to give you a visual.
Historically we tend to post a local top in mid-February.
Bottom Line:
I think there is far more risk in old crop compared to new crop. They are two separate markets.
New crop has to hold on to the acres.
New crop has a long ways to go.
I expect us to be weak here, like we typically tend to do heading into the end of February.
We have a lot of basis contracts that are going to need to be priced or rolled the next two weeks.
Keep in mind, demand is still the best it's ever been. I think that prevents us from getting too cheap.
Export inspections are over +300 million bushels ahead of the USDA's pace. But that doesn’t mean we have to go screaming higher here. We have a ton of supply to chew through.
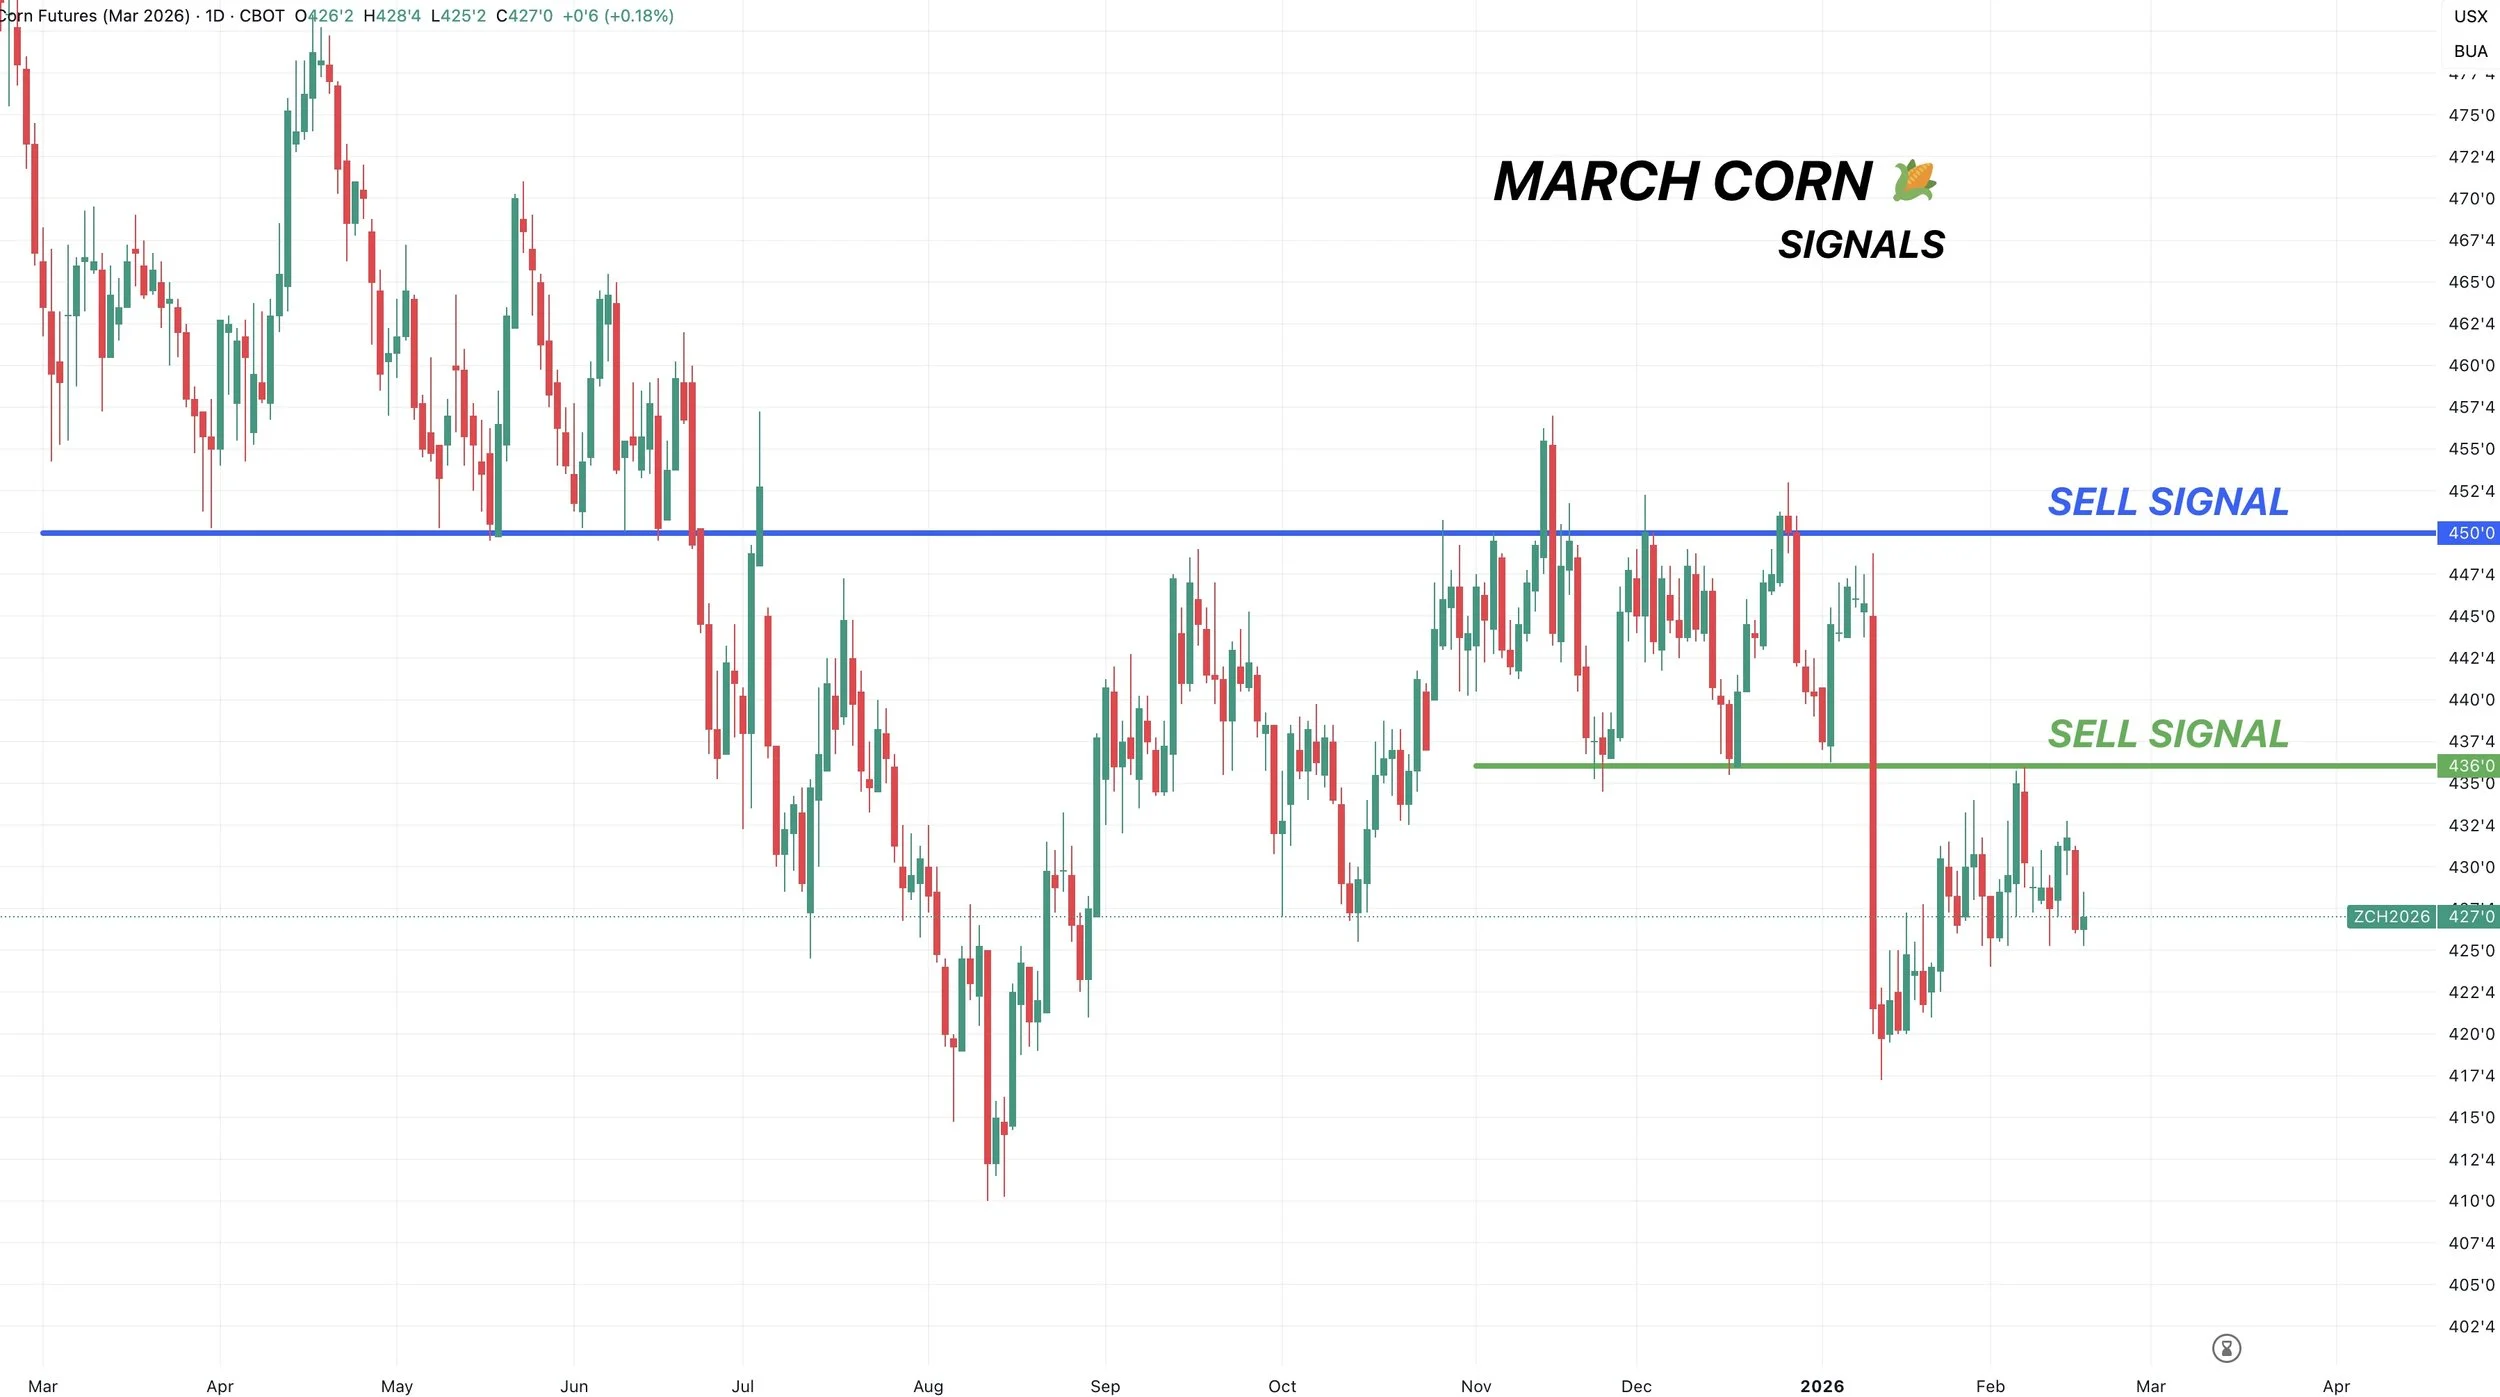
We sent a sell signal at $4.36 for March corn two weeks ago.
I do still like keeping downside protection in old crop corn for those who are still unprotected.
Downside Risk Strategies:
Here are some specific strategies from Lauren and Jeremey at Texas Hedge Risk Management.
In this short blog post, Lauren goes over a few downside protection strategies for both old crop and new crop corn.
Click Here to View
Technicals:
The charts are another reason I am short-term cautious in the corn market, and would not be surprised to see some weakness.
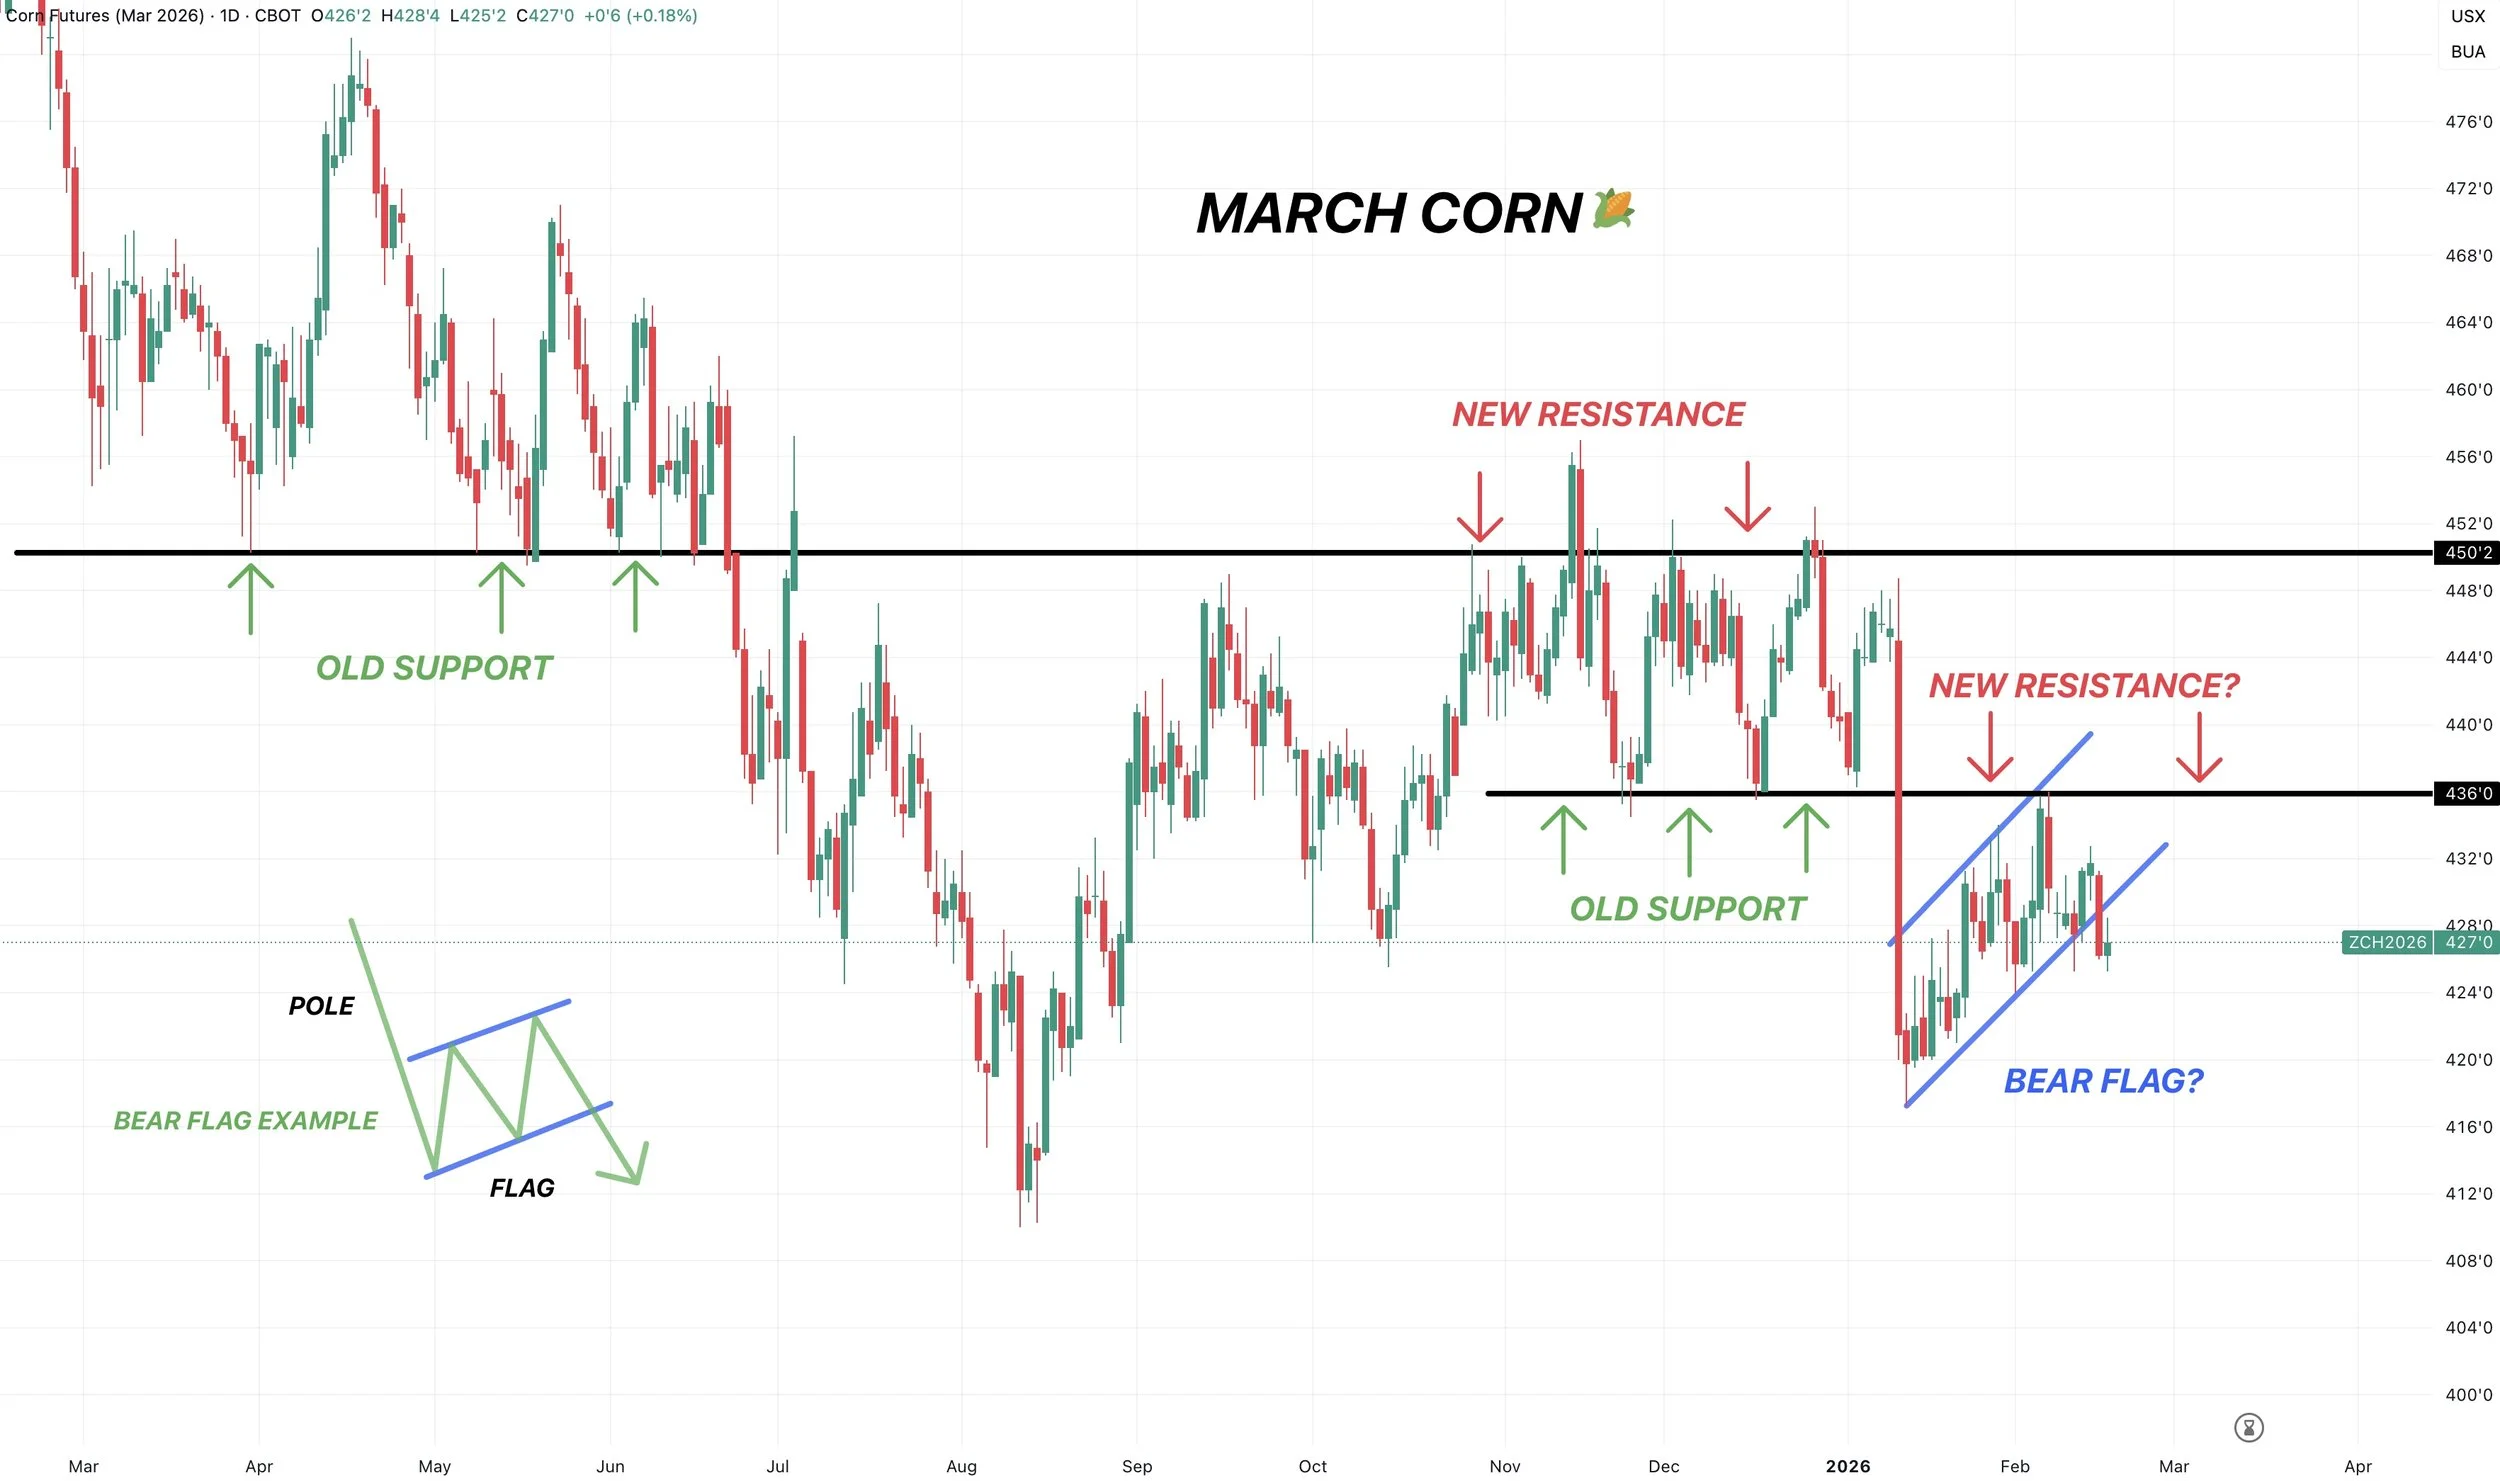
March Corn:
We failed right at key support from late last year. Which is why we issued the sell signal and hedge alert at that level.
Similar to how the harvest rally failed at our key support from last spring.
We now have a potential breakdown of a bear flag here. Which is viewed as a potential bearish pattern. Adding more caution.
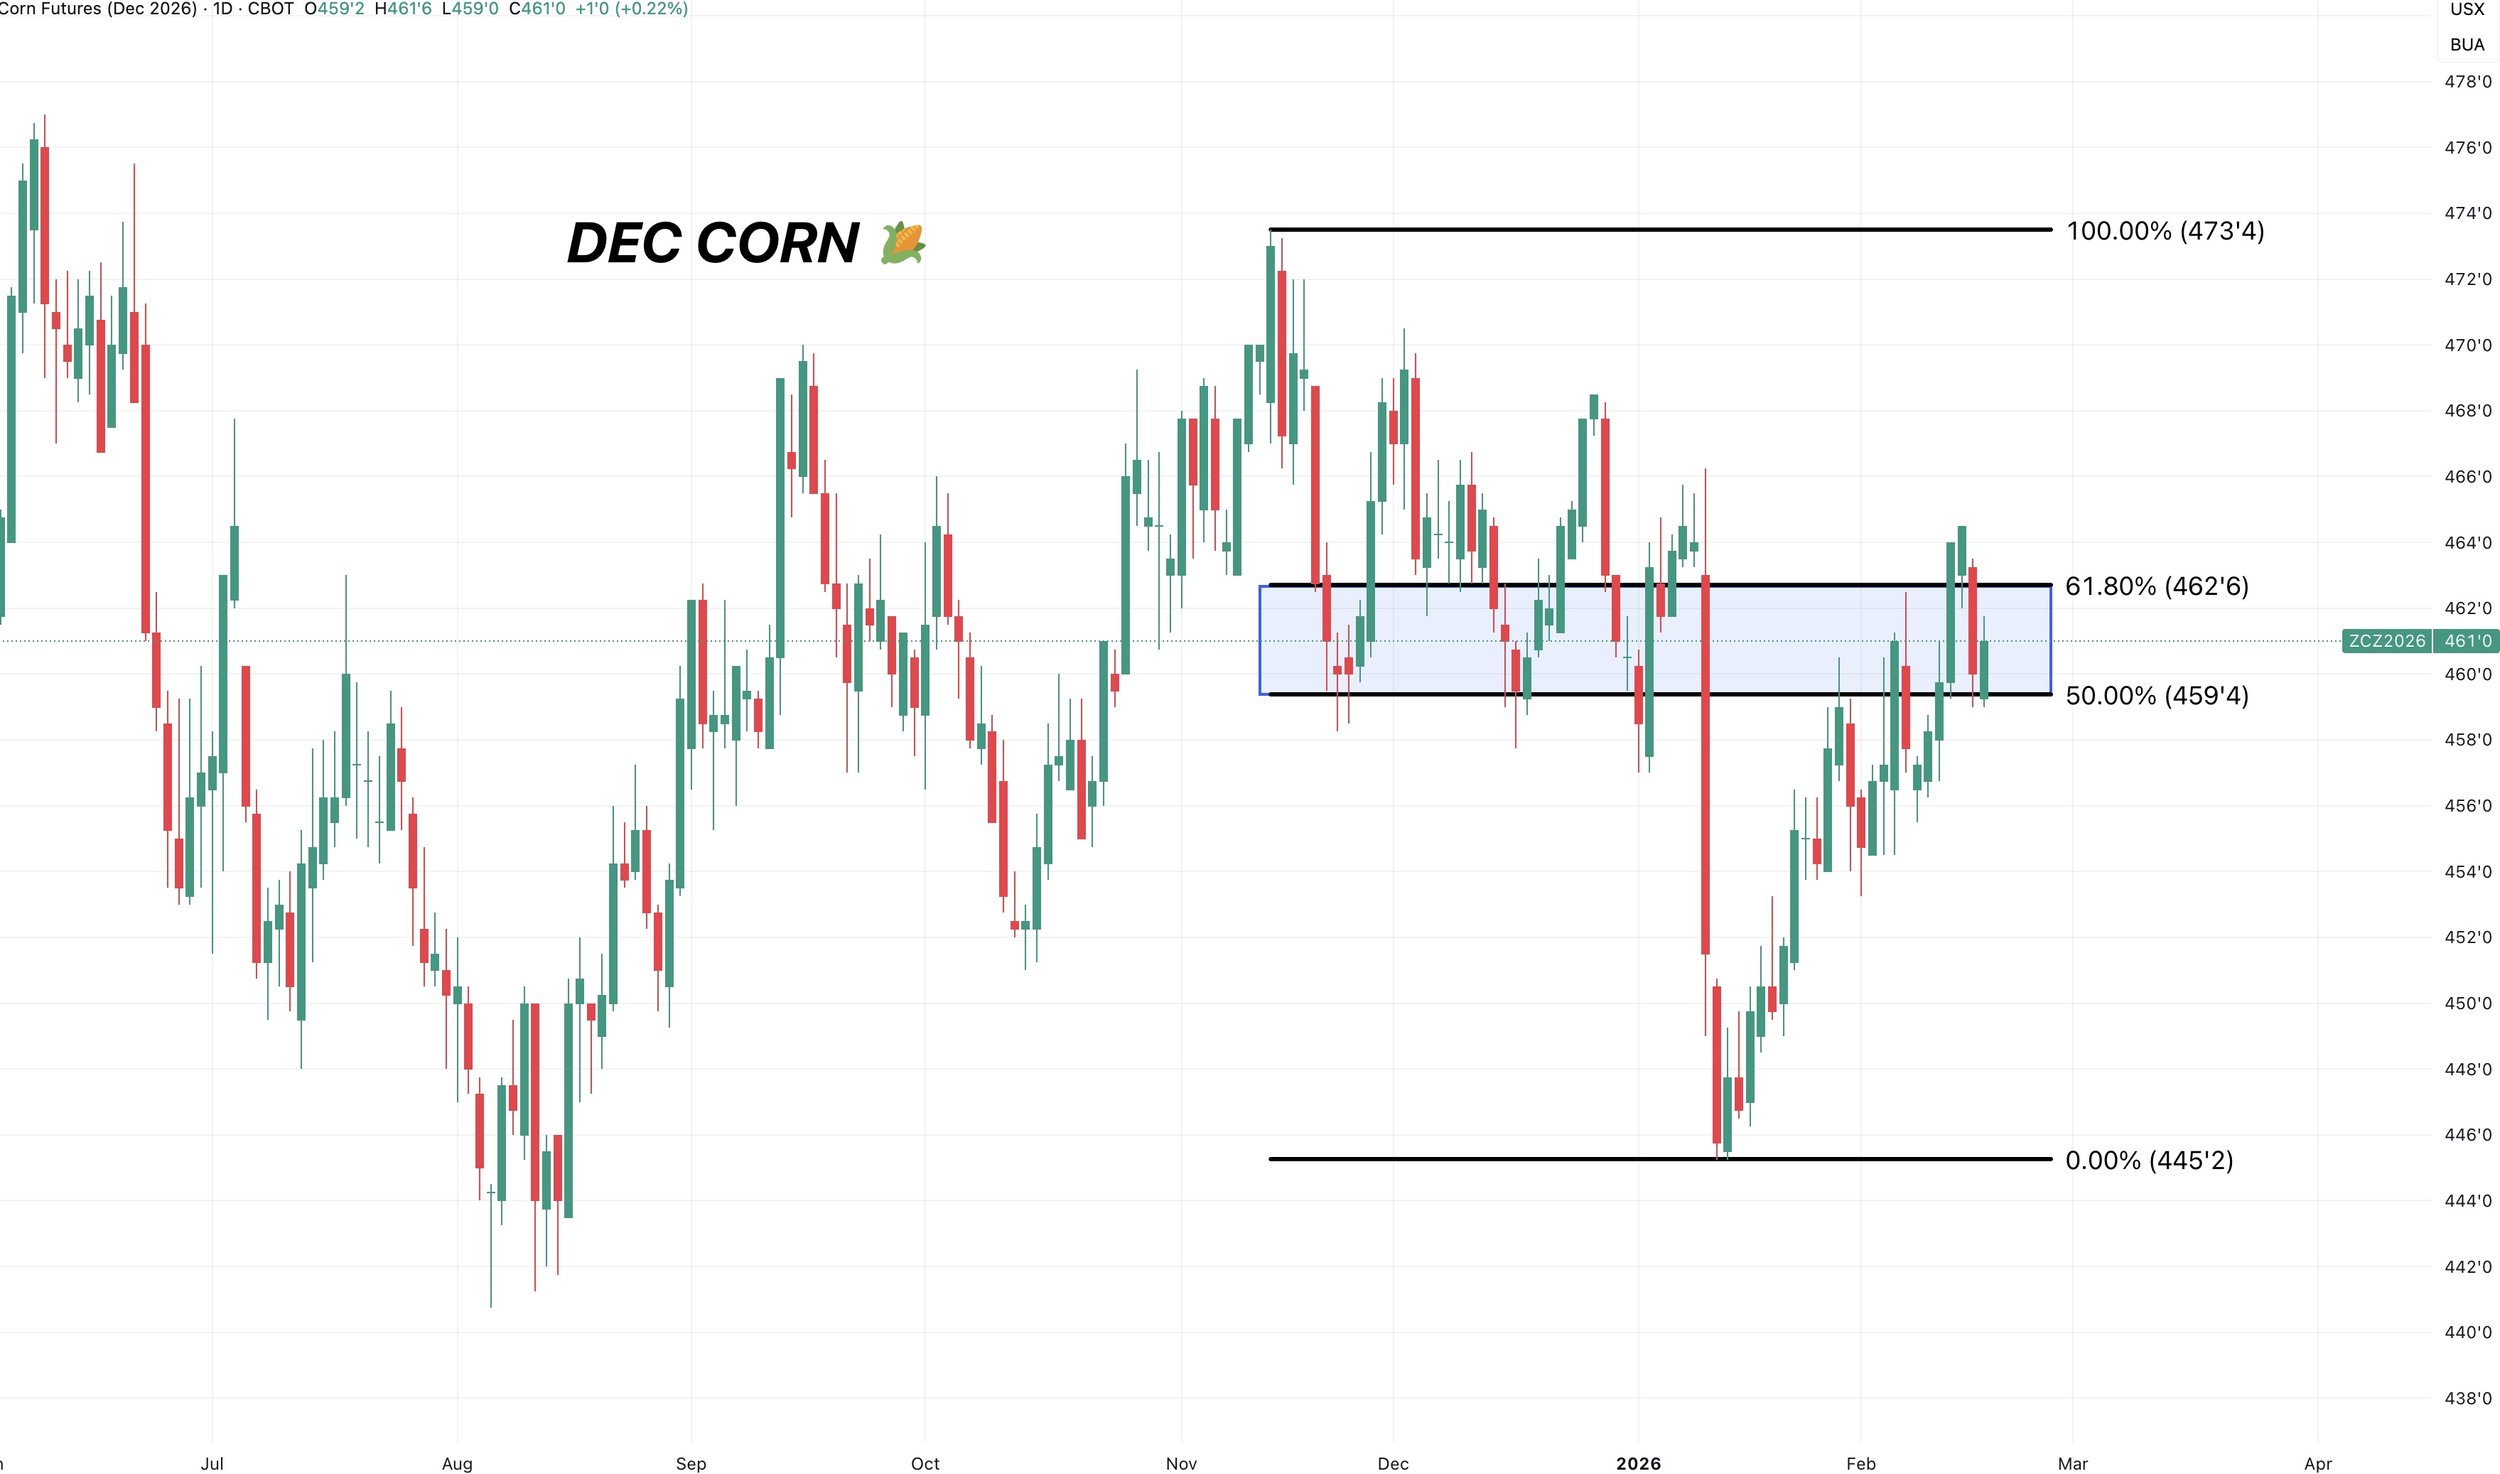
Dec Corn:
For many, we do like waiting on new crop before getting too aggressive.
However, this is not the worst spot to look at starting to do something, as we've been talking about the last two weeks.
Especially if you are someone who lacks storage etc. If you’re in that situation, you need to be more proactive.
We are sitting right in the golden zone retracement up to the November highs.
A common spot for a rally to stall.
Soybeans
Fundamentals:
Soybeans caught a bid this morning before falling well off the highs.
We've been driven by a few headlines.
We of course have Trump and China.
Trump said that he and China are looking to extend their truce by another year when they meet in April.
Trump says China "might" buy an extra 300 million bushels of soybeans.
I'm not going to dive into this topic too much today.
There are plenty of logistical and economic issues that have to make you question the entire situation.
Does it make sense for China to do it? No.
Regardless, this is a political chess match. You can’t count it out.
China wants the bigger deals. If that means all they have to do is buy some soybeans, I don’t see why they couldn’t make it happen. Even if it makes no sense for them to do so.
If they do end up buying these, it has the "potential" to be a game changer.
As they would pretty much be buying the entire US carryout.
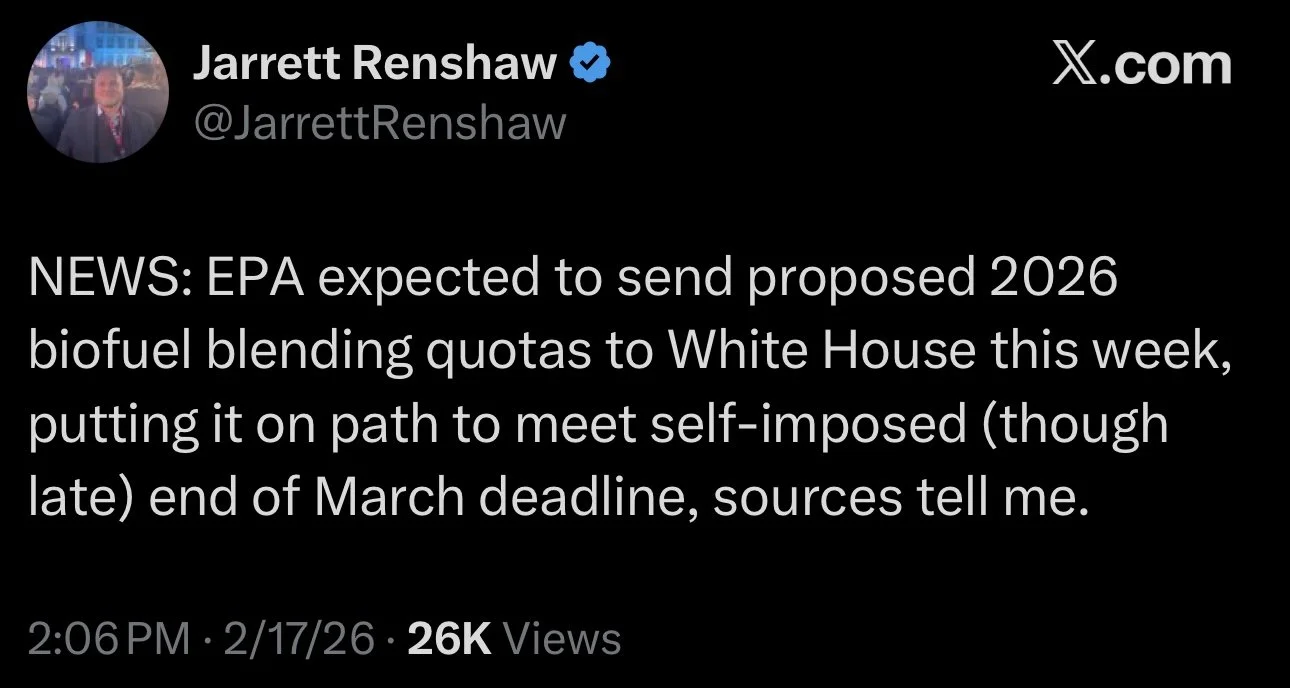
The other headline was RVO news.
The EPA is expected to send their RVO proposal to the White House this week.
They are proposing 24 billion gallons for 2026 and 24.46 billion for 2027.
Which is a pretty large increase from the 22.33 billion from 2025.
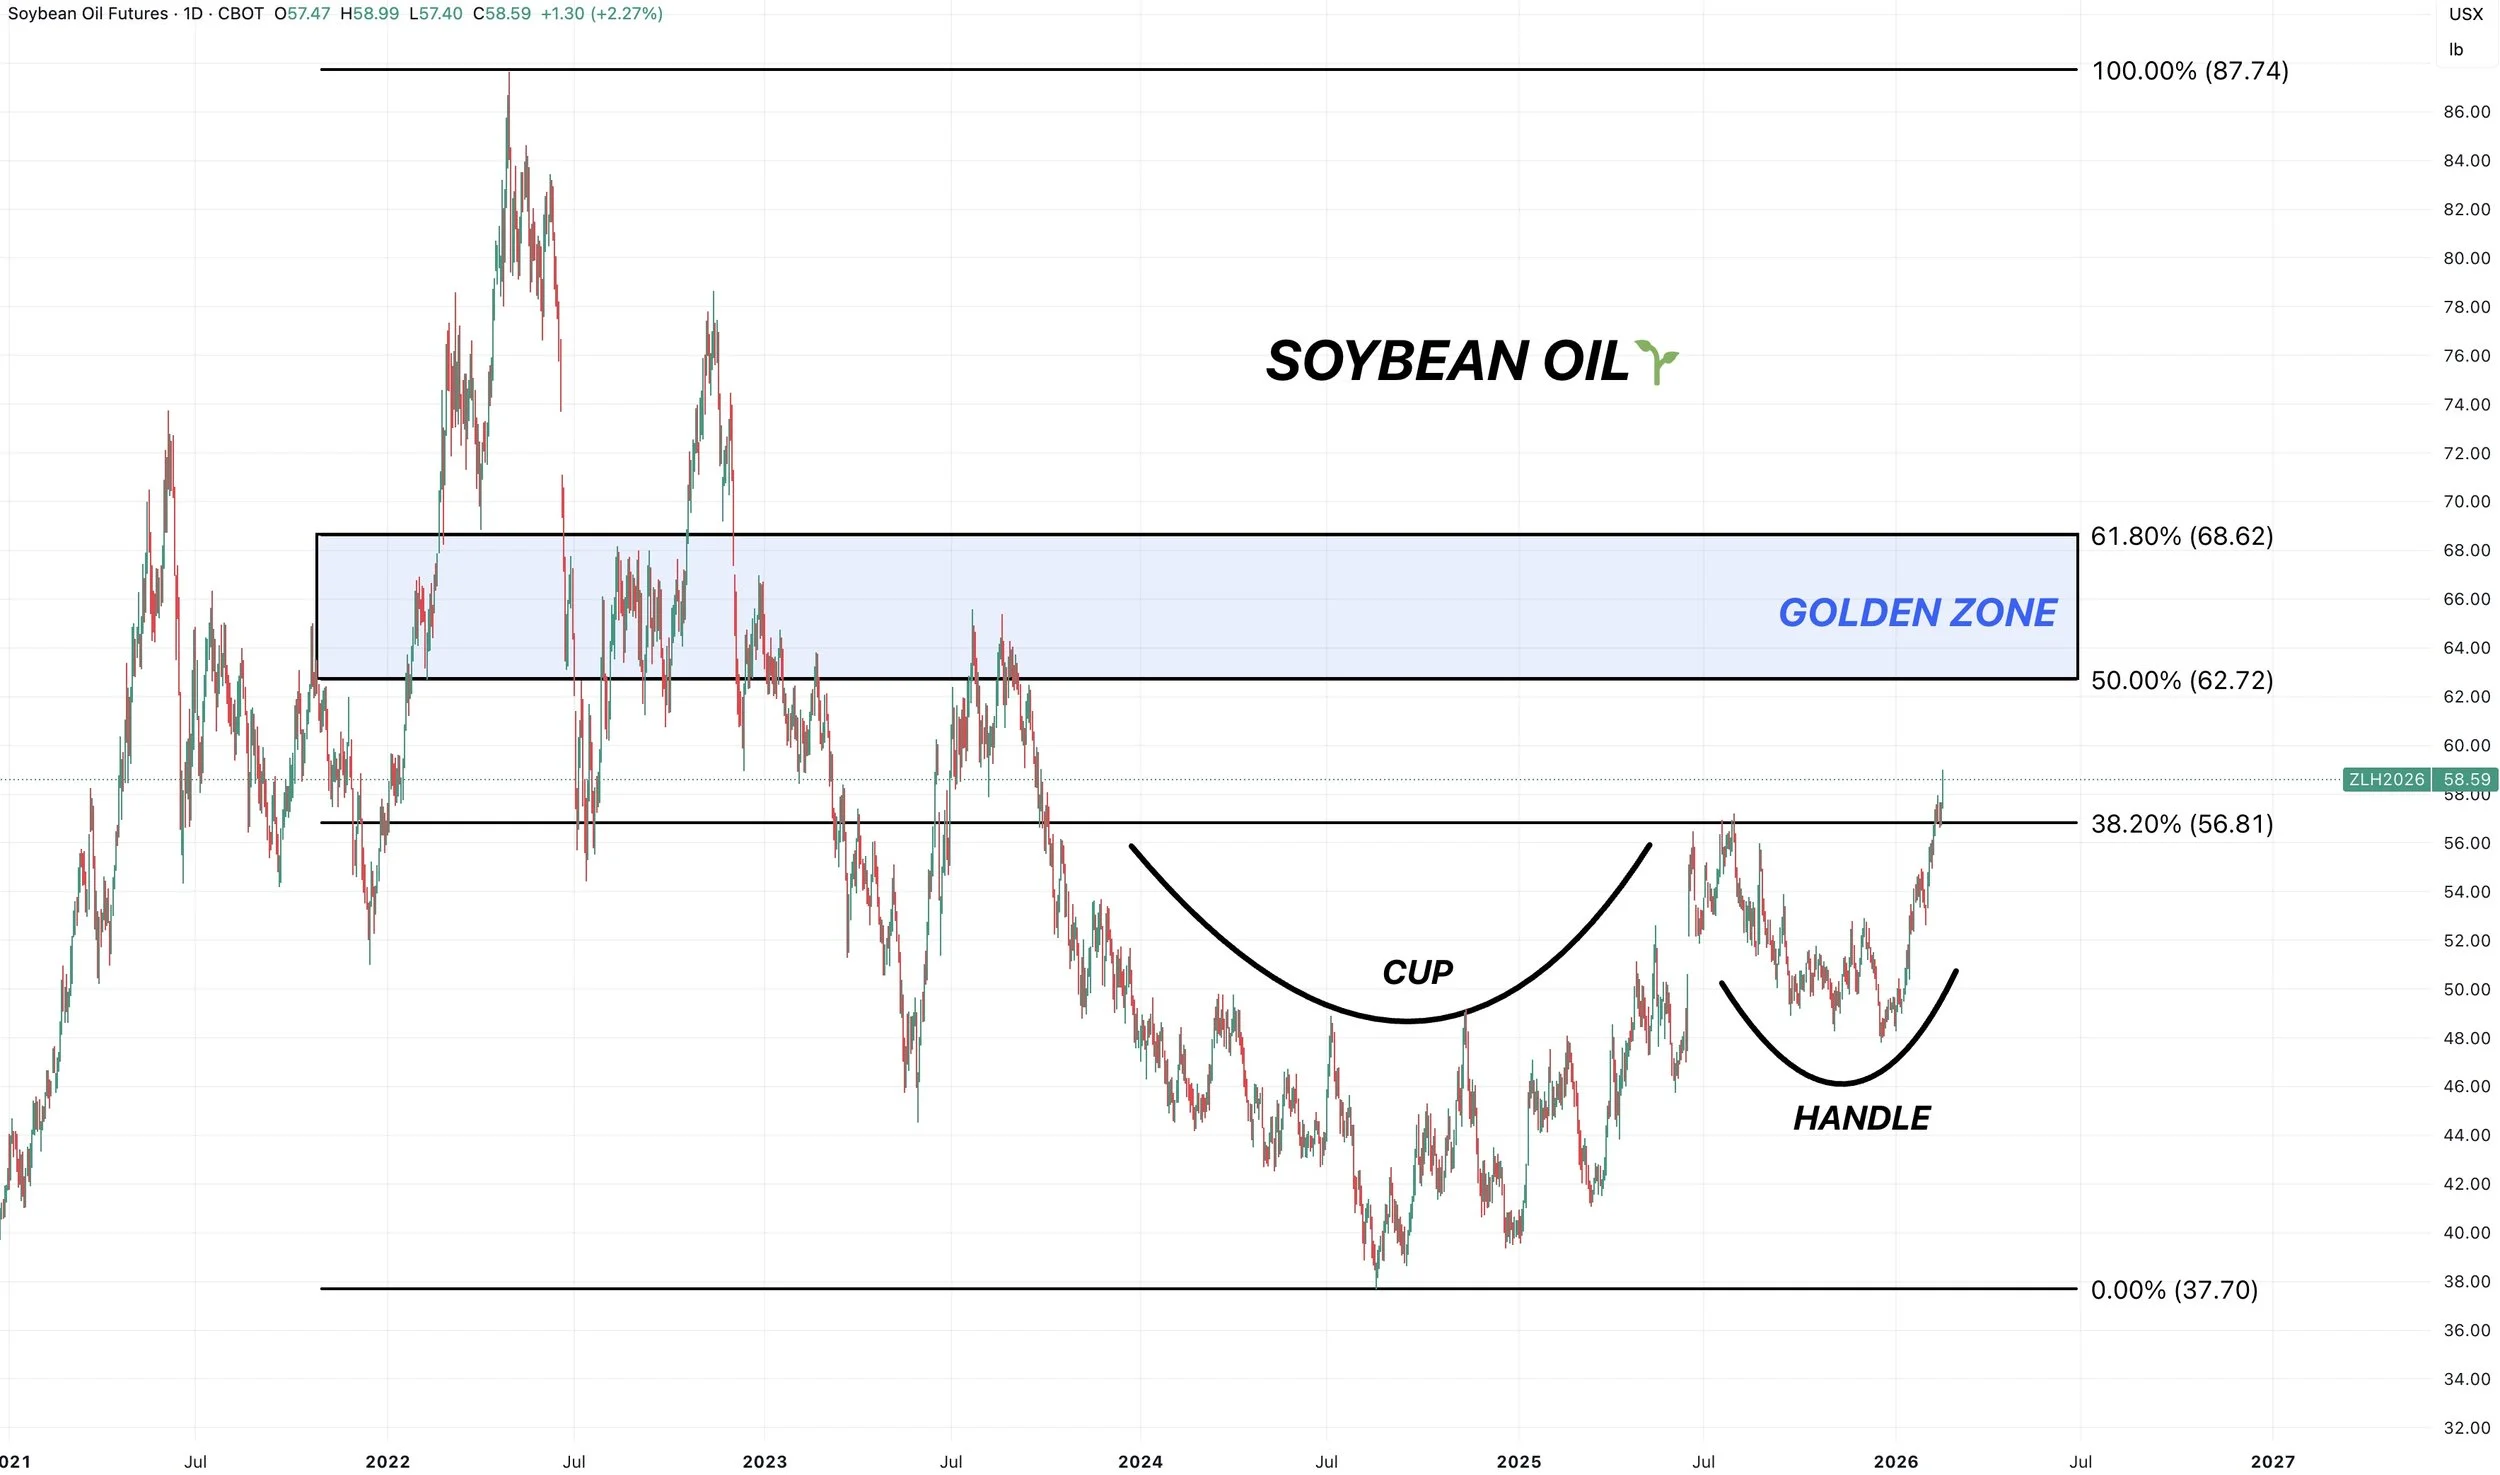
This led to soybean oil hitting it's highest levels since 2023.
The chart looks very solid here.
We have a clean cup and handle pattern.
I wouldn’t be surprised to see this continue to push higher.
Could potentially add some support to soybeans if it does.
Bottom Line:
It's impossible to know how this whole thing between China will play out.
Headline driven markets are the hardest to navigate.
If it wasn’t for that Trump tweet, the USDA pretty much said they would’ve lowered exports in the last USDA report, and we'd of course be trading a lot lower.
This market clearly has all the upside "potential" in the world.
We "could" go a lot higher.
But if I told you back in the middle of January that we'd be $1.00 higher in a month, most wouldn’t have blinked to take some risk off the table if given the chance.
It simply makes sense to reward this rally to some extent if you have not yet done so, especially in old crop. We like being more patient in new crop as there could be a story.
There potential is there, but there are also several question marks and reasons to pause.
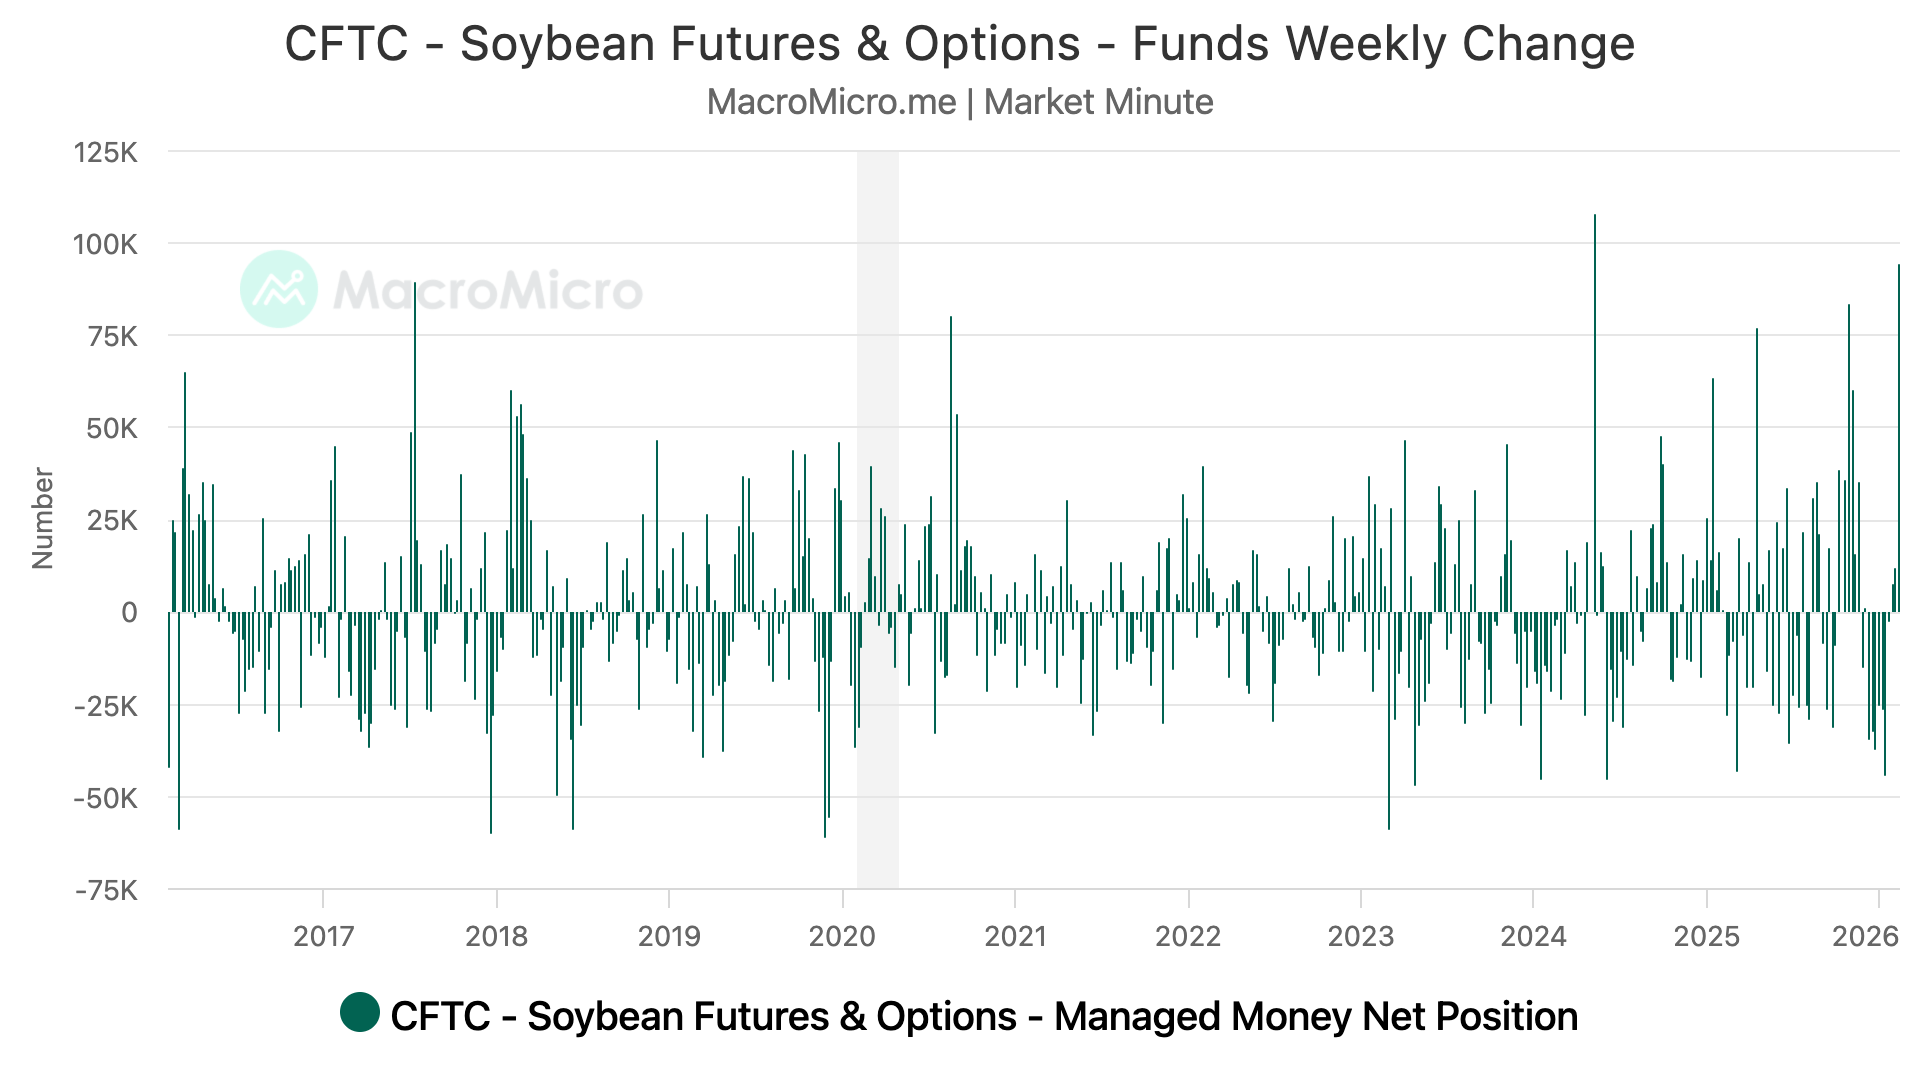
The funds bought over +90k contracts on last week's CTFC report.
That is the 2nd largest weekly buying on record.
So the funds clearly believe in the story for now.
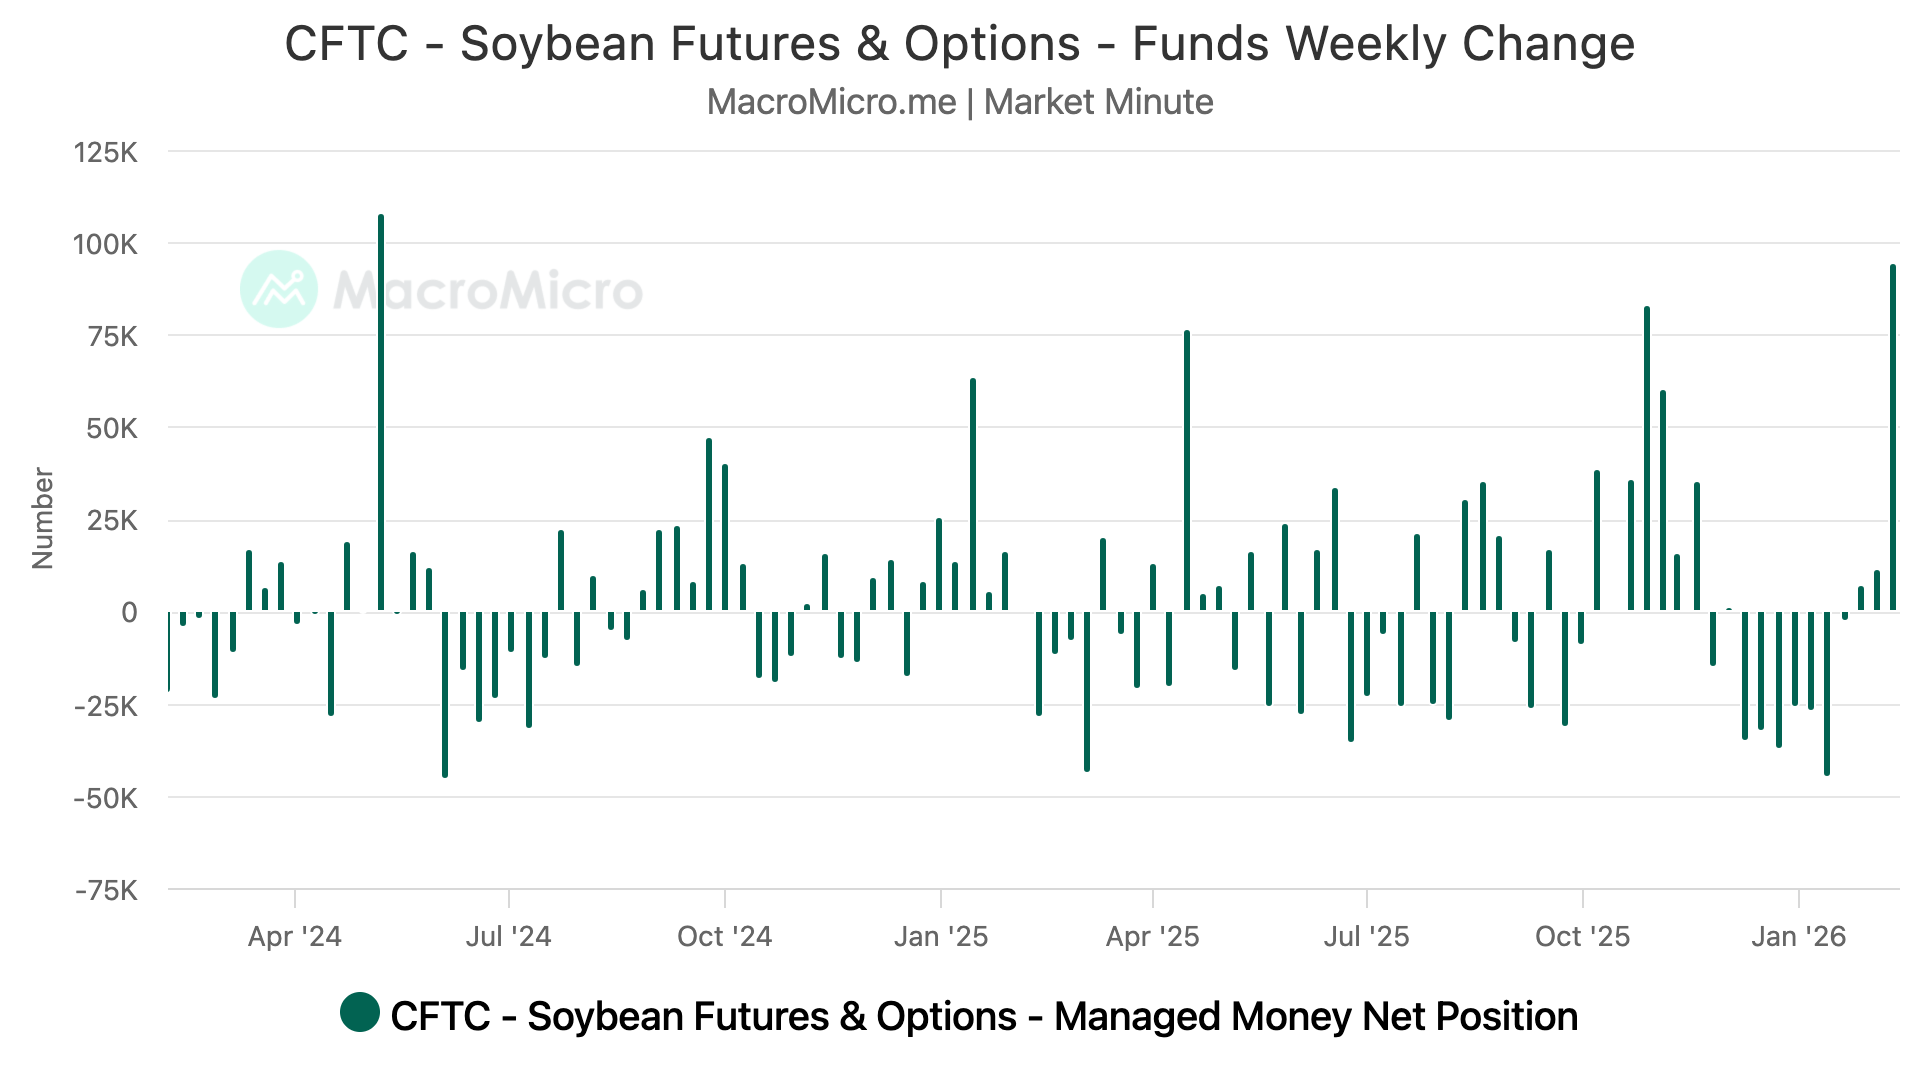
Here are two charts showing the funds weekly position change.
I included one that shows the last 10 years of data and one that includes the last 2 years of data to give you a good visual.
10 Years of Data
2 Years of Data
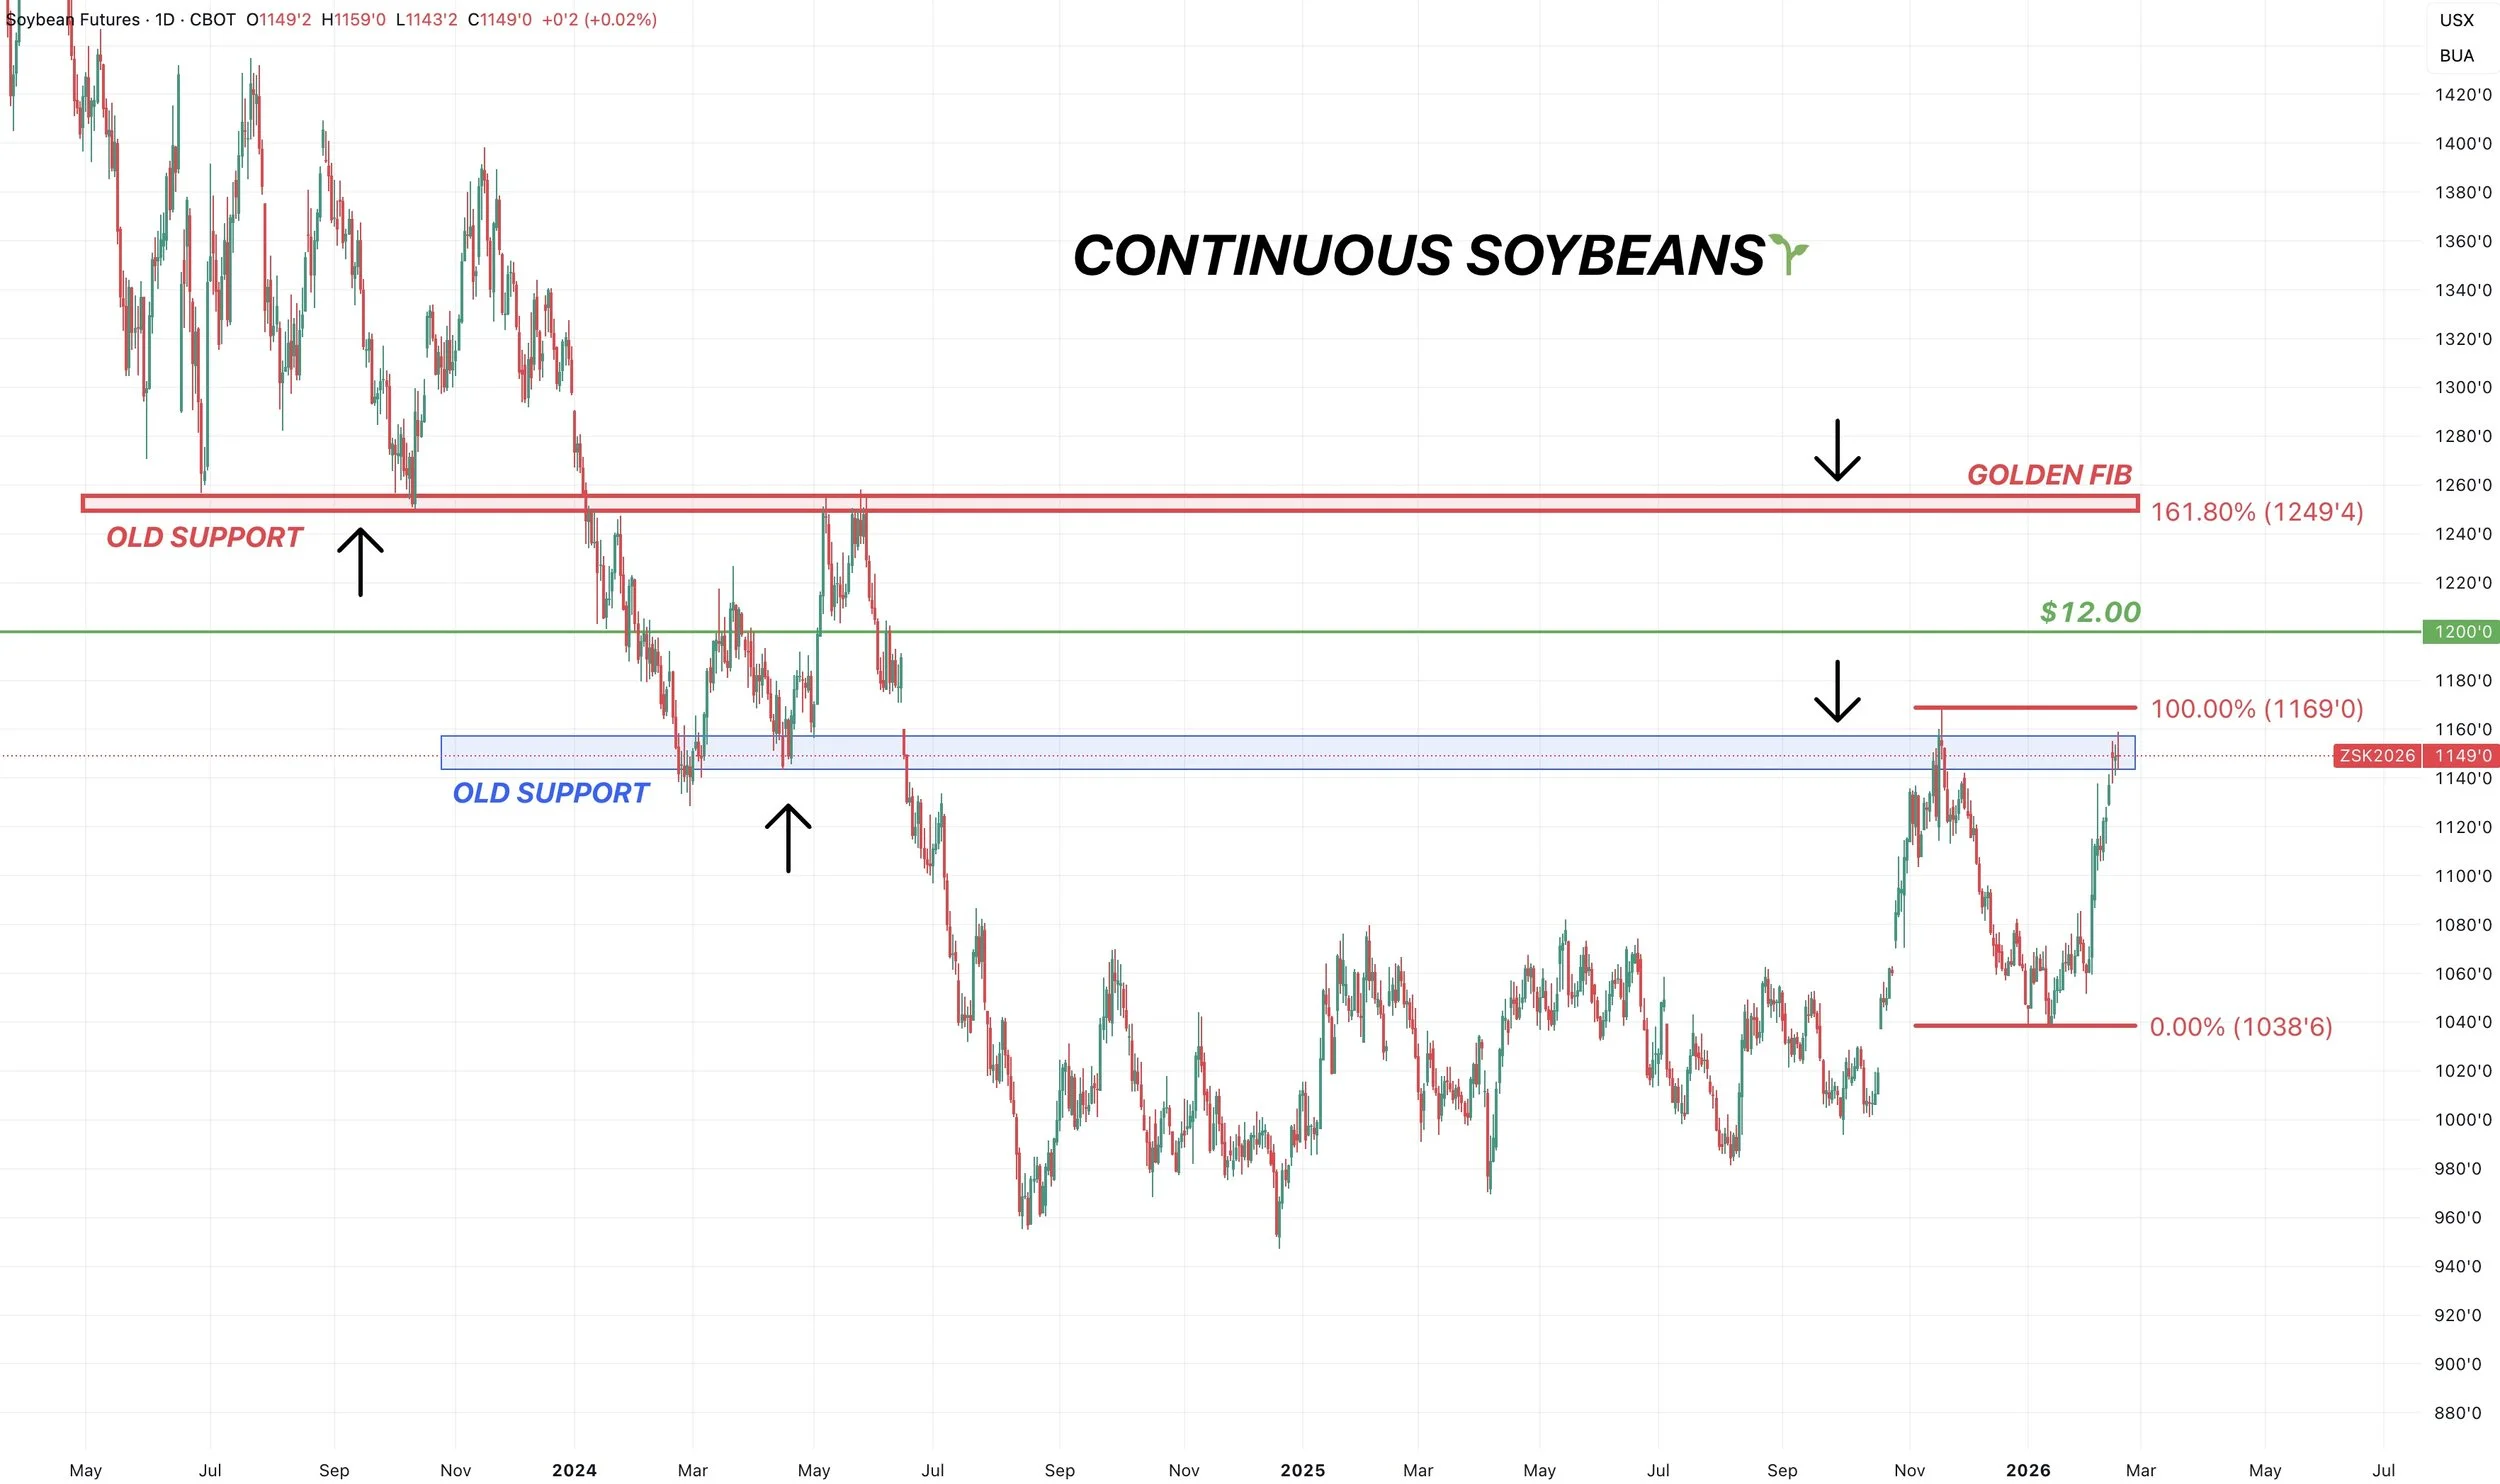
Continuous Chart & Targets:
We took some risk off the table at these levels already.
We are sitting at a pretty big resistance level here.
The November highs and our support from 2024.
Break above, and the next point of interest is the psychological $12 level.
After that, the next target is $12.50
That is old key support and resistance. It is also 161.8% of the recent lows up to the November highs. Known as the golden fib extension.
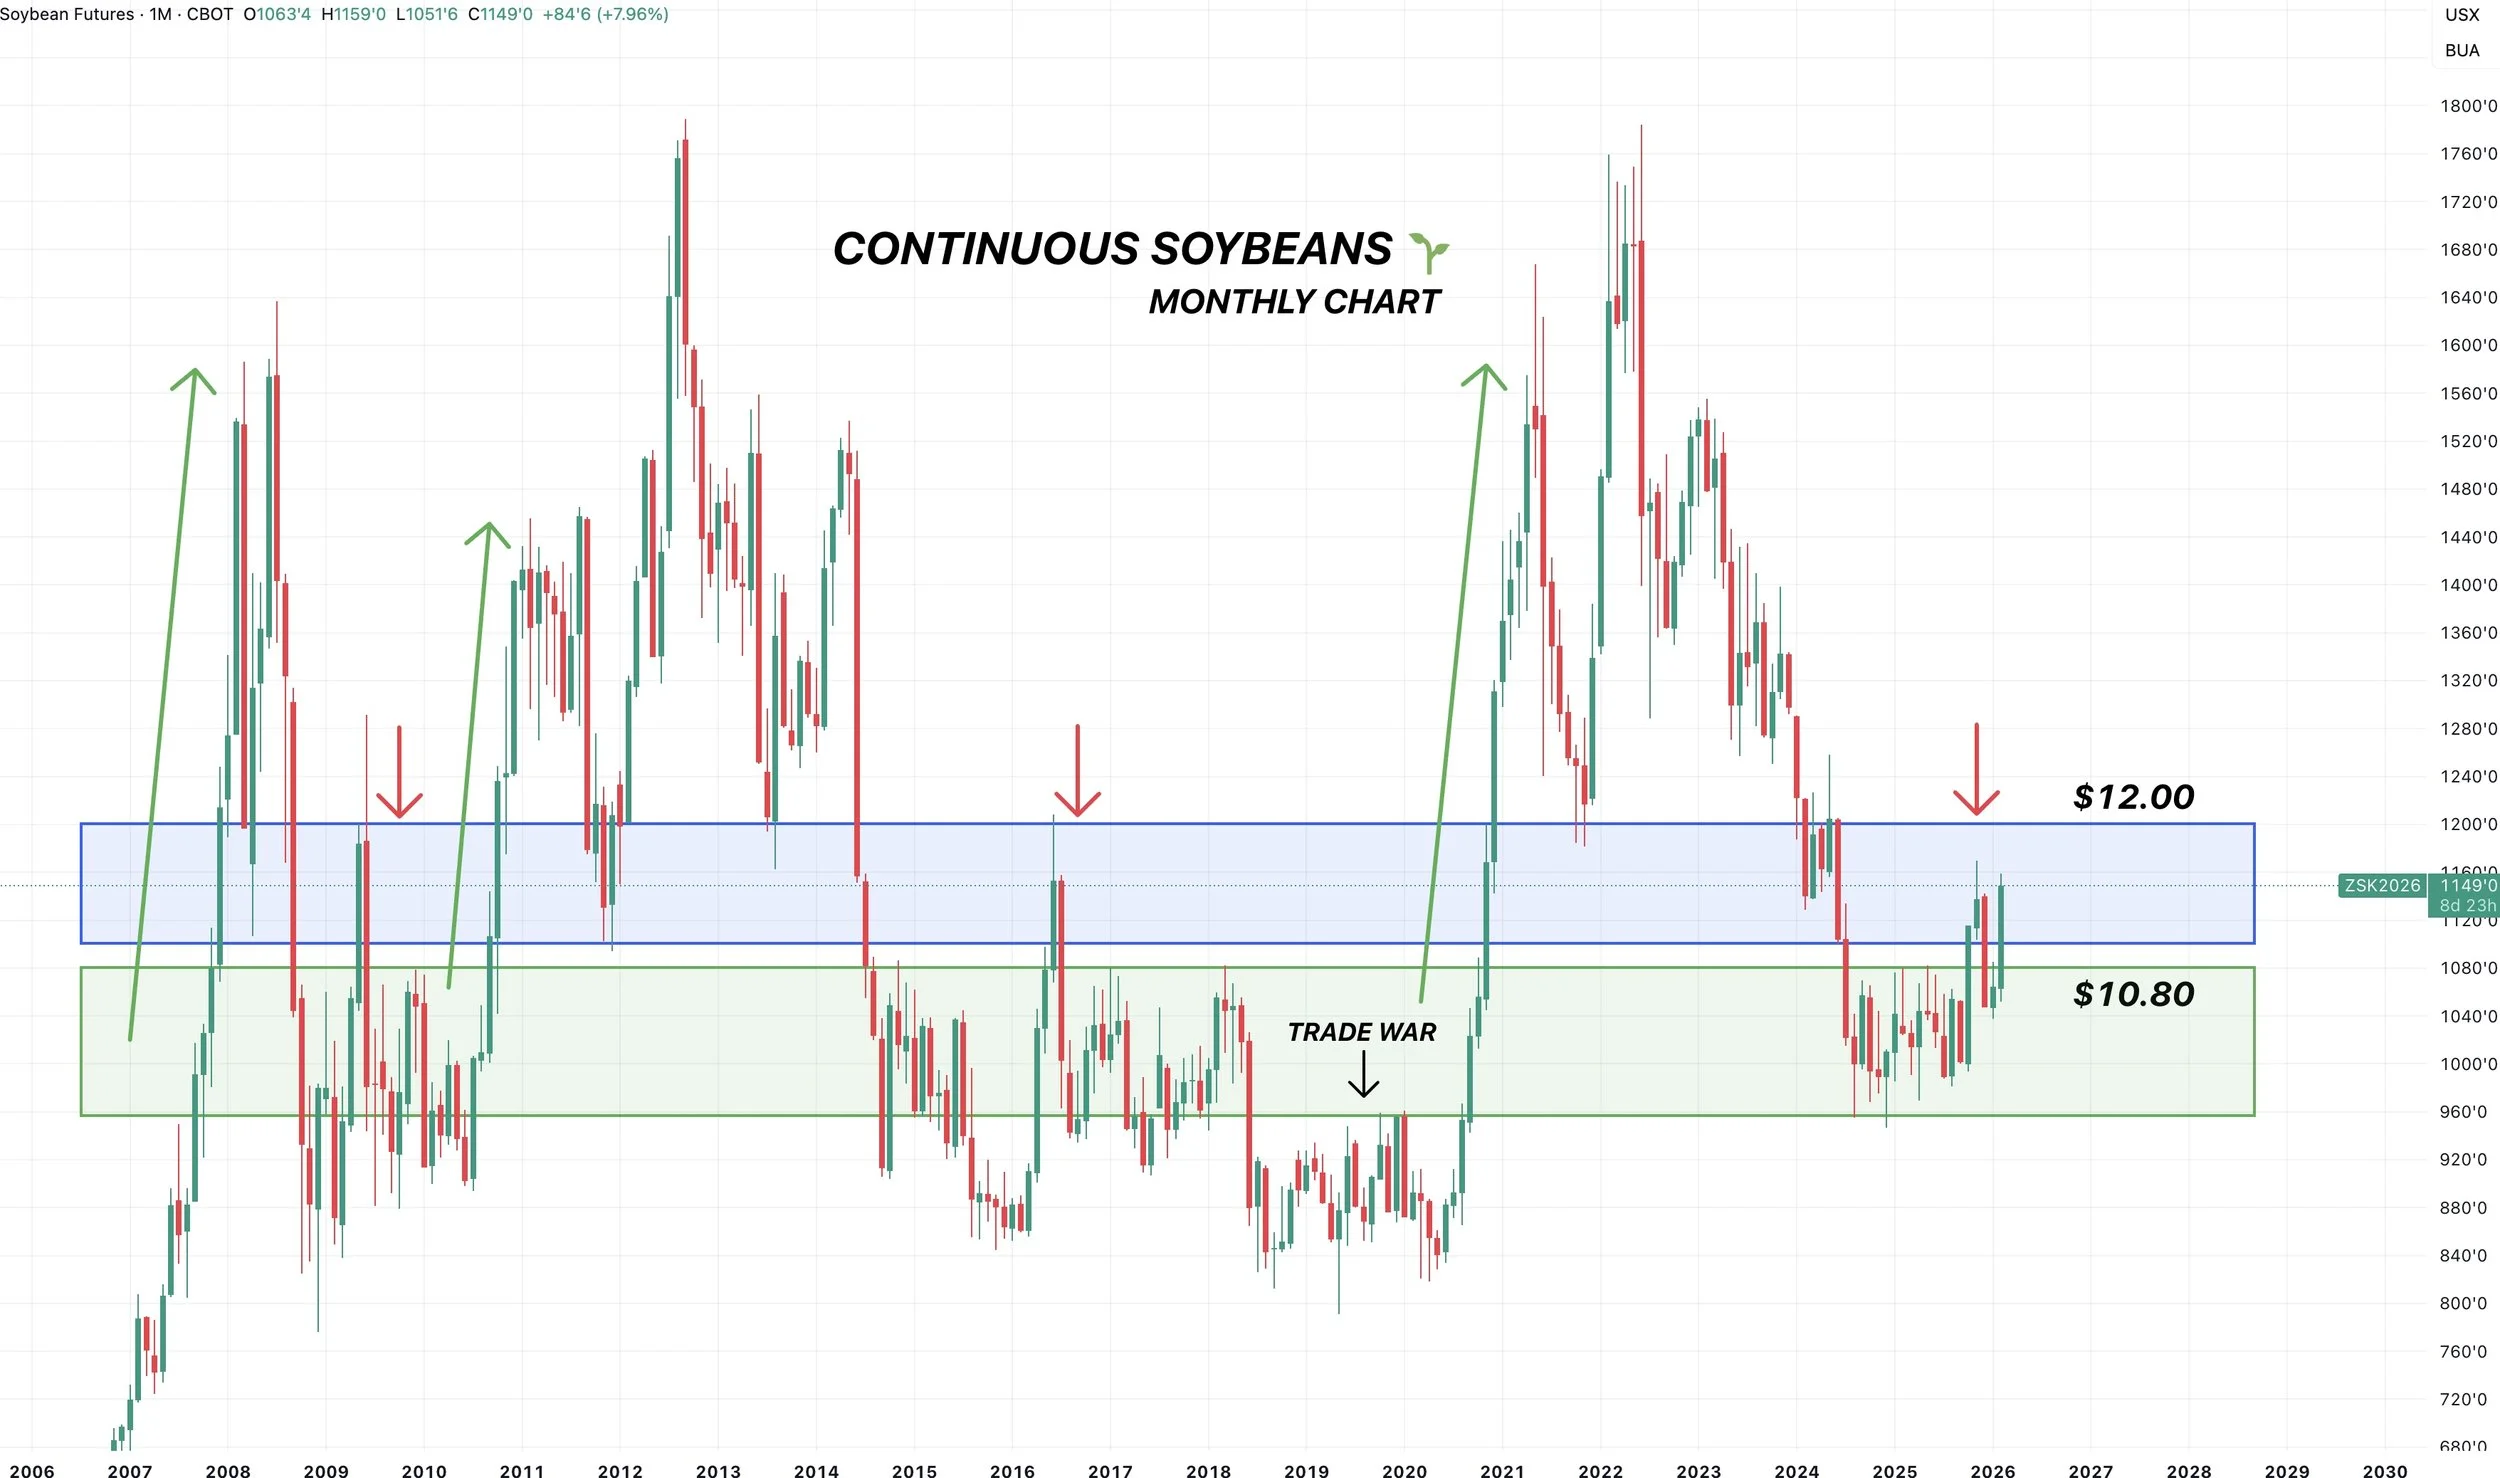
Monthly Chart:
We've still never just stopped a rally in the $11.00's.
This is probably the biggest argument for $12.00 beans.
If we fail to hit $12.00 it would be the very first time we broke above $10.80 and did not reach $12.00
It's happened 5 separate times before now.
It could happen, but it has yet to do so.
Wheat
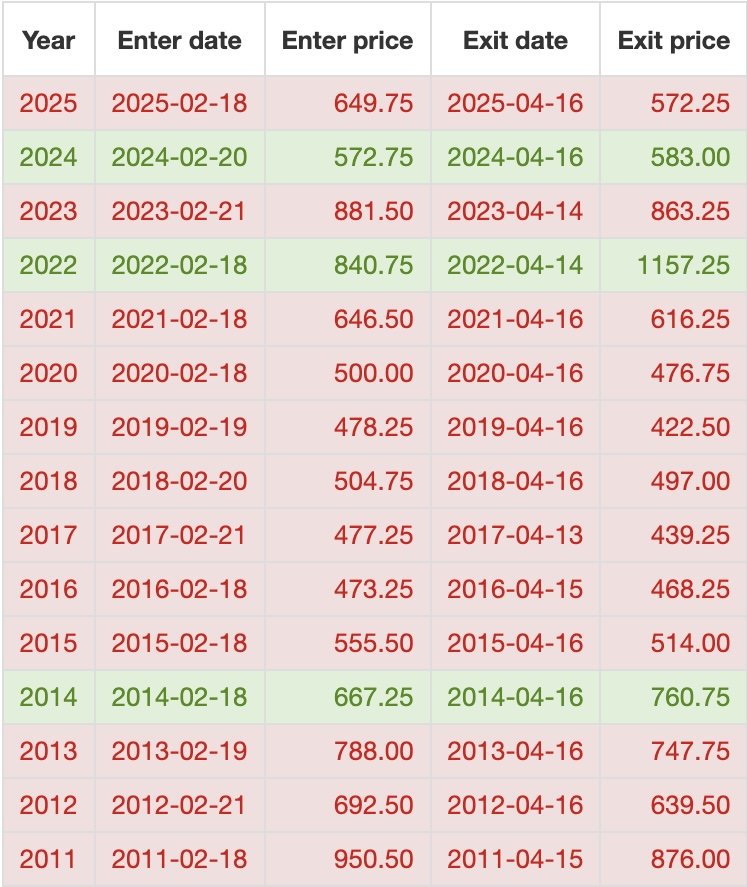
Weak Seasonal Tendency?
From today until April 16th, KC tends to trade lower.
The data:
Lower 8 of 10 years.
Lower 12 of 15 years.
Here is the seasonal chart for July KC.
We often tend to put in a local high around late February.
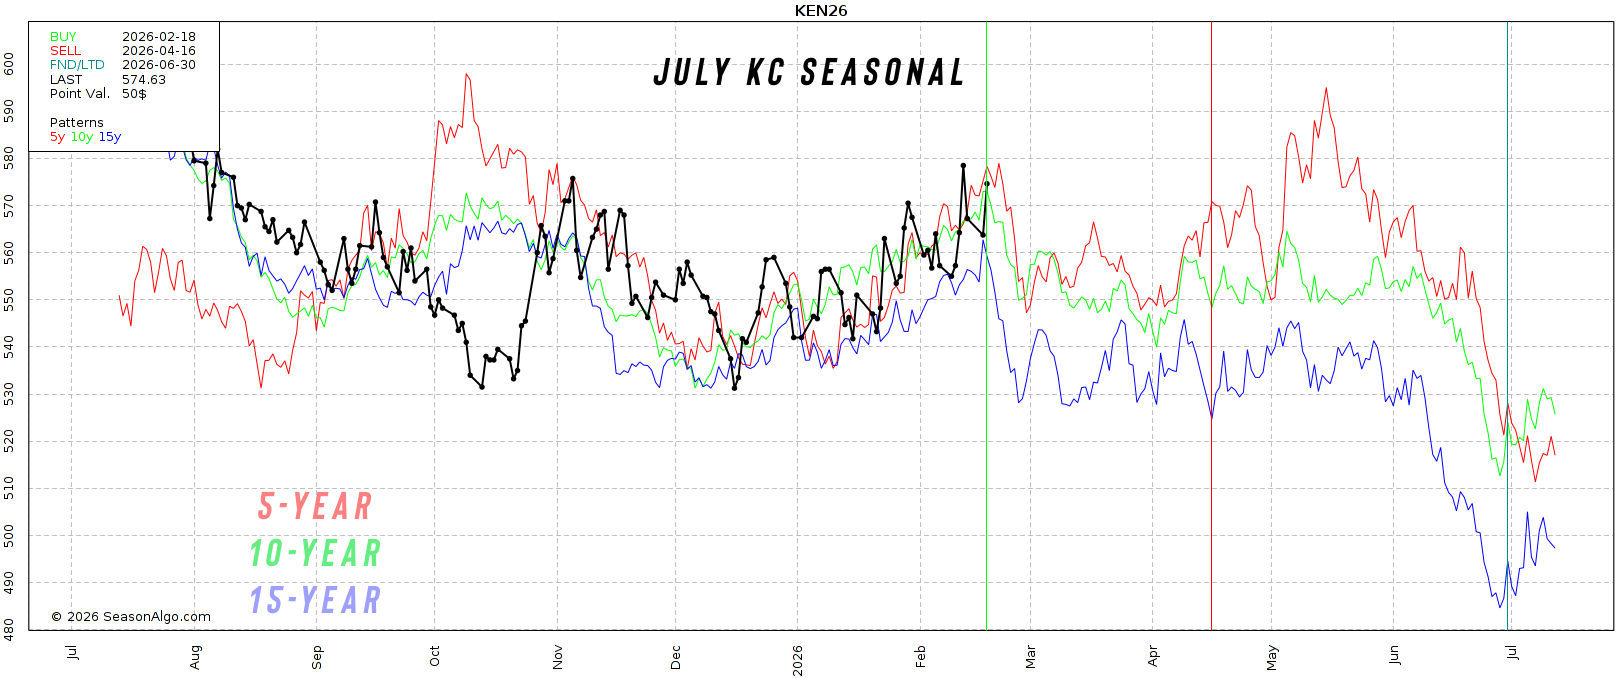
Given that we've traded lower 80% of the time for the last 15 years going into April, it does make you somewhat cautious following this rally.
It's a compelling set of data.
So we may be wanting to look to reward this rally soon.
However, the charts do look pretty promising.
So it makes me wonder if the seasonals will play out this year or if this will be a year where we deviate from the normal.
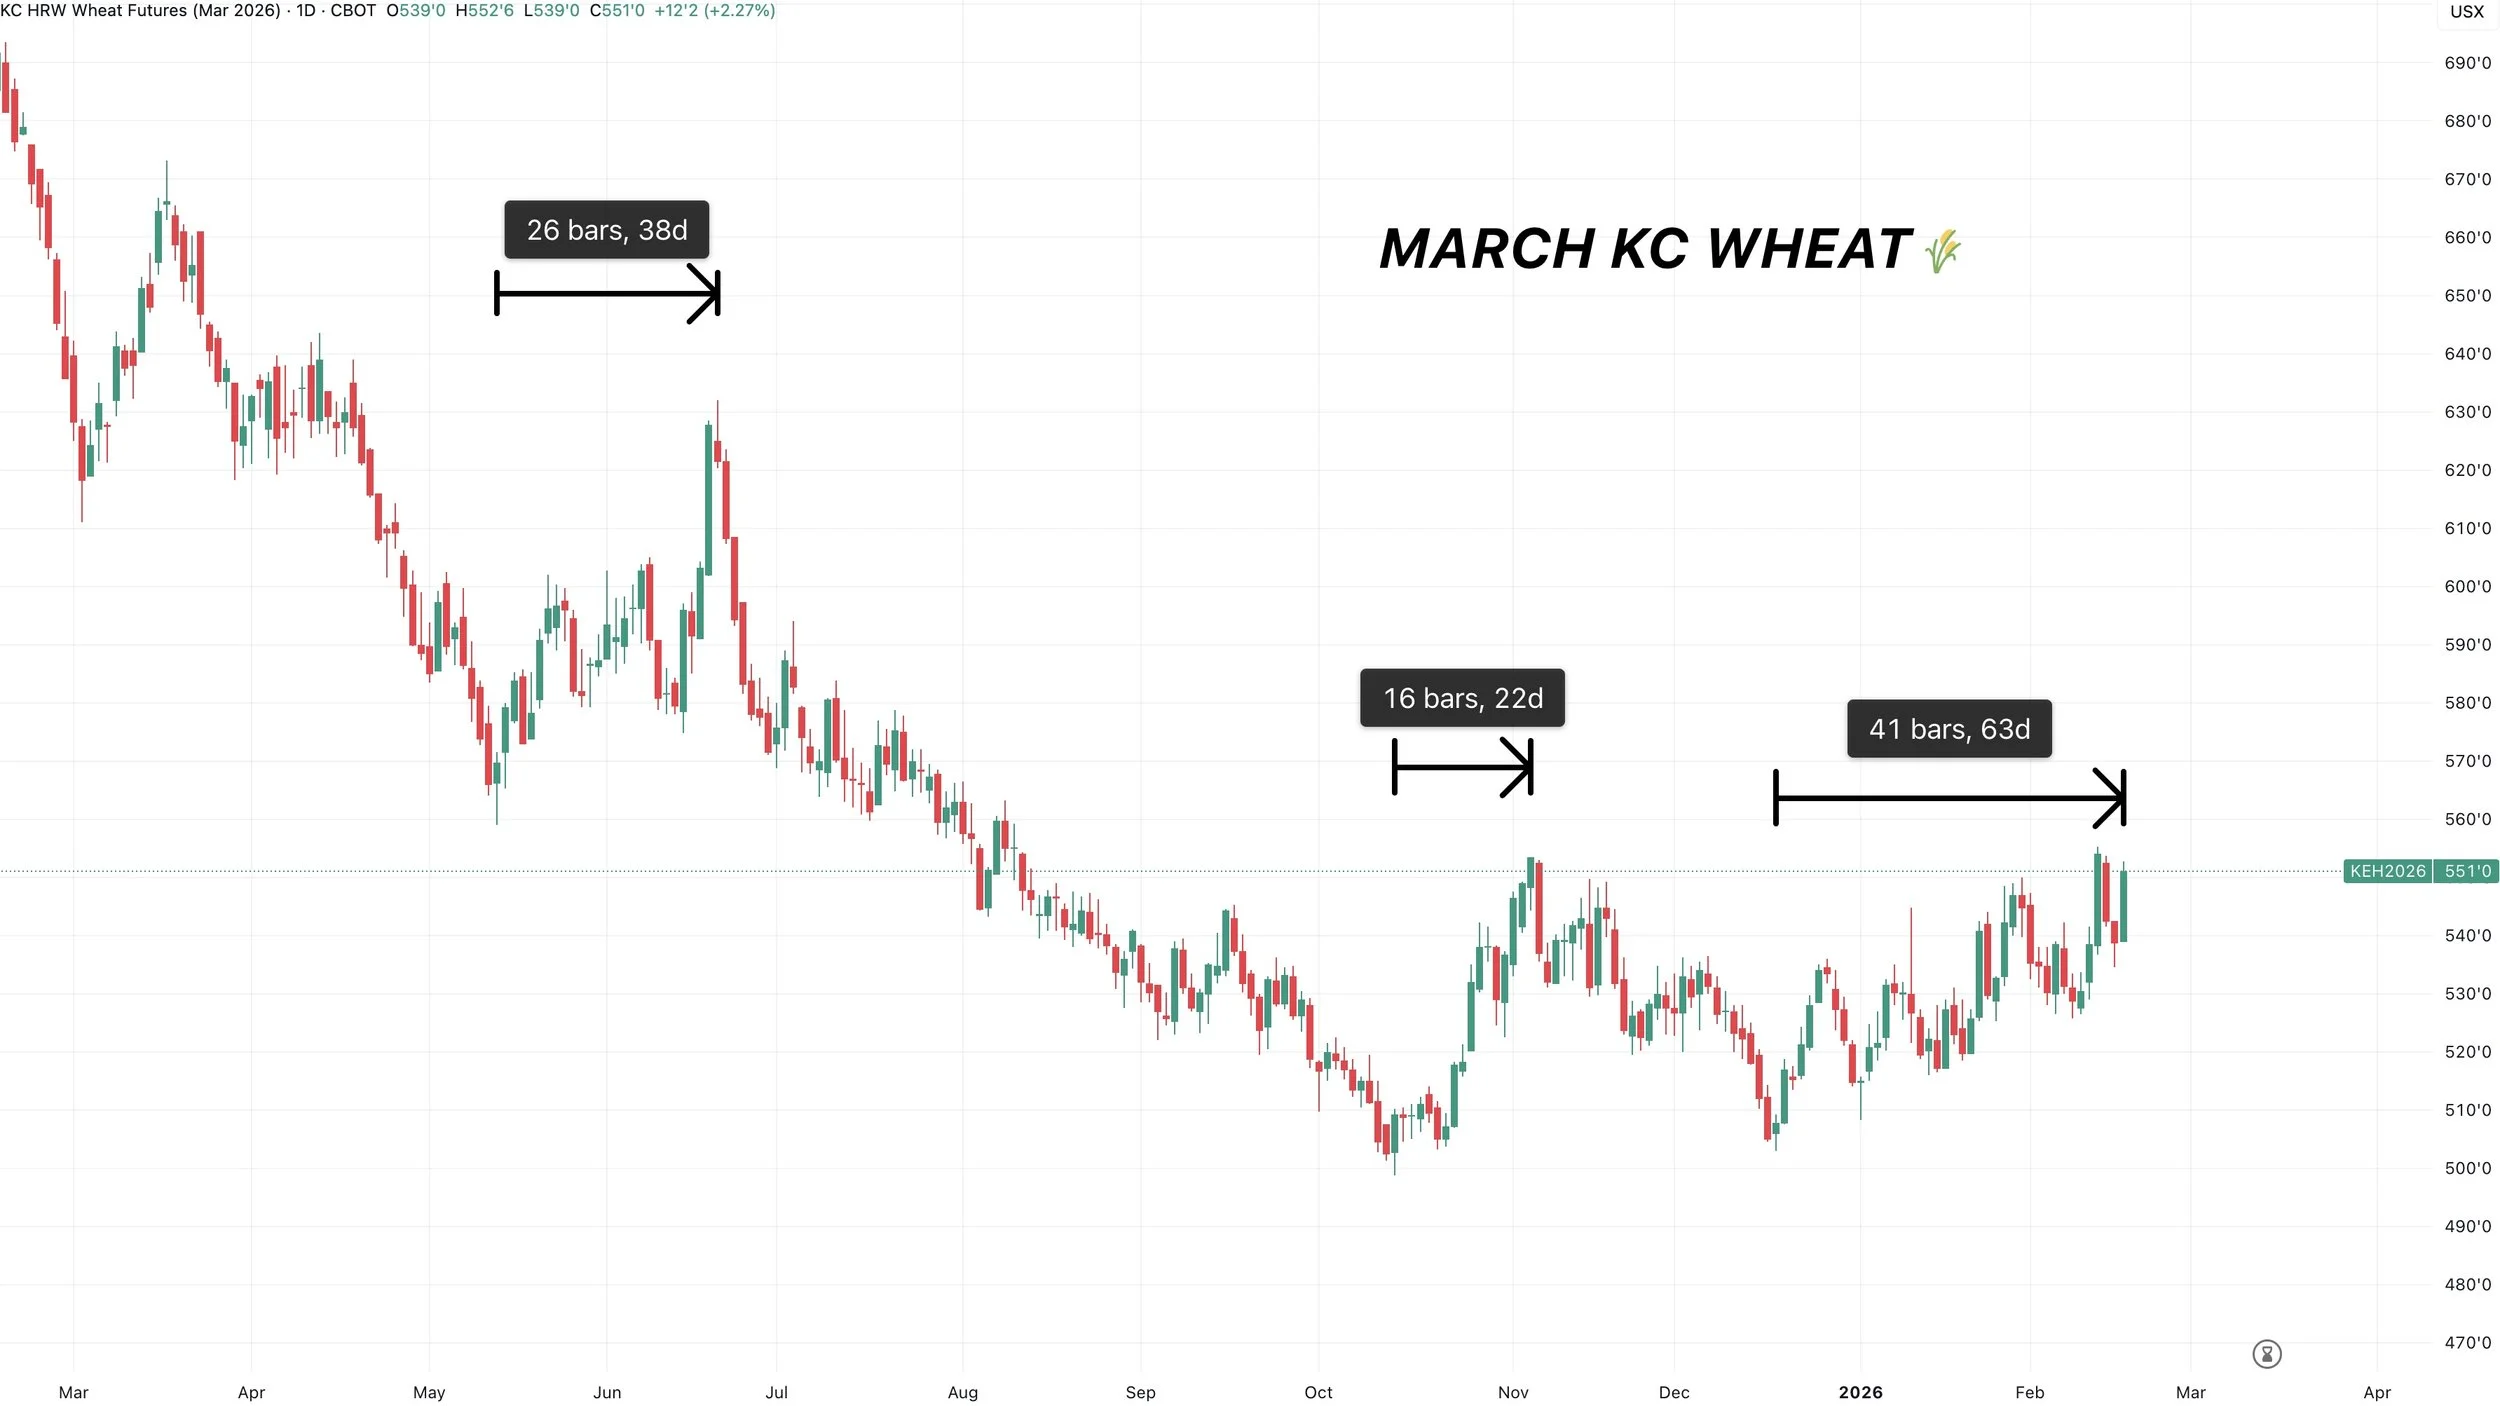
This hasn’t been the usual supply shock rally we see in the wheat market, where we run hard for a few weeks, then come crashing down. This has been a more gradual healthy rally. Which is the type of rally you want to see.
For reference:
June rally lasted 36 days.
November rally lasted 22 days.
Current rally has lasted 63 days.
Let's dive in to the charts.
Technicals:
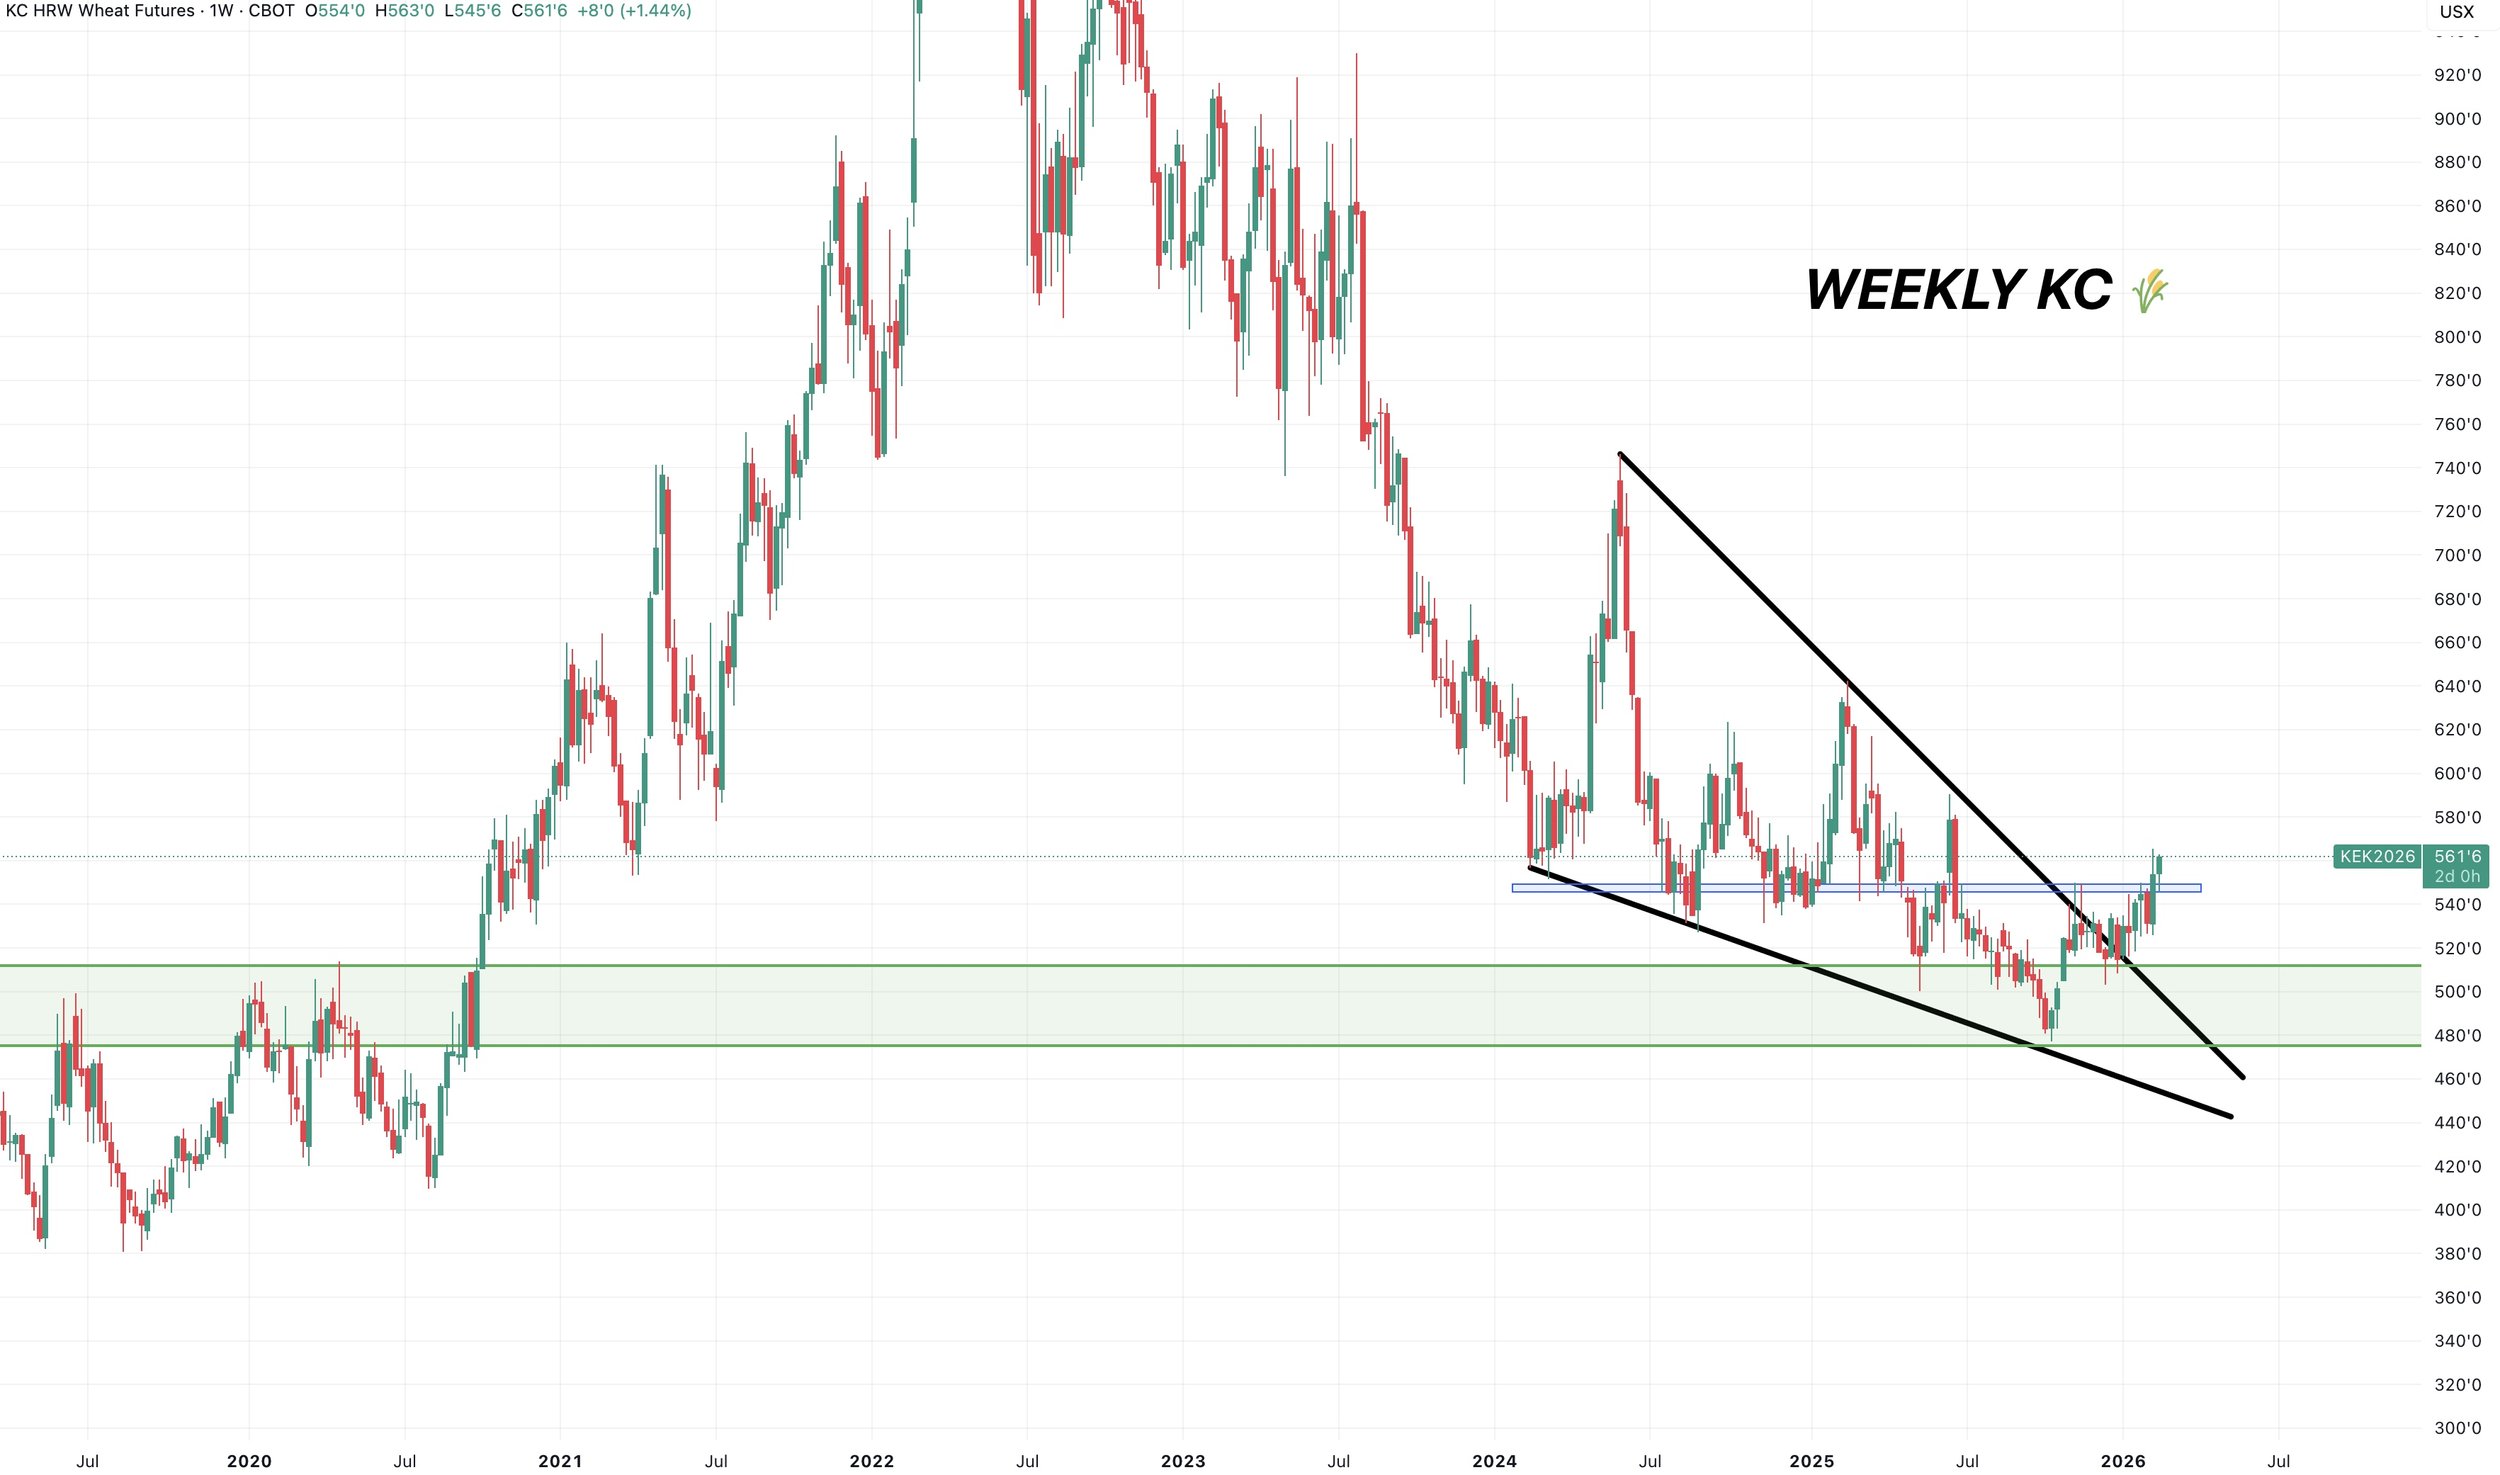
Weekly KC:
I don’t know about you, but this chart looks pretty friendly to me.
We found support right at those 2020 resistance levels.
We broke out of a multi-year falling wedge.
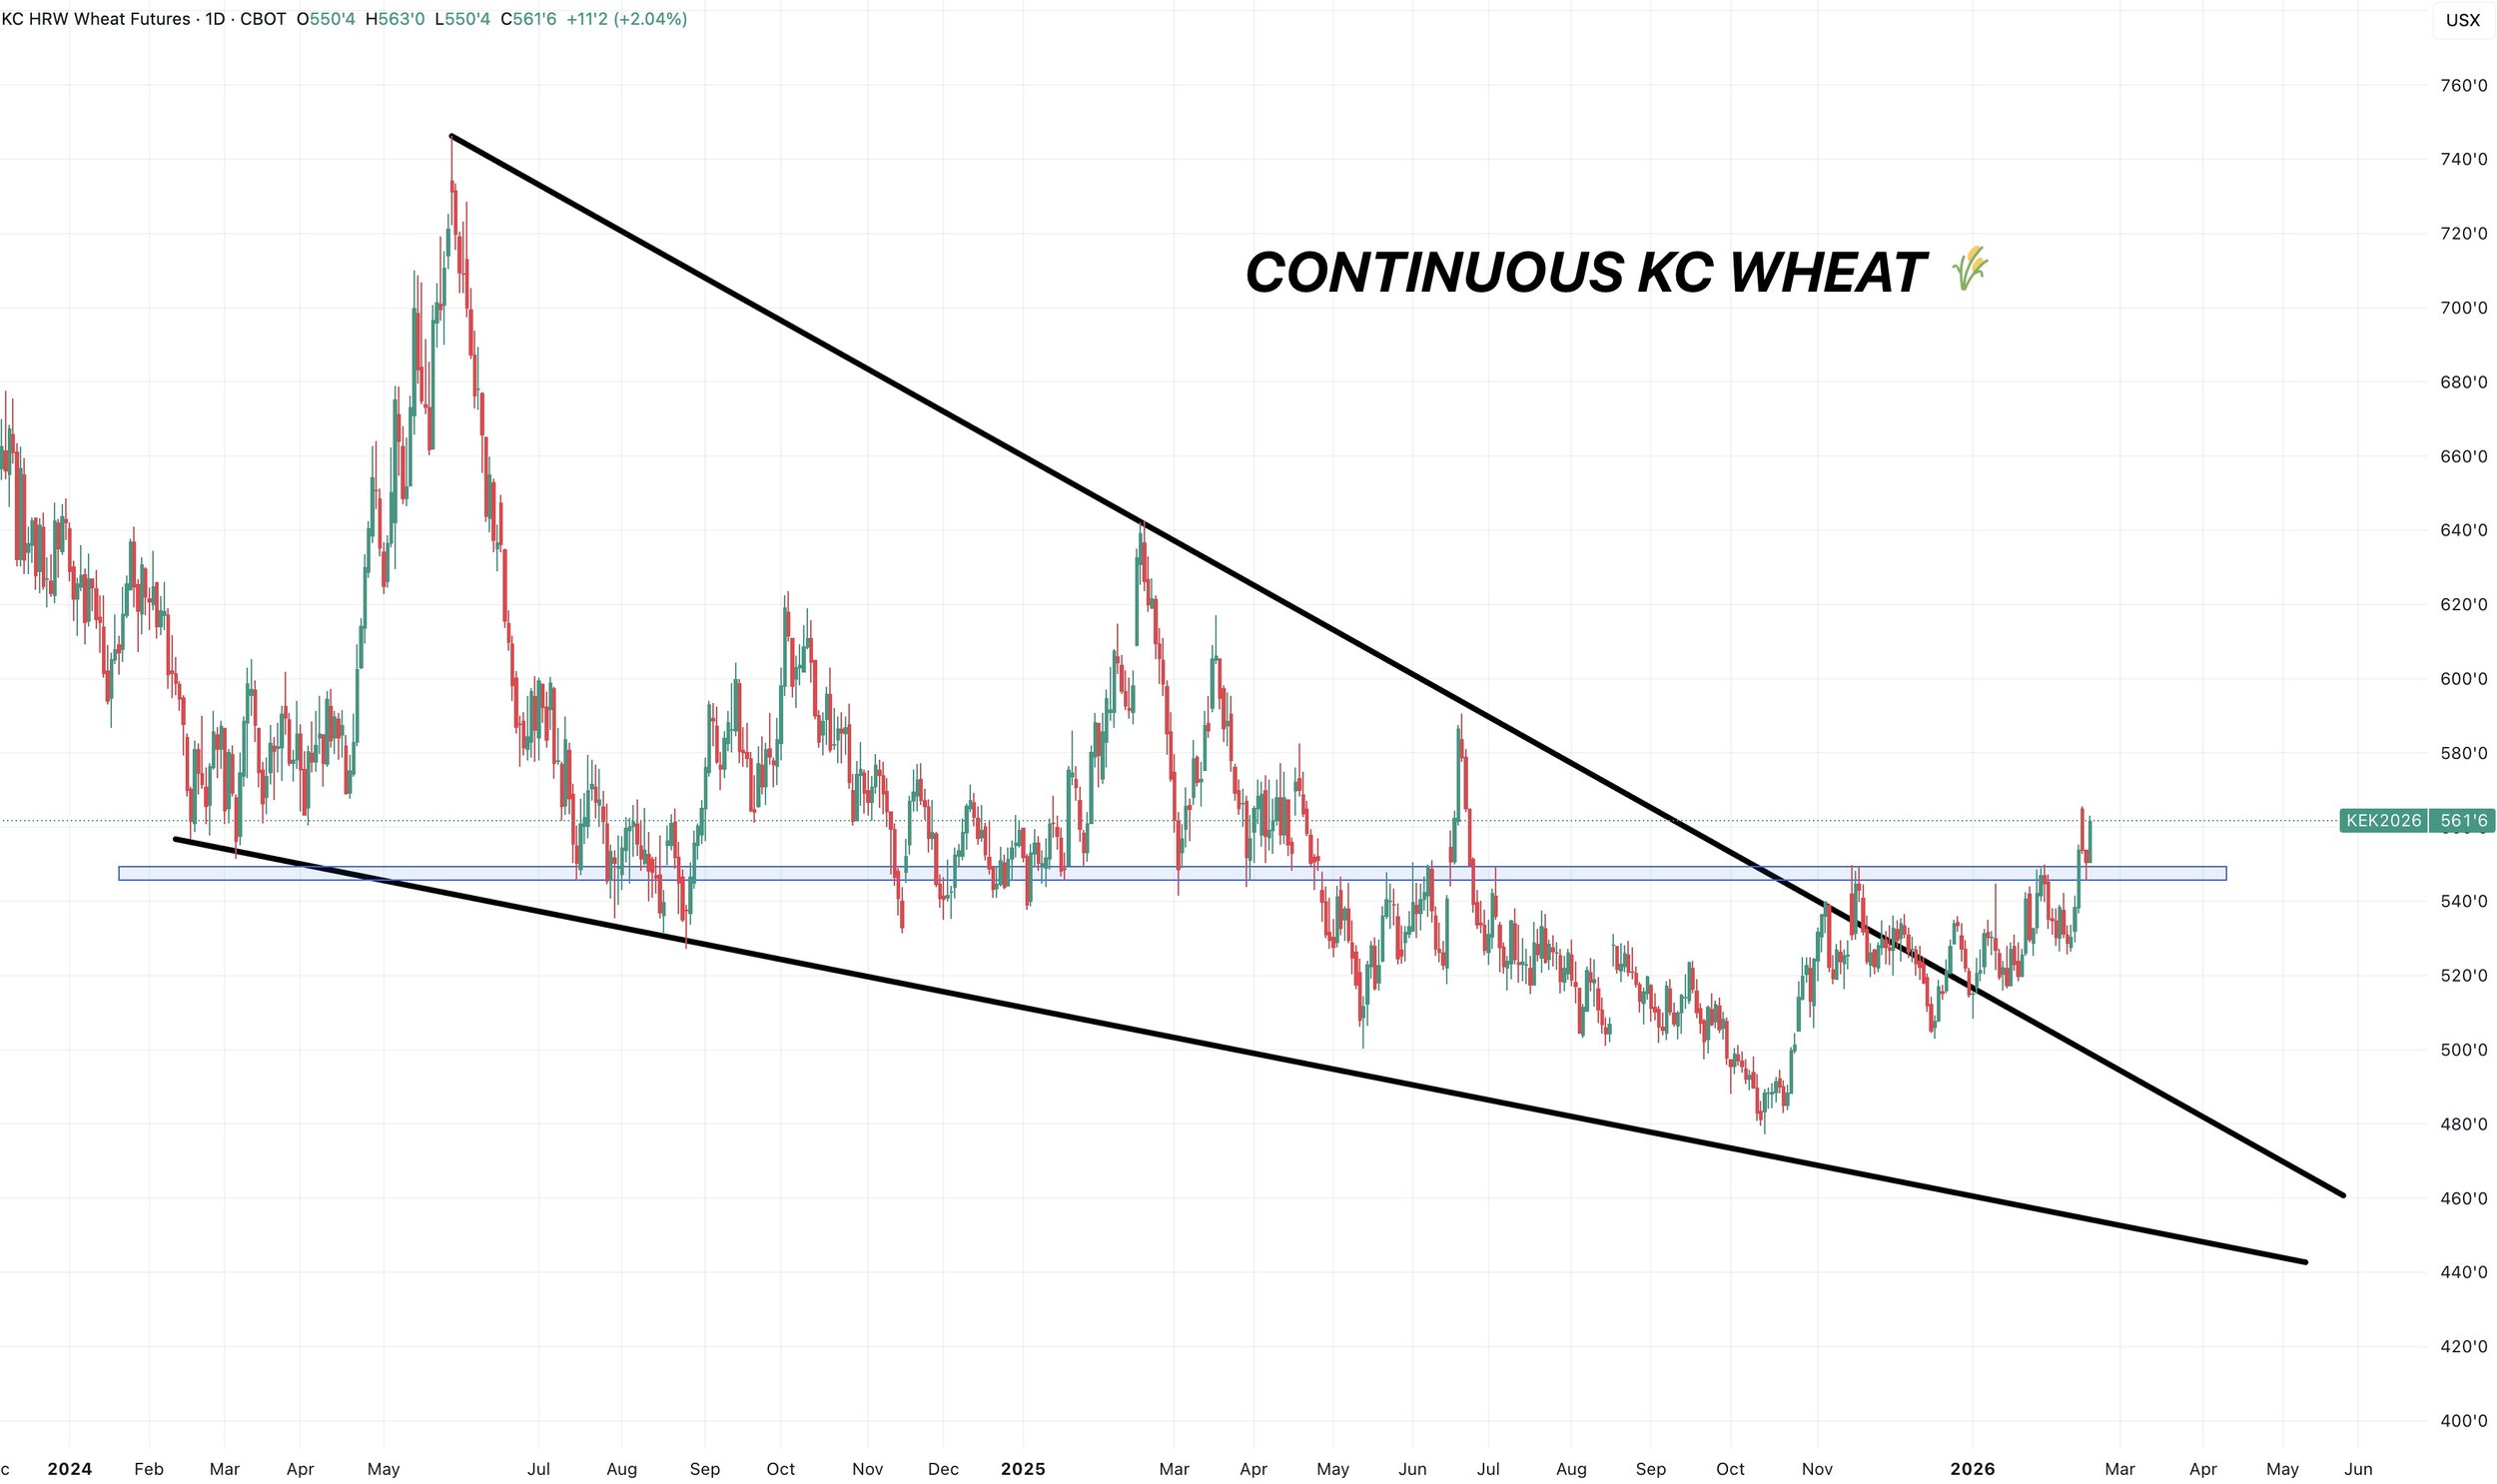
Continuous KC:
Here is another look on the daily chart.
We have a wedge breakout.
We also cleared horizontal resistance.
The chart looks friendly.
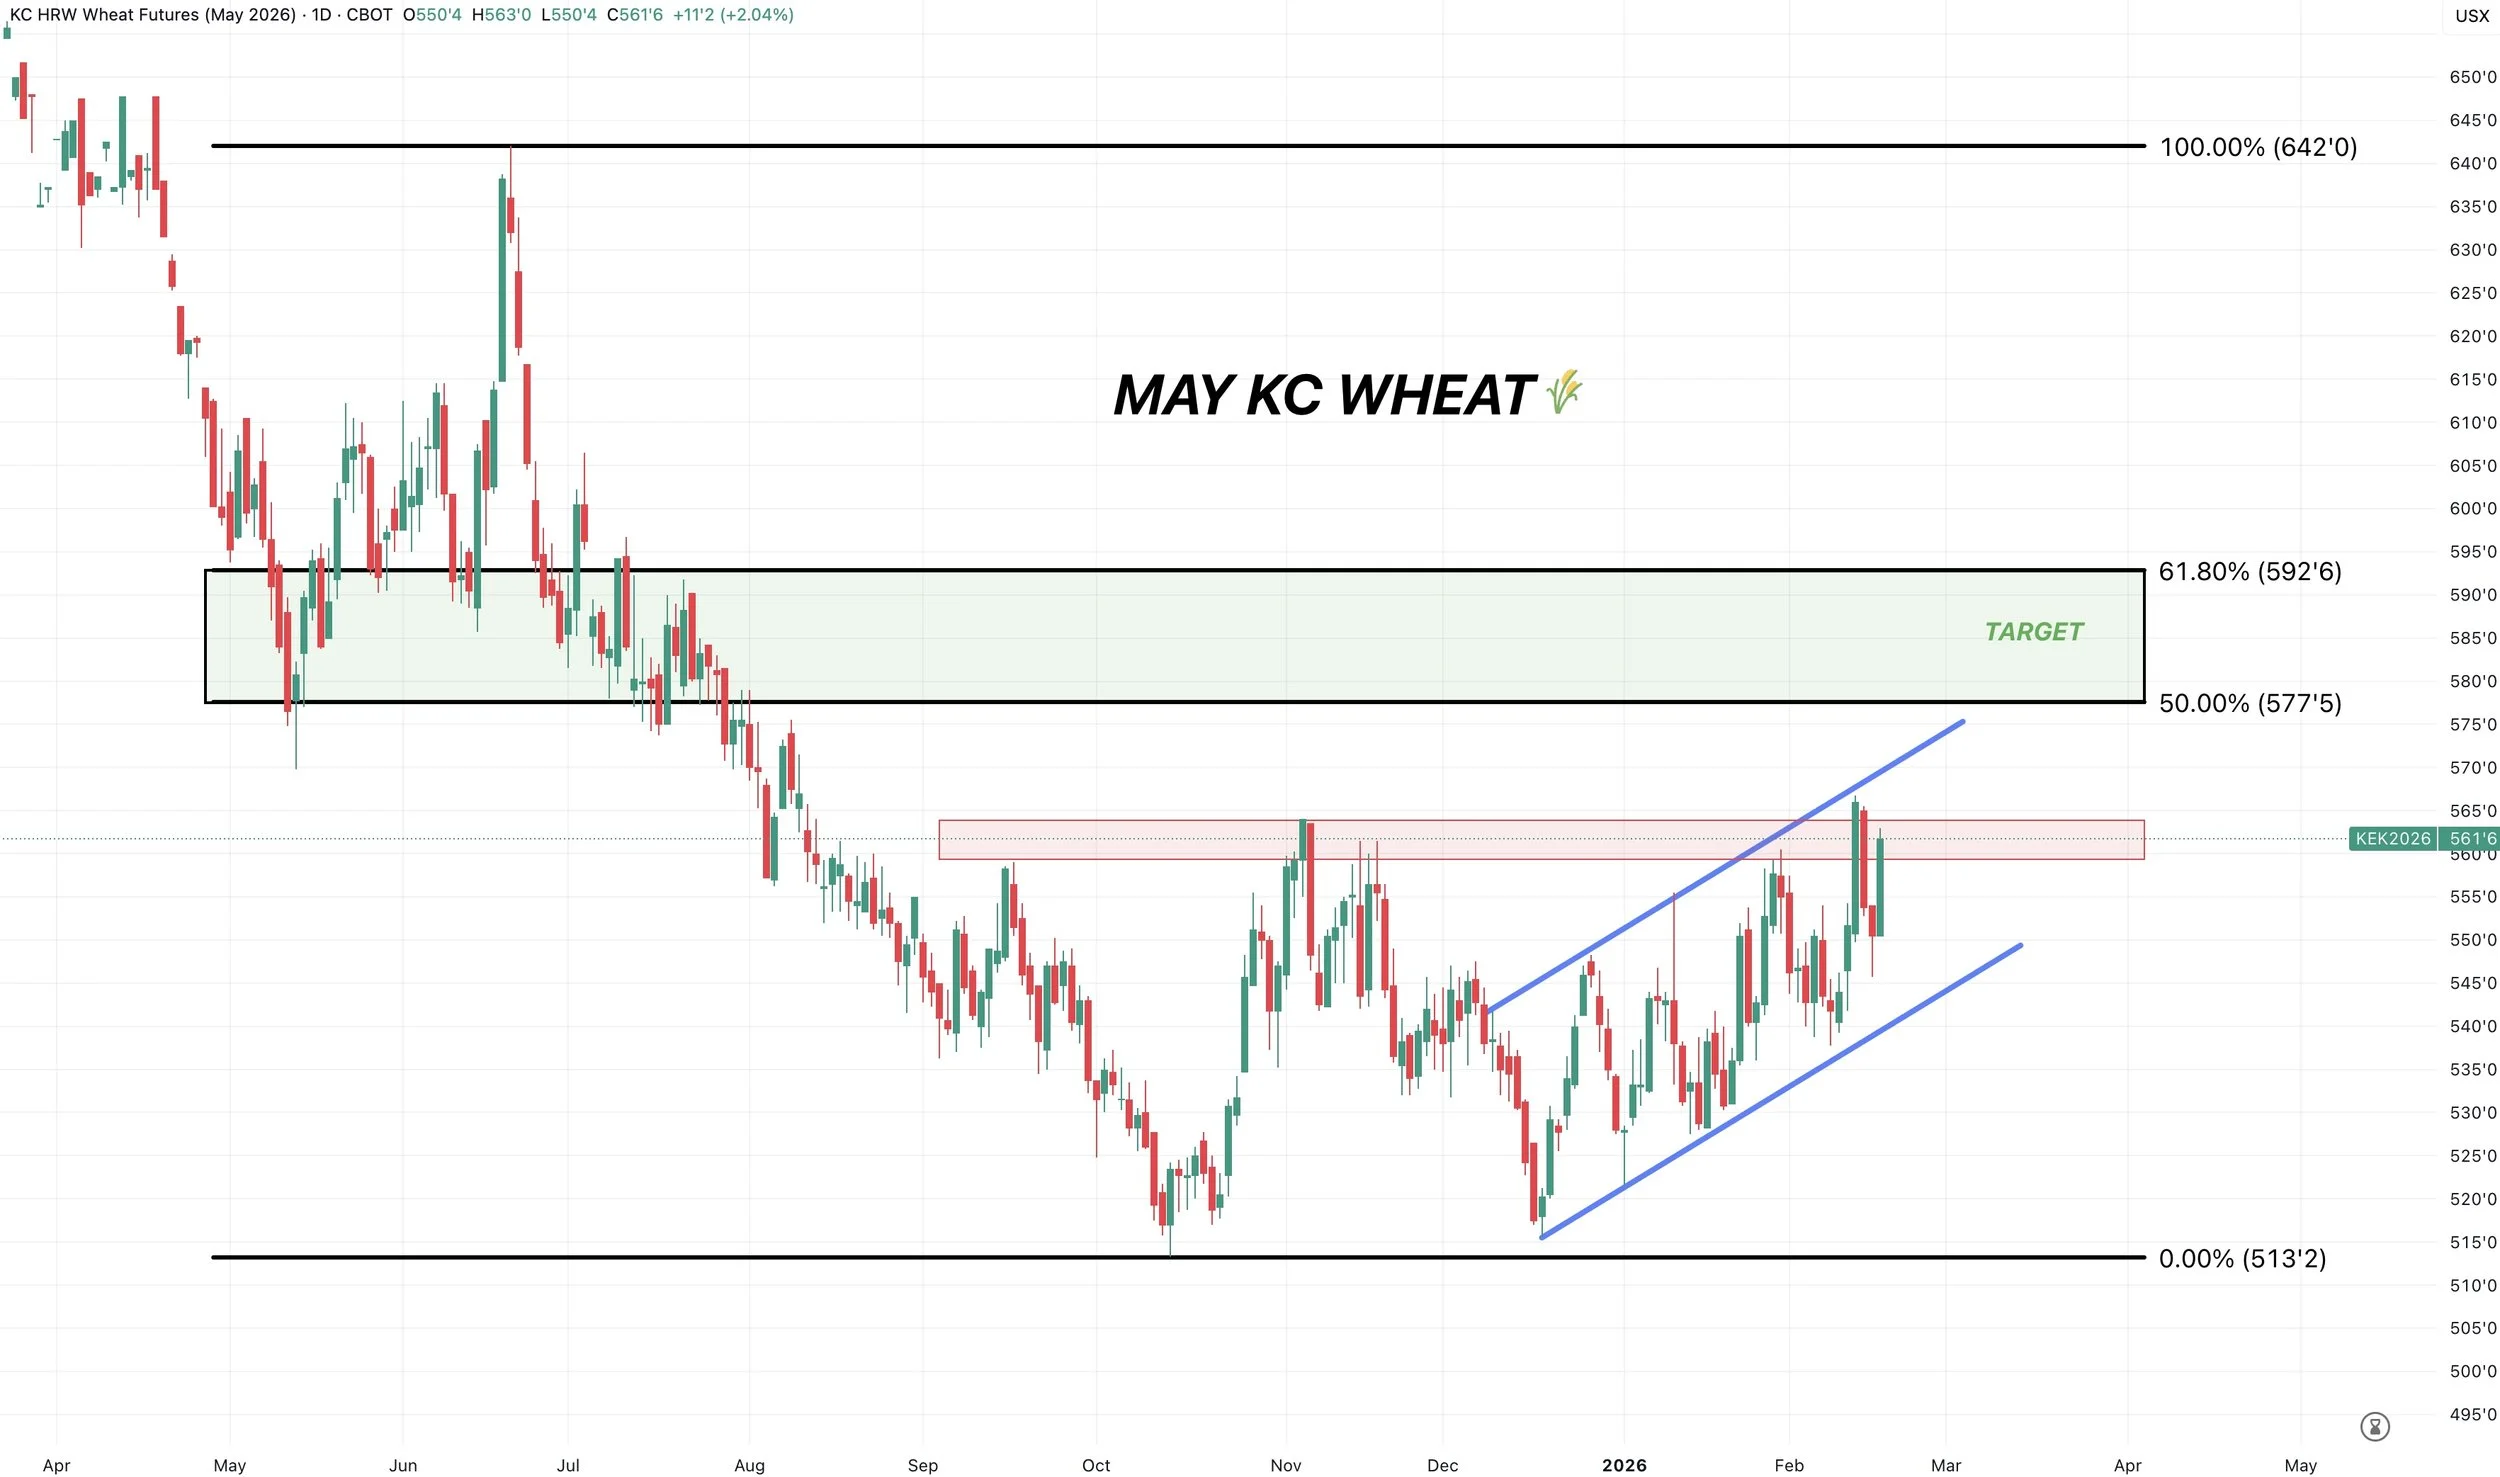
May KC:
We have a clear upward channel in place.
Battling resistance here at the November highs.
If we can clear this level, we should have room to run towards the green box.
That is where I am looking to de-risk.
The golden zone up to the June highs. It was prior support as well, so it could offer resistance.
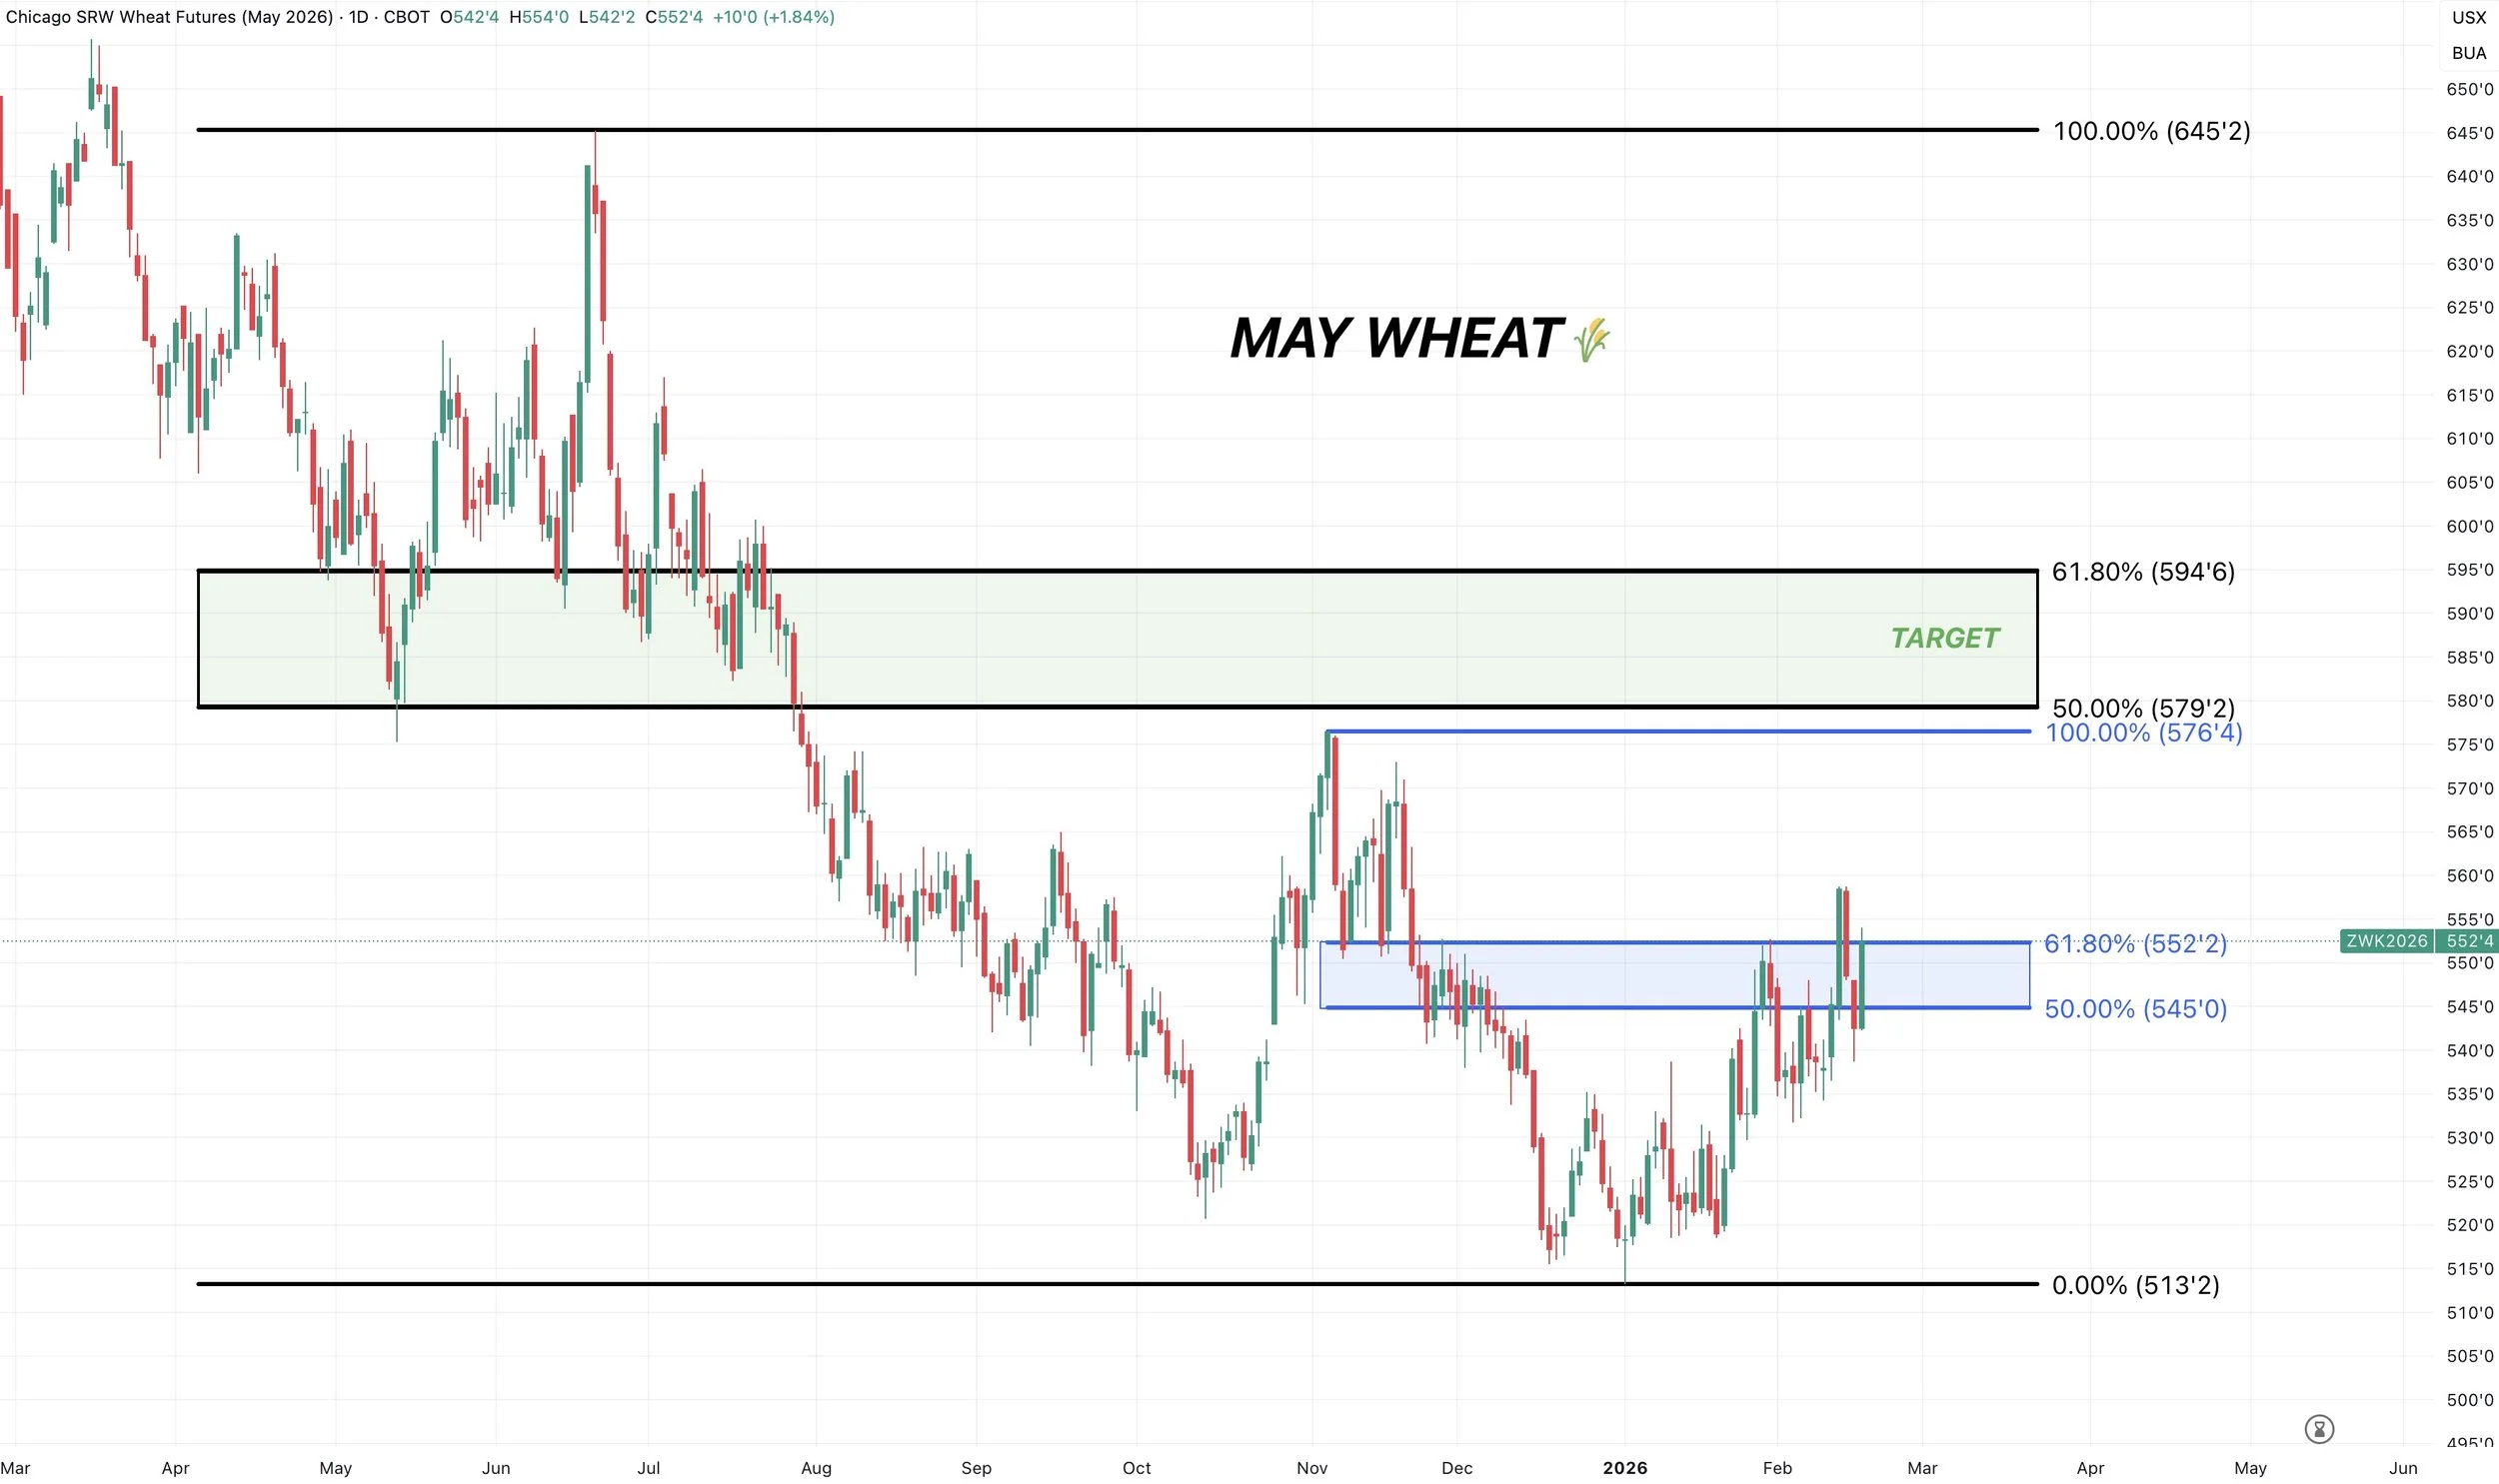
May Chicago:
We are right at the golden zone up to the November highs.
Break above this level and it should result in further upside.
Looking to reward a move towards the green box.
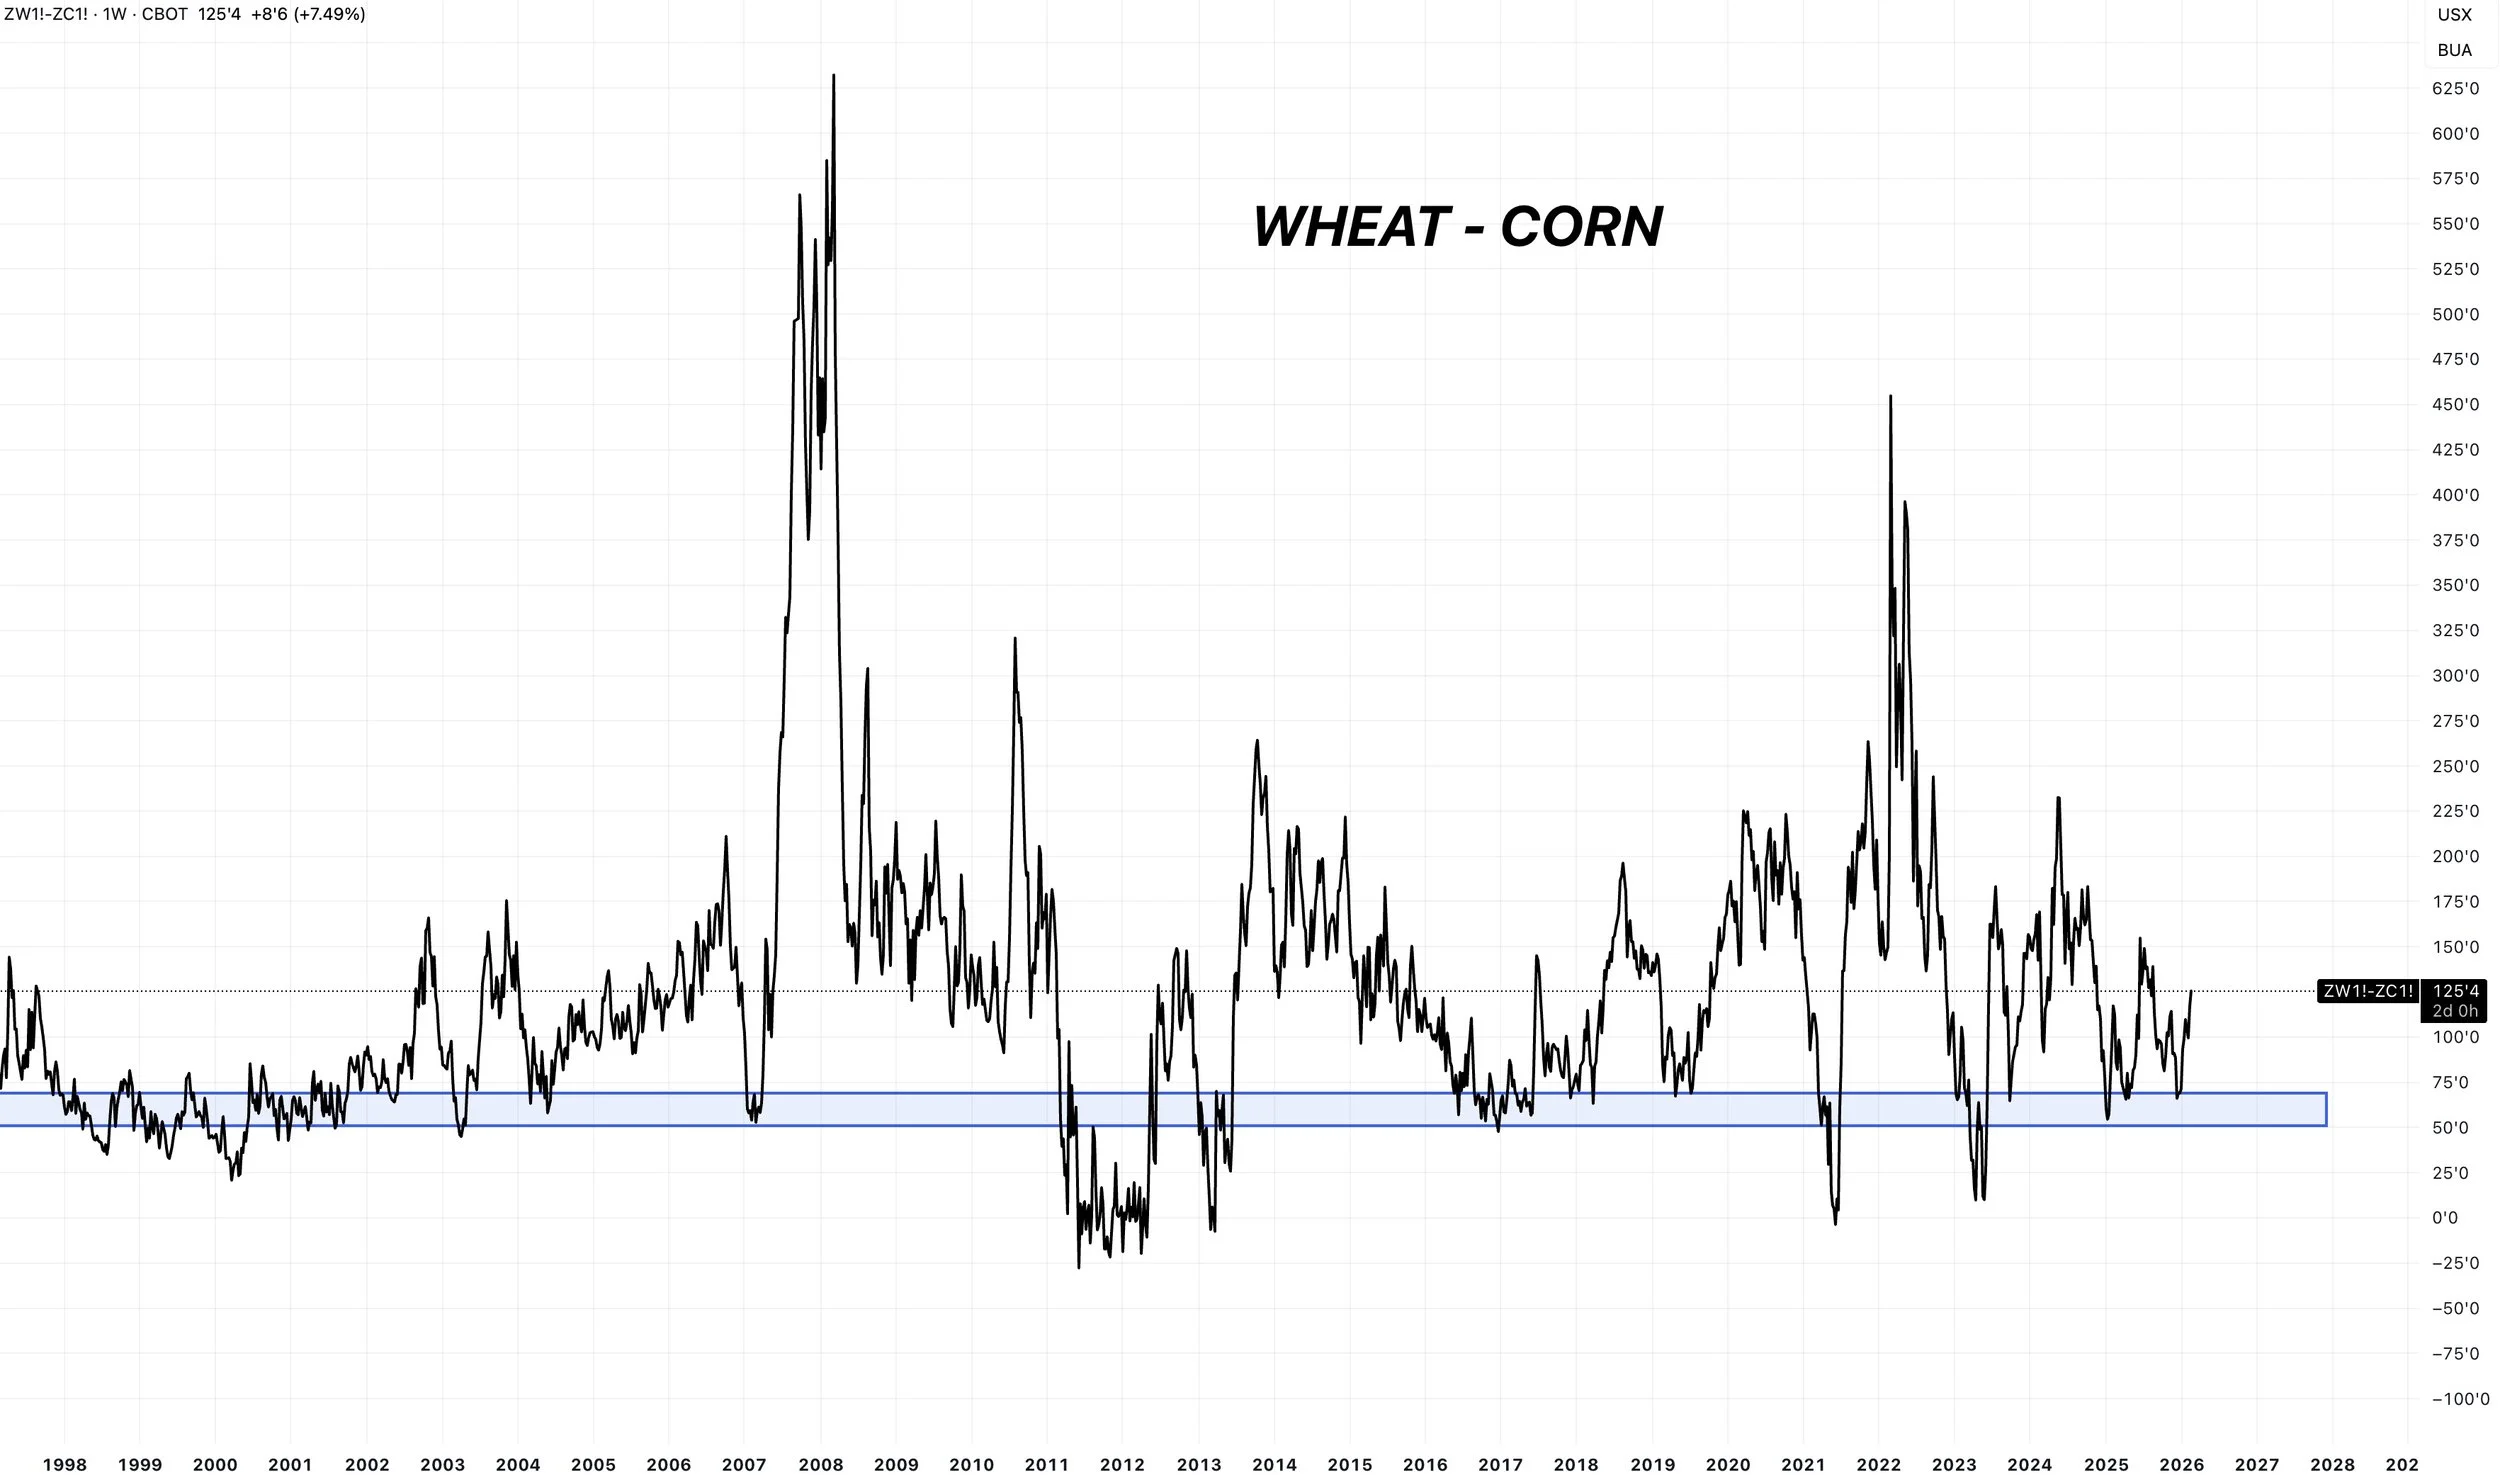
Wheat-Corn Spread:
Here is the spread.
It looks like wheat could very well be set to outperform corn.
Cattle
Nothing to update on cattle today as there is limited news and choppy trade.
We do have a cattle on feed report on Friday.
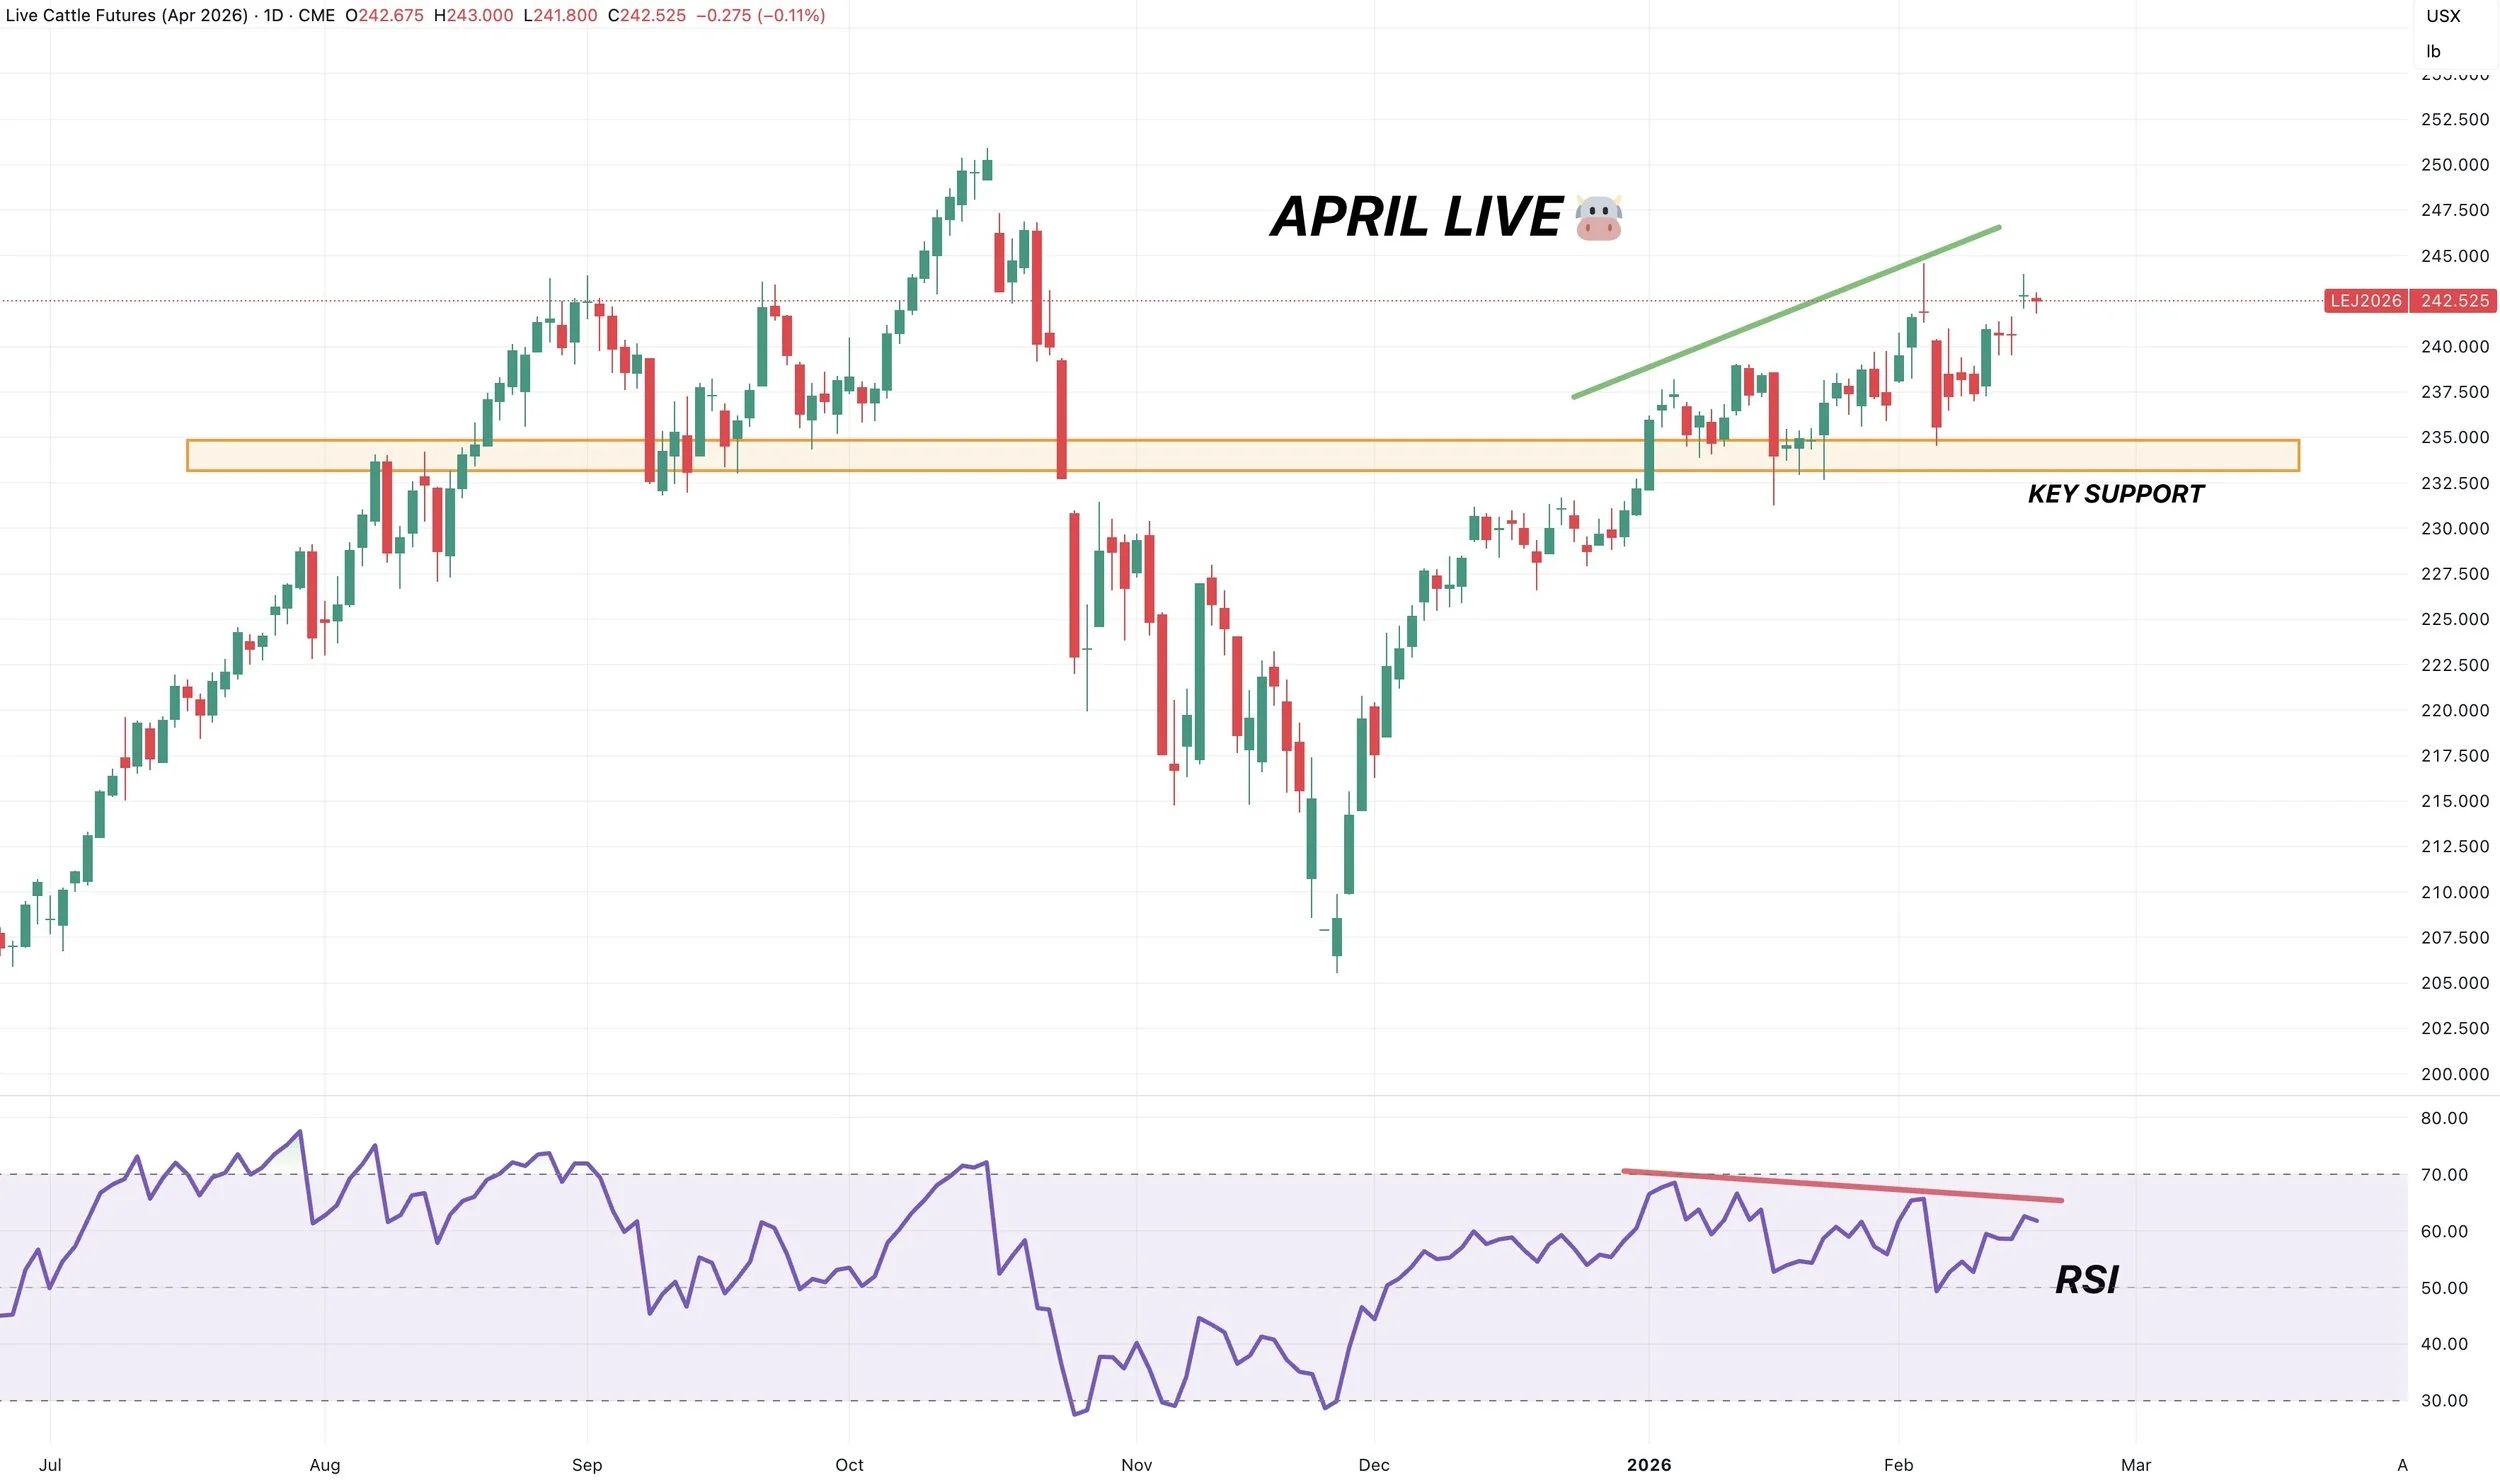
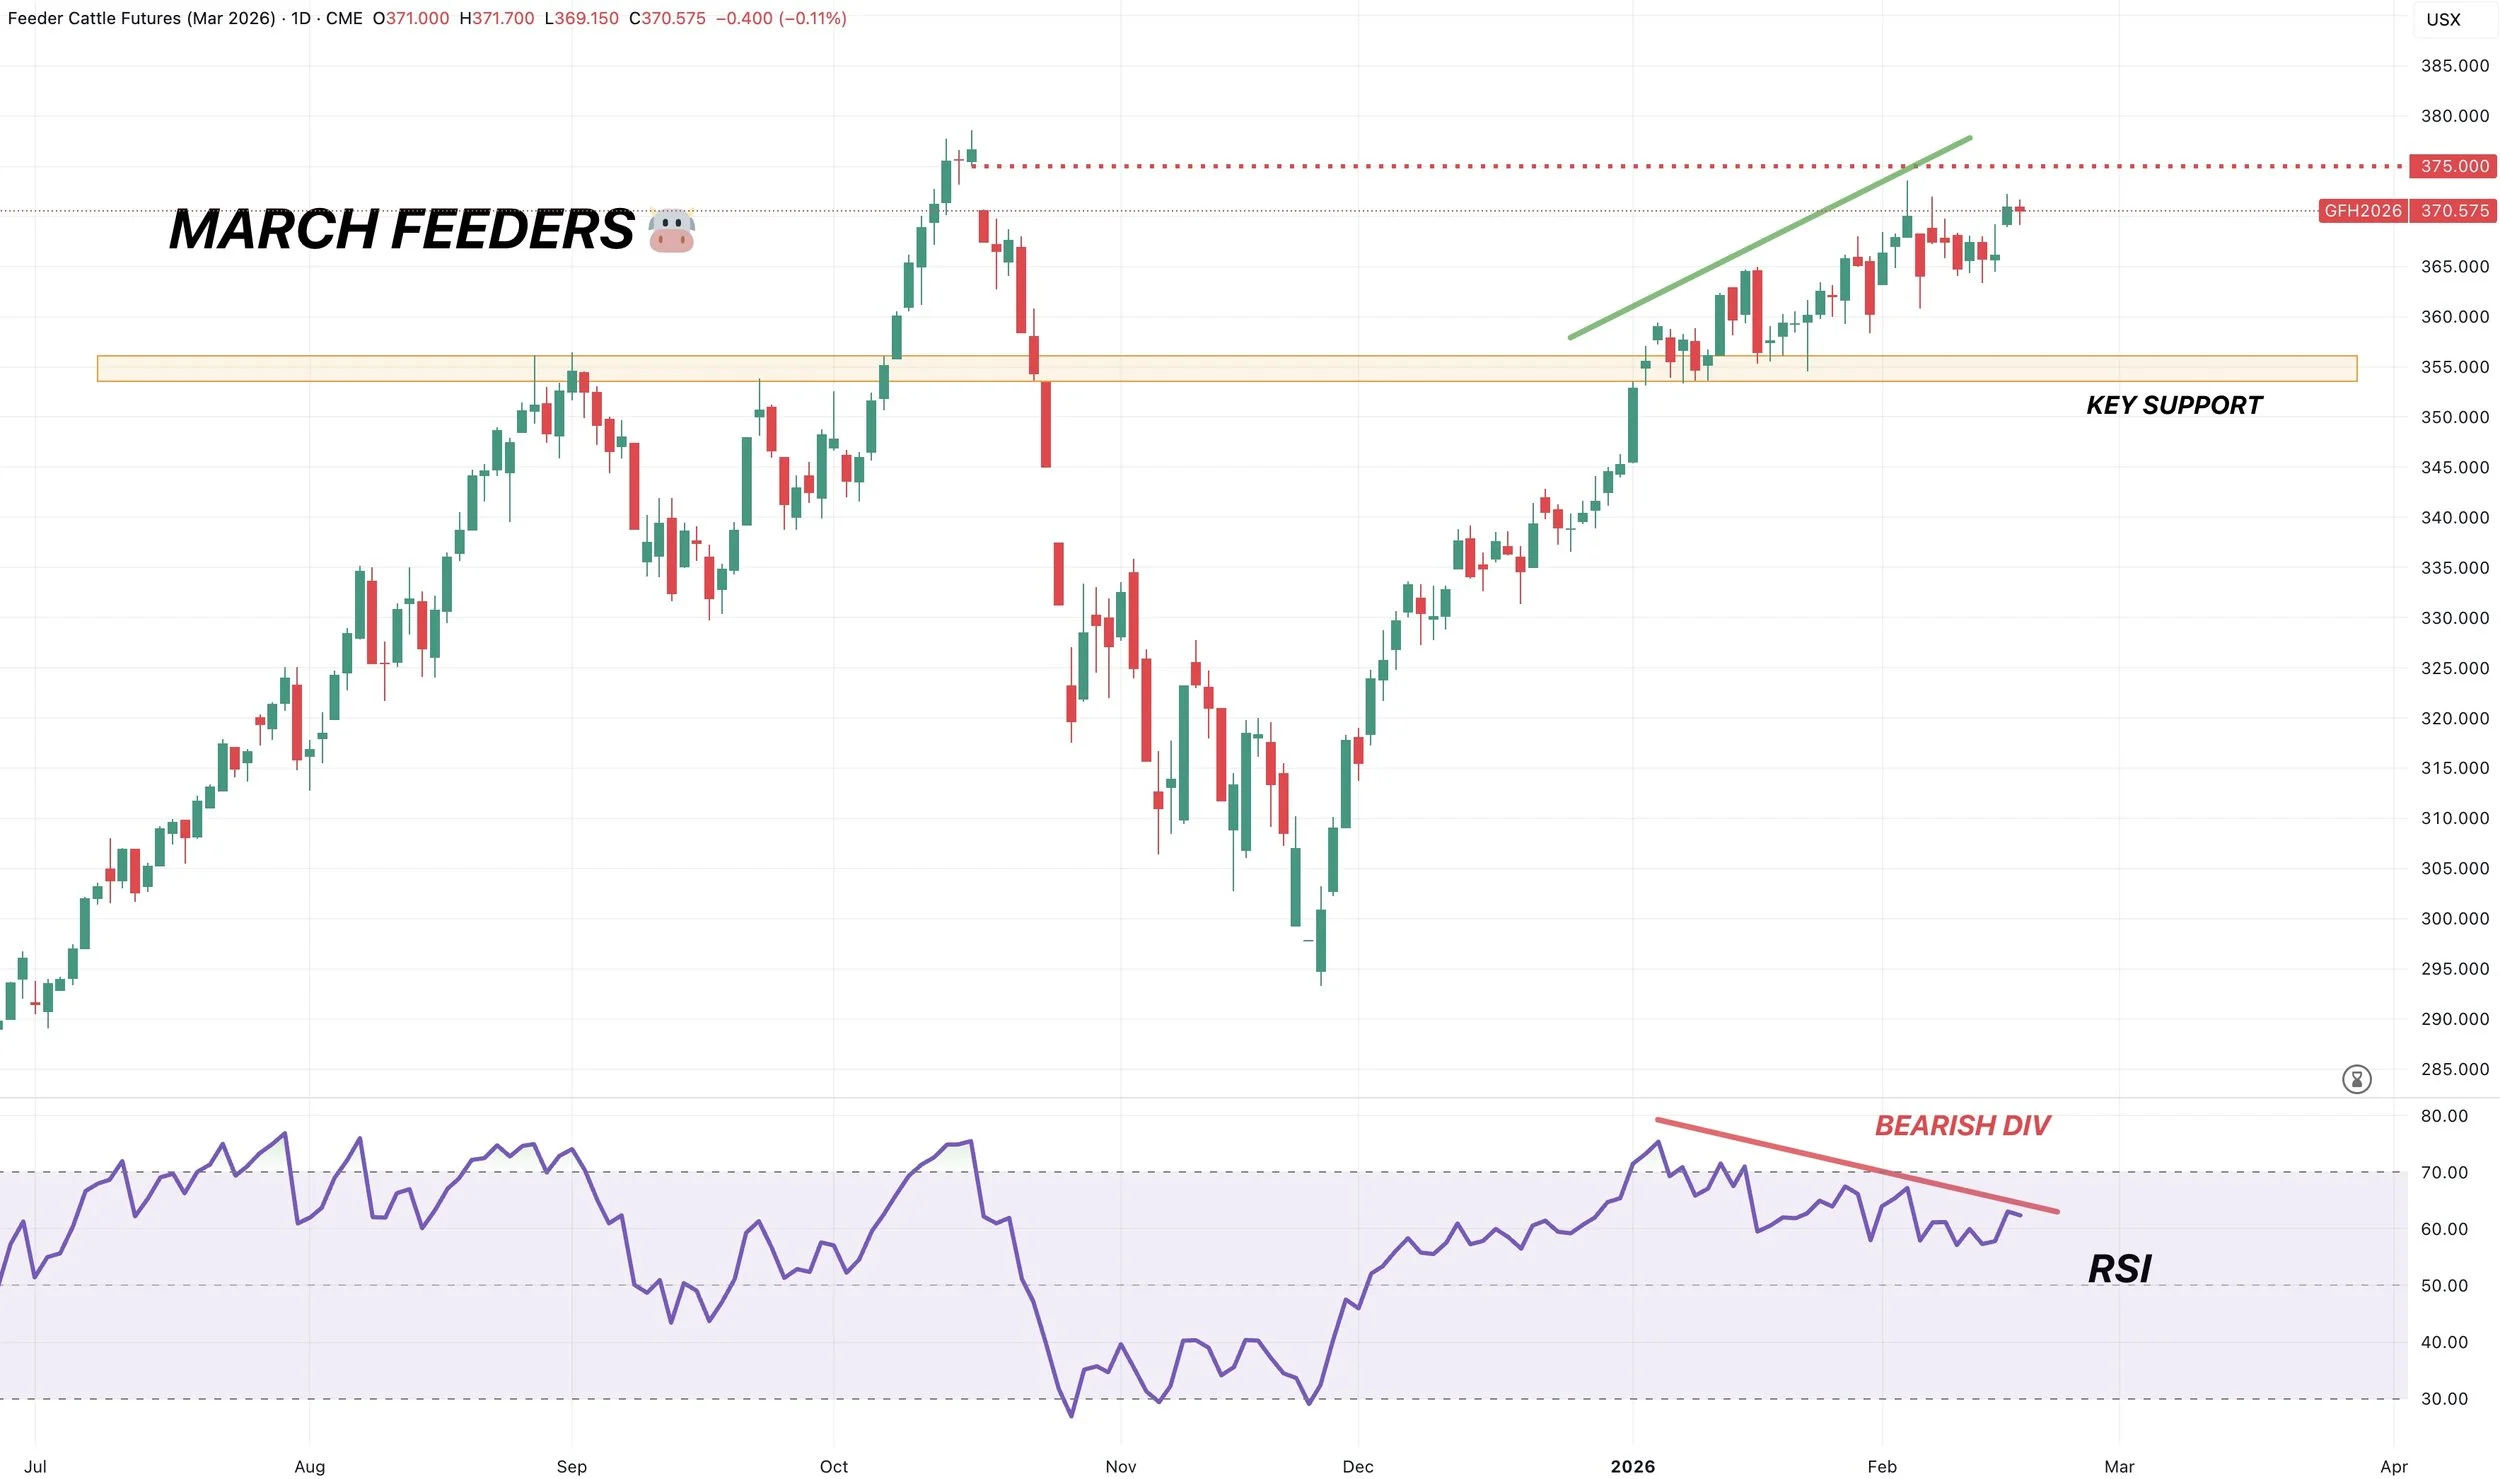
Overall, I'm still using caution in this market. As it still feels like it might take an outside catalyst to soar to new all-time highs.
The charts are still giving us a reason to be cautious.
As we are still showing very clear definitive bearish divergence on the RSI for both live and feeders.
Hinting that our upside momentum is slowing down. Basically, a possible warning sign.
April Live
March Feeders
Past Sell or Protection Signals
Feb 6th: 🌽 🌱
Corn & soybean sell signal & hedge alert.
Feb 4th: 🌱
Soybean sell signal & hedge alert.
Dec 11th: 🐮
Cattle sell signal & hedge alert.
Dec 5th: 🐮
Cattle sell signal & hedge alert.
Nov 17th: 🌱
Soybean sell signal & hedge alert.
Nov 13th: 🌽 🌱
Managing risk in corn & beans ahead of USDA report.
Oct 28th: 🌽
Corn sell signal & hedge alert.
Oct 27th: 🌱
Soybean sell signal & hedge alert.
Oct 13th: 🐮
Cattle sell signal & hedge alert.
Aug 22nd: 🌱
Soybean sell signal & hedge alert.
July 31st: 🐮
Cattle sell signal & hedge alert.
July 10th: 🐮
Cattle sell signal & hedge alert.
CLICK HERE TO VIEW
June 5th: 🐮
Cattle sell signal & hedge alert.
June 2nd: 🌾
MPLS wheat sell signal.
April 10th: 🌽
Old crop corn sell signal.
March 19th: 🐮
Cattle hedge & sell signal.
Feb 18th: 🌽 🌾
Old crop KC wheat & old crop corn signal.
Jan 23rd: 🌽 🌱
Corn & beans old crop sell signal.
CLICK HERE TO VIEW
Jan 15th: 🌽 🌱
Corn & beans hedge alert/sell signal.
Jan 2nd: 🐮
Cattle hedge alert at new all-time highs & target.
Dec 11th: 🌽
Corn sell signal at $4.51 200-day MA
CLICK HERE TO VIEW
Oct 2nd: 🌾
Wheat sell signal at $6.12 target
Sep 30th: 🌽
Corn protection signal at $4.23-26
Sep 27th: 🌱
Soybean sell & protection signal at $10.65
Sep 13th: 🌾
Wheat sell signal at $5.98
May 22nd: 🌾
Wheat sell signal when wheat traded +$7.00
Want to Talk?
Our phones are open 24/7 for you guys if you ever need anything or want to discuss your operation.
Hedge Account
Interested in a hedge account? Use the link below to set up an account or shoot Jeremey a call at (605)295-3100.