
NEARING CATTLE TARGET. DOES CHINA NEED CORN?
MARKET UPDATE
You can scroll to read the usual update as well. As the written version is the exact same as the video.
Timestamps for video:
Overview: 0:00min
Corn: 4:50min
Beans: 9:30min
Wheat: 13:50min
Cattle: 15:45min
Want to talk about your situation?
(605)250-3863
Futures Prices Close

Overview
Grains and cattle both higher across the board today.
As grains erase most of their losses from yesterday while the cattle market has now traded higher the past 5 of 6 days.
Feeders are now 37 bucks of their lows and live cattle is about 20 bucks off it's lows from just last week.
We are approaching some pretty big points of interest on the cattle charts, and will likely be alerting a hedge alert and sell signal here soon if those areas hit.
As always cattle is at the end of the update after the grains. So cattle guys make sure you check that out.
Let's jump into the news.
China & Soybean Confusion
There is a lot of miscommunication surrounding the entire China and soybean fiasco.
Some thought that the 12 MMT of soybeans China agreed to buy is for the entire marketing year. Meaning they have until September 2026.
Not the end of the year.
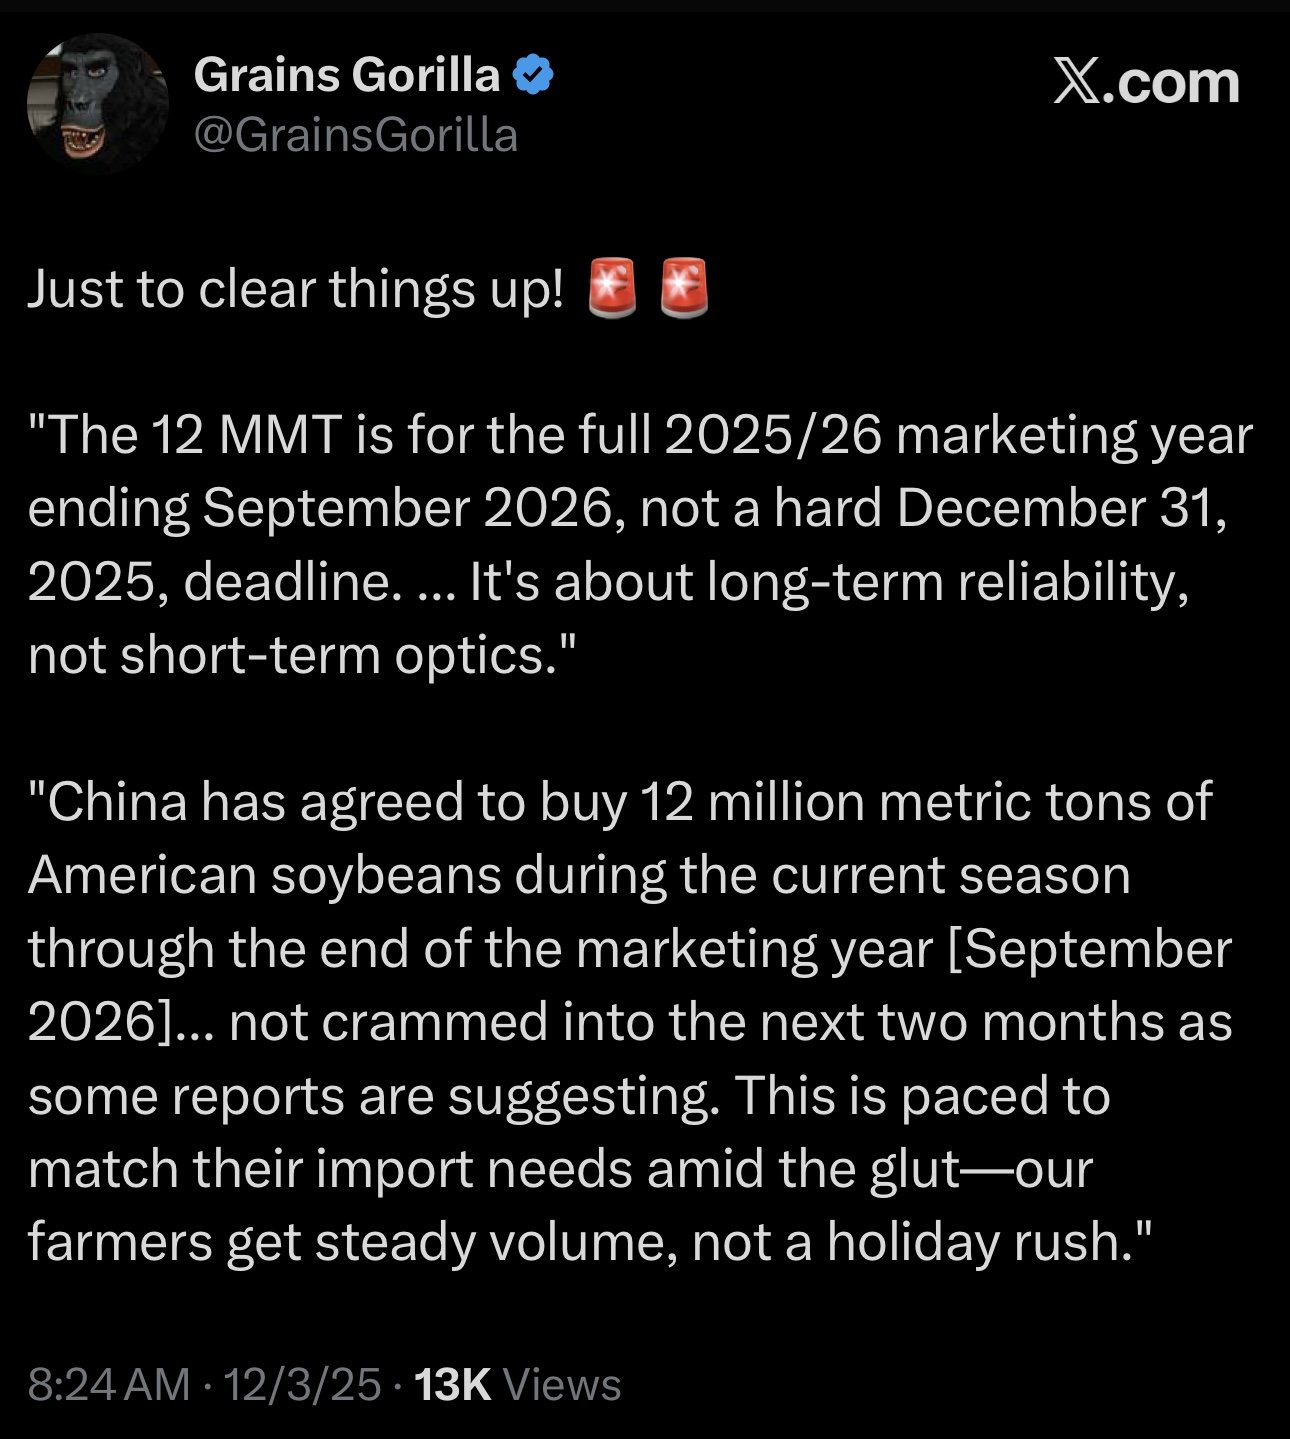
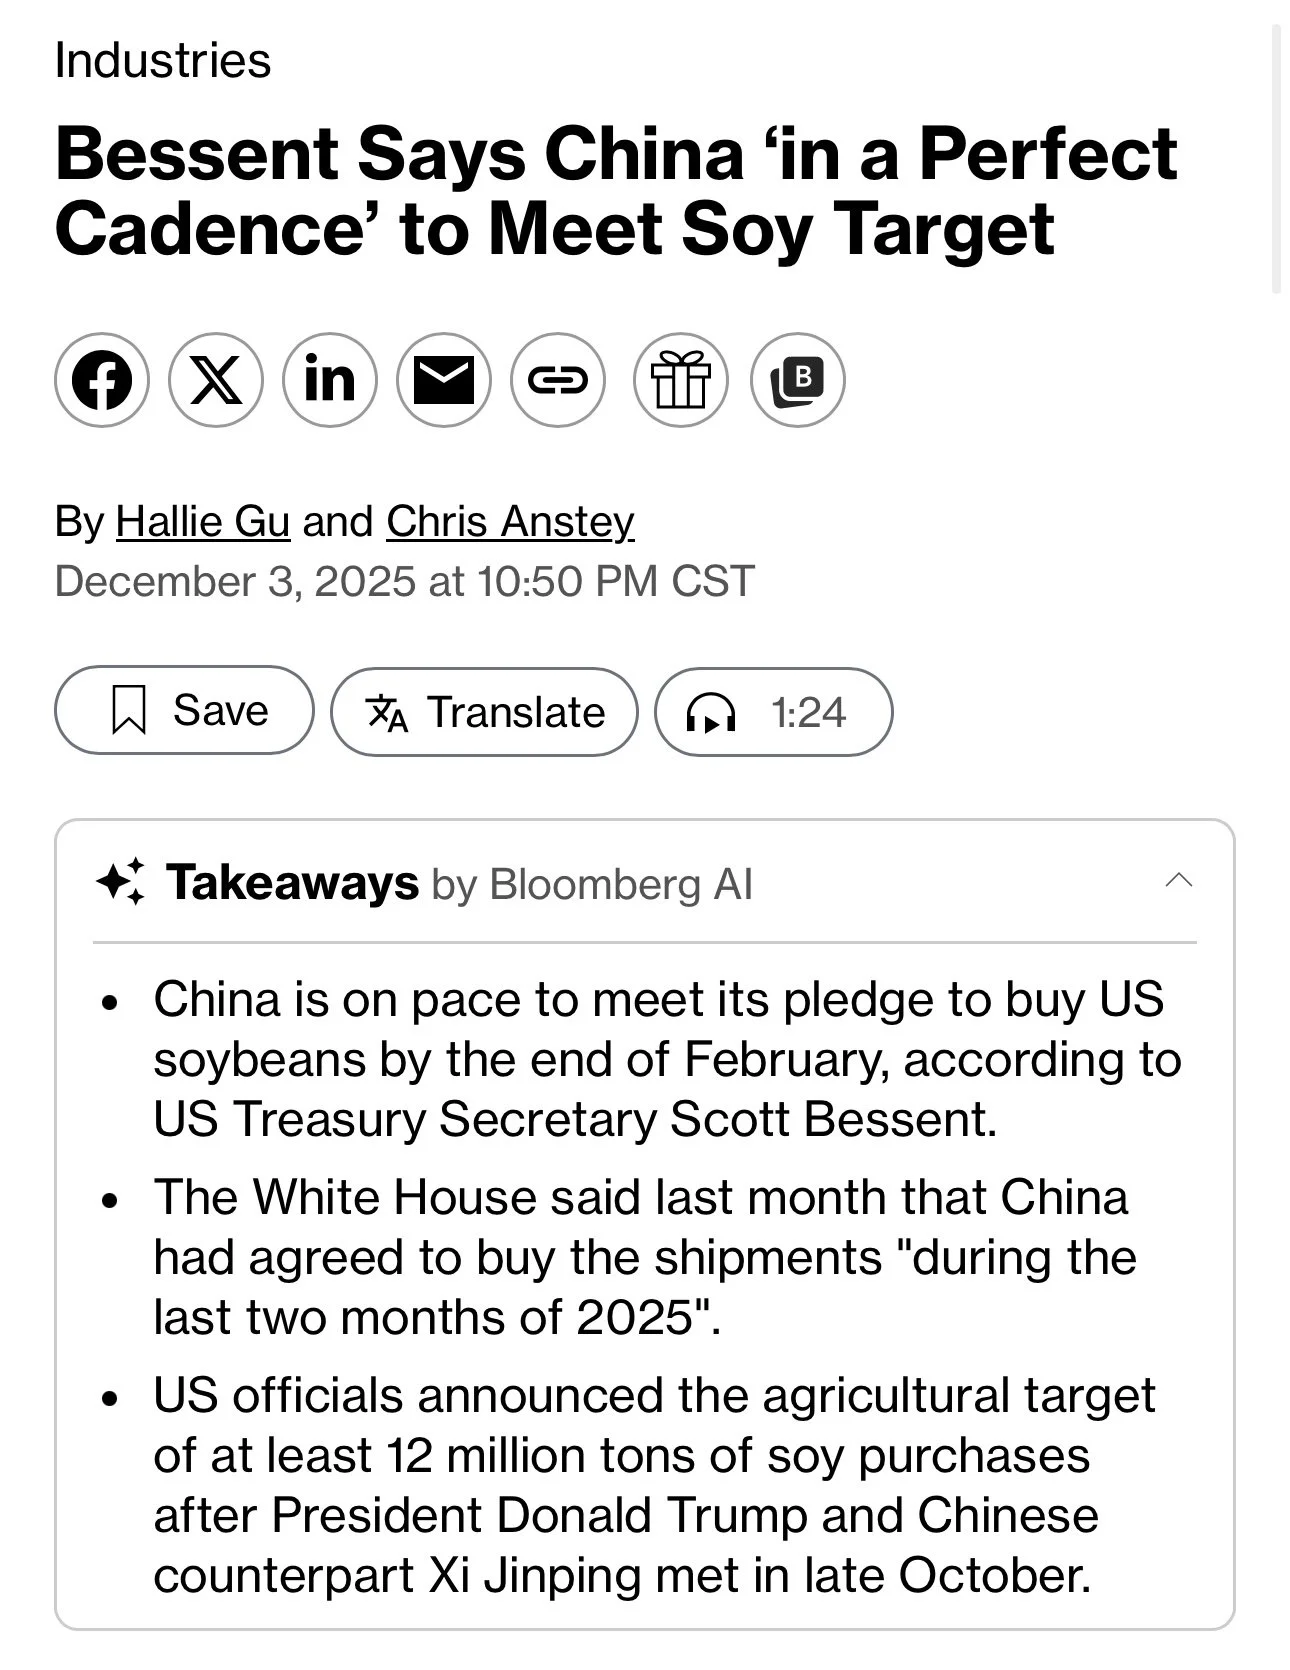
Scott Bessent then, in an interview yesterday, stated China is on "cadence" to meet their purchases.
He basically said the White House never claimed the purchases would be met by the end of the year.
He said it was always the "season" that ends Feb 28th.
Which doesn’t make much sense to begin with because there isn’t a season that ends Feb 28th to begin with.

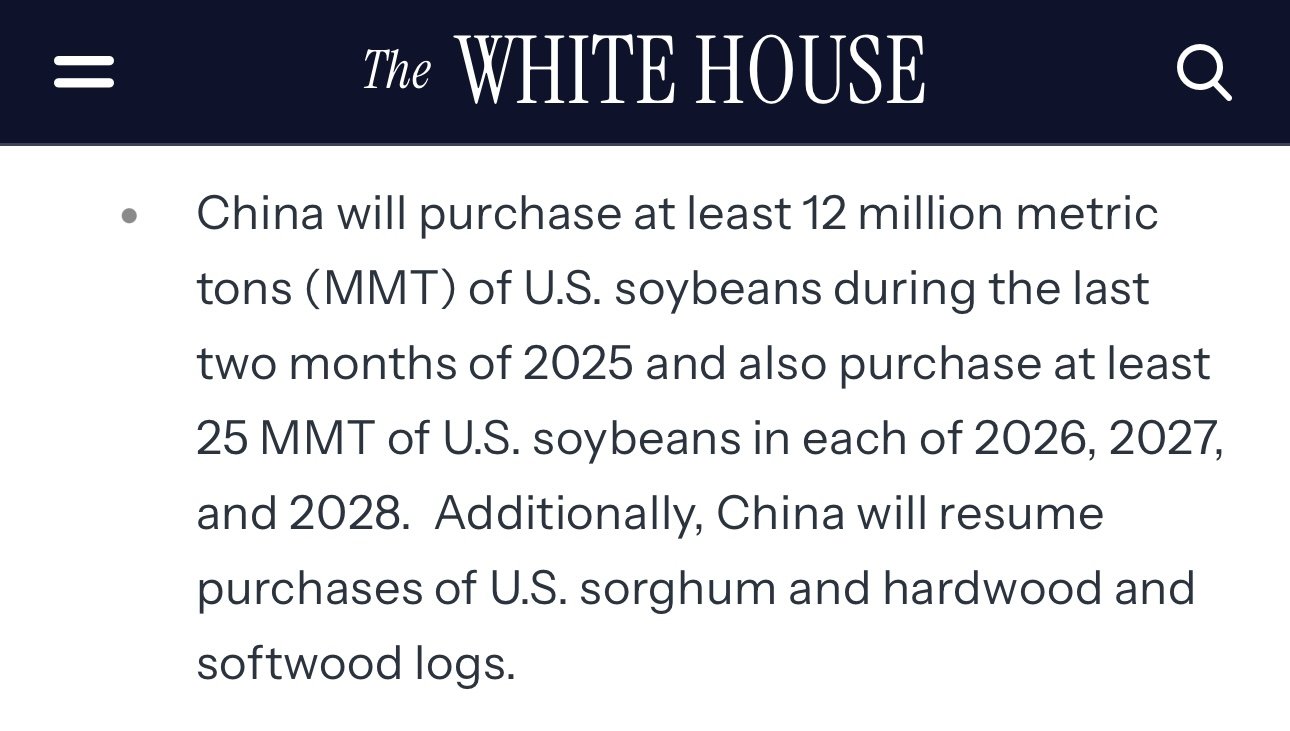
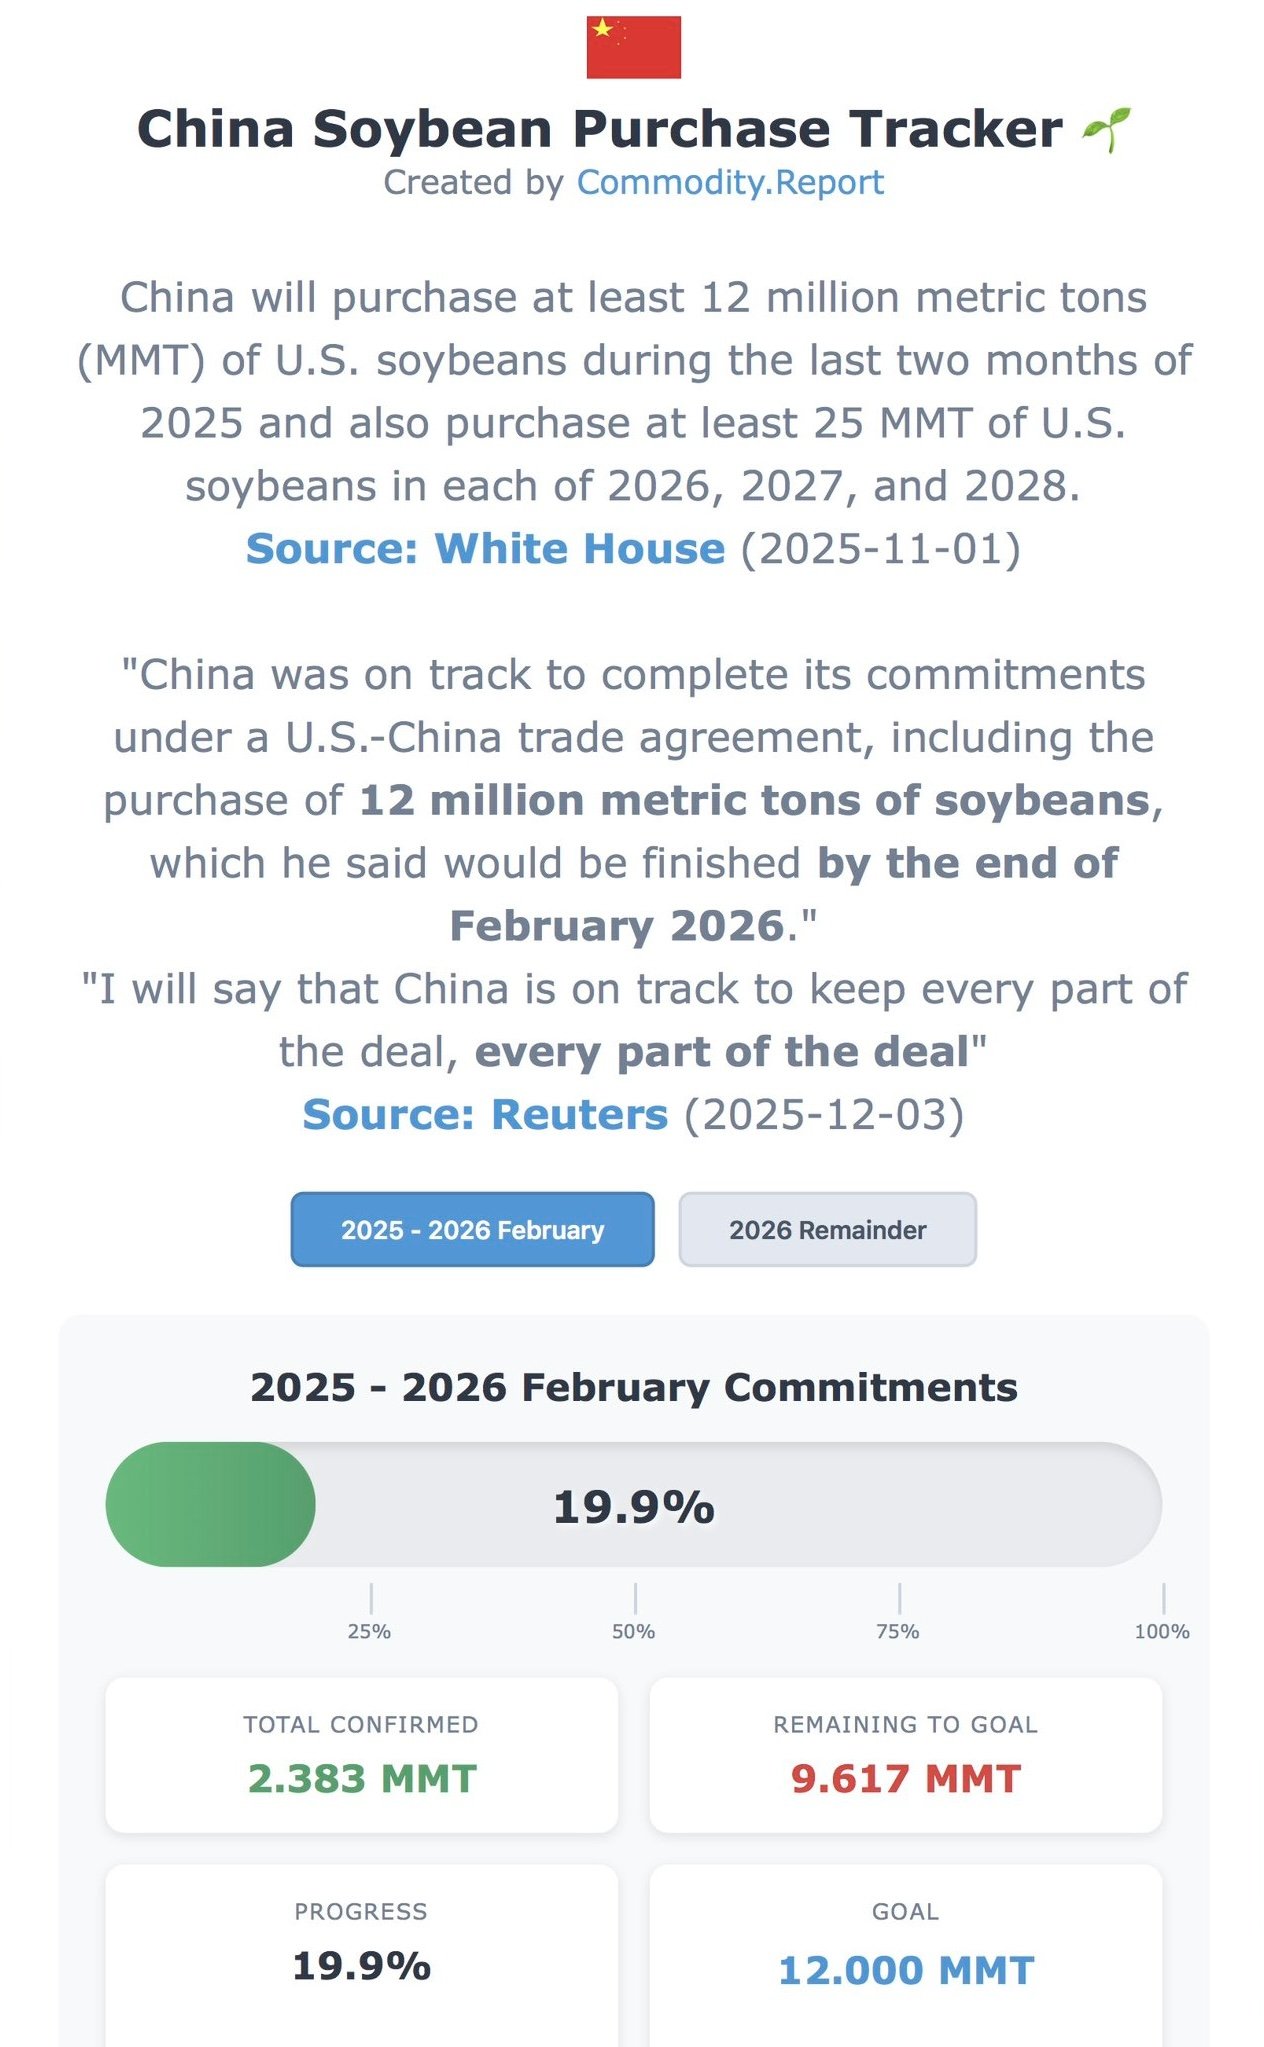
To add on to this, the fact sheet on the White House's website cleary states:
"China will purchase at least 12 million metric tons of US soybeans during the last two months of 2025."
This is a screenshot of their website from today. It still says this.
So it does kind of feel like we are being gas lit. Not to mention that both Bessent and Rollins stated on a few occasions that the purchases would be made by the end of the year.
I do personally think the purchases will be met, whether it's by February or however long it takes.
Trump, Bessent, and Rollins better hope they do. Because they have been bragging about how China is going to buy all of these soybeans.
Rollins also said that the 12 MMT is China's "floor" for their purchases. Not their ceiling. She said that is the bare minimum.
China Buying Under Radar?
Is China buying soybeans under the radar?
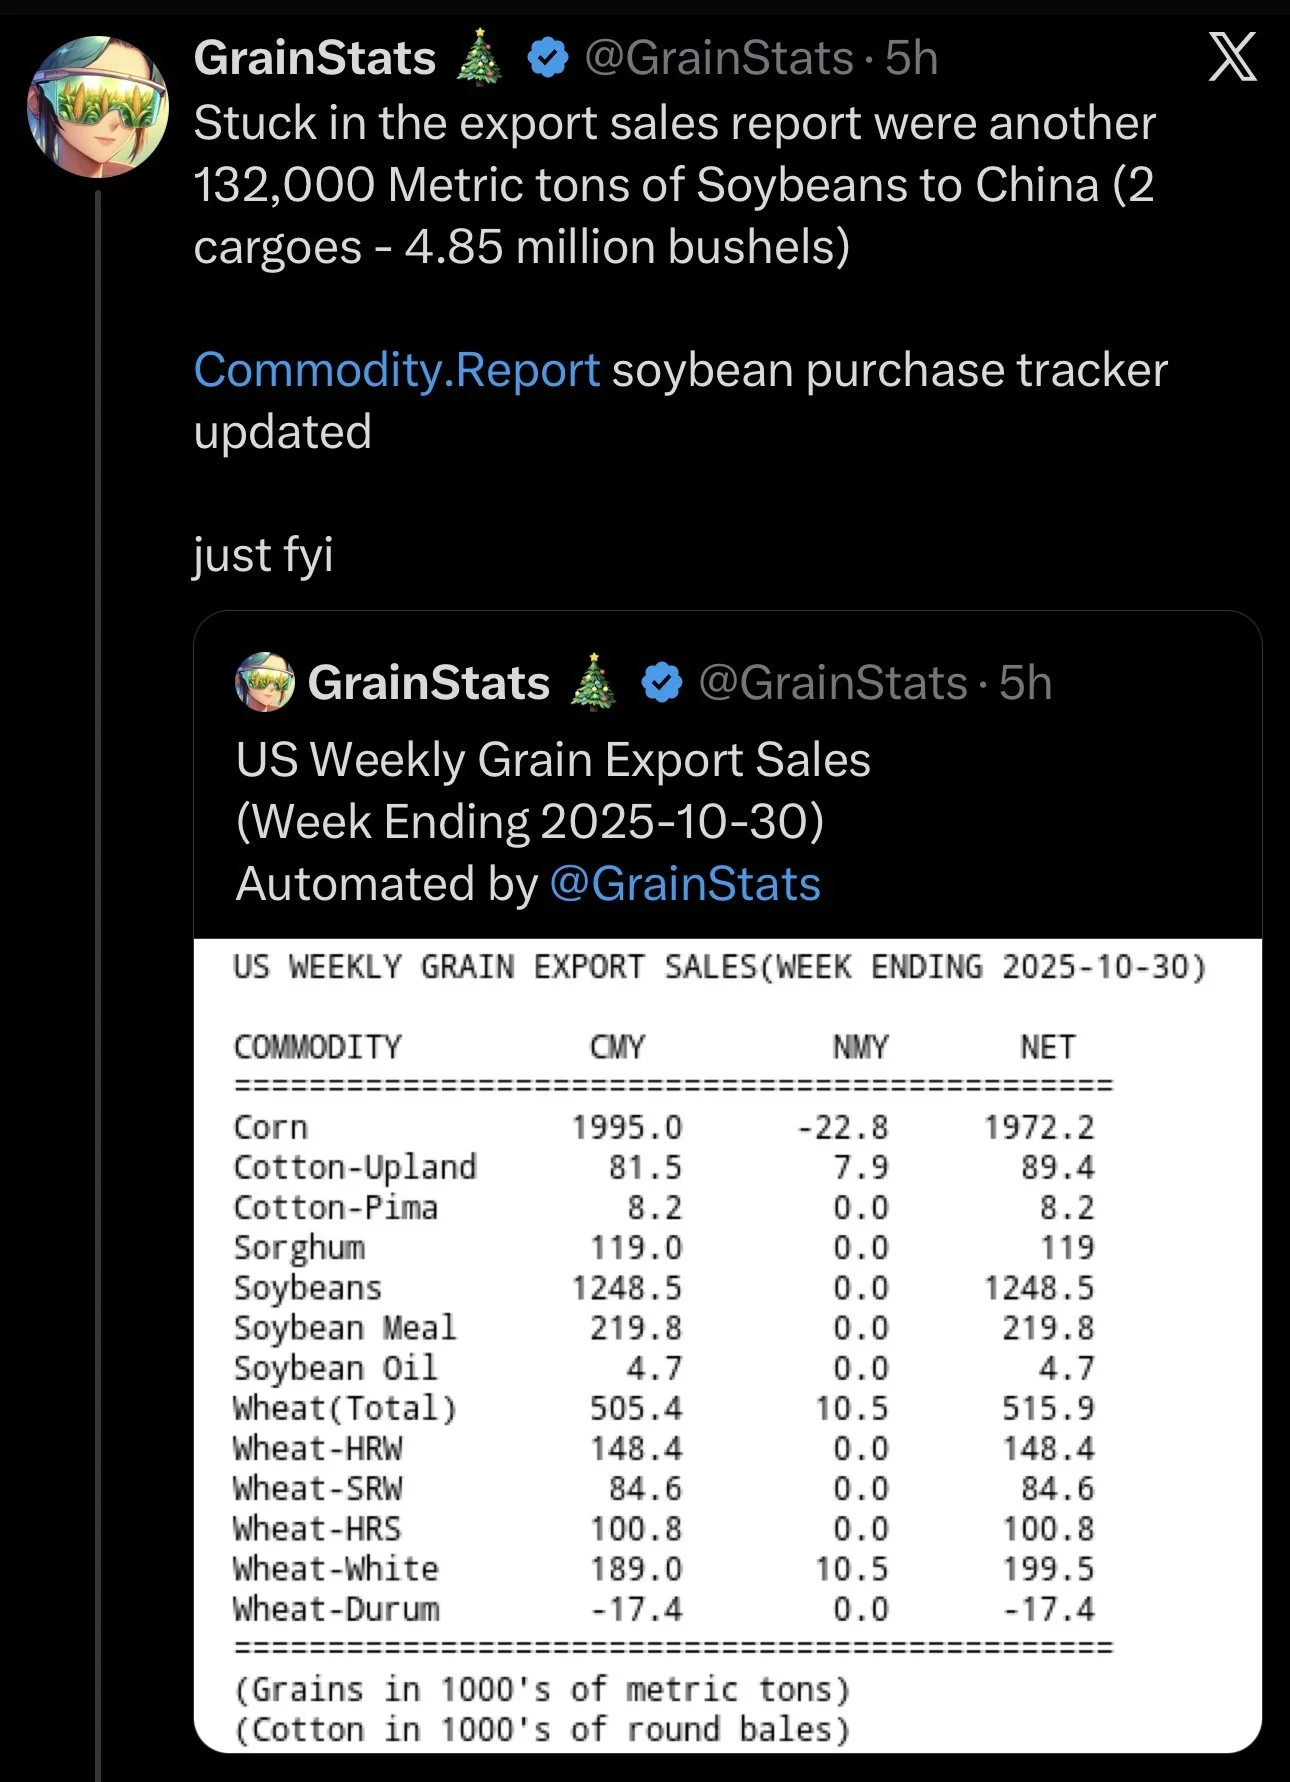
Today we saw the export sales data from October 30th. Over a month later.
Stuck in the export sales data was another 132k MT of soybeans to China.
It was not reported as a flash sale since it was under the required amount to be reported.
China isn’t dumb, they know our export sales aren’t up to date.
Who knows if they are secretly buying some smaller amounts of soybeans and have been over the last month. But it is certainly possible.
Regardless, we do still have a long ways to go to meet the 12 million.
Sitting at 20%of the goal as of today based on what we know.
Chart from GrainStats
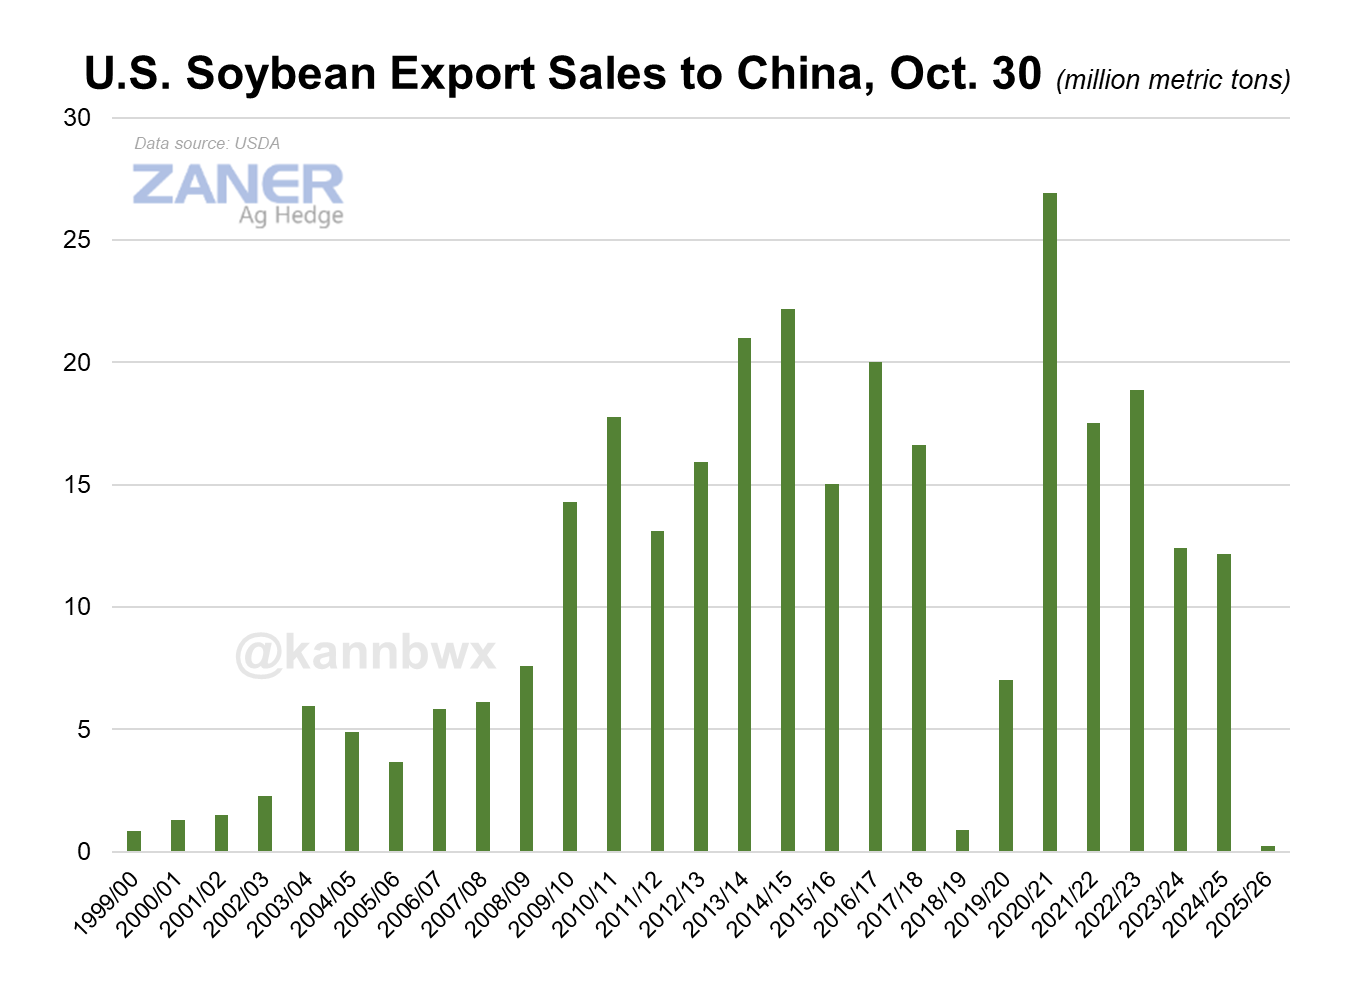
Here is a great chart from Karen Braun of Zaner Hedge.
It shows US soybean export sales to China through Oct 30th (the newest data we have).
Normally China has already bought around 50% or more of their total US soybean needs.
That would be at 2% if we assumed the 12 million is all China is going to buy.
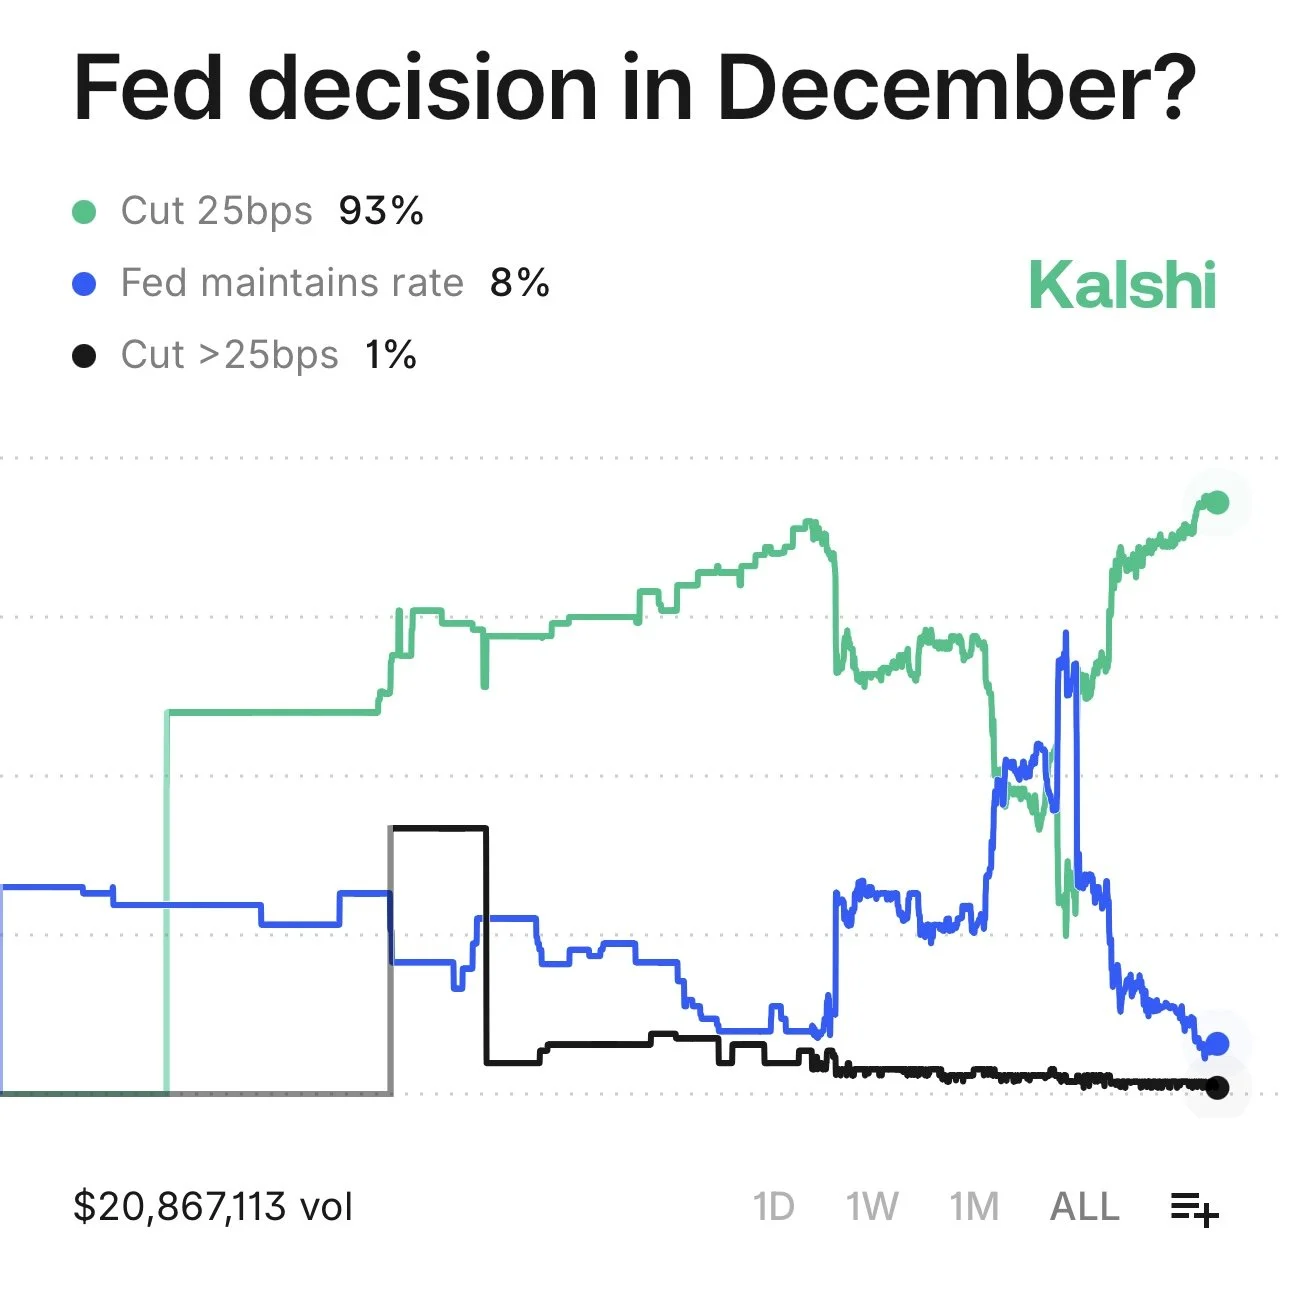
Rate Cuts & Commodity Index
There is currently a 93% chance the Feds cut rates again in December according to the betting markets.
If you've followed us for a while, we've talked about this for a long time.
How this could potentially be a friendly long-term story for grains and commodities.
In simple terms:
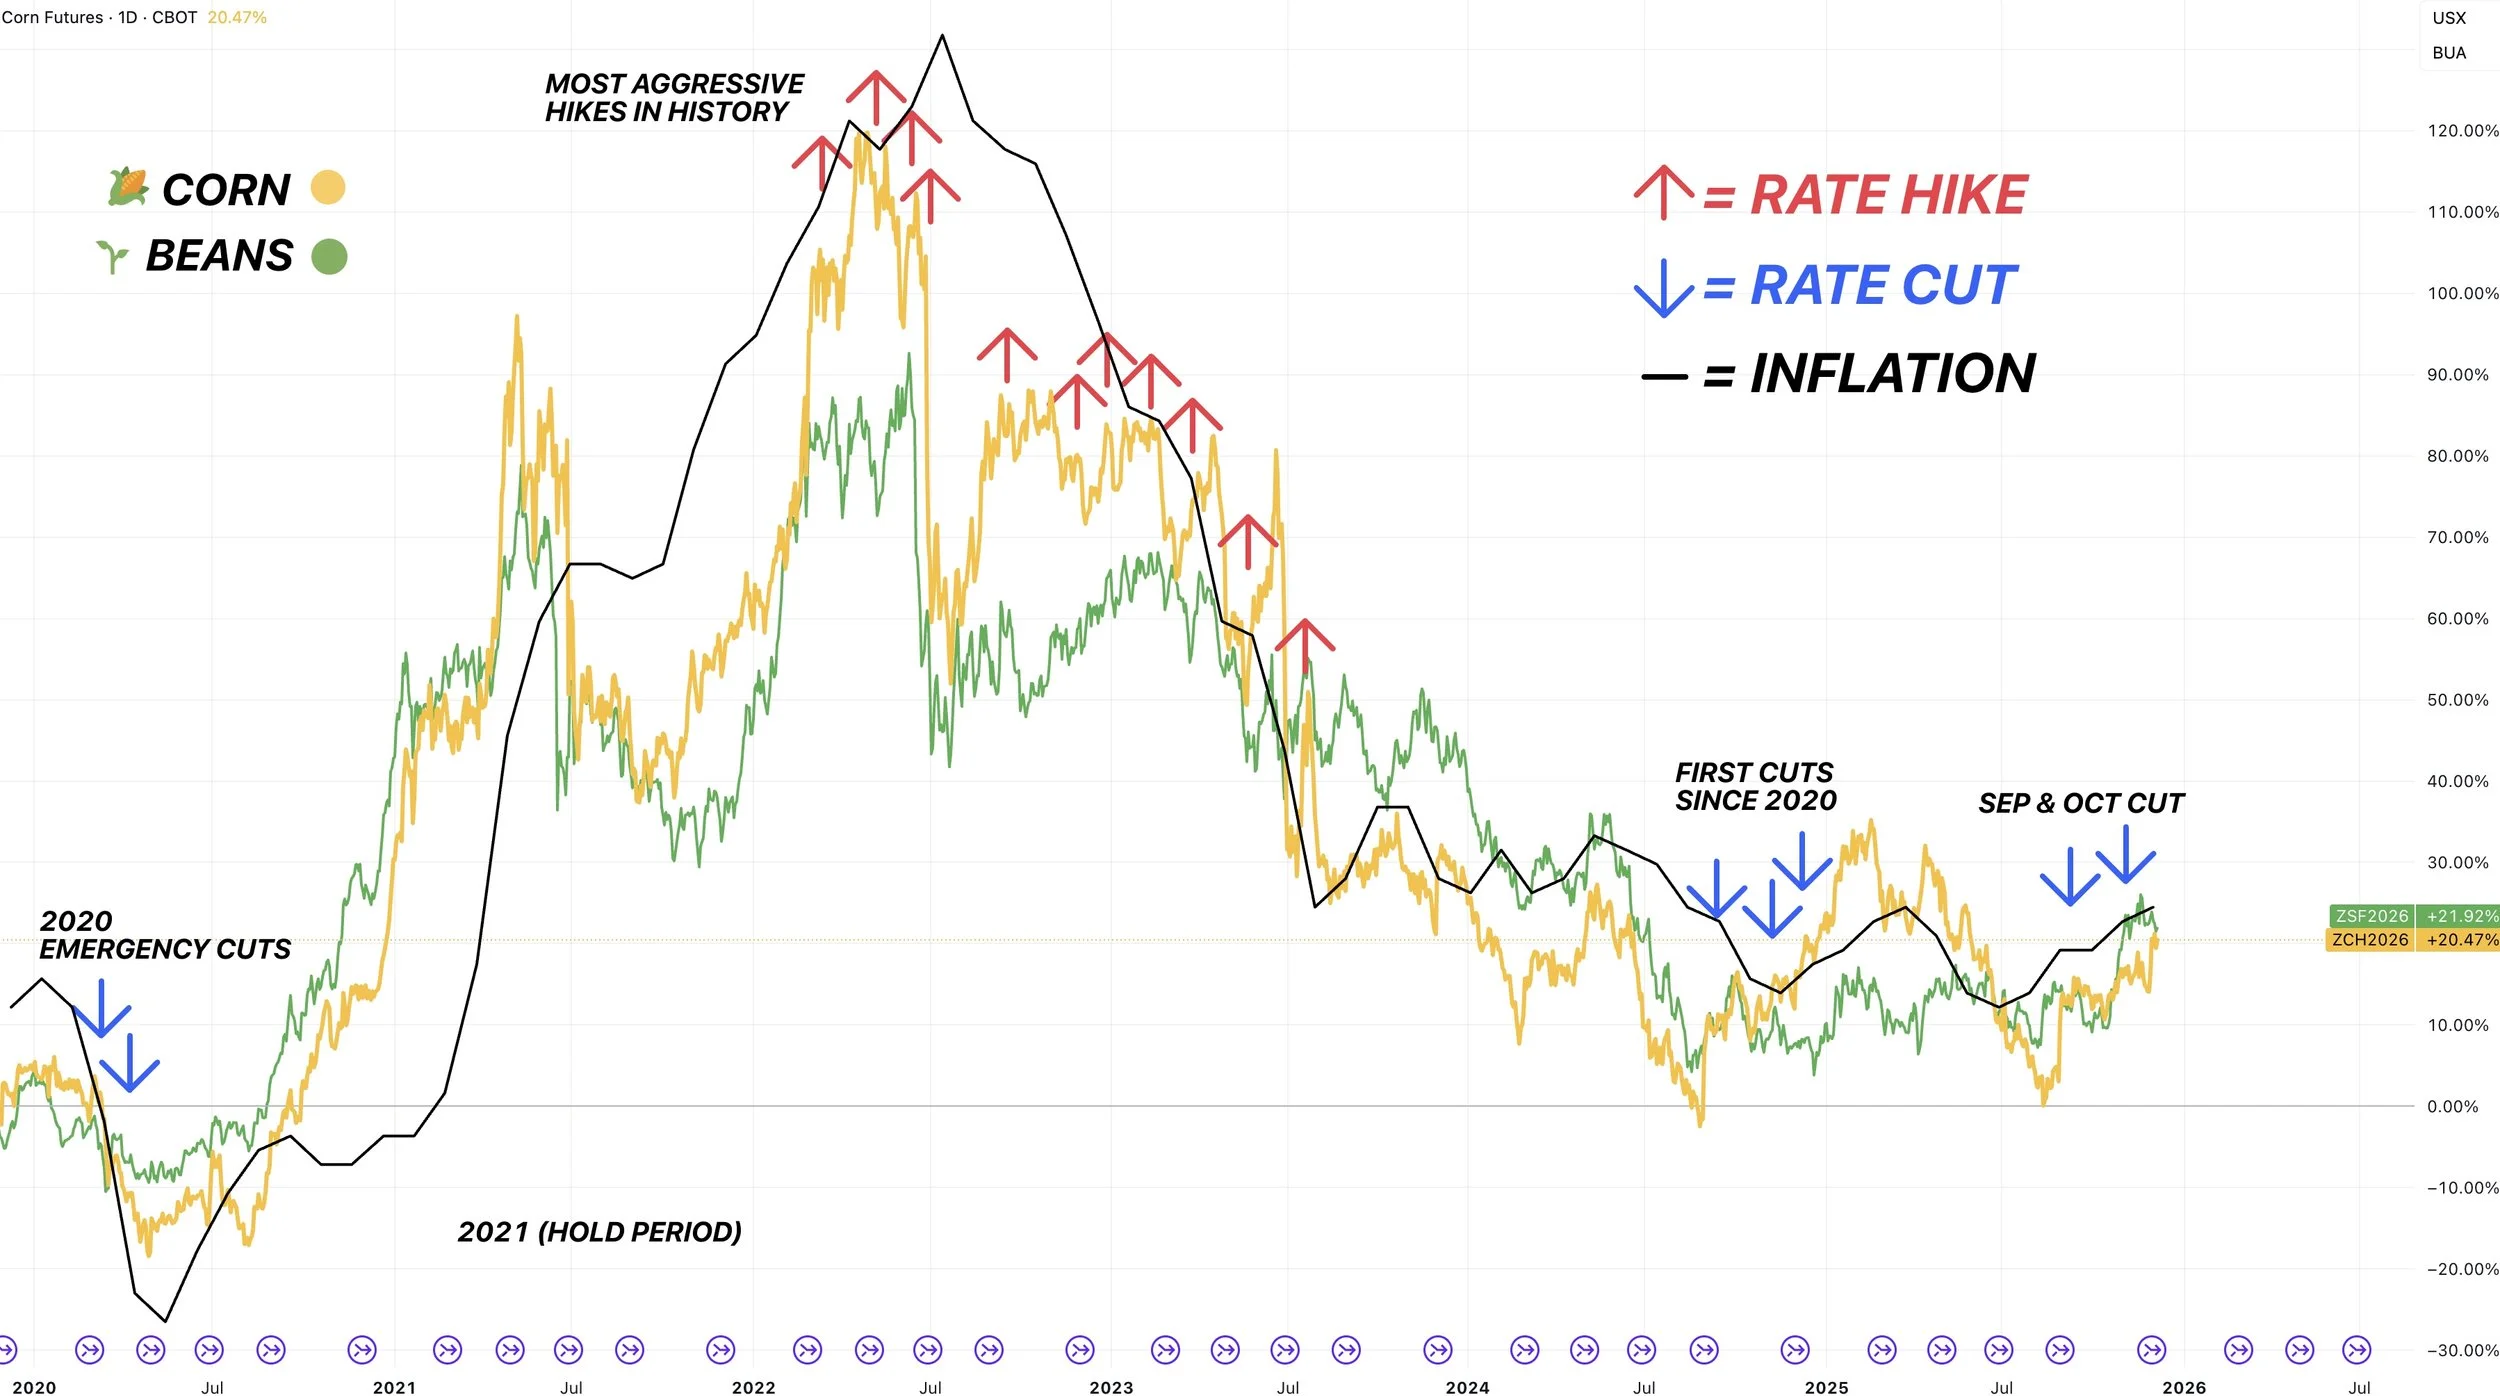
Rate hikes = less inflation. Which entices lower priced commodities.
Rate cuts = more inflation. Which supports higher priced commodities.
Our last rate hikes marked the end of the bull market in corn and beans back in 2022.
Our first rate cut since 2020 happened last fall. Inflation rose. Corn then went on it's most sustained rally of the entire bear market.
This chart provides a pretty compelling argument that corn and soybean prices tend to follow inflation.
This isn’t some factor that is going to play out right away. But taking a long term approach (years) it could possibly be something to helps push prices higher in the future.
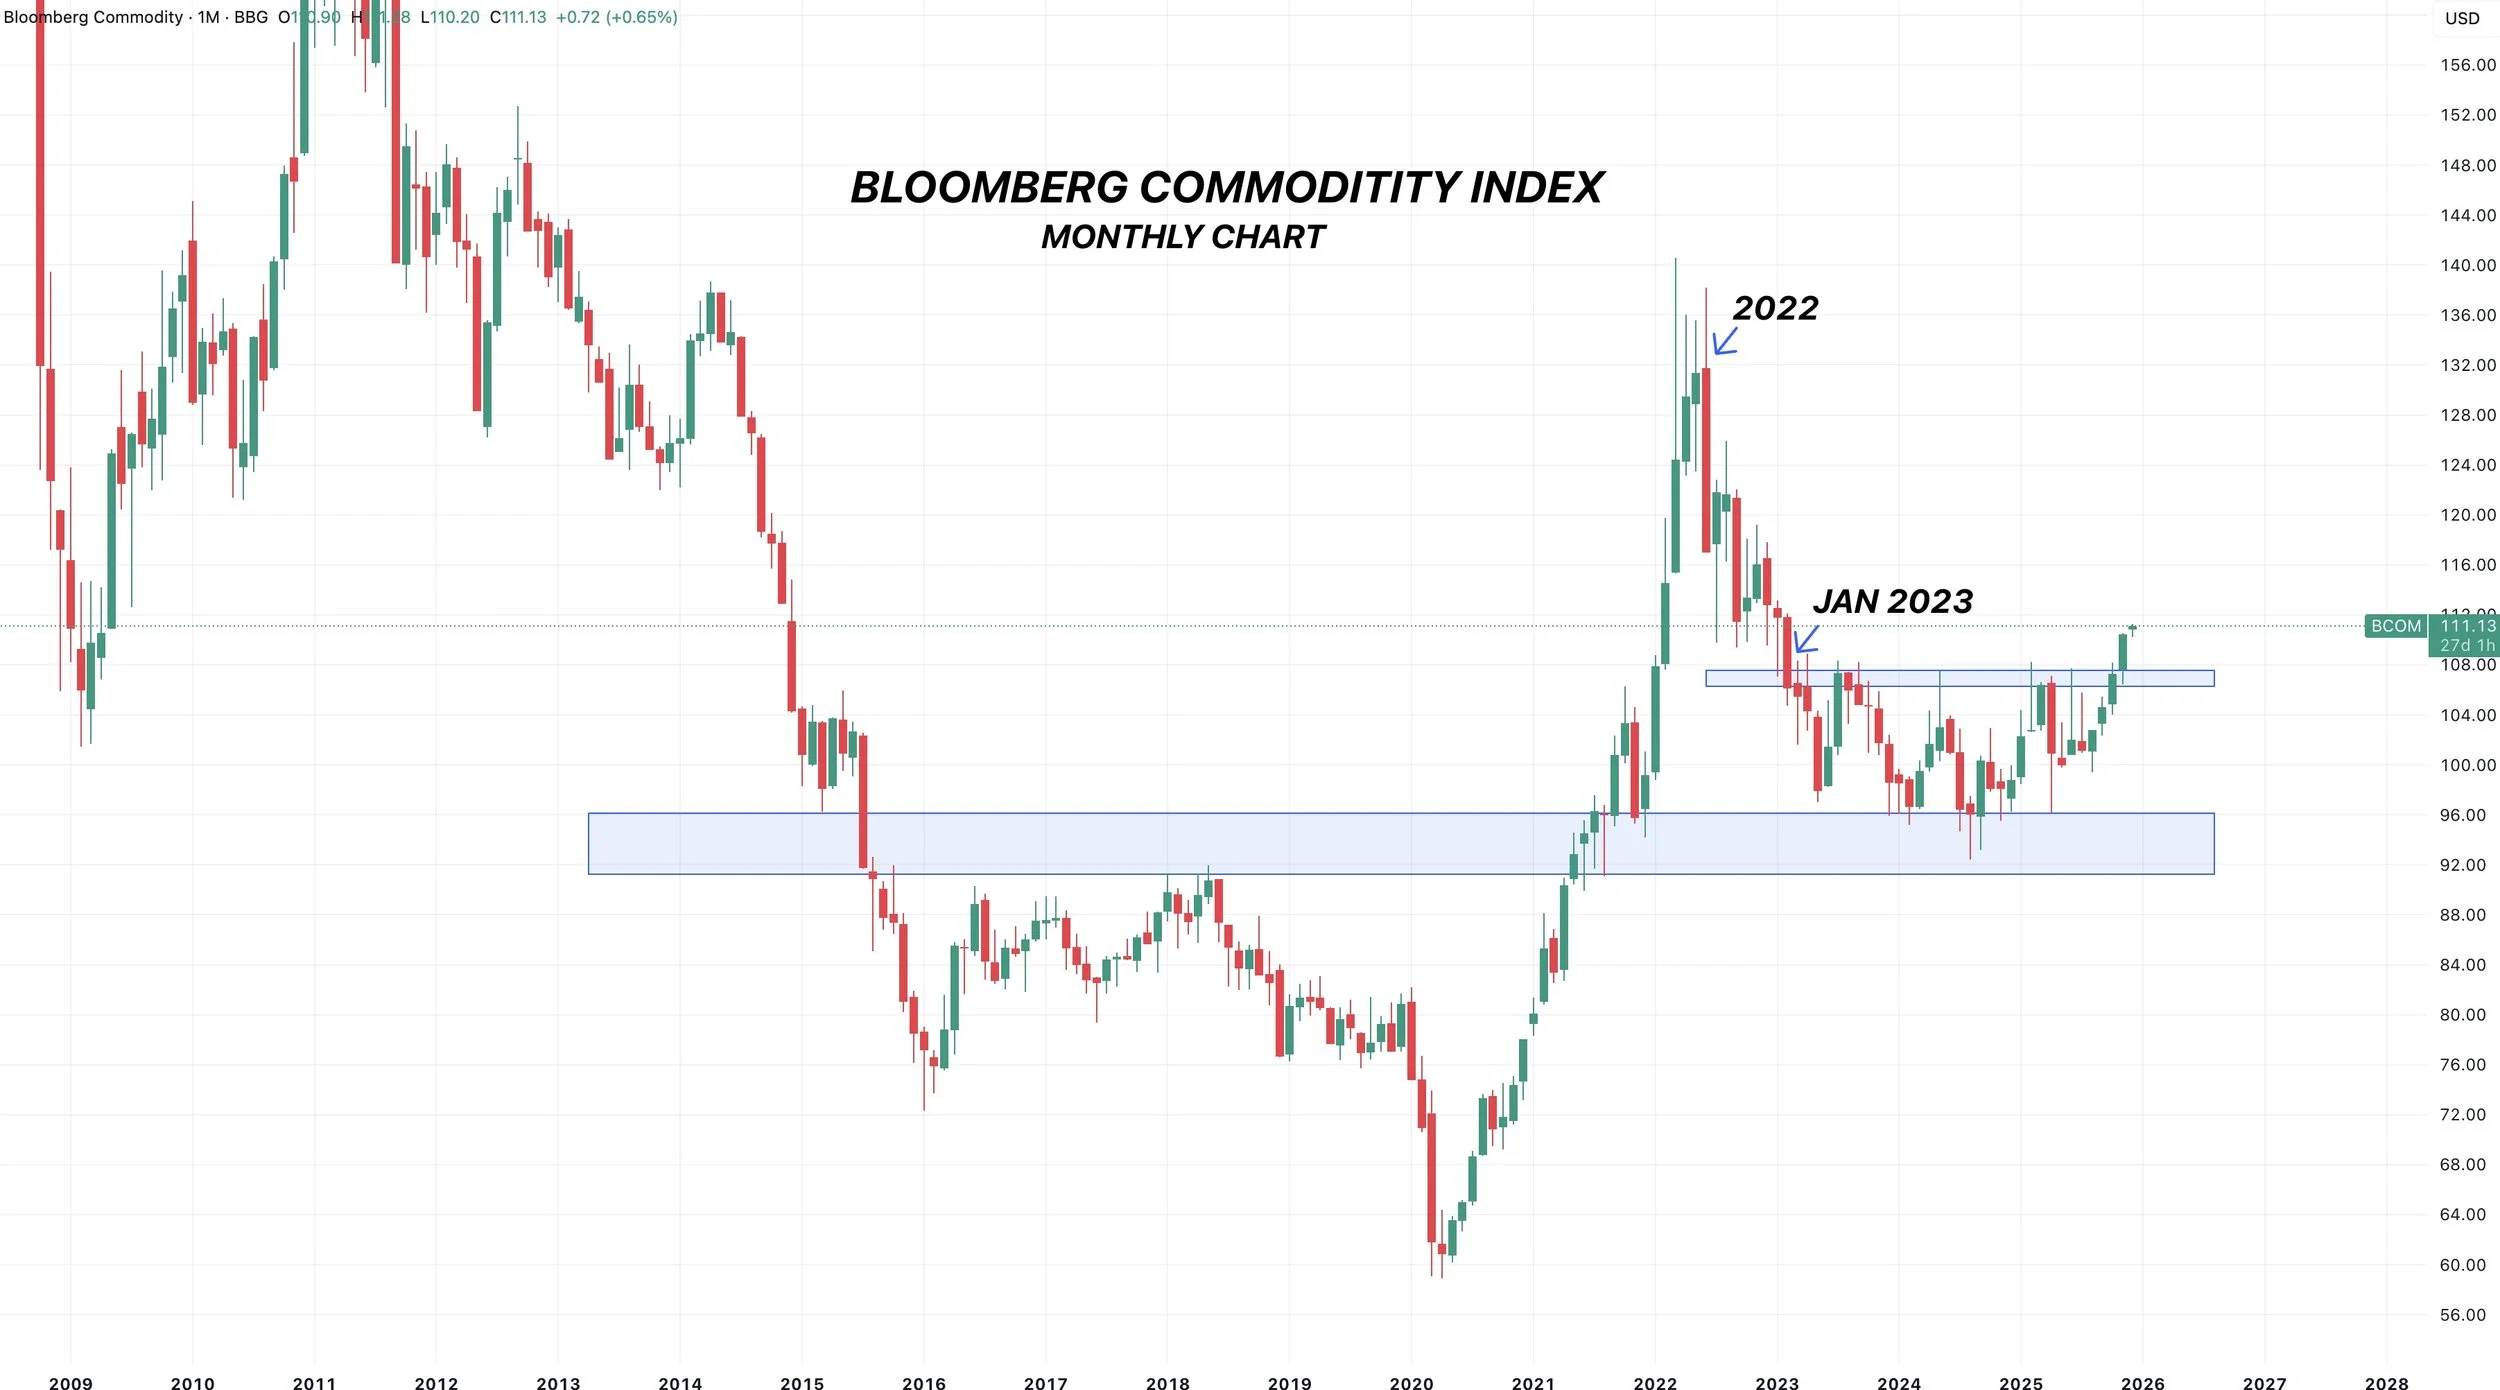
If we look at the Bloomberg Commodity Index, it looks like it is breaking out of a multi-year range.
This index includes 5 sectors.
Energy, metals, ags, livestock, and specialty commodities.
So it's not a direct correlation to grains or livestock, as you've all probably noticed gold and silver hitting all-time highs.
But maybe this helps entice some money flow into commodities as a whole in the long run.
This commodity index is often used as a hedge for inflation.
(Monthly chart - breakout on Bloomberg Index)
Today's Main Takeaways
Corn
Fundamentals:
In short, demand is at a record. So any big breaks are probably going to be bought in this market and help keep a floor.
At the same time, we have too much supply, so major rallies will somewhat be limited for now (I am talking over $5.00).
If we get too cheap, we create even more demand.
The market's job is to balance supply and demand through price.
If there is too much supply, prices fall down to levels that create demand.
If demand is too strong, prices rise to justify less demand.
Here is what I'm talking about.
First for supply.
I've shown a chart similar to this countless times.
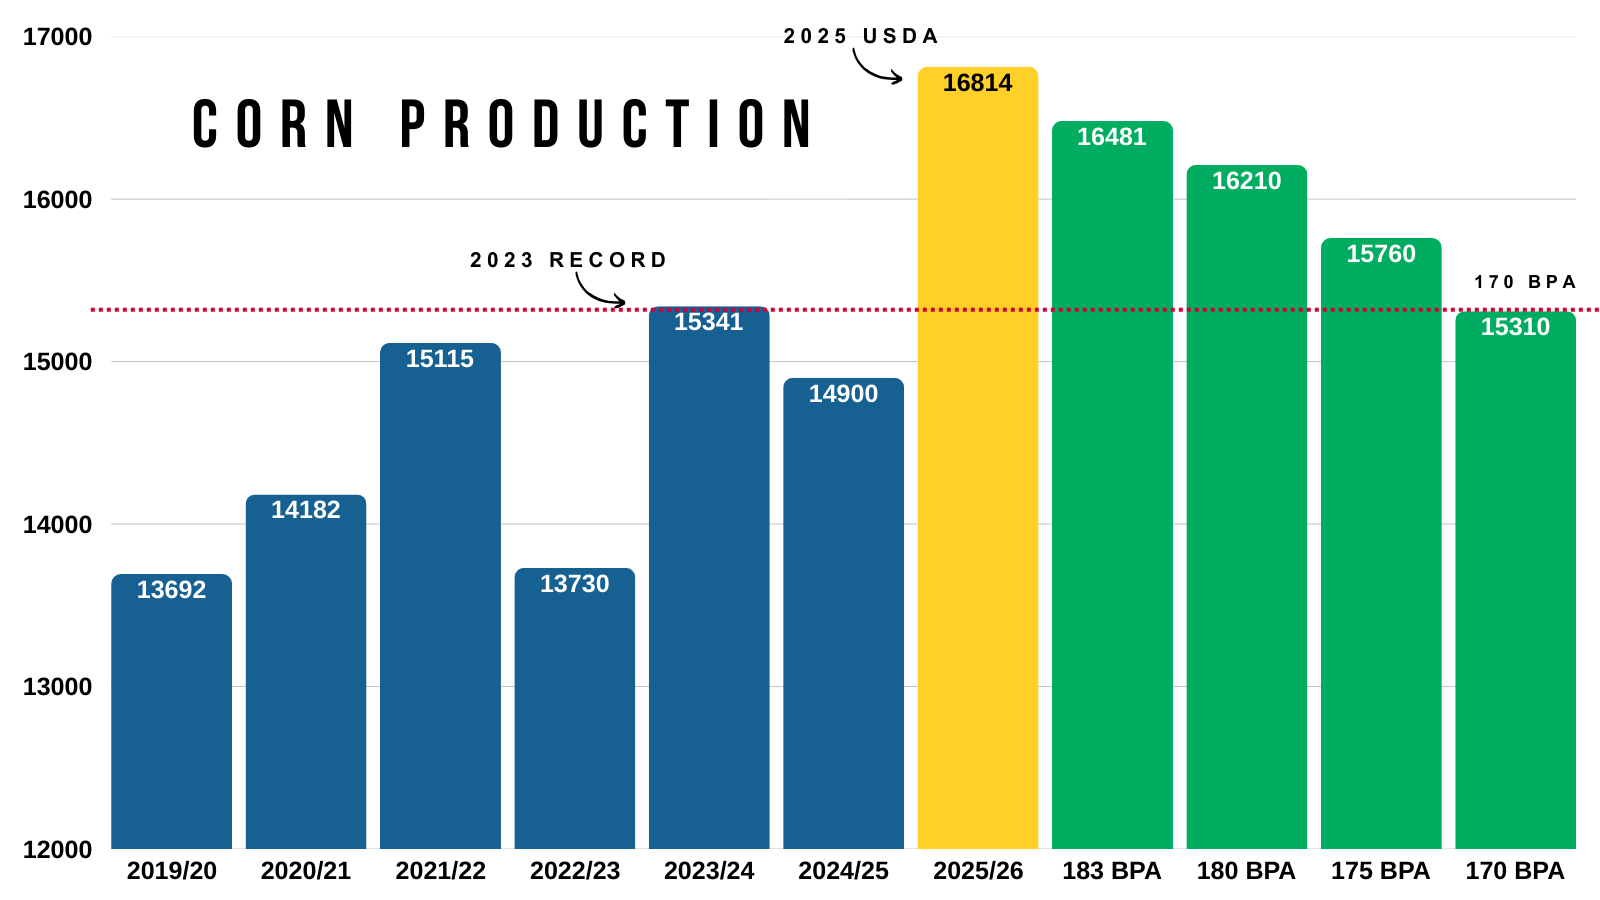
We have a massive corn crop. It doesn’t matter if the USDA cuts yield below 180. We are still looking at a record crop.
For this year's corn crop not to a be record, it would take a 170 bpa yield.
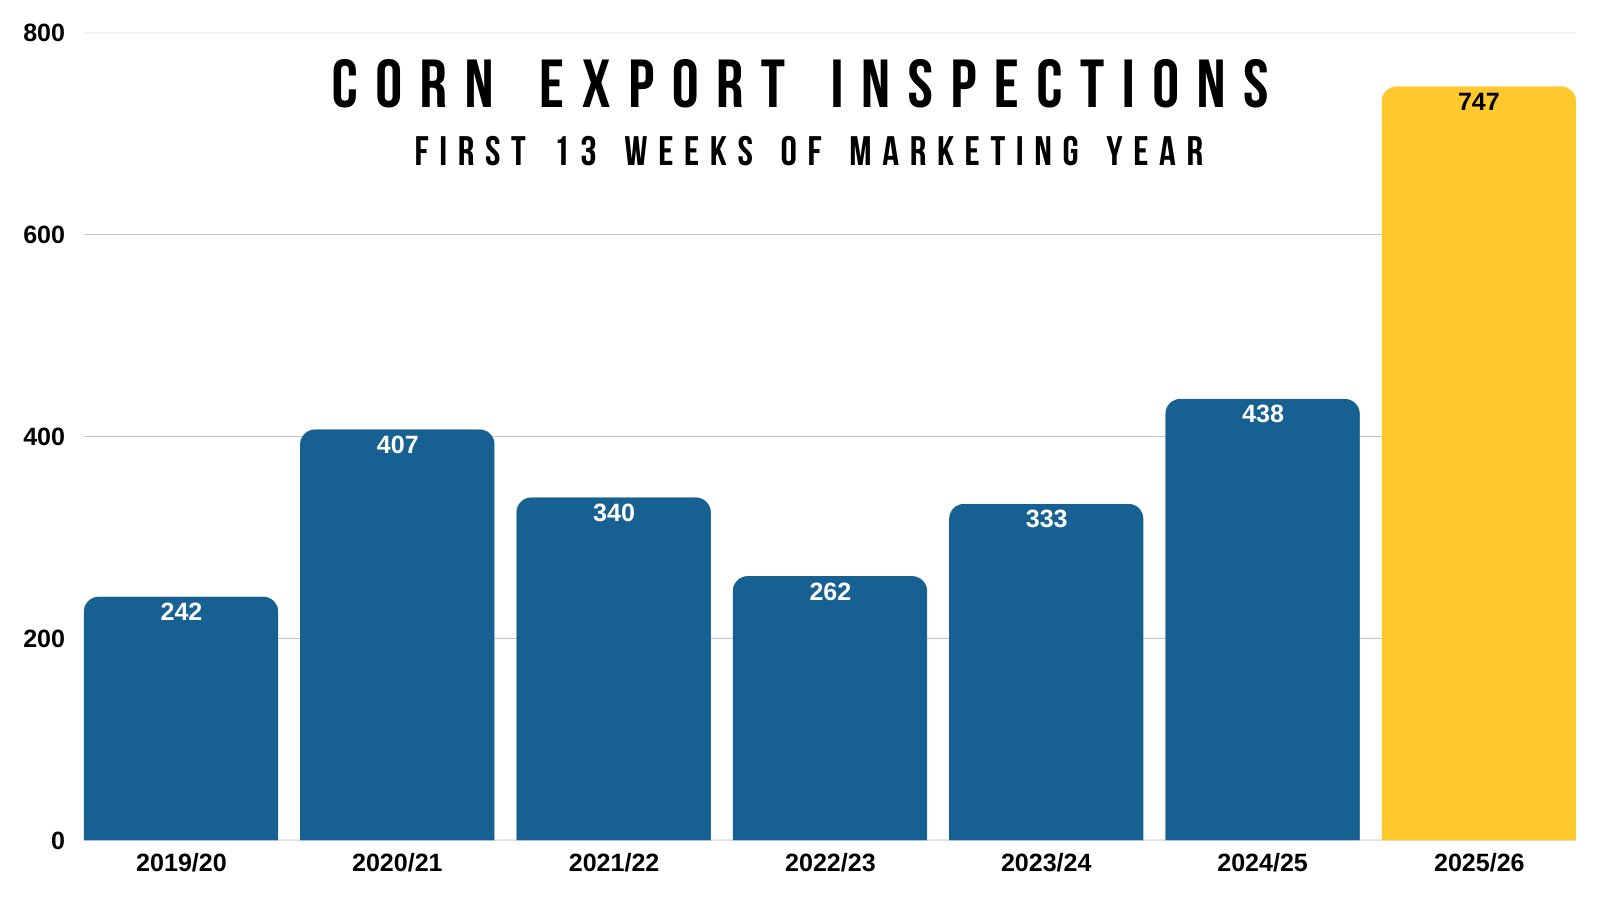
At the same time, record demand is offsetting that supply.
Like we talked about on Tuesday, export inspections are over 70% better than last year.
Last year was a record.
We are absolutely shattering that record.
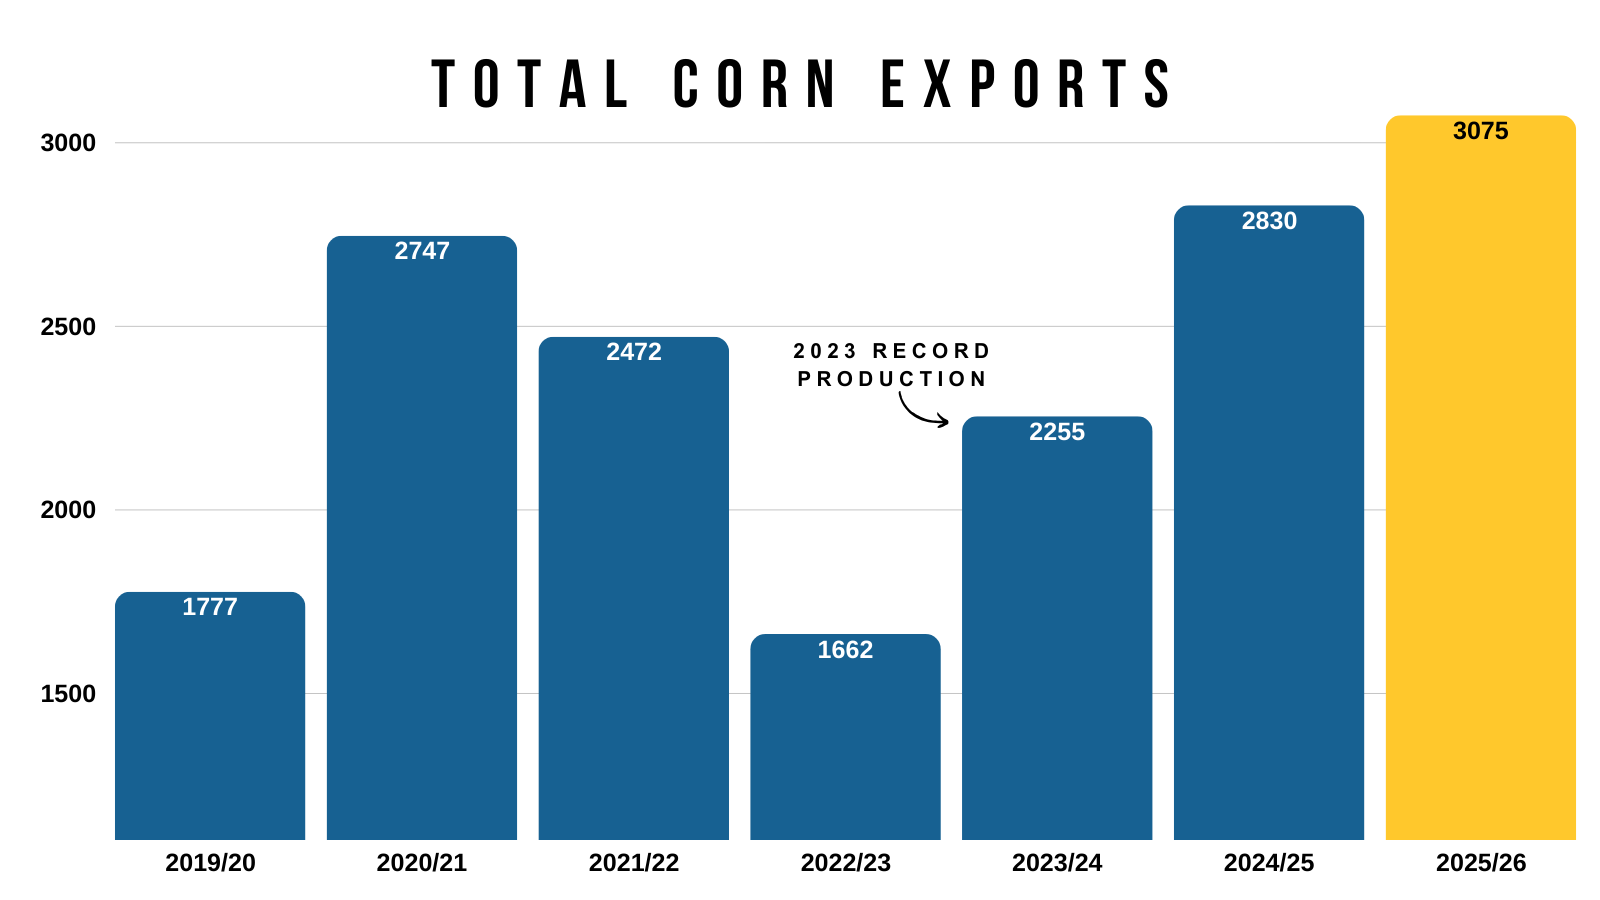
Here is a visual that shows the USDA total export projections.
The current projection is 3,075 million bushels.
Our record crop was 2023.
Our exports that year were 2,255.
A near 40% increase from the last time we saw a record crop.
Could China Buy Corn?
I have zero idea if China will buy US corn.
It would be very bullish and one of those few factors that could turn this corn situation into a far more bullish one.
China's November port stocks hit 5-year lows. Meaning their physical corn situation on the ground is tight.
Which typically leads to higher prices for their corn and or imports.
China is still auctioning state reserve corn. Meaning they are selling old goverment held corn into the market (this corn is from 2020-2022).
Which usually means they are trying to cool down prices or stretch limited supply.

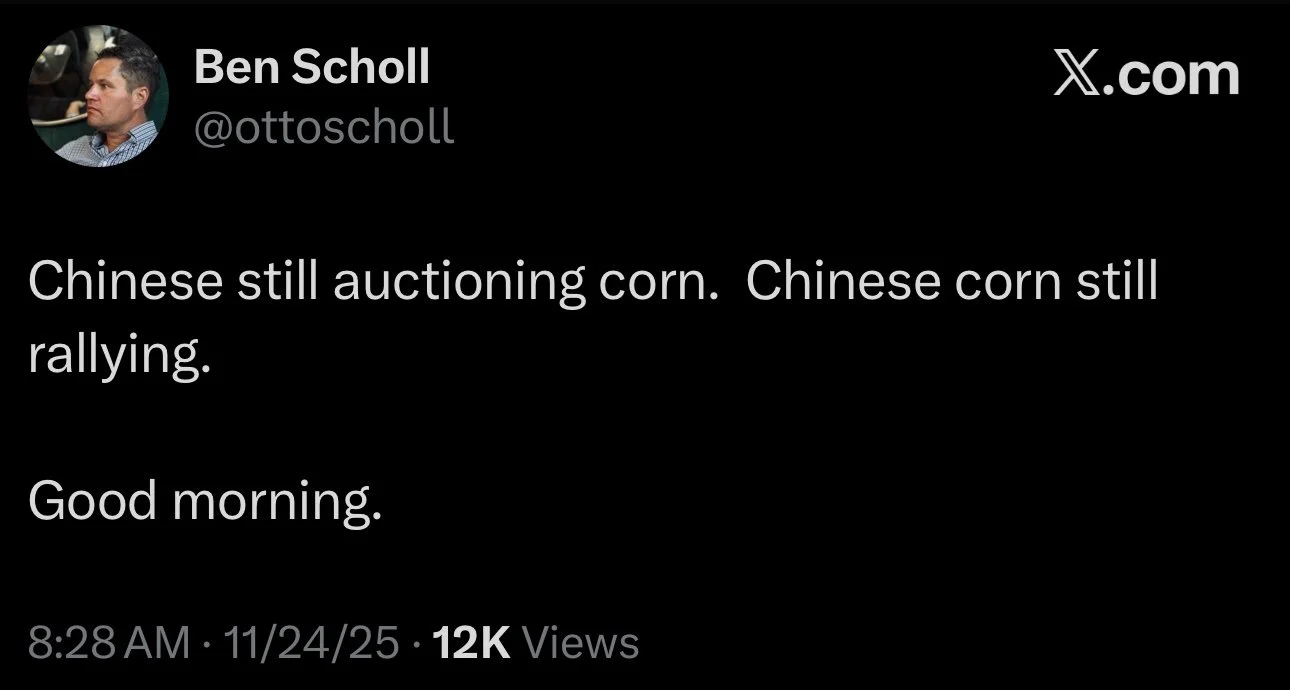
At the same time, China's corn futures are surging.
Their corn market is up almost 10% in the last 50 days. Challenging new yearly highs.
If their corn market is rallying, while at the same time their government is dumping supply..
It "could" mean that their supply is tight enough that even the government selling their supply can’t stop the rally.
This doesn’t mean China "will" buy US corn at all..
But their market is hinting at the possibility that China might start to import corn again after living off their domestic supply the last few years.
The million-dollar question is, will they buy, and if so, how much?
Who knows. All of this could mean nothing. But the situation is giving some 2020 type vibes.
Something to watch moving forward. As this is one of those things that could actually be a game changer IF it happens.
Not to mention, demand is already at record levels without a single bushel going to China.
China Corn Futures
2025 vs 2026 Corn Action
Here is an update on that March-25 vs March-26 corn chart I’ve been showing the last few months.
In this example, we lined up the harvest lows.
So far, we are still tracking extremely closely.
Some thoughts:
Last year we topped out in Feb just over $5.00
Based on the corn fundamentals as of today, last years situation was viewed as more bullish (although this can always change).
Last year we all we did was essentially revisit those spring highs.
If we revisited our spring highs this year, it would put us around $4.70 to $4.80
Which does line up with next target on my technical analysis.
(Scroll for this target and analysis).

Technicals:
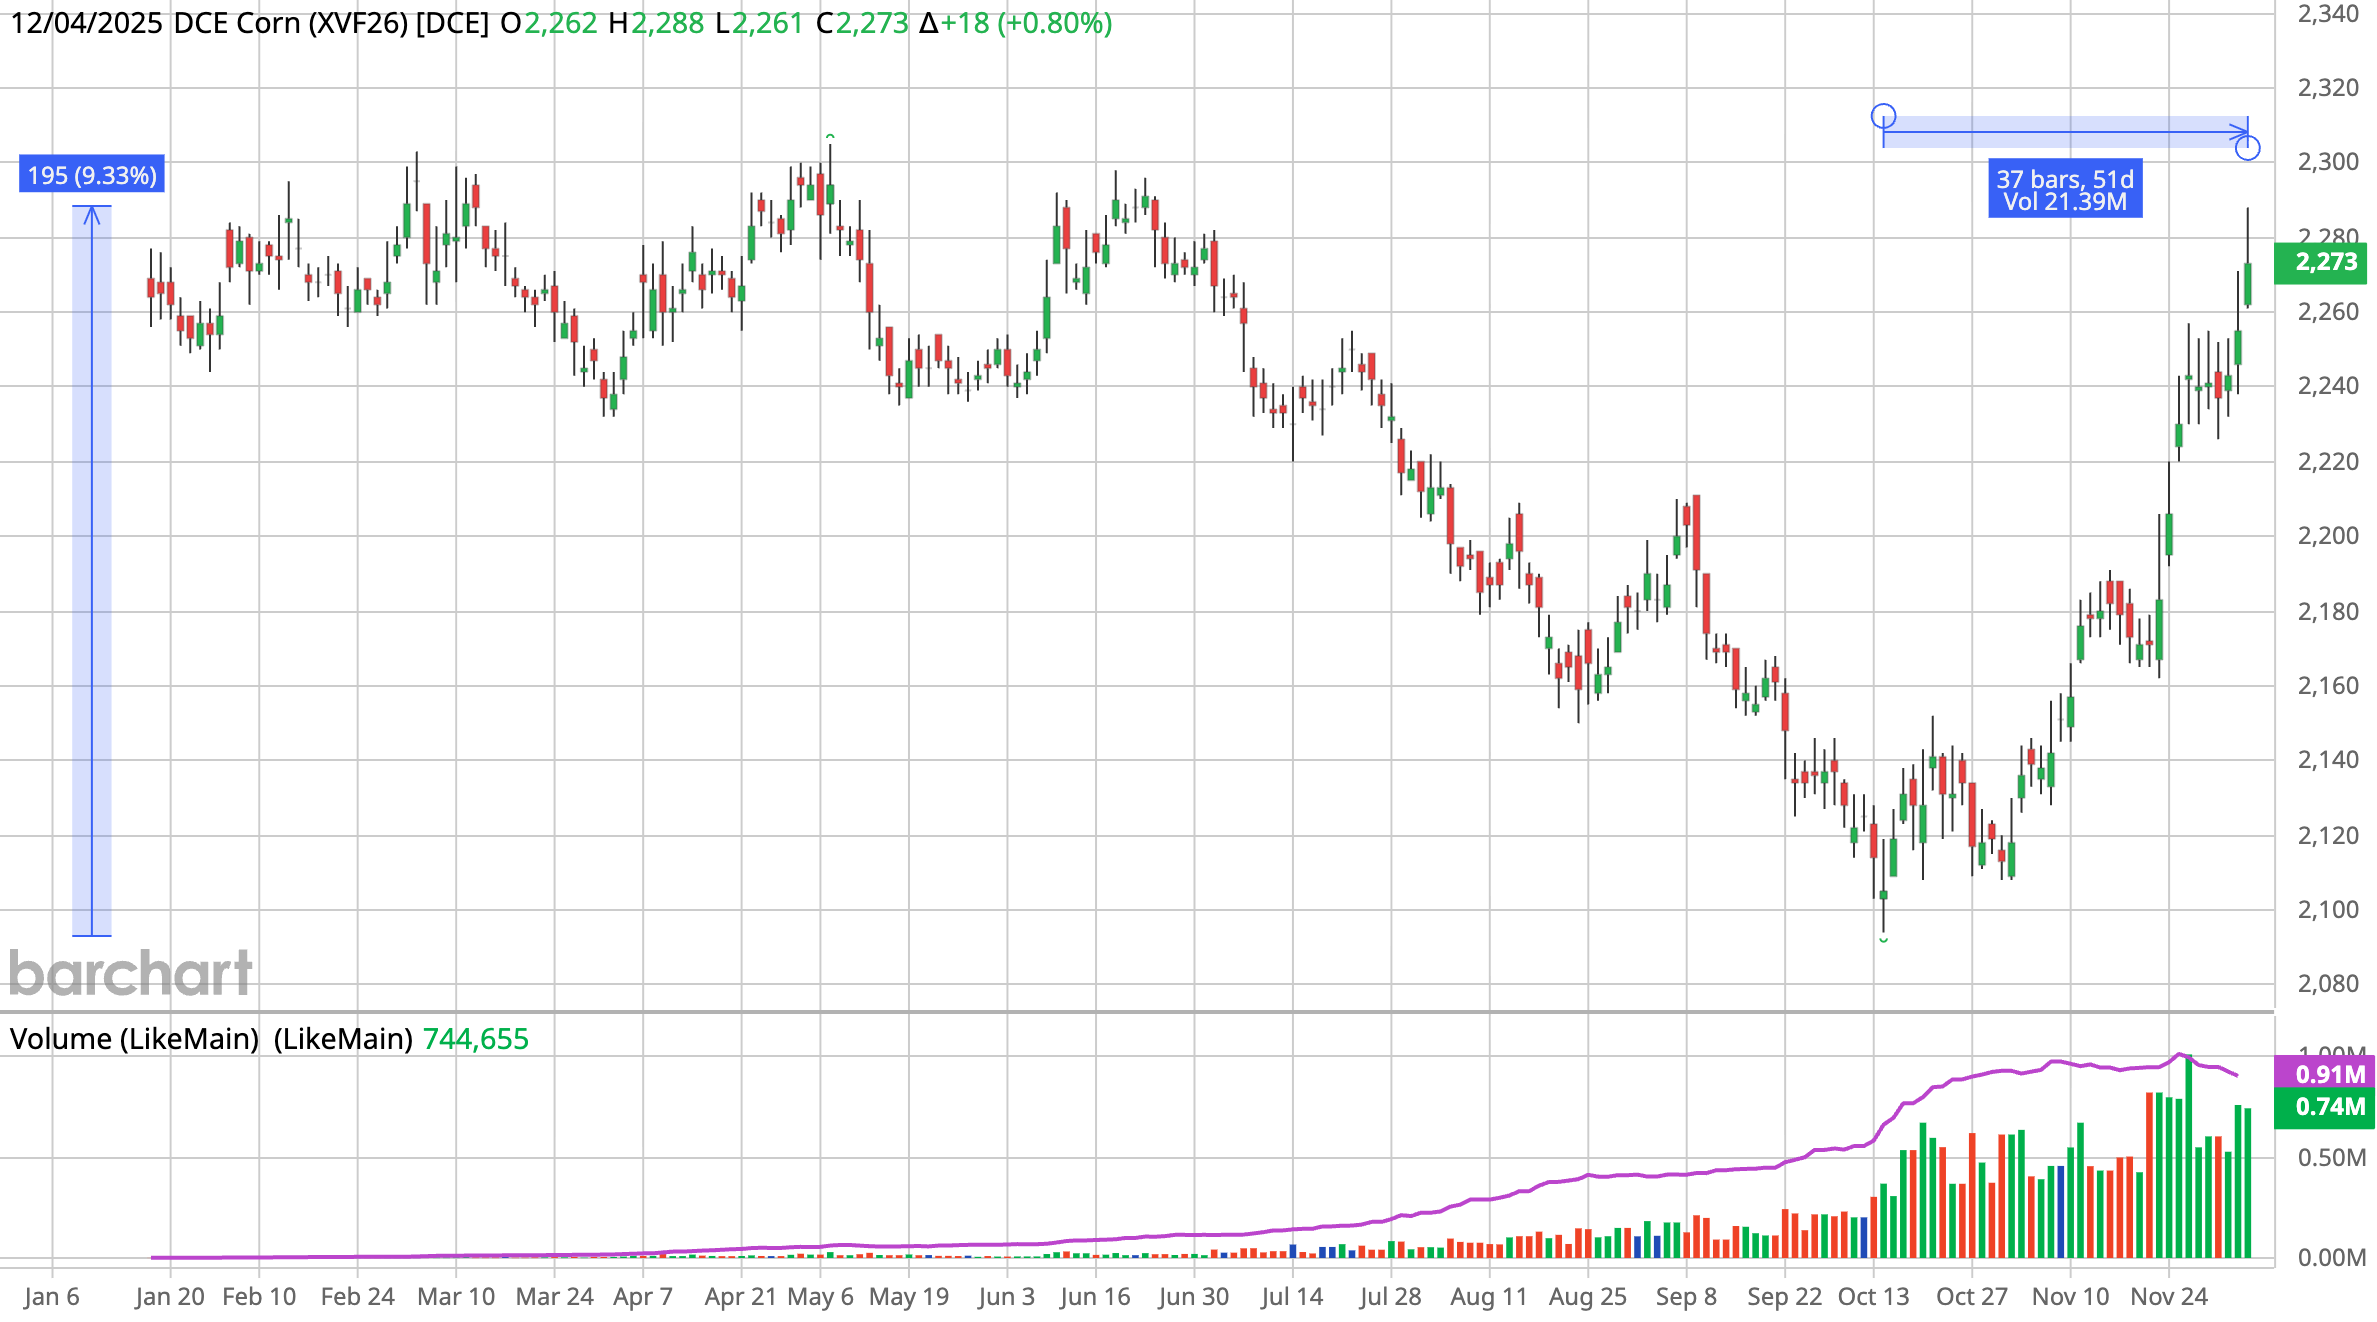
March Corn
We continue to struggle to break above that $4.50 level and where we intially took some risk off the table.
That is going to be the big level to watch. If we can break above, we should get some further upside.
To the downside, we still need to hold the golden zone which we already bounced out of.
$4.37 gives back 61.8% of the Oct rally.

Next Target: $4.70 - $4.73
Since we took risk off the table and alerted a sell signal the first time we hit $4.50
Our next target is $4.70-73
That is where I want to further de-risk.
$4.73 is 161.8% of the size of the Sep rally off contract lows.
This is a very common spot for a 2nd rally to pause.
I think the next move in corn could be more of a grind than a sling shot. Given we do have a lot of supply.
Soybeans
Fundamentals:
Personally I think China does wind up buying the amount of beans they agreed to. Even if it takes longer than expected.
It would be nice to see some actual details of a trade agreement.
Do soybeans still have the potential for +$12.00?
I'd like to say yes. That isn’t me saying we "have" to at all. The highs could already be in for this market. But the upside "potential" is still there.
What would it take?
A) China buys more soybeans than expected.
After all, Rollins and the government said that 12 million metric tons is the minimum they agreed to buy. Not the ceiling.
So there is always the possibility for them to buy more than that. The market ran up on the thoughts that they will buy 12 million, and we've sold off because that optimism has been shrinking.
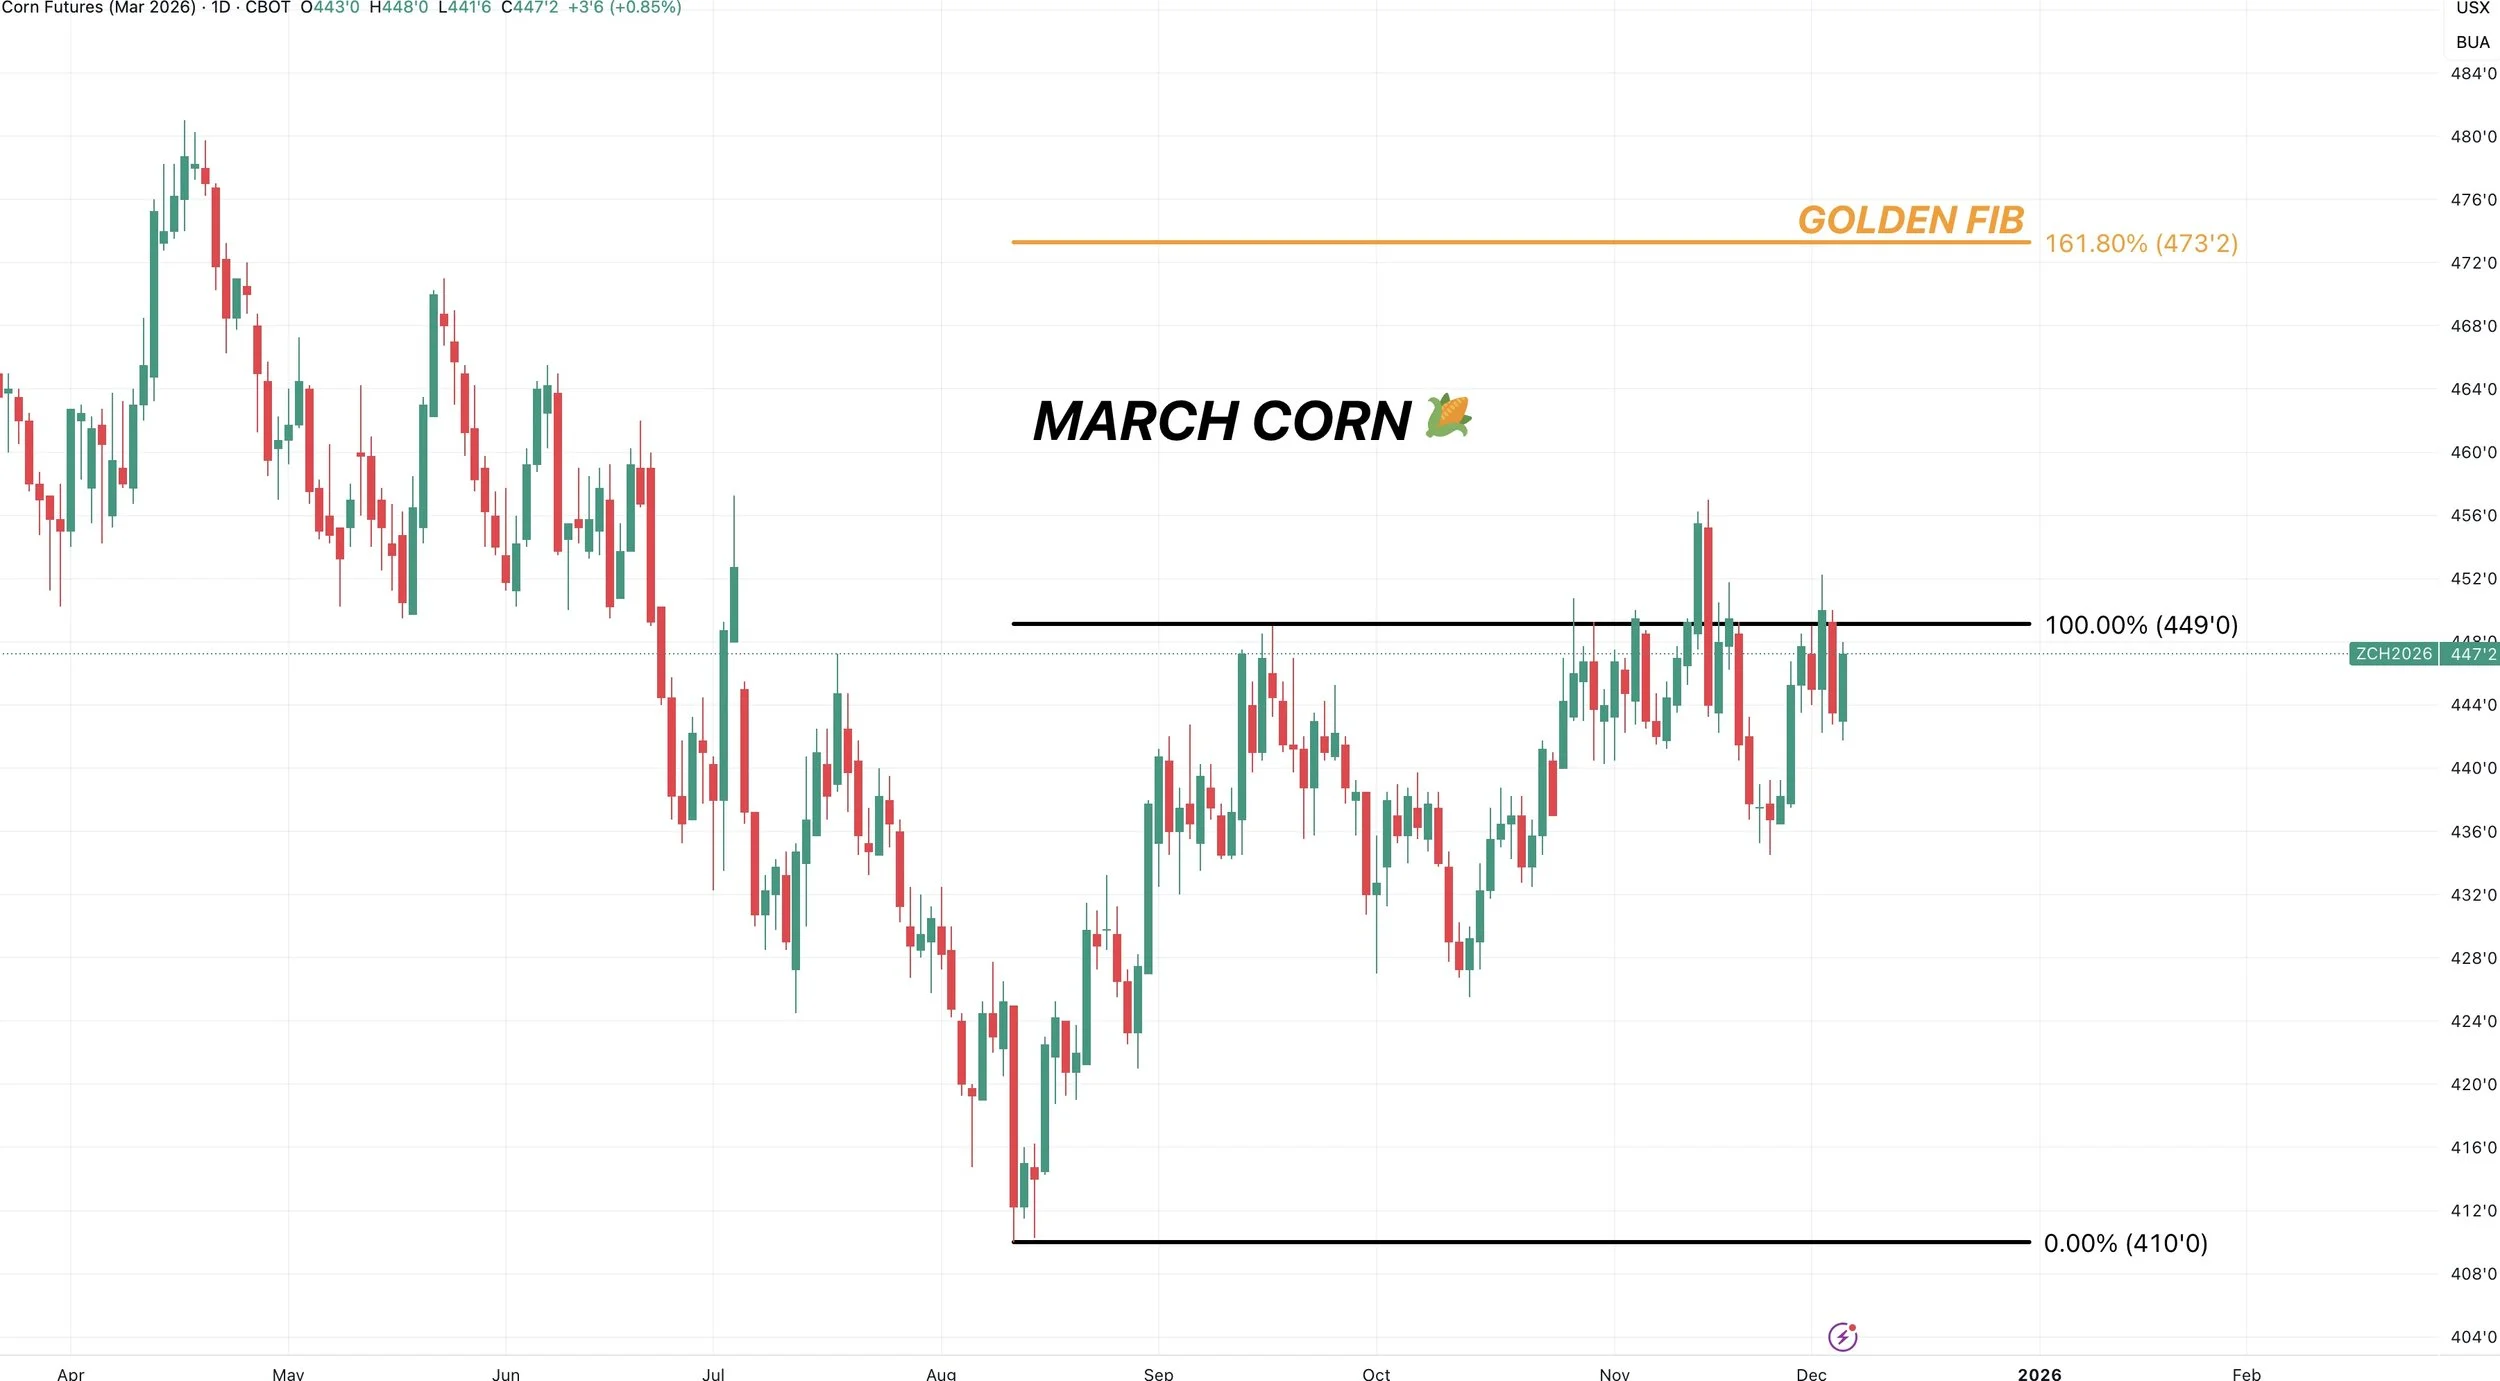
B) Brazil weather issue.
This is probably the biggest one.
We've seen some analysts walk back both their corn and soybean production estimates out of Brazil. But overall they are still projecting record crops.
For example, Mato Grosso's corn crop is now expected to be down nearly -7% from last year. Despite them planting more. So the recent dry weather is starting to stress the corn as well.
We still have a good 2 months of weather season to trade. So anything can happen.
It's been dry. Here is the last month of precip, but it's still early.
Currently the next two weeks are forecasted to be pretty wet. With many areas receiving plenty of moisture.
So there isn’t any concerns here yet.

C) US Production
We also have to keep in mind that despite everything going on with China and the focus switching over to Brazil, the US balance sheet is still tight for beans on the supply side.
Who knows where yield ends up at. Either way, there just isn’t a ton of room for error.
We've gone over these scenarios all year long.
But for example, if you left demand completely the same, and drop yield by X amount, this is the carryout you get:
53 Yield = 290 million carryout
52 Yield = 210 million carryout
51 Yield = 130 million carryout
The USDA will offset these supply losses by cutting demand numbers, but you get the idea.
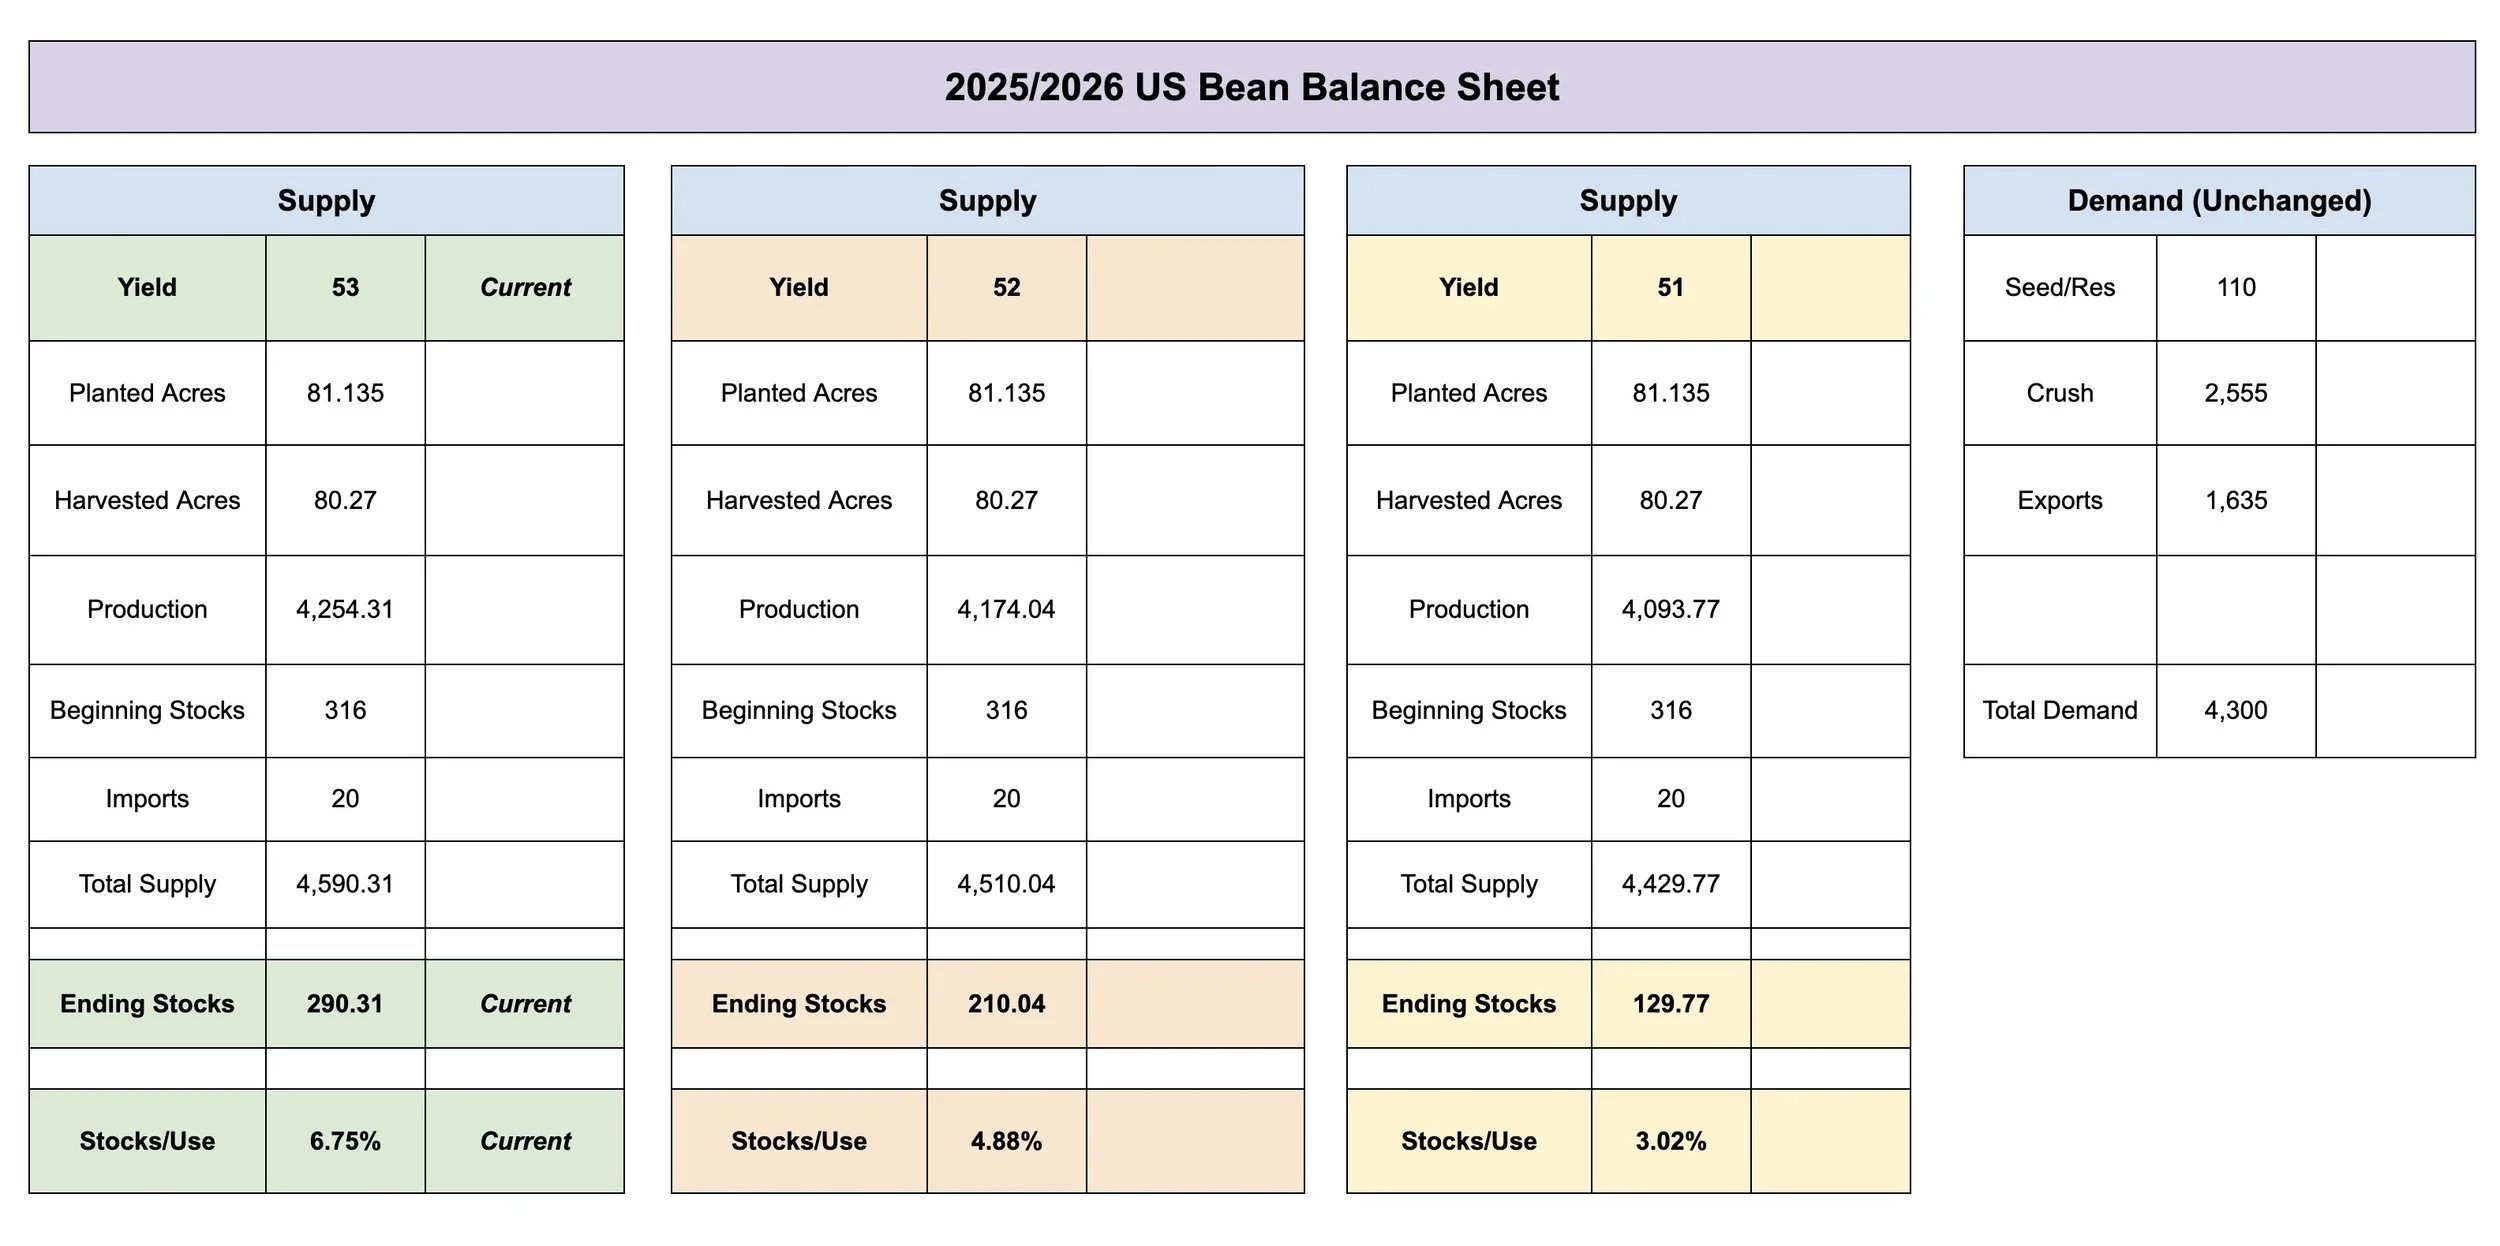
For reference, the current 290 million carryout isn’t bearish to begin with.
If you crawl towards that 250 range things become tight in the US.
The last bull run we were around that 260 range.
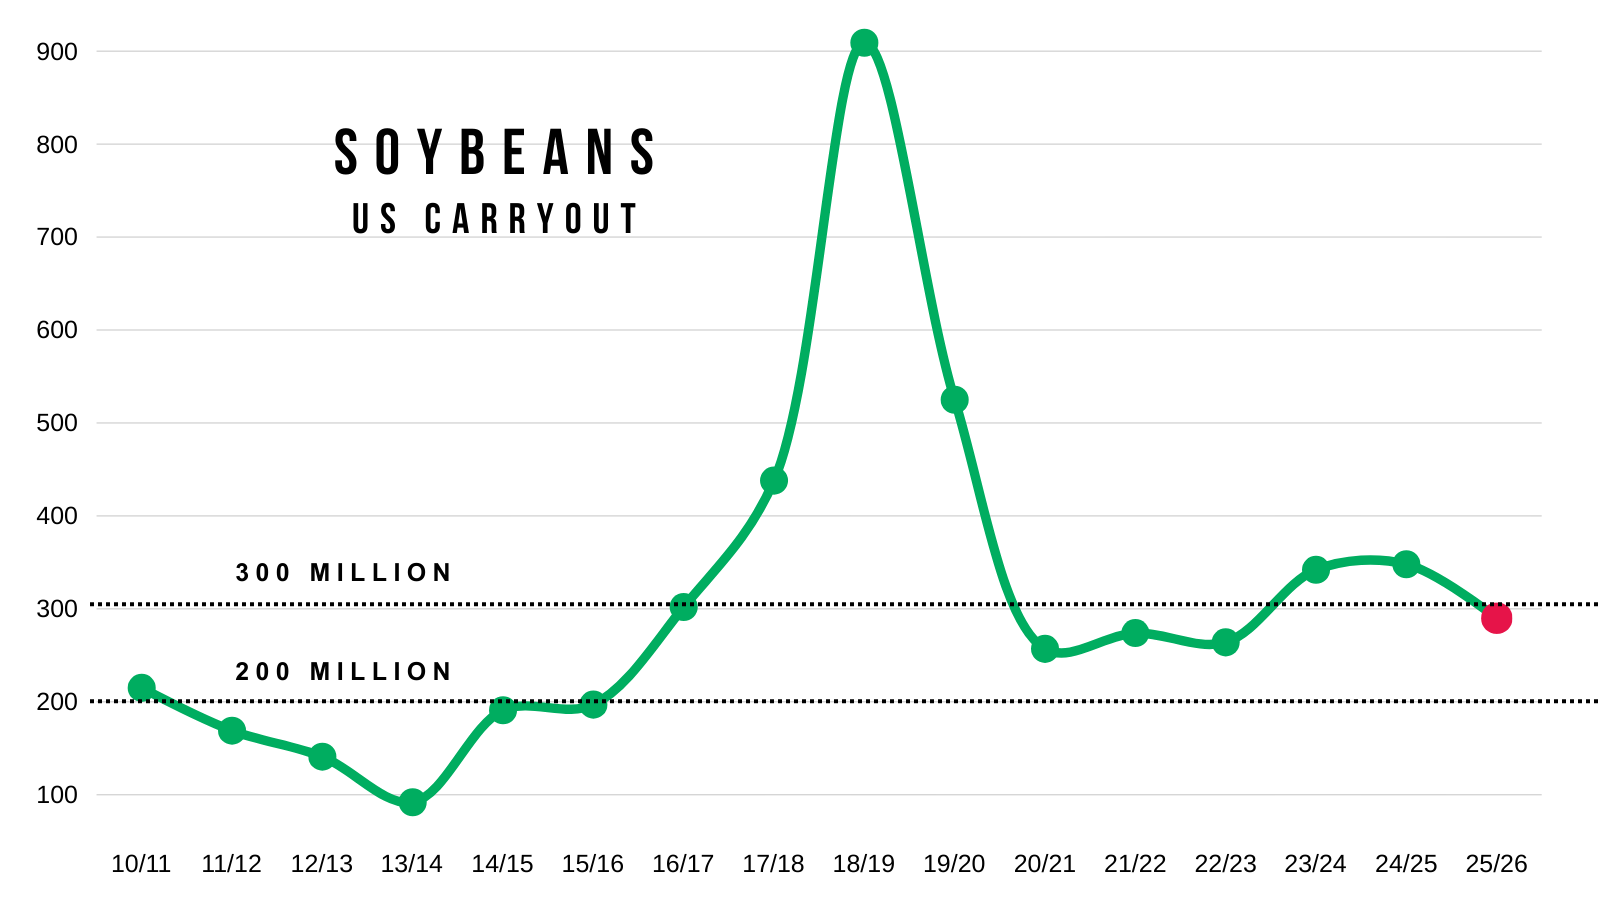
If our US carryout is almost as tight as it was during the bull market why aren’t higher?
Well we still have the concerns surrounding demand and China.
But the answer is the world situation.
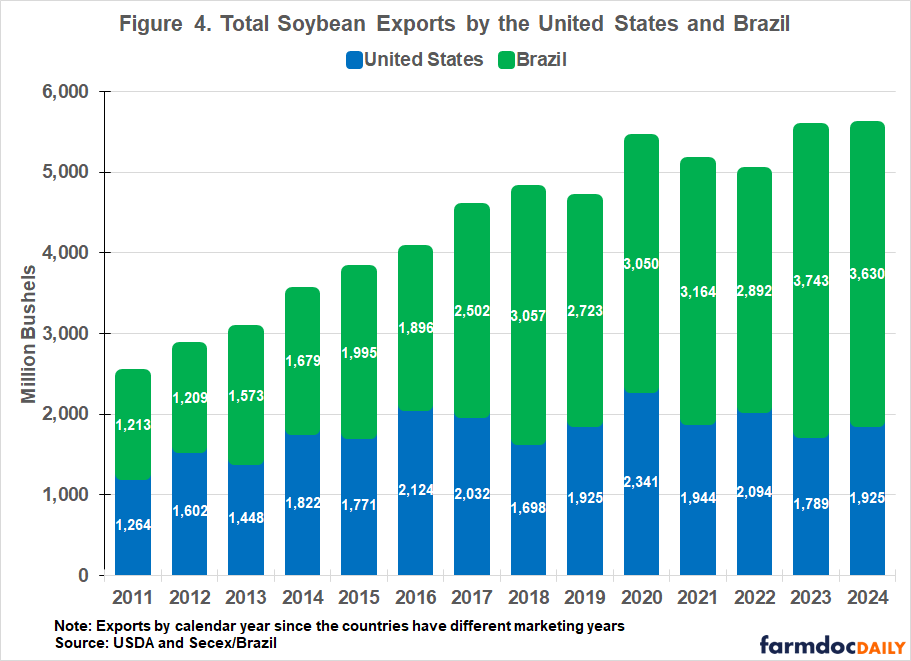
This is why Brazil's crop matters a lot.
Just look at how Brazil's exports have grown compared to the US.
A decade ago we were neck and neck. Brazil is clearly the leader now.
Chart from Farm Doc Daily
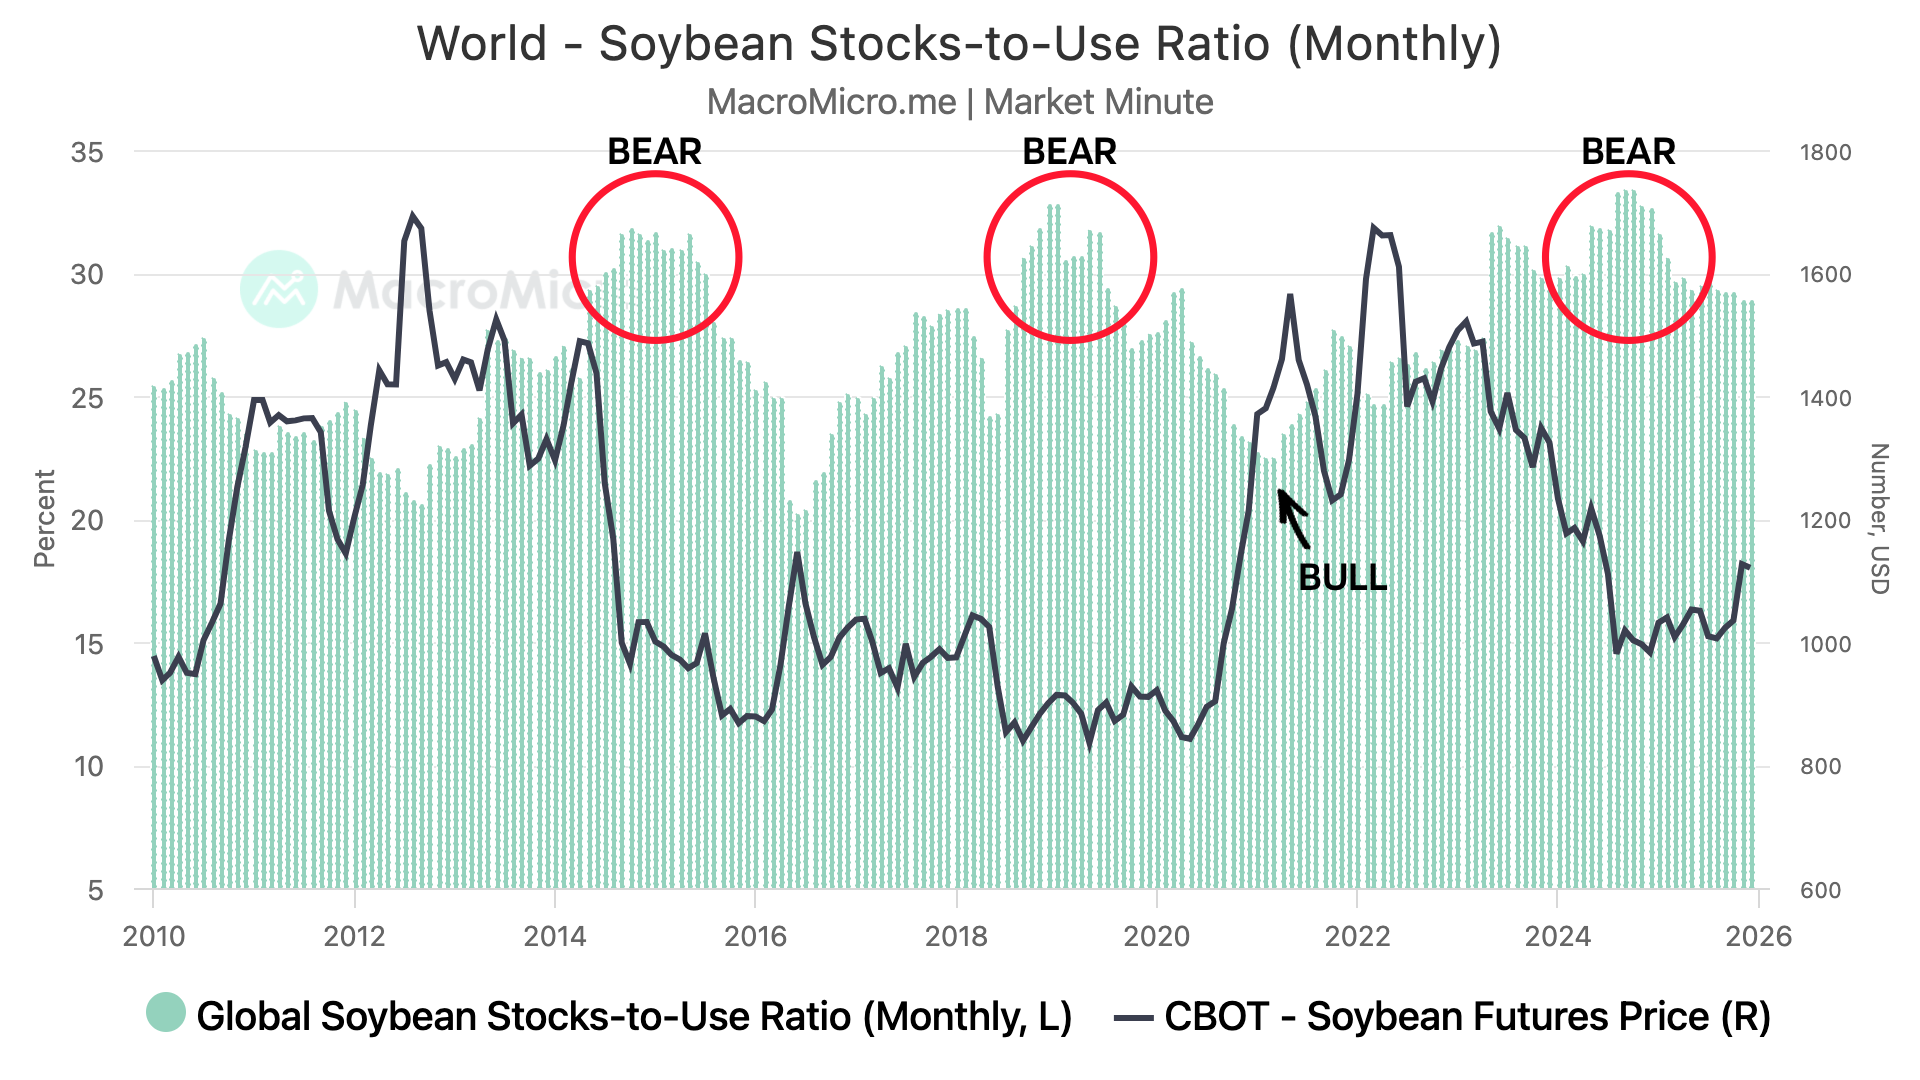
This is the world stocks to use ratio (green bars).
Along with soybean futures prices (black line).
Last year at one point, we were looking at the highest stocks to use ever. Higher than the trade war.
It's cooled off, but is historically still at some high levels.
Each time the stocks to use has been this high, bear market prices followed. Which is what we've experienced the last few years.
During the last bull market, the world stocks to use featured a tight situation.
Technicals:
Jan Beans
For now bulls want to hold $11.08
Which gives 61.8% of where we gapped open on the China news.
If we break below, the next point of interest is going to be the green box.
Which gives back 50-61.8% of the entire rally.
That level also perfectly lines up with a re-test of that yearly resistance. Old resistance is usually support and we have yet to back test the point of breakout.
We do not have to go that low, but it's possible. If we do, that is where I would expect us to find a floor.
We do have to be cautious that we still have a possible head and shoulders pattern in place which is viewed as bearish unless we break above the right shoulder.

Since we alerted that sell signal at $11.55
My next target I am looking to de-risk at is still $12.00 if we can get there.

Wheat
Mostly just going to be going over the charts today, as we are sitting at some key levels with not much fresh to update fundamentally.
We had that spike earlier this week off the back of war tensions, but like we've done for the past few years we gave the strength right back.
Today we did see StatsCan release their numbers.
Canadian farmers all-wheat production hit a new all-time record.
Chart from Karen Braun
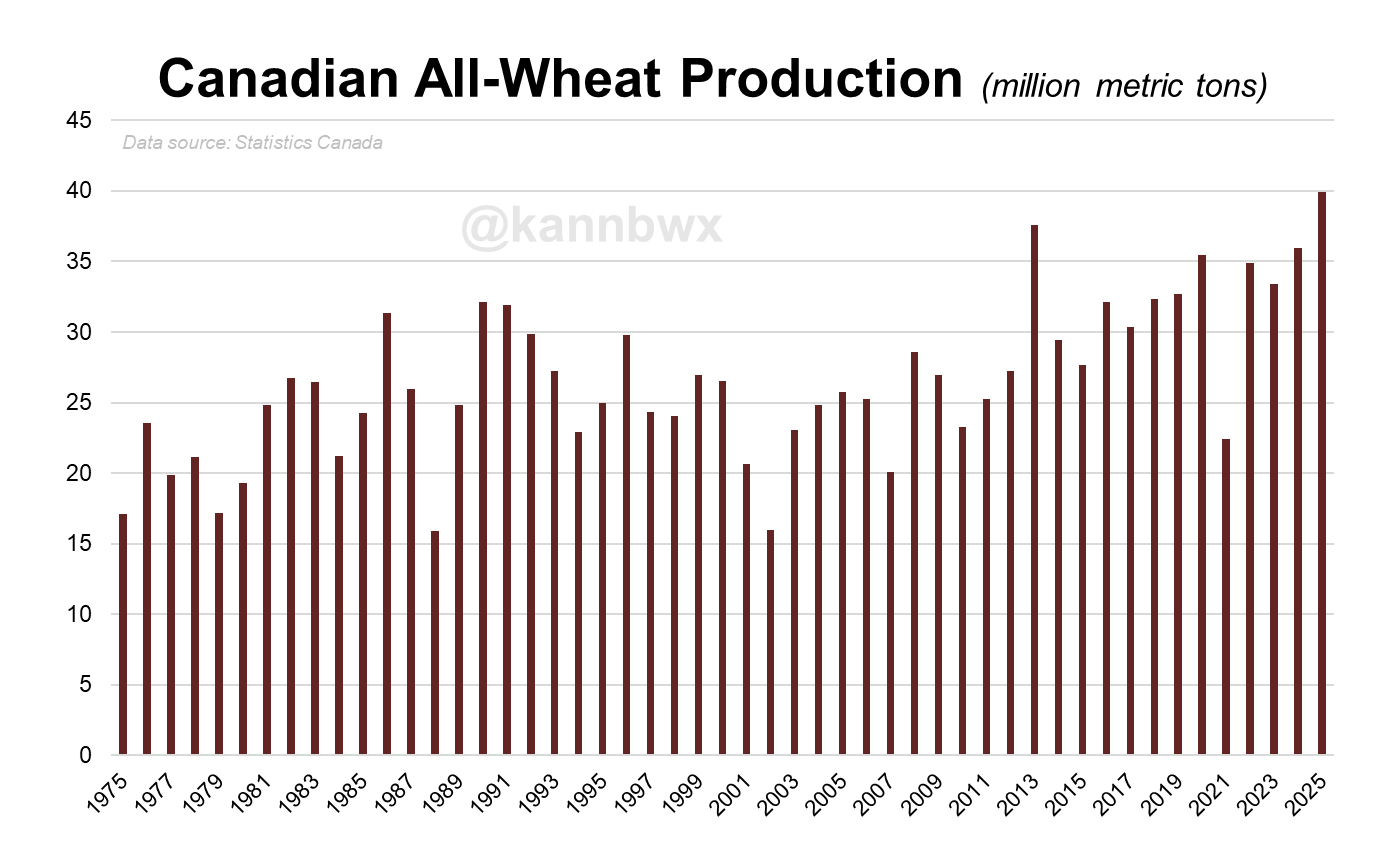
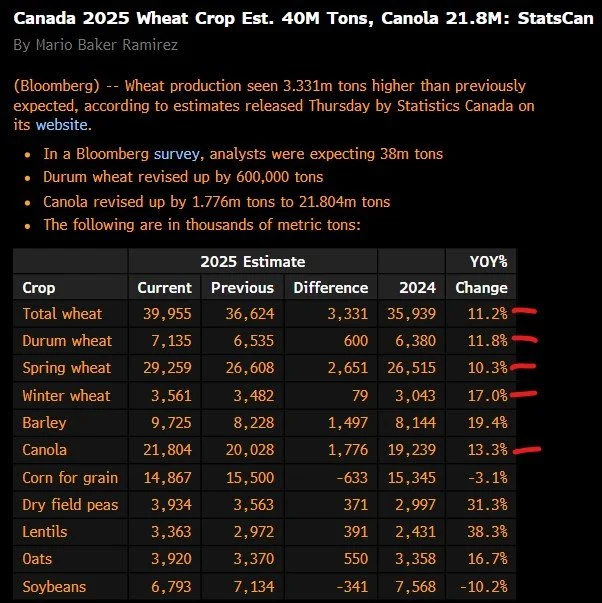
Here was the results from Stats Can.
Large year over year changes across the board in wheat and canola.
Overall, demand is great for the wheat market. The best it's been in over a decade.
However, the world just has too much supply and we lack a true catalyst to go tremendously higher for now.
Technicals:
March Wheat
This market has traded completely sideways since Nov 21st.
Today we did end up closing +9 cents off the lows after testing that golden fib once again.
We have now tested and bounced off that level several times now.
That is still the must hold area. It gives back 61.8% of the entire rally from contract lows.
Which is a standard correction. Bounce there and the trend remains higher. Fail there and we open the door lower towards contract lows.
To the upside, we've been failing that blue box around $5.45 for two weeks now. A break above should bring more upside.

If the rally comes, I am still targeting the green box in the $5.70 to $5.85 range.
That reclaims 50-61.8% of the June highs.
The 200-day MA sits right there as well.
This market has only traded above the 200-day a handful of times this year. Every single time it was short lived.

Dec KC Wheat
KC continues to hold the golden zone.
That is still the must hold spot.
So $5.20 is the level to hold to keep the trend higher.
As that level is where the market tells us if we are simply correcting or starting to fall apart.

Cattle
The cattle market continues to run off the recent lows.
Open interest has been decreasing on the rally, so that tells us that shorts are decreasing instead of new actual long positions being open.
It would probably take some fresh news to get managed money back behind this market.
Yes the fundamentals are still tight as ever. But the government wants lower prices.
Then we also have the on going story of the border and when it will be re-opened.
They did just find a new case of screw worm 120 miles off the Texas border, which will probably continue to delay the border from re-opening.
Regardless, I think we are approaching some great hedging opportunities.
So let's jump into the charts.
Technicals:
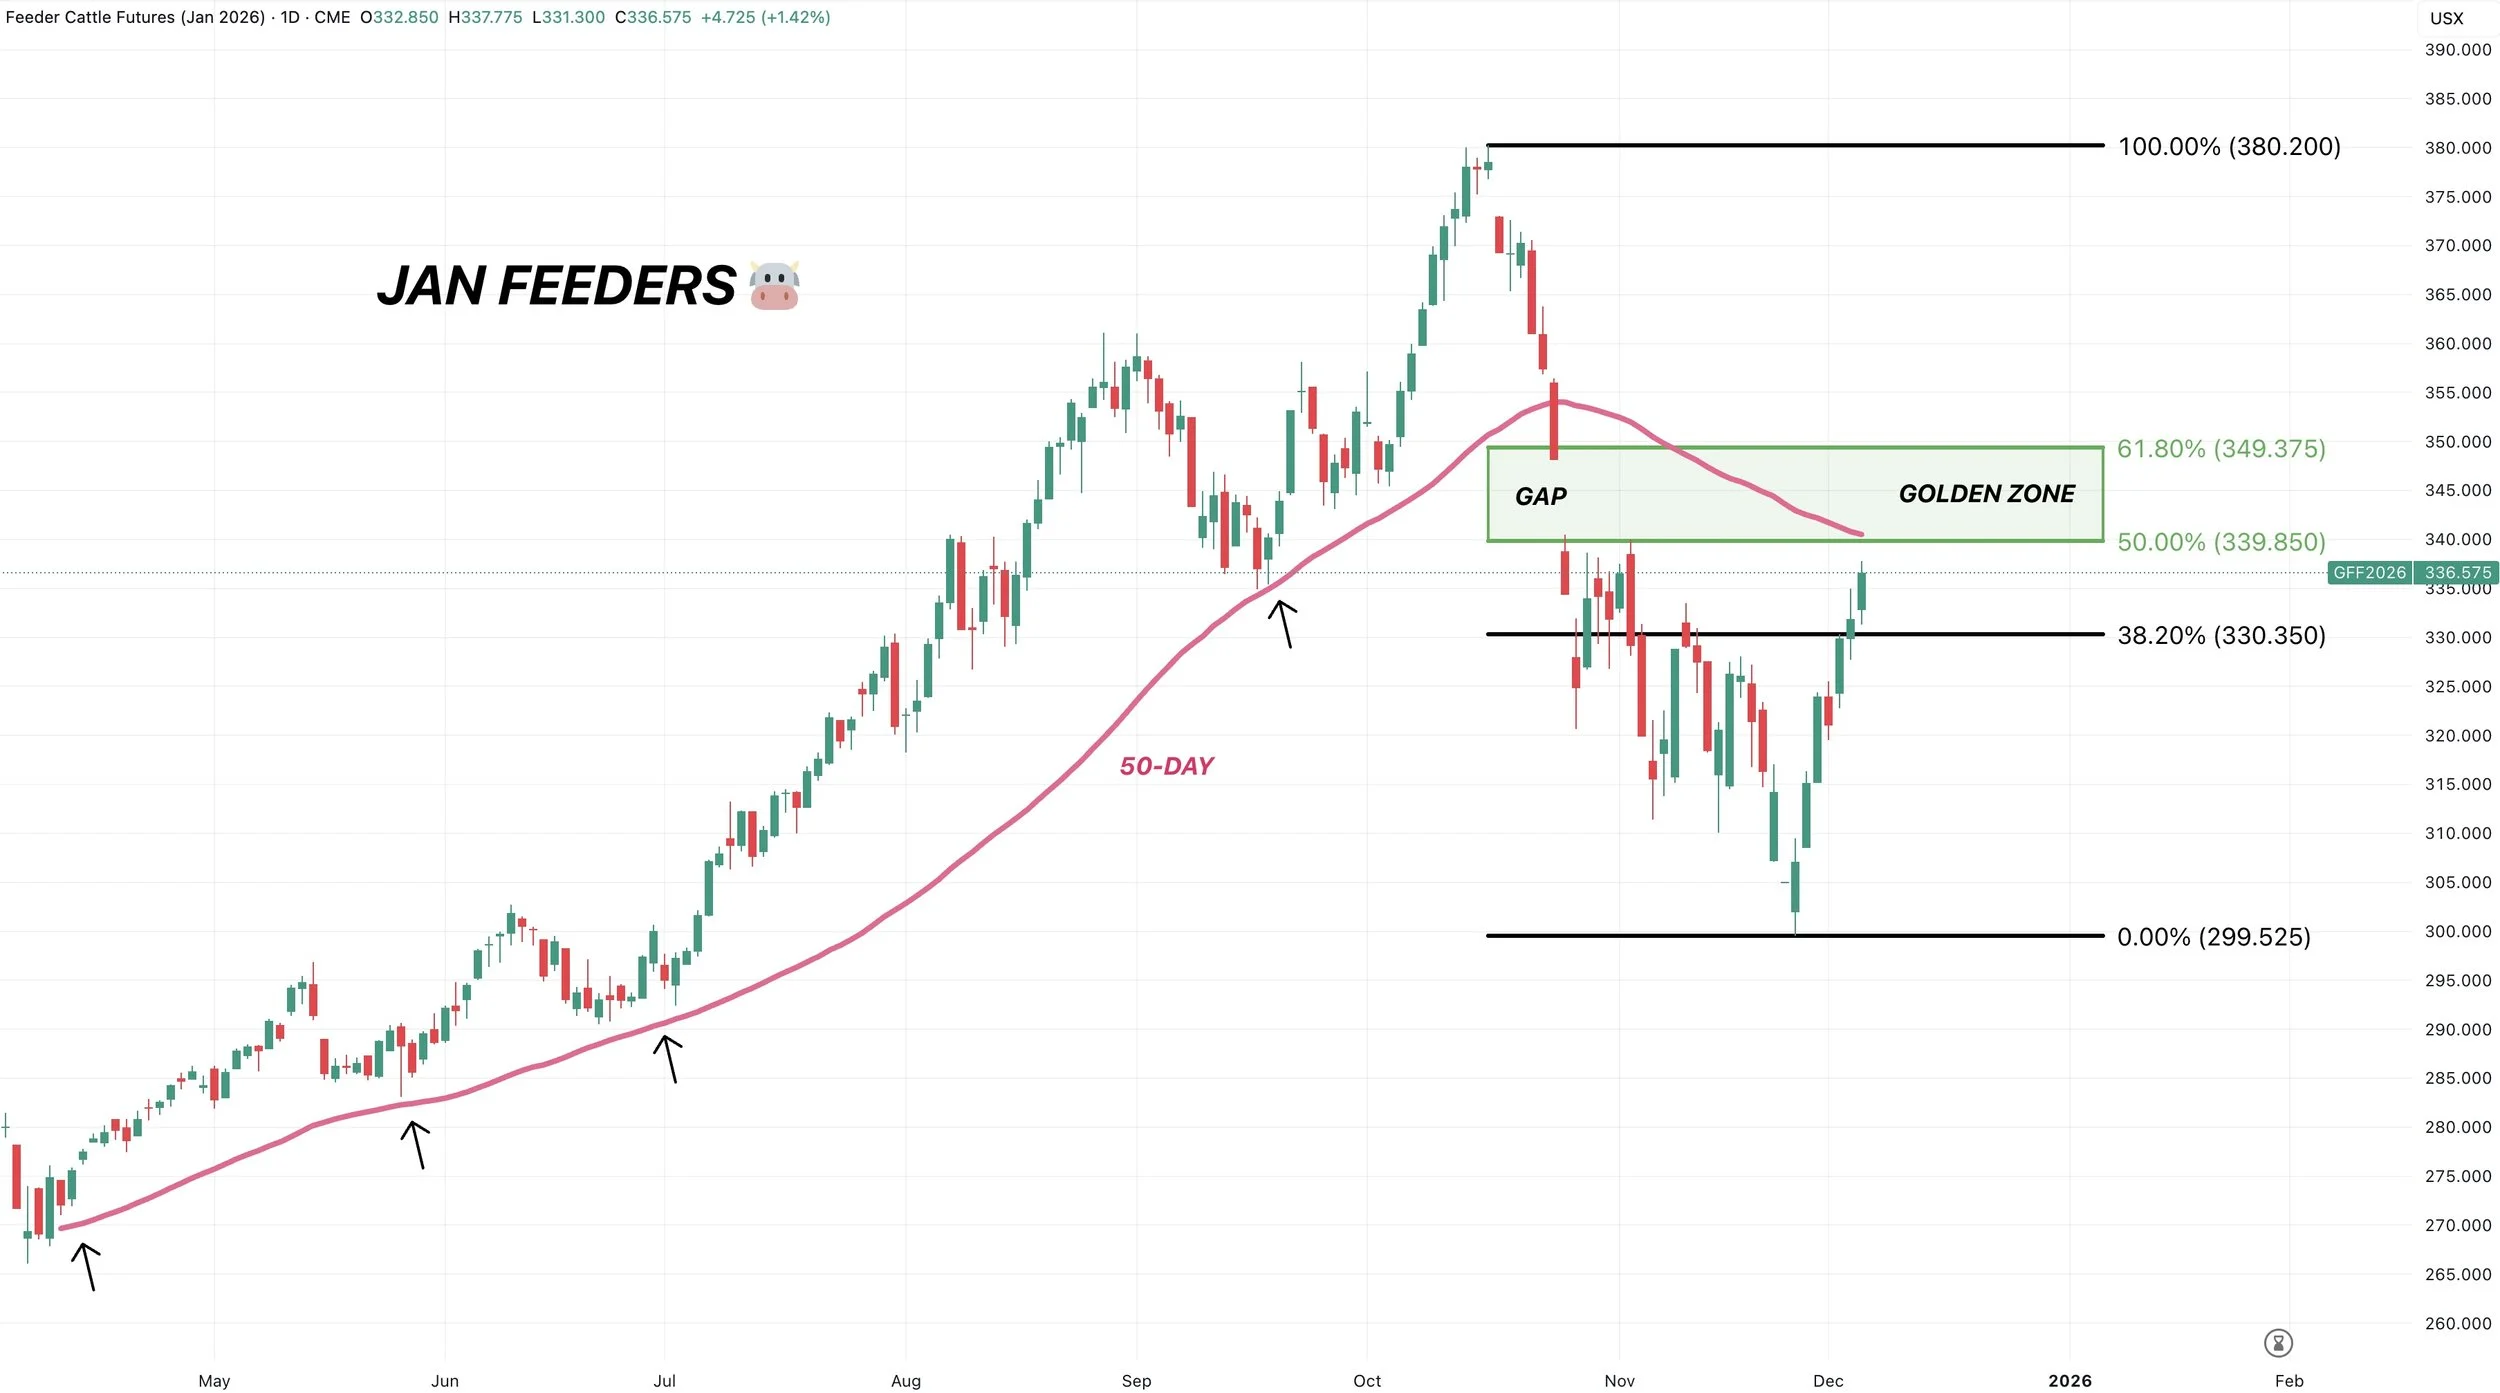
Jan Feeders
339 to 349 claws back 50-61.8% of this entire sell off.
The 50-61.8% levels are the most common spot for a market to revert back to before making a decision.
We are getting very close to reclaiming 50% of the sell off.
The 50-day MA also sits almost exactly at that 50% level.
If you remember, that 50-day MA acted a floor the entire year.
So it should now be viewed as resistance (old resistance is new support).
The 61.8% level aligns with that gap we left in Oct.
I'm not sure we have enough juice to fill the gap and hit the 61.8% level.
So I will likely be looking to de-risk at the 50% level and 50-day MA.
That is where I will likely be issuing a hedge alert. Our first since Oct 13th.
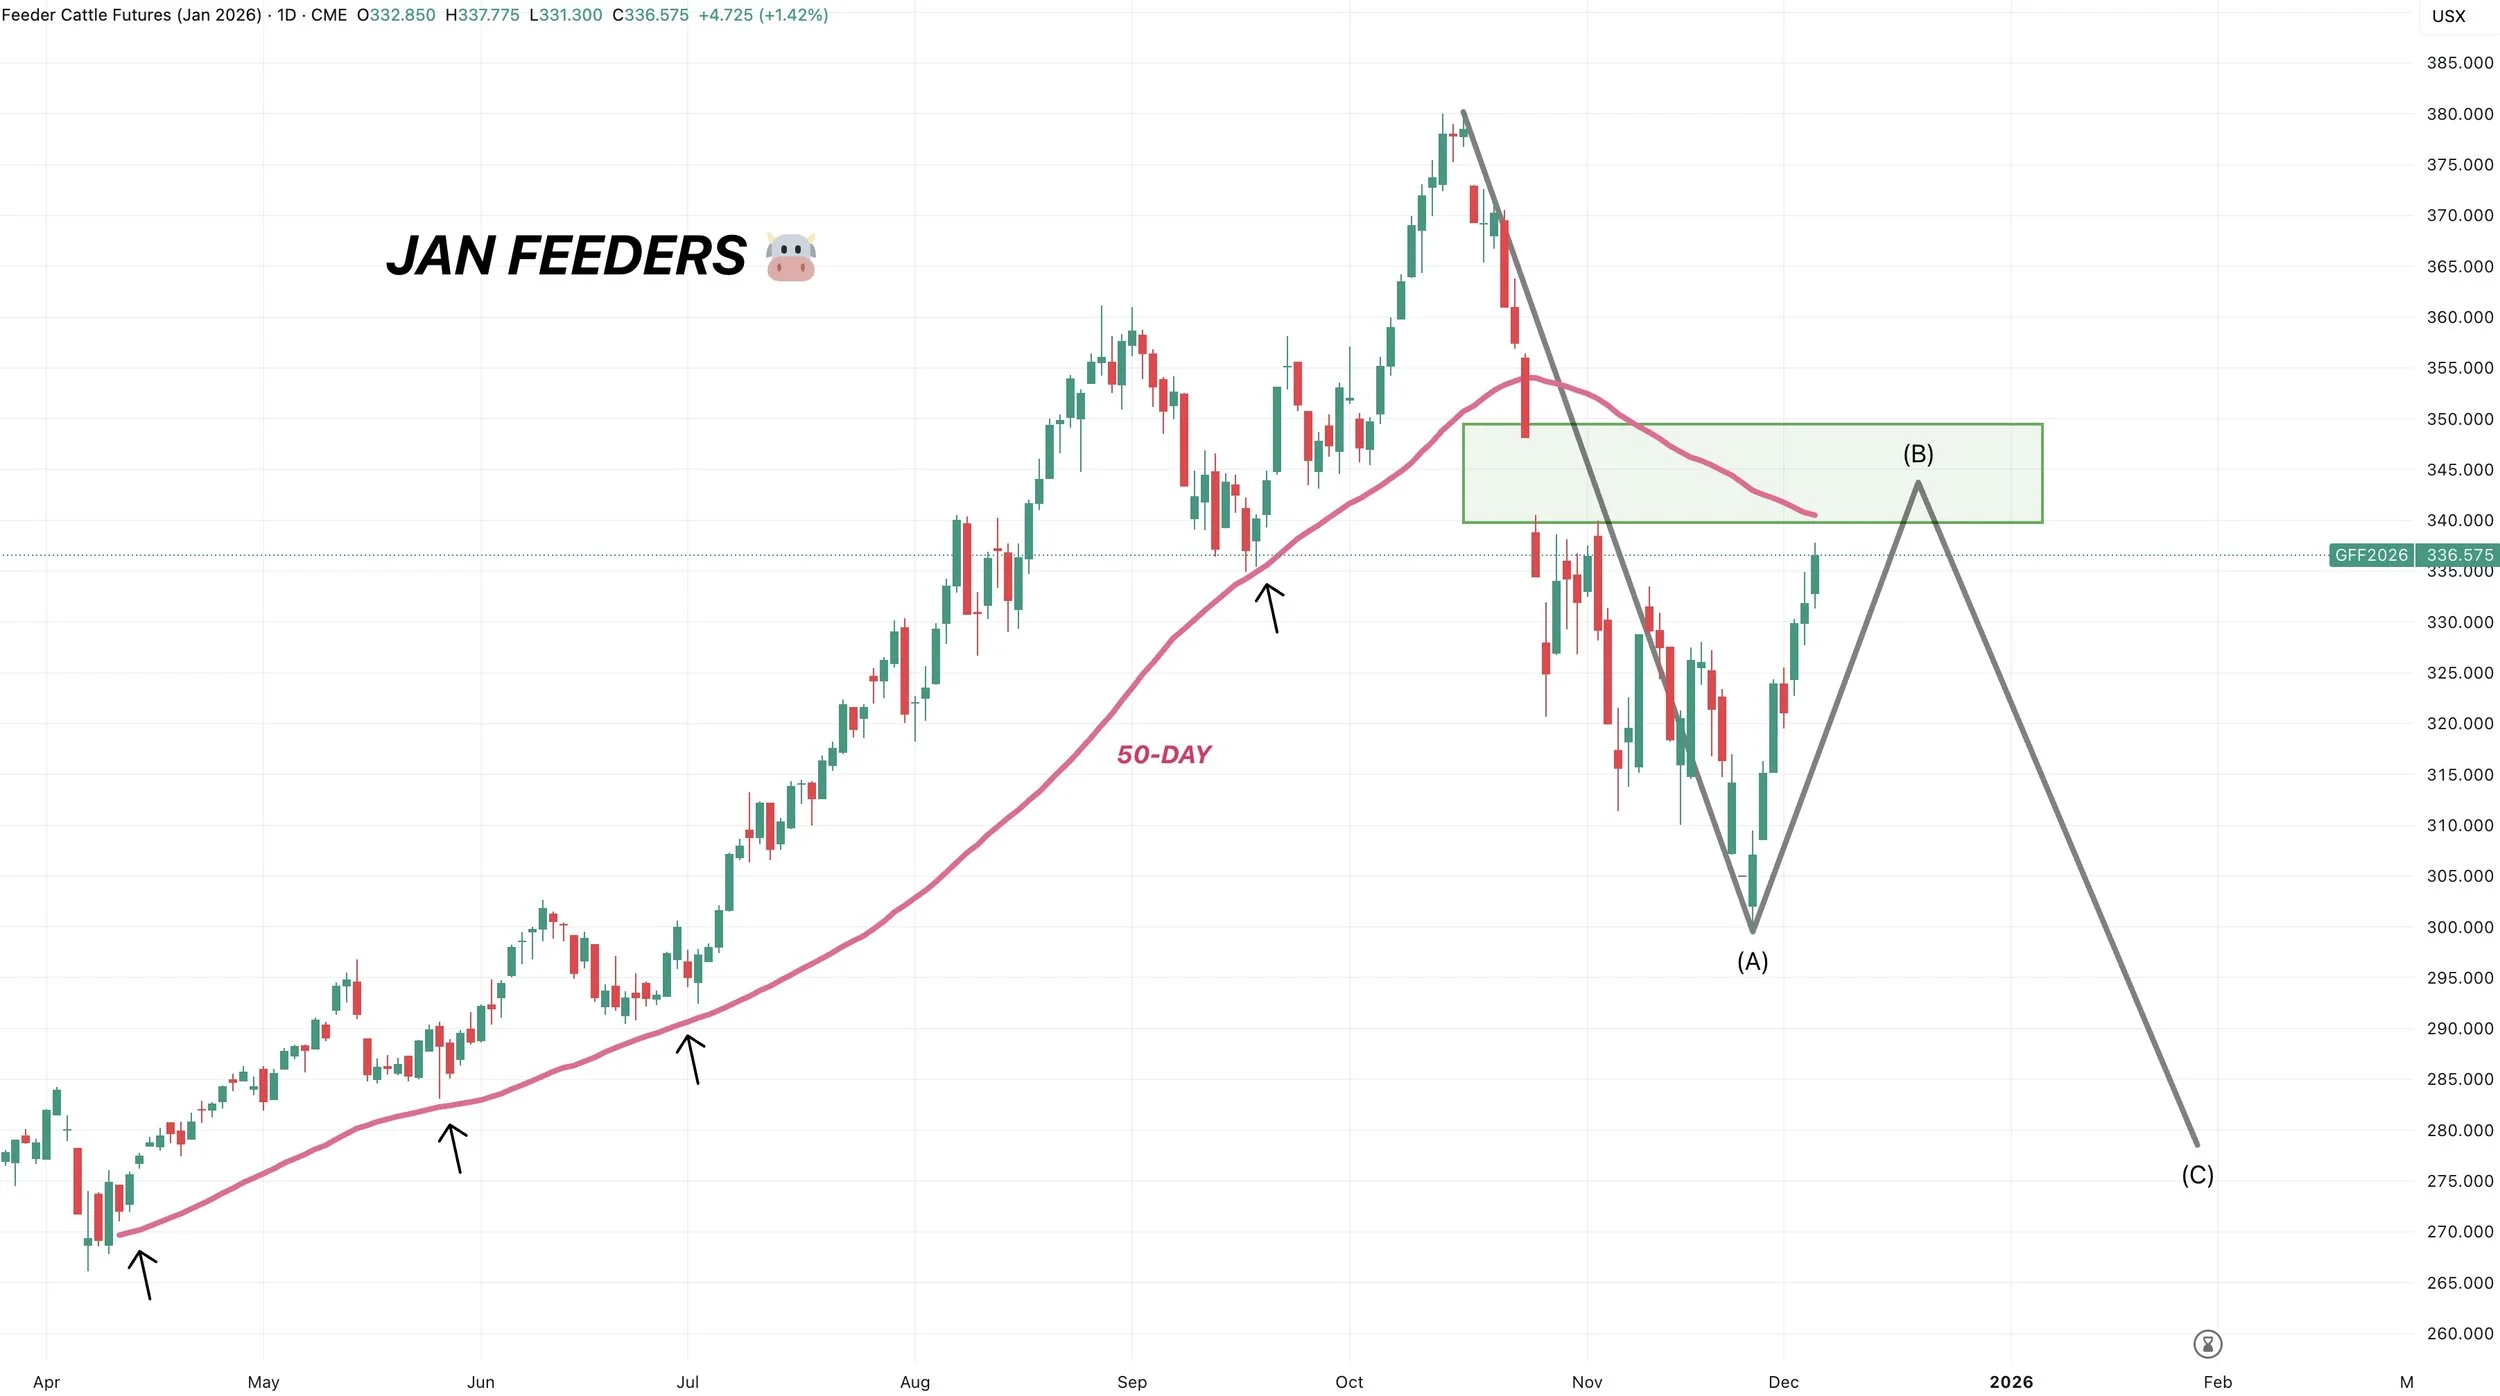
In markets, the most common pattern for a correction is called an "ABC" correction.
You get the intial A wave down. The start of the sell off.
Then you get the B wave up. This is the relief bounce where everyone thinks the bottom is in.
Then you get the last C leg down. Which is the leg that actually marks the bottom.
Doesn’t have to happen, but I could very easily see something like this play out where we end up making a bigger leg lower eventually.
Which is why I want to be rewarding this rally soon.
Feb Live
Live cattle are not as close to that upside target as feeders are.
However, when we alert that hedge alert for feeders it will also be for live cattle. As they move in tandem for the most part.
Then if we hit the target in live cattle, we will issue another hedge alert.
For example,
Feeders could hit the 50% target. Meanwhile live cattle does not hit the target. Either way, we want to take risk off the table because feeders hit a target.
Or perhaps feeders hit the 61.8% level and fill the gap, and then live cattle only hits the 50% level. So we take risk off the table again.

Past Sell or Protection Signals
Nov 17th: 🌱
Soybean sell signal & hedge alert.
Nov 13th: 🌽 🌱
Managing risk in corn & beans ahead of USDA report.
Oct 28th: 🌽
Corn sell signal & hedge alert.
Oct 27th: 🌱
Soybean sell signal & hedge alert.
Oct 13th: 🐮
Cattle sell signal & hedge alert.
Aug 22nd: 🌱
Soybean sell signal & hedge alert.
July 31st: 🐮
Cattle sell signal & hedge alert.
July 10th: 🐮
Cattle sell signal & hedge alert.
CLICK HERE TO VIEW
June 5th: 🐮
Cattle sell signal & hedge alert.
June 2nd: 🌾
MPLS wheat sell signal.
April 10th: 🌽
Old crop corn sell signal.
March 19th: 🐮
Cattle hedge & sell signal.
Feb 18th: 🌽 🌾
Old crop KC wheat & old crop corn signal.
Jan 23rd: 🌽 🌱
Corn & beans old crop sell signal.
CLICK HERE TO VIEW
Jan 15th: 🌽 🌱
Corn & beans hedge alert/sell signal.
Jan 2nd: 🐮
Cattle hedge alert at new all-time highs & target.
Dec 11th: 🌽
Corn sell signal at $4.51 200-day MA
CLICK HERE TO VIEW
Oct 2nd: 🌾
Wheat sell signal at $6.12 target
Sep 30th: 🌽
Corn protection signal at $4.23-26
Sep 27th: 🌱
Soybean sell & protection signal at $10.65
Sep 13th: 🌾
Wheat sell signal at $5.98
May 22nd: 🌾
Wheat sell signal when wheat traded +$7.00
Want to Talk?
Our phones are open 24/7 for you guys if you ever need anything or want to discuss your operation.
Hedge Account
Interested in a hedge account? Use the link below to set up an account or shoot Jeremey a call at (605)295-3100.