
DOES HISTORY SAY HIGHER CORN?
MARKET UPDATE
You can scroll to read the usual update as well. As the written version is the exact same as the video.
Timestamps for video:
Overview: 0:00min
Corn: 1:00min
Beans: 6:25min
Wheat: 12:25min
Cattle: 14:00min
Want to talk about your situation?
(605)250-3863
Futures Prices Close
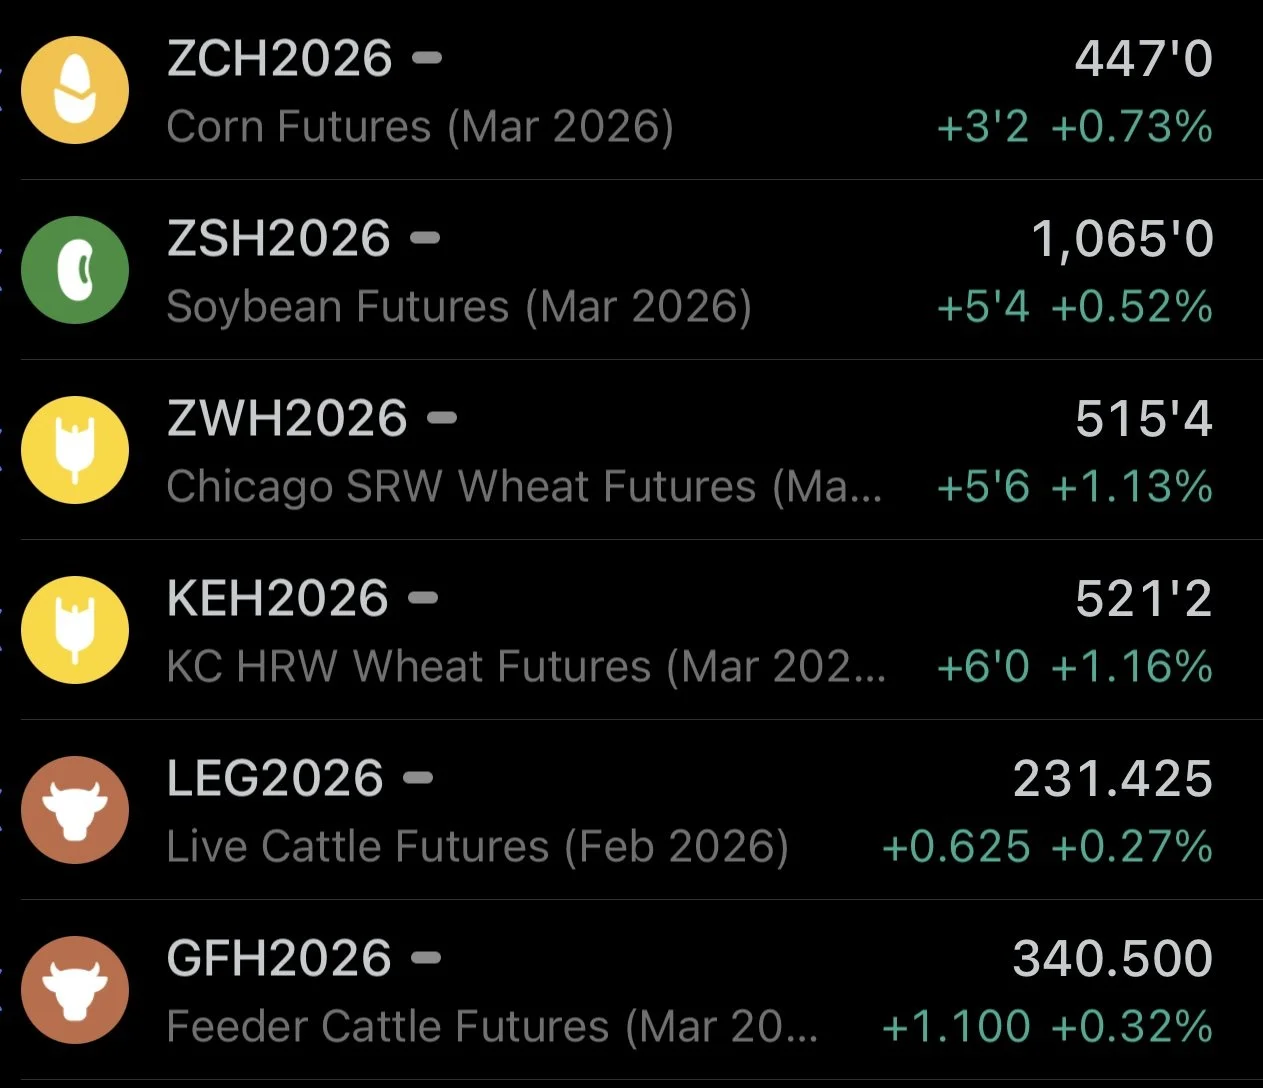
Overview
Grains and cattle higher across the board as wheat leads the way higher.
Today soybeans ended their longest daily losing streak since August 2024. As before today, they traded lower for 6 days in a row.
Soybeans were only up a nickel, but today was actually soybeans' strongest day of the entire month of December. As today was just the 4th day of the month we've been higher.
Trading lower the last 11 of 15 days.
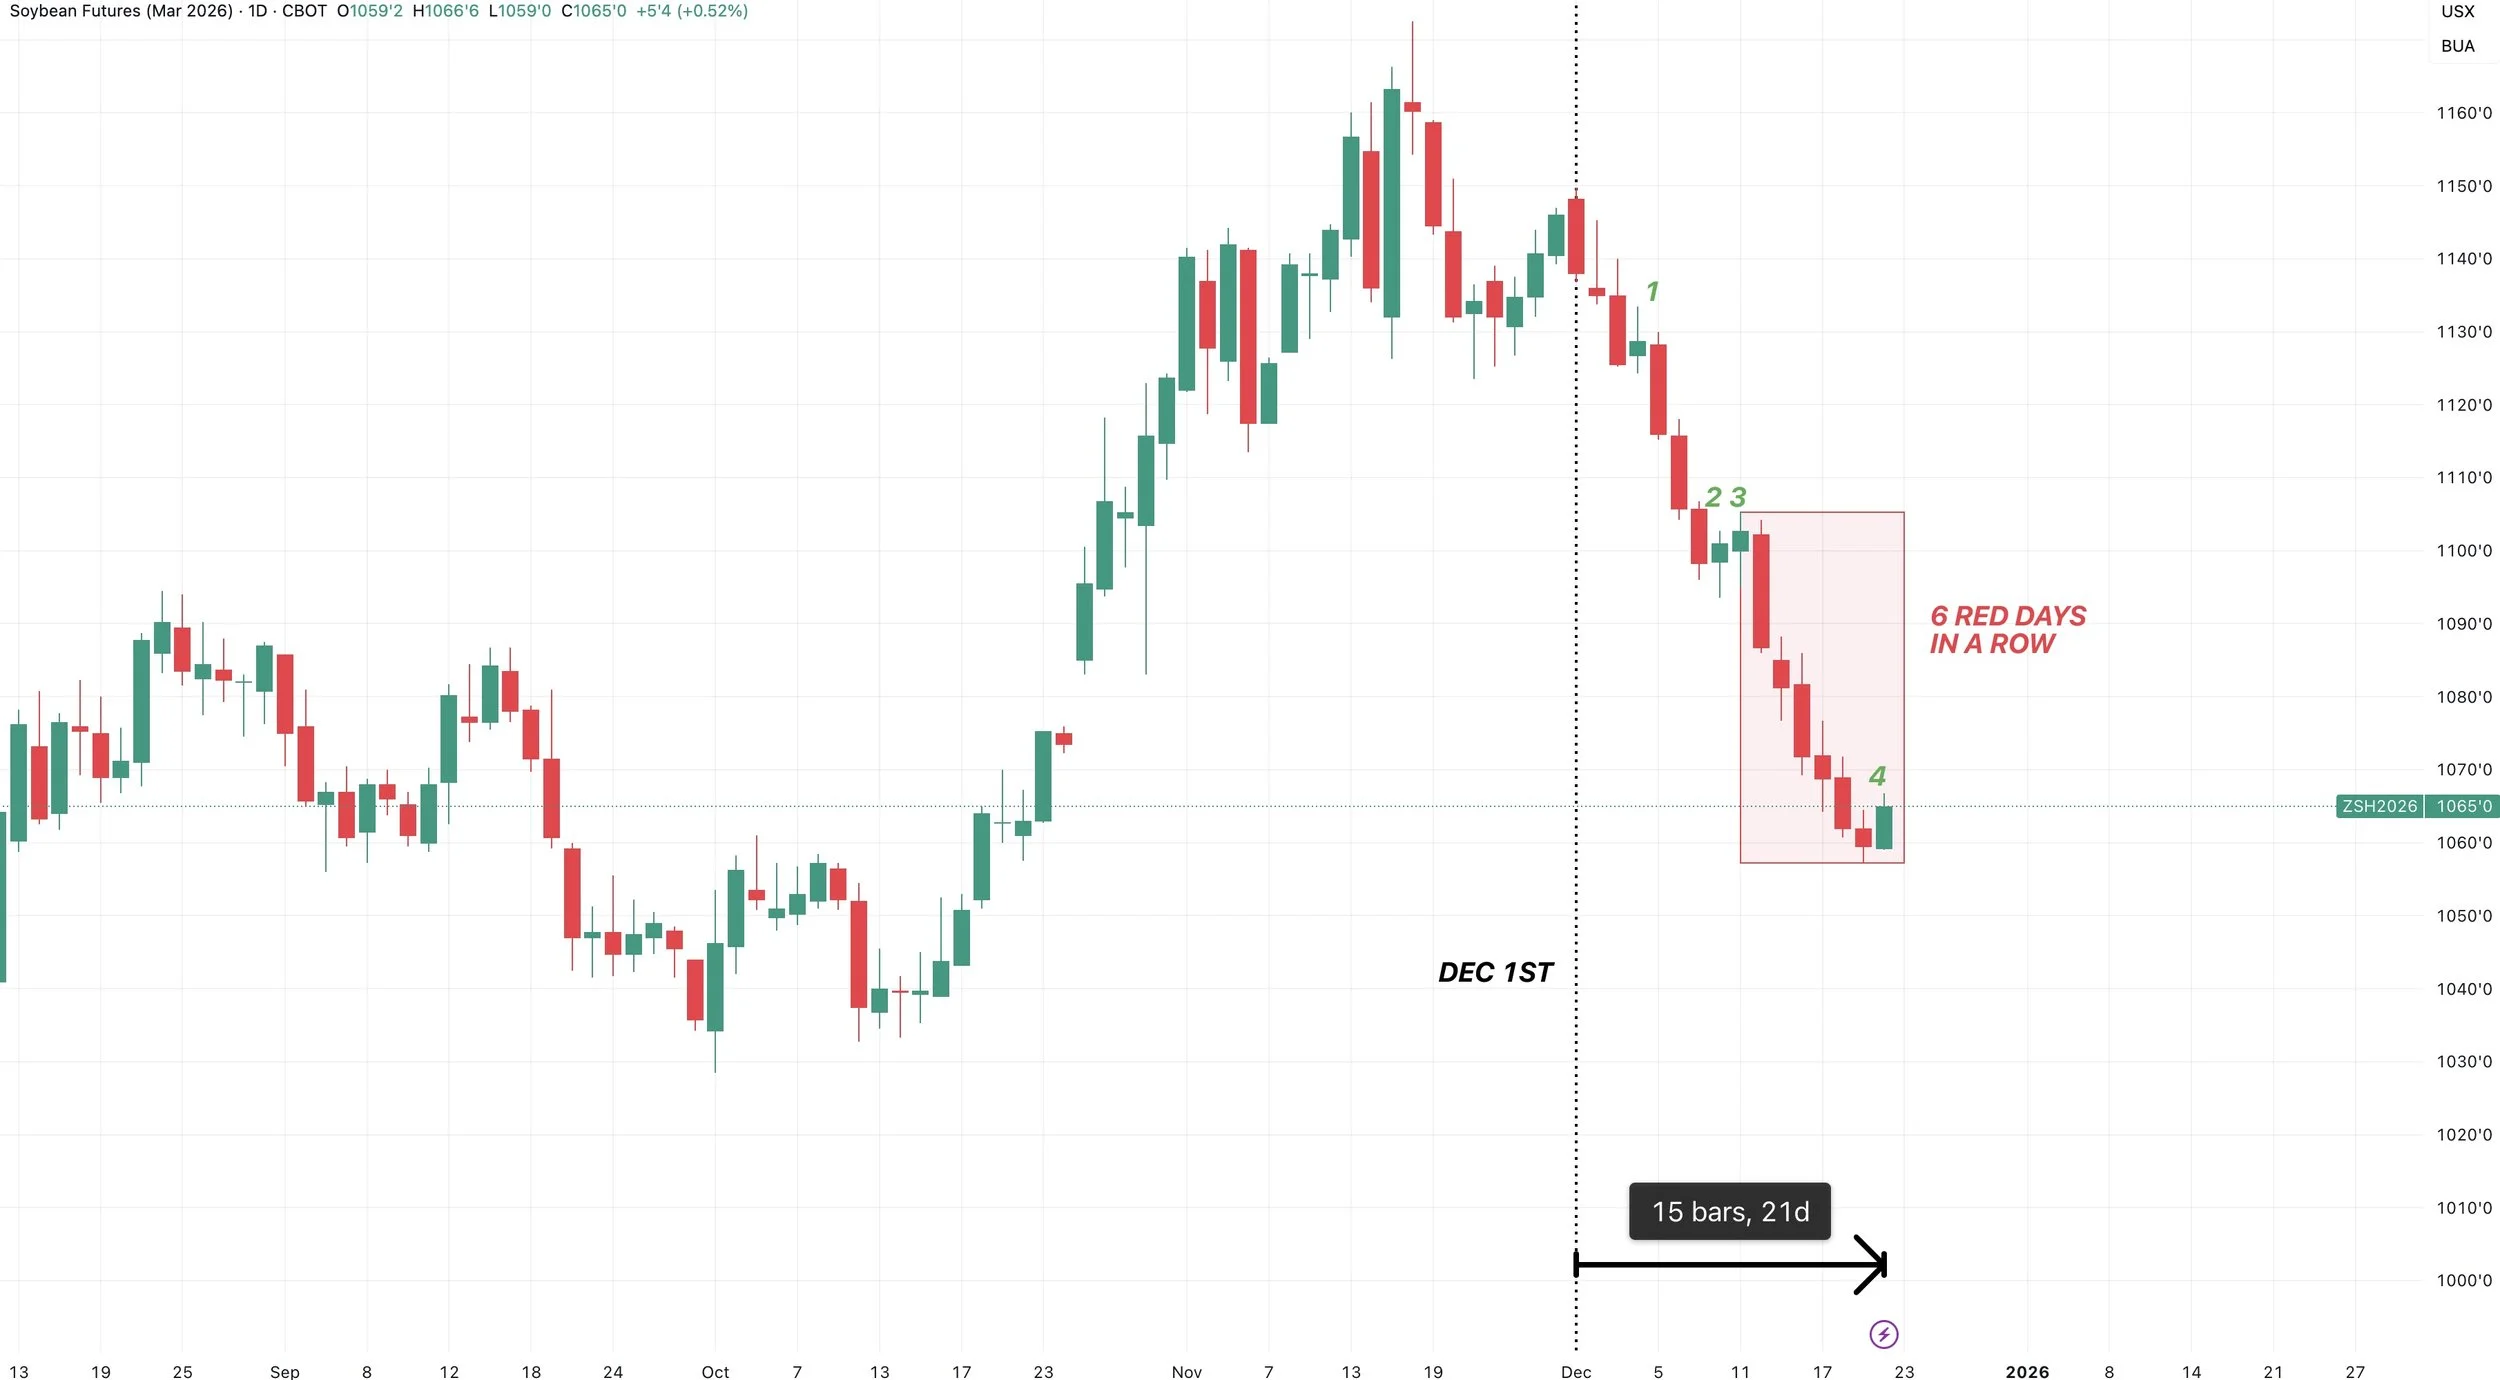
We have a holiday week with thin trade and low volume. So sometimes this can lead to some larger swings. As low volume makes it so the market can move larger with less trades.
Outside of that, there wasn’t much fresh news for the market to digest.
Here is the market's trading schedule for this week:
🟢 Today: Normal
🟢 Tomorrow: Normal
🟠 Wednesday: Close Early at 12:05pm CT
🔴 Thursday: Closed
🟢 Friday: Open 8:30am CT and normal close.
We will have an update out tomorrow. The rest of the week will depend on if anything significant happens in the markets or not. If nothing noteworthy happens, we will not have anything out on Wednesday or Friday.
Today's Main Takeaways
Corn
Fundamentals:
Some are saying that the recent strength in corn has largely been behind the idea that China might be buying our corn.
Who knows if this rumor has any merit. I am pretty skeptical, but of course it'd be incredibly friendly.
Outside of the last trade deal, China rarely buys corn. We have seen several years where they don’t purchase much if any.
They haven’t bought any for this marketing year.
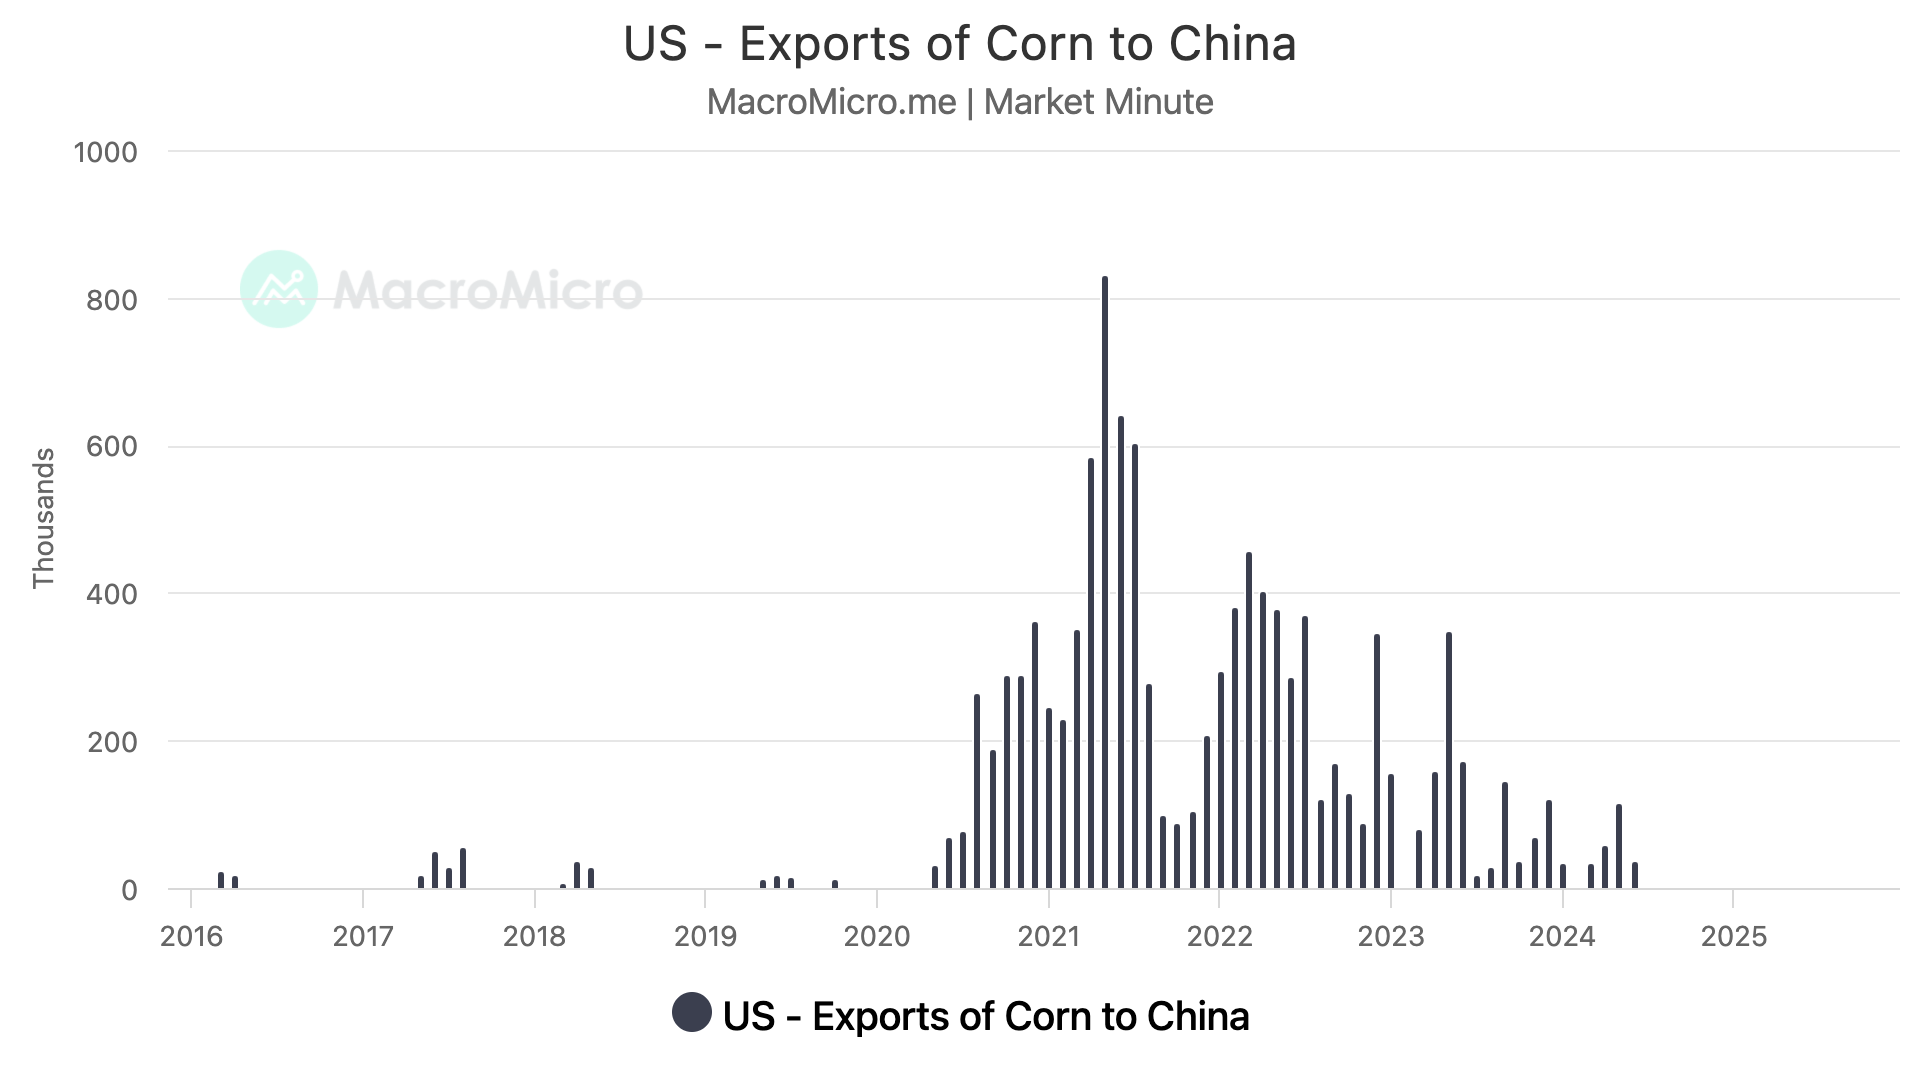
Regardless, this rumor, along with our actual export demand, has been adding some support.
Here is a nice chart from Karen Braun that shows that show cases non-China exports sales along with China sales.
(Blue = Non-China) (Orange = China)
Our export demand is the best it's ever been.
2021 was driven almost entirely from China.
So you can only imagine how much more friendlier the corn demand story becomes if you throw some China buying on top of what's already record demand.
This is one of those possible wild cards that "could" lead to a lot more bullish of situation than we currently. But of course, it's still just a wild card for now.
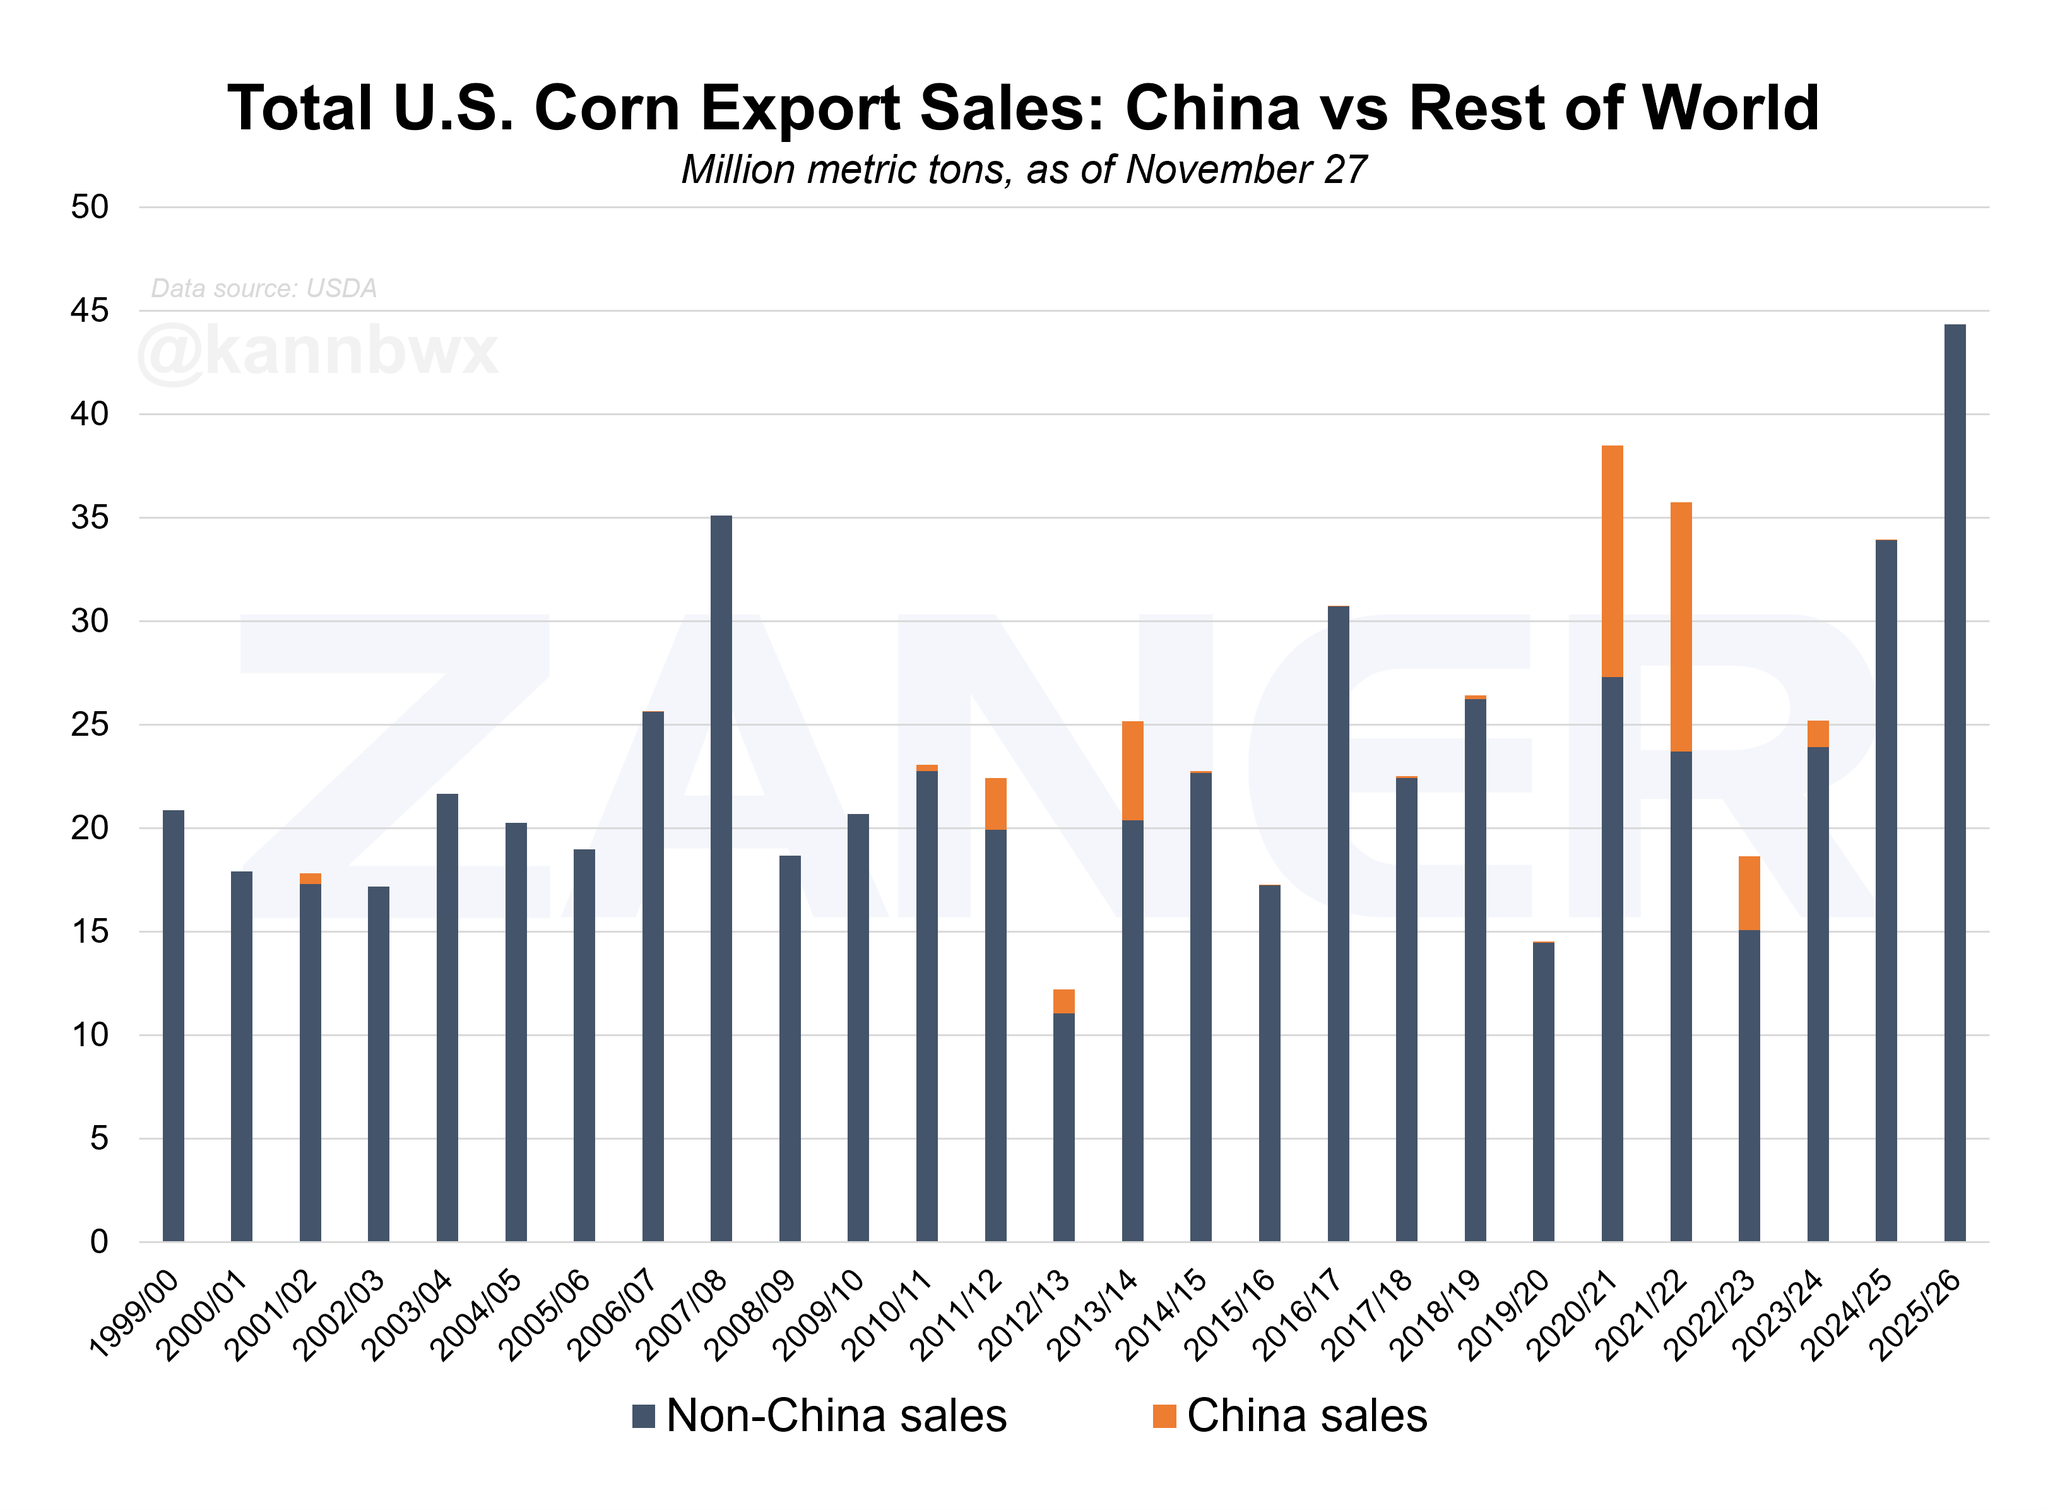
Record demand should continue to support this market and keep a floor under us. Essentially prevent this market from falling apart.
Because this market can’t get too cheap without incentivizing even more demand.
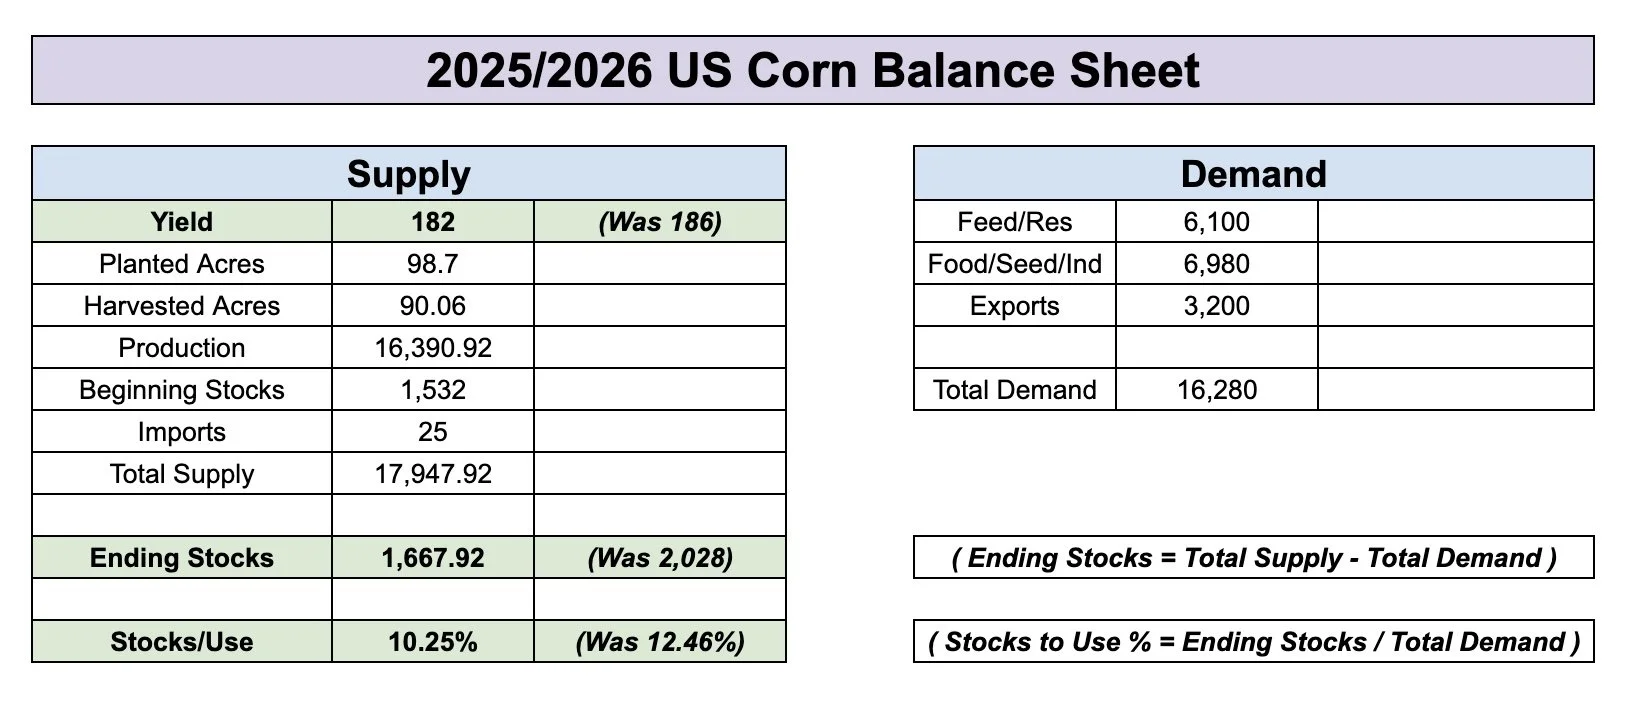
However, like we'd talked about for a long time. It still might be hard to paint some crazy bullish story in corn unless we see some major shock in the USDA report come January.
For starters, feed and residual should be coming down in the report. Almost everyone agrees with this. So that will partially offset some of the yield cuts.
I am pretty confident yield will move lower in January.
But it would take a pretty large cut to yield to get this market in a situation where we are drastically below a 2 billion bushel carryout.
Without changing demand, to get a stocks to use as tight as last year's, we would need to see a yield of 182. This is without lowering the feed and residual number.
I am not bearish corn at all.
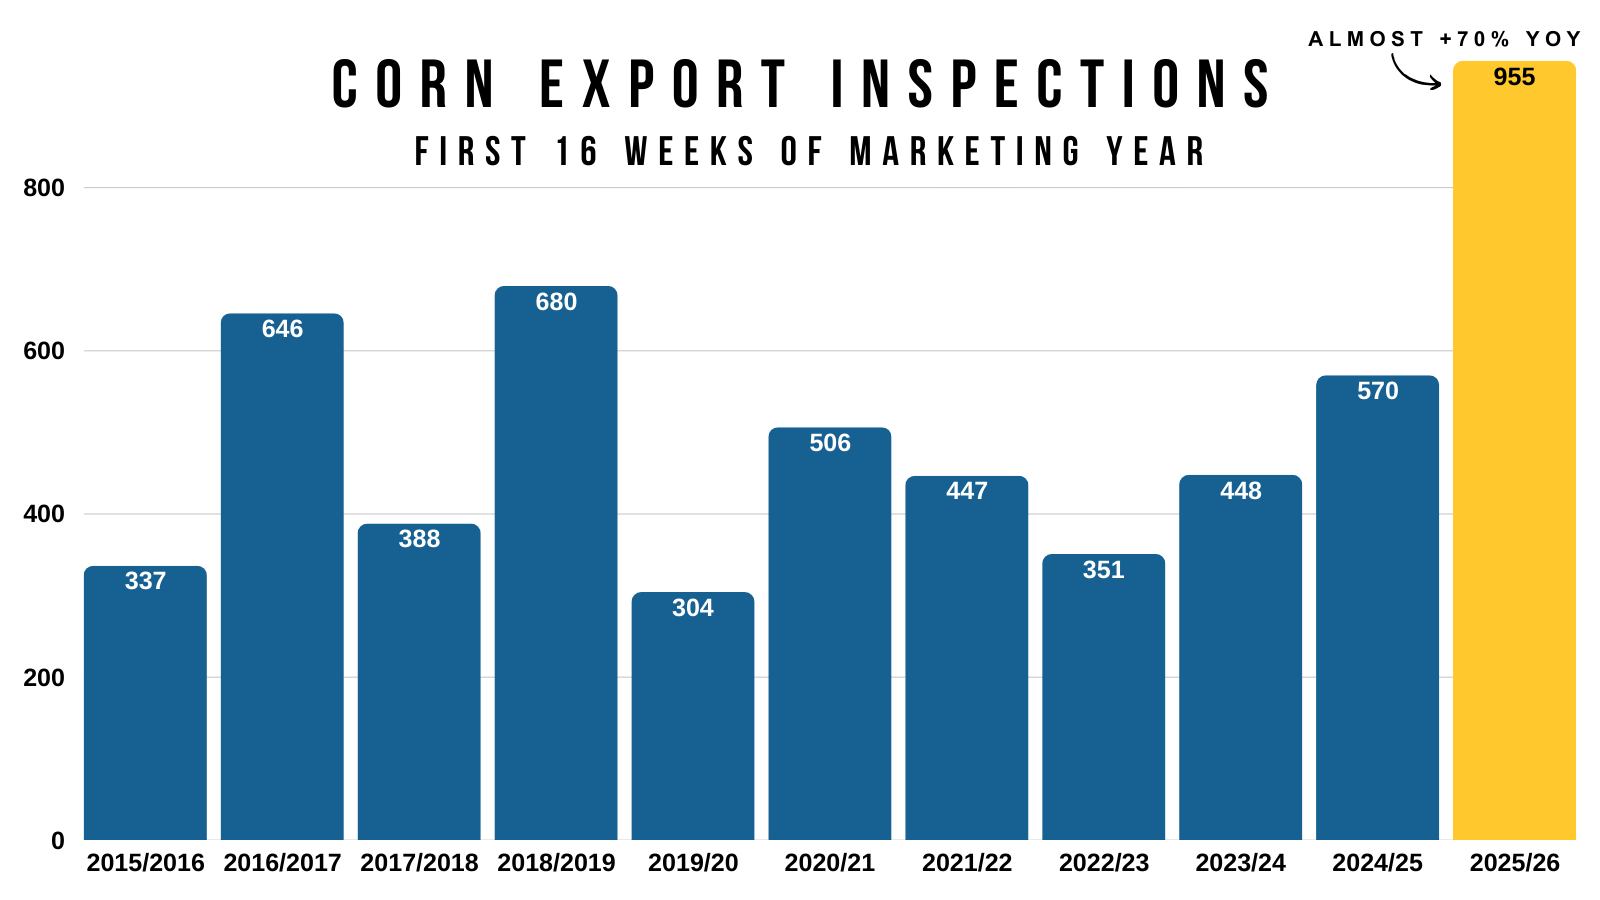
I mean look at the export inspections.
They are nearly up +70% compared to last year.
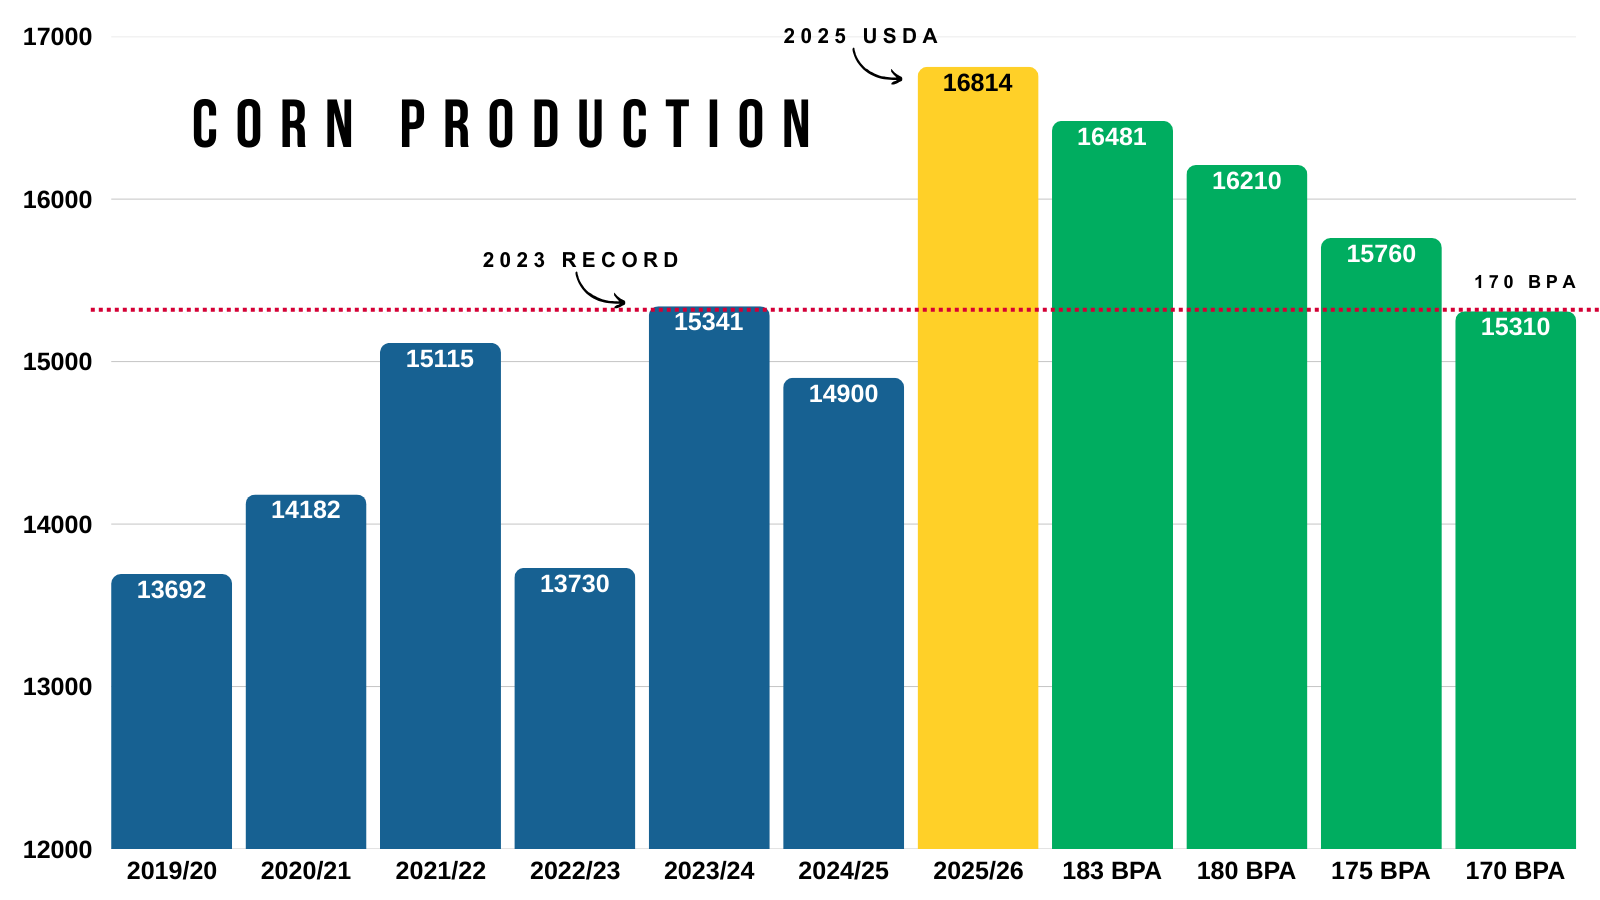
But like I've stated several times, it would take a yield of 170 for the US to not have record production this year.
Which makes it harder to think this market has some wild upside for now.
(I'm talking north of $5.00)
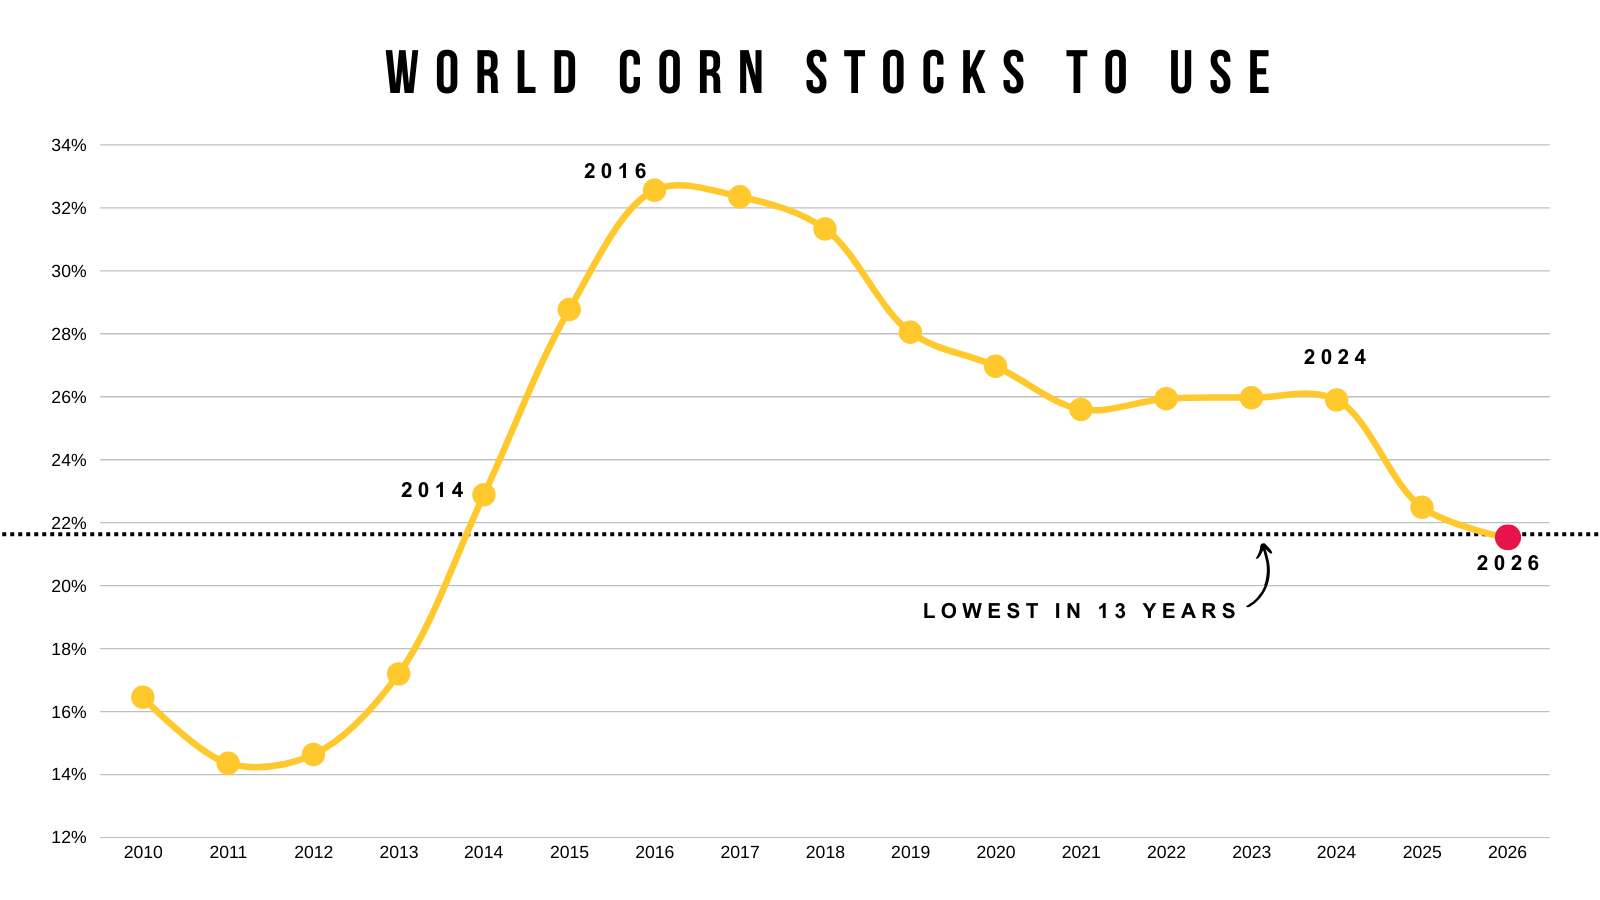
The world situation continues to be interesting.
It's still the tightest in over a decade.
But this doesn’t really matter today, given that the US has a record crop.
But.. let's just say we run into a weather scare next summer.. this chart would amplify that even more.
The world absolutely needs US corn.
Seasonally, we are entering a friendly time frame for corn.
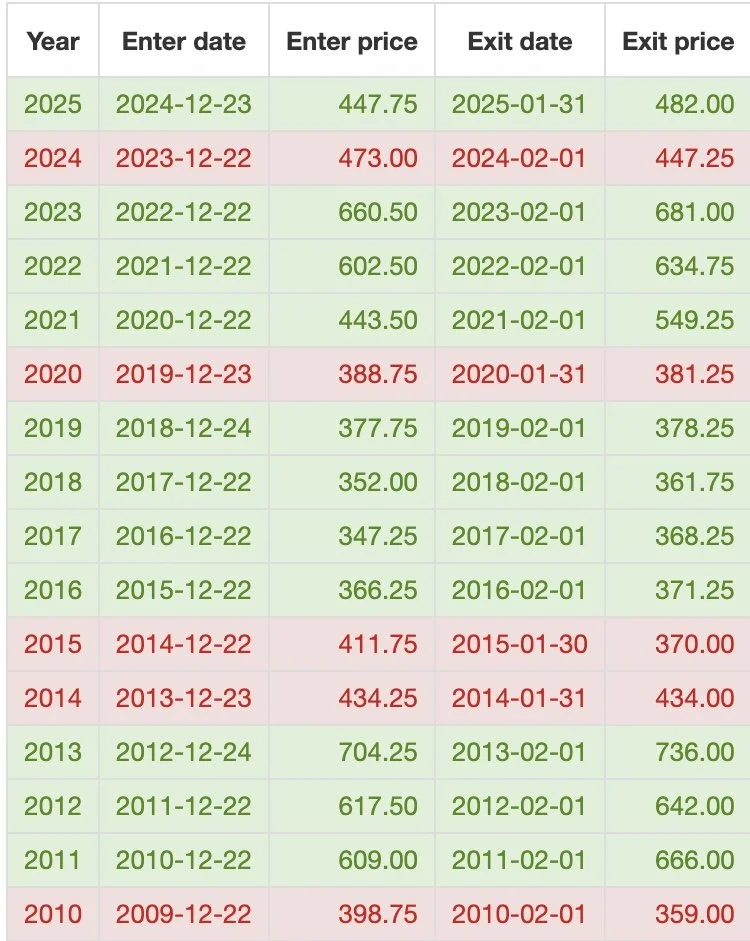
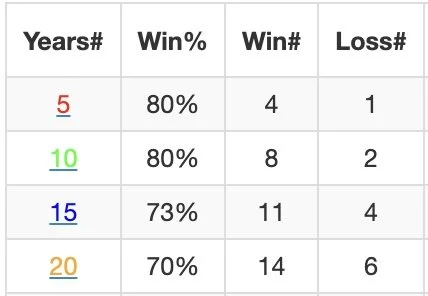
How often does corn trade higher from today until February 1st?
Here is the data:
We've traded higher..
The last 8 of 10 years.
The last 4 of 5 years.
The last 11 of 15 years.
The only two losers of the last decade were 2020 and 2024.
So historically, the corn market tends to trade higher from now until February.
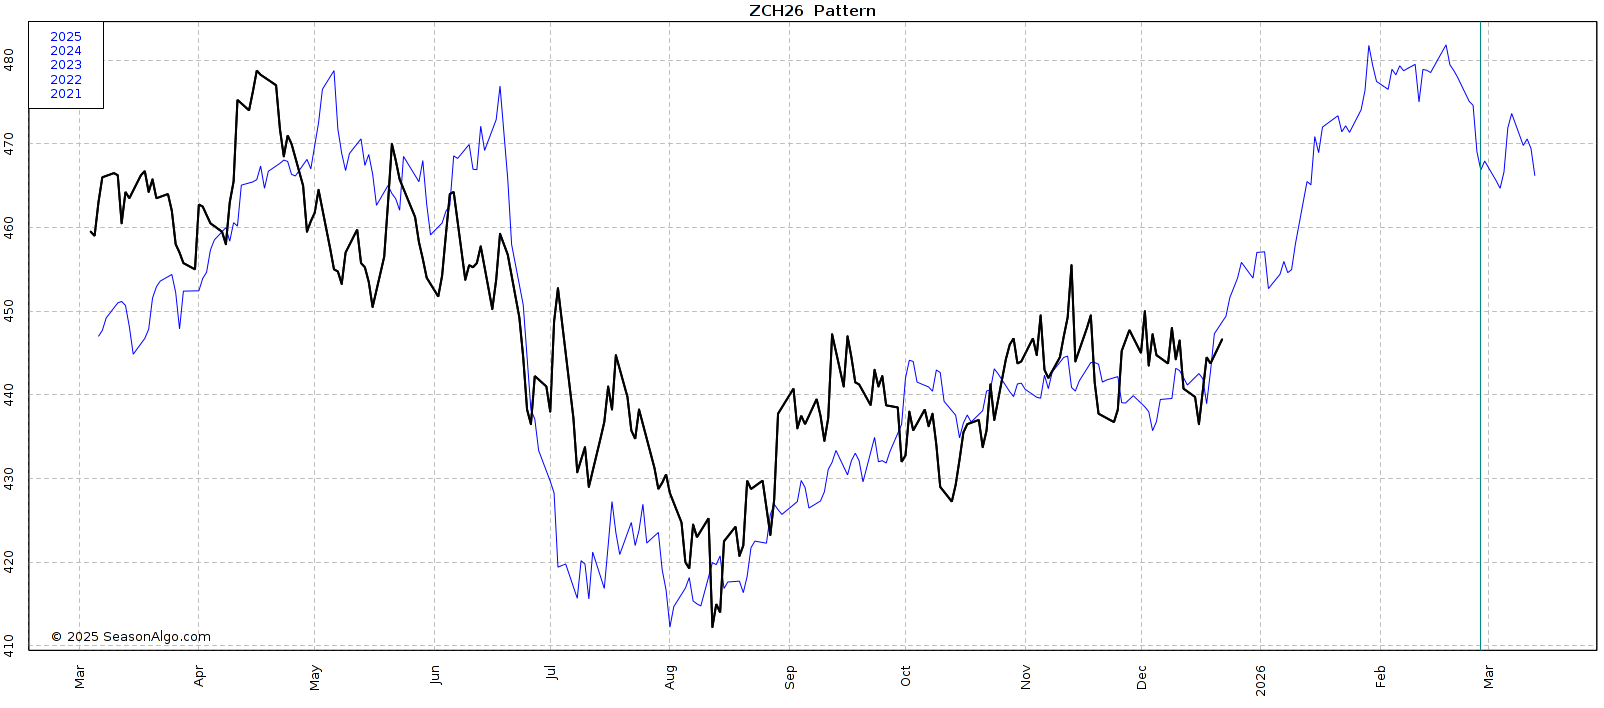
Here is an update on the 5-year seasonal pattern.
So far, we've been following this pretty closely all year long.
This seasonal suggests strength going into early next year. The top on this seasonal comes in right around $4.80
Technicals:
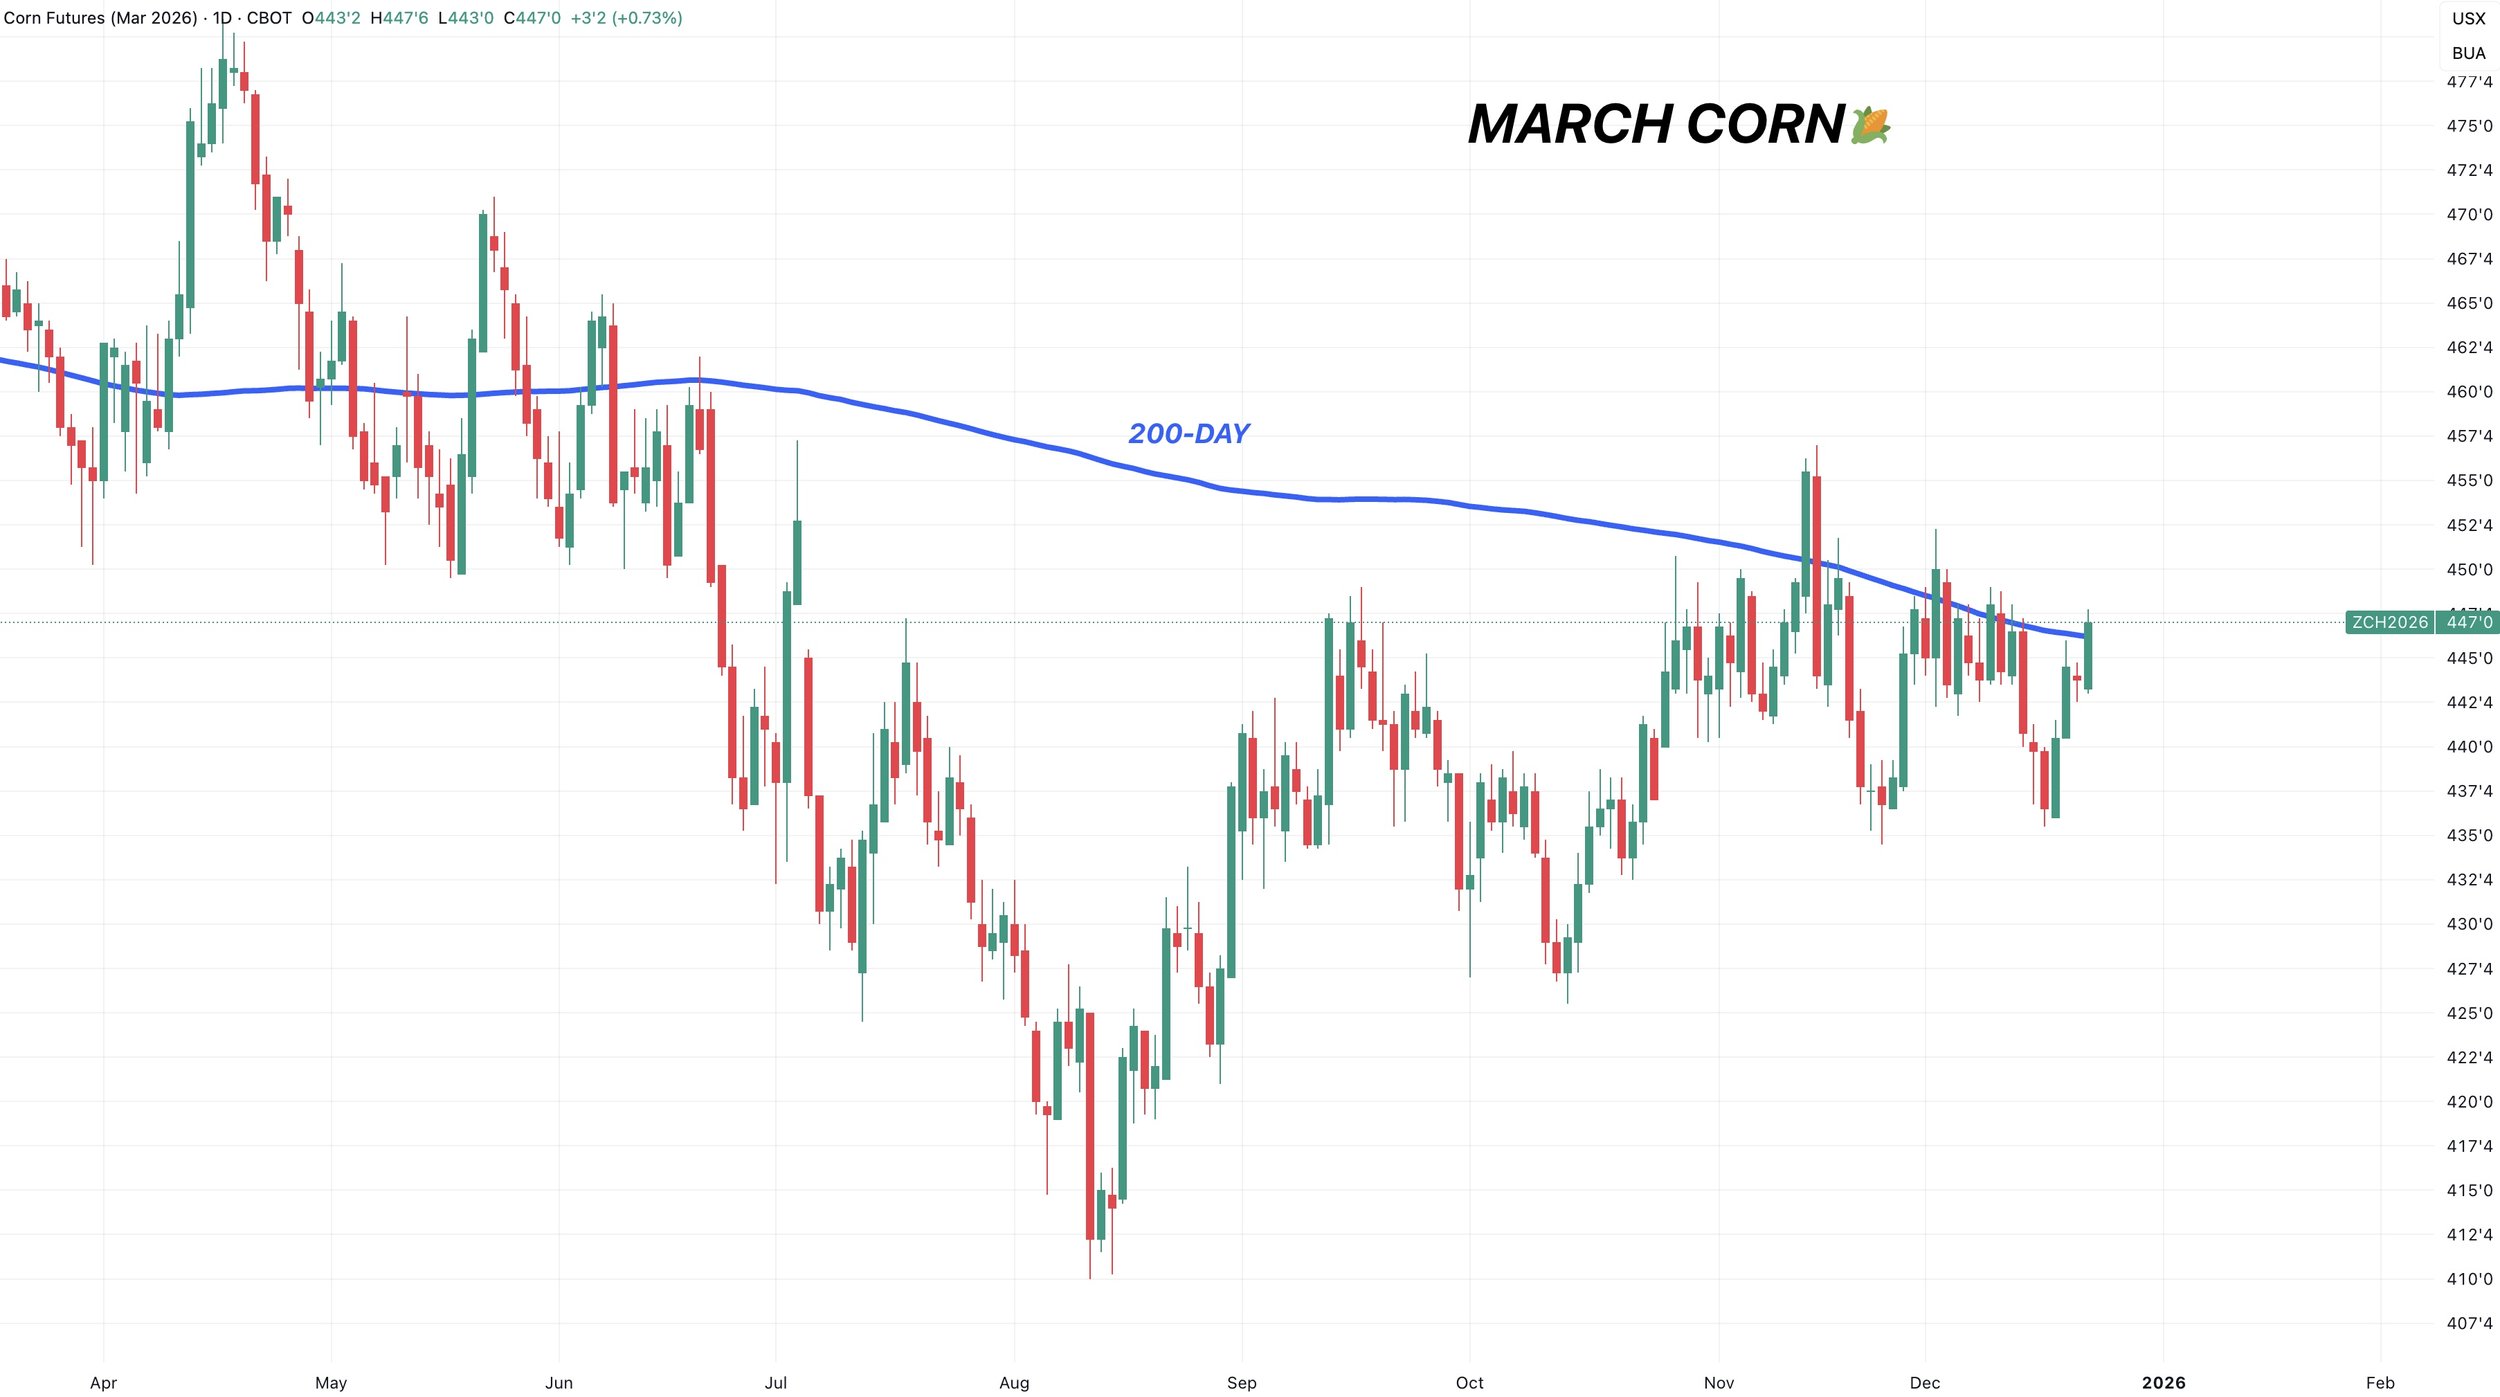
March Corn
The corn chart looks pretty solid.
But ultimately, we are still trapped in a pretty brutual range.
We've closed between $4.40 and $4.50 for the last 33 of 39 days.
The level to break to spark more upside is still clearly $4.50
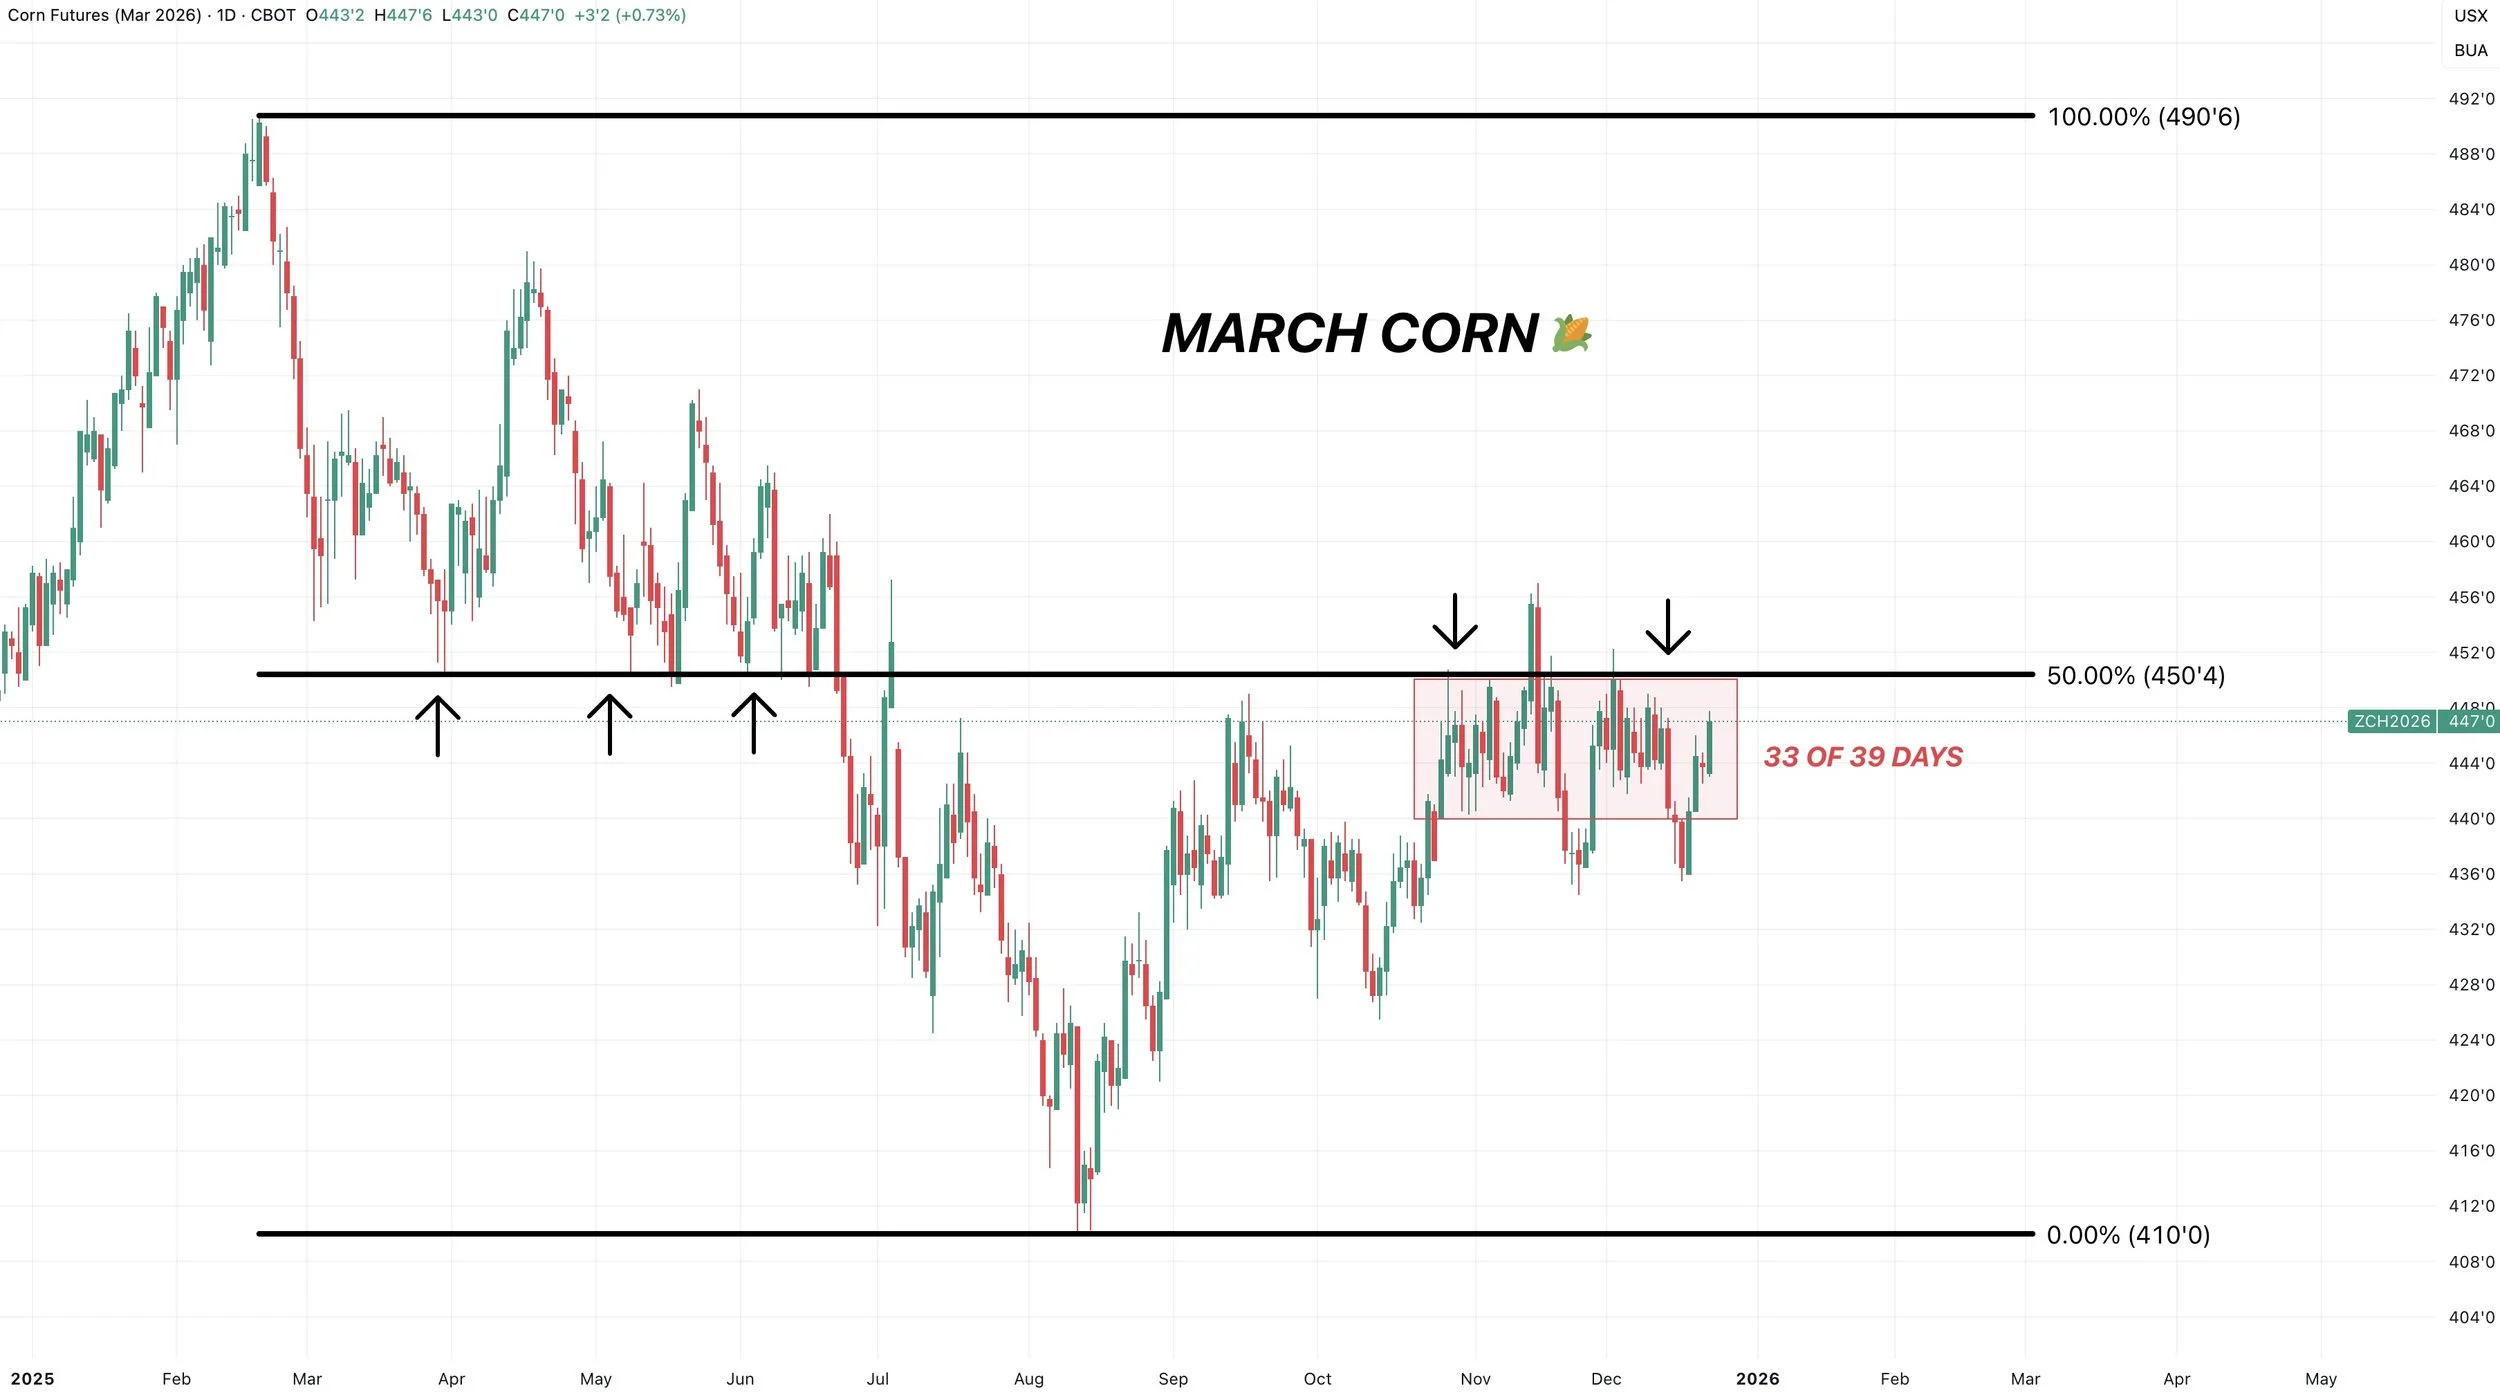
Today we closed above the 200-day MA.
This is now the 4th time we've done this since June.
However, every single time this far we have failed to close above it for back to back days.
As it's acted as big resistance for over a month now.
So if we can get multiple days above it, that should be a good sign and could potentially ignite some algo buying.
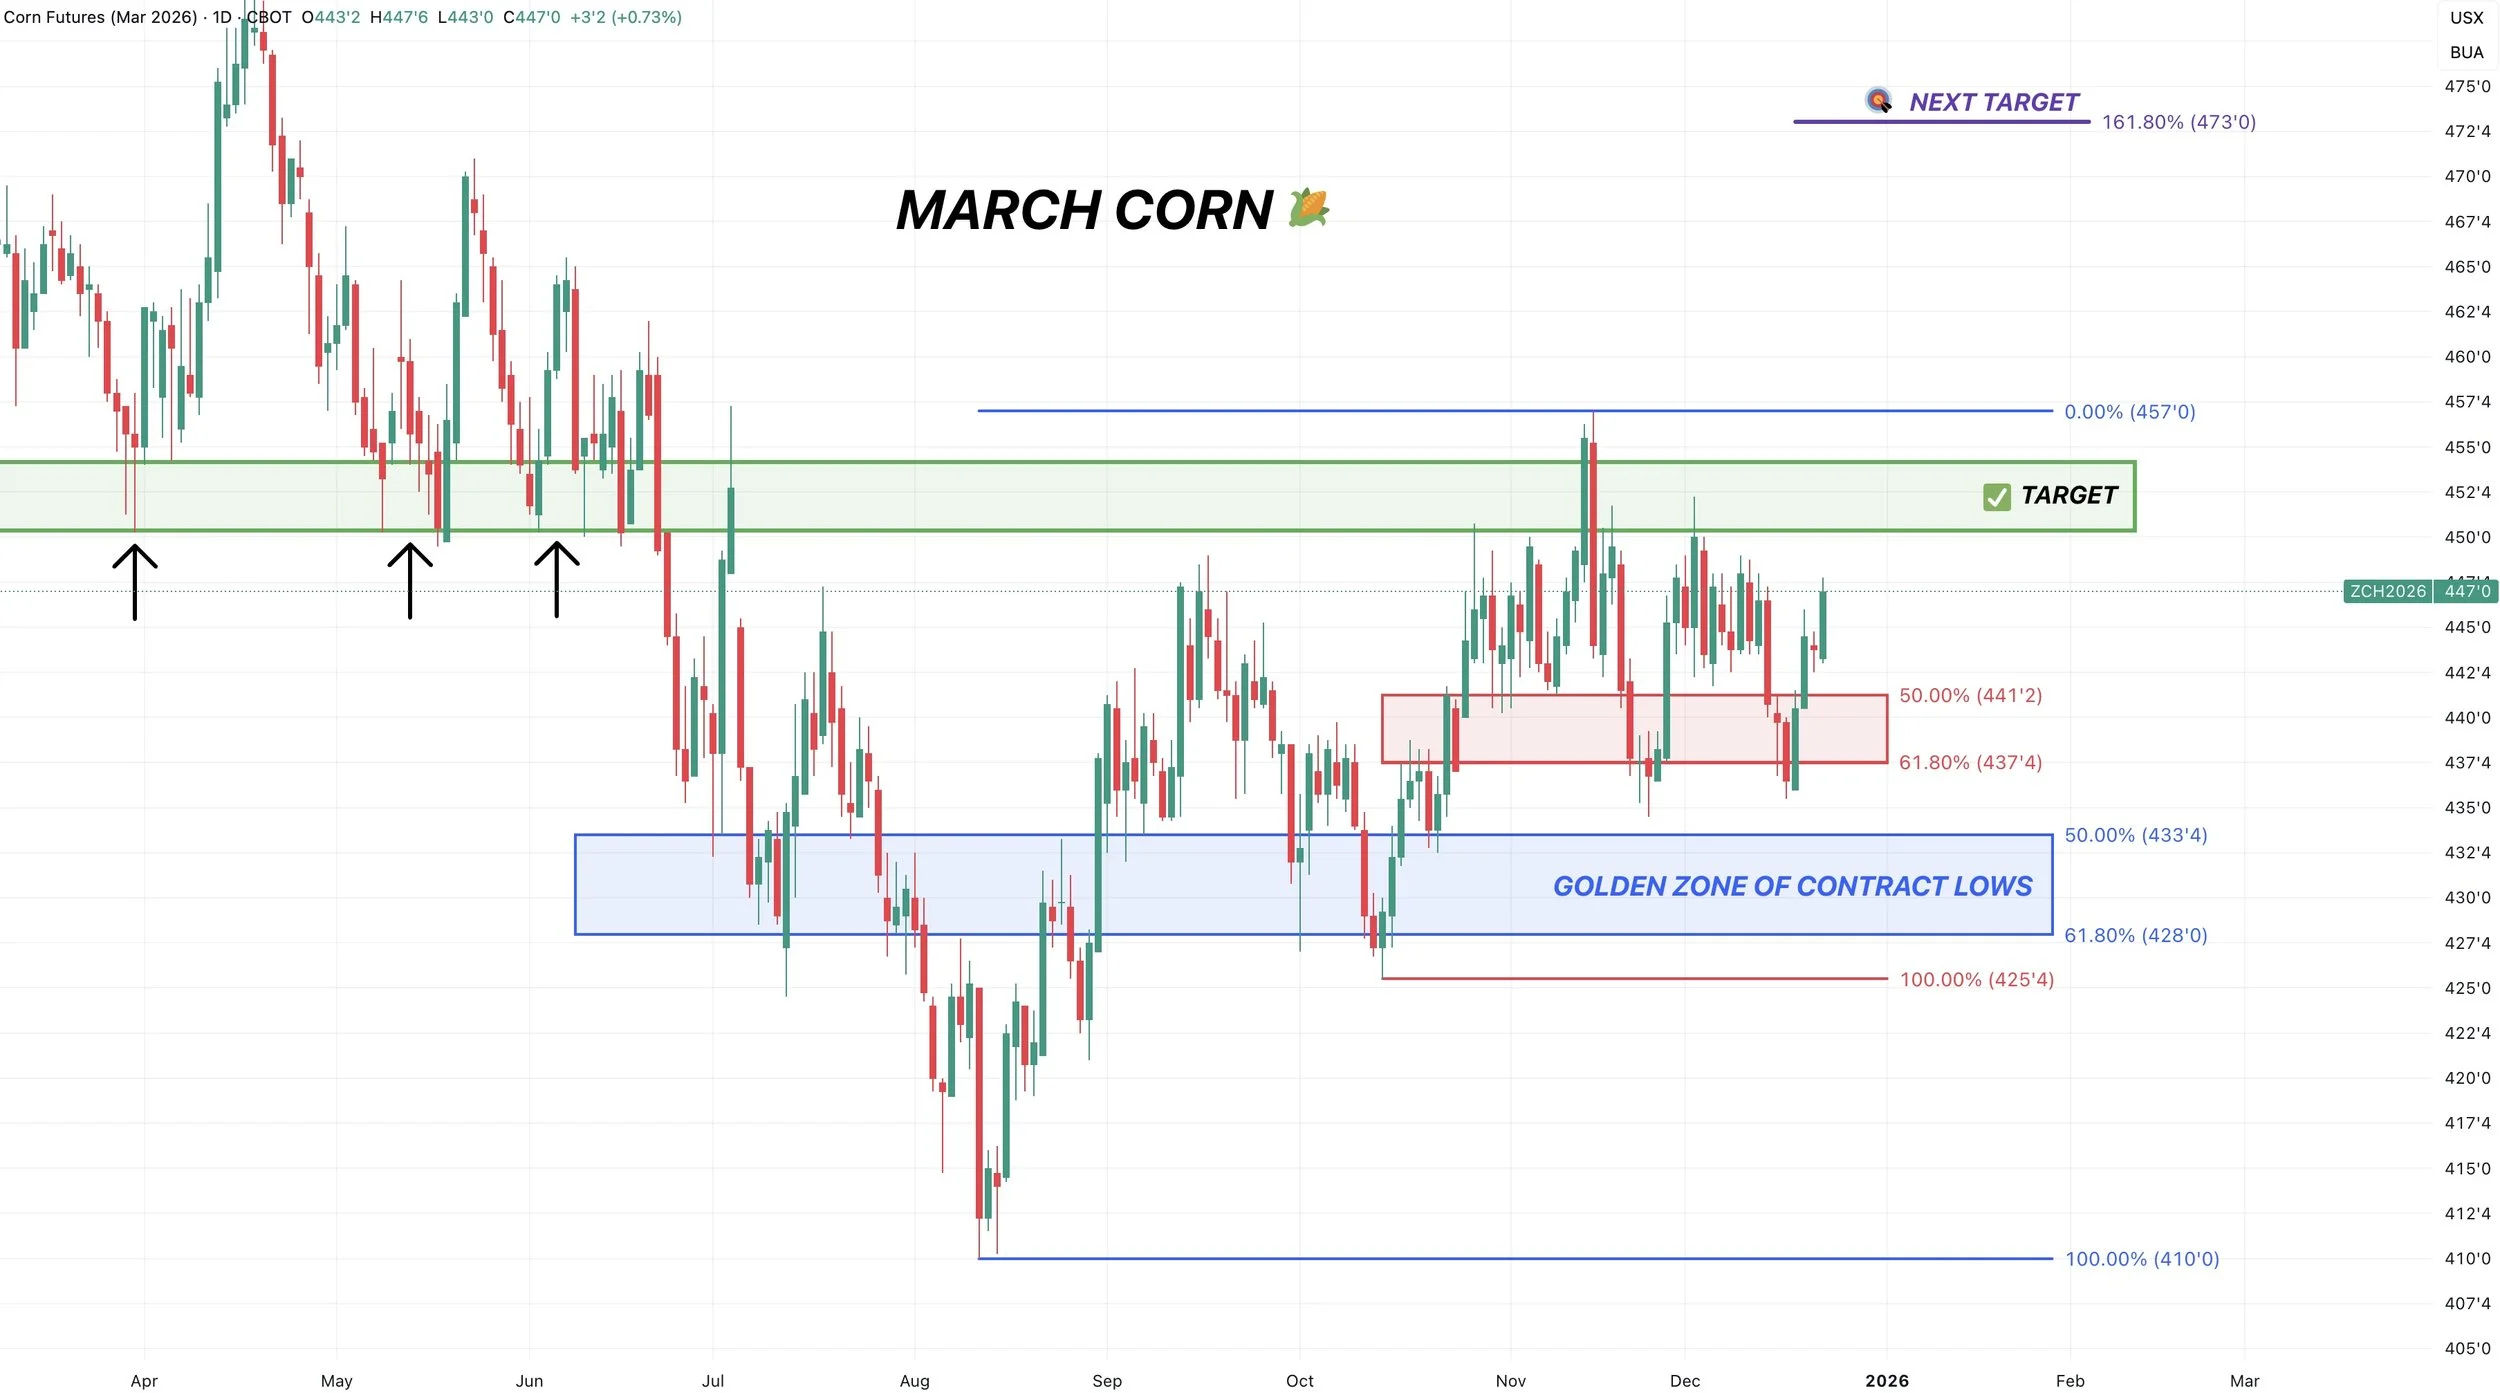
To the downside, we held the golden zone from the October lows, along with our Thanksgiving lows.
If we fail to hold there, the next point of interest would be the blue box. Which is the golden zone down to contract lows.
We don’t have to go that low, and I don’t think we do. But that is where I would look to be re-owning if it came.
I am not going to re-own here a few pennies off the highs.
Our first sell signal since April came when we hit that first $4.50 target.
Since we took risk off the table there, our next target is $4.73 as of right now but is subject to change.
That level equals 161.8% of the size of that first rally we saw off contract lows up to the September highs. A common spot for a 2nd rally to pause.
Soybeans
Fundamentals:
Soybeans finally finding a small amount of life here.
Sitting over $1.00 off those November highs.
Like I mentioned, this market has only traded higher 4 days this entire month and just suffered it's longest daily losing streak since last fall.
We had that big rally on the idea of a China trade agreement.
We still haven’t got that deal in writing.
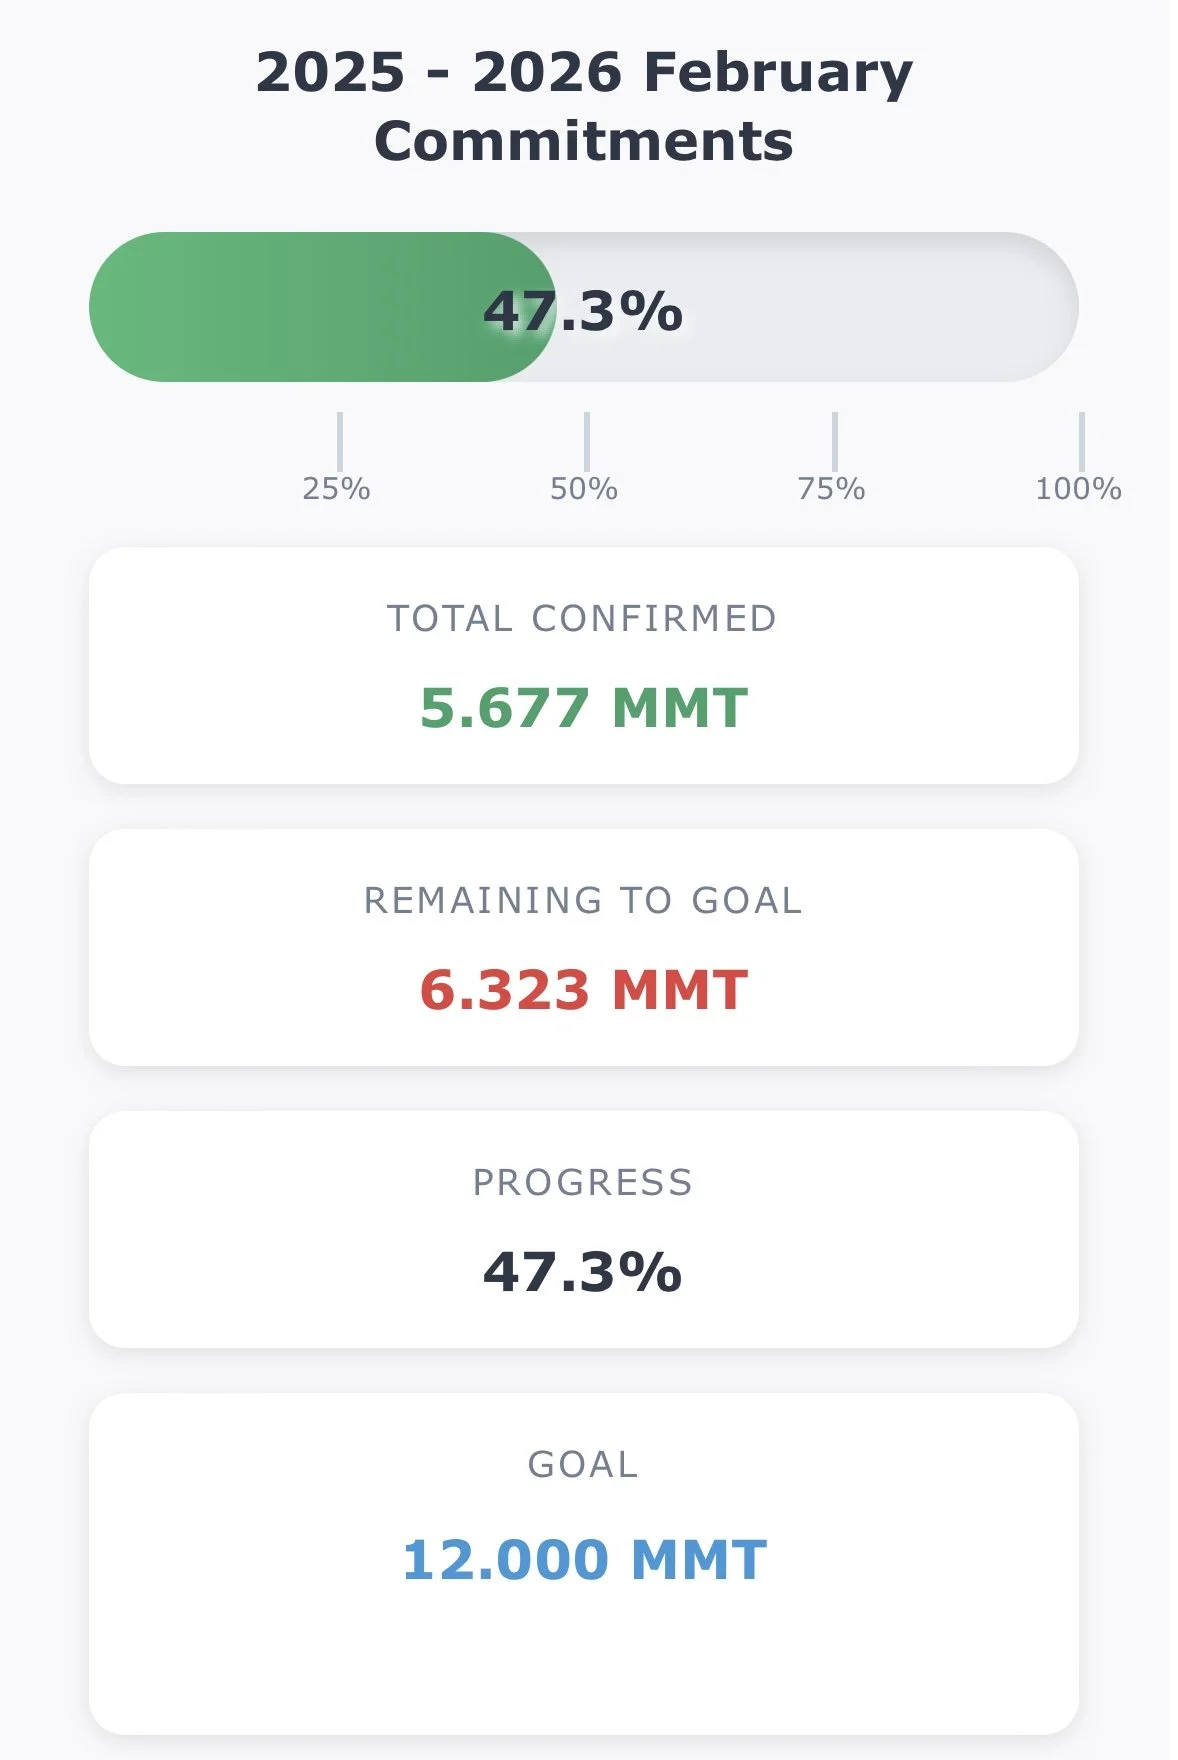
However, China does continue to buy soybeans which is good to see.
They've now offically almost reached 50% of that goal. The actual number is probably higher as I'm sure some of the sales to unknown are China and there could still be some hidden in the backlog of export sales data. But this is the official known number.
So it does seem pretty reasonable to think they'll meet the goal over the course of the next two months.
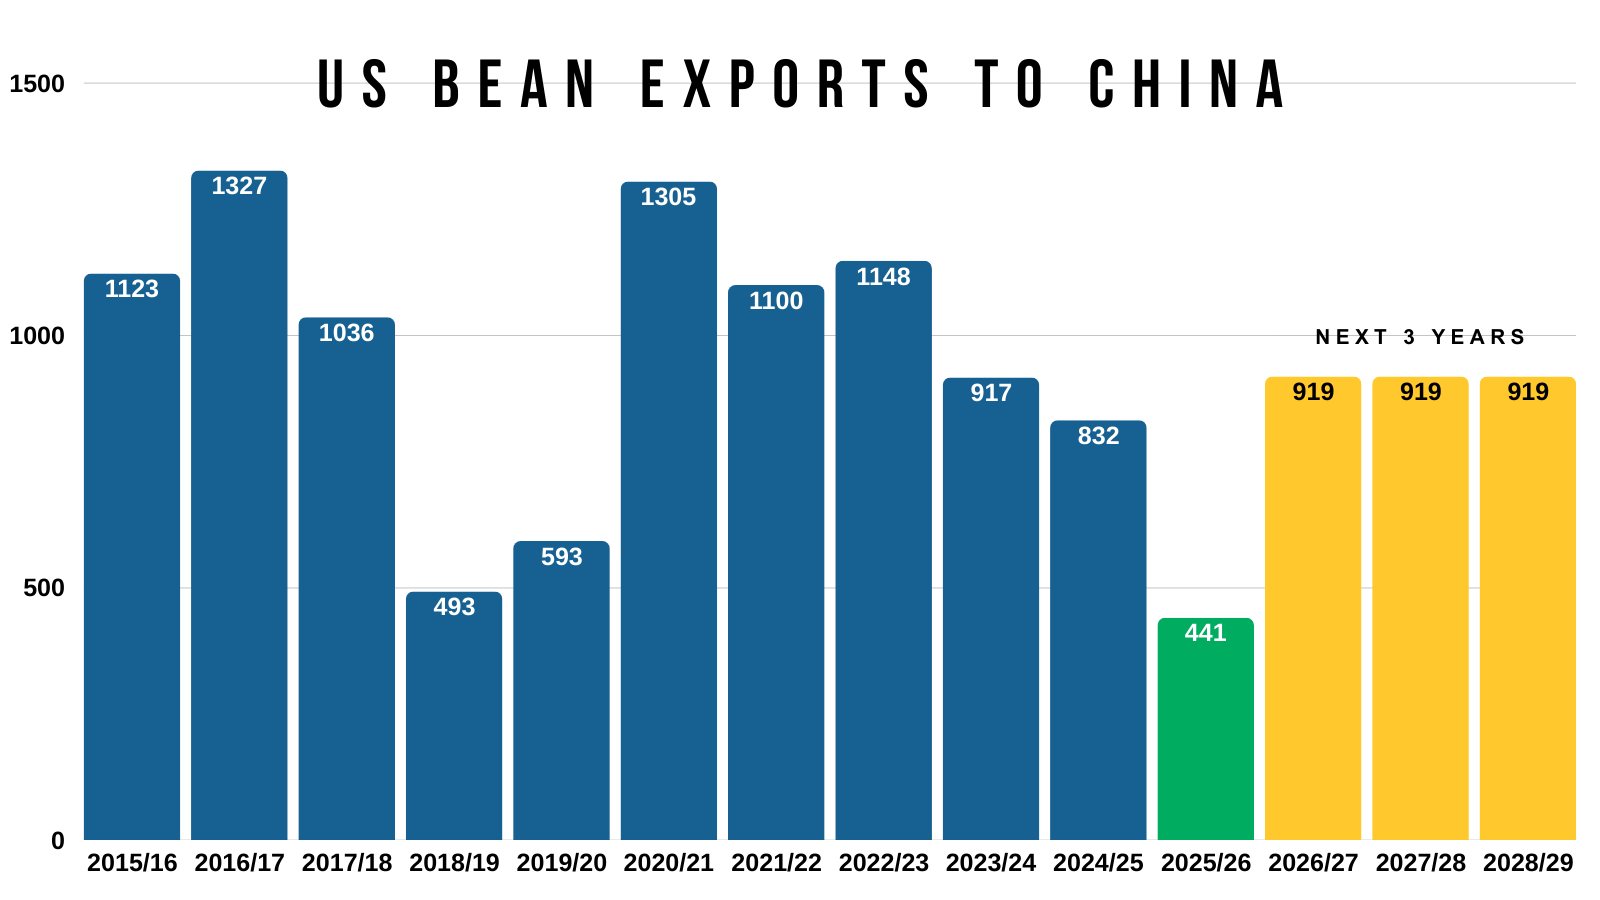
Chart from GrainStats
The issue is that the market realized, soybeans might still fall short of the USDA's export projections even if China meets that 12 MMT goal.
So unless China buys more than the 12 million they agreed to, the USDA might to have to start cutting into the export numbers.
I'd say the other big issue has simply been Brazil.
They've seen virtually zero weather threats.
Brazil soybeans are still sitting at a discount to ours, so there really isn’t a ton of motivation for China to buy more than they agreed to unless Trump interferes.
That 12 million is less than they usually buy to begin with.
So we might have to either see China buy more than this, or other countries step up, to prevent the USDA from walking exports back.
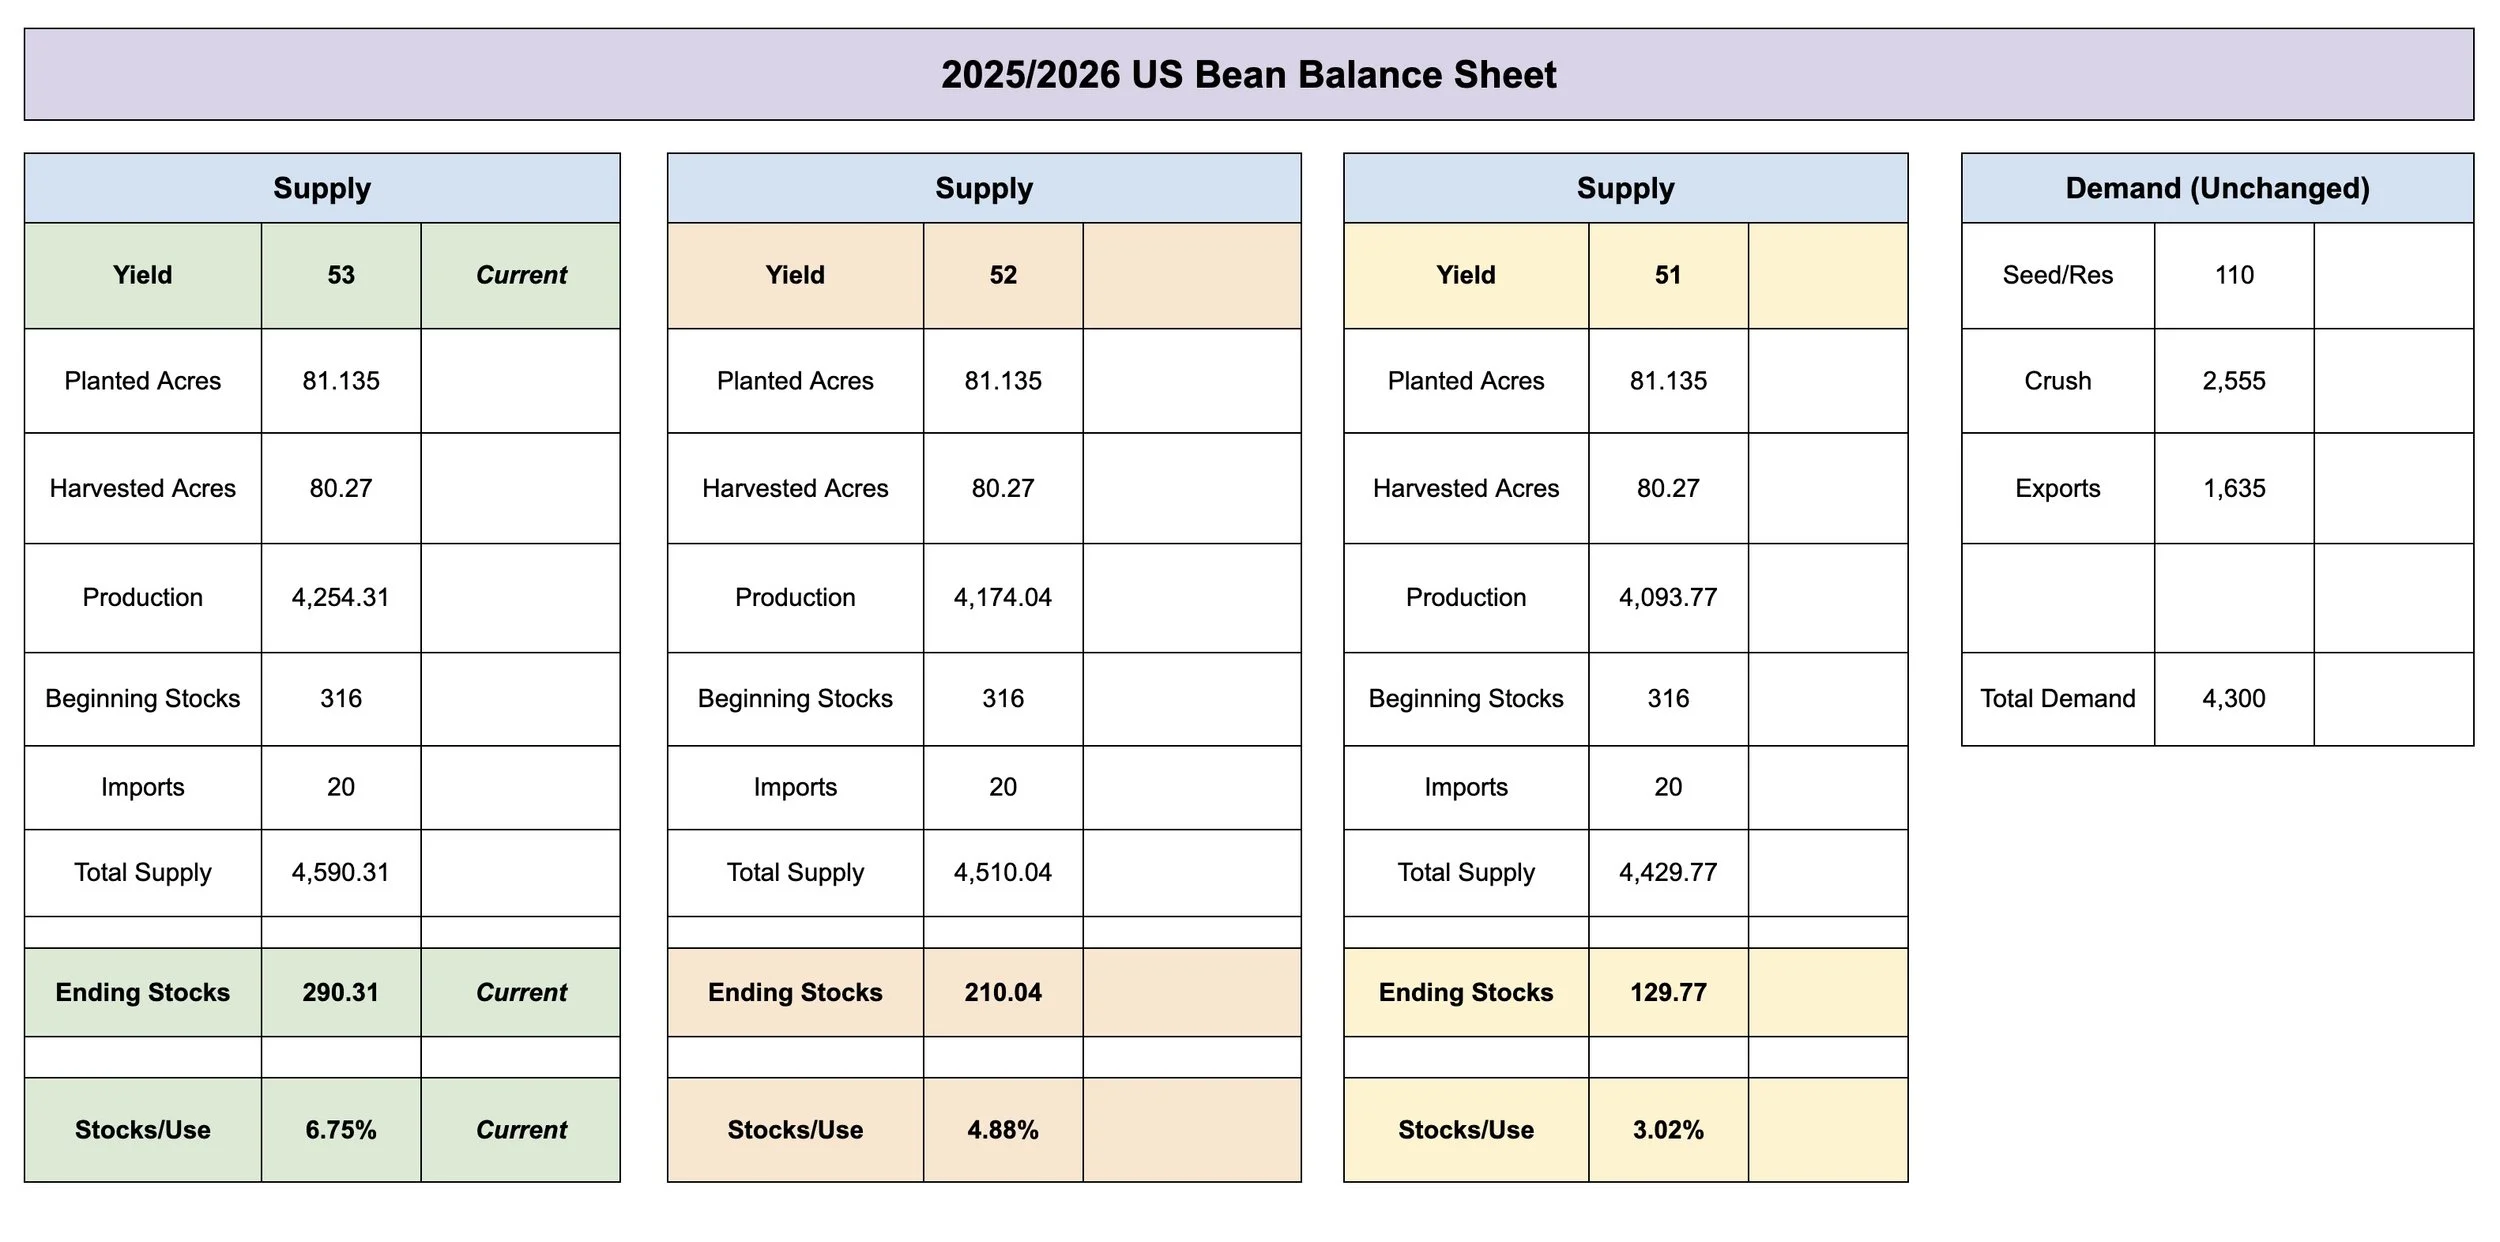
The US balance sheet is still relatively tight.
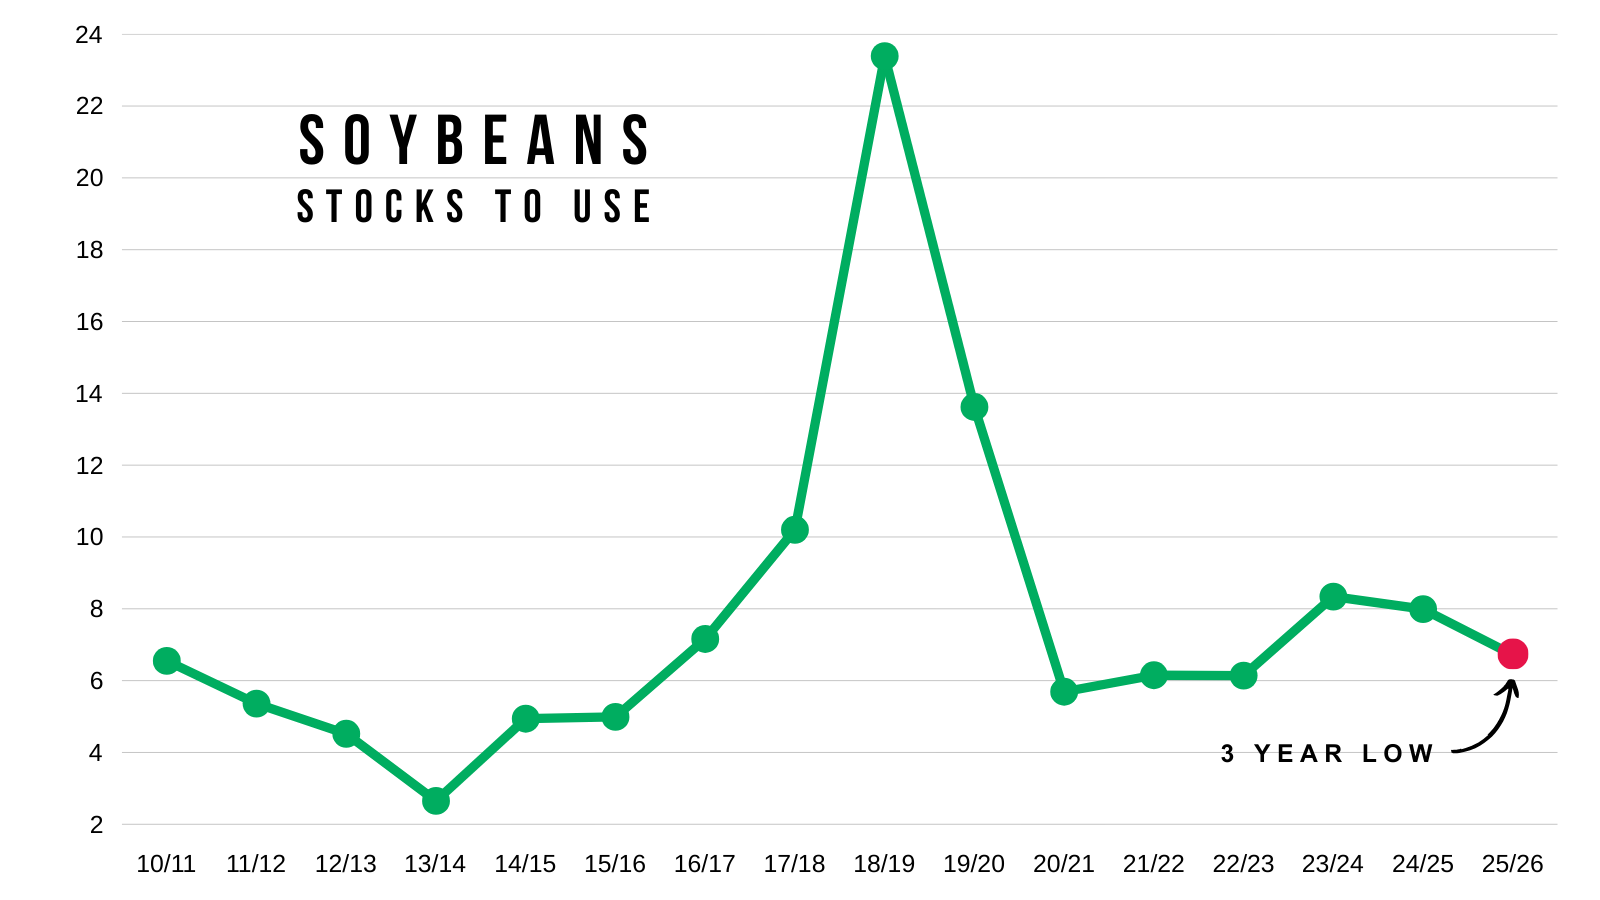
A 290 million carryout is the lowest in 3 years.
So if exports are fine, there is simply zero room for error due on the balance sheet to the smaller acres.
However.. exports are a big "if".
There is a "path" to a really tight US situation. But there are still plenty of question marks surrounding the demand side of the equation.
I've shown this countless times, but here is the current balance sheet vs how it changes as yield gets lowered. WITHOUT changing demand.
If yield falls, the USDA will offset it with some demand losses. The question is by how much?
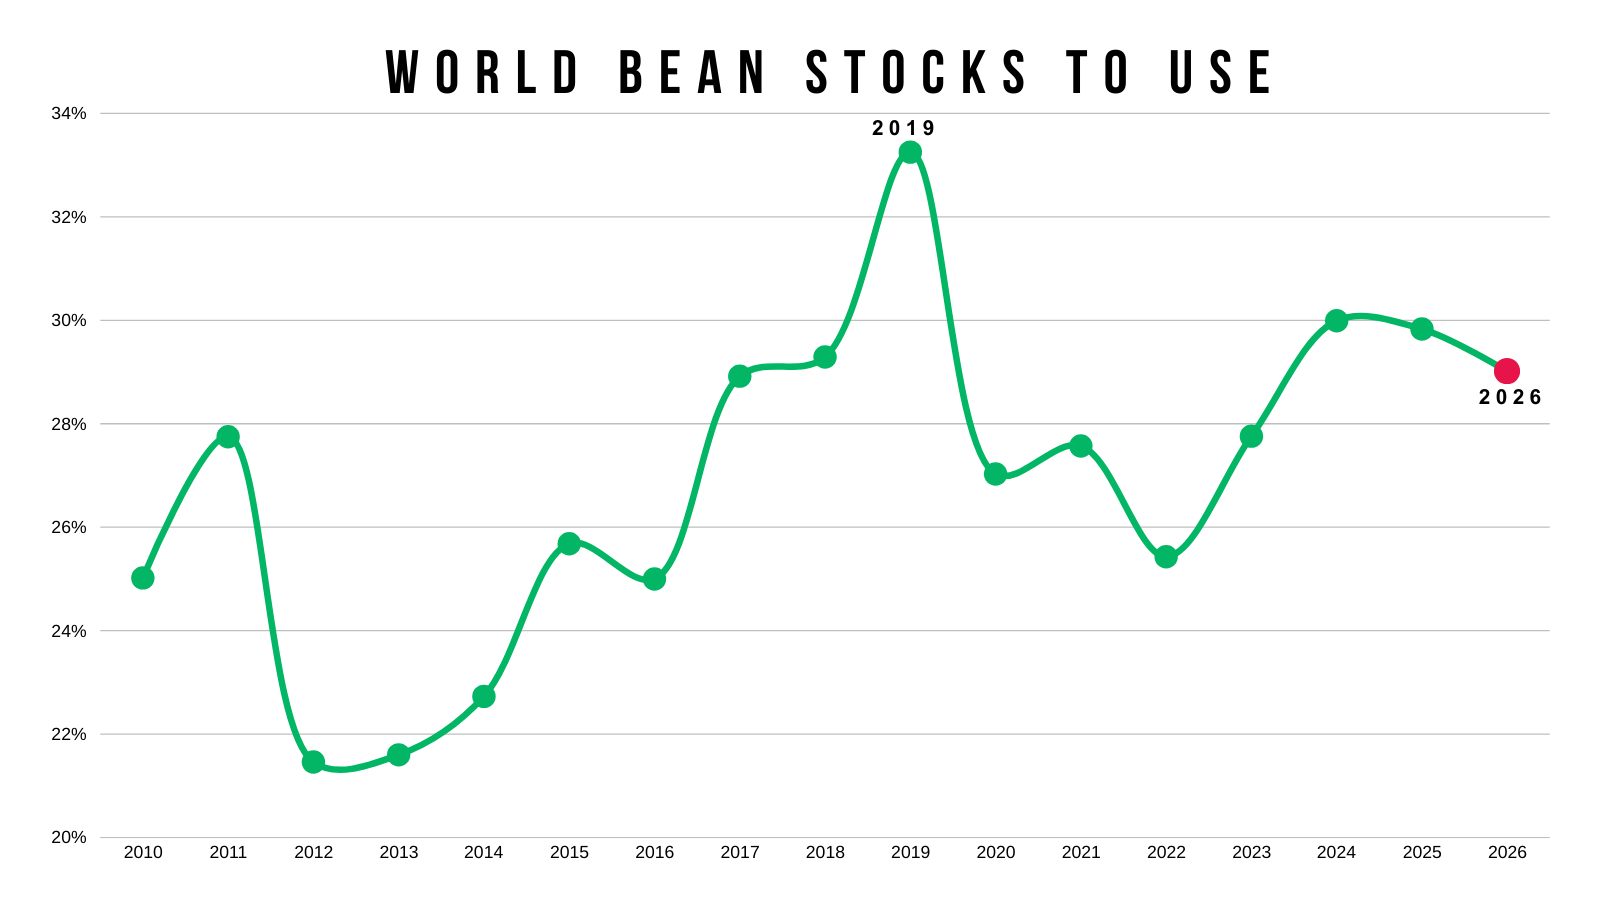
Even with the potentially tight US story, the world situation is still on the negative side like we've talked about plenty of times.
For soybeans to go incredibly higher and go post new highs, it would take either a big shock in the Jan USDA, a supply scare out of Brazil, or China buying more soybeans than is currently priced into the market.
It's possible, but none of these seem extremely likely right now.
So we will be looking to reward a relief bounce if it comes.
The funds were just record long soybeans when the government was shutdown.
No one actually even knew this at the time, because all the private estimates were completely wrong.
But it'll take some big changes for them to jump on board like that again, and spark that intial China trade deal interest they had.
Technicals:
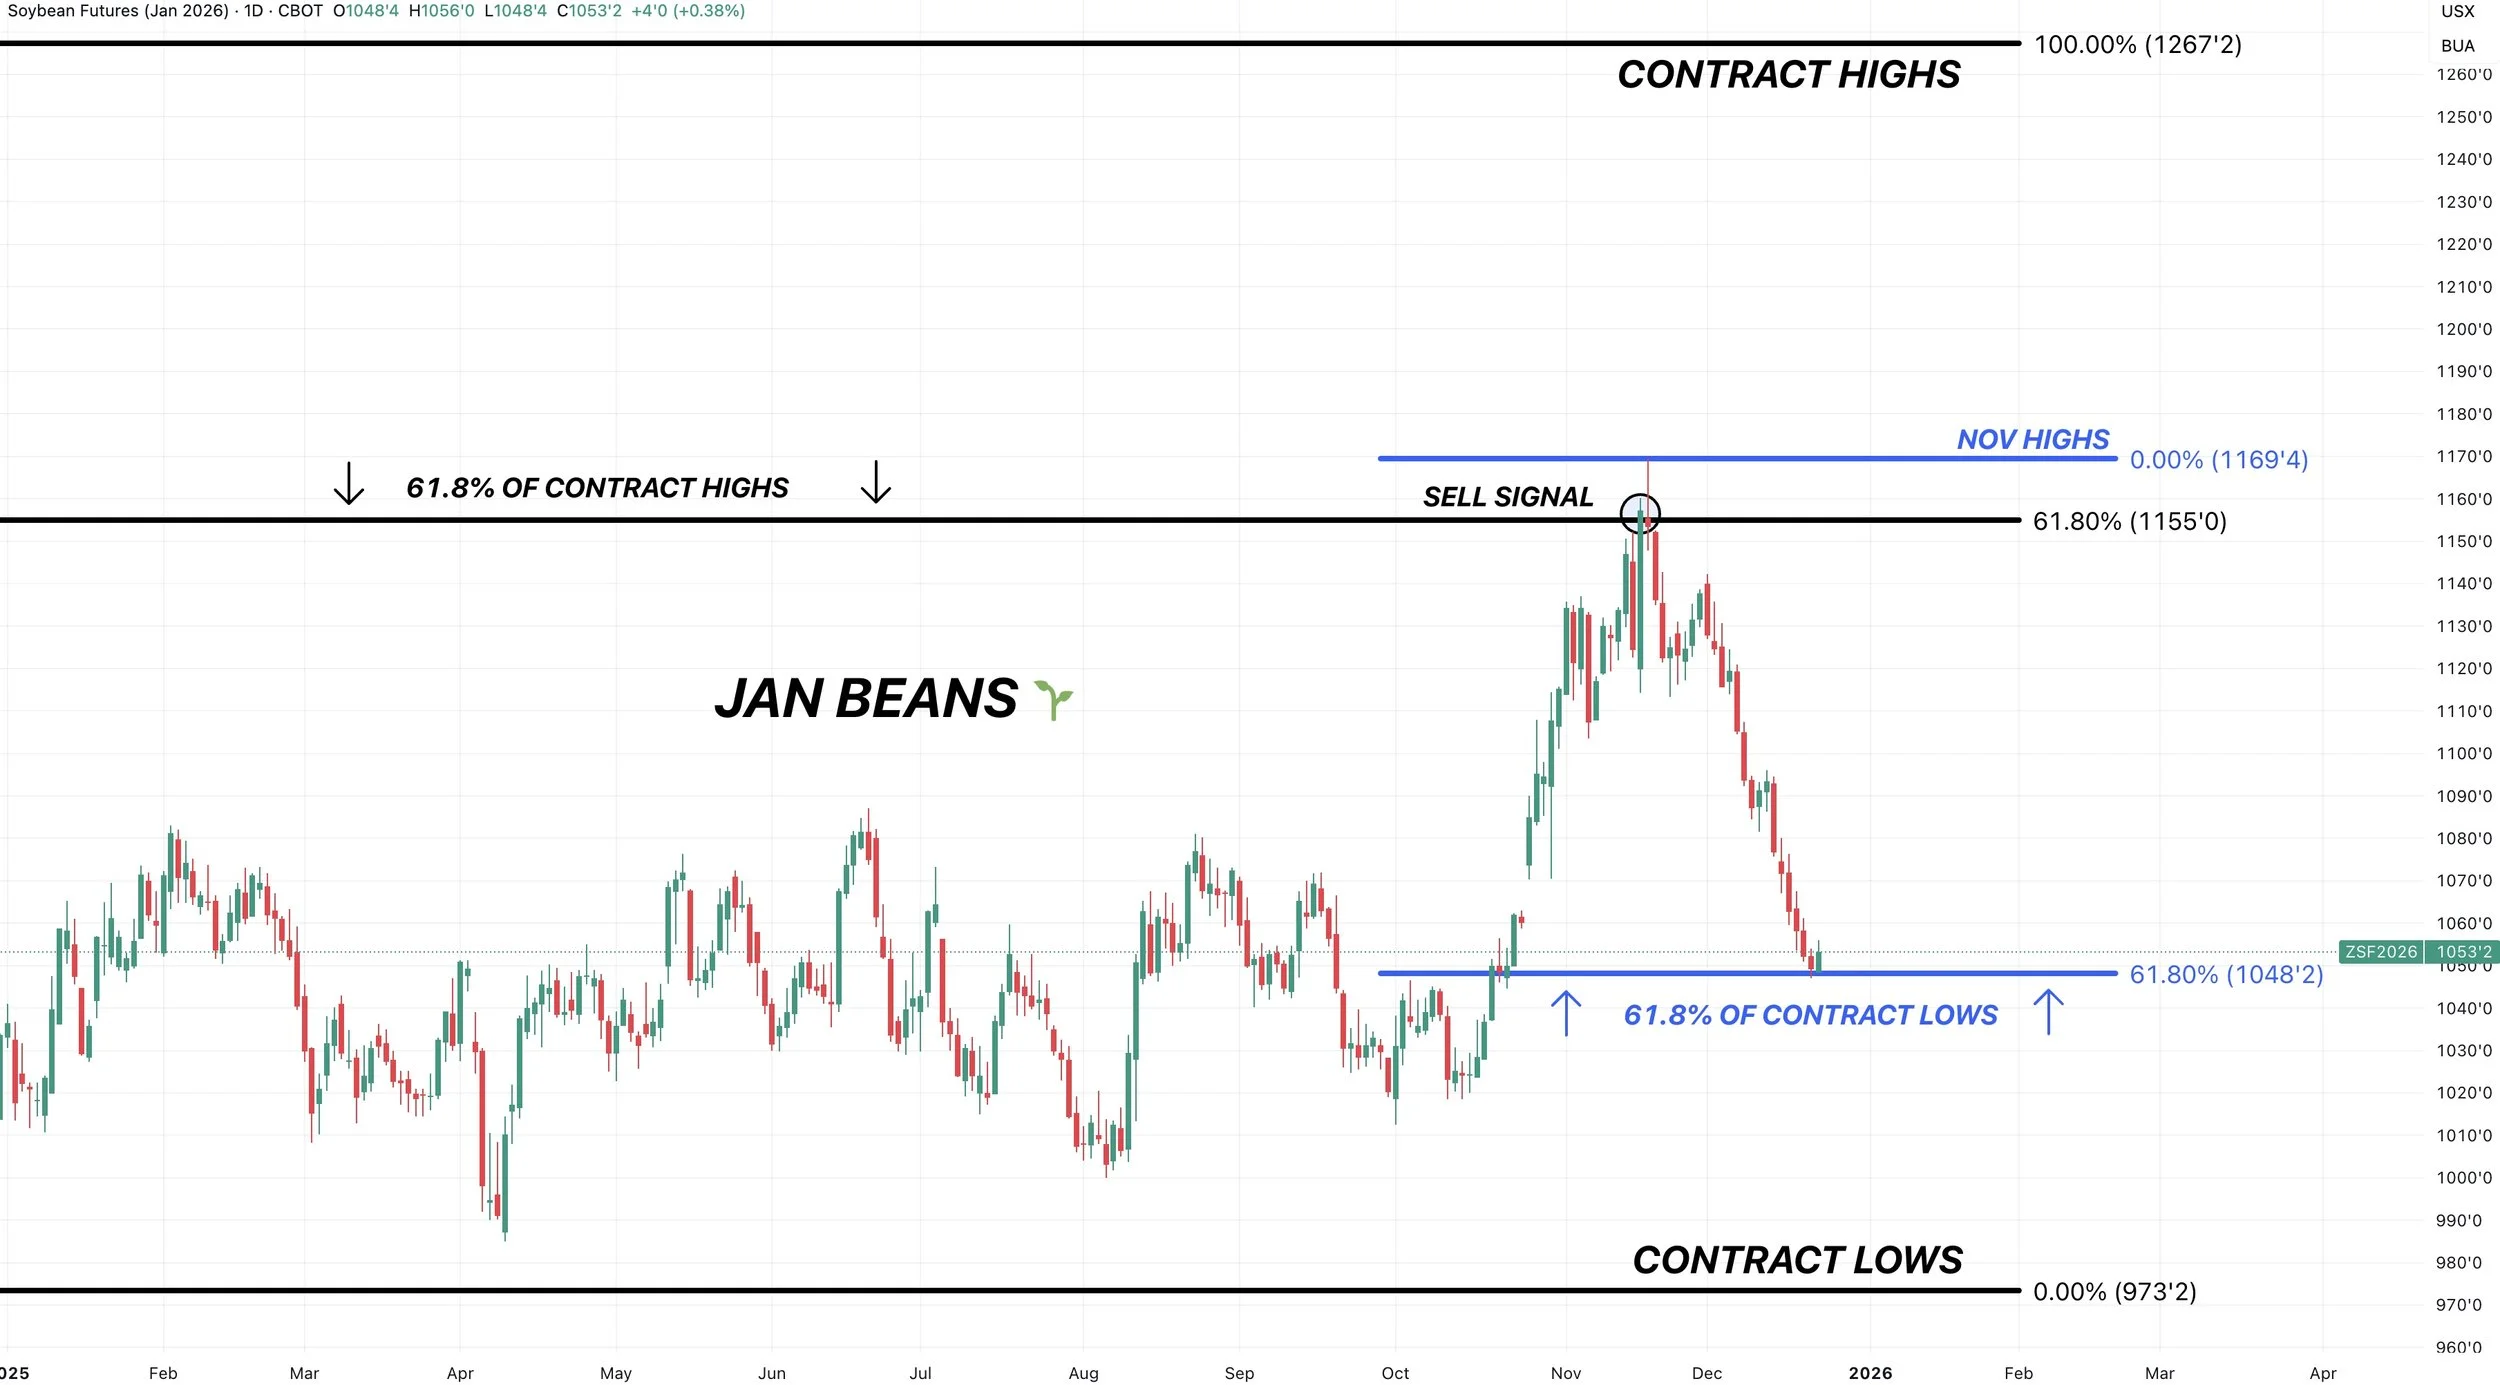
Jan Beans
The biggest bull argument in soybeans isn’t any fresh fundamental changes.
It's simply that the market might’ve overdone it to the downside here.
We did alert a buy zone alert late last week as we were approaching our downside targets.
If you missed it: Click Here to View
Basically the alert was to take some profits if you followed our $11.55 sell signal, and if you wanted to look to re-own, this is an area we like considering doing so.
This market is oversold, and I think we should be due for a relief bounce.
Why is this the area to expect a bounce?
I will be switching over to March beans, but the Jan bean technicals were the reason for our sell signal back in November and our recent buy signal.
This entire rally failed after we clawed back 61.8% of the contract highs.
We've now sold off and given back 61.8% of the contract lows.
Which was at $10.48 and our downside target.
That is called the golden fib for a reason.
It's the most common level for a market to revert back to before making a decision.
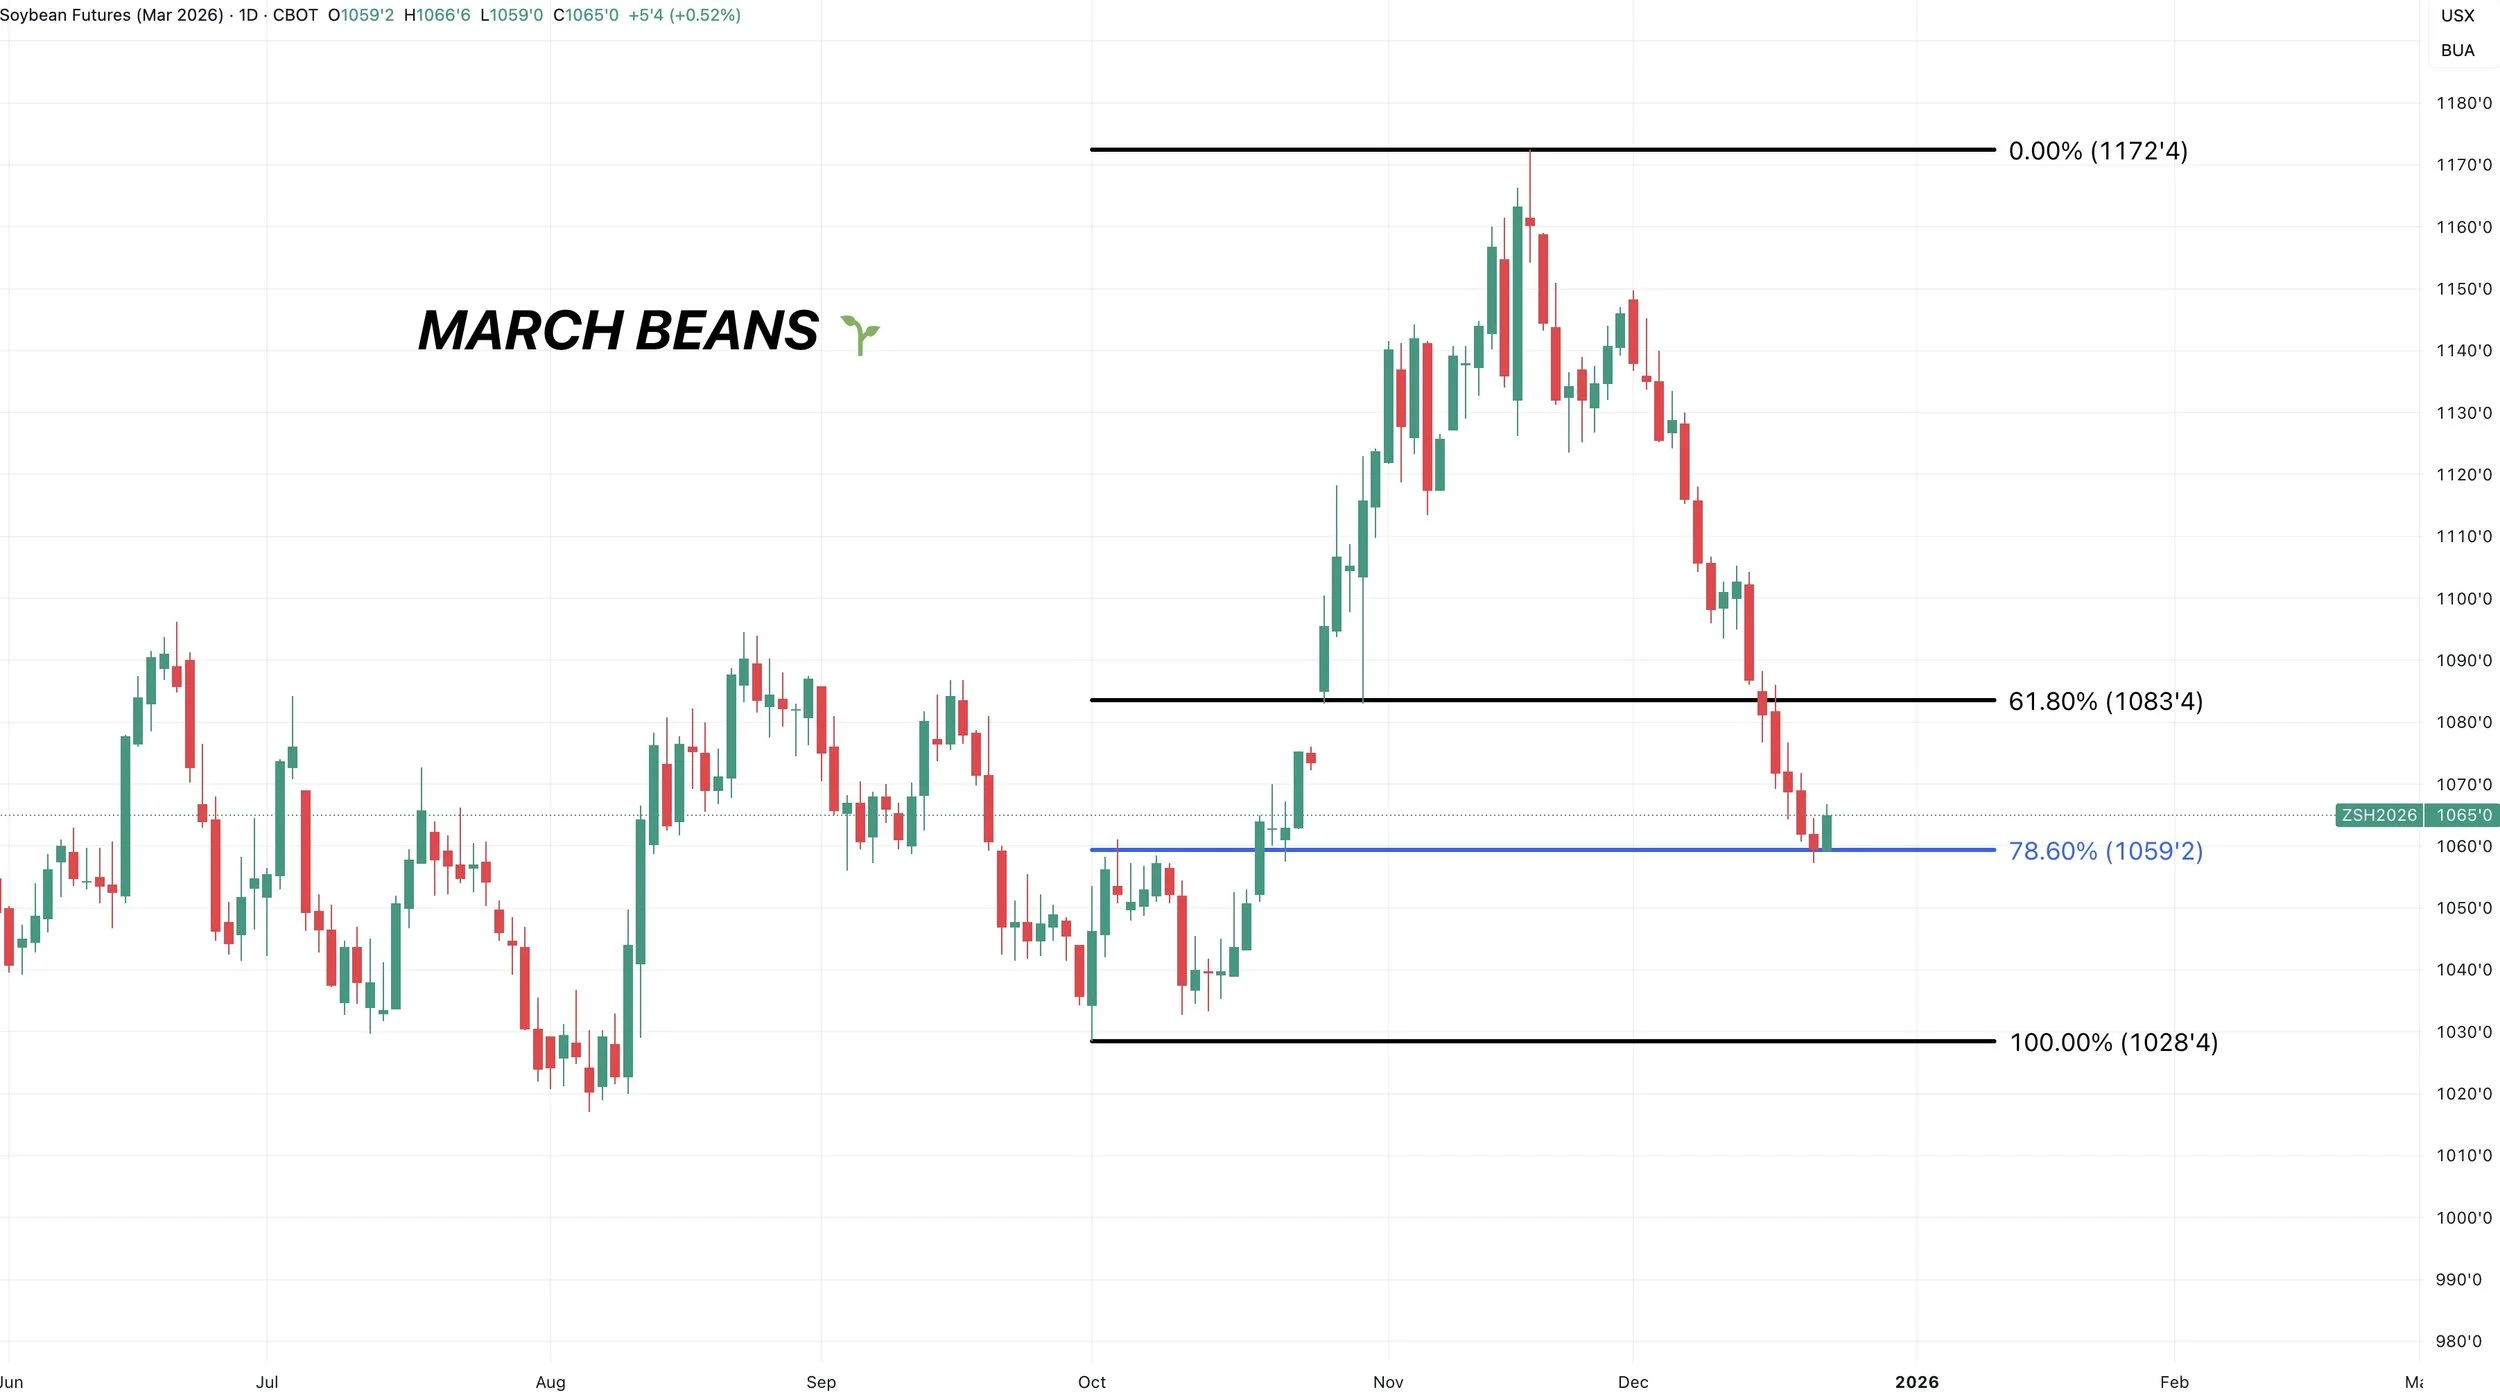
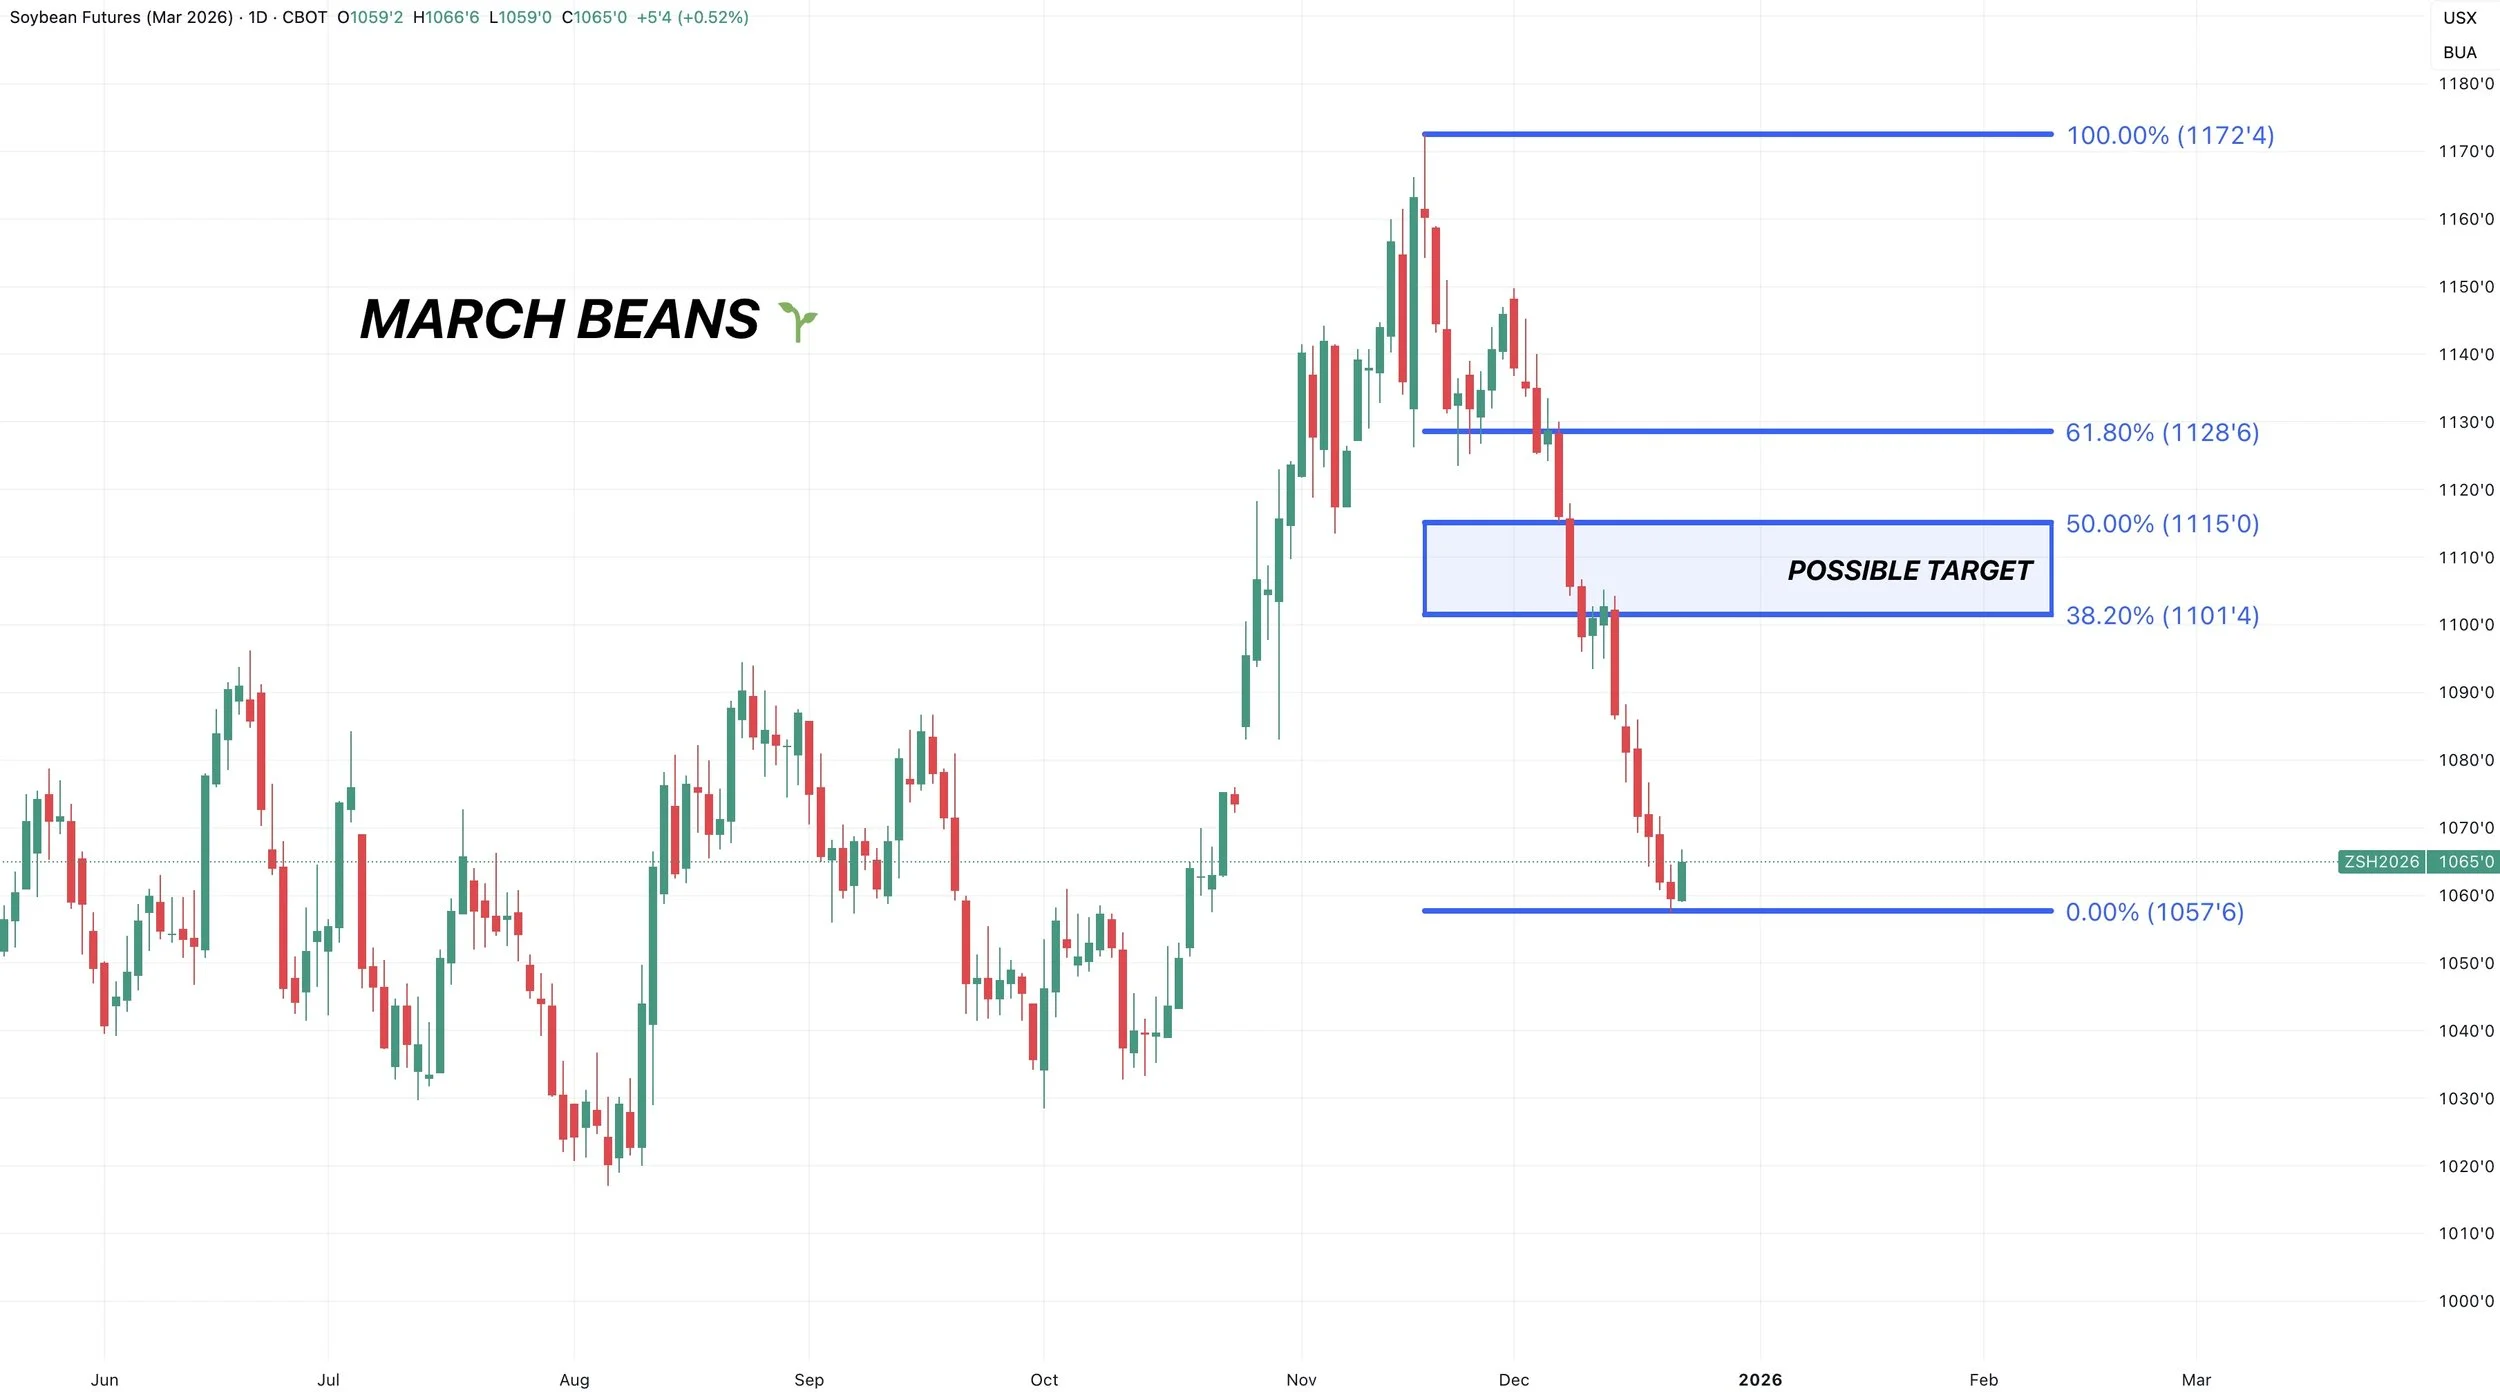
March Beans
Now for March soybeans.
We failed to hold the 61.8% level of the entire China fueled rally.
The next level is the 78.6% level at $10.59
Which we have perfectly bounced off of so far. Need to continue to see that hold.
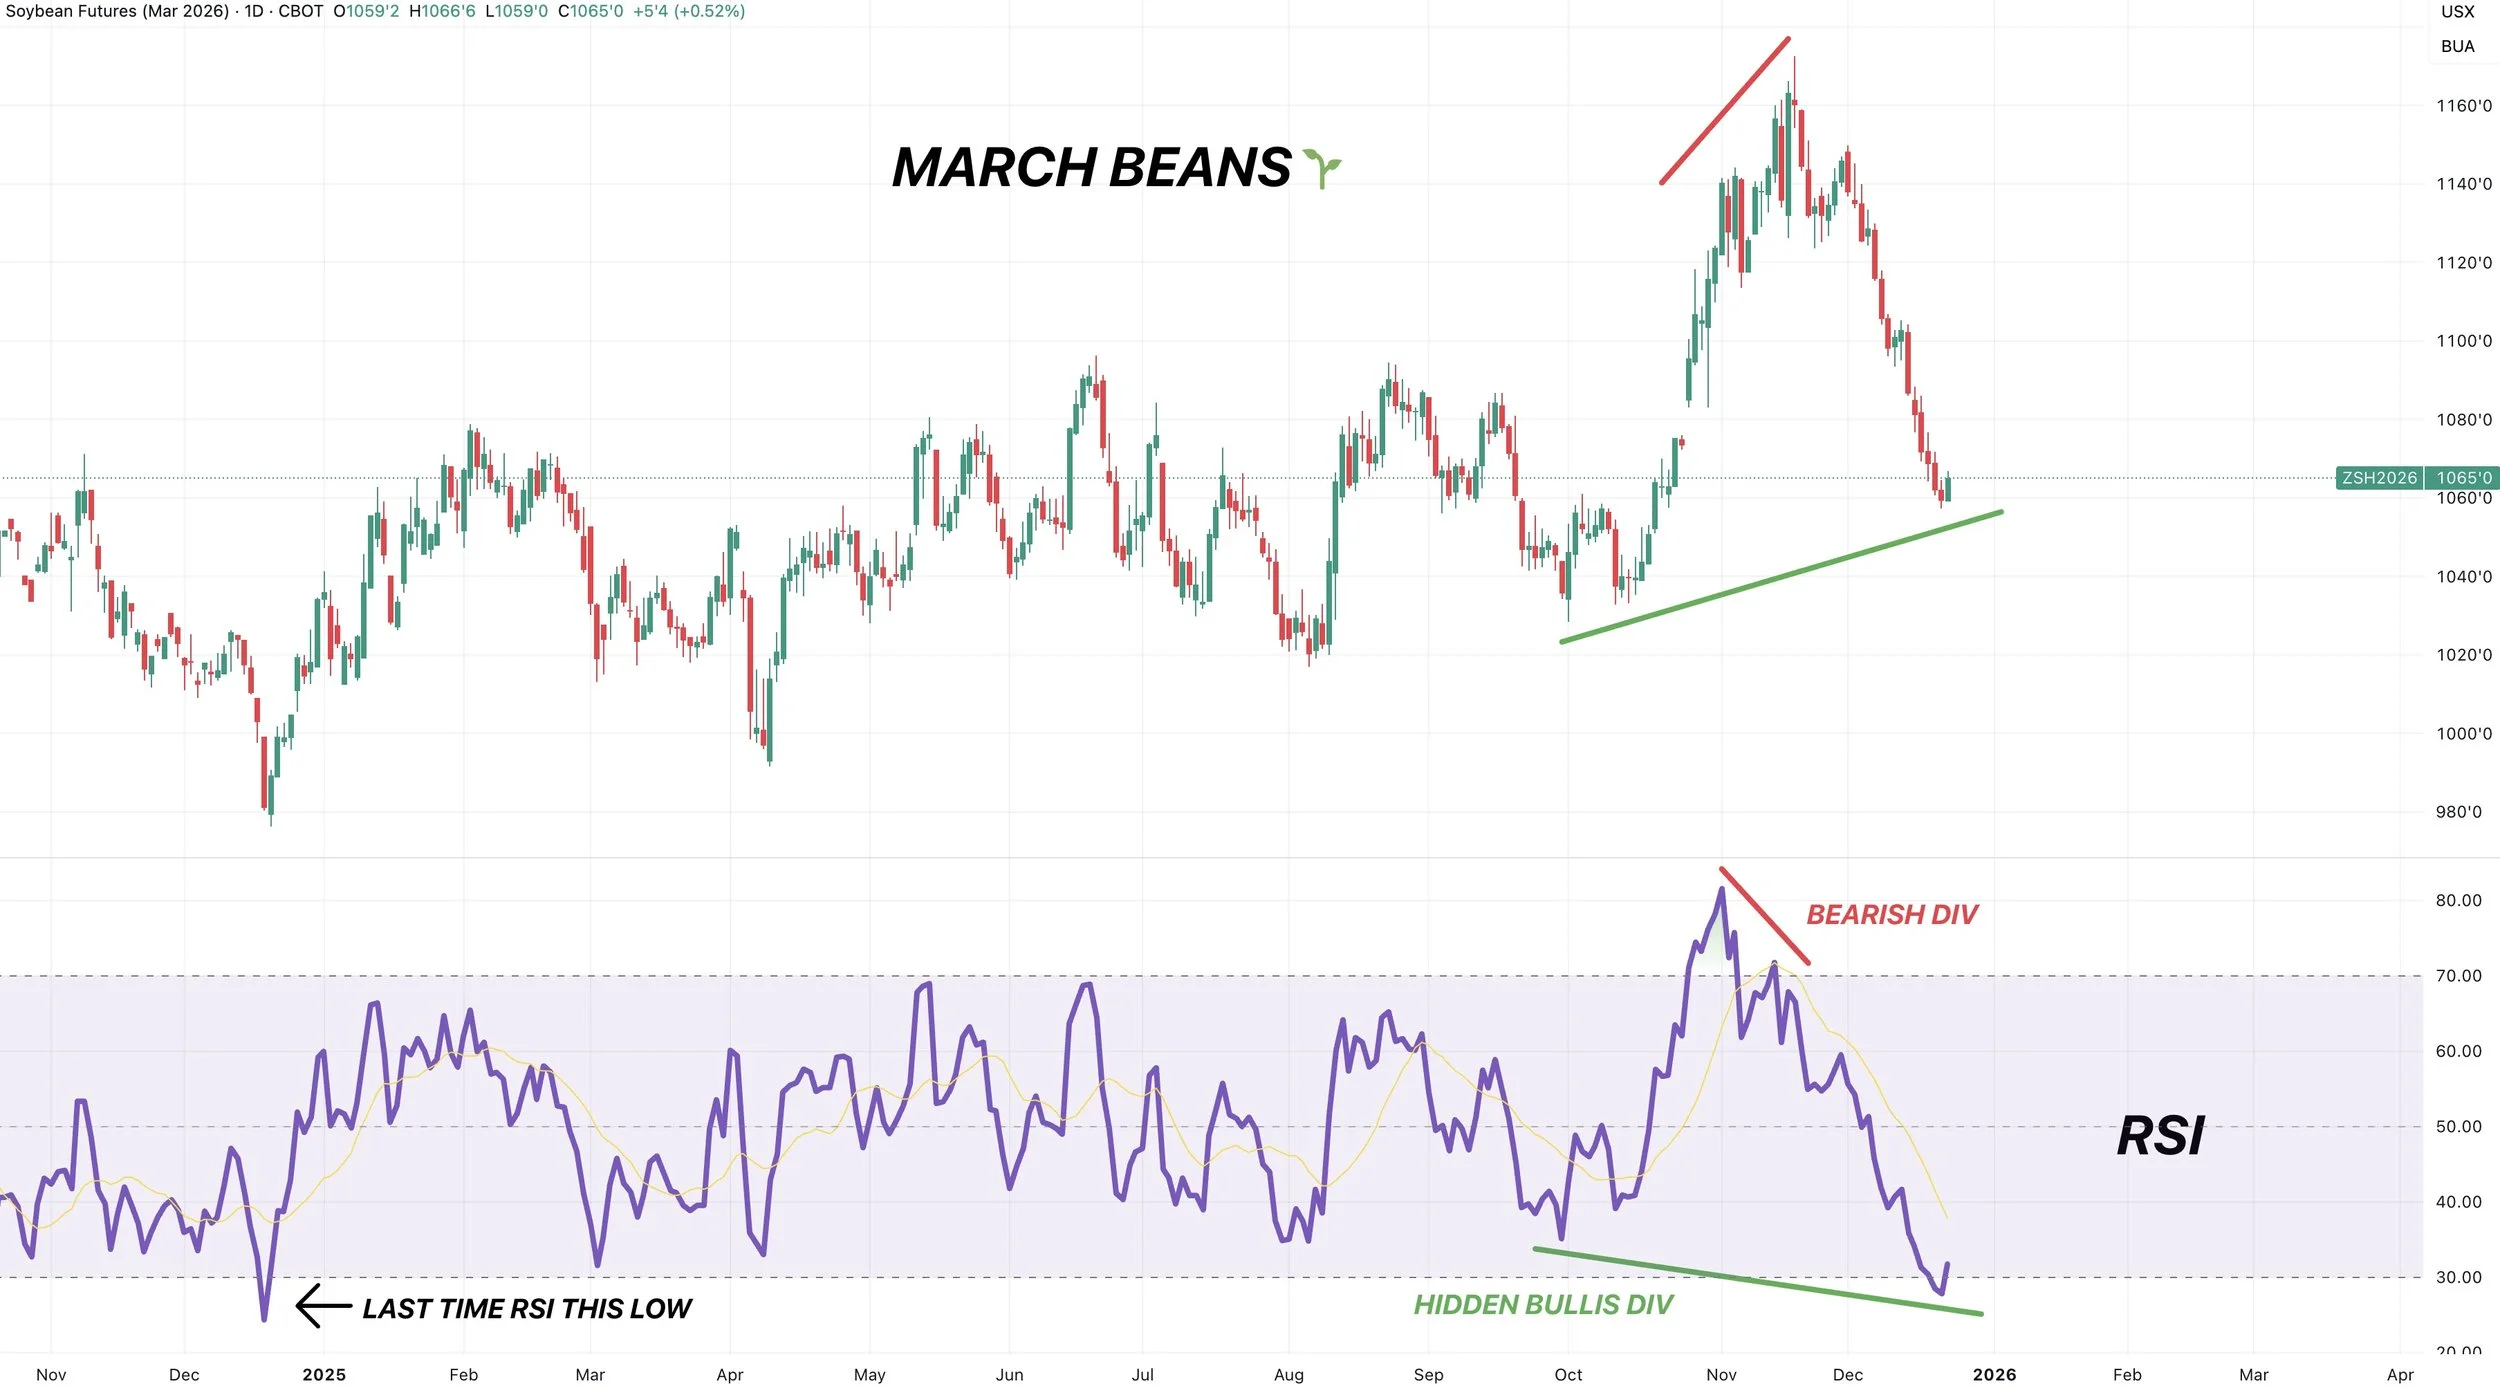
Soybeans are the most oversold they've been since our contract lows last year.
So the RSI is making new lows.
Meanwhile, prices are clearly not as low as they were the last time the RSI was this low.
That is called hidden bullish divergence. It doesn’t mean we "have to go higher". It is simply a sign that downside momentum could start to get weak.
Bearish divergence marked the November highs. Which happens when prices make new highs but the RSI does not. This is a sign that upside momentum is getting weak.
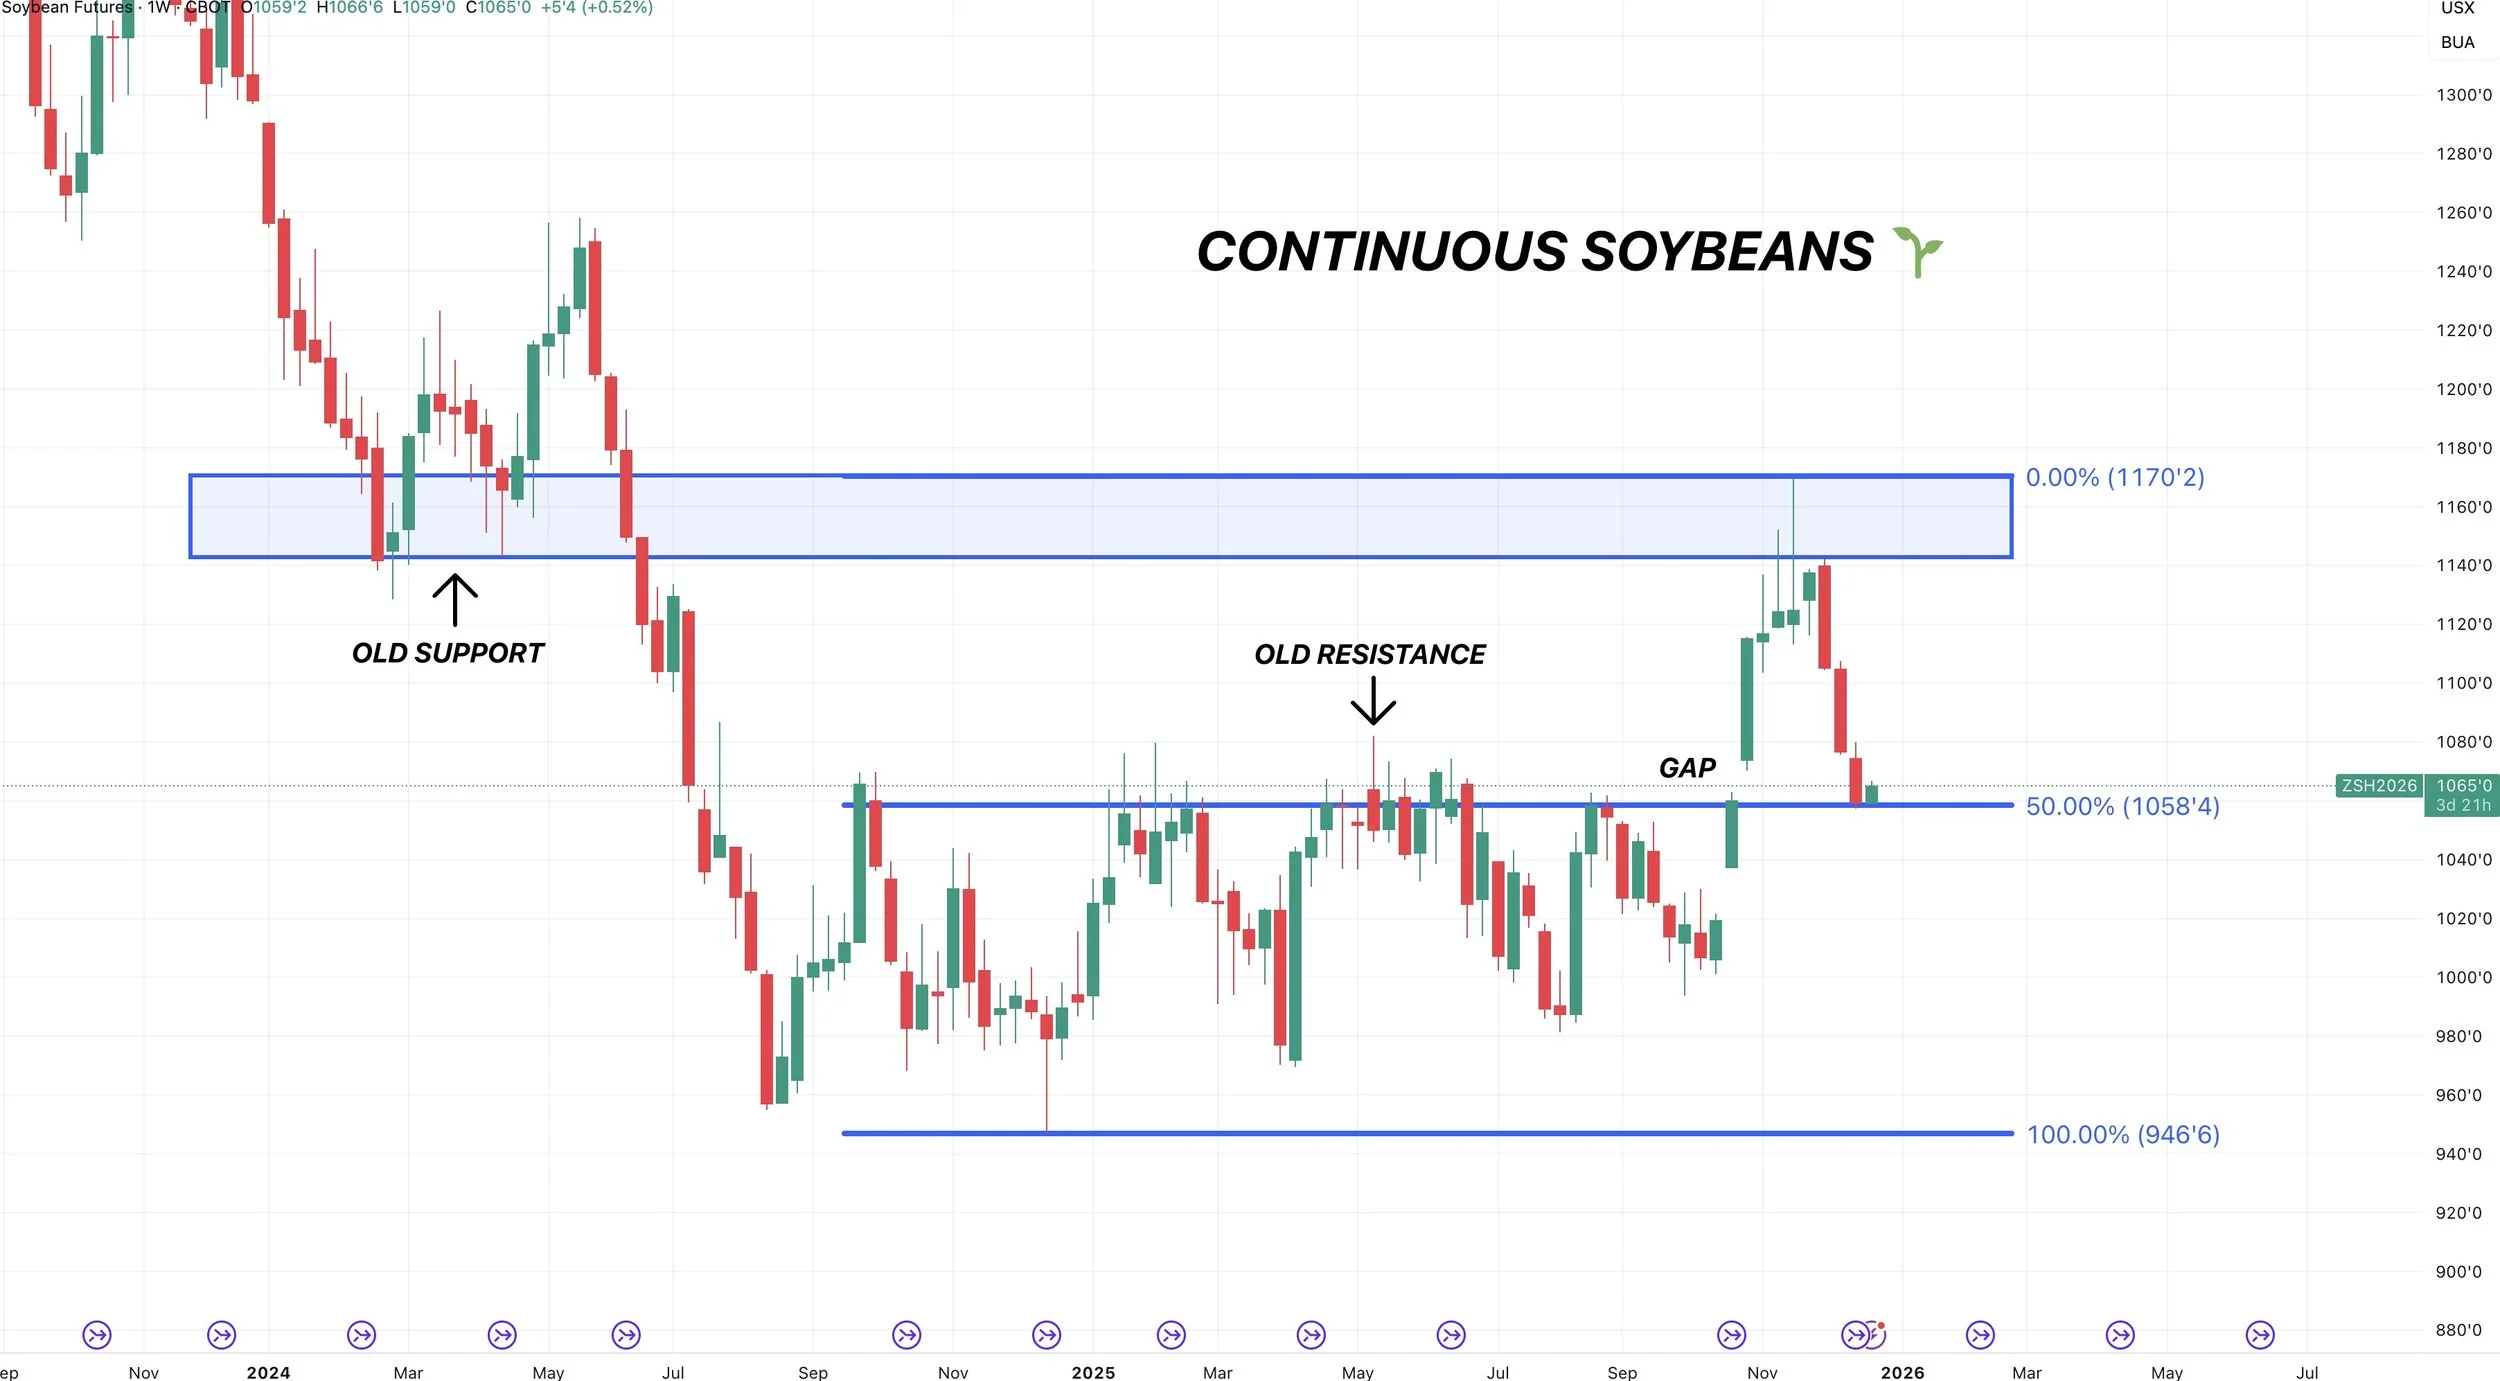
Continuous Chart
Here is a weekly contiuous chart.
This chart gave back 50% of the entire rally off contract lows.
That level aligns with a re-test of the yearly resistance levels.
We also had that gap we left back in October which has now been filled.
So finding some life here would make sense.
Old resistance often becomes new support and vice versa.
For example, our support from 2024 is the same level we failed at on the rally.
Relief Bounces
I talked about this last week, but markets rarely ever just go straight go down.
More often than not, they will provide a relief bounce.
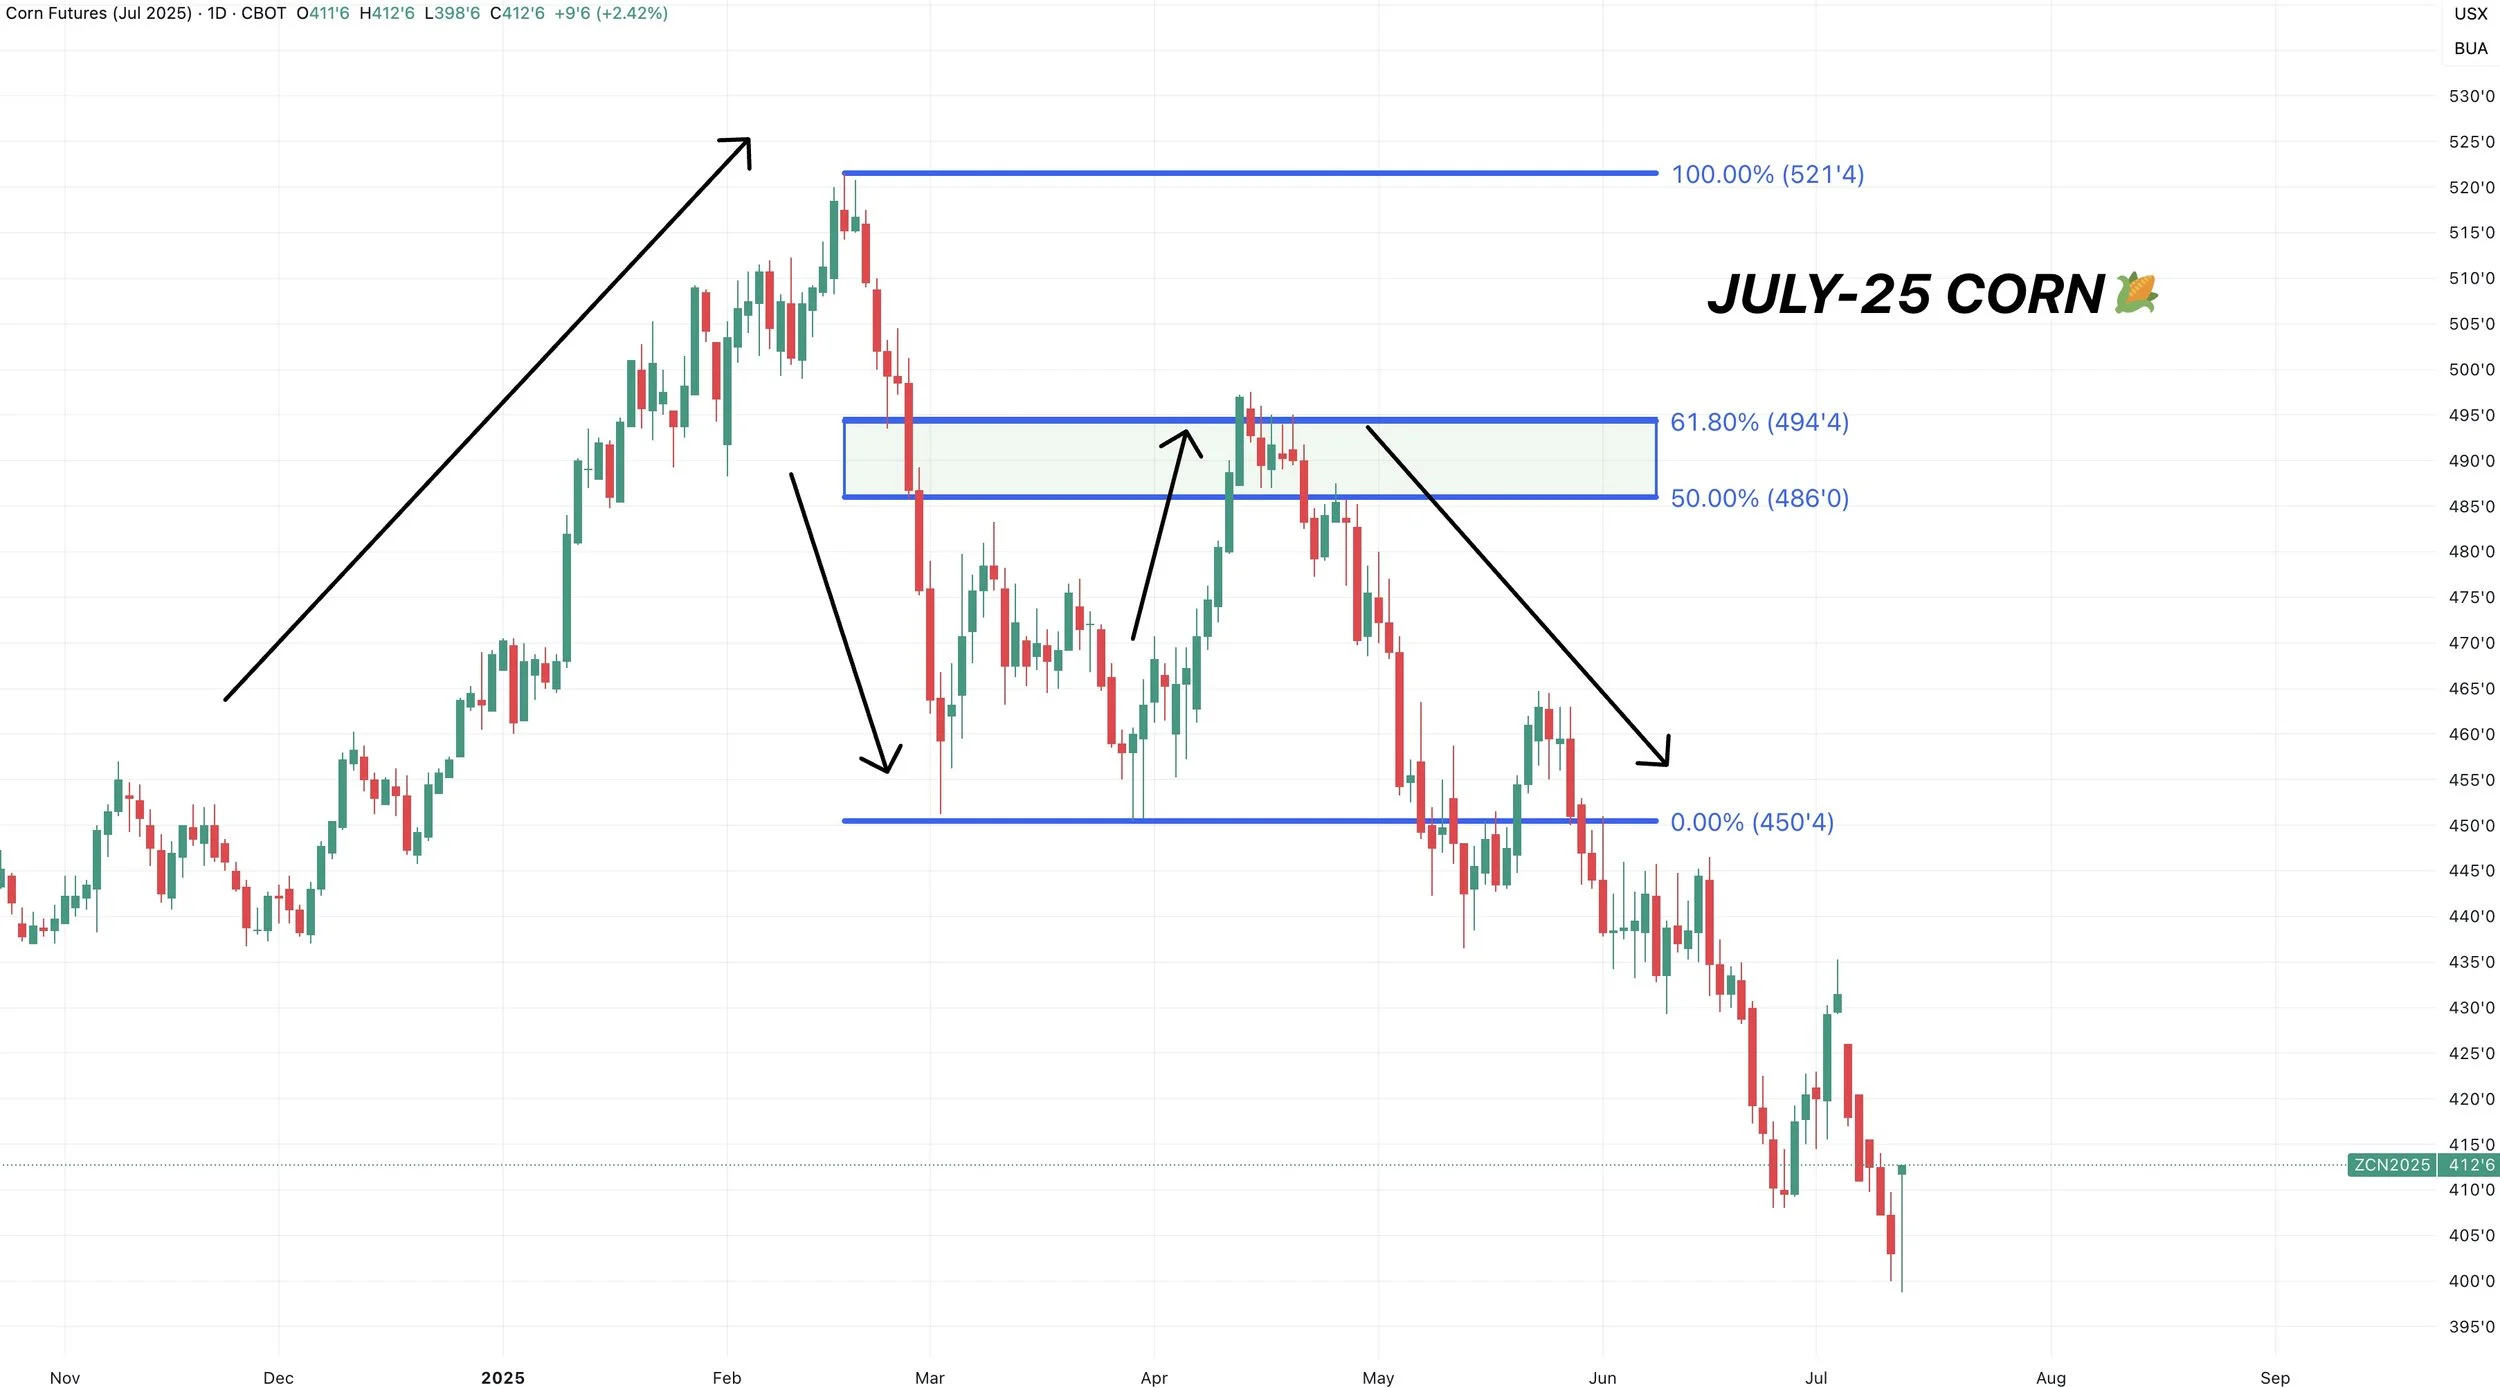
The corn market earlier this year is a prime example of that.
Feb sell off, April relief bounce, ultimately we went a lot lower.
If today was truly the bottom.. 50% of the sell off on March beans would be $11.15
$11.00 to $11.15 claws back 38.2% to 50% of the entire sell off.
So that is going to be a possible upside target from here.
I would be hesitant to think we have enough juice to hit the 61.8% level at $11.28
Wheat
I don’t have much to update on the wheat market today.
It's the same old story it's been for a while.
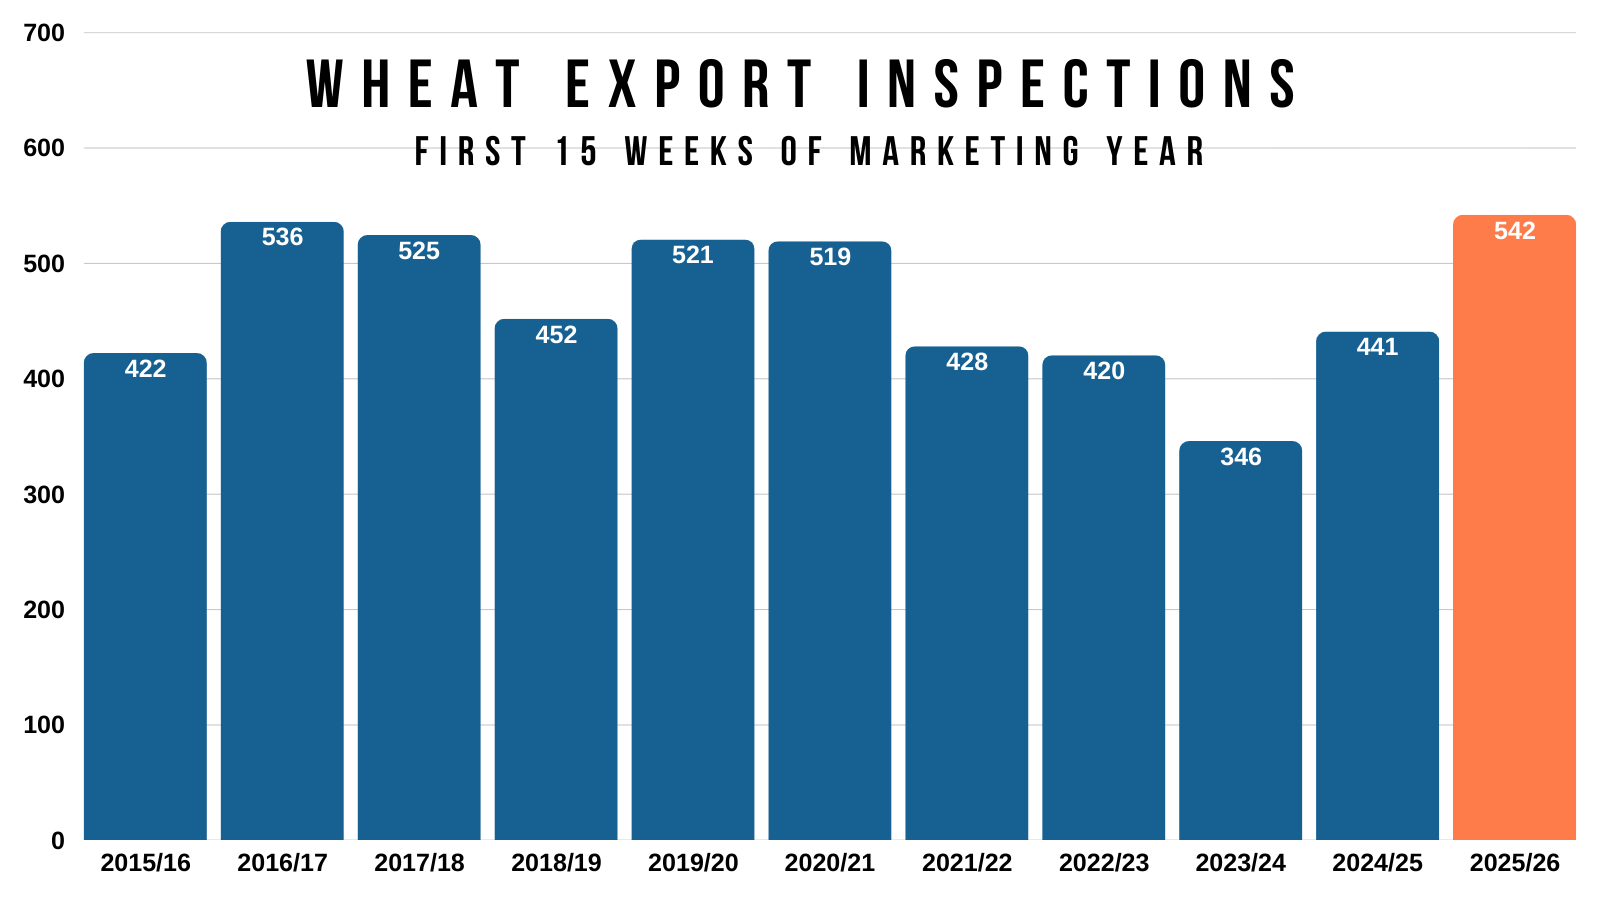
Demand is still amazing.
Inspections are up +23% vs last year.
Sitting at their best levels in a decade.
The problem is that world production is really strong and we don’t have any issues with any of the big players globally.
The USDA has added a lot of global production the last few months.
Throw that on to the fact that the US situation is the most bearish it's been in 5 years, and you get a market that is disappointing.
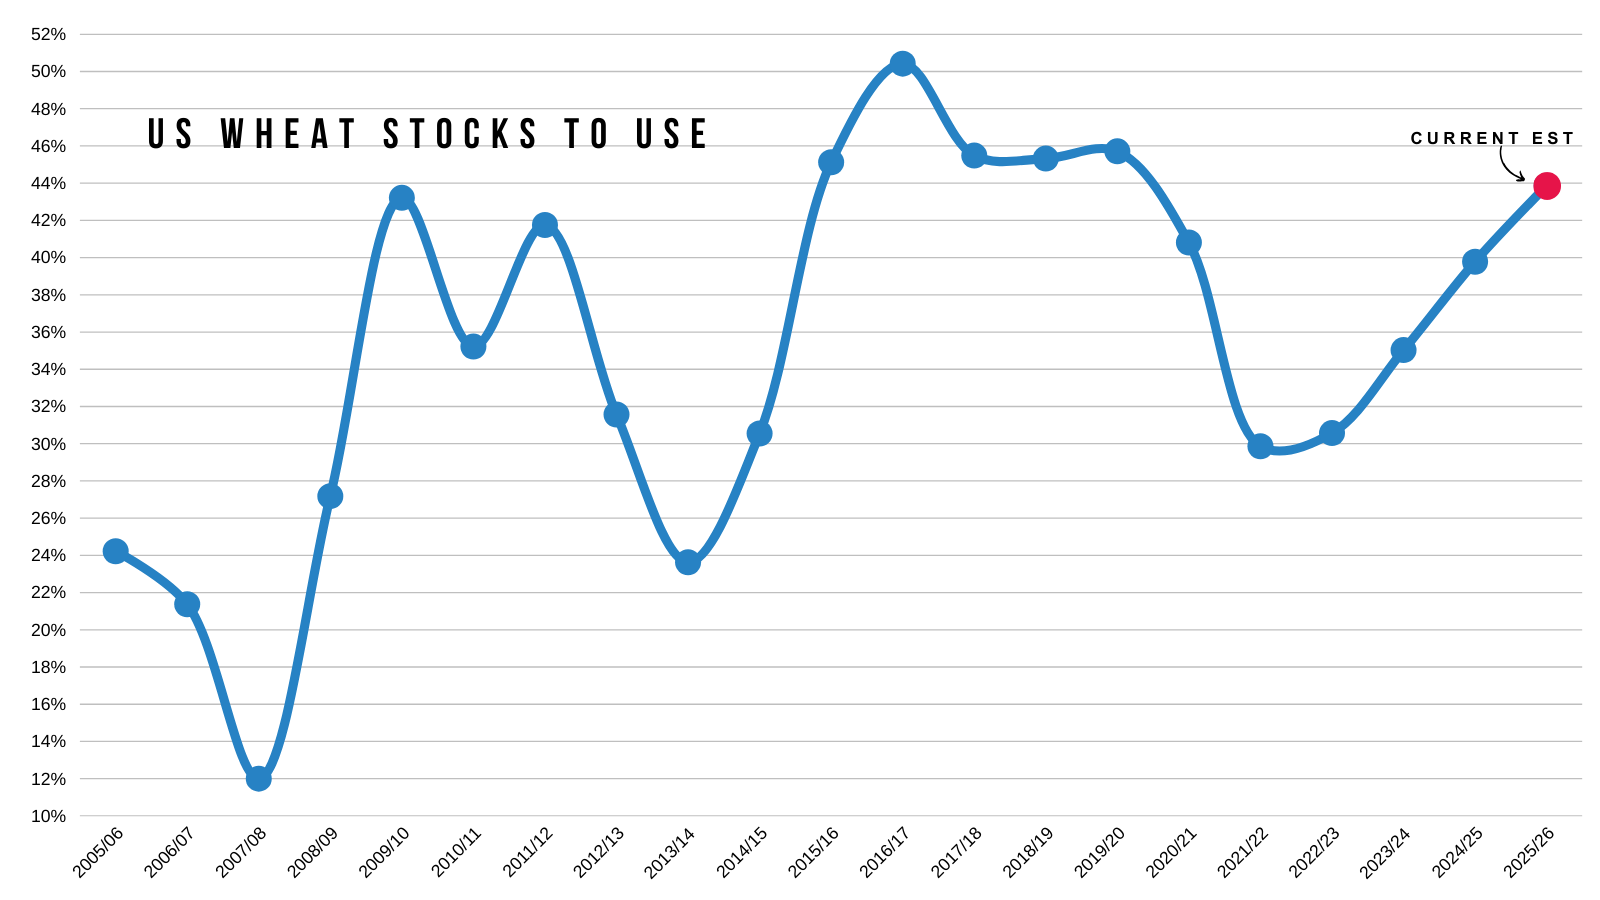
So even though demand is the best in a decade, the wheat market is just too over supplied everywhere to justify a real reason to rally.
Moving forward, it does feel like we should be looking at less acres which could be a longer term friendly story here in the US.
If I'm the funds, do I really see a good risk to reward in shorting a market that is this cheap?
Despite not having a reason to be bullish on wheat, I do find it hard to get overly bearish at these levels. As it's hard to get excited shorting a market sitting at multi-year lows already.
Patiently waiting for an opportunity.
Technicals:
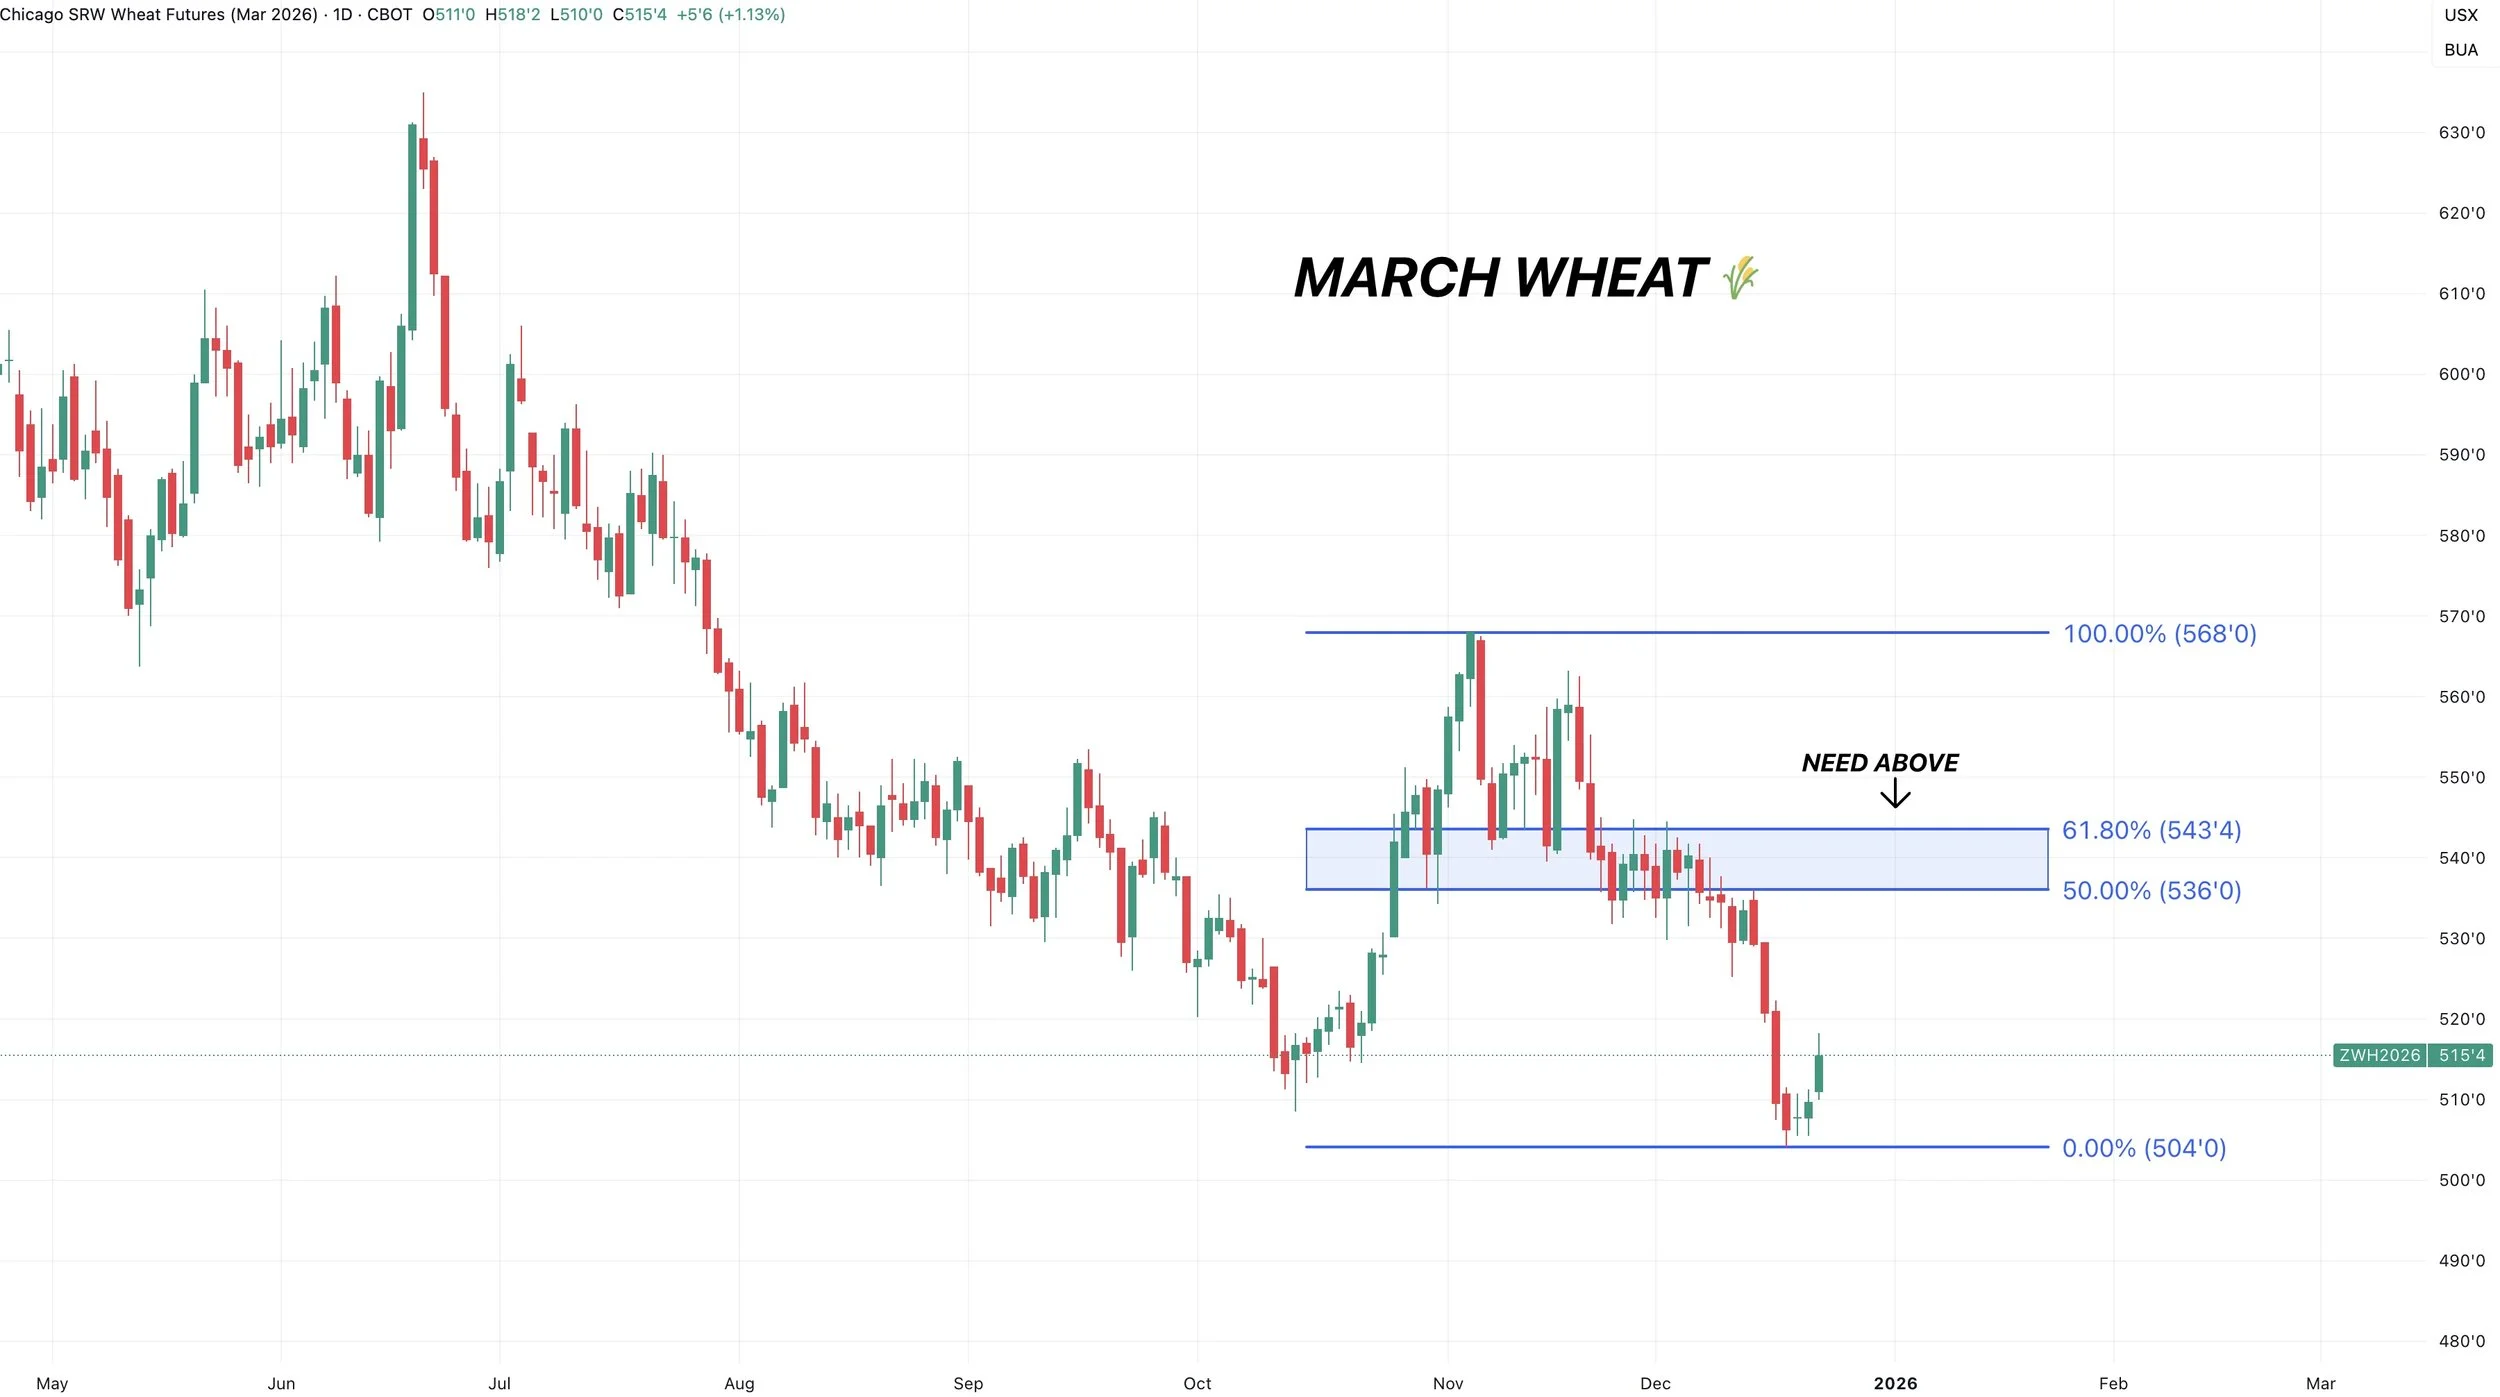
March Wheat
The charts are starting to look a little more optimistic.
We need above $5.44 to be confident this market has fully bottomed and is getting ready for the next leg higher and a real opportunity.
That is the 61.8% retracement up to the recent highs.
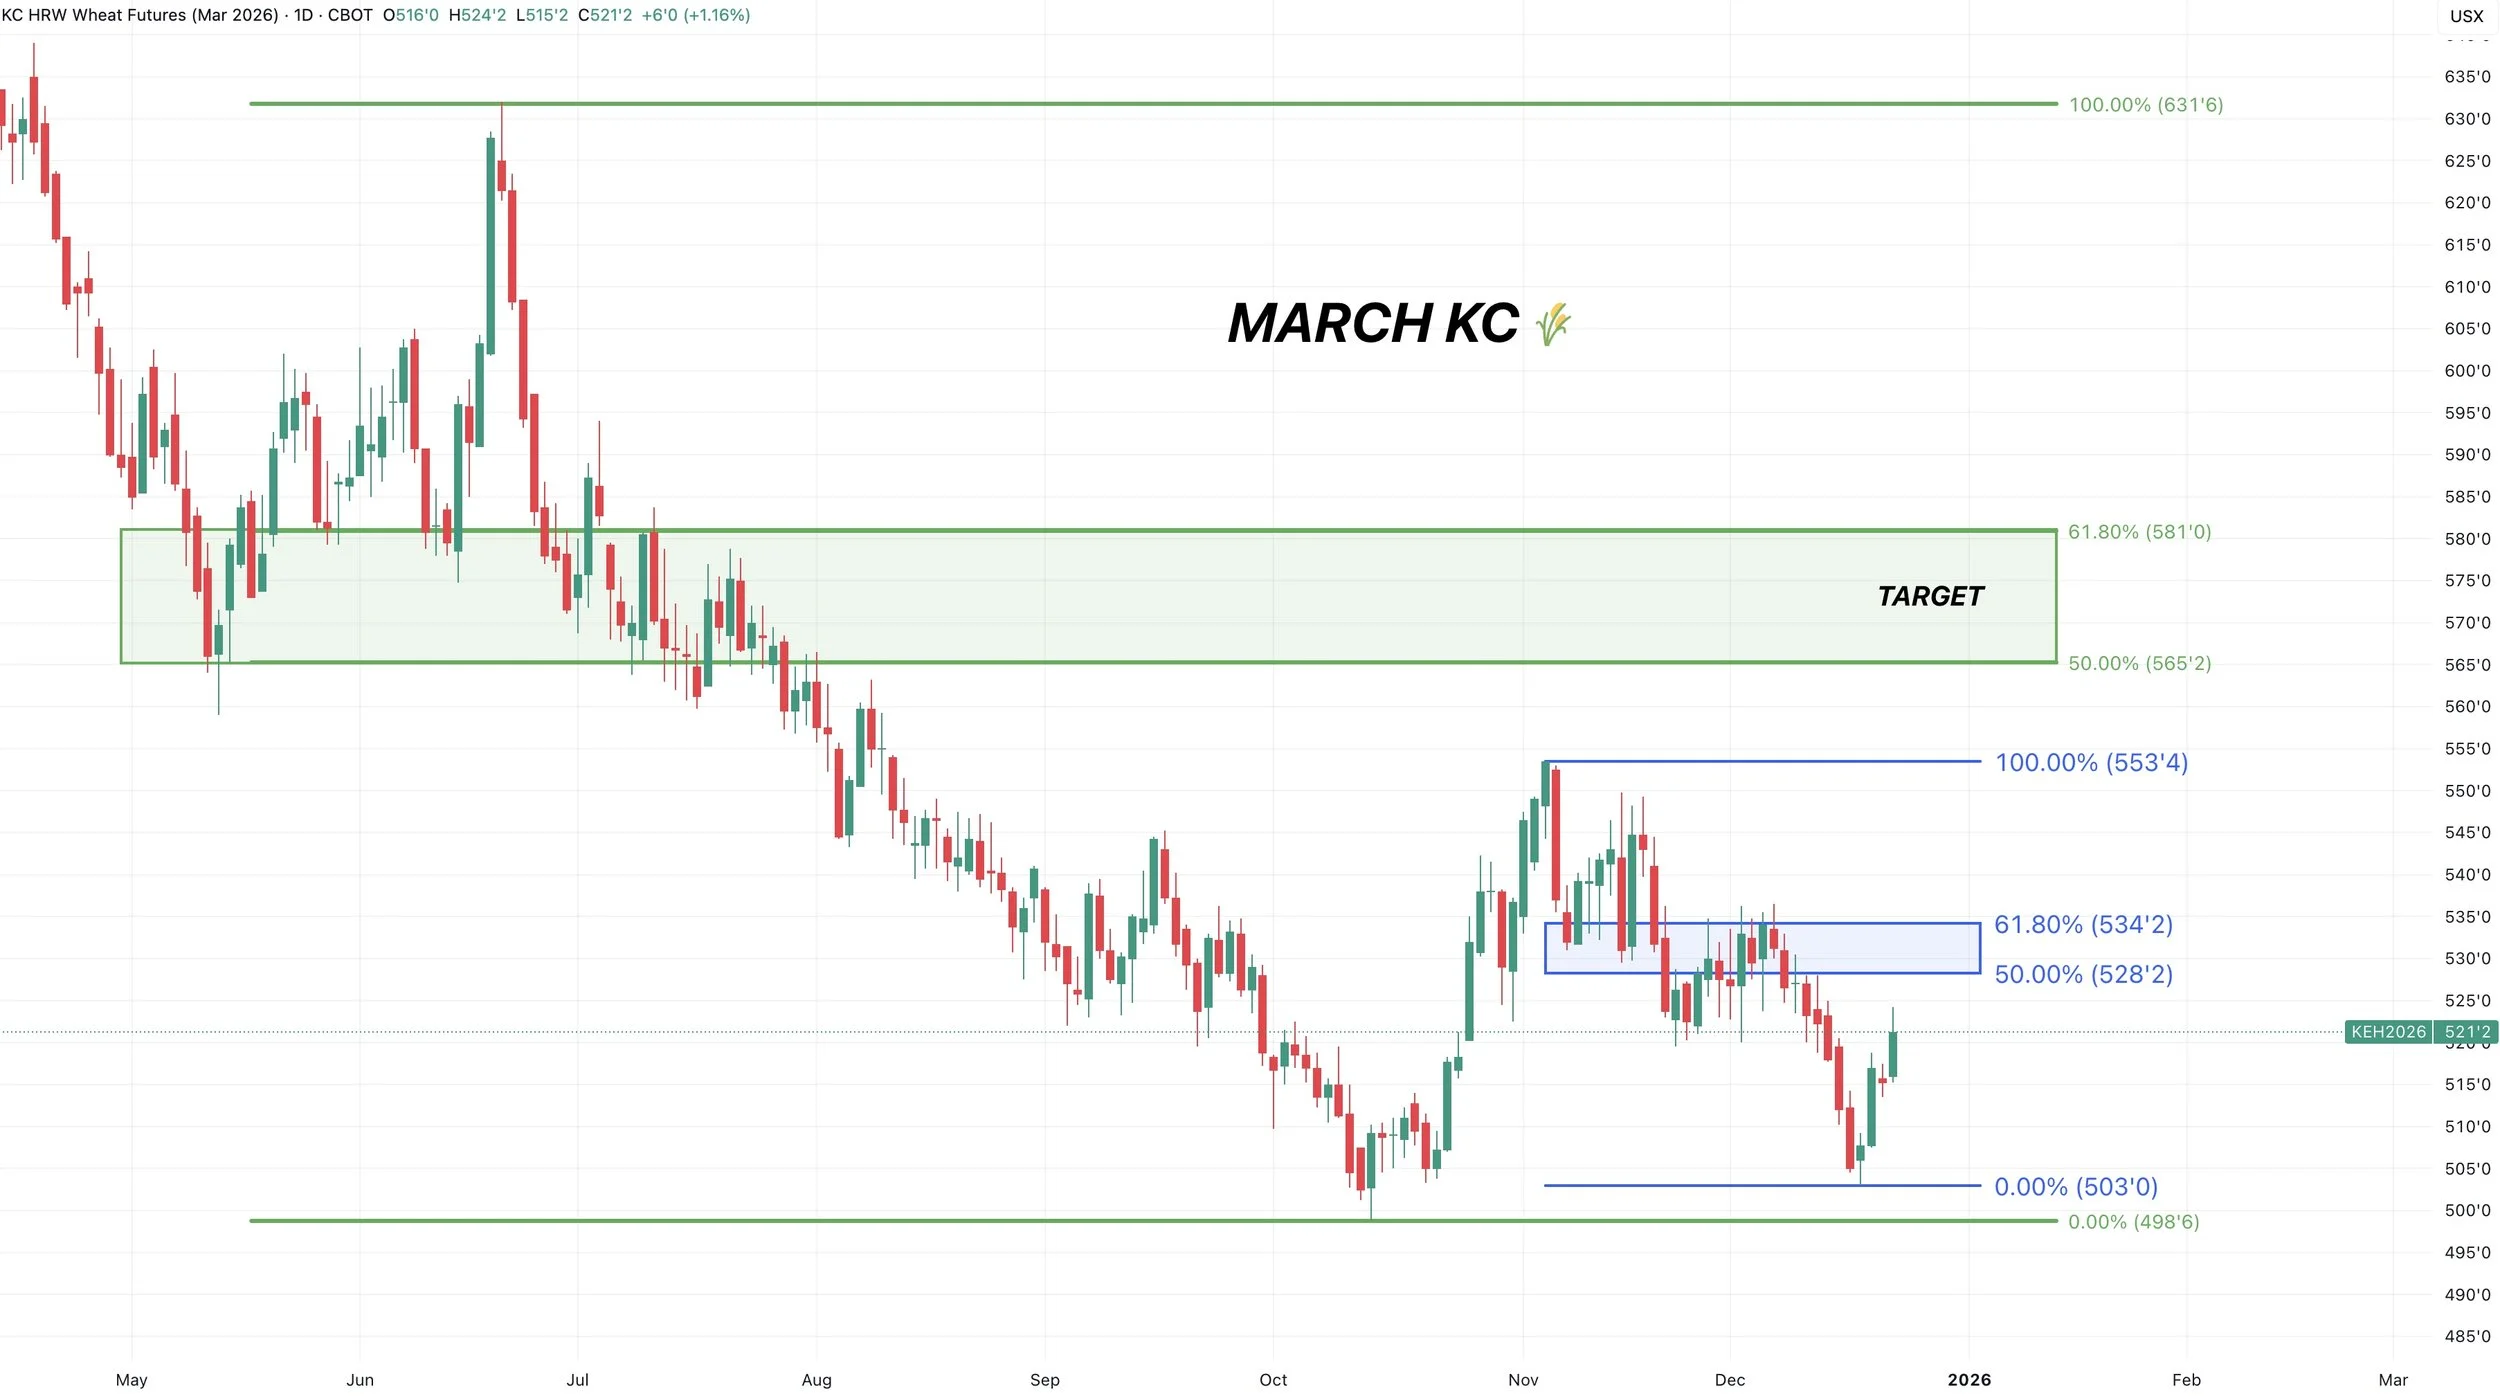
March KC Wheat
KC wheat looks hopeful here.
We have a potential double bottom in place.
To say we are done going to down, I'd like to see us above $5.34
The 61.8% level up to the recent highs. That is the most common level for a relief bounce to fail. So if we break above it, then it would be a sign that perhaps we are finally ready to move higher.
Cattle
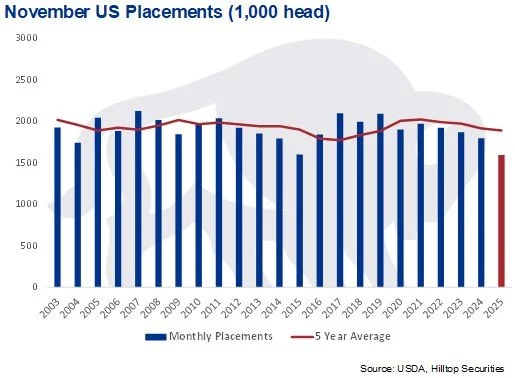
We had a cattle on feed report on Friday.
The numbers were pretty friendly.
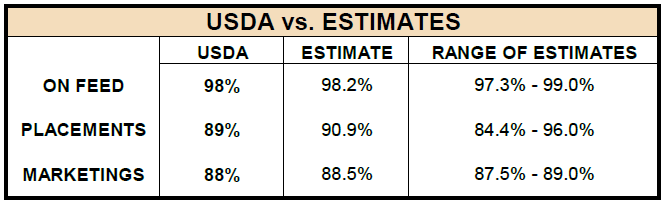
Placements were the lowest on record.
So the report reiterated that fundamentally, the cattle situation is still tight.
Chart from HTS Commodities
So fundamentally yes, this market is still bullish.
However, if you are managed money, and you just got wacked from a bunch of Trump tweets.. would you jump into this market with both feet and get overly long?
We also have the Mexico border factor. If we don’t get a case of screwworm for a while, it sounds like they will have a timeline announced on when the border will be re-opened.
We rallied going into this report.
Everyone was expecting the report to be bullish, and that's exactly what it was.
The friendly report wasn’t a surprise.
So I could easily see a buy the rumor sell the fact type of event here, where the reaction to this report is faded.
Technicals:
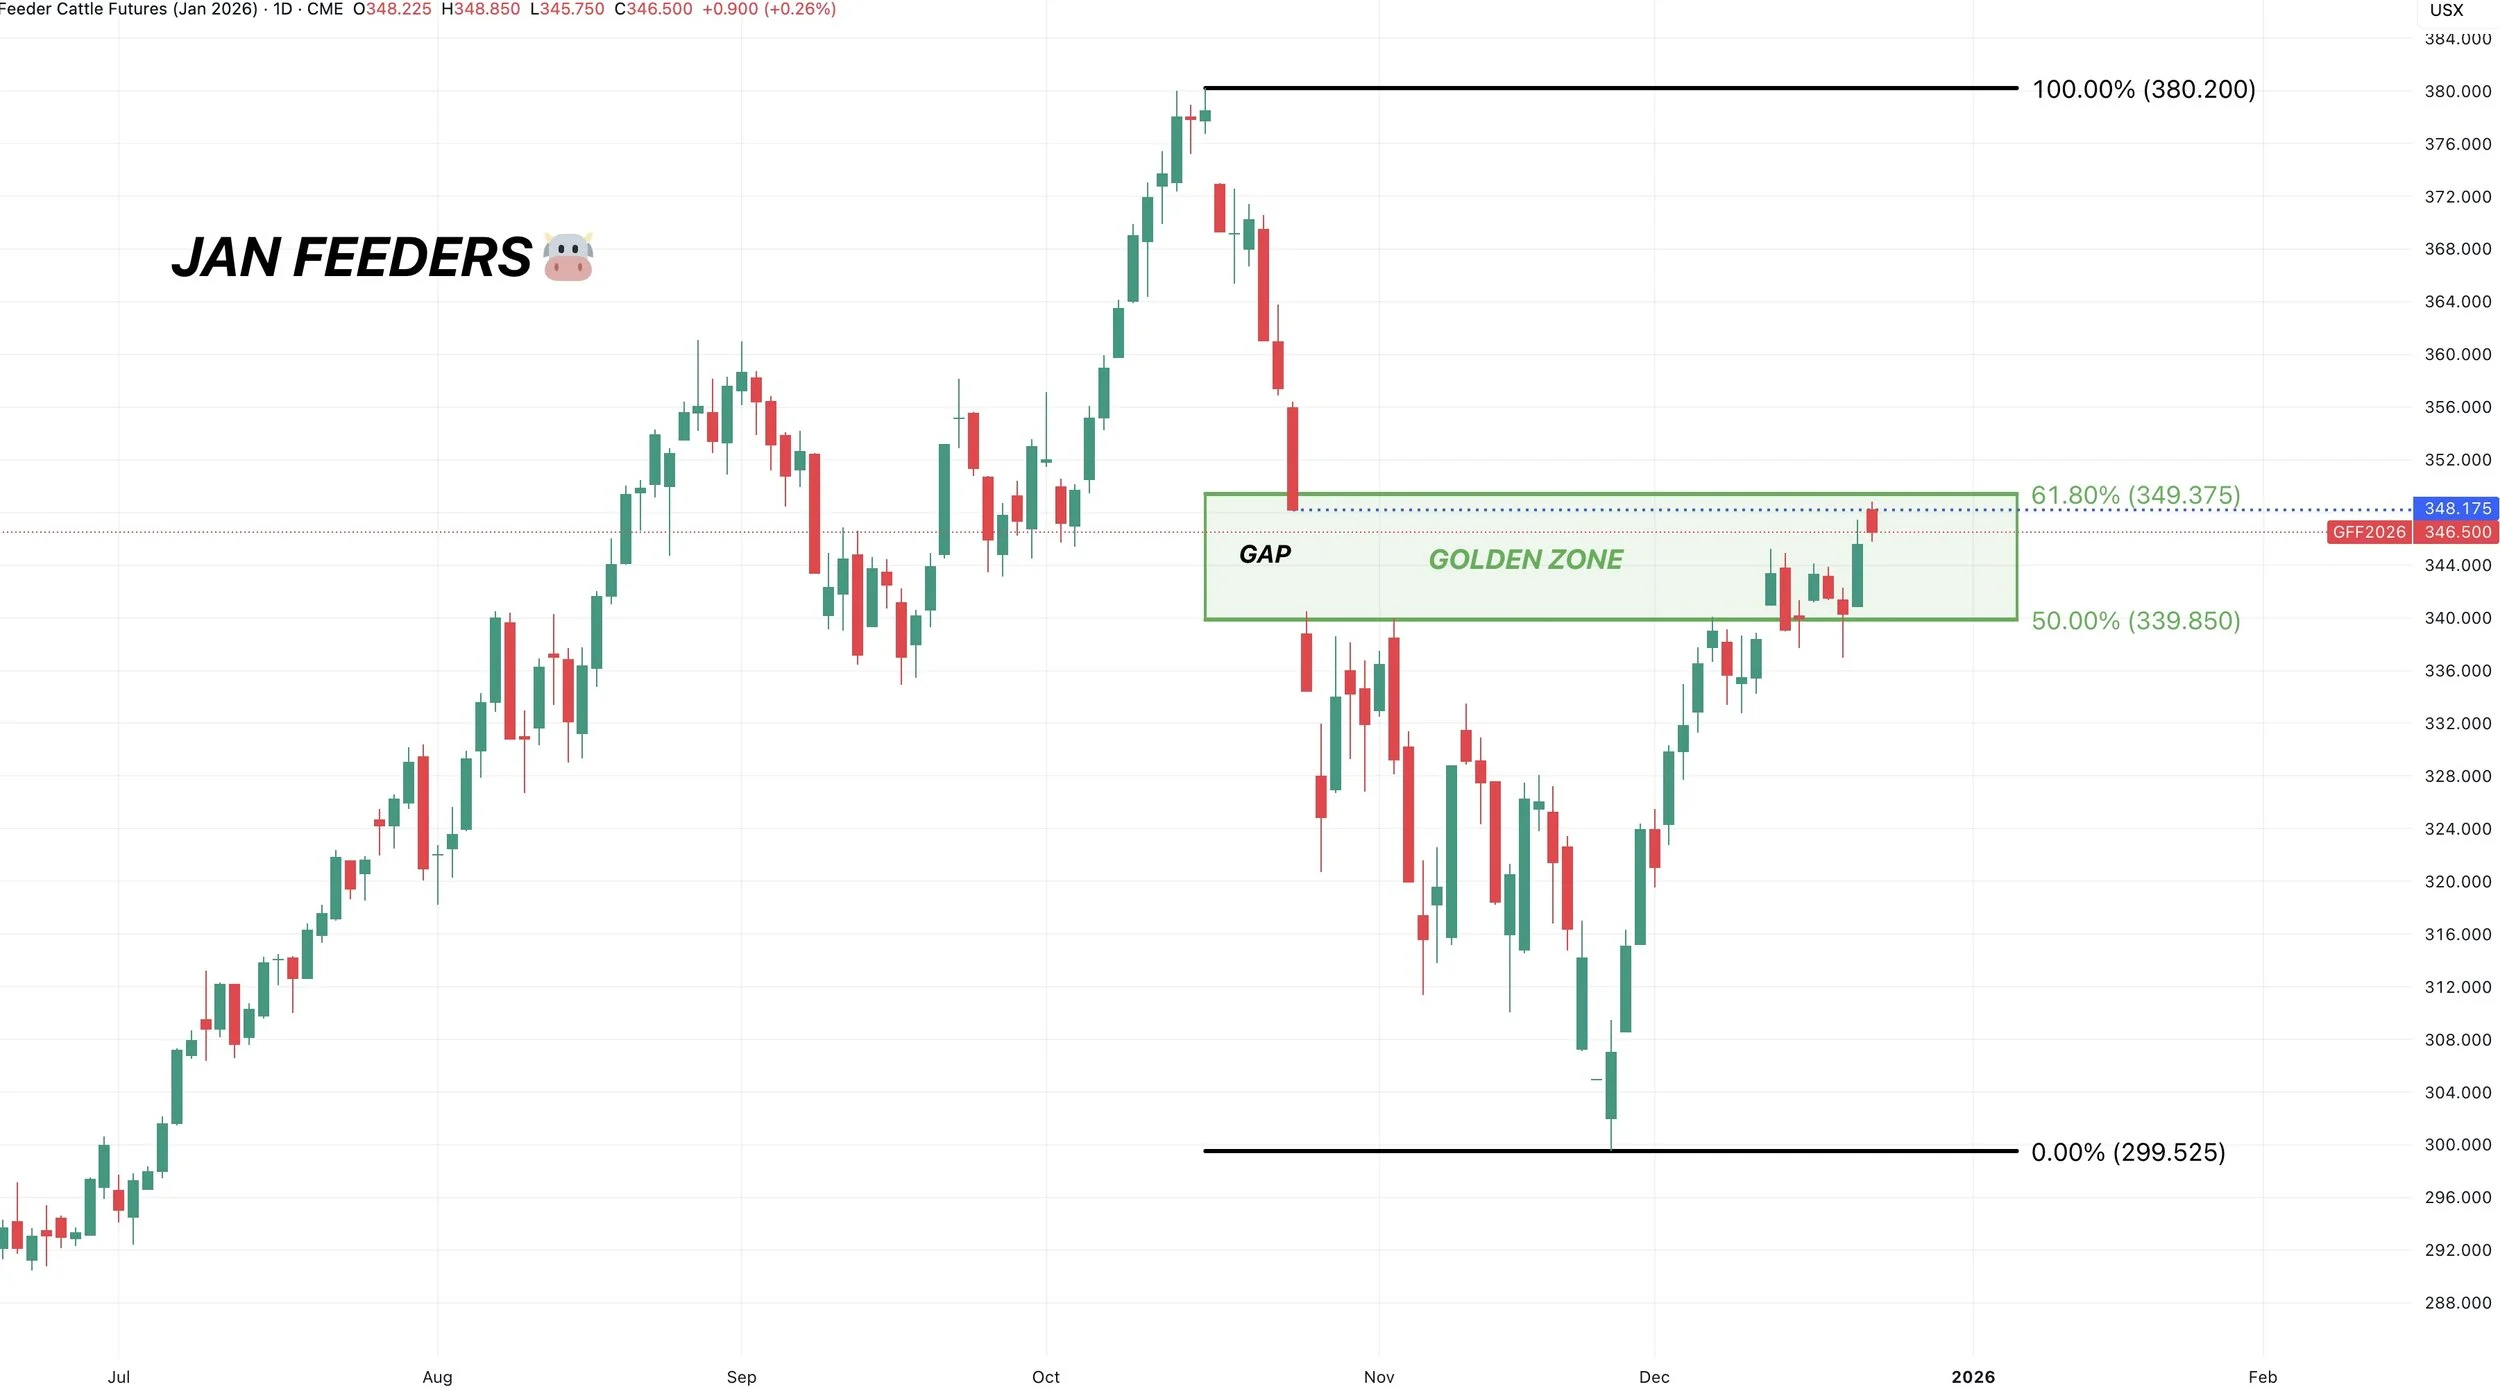
Jan Feeders
We will be switching to the March contract, but I wanted to point out some stuff on the Jan contract.
Jan feeders did perfectly fill that gap we left back in October.
Nearly tapping the 61.8% retracement of the entire sell off.
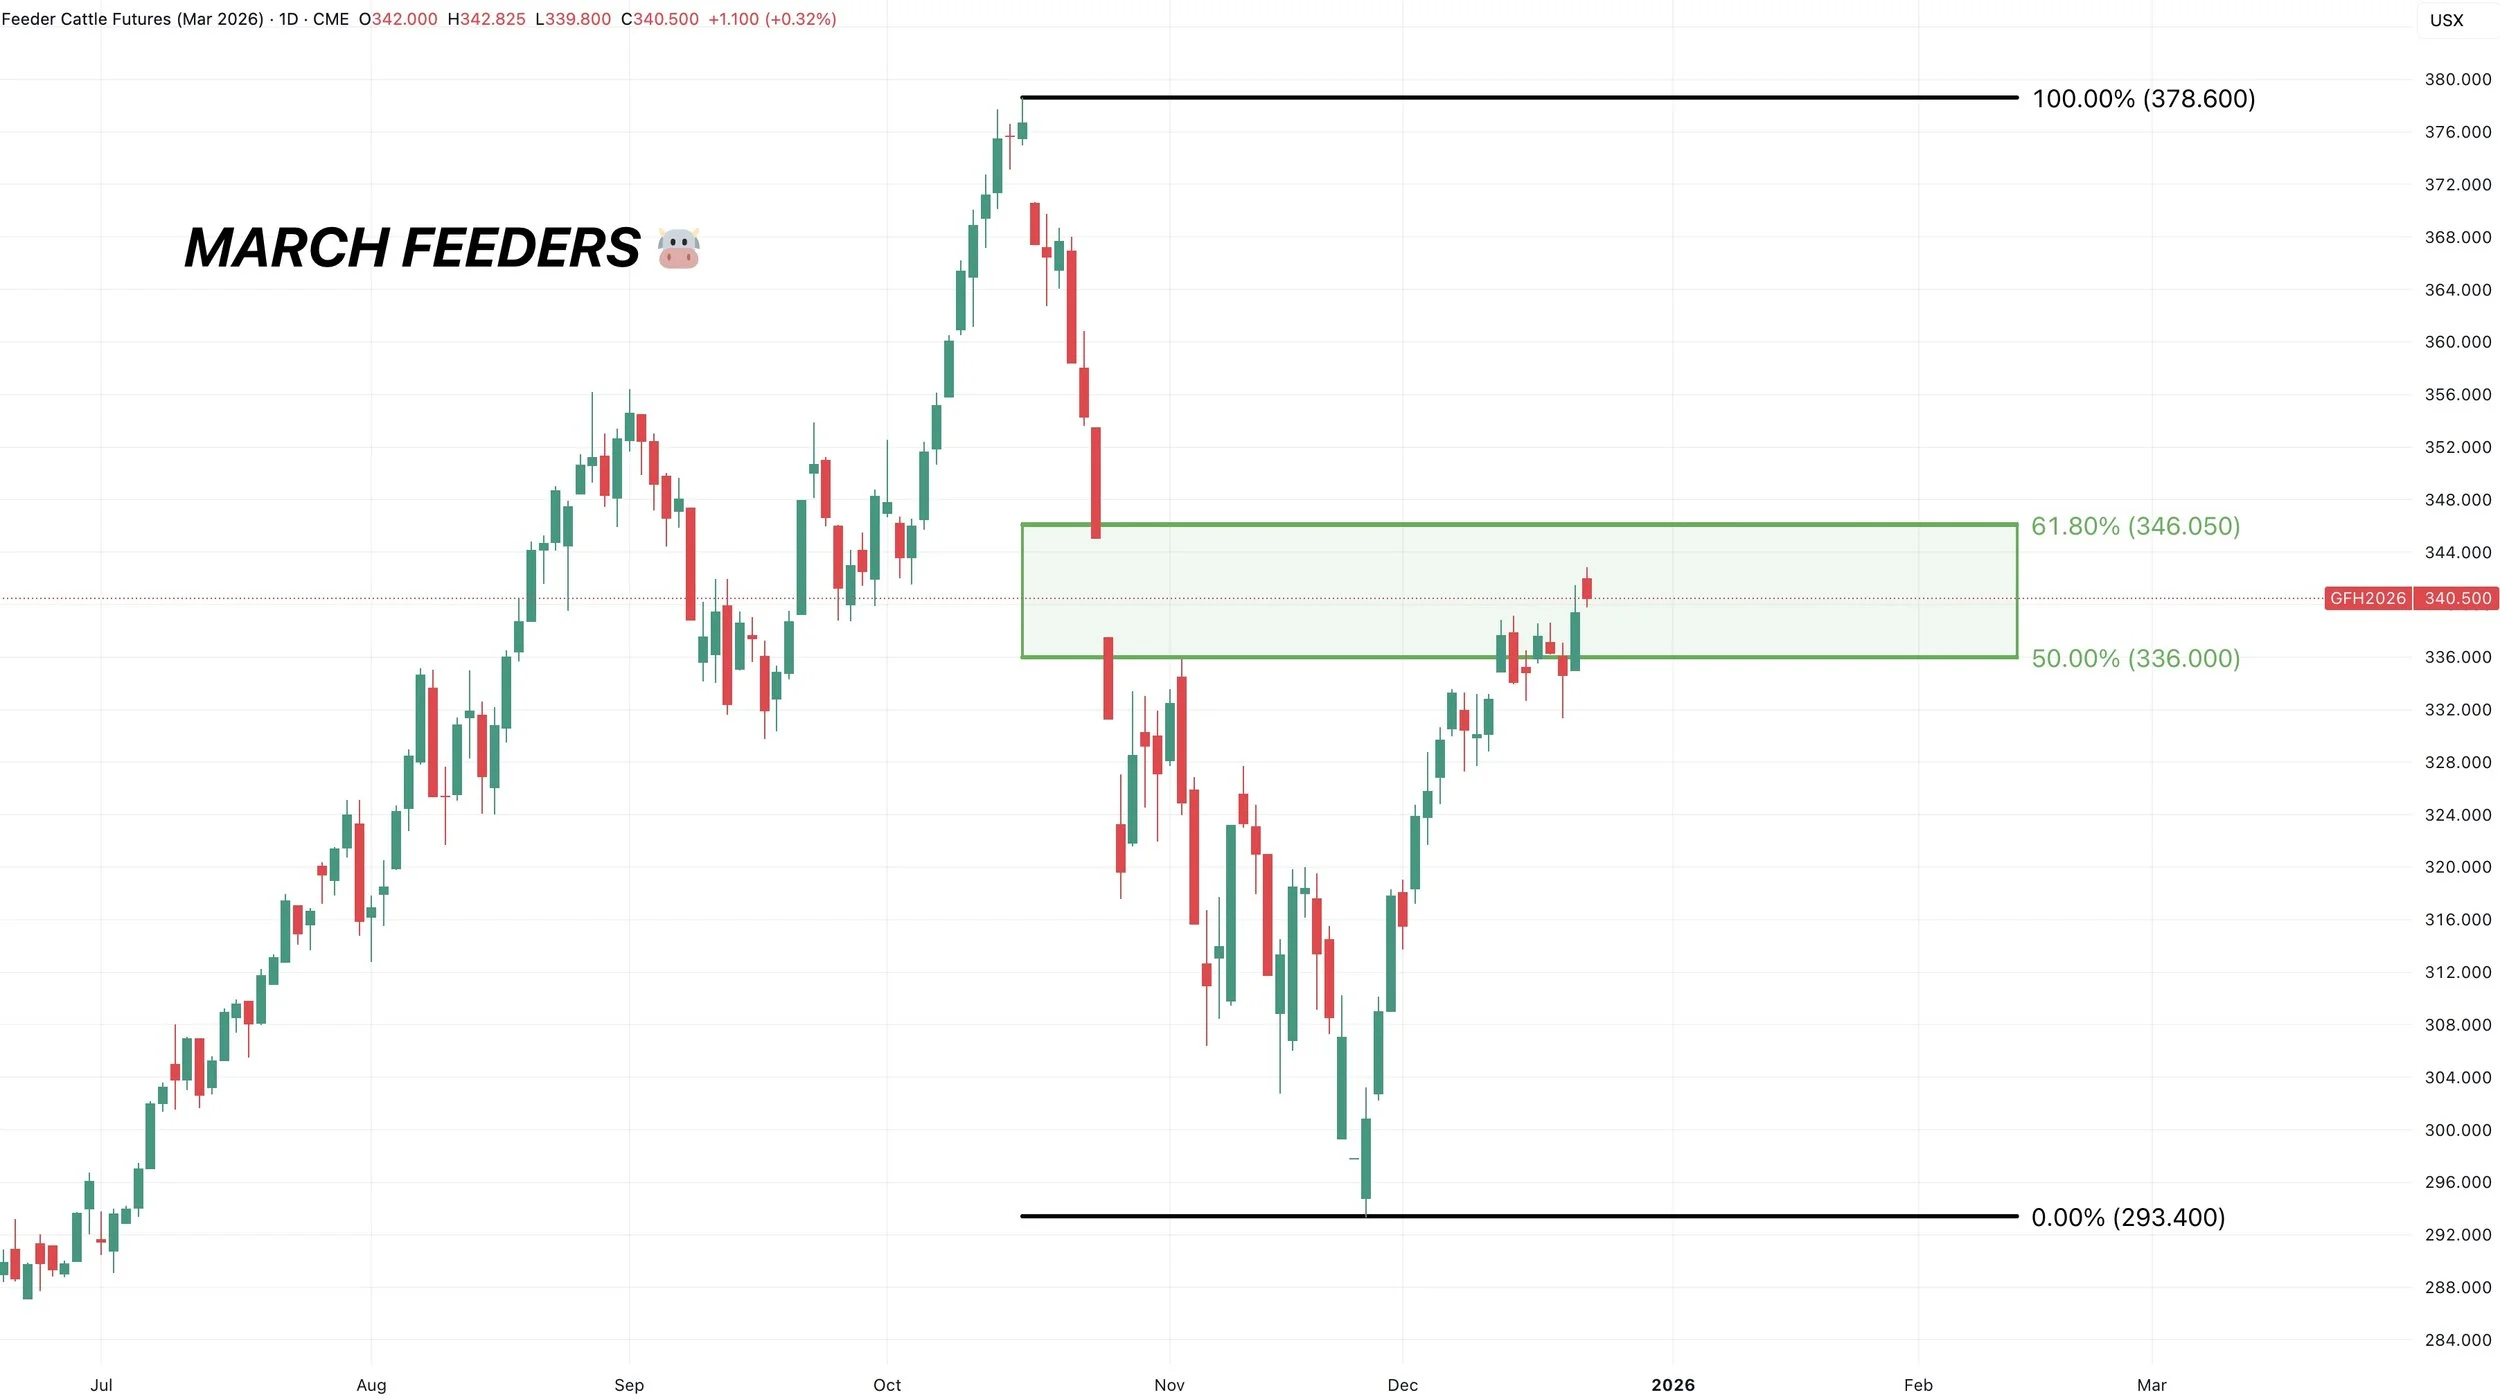
March Feeders
Hopping over to the March contract.
We are still sitting in the golden zone.
Getting close to that gap.
I still like having our hedges in place here, as if this market is going to fail, this would be the spot for it to happen.
This is where most relief bounces fail.
On the other hand, if we take out the 61.8% level. This would no longer be viewed as just your typical relief bounce. But until that happens, it is viewed as a relief bounce.
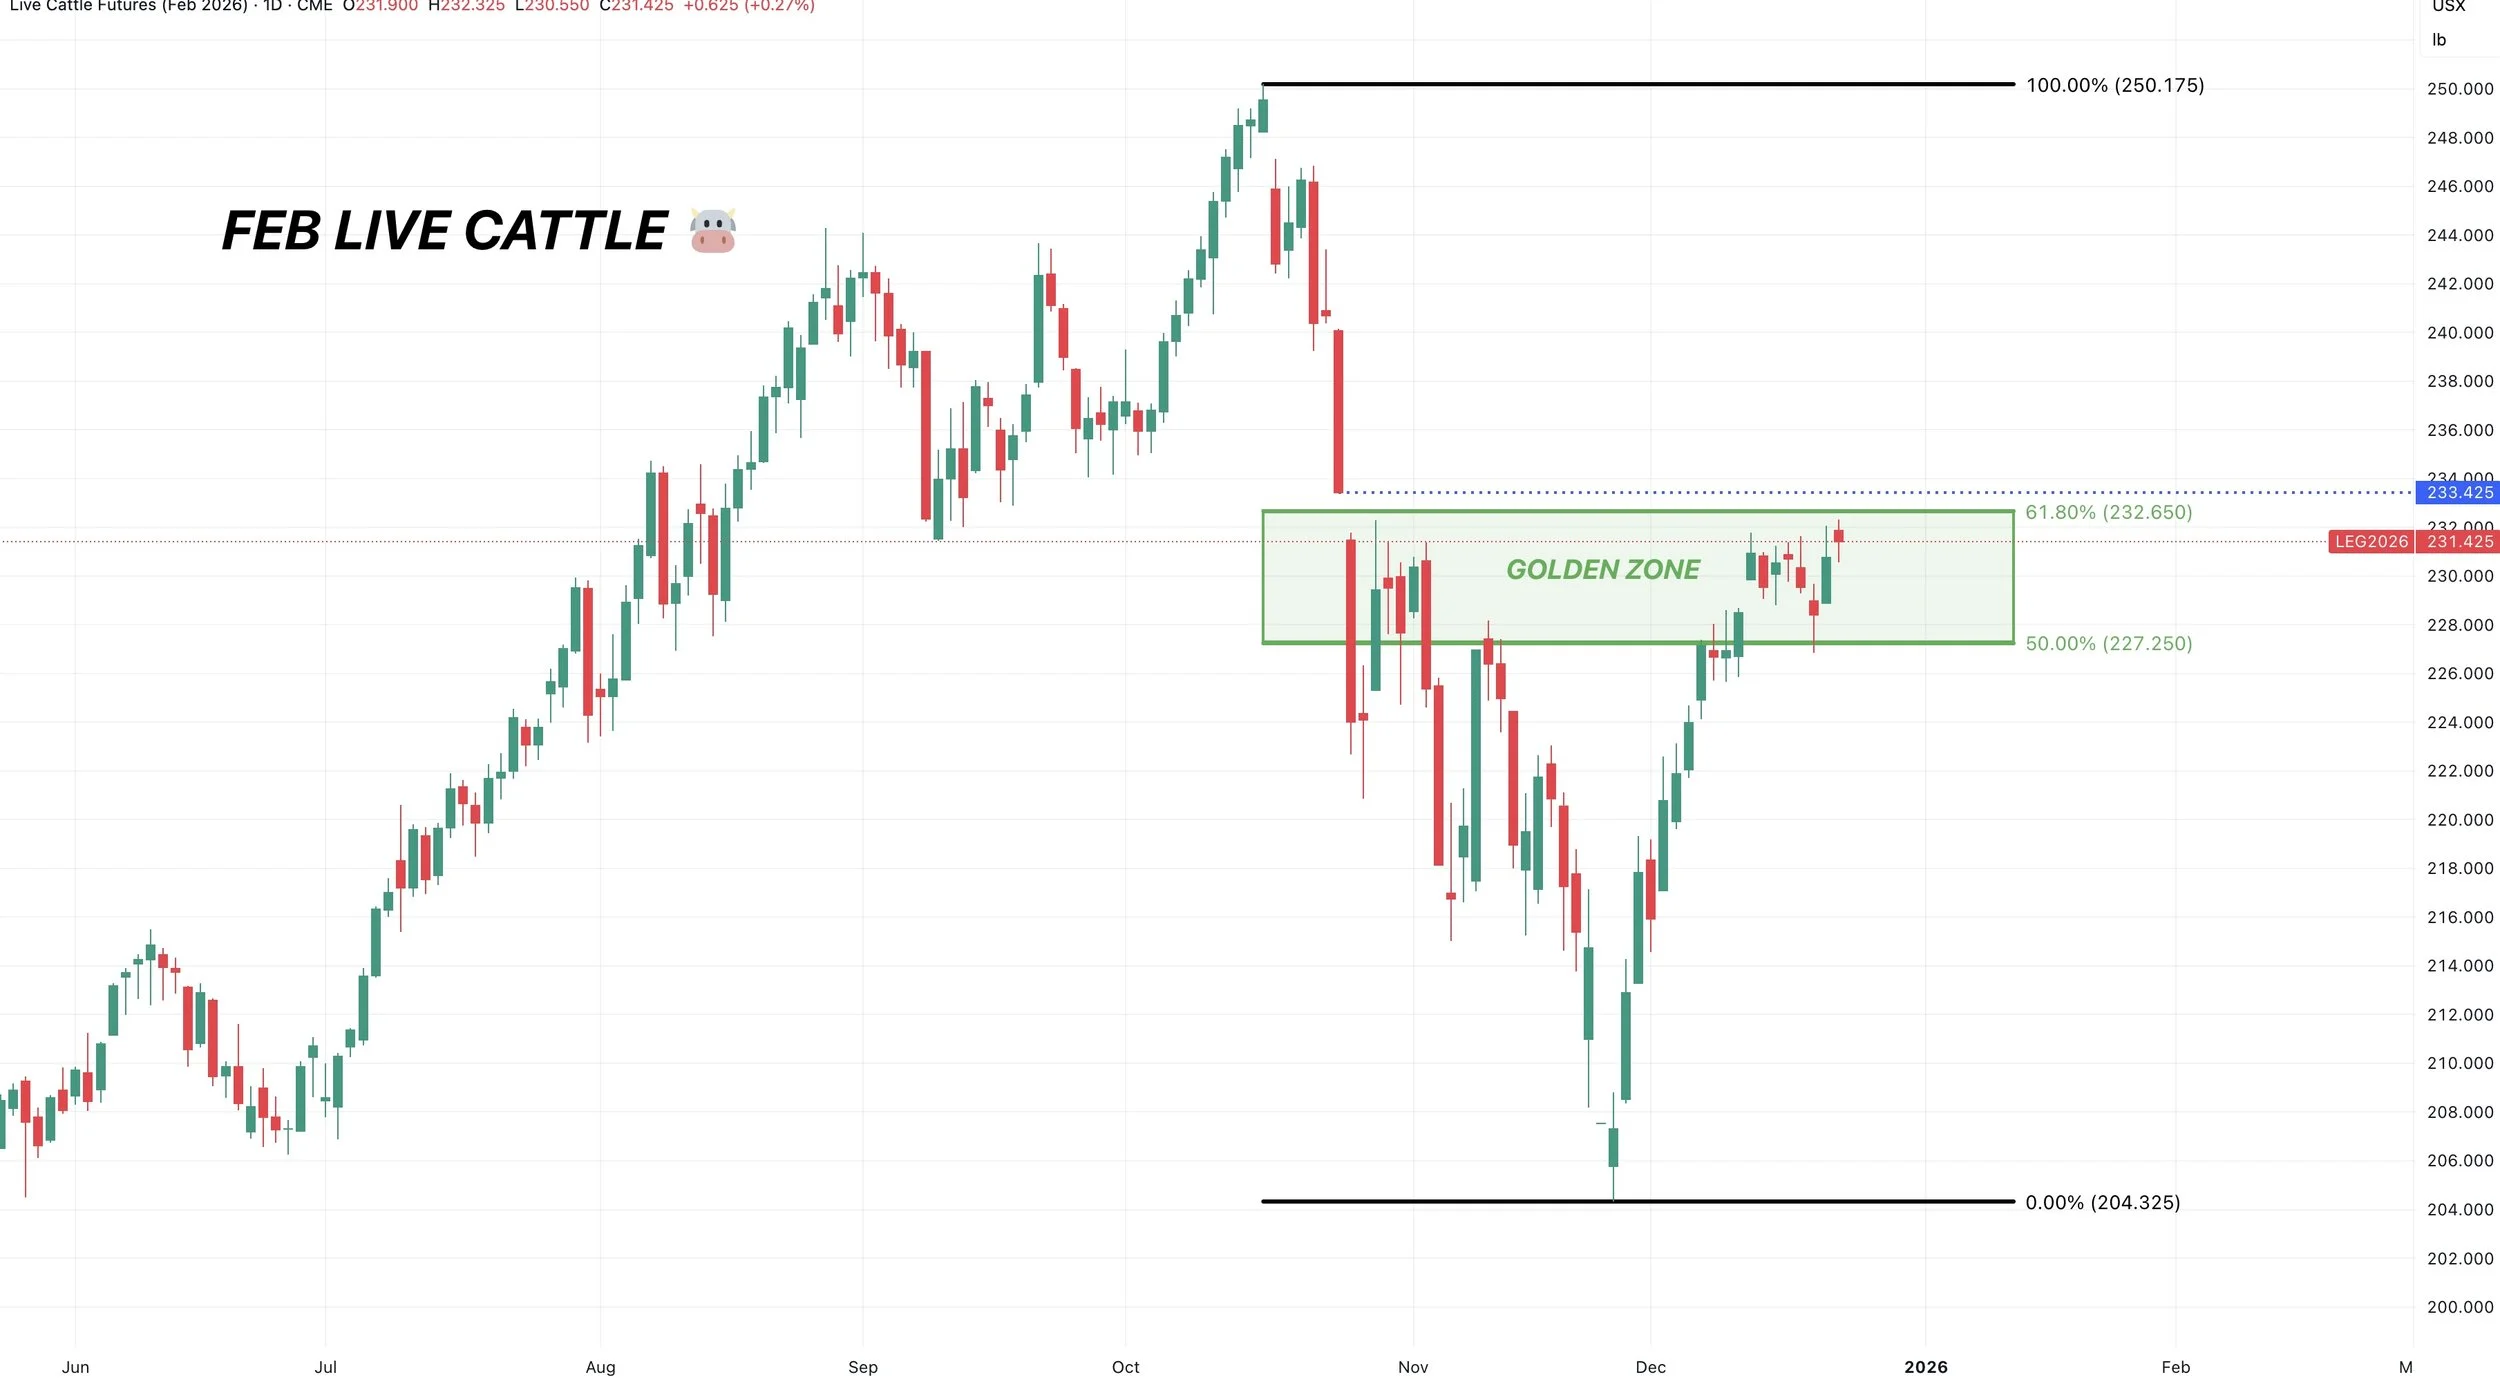
Feb Live
Nearly filled the gap as well.
Also nearly tapping that 61.8% level.
This is where the market often reverts back to before deciding if this is a relief bounce or something bigger.
Past Sell or Protection Signals
Dec 11th: 🐮
Cattle sell signal & hedge alert.
Dec 5th: 🐮
Cattle sell signal & hedge alert.
Nov 17th: 🌱
Soybean sell signal & hedge alert.
Nov 13th: 🌽 🌱
Managing risk in corn & beans ahead of USDA report.
Oct 28th: 🌽
Corn sell signal & hedge alert.
Oct 27th: 🌱
Soybean sell signal & hedge alert.
Oct 13th: 🐮
Cattle sell signal & hedge alert.
Aug 22nd: 🌱
Soybean sell signal & hedge alert.
July 31st: 🐮
Cattle sell signal & hedge alert.
July 10th: 🐮
Cattle sell signal & hedge alert.
CLICK HERE TO VIEW
June 5th: 🐮
Cattle sell signal & hedge alert.
June 2nd: 🌾
MPLS wheat sell signal.
April 10th: 🌽
Old crop corn sell signal.
March 19th: 🐮
Cattle hedge & sell signal.
Feb 18th: 🌽 🌾
Old crop KC wheat & old crop corn signal.
Jan 23rd: 🌽 🌱
Corn & beans old crop sell signal.
CLICK HERE TO VIEW
Jan 15th: 🌽 🌱
Corn & beans hedge alert/sell signal.
Jan 2nd: 🐮
Cattle hedge alert at new all-time highs & target.
Dec 11th: 🌽
Corn sell signal at $4.51 200-day MA
CLICK HERE TO VIEW
Oct 2nd: 🌾
Wheat sell signal at $6.12 target
Sep 30th: 🌽
Corn protection signal at $4.23-26
Sep 27th: 🌱
Soybean sell & protection signal at $10.65
Sep 13th: 🌾
Wheat sell signal at $5.98
May 22nd: 🌾
Wheat sell signal when wheat traded +$7.00
Want to Talk?
Our phones are open 24/7 for you guys if you ever need anything or want to discuss your operation.
Hedge Account
Interested in a hedge account? Use the link below to set up an account or shoot Jeremey a call at (605)295-3100.