
PRE-USDA BREAKDOWN
MARKET UPDATE
You can scroll to read the usual update as well. As the written version is the exact same as the video.
Timestamps for video:
Overview: 0:00min
Corn: 2:15min
Beans: 10:20min
Wheat: 14:30min
Cattle: 17:00min
Want to talk about your situation?
(605)250-3863
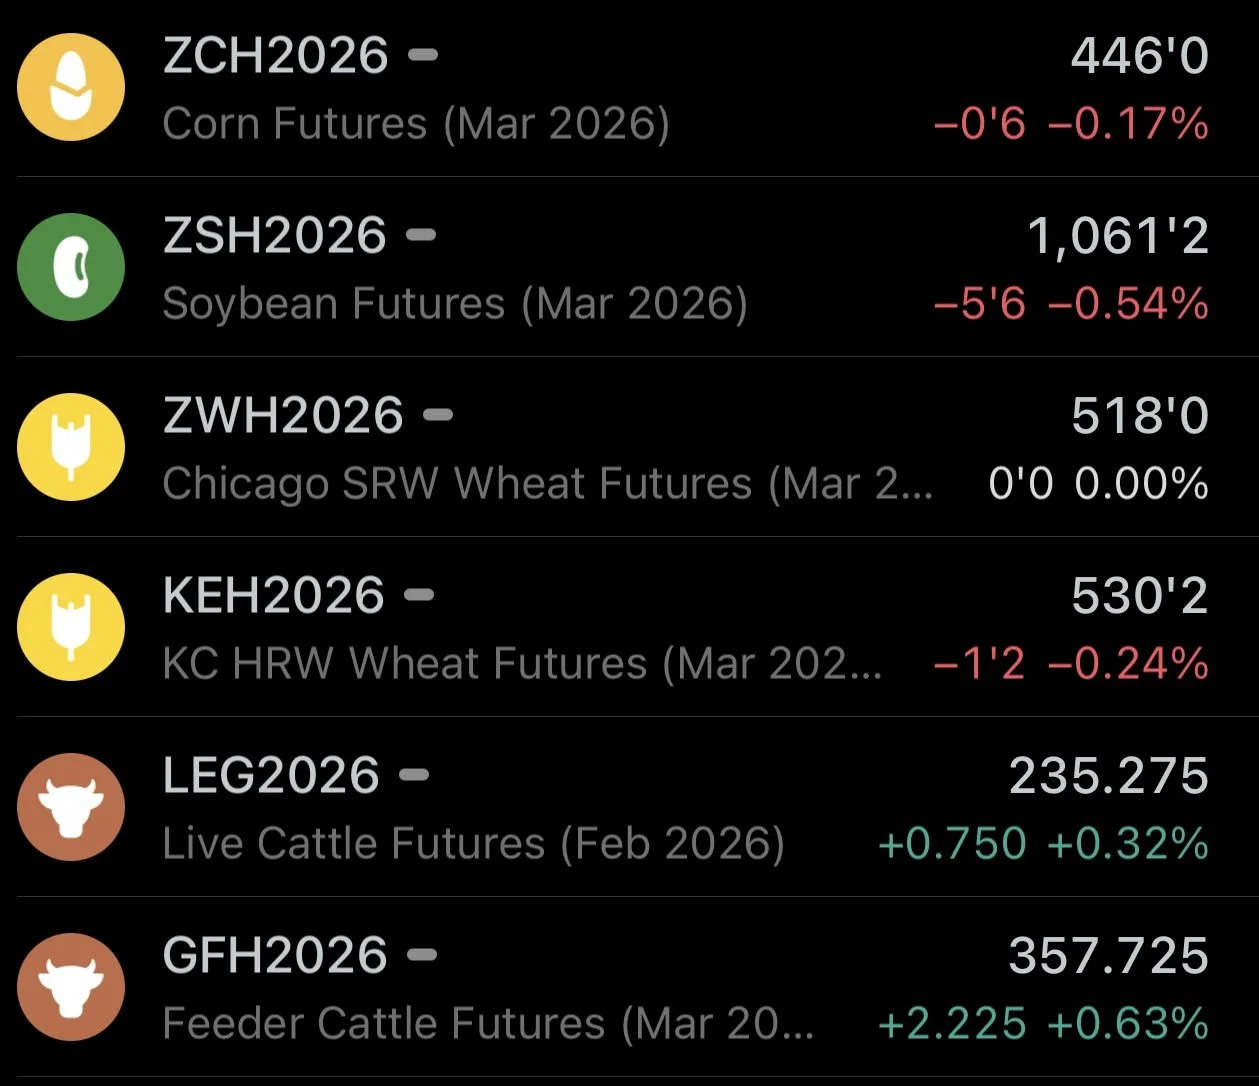
Futures Prices Close
Overview
Today's update is going to be a longer one.
As we go over the USDA report, fundamentals, charts, as well as some pre-report trade ideas to manage your risk.
Grains were mostly lower while cattle was slightly higher today ahead of Monday's big USDA report.
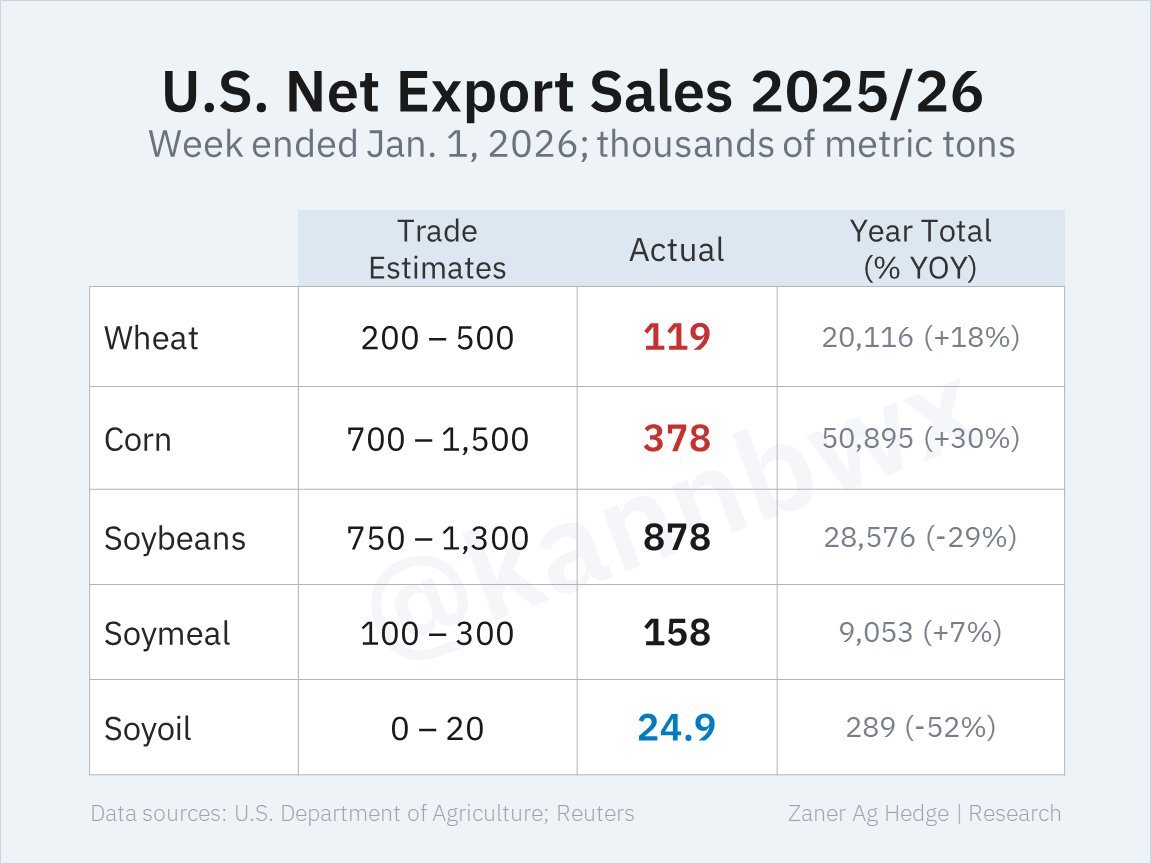
The only real piece of news today was export sales.
Corn and wheat came in disappointing, while soybeans were above average.
It was actually a marketing year low for corn export sales.
But this isn’t a concern whatsoever.
Why would exports be great for the week between Christmas and New Years?
Chart from Karen Braun
USDA Preview
Let's jump right into the USDA report.
This report will include production and demand estimates. Along with the quarterly stocks and wheat seedings.
This report is usually one of the bigger ones of the year. But given the government shutdown, this report could mean even more than usual.
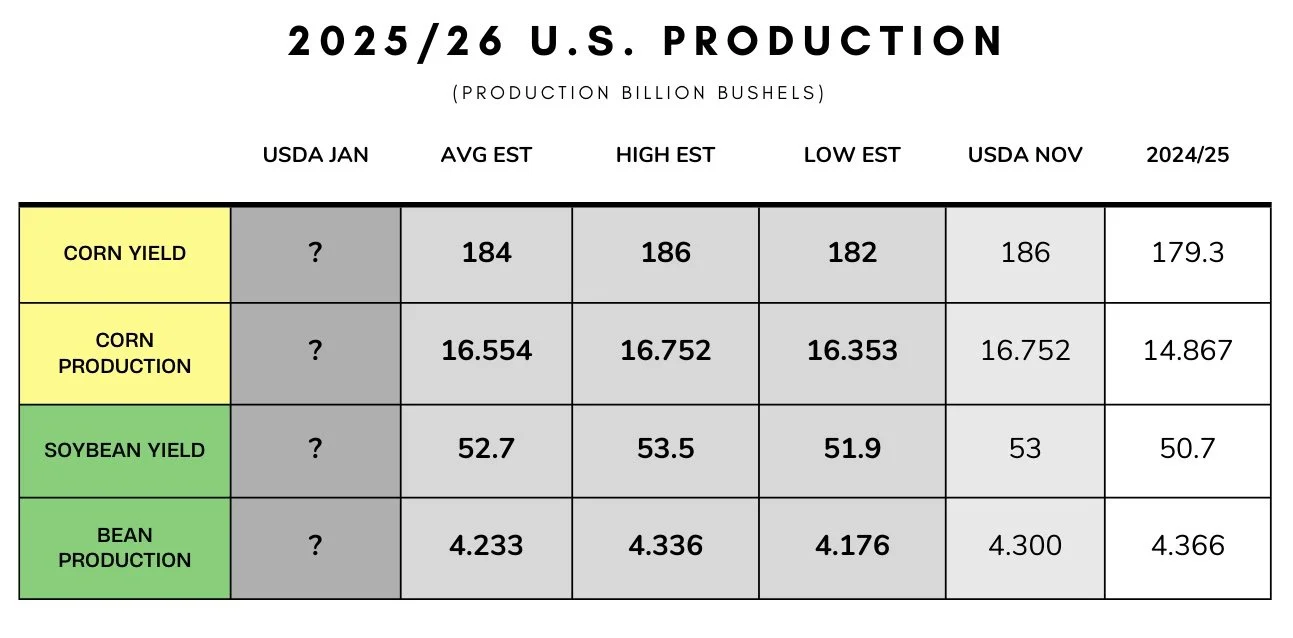
The Yield Estimates:
Corn
Avg: 184
High: 186
Low: 182
Last USDA: 186
Beans
Avg: 52.7
High: 53.5
Low: 51.9
Last USDA: 53
The trade is expecting a smaller corn yield, while expecting a slightly smaller soybean yield.
The Carryout Estimates:
Corn (billion bu)
Avg: 1.986
High: 2.235
Low: 1.772
Last USDA: 2.029
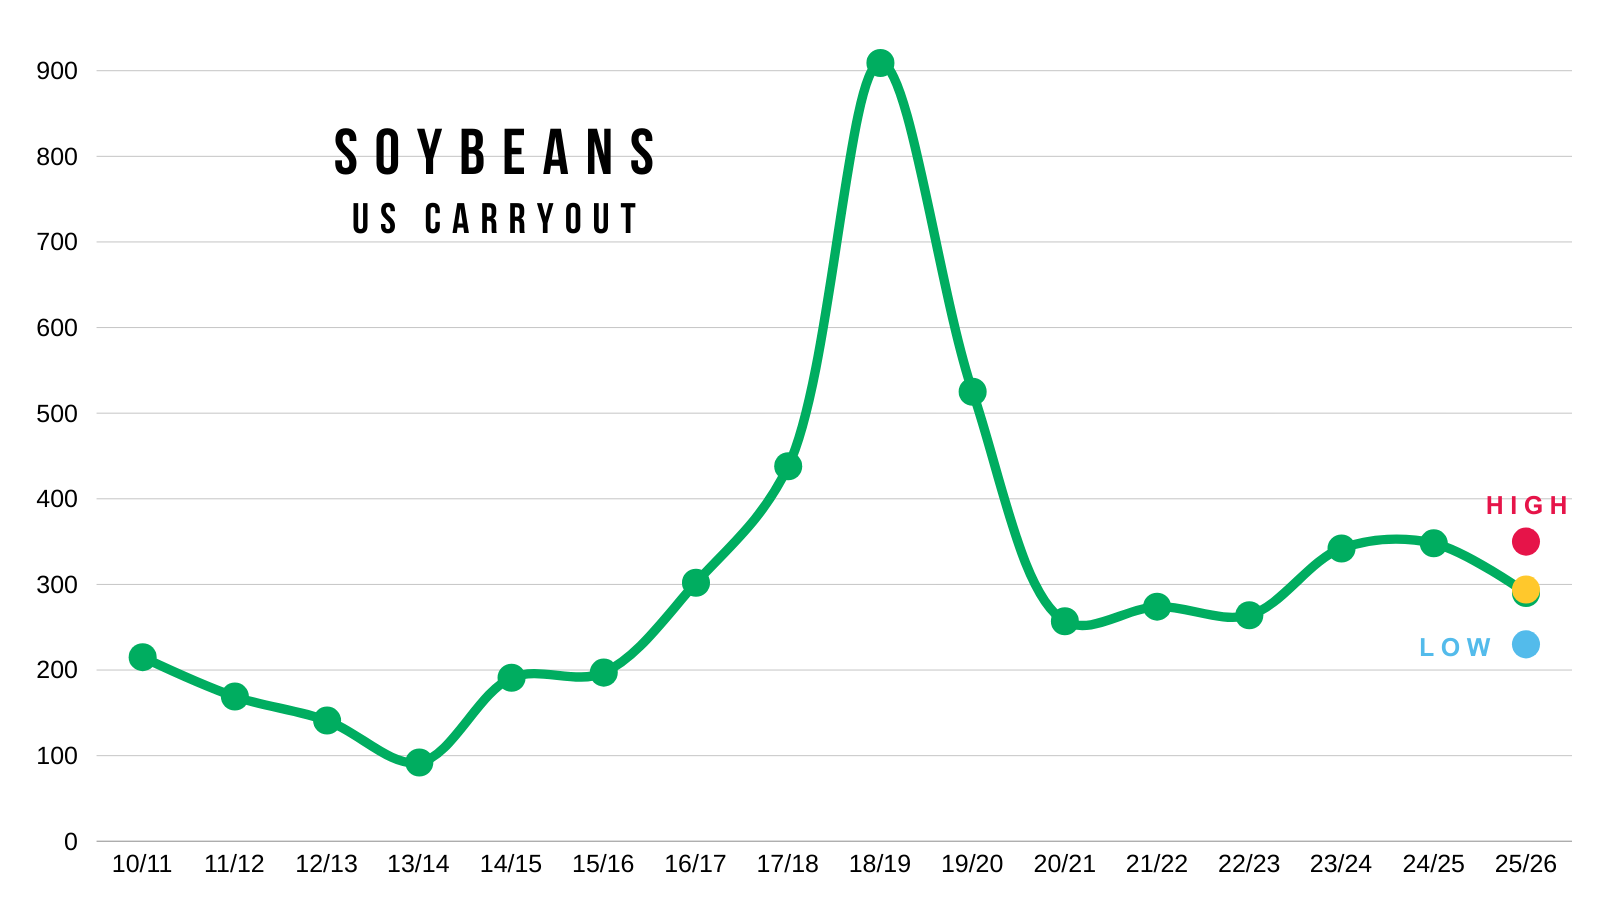
Beans (million bu)
Avg: 294
High: 350
Low: 230
Last USDA: 290
Wheat (million bu)
Avg: 896
High: 926
Low: 851
Last USDA: 901
The trade is expecting a smaller corn and wheat carryout, with a fractionally higher soybean carryout.

Those are some pretty wide trade ranges.
A 465 million bu range in corn.
A 120 million bu range in soybeans.
Just to put into perspective how big of ranges these are, here is the high, low, and average carryout estimates for corn and soybeans when compared to previous years.

The Wheat Seeding Estimates:
Wheat seedings are expected to decline across the board from the last USDA report.

Today's Main Takeaways
Corn
Fundamentals:
It's all about the USDA report.
We continue to find demand on the bottom of this range and a lid on the upper end of this range. As we've essentially been trading between $4.40 and $4.50 since October.
Hopefully this report can provide enough of a reason for us to break out of this range.
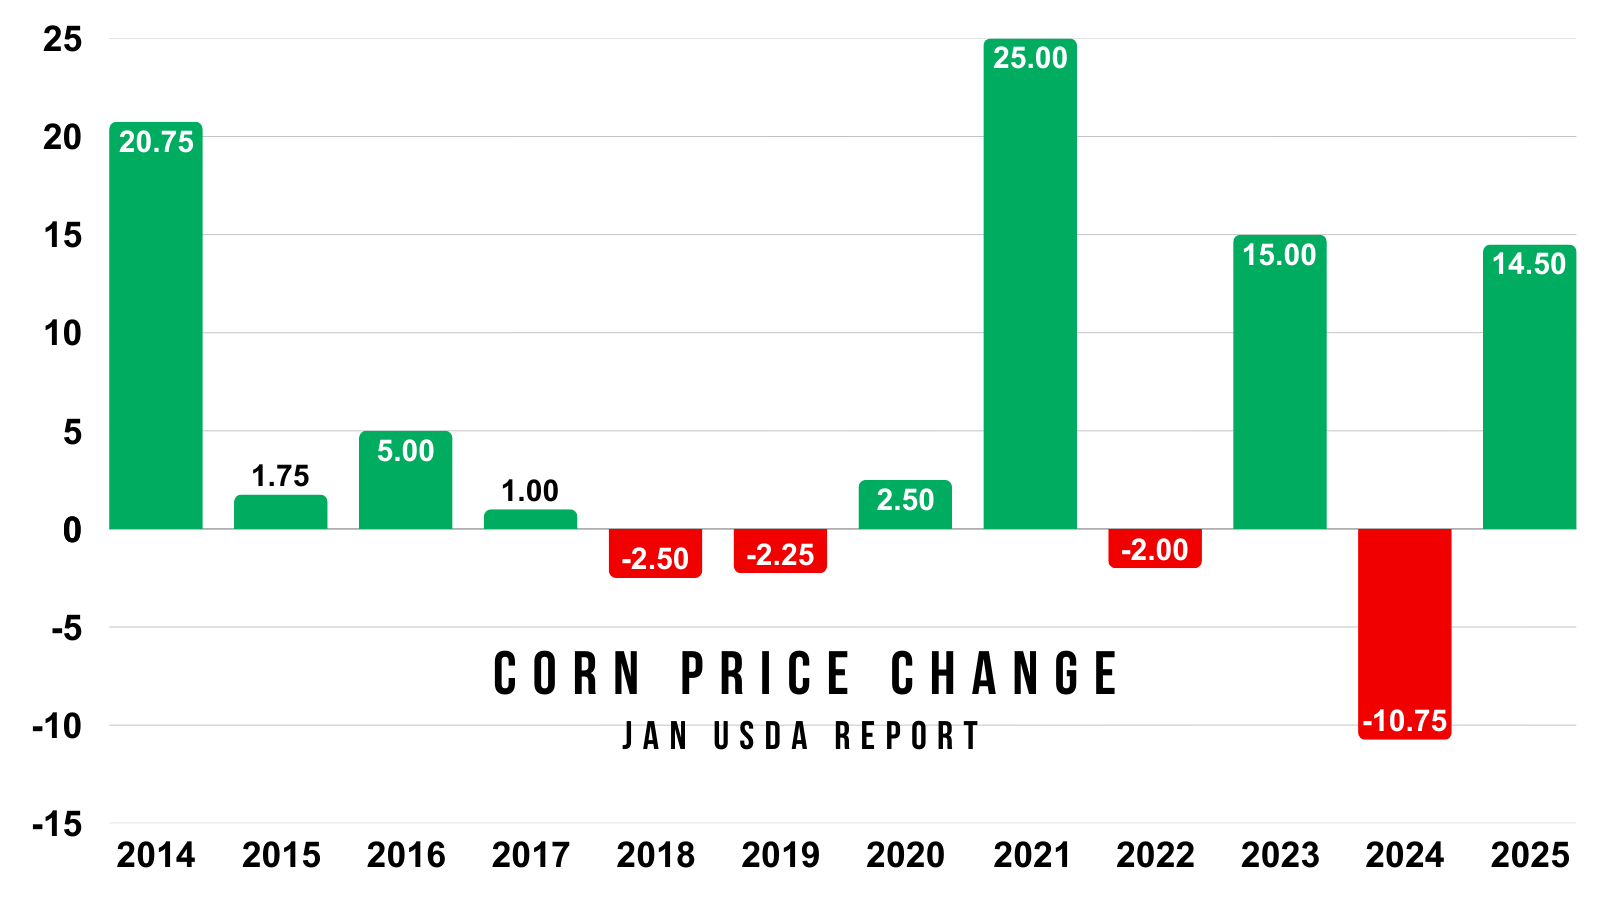
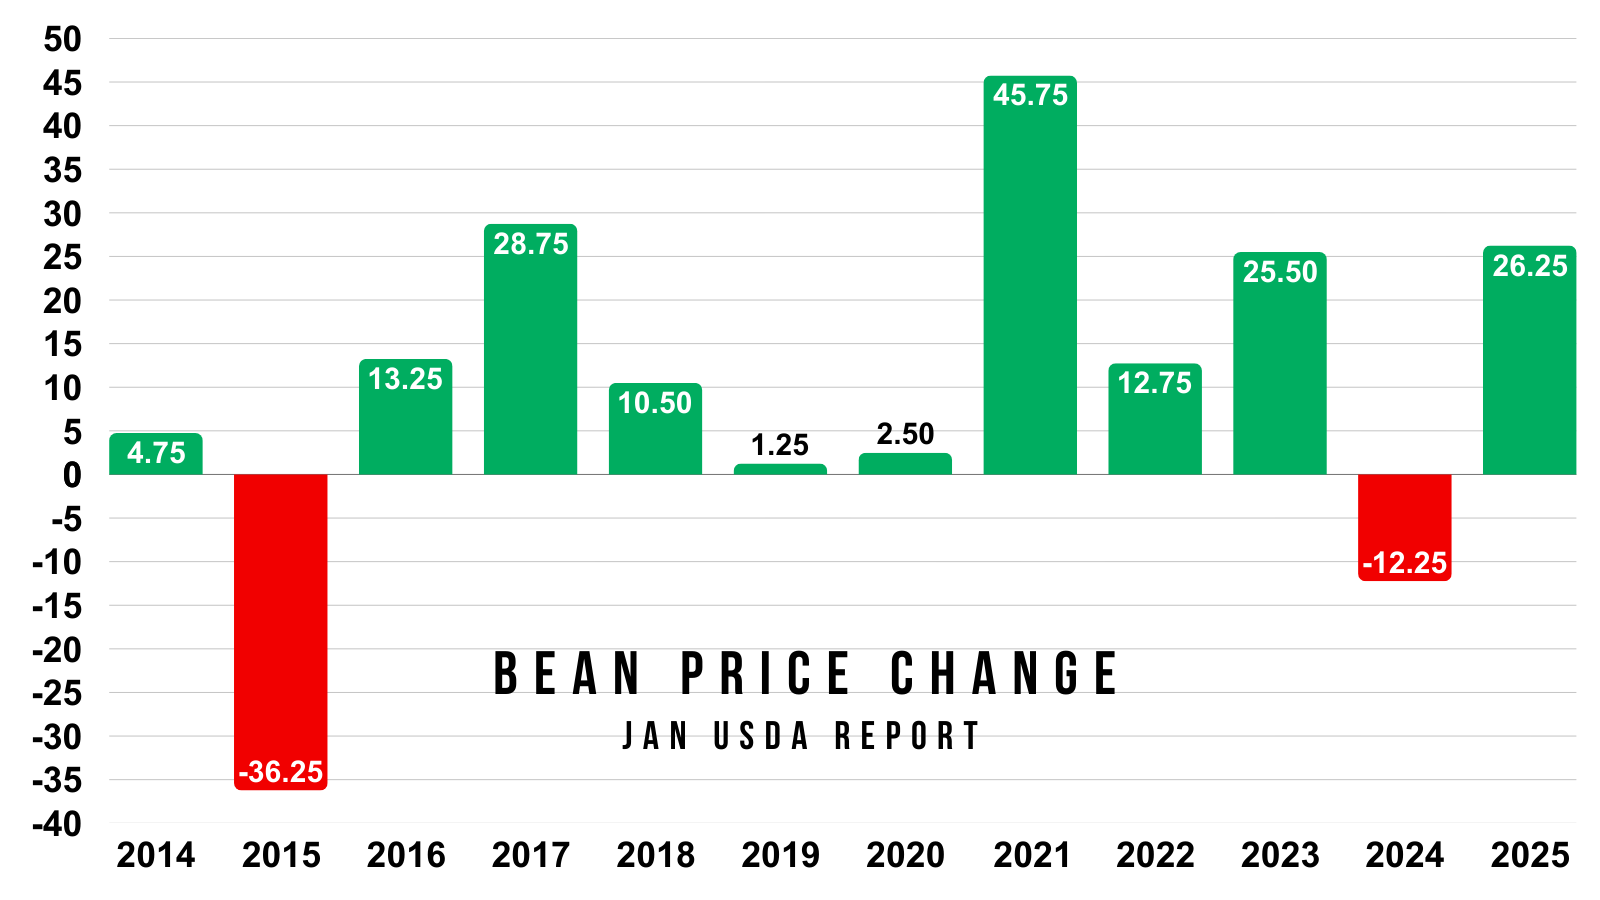
As for the report, like we talked about earlier this week, corn has traded higher the last 8 of 12 years on this report.
In those 4 years we traded lower, 3 of them provided losses of just 2 cents.
The only year we had a truly bearish reaction was 2024 where we dropped over a dime.
That doesn’t mean the report has to be overly bullish and we rally. But in the last decade, this report has not tended to be bearish.
On average we move +/- 8.5 cents.
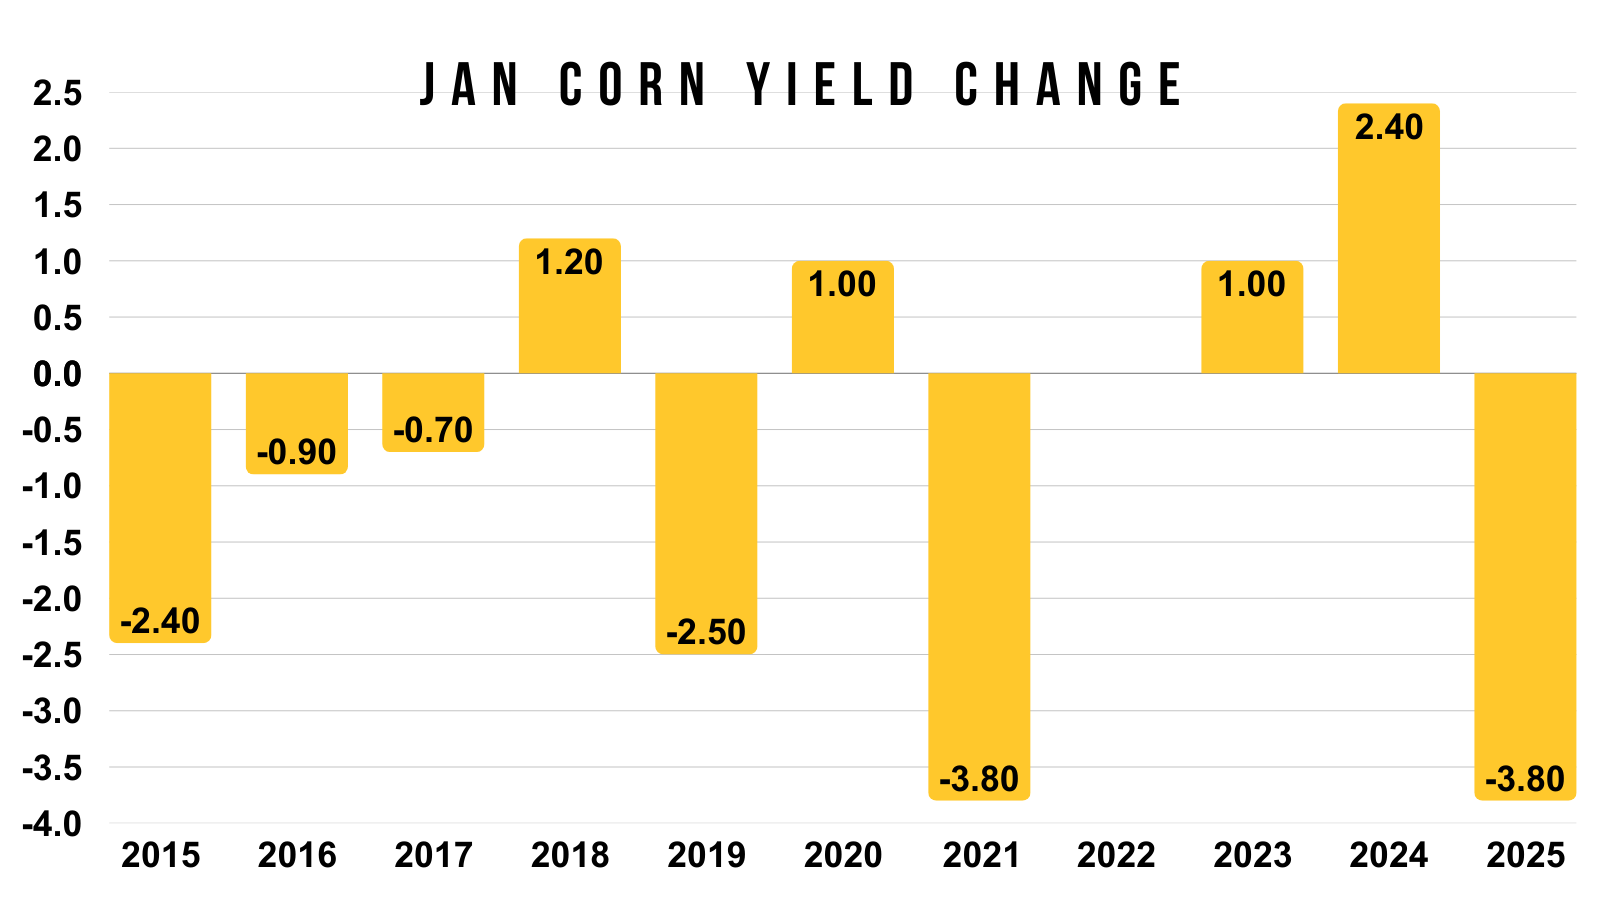
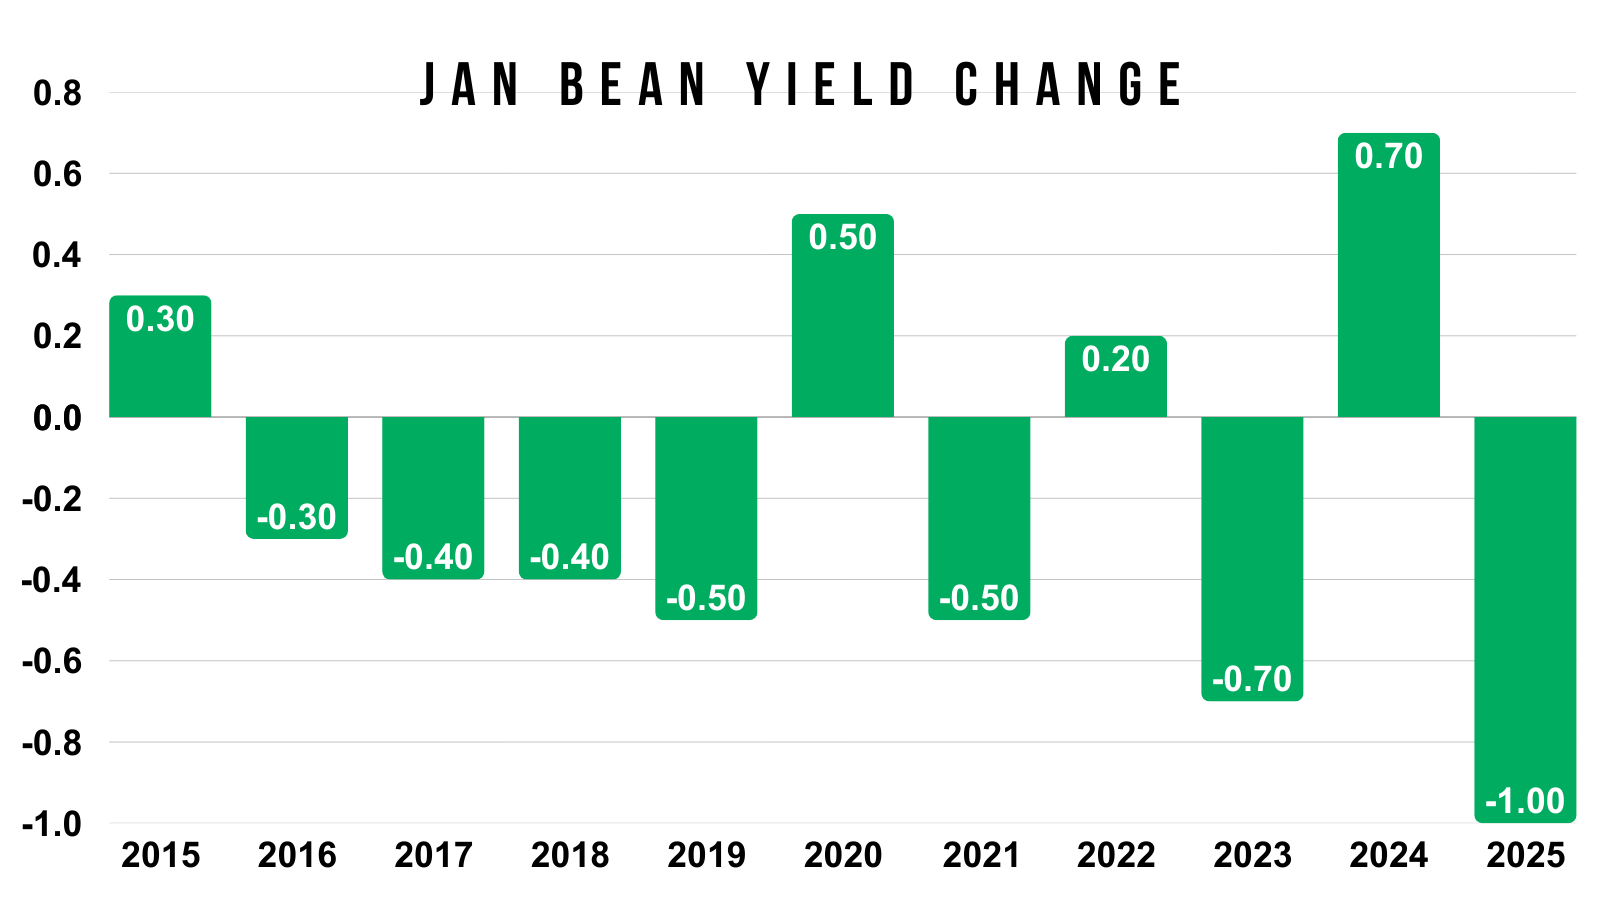
We showed this earlier this week as well, but this is the past yield changes for this report.
The biggest we've seen in the last decade was a 3.80 bpa cut twice.
If we saw that again, it would put us right above a 182 yield.
But to get a number closer to 180 or lower, it would take one of the largest cuts we've seen.
Possible, but doesn’t seem that probable simply given the past data.
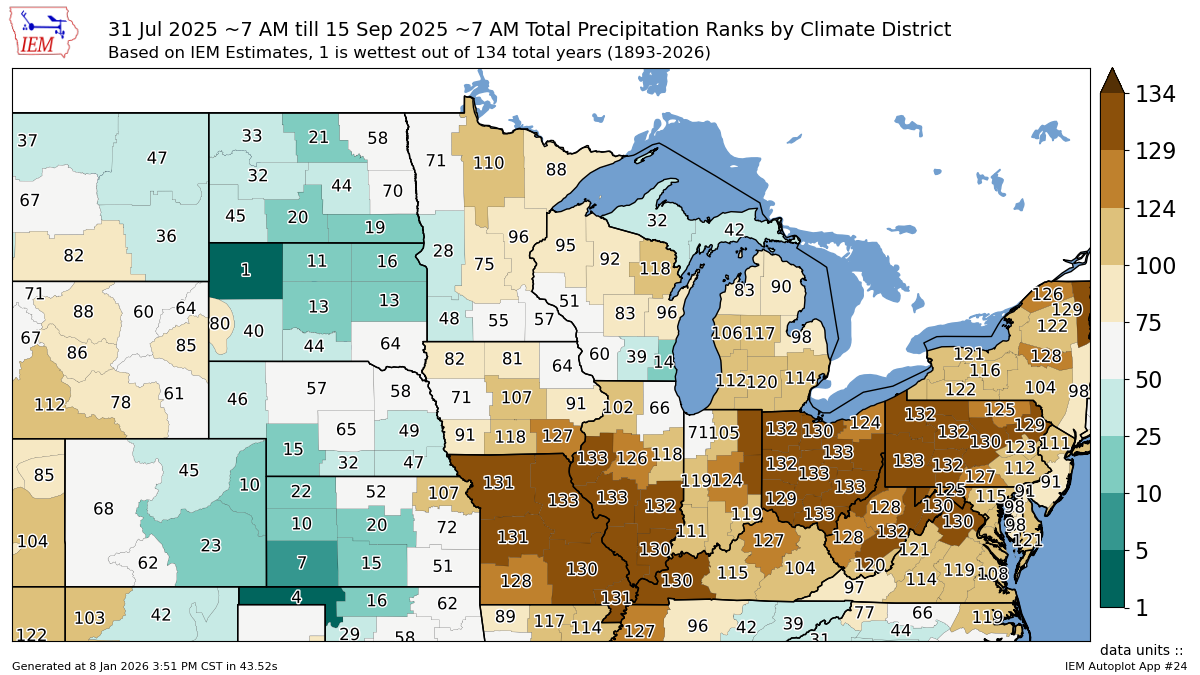
We did see an incredibly dry finish to end the year.
We saw last year that this does indeed make an impact.
Throw on the fact that we nearly had 100 million acres of corn that includes fringe acres, and it does make you contemplate just how over estimated yield is.
July 31 - Sep 15th Precip Ranking
The two biggest numbers are going to be yield and feed demand.
How much will they cut yield, and if they do how much of that will be offset by cuts to feed demand?
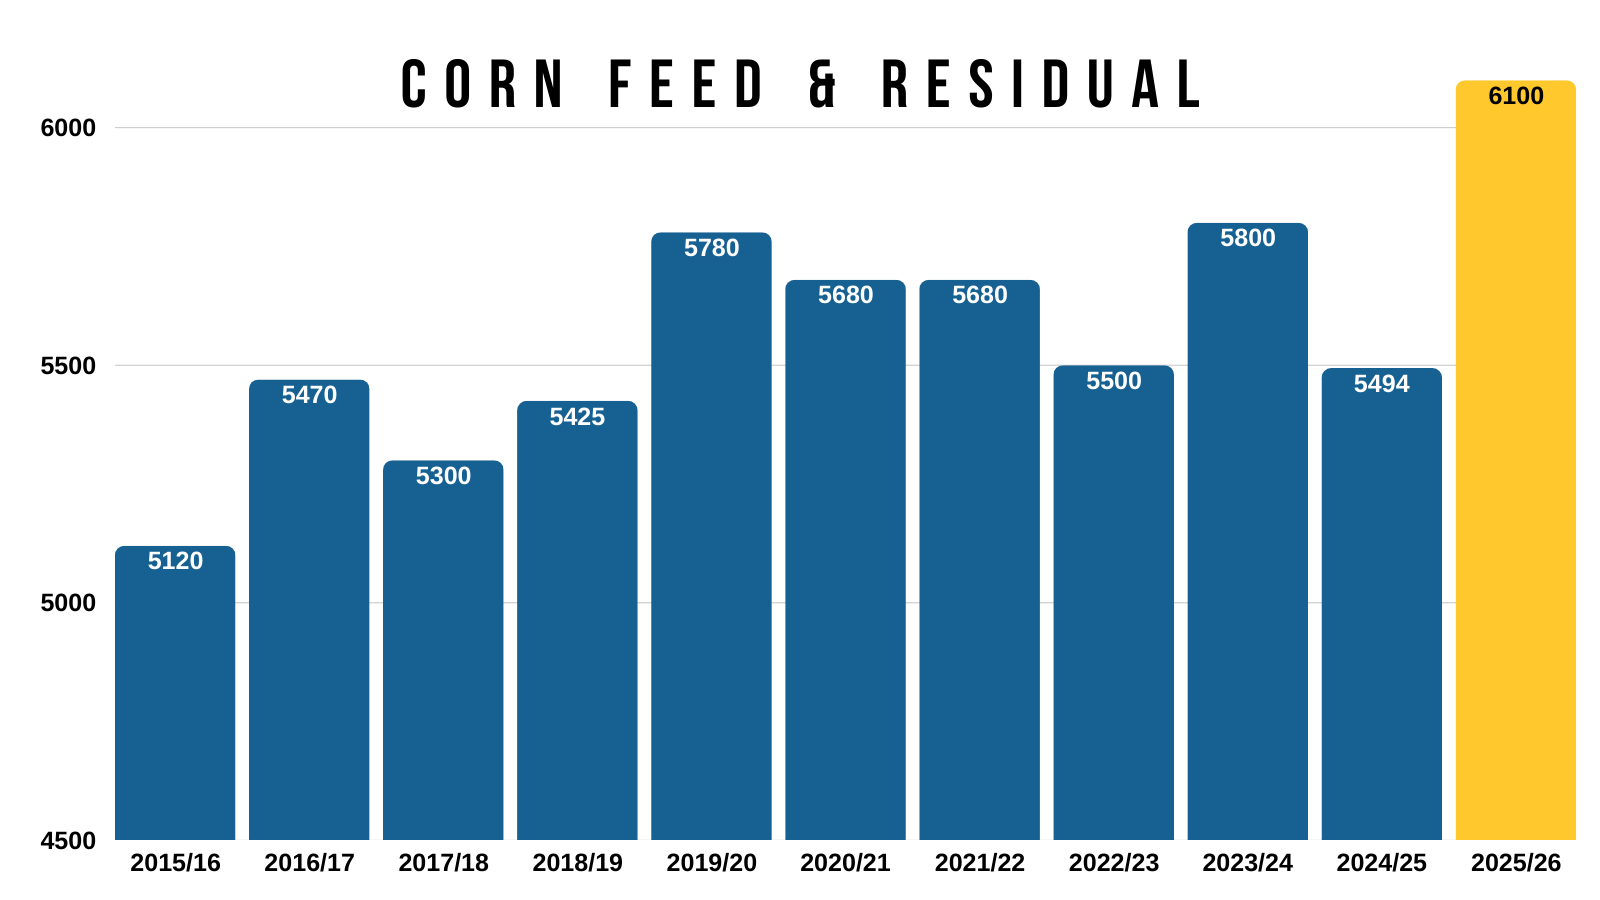
The issue is that most would argue our feed demand is too high.
It's 600 million higher than last year.
Many argue that the number shouldn’t even be higher than last year, as they don’t think we have the animal numbers to support it.
Why are people arguing this?
Well I mean cattle is at an all-time high because cattle supply is tight, so why should feed demand be this crazy record?
This gives the USDA some wiggle room to "balance the balance sheet".
Let's dive into the balance sheet.
The yield estimate is 184 vs last month's 186.
Before touching the demand numbers.. this lowers carryout from 2.03 billion down to 1.85 billion.
That is a 180 million bushel decrease on the supply side.
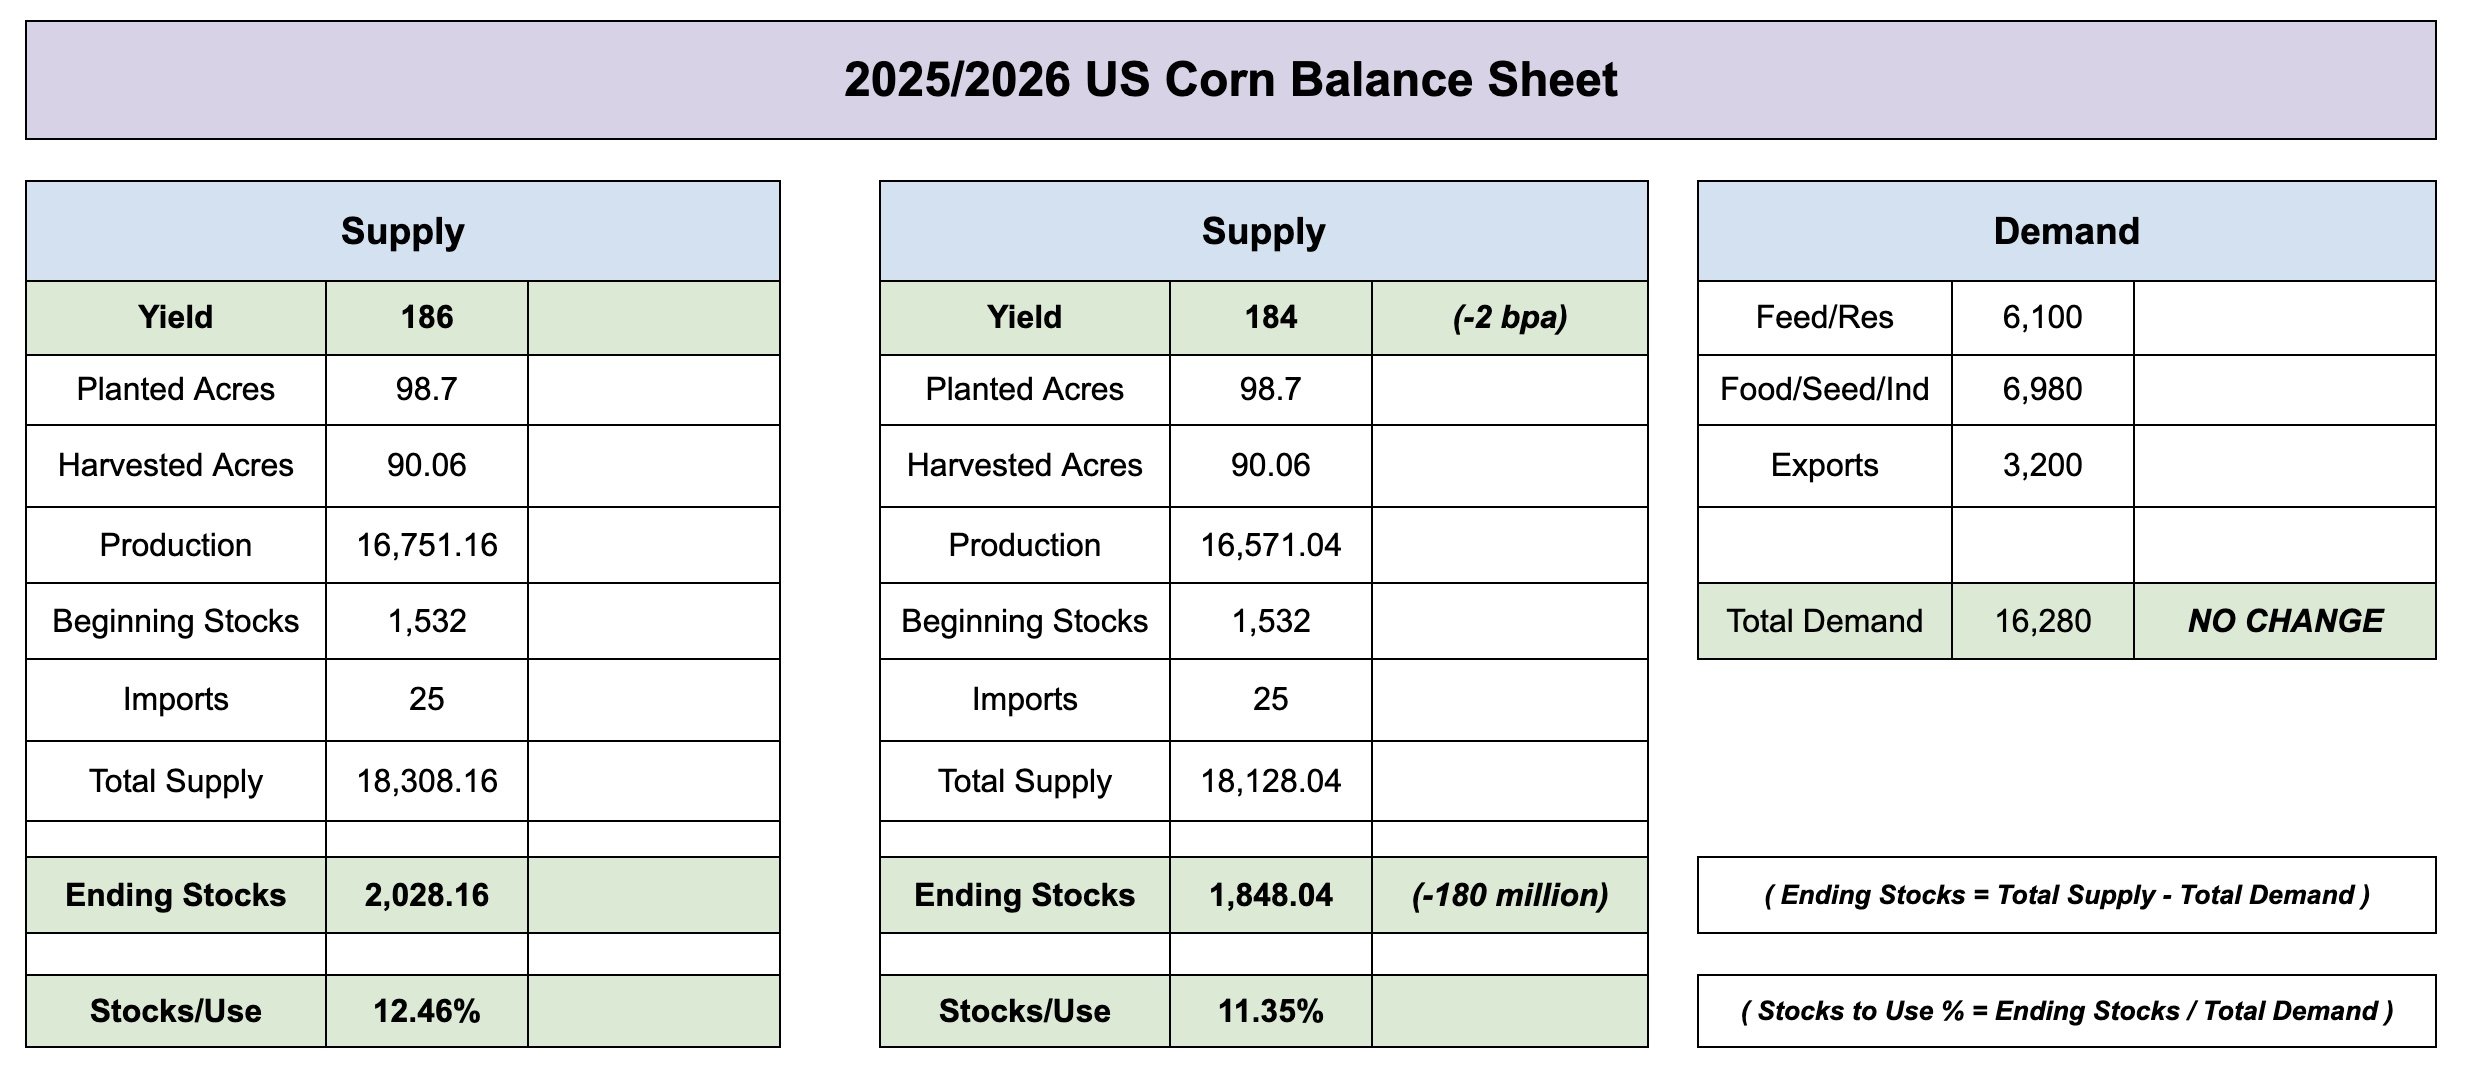
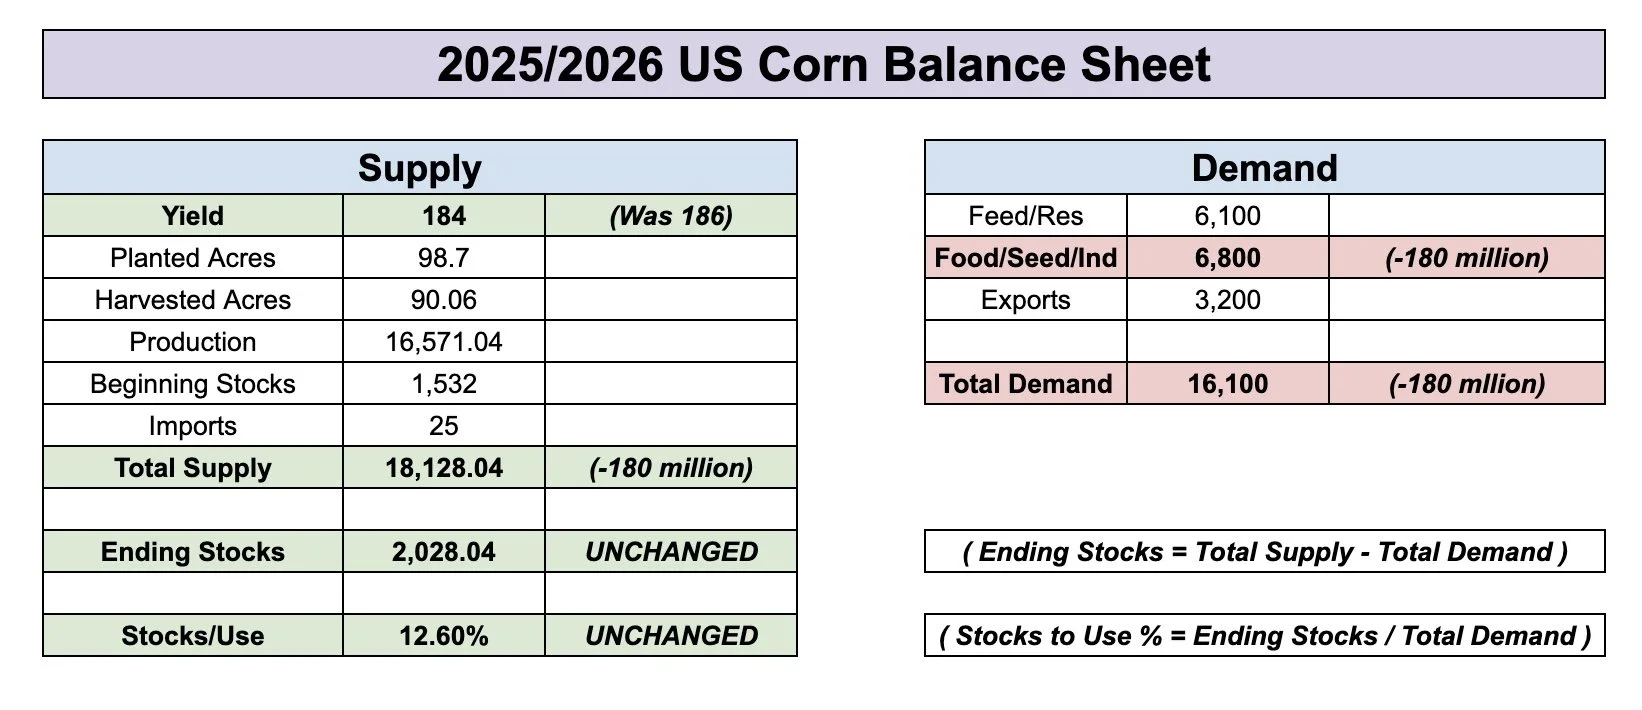
Which means if the USDA cut feed demand by 180 million while cutting yield down to 184, the balance sheet could stay the exact same.
With a 2 billion bu carryout.
So if yield comes in at 184, it wouldn’t be surprising to see the USDA just offset most of it with a cut to feed demand.
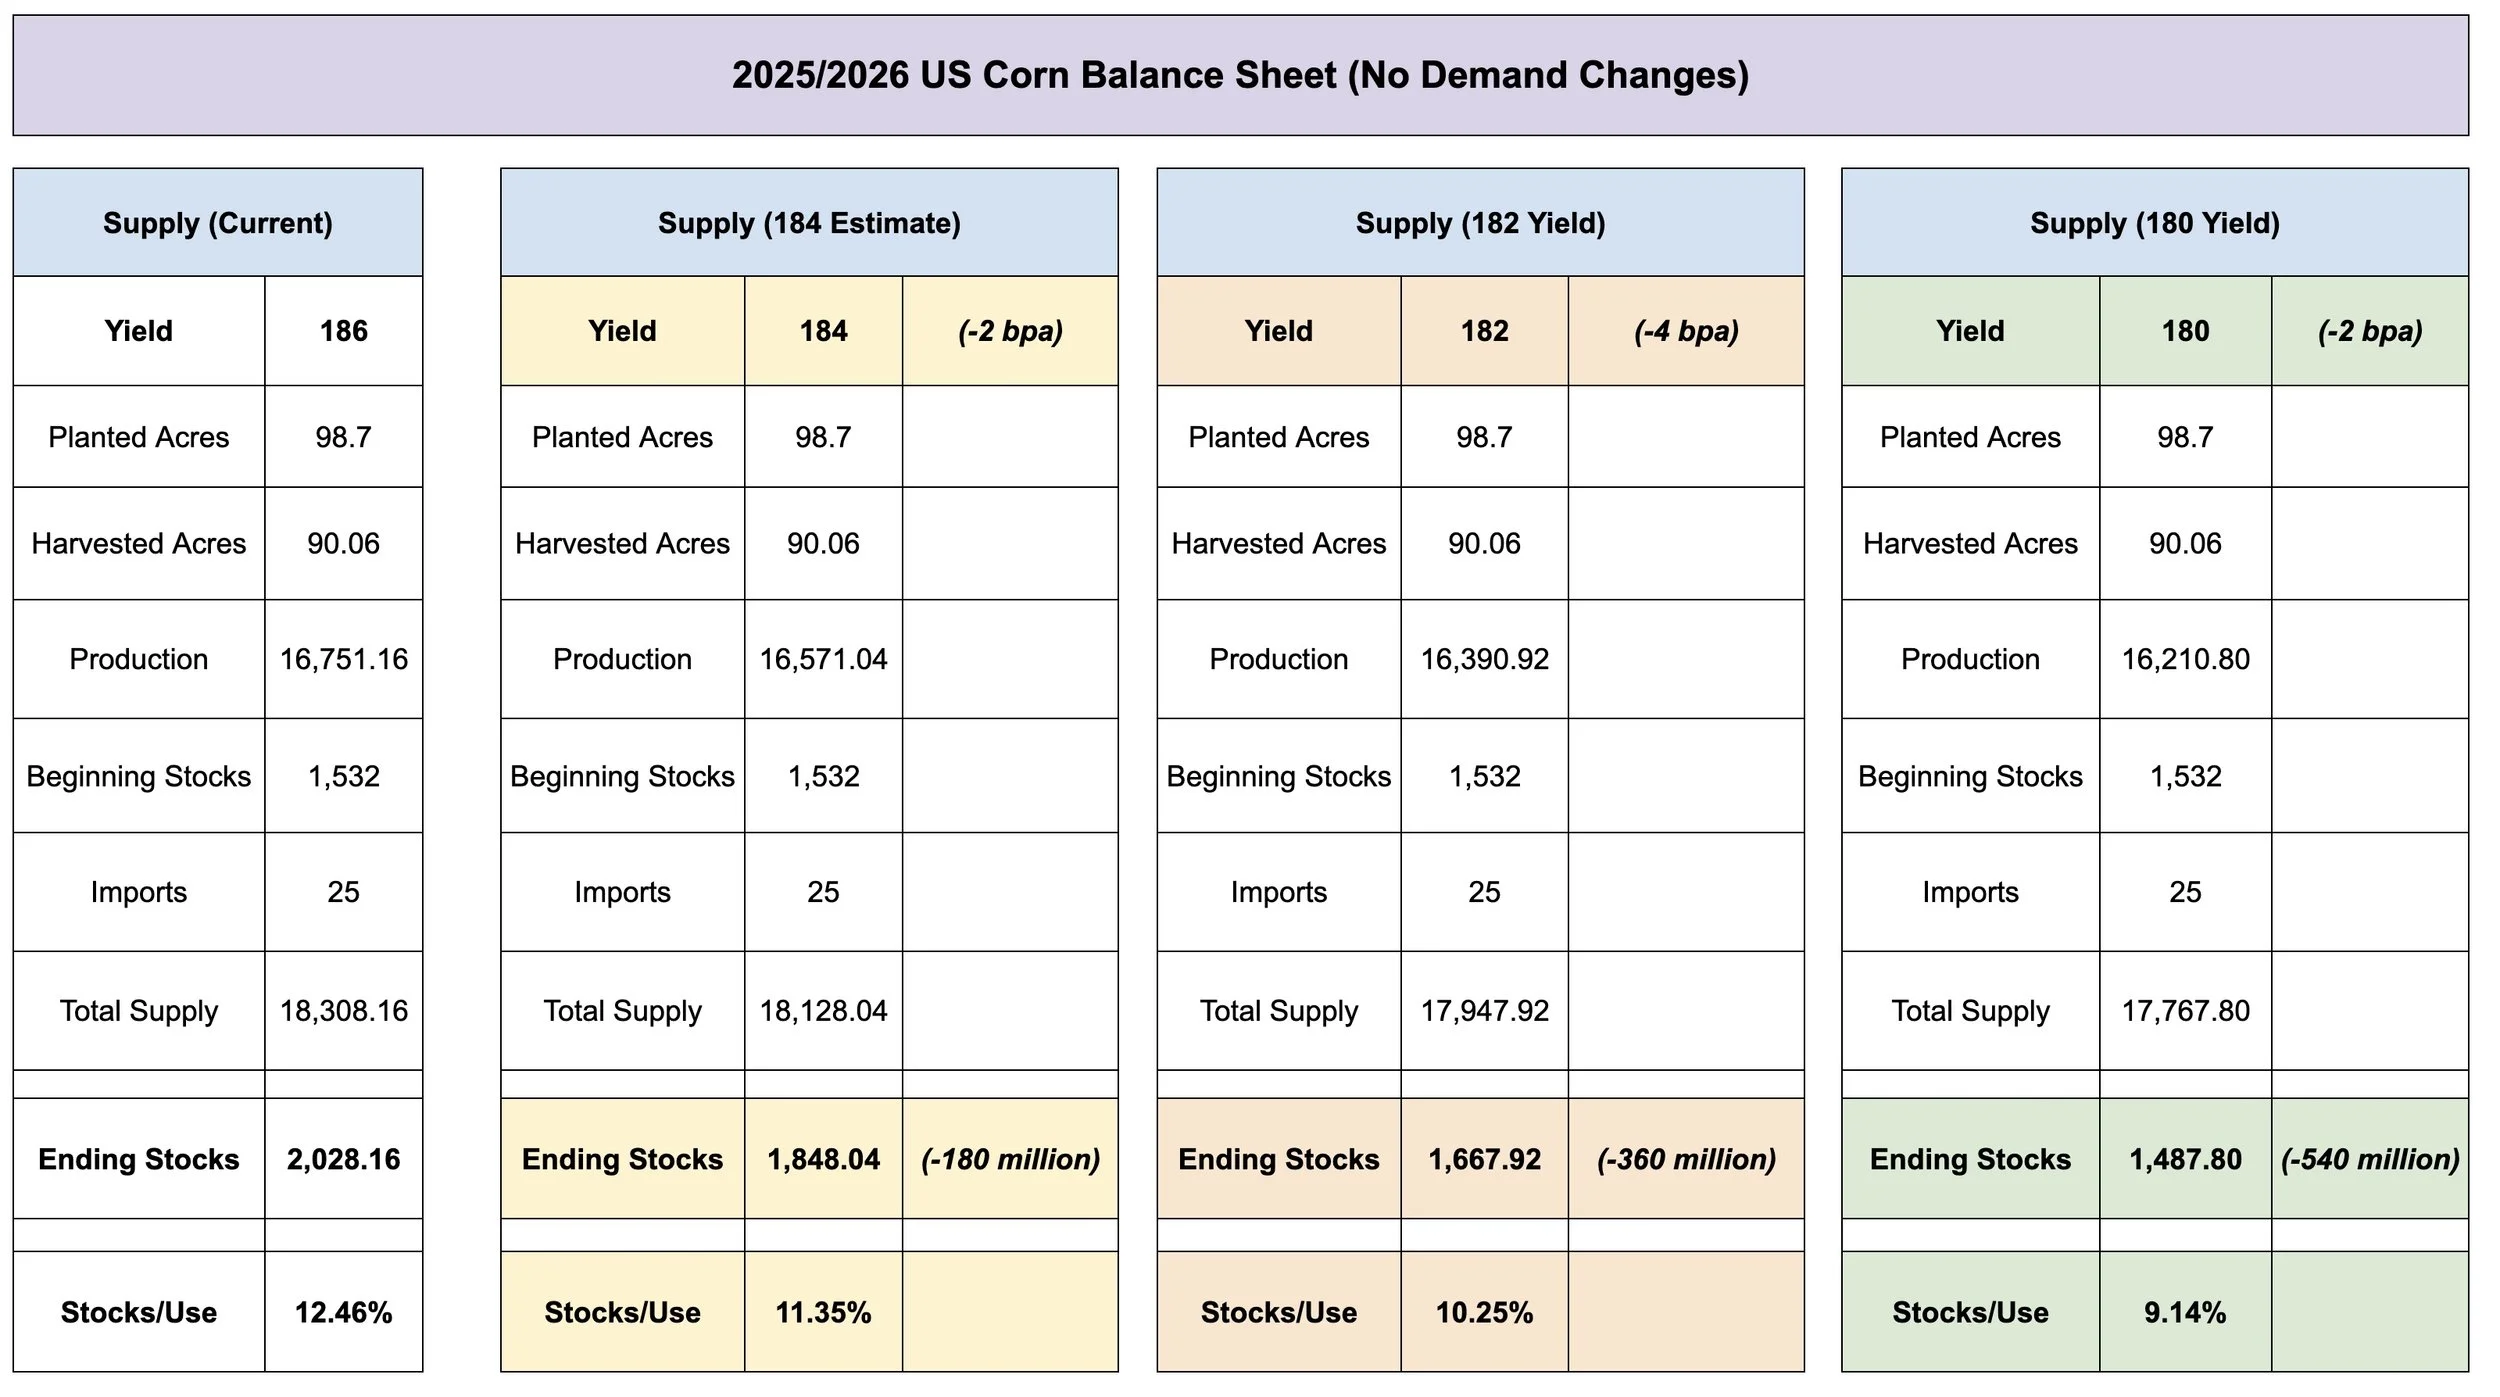
Every 1 bushel drop on yield, drops our supply by -90 milllion bushels.
So if yield came down to 182, it would drop our supply by -360 million.
(4 x 90 = 360)
If yield was 180, it would drop supply by -540 billion.
(6 x 90 = 540)
So to get a truly bullish reaction, it makes sense that we'd need to see yield come in at 182 or lower.
As the USDA would have to drop demand by 360 to 540 million bushels to offset that supply loss.
Which is a lot harder than offsetting 180 million bushels.
Here is how yield cuts affect the supply side of the balance sheet.
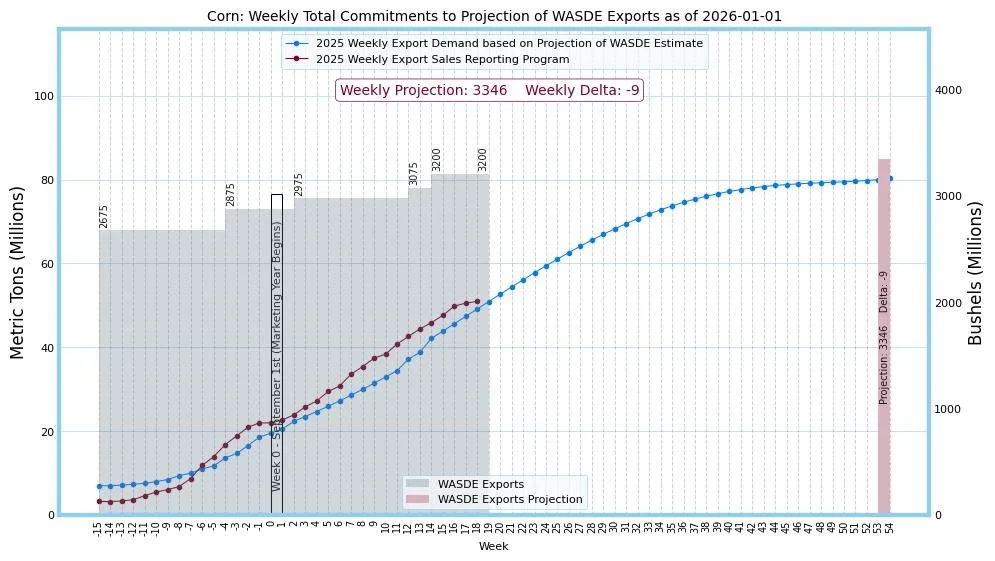
Then we of course have export and ethanol demand as well that will play a role.
I have no clue how much the USDA will touch feed demand by.
Unlike exports and ethanol demand, where we have a hard set of data to go off of. We don’t have that with feed and residual.
For reference, here is a chart from Robert McClure that shows the current pace of corn export sales vs the USDA's estimates.
We are on track to exceed those expectations.
The reaction to the USDA report could be friendly.
But it is still hard to paint a scenario where we get this extremely tight balance sheet moving forward.
Unless of course the USDA throws a curveball and drastically lowers yield down to 180 or lower.
Then yes this market would have a real story.
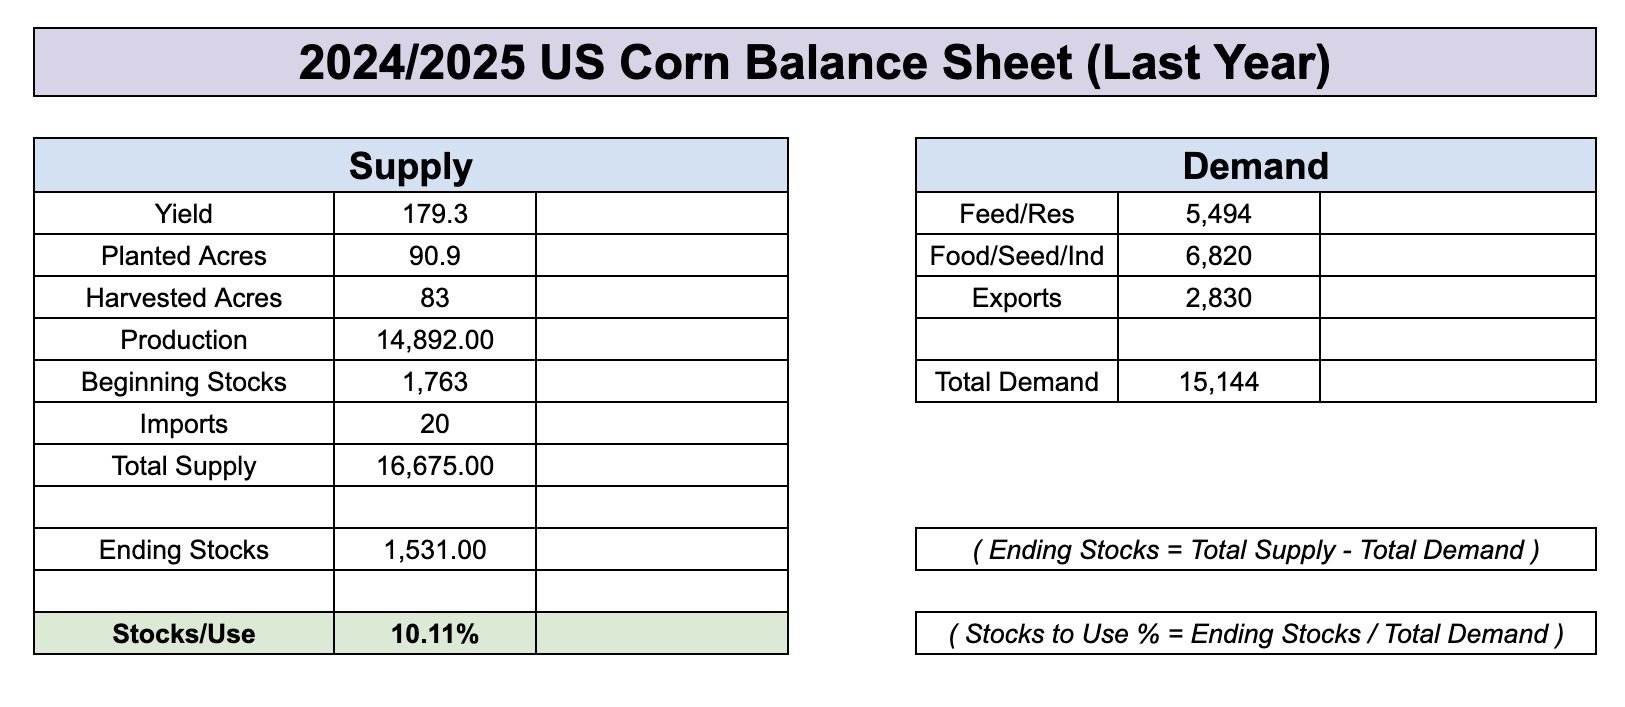
But for reference, if yield came in at 182 and we left demand unchanged.
It would drop the stocks to use down to 10.25%.
Which is in the realm of "bullish balance sheets". But that's not even as tight as last year's 10.10% stocks to use.
And the USDA won’t leave demand unchanged.
Meaning it would take less than a 182 yield to get a "bullish" balance sheet.
182 Yield - No Demand Change: 10.25% S/U
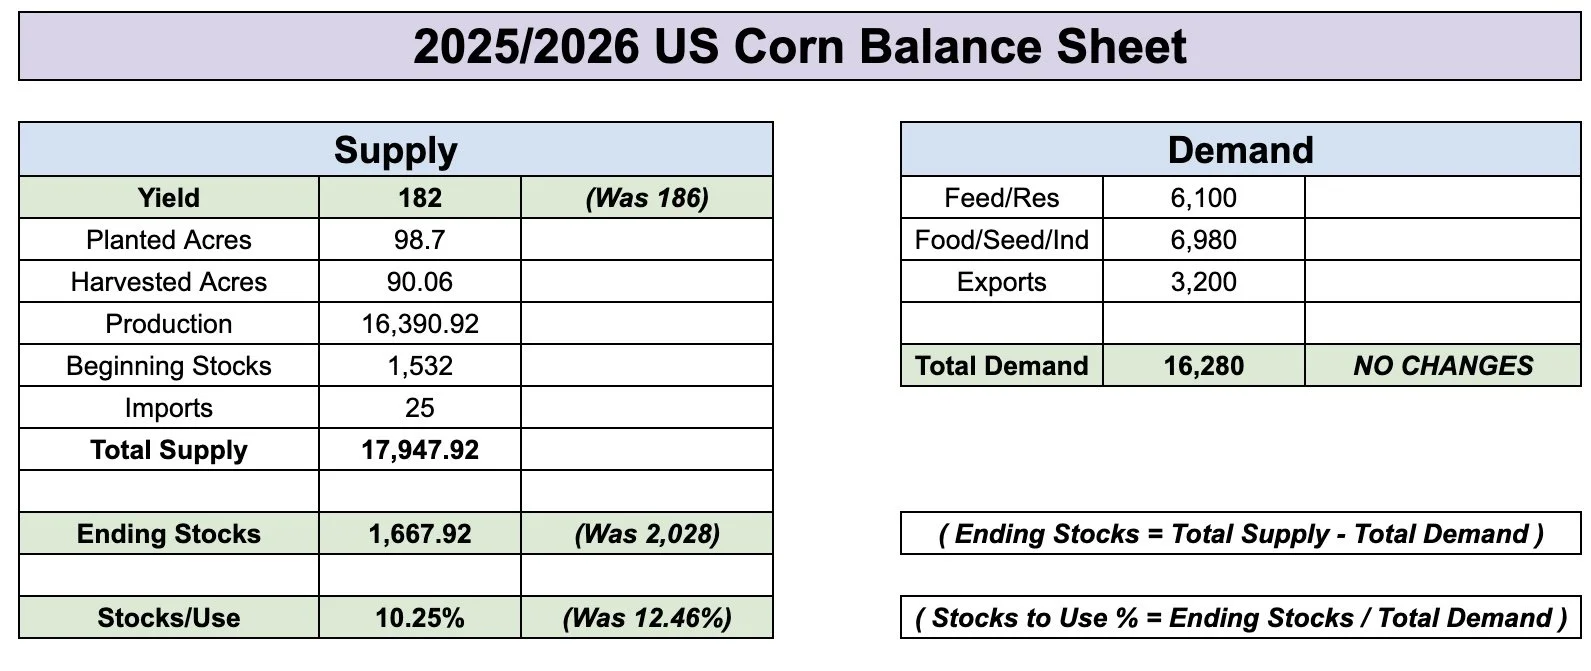
Last Year's Balance Sheet: 10.11% S/U
Altough this report doesn’t "have" to be bullish.
At the same time, I do find it hard to get a scenario where this report is truly bearish and collapses corn.
The market is well aware we have record production. You can’t really argue our export demand needs to be cut, if anything you could argue it should be bumped higher.
We are already at a 2 billion bu carryout today.
My final thoughts:
If we get a 184 yield, I think the USDA probably offsets it with a cut to feed demand. We don’t get a super bullish or bearish reaction.
If we get a 182 yield, I'm sure it'll be a bullish reaction and provide some life into this market. However, even a 182 yield doesn’t make the corn situation tighter than last year.
If we get a 180 or lower yield, well this market will of course take off.
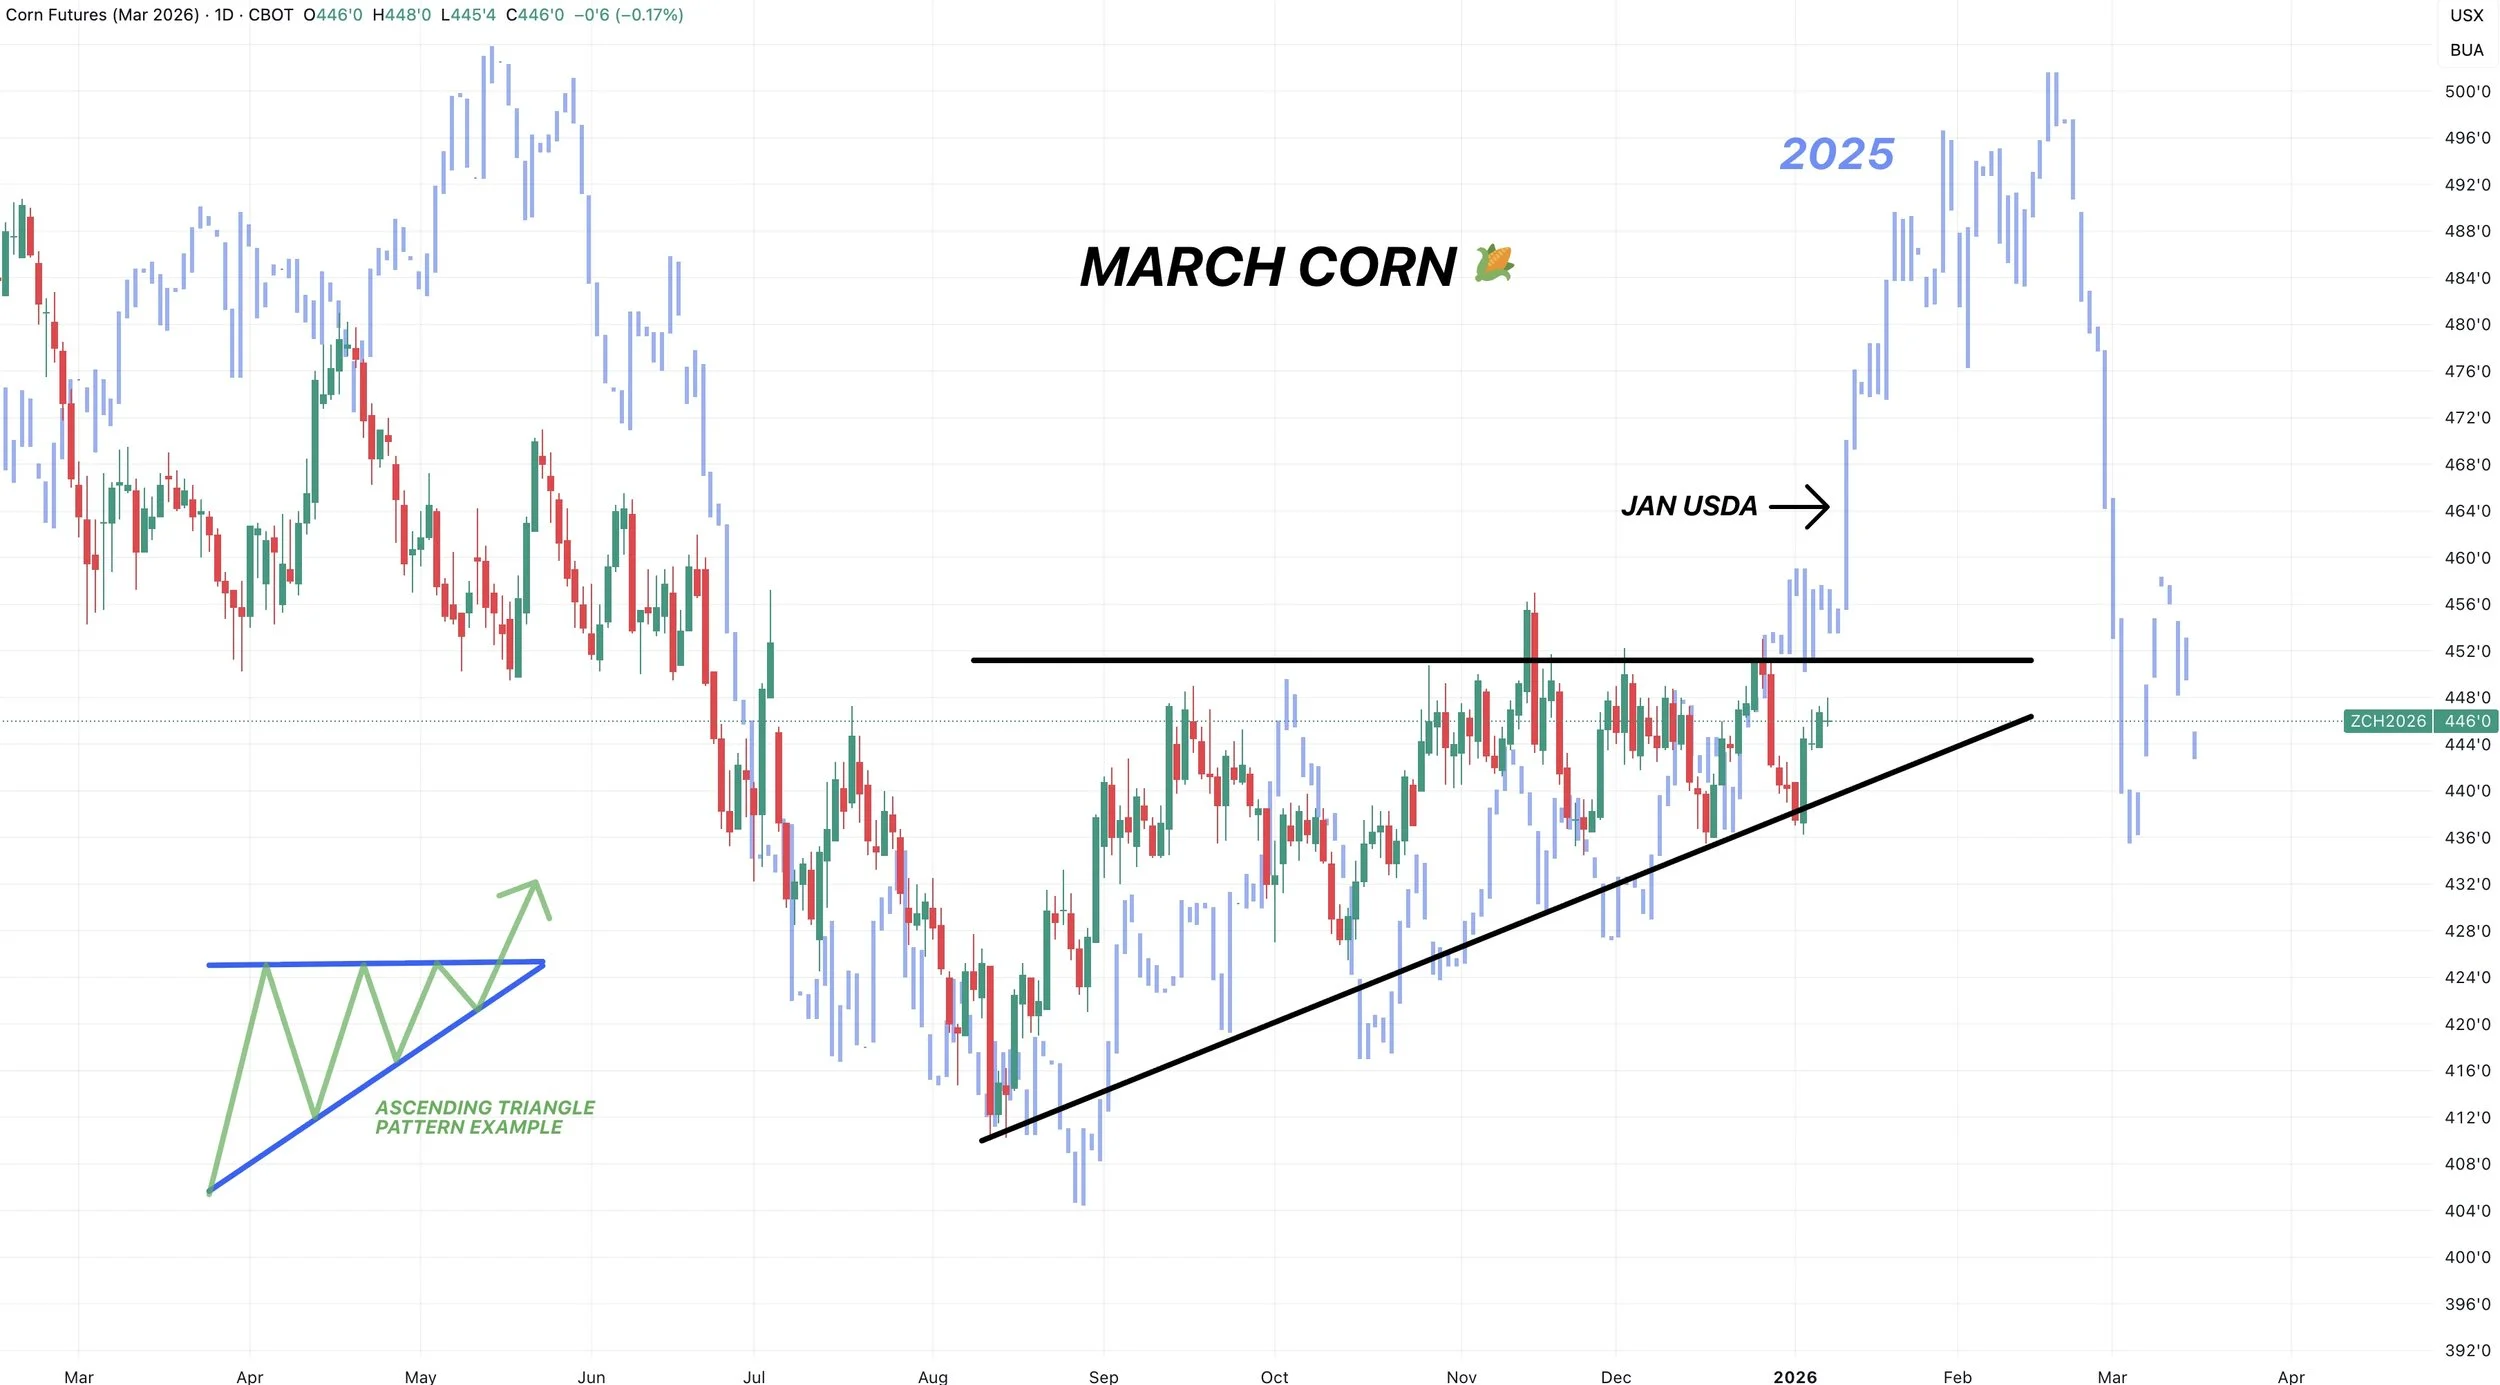
March 25 vs March 26
We are still tracking last year's price action almost exactly.
Last year, we truly broke out on the day of the USDA report.
Guess we will find out if we can do it again.
Regardless, the ascending triangle pattern we are sitting in is seen as a friendly pattern.
Pre-Report Positioning
If you want upside exposure in corn, here are some trades.
Ratio Trades:
Buying 2 March $4.50 calls - Selling 1 Dec-26 $5.00 call for approximately no cost.
Buying 3 Feb $4.50 calls - Selling 1 Dec-26 $5.00 calls for a slight credit.
Simple Trade:
Buy Feb $4.55 calls for less than 5 cents.
(Feb calls expire 1/23/26 and March calls expire 2/20/2026)
If you want downside coverage here is a trade.
Buy April short dated $4.55 puts for 5 cents or less.
This gives you protection against the Dec contract, expiring 3/27/26. It gives you a net floor of $4.50 with upside open through the first quarter of the year.
If you have questions on this please give us a call.
Jeremey: (605)250-3863
Lauren: (806)391-7178
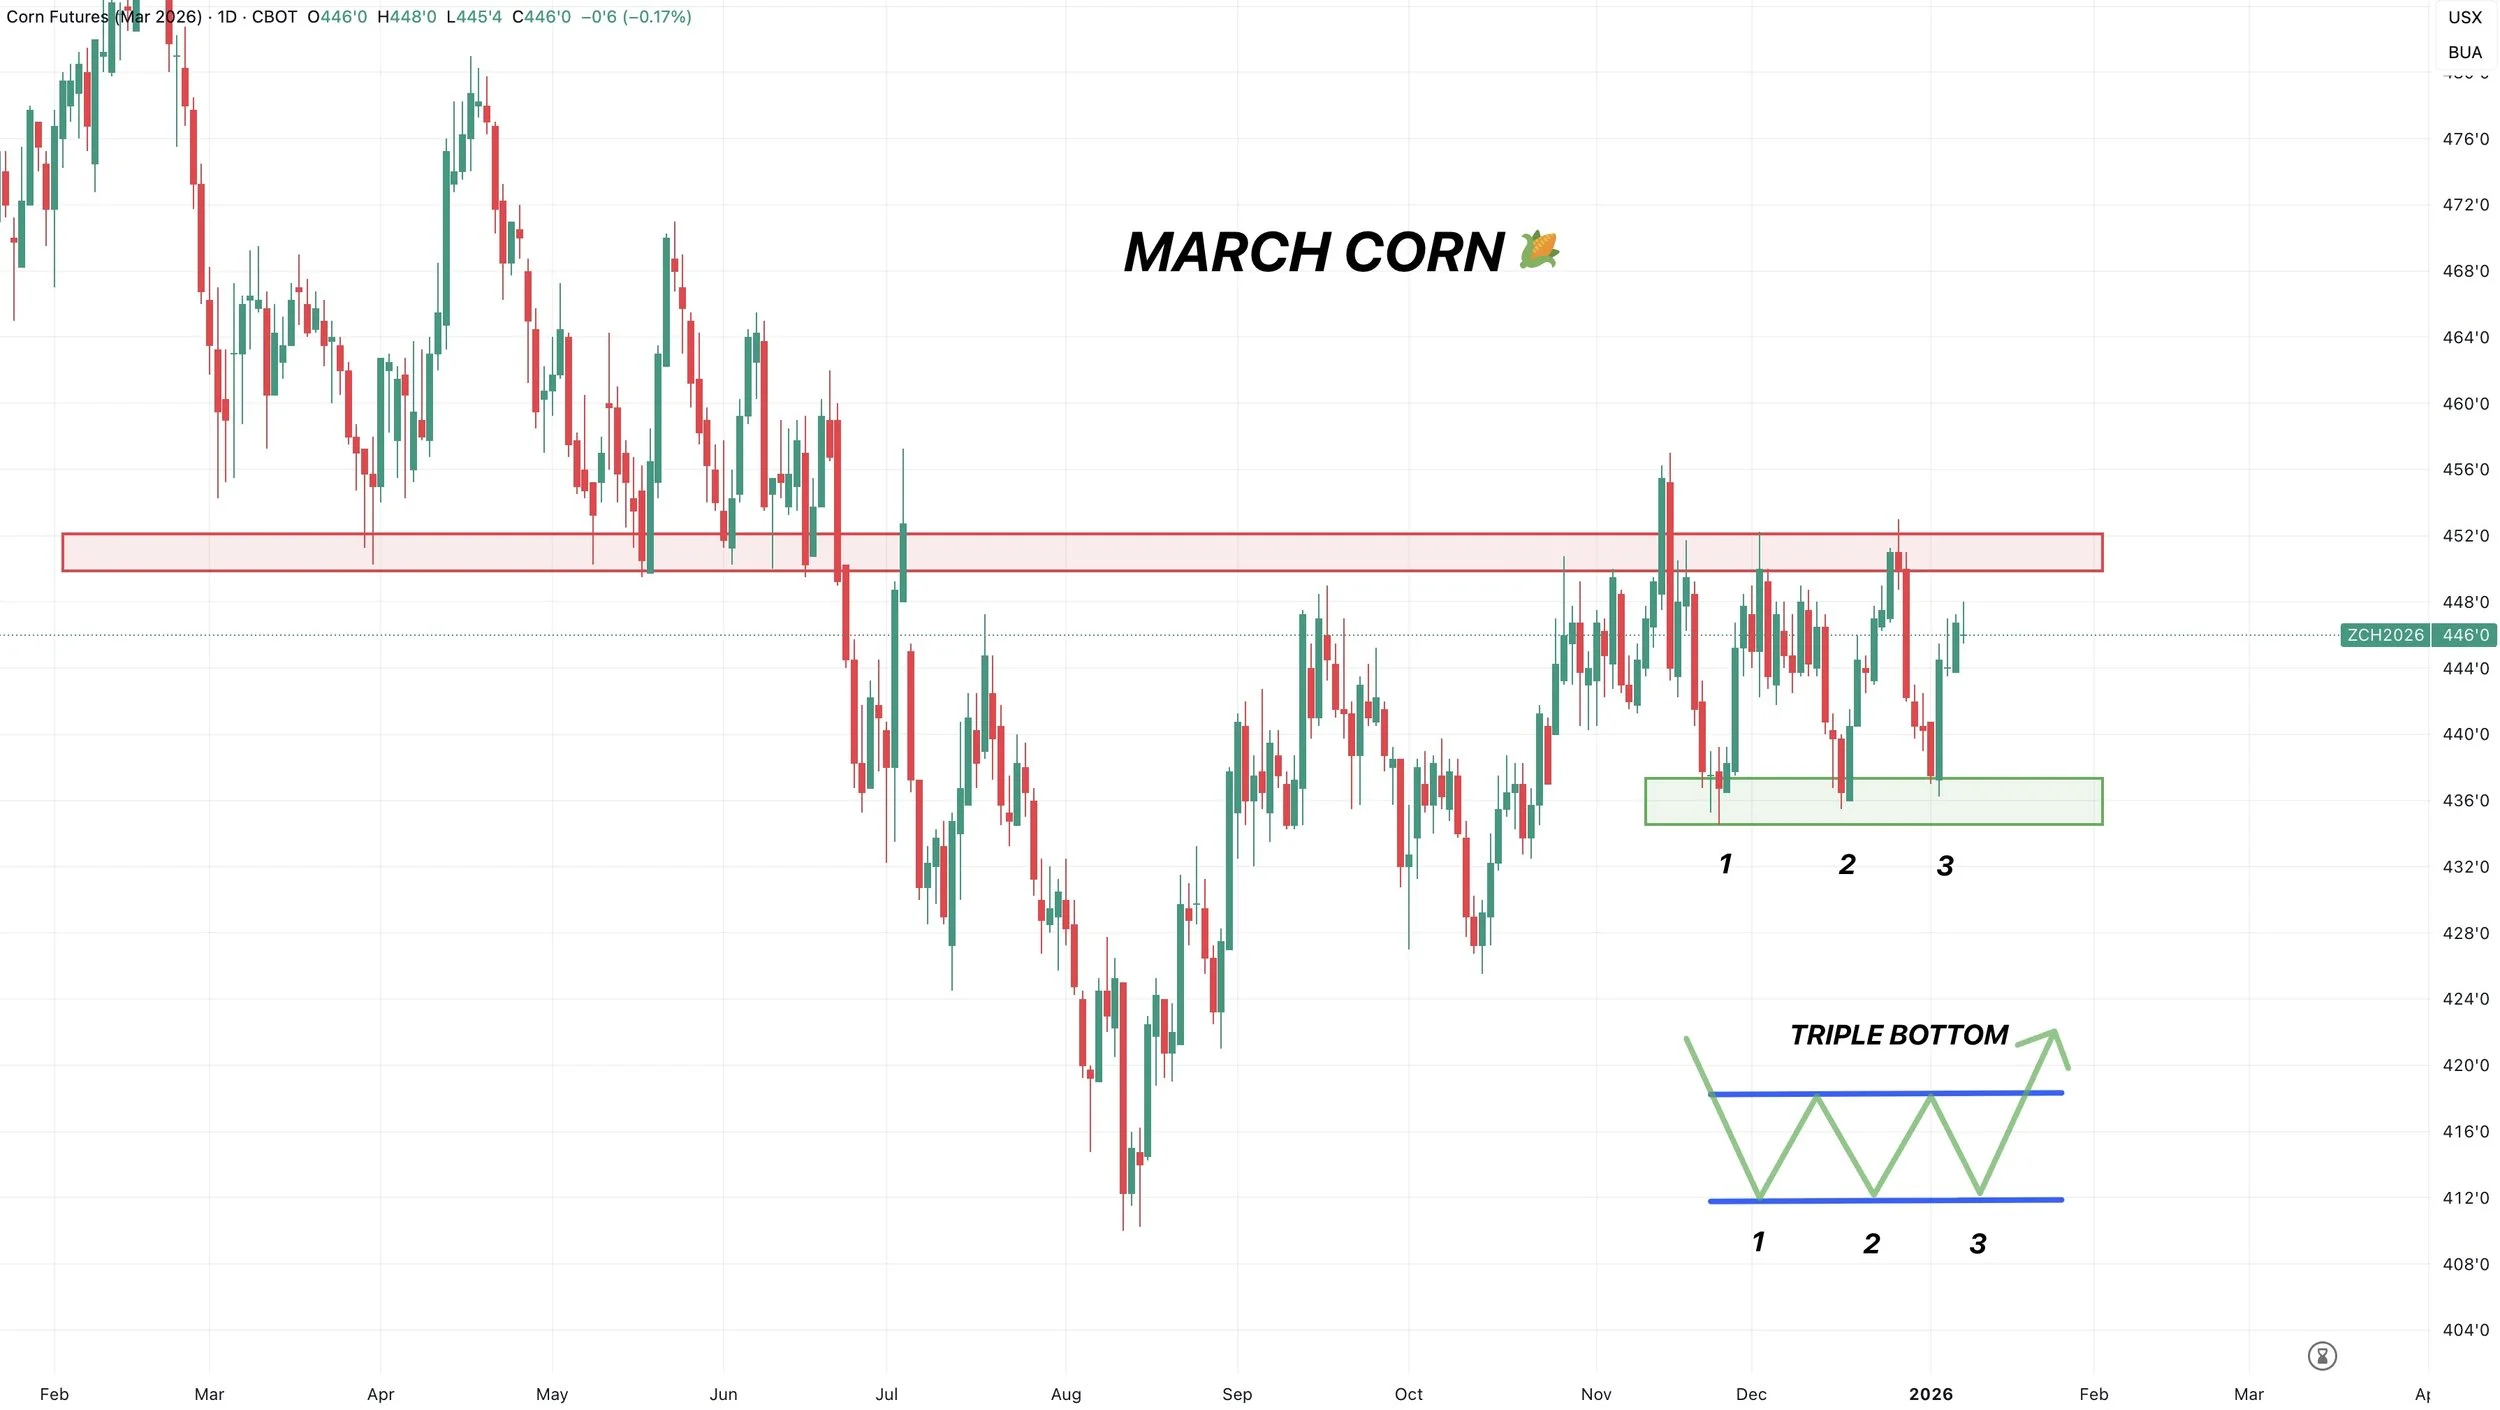
Technicals:
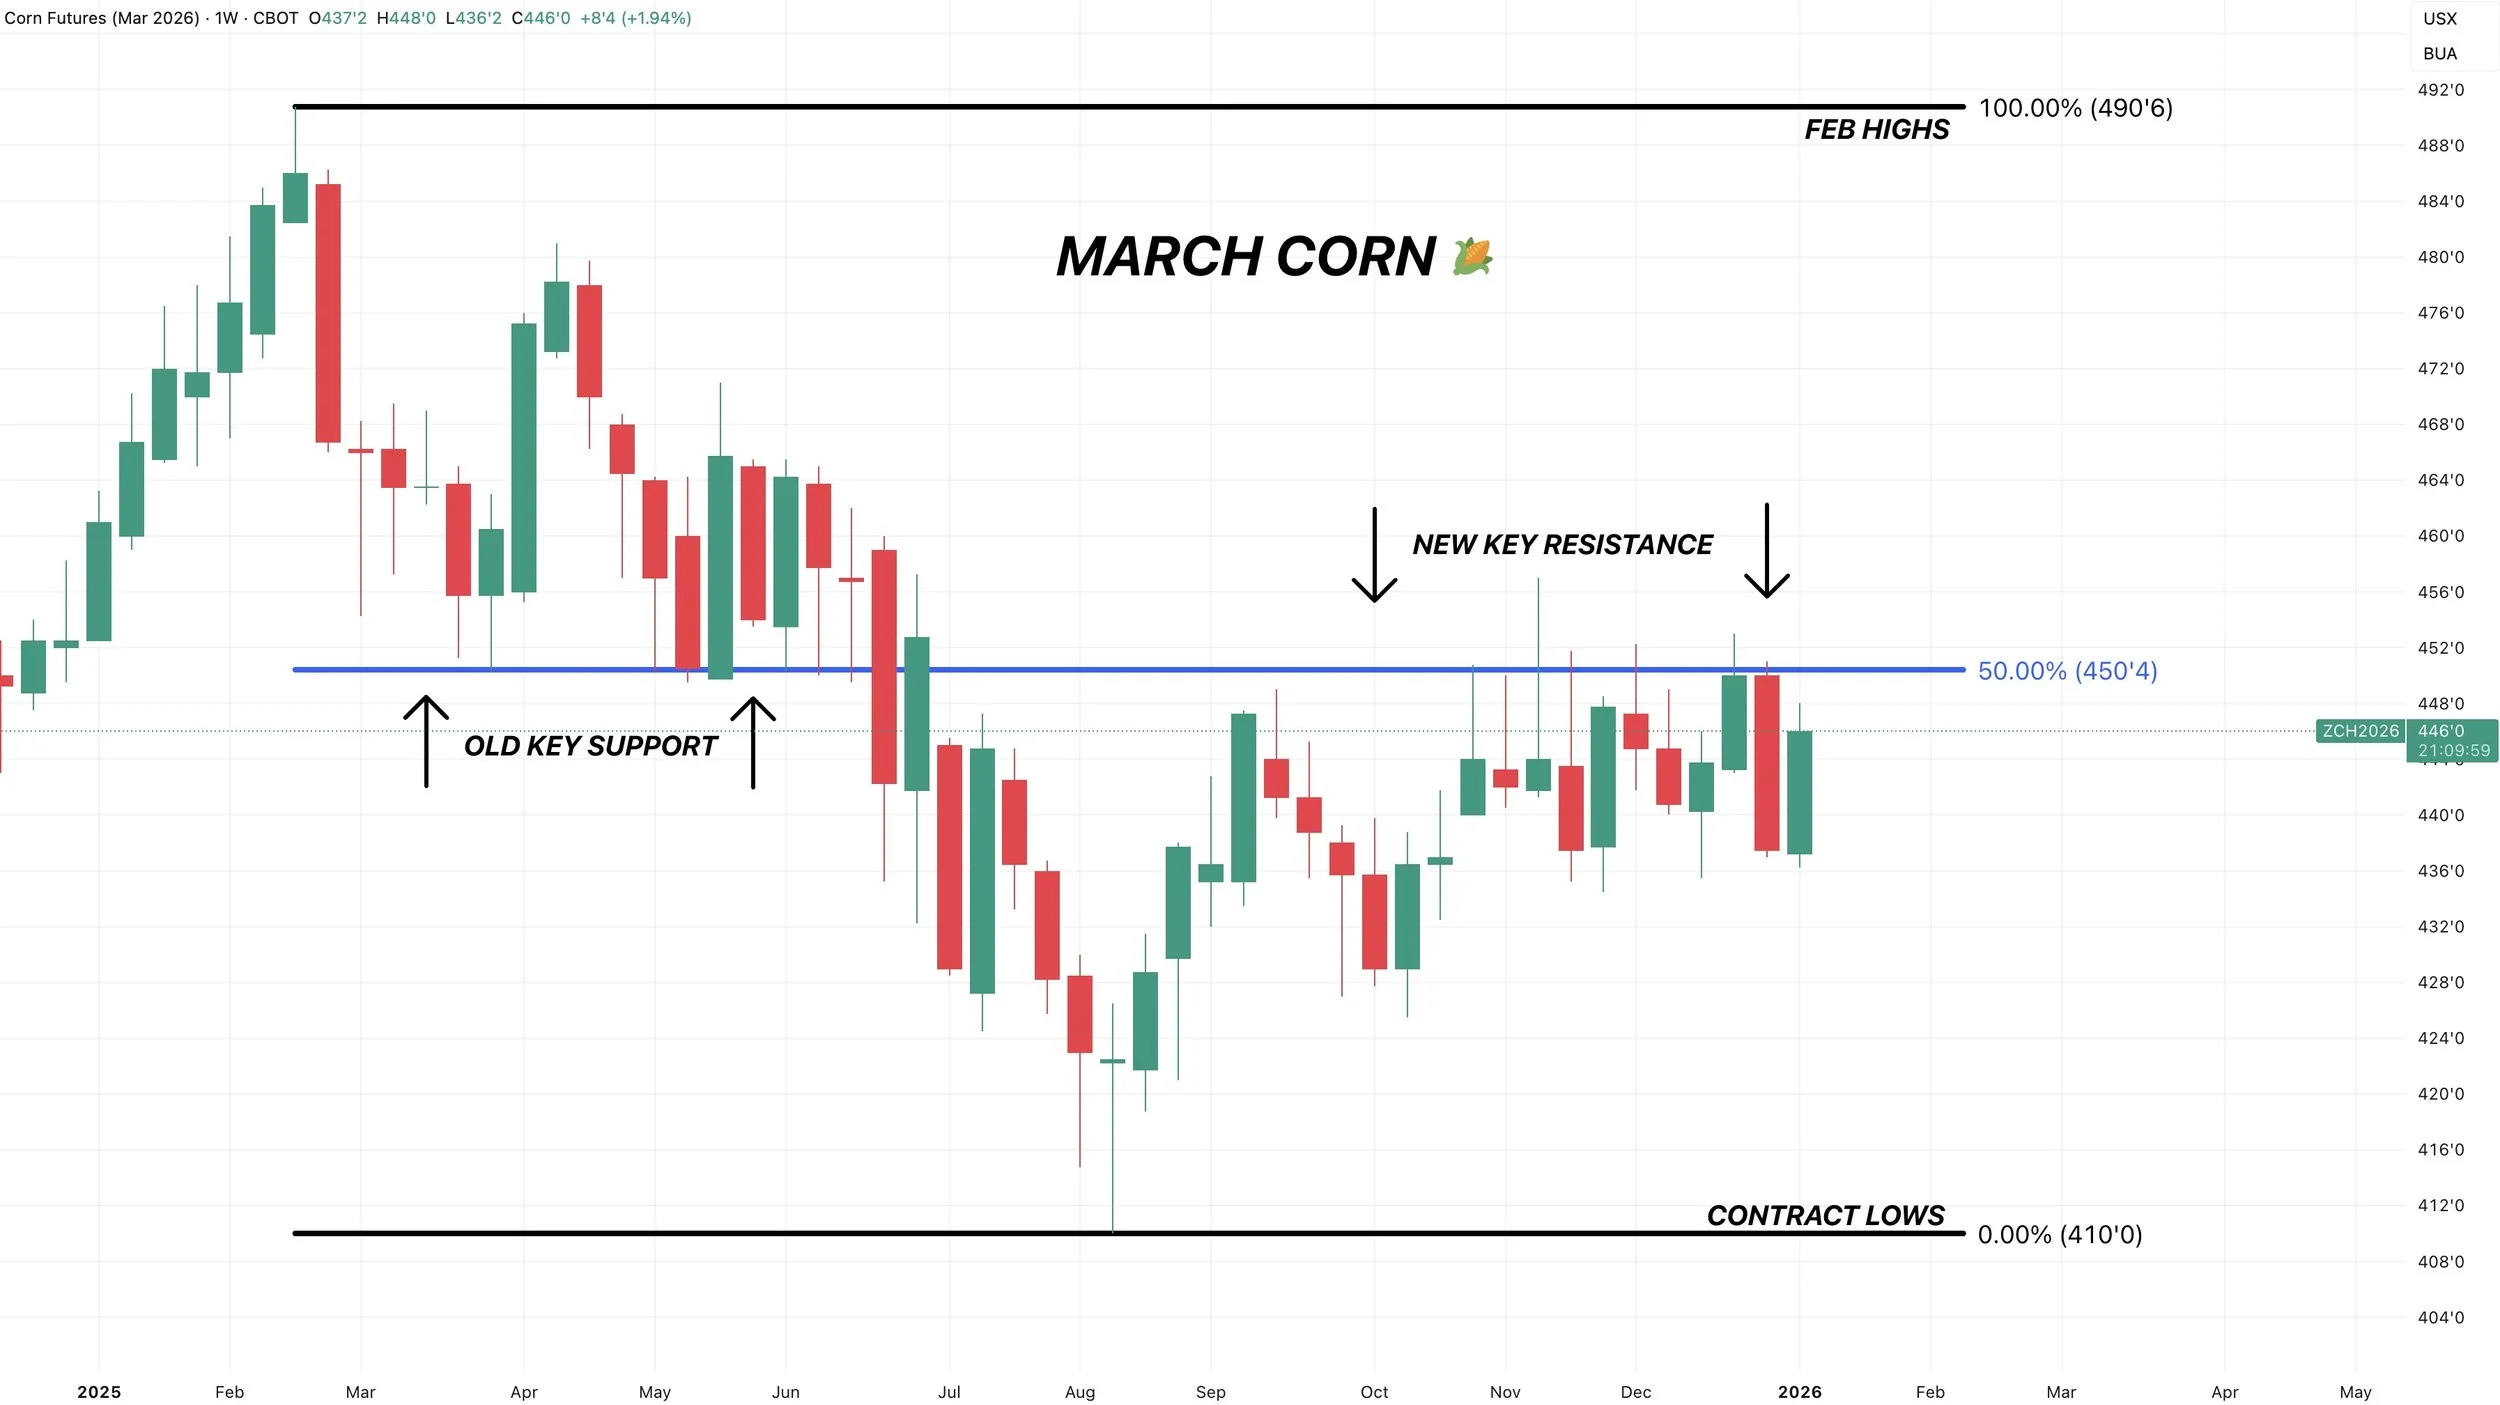
March Corn
We still have that triple bottom in place.
Which is a textbook reversal pattern.
The market is just waiting for the USDA to decide if we get the break out.
If we break above $4.50, we should get another leg higher.
Weekly Chart
We have still yet to get a close above $4.50 on the weekly chart.
Failing there time and time again.
It was support from spring.
It claws back 50% of the Feb highs.
Close above $4.50 on a weekly basis and we should go higher.
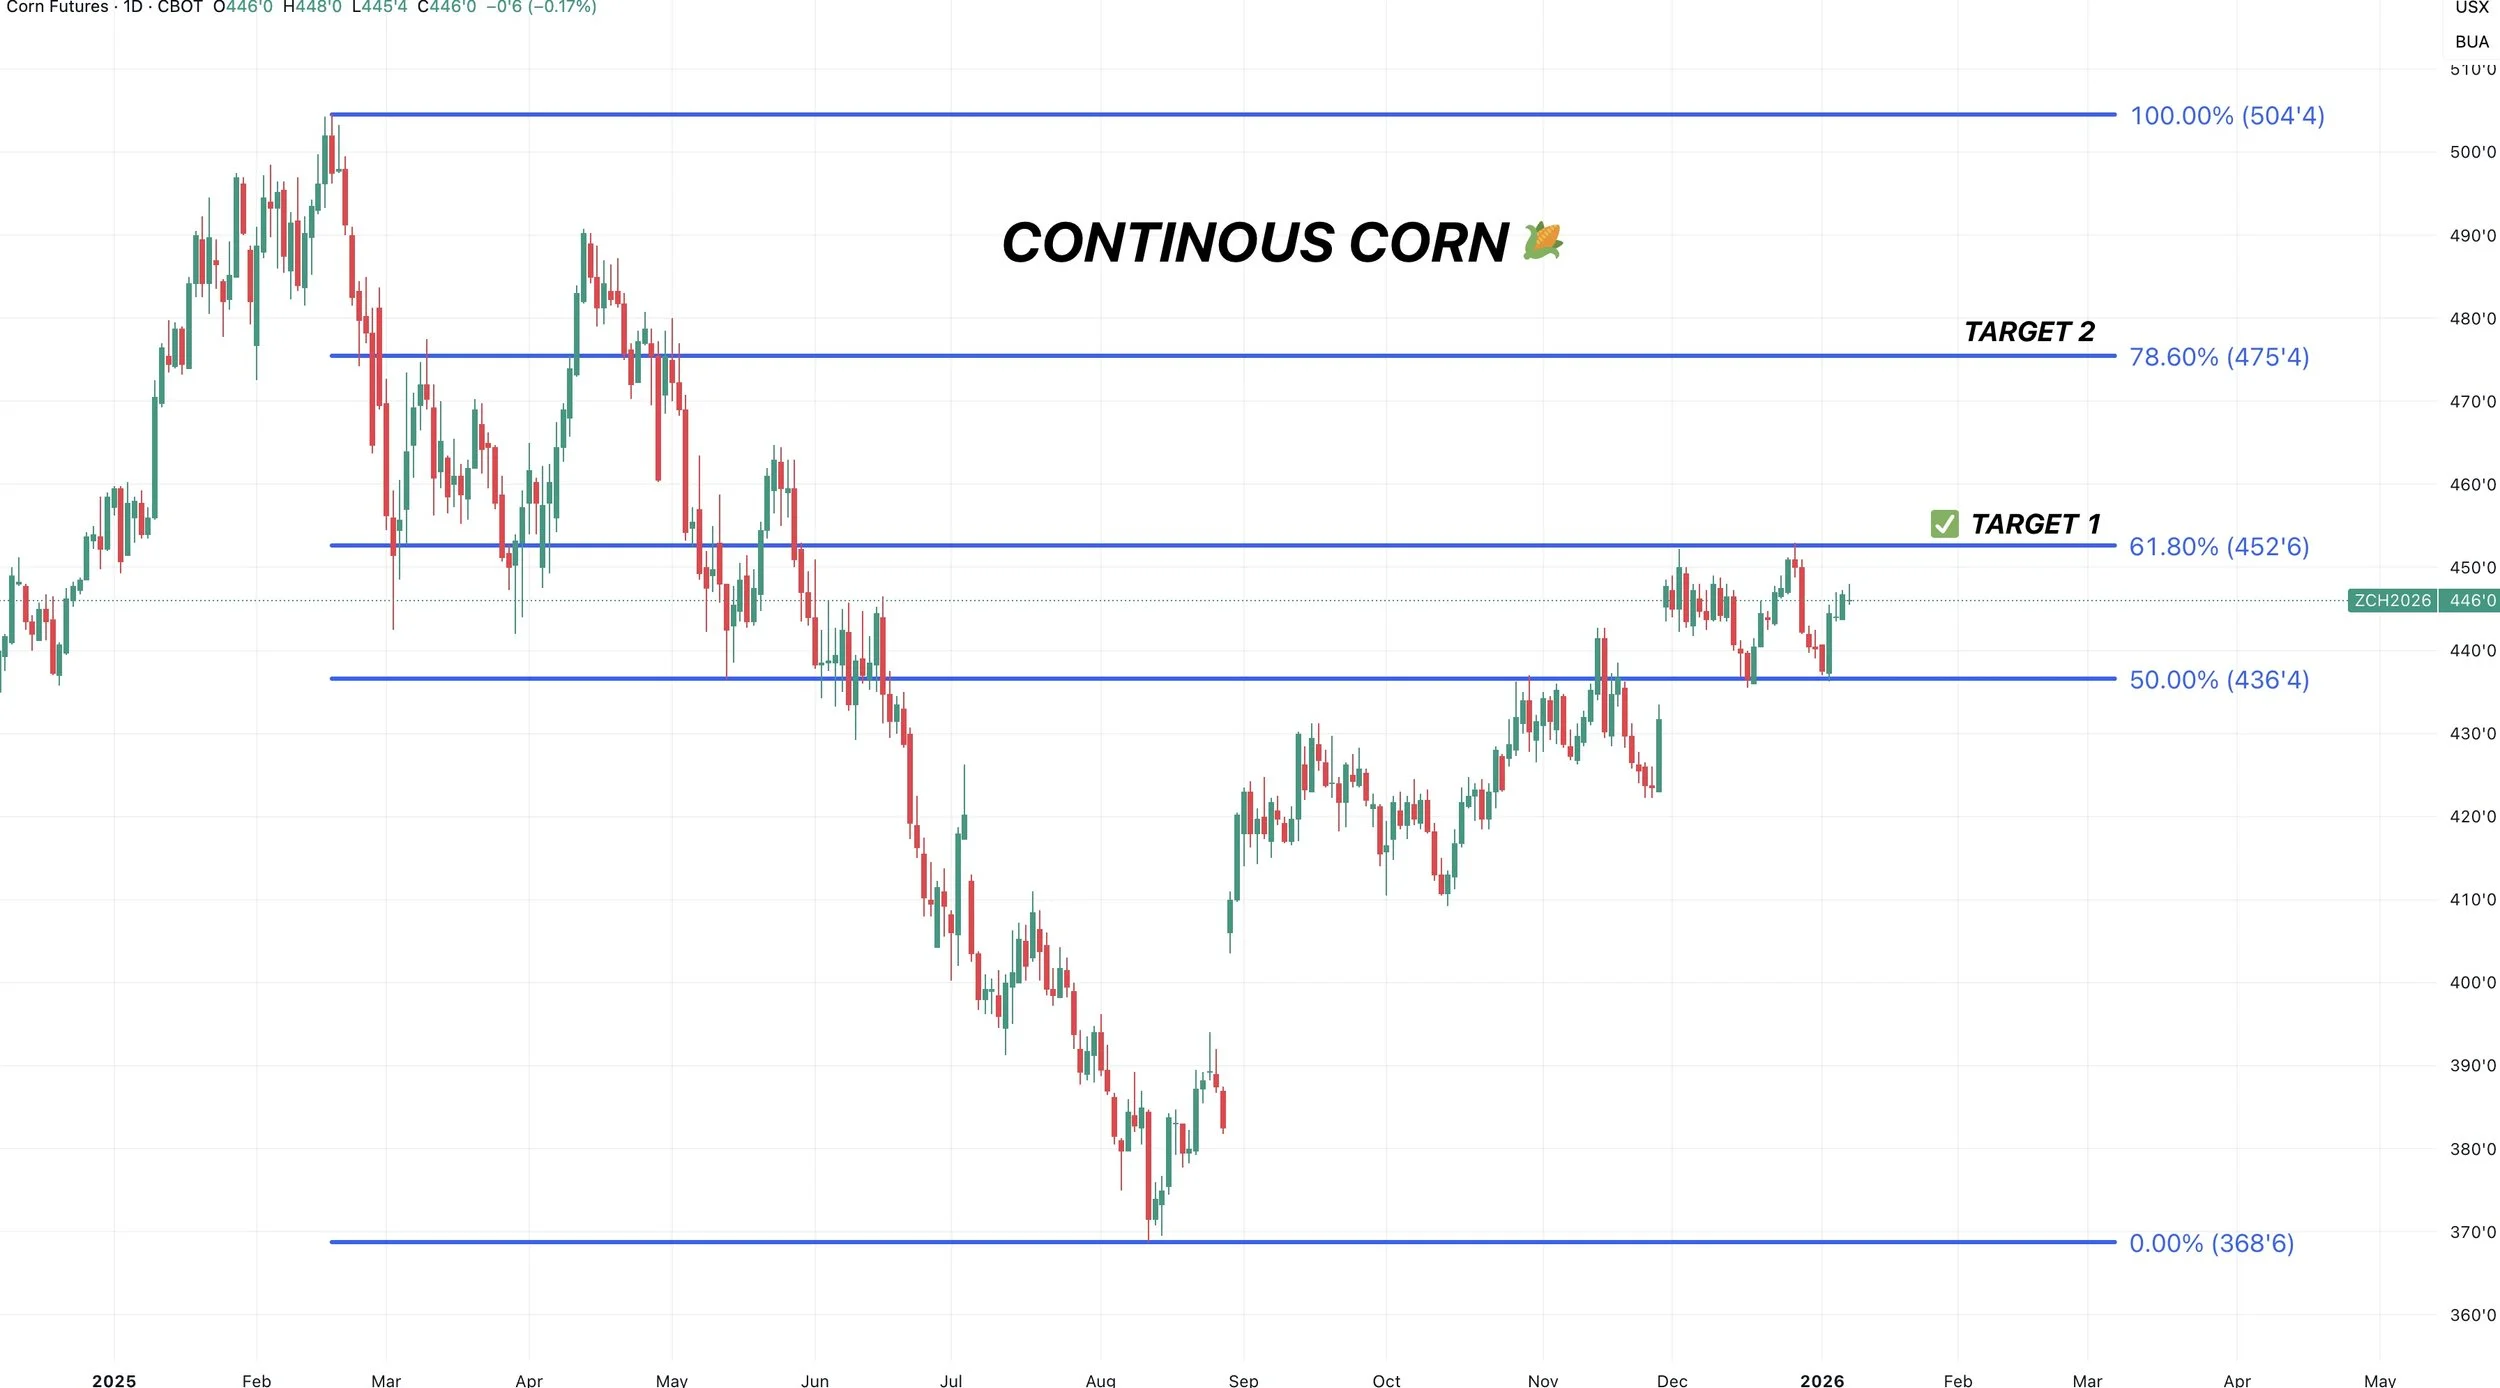
Current Next Target:
We originally took some risk off the table and alerted a sell signal at $4.50
Our next target is subject to change.
But if we get a friendly report and get an upside breakout, the next area we are looking to de-risk a lot heavier is $4.70 to $4.75 for a variety of reasons.
If the time comes, I'll go through all the reasonings.
But the first one is based on the continuous chart.
This rally stalled exactly at the 61.8% level up to the Feb highs.
The next level is the 78.6% level at $4.75
Soybeans
Fundamentals:
Soybeans have been finding a little bit of life, probably mostly technical buying and position squaring ahead of the report. As soybeans were just very oversold.
As for the USDA report, like we talked about Tuesday, it does tend to be a friendly report for soybeans.
We've traded higher 10 of the last 12 years.
Higher the last 9 of 10 years.
On average we move +/- 18.5 cents
The two biggest things are clearly going to be yield and exports.
Will they drop yield and by how much?
If they do, will they offset those losses by cutting our exports?
First for yield.
The estimates have yield dropping by -0.3 bpa.
The largest drop we've seen in the last decade came last year, where they dropped it a full 1 bushel.
I think the USDA can lower yield, but relatively speaking, soybean yields seem to look better than corn yields.
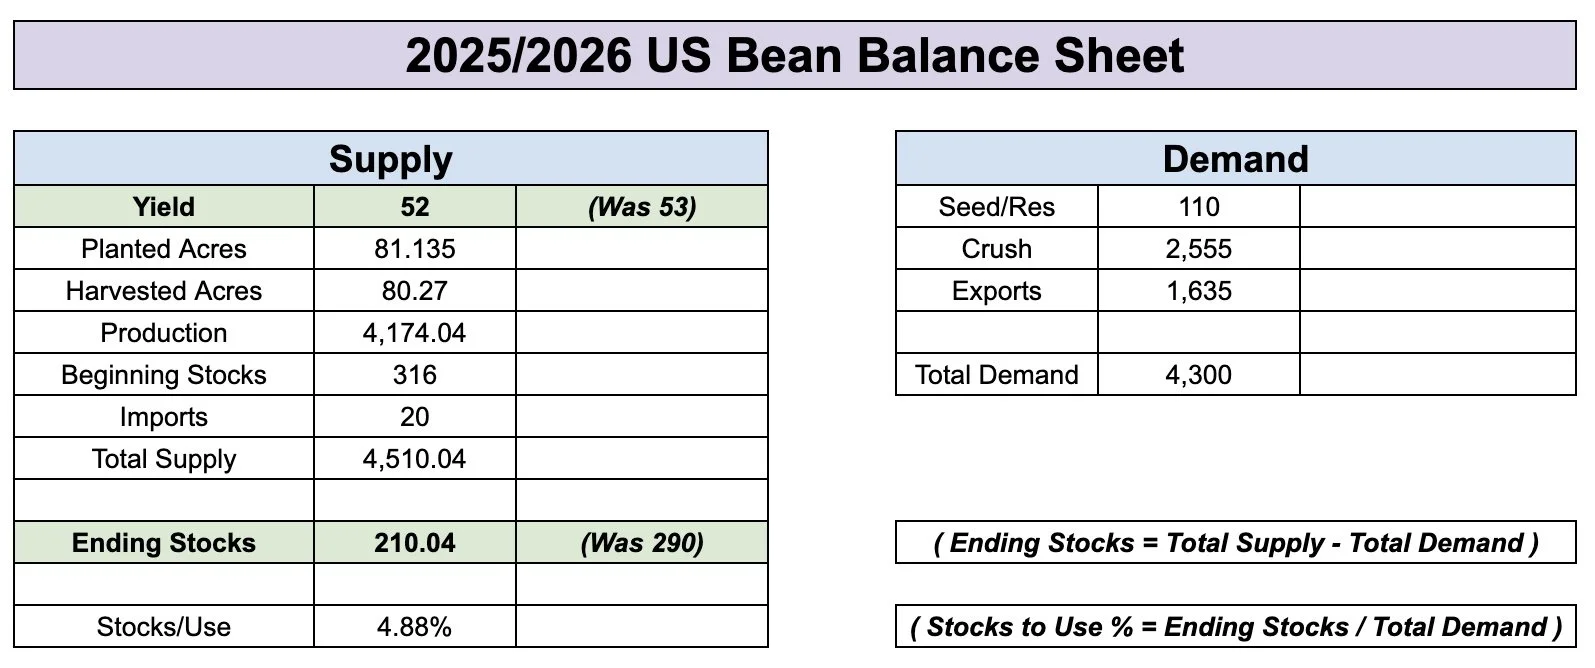
The US balance sheet is actually pretty tight for soybeans.
If yield did come in at 52 bpa (currently 53) it would drop the carryout down to it's lowest levels in a decade.
Some of that supply loss will inevitably be met with cuts to exports that are arguably too high to begin with.
But if you want a bullish story in soybeans, that seems like one of the routes here.
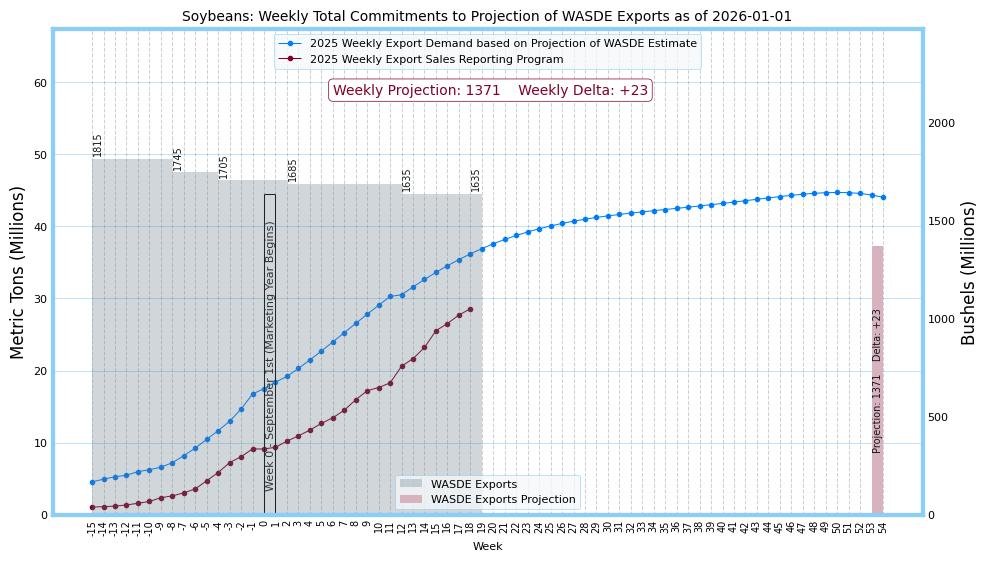
The issue is exports.
They are down -29% vs last year.
The USDA's estimates only suggest export demand being down -13% vs last year.
So we are well behind the USDA's pace to hit the estimates. Meaning you could easily argue they need to be lowered.
Here is a good chart from Robert McClure show casing the current export sales vs the USDA's current estimates.
If you throw on the fact that Brazil beans are around $1 cheaper than ours, and Brazil is going to be harvesting in the next 1-2 months. Which is going to supply the world market.
It does make it that much harder to think that the export estimates aren’t too high.
Which makes it easier for the USDA to balance the balance sheet if they opt to lower yield.
Pre-Report Positioning
If you want upside exposure, here are some trades.
Buying Feb $11.00 calls for 3 cents or less.
Buying March $11.00 calls for 7 cents or less.
No margin requirement and gives you participation for a fixed cost. With unlimited upside.
If you want downside coverage, here are some trades.
March short dated $10.60 puts for 10 cents or less. This gives you protection against the Nov contract, expiring 2/20/26. This leaves your upside open and buys you a floor.
March $10.50 puts for 15 cents or less. If we get a bearish report, the front month contract should lead us lower.
Feel free to reach out if you have questions.
Jeremey: (605)250-3863
Lauren: (806)391-7178
Technicals:
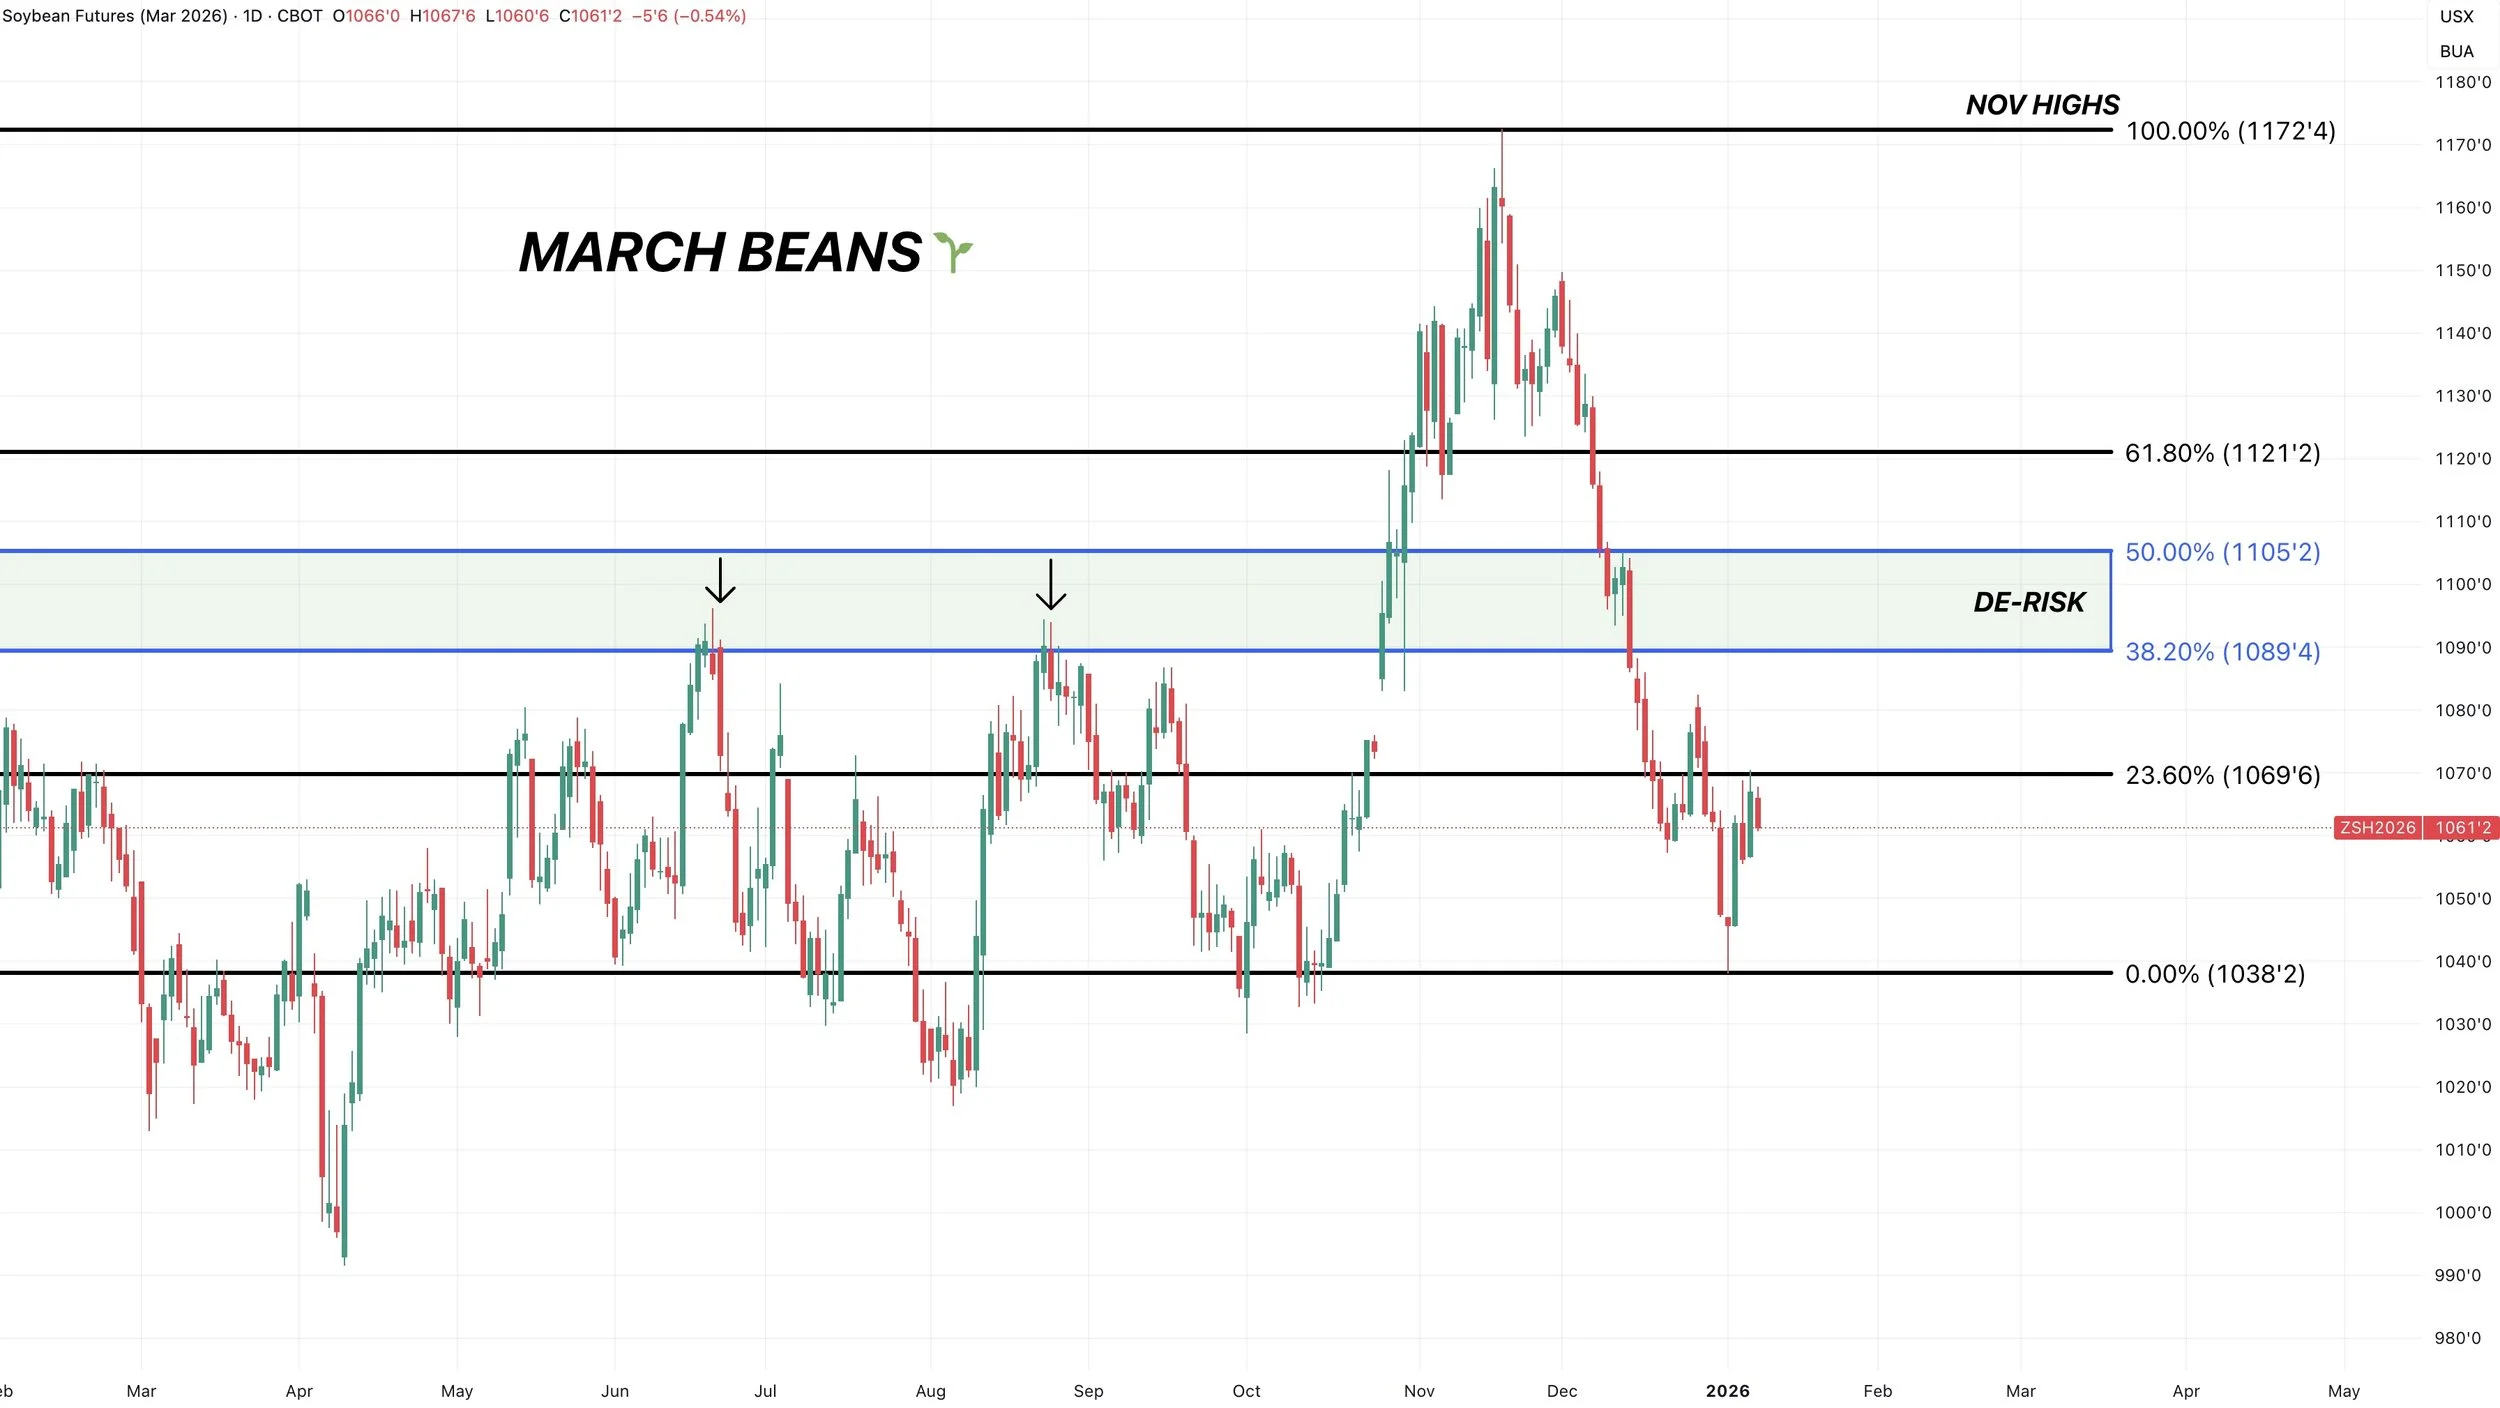
March Beans
Friday and Monday we posted that textbook key reversal and false breakdown we talked about.
So far we've seen some decent price action.
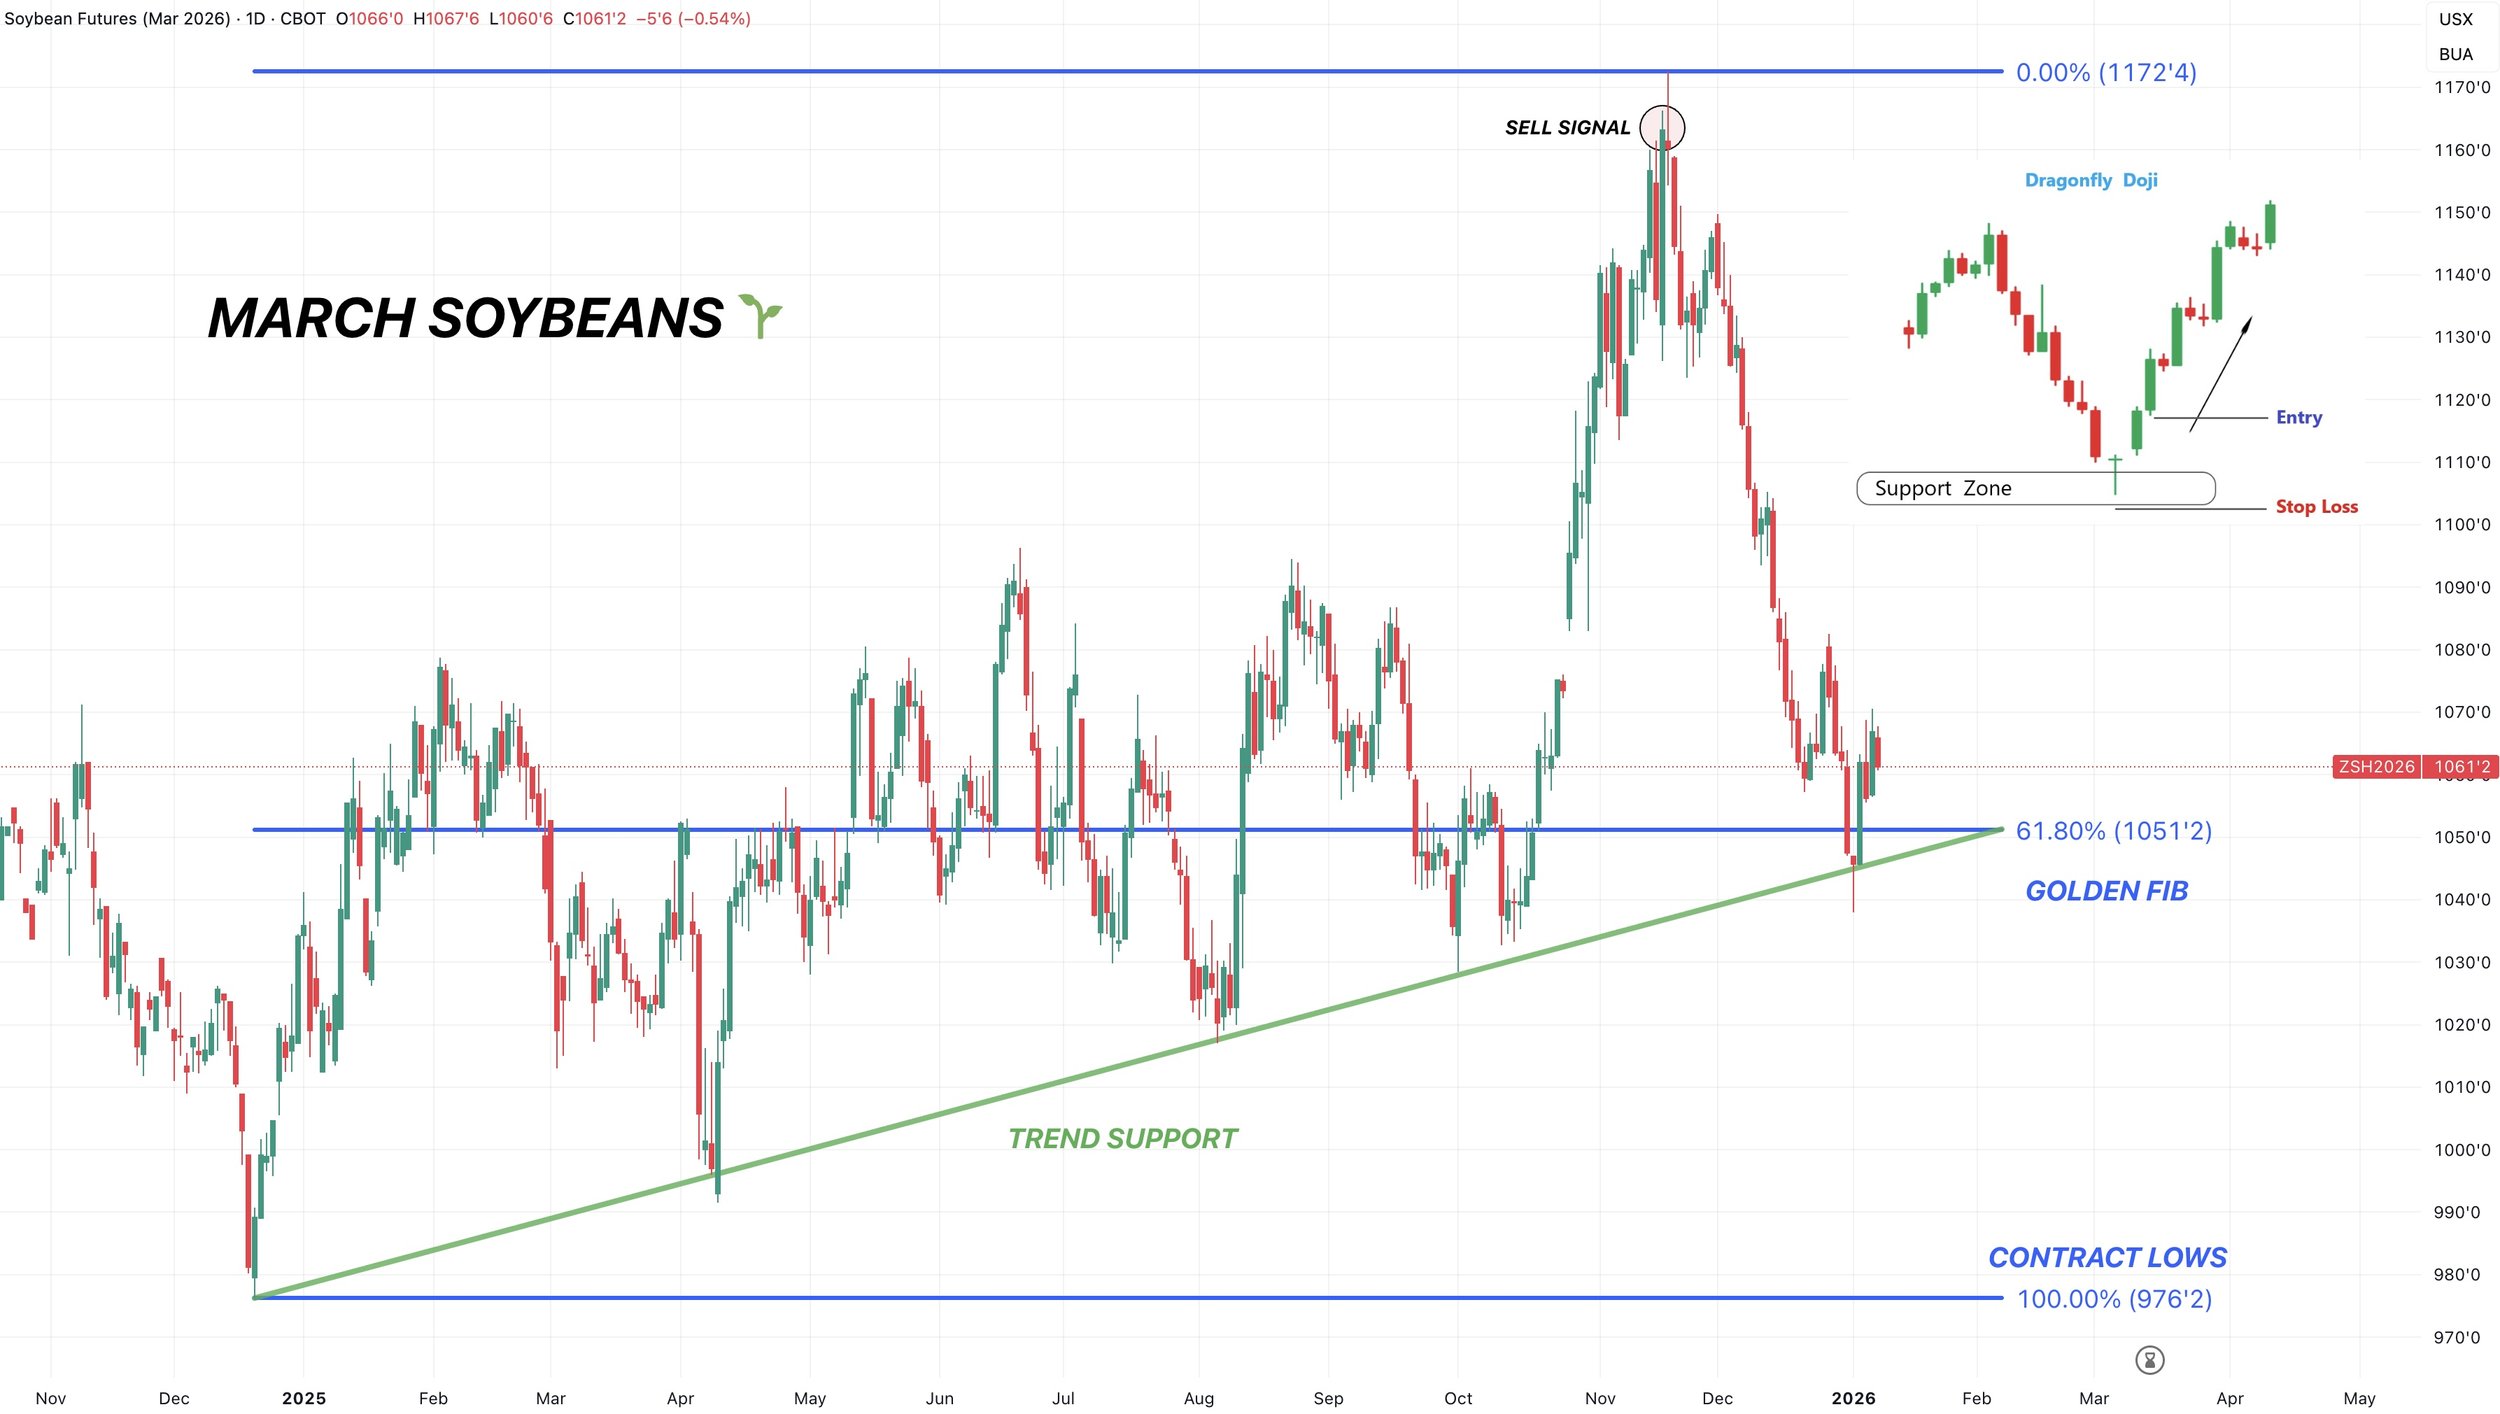
However, we aren’t quite out of the woods just yet.
We are failing right at the 61.8% retracement up to those Christmas highs.
We need above that level to be confident we are in the process of starting a bigger move higher.
Until we break above that, this is seen as a mini corrective bounce.
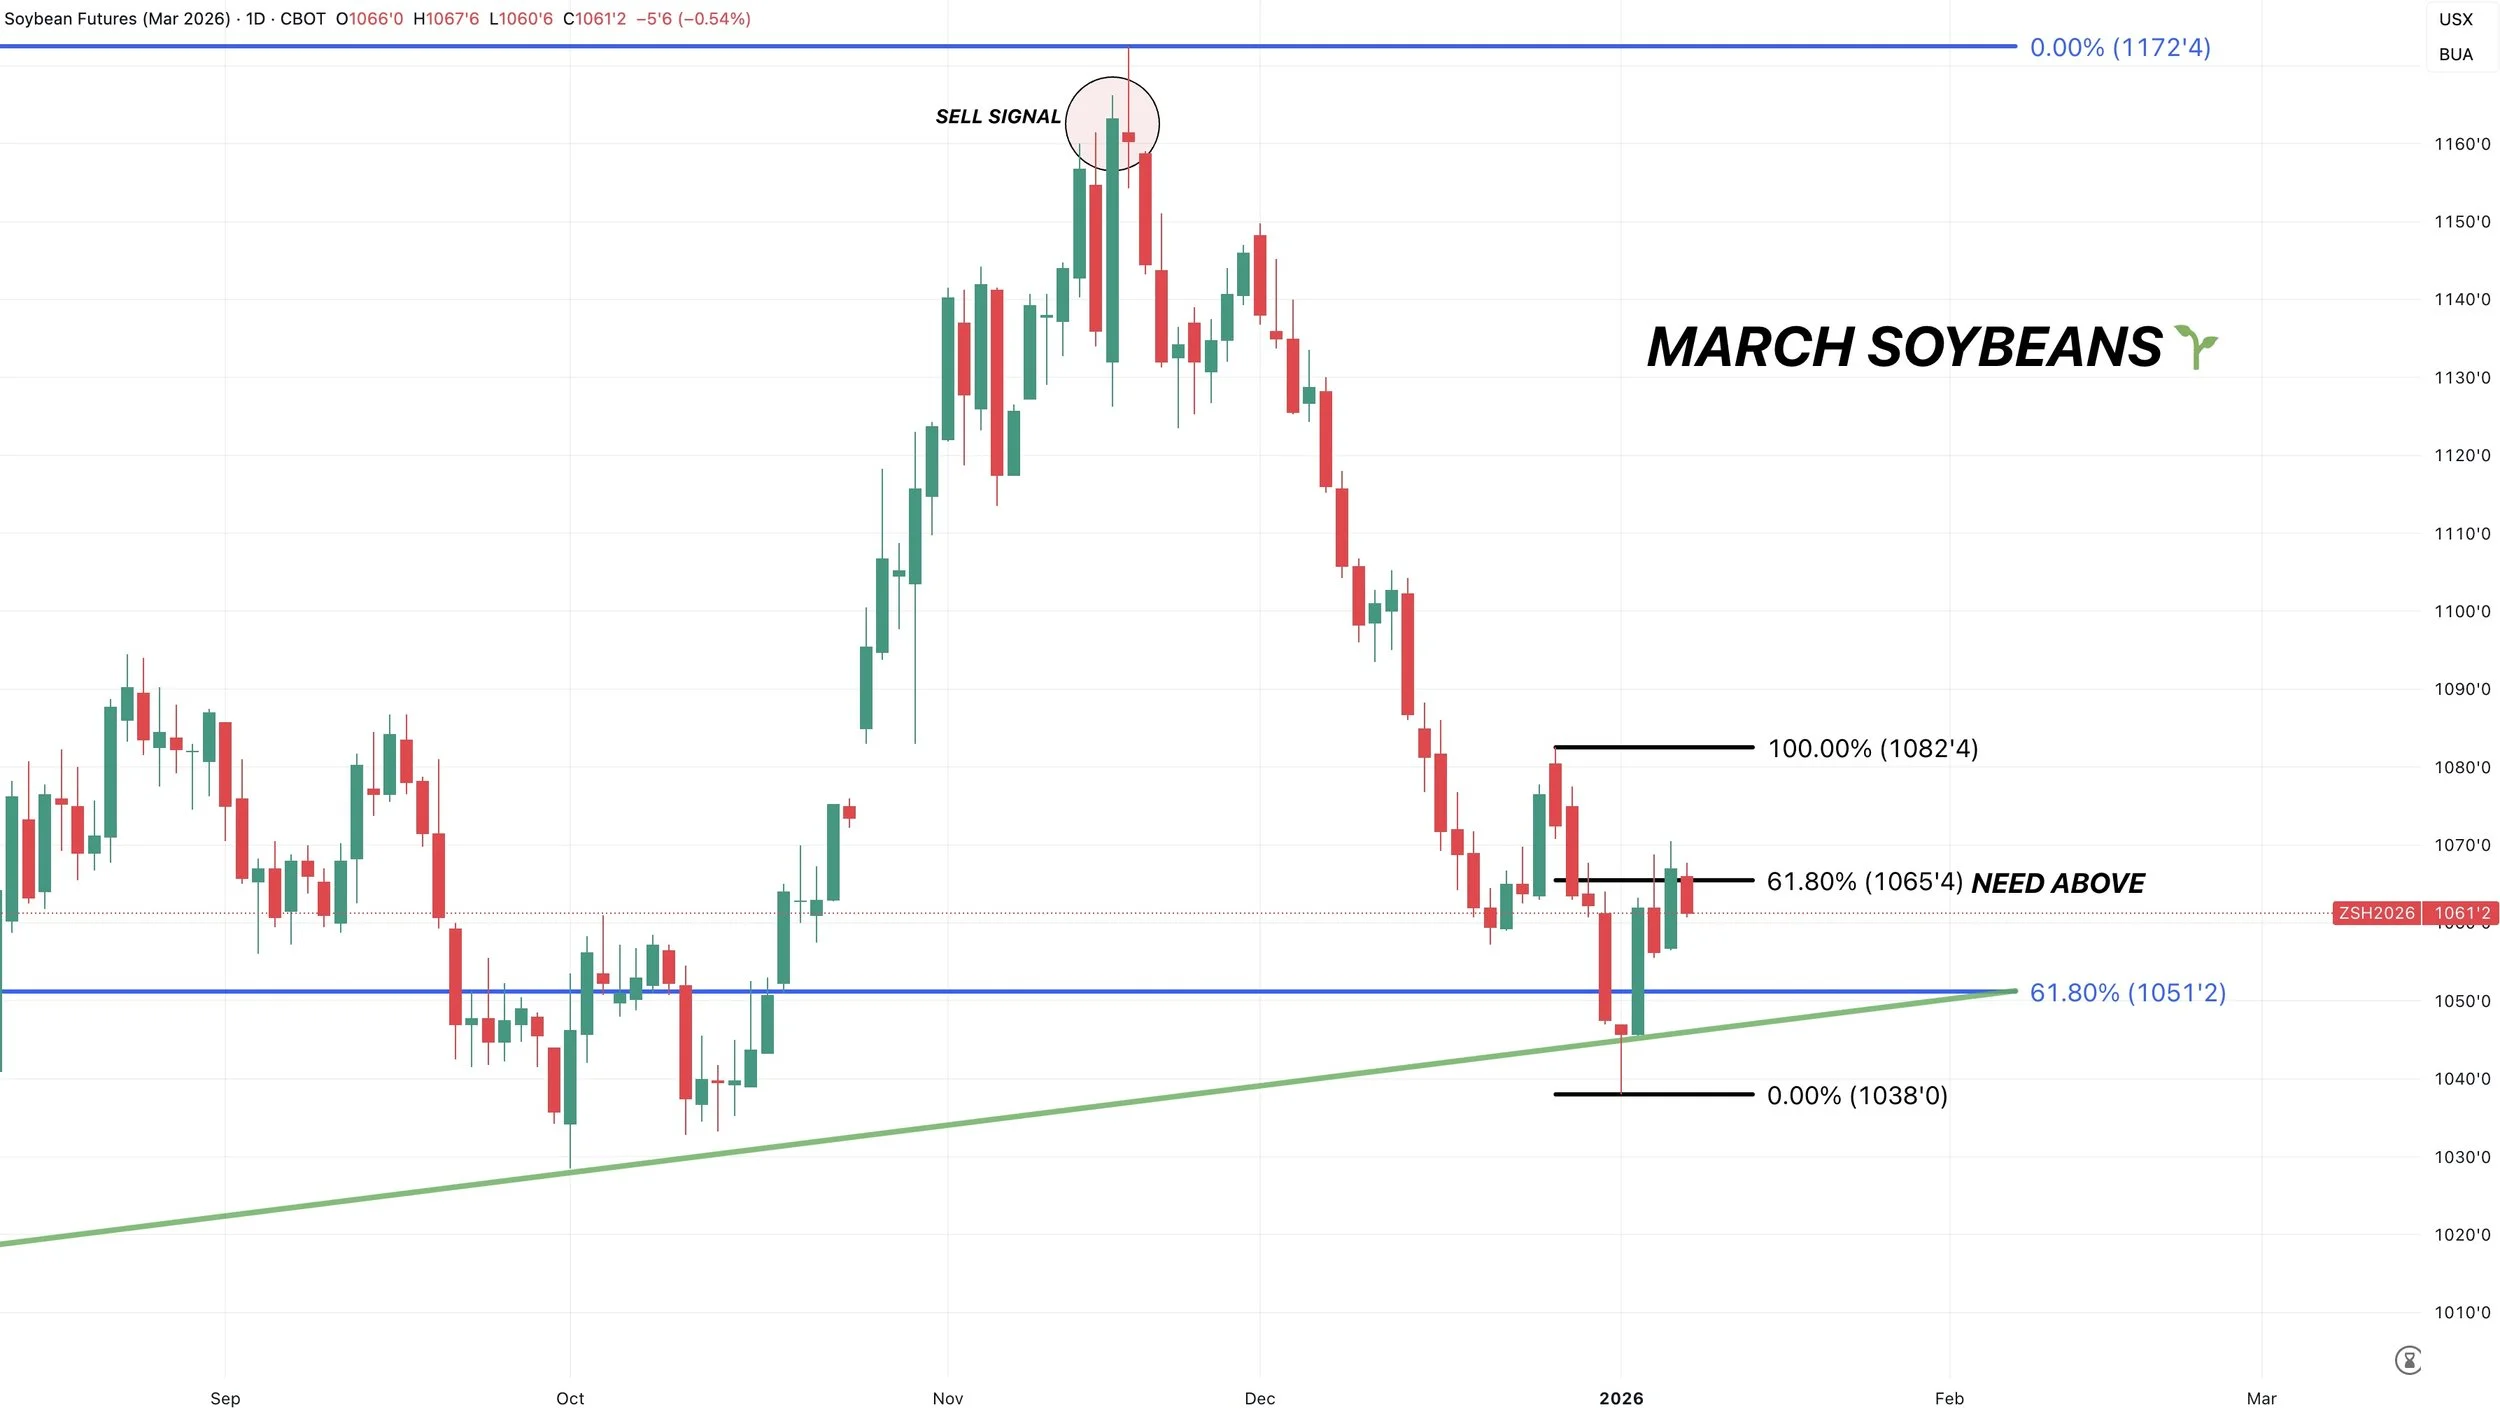
Current Target
We are also rejecting at the 23.6% level from the recent lows up to the November highs.
Which is the very first fib level.
If we can break above this level, we are going to look to be rewarding a move towards $10.89 to $11.05
Which would claw back 38.2% and 50% of the November highs.
That level also lines up with prior resistance on a few occasions earlier this year.
The upside target is subject to change, but that is our target for now.
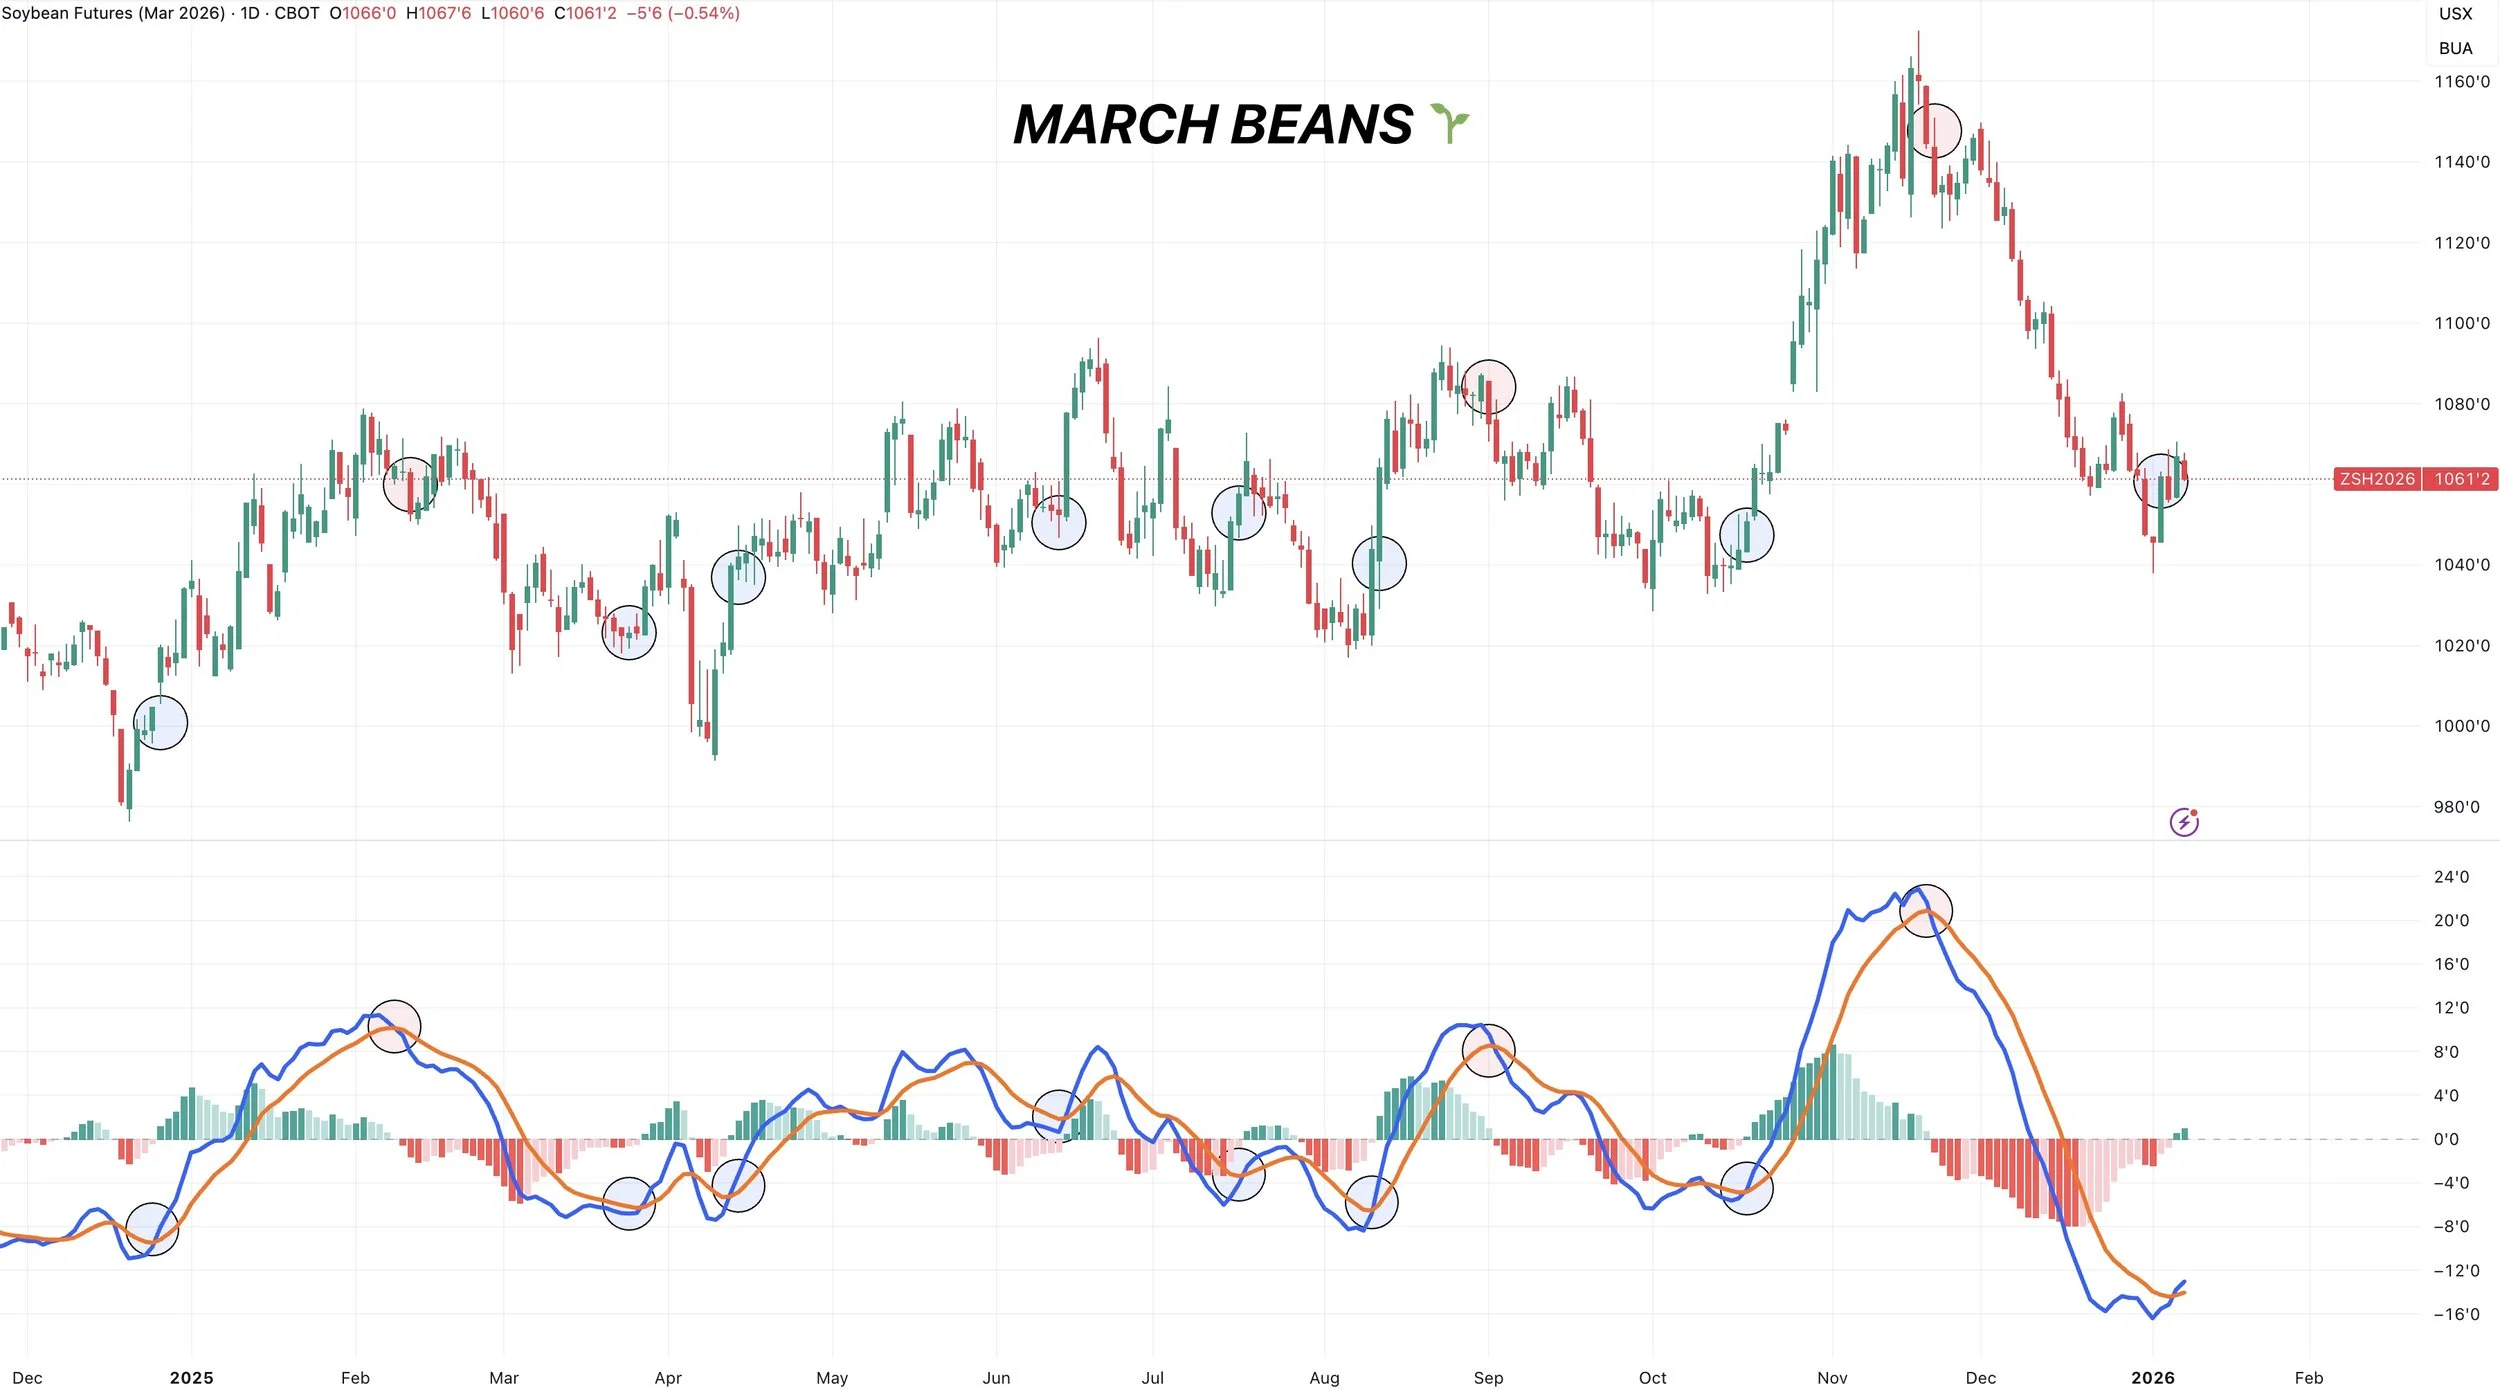
MACD Indicator
Yesterday the MACD crossed bullish.
This is a momentum indicator.
It's not a perfect indicator as none are, but it has been decently accurate at picking tops and bottoms and identifying trend changes.
A reason to have some optimism here.
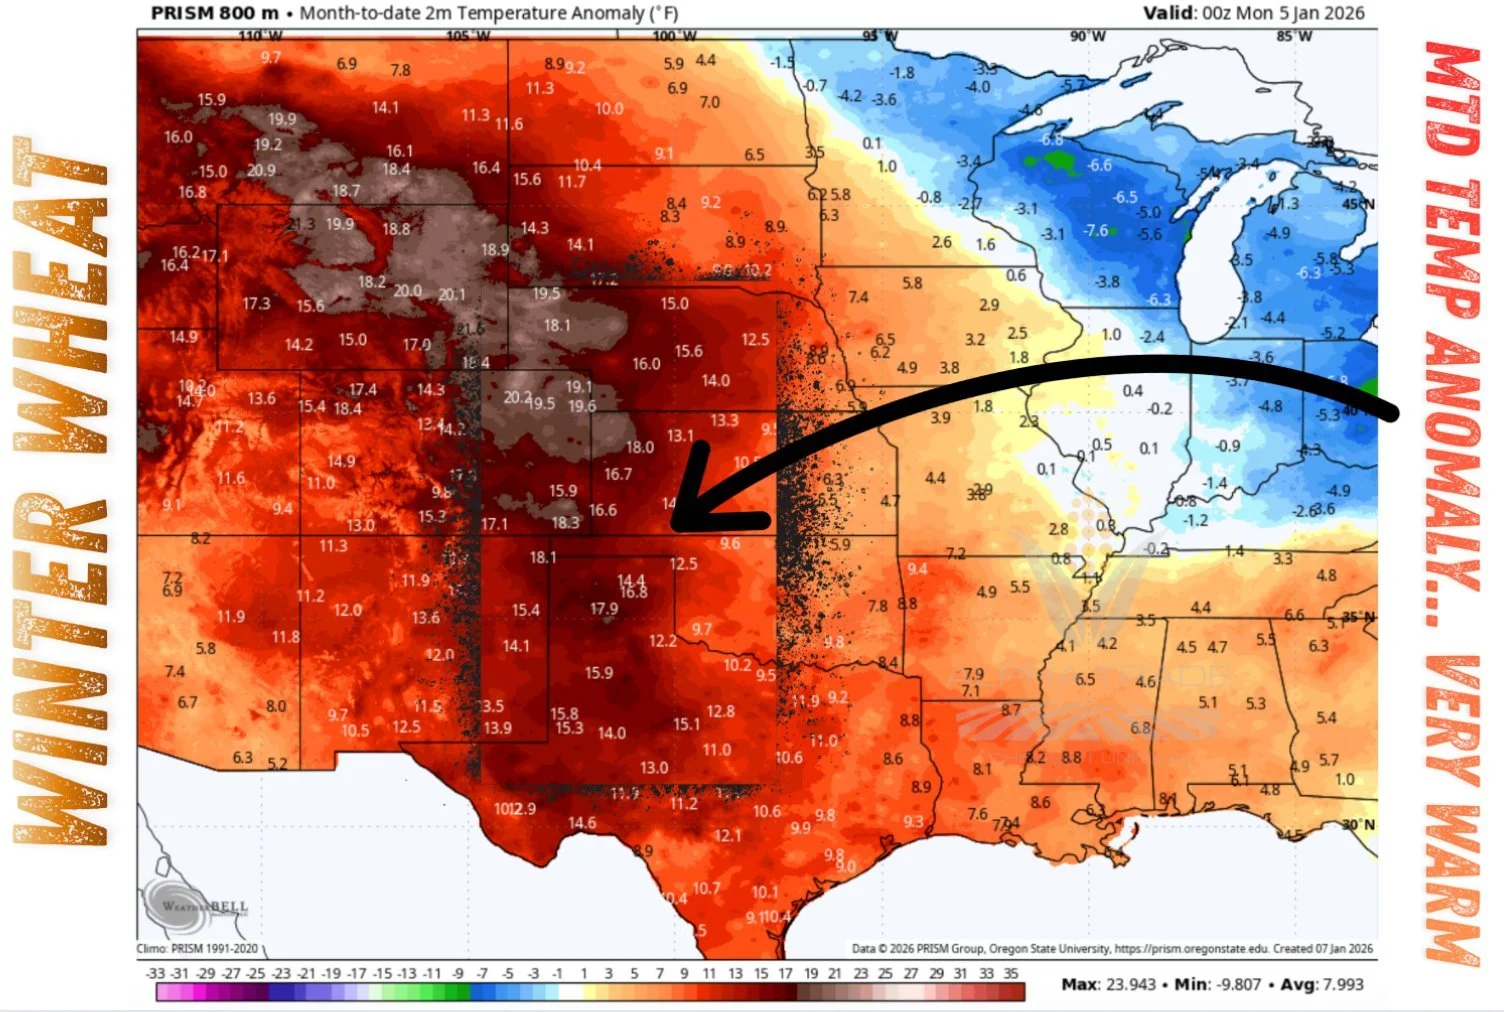
Wheat
Wheat has performed well the last few days.
It looks like we actually might be putting in a little weather premium.
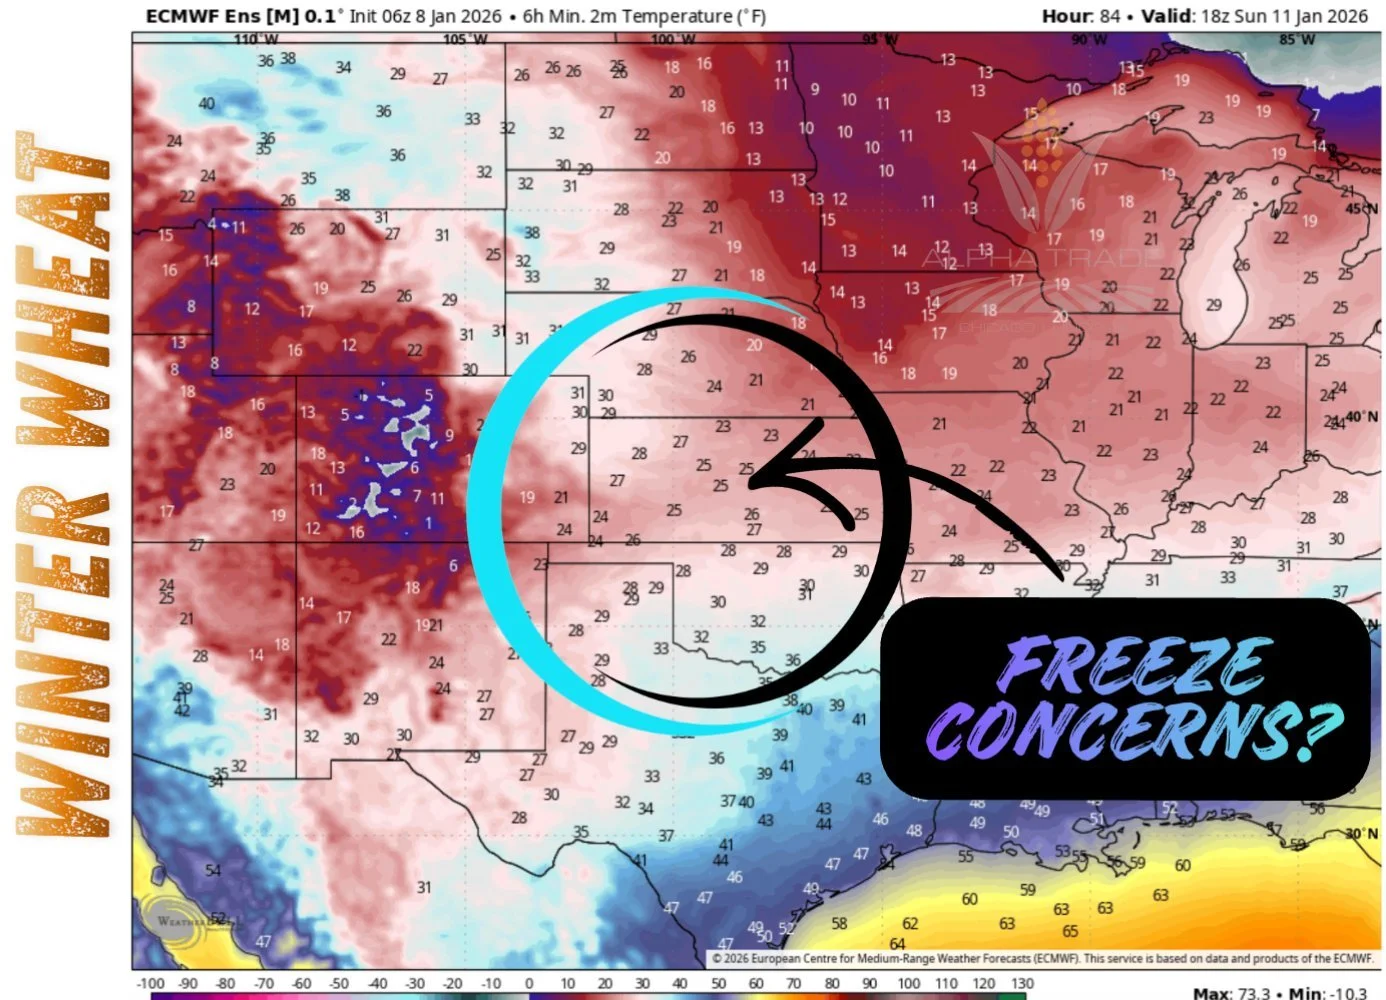
Here are some nice maps from Darrin Fessler of Lake Front Futures.
The month to date temps have been abnormally warm.
The last month has also provided zero precipitation.
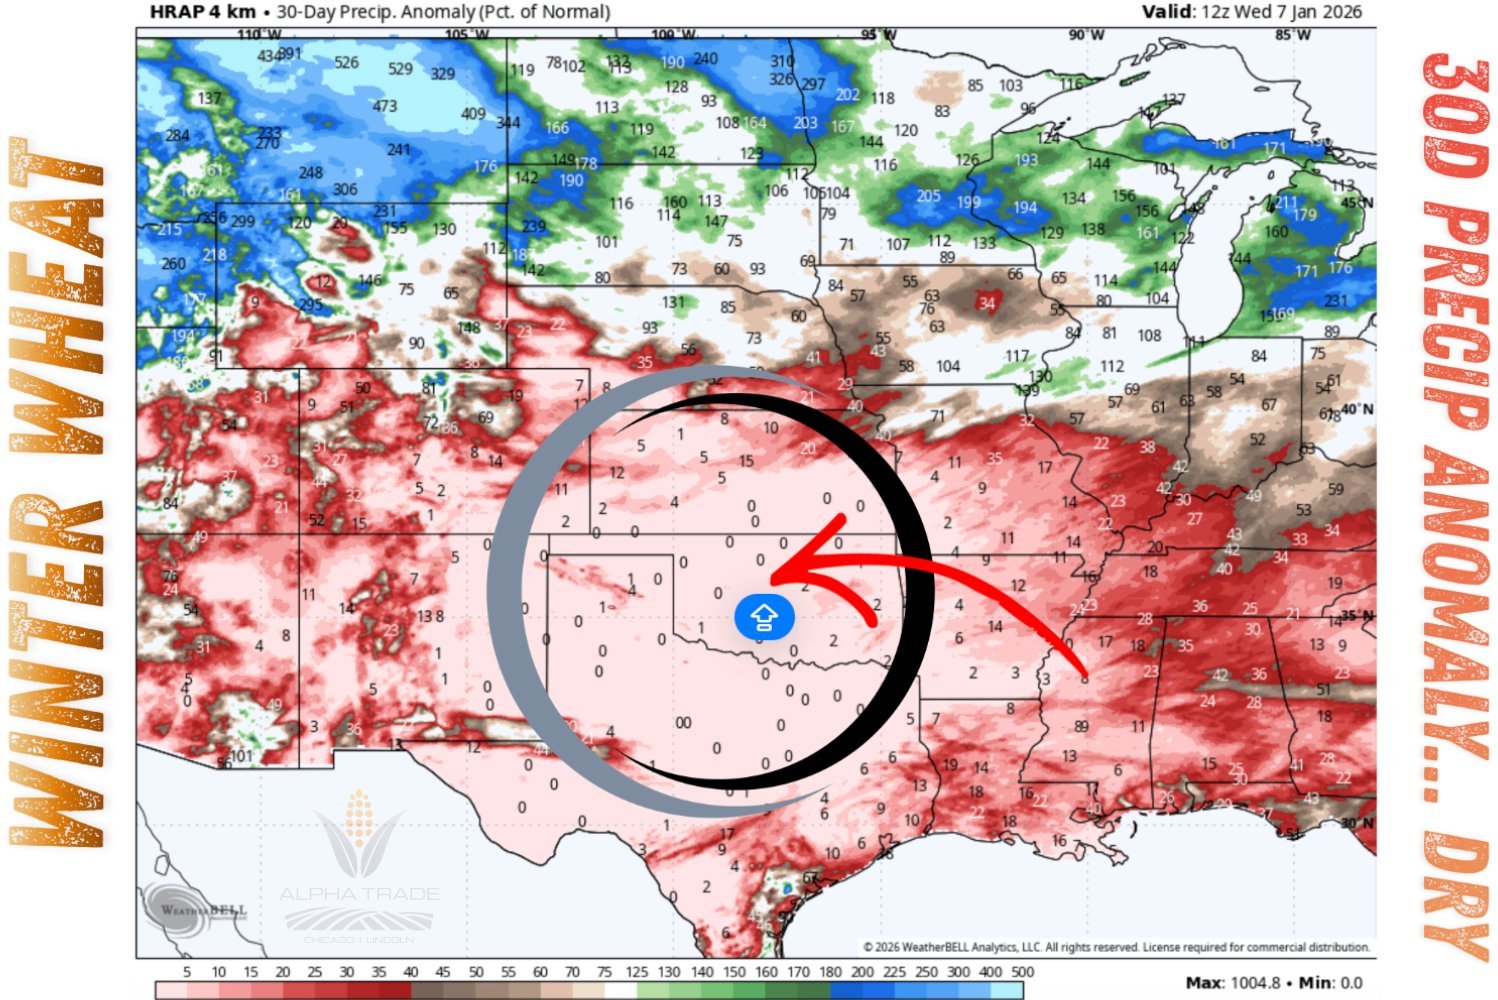
If you look at the snow depth, there is virtually no snow cover in the main winter wheat growing regions.
As there hasn’t been any precip and it's been warm.
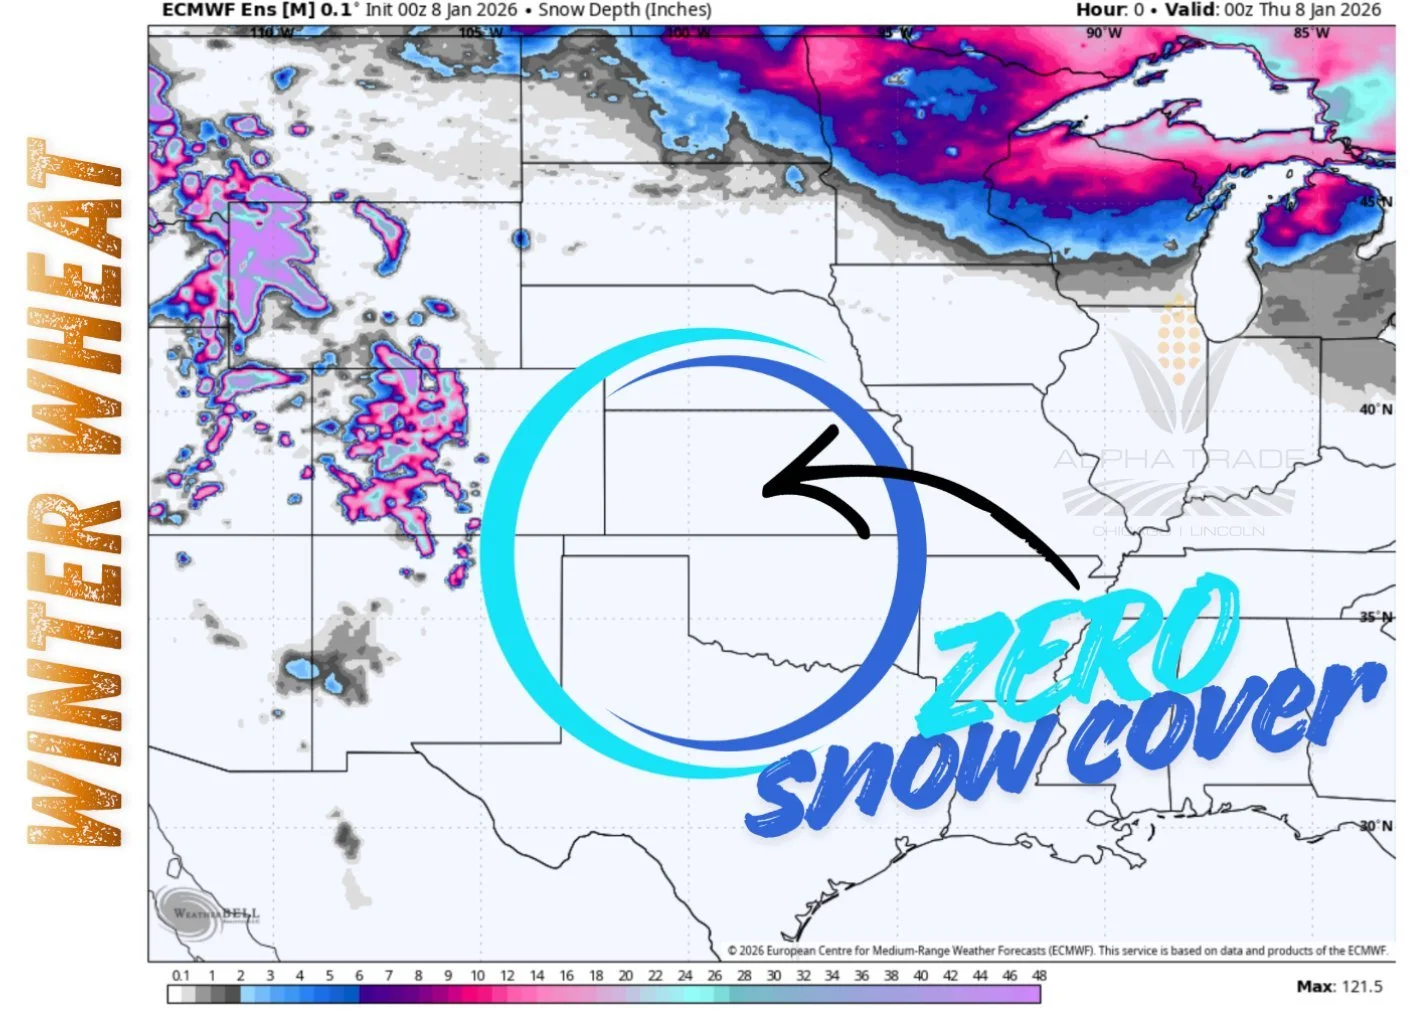
Given the lack of snow cover, it opens the door to winter kill.
So there could definitely be some freeze concerns here.
Outside of that, there are some rumors that China is having some big issues with their winter wheat crop. Will have to be a story to keep your eye on, as it could help our export demand.
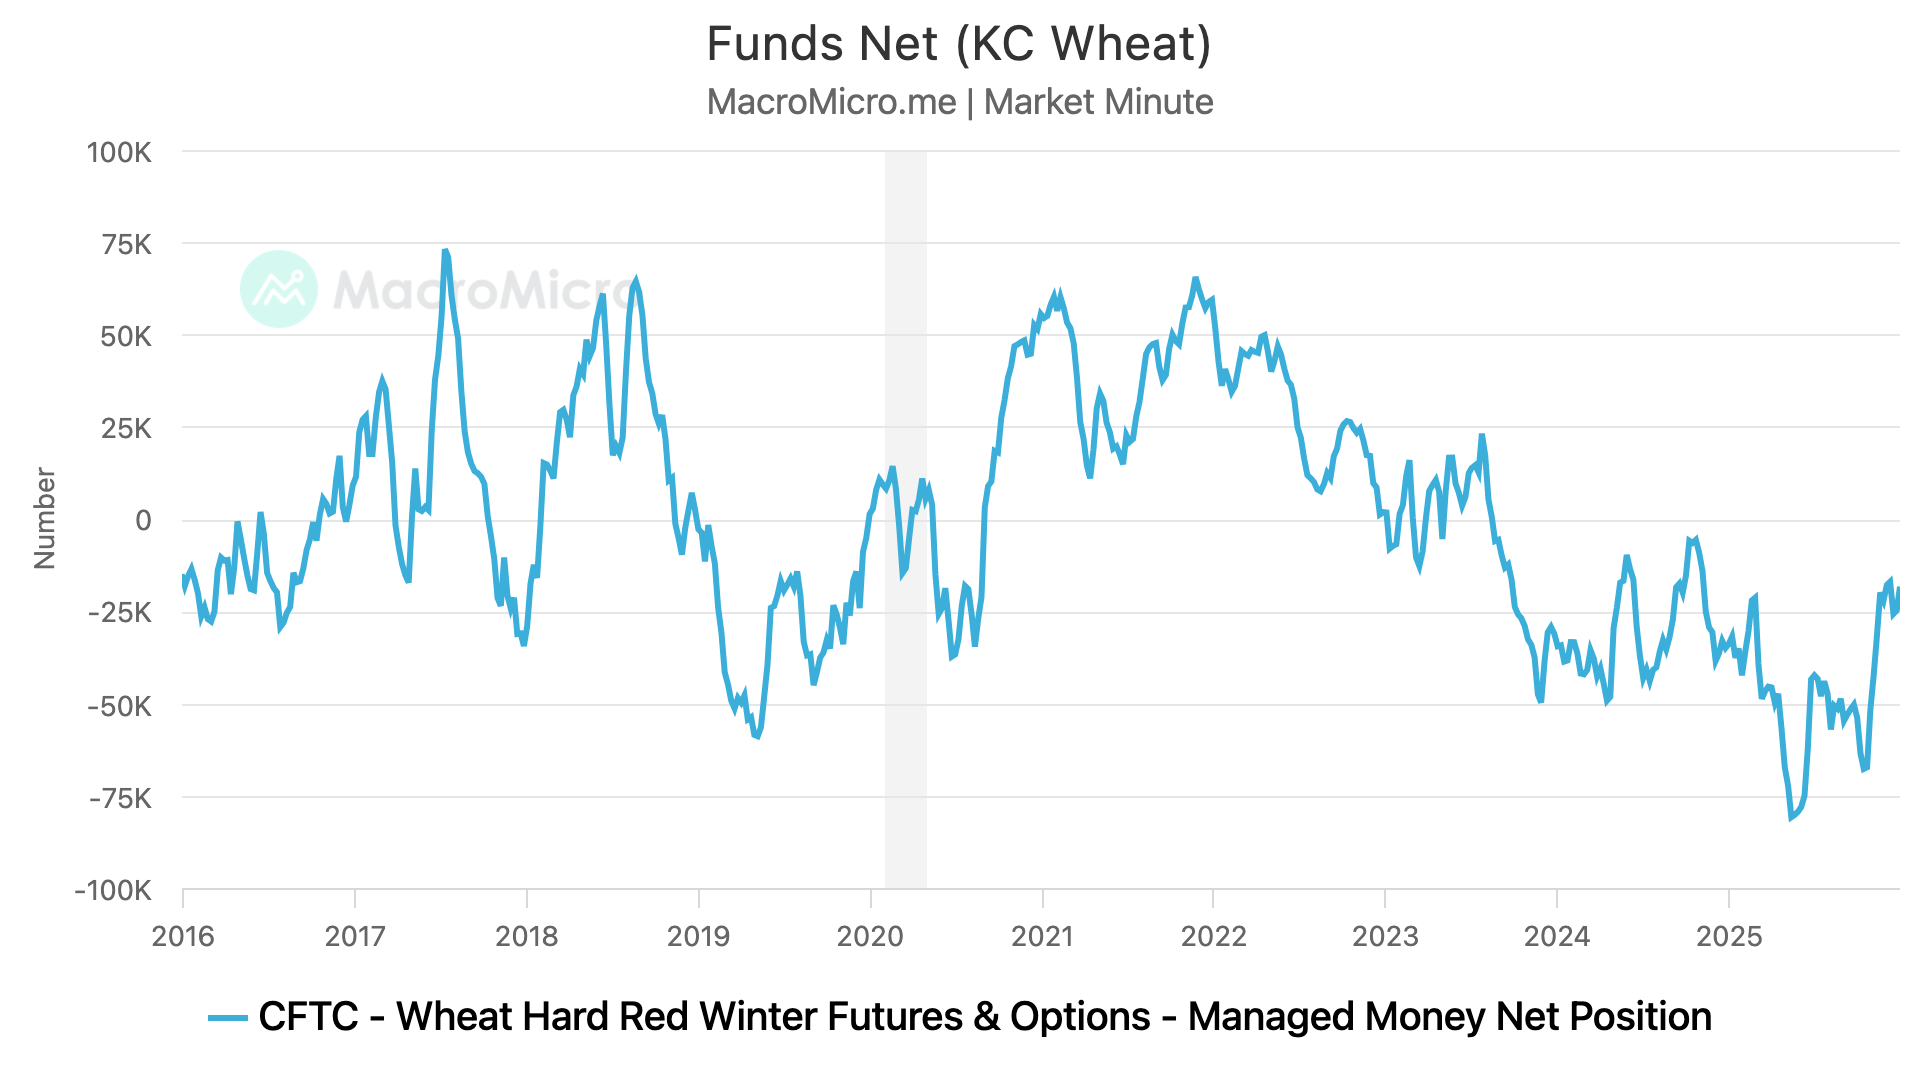
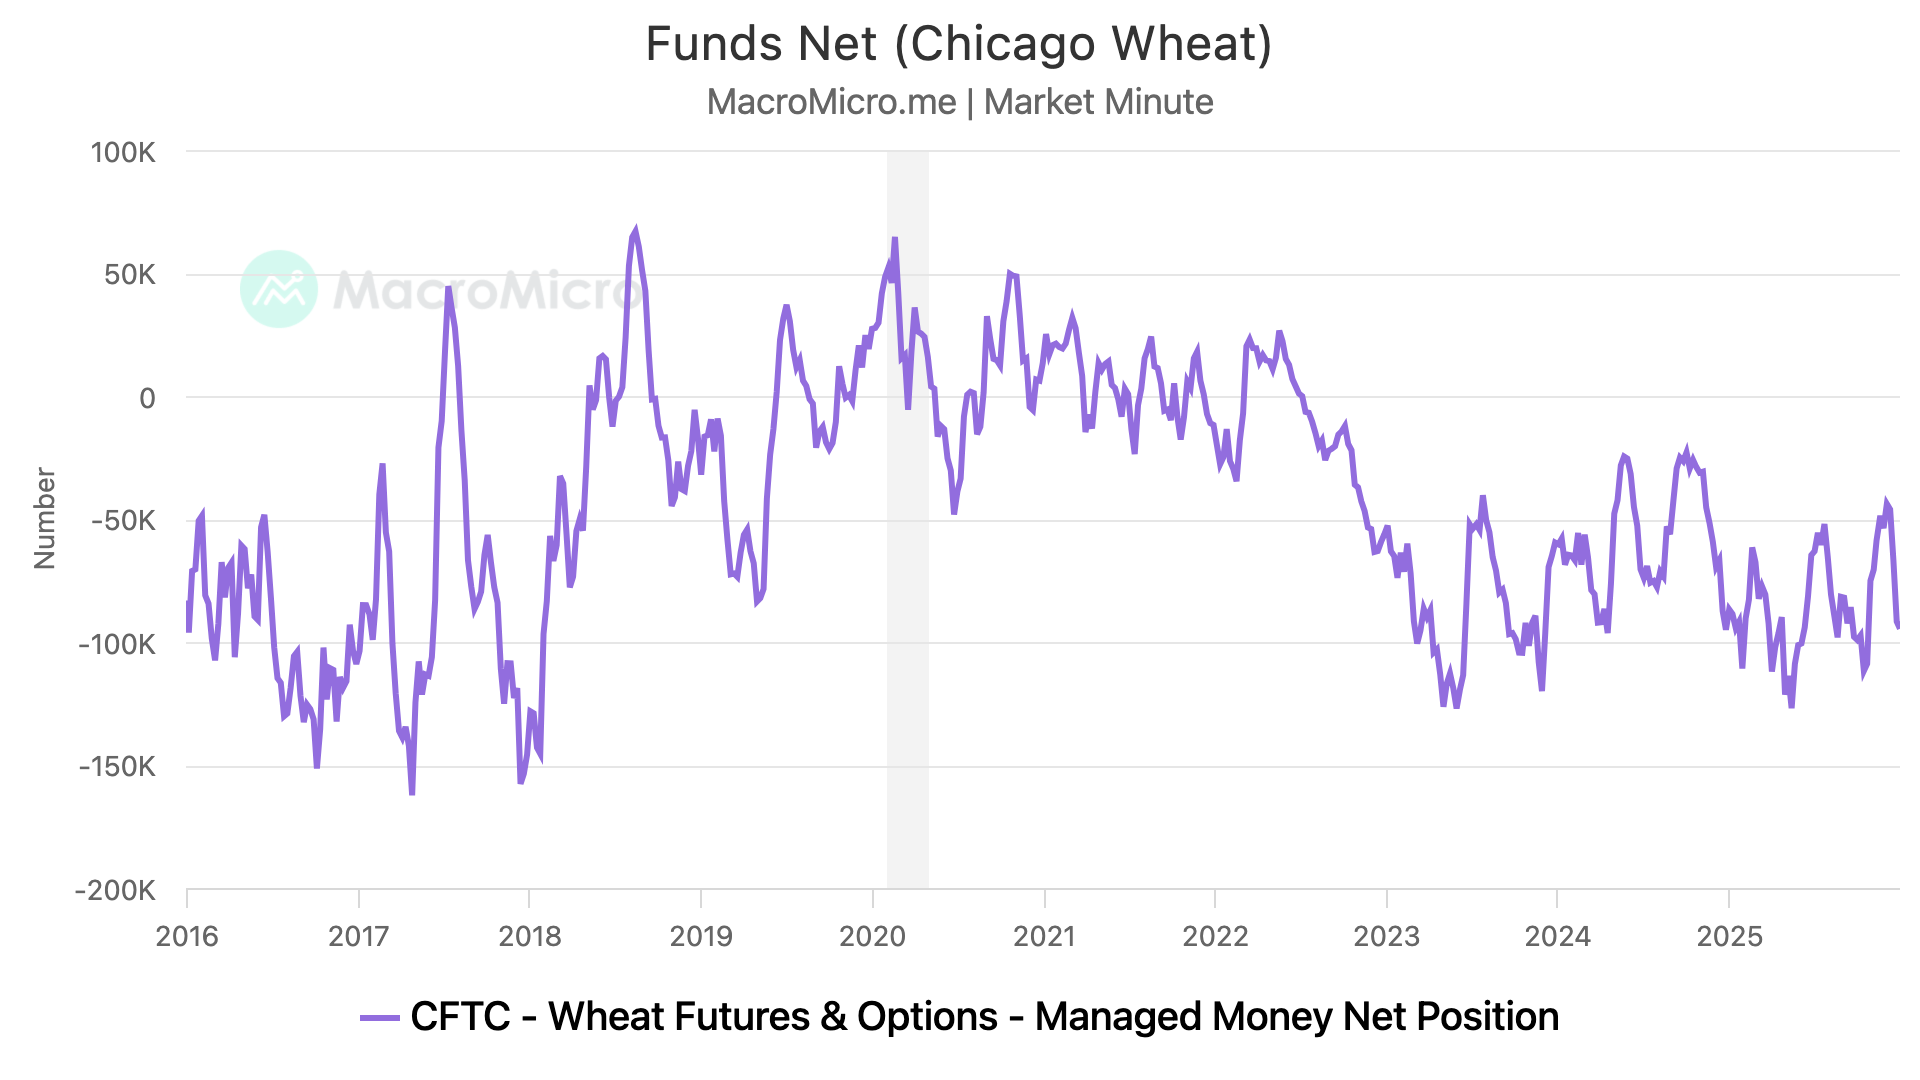
We also have the funds.
They are incredibly short wheat.
They are almost always short. They haven’t been long KC wheat since 2023 and haven’t been long Chicago since 2022.
That is why anytime we see a supply issue somewhere, wheat goes on a fast short covering rally, but the rally typically doesn’t last.
(For example: Russia drought concerns in May 2024)
At a certain point, does it really make sense for the funds to continue shorting and pounding wheat to zero when we're already at multi-year lows?
I don’t think keeping wheat below $5.00 for a sustained period of time would make much sense from a risk to reward perspective if I were the funds.
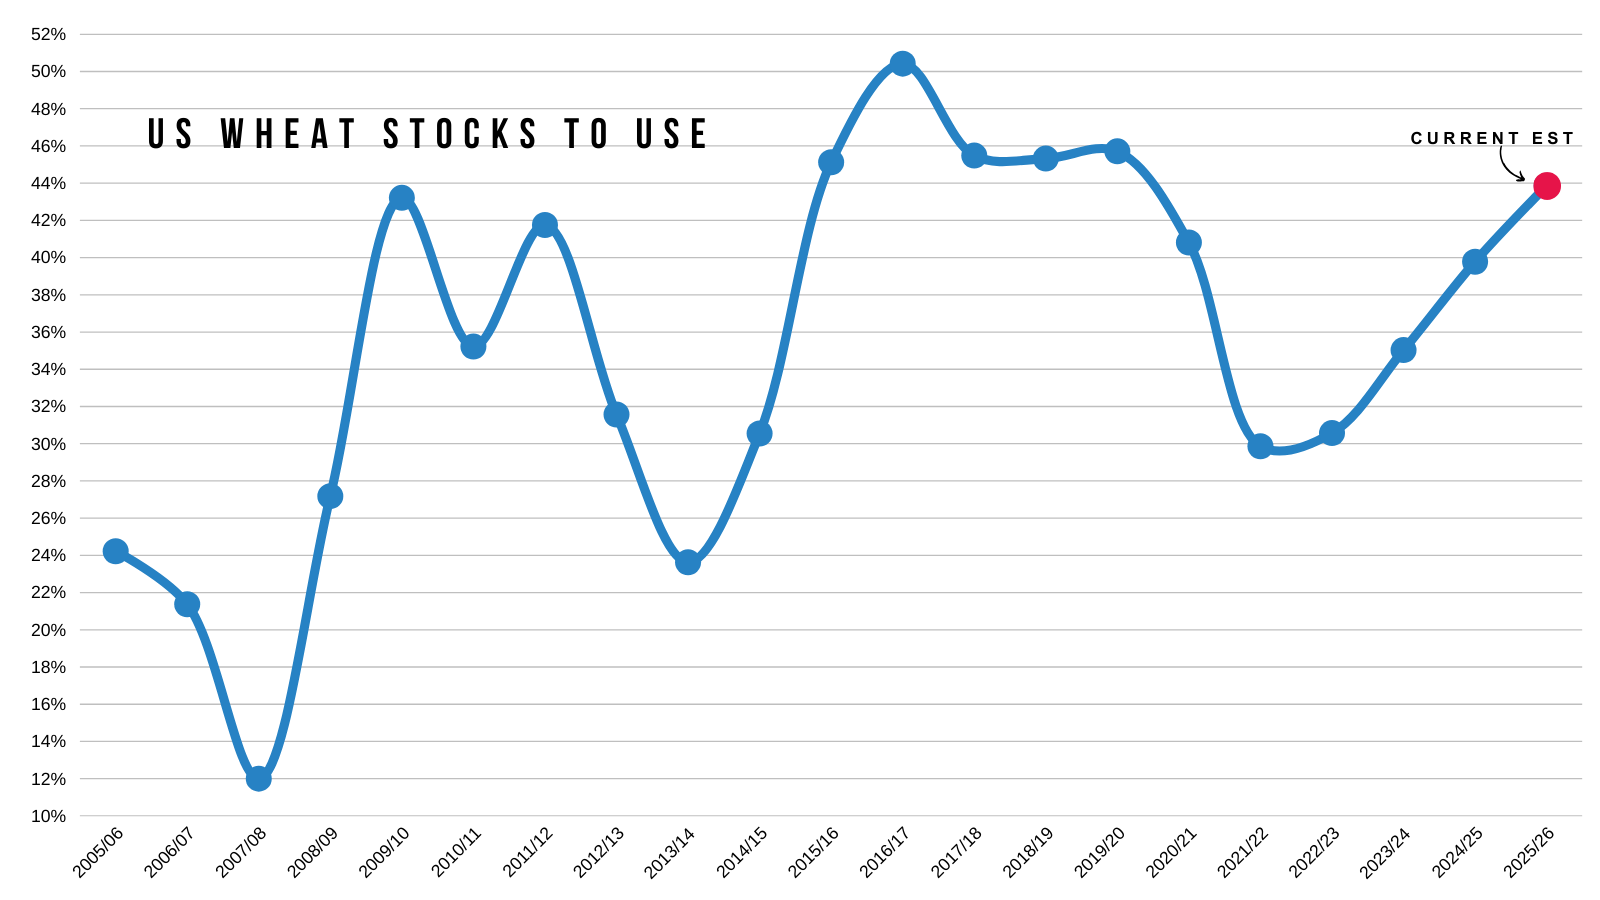
The wheat story isn’t "bullish".
The US stocks to use ratio can tell you that.
World crops continue to get bigger.
But is wheat below $5.00 really justified here?
I'd say probably not. At least not for long if so.
So I'd like to think the wheat market has more upside potential than downside potential even though bulls struggle to find a story or major upside catalyst.
It feels like it might take a supply scare somewhere for this market to really provide an opportunity.
Still just waiting for the market to provide that opportunity that only seems to come around once or twice a year in wheat.
Technicals:
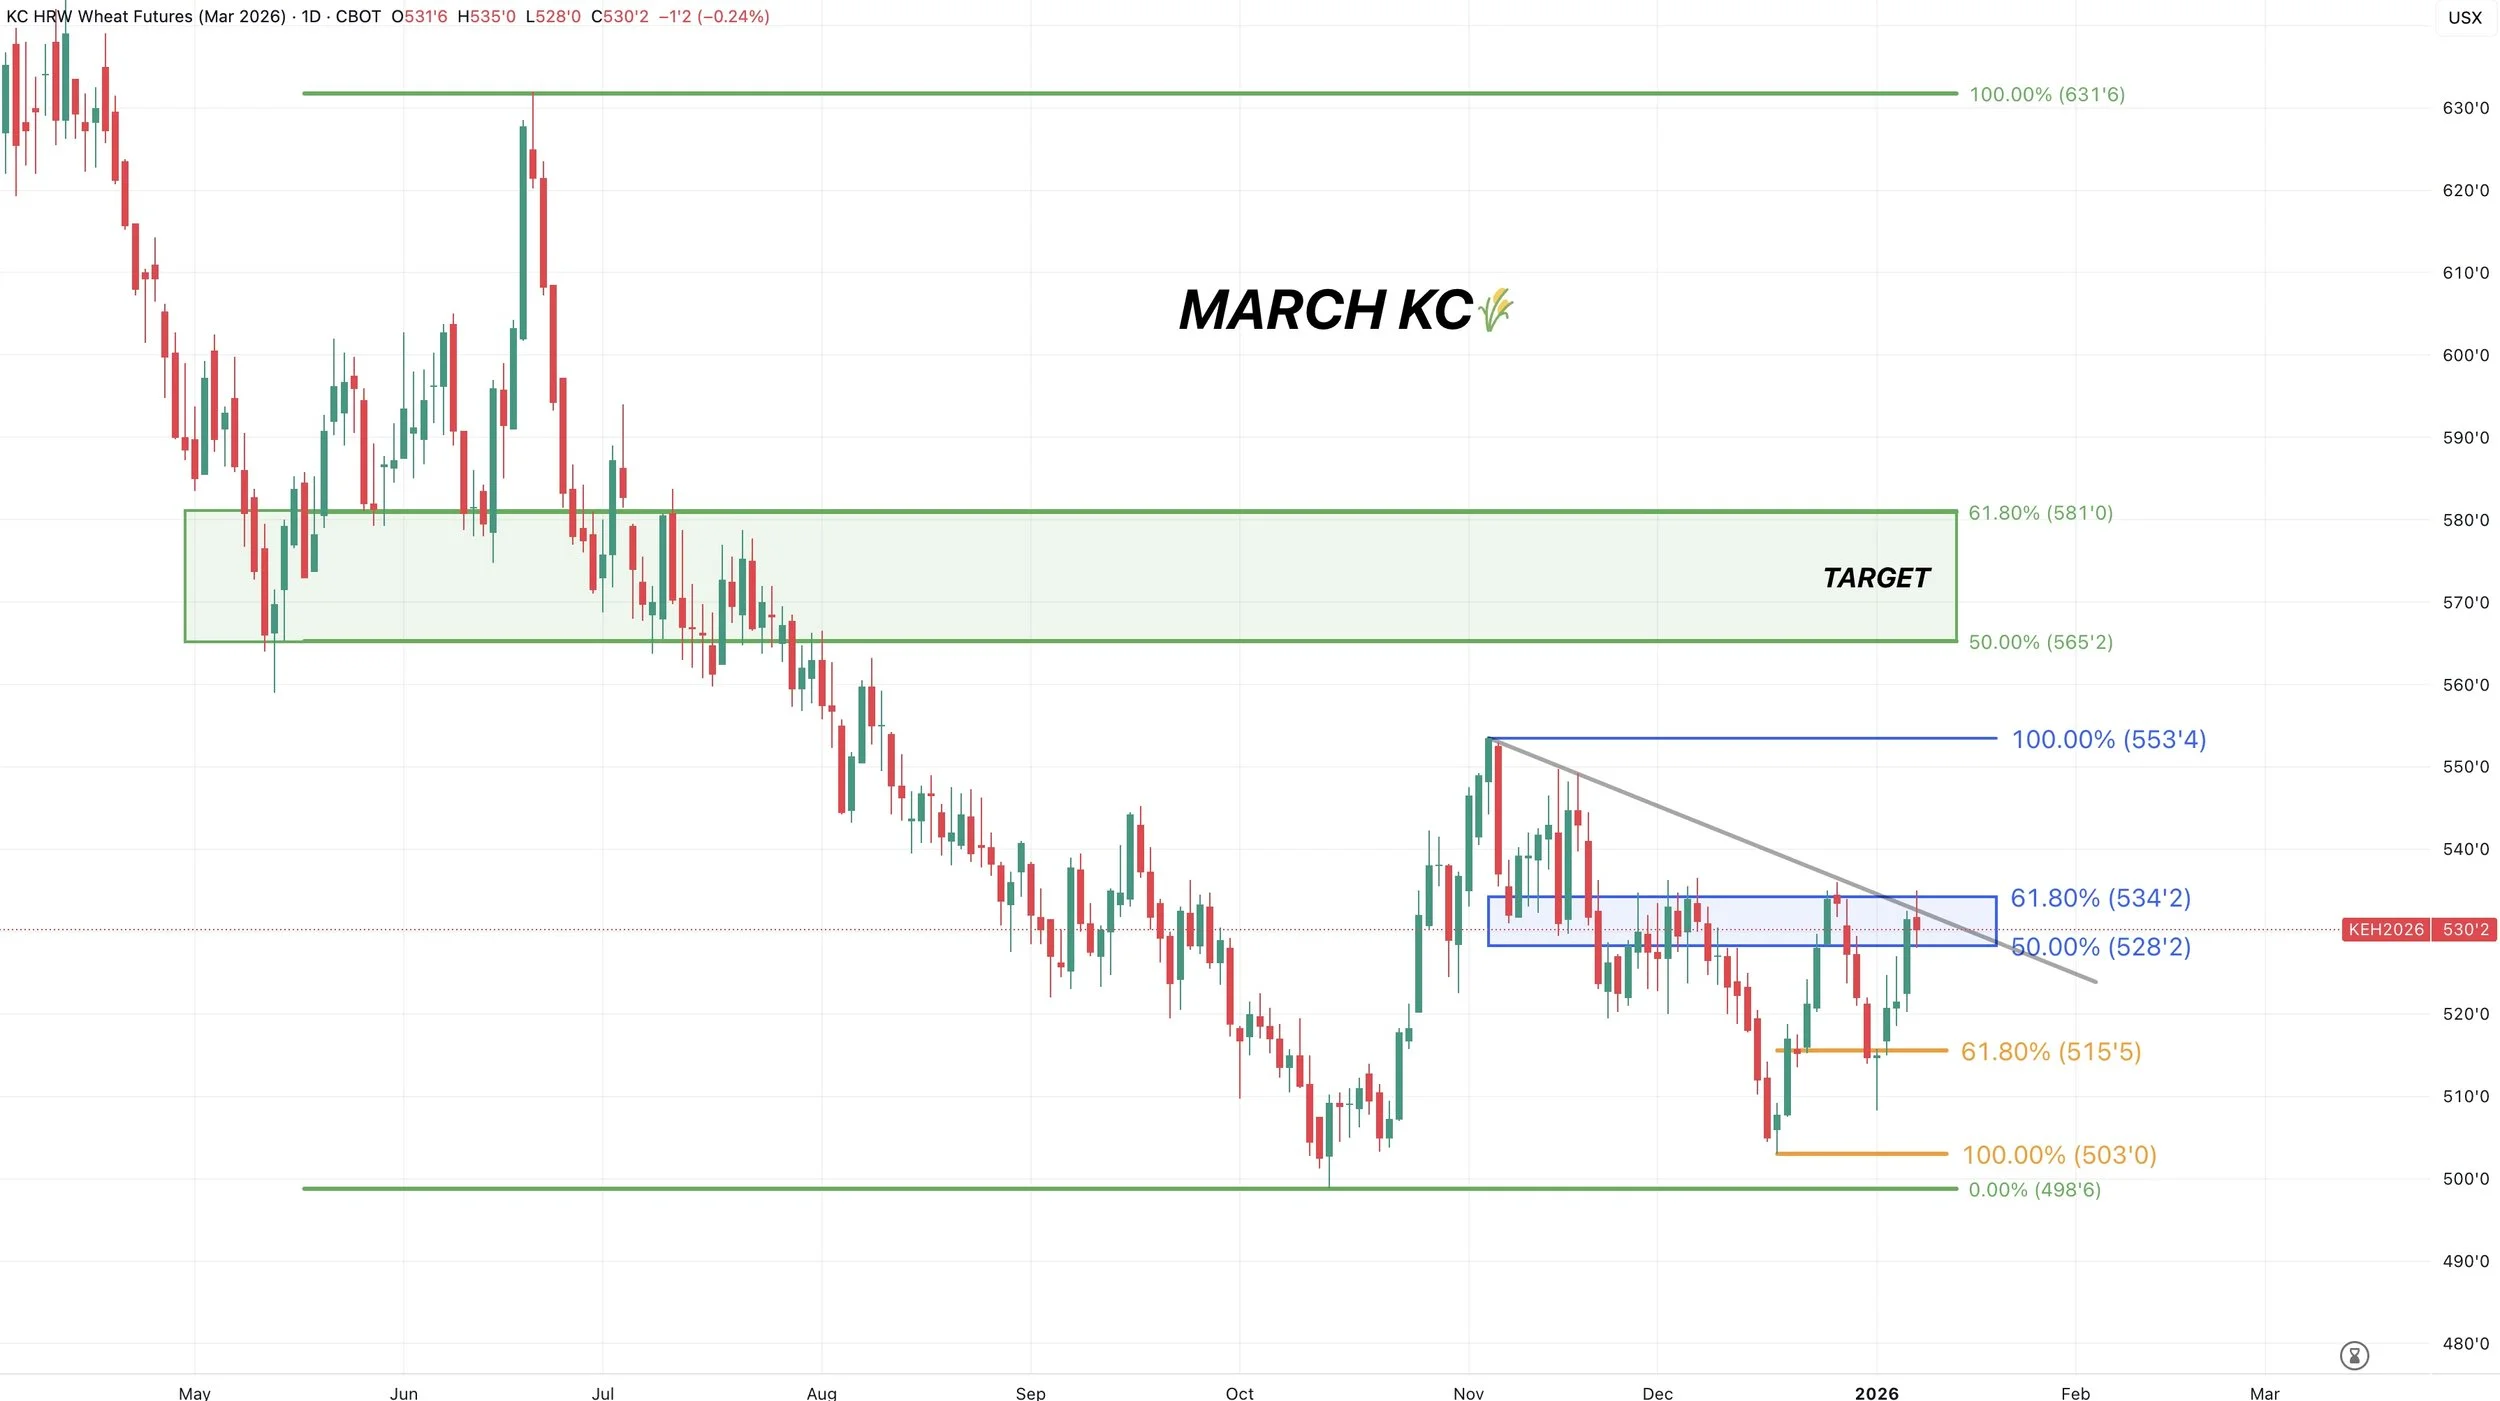
March KC
We are right back at a key spot for bulls.
Sitting right below the 61.8% retracement up to those November highs.
If we break above it, it should spark a leg higher.
At the same time, we have some trendline resistance that should add more fuel if we get the breakout.
Pretty big spot to break.
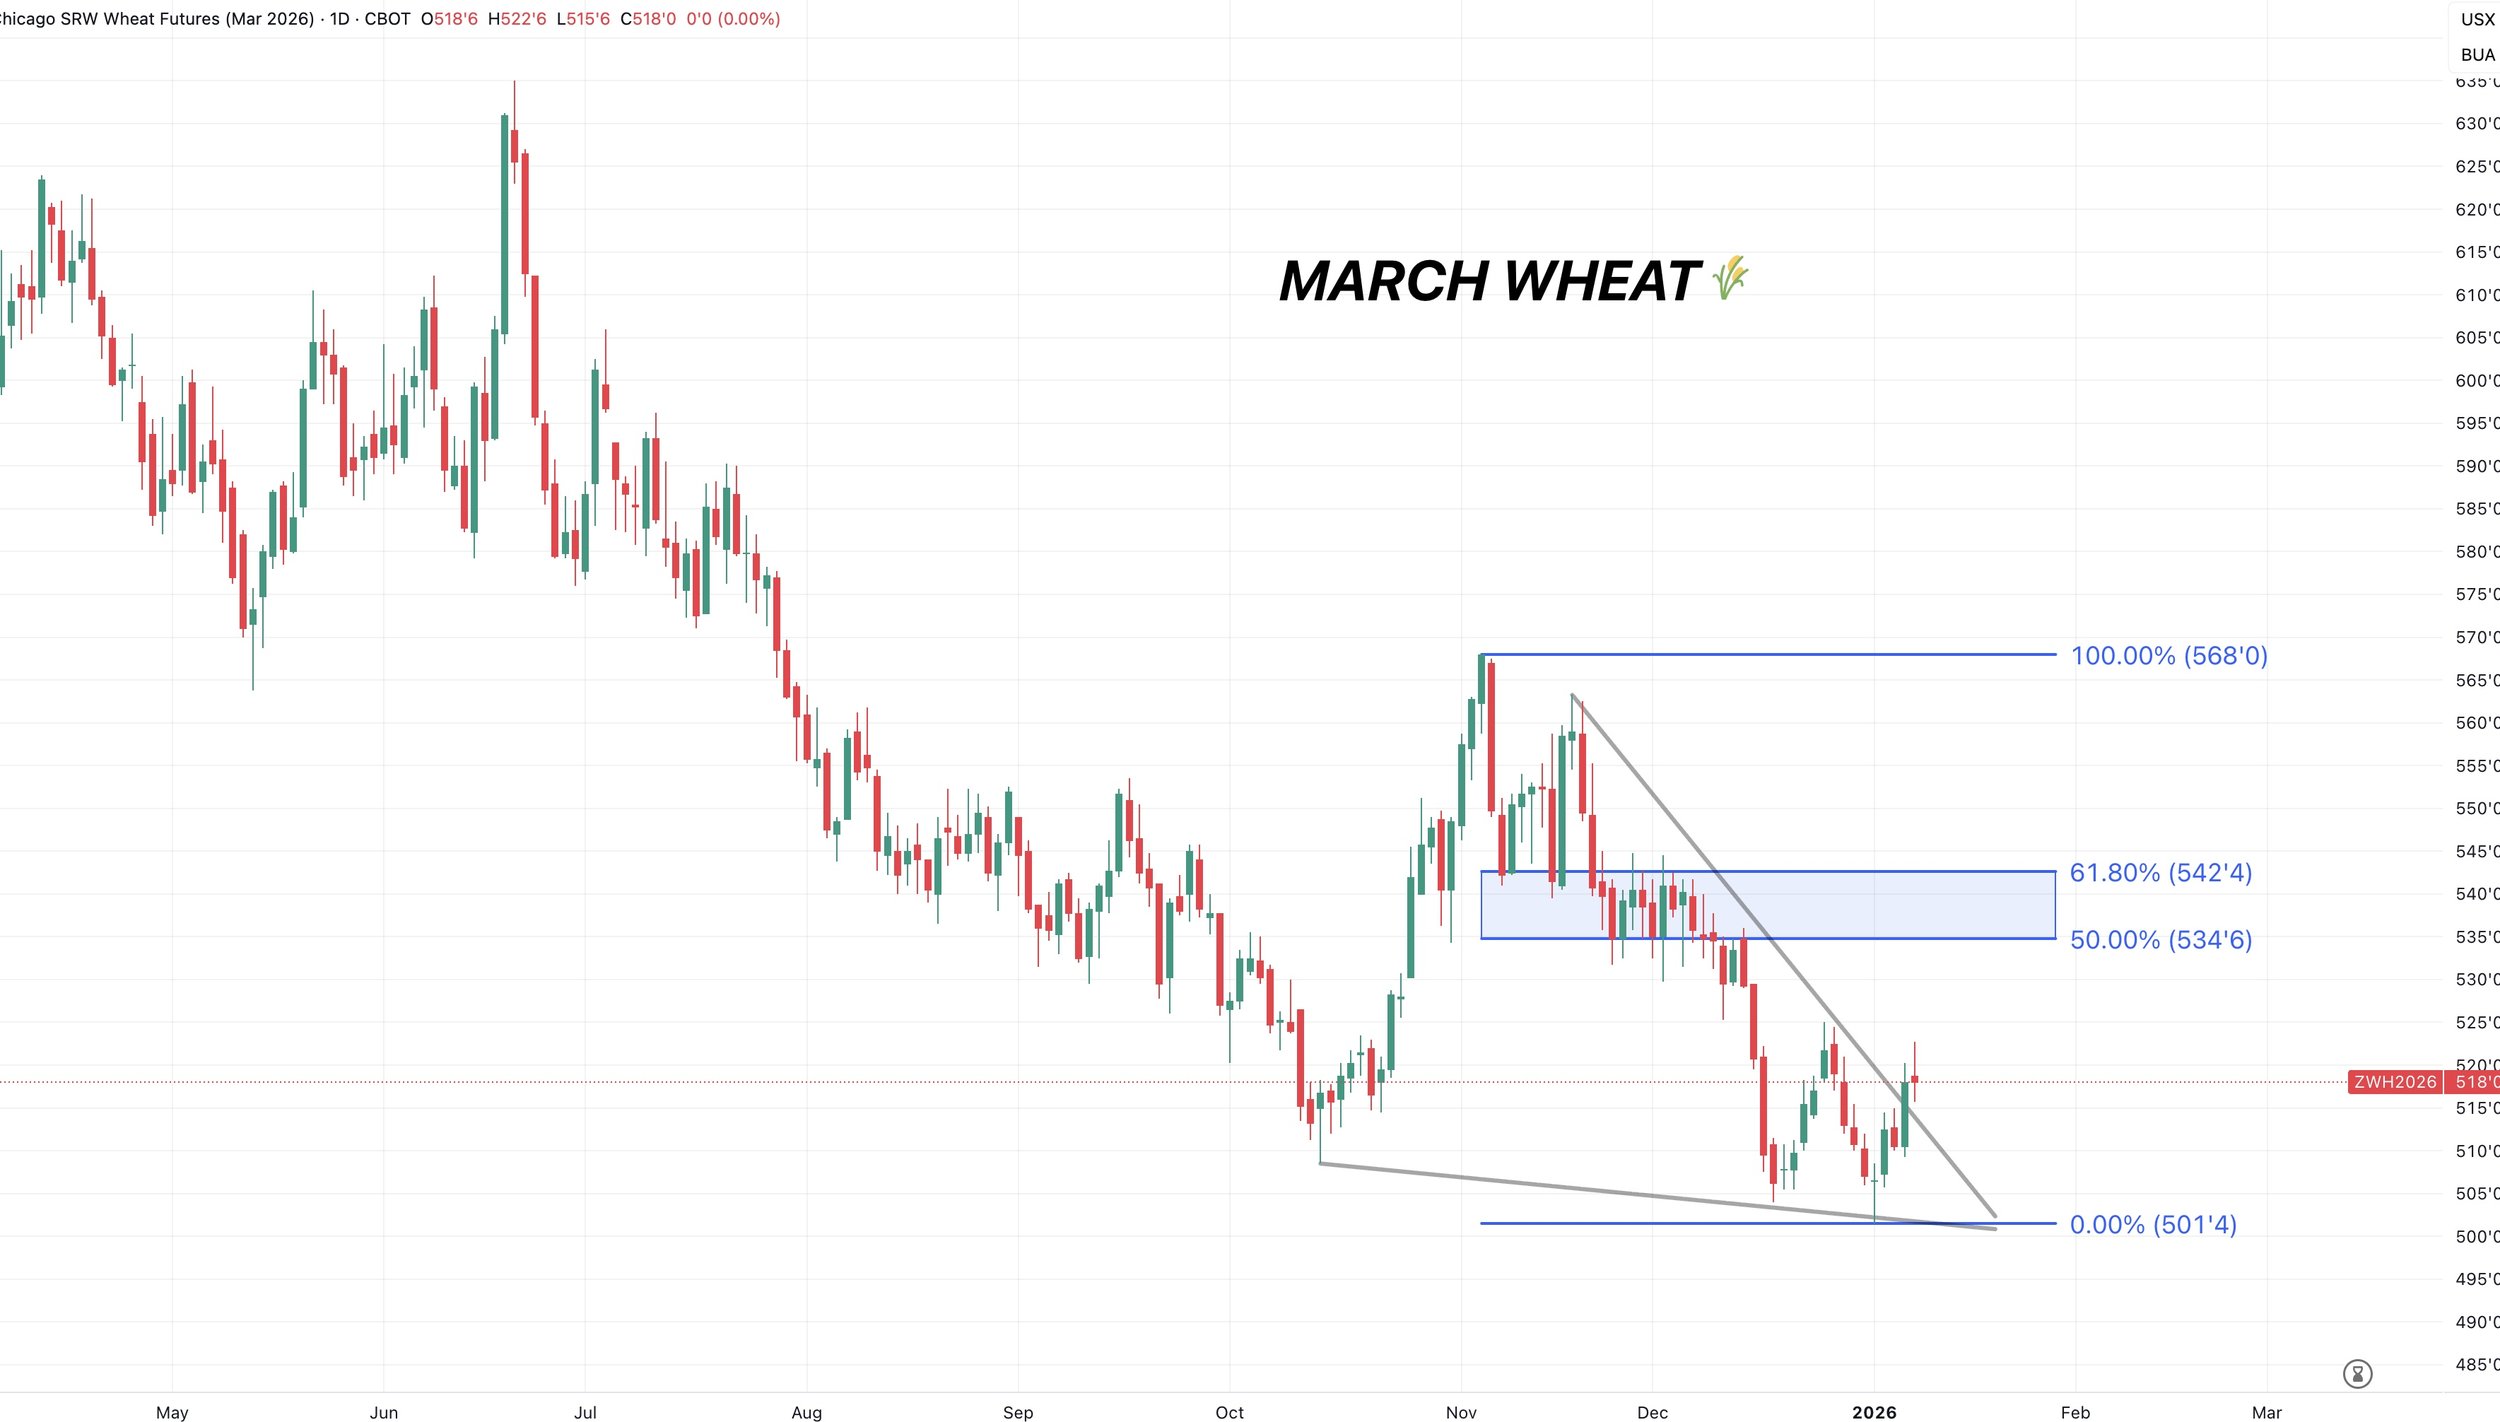
March Chicago
Still a little early to claim we've found a bottom.
But the chart is starting to look better.
With a potential breakout here of trendline resistance.
Cattle
Fundamentals:
Yesterday was the first day lower in cattle since Christmas.
Tuesday I talked about how the recent rally the past week or so didn’t make a ton of sense from a fundamental standpoint.
We were ripping higher even though packers are in the red, we had a plant close down, and cut out isn’t strong.
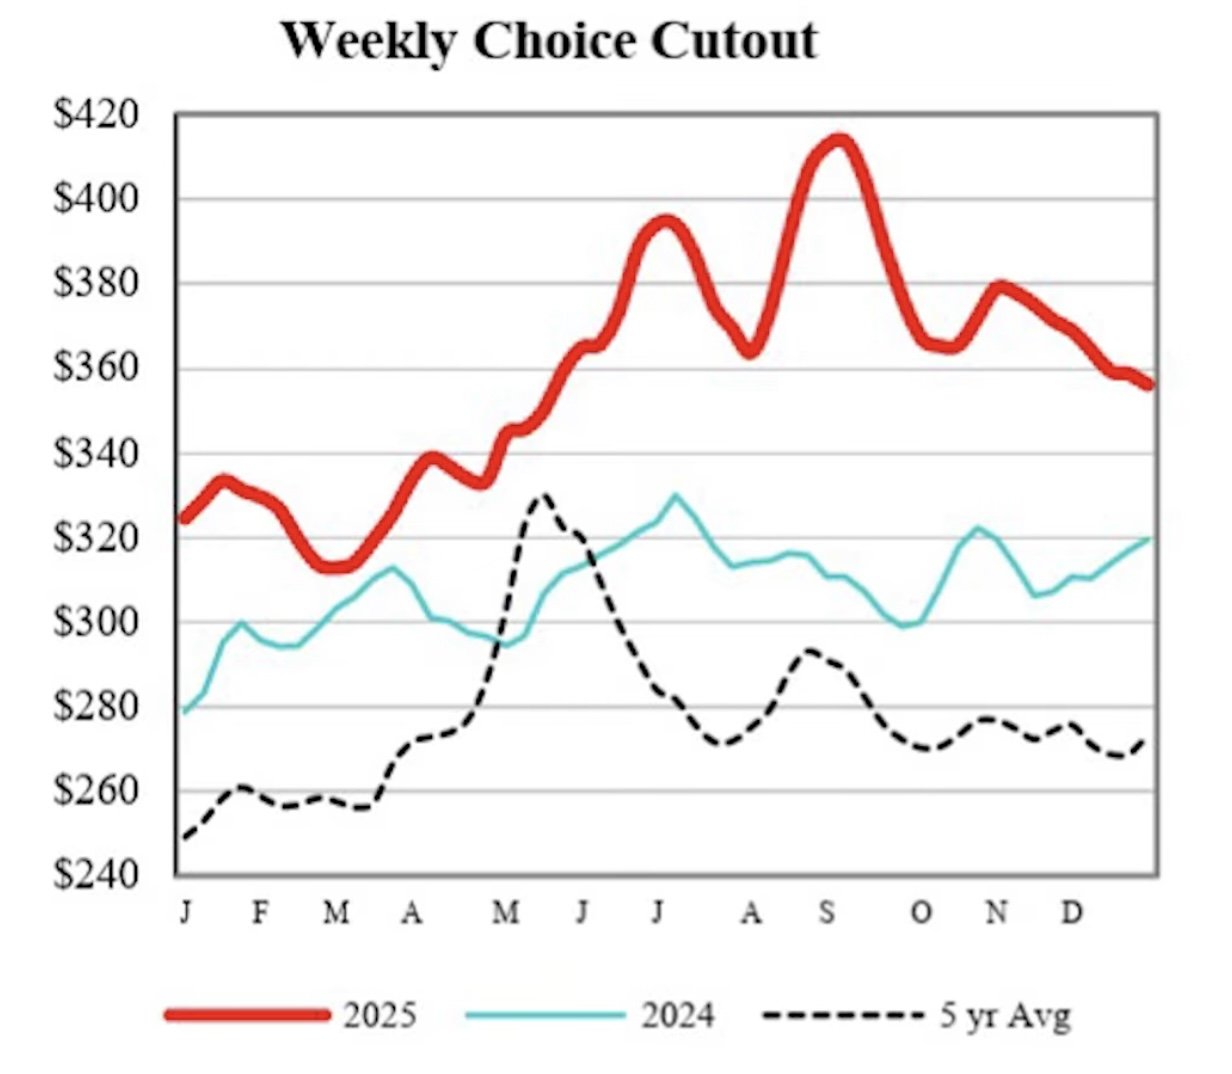
For this market to justifiably keep going higher, we need to see cash keep going higher or cut out needs to improve a lot.
For reference, cut out values dropped below $350 for the first time since last spring.
This is telling us that demand is getting softer and can lead to packers losing their leverage to bid cattle higher.
In other words, the wholesale side of the market is blinking first.
Which is a reason to have some caution up here following the big rally.
Cash is king in this market.
It could continue to be strong, but the seasonals do lean to the negative side there.
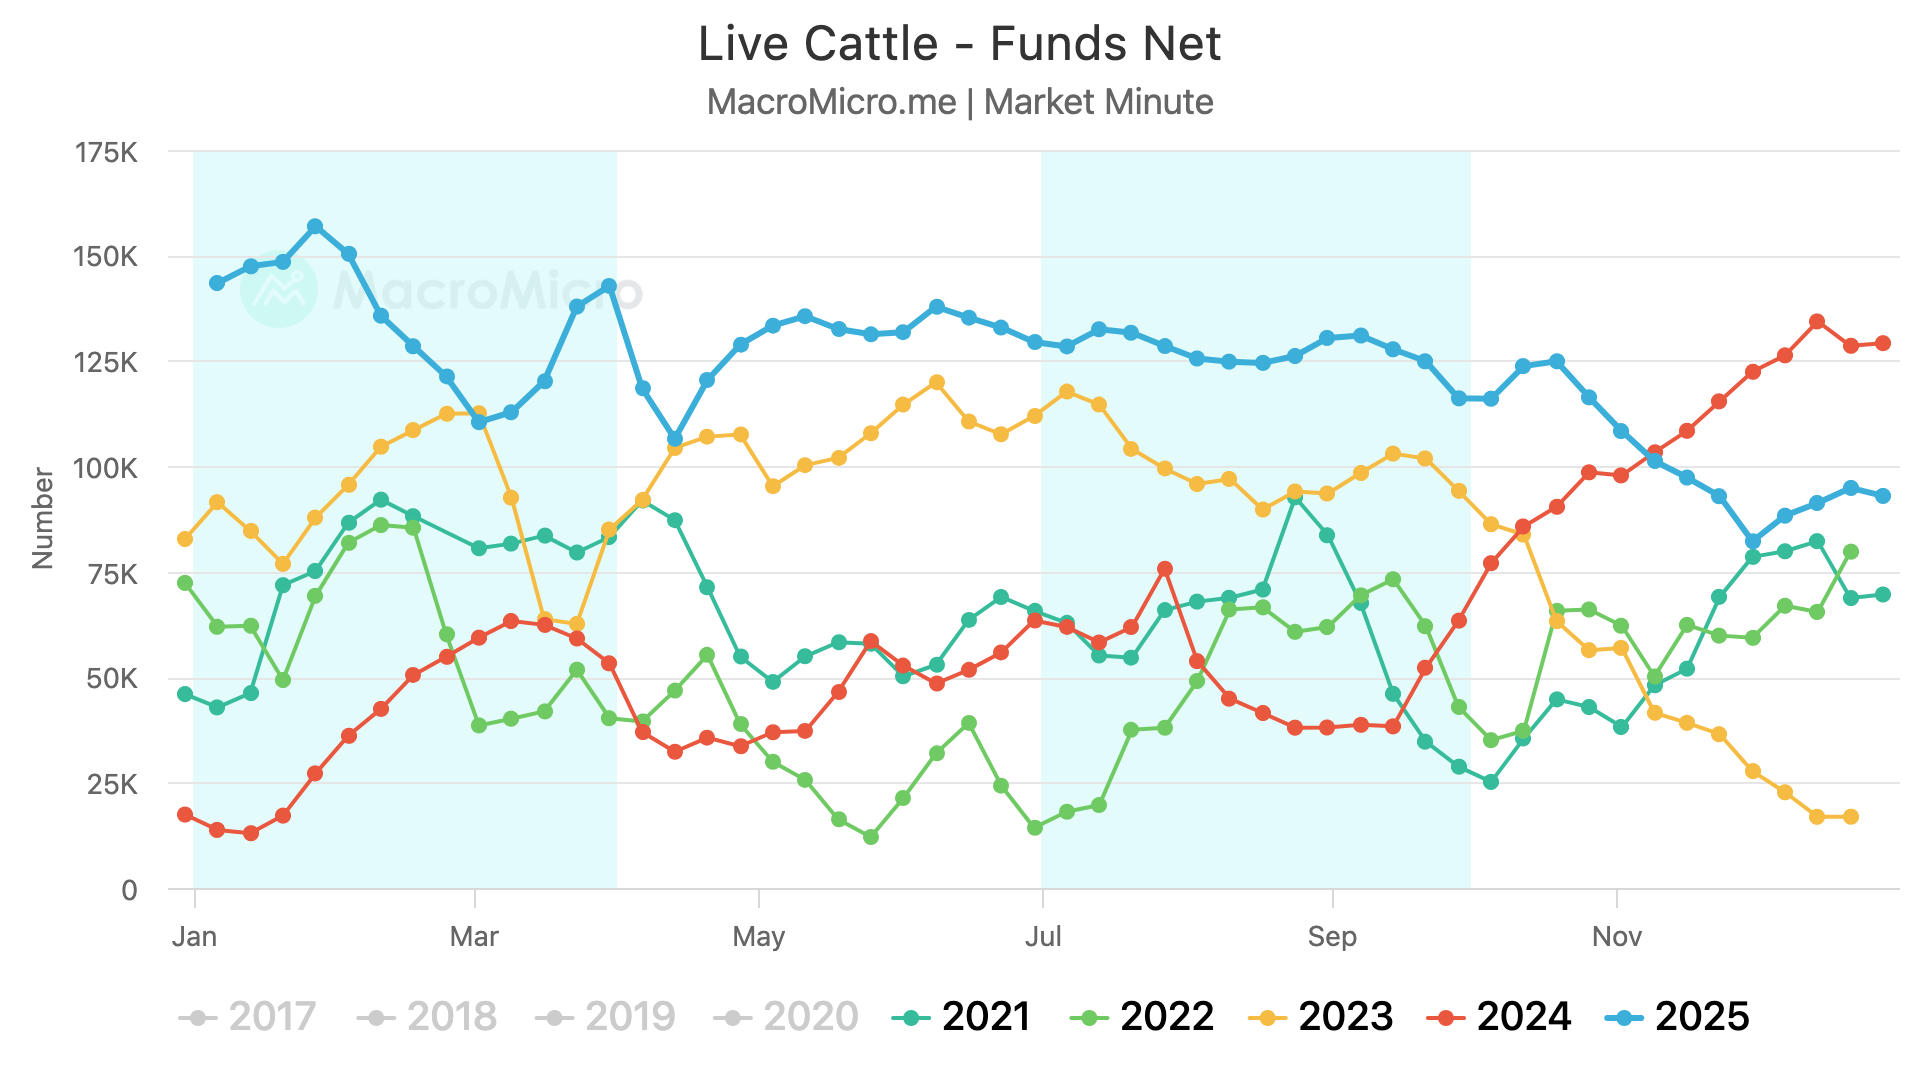
If the funds want to continue piling into this market, you can’t rule out us going and posting new highs.
The funds are holding their smallest long position in a year.
On one hand you could argue they have plenty of ammo to get long.
On the other hand, you have to question what would make them get aggressively long again after being burnt back in the fall.
To me it just feels like this market might need an outside factor to justify going and posting new highs.
So we still like defending these levels in some sort of fashion.
Today we did see the cash feeder index higher and boxed beef higher so that could provide some more strength, but the market seems to be slowing down.
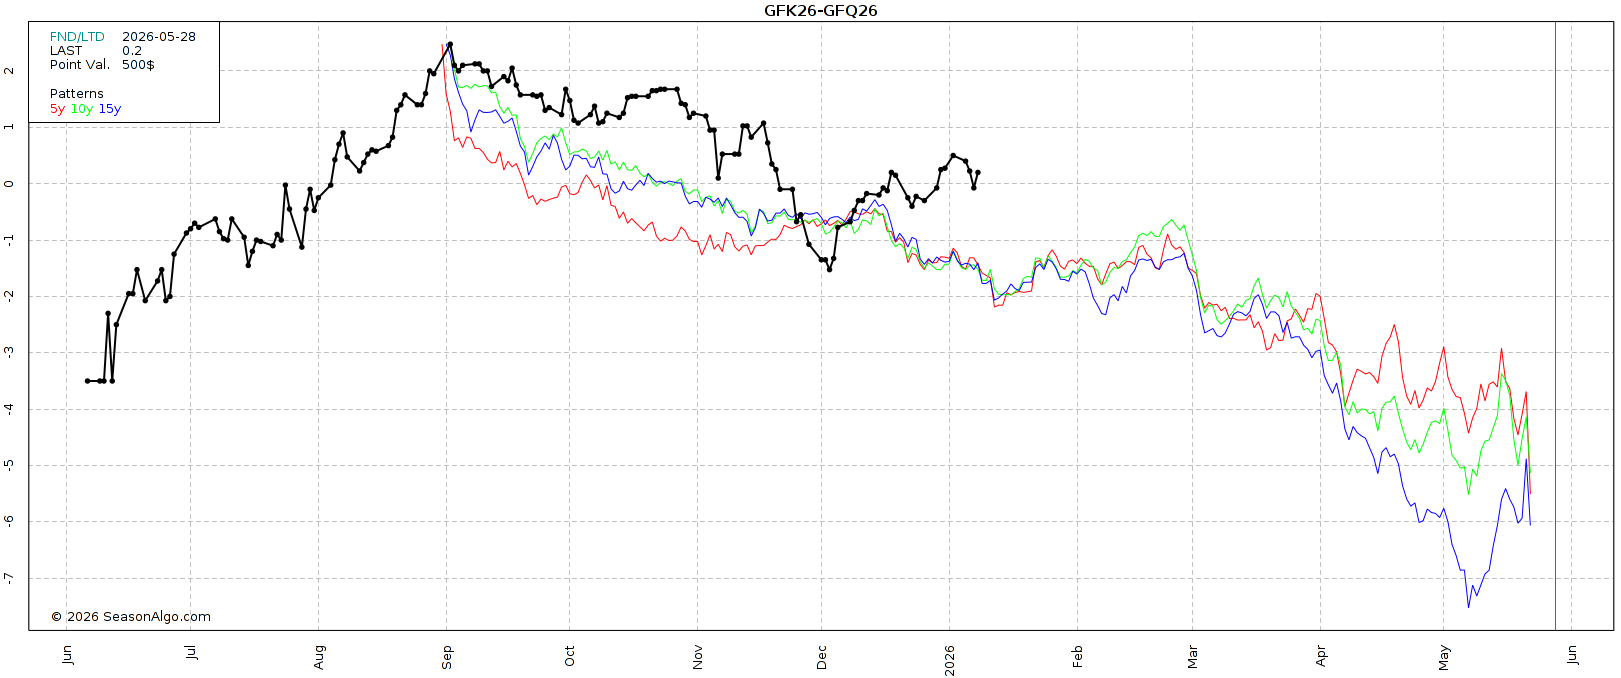
Spread Trade Idea
If you want to trade a spread, here is a trade.
Selling May Feeders - Buying August Feeders.
Typically August is at a premiuim to May. Right now they are even. Margin on this is $800/contract.
Call us if you have questions on any of these trades.
Jeremey: (605)250-3863
Lauren: (806)391-7178
All of these trade ideas today came from Lauren and Jeremey at Texas Hedge Risk Management.
Visit their website for more details that include the risk and reward for each strategy: Click Here
May/Aug Feeder Cattle Spread Seasonal
Technicals:
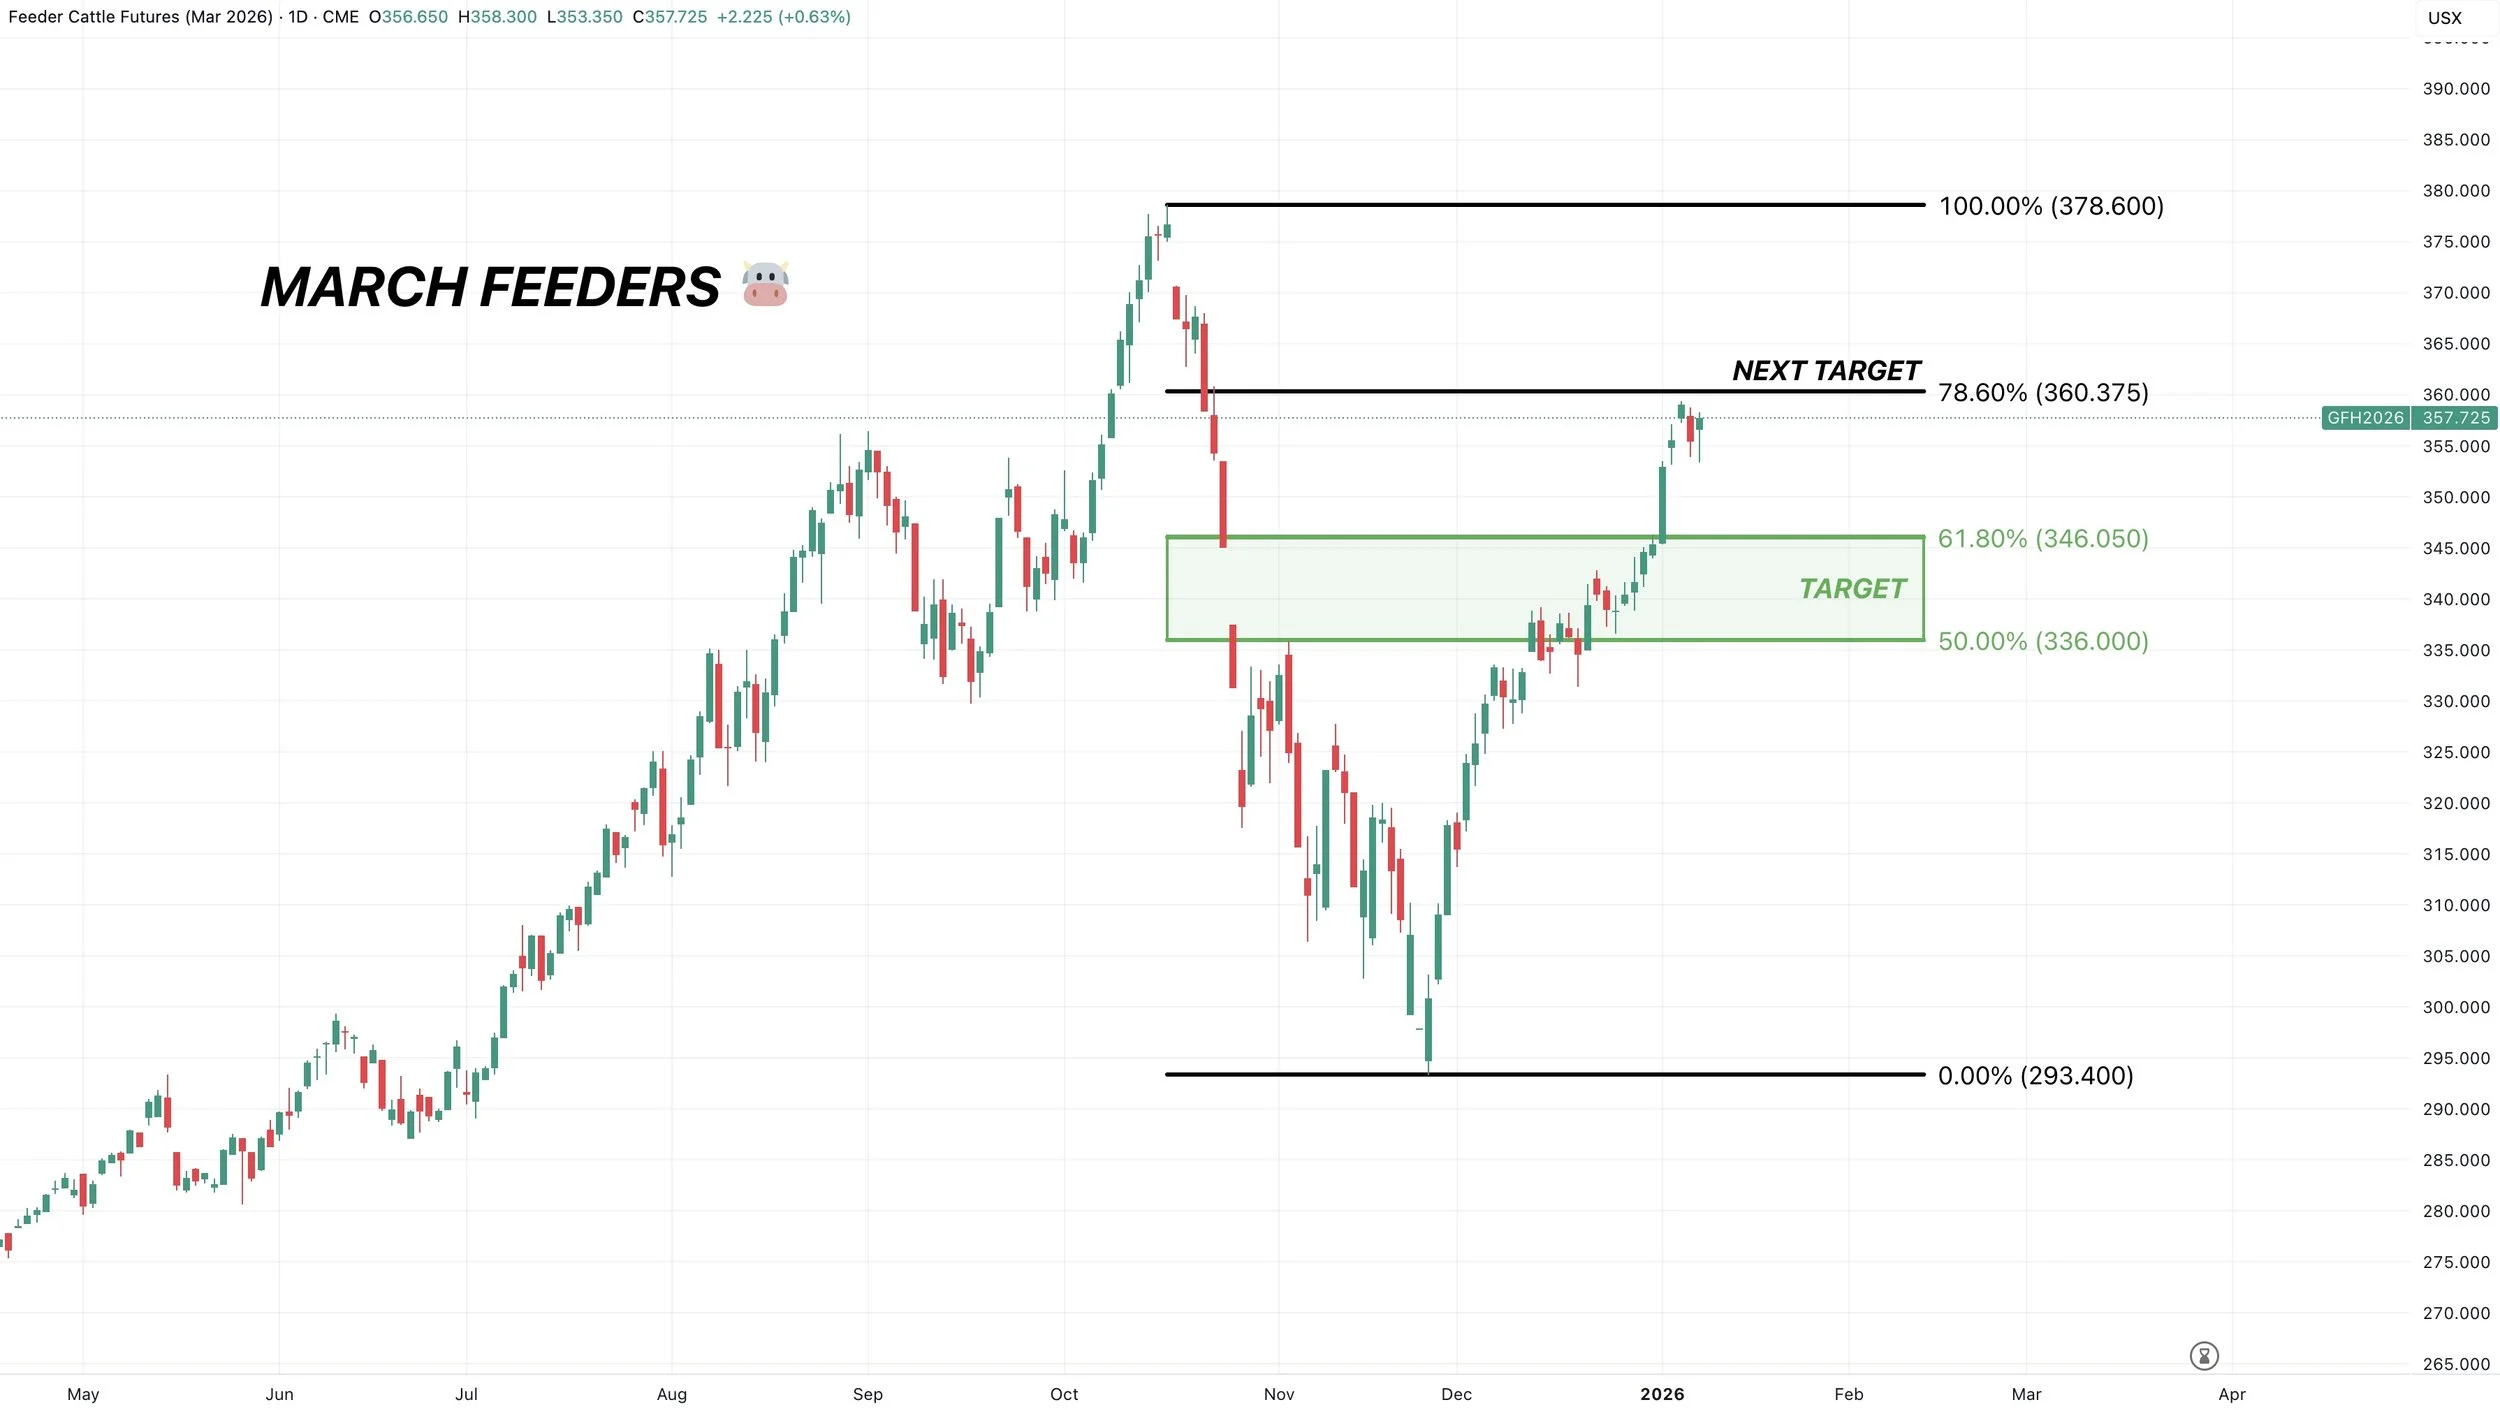
March Feeders
Struggling right at that last target.
The 78.6% level up to the highs.
If you take that level out, the next point of interest is the gap and those highs.
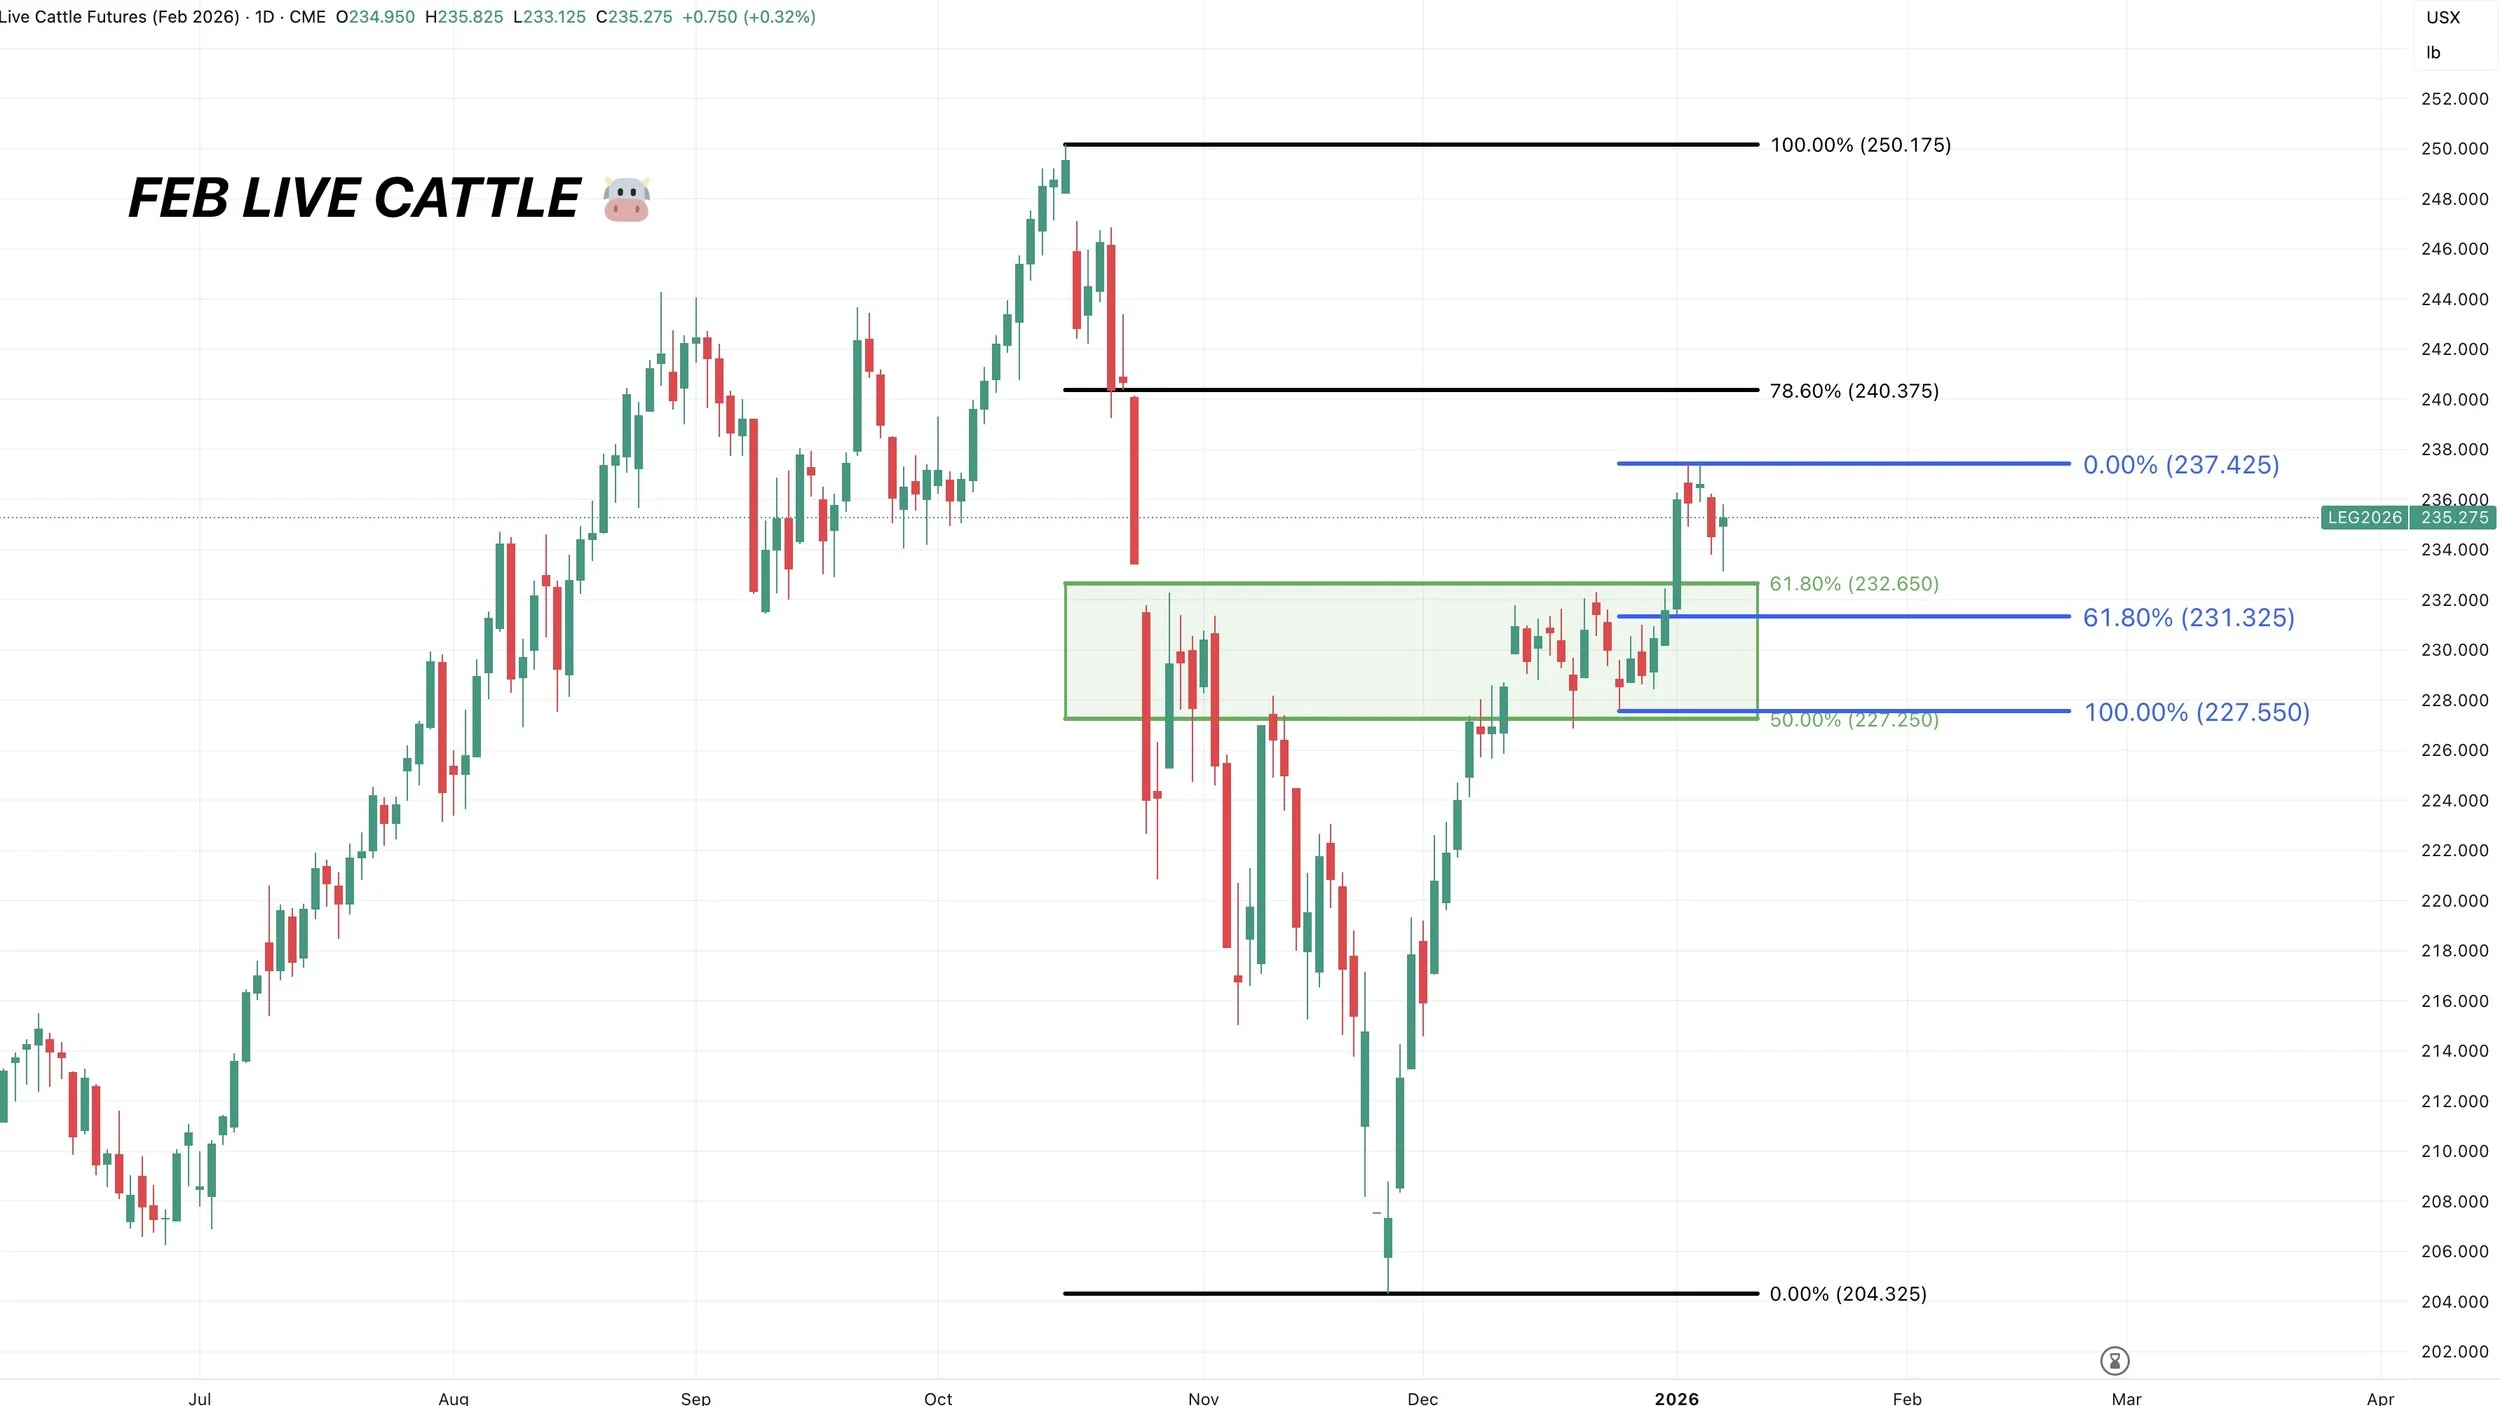
Feb Live
Live cattle didn’t quiet make it up to that 78.6% level as feeders have been leading the charge.
To the downside, the warning sign that we are due for a bigger correction would be if we took out last Friday's lows.
That level also gives back 61.8% of the recent rally (blue lines).
Past Sell or Protection Signals
Dec 11th: 🐮
Cattle sell signal & hedge alert.
Dec 5th: 🐮
Cattle sell signal & hedge alert.
Nov 17th: 🌱
Soybean sell signal & hedge alert.
Nov 13th: 🌽 🌱
Managing risk in corn & beans ahead of USDA report.
Oct 28th: 🌽
Corn sell signal & hedge alert.
Oct 27th: 🌱
Soybean sell signal & hedge alert.
Oct 13th: 🐮
Cattle sell signal & hedge alert.
Aug 22nd: 🌱
Soybean sell signal & hedge alert.
July 31st: 🐮
Cattle sell signal & hedge alert.
July 10th: 🐮
Cattle sell signal & hedge alert.
CLICK HERE TO VIEW
June 5th: 🐮
Cattle sell signal & hedge alert.
June 2nd: 🌾
MPLS wheat sell signal.
April 10th: 🌽
Old crop corn sell signal.
March 19th: 🐮
Cattle hedge & sell signal.
Feb 18th: 🌽 🌾
Old crop KC wheat & old crop corn signal.
Jan 23rd: 🌽 🌱
Corn & beans old crop sell signal.
CLICK HERE TO VIEW
Jan 15th: 🌽 🌱
Corn & beans hedge alert/sell signal.
Jan 2nd: 🐮
Cattle hedge alert at new all-time highs & target.
Dec 11th: 🌽
Corn sell signal at $4.51 200-day MA
CLICK HERE TO VIEW
Oct 2nd: 🌾
Wheat sell signal at $6.12 target
Sep 30th: 🌽
Corn protection signal at $4.23-26
Sep 27th: 🌱
Soybean sell & protection signal at $10.65
Sep 13th: 🌾
Wheat sell signal at $5.98
May 22nd: 🌾
Wheat sell signal when wheat traded +$7.00
Want to Talk?
Our phones are open 24/7 for you guys if you ever need anything or want to discuss your operation.
Hedge Account
Interested in a hedge account? Use the link below to set up an account or shoot Jeremey a call at (605)295-3100.