
PLANTING & FIRST NOTICE DAY PRESSURE. CORN CLOSE TO BOTTOM?
MARKET UPDATE
You can scroll to read the usual update as well. As the written version is the exact same as the video.
Timestamps for video:
Why the Weakness?: 0:00min
Weather Outlook: 1:40min
Corn Seasonal & Exports: 2:40min
Corn Takeaways: 4:30min
Corn Close to Bottom?: 5:40min
Soybeans: 8:30min
Wheat: 11:00min
Want to talk about your situation?
(605)295-3100
Futures Prices Close

Overview
Blood bath in the grains today. All grains were holding on overnight and into this morning but eventually fell apart.
Why the weakness?
One reason is first notice day. This is tomorrow.
This usually leads to pressure in the markets, and often times the market can find it's footing and bottom afterwards.
Simple Explanation Why This Happens:
Going into first notice day, we see forced selling from traders who do not want to risk getting stuck with physical corn. So this creates pressure. As anyone who is is long May contracts by today's close either had to sell their contracts or roll them.
Reason #2 for Weakness: Planting & Forecasts
This is something we have been talking about for a while.
Fast planting will almost always pressure the market.
This is because the trade does not see any risk of this crop getting in the ground.
No concerns with production = pressure to prices.
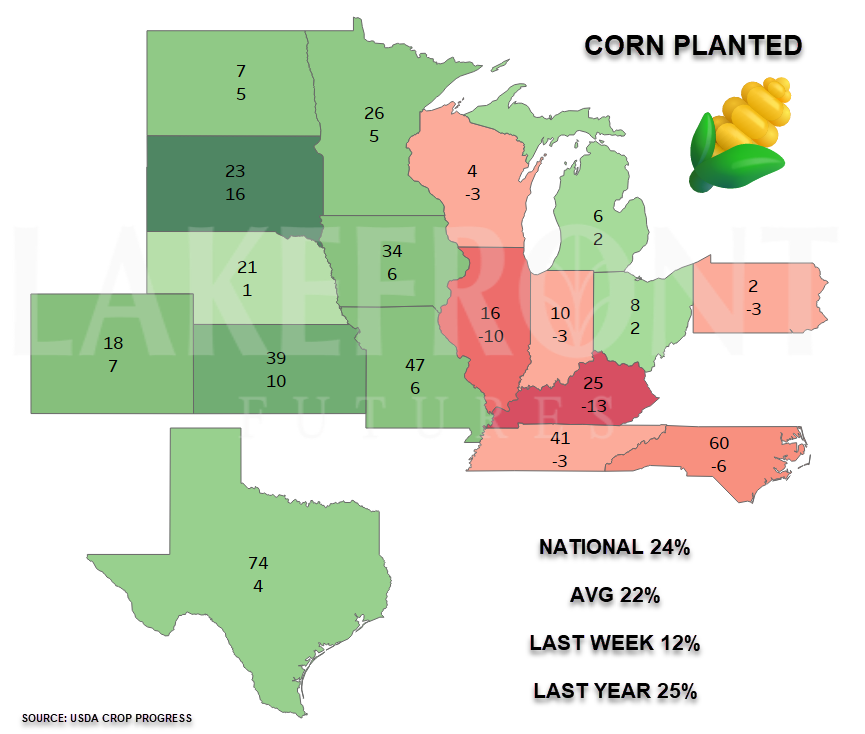
Planting Progress:
Corn
Current: 24%
Last Week: 12%
Last Year: 25%
Average: 22%
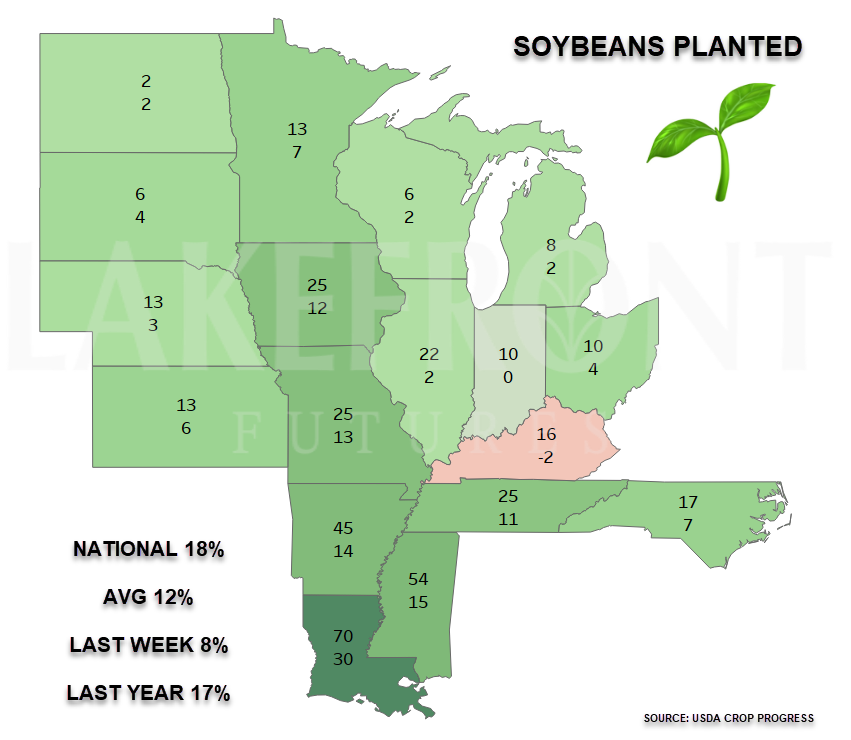
Soybeans
Current: 18%
Last Week: 8%
Last Year: 17%
Average: 12%
Corn planting isn’t abnormally fast or slow, but is faster than normal.
Progress is ahead of usual for most of the corn belt aside from some eastern states such as Illinois and Indiana.
Corn might have seen some extra pressure due to the thought process that fast planting will steal more acres away from soybeans. But the last few years more and more growers have been opting to plant beans earlier or before corn. So I don’t think this is an entirely true argument.
Chart from Karen Braun

Chart from Darrin Fessler of Lake Front Futures
Soybean planting is at a record fast pace.
Currently the fastest ever.
With every state of ahead of usual outside of Kentucky.
Chart from Karen Braun
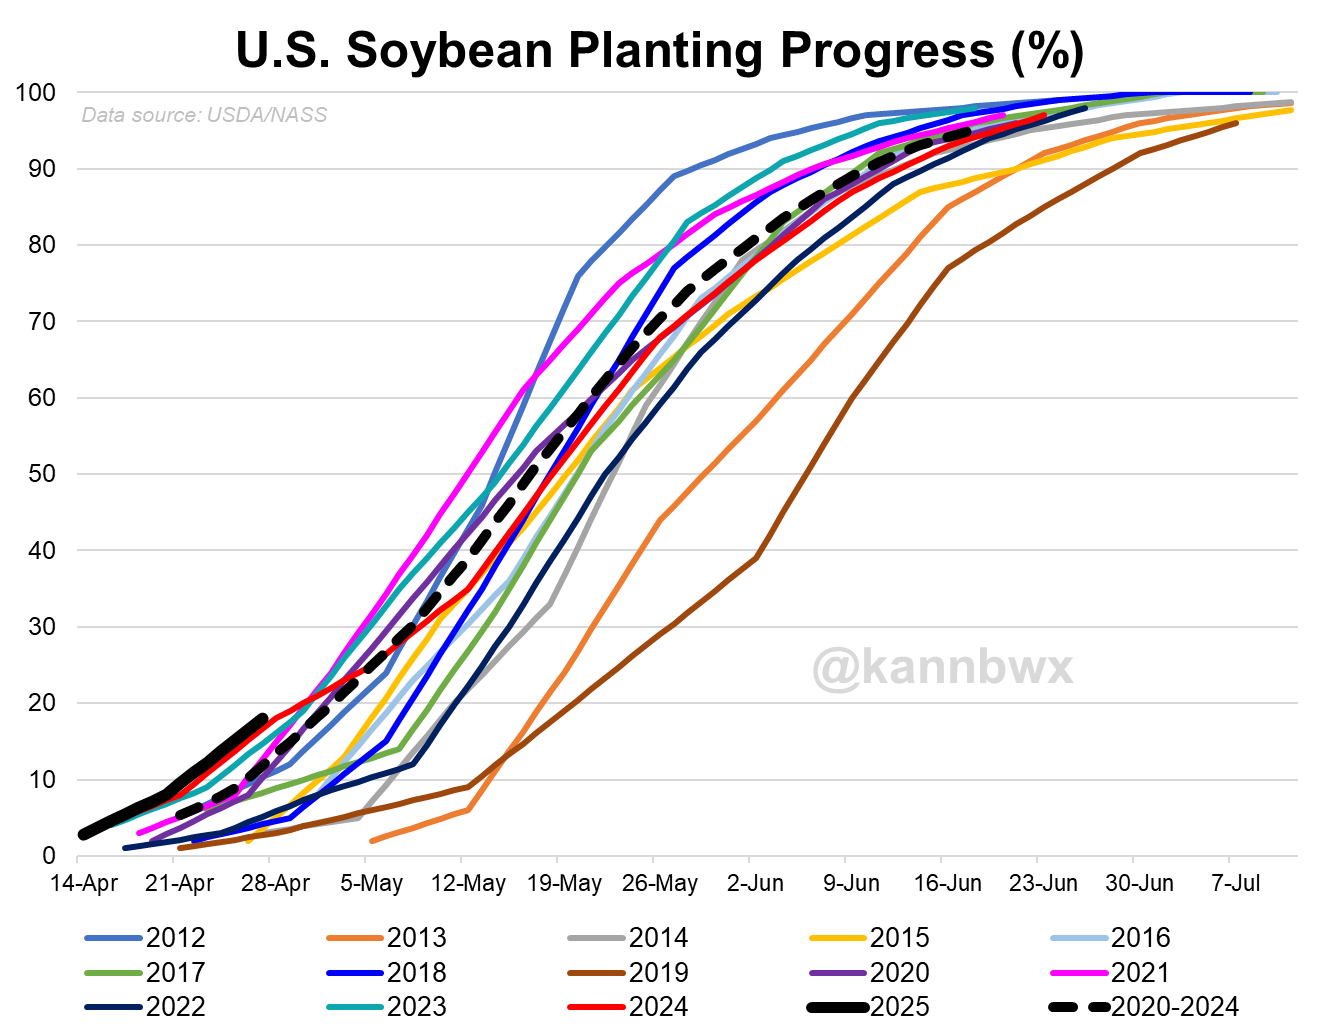
Chart from Darrin Fessler of Lake Front Futures
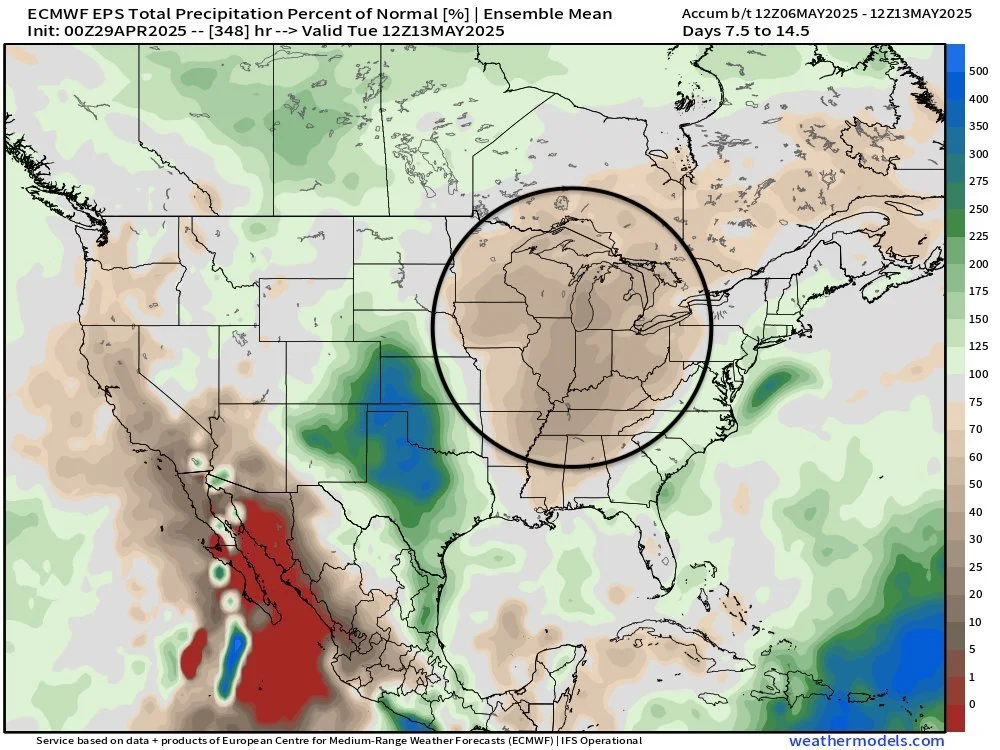
Weather & Future Outlook
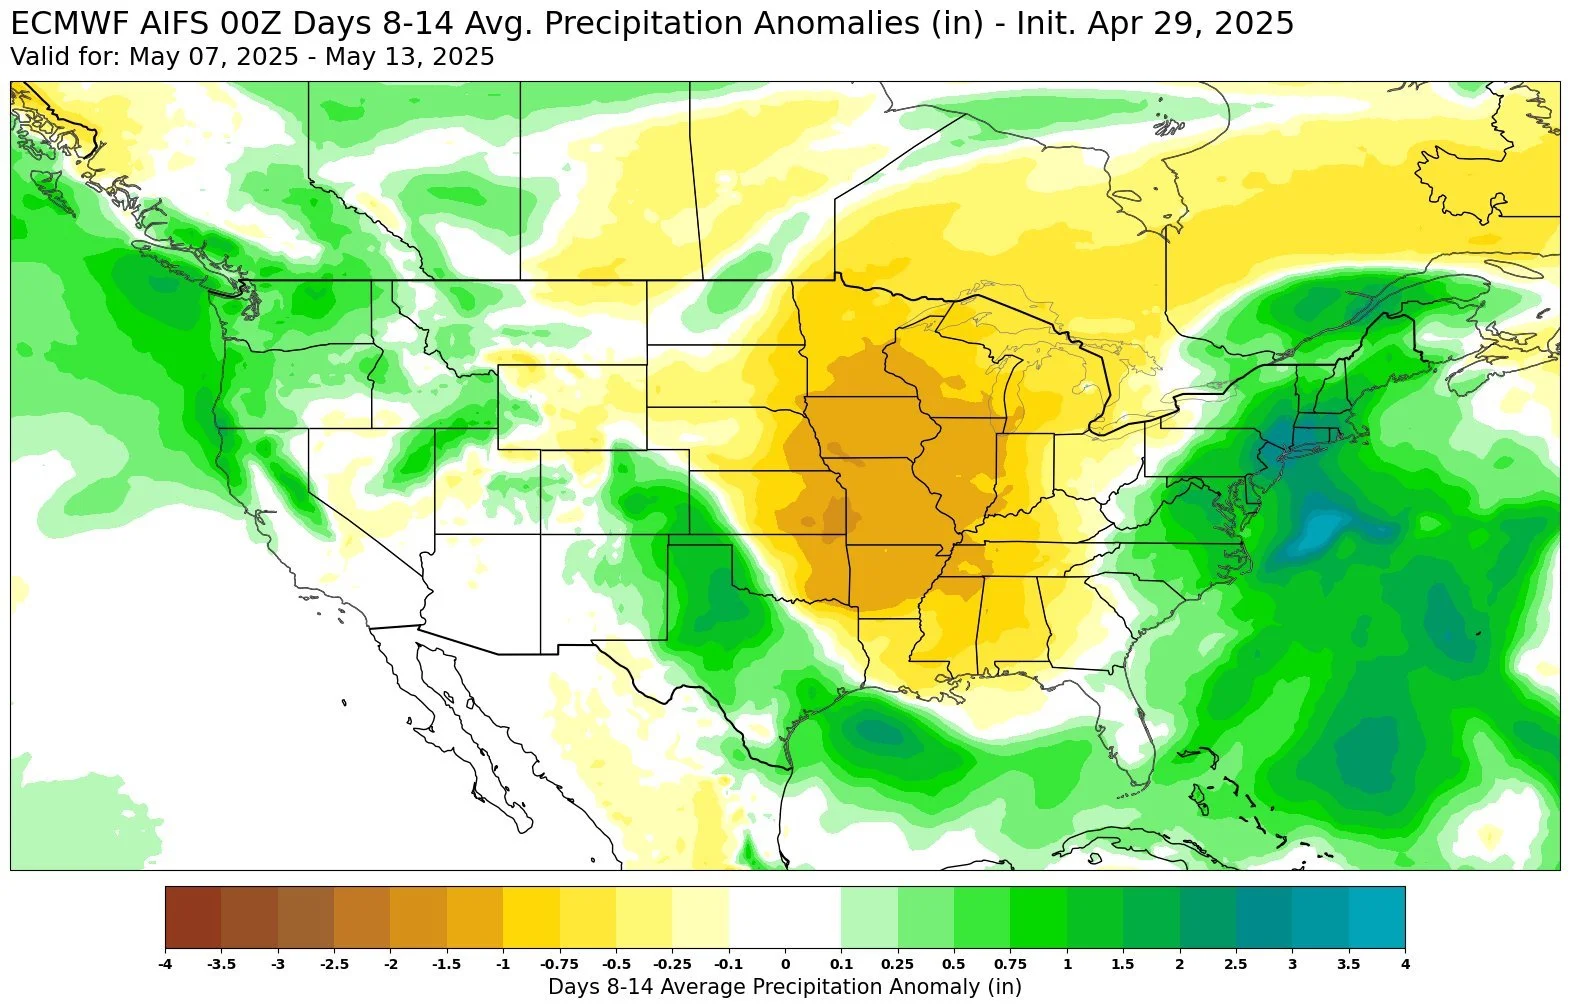
Here is the outlook for next week.
Dry across all of the eastern corn belt which should result in this crop getting in fast and will continue to somewhat keep a lid on prices momentarily.
Over in the southern plains, we are suppose to get some rain. So this has added pressure to the wheat market.
However despite these rains, there is some still obvious concerns in winter wheat region as the forecasts long term ratchet back up to hot and dry.
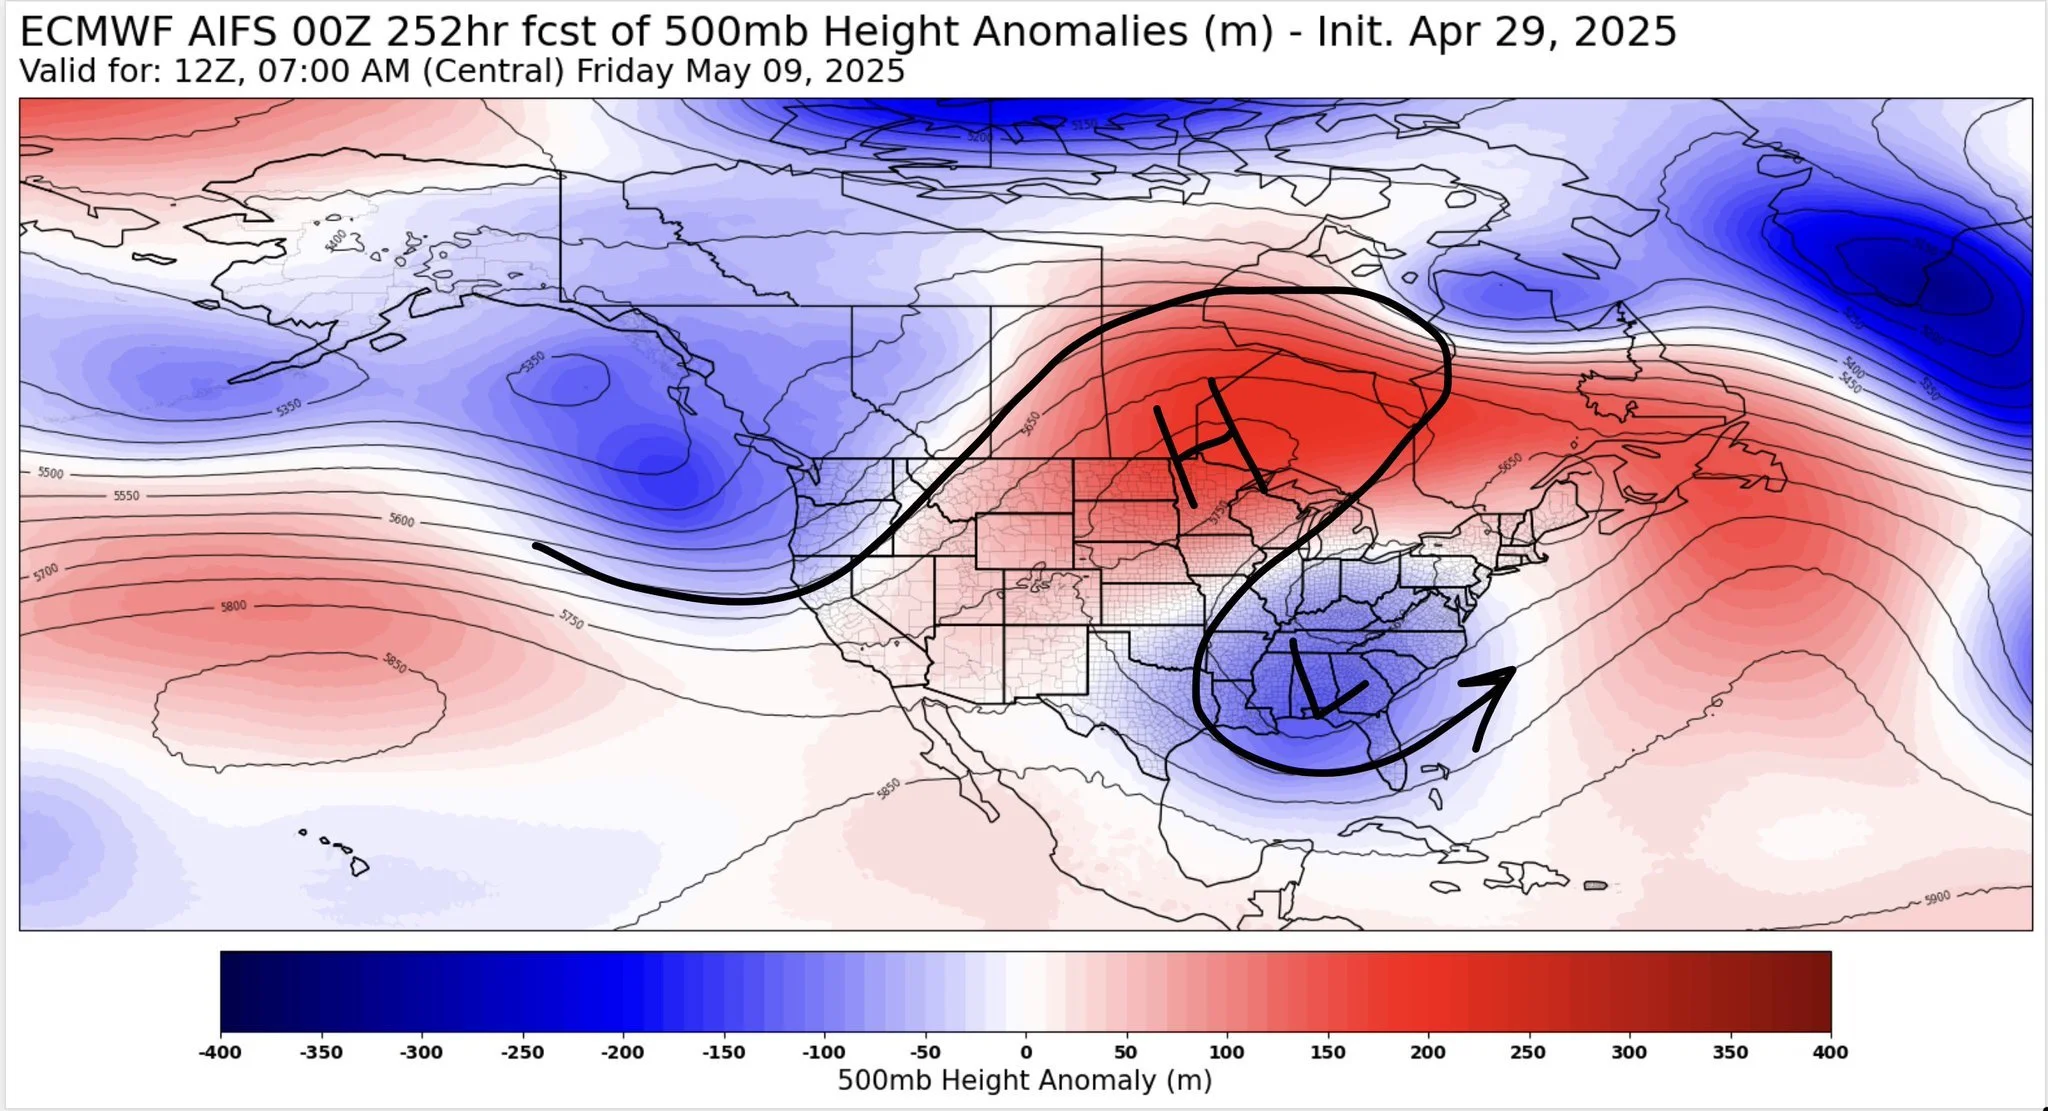
From Eric Snodgrass:
"Several models coming back together on an eastern US high-over-low block leading to a longer stretch of drier weather from Midwest/Great Lakes/Miss Valley through the Ohio Valley and Mid South.
Crops should be rapidly planted during that time. Major concerns in southern plains for flooding next 2 weeks though."
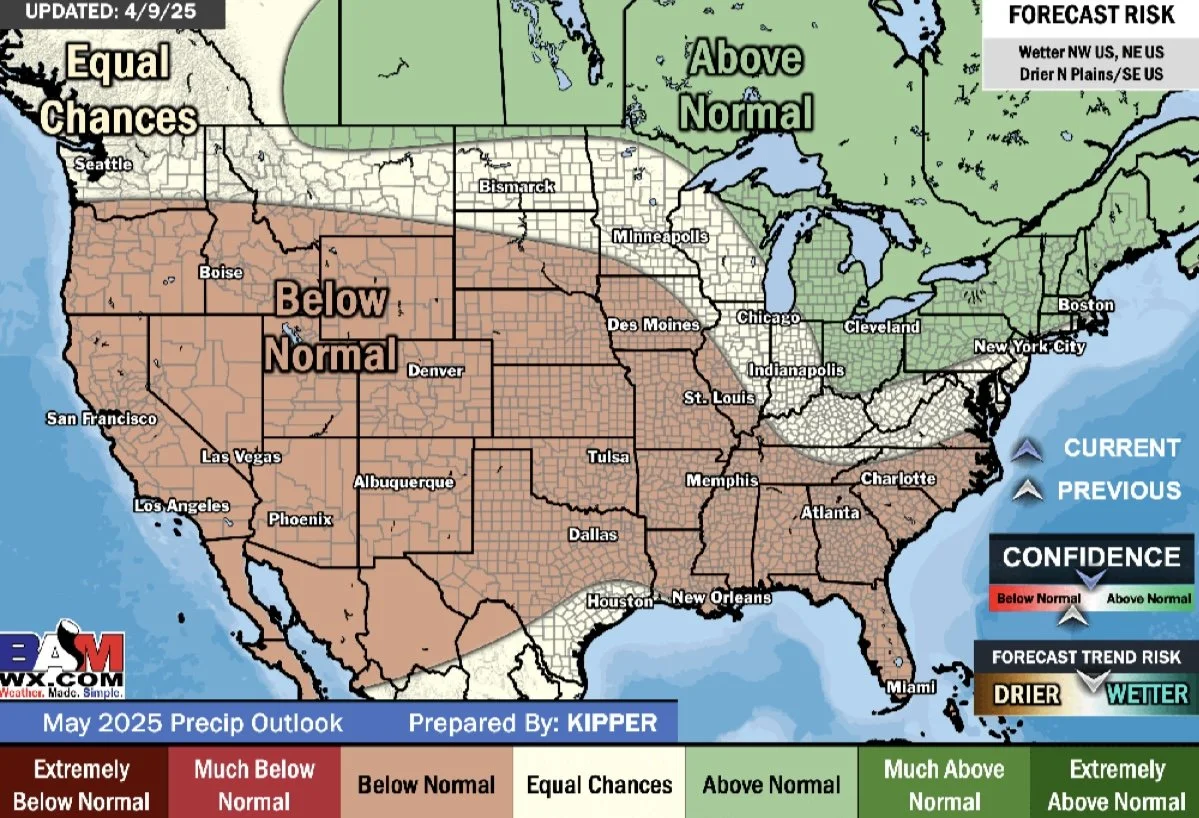
Despite pressure from fast planting.. what does fast planting typically mean?
Usually it means it's dry.
The long term forecasts still suggest hot and dry from nearly every agency and analyst out there.
Here is the May outlook. Again this should lead to fast planting and likely keep a lid on a rally short term. But this brings a greater chance for a weather scare later on.
Seasonal Pressure
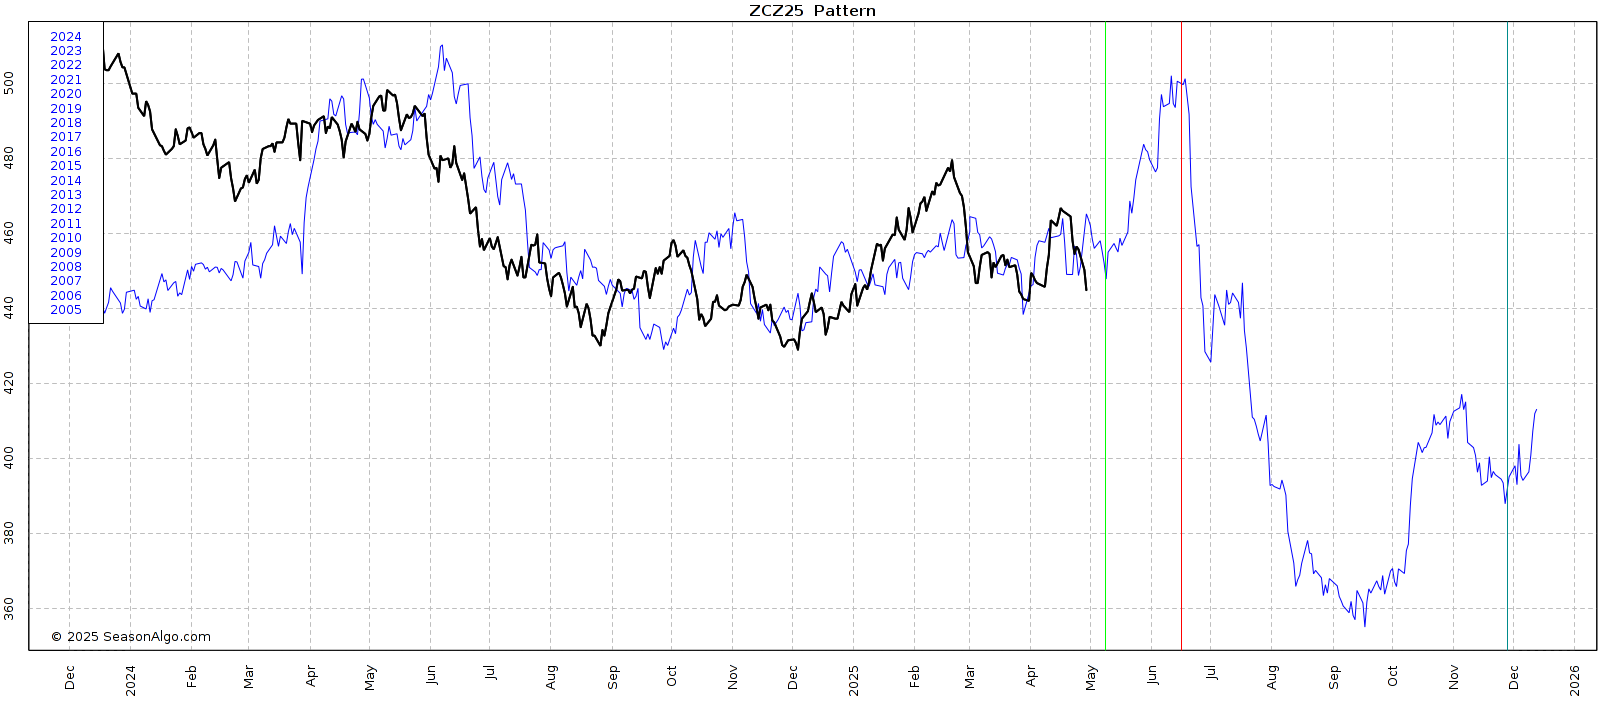
Take a look at this new crop corn seasonal that I included last week.
Seasonally, we struggle into the early part of May with planting. As more often than not, we don’t get a planting rally unless we see some major wet concerns.
This weakness is nothing that uncommon seasonally speaking.
Corn Export Demand
Corn demand remains great.
Exports are +29% ahead of last year.
The USDA projects us to just be up +11% vs last year.
Still an argument to be made that the USDA could bump exports even more. Further eating into that old crop carryout which is already now below 10% for the first time since March 2023.
Here is a great chart showing this visual from the Brock Report.
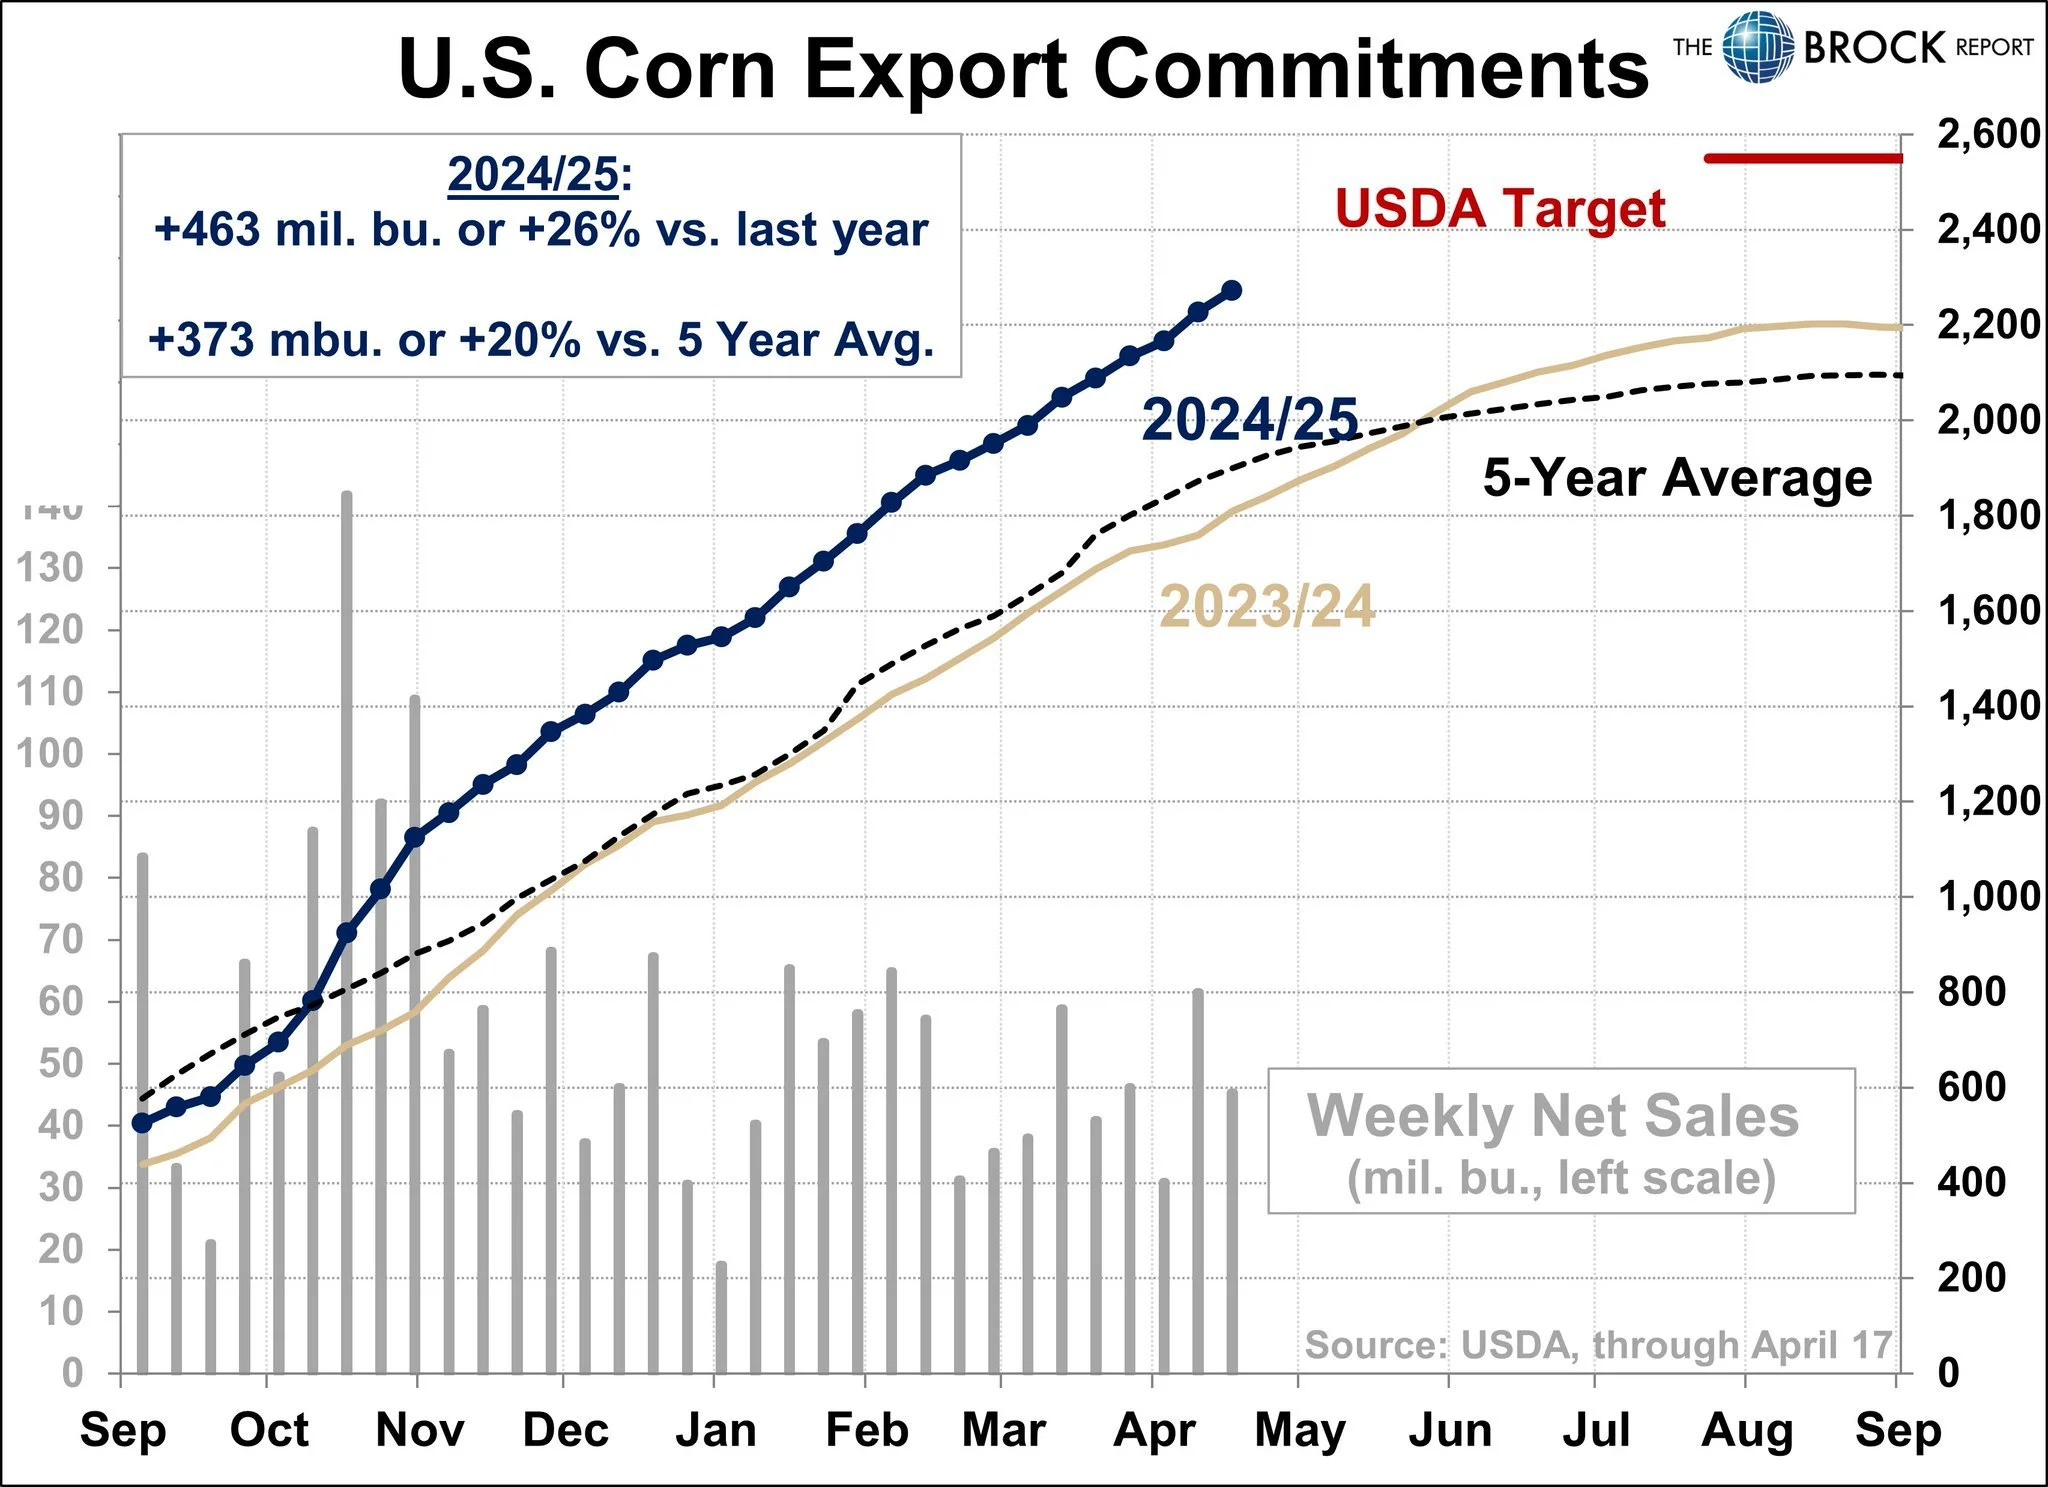
Currently exports are up +450 million bushels vs last year.
The USDA projects them to be up just +250 million.
Last Years Exports: 2,550 million
USDA Estimates: 2,292 million
Current Pace: 2,750 million
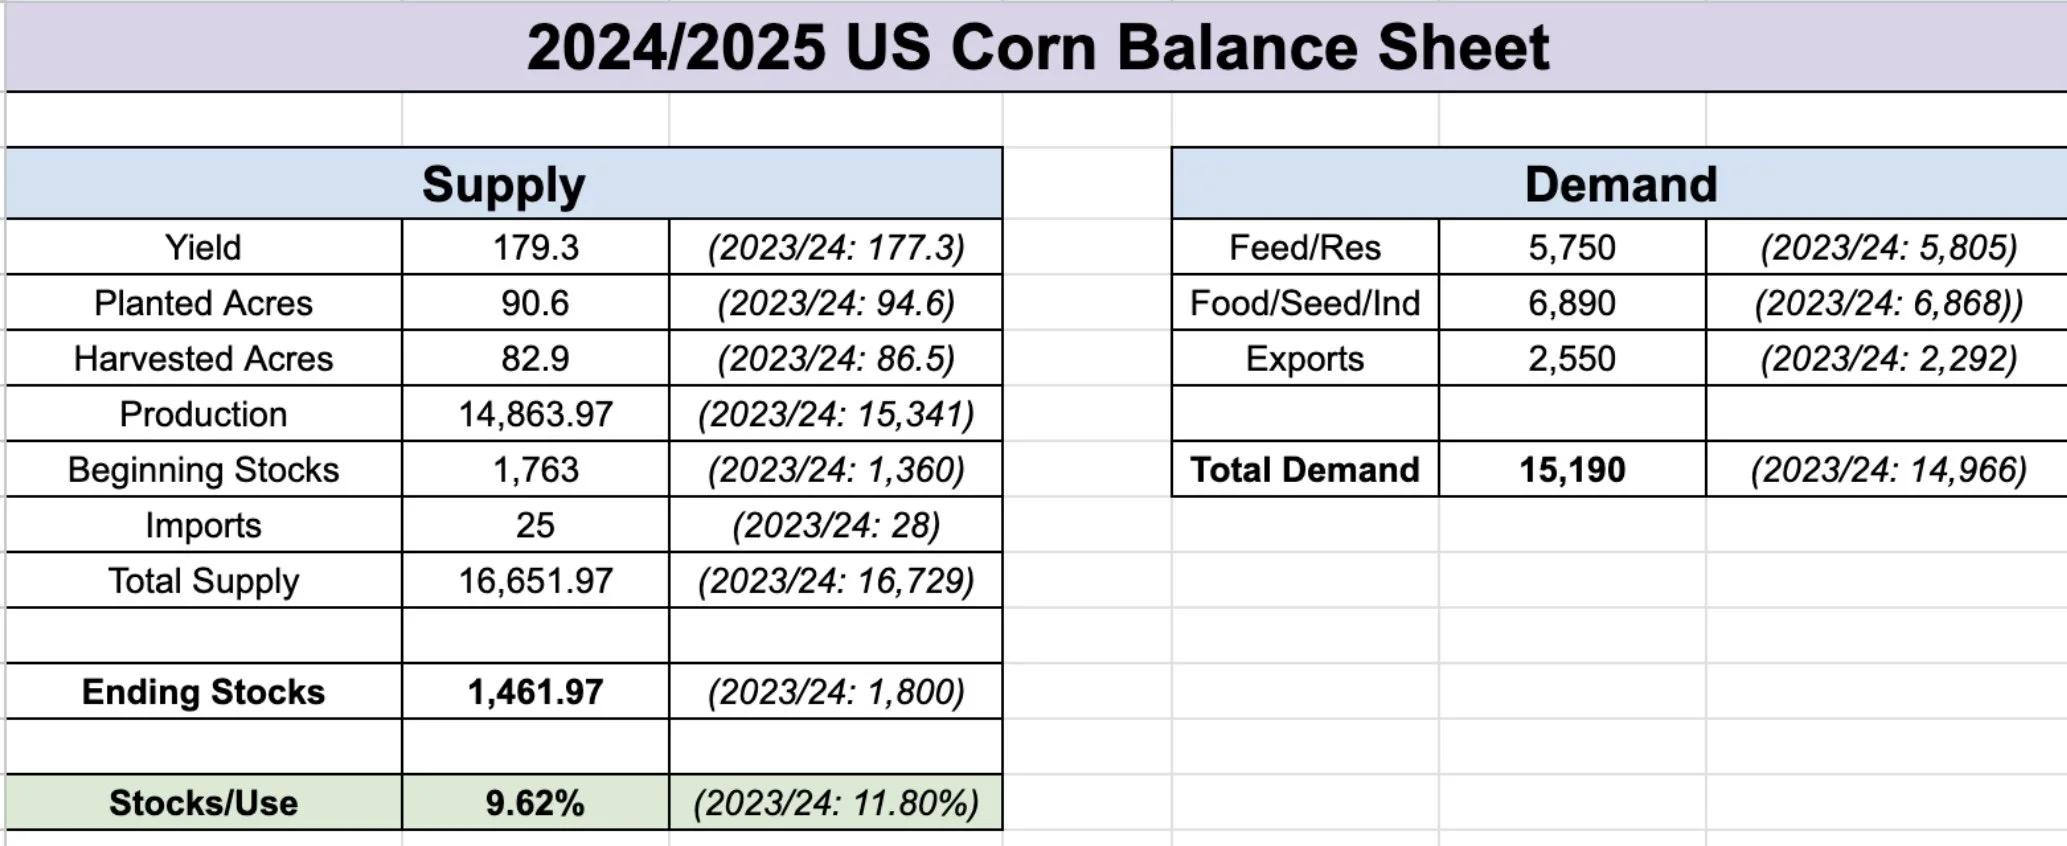
Let's just say the USDA bumps exports by another 100 million. A smaller increase of 50 to 75 million is more likely, but another 100 million of exports drops our old crop balance sheet's stock to use ratio below 9%.
Current Balance Sheet (2,550 Exports)
Scenario Balance Sheet (2,650 Exports)
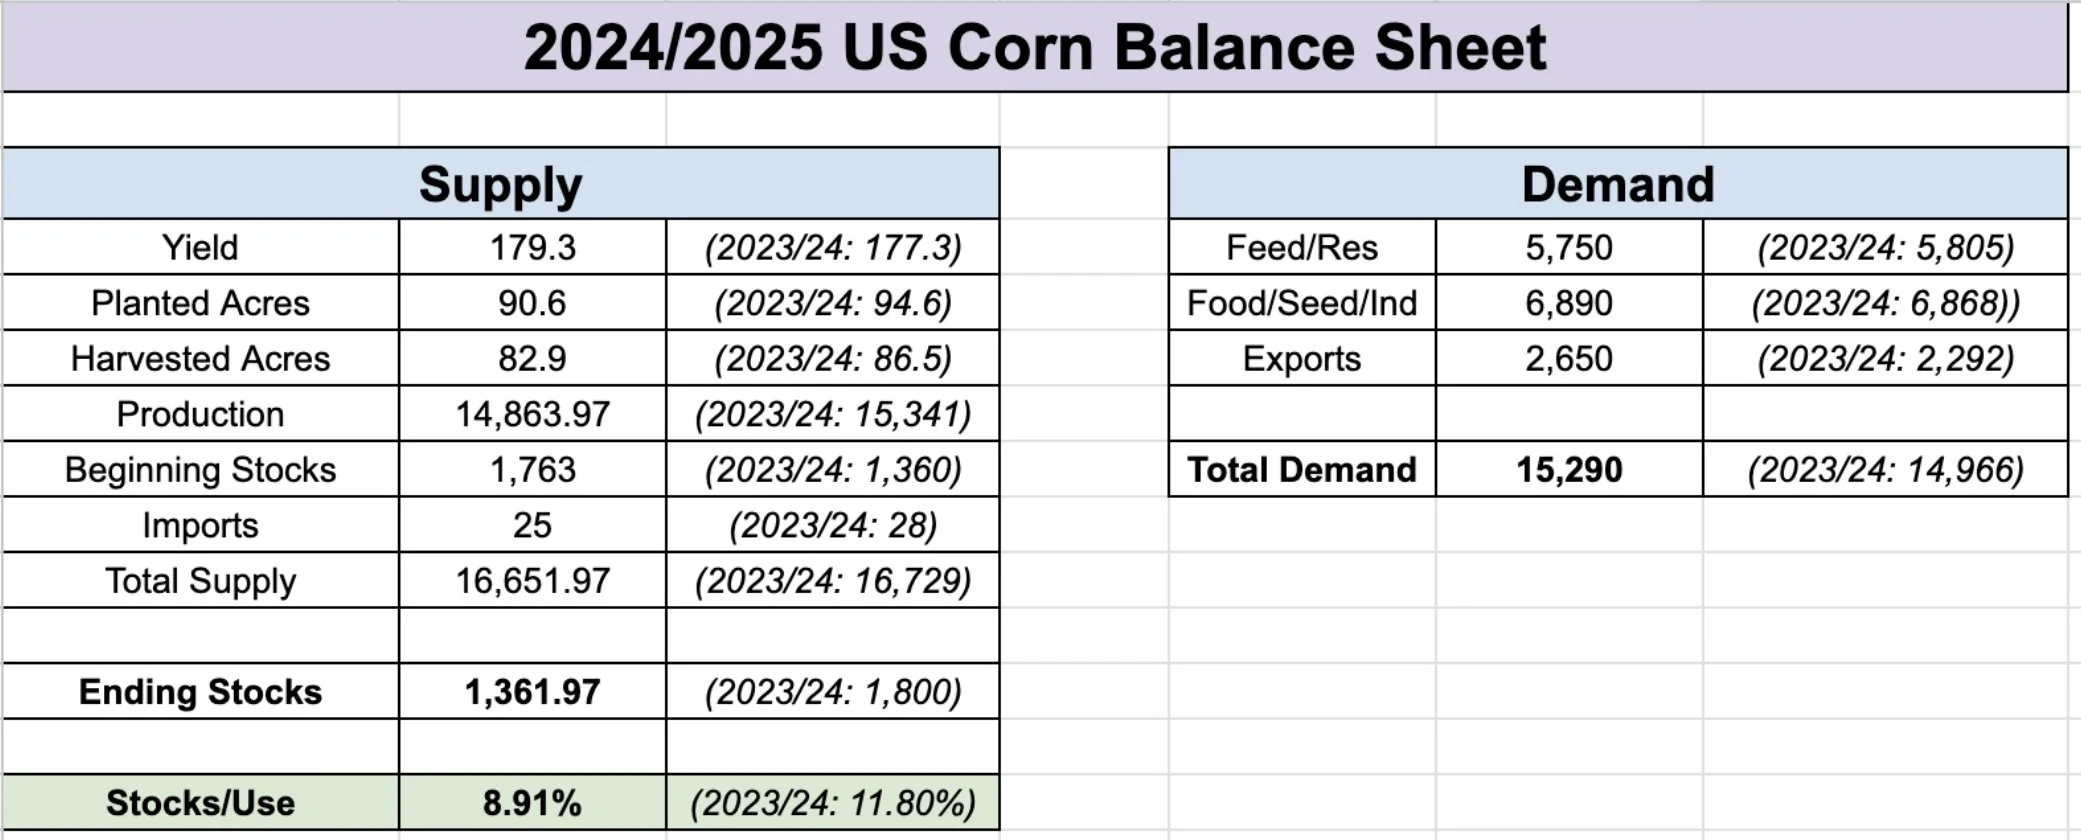
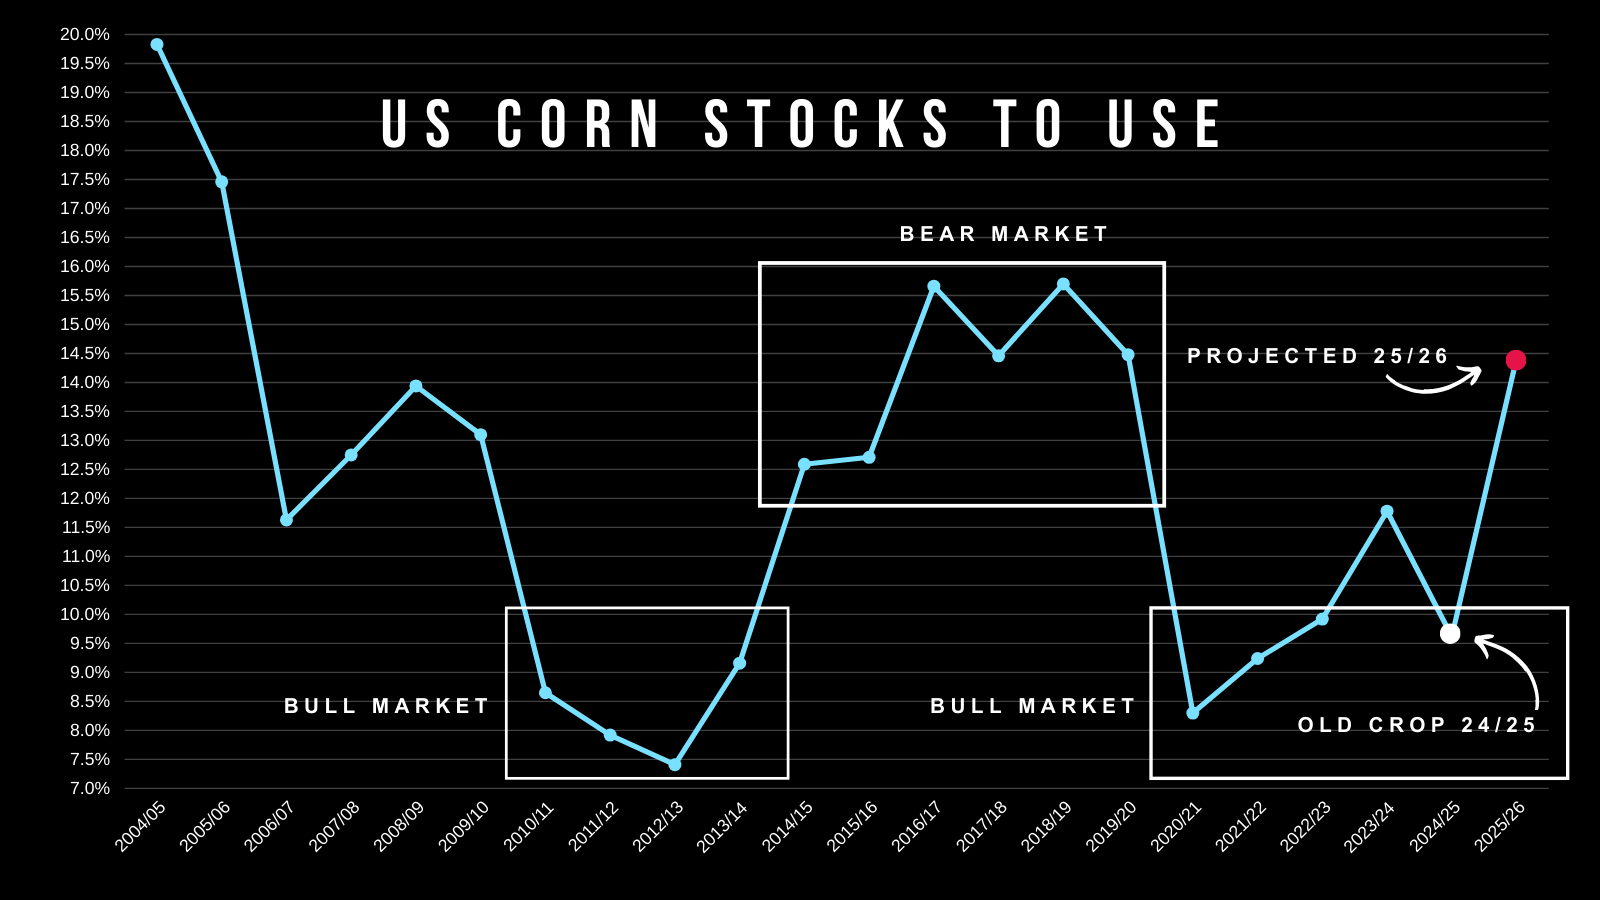
This would be the tightest since 2020/21's 8.3%
The old crop corn situation is far from bearish.
Today's Main Takeaways
Corn
Fundamentals:
As I have been saying, short term planting could weigh on us.
Looking towards summer I am still looking for that usual seasonal opportunity.
The world situation cannot afford a hiccup with the US crop.
Now that first notice day is out of the way, I think we should be able to find some footing here. I do not think we will rally out of nowhere, I just think the heavy bleeding is close to done here.
Short term we don’t have a reason to go substantially lower given this crop isn’t even in the ground yet. So the risk of lower production is still out there and the forecasts still call dry.
We saw corn acres come in at +95 million in March. The market traded higher.
We started a trade war. The market traded higher.
I just don’t think corn should fundamentally go much lower given the possibilities.
Short term we do not have a reason to go tremendously higher either. Not until this crop is in the ground and until focus starts shiting to those dry forecasts.
So for now I think we could simply be range bound and choppy.
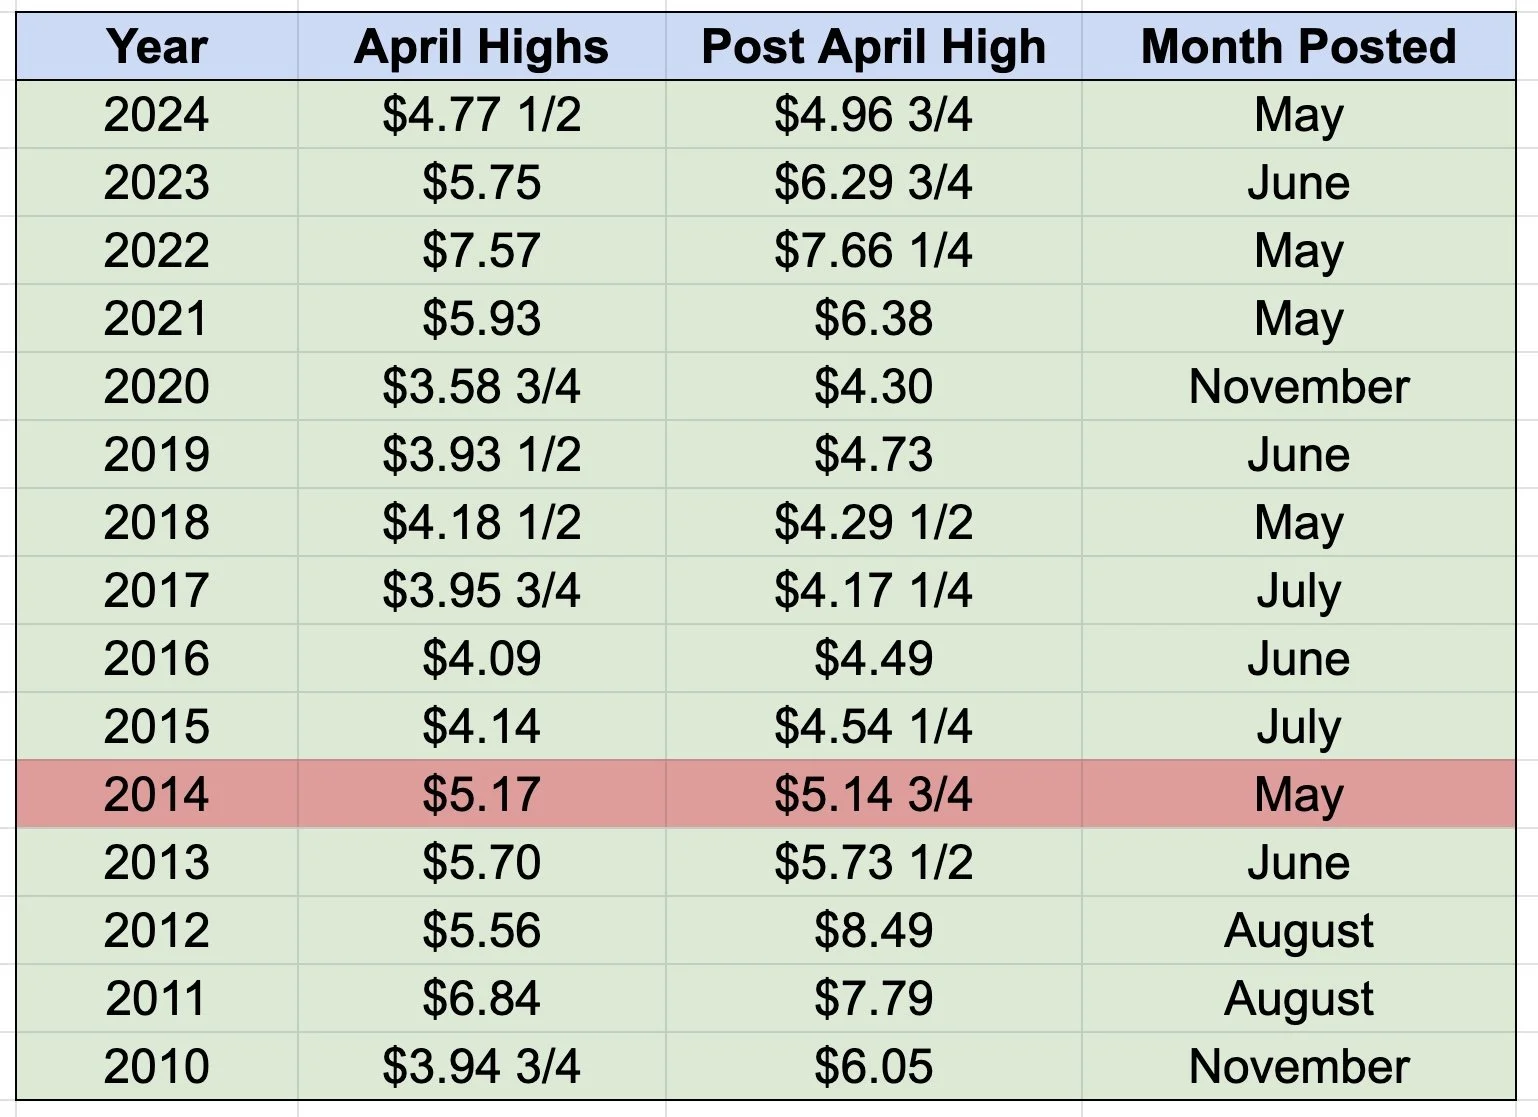
I included this last week, but since April ends tomorrow. As a reminder, new crop corn has not taken out the April highs only once since 2010. That was 2014.
The April high this year was $4.69
Technicals:
For the past 2 weeks I have been saying I thought we could very easily find a bottom between $4.69 to $4.74. We finally hit that downside target today.
From Last Week

Make it stand out
I would like to think we start to carve out some lows here in this area.
Why did I think we would bottom here?
$4.69 gives back 61.8% of the recent rally.
This is the most common place for a correction to bottom.

Here is another reason why I wasn’t convinced last week's bounce was our bottom.
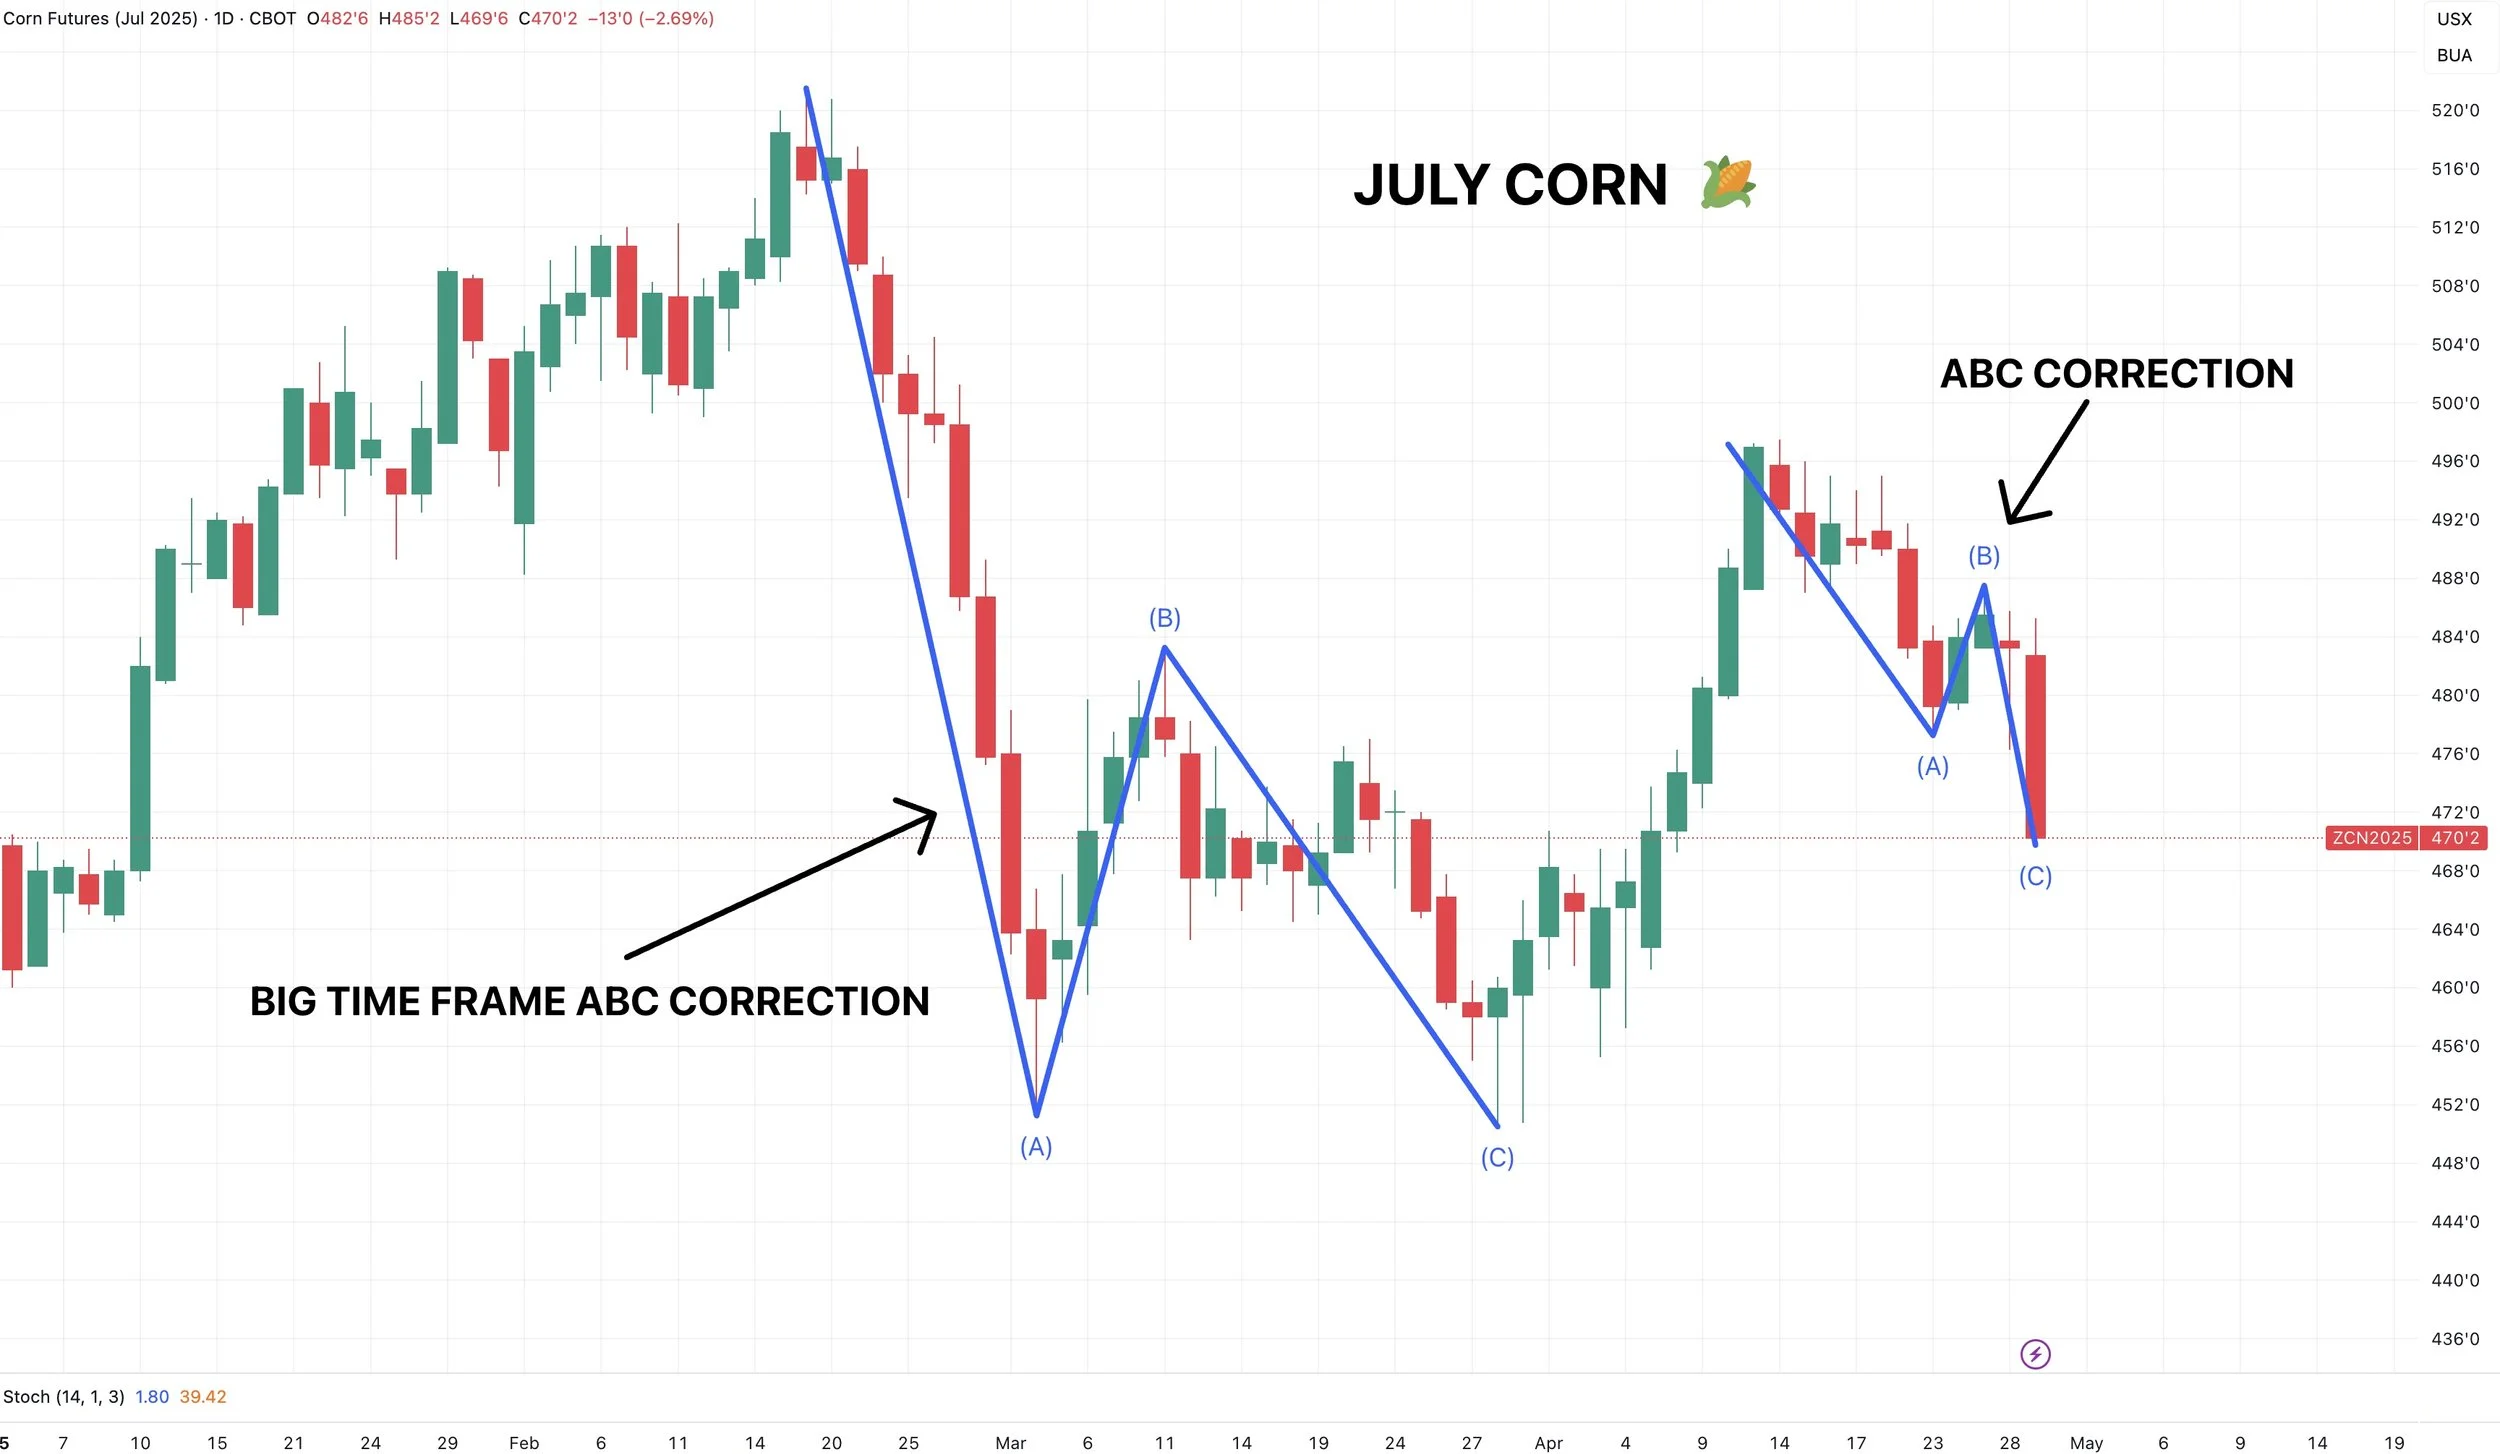
Corrections usually happen in 3 moves.
It is called an ABC correction and it is the most common pullback pattern in markets.
Here is a simple explanation why they happen:
Wave A: The initial sell off. Driven by profit taking after a rally.
Wave B: The relief bounce. A temporary rally where buyers step in trying to catch a bottom. But it usually just acts as exit liquidity for smart sellers and people who were long.
Wave C: The final leg lower. Trapping B wave buyers and completing the correction before the uptrend resumes.

Now that we have our 3 moves. I think finding a bottom soon here would make sense.
Again I not claiming we will rally tomorrow, as we do not have a real reason to go much higher. I just think the heavy selling could be over for now.
Here is an example of these corrections. We saw the same pattern but on a bigger scale on the Feb sell off.
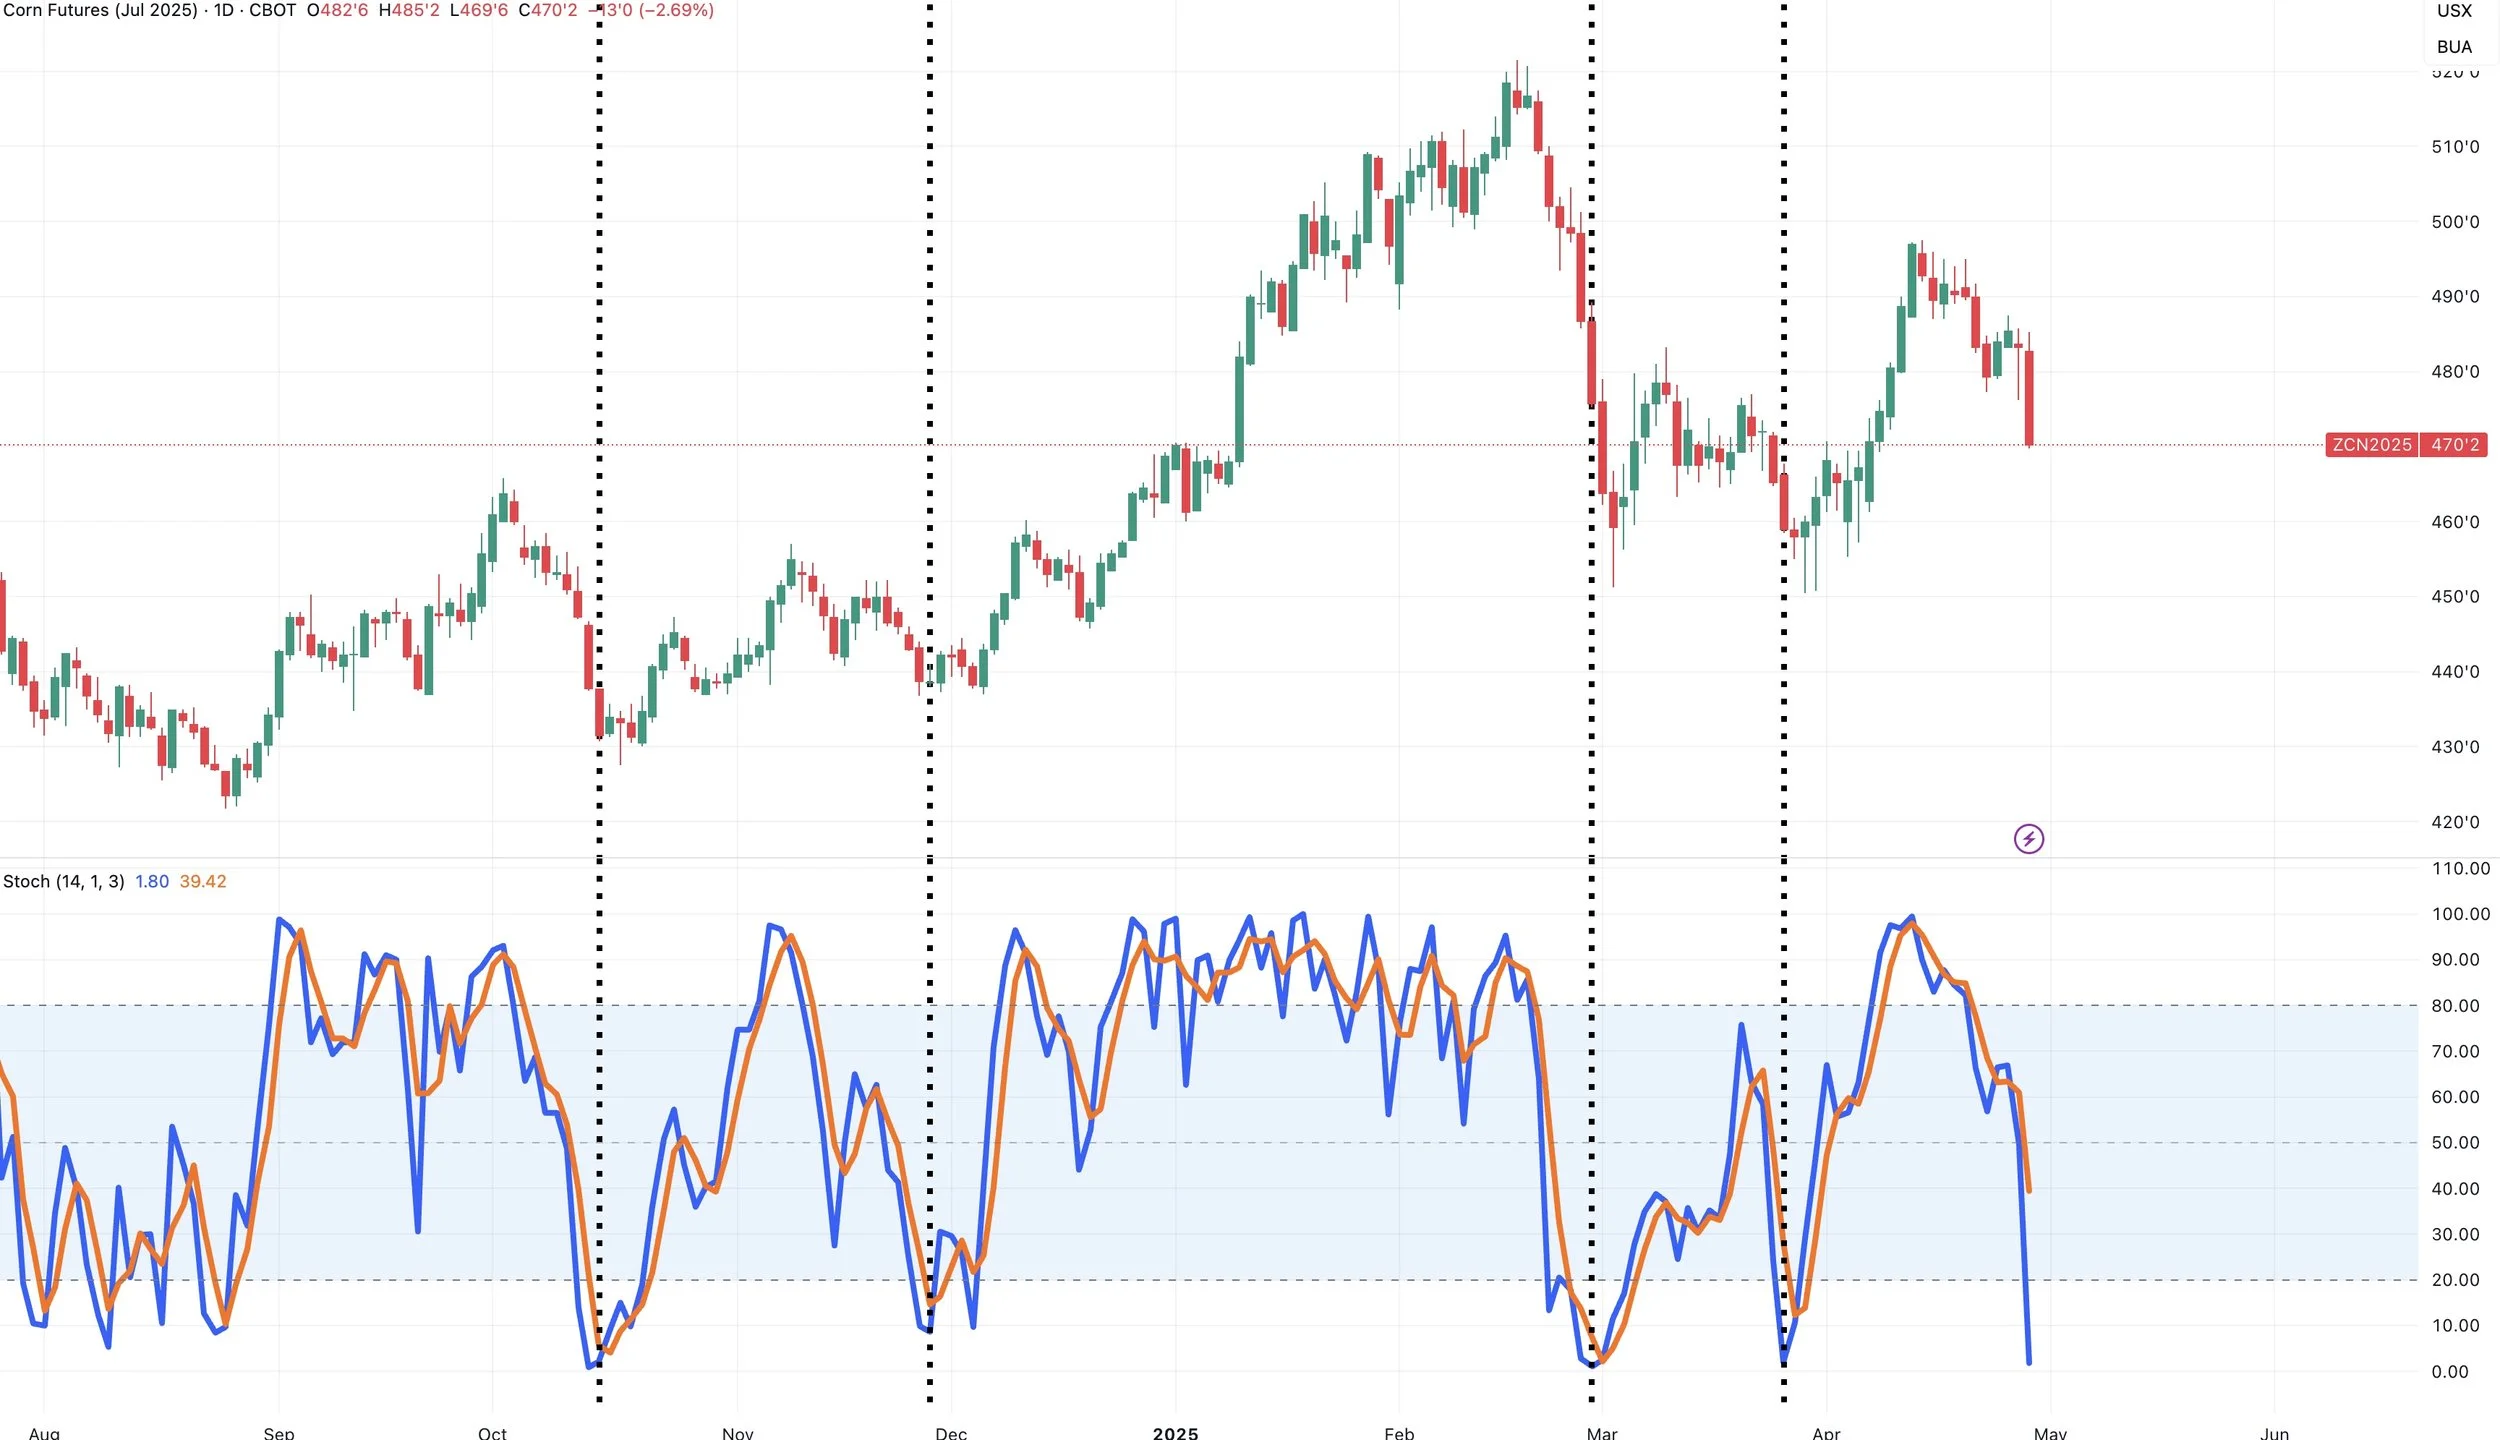
If we look at the stochastics they are almost bottomed out as well.
These often mark when we are close to a bottom.
The dotted lines mark other times it bottomed out.
This is just a momentum indicator letting us know when a market is overbought or oversold.
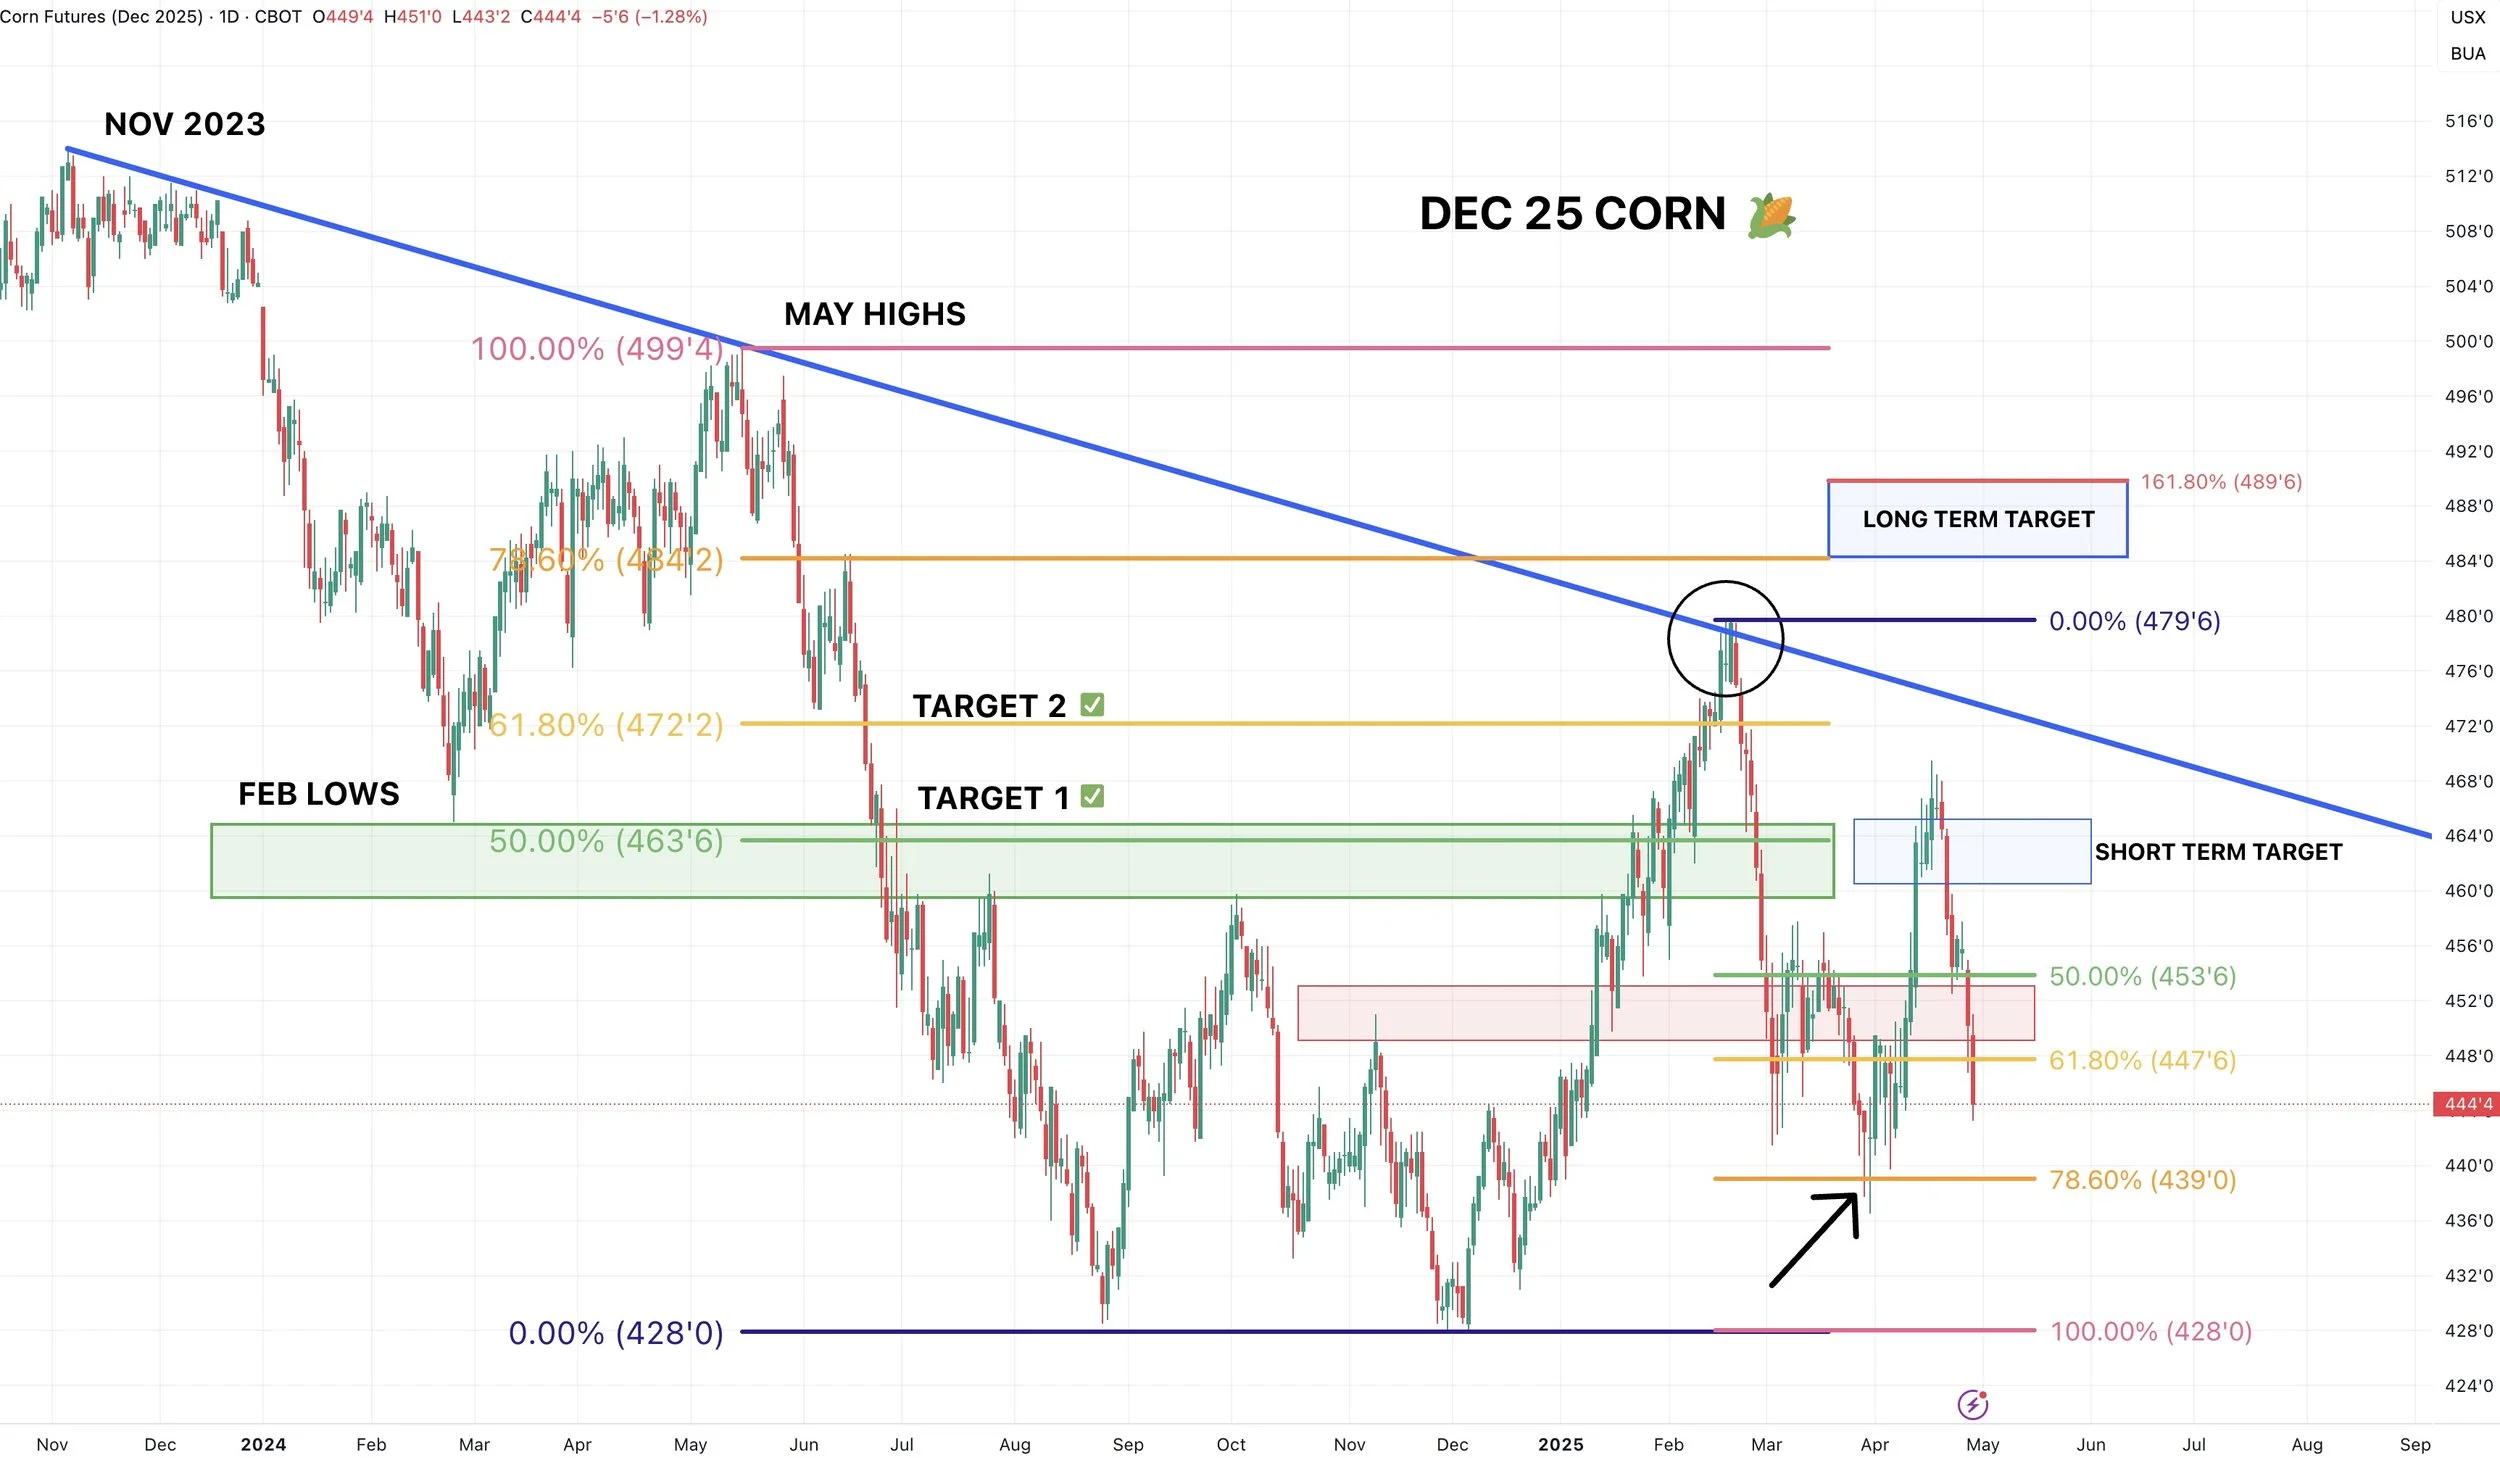
Dec corn broke below the golden zone retracment so not a great look.
Bulls pretty much want a bounce right now.
We are sitting right at the 78.6% retracment of the rally. So not all hope is lost.

This chart shows the retracment levels from Dec to Feb rally instead of the recent rally.
After the Feb sell off, we also bounced at the 78.6% level of that entire rally.
Soybeans
Fundamentals:
No major updates on soybeans today.
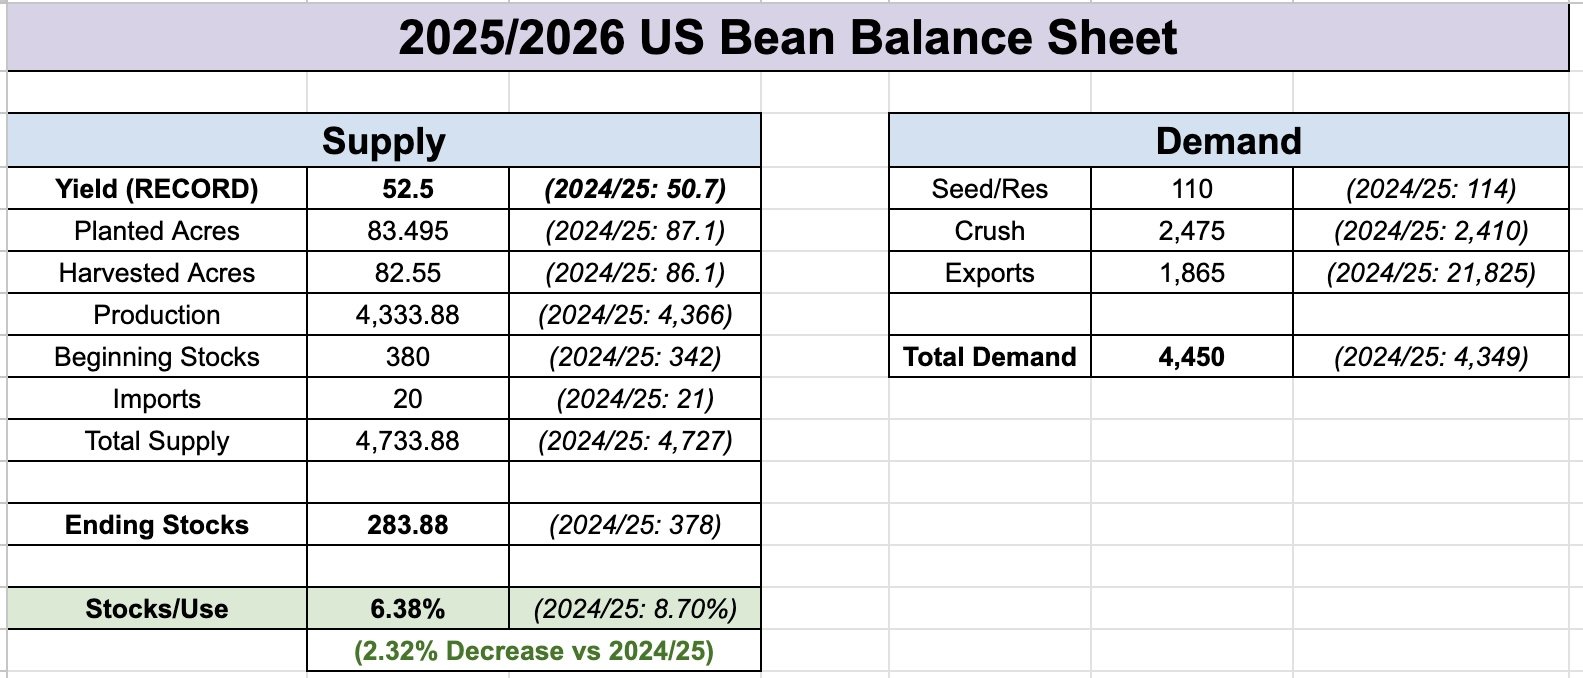
The biggest take away is still the fact that our new crop carryout is projected to be down -25% vs last year even if we raise a 52.5 bpa record yield.
Any hiccup in production will drastically cut into that carryout.
Any perception of yield not being as big as advertised will result in a pricing opportunity.
Current New Crop Balance Sheet: 52.5 Yield
Scenario New Crop Balance Sheet: 51 Yield

The trade war won’t be a truly bearish factor unless a deal is not made by harvest.
China came out with a report saying that they don’t need US grain. But again, this doesn’t really matter today as China doesn’t seasonally buy from us right now anyways.
Like corn, we don’t have a ton of reasons to go screaming higher tomorrow. But at the same time I don’t see the argument for us to go and post new lows either.
Technicals:
Last week we closed above the 200-day MA for the first time in 2 years.
A major win for the bulls.
This is now our support bulls want to defend to keep the bias leaning higher.
Today we found support right at the 200-day MA.
It was major resistance, so it only makes sense we would now turn into support and consolidate above it.
The 100-day MA (purple) is the must hold level. A drop below that likely sparks a drop down to that red support box.
Next target is still $11.04

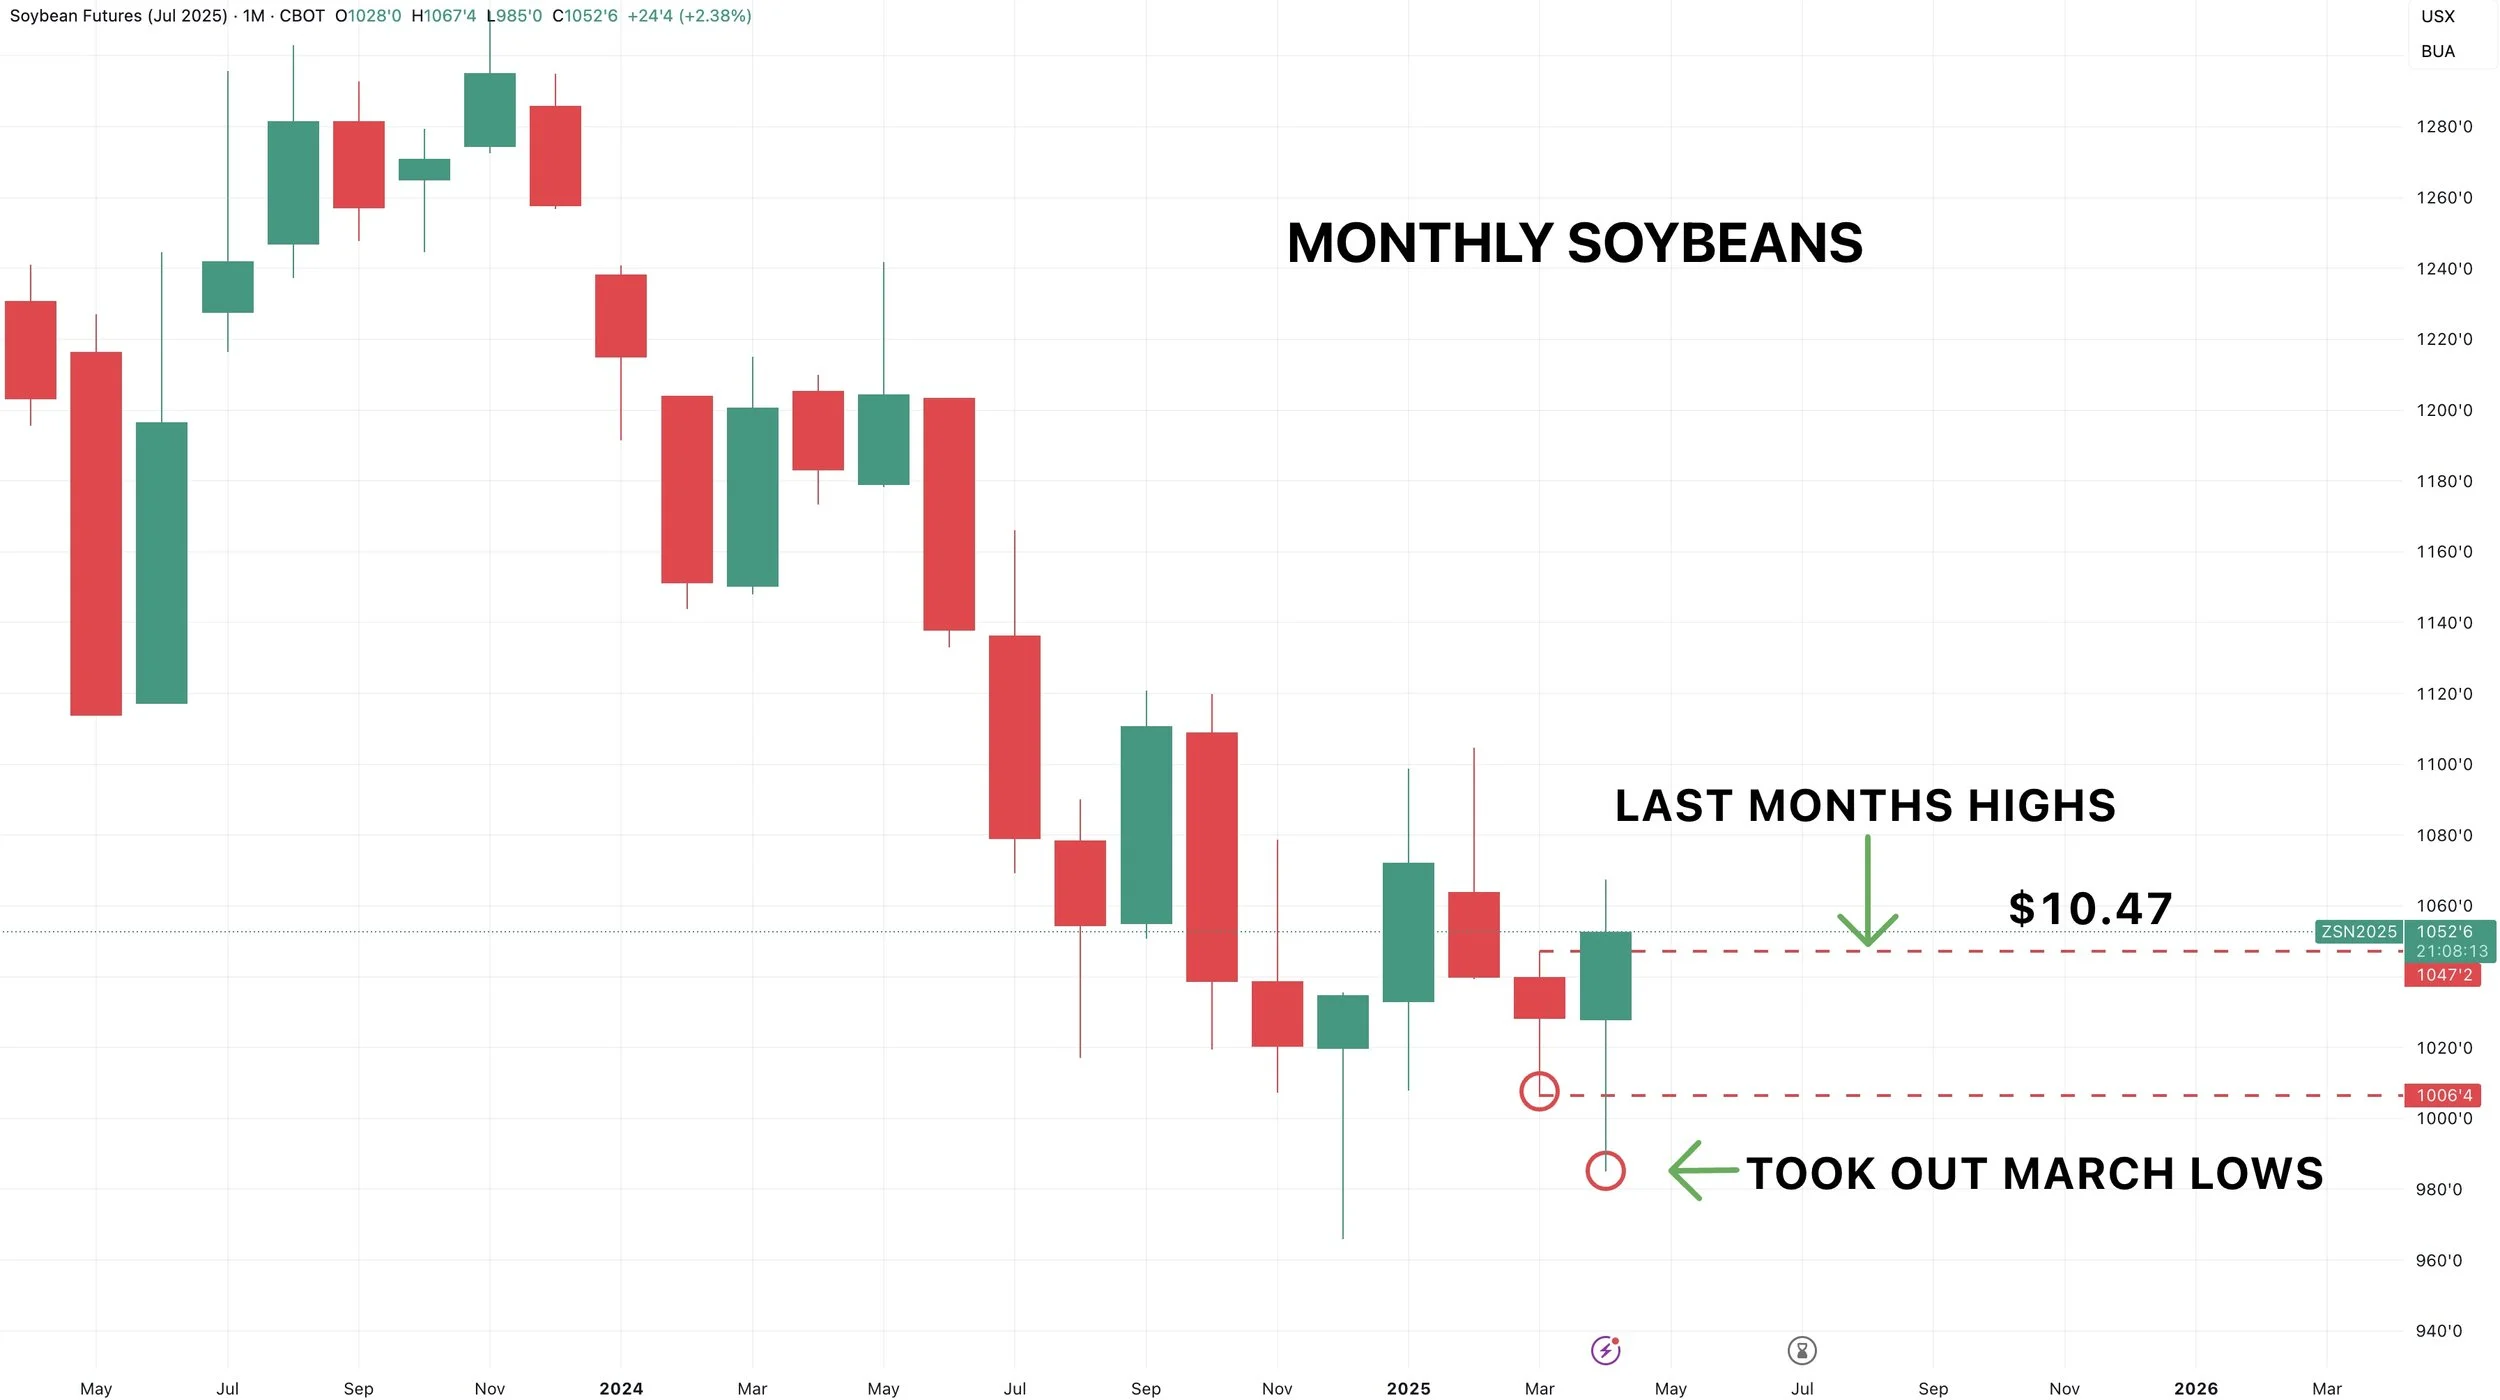
Here is monthly soybeans.
We still have a potential key reversal in place.
As we took out last months lows and are currently above last months highs.
July soybeans have not posted a monthly reversal candle in the entire life of the contract.
Potentially a pretty positive sign.
Need to hold $10.47 tomorrow as it is the final day of the month.
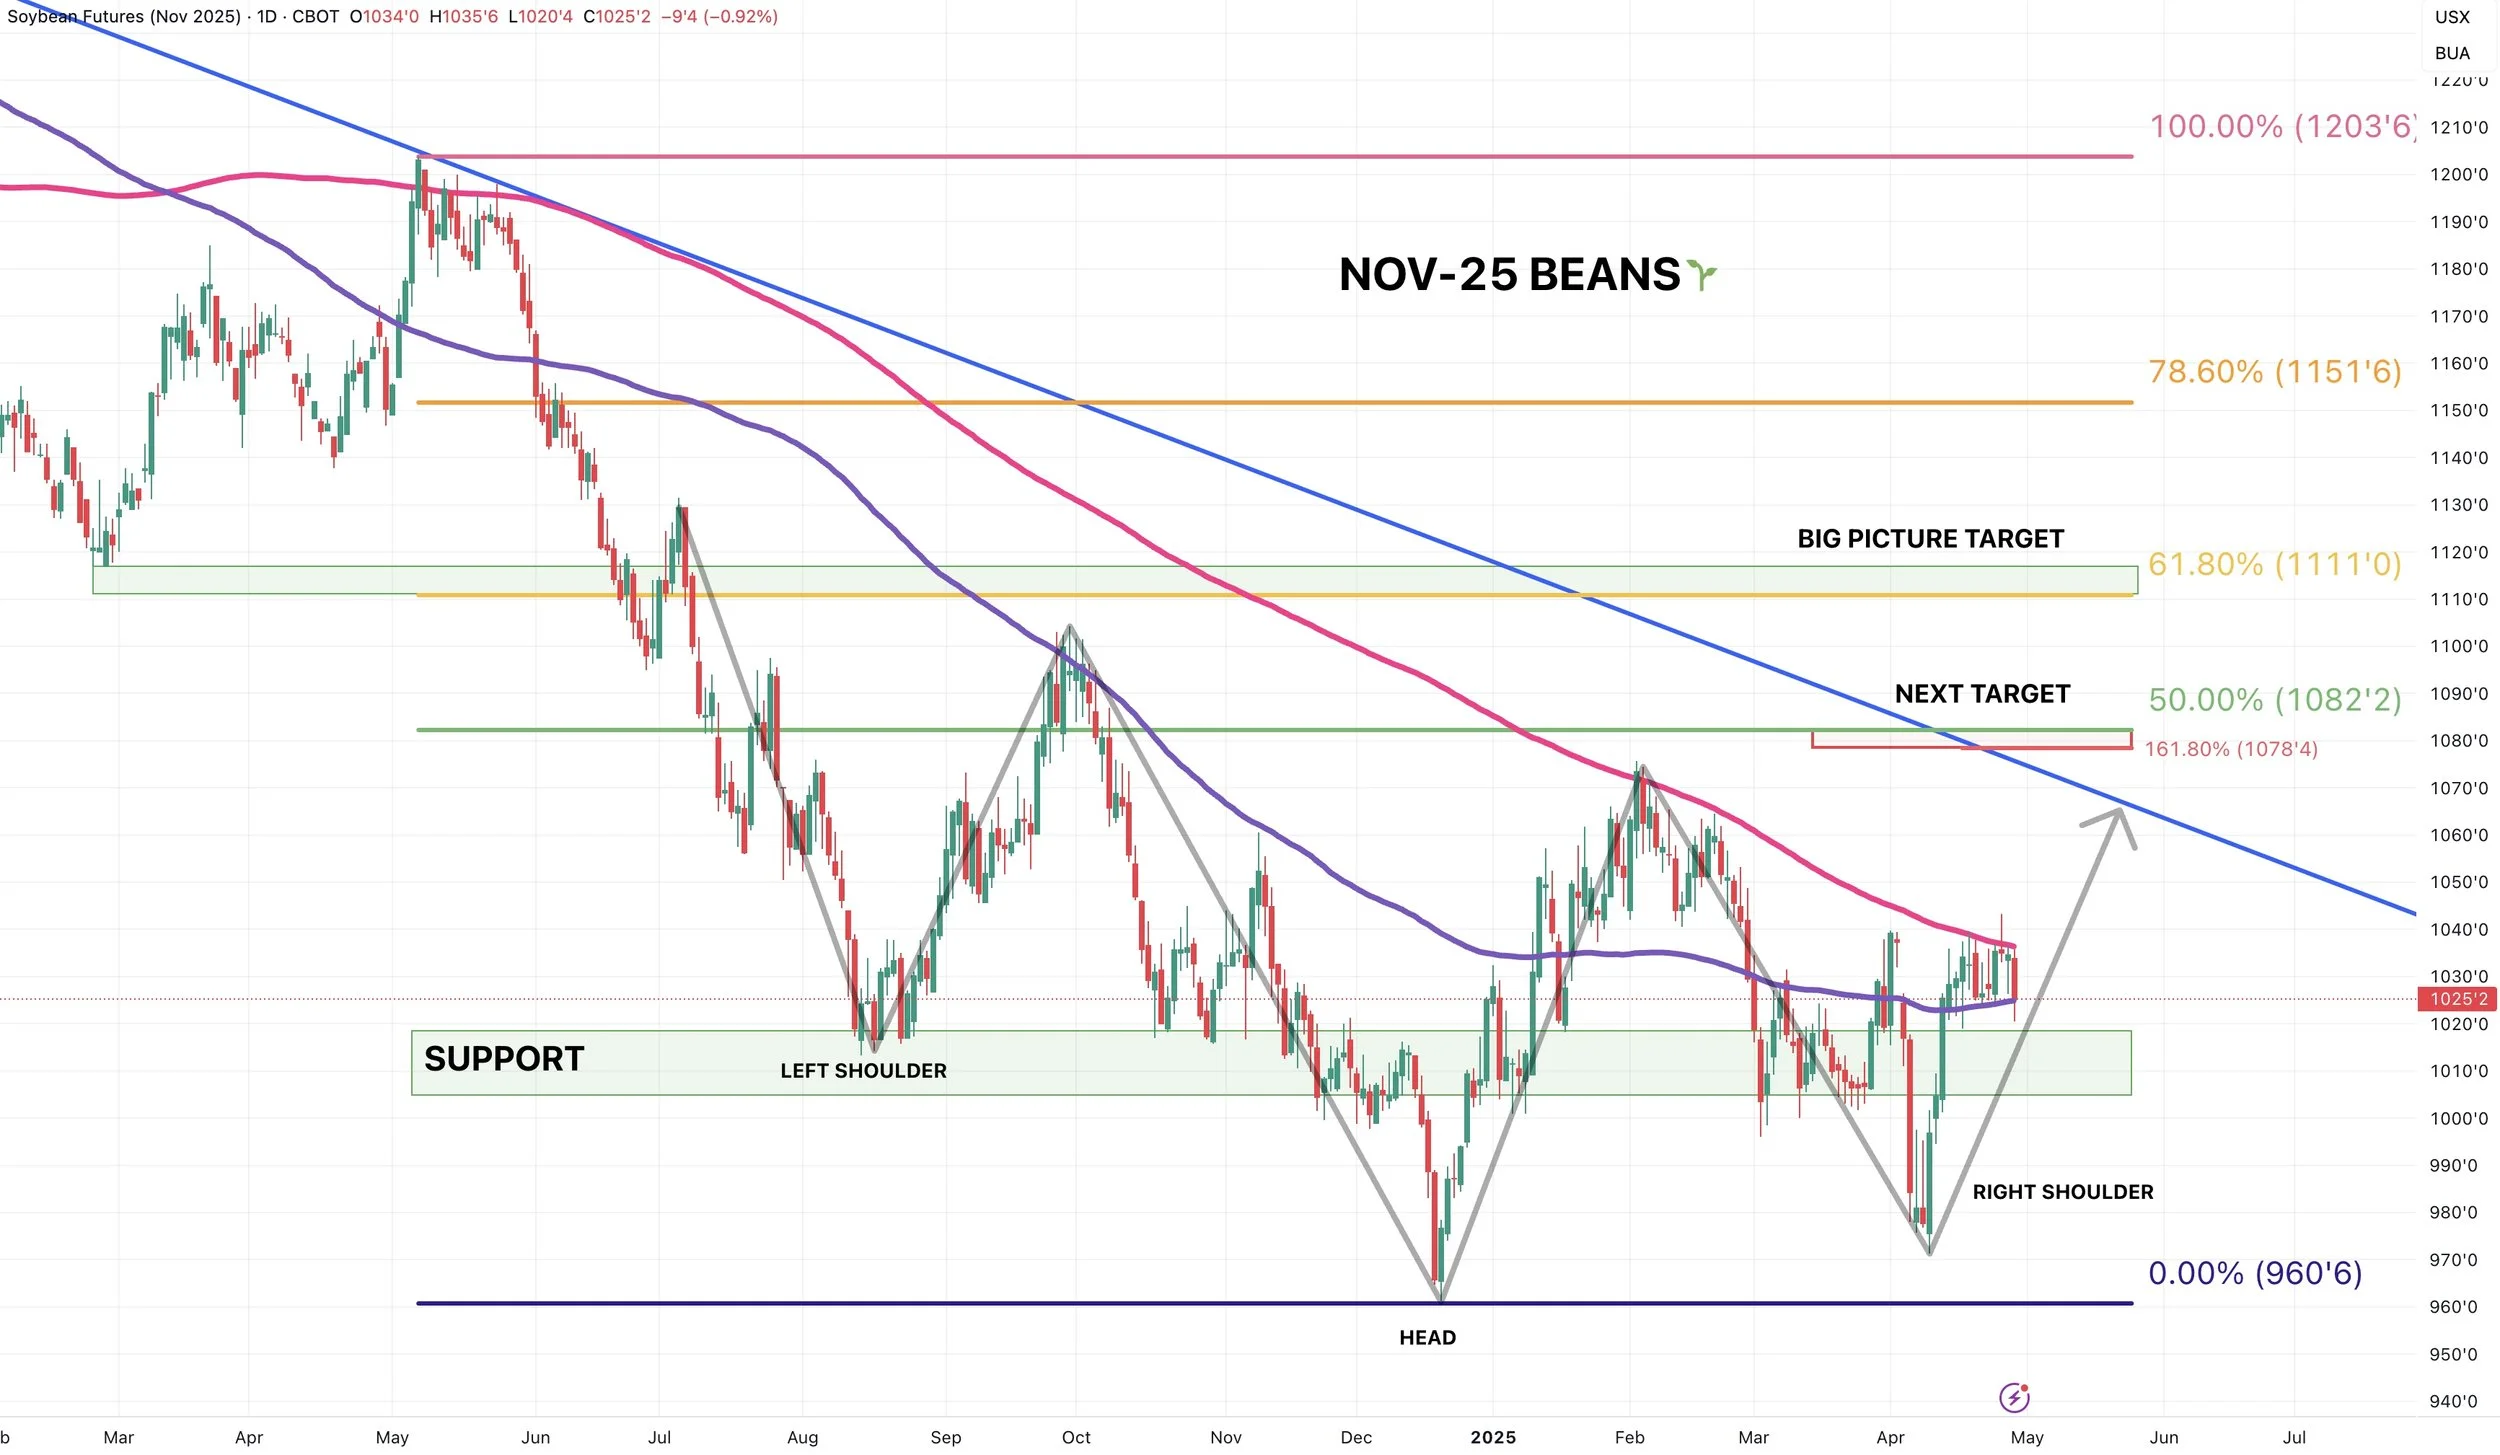
Nov beans have still not taken out the 200-day MA to the upside like July beans have.
Nov beans are instead hovering right above the 100-day MA.
This is a pretty important spot to hold here as the 100-day had acted as key resistance in the past. It is now key support. We have bounced off of it several times the past few weeks.
We have been trapped in between the 100 and 200-day MA for almost 3 weeks now waiting for the market to makes it's decision.
Pretty simple. A break and hold above the 200-day sets the stages for more upside. A break below the 100-day probably results in a drop lower.
Wheat
Fundamentals:
Another day, another low in the wheat market.
Wheat continues to be pressured from rain in the plains.
However, there is still concerns with winter wheat area.
I'd have to imagine that after these rains, the market will soon start to focus on the longer term dry forecasts and we will see buyers step back into this market and provide some life.
The funds are heavily short so we could see some short covering eventually.
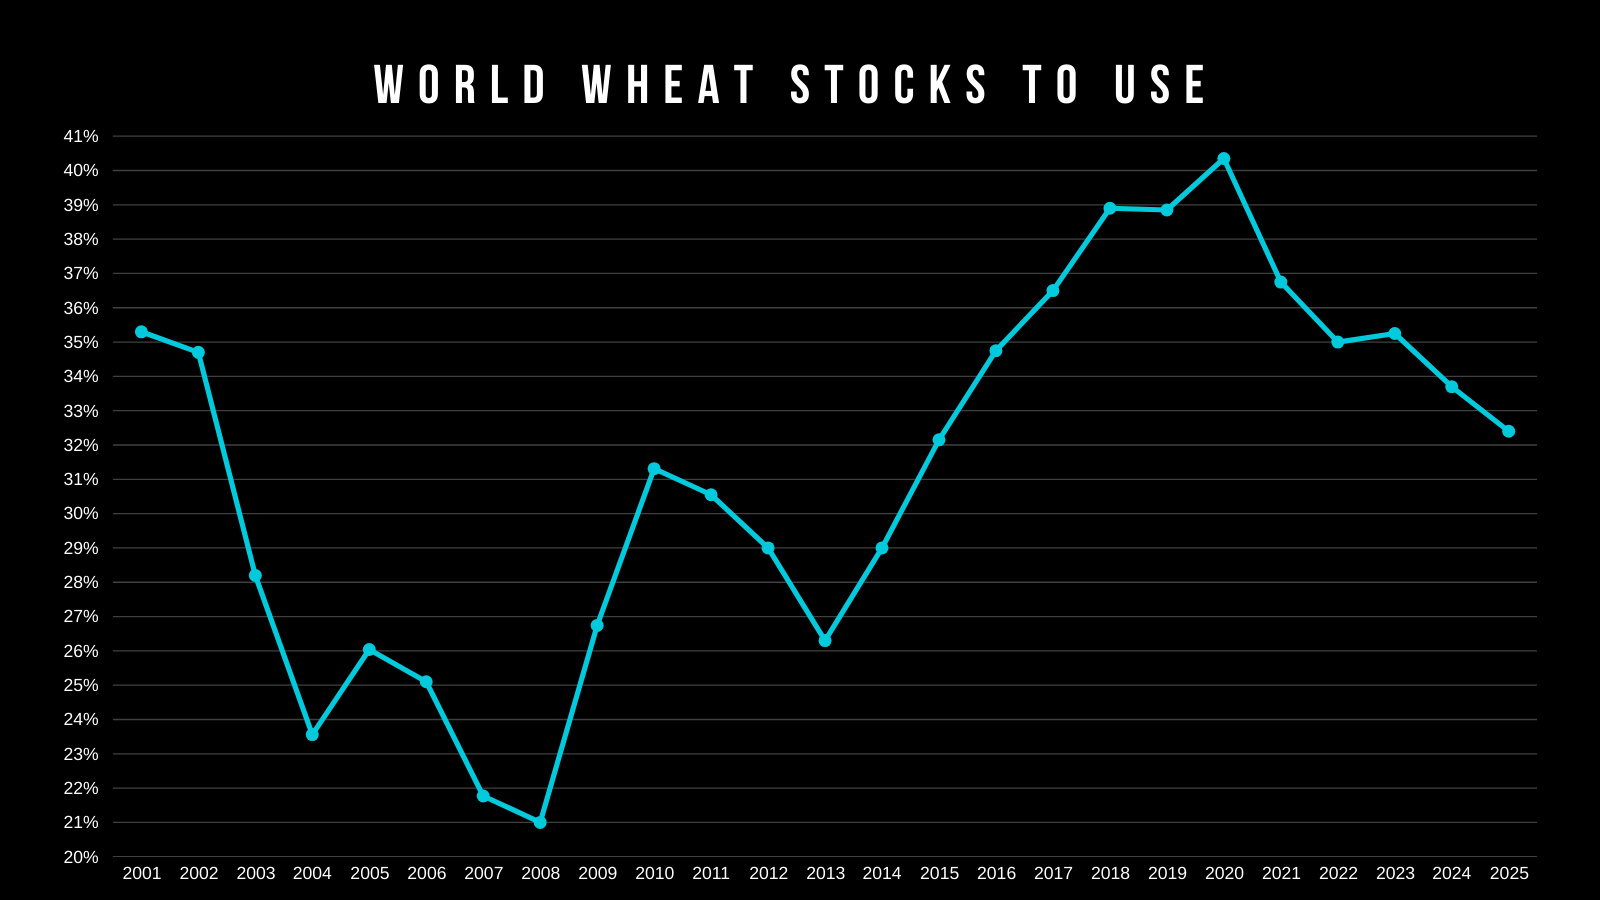
The global wheat picture is the most bullish in years.
Bottom line, I have no interest selling wheat here. Simply waiting for our next opportunity as brutal as the wheat market has been.
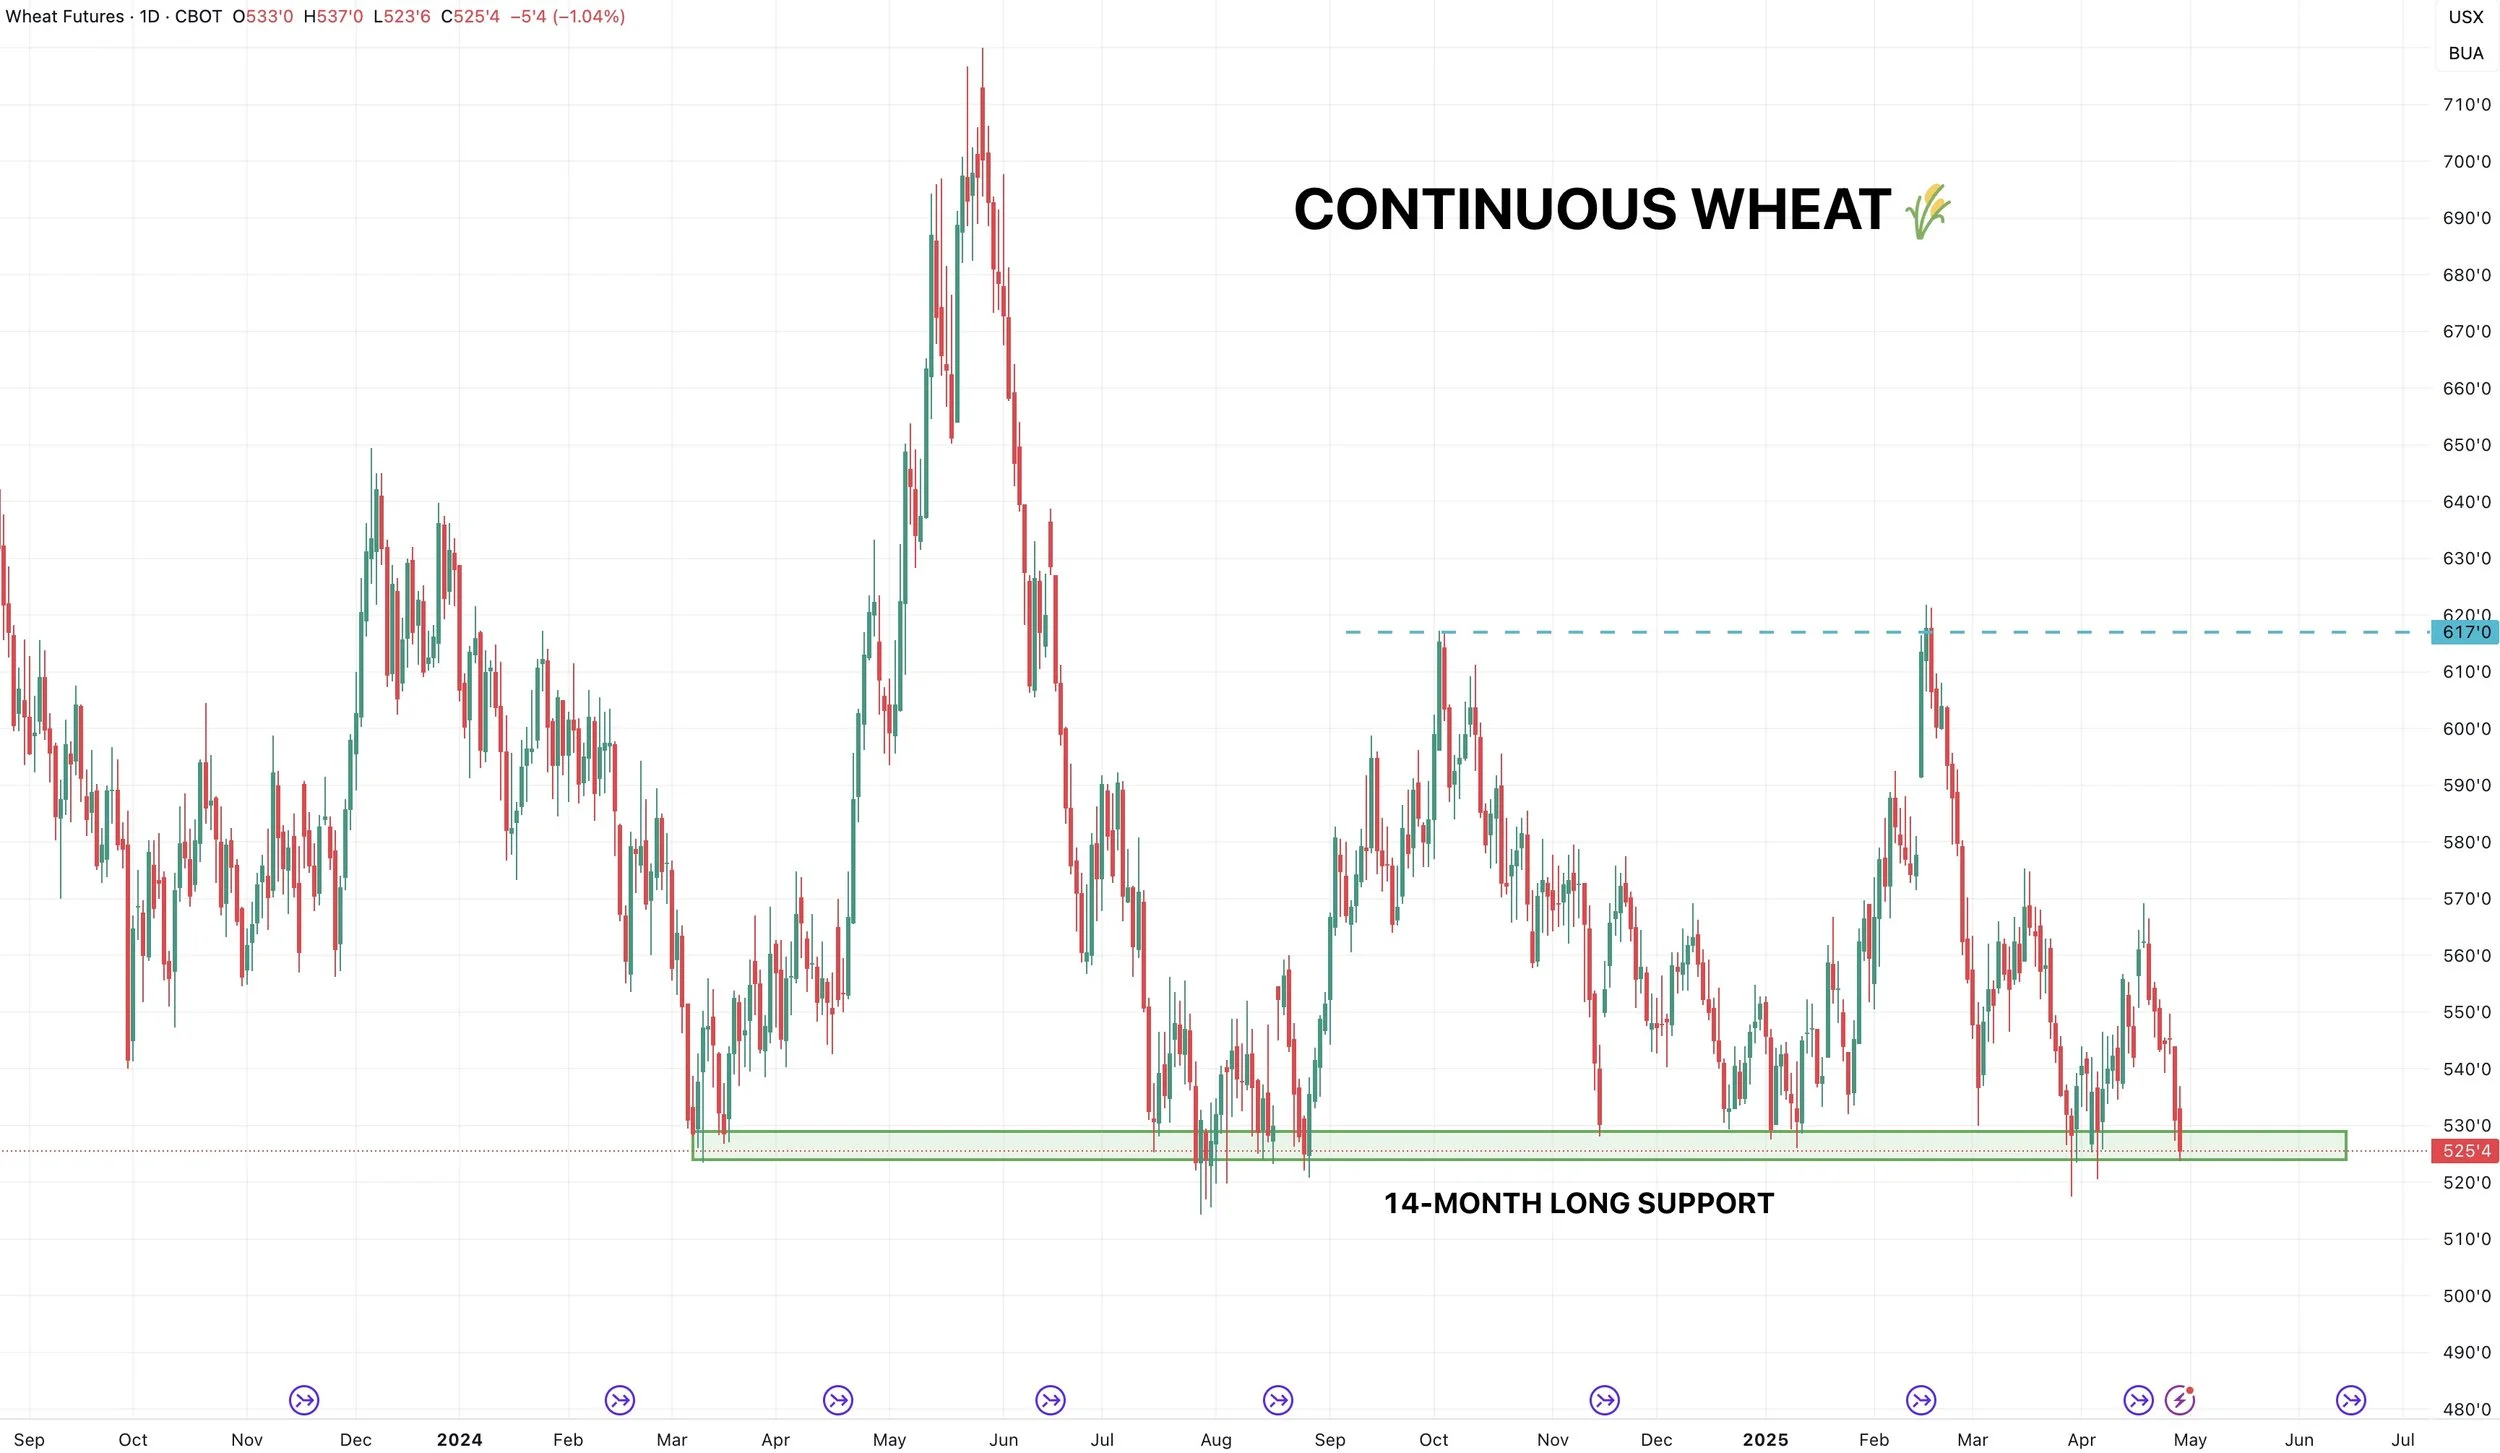
Technicals:
Here is continuous Chicago.
We are right at this major level of support that has held for 14 months.
I'd like to see us continue to hold it.
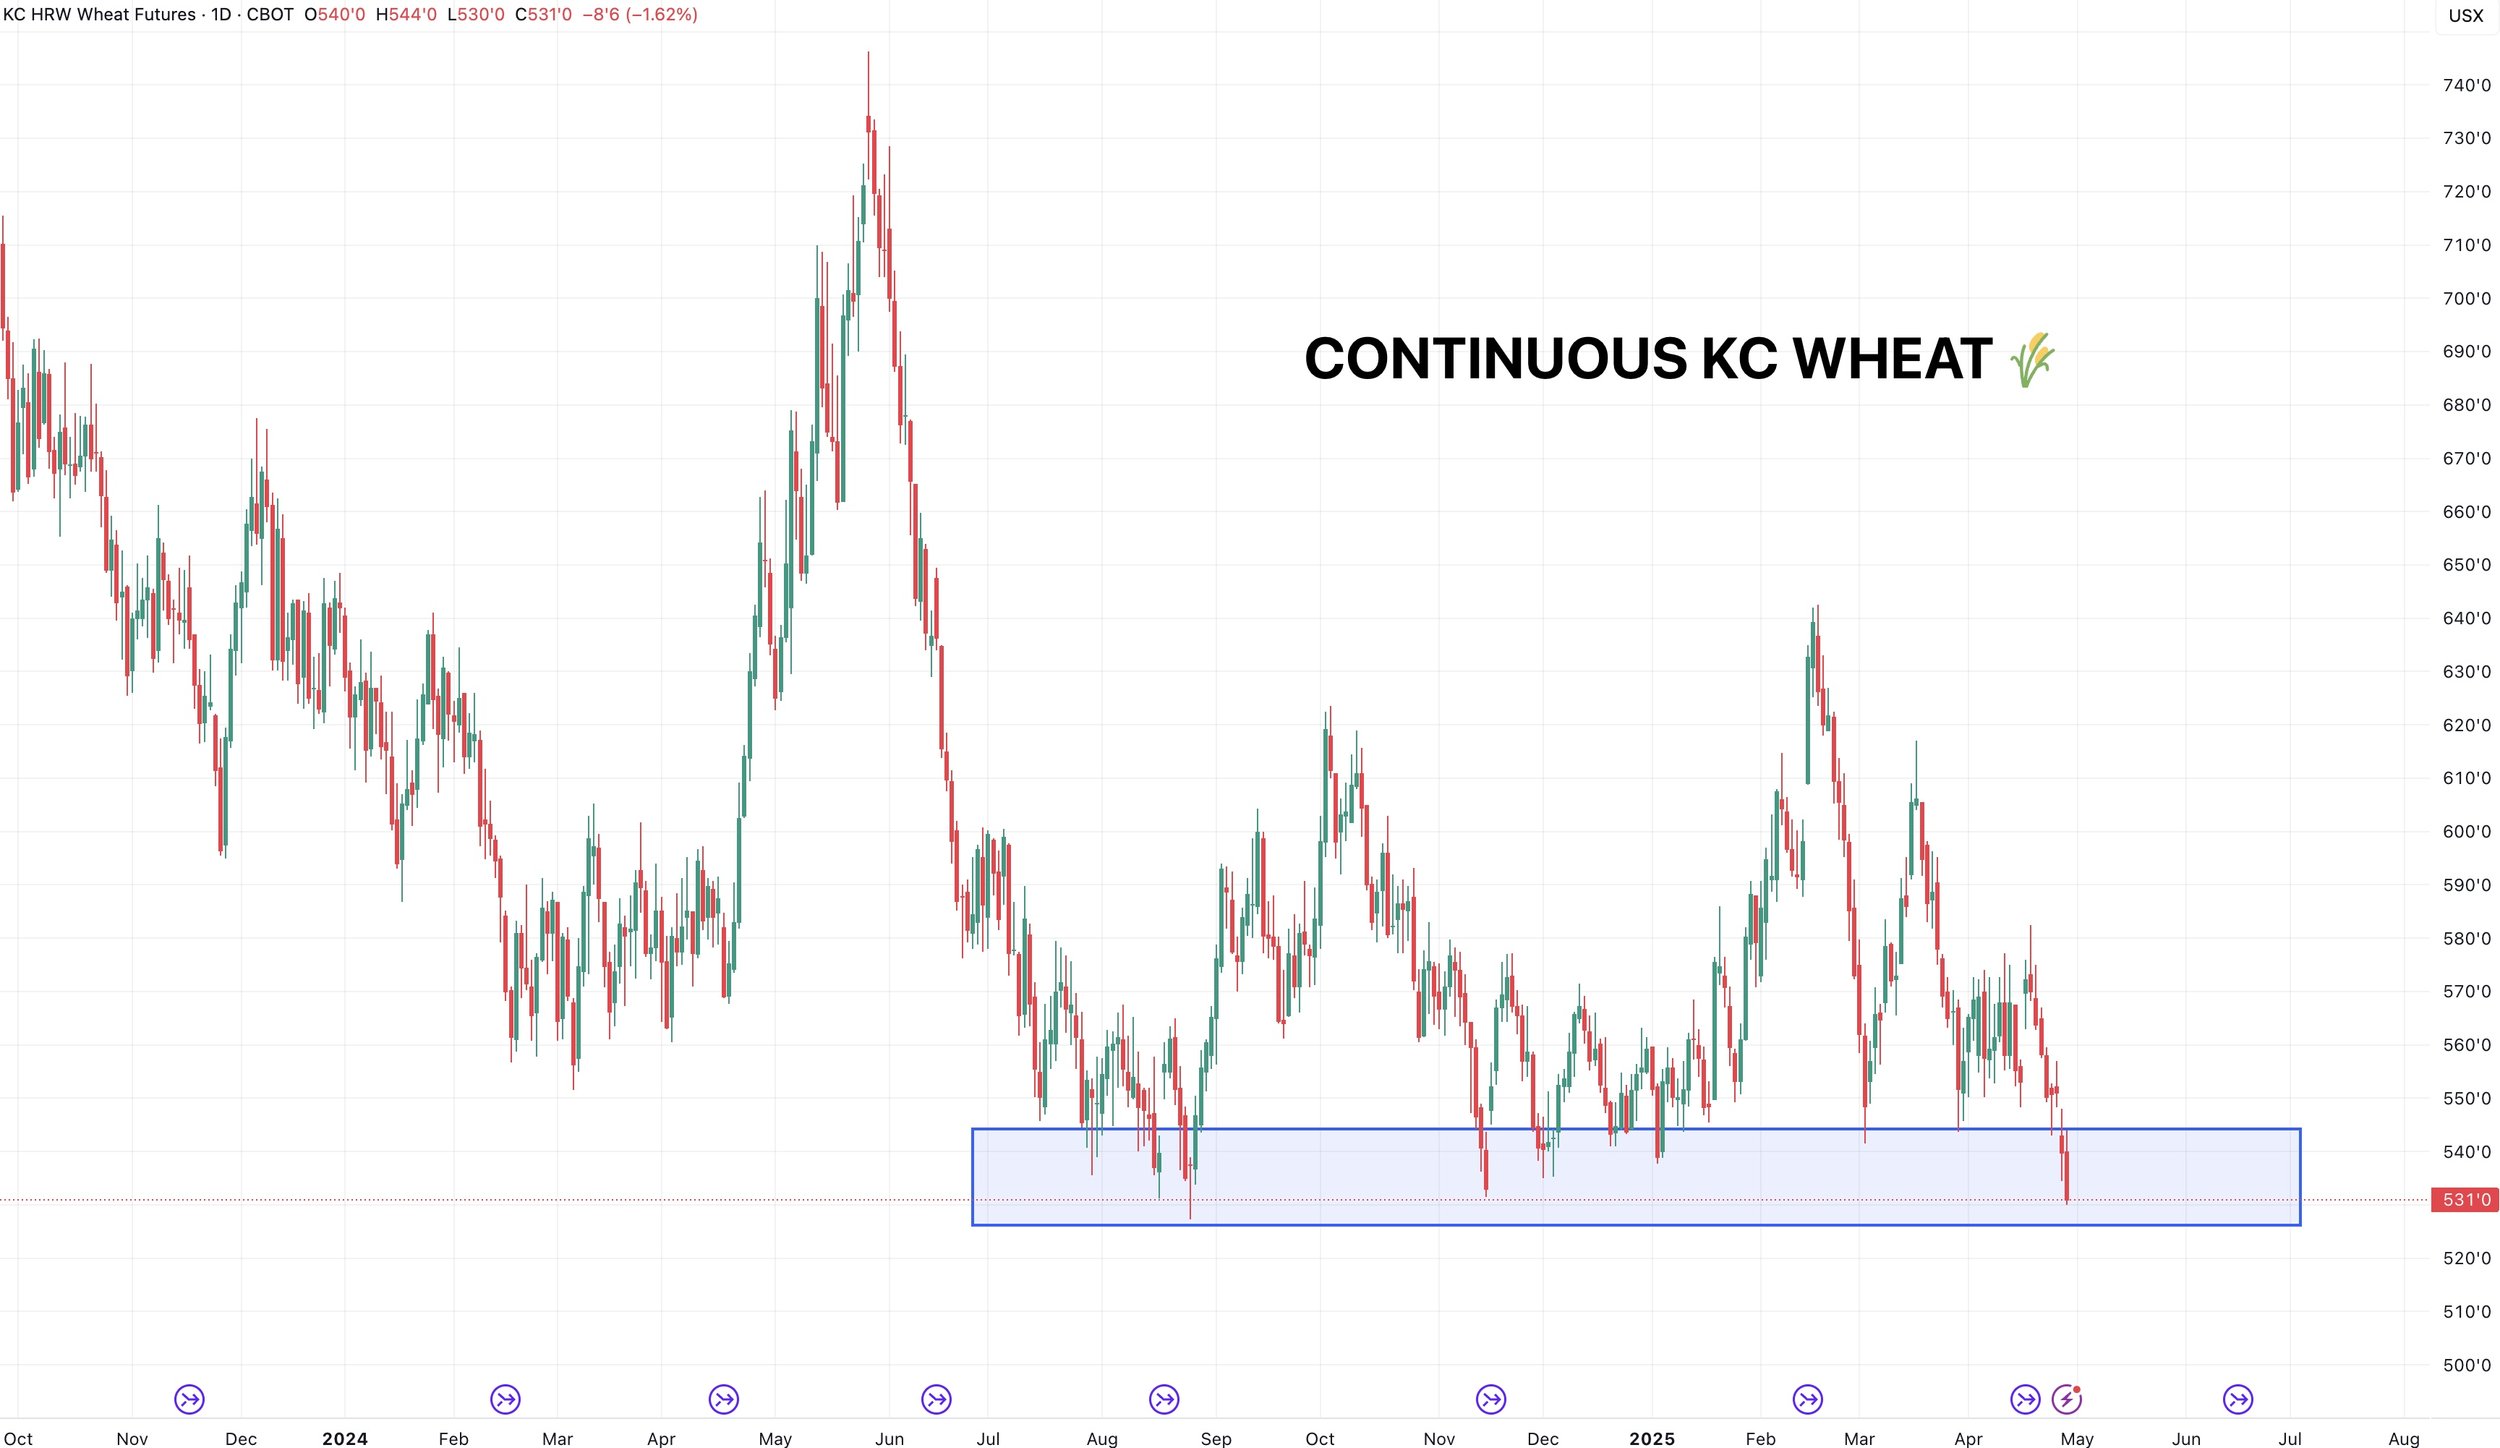
Here is continuous KC wheat.
Just like Chicago, we are at some major support bulls want to hold.
Past Sell or Protection Signals
We recently incorporated these. Here are our past signals.
April 10th: 🌽
Old crop corn sell signal.
March 19th: 🐮
Cattle hedge & sell signal.
Feb 18th: 🌽 🌾
Old crop KC wheat & old crop corn signal.
Jan 23rd: 🌽 🌱
Corn & beans old crop sell signal.
CLICK HERE TO VIEW
Jan 15th: 🌽 🌱
Corn & beans hedge alert/sell signal.
Jan 2nd: 🐮
Cattle hedge alert at new all-time highs & target.
Dec 11th: 🌽
Corn sell signal at $4.51 200-day MA
CLICK HERE TO VIEW
Oct 2nd: 🌾
Wheat sell signal at $6.12 target
Sep 30th: 🌽
Corn protection signal at $4.23-26
Sep 27th: 🌱
Soybean sell & protection signal at $10.65
Sep 13th: 🌾
Wheat sell signal at $5.98
May 22nd: 🌾
Wheat sell signal when wheat traded +$7.00
Want to Talk?
Our phones are open 24/7 for you guys if you ever need anything or want to discuss your operation.
Hedge Account
Interested in a hedge account? Use the link below to set up an account or shoot Jeremey a call at (605)295-3100.
Check Out Past Updates
4/28/25
CAPTURING INVERSE & SEASONAL PREPARATION
4/25/25
HOW OFTEN DOES CORN NOT BREAK APRIL HIGHS?
4/24/25
KNOW WHEN TO SELL. BEANS BREAK 200-DAY FIRST TIME IN 483 DAYS
4/23/25
MONEY FLOW & DROUGHT CARDS
4/22/25
CRUCIAL SPOT FOR CORN & BEANS
4/21/25
NO PLANTING THREAT YET
4/18/25
POTENTIAL OPPORTUNITIES, BASIS CONTRACTS & STRATEGIES
4/16/25
HOW YIELD IMPACTS CARRYOUT. MAJOR SPOT FOR SOYBEANS
4/15/25
TOTAL CHART BREAKDOWNS & TARGETS
4/14/25
TECHNICAL SELLING IN GRAINS
4/11/25
SPECIFIC GRAIN MARKETING DECISIONS
4/10/25
USDA REPORT. HOW THIS IMPACTS CORN
4/9/25
TARIFFS GIVE. TARIFFS TAKE
4/8/25
CORN’S DIVERGING STRENGTH
4/7/25
SOLID PRICE ACTION DESPITE OUTSIDE FEAR
4/4/25
CORN PRICE ACTION SPEAKS VOLUME. ANY HOPE LEFT FOR SOYBEANS?
4/3/25
WHAT IS LEFT FOR CORN BEARS? TRADE WAR: CHARTS HOLDING SUPPORT
4/2/25
SHOULD UNKNOWNS KEEP A FLOOR UNDER GRAIN PRICES?
4/1/25
HOW DO ACRES IMPACT FUTURE OF THE GRAINS?
3/31/25
USDA REPORT: NOW WHAT?
3/28/25
ALL EYES ON USDA
3/27/25
PRE-USDA POSITIONING. DON’T GIVE GRAIN AWAY
3/26/25
HISTORY OF MARCH INTENTIONS. SOYBEANS UNDERVALUED?
3/25/25
6 DAYS UNTIL MAJOR USDA REPORT
3/24/25
HOW TO POSITION YOURSELF BEFORE PLANTING
3/21/25
REASONS TO BE OPTIMISTIC IN GRAINS?
3/20/25
WAS THAT THE BOTTOM IN CORN?
3/19/25
THE PATH HIGHER & THE DOWNSIDE RISKS IN GRAINS
3/18/25
SEASONALS, CATTLE HEDGE, CHARTS & DROUGHT?
3/17/25
WHEAT RALLIES. DON’T GET BACKED INTO A CORNER
3/14/25
MARCH 31ST REPORT THOUGHTS & WHAT’S NEXT FOR GRAINS
3/13/25
EXPLAINING RE-OWNERSHIP VS COURAGE CALLS
3/12/25
TARIFF FEARS. EU, CANADA, & ETHANOL
3/11/25
USDA SNOOZE. RECORD FUND SELLING A CONCERN?
3/10/25
USDA TOMORROW. GETTING COMFORTABLE IN MARKETING
3/7/25
HOW TIGHT IS THE WORLD & US SITUATION?
3/6/25
TARIFFS PUSHED BACK. FUTURE OPPORTUNITIES?
3/5/25
IS GRAINS BIGGEST RISK WEAK CRUDE & DEFLATION?
3/4/25
TRADE WAR BEGINS. 8TH DAY OF PAIN FOR GRAINS
3/3/25
TARIFFS ON TOMORROW. BUY SIGNAL
3/3/25
BUY SIGNAL
2/28/25
WHEN WILL THE BLEEDING STOP?
2/27/25
CORN AT CRITICAL SPOT. USDA ACRE REPORT. WAY TOO EARLY DROUGHT TALK
2/26/25
HISTORY SUGGESTS CORN TOP ISN’T IN? ACRE OUTLOOK TOMORROW
2/25/25
POSITIVE CLOSE. WHAT TO KNOW ABOUT USDA OUTLOOK
2/24/25
USDA OUTLOOK, FIRST NOTICE DAY & BRAZIL
2/21/25
WHAT TO EXPECT MOVING FORWARD IN GRAINS
2/20/25
FIRST NOTICE DAY CONCERNS. MASSIVE CORN ACRES OR NOT?
2/19/25
HOW TIGHT IS THE CORN SITUATION?
2/18/25
MORE DETAILS ON TODAYS SELL SIGNAL
2/18/25
OLD CROP KC WHEAT & CORN SELL SIGNAL
2/14/25
WHEAT BREAKING OUT ON WEATHER RISK. TECHNICALS & FUNDAMENTALS
2/12/25
GLOBAL GRAIN SITUATION, ACRE TALK, CHARTS & MORE
2/11/25
USDA: NOT A BEARISH REPORT. DISAPPOINTING PRICE ACTION
2/10/25
USDA TOMORROW. LONG TERM PATH FOR SUB 10% CORN STOCKS TO USE?
2/7/25
WHY WOULD THE FUNDS EXIT THEIR LONGS?
2/6/25
WHEAT FINALLY CATCHING A BID
2/5/25
COMPLETE THOUGHTS ON MARKETS: BACK & FORTH DISCUSSION
2/4/25
STRONG JANUARY LEAD TO STRONG YEAR? TARIFFS, CHARTS & MORE
2/3/25
TARIFFS PUSHED BACK
1/31/25
TARIFF NEWS ALL OVER THE PLACE. ARE YOU PREPARED FOR POSSIBILITIES?
1/30/25
WHEAT BULL ARGUMENT. TRUMP ADDS TARIFFS
1/29/25
CORN APPROACHES $5.00
1/28/25
TARIFFS, CORN FUNDS, SOUTH AMERICA & MORE
1/27/25
HEALTHY CORRECTION WE TALKED ABOUT & TARIFF NEWS
1/24/25
GRAINS DUE FOR SHORT TERM CORRECTION?
1/23/25
OUR ENTIRE NEW CROP SALES THOUGHTS & OLD CROP SELL SIGNAL
1/22/25
GRAINS TAKE A BREATHER. IS CORN IN A BULL OR BEAR MARKET?
1/21/25
HUGE DAY IN GRAINS. WHAT TO DO WITH OLD CROP VS NEW CROP
Read More
1/20/25
VIDEO CHART UPDATE
1/17/25
TRUMP, CHINA, ARGY & USING THE SPREADS INVERSE
1/16/25
OLD CROP LEADS US LOWER. MARKETING THOUGHTS
1/15/25
SIGNAL & HEDGE ALERT QUESTIONS EXPLAINED. IS $6 CORN EVEN POSSIBLE?
1/14/25
MORE DETAILS ON TODAYS HEDGE ALERT & SELL SIGNAL
1/14/25
CORN & SOYBEANS HEDGE ALERT/SELL SIGNAL
1/13/25
USDA GAME CHANGER OR NOT?
1/10/25
BULLISH USDA FOR CORN & BEANS
1/9/25
USDA OUT TOMORROW
1/8/25
2 DAYS UNTIL USDA. BE PREPARED
1/7/25
THE HISTORY OF THE JAN USDA & MORE
1/6/25
MAJOR USDA REPORT FRIDAY
Read More
1/3/25
UGLY DAY ACROSS THE GRAINS
1/2/25